Embed Size (px)
DESCRIPTION
Solman Baker
Citation preview
Chapter 06 - Intercompany Inventory Transactions
6-1
CHAPTER 6
INTERCOMPANY INVENTORY TRANSACTIONS
ANSWERS TO QUESTIONS
Q6-1 All inventory transfers between related companies must be eliminated to avoid an overstatement of revenue and cost of goods sold in the consolidated income statement. In addition, when unrealized profits exist at the end of the period, the eliminations are needed to avoid overstating inventory and consolidated net income.
Q6-2 An inventory transfer at cost results in an overstatement of sales and cost of goods sold. While net income is not affected, gross profit ratios and other financial statement analysis may be substantially in error if appropriate eliminations are not made.
Q6-3 An upstream sale occurs when the parent purchases items from one or more subsidiaries. A downstream sale occurs when the sale is made by the parent to one or more subsidiaries. Knowledge of the direction of sale is important when there are unrealized profits so that the person preparing the consolidation worksheet will know whether to reduce consolidated net income assigned to the controlling interest by the full amount of the unrealized profit (downstream) or reduce consolidated income assigned to the controlling and noncontrolling interestson a proportionate basis (upstream).
Q6-4 As in all cases, the total amount of the unrealized profit must be eliminated in preparing the consolidated statements. When the profits are on the parent company's books, consolidated net income and income assigned to the controlling interest are reduced by the full amount of the unrealized profit.
Q6-5 Consolidated net income is reduced by the full amount of the unrealized profits. In the upstream sale, the unrealized profits are apportioned between the parent company shareholders and the noncontrolling shareholders. Thus, consolidated net income assigned to the controlling and noncontrolling interests is reduced by a pro rata portion of the unrealized profits.
Q6-6 Income assigned to the noncontrolling interest is affected when unrealized profits are recorded on the subsidiary's books as a result of an upstream sale. A downstream sale should have no effect on the income assigned to noncontrolling interest because the profits are on the books of the parent.
Q6-7 The basic eliminating entry needed when the item is resold before the end of the period is:
Sales XXXXXX
Cost of Goods Sold
XXXXXX
Chapter 06 - Intercompany Inventory Transactions
6-2
The debit to sales is based on the intercorporate sale price. This means that only the revenue recorded by the company ultimately selling to the nonaffiliate is to be included in the consolidated income statement. Cost of goods sold is credited for the amount paid by the purchaser on the intercorporate transfer, thereby permitting the cost of goods sold recorded by the initial owner to be reported in the consolidated statement. Q6-8 The basic eliminating entry needed when one or more of the items are not resold before the end of the period is:
Sales XXXXXX
Cost of Goods Sold
XXXXXX
Inventory
XXXXXX
The debit to sales is for the full amount of the transfer price. Inventory is credited for the unrealized profit at the end of the period and cost of goods sold is credited for the amount charged to cost of goods sold by the company making the intercompany sale.
Q6-9 Cost of goods sold is reported by the consolidated entity when inventory is sold to an external party. The amount reported as cost of goods sold is based on the amount paid for the inventory when it was produced or purchased from an external party. If inventory has been purchased by one company and sold to a related company, the cost of goods sold recorded on the intercorporate sale must be eliminated.
Q6-10 No adjustment to retained earnings is needed if the intercorporate sales have been made at cost or if all intercorporate sales have been resold to an external party in the same accounting period. If all of the intercorporate sales have not been resold by the end of the period, under the fully adjusted equity method, the parent defers unrealized profits in the investment in sub and income from sub accounts. This adjustment would be made to retained earnings under the modified equity method. However, regardless of the parent’s method for accounting for the investment, the amount of the noncontrolling interest is reduced by the NCI’s proportionate share of the unrealized profit associated with upstream sales.
Q6-11 A proportionate share of the realized retained earnings of the subsidiary are assigned to the noncontrolling interest. Any unrealized profits on upstream sales are deducted proportionately from the amount assigned to the noncontrolling interest. Unrealized profits on downstream sales do not affect the noncontrolling interest.
Q6-12 When inventory profits from a prior period intercompany transfer are realized in the current period, the profit is added to consolidated net income and to the income assigned to the shareholders of the company that made the intercompany sale. If the unrealized profits arise from a downstream sale, income assigned to the controlling interest will increase by the full amount of profit realized. When the profits arise from an upstream sale, income assigned to the controlling and noncontrolling interests will be increased proportionately in the period the profit is realized. Thus, knowledge of whether the profits resulted from an upstream or a downstream sale is imperative in assigning consolidated net income to the appropriate shareholder group.
Chapter 06 - Intercompany Inventory Transactions
6-3
Q6-13 Under the fully adjusted equity method, consolidated retained earnings is not affected directly by unrealized profits. Unrealized profits are deferred in the investment in sub and income from sub accounts on the parent’s books. Income from sub is closed out to retained earnings, so the deferral of unrealized profits indirectly affects retained earnings. As a result, the amount reported for consolidated retained earnings is always equal to the parent’s retained earnings.
Q6-14 Consolidated retained earnings are always equal to the parent’s retained earnings under the fully adjusted equity method. Since the parent company defers unrealized profits in the income from sub and investment in sub accounts and since income from sub is closed out to the parent’s retained earnings, the ending balance in consolidated retained earnings will reflect the reduction associated with the deferral of unrealized profits.
Q6-15* Sales between subsidiaries are treated in the same manner as upstream sales. Whenever the profits are on the books of one of the subsidiaries, the unrealized profits at the end of the period are eliminated and consolidated net income and income assigned to the controlling and noncontrolling interests is reduced.
Q6-16* When a company is acquired in a business combinationthe transactions occurring before the combination generally are regarded as transactions with unrelated parties and no adjustments or eliminations are needed. All transactions between the companies following the combination must be fully eliminated. SOLUTIONS TO CASES
C6-1 Measuring Cost of Goods Sold
a. While the rule covers only a part of the elimination needed, Charlie is correct in that the cost of goods sold recorded by the selling company must be eliminated to avoid overstating that caption in the consolidated income statement.
b. The rules will result in the proper consolidated totals if rule #1 is expanded to include a debit to sales and a credit to ending inventory for the amount of profit recorded by the company that sold to its affiliate.
c. The way in which the rule is stated makes it appear to be incorrect, but it is correct. The rule is appropriate in that the cost of goods sold recorded by the purchasing affiliate is equal to the cost of goods sold to the first owner plus the profit the first owner recorded on the sale. Eliminating these amounts therefore eliminates the appropriate amount of cost of goods sold. If an equal amount of sales is eliminated, the rule should result in proper consolidated financial statement totals.
d. The employee would be forced to look at the books of the selling affiliate and determine the difference between the intercorporate sale price and the price it paid to acquire or produce the items. If the items sold to affiliates are routinely produced and costs do not fluctuate greatly, it may be possible to use some form of gross profit ratio to estimate the amount of unrealized profit.
Chapter 06 - Intercompany Inventory Transactions
6-4
C6-2 Inventory Values and Intercompany Transfers
MEMO
To: President Water Products Corporation
From: , CPA
Re: Inventory Sale and Purchase of New Inventory
If Water Products holds only a small percent of the ownership of Plumbers Products and Growinkle Manufacturing, it should have no difficulty in reporting the desired results. This would not be the case if the two companies are subsidiaries of Water Products.
If both Plumbers Products and Growinkel are subsidiaries of Water Products, both the sale of inventory to Plumbers Supply and the purchase of inventory from Growinkle Manufacturing must be eliminated.In addition, the unrealized profit on any unsold inventory involved in these transfers must be eliminated in preparing the financial statements for the current period.
The consolidated income statement should include the same amount of income on the inventory sold to Plumbers Supply and resold during the year as would have been recorded if Water Products had sold the inventory directly to the purchaser. Any income recorded by Water Products on inventory not resold by Plumbers Supply must be eliminated.
Similarly, the consolidated income statement should include the same amount of income on the inventory purchased by Water Products and resold during the year as would have been recorded if Growinkle Manufacturing had sold the inventory directly to the purchaser. Any income recorded by Growinkle Manufacturing on inventory not resold by Water Products must be eliminated.
Consolidated net income may increase if Plumbers Supply is able to sell the inventory it purchased from Water Products at a higher price than would have been received by Water Products or if it is able to sell a larger number of units. The same can be said for the inventory purchased by Water Products from Growinkle Manufacturing. It is important to recognize that the transfer of inventory between Water Products and its subsidiaries does not in itself generate income for the consolidated entity.
An additional level of complexity may arise in this situation if Water Products uses the LIFO inventory method. It might, for example, be forced to carry over its LIFO cost basis on the old inventory sold to Plumbers Supply to the new inventory purchased from Growinkle Manufacturing since it was replaced within the accounting period.
Primary citation: ARB 51, Par. 6 (ASC 810)
Chapter 06 - Intercompany Inventory Transactions
6-5
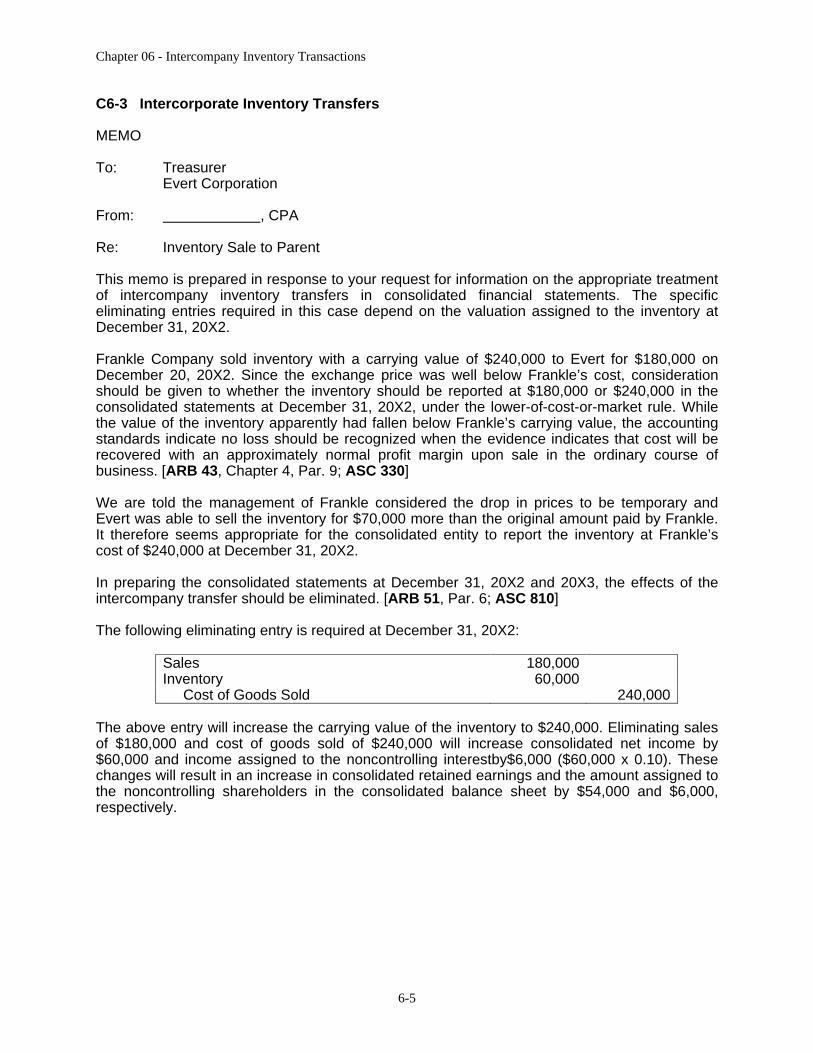
C6-3 Intercorporate Inventory Transfers
MEMO
To: Treasurer Evert Corporation
From: , CPA
Re: Inventory Sale to Parent
This memo is prepared in response to your request for information on the appropriate treatment of intercompany inventory transfers in consolidated financial statements. The specific eliminating entries required in this case depend on the valuation assigned to the inventory at December 31, 20X2.
Frankle Company sold inventory with a carrying value of $240,000 to Evert for $180,000 on December 20, 20X2. Since the exchange price was well below Frankle’s cost, consideration should be given to whether the inventory should be reported at $180,000 or $240,000 in the consolidated statements at December 31, 20X2, under the lower-of-cost-or-market rule. While the value of the inventory apparently had fallen below Frankle’s carrying value, the accounting standards indicate no loss should be recognized when the evidence indicates that cost will be recovered with an approximately normal profit margin upon sale in the ordinary course of business. [ARB 43, Chapter 4, Par. 9; ASC 330]
We are told the management of Frankle considered the drop in prices to be temporary and Evert was able to sell the inventory for $70,000 more than the original amount paid by Frankle. It therefore seems appropriate for the consolidated entity to report the inventory at Frankle’s cost of $240,000 at December 31, 20X2.
In preparing the consolidated statements at December 31, 20X2 and 20X3, the effects of the intercompany transfer should be eliminated. [ARB 51, Par. 6; ASC 810]
The following eliminating entry is required at December 31, 20X2:
Sales 180,000
Inventory 60,000
Cost of Goods Sold
240,000
The above entry will increase the carrying value of the inventory to $240,000. Eliminating sales of $180,000 and cost of goods sold of $240,000 will increase consolidated net income by $60,000 and income assigned to the noncontrolling interestby$6,000 ($60,000 x 0.10). These changes will result in an increase in consolidated retained earnings and the amount assigned to the noncontrolling shareholders in the consolidated balance sheet by $54,000 and $6,000, respectively.

Chapter 06 - Intercompany Inventory Transactions
6-6
C6-3 (continued)
The following eliminating entry is required at December 31, 20X3:
Cost of Goods Sold 60,000
Investment in Sub
54,000
NCI in NA of Sub
6,000
The above entry will reduce consolidated net income by $60,000 and income assigned to the noncontrolling interest by $6,000 ($60,000 x .10). The credits to Investment in Sub and NCI in NA of Sub needed to bring the beginning balances into agreement with those reported at December 31, 20X2.
No eliminations are required for balances reported at December 31, 20X3, because the inventory has been sold to a nonaffiliate prior to year-end.
Primary citations: ARB 43, CH 4, Par. 9 (ASC 330) ARB 51, Par. 6 (ASC 810)
C6-4 Unrealized Inventory Profits
a. When the amount of unrealized inventory profits on the books of the subsidiary at the beginning of the period is greater than the amount at the end of the period, the income assigned to the noncontrolling interest for the period will exceed a pro rata portion of the reported net income of the subsidiary.
b. The subsidiary apparently had less unrealized inventory profit at the end of the period than it did at the start of the period. In addition, the parent must have had more unrealized profit on its books at the end of the period than it did at the beginning. The negative effect of the latter apparently offset the positive effect of the reduction in unrealized profits by the subsidiary.
c. The most likely reason is that a substantial amount of the parent company sales was made to its subsidiaries and the cost of goods sold on those items was eliminated in preparing the consolidated statements.
d. A loss was recorded by the seller on an intercompany sale of inventory to an affiliate and the purchaser continues to hold the inventory.
Chapter 06 - Intercompany Inventory Transactions
6-7
C6-5 Eliminating Inventory Transfers
a. If no intercompany sales are eliminated, the income statement may include overstated sales revenue and cost of goods sold. The net impact on income will depend upon whether there were more unrealized profits at the beginning or end of the year. If ReadyBuilding does not hold total ownership of the subsidiaries, the amount of income assigned to noncontrolling shareholders is likely to be incorrect as well.
Inventory, current assets and total assets, retained earnings, and stockholders' equity are likely to be overstated if inventories are sold to affiliates at a profit. If the companies pay income taxes on their individual earnings, the amount of income tax expense also will be overstated in the period in which unrealized profits are reported and understated in the period in which the profits are realized.
b. Because profit margins vary considerably, the amount of unrealized profit may vary considerably if uneven amounts of product are purchased by affiliates from period to period. ReadyBuilding needs to establish a formal system to monitor intercompany sales. Perhaps the best alternative would be to establish a separate series of accounts to be used solely for intercompany transfers. Alternatively, it may be possible to use unique shipping containers for intercompany sales or to specifically mark the containers in some way to identify the intercompany shipments at the time of receipt. The purchaser might then use a different type of inventory tag or mark these units in some way when the product is received and placed in inventory. Inventory count teams could then easily identify the product when inventories are taken.
c. A number of factors might be considered. The most important inventory system is the one used by the company making the intercompany purchase. When intercompany inventory purchases are bunched at the end of the year, the amount of unrealized profit included in ending inventory may be quite different under FIFO versus LIFO. If intercompany purchases are placed in a LIFO inventory base, inventories may be misstated for a period of years before the inventory is resold. Eliminating entries must be made each of the years until resale to avoid a misstatement of assets and equities. In those cases where the intercompany purchases are in high volume and the inventory turns over very quickly, a small amount of inventory left at the end of the period may be immaterial and of little concern. Typically, a parent will align inventory costing methods subsequent to a subsidiary acquisition to avoid problems caused by differences in accounting for the same items or types of items.
d. It may be necessary to start by looking at intercorporate cash receipts and disbursements to determine the extent of intercorporate sales. One or more months might be selected and all vouchers examined to establish the level of intercorporate sales and the profit margins recorded on the sales. For those products sold throughout the year, it may be possible to estimate for the year as a whole based on an examination of several months. Once total intercompany sales and profit margins have been estimated, the amount of unrealized profit at year end should be estimated. One approach would be to take a physical inventory of the specific product types which have been identified and attempt to trace back using the product identification numbers or shipping numbers to determine what portion of the inventory on hand was purchased from affiliates.
Chapter 06 - Intercompany Inventory Transactions
6-8
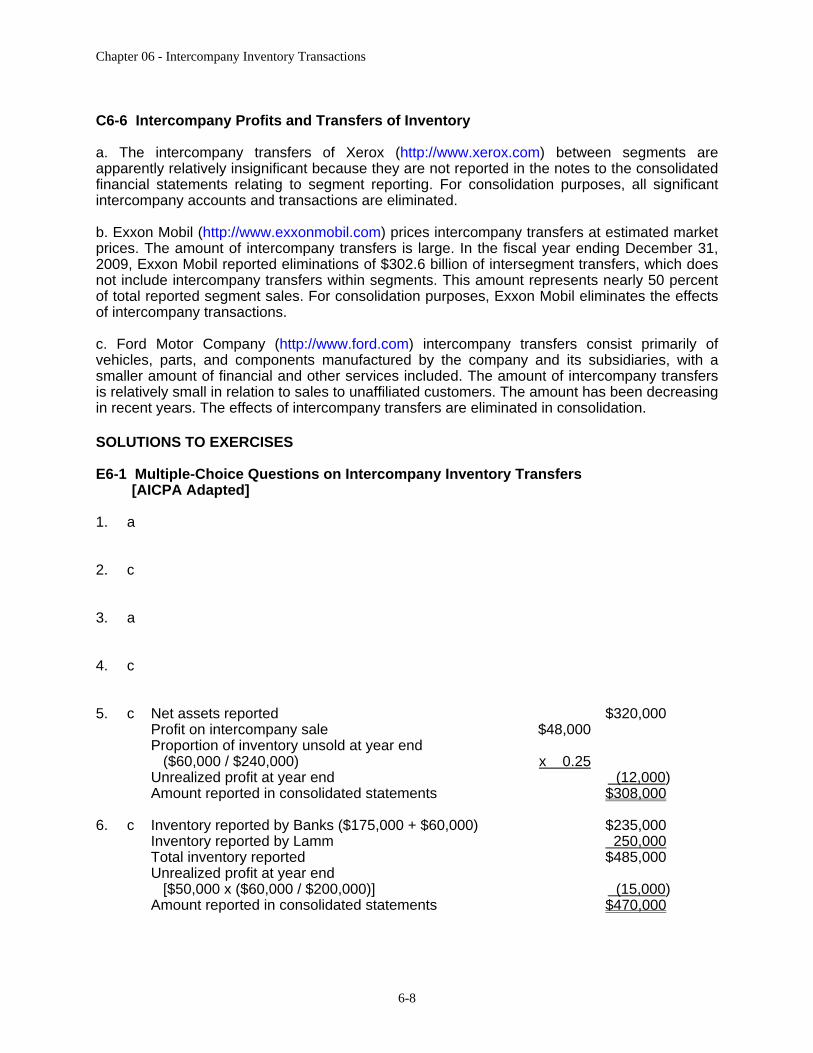
C6-6 Intercompany Profits and Transfers of Inventory
a. The intercompany transfers of Xerox (http://www.xerox.com) between segments are apparently relatively insignificant because they are not reported in the notes to the consolidated financial statements relating to segment reporting. For consolidation purposes, all significant intercompany accounts and transactions are eliminated.
b. Exxon Mobil (http://www.exxonmobil.com) prices intercompany transfers at estimated market prices. The amount of intercompany transfers is large. In the fiscal year ending December 31, 2009, Exxon Mobil reported eliminations of $302.6 billion of intersegment transfers, which does not include intercompany transfers within segments. This amount represents nearly 50 percent of total reported segment sales. For consolidation purposes, Exxon Mobil eliminates the effects of intercompany transactions.
c. Ford Motor Company (http://www.ford.com) intercompany transfers consist primarily of vehicles, parts, and components manufactured by the company and its subsidiaries, with a smaller amount of financial and other services included. The amount of intercompany transfers is relatively small in relation to sales to unaffiliated customers. The amount has been decreasing in recent years. The effects of intercompany transfers are eliminated in consolidation.
SOLUTIONS TO EXERCISES
E6-1 Multiple-Choice Questions on Intercompany Inventory Transfers [AICPA Adapted]
1. a
2. c
3. a
4. c
5. c Net assets reported
$320,000
Profit on intercompany sale $48,000
Proportion of inventory unsold at year end
($60,000 / $240,000) x 0.25
Unrealized profit at year end
(12,000)
Amount reported in consolidated statements
$308,000
6. c Inventory reported by Banks ($175,000 + $60,000)
$235,000
Inventory reported by Lamm
250,000
Total inventory reported
$485,000
Unrealized profit at year end
[$50,000 x ($60,000 / $200,000)]
(15,000)
Amount reported in consolidated statements
$470,000
Chapter 06 - Intercompany Inventory Transactions
6-9
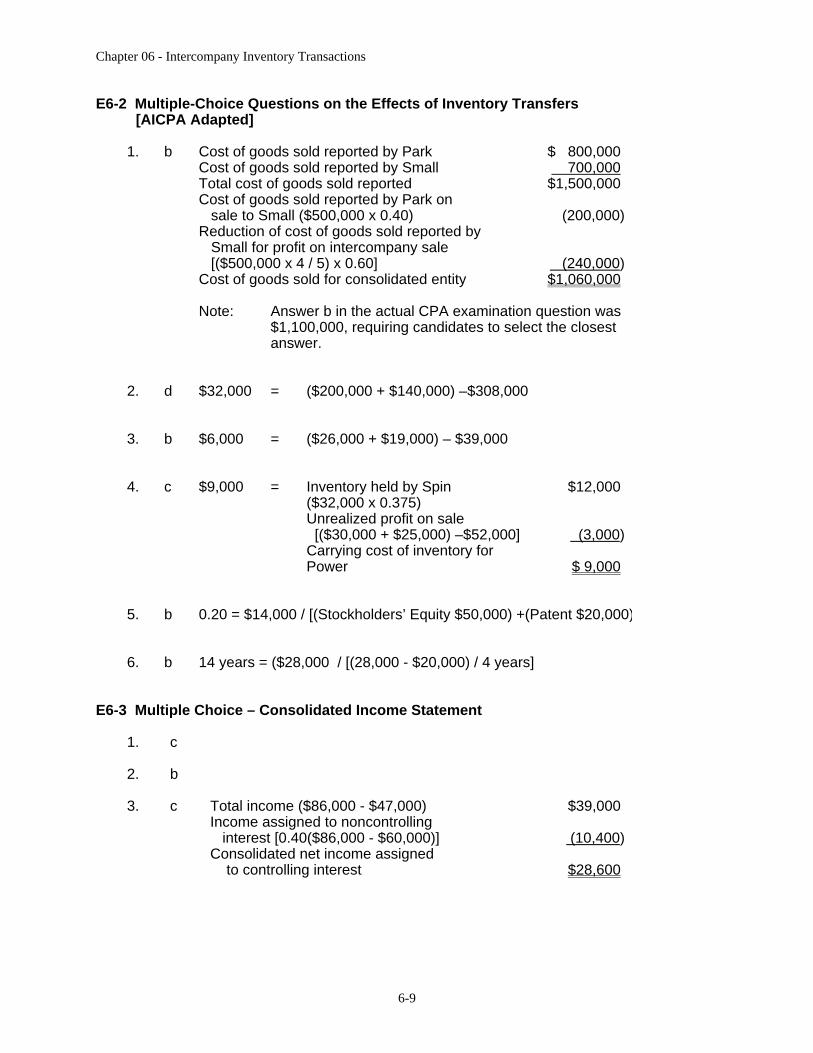
E6-2 Multiple-Choice Questions on the Effects of Inventory Transfers [AICPA Adapted]
1. b Cost of goods sold reported by Park $ 800,000
Cost of goods sold reported by Small 700,000
Total cost of goods sold reported $1,500,000
Cost of goods sold reported by Park on
sale to Small ($500,000 x 0.40) (200,000)
Reduction of cost of goods sold reported by
Small for profit on intercompany sale
[($500,000 x 4 / 5) x 0.60] (240,000)
Cost of goods sold for consolidated entity $1,060,000
Note: Answer b in the actual CPA examination question was $1,100,000, requiring candidates to select the closest answer.
2. d $32,000 = ($200,000 + $140,000) –$308,000
3. b $6,000 = ($26,000 + $19,000) – $39,000
4. c $9,000 = Inventory held by Spin ($32,000 x 0.375)
$12,000
Unrealized profit on sale
[($30,000 + $25,000) –$52,000] (3,000)
Carrying cost of inventory for Power
$ 9,000
5. b 0.20 = $14,000 / [(Stockholders’ Equity $50,000) +(Patent $20,000)]
6. b 14 years = ($28,000 / [(28,000 - $20,000) / 4 years]
E6-3 Multiple Choice – Consolidated Income Statement
1. c
2. b
3. c Total income ($86,000 - $47,000) $39,000
Income assigned to noncontrolling
interest [0.40($86,000 - $60,000)] (10,400)
Consolidated net income assigned
to controlling interest $28,600

Chapter 06 - Intercompany Inventory Transactions
6-10
E6-4 Multiple-Choice Questions — Consolidated Balances
1. c
2. a Amount paid by Lorn Corporation
$120,000
Unrealized profit
(45,000)
Actual cost
$ 75,000
Portion sold
x 0.80
Cost of goods sold
$ 60,000
3. e Consolidated sales
$140,000
Cost of goods sold
(60,000)
Consolidated net income
$ 80,000
Income to Dresser’s noncontrolling
interest:
Sales $120,000
Reported cost of sales (75,000)
Report income $ 45,000
Portion realized x 0.80
Realized net income $ 36,000
Portion to Noncontrolling
Interest x 0.30
Income to noncontrolling
Interest
(10,800)
Income to controlling interest
$ 69,200
4. a Inventory reported by Lorn
$ 24,000
Unrealized profit ($45,000 x .20)
(9,000)
Ending inventory reported
$ 15,000
E6-5 Multiple-Choice Questions — Consolidated Income Statement
1. a $20,000 = $30,000 x [($48,000 - $16,000) / $48,000]
2. d Sales reported by Movie Productions Inc. $67,000
Cost of goods sold ($30,000 x 2/3) (20,000)
Consolidated net income $47,000
3. a $7,000 = [($67,000 - $32,000) x 0.20]
Chapter 06 - Intercompany Inventory Transactions
6-11
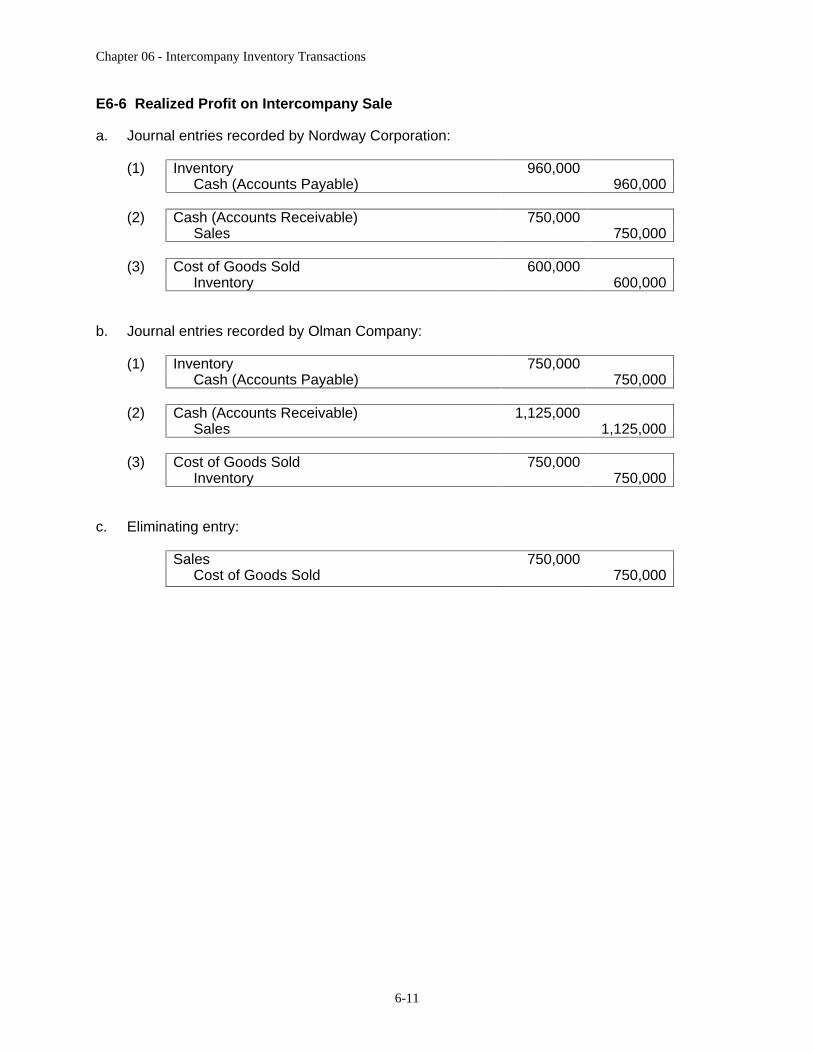
E6-6 Realized Profit on Intercompany Sale
a. Journal entries recorded by Nordway Corporation:
(1) Inventory 960,000
Cash (Accounts Payable)
960,000
(2) Cash (Accounts Receivable) 750,000
Sales
750,000
(3) Cost of Goods Sold 600,000
Inventory
600,000
b. Journal entries recorded by Olman Company:
(1) Inventory 750,000
Cash (Accounts Payable)
750,000
(2) Cash (Accounts Receivable) 1,125,000
Sales
1,125,000
(3) Cost of Goods Sold 750,000
Inventory
750,000
c. Eliminating entry:
Sales 750,000
Cost of Goods Sold
750,000

Chapter 06 - Intercompany Inventory Transactions
6-12
E6-7 Sale of Inventory to Subsidiary
a. Journal entries recorded by Nordway Corporation:
(1) Inventory 960,000
Cash (Accounts Payable)
960,000
(2) Cash (Accounts Receivable) 750,000
Sales
750,000
(3) Cost of Goods Sold 600,000
Inventory
600,000
b. Journal entries recorded by Olman Company:
(1) Inventory 750,000
Cash (Accounts Payable)
750,000
(2) Cash (Accounts Receivable) 810,000
Sales
810,000
(3) Cost of Goods Sold 540,000
Inventory
540,000
c. Eliminating entry:
Sales 750,000
Cost of Goods Sold
708,000
Inventory
42,000
Calculations
Total =
Re-Sold
+
Ending Inventory
Sales 750,000
540,000
210,000
COGS 600,000
432,000
168,000
Gross Profit 150,000
108,000
42,000
Gross Profit % 20%
Chapter 06 - Intercompany Inventory Transactions
6-13
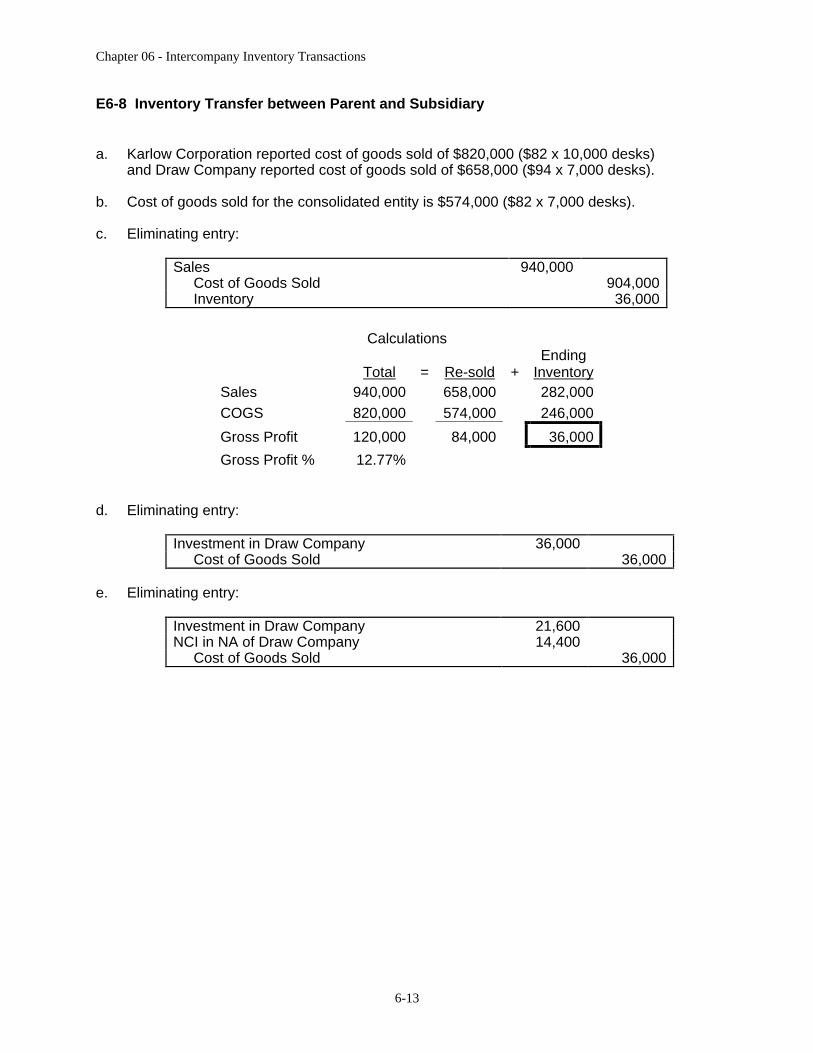
E6-8 Inventory Transfer between Parent and Subsidiary
a. Karlow Corporation reported cost of goods sold of $820,000 ($82 x 10,000 desks) and Draw Company reported cost of goods sold of $658,000 ($94 x 7,000 desks).
b. Cost of goods sold for the consolidated entity is $574,000 ($82 x 7,000 desks).
c. Eliminating entry:
Sales 940,000
Cost of Goods Sold
904,000
Inventory
36,000
Calculations
Total
=
Re-sold
+
Ending Inventory
Sales 940,000
658,000
282,000
COGS 820,000
574,000
246,000
Gross Profit 120,000
84,000
36,000
Gross Profit % 12.77%
d. Eliminating entry:
Investment in Draw Company 36,000
Cost of Goods Sold
36,000
e. Eliminating entry:
Investment in Draw Company 21,600
NCI in NA of Draw Company 14,400
Cost of Goods Sold
36,000
Chapter 06 - Intercompany Inventory Transactions
6-14
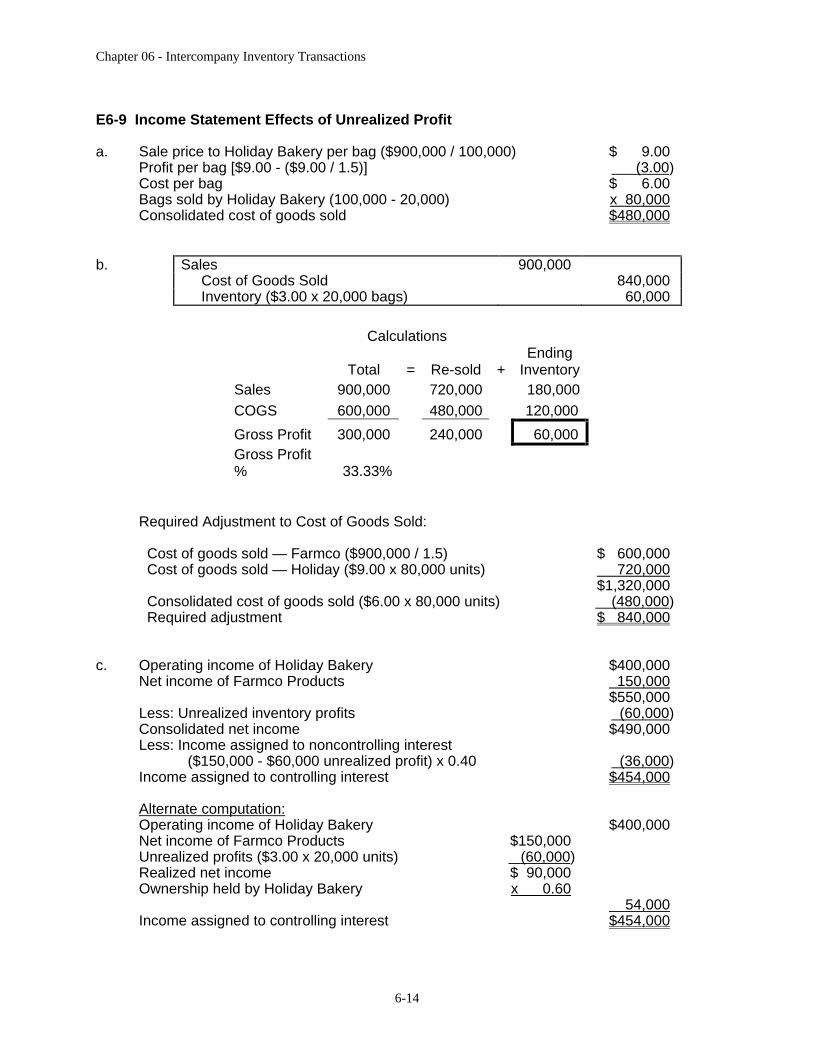
E6-9 Income Statement Effects of Unrealized Profit
a. Sale price to Holiday Bakery per bag ($900,000 / 100,000) $ 9.00
Profit per bag [$9.00 - ($9.00 / 1.5)] (3.00)
Cost per bag $ 6.00
Bags sold by Holiday Bakery (100,000 - 20,000) x 80,000
Consolidated cost of goods sold $480,000
b. Sales 900,000
Cost of Goods Sold
840,000
Inventory ($3.00 x 20,000 bags)
60,000
Calculations
Total =
Re-sold +
Ending Inventory
Sales 900,000
720,000
180,000
COGS 600,000
480,000
120,000
Gross Profit 300,000
240,000
60,000
Gross Profit % 33.33%
Required Adjustment to Cost of Goods Sold:
Cost of goods sold — Farmco ($900,000 / 1.5) $ 600,000
Cost of goods sold — Holiday ($9.00 x 80,000 units) 720,000
$1,320,000
Consolidated cost of goods sold ($6.00 x 80,000 units) (480,000)
Required adjustment $ 840,000
c. Operating income of Holiday Bakery $400,000
Net income of Farmco Products 150,000
$550,000
Less: Unrealized inventory profits (60,000)
Consolidated net income $490,000
Less: Income assigned to noncontrolling interest
($150,000 - $60,000 unrealized profit) x 0.40 (36,000)
Income assigned to controlling interest $454,000
Alternate computation:
Operating income of Holiday Bakery
$400,000
Net income of Farmco Products $150,000
Unrealized profits ($3.00 x 20,000 units) (60,000)
Realized net income $ 90,000
Ownership held by Holiday Bakery x 0.60
54,000
Income assigned to controlling interest
$454,000
Chapter 06 - Intercompany Inventory Transactions
6-15
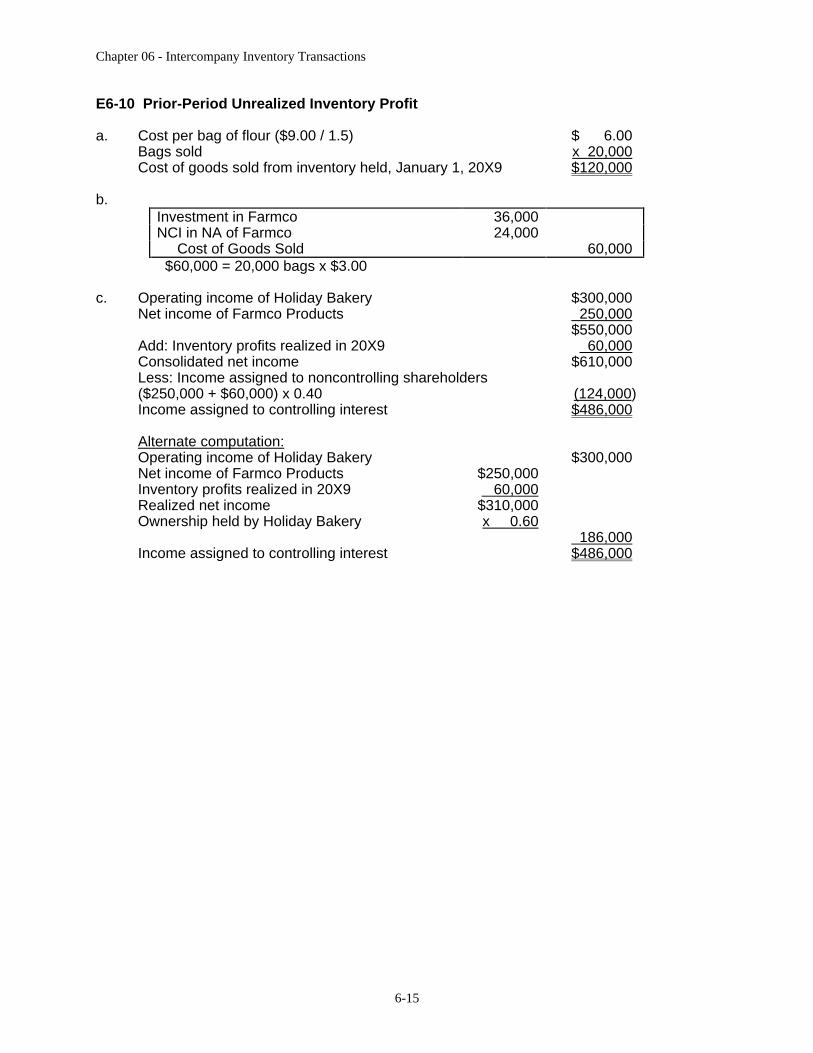
E6-10 Prior-Period Unrealized Inventory Profit
a. Cost per bag of flour ($9.00 / 1.5)
$ 6.00
Bags sold
x 20,000
Cost of goods sold from inventory held, January 1, 20X9 $120,000
b.
Investment in Farmco 36,000
NCI in NA of Farmco 24,000
Cost of Goods Sold
60,000
$60,000 = 20,000 bags x $3.00
c. Operating income of Holiday Bakery $300,000
Net income of Farmco Products 250,000
$550,000
Add: Inventory profits realized in 20X9 60,000
Consolidated net income $610,000
Less: Income assigned to noncontrolling shareholders
($250,000 + $60,000) x 0.40 (124,000)
Income assigned to controlling interest $486,000
Alternate computation:
Operating income of Holiday Bakery
$300,000
Net income of Farmco Products $250,000
Inventory profits realized in 20X9 60,000
Realized net income $310,000
Ownership held by Holiday Bakery x 0.60
186,000
Income assigned to controlling interest
$486,000

Chapter 06 - Intercompany Inventory Transactions
6-16
E6-11 Computation of Consolidated Income Statement Data
Downstream Transaction Calculations
Total
=
Re-sold
+
Ending
Inventory
Sales 30,000
24,000
6,000
COGS 20,000
16,000
4,000
Gross Profit 10,000
8,000
2,000
Gross Profit % 33.33%
Worksheet Entry (not requested in problem) Sales
30,000
Cost of Goods Sold 28,000
Inventory 2,000
Upstream Transaction Calculations
Total
=
Re-sold
+
Ending Inventory
Sales 80,000
60,000
20,000
COGS 50,000
37,500
12,500
Gross Profit 30,000
22,500
7,500
Gross Profit % 37.50%
Worksheet Entry (not requested in problem) Sales
80,000
Cost of Goods Sold 72,500
Inventory 7,500
a. Reported sales of Prem Company
$400,000
Reported sales of Cooper Company
200,000
$600,000
Intercompany sales by Prem Company in 20X5 $ 30,000
Intercompany sales by Cooper Company in 20X5 80,000
(110,000)
Sales reported on consolidated income statement
$490,000
Chapter 06 - Intercompany Inventory Transactions
6-17
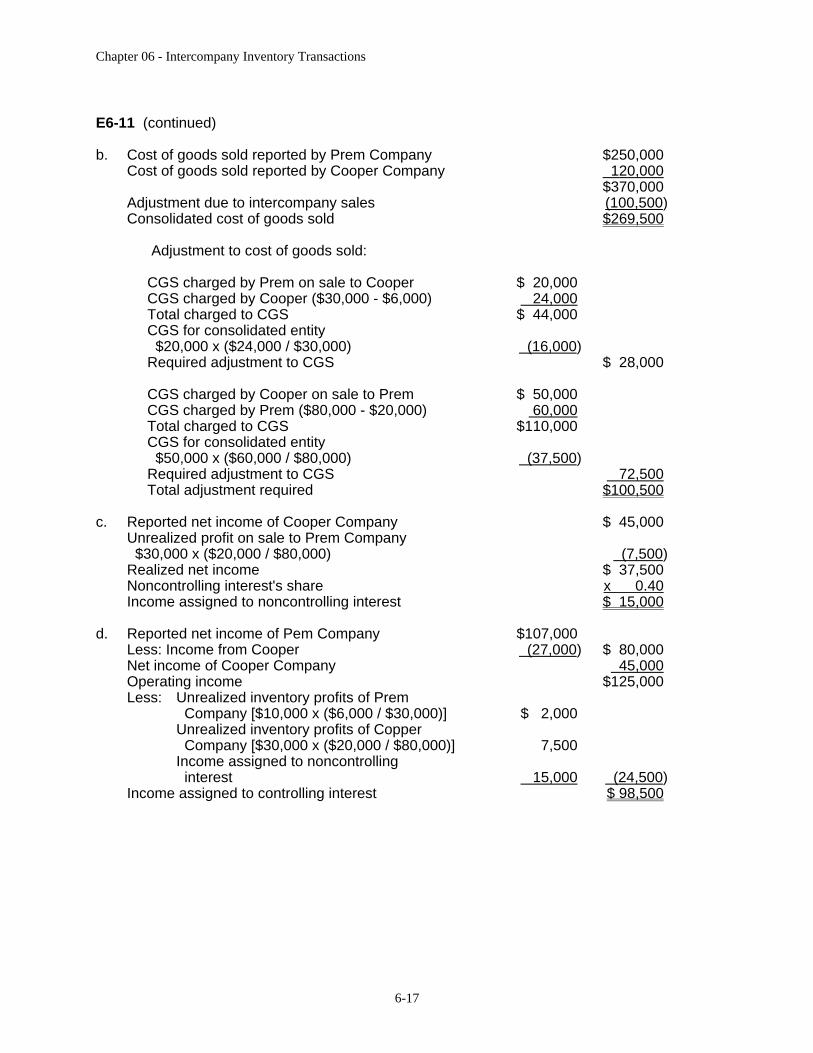
E6-11 (continued)
b. Cost of goods sold reported by Prem Company
$250,000
Cost of goods sold reported by Cooper Company
120,000
$370,000
Adjustment due to intercompany sales
(100,500)
Consolidated cost of goods sold
$269,500
Adjustment to cost of goods sold:
CGS charged by Prem on sale to Cooper $ 20,000
CGS charged by Cooper ($30,000 - $6,000) 24,000
Total charged to CGS $ 44,000
CGS for consolidated entity
$20,000 x ($24,000 / $30,000) (16,000)
Required adjustment to CGS
$ 28,000
CGS charged by Cooper on sale to Prem $ 50,000
CGS charged by Prem ($80,000 - $20,000) 60,000
Total charged to CGS $110,000
CGS for consolidated entity
$50,000 x ($60,000 / $80,000) (37,500)
Required adjustment to CGS
72,500
Total adjustment required
$100,500
c. Reported net income of Cooper Company
$ 45,000
Unrealized profit on sale to Prem Company
$30,000 x ($20,000 / $80,000)
(7,500)
Realized net income
$ 37,500
Noncontrolling interest's share
x 0.40
Income assigned to noncontrolling interest
$ 15,000
d. Reported net income of Pem Company $107,000
Less: Income from Cooper (27,000)
$ 80,000
Net income of Cooper Company
45,000
Operating income
$125,000
Less:
Unrealized inventory profits of Prem
Company [$10,000 x ($6,000 / $30,000)] $ 2,000
Unrealized inventory profits of Copper
Company [$30,000 x ($20,000 / $80,000)] 7,500
Income assigned to noncontrolling
interest 15,000
(24,500)
Income assigned to controlling interest
$ 98,500
Chapter 06 - Intercompany Inventory Transactions
6-18
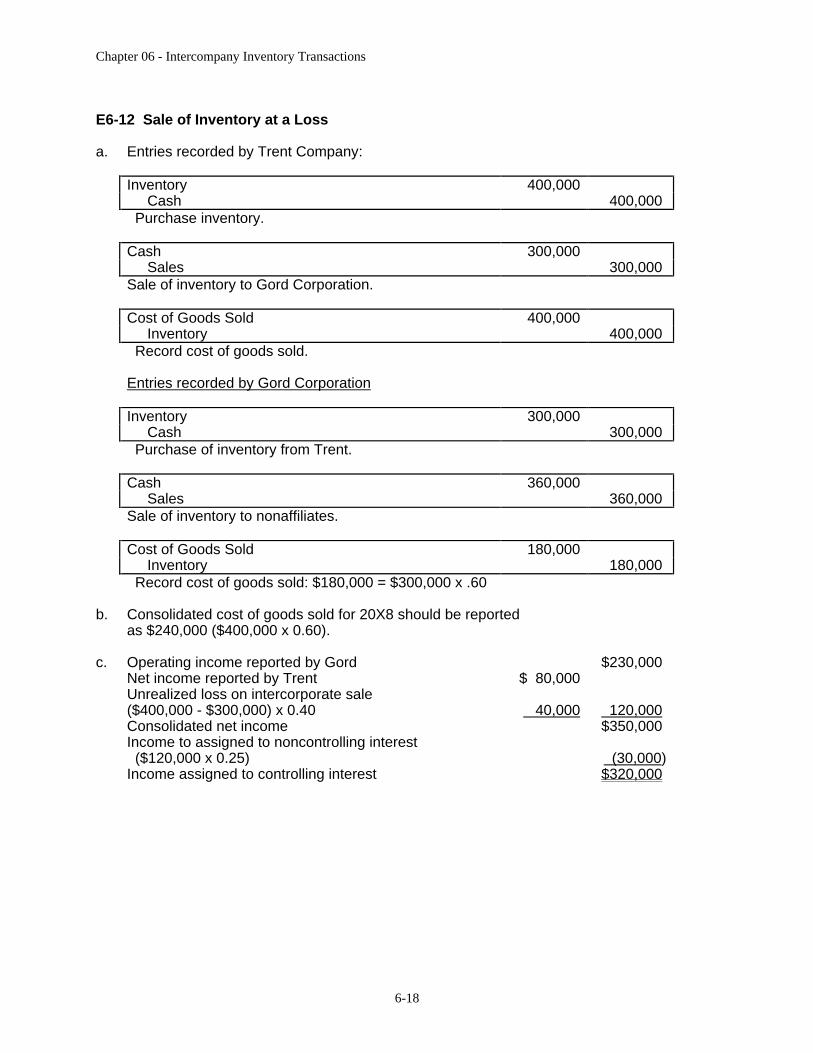
E6-12 Sale of Inventory at a Loss
a. Entries recorded by Trent Company:
Inventory 400,000
Cash
400,000
Purchase inventory.
Cash 300,000
Sales
300,000
Sale of inventory to Gord Corporation.
Cost of Goods Sold 400,000
Inventory
400,000
Record cost of goods sold.
Entries recorded by Gord Corporation
Inventory 300,000
Cash
300,000
Purchase of inventory from Trent.
Cash 360,000
Sales
360,000
Sale of inventory to nonaffiliates.
Cost of Goods Sold 180,000
Inventory
180,000
Record cost of goods sold: $180,000 = $300,000 x .60
b. Consolidated cost of goods sold for 20X8 should be reported as $240,000 ($400,000 x 0.60).
c. Operating income reported by Gord
$230,000
Net income reported by Trent $ 80,000
Unrealized loss on intercorporate sale
($400,000 - $300,000) x 0.40 40,000
120,000
Consolidated net income
$350,000
Income to assigned to noncontrolling interest ($120,000 x 0.25)
(30,000)
Income assigned to controlling interest
$320,000

Chapter 06 - Intercompany Inventory Transactions
6-19
E6-12 (continued)
d. Eliminating entry, December 31, 20X8:
Sales 300,000
Inventory 40,000
Cost of Goods Sold
340,000
Computation of cost of goods sold to be eliminated
Cost of goods sold recorded by Trent
$400,000
Cost of goods sold recorded by Gord
180,000
Total recorded
$580,000
Consolidated cost of goods sold
(240,000)
Required elimination
$340,000
Intercompany Transaction Calculations
Total
=
Re-sold
+
Ending Inventory
Sales 300,000
180,000
120,000
COGS 400,000
240,000
160,000
Gross Profit (100,000)
(60,000)
(40,000)
Gross Profit % -33.33%
Chapter 06 - Intercompany Inventory Transactions
6-20
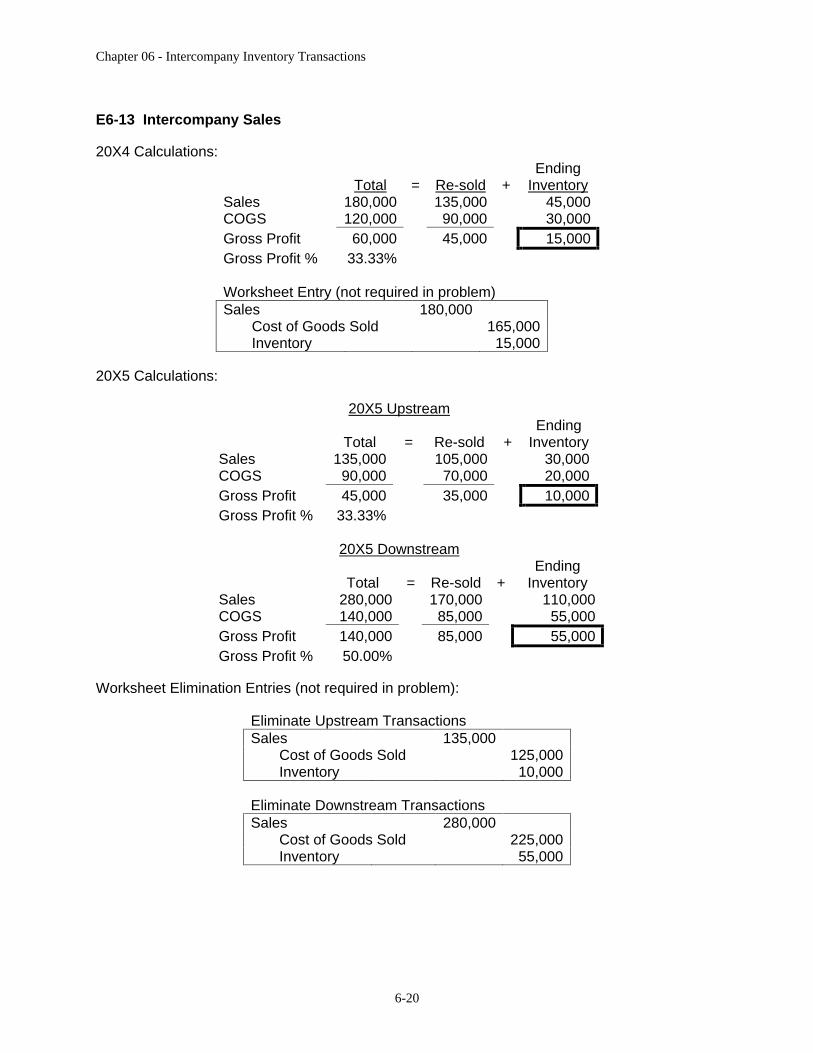
E6-13 Intercompany Sales
20X4 Calculations:
Total
=
Re-sold
+
Ending
Inventory
Sales 180,000
135,000
45,000
COGS 120,000
90,000
30,000
Gross Profit 60,000
45,000
15,000
Gross Profit % 33.33%
Worksheet Entry (not required in problem) Sales 180,000
Cost of Goods Sold 165,000
Inventory 15,000
20X5 Calculations:
20X5 Upstream
Total = Re-sold + Ending
Inventory
Sales 135,000
105,000
30,000
COGS 90,000
70,000
20,000
Gross Profit 45,000
35,000
10,000
Gross Profit % 33.33%
20X5 Downstream
Total =
Re-sold +
Ending Inventory
Sales 280,000
170,000
110,000
COGS 140,000
85,000
55,000
Gross Profit 140,000
85,000
55,000
Gross Profit % 50.00%
Worksheet Elimination Entries (not required in problem):
Eliminate Upstream Transactions Sales
135,000
Cost of Goods Sold 125,000
Inventory 10,000
Eliminate Downstream Transactions Sales
280,000
Cost of Goods Sold 225,000
Inventory 55,000
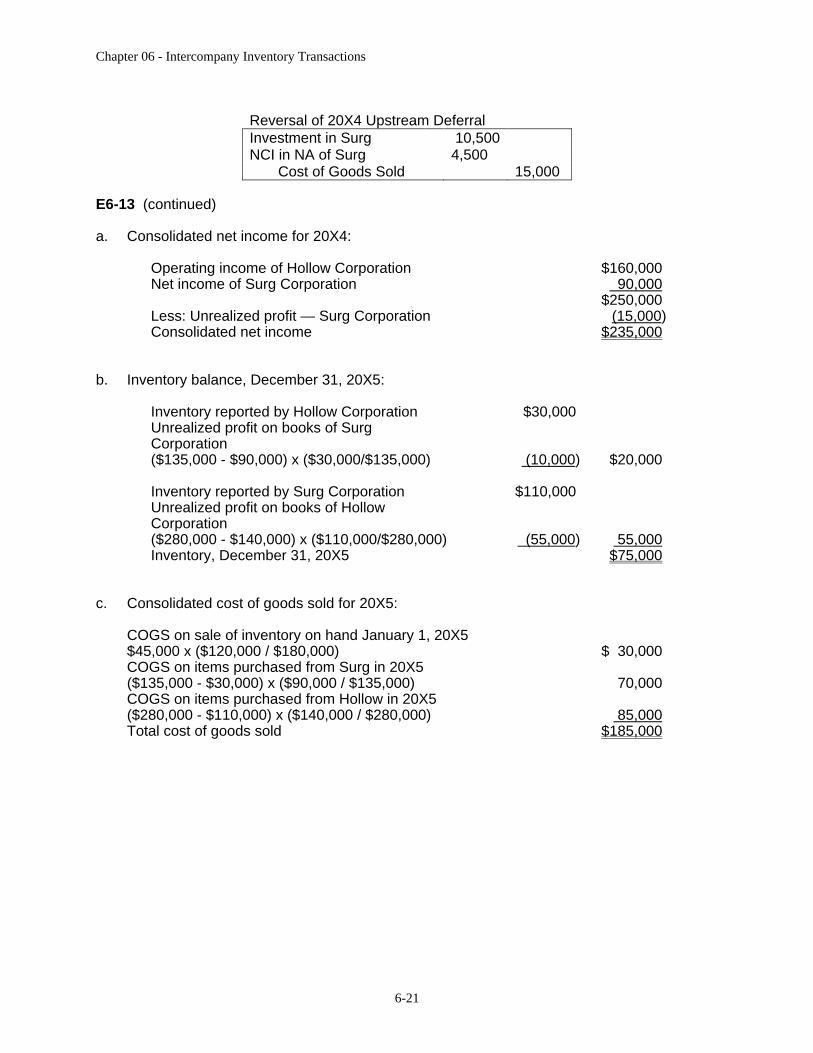
Chapter 06 - Intercompany Inventory Transactions
6-21
Reversal of 20X4 Upstream Deferral Investment in Surg
10,500
NCI in NA of Surg
4,500
Cost of Goods Sold 15,000
E6-13 (continued)
a. Consolidated net income for 20X4:
Operating income of Hollow Corporation
$160,000
Net income of Surg Corporation
90,000
$250,000
Less: Unrealized profit — Surg Corporation
(15,000)
Consolidated net income
$235,000
b. Inventory balance, December 31, 20X5:
Inventory reported by Hollow Corporation $30,000
Unrealized profit on books of Surg
Corporation
($135,000 - $90,000) x ($30,000/$135,000) (10,000)
$20,000
Inventory reported by Surg Corporation $110,000
Unrealized profit on books of Hollow
Corporation
($280,000 - $140,000) x ($110,000/$280,000) (55,000)
55,000
Inventory, December 31, 20X5
$75,000
c. Consolidated cost of goods sold for 20X5:
COGS on sale of inventory on hand January 1, 20X5
$45,000 x ($120,000 / $180,000)
$ 30,000
COGS on items purchased from Surg in 20X5
($135,000 - $30,000) x ($90,000 / $135,000)
70,000
COGS on items purchased from Hollow in 20X5
($280,000 - $110,000) x ($140,000 / $280,000)
85,000
Total cost of goods sold
$185,000
Chapter 06 - Intercompany Inventory Transactions
6-22
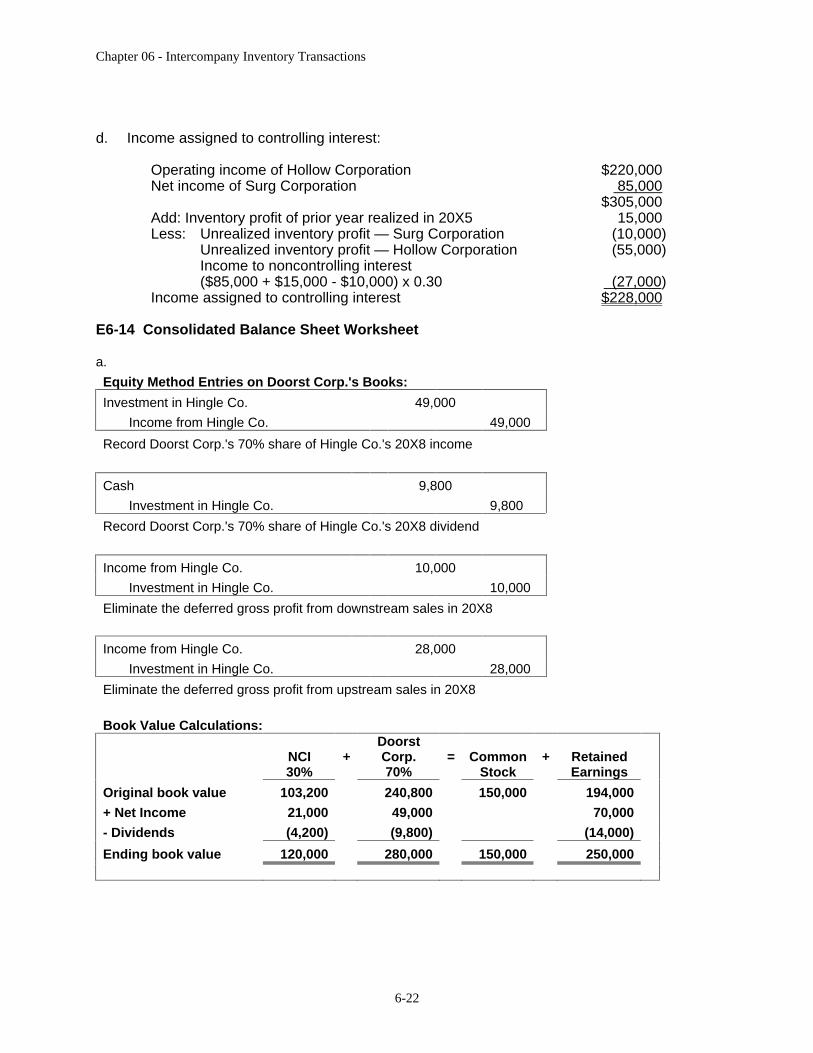
d. Income assigned to controlling interest:
Operating income of Hollow Corporation
$220,000
Net income of Surg Corporation
85,000
$305,000
Add: Inventory profit of prior year realized in 20X5
15,000
Less:
Unrealized inventory profit — Surg Corporation (10,000)
Unrealized inventory profit — Hollow Corporation (55,000)
Income to noncontrolling interest
($85,000 + $15,000 - $10,000) x 0.30
(27,000)
Income assigned to controlling interest
$228,000
E6-14 Consolidated Balance Sheet Worksheet
a.
Equity Method Entries on Doorst Corp.'s Books:
Investment in Hingle Co.
49,000
Income from Hingle Co.
49,000
Record Doorst Corp.'s 70% share of Hingle Co.'s 20X8 income
Cash
9,800
Investment in Hingle Co. 9,800
Record Doorst Corp.'s 70% share of Hingle Co.'s 20X8 dividend
Income from Hingle Co.
10,000
Investment in Hingle Co.
10,000
Eliminate the deferred gross profit from downstream sales in 20X8
Income from Hingle Co.
28,000
Investment in Hingle Co.
28,000
Eliminate the deferred gross profit from upstream sales in 20X8
Book Value Calculations:
NCI 30%
+
Doorst Corp. 70%
=
Common
Stock + Retained
Earnings
Original book value 103,200
240,800
150,000
194,000
+ Net Income 21,000
49,000
70,000
- Dividends (4,200)
(9,800)
(14,000)
Ending book value 120,000
280,000
150,000
250,000
Chapter 06 - Intercompany Inventory Transactions
6-23
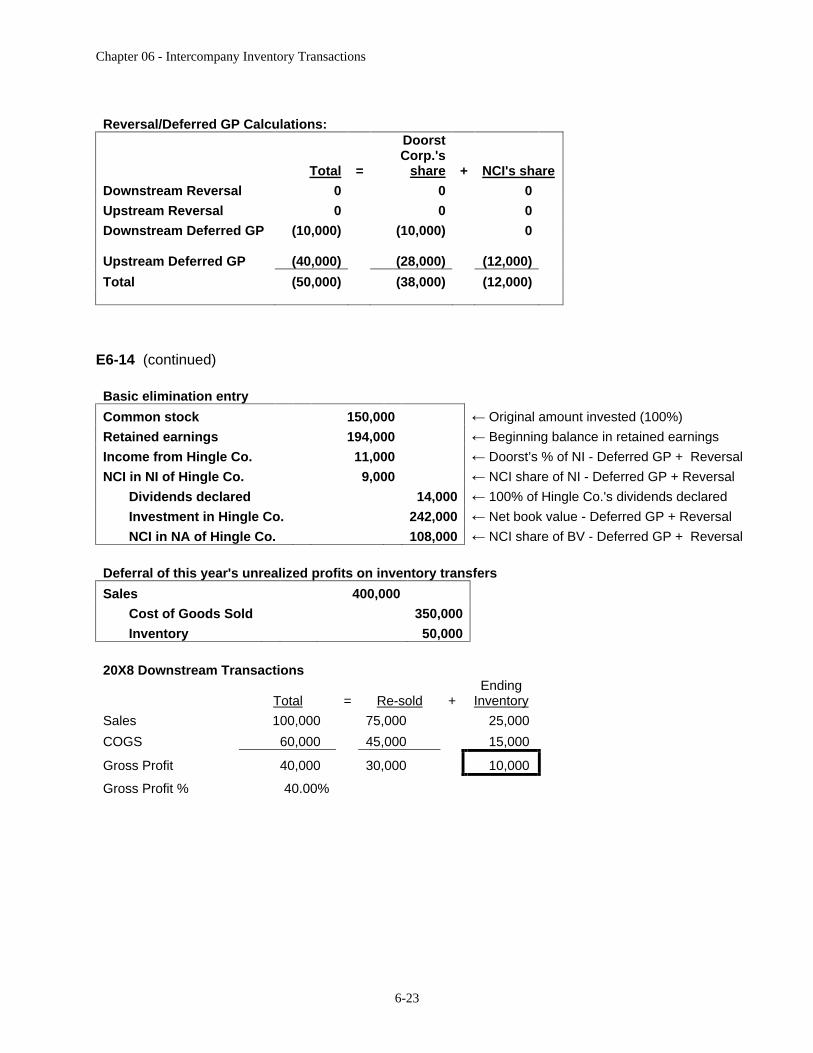
Reversal/Deferred GP Calculations:
Total
=
Doorst Corp.'s
share
+
NCI's share
Downstream Reversal 0
0
0
Upstream Reversal 0
0
0
Downstream Deferred GP (10,000)
(10,000)
0
Upstream Deferred GP (40,000)
(28,000)
(12,000)
Total (50,000)
(38,000)
(12,000)
E6-14 (continued)
Basic elimination entry
Common stock
150,000
Original amount invested (100%)
Retained earnings
194,000
Beginning balance in retained earnings
Income from Hingle Co.
11,000
Doorst’s % of NI - Deferred GP + Reversal
NCI in NI of Hingle Co.
9,000
NCI share of NI - Deferred GP + Reversal
Dividends declared
14,000
100% of Hingle Co.'s dividends declared
Investment in Hingle Co.
242,000
Net book value - Deferred GP + Reversal
NCI in NA of Hingle Co.
108,000
NCI share of BV - Deferred GP + Reversal
Deferral of this year's unrealized profits on inventory transfers
Sales
400,000
Cost of Goods Sold 350,000
Inventory
50,000
20X8 Downstream Transactions
Total
=
Re-sold
+
Ending Inventory
Sales 100,000 75,000 25,000
COGS 60,000 45,000 15,000
Gross Profit 40,000 30,000 10,000
Gross Profit % 40.00%
Chapter 06 - Intercompany Inventory Transactions
6-24
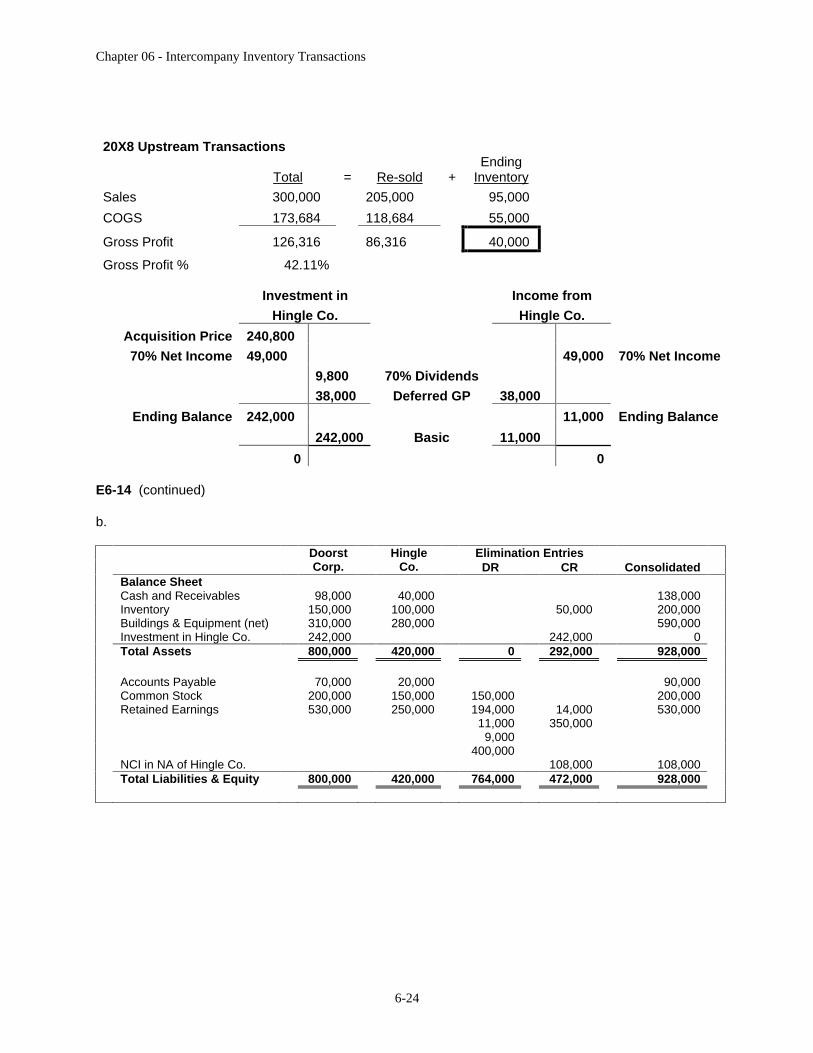
20X8 Upstream Transactions
Total
=
Re-sold
+
Ending
Inventory
Sales 300,000 205,000 95,000
COGS 173,684 118,684 55,000
Gross Profit 126,316 86,316 40,000
Gross Profit % 42.11%
Investment in Income from
Hingle Co. Hingle Co.
Acquisition Price
240,800
70% Net Income
49,000 49,000
70% Net Income
9,800 70% Dividends
38,000 Deferred GP 38,000
Ending Balance
242,000 11,000
Ending Balance
242,000
Basic 11,000
0
0
E6-14 (continued)
b.
Elimination Entries
Doorst Corp.
Hingle Co. DR CR Consolidated
Balance Sheet
Cash and Receivables 98,000
40,000
138,000
Inventory 150,000
100,000
50,000
200,000
Buildings & Equipment (net) 310,000
280,000
590,000
Investment in Hingle Co. 242,000
242,000
0
Total Assets 800,000
420,000
0
292,000
928,000
Accounts Payable 70,000
20,000
90,000
Common Stock 200,000
150,000
150,000
200,000
Retained Earnings 530,000
250,000
194,000
14,000
530,000
11,000
350,000
9,000
400,000
NCI in NA of Hingle Co. 108,000
108,000
Total Liabilities & Equity 800,000
420,000
764,000
472,000
928,000
Chapter 06 - Intercompany Inventory Transactions
6-25
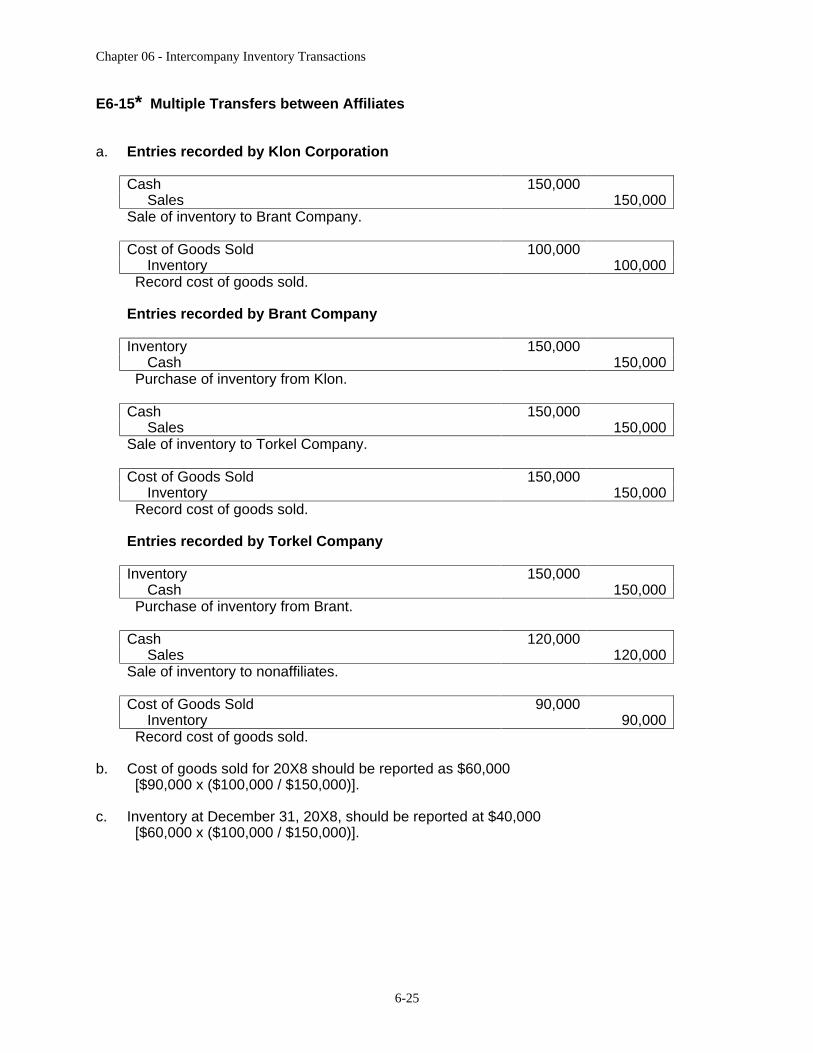
E6-15* Multiple Transfers between Affiliates
a. Entries recorded by Klon Corporation
Cash 150,000
Sales
150,000
Sale of inventory to Brant Company.
Cost of Goods Sold 100,000
Inventory
100,000
Record cost of goods sold.
Entries recorded by Brant Company
Inventory 150,000
Cash
150,000
Purchase of inventory from Klon.
Cash 150,000
Sales
150,000
Sale of inventory to Torkel Company.
Cost of Goods Sold 150,000
Inventory
150,000
Record cost of goods sold.
Entries recorded by Torkel Company
Inventory 150,000
Cash
150,000
Purchase of inventory from Brant.
Cash 120,000
Sales
120,000
Sale of inventory to nonaffiliates.
Cost of Goods Sold 90,000
Inventory
90,000
Record cost of goods sold.
b. Cost of goods sold for 20X8 should be reported as $60,000 [$90,000 x ($100,000 / $150,000)].
c. Inventory at December 31, 20X8, should be reported at $40,000 [$60,000 x ($100,000 / $150,000)].
Chapter 06 - Intercompany Inventory Transactions
6-26
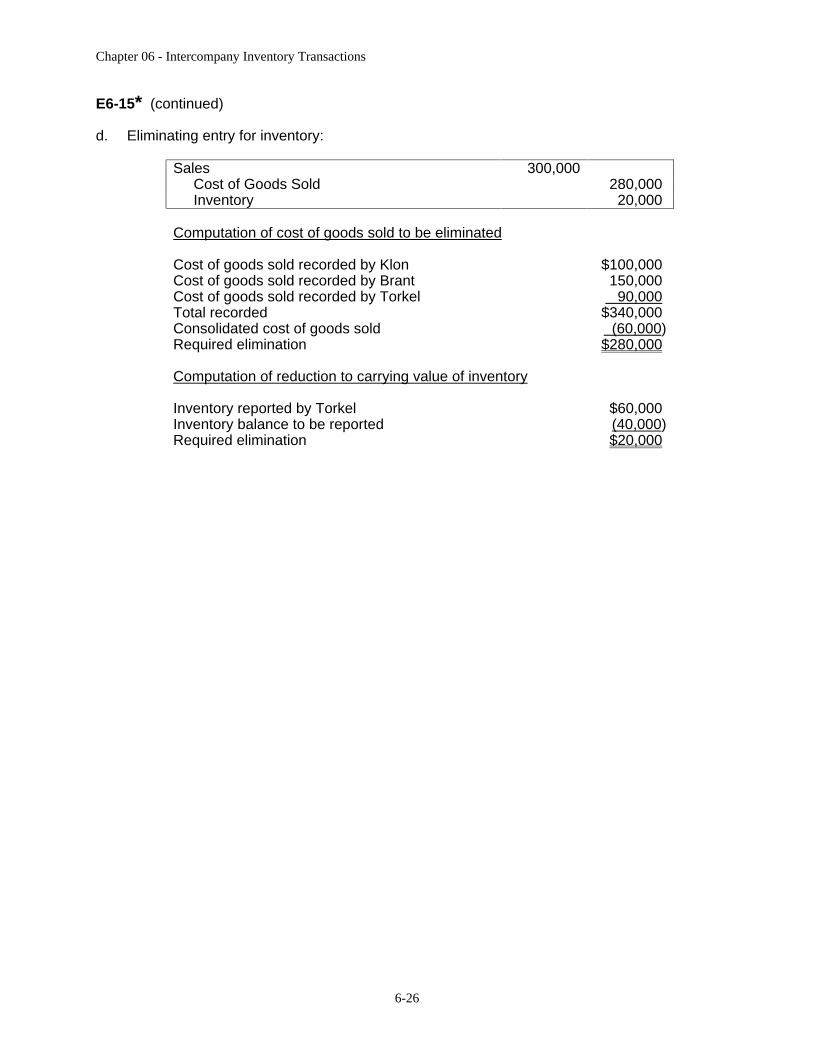
E6-15* (continued)
d. Eliminating entry for inventory:
Sales 300,000
Cost of Goods Sold
280,000
Inventory
20,000
Computation of cost of goods sold to be eliminated
Cost of goods sold recorded by Klon
$100,000
Cost of goods sold recorded by Brant
150,000
Cost of goods sold recorded by Torkel
90,000
Total recorded
$340,000
Consolidated cost of goods sold
(60,000)
Required elimination
$280,000
Computation of reduction to carrying value of inventory
Inventory reported by Torkel
$60,000
Inventory balance to be reported
(40,000)
Required elimination
$20,000
Chapter 06 - Intercompany Inventory Transactions
6-27
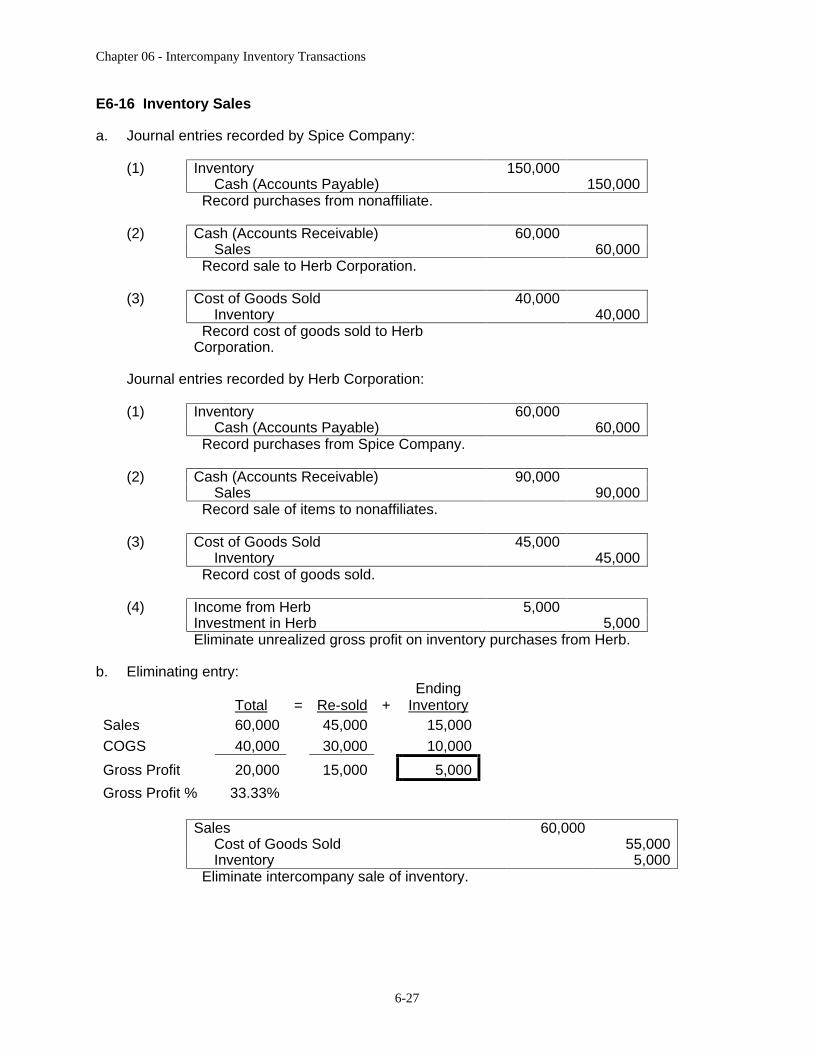
E6-16 Inventory Sales
a. Journal entries recorded by Spice Company:
(1) Inventory 150,000
Cash (Accounts Payable)
150,000
Record purchases from nonaffiliate.
(2) Cash (Accounts Receivable) 60,000
Sales
60,000
Record sale to Herb Corporation.
(3) Cost of Goods Sold 40,000
Inventory
40,000
Record cost of goods sold to Herb Corporation.
Journal entries recorded by Herb Corporation:
(1) Inventory 60,000
Cash (Accounts Payable)
60,000
Record purchases from Spice Company.
(2) Cash (Accounts Receivable) 90,000
Sales
90,000
Record sale of items to nonaffiliates.
(3) Cost of Goods Sold 45,000
Inventory
45,000
Record cost of goods sold.
(4) Income from Herb 5,000
Investment in Herb
5,000
Eliminate unrealized gross profit on inventory purchases from Herb.
b. Eliminating entry:
Total
=
Re-sold
+
Ending Inventory
Sales 60,000
45,000
15,000
COGS 40,000
30,000
10,000
Gross Profit 20,000
15,000
5,000
Gross Profit % 33.33%
Sales 60,000
Cost of Goods Sold
55,000
Inventory
5,000
Eliminate intercompany sale of inventory.

Chapter 06 - Intercompany Inventory Transactions
6-28
E6-17 Prior-Period Inventory Profits
a. 20X8 Sale:
Total
=
Re-sold
+
Ending
Inventory
Sales 180,000
170,000
30,000
COGS 120,000
113,333
20,000
Gross Profit 60,000
56,667
10,000
Gross Profit % 33.33%
20X9 Sale:
Total
=
Re-sold
+
Ending Inventory
Sales 240,000
170,000
150,000
COGS 160,000
113,333
100,000
Gross Profit 80,000
56,667
50,000
Gross Profit % 33.33%
Investment in Level Brothers 7,500
NCI in NA of Level Brothers 2,500
Cost of goods sold
10,000
Reversal of 20X8 gross profit deferral
Sales 240,000
Cost of Goods Sold
190,000
Inventory
50,000
Eliminate 20X9 intercompany sale of inventory.
b. 20X8
20X9
Reported net income of Level Brothers $350,000
$420,000
Unrealized profit, December 31, 20X8 (10,000)
10,000
Unrealized profit, December 31, 20X9
(50,000)
Realized net income $340,000
$380,000
Noncontrolling interest's share of ownership x 0.25
x 0.25
Income assigned to noncontrolling interest $ 85,000
$ 95,000
Chapter 06 - Intercompany Inventory Transactions
6-29
SOLUTIONS TO PROBLEMS
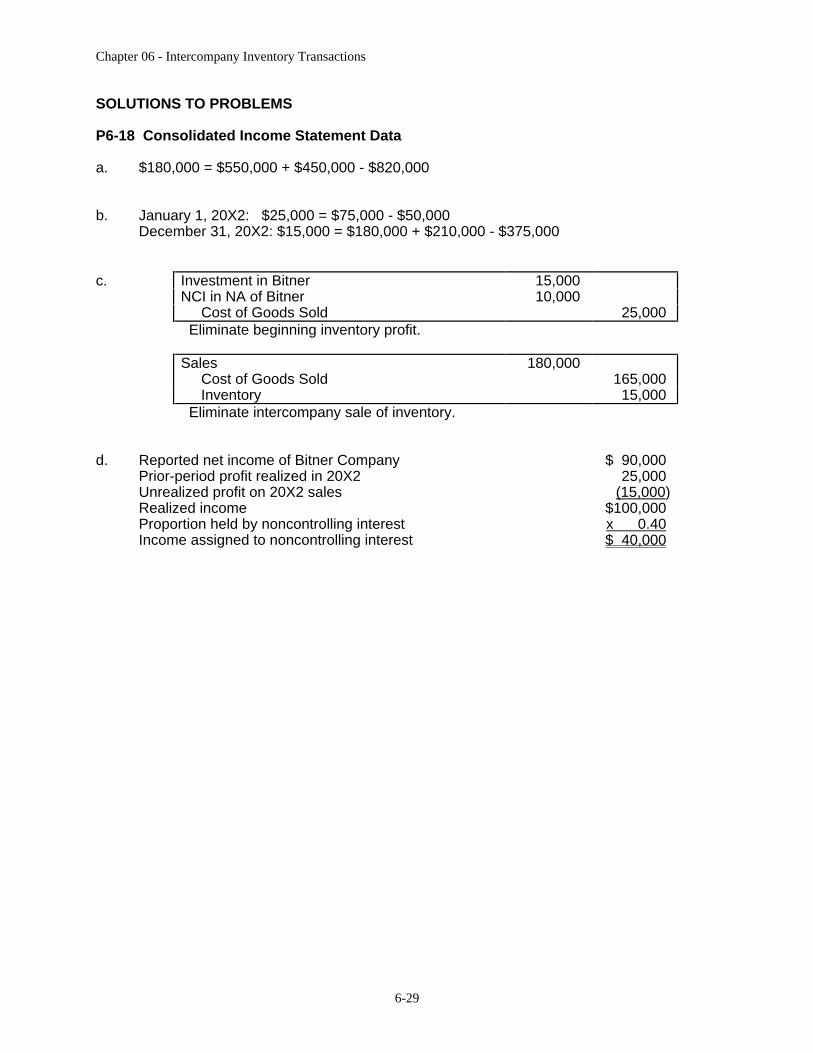
P6-18 Consolidated Income Statement Data
a. $180,000 = $550,000 + $450,000 - $820,000
b. January 1, 20X2: $25,000 = $75,000 - $50,000
December 31, 20X2: $15,000 = $180,000 + $210,000 - $375,000
c. Investment in Bitner 15,000
NCI in NA of Bitner 10,000
Cost of Goods Sold
25,000
Eliminate beginning inventory profit.
Sales 180,000
Cost of Goods Sold
165,000
Inventory
15,000
Eliminate intercompany sale of inventory.
d. Reported net income of Bitner Company
$ 90,000
Prior-period profit realized in 20X2
25,000
Unrealized profit on 20X2 sales
(15,000)
Realized income
$100,000
Proportion held by noncontrolling interest
x 0.40
Income assigned to noncontrolling interest
$ 40,000
Chapter 06 - Intercompany Inventory Transactions
6-30
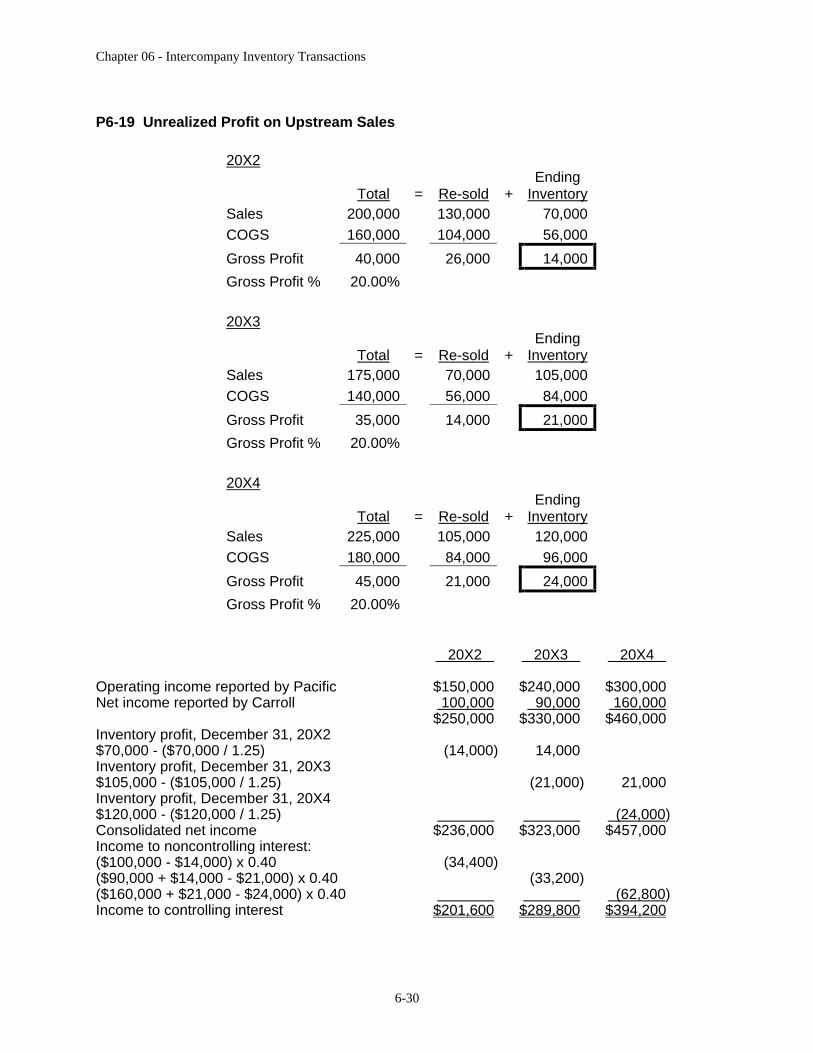
P6-19 Unrealized Profit on Upstream Sales
20X2
Total
=
Re-sold
+
Ending
Inventory
Sales 200,000
130,000
70,000
COGS 160,000
104,000
56,000
Gross Profit 40,000
26,000
14,000
Gross Profit % 20.00%
20X3
Total
=
Re-sold
+
Ending Inventory
Sales 175,000
70,000
105,000
COGS 140,000
56,000
84,000
Gross Profit 35,000
14,000
21,000
Gross Profit % 20.00%
20X4
Total
=
Re-sold
+
Ending Inventory
Sales 225,000
105,000
120,000
COGS 180,000
84,000
96,000
Gross Profit 45,000
21,000
24,000
Gross Profit % 20.00%
20X2
20X3
20X4
Operating income reported by Pacific $150,000
$240,000
$300,000
Net income reported by Carroll 100,000
90,000
160,000
$250,000
$330,000
$460,000
Inventory profit, December 31, 20X2
$70,000 - ($70,000 / 1.25) (14,000)
14,000
Inventory profit, December 31, 20X3
$105,000 - ($105,000 / 1.25)
(21,000)
21,000
Inventory profit, December 31, 20X4
$120,000 - ($120,000 / 1.25)
(24,000)
Consolidated net income $236,000
$323,000
$457,000
Income to noncontrolling interest:
($100,000 - $14,000) x 0.40 (34,400)
($90,000 + $14,000 - $21,000) x 0.40
(33,200)
($160,000 + $21,000 - $24,000) x 0.40
(62,800)
Income to controlling interest $201,600
$289,800
$394,200
Chapter 06 - Intercompany Inventory Transactions
6-31
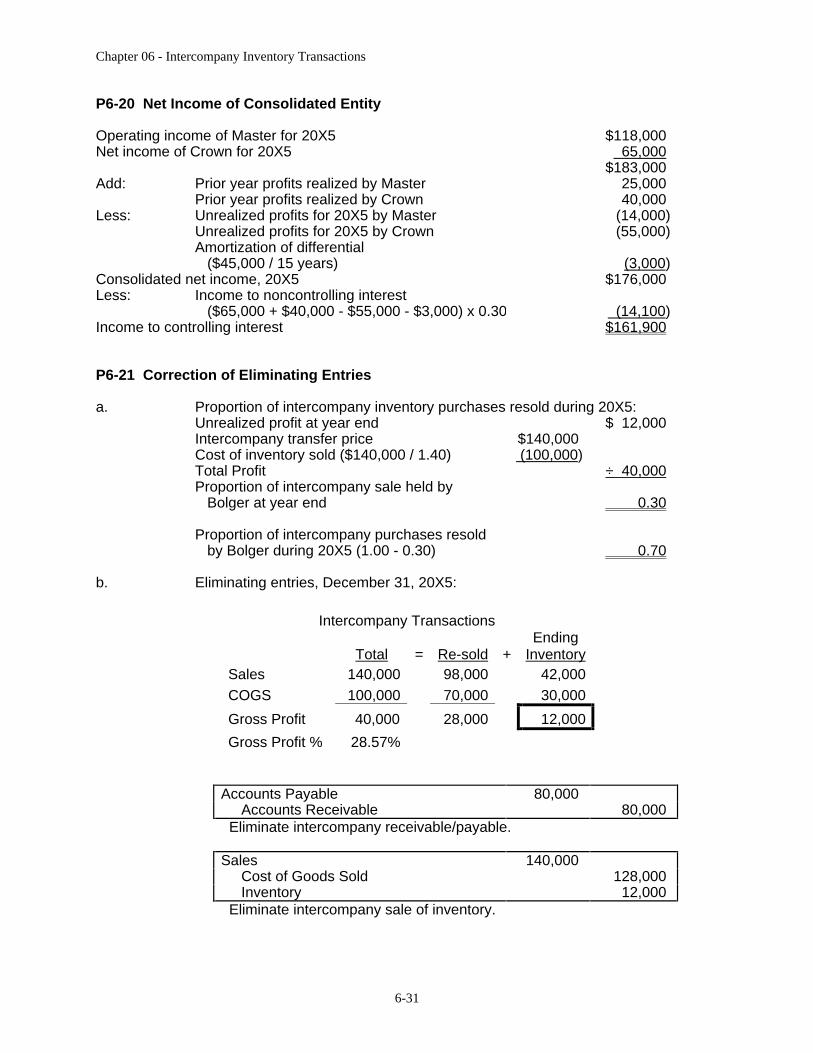
P6-20 Net Income of Consolidated Entity
Operating income of Master for 20X5
$118,000
Net income of Crown for 20X5
65,000
$183,000
Add: Prior year profits realized by Master
25,000
Prior year profits realized by Crown
40,000
Less: Unrealized profits for 20X5 by Master
(14,000)
Unrealized profits for 20X5 by Crown
(55,000)
Amortization of differential
($45,000 / 15 years)
(3,000)
Consolidated net income, 20X5
$176,000
Less: Income to noncontrolling interest
($65,000 + $40,000 - $55,000 - $3,000) x 0.30
(14,100)
Income to controlling interest
$161,900
P6-21 Correction of Eliminating Entries
a. Proportion of intercompany inventory purchases resold during 20X5: Unrealized profit at year end
$ 12,000
Intercompany transfer price $140,000
Cost of inventory sold ($140,000 / 1.40) (100,000)
Total Profit
÷ 40,000
Proportion of intercompany sale held by
Bolger at year end
0.30
Proportion of intercompany purchases resold
by Bolger during 20X5 (1.00 - 0.30)
0.70
b. Eliminating entries, December 31, 20X5:
Intercompany Transactions
Total
=
Re-sold
+
Ending Inventory
Sales 140,000
98,000
42,000
COGS 100,000
70,000
30,000
Gross Profit 40,000
28,000
12,000
Gross Profit % 28.57%
Accounts Payable 80,000
Accounts Receivable
80,000
Eliminate intercompany receivable/payable.
Sales 140,000
Cost of Goods Sold
128,000
Inventory
12,000
Eliminate intercompany sale of inventory.
Chapter 06 - Intercompany Inventory Transactions
6-32
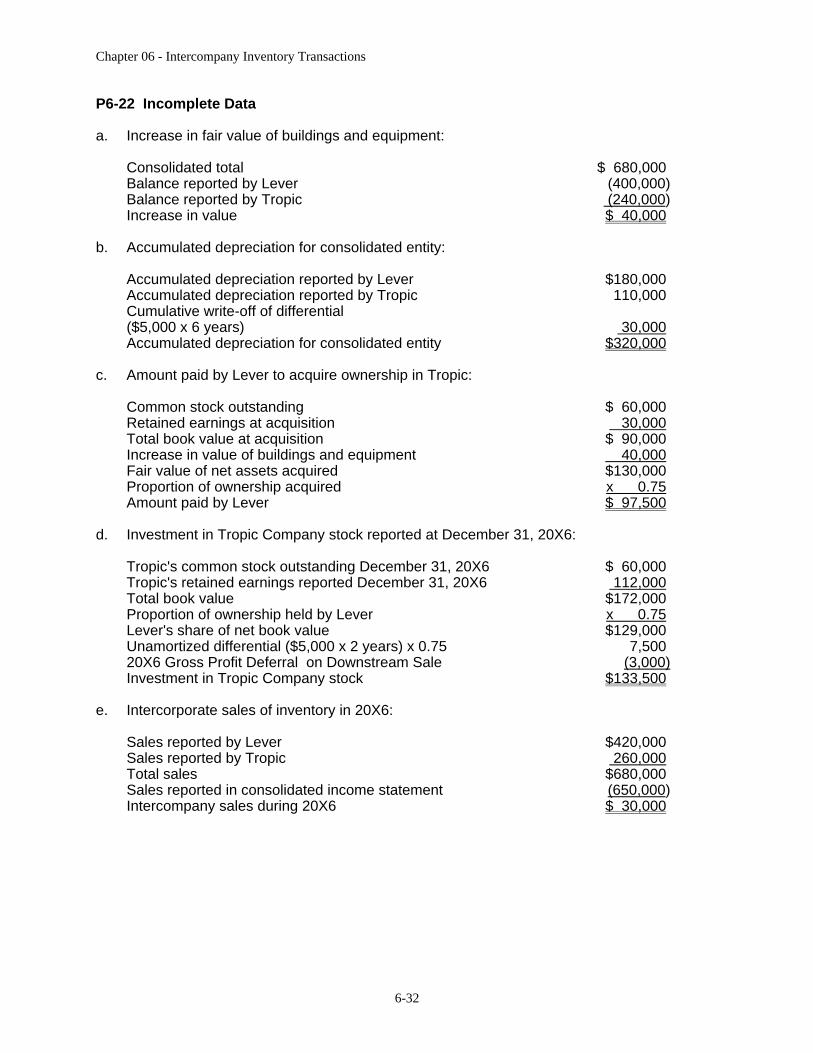
P6-22 Incomplete Data
a. Increase in fair value of buildings and equipment:
Consolidated total $ 680,000
Balance reported by Lever (400,000)
Balance reported by Tropic (240,000)
Increase in value $ 40,000
b. Accumulated depreciation for consolidated entity:
Accumulated depreciation reported by Lever $180,000
Accumulated depreciation reported by Tropic 110,000
Cumulative write-off of differential
($5,000 x 6 years) 30,000
Accumulated depreciation for consolidated entity $320,000
c. Amount paid by Lever to acquire ownership in Tropic:
Common stock outstanding $ 60,000
Retained earnings at acquisition 30,000
Total book value at acquisition $ 90,000
Increase in value of buildings and equipment 40,000
Fair value of net assets acquired $130,000
Proportion of ownership acquired x 0.75
Amount paid by Lever $ 97,500
d. Investment in Tropic Company stock reported at December 31, 20X6:
Tropic's common stock outstanding December 31, 20X6 $ 60,000
Tropic's retained earnings reported December 31, 20X6 112,000
Total book value $172,000
Proportion of ownership held by Lever x 0.75
Lever's share of net book value $129,000
Unamortized differential ($5,000 x 2 years) x 0.75 7,500
20X6 Gross Profit Deferral on Downstream Sale (3,000)
Investment in Tropic Company stock $133,500
e. Intercorporate sales of inventory in 20X6:
Sales reported by Lever $420,000
Sales reported by Tropic 260,000
Total sales $680,000
Sales reported in consolidated income statement (650,000)
Intercompany sales during 20X6 $ 30,000
Chapter 06 - Intercompany Inventory Transactions
6-33
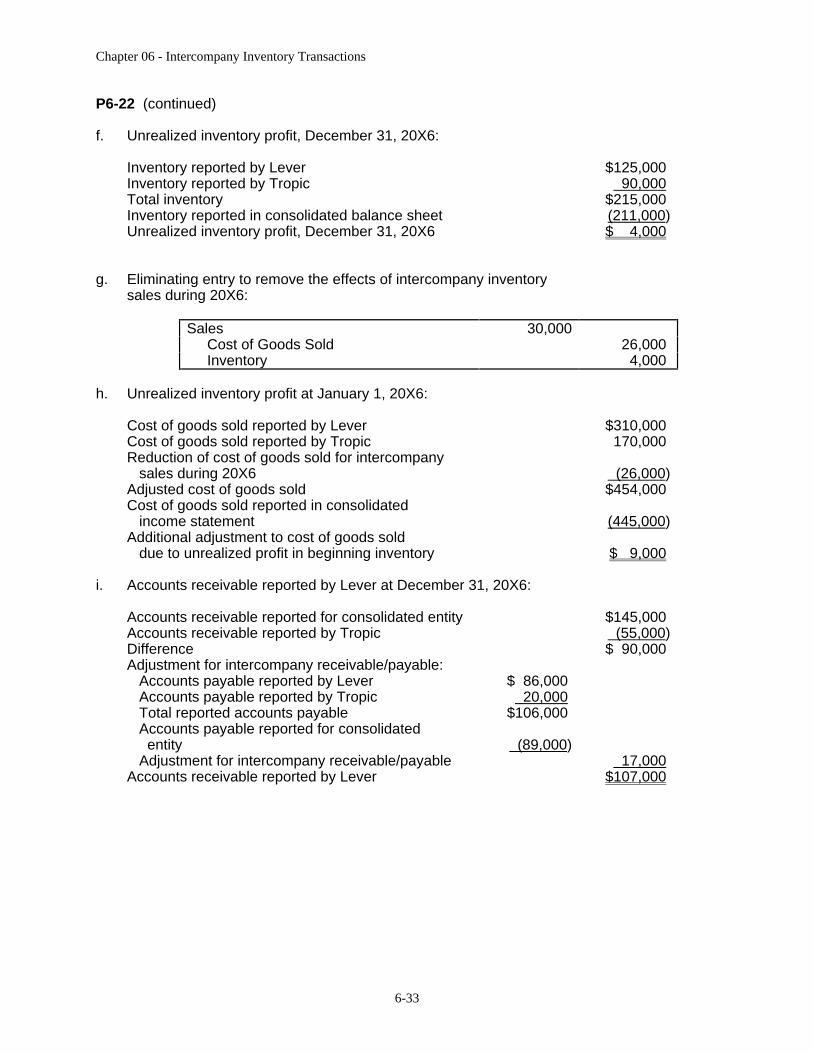
P6-22 (continued)
f. Unrealized inventory profit, December 31, 20X6:
Inventory reported by Lever $125,000
Inventory reported by Tropic 90,000
Total inventory $215,000
Inventory reported in consolidated balance sheet (211,000)
Unrealized inventory profit, December 31, 20X6 $ 4,000
g. Eliminating entry to remove the effects of intercompany inventory sales during 20X6:
Sales 30,000
Cost of Goods Sold
26,000
Inventory
4,000
h. Unrealized inventory profit at January 1, 20X6:
Cost of goods sold reported by Lever $310,000
Cost of goods sold reported by Tropic 170,000
Reduction of cost of goods sold for intercompany
sales during 20X6 (26,000)
Adjusted cost of goods sold $454,000
Cost of goods sold reported in consolidated
income statement (445,000)
Additional adjustment to cost of goods sold
due to unrealized profit in beginning inventory $ 9,000
i. Accounts receivable reported by Lever at December 31, 20X6:
Accounts receivable reported for consolidated entity $145,000
Accounts receivable reported by Tropic (55,000)
Difference $ 90,000
Adjustment for intercompany receivable/payable:
Accounts payable reported by Lever $ 86,000
Accounts payable reported by Tropic 20,000
Total reported accounts payable $106,000
Accounts payable reported for consolidated
entity (89,000)
Adjustment for intercompany receivable/payable 17,000
Accounts receivable reported by Lever $107,000
Chapter 06 - Intercompany Inventory Transactions
6-34
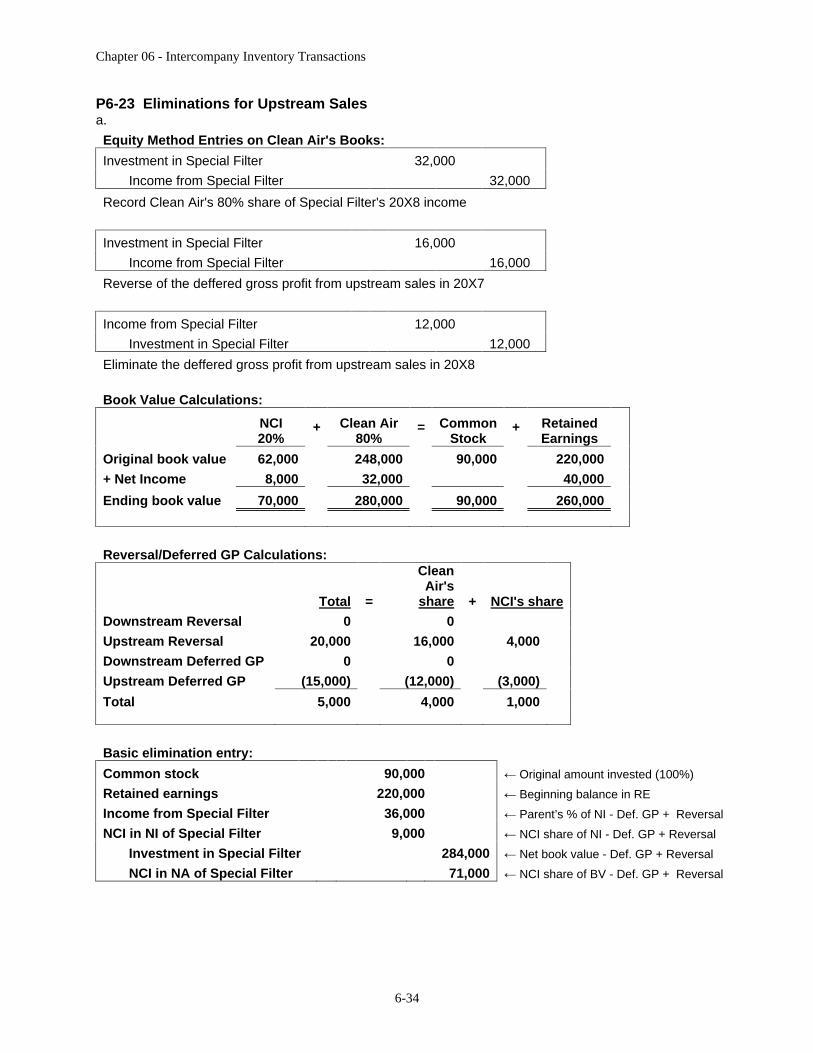
P6-23 Eliminations for Upstream Sales a.
Equity Method Entries on Clean Air's Books:
Investment in Special Filter
32,000
Income from Special Filter
32,000
Record Clean Air's 80% share of Special Filter's 20X8 income
Investment in Special Filter
16,000
Income from Special Filter
16,000
Reverse of the deffered gross profit from upstream sales in 20X7
Income from Special Filter
12,000
Investment in Special Filter
12,000
Eliminate the deffered gross profit from upstream sales in 20X8
Book Value Calculations:
NCI 20%
+
Clean Air
80% =
Common
Stock + Retained
Earnings
Original book value
62,000
248,000
90,000
220,000
+ Net Income 8,000
32,000
40,000
Ending book value 70,000
280,000
90,000
260,000
Reversal/Deferred GP Calculations:
Total
=
Clean Air's
share
+
NCI's share
Downstream Reversal 0
0
Upstream Reversal 20,000
16,000
4,000
Downstream Deferred GP 0
0
Upstream Deferred GP (15,000)
(12,000)
(3,000)
Total 5,000
4,000
1,000
Basic elimination entry:
Common stock
90,000
Original amount invested (100%)
Retained earnings
220,000
Beginning balance in RE
Income from Special Filter 36,000
Parent’s % of NI - Def. GP + Reversal
NCI in NI of Special Filter 9,000
NCI share of NI - Def. GP + Reversal
Investment in Special Filter
284,000
Net book value - Def. GP + Reversal
NCI in NA of Special Filter
71,000
NCI share of BV - Def. GP + Reversal
Chapter 06 - Intercompany Inventory Transactions
6-35
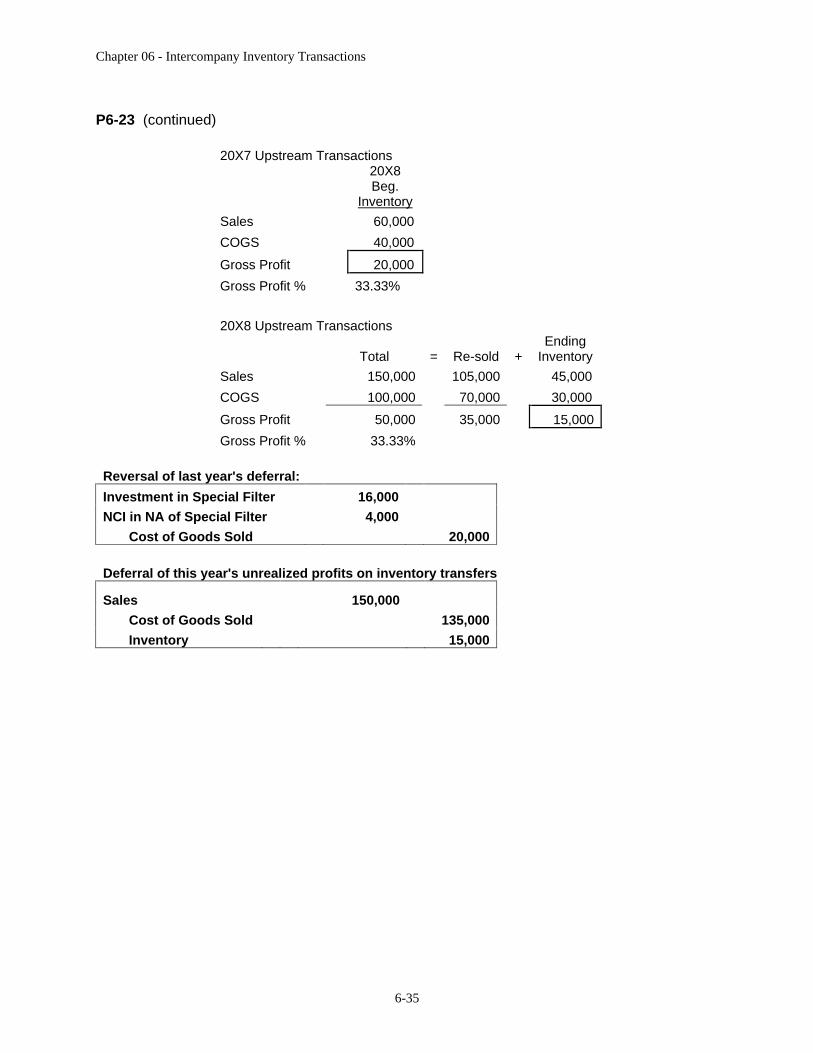
P6-23 (continued)
20X7 Upstream Transactions 20X8 Beg.
Inventory
Sales 60,000
COGS 40,000
Gross Profit 20,000
Gross Profit % 33.33%
20X8 Upstream Transactions
Total =
Re-sold +
Ending Inventory
Sales 150,000
105,000
45,000
COGS 100,000
70,000
30,000
Gross Profit 50,000
35,000
15,000
Gross Profit % 33.33%
Reversal of last year's deferral:
Investment in Special Filter
16,000
NCI in NA of Special Filter
4,000
Cost of Goods Sold
20,000
Deferral of this year's unrealized profits on inventory transfers
Sales
150,000
Cost of Goods Sold
135,000
Inventory
15,000
Chapter 06 - Intercompany Inventory Transactions
6-36
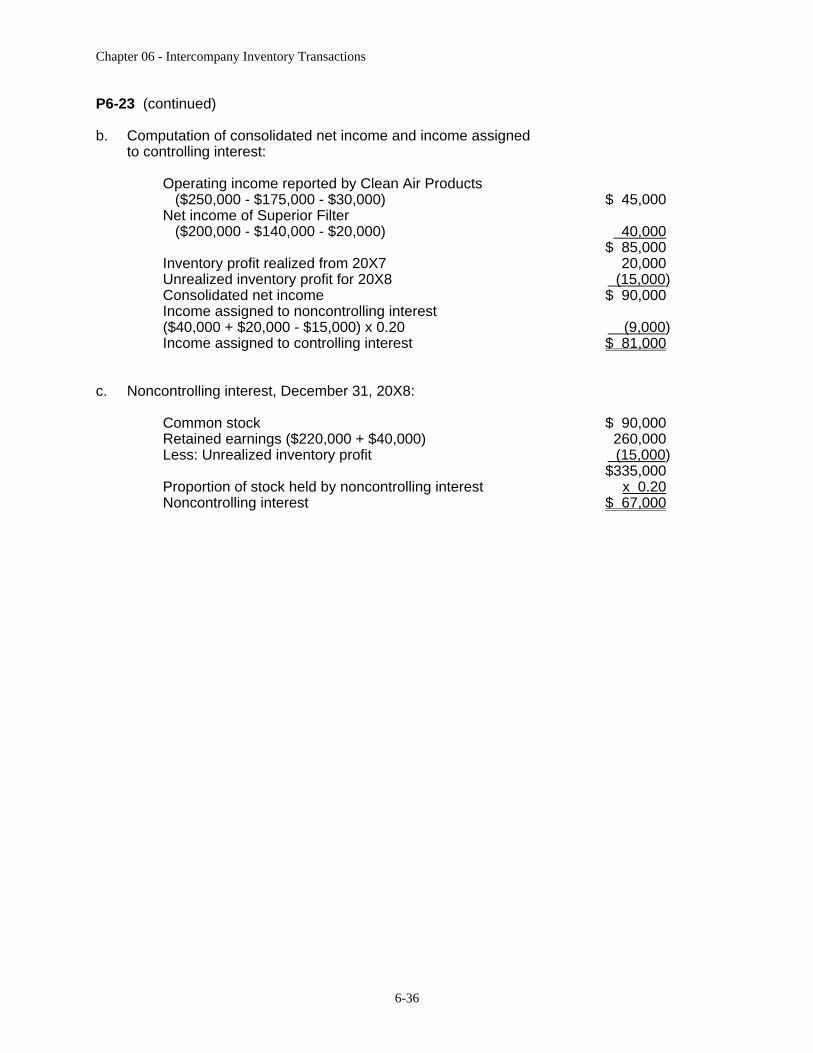
P6-23 (continued)
b. Computation of consolidated net income and income assigned to controlling interest:
Operating income reported by Clean Air Products
($250,000 - $175,000 - $30,000) $ 45,000
Net income of Superior Filter
($200,000 - $140,000 - $20,000) 40,000
$ 85,000
Inventory profit realized from 20X7 20,000
Unrealized inventory profit for 20X8 (15,000)
Consolidated net income $ 90,000
Income assigned to noncontrolling interest
($40,000 + $20,000 - $15,000) x 0.20 (9,000)
Income assigned to controlling interest $ 81,000
c. Noncontrolling interest, December 31, 20X8:
Common stock $ 90,000
Retained earnings ($220,000 + $40,000) 260,000
Less: Unrealized inventory profit (15,000)
$335,000
Proportion of stock held by noncontrolling interest x 0.20
Noncontrolling interest $ 67,000
Chapter 06 - Intercompany Inventory Transactions
6-37
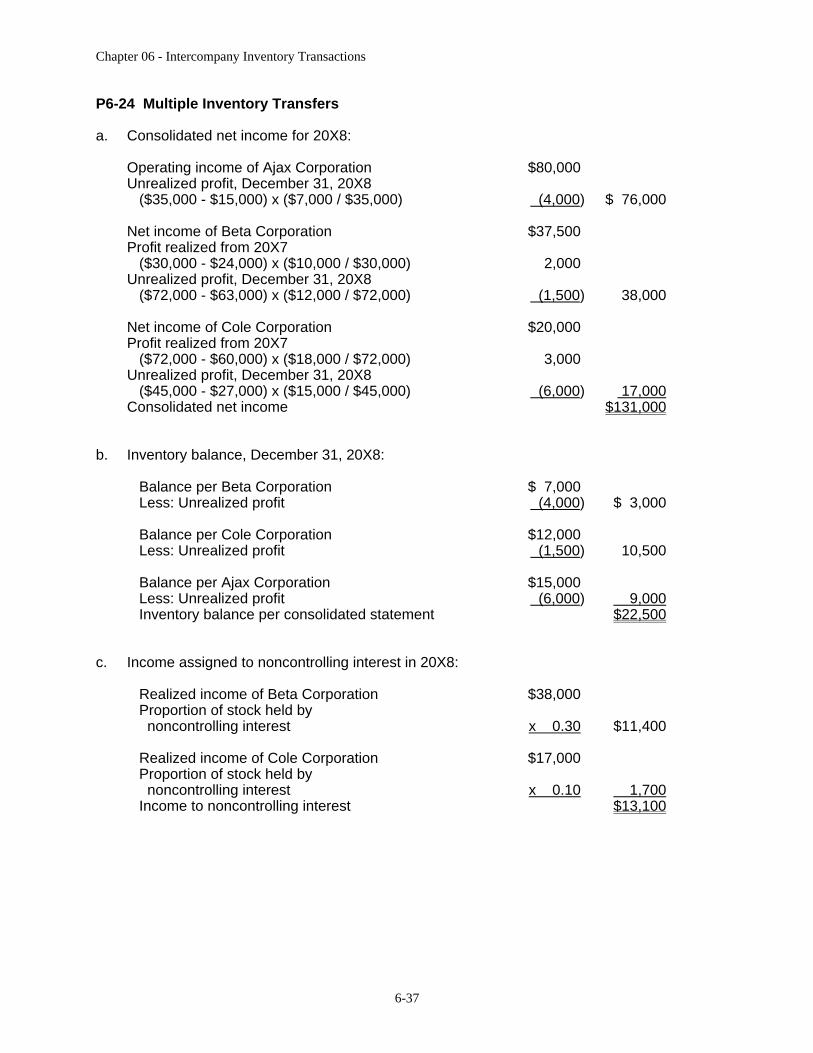
P6-24 Multiple Inventory Transfers
a. Consolidated net income for 20X8:
Operating income of Ajax Corporation $80,000
Unrealized profit, December 31, 20X8
($35,000 - $15,000) x ($7,000 / $35,000) (4,000)
$ 76,000
Net income of Beta Corporation $37,500
Profit realized from 20X7
($30,000 - $24,000) x ($10,000 / $30,000) 2,000
Unrealized profit, December 31, 20X8
($72,000 - $63,000) x ($12,000 / $72,000) (1,500)
38,000
Net income of Cole Corporation $20,000
Profit realized from 20X7
($72,000 - $60,000) x ($18,000 / $72,000) 3,000
Unrealized profit, December 31, 20X8
($45,000 - $27,000) x ($15,000 / $45,000) (6,000)
17,000
Consolidated net income
$131,000
b. Inventory balance, December 31, 20X8:
Balance per Beta Corporation $ 7,000
Less: Unrealized profit (4,000)
$ 3,000
Balance per Cole Corporation $12,000
Less: Unrealized profit (1,500)
10,500
Balance per Ajax Corporation $15,000
Less: Unrealized profit (6,000)
9,000
Inventory balance per consolidated statement
$22,500
c. Income assigned to noncontrolling interest in 20X8:
Realized income of Beta Corporation $38,000
Proportion of stock held by
noncontrolling interest x 0.30
$11,400
Realized income of Cole Corporation $17,000
Proportion of stock held by
noncontrolling interest x 0.10
1,700
Income to noncontrolling interest
$13,100
Chapter 06 - Intercompany Inventory Transactions
6-38
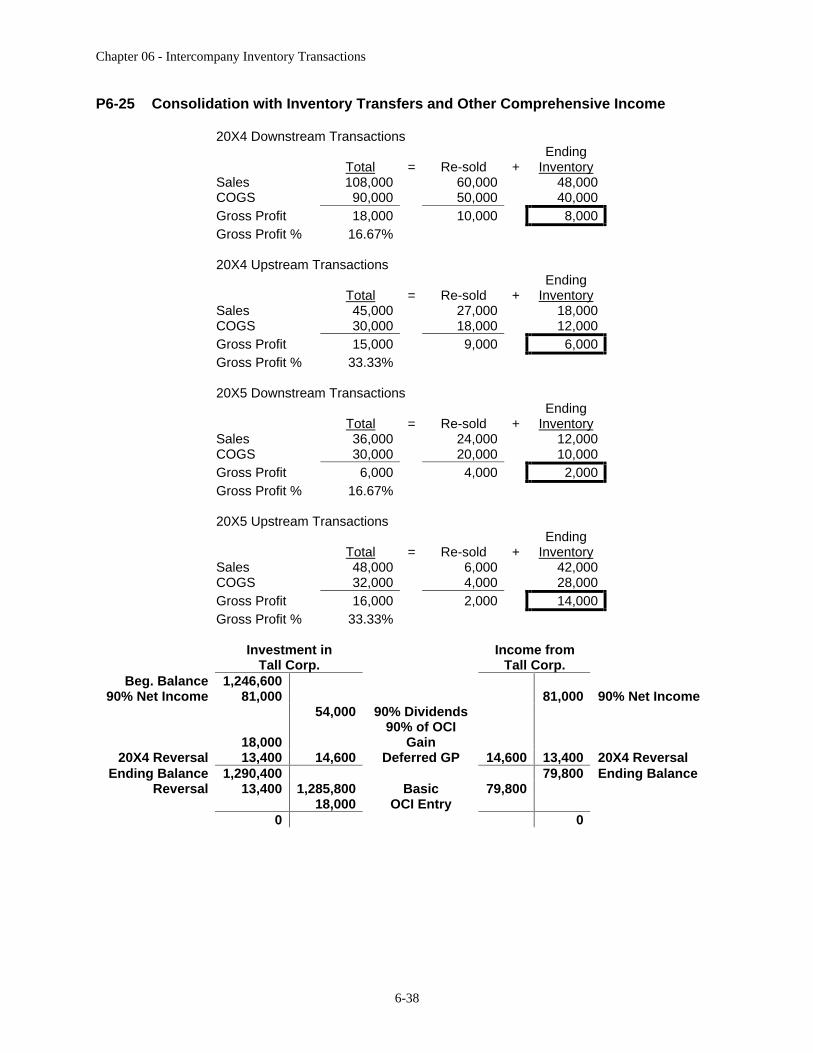
P6-25 Consolidation with Inventory Transfers and Other Comprehensive Income
20X4 Downstream Transactions
Total
=
Re-sold +
Ending
Inventory
Sales 108,000
60,000
48,000
COGS 90,000
50,000
40,000
Gross Profit 18,000
10,000
8,000
Gross Profit % 16.67%
20X4 Upstream Transactions
Total
=
Re-sold +
Ending Inventory
Sales 45,000
27,000
18,000
COGS 30,000
18,000
12,000 Gross Profit 15,000
9,000
6,000
Gross Profit % 33.33%
20X5 Downstream Transactions
Total
=
Re-sold +
Ending Inventory
Sales 36,000
24,000
12,000
COGS 30,000
20,000
10,000
Gross Profit 6,000
4,000
2,000
Gross Profit % 16.67%
20X5 Upstream Transactions
Total
=
Re-sold +
Ending Inventory
Sales 48,000
6,000
42,000
COGS 32,000
4,000
28,000
Gross Profit 16,000
2,000
14,000
Gross Profit % 33.33%
Investment in Income from
Tall Corp. Tall Corp. Beg. Balance
1,246,600
90% Net Income
81,000
81,000
90% Net Income
54,000
90% Dividends
18,000
90% of OCI Gain
20X4 Reversal
13,400
14,600
Deferred GP 14,600
13,400
20X4 Reversal Ending Balance
1,290,400
79,800
Ending Balance Reversal
13,400
1,285,800
Basic 79,800
18,000
OCI Entry
0
0
Chapter 06 - Intercompany Inventory Transactions
6-39
P6-25 (continued)
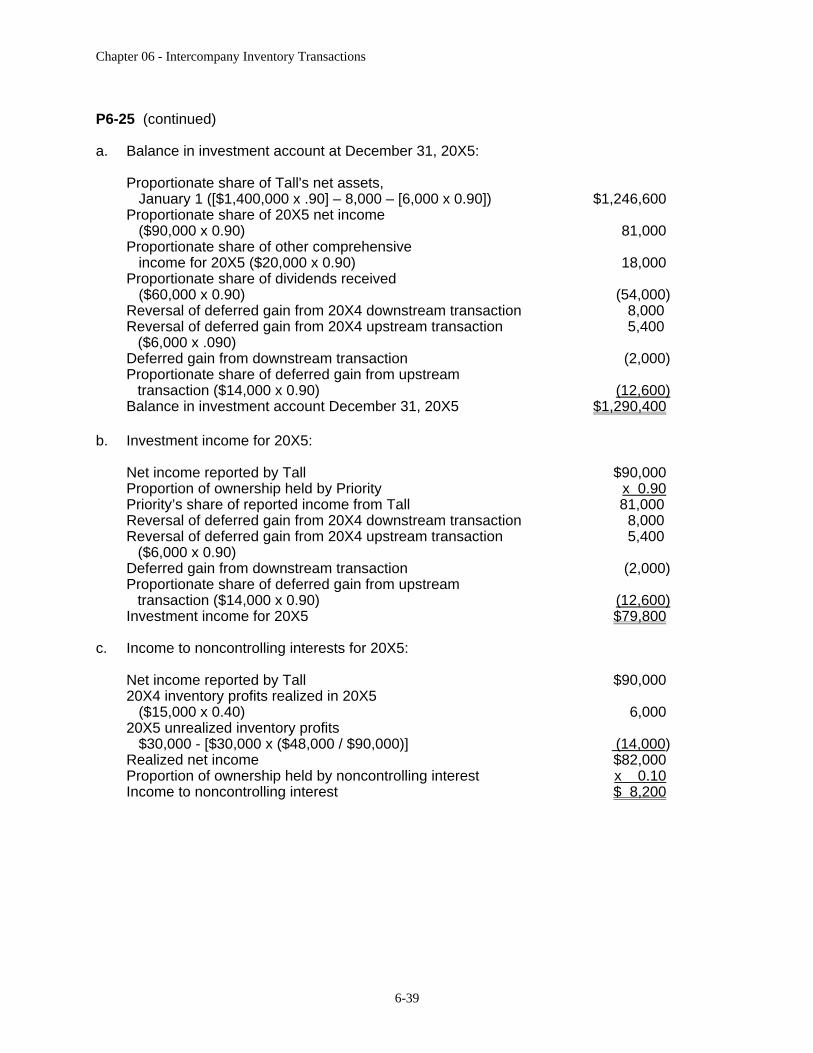
a. Balance in investment account at December 31, 20X5:
Proportionate share of Tall's net assets,
January 1 ([$1,400,000 x .90] – 8,000 – [6,000 x 0.90]) $1,246,600
Proportionate share of 20X5 net income
($90,000 x 0.90) 81,000
Proportionate share of other comprehensive
income for 20X5 ($20,000 x 0.90) 18,000
Proportionate share of dividends received
($60,000 x 0.90) (54,000)
Reversal of deferred gain from 20X4 downstream transaction 8,000 Reversal of deferred gain from 20X4 upstream transaction
($6,000 x .090) 5,400
Deferred gain from downstream transaction (2,000)
Proportionate share of deferred gain from upstream transaction ($14,000 x 0.90) (12,600)
Balance in investment account December 31, 20X5 $1,290,400
b. Investment income for 20X5:
Net income reported by Tall $90,000
Proportion of ownership held by Priority x 0.90
Priority’s share of reported income from Tall 81,000
Reversal of deferred gain from 20X4 downstream transaction 8,000 Reversal of deferred gain from 20X4 upstream transaction
($6,000 x 0.90) 5,400
Deferred gain from downstream transaction (2,000)
Proportionate share of deferred gain from upstream transaction ($14,000 x 0.90) (12,600)
Investment income for 20X5 $79,800
c. Income to noncontrolling interests for 20X5:
Net income reported by Tall $90,000
20X4 inventory profits realized in 20X5
($15,000 x 0.40) 6,000
20X5 unrealized inventory profits
$30,000 - [$30,000 x ($48,000 / $90,000)] (14,000)
Realized net income $82,000
Proportion of ownership held by noncontrolling interest x 0.10
Income to noncontrolling interest $ 8,200
Chapter 06 - Intercompany Inventory Transactions
6-40
P6-25 (continued)
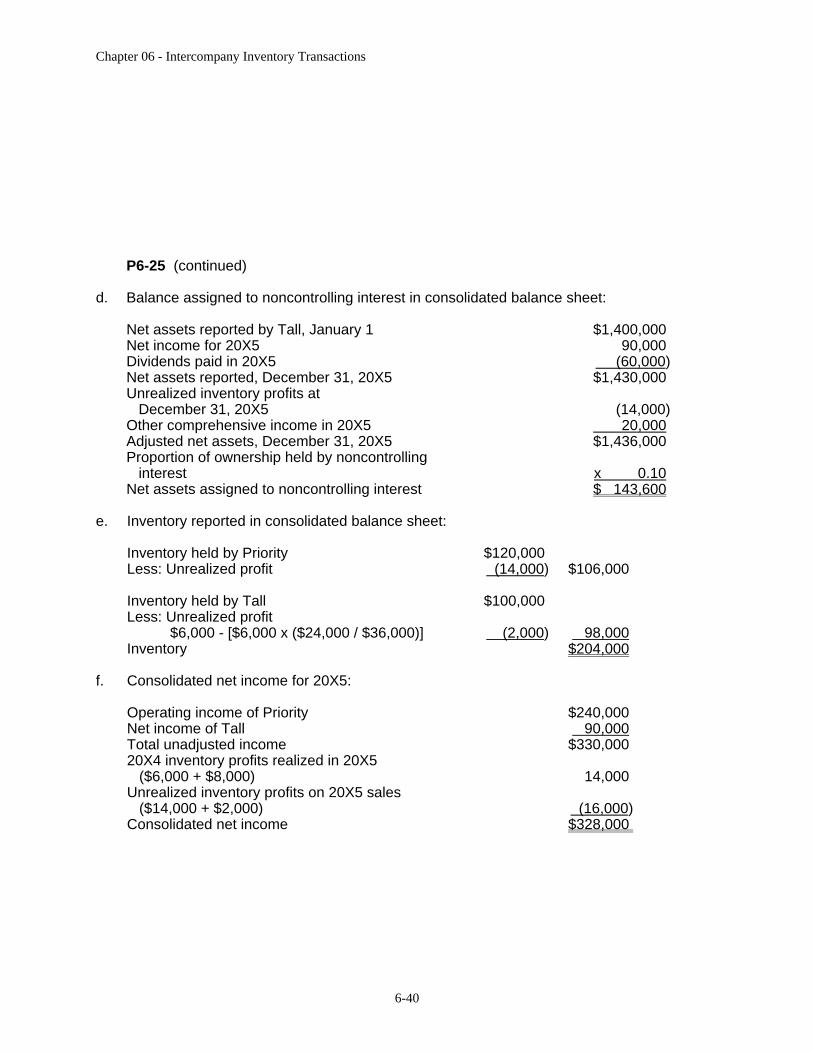
d. Balance assigned to noncontrolling interest in consolidated balance sheet:
Net assets reported by Tall, January 1 $1,400,000
Net income for 20X5 90,000
Dividends paid in 20X5 (60,000)
Net assets reported, December 31, 20X5 $1,430,000
Unrealized inventory profits at
December 31, 20X5 (14,000)
Other comprehensive income in 20X5 20,000
Adjusted net assets, December 31, 20X5 $1,436,000
Proportion of ownership held by noncontrolling
interest x 0.10
Net assets assigned to noncontrolling interest $ 143,600
e. Inventory reported in consolidated balance sheet:
Inventory held by Priority $120,000
Less: Unrealized profit (14,000)
$106,000
Inventory held by Tall $100,000
Less: Unrealized profit
$6,000 - [$6,000 x ($24,000 / $36,000)] (2,000)
98,000
Inventory
$204,000
f. Consolidated net income for 20X5:
Operating income of Priority
$240,000
Net income of Tall
90,000
Total unadjusted income
$330,000
20X4 inventory profits realized in 20X5
($6,000 + $8,000)
14,000
Unrealized inventory profits on 20X5 sales
($14,000 + $2,000)
(16,000)
Consolidated net income
$328,000

Chapter 06 - Intercompany Inventory Transactions
6-41
g. Eliminating entries, December 31, 20X5
Book Value Calculations:
NCI 10%
+ Priority Corp. 90%
= Comm. Stock
+ Add.
Paid-In Capital
+ Retained Earnings
+
Acc. OCI
Original book value
140,000
1,260,000
400,000
200,000
790,000
10,000
+ Net Income 9,000
81,000
90,000
- Dividends (6,000) (54,000) (60,000) Ending book value 143,000
1,287,000
400,000
200,000
820,000
10,000
P6-25 (continued)
Reversal/Deferred GP Calculations:
Total =
Priority Corp.'s share +
NCI's share
Downstream Reversal 8,000
8,000
Upstream Reversal 6,000
5,400
600
Downstream Deferred GP (2,000)
(2,000)
Upstream Deferred GP (14,000)
(12,600)
(1,400)
Total (2,000)
(1,200)
(800)
Chapter 06 - Intercompany Inventory Transactions
6-42
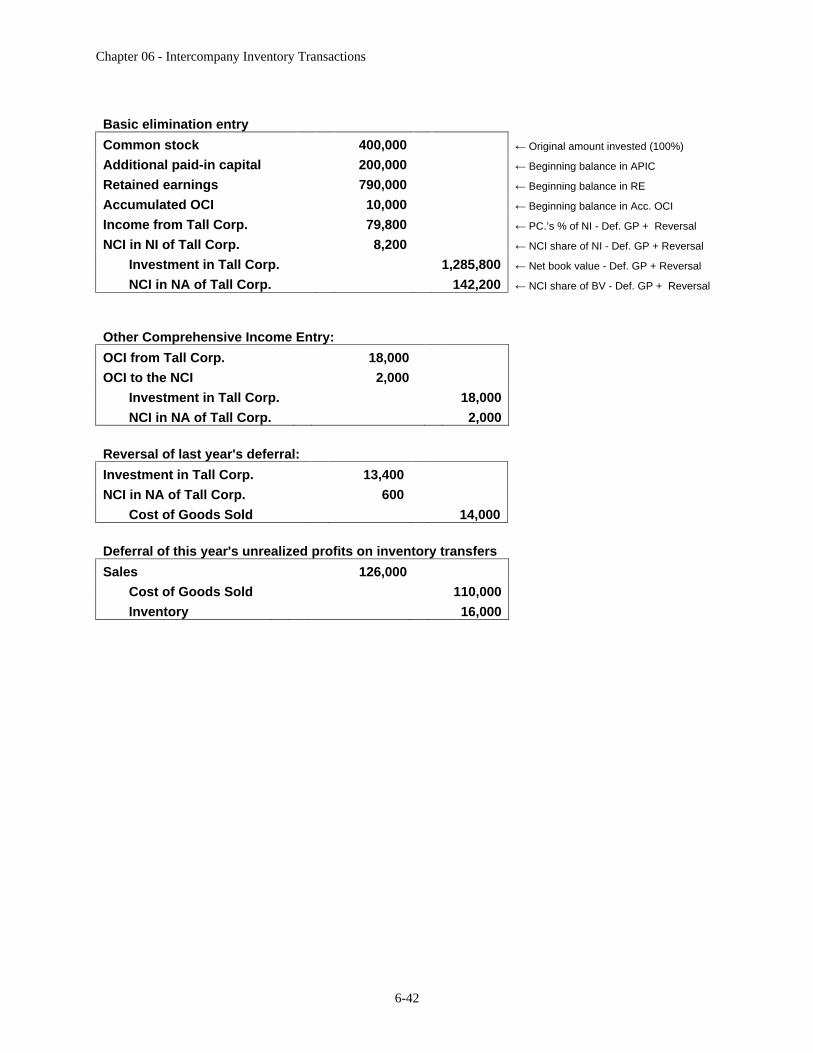
Basic elimination entry
Common stock
400,000
Original amount invested (100%)
Additional paid-in capital
200,000
Beginning balance in APIC
Retained earnings
790,000
Beginning balance in RE
Accumulated OCI
10,000
Beginning balance in Acc. OCI
Income from Tall Corp.
79,800
PC.’s % of NI - Def. GP + Reversal
NCI in NI of Tall Corp.
8,200
NCI share of NI - Def. GP + Reversal
Investment in Tall Corp.
1,285,800
Net book value - Def. GP + Reversal
NCI in NA of Tall Corp.
142,200
NCI share of BV - Def. GP + Reversal
Other Comprehensive Income Entry:
OCI from Tall Corp.
18,000
OCI to the NCI
2,000
Investment in Tall Corp.
18,000
NCI in NA of Tall Corp.
2,000
Reversal of last year's deferral:
Investment in Tall Corp.
13,400
NCI in NA of Tall Corp.
600
Cost of Goods Sold
14,000
Deferral of this year's unrealized profits on inventory transfers
Sales
126,000
Cost of Goods Sold
110,000
Inventory
16,000
Chapter 06 - Intercompany Inventory Transactions
6-43
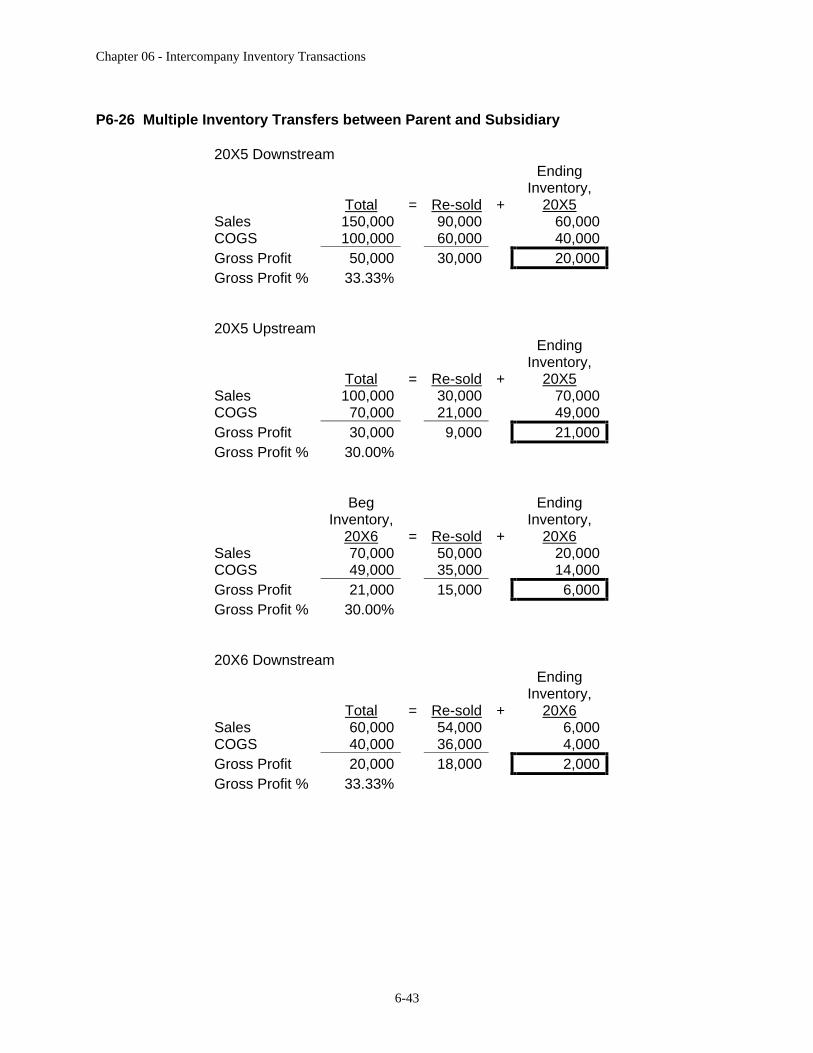
P6-26 Multiple Inventory Transfers between Parent and Subsidiary
20X5 Downstream
Total
=
Re-sold
+
Ending
Inventory, 20X5
Sales 150,000
90,000
60,000
COGS 100,000
60,000
40,000
Gross Profit 50,000
30,000
20,000
Gross Profit % 33.33%
20X5 Upstream
Total
=
Re-sold
+
Ending Inventory,
20X5
Sales 100,000
30,000
70,000
COGS 70,000
21,000
49,000
Gross Profit 30,000
9,000
21,000
Gross Profit % 30.00%
Beg Inventory,
20X6
=
Re-sold
+
Ending Inventory,
20X6
Sales 70,000
50,000
20,000
COGS 49,000
35,000
14,000
Gross Profit 21,000
15,000
6,000
Gross Profit % 30.00%
20X6 Downstream
Total
=
Re-sold
+
Ending Inventory,
20X6
Sales 60,000
54,000
6,000
COGS 40,000
36,000
4,000
Gross Profit 20,000
18,000
2,000
Gross Profit % 33.33%

Chapter 06 - Intercompany Inventory Transactions
6-44
20X6 Upstream
Total
=
Re-sold
+
Ending
Inventory, 20X6
Sales 240,000
60,000
180,000
COGS 200,000
50,000
150,000
Gross Profit 40,000
10,000
30,000
Gross Profit % 16.67%
a. Eliminating entries:
Investment in Slinky 20,000
Cost of goods sold
20,000
Eliminate beginning inventory profit of Proud Company.
Investment in Slinky 12,600
NCI in NA of Slinky 8,400
Cost of goods sold
15,000
Inventory
6,000
Eliminate beginning inventory profit of Slinky Company.
Sales 60,000
Cost of goods sold
58,000
Inventory
2,000
Eliminate intercompany sale of inventory by Proud Company.
Sales 240,000
Cost of goods sold
210,000
Inventory
30,000
Eliminate intercompany sale of inventory by Slinky Company.
b. Computation of cost of goods sold for consolidated entity:
Inventory produced by Proud in 20X5
($100,000 x 0.40) $ 40,000
Inventory produced by Slinky in 20X5
($70,000 x 0.50) 35,000
Inventory produced by Proud in 20X6
($40,000 x 0.90) 36,000
Inventory produced by Slinky in 20X6
($200,000 x 0.25) 50,000
Cost of goods sold reported in
consolidated income statement $161,000
Chapter 06 - Intercompany Inventory Transactions
6-45
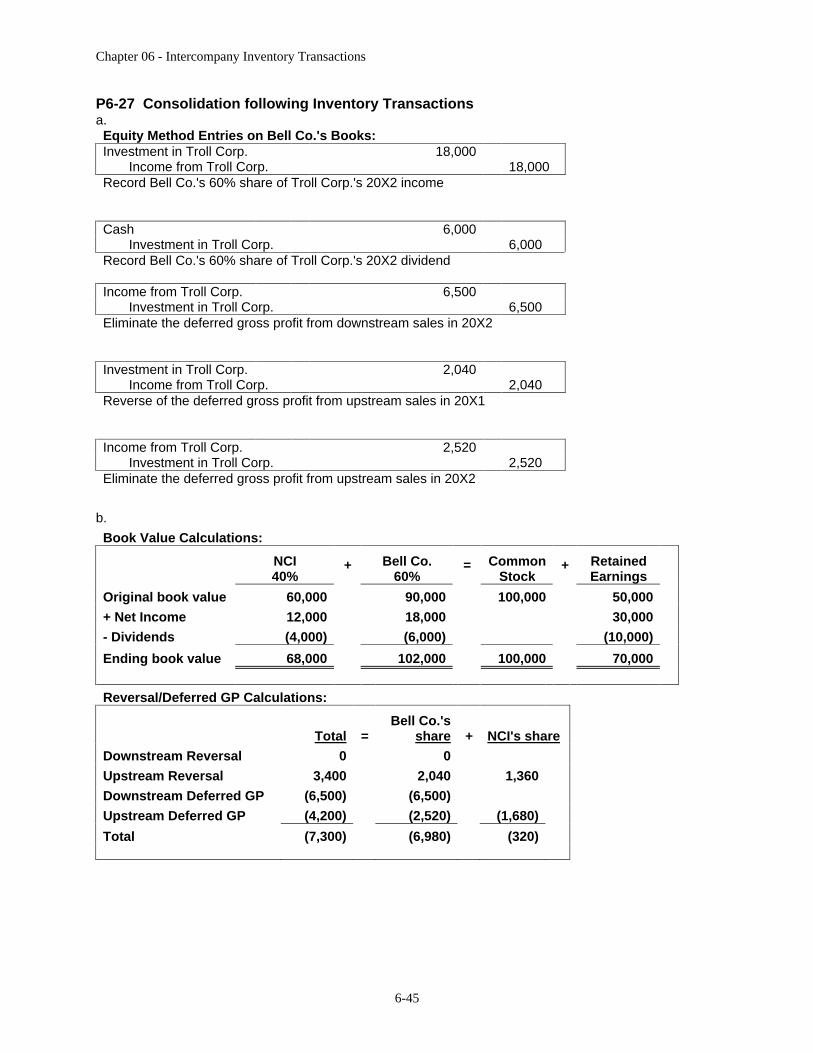
P6-27 Consolidation following Inventory Transactions a. Equity Method Entries on Bell Co.'s Books: Investment in Troll Corp.
18,000
Income from Troll Corp.
18,000
Record Bell Co.'s 60% share of Troll Corp.'s 20X2 income
Cash
6,000
Investment in Troll Corp. 6,000 Record Bell Co.'s 60% share of Troll Corp.'s 20X2 dividend
Income from Troll Corp.
6,500
Investment in Troll Corp.
6,500 Eliminate the deferred gross profit from downstream sales in 20X2
Investment in Troll Corp.
2,040
Income from Troll Corp.
2,040 Reverse of the deferred gross profit from upstream sales in 20X1
Income from Troll Corp.
2,520
Investment in Troll Corp.
2,520 Eliminate the deferred gross profit from upstream sales in 20X2
b.
Book Value Calculations:
NCI 40%
+ Bell Co. 60%
= Common
Stock + Retained
Earnings
Original book value
60,000
90,000
100,000
50,000
+ Net Income 12,000
18,000
30,000
- Dividends (4,000)
(6,000)
(10,000)
Ending book value 68,000
102,000
100,000
70,000
Reversal/Deferred GP Calculations:
Total
=
Bell Co.'s share
+
NCI's share
Downstream Reversal 0
0
Upstream Reversal 3,400
2,040
1,360
Downstream Deferred GP (6,500)
(6,500)
Upstream Deferred GP (4,200)
(2,520)
(1,680)
Total (7,300)
(6,980)
(320)
Chapter 06 - Intercompany Inventory Transactions
6-46
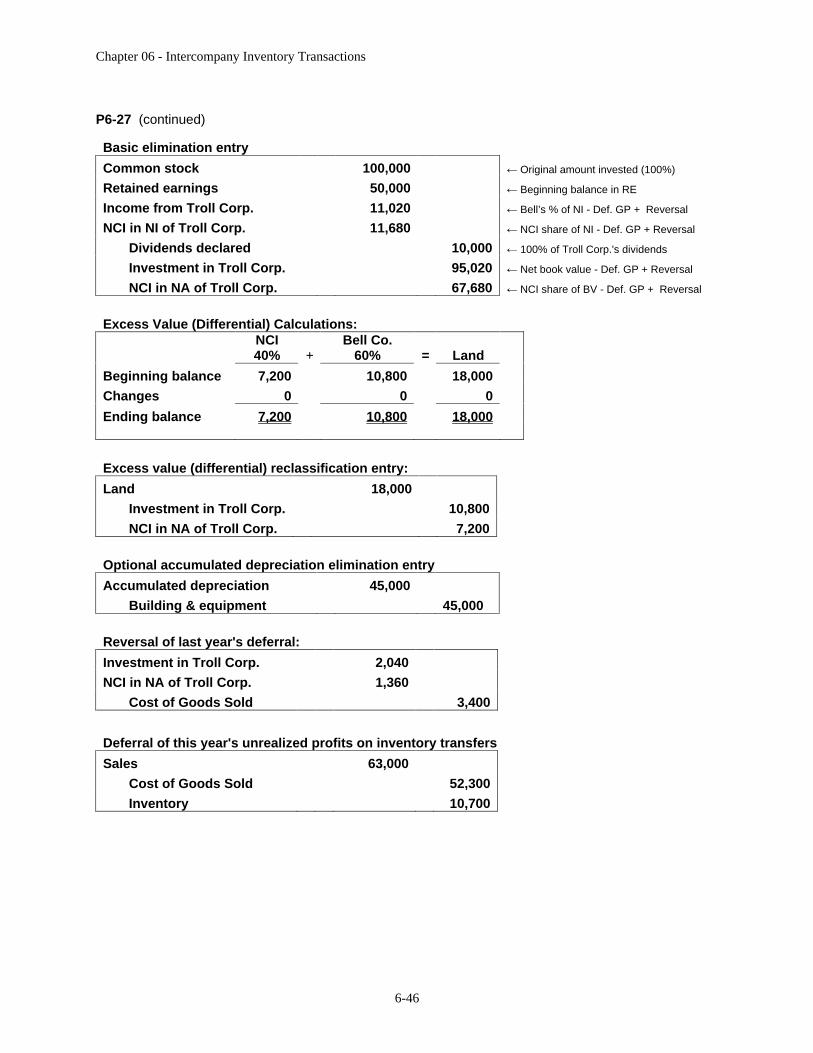
P6-27 (continued)
Basic elimination entry
Common stock
100,000
Original amount invested (100%)
Retained earnings
50,000
Beginning balance in RE
Income from Troll Corp.
11,020
Bell’s % of NI - Def. GP + Reversal
NCI in NI of Troll Corp.
11,680
NCI share of NI - Def. GP + Reversal
Dividends declared
10,000
100% of Troll Corp.'s dividends
Investment in Troll Corp.
95,020
Net book value - Def. GP + Reversal
NCI in NA of Troll Corp.
67,680
NCI share of BV - Def. GP + Reversal
Excess Value (Differential) Calculations: NCI 40% +
Bell Co. 60% =
Land
Beginning balance 7,200
10,800
18,000
Changes 0
0
0
Ending balance 7,200
10,800
18,000
Excess value (differential) reclassification entry:
Land
18,000
Investment in Troll Corp.
10,800
NCI in NA of Troll Corp. 7,200
Optional accumulated depreciation elimination entry
Accumulated depreciation
45,000
Building & equipment
45,000
Reversal of last year's deferral:
Investment in Troll Corp.
2,040
NCI in NA of Troll Corp.
1,360
Cost of Goods Sold
3,400
Deferral of this year's unrealized profits on inventory transfers
Sales
63,000
Cost of Goods Sold
52,300
Inventory
10,700
Chapter 06 - Intercompany Inventory Transactions
6-47
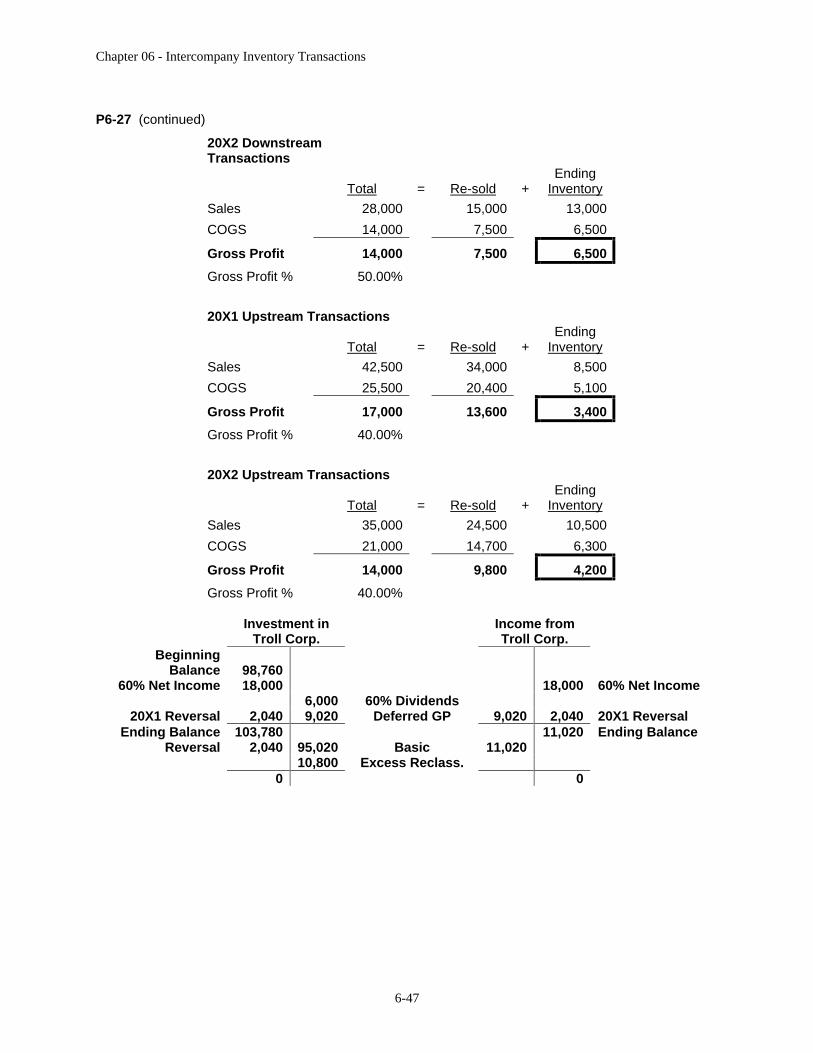
P6-27 (continued)
20X2 Downstream Transactions
Total
=
Re-sold
+
Ending
Inventory
Sales 28,000
15,000
13,000
COGS 14,000
7,500
6,500
Gross Profit 14,000
7,500
6,500
Gross Profit % 50.00%
20X1 Upstream Transactions
Total
=
Re-sold
+
Ending Inventory
Sales 42,500
34,000
8,500
COGS 25,500
20,400
5,100
Gross Profit 17,000
13,600
3,400
Gross Profit % 40.00%
20X2 Upstream Transactions
Total
=
Re-sold
+
Ending Inventory
Sales 35,000
24,500
10,500
COGS 21,000
14,700
6,300
Gross Profit 14,000
9,800
4,200
Gross Profit % 40.00%
Investment in Income from
Troll Corp. Troll Corp. Beginning
Balance
98,760
60% Net Income
18,000
18,000
60% Net Income
6,000
60% Dividends
20X1 Reversal
2,040
9,020
Deferred GP 9,020
2,040
20X1 Reversal Ending Balance
103,780
11,020
Ending Balance Reversal
2,040
95,020
Basic 11,020
10,800
Excess Reclass.
0
0
Chapter 06 - Intercompany Inventory Transactions
6-48
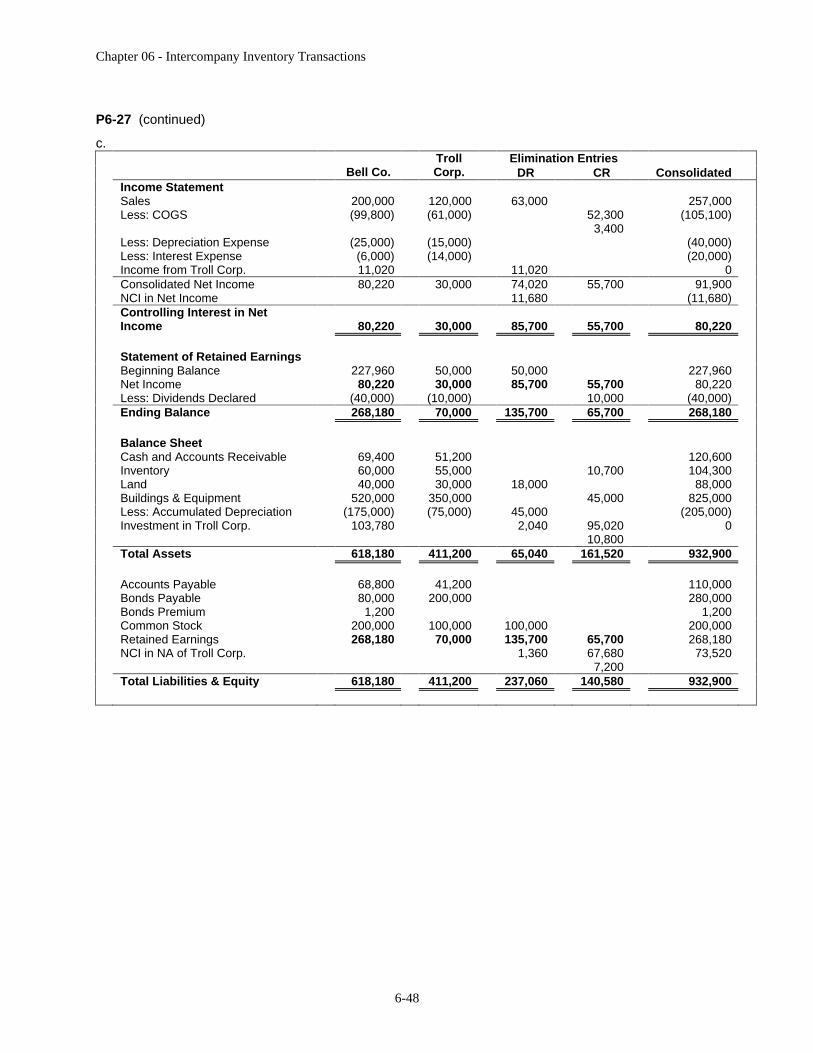
P6-27 (continued)
c. Elimination Entries
Bell Co.
Troll Corp. DR CR Consolidated
Income Statement
Sales 200,000
120,000
63,000
257,000
Less: COGS (99,800) (61,000) 52,300
(105,100)
3,400
Less: Depreciation Expense (25,000) (15,000) (40,000)
Less: Interest Expense (6,000) (14,000) (20,000)
Income from Troll Corp. 11,020
11,020
0
Consolidated Net Income 80,220
30,000
74,020
55,700
91,900
NCI in Net Income 11,680
(11,680)
Controlling Interest in Net Income 80,220
30,000
85,700
55,700
80,220
Statement of Retained Earnings
Beginning Balance 227,960
50,000
50,000
227,960
Net Income 80,220
30,000
85,700
55,700
80,220
Less: Dividends Declared (40,000) (10,000) 10,000
(40,000)
Ending Balance 268,180
70,000
135,700
65,700
268,180
Balance Sheet
Cash and Accounts Receivable 69,400
51,200
120,600
Inventory 60,000
55,000
10,700
104,300
Land 40,000
30,000
18,000
88,000
Buildings & Equipment 520,000
350,000
45,000
825,000
Less: Accumulated Depreciation (175,000) (75,000) 45,000
(205,000)
Investment in Troll Corp. 103,780
2,040
95,020
0
10,800
Total Assets 618,180
411,200
65,040
161,520 932,900
Accounts Payable 68,800
41,200
110,000
Bonds Payable 80,000
200,000
280,000
Bonds Premium 1,200
1,200
Common Stock 200,000
100,000
100,000
200,000
Retained Earnings 268,180
70,000
135,700
65,700
268,180
NCI in NA of Troll Corp. 1,360
67,680
73,520
7,200
Total Liabilities & Equity 618,180
411,200
237,060
140,580 932,900

Chapter 06 - Intercompany Inventory Transactions
6-49
P6-28 Consolidation Worksheet
a.
Equity Method Entries on Crow Corp.'s Books:
Investment in West Co.
14,000
Income from West Co.
14,000
Record Crow Corp.'s 70% share of West Co.'s 20X9 income
Cash
3,500
Investment in West Co. 3,500
Record Crow Corp.'s 70% share of West Co.'s 20X9 dividend
Investment in West Co.
15,000
Income from West Co.
15,000
Reverse of the deferred gross profit from downstream sales in 20X8
Income from West Co.
8,000
Investment in West Co.
8,000
Eliminate the deferred gross profit from downstream sales in 20X9
Investment in West Co.
21,000
Income from West Co.
21,000
Reverse of the deferred gross profit from upstream sales in 20X8
Income from West Co.
17,500
Investment in West Co.
17,500
Eliminate the deferred gross profit from upstream sales in 20X9
Book Value Calculations:
NCI 30%
+
Crow Corp. 70%
=
Common
Stock + Retained
Earnings
Original book value 120,000
280,000
150,000
250,000
+ Net Income 6,000
14,000
20,000
- Dividends (1,500)
(3,500)
(5,000)
Ending book value 124,500
290,500
150,000
265,000
Chapter 06 - Intercompany Inventory Transactions
6-50
P6-28 (continued)
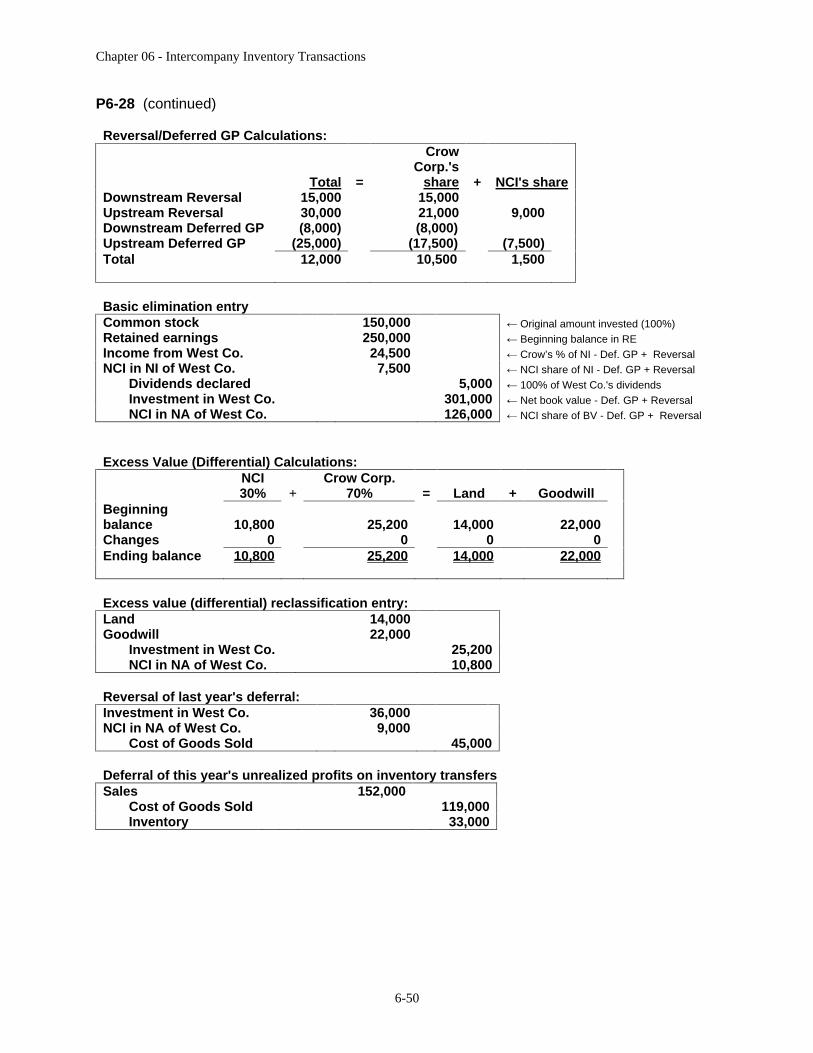
Reversal/Deferred GP Calculations:
Total
=
Crow
Corp.'s share
+
NCI's share
Downstream Reversal 15,000
15,000
Upstream Reversal 30,000
21,000
9,000
Downstream Deferred GP (8,000)
(8,000)
Upstream Deferred GP (25,000)
(17,500)
(7,500)
Total 12,000
10,500
1,500
Basic elimination entry Common stock
150,000
Original amount invested (100%) Retained earnings
250,000
Beginning balance in RE Income from West Co.
24,500
Crow’s % of NI - Def. GP + Reversal NCI in NI of West Co.
7,500
NCI share of NI - Def. GP + Reversal Dividends declared
5,000
100% of West Co.'s dividends Investment in West Co.
301,000
Net book value - Def. GP + Reversal NCI in NA of West Co.
126,000
NCI share of BV - Def. GP + Reversal
Excess Value (Differential) Calculations: NCI 30% +
Crow Corp. 70% =
Land + Goodwill Beginning balance 10,800
25,200
14,000
22,000
Changes 0
0
0
0
Ending balance 10,800
25,200
14,000
22,000
Excess value (differential) reclassification entry: Land
14,000
Goodwill 22,000
Investment in West Co.
25,200
NCI in NA of West Co. 10,800
Reversal of last year's deferral: Investment in West Co.
36,000
NCI in NA of West Co.
9,000
Cost of Goods Sold
45,000
Deferral of this year's unrealized profits on inventory transfers Sales
152,000
Cost of Goods Sold
119,000
Inventory
33,000
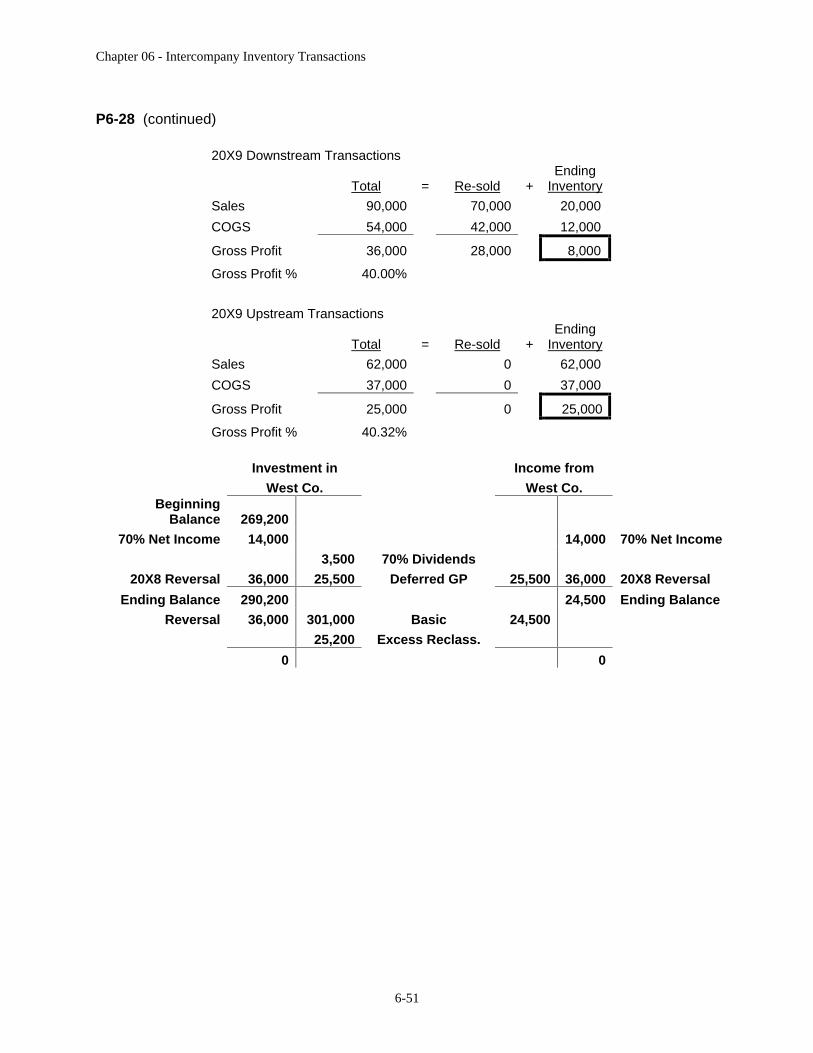
Chapter 06 - Intercompany Inventory Transactions
6-51
P6-28 (continued)
20X9 Downstream Transactions
Total
=
Re-sold
+
Ending
Inventory
Sales 90,000
70,000
20,000
COGS 54,000
42,000
12,000
Gross Profit 36,000
28,000
8,000
Gross Profit % 40.00%
20X9 Upstream Transactions
Total
=
Re-sold
+
Ending Inventory
Sales 62,000
0
62,000
COGS 37,000
0
37,000
Gross Profit 25,000
0
25,000
Gross Profit % 40.32%
Investment in Income from
West Co. West Co. Beginning
Balance
269,200
70% Net Income
14,000
14,000
70% Net Income
3,500
70% Dividends
20X8 Reversal
36,000
25,500
Deferred GP 25,500
36,000
20X8 Reversal
Ending Balance
290,200
24,500
Ending Balance
Reversal
36,000
301,000
Basic 24,500
25,200
Excess Reclass.
0
0
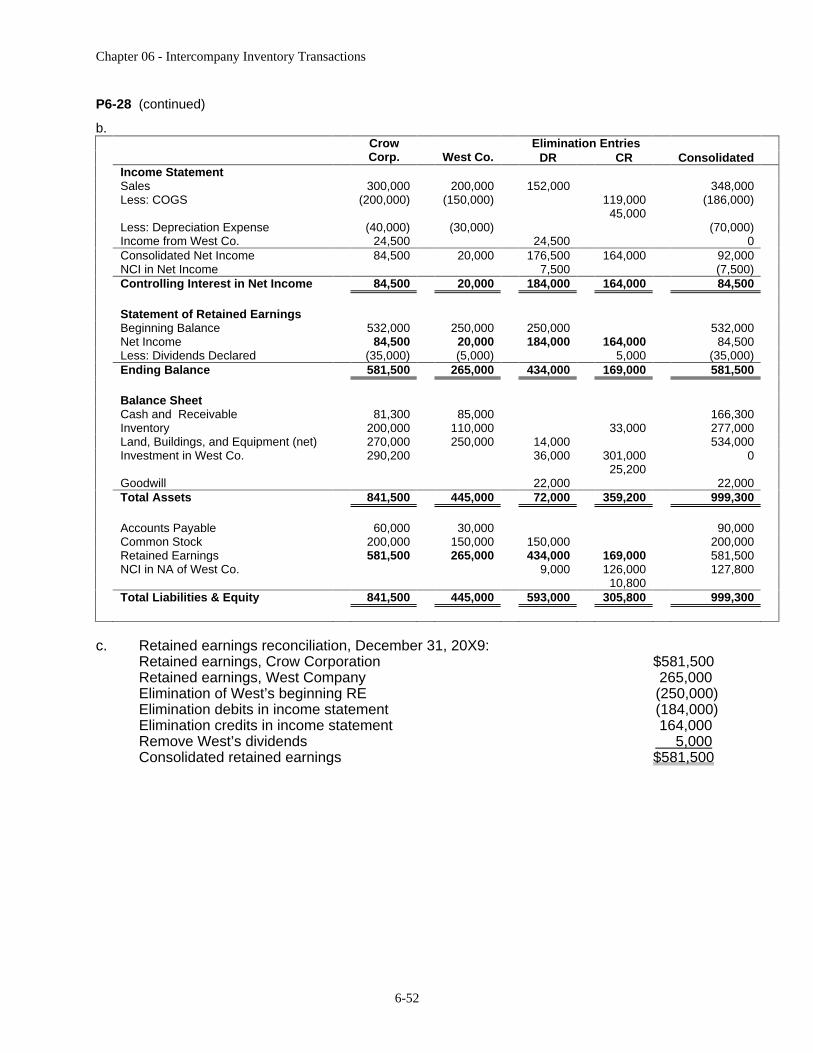
Chapter 06 - Intercompany Inventory Transactions
6-52
P6-28 (continued)
b. Elimination Entries
Crow Corp. West Co. DR CR Consolidated
Income Statement
Sales 300,000
200,000
152,000
348,000
Less: COGS (200,000) (150,000) 119,000
(186,000)
45,000
Less: Depreciation Expense (40,000) (30,000) (70,000)
Income from West Co. 24,500
24,500
0
Consolidated Net Income 84,500
20,000
176,500
164,000
92,000
NCI in Net Income 7,500
(7,500)
Controlling Interest in Net Income 84,500
20,000
184,000
164,000
84,500
Statement of Retained Earnings
Beginning Balance 532,000
250,000
250,000
532,000
Net Income 84,500
20,000
184,000
164,000
84,500
Less: Dividends Declared (35,000) (5,000) 5,000
(35,000)
Ending Balance 581,500
265,000
434,000
169,000
581,500
Balance Sheet
Cash and Receivable 81,300
85,000
166,300
Inventory 200,000
110,000
33,000
277,000
Land, Buildings, and Equipment (net) 270,000
250,000
14,000
534,000
Investment in West Co. 290,200
36,000
301,000
0
25,200
Goodwill 22,000
22,000
Total Assets 841,500
445,000
72,000 359,200 999,300
Accounts Payable 60,000
30,000
90,000
Common Stock 200,000
150,000
150,000
200,000
Retained Earnings 581,500
265,000
434,000
169,000
581,500
NCI in NA of West Co. 9,000
126,000
127,800
10,800
Total Liabilities & Equity 841,500
445,000
593,000 305,800 999,300
c. Retained earnings reconciliation, December 31, 20X9:
Retained earnings, Crow Corporation
$581,500
Retained earnings, West Company
265,000 Elimination of West’s beginning RE
(250,000)
Elimination debits in income statement
(184,000)
Elimination credits in income statement
164,000 Remove West’s dividends
5,000
Consolidated retained earnings
$581,500

Chapter 06 - Intercompany Inventory Transactions
6-53
P6-29 Computation of Consolidated Totals
a. Consolidated sales for 20X8:
Bunker
Harrison
Consol-
Corp.
Co.
idated
Sales reported $660,000
$510,000
Intercorporate sales (140,000)
(240,000)
Sales to nonaffiliates $520,000
$270,000
$790,000
b. Consolidated cost of goods sold:
Total sales reported $660,000
$510,000
Ratio of cost to sales price ÷ 1.4
÷ 1.2
Cost of goods sold $471,429
$425,000
Amount to be eliminated
(see entry) (128,000)
(232,000)
Cost of goods sold adjusted $343,429
$193,000
$536,429
Downstream:
Total
=
Re-sold
+
Ending Inventory
Sales 140,000
98,000
42,000
COGS 100,000
70,000
30,000
Gross Profit 40,000
28,000
12,000
Gross Profit % 28.57%
Upstream:
Total
=
Re-sold
+
Ending Inventory
Sales 240,000
192,000
48,000
COGS 200,000
160,000
40,000
Gross Profit 40,000
32,000
8,000
Gross Profit % 16.67%
Eliminating entries:
Sales 140,000
Cost of Goods Sold
128,000
Inventory
12,000
Elimination of sales by Bunker to Harrison:
Sales 240,000
Cost of Goods Sold
232,000
Inventory
8,000
Elimination of sales by Harrison to Bunker:
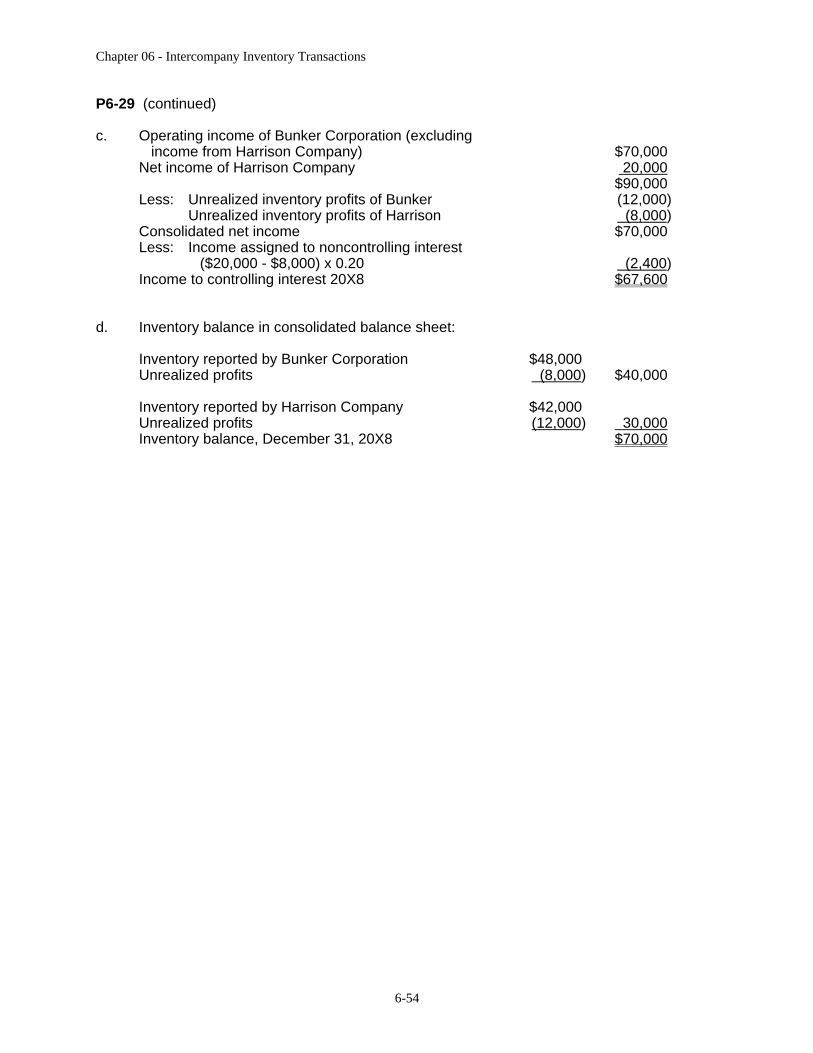
Chapter 06 - Intercompany Inventory Transactions
6-54
P6-29 (continued)
c. Operating income of Bunker Corporation (excluding
income from Harrison Company)
$70,000
Net income of Harrison Company
20,000
$90,000
Less:
Unrealized inventory profits of Bunker
(12,000)
Unrealized inventory profits of Harrison
(8,000)
Consolidated net income
$70,000
Less:
Income assigned to noncontrolling interest
($20,000 - $8,000) x 0.20
(2,400)
Income to controlling interest 20X8
$67,600
d. Inventory balance in consolidated balance sheet:
Inventory reported by Bunker Corporation $48,000
Unrealized profits (8,000)
$40,000
Inventory reported by Harrison Company $42,000
Unrealized profits (12,000)
30,000
Inventory balance, December 31, 20X8
$70,000
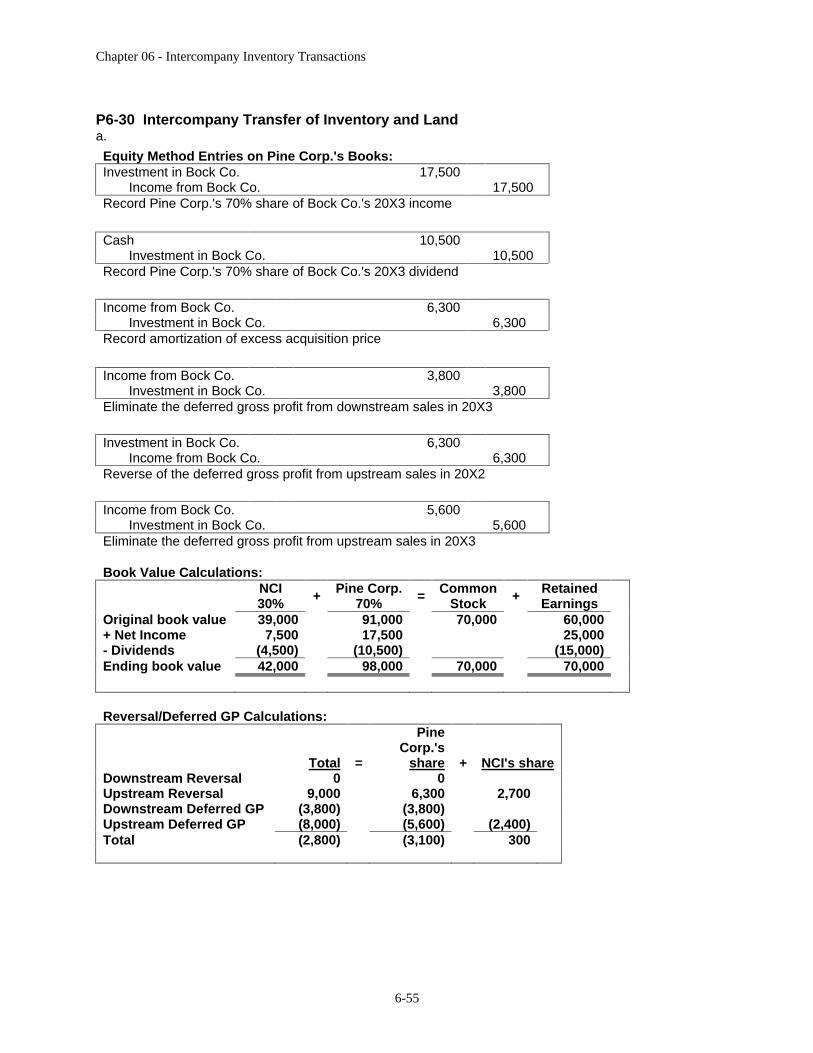
Chapter 06 - Intercompany Inventory Transactions
6-55
P6-30 Intercompany Transfer of Inventory and Land a.
Equity Method Entries on Pine Corp.'s Books: Investment in Bock Co.
17,500
Income from Bock Co.
17,500
Record Pine Corp.'s 70% share of Bock Co.'s 20X3 income
Cash
10,500
Investment in Bock Co. 10,500 Record Pine Corp.'s 70% share of Bock Co.'s 20X3 dividend
Income from Bock Co.
6,300
Investment in Bock Co. 6,300 Record amortization of excess acquisition price
Income from Bock Co.
3,800
Investment in Bock Co.
3,800 Eliminate the deferred gross profit from downstream sales in 20X3
Investment in Bock Co.
6,300
Income from Bock Co.
6,300 Reverse of the deferred gross profit from upstream sales in 20X2
Income from Bock Co.
5,600
Investment in Bock Co.
5,600 Eliminate the deferred gross profit from upstream sales in 20X3
Book Value Calculations:
NCI 30% +
Pine Corp.
70% =
Common
Stock + Retained
Earnings
Original book value
39,000
91,000
70,000
60,000
+ Net Income 7,500
17,500
25,000
- Dividends (4,500)
(10,500)
(15,000)
Ending book value 42,000
98,000
70,000
70,000
Reversal/Deferred GP Calculations:
Total
=
Pine Corp.'s
share
+
NCI's share
Downstream Reversal 0
0
Upstream Reversal 9,000
6,300
2,700
Downstream Deferred GP (3,800)
(3,800)
Upstream Deferred GP (8,000)
(5,600)
(2,400)
Total (2,800)
(3,100)
300
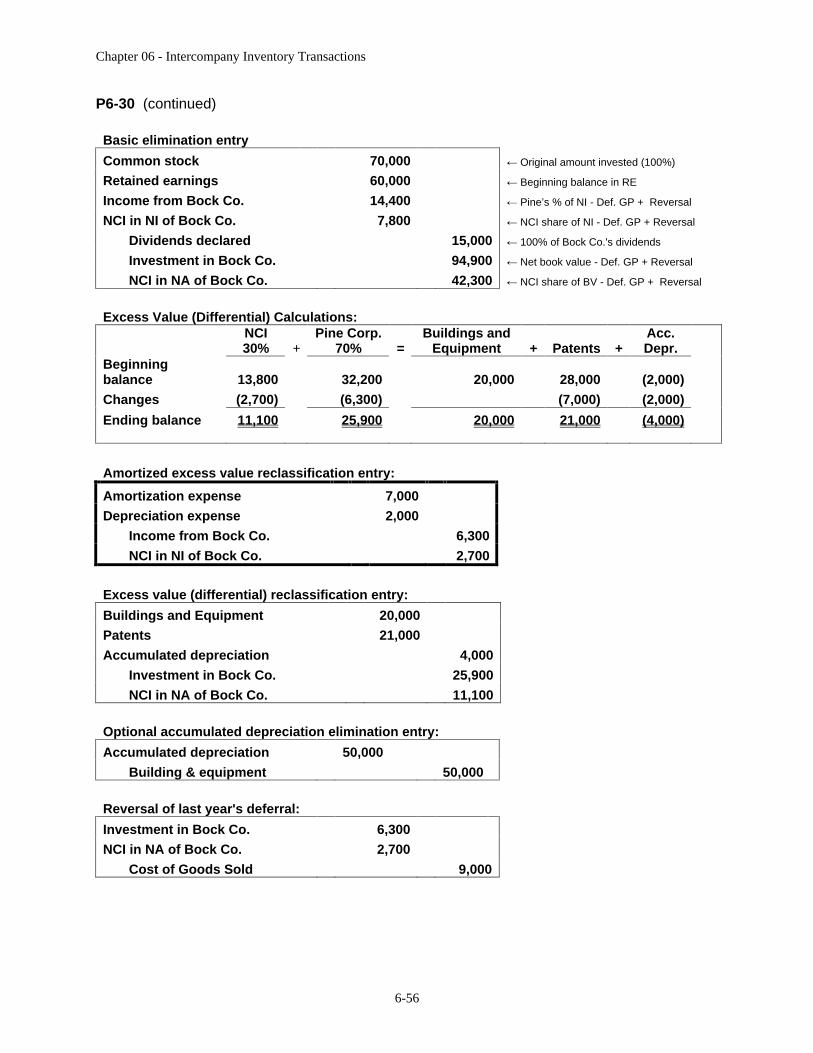
Chapter 06 - Intercompany Inventory Transactions
6-56
P6-30 (continued)
Basic elimination entry
Common stock
70,000
Original amount invested (100%)
Retained earnings
60,000
Beginning balance in RE
Income from Bock Co.
14,400
Pine’s % of NI - Def. GP + Reversal
NCI in NI of Bock Co.
7,800
NCI share of NI - Def. GP + Reversal
Dividends declared
15,000
100% of Bock Co.'s dividends
Investment in Bock Co.
94,900
Net book value - Def. GP + Reversal
NCI in NA of Bock Co.
42,300
NCI share of BV - Def. GP + Reversal
Excess Value (Differential) Calculations: NCI 30% +
Pine Corp. 70% =
Buildings and Equipment + Patents
+
Acc. Depr.
Beginning balance 13,800
32,200
20,000
28,000
(2,000)
Changes (2,700)
(6,300)
(7,000)
(2,000)
Ending balance 11,100
25,900
20,000
21,000
(4,000)
Amortized excess value reclassification entry:
Amortization expense
7,000
Depreciation expense
2,000
Income from Bock Co.
6,300
NCI in NI of Bock Co.
2,700
Excess value (differential) reclassification entry:
Buildings and Equipment
20,000
Patents 21,000
Accumulated depreciation 4,000
Investment in Bock Co. 25,900
NCI in NA of Bock Co. 11,100
Optional accumulated depreciation elimination entry:
Accumulated depreciation
50,000
Building & equipment
50,000
Reversal of last year's deferral:
Investment in Bock Co.
6,300
NCI in NA of Bock Co.
2,700
Cost of Goods Sold
9,000
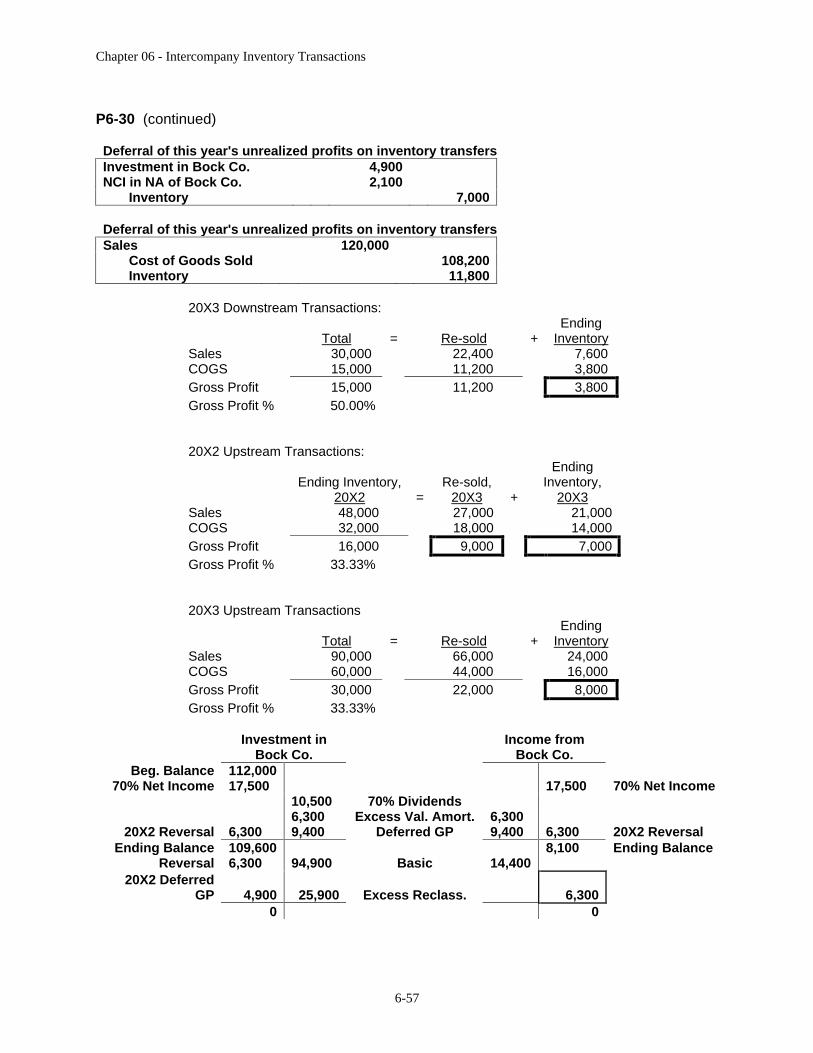
Chapter 06 - Intercompany Inventory Transactions
6-57
P6-30 (continued)
Deferral of this year's unrealized profits on inventory transfersInvestment in Bock Co.
4,900
NCI in NA of Bock Co.
2,100
Inventory
7,000
Deferral of this year's unrealized profits on inventory transfersSales
120,000
Cost of Goods Sold
108,200
Inventory
11,800
Investment in Income from
Bock Co. Bock Co. Beg. Balance
112,000
70% Net Income
17,500 17,500 70% Net Income
10,500 70% Dividends
6,300 Excess Val. Amort. 6,300 20X2 Reversal
6,300 9,400 Deferred GP 9,400 6,300 20X2 Reversal Ending Balance
109,600
8,100 Ending Balance Reversal
6,300 94,900 Basic 14,400
20X2 Deferred GP
4,900
25,900
Excess Reclass. 6,300
0
0
20X3 Downstream Transactions:
Total
=
Re-sold
+
Ending Inventory
Sales 30,000 22,400 7,600
COGS 15,000 11,200 3,800
Gross Profit 15,000 11,200 3,800
Gross Profit % 50.00%
20X2 Upstream Transactions:
Ending Inventory, 20X2
=
Re-sold, 20X3
+
Ending Inventory,
20X3
Sales 48,000 27,000
21,000
COGS 32,000 18,000
14,000
Gross Profit 16,000 9,000
7,000
Gross Profit % 33.33%
20X3 Upstream Transactions
Total
=
Re-sold
+
Ending Inventory
Sales 90,000 66,000 24,000
COGS 60,000 44,000 16,000
Gross Profit 30,000 22,000 8,000
Gross Profit % 33.33%
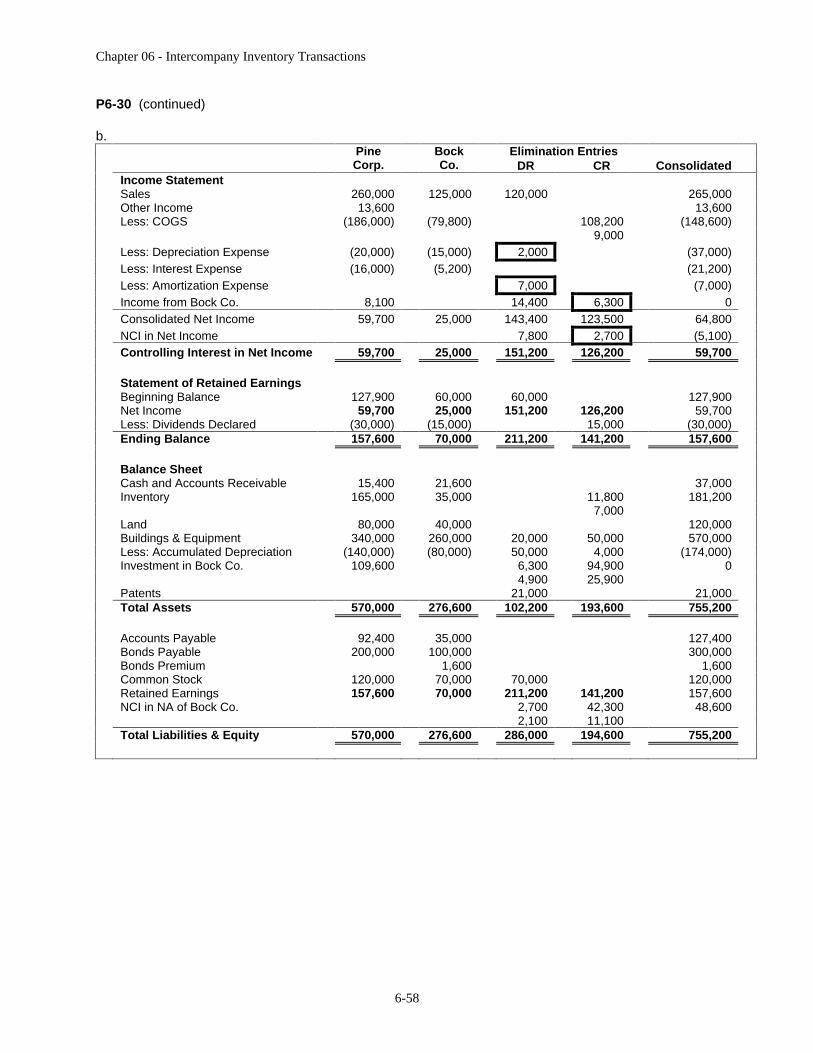
Chapter 06 - Intercompany Inventory Transactions
6-58
P6-30 (continued)
b. Elimination Entries
Pine Corp.
Bock Co. DR CR Consolidated
Income Statement
Sales 260,000
125,000
120,000
265,000
Other Income 13,600
13,600
Less: COGS (186,000) (79,800) 108,200
(148,600)
9,000
Less: Depreciation Expense (20,000) (15,000)
2,000
(37,000)
Less: Interest Expense (16,000) (5,200) (21,200)
Less: Amortization Expense
7,000
(7,000)
Income from Bock Co. 8,100
14,400
6,300
0
Consolidated Net Income 59,700
25,000
143,400
123,500
64,800
NCI in Net Income 7,800
2,700
(5,100)
Controlling Interest in Net Income
59,700
25,000
151,200
126,200
59,700
Statement of Retained Earnings
Beginning Balance 127,900
60,000
60,000
127,900
Net Income 59,700
25,000
151,200
126,200
59,700
Less: Dividends Declared (30,000) (15,000) 15,000
(30,000)
Ending Balance 157,600
70,000
211,200
141,200
157,600
Balance Sheet
Cash and Accounts Receivable 15,400
21,600
37,000
Inventory 165,000
35,000
11,800
181,200
7,000
Land 80,000
40,000
120,000
Buildings & Equipment 340,000
260,000
20,000
50,000
570,000
Less: Accumulated Depreciation (140,000) (80,000) 50,000
4,000
(174,000)
Investment in Bock Co. 109,600
6,300
94,900
0
4,900
25,900
Patents 21,000
21,000
Total Assets 570,000
276,600
102,200
193,600
755,200
Accounts Payable 92,400
35,000
127,400
Bonds Payable 200,000
100,000
300,000
Bonds Premium 1,600
1,600
Common Stock 120,000
70,000
70,000
120,000
Retained Earnings 157,600
70,000
211,200
141,200
157,600
NCI in NA of Bock Co. 2,700
42,300
48,600
2,100
11,100
Total Liabilities & Equity 570,000
276,600
286,000
194,600
755,200
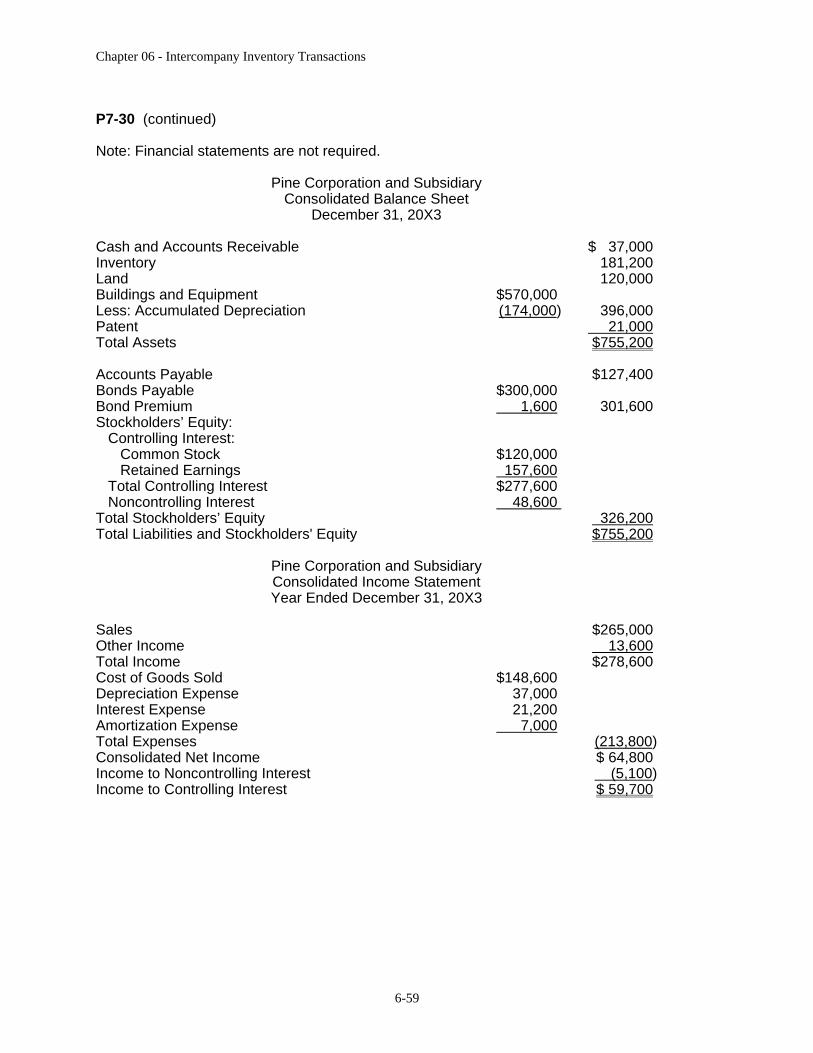
Chapter 06 - Intercompany Inventory Transactions
6-59
P7-30 (continued)
Note: Financial statements are not required.
Pine Corporation and Subsidiary Consolidated Balance Sheet
December 31, 20X3
Cash and Accounts Receivable
$ 37,000
Inventory
181,200
Land
120,000
Buildings and Equipment $570,000
Less: Accumulated Depreciation (174,000)
396,000
Patent
21,000
Total Assets
$755,200
Accounts Payable
$127,400
Bonds Payable $300,000
Bond Premium 1,600
301,600
Stockholders’ Equity:
Controlling Interest:
Common Stock $120,000
Retained Earnings 157,600
Total Controlling Interest $277,600
Noncontrolling Interest 48,600
Total Stockholders’ Equity
326,200
Total Liabilities and Stockholders' Equity
$755,200
Pine Corporation and Subsidiary Consolidated Income Statement Year Ended December 31, 20X3
Sales
$265,000
Other Income
13,600
Total Income
$278,600
Cost of Goods Sold $148,600
Depreciation Expense 37,000
Interest Expense 21,200
Amortization Expense 7,000
Total Expenses
(213,800)
Consolidated Net Income
$ 64,800
Income to Noncontrolling Interest
(5,100)
Income to Controlling Interest
$ 59,700
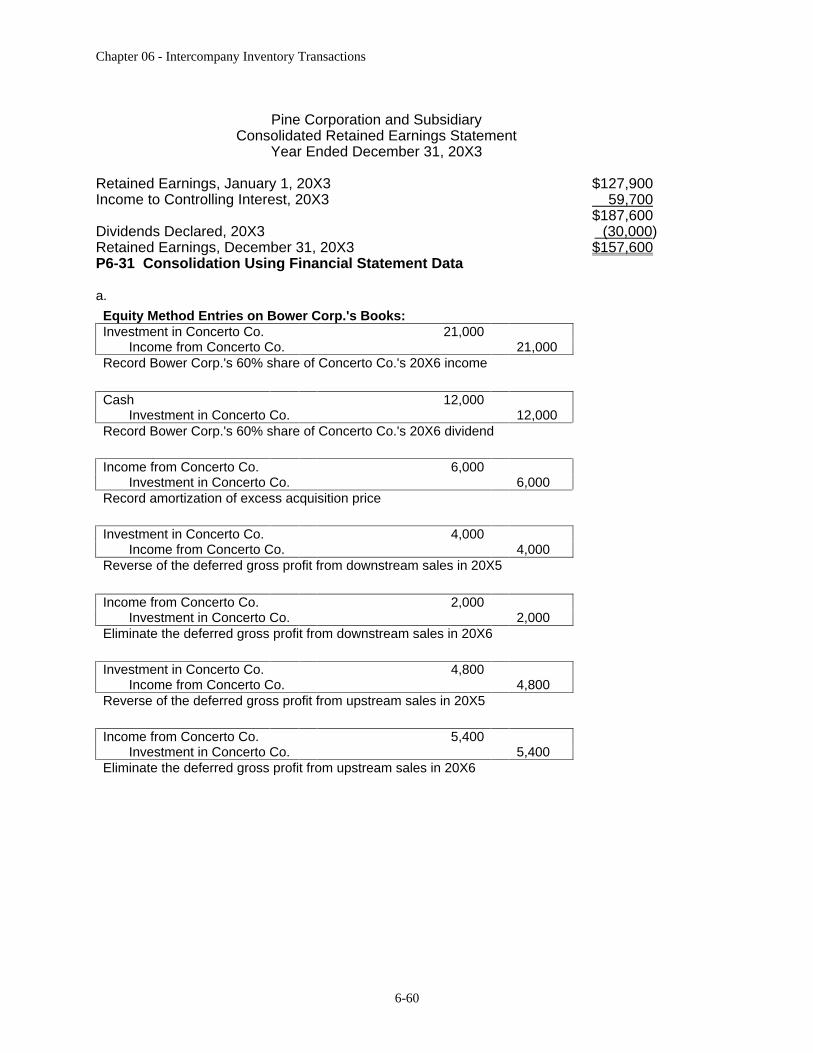
Chapter 06 - Intercompany Inventory Transactions
6-60
Pine Corporation and Subsidiary Consolidated Retained Earnings Statement
Year Ended December 31, 20X3
Retained Earnings, January 1, 20X3
$127,900
Income to Controlling Interest, 20X3
59,700
$187,600
Dividends Declared, 20X3
(30,000)
Retained Earnings, December 31, 20X3
$157,600
P6-31 Consolidation Using Financial Statement Data
a.
Equity Method Entries on Bower Corp.'s Books: Investment in Concerto Co.
21,000
Income from Concerto Co.
21,000 Record Bower Corp.'s 60% share of Concerto Co.'s 20X6 income
Cash
12,000
Investment in Concerto Co.
12,000 Record Bower Corp.'s 60% share of Concerto Co.'s 20X6 dividend
Income from Concerto Co.
6,000
Investment in Concerto Co. 6,000 Record amortization of excess acquisition price
Investment in Concerto Co.
4,000
Income from Concerto Co.
4,000 Reverse of the deferred gross profit from downstream sales in 20X5
Income from Concerto Co.
2,000
Investment in Concerto Co.
2,000 Eliminate the deferred gross profit from downstream sales in 20X6
Investment in Concerto Co.
4,800
Income from Concerto Co.
4,800 Reverse of the deferred gross profit from upstream sales in 20X5
Income from Concerto Co.
5,400
Investment in Concerto Co.
5,400 Eliminate the deferred gross profit from upstream sales in 20X6
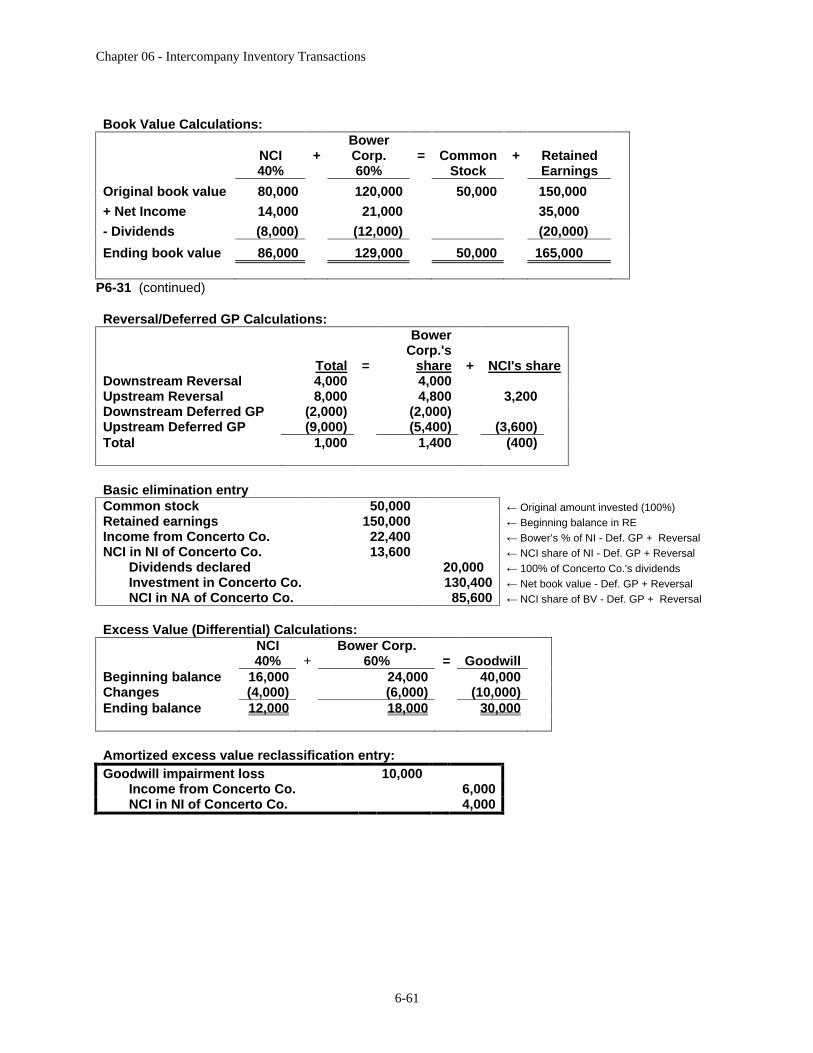
Chapter 06 - Intercompany Inventory Transactions
6-61
Book Value Calculations:
NCI 40%
+
Bower Corp. 60%
=
Common
Stock
+ Retained
Earnings
Original book value
80,000
120,000
50,000
150,000
+ Net Income 14,000
21,000
35,000
- Dividends (8,000)
(12,000)
(20,000)
Ending book value 86,000
129,000
50,000
165,000
P6-31 (continued)
Reversal/Deferred GP Calculations:
Total
=
Bower Corp.'s
share
+
NCI's share
Downstream Reversal 4,000
4,000
Upstream Reversal 8,000
4,800
3,200
Downstream Deferred GP (2,000)
(2,000)
Upstream Deferred GP (9,000)
(5,400)
(3,600)
Total 1,000
1,400
(400)
Basic elimination entry Common stock
50,000
Original amount invested (100%) Retained earnings
150,000
Beginning balance in RE Income from Concerto Co.
22,400
Bower’s % of NI - Def. GP + Reversal NCI in NI of Concerto Co.
13,600
NCI share of NI - Def. GP + Reversal Dividends declared
20,000 100% of Concerto Co.'s dividends Investment in Concerto Co.
130,400
Net book value - Def. GP + Reversal NCI in NA of Concerto Co.
85,600
NCI share of BV - Def. GP + Reversal
Excess Value (Differential) Calculations: NCI 40% +
Bower Corp. 60% =
Goodwill
Beginning balance 16,000
24,000
40,000
Changes (4,000)
(6,000)
(10,000)
Ending balance 12,000
18,000
30,000
Amortized excess value reclassification entry: Goodwill impairment loss
10,000
Income from Concerto Co.
6,000
NCI in NI of Concerto Co.
4,000

Chapter 06 - Intercompany Inventory Transactions
6-62
Excess value (differential) reclassification entry: Goodwill
30,000
Investment in Concerto Co.
18,000
NCI in NA of Concerto Co. 12,000
Optional accumulated depreciation elimination entry
Accumulated depreciation
25,000
Building & equipment
25,000 P6-31 (continued)
Reversal of last year's deferral:
Investment in Concerto Co.
8,800
NCI in NA of Concerto Co.
3,200
Cost of Goods Sold
12,000
Deferral of this year's unrealized profits on inventory transfers
Sales
112,000
Cost of Goods Sold
101,000
Inventory
11,000
20X5 Downstream Transactions:
Ending Inv., 20X5
Sales 14,000
COGS 10,000
Gross Profit 4,000
Gross Profit % 28.57%
20X6 Downstream Transactions:
Total
=
Re-sold
+
Ending Inventory
Sales 22,000
15,000
7,000
COGS 15,714
10,714
5,000
Gross Profit 6,286
4,286
2,000
Gross Profit % 28.57%
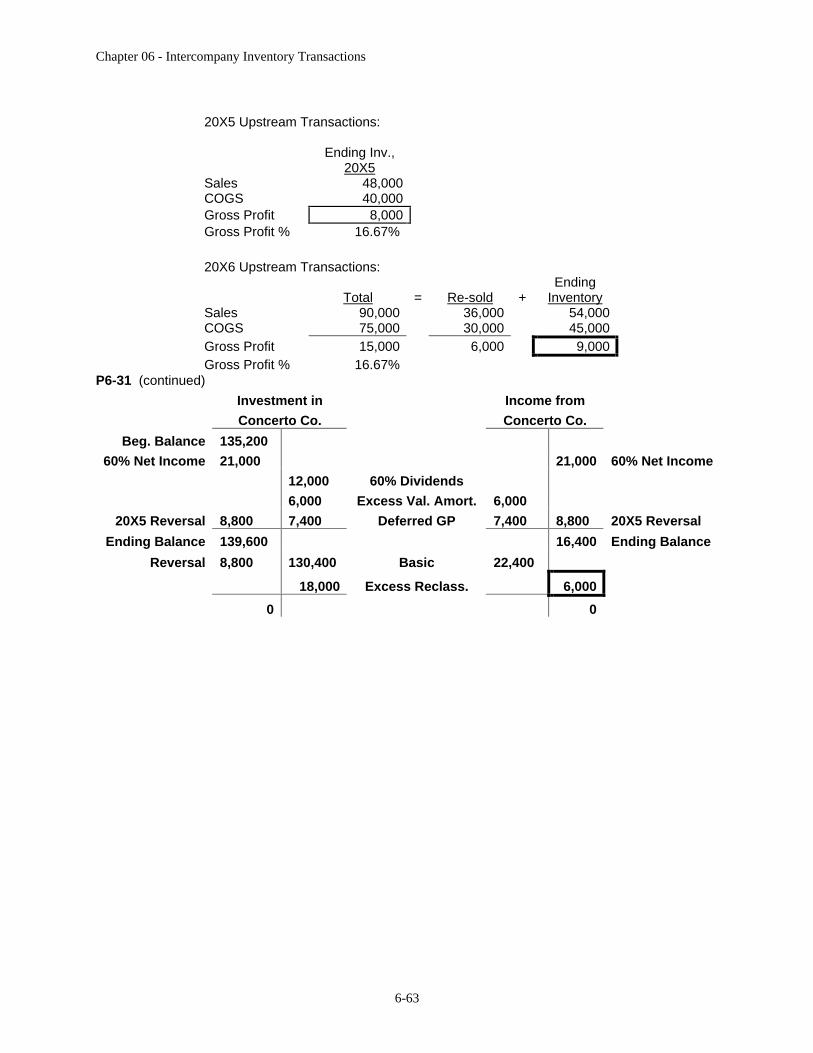
Chapter 06 - Intercompany Inventory Transactions
6-63
20X5 Upstream Transactions:
Ending Inv., 20X5
Sales 48,000
COGS 40,000
Gross Profit 8,000
Gross Profit % 16.67%
20X6 Upstream Transactions:
Total
=
Re-sold
+
Ending Inventory
Sales 90,000
36,000
54,000
COGS 75,000
30,000
45,000
Gross Profit 15,000
6,000
9,000
Gross Profit % 16.67%
P6-31 (continued)
Investment in Income from
Concerto Co. Concerto Co.
Beg. Balance
135,200
60% Net Income
21,000 21,000
60% Net Income
12,000 60% Dividends
6,000 Excess Val. Amort. 6,000
20X5 Reversal
8,800 7,400 Deferred GP 7,400 8,800 20X5 Reversal
Ending Balance
139,600 16,400
Ending Balance
Reversal
8,800 130,400
Basic 22,400
18,000
Excess Reclass. 6,000
0
0
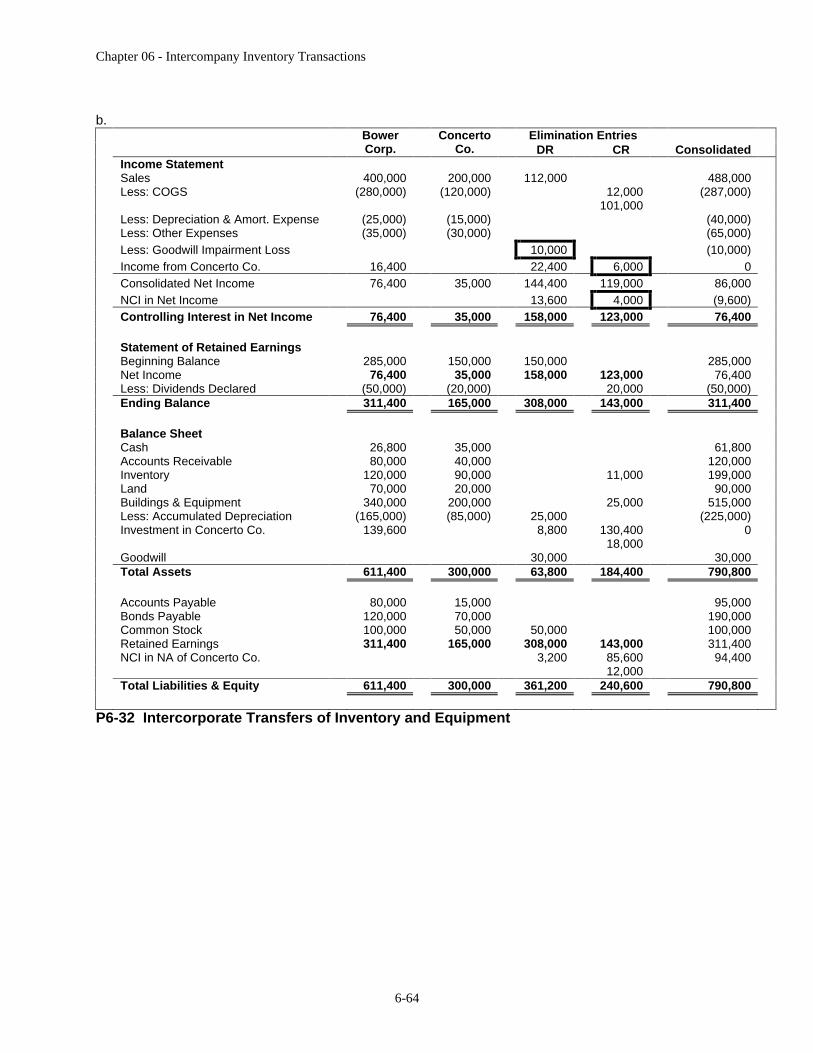
Chapter 06 - Intercompany Inventory Transactions
6-64
b. Elimination Entries
Bower Corp.
Concerto Co. DR CR Consolidated
Income Statement
Sales 400,000
200,000
112,000
488,000
Less: COGS (280,000) (120,000) 12,000
(287,000)
101,000
Less: Depreciation & Amort. Expense (25,000) (15,000) (40,000)
Less: Other Expenses (35,000) (30,000) (65,000)
Less: Goodwill Impairment Loss
10,000
(10,000)
Income from Concerto Co. 16,400
22,400
6,000
0
Consolidated Net Income 76,400
35,000
144,400
119,000
86,000
NCI in Net Income 13,600
4,000
(9,600)
Controlling Interest in Net Income 76,400
35,000
158,000
123,000
76,400
Statement of Retained Earnings
Beginning Balance 285,000
150,000
150,000
285,000
Net Income 76,400
35,000
158,000
123,000
76,400
Less: Dividends Declared (50,000) (20,000) 20,000
(50,000)
Ending Balance 311,400
165,000
308,000
143,000
311,400
Balance Sheet
Cash 26,800
35,000
61,800
Accounts Receivable 80,000
40,000
120,000
Inventory 120,000
90,000
11,000
199,000
Land 70,000
20,000
90,000
Buildings & Equipment 340,000
200,000
25,000
515,000
Less: Accumulated Depreciation (165,000) (85,000) 25,000
(225,000)
Investment in Concerto Co. 139,600
8,800
130,400
0
18,000
Goodwill 30,000
30,000
Total Assets 611,400
300,000
63,800
184,400
790,800
Accounts Payable 80,000
15,000
95,000
Bonds Payable 120,000
70,000
190,000
Common Stock 100,000
50,000
50,000
100,000
Retained Earnings 311,400
165,000
308,000
143,000
311,400
NCI in NA of Concerto Co. 3,200
85,600
94,400
12,000
Total Liabilities & Equity 611,400
300,000
361,200
240,600
790,800
P6-32 Intercorporate Transfers of Inventory and Equipment
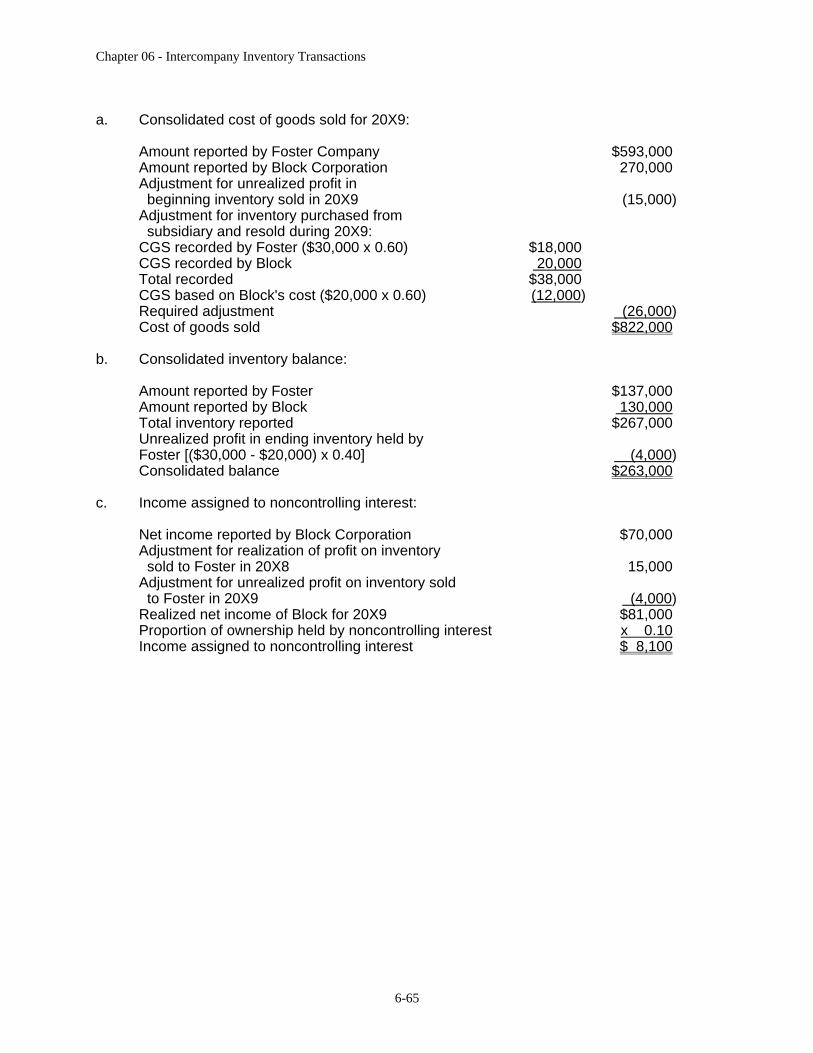
Chapter 06 - Intercompany Inventory Transactions
6-65
a. Consolidated cost of goods sold for 20X9:
Amount reported by Foster Company
$593,000
Amount reported by Block Corporation
270,000
Adjustment for unrealized profit in
beginning inventory sold in 20X9
(15,000)
Adjustment for inventory purchased from
subsidiary and resold during 20X9:
CGS recorded by Foster ($30,000 x 0.60) $18,000
CGS recorded by Block 20,000
Total recorded $38,000
CGS based on Block's cost ($20,000 x 0.60) (12,000)
Required adjustment
(26,000)
Cost of goods sold
$822,000
b. Consolidated inventory balance:
Amount reported by Foster
$137,000
Amount reported by Block
130,000
Total inventory reported
$267,000
Unrealized profit in ending inventory held by
Foster [($30,000 - $20,000) x 0.40]
(4,000)
Consolidated balance
$263,000
c. Income assigned to noncontrolling interest:
Net income reported by Block Corporation
$70,000
Adjustment for realization of profit on inventory
sold to Foster in 20X8
15,000
Adjustment for unrealized profit on inventory sold
to Foster in 20X9
(4,000)
Realized net income of Block for 20X9
$81,000
Proportion of ownership held by noncontrolling interest
x 0.10
Income assigned to noncontrolling interest
$ 8,100
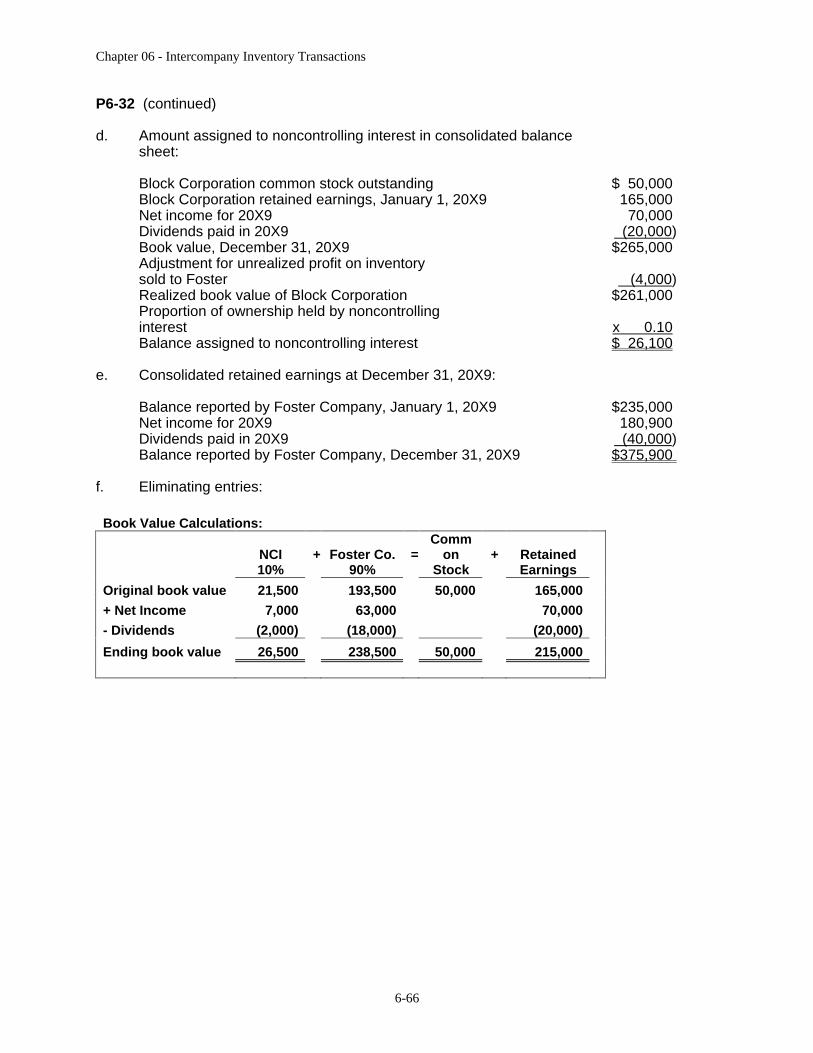
Chapter 06 - Intercompany Inventory Transactions
6-66
P6-32 (continued)
d. Amount assigned to noncontrolling interest in consolidated balance sheet:
Block Corporation common stock outstanding $ 50,000
Block Corporation retained earnings, January 1, 20X9 165,000
Net income for 20X9 70,000
Dividends paid in 20X9 (20,000)
Book value, December 31, 20X9 $265,000
Adjustment for unrealized profit on inventory
sold to Foster (4,000)
Realized book value of Block Corporation $261,000
Proportion of ownership held by noncontrolling
interest x 0.10
Balance assigned to noncontrolling interest $ 26,100
e. Consolidated retained earnings at December 31, 20X9:
Balance reported by Foster Company, January 1, 20X9 $235,000
Net income for 20X9 180,900
Dividends paid in 20X9 (40,000)
Balance reported by Foster Company, December 31, 20X9 $375,900
f. Eliminating entries:
Book Value Calculations:
NCI 10%
+
Foster Co.
90% =
Common
Stock + Retained
Earnings
Original book value
21,500
193,500
50,000
165,000
+ Net Income 7,000
63,000
70,000
- Dividends (2,000)
(18,000)
(20,000)
Ending book value 26,500
238,500
50,000
215,000
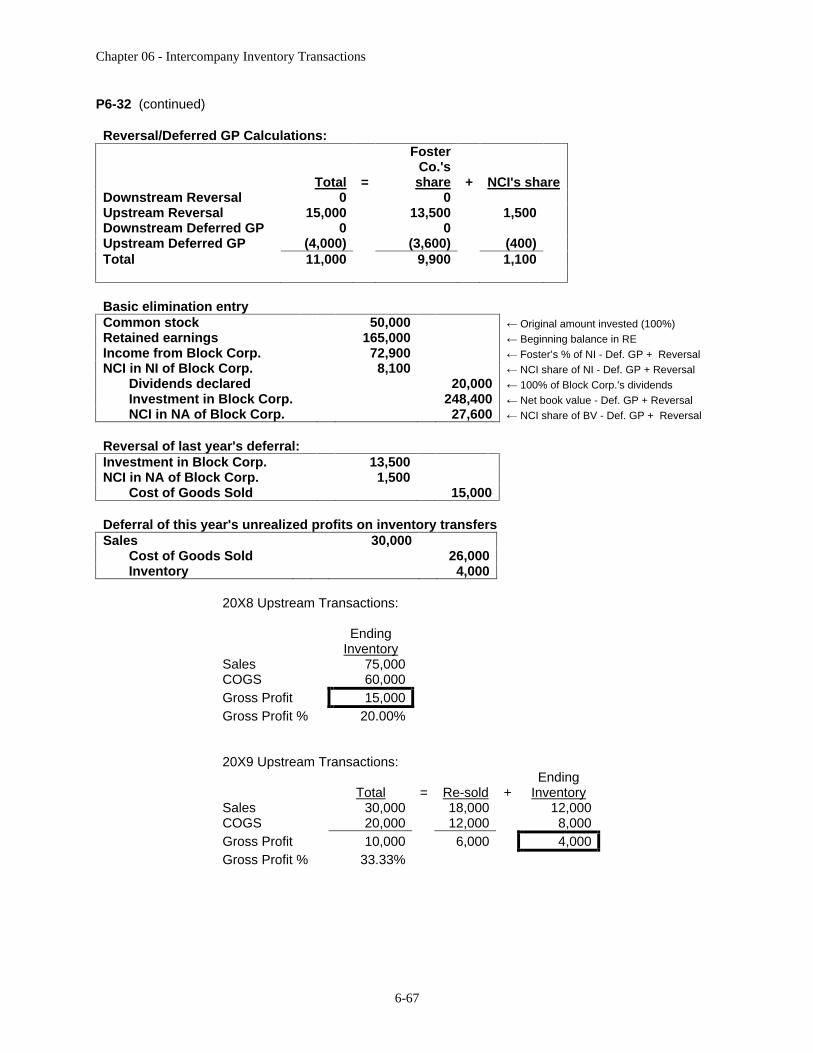
Chapter 06 - Intercompany Inventory Transactions
6-67
P6-32 (continued)
Reversal/Deferred GP Calculations:
Total
=
Foster
Co.'s share
+
NCI's share
Downstream Reversal 0
0
Upstream Reversal 15,000
13,500
1,500
Downstream Deferred GP 0
0
Upstream Deferred GP (4,000)
(3,600)
(400)
Total 11,000
9,900
1,100
Basic elimination entry Common stock
50,000
Original amount invested (100%) Retained earnings
165,000
Beginning balance in RE Income from Block Corp.
72,900
Foster’s % of NI - Def. GP + Reversal NCI in NI of Block Corp.
8,100
NCI share of NI - Def. GP + Reversal Dividends declared
20,000
100% of Block Corp.'s dividends Investment in Block Corp.
248,400
Net book value - Def. GP + Reversal NCI in NA of Block Corp.
27,600
NCI share of BV - Def. GP + Reversal
Reversal of last year's deferral: Investment in Block Corp.
13,500
NCI in NA of Block Corp.
1,500
Cost of Goods Sold
15,000
Deferral of this year's unrealized profits on inventory transfers Sales
30,000
Cost of Goods Sold
26,000
Inventory
4,000
20X8 Upstream Transactions:
Ending Inventory
Sales 75,000
COGS 60,000
Gross Profit 15,000
Gross Profit % 20.00%
20X9 Upstream Transactions:
Total
=
Re-sold
+
Ending Inventory
Sales 30,000
18,000
12,000
COGS 20,000
12,000
8,000
Gross Profit 10,000
6,000
4,000
Gross Profit % 33.33%
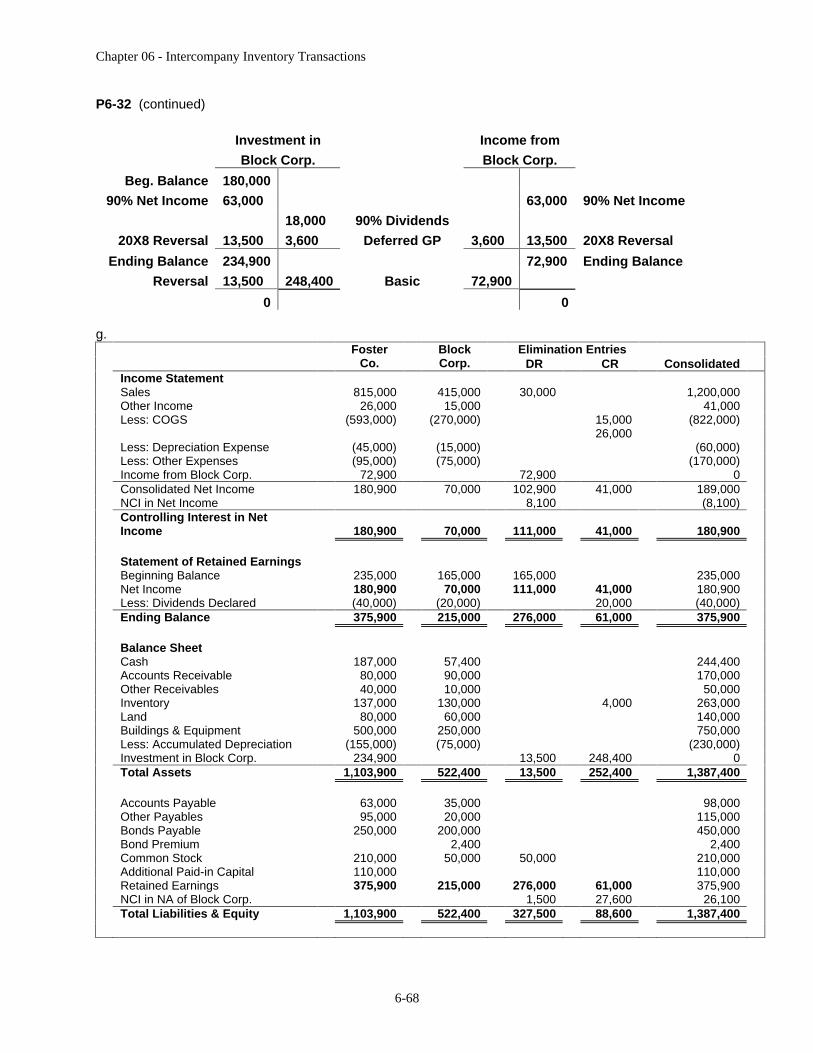
Chapter 06 - Intercompany Inventory Transactions
6-68
P6-32 (continued)
Investment in Income from
Block Corp. Block Corp.
Beg. Balance
180,000
90% Net Income
63,000 63,000
90% Net Income
18,000 90% Dividends
20X8 Reversal
13,500 3,600 Deferred GP 3,600 13,500
20X8 Reversal
Ending Balance
234,900
72,900
Ending Balance
Reversal
13,500 248,400
Basic 72,900
0
0
g. Elimination Entries
Foster Co.
Block Corp. DR CR Consolidated
Income Statement
Sales 815,000
415,000
30,000
1,200,000
Other Income 26,000
15,000
41,000
Less: COGS (593,000) (270,000) 15,000
(822,000)
26,000
Less: Depreciation Expense (45,000) (15,000) (60,000)
Less: Other Expenses (95,000) (75,000) (170,000)
Income from Block Corp. 72,900
72,900
0
Consolidated Net Income 180,900
70,000
102,900
41,000
189,000
NCI in Net Income 8,100
(8,100)
Controlling Interest in Net Income 180,900
70,000
111,000
41,000
180,900
Statement of Retained Earnings
Beginning Balance 235,000
165,000
165,000
235,000
Net Income 180,900
70,000
111,000
41,000
180,900
Less: Dividends Declared (40,000) (20,000) 20,000
(40,000)
Ending Balance 375,900
215,000
276,000
61,000
375,900
Balance Sheet
Cash 187,000
57,400
244,400
Accounts Receivable 80,000
90,000
170,000
Other Receivables 40,000
10,000
50,000
Inventory 137,000
130,000
4,000
263,000
Land 80,000
60,000
140,000
Buildings & Equipment 500,000
250,000
750,000
Less: Accumulated Depreciation (155,000) (75,000) (230,000)
Investment in Block Corp. 234,900
13,500
248,400
0
Total Assets 1,103,900
522,400
13,500
252,400
1,387,400
Accounts Payable 63,000
35,000
98,000
Other Payables 95,000
20,000
115,000
Bonds Payable 250,000
200,000
450,000
Bond Premium 2,400
2,400
Common Stock 210,000
50,000
50,000
210,000
Additional Paid-in Capital 110,000
110,000
Retained Earnings 375,900
215,000
276,000
61,000
375,900
NCI in NA of Block Corp. 1,500
27,600
26,100
Total Liabilities & Equity 1,103,900
522,400
327,500
88,600
1,387,400

Chapter 06 - Intercompany Inventory Transactions
6-69
P6-33 Consolidated Balance Sheet Worksheet [AICPA Adapted]
Book Value Calculations:
NCI 10% +
Pine Corp.
90% =
Common
Stock + Retained
Earnings
Original book value 80,000
720,000
200,000
600,000
+ Net Income 10,100
90,900
101,000
- Dividends (100)
(900)
(1,000)
Ending book value 90,000
810,000
200,000
700,000
Reversal/Deferred GP Calculations:
Total
=
Pine Corp.'s
share
+
NCI's share
Downstream Reversal 0
0
Upstream Reversal 0
0
0
Downstream Deferred GP -3,000
-3,000
Upstream Deferred GP 0
0
0
Total (3,000)
(3,000)
0
Basic elimination entry
Common stock
200,000
Original amount invested (100%)
Retained earnings
600,000
Beginning balance in RE
Income from Slim Corp.
87,900
Pine’s % of NI - Def. GP + Reversal
NCI in NI of Slim Corp.
10,100
NCI share of NI - Def. GP + Reversal
Dividends declared
1,000
100% of Slim Corp.'s dividends
Investment in Slim Corp.
807,000
Net book value - Def. GP + Reversal
NCI in NA of Slim Corp.
90,000
NCI share of BV - Def. GP + Reversal
Excess Value (Differential) Calculations: NCI 10% +
Pine Corp. 90% =
Goodwill
Beginning balance 50,000
450,000
500,000
Changes 0
0
0
Ending balance 50,000
450,000
500,000
Excess value (differential) reclassification entry:
Goodwill
500,000
Investment in Slim Corp.
450,000
NCI in NA of Slim Corp. 50,000

Chapter 06 - Intercompany Inventory Transactions
6-70
P6-33 (continued)
Intercompany Transactions
Dividends Payable
900
Dividends Receivable
900
Accounts Payable
90,000
Accounts Receivable
90,000
Note Payable
100,000
Note Receivable
100,000
Interest Payable
5,000
Interest Receivable
5,000
Deferral of this year's unrealized profits on inventory transfers
Sales
300,000
Cost of Goods Sold
297,000
Inventory
3,000
20X6 Downstream Transactions:
Total
=
Re-sold
+
Ending Inventory
Sales 300,000
285,000
15,000
COGS 240,000
228,000
12,000
Gross Profit 60,000
57,000
3,000
Gross Profit % 20.00%
Investment in Income from
Slim Corp. Slim Corp. Acquisition
Price
1,170,000
90% Net Income
90,900
90,900
90% Net Income
900
90% Dividends
3,000
Deferred GP 3,000
Ending Balance
1,257,000
87,900
Ending Balance
807,000
Basic 87,900
450,000
Excess Reclass.
0
0
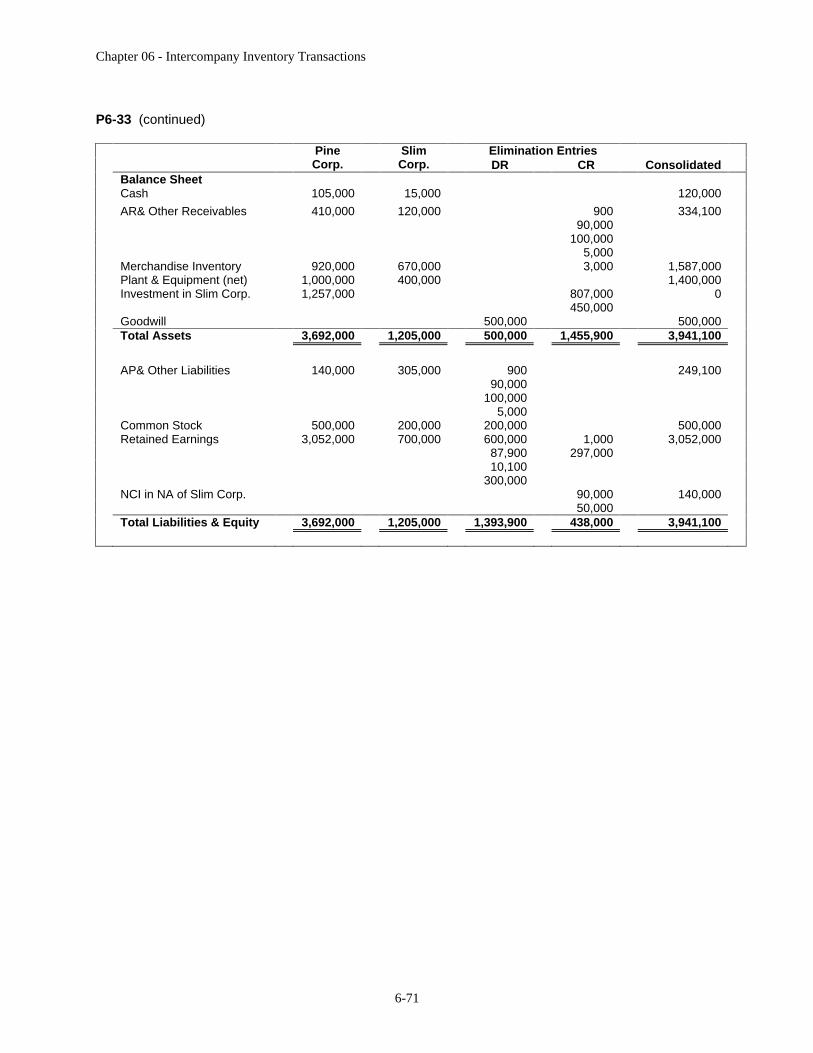
Chapter 06 - Intercompany Inventory Transactions
6-71
P6-33 (continued)
Elimination Entries
Pine Corp.
Slim Corp. DR CR Consolidated
Balance Sheet
Cash 105,000
15,000
120,000
AR& Other Receivables 410,000
120,000
900
334,100
90,000
100,000
5,000
Merchandise Inventory 920,000
670,000
3,000
1,587,000
Plant & Equipment (net) 1,000,000
400,000
1,400,000
Investment in Slim Corp. 1,257,000
807,000
0
450,000
Goodwill 500,000
500,000
Total Assets 3,692,000
1,205,000
500,000
1,455,900
3,941,100
AP& Other Liabilities 140,000
305,000
900
249,100
90,000
100,000
5,000
Common Stock 500,000
200,000
200,000
500,000
Retained Earnings 3,052,000
700,000
600,000
1,000
3,052,000
87,900
297,000
10,100
300,000
NCI in NA of Slim Corp. 90,000
140,000
50,000
Total Liabilities & Equity 3,692,000
1,205,000
1,393,900
438,000
3,941,100
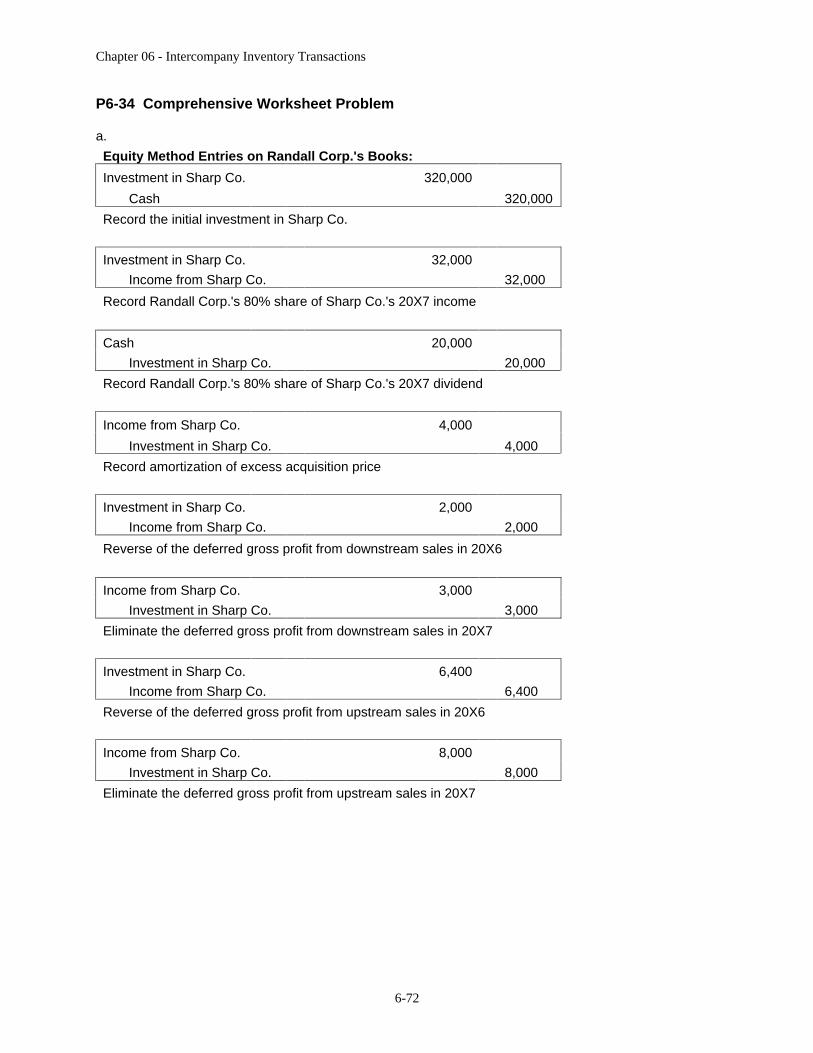
Chapter 06 - Intercompany Inventory Transactions
6-72
P6-34 Comprehensive Worksheet Problem
a.
Equity Method Entries on Randall Corp.'s Books:
Investment in Sharp Co.
320,000
Cash
320,000
Record the initial investment in Sharp Co.
Investment in Sharp Co.
32,000
Income from Sharp Co.
32,000
Record Randall Corp.'s 80% share of Sharp Co.'s 20X7 income
Cash
20,000
Investment in Sharp Co. 20,000
Record Randall Corp.'s 80% share of Sharp Co.'s 20X7 dividend
Income from Sharp Co.
4,000
Investment in Sharp Co. 4,000
Record amortization of excess acquisition price
Investment in Sharp Co.
2,000
Income from Sharp Co.
2,000
Reverse of the deferred gross profit from downstream sales in 20X6
Income from Sharp Co.
3,000
Investment in Sharp Co.
3,000
Eliminate the deferred gross profit from downstream sales in 20X7
Investment in Sharp Co.
6,400
Income from Sharp Co.
6,400
Reverse of the deferred gross profit from upstream sales in 20X6
Income from Sharp Co.
8,000
Investment in Sharp Co.
8,000
Eliminate the deferred gross profit from upstream sales in 20X7

Chapter 06 - Intercompany Inventory Transactions
6-73
6-34 (continued)
b.
Book Value Calculations:
NCI 20%
+
Randall Corp. 80%
=
Common
Stock
+ Add. Paid-in Capital
+
Retained
Earnings
Original book value
67,000
268,000
100,000
20,000
215,000
+ Net Income 8,000
32,000
40,000
- Dividends (5,000)
(20,000)
(25,000)
Ending book value 70,000
280,000
100,000
20,000
230,000
Reversal/Deferred GP Calculations:
Total
=
Randall Corp.'s
share
+
NCI's share
Downstream Reversal 2,000
2,000
Upstream Reversal 8,000
6,400
1,600
Downstream Deferred GP (3,000)
(3,000)
Upstream Deferred GP (10,000)
(8,000)
(2,000)
Total (3,000)
(2,600)
(400)
Basic elimination entry
Common stock
100,000
Original amount invested (100%)
Additional paid-in capital
20,000
Beginning balance in APIC
Retained earnings
215,000
Beginning balance in RE
Income from Sharp Co.
29,400
Randall’s % of NI - Def. GP + Reversal
NCI in NI of Sharp Co.
7,600
NCI share of NI - Def. GP + Reversal
Dividends declared
25,000
100% of Sharp Co.'s dividends
Investment in Sharp Co.
277,400
Net book value - Def. GP + Reversal
NCI in NA of Sharp Co.
69,600
NCI share of BV - Def. GP + Reversal
Excess Value (Differential) Calculations: NCI 20% +
Randall Corp. 80% =
Buildings & equipment + Acc. Depr.
Beginning balance 7,000
28,000
50,000
(15,000)
Changes (1,000)
(4,000)
(5,000)
Ending balance 6,000
24,000
50,000
(20,000)
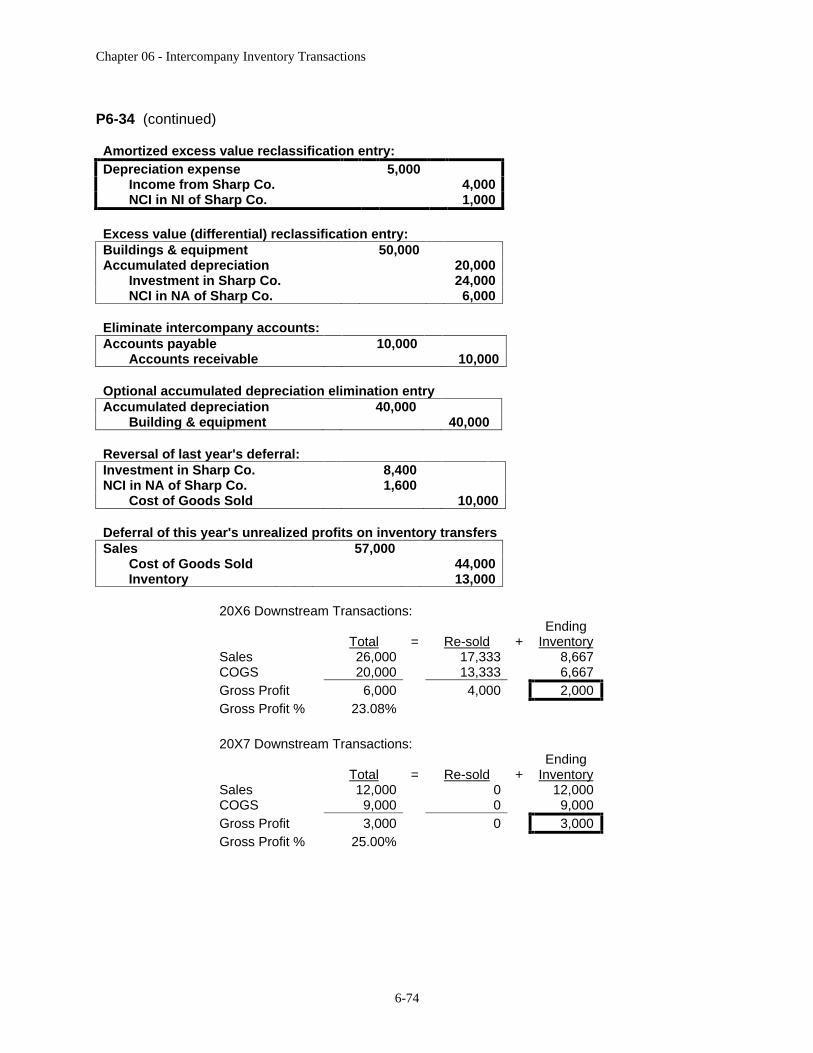
Chapter 06 - Intercompany Inventory Transactions
6-74
P6-34 (continued)
Amortized excess value reclassification entry: Depreciation expense
5,000
Income from Sharp Co.
4,000
NCI in NI of Sharp Co.
1,000
Excess value (differential) reclassification entry: Buildings & equipment
50,000
Accumulated depreciation
20,000
Investment in Sharp Co. 24,000
NCI in NA of Sharp Co. 6,000
Eliminate intercompany accounts: Accounts payable
10,000
Accounts receivable
10,000
Optional accumulated depreciation elimination entry Accumulated depreciation
40,000
Building & equipment
40,000
Reversal of last year's deferral: Investment in Sharp Co.
8,400
NCI in NA of Sharp Co.
1,600
Cost of Goods Sold
10,000
Deferral of this year's unrealized profits on inventory transfers Sales
57,000
Cost of Goods Sold
44,000
Inventory
13,000
20X6 Downstream Transactions:
Total
=
Re-sold
+
Ending Inventory
Sales 26,000
17,333
8,667
COGS 20,000
13,333
6,667
Gross Profit 6,000
4,000
2,000
Gross Profit % 23.08%
20X7 Downstream Transactions:
Total
=
Re-sold
+
Ending Inventory
Sales 12,000
0
12,000
COGS 9,000
0
9,000
Gross Profit 3,000
0
3,000
Gross Profit % 25.00%
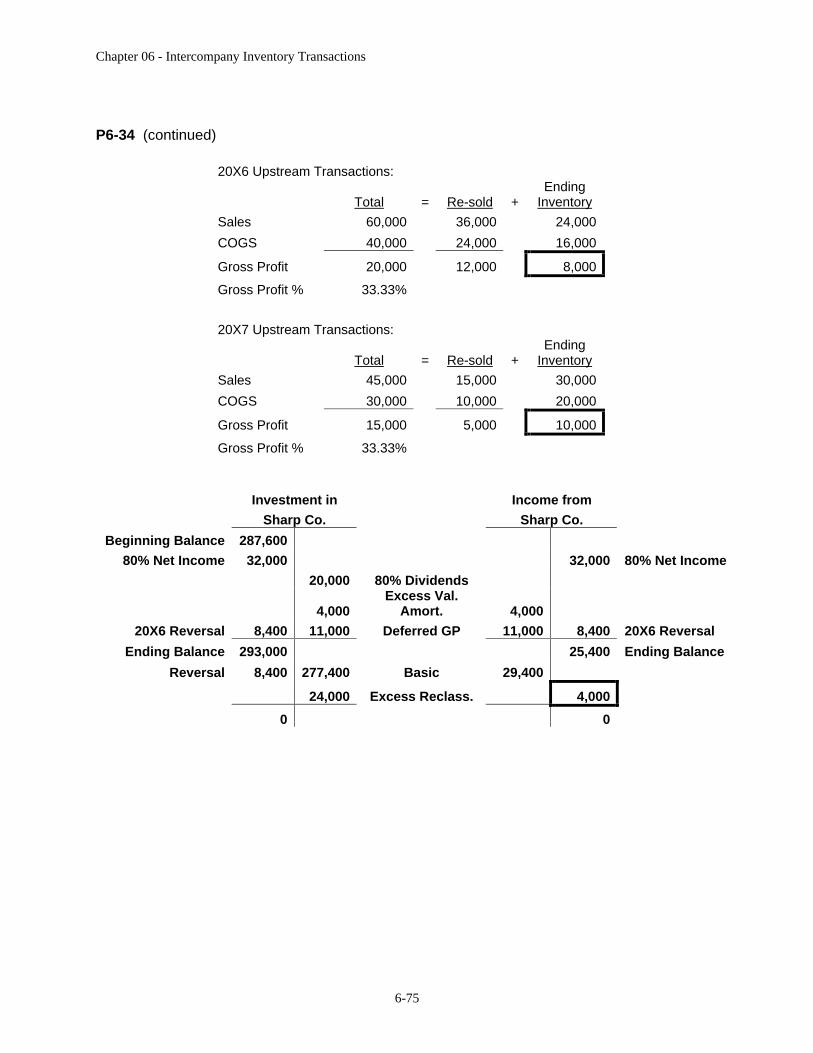
Chapter 06 - Intercompany Inventory Transactions
6-75
P6-34 (continued)
20X6 Upstream Transactions:
Total
=
Re-sold
+
Ending
Inventory
Sales 60,000
36,000
24,000
COGS 40,000
24,000
16,000
Gross Profit 20,000
12,000
8,000
Gross Profit % 33.33%
20X7 Upstream Transactions:
Total
=
Re-sold
+
Ending Inventory
Sales 45,000
15,000
30,000
COGS 30,000
10,000
20,000
Gross Profit 15,000
5,000
10,000
Gross Profit % 33.33%
Investment in Income from
Sharp Co. Sharp Co.
Beginning Balance
287,600
80% Net Income
32,000
32,000
80% Net Income
20,000
80% Dividends
4,000
Excess Val. Amort. 4,000
20X6 Reversal
8,400
11,000
Deferred GP 11,000
8,400
20X6 Reversal
Ending Balance
293,000
25,400
Ending Balance
Reversal
8,400
277,400
Basic 29,400
24,000
Excess Reclass.
4,000
0
0
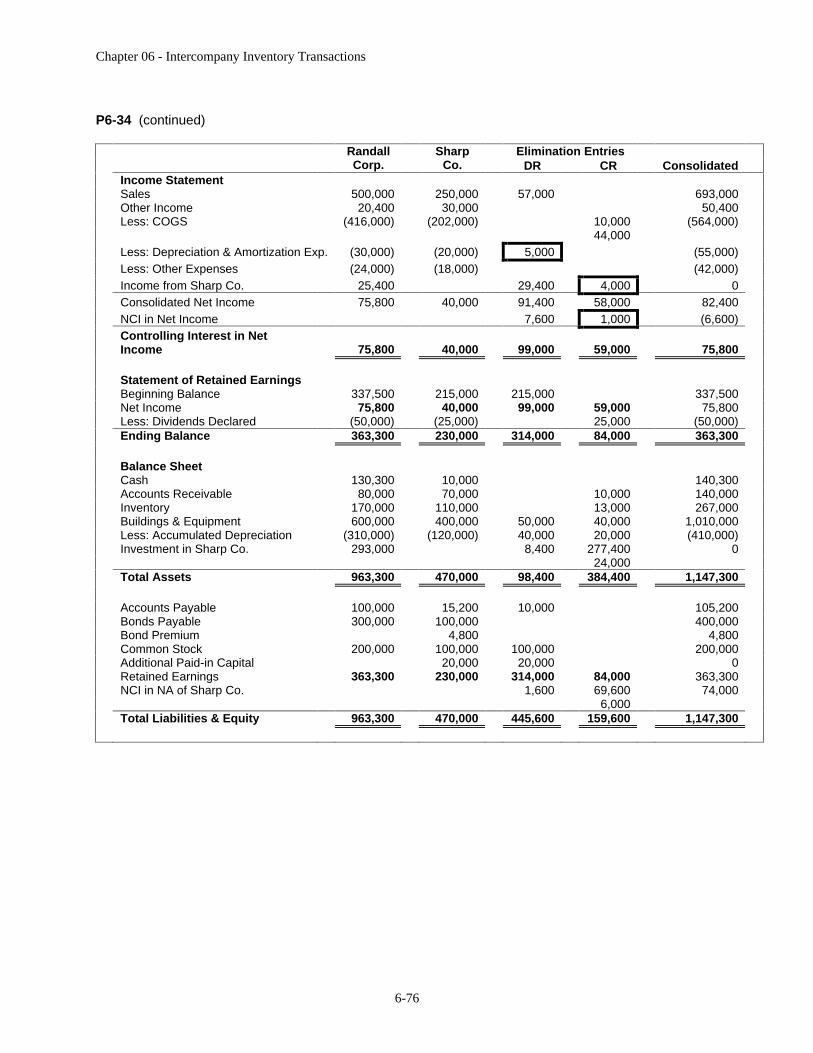
Chapter 06 - Intercompany Inventory Transactions
6-76
P6-34 (continued)
Elimination Entries
Randall Corp.
Sharp Co. DR CR Consolidated
Income Statement
Sales 500,000
250,000
57,000
693,000
Other Income 20,400
30,000
50,400
Less: COGS (416,000) (202,000) 10,000
(564,000)
44,000
Less: Depreciation & Amortization Exp. (30,000) (20,000)
5,000
(55,000)
Less: Other Expenses (24,000) (18,000) (42,000)
Income from Sharp Co. 25,400
29,400
4,000
0
Consolidated Net Income 75,800
40,000
91,400
58,000
82,400
NCI in Net Income 7,600
1,000
(6,600)
Controlling Interest in Net Income 75,800
40,000
99,000
59,000
75,800
Statement of Retained Earnings
Beginning Balance 337,500
215,000
215,000
337,500
Net Income 75,800
40,000
99,000
59,000
75,800
Less: Dividends Declared (50,000) (25,000) 25,000
(50,000)
Ending Balance 363,300
230,000
314,000
84,000
363,300
Balance Sheet
Cash 130,300
10,000
140,300
Accounts Receivable 80,000
70,000
10,000
140,000
Inventory 170,000
110,000
13,000
267,000
Buildings & Equipment 600,000
400,000
50,000
40,000
1,010,000
Less: Accumulated Depreciation (310,000) (120,000) 40,000
20,000
(410,000)
Investment in Sharp Co. 293,000
8,400
277,400
0
24,000
Total Assets 963,300
470,000
98,400
384,400
1,147,300
Accounts Payable 100,000
15,200
10,000
105,200
Bonds Payable 300,000
100,000
400,000
Bond Premium 4,800
4,800
Common Stock 200,000
100,000
100,000
200,000
Additional Paid-in Capital 20,000
20,000
0
Retained Earnings 363,300
230,000
314,000
84,000
363,300
NCI in NA of Sharp Co. 1,600
69,600
74,000
6,000
Total Liabilities & Equity 963,300
470,000
445,600
159,600
1,147,300
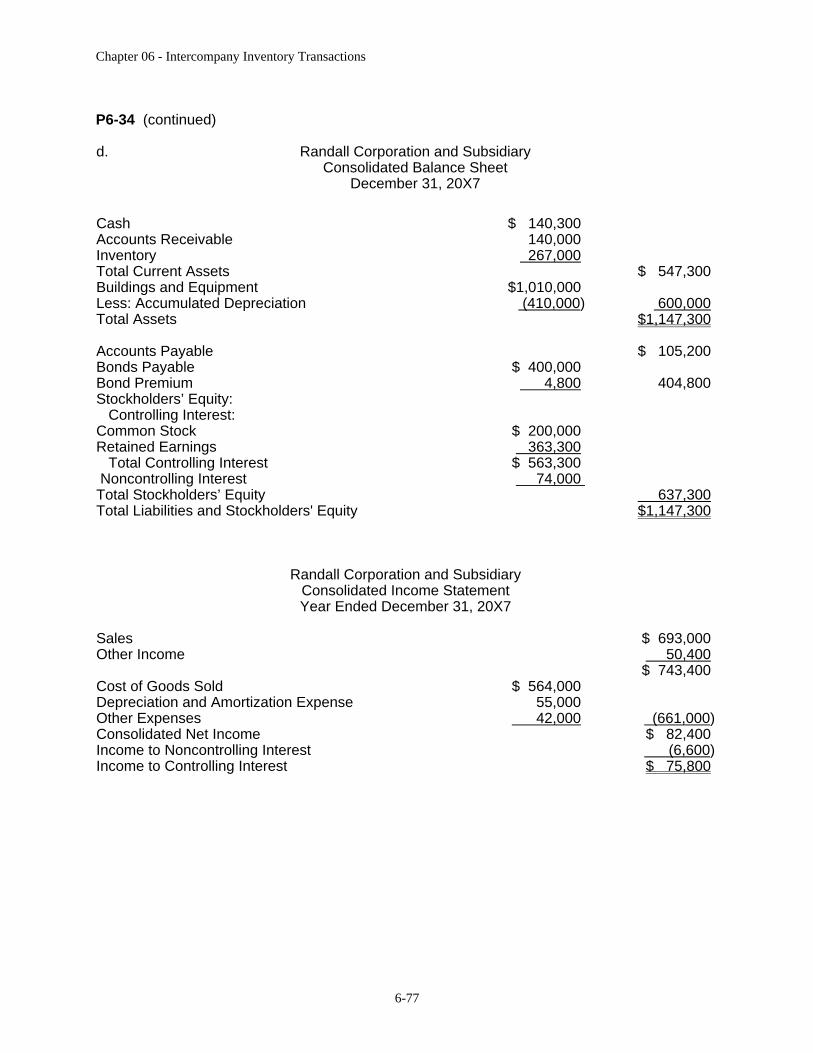
Chapter 06 - Intercompany Inventory Transactions
6-77
P6-34 (continued)
d.
Randall Corporation and Subsidiary
Consolidated Balance Sheet December 31, 20X7
Cash
$ 140,300
Accounts Receivable
140,000
Inventory
267,000
Total Current Assets
$ 547,300
Buildings and Equipment
$1,010,000
Less: Accumulated Depreciation
(410,000)
600,000
Total Assets
$1,147,300
Accounts Payable
$ 105,200
Bonds Payable
$ 400,000
Bond Premium
4,800
404,800
Stockholders’ Equity:
Controlling Interest:
Common Stock
$ 200,000
Retained Earnings
363,300
Total Controlling Interest
$ 563,300
Noncontrolling Interest
74,000
Total Stockholders’ Equity
637,300
Total Liabilities and Stockholders' Equity
$1,147,300
Randall Corporation and Subsidiary Consolidated Income Statement Year Ended December 31, 20X7
Sales
$ 693,000
Other Income
50,400
$ 743,400
Cost of Goods Sold
$ 564,000
Depreciation and Amortization Expense
55,000
Other Expenses
42,000
(661,000)
Consolidated Net Income
$ 82,400
Income to Noncontrolling Interest
(6,600)
Income to Controlling Interest
$ 75,800

Chapter 06 - Intercompany Inventory Transactions
6-78
Randall Corporation and Subsidiary
Consolidated Statement of Retained Earnings Year Ended December 31, 20X7
Retained Earnings, January 1, 20X7
$ 337,500
Income to Controlling Interest, 20X7
75,800
$ 413,300
Dividends Declared, 20X7
(50,000)
Retained Earnings, December 31, 20X7
$ 363,300
P6-35 Comprehensive Consolidation Worksheet; Equity Method [AICPA Adapted]
Equity Method Entries on Fran Corp.'s Books:
Investment in Brey Inc.
750,000
Cash
750,000
Record the initial investment in Brey Inc.
Investment in Brey Inc.
190,000
Income from Brey Inc.
190,000
Record Fran Corp.'s 100% share of Brey Inc.'s 20X9 income
Cash
40,000
Investment in Brey Inc. 40,000
Record Fran Corp.'s 100% share of Brey Inc.'s 20X9 dividend
Income from Brey Inc.
44,000
Investment in Brey Inc.
44,000
Record amortization of excess acquisition price
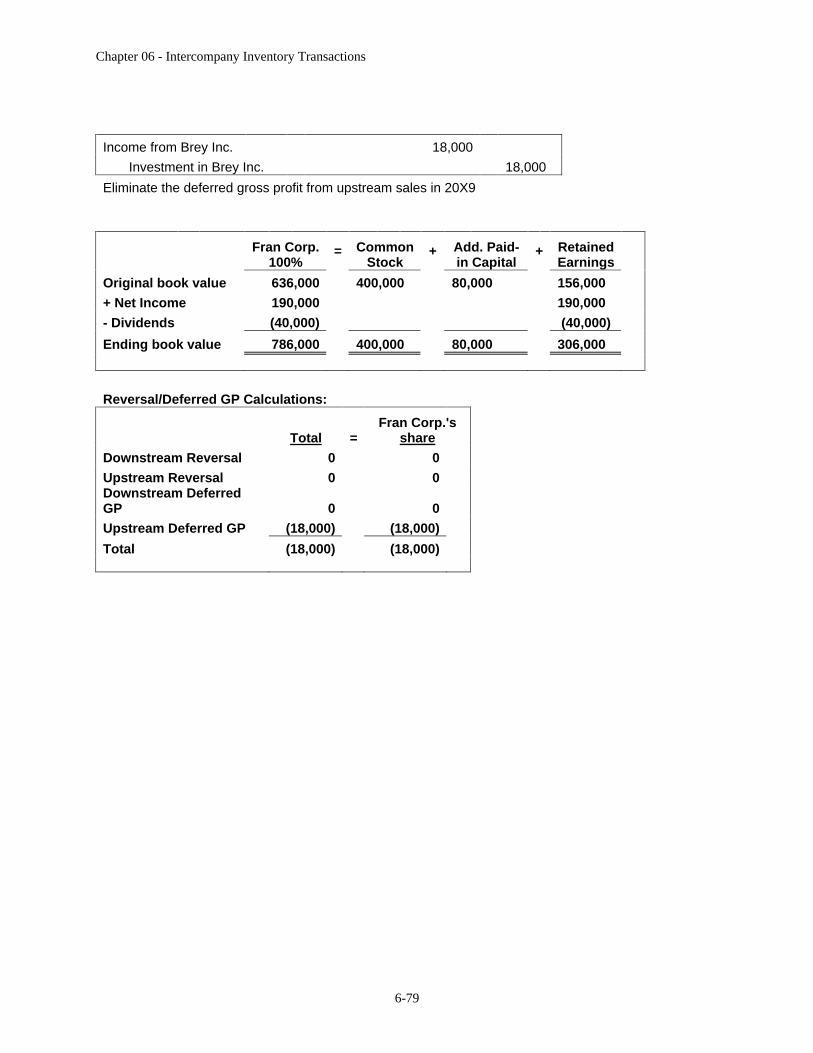
Chapter 06 - Intercompany Inventory Transactions
6-79
Income from Brey Inc.
18,000
Investment in Brey Inc.
18,000
Eliminate the deferred gross profit from upstream sales in 20X9
Fran Corp.
100% =
Common
Stock + Add. Paid-
in Capital +
Retained
Earnings
Original book value 636,000
400,000 80,000 156,000
+ Net Income 190,000
190,000
- Dividends (40,000)
(40,000)
Ending book value 786,000
400,000 80,000 306,000
Reversal/Deferred GP Calculations:
Total
=
Fran Corp.'s share
Downstream Reversal 0
0
Upstream Reversal 0
0
Downstream Deferred GP 0
0
Upstream Deferred GP (18,000)
(18,000)
Total (18,000)
(18,000)
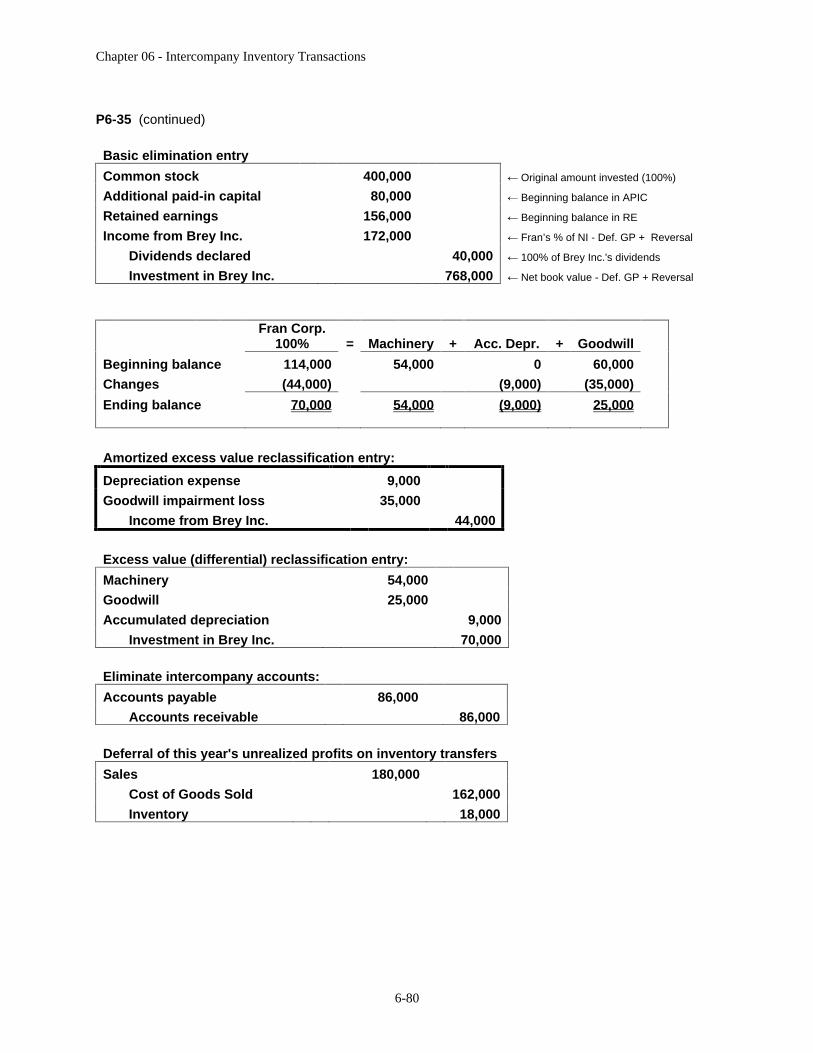
Chapter 06 - Intercompany Inventory Transactions
6-80
P6-35 (continued)
Basic elimination entry
Common stock
400,000
Original amount invested (100%)
Additional paid-in capital
80,000
Beginning balance in APIC
Retained earnings
156,000
Beginning balance in RE
Income from Brey Inc.
172,000
Fran’s % of NI - Def. GP + Reversal
Dividends declared
40,000
100% of Brey Inc.'s dividends
Investment in Brey Inc.
768,000
Net book value - Def. GP + Reversal
Fran Corp. 100% =
Machinery
+ Acc. Depr. +
Goodwill
Beginning balance 114,000
54,000
0
60,000
Changes (44,000)
(9,000)
(35,000)
Ending balance 70,000
54,000
(9,000)
25,000
Amortized excess value reclassification entry:
Depreciation expense
9,000
Goodwill impairment loss
35,000
Income from Brey Inc.
44,000
Excess value (differential) reclassification entry:
Machinery
54,000
Goodwill 25,000
Accumulated depreciation 9,000
Investment in Brey Inc. 70,000
Eliminate intercompany accounts:
Accounts payable
86,000
Accounts receivable
86,000
Deferral of this year's unrealized profits on inventory transfers
Sales
180,000
Cost of Goods Sold
162,000
Inventory
18,000
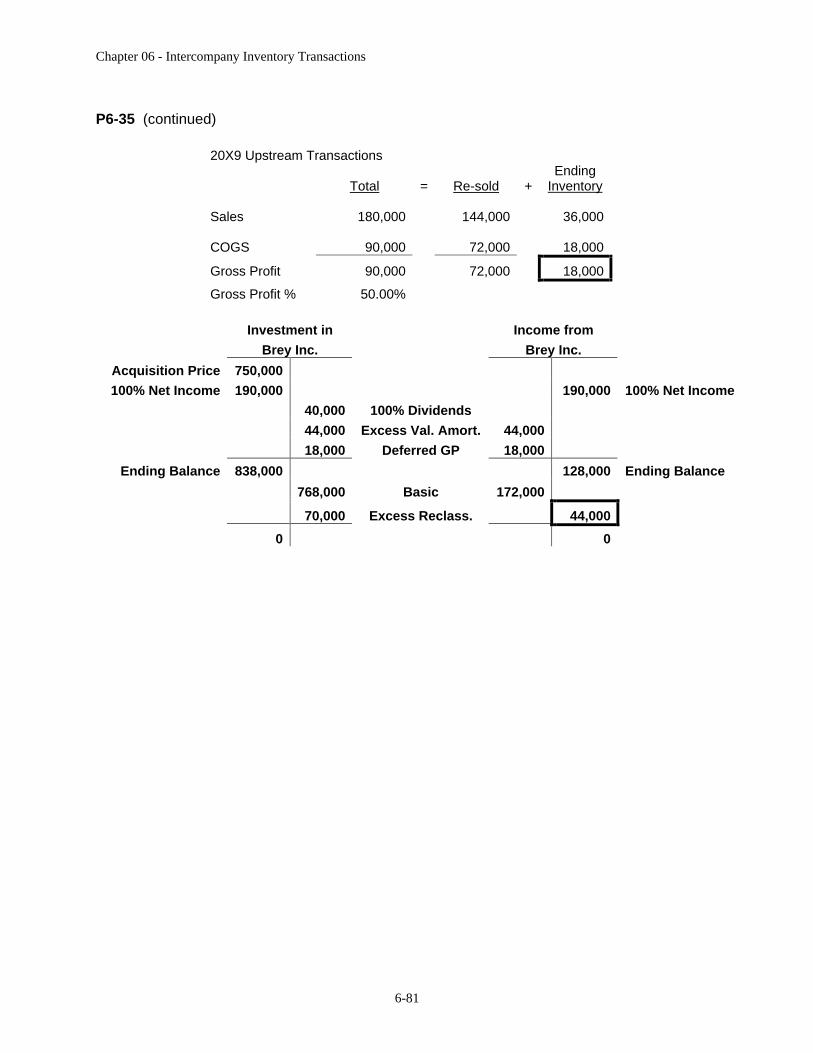
Chapter 06 - Intercompany Inventory Transactions
6-81
P6-35 (continued)
20X9 Upstream Transactions
Total
=
Re-sold
+
Ending
Inventory
Sales 180,000
144,000
36,000
COGS 90,000
72,000
18,000
Gross Profit 90,000
72,000
18,000
Gross Profit % 50.00%
Investment in Income from
Brey Inc. Brey Inc.
Acquisition Price
750,000
100% Net Income
190,000
190,000
100% Net Income
40,000
100% Dividends
44,000
Excess Val. Amort. 44,000
18,000
Deferred GP 18,000
Ending Balance
838,000
128,000
Ending Balance
768,000
Basic 172,000
70,000
Excess Reclass.
44,000
0
0

Chapter 06 - Intercompany Inventory Transactions
6-82
P6-35 (continued)
Note that in the 8th edition, the sale of the warehouse was an intercompany transaction and needed to be eliminated. We changed the problem in the 9th edition to assume that the sale was to a non-affiliated third party. Thus, the gain on the sale of the warehouse is not eliminated in this problem.
Elimination Entries
Fran Corp. Brey Inc. DR CR Consolidated
Income Statement
Net Sales 3,800,000
1,500,000
180,000
5,120,000
Gain on Sale of Warehouse 30,000
30,000
Less: COGS (2,360,000) (870,000) 162,000
(3,068,000)
Less: Operating Expenses (1,100,000) (440,000)
9,000
(1,549,000)
Less: Goodwill Impairment
35,000
(35,000)
Income from Brey Inc. 128,000
172,000
44,000
0
Net Income 498,000
190,000
396,000
206,000
498,000
Statement of Retained Earnings
Beginning Balance 440,000
156,000
156,000
440,000
Net Income 498,000
190,000
396,000
206,000
498,000
Less: Dividends Declared (40,000) 40,000
0
Ending Balance 938,000
306,000
552,000
246,000
938,000
Balance Sheet
Cash 570,000
150,000
720,000
Accounts Receivable (net) 860,000
350,000
86,000
1,124,000
Inventories 1,060,000
410,000
18,000
1,452,000
Land, Plant, and Equipment 1,320,000
680,000
54,000
2,054,000
Less: Accumulated Depreciation (370,000) (210,000) 9,000
(589,000)
Investment in Brey Inc. 838,000
768,000
0
70,000
Goodwill 25,000
25,000
Total Assets 4,278,000
1,380,000
79,000
951,000
4,786,000
Accounts Payable & Accrued Expenses 1,340,000
594,000
86,000
1,848,000
Common Stock 1,700,000
400,000
400,000
1,700,000
Additional Paid-in Capital 300,000
80,000
80,000
300,000
Retained Earnings 938,000
306,000
552,000
246,000
938,000
Total Liabilities & Equity 4,278,000
1,380,000
1,118,000
246,000
4,786,000
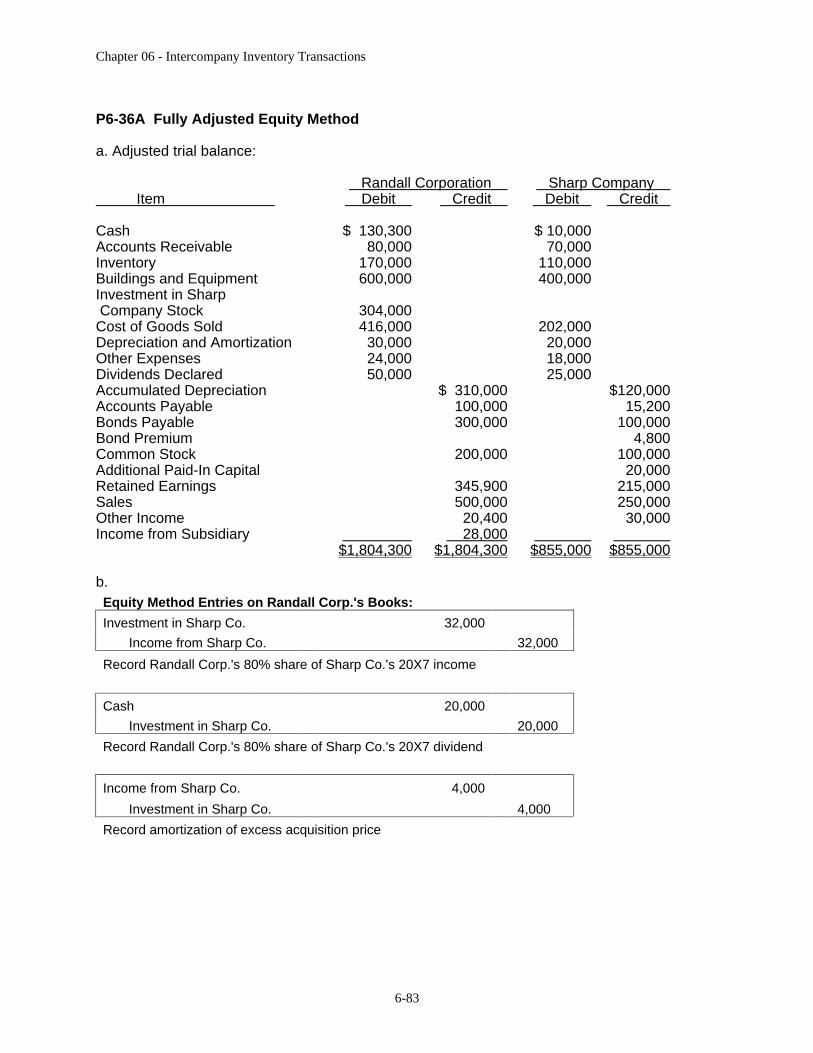
Chapter 06 - Intercompany Inventory Transactions
6-83
P6-36A Fully Adjusted Equity Method
a. Adjusted trial balance:
Randall Corporation
Sharp Company
Item
Debit
Credit
Debit
Credit
Cash $ 130,300
$ 10,000
Accounts Receivable 80,000
70,000
Inventory 170,000
110,000
Buildings and Equipment 600,000
400,000
Investment in Sharp
Company Stock 304,000
Cost of Goods Sold 416,000
202,000
Depreciation and Amortization 30,000
20,000
Other Expenses 24,000
18,000
Dividends Declared 50,000
25,000
Accumulated Depreciation
$ 310,000
$120,000
Accounts Payable
100,000
15,200
Bonds Payable
300,000
100,000
Bond Premium
4,800
Common Stock
200,000
100,000
Additional Paid-In Capital
20,000
Retained Earnings
345,900
215,000
Sales
500,000
250,000
Other Income
20,400
30,000
Income from Subsidiary
28,000
$1,804,300
$1,804,300
$855,000
$855,000
b. Equity Method Entries on Randall Corp.'s Books:
Investment in Sharp Co.
32,000
Income from Sharp Co.
32,000
Record Randall Corp.'s 80% share of Sharp Co.'s 20X7 income
Cash
20,000
Investment in Sharp Co. 20,000
Record Randall Corp.'s 80% share of Sharp Co.'s 20X7 dividend
Income from Sharp Co.
4,000
Investment in Sharp Co. 4,000
Record amortization of excess acquisition price

Chapter 06 - Intercompany Inventory Transactions
6-84
P6-36A (continued)
c.
Book Value Calculations:
NCI 20%
+
Randall Corp. 80%
=
Commo
n Stock
+ Add. Paid-in Capital
+
Retained
Earning
s
Original book value
67,000
268,000
100,000 20,000 215,000
+ Net Income 8,000
32,000
40,000
- Dividends (5,000)
(20,000)
(25,000)
Ending book value 70,000
280,000
100,000 20,000 230,000
Reversal/Deferred GP Calculations:
Total
=
Randall Corp.'s
share
+
NCI's share
Downstream Reversal 2,000
2,000
Upstream Reversal 8,000
6,400
1,600
Downstream Deferred GP (3,000)
(3,000)
Upstream Deferred GP (10,000)
(8,000)
(2,000)
Total (3,000)
(2,600)
(400)
Basic elimination entry
Common stock
100,000
Original amount invested (100%)
Additional paid-in capital
20,000
Beginning balance in APIC
Retained earnings
215,000
Beginning balance in RE
Income from Sharp Co.
32,000
Randall Corp.’s % of NI
NCI in NI of Sharp Co.
7,600
NCI share of NI - Def. GP + Reversal
Dividends declared
25,000
100% of Sharp Co.'s dividends
Investment in Sharp Co.
280,000
Net book value
NCI in NA of Sharp Co.
69,600
NCI share of BV - Def. GP + Reversal
Excess Value (Differential) Calculations: NCI 20% +
Randall Corp. 80% =
Buildings & equipment + Acc. Depr.
Beginning balance 7,000 28,000 50,000 (15,000)
Changes (1,000) (4,000) (5,000)
Ending balance 6,000 24,000 50,000 (20,000)
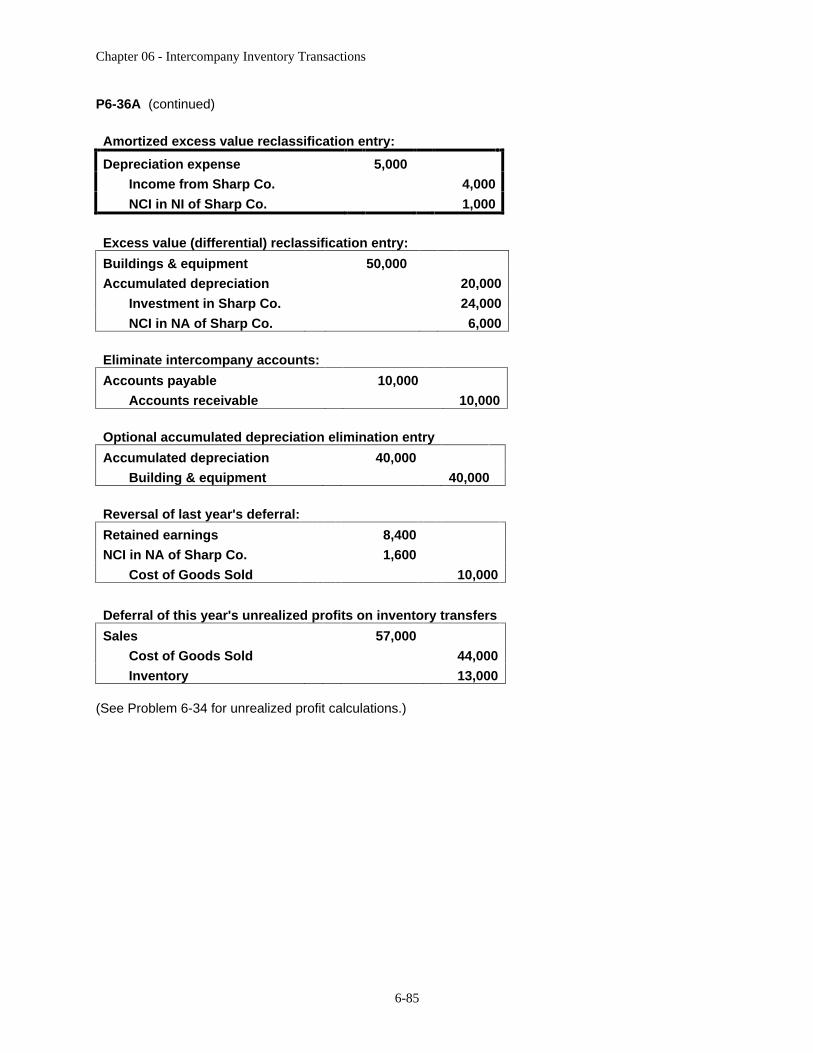
Chapter 06 - Intercompany Inventory Transactions
6-85
P6-36A (continued)
Amortized excess value reclassification entry:
Depreciation expense
5,000
Income from Sharp Co.
4,000
NCI in NI of Sharp Co.
1,000
Excess value (differential) reclassification entry:
Buildings & equipment 50,000
Accumulated depreciation
20,000
Investment in Sharp Co.
24,000
NCI in NA of Sharp Co.
6,000
Eliminate intercompany accounts:
Accounts payable
10,000
Accounts receivable
10,000
Optional accumulated depreciation elimination entry
Accumulated depreciation
40,000
Building & equipment
40,000
Reversal of last year's deferral:
Retained earnings
8,400
NCI in NA of Sharp Co.
1,600
Cost of Goods Sold
10,000
Deferral of this year's unrealized profits on inventory transfers
Sales
57,000
Cost of Goods Sold
44,000
Inventory
13,000
(See Problem 6-34 for unrealized profit calculations.)
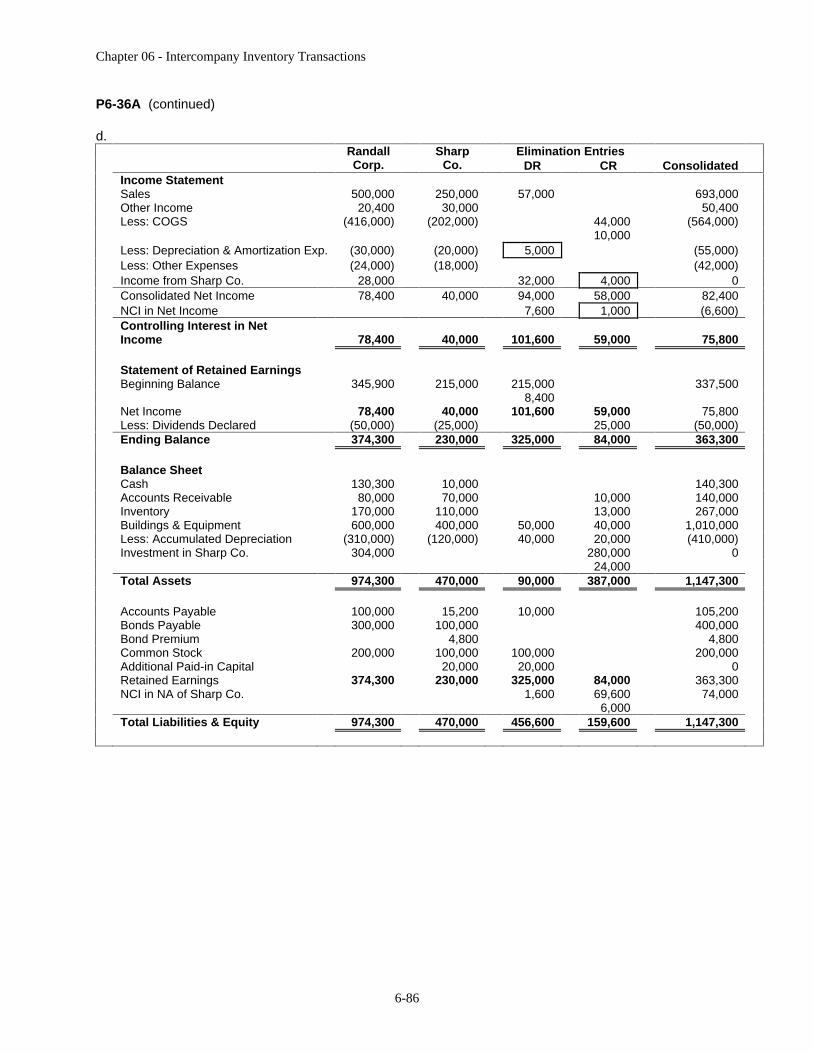
Chapter 06 - Intercompany Inventory Transactions
6-86
P6-36A (continued)
d. Elimination Entries
Randall Corp.
Sharp Co. DR CR Consolidated
Income Statement
Sales 500,000
250,000
57,000
693,000
Other Income 20,400
30,000
50,400
Less: COGS (416,000) (202,000) 44,000
(564,000)
10,000
Less: Depreciation & Amortization Exp. (30,000) (20,000) 5,000
(55,000)
Less: Other Expenses (24,000) (18,000) (42,000)
Income from Sharp Co. 28,000
32,000
4,000
0
Consolidated Net Income 78,400
40,000
94,000
58,000
82,400
NCI in Net Income 7,600
1,000
(6,600)
Controlling Interest in Net Income 78,400
40,000
101,600
59,000
75,800
Statement of Retained Earnings
Beginning Balance 345,900
215,000
215,000
337,500
8,400
Net Income 78,400
40,000
101,600
59,000
75,800
Less: Dividends Declared (50,000) (25,000) 25,000
(50,000)
Ending Balance 374,300
230,000
325,000
84,000
363,300
Balance Sheet
Cash 130,300
10,000
140,300
Accounts Receivable 80,000
70,000
10,000
140,000
Inventory 170,000
110,000
13,000
267,000
Buildings & Equipment 600,000
400,000
50,000
40,000
1,010,000
Less: Accumulated Depreciation (310,000) (120,000) 40,000
20,000
(410,000)
Investment in Sharp Co. 304,000
280,000
0
24,000
Total Assets 974,300
470,000
90,000
387,000
1,147,300
Accounts Payable 100,000
15,200
10,000
105,200
Bonds Payable 300,000
100,000
400,000
Bond Premium 4,800
4,800
Common Stock 200,000
100,000
100,000
200,000
Additional Paid-in Capital 20,000
20,000
0
Retained Earnings 374,300
230,000
325,000
84,000
363,300
NCI in NA of Sharp Co. 1,600
69,600
74,000
6,000
Total Liabilities & Equity 974,300
470,000
456,600
159,600
1,147,300
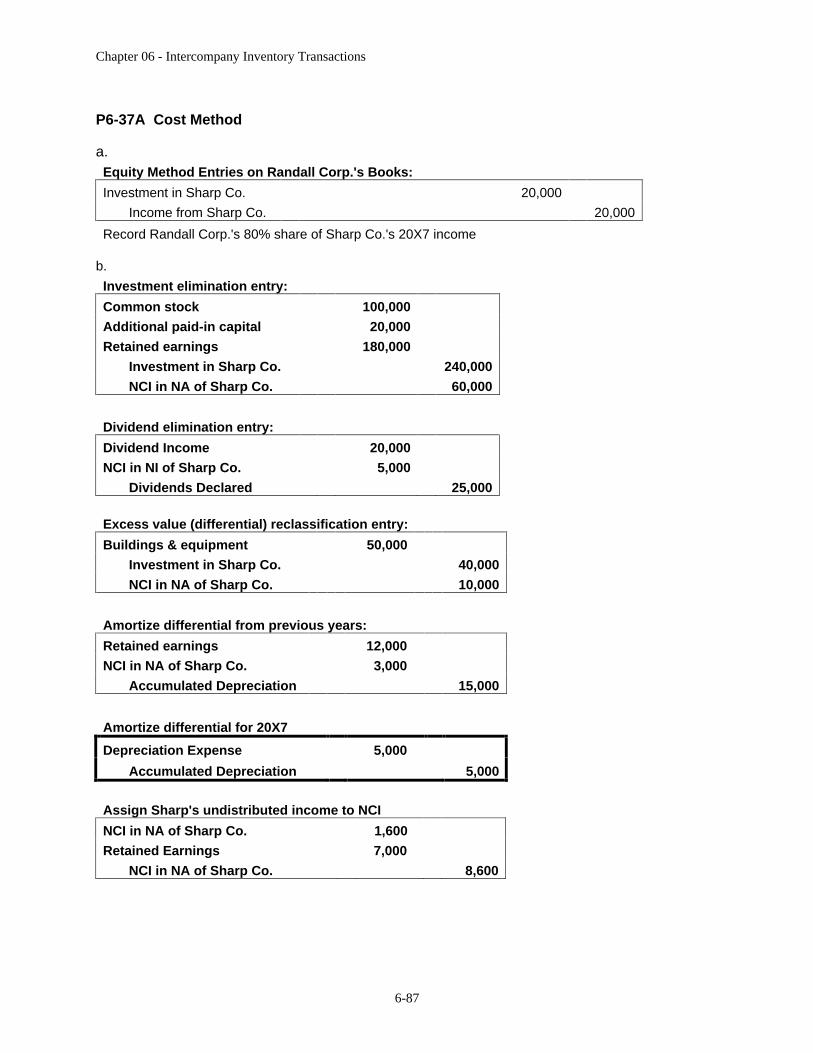
Chapter 06 - Intercompany Inventory Transactions
6-87
P6-37A Cost Method
a. Equity Method Entries on Randall Corp.'s Books:
Investment in Sharp Co.
20,000
Income from Sharp Co.
20,000
Record Randall Corp.'s 80% share of Sharp Co.'s 20X7 income
b.
Investment elimination entry:
Common stock
100,000
Additional paid-in capital
20,000
Retained earnings
180,000
Investment in Sharp Co.
240,000
NCI in NA of Sharp Co.
60,000
Dividend elimination entry:
Dividend Income
20,000
NCI in NI of Sharp Co.
5,000
Dividends Declared
25,000
Excess value (differential) reclassification entry:
Buildings & equipment
50,000
Investment in Sharp Co.
40,000
NCI in NA of Sharp Co.
10,000
Amortize differential from previous years:
Retained earnings
12,000
NCI in NA of Sharp Co.
3,000
Accumulated Depreciation
15,000
Amortize differential for 20X7
Depreciation Expense
5,000
Accumulated Depreciation
5,000
Assign Sharp's undistributed income to NCI
NCI in NA of Sharp Co.
1,600
Retained Earnings
7,000
NCI in NA of Sharp Co.
8,600
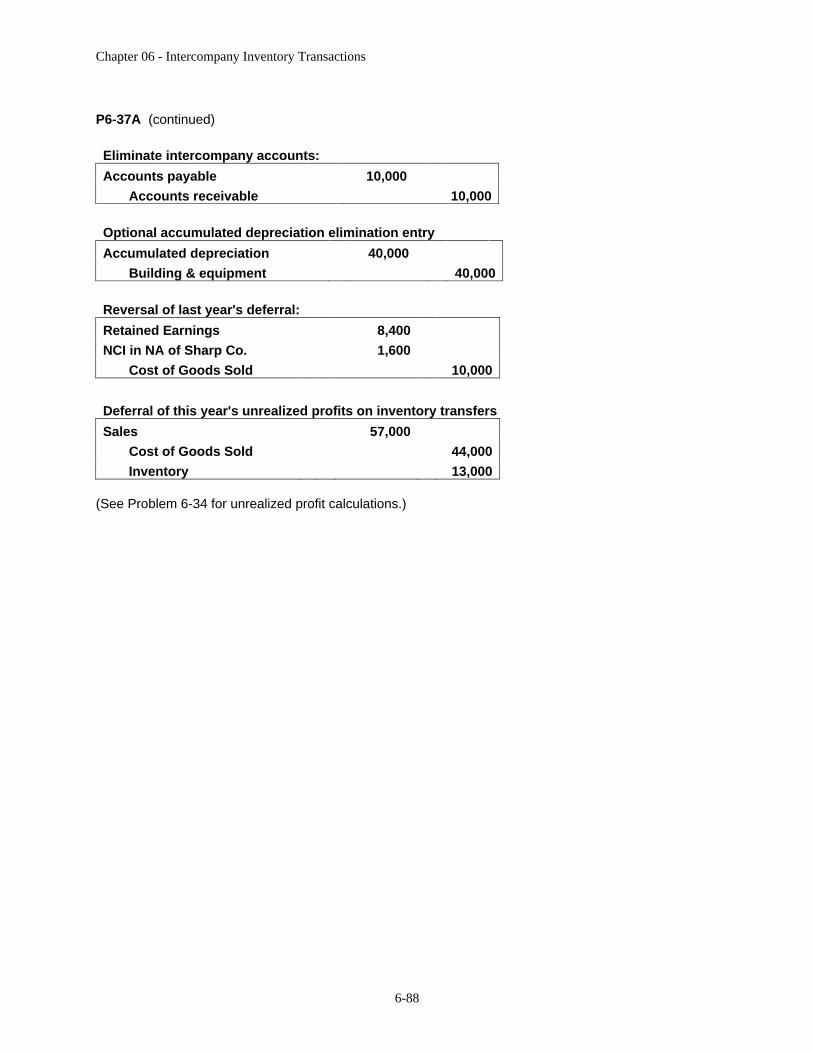
Chapter 06 - Intercompany Inventory Transactions
6-88
P6-37A (continued)
Eliminate intercompany accounts:
Accounts payable
10,000
Accounts receivable
10,000
Optional accumulated depreciation elimination entry
Accumulated depreciation
40,000
Building & equipment
40,000
Reversal of last year's deferral:
Retained Earnings
8,400
NCI in NA of Sharp Co.
1,600
Cost of Goods Sold
10,000
Deferral of this year's unrealized profits on inventory transfers
Sales
57,000
Cost of Goods Sold
44,000
Inventory
13,000
(See Problem 6-34 for unrealized profit calculations.)
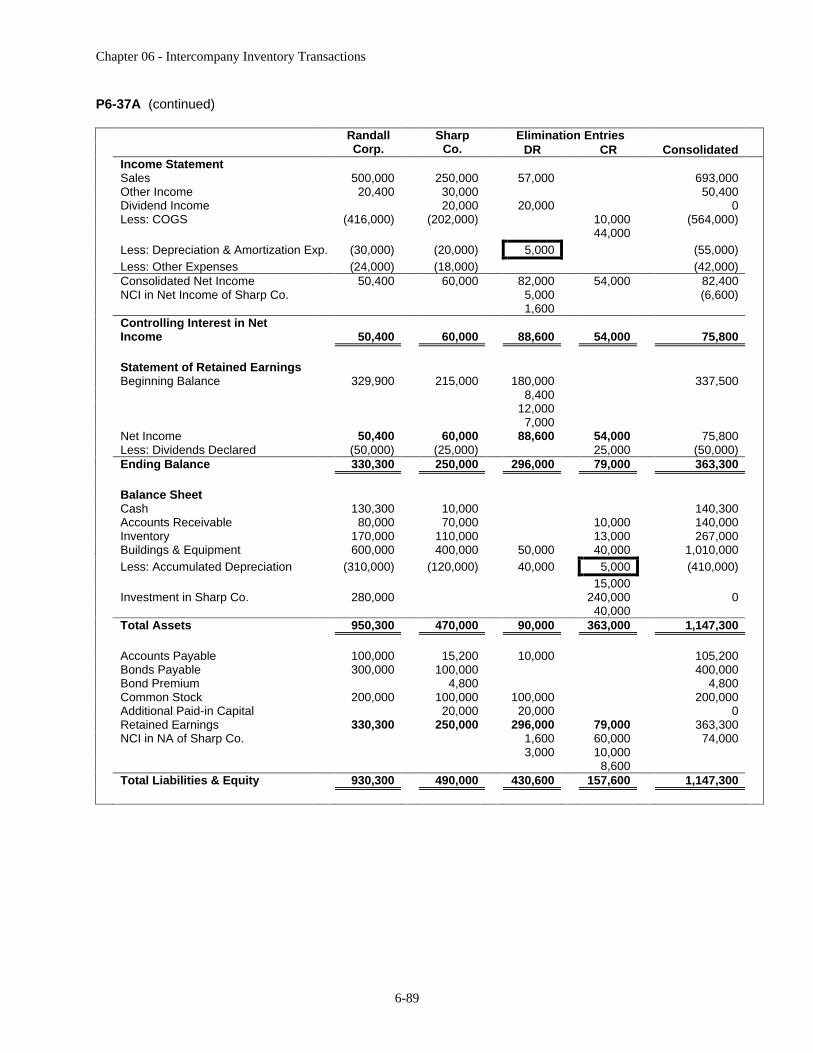
Chapter 06 - Intercompany Inventory Transactions
6-89
P6-37A (continued)
Elimination Entries
Randall Corp.
Sharp Co. DR CR Consolidated
Income Statement
Sales 500,000
250,000
57,000
693,000
Other Income 20,400
30,000
50,400
Dividend Income 20,000
20,000
0
Less: COGS (416,000) (202,000) 10,000
(564,000)
44,000
Less: Depreciation & Amortization Exp. (30,000) (20,000)
5,000
(55,000)
Less: Other Expenses (24,000) (18,000) (42,000)
Consolidated Net Income 50,400
60,000
82,000
54,000
82,400
NCI in Net Income of Sharp Co. 5,000
(6,600)
1,600
Controlling Interest in Net Income 50,400
60,000
88,600
54,000
75,800
Statement of Retained Earnings
Beginning Balance 329,900
215,000
180,000
337,500
8,400
12,000
7,000
Net Income 50,400
60,000
88,600
54,000
75,800
Less: Dividends Declared (50,000) (25,000) 25,000
(50,000)
Ending Balance 330,300
250,000
296,000
79,000
363,300
Balance Sheet
Cash 130,300
10,000
140,300
Accounts Receivable 80,000
70,000
10,000
140,000
Inventory 170,000
110,000
13,000
267,000
Buildings & Equipment 600,000
400,000
50,000
40,000
1,010,000
Less: Accumulated Depreciation (310,000) (120,000) 40,000
5,000
(410,000)
15,000
Investment in Sharp Co. 280,000
240,000
0
40,000
Total Assets 950,300
470,000
90,000
363,000
1,147,300
Accounts Payable 100,000
15,200
10,000
105,200
Bonds Payable 300,000
100,000
400,000
Bond Premium 4,800
4,800
Common Stock 200,000
100,000
100,000
200,000
Additional Paid-in Capital 20,000
20,000
0
Retained Earnings 330,300
250,000
296,000
79,000
363,300
NCI in NA of Sharp Co. 1,600
60,000
74,000
3,000
10,000
8,600
Total Liabilities & Equity 930,300
490,000
430,600
157,600
1,147,300


