Embed Size (px)
Citation preview
14-1
Survey Instrument and Survey Instrument and Questionnaire responsesQuestionnaire responses
Presentation at the Workshop on Sustainable Development Indicators: Conceptual Framework, Data
Collection and Analysis
Addis Ababa, Ethiopia, December 11-13, 2012
14-2
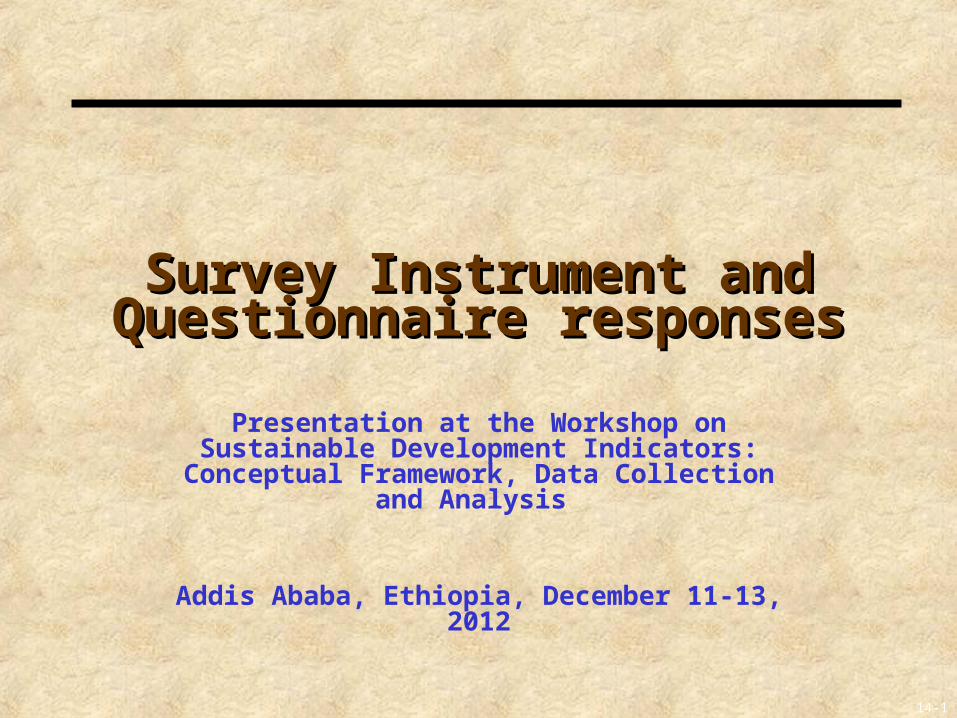
BackgroundBackground A draft questionnaire was developed jointly by FSSDD and
ACS of UNECA
The objective was to obtain standardized data
Discussion on the proposed indicators was made with experts from CSA and MoFED of Ethiopia.
Based on the comments received, the questionnaire was revised accordingly
The Questionnaire was sent to 15 countries
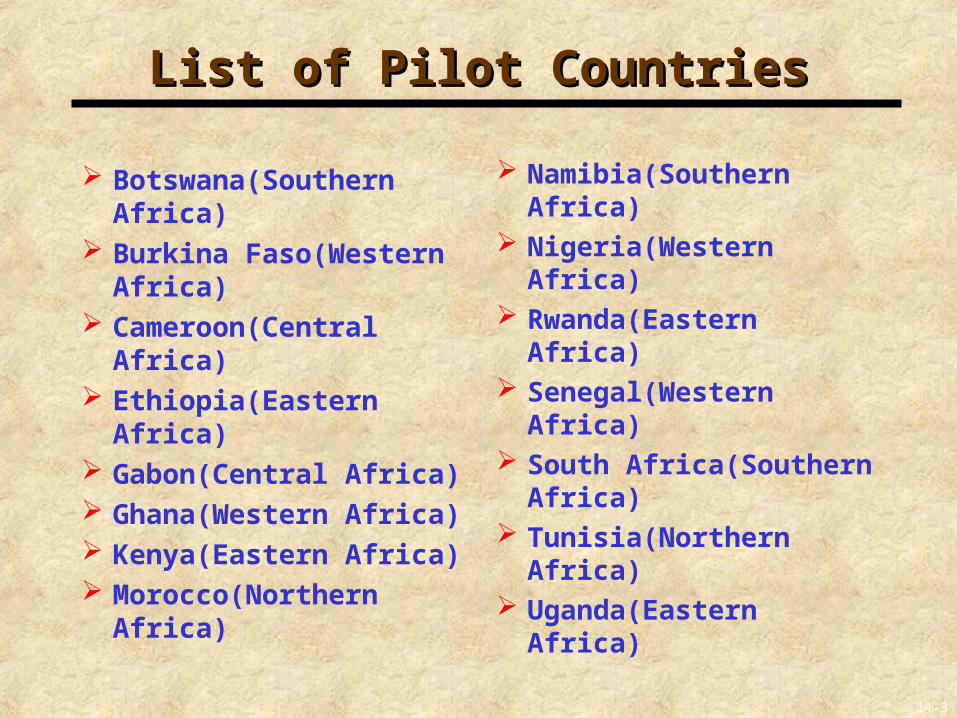
List of Pilot CountriesList of Pilot Countries
Botswana(Southern
Africa) Burkina Faso(Western
Africa) Cameroon(Central
Africa) Ethiopia(Eastern Africa) Gabon(Central Africa) Ghana(Western Africa) Kenya(Eastern Africa) Morocco(Northern
Africa)
Namibia(Southern Africa)
Nigeria(Western Africa) Rwanda(Eastern Africa) Senegal(Western Africa) South Africa(Southern
Africa) Tunisia(Northern
Africa) Uganda(Eastern Africa)
14-3
14-4
Completed questionnaires Completed questionnaires
Completed questionnaires were received from 6 countries out of the 15 countries for which the questionnaire was sent. (completion rate of 40%)
Completion rate here refers to the percentage of countries who completed the questionnaire.
A significant percentage of responses received contained no data for some indicators or data for few years.
14-5
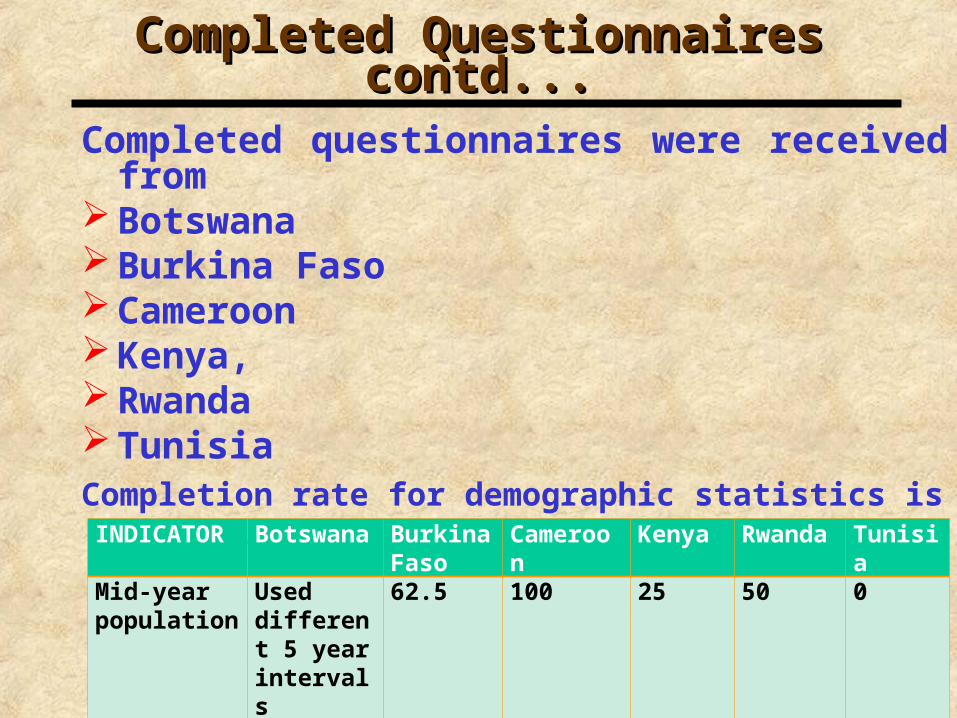
Completed Questionnaires contd...Completed Questionnaires contd...Completed questionnaires were received from Botswana Burkina Faso Cameroon Kenya, Rwanda TunisiaCompletion rate for demographic statistics is as follows
INDICATOR Botswana Burkina Faso
Cameroon Kenya Rwanda Tunisia
Mid-year population
Used different 5 year intervals
62.5 100 25 50 0
14-6
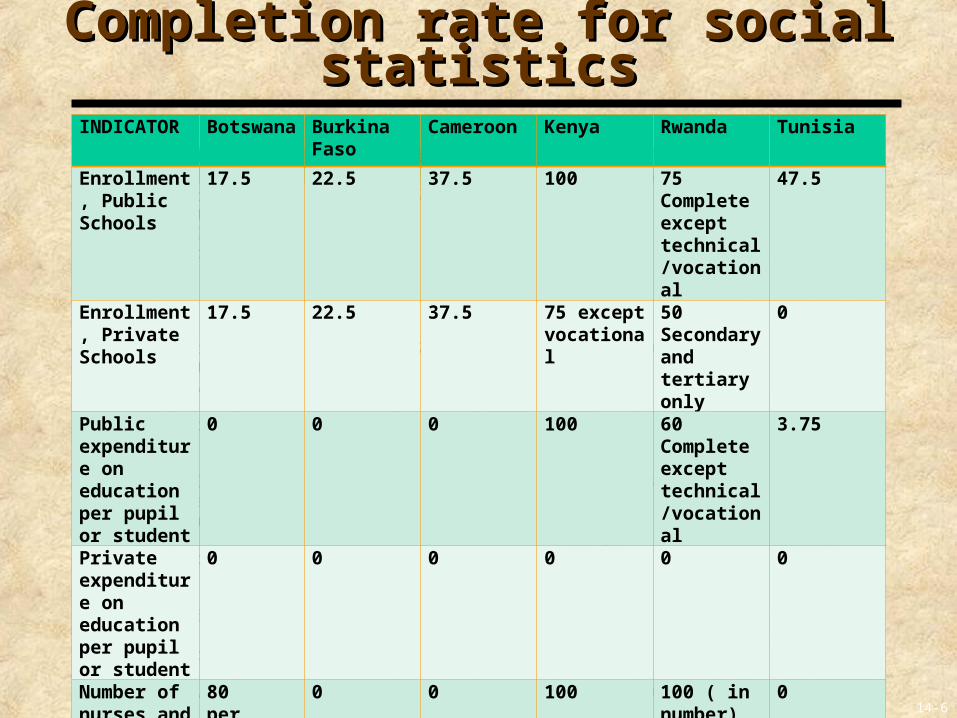
Completion rate for social statisticsCompletion rate for social statistics
INDICATOR
Botswana
Burkina Faso
Cameroon
Kenya Rwanda Tunisia
Enrollment, Public Schools
17.5 22.5 37.5 100 75 Complete except technical/vocational
47.5
Enrollment, Private Schools
17.5 22.5 37.5 75 except vocational
50Secondary and tertiary only
0
Public expenditure on education per pupil or student
0 0 0 100 60Complete except technical/vocational
3.75
Private expenditure on education per pupil or student
0 0 0 0 0 0
Number of nurses and midwives
80per 10,000 people
0 0 100 100 but in number
0
INDICATOR Botswana Burkina Faso
Cameroon Kenya Rwanda Tunisia
Enrollment, Public Schools
17.5 22.5 37.5 100 75 Complete except technical/vocational
47.5
Enrollment, Private Schools
17.5 22.5 37.5 75 except vocational
50Secondary and tertiary only
0
Public expenditure on education per pupil or student
0 0 0 100 60Complete except technical/vocational
3.75
Private expenditure on education per pupil or student
0 0 0 0 0 0
Number of nurses and midwives
80per 10,000 people
0 0 100 100 ( in number)
0
14-7
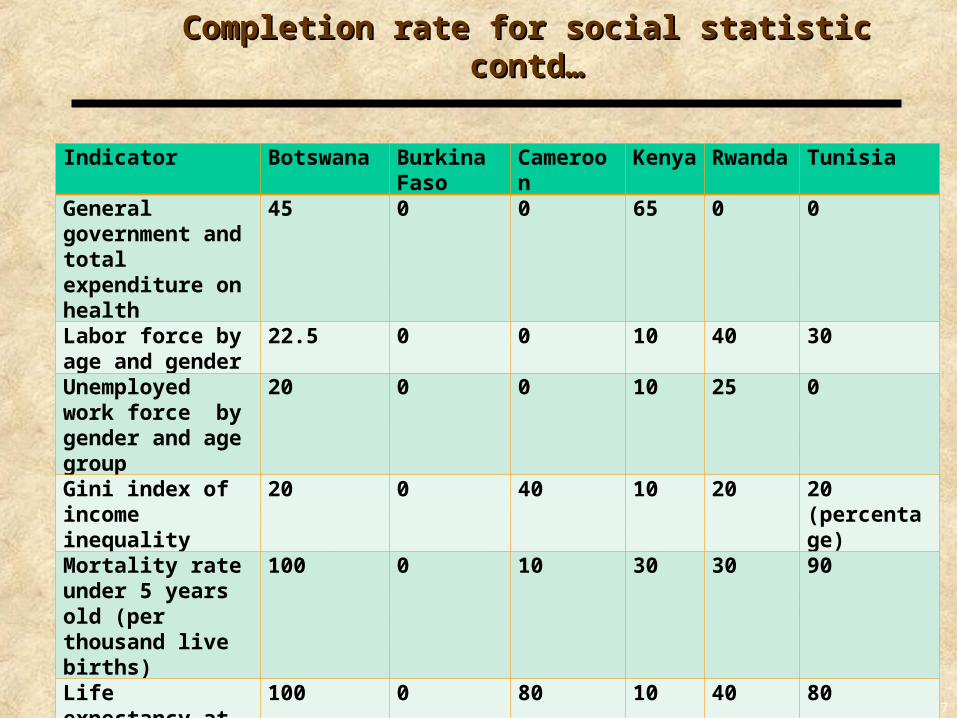
Completion rate for social statistic contd…Completion rate for social statistic contd…
Indicator Botswana Burkina Faso
Cameroon Kenya Rwanda Tunisia
General government and total expenditure on health
45 0 0 65 0 0
Labor force by age and gender
22.5 0 0 10 40 30
Unemployed work force by gender and age group
20 0 0 10 25 0
Gini index of income inequality
20 0 40 10 20 20 (percentage)
Mortality rate under 5 years old (per thousand live births)
100 0 10 30 30 90
Life expectancy at birth (years of life) years
100 0 80 10 40 80
14-8
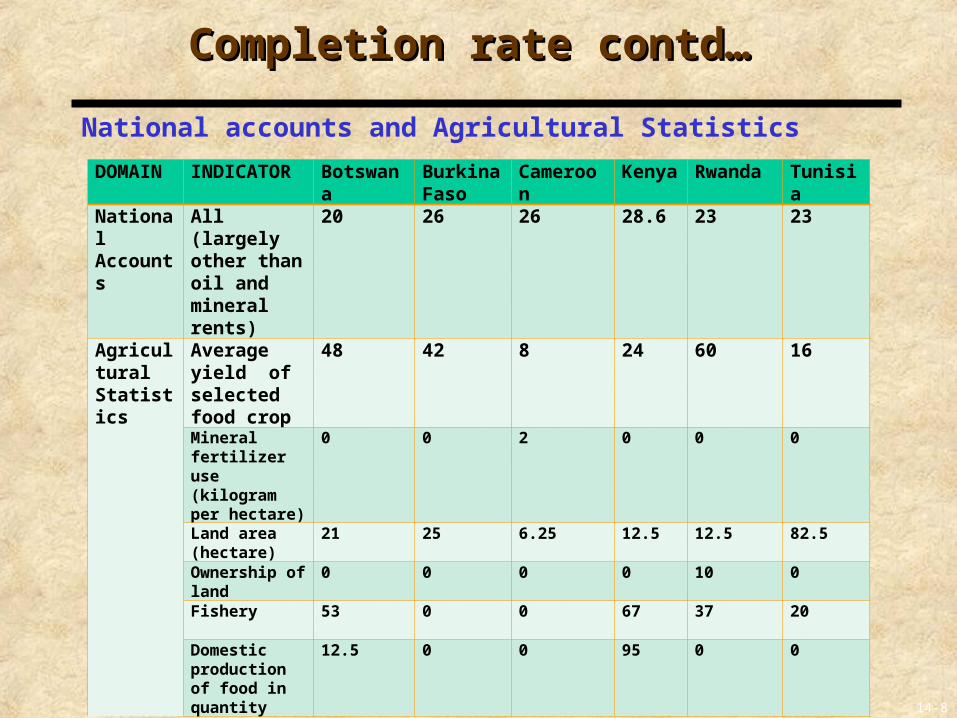
Completion rate contd…Completion rate contd…
National accounts and Agricultural Statistics
DOMAIN INDICATOR Botswana Burkina Faso
Cameroon Kenya Rwanda Tunisia
National Accounts
All (largely other than oil and mineral rents)
20 26 26 28.6 23 23
Agricultural Statistics
Average yield of selected food crop
48 42 8 24 60 16
Mineral fertilizer use (kilogram per hectare)
0 0 2 0 0 0
Land area (hectare)
21 25 6.25 12.5 12.5 82.5
Ownership of land
0 0 0 0 10 0
Fishery 53 0 0 67 37 20
Domestic production of food in quantity
12.5 0 0 95 0 0
14-9
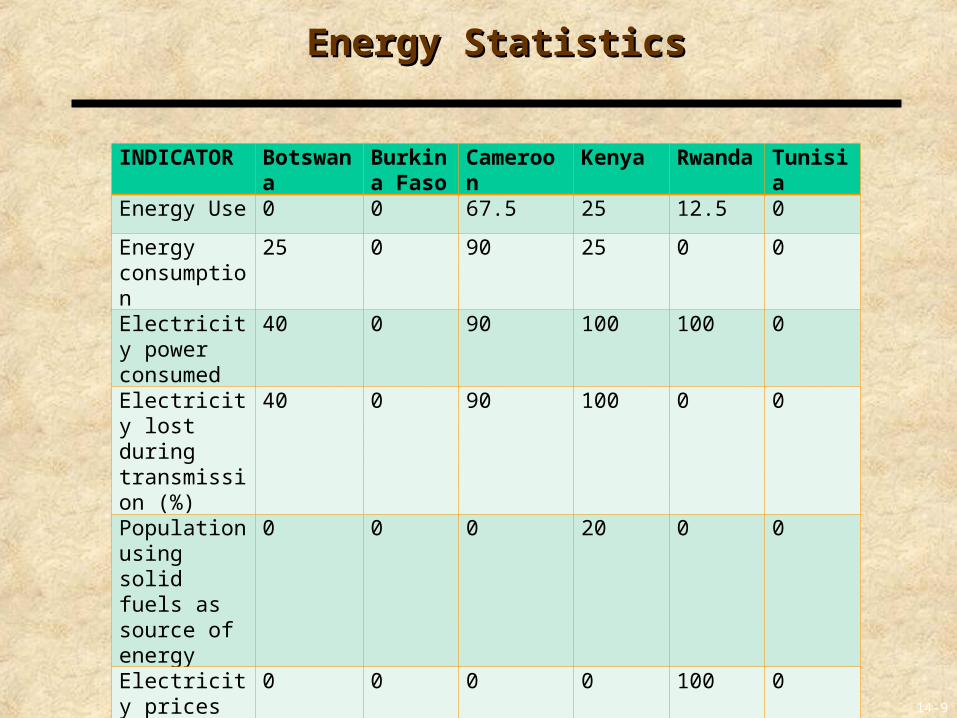
Energy StatisticsEnergy Statistics
INDICATOR Botswana Burkina Faso
Cameroon Kenya Rwanda Tunisia
Energy Use 0 0 67.5 25 12.5 0
Energy consumption
25 0 90 25 0 0
Electricity power consumed
40 0 90 100 100 0
Electricity lost during transmission (%)
40 0 90 100 0 0
Population using solid fuels as source of energy
0 0 0 20 0 0
Electricity prices to industrial/commercial and domestic customers
0 0 0 0 100 0
14-10
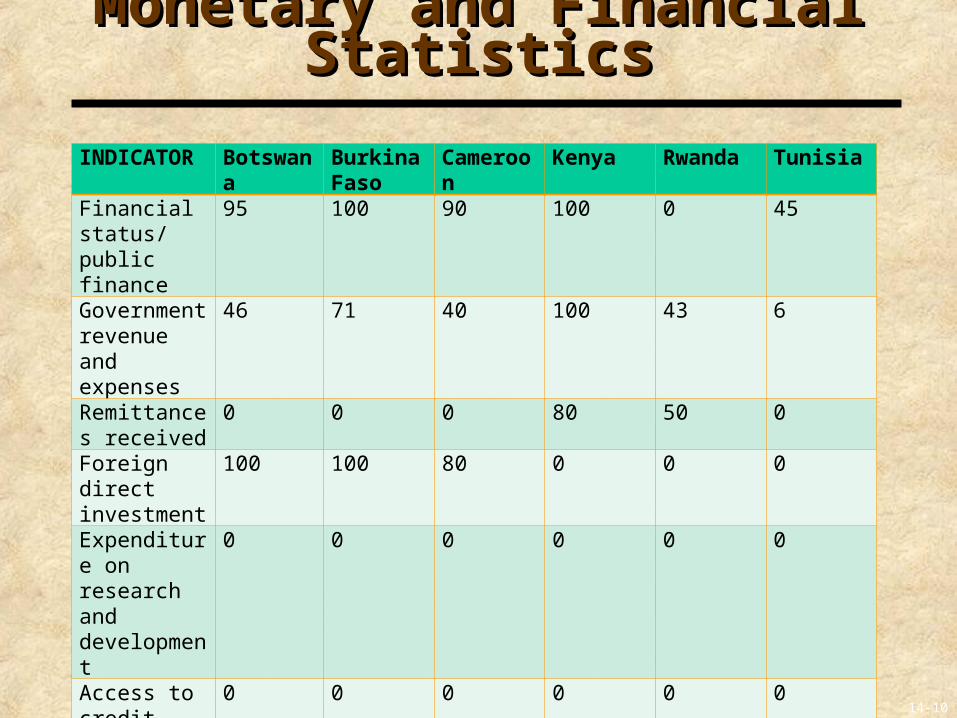
Monetary and Financial StatisticsMonetary and Financial Statistics
INDICATOR Botswana Burkina Faso
Cameroon Kenya Rwanda Tunisia
Financial status/ public finance
95 100 90 100 0 45
Government revenue and expenses
46 71 40 100 43 6
Remittances received
0 0 0 80 50 0
Foreign direct investment
100 100 80 0 0 0
Expenditure on research and development
0 0 0 0 0 0
Access to credit facilities
0 0 0 0 0 0
14-11
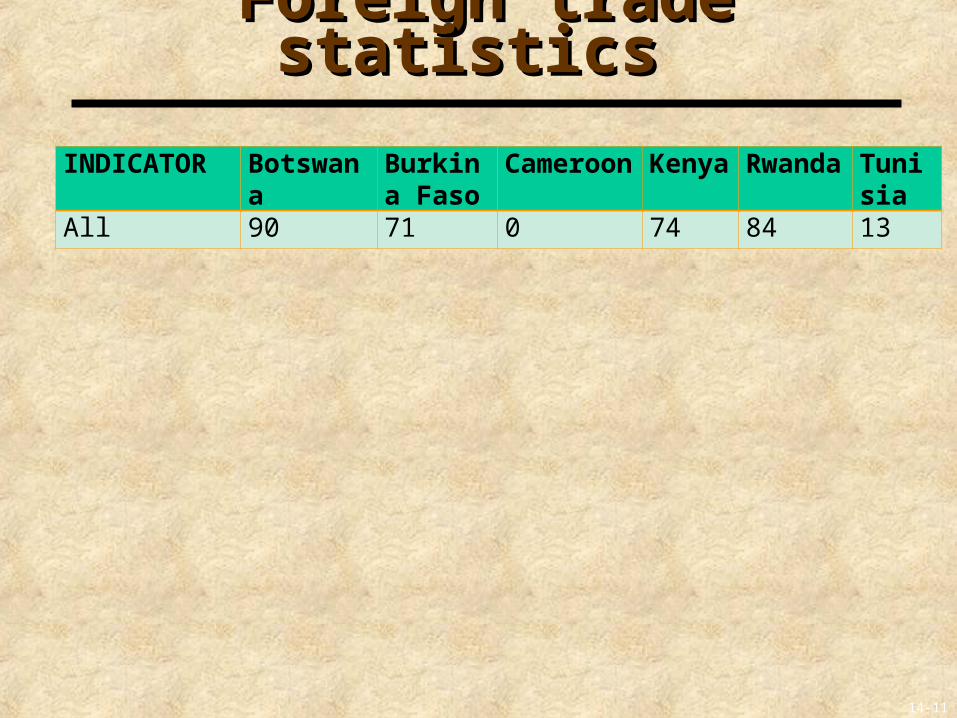
Foreign trade statisticsForeign trade statistics
INDICATOR Botswana Burkina Faso
Cameroon Kenya Rwanda Tunisia
All 90 71 0 74 84 13
14-12
RecommendationsRecommendations
Provide technical assistance to countries in the use of international definitions.
Improve the process of consultation by international agencies with countries before publishing their data.

14-13