Embed Size (px)
Citation preview
1502 Debugging Simulation Models -- Introduction
The following exercises are simple, hands-on examples of some of the subjects discussed during the lecture.
If you need help
If you get stuck during a lab, raise your hand, and one of the teaching assistants (TAs) will help you. Also, there is a set of models with all of the lab steps completed that you may inspect. These files end in the suffix “_ref” (reference).
Lab 1: Using the DES log to fix a configuration problem
Purpose of the exercise
This lab exercise introduces a configuration error into a scenario. We will investigate the resulting log messages, and use the information to do a detailed investigation into the configuration problem.
Overview of model architecture
This scenario doesn’t have any custom code in it---all the underlying models are part of the OPNET Model Library. A simple client-server topology has been configured. Application requests are sent from the client to the server, and the server sends responses. But there is something wrong with this model… it doesn’t produce any application results!
The following steps will guide you through the debugging process.
Run the simulation
1. Double-click the Modeler icon on your desktop. Modeler opens.
2. Open the “lab1” project.
a. Select File / Open from the menu.
b. Double-click the “lab1” project to open it.
3. Click the “running man” icon. The Configure/Run DES window opens.
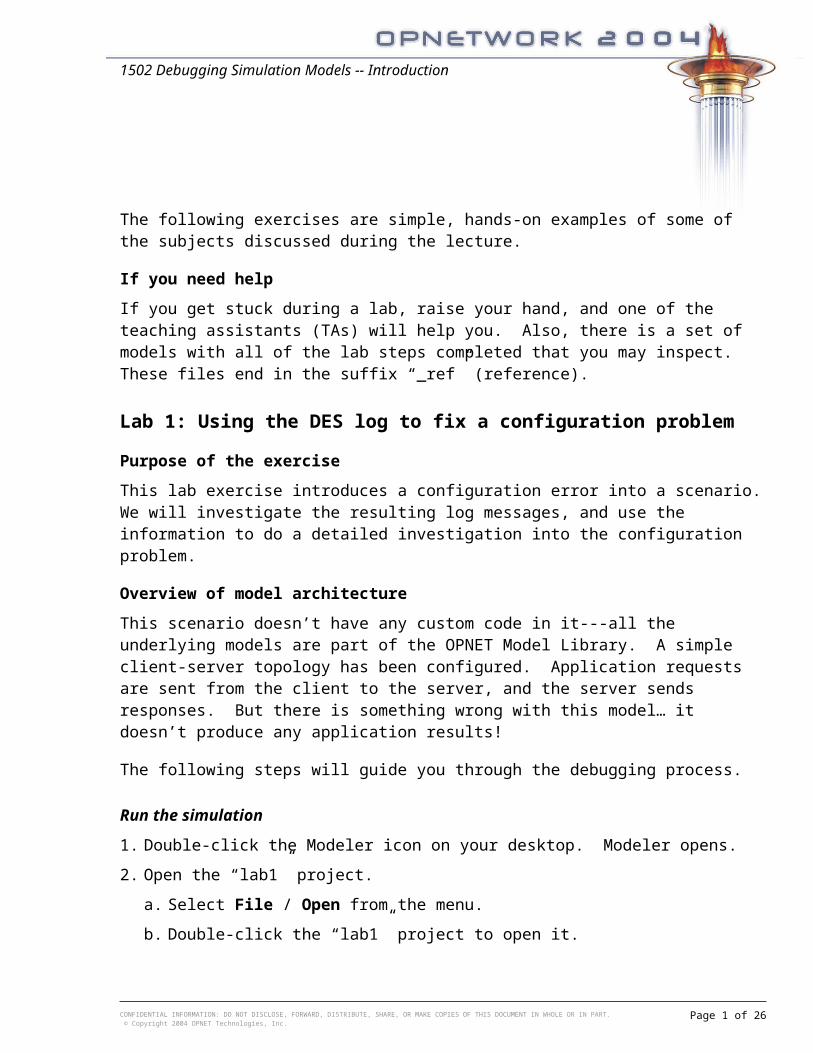
4. Click on the Run button to start the simulation. The Simulation Sequence window opens. After a moment, the simulation completes.
5. Note that the DES Log (Simulation Log) contains entries (see Fig. 1).
6. Click the Close button to close the Simulation Sequence window.
CONFIDENTIAL INFORMATION: DO NOT DISCLOSE, FORWARD, DISTRIBUTE, SHARE, OR MAKE COPIES OF THIS DOCUMENT IN WHOLE OR IN PART. © Copyright 2004 OPNET Technologies, Inc.
Page 1 of 23
1502 Debugging Simulation Models -- Introduction
Figure 1: The simulation completes without errors, but the DES Log contains many messages
7. View the results.
a. Select the DES > Results > View Statistics menu item. The View Results window opens with the Discrete Event Graphs tab displayed.
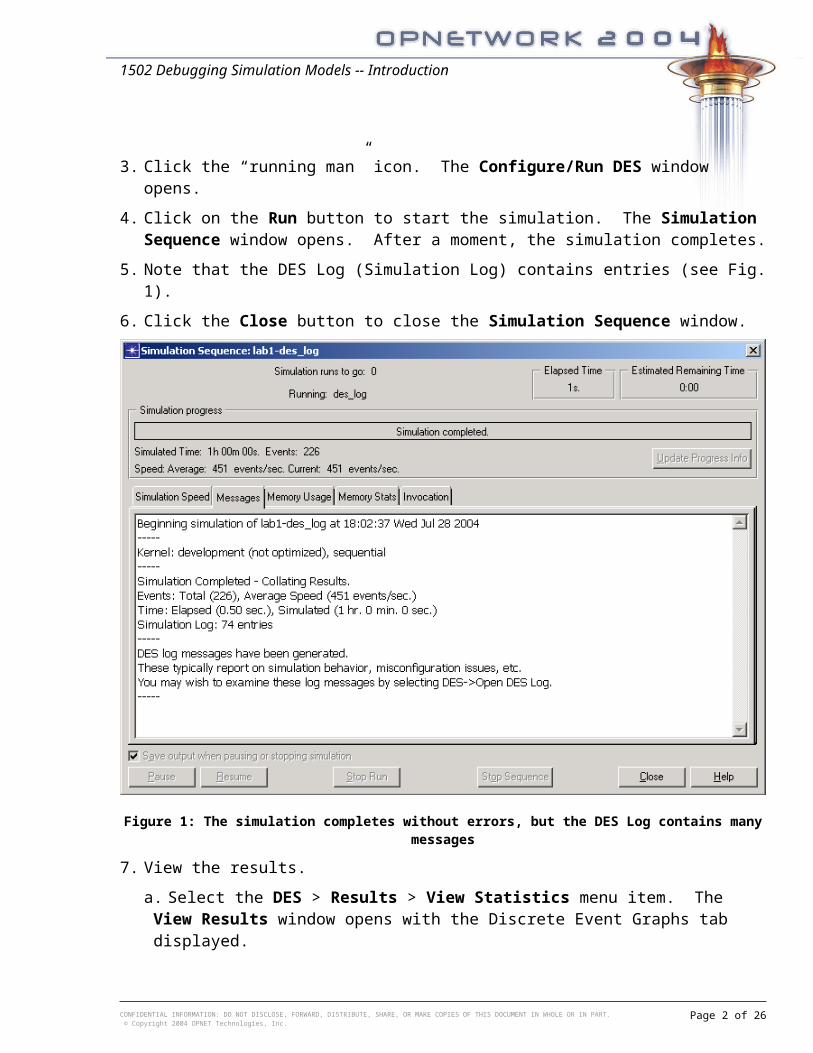
b. Click on the Report Email > Global Statistics > Email > Traffic Received statistic in the treeview, then click the Show button in the lower right corner. An analysis panel appears.
c. Note that there was no email traffic received (see Fig. 2).
d. When you are ready, close the analysis panel by clicking on the X button in the upper right-hand corner. When prompted, click on the Delete button to permanently delete this analysis panel.
e. When you are ready, close the View Results window by clicking on the Close button.
CONFIDENTIAL INFORMATION: DO NOT DISCLOSE, FORWARD, DISTRIBUTE, SHARE, OR MAKE COPIES OF THIS DOCUMENT IN WHOLE OR IN PART. © Copyright 2004 OPNET Technologies, Inc.
Page 2 of 23
1502 Debugging Simulation Models -- Introduction
Figure 2: Unexpected results—our first indication that something is wrong!
View the DES Log messages
8. Open the DES Log to see if it helps explain the results. There are two ways to open the DES Log.
Select DES > Open DES Log from the menu. The Log Browser opens.
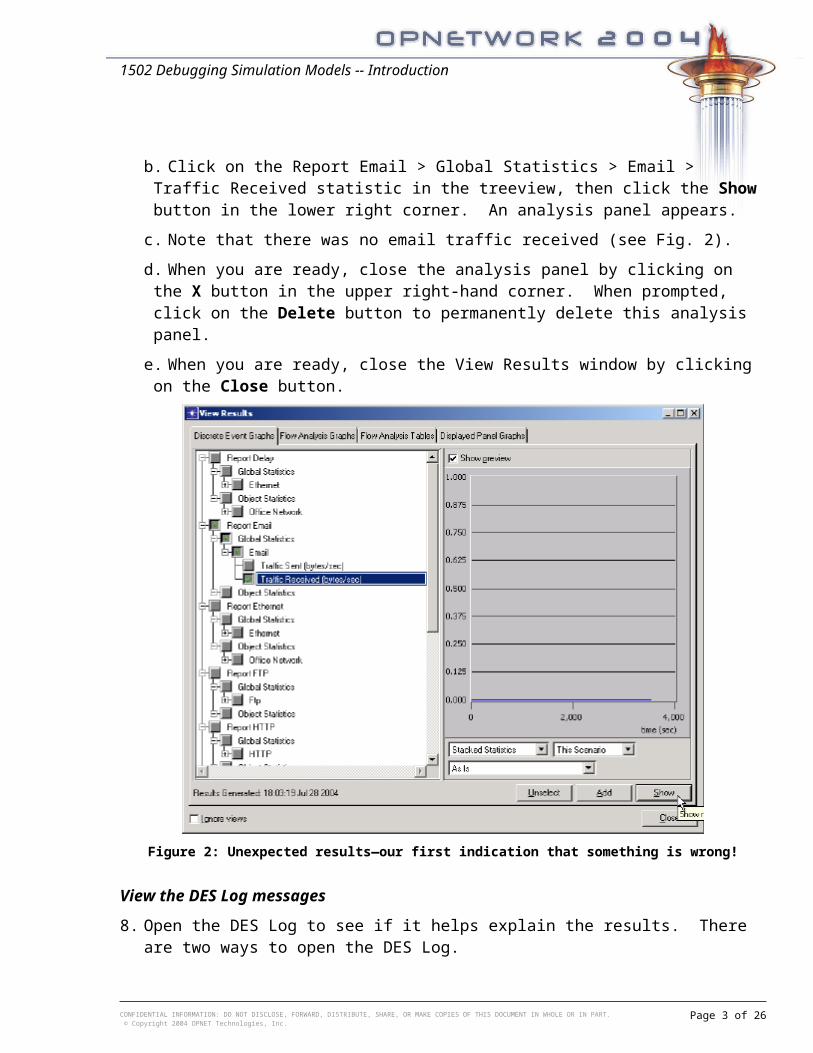
Right-click on a blank area in the project workspace and select Open DES Log (see Fig. 3). The Log Browser opens.
CONFIDENTIAL INFORMATION: DO NOT DISCLOSE, FORWARD, DISTRIBUTE, SHARE, OR MAKE COPIES OF THIS DOCUMENT IN WHOLE OR IN PART. © Copyright 2004 OPNET Technologies, Inc.
Page 3 of 23
1502 Debugging Simulation Models -- Introduction
Figure 3: Opening the DES Log by right-clicking in the project workspace
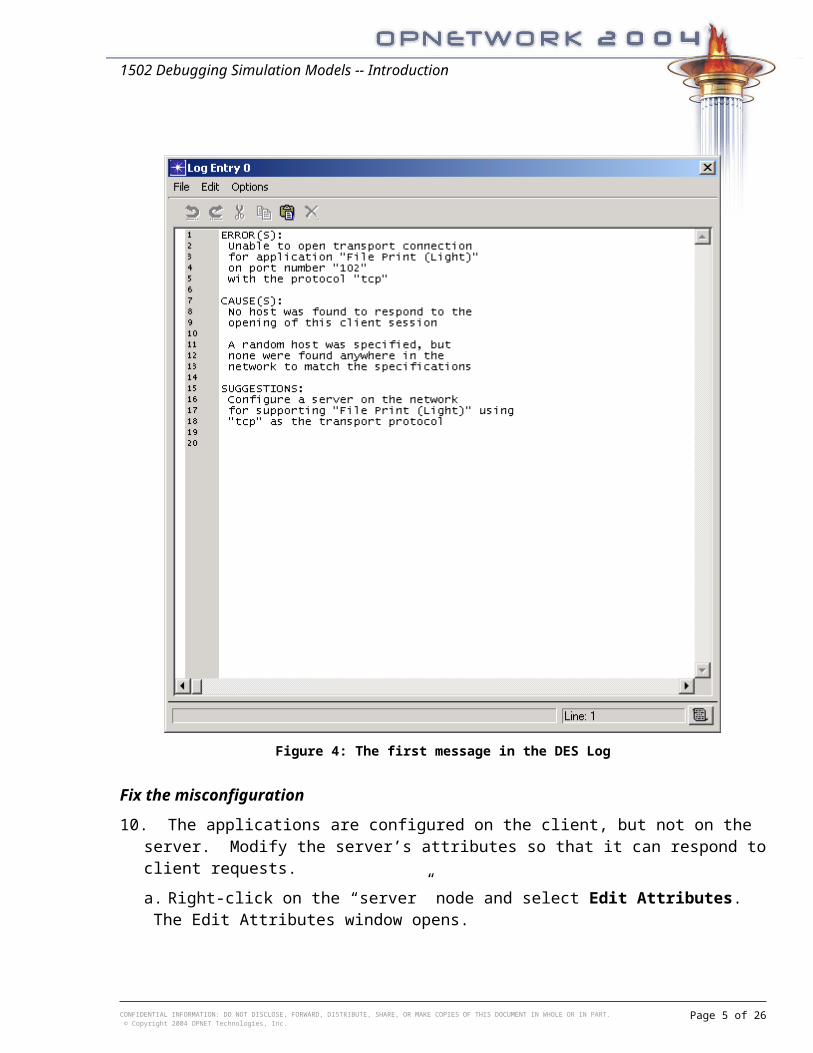
9. View the first message in the DES Log in detail.
a. At what simulation time did the first message occur?
b. At what event did the first message occur?
c. What is the message’s category? What is its class and subclass?
d. Click on the “Message” field of first line to expand the message. The Log Entry window opens (see Fig. 4).
e. What changes do you think would fix this problem?
f. When you are done, close the Log Entry and Browser Log windows.
CONFIDENTIAL INFORMATION: DO NOT DISCLOSE, FORWARD, DISTRIBUTE, SHARE, OR MAKE COPIES OF THIS DOCUMENT IN WHOLE OR IN PART. © Copyright 2004 OPNET Technologies, Inc.
Page 4 of 23
1502 Debugging Simulation Models -- Introduction
Figure 4: The first message in the DES Log
Fix the misconfiguration
10. The applications are configured on the client, but not on the server. Modify the server’s attributes so that it can respond to client requests.
a. Right-click on the “server” node and select Edit Attributes. The Edit Attributes window opens.
b. Click on the “+” symbol next to the “Applications” group to expand the applications-related attributes.
c. Change the value of the “Application: Supported Services” attribute from the symbol “None” to the symbol “All”. This server will now respond to client requests for all applications.
CONFIDENTIAL INFORMATION: DO NOT DISCLOSE, FORWARD, DISTRIBUTE, SHARE, OR MAKE COPIES OF THIS DOCUMENT IN WHOLE OR IN PART. © Copyright 2004 OPNET Technologies, Inc.
Page 5 of 23
1502 Debugging Simulation Models -- Introduction
d. Click on the OK button to retain your changes.
Test if the fix worked
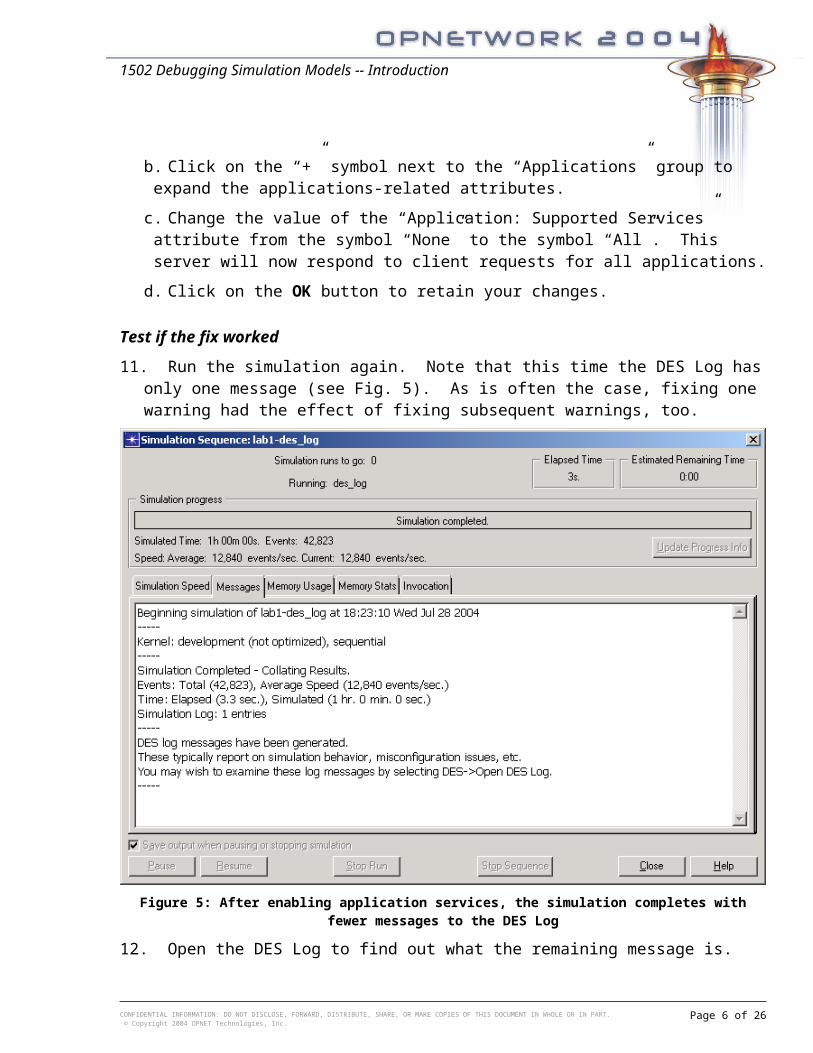
11. Run the simulation again. Note that this time the DES Log has only one message (see Fig. 5). As is often the case, fixing one warning had the effect of fixing subsequent warnings, too.
Figure 5: After enabling application services, the simulation completes with fewer messages to the DES Log
12. Open the DES Log to find out what the remaining message is.
a. At what simulation time did the first message occur?
b. At what event did the first message occur?
c. What is the message’s category? What is its class and subclass?
d. Click on the “Message” field of first line to expand the message. The Log Entry window opens.
e. Does the network configuration need to be adjusted in order to produce the correct behavior?
13. If desired, view the results using the same procedure as in step 7 above. Success! If this were a real project, you would now analyze the meaning of the results collected.
CONFIDENTIAL INFORMATION: DO NOT DISCLOSE, FORWARD, DISTRIBUTE, SHARE, OR MAKE COPIES OF THIS DOCUMENT IN WHOLE OR IN PART. © Copyright 2004 OPNET Technologies, Inc.
Page 6 of 23
1502 Debugging Simulation Models -- Introduction
Further tips for using the DES Log
Remember, the presence of a DES Log does not necessarily indicate a problem. You need to read it to find out if it contains errors, warnings, or simply messages. It may contain information about the state of objects in the network (such as routing tables) or remind you of any interesting events that will affect your simulation results (such as efficiency modes).
Exit the software
14. When you are done…
a. Click on the Close button to close the Simulation Sequence window.
b. Select the File > Exit menu item to close Modeler. If prompted, click on the Save button to save your changes. If there is time left over, check with a TA to find out when the class will resume, then take a break.
CONFIDENTIAL INFORMATION: DO NOT DISCLOSE, FORWARD, DISTRIBUTE, SHARE, OR MAKE COPIES OF THIS DOCUMENT IN WHOLE OR IN PART. © Copyright 2004 OPNET Technologies, Inc.
Page 7 of 23
1502 Debugging Simulation Models -- Introduction
Lab 2: Debugging a structural problem using “evstop” and “fulltrace” ODB commands
When you first started using Modeler, you may have studied the “Packet Switching I” tutorial. Labs 2 and 3 use the “Packet Switching I” tutorial with a few mistakes introduced into the process model code. We will use the debugging concepts discussed in the lecture to find and correct these mistakes.
Purpose of the exercise
This lab exercise introduces a structural error that must be debugged. We will investigate the resulting error messages, and use the information to investigate in detail the event where the program abort occurs.
Overview of model architecture
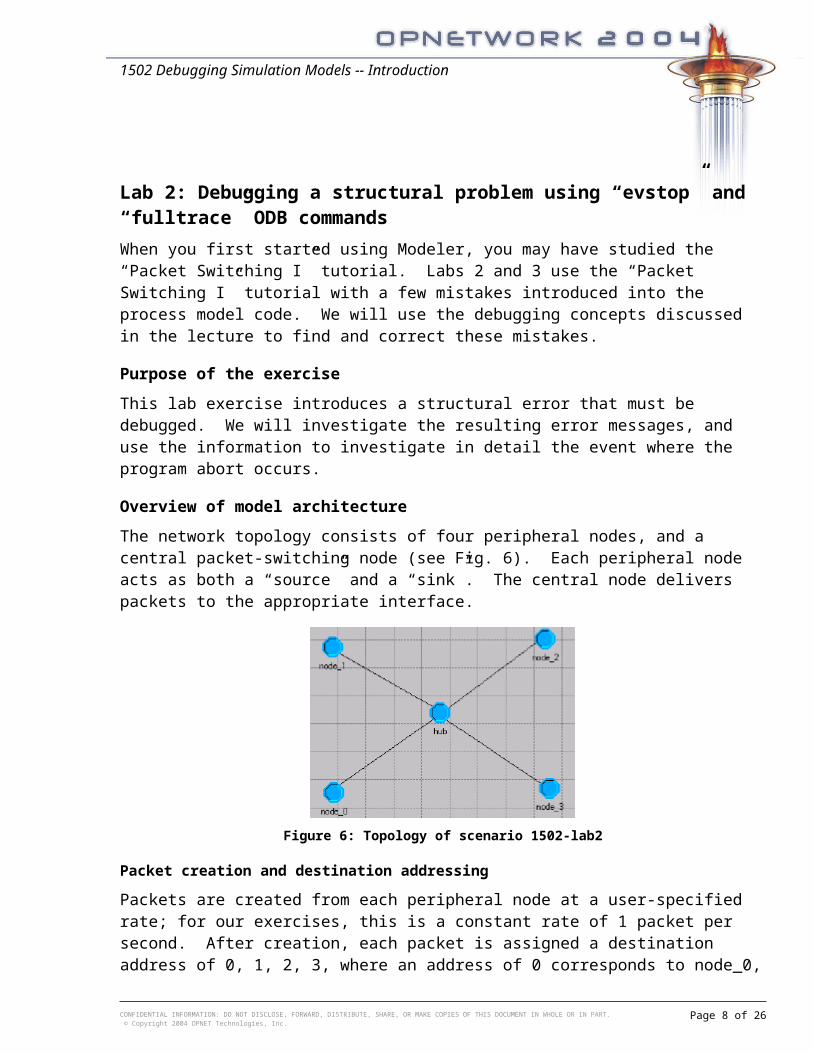
The network topology consists of four peripheral nodes, and a central packet-switching node (see Fig. 6). Each peripheral node acts as both a “source” and a “sink”. The central node delivers packets to the appropriate interface.
Figure 6: Topology of scenario 1502-lab2
Packet creation and destination addressing
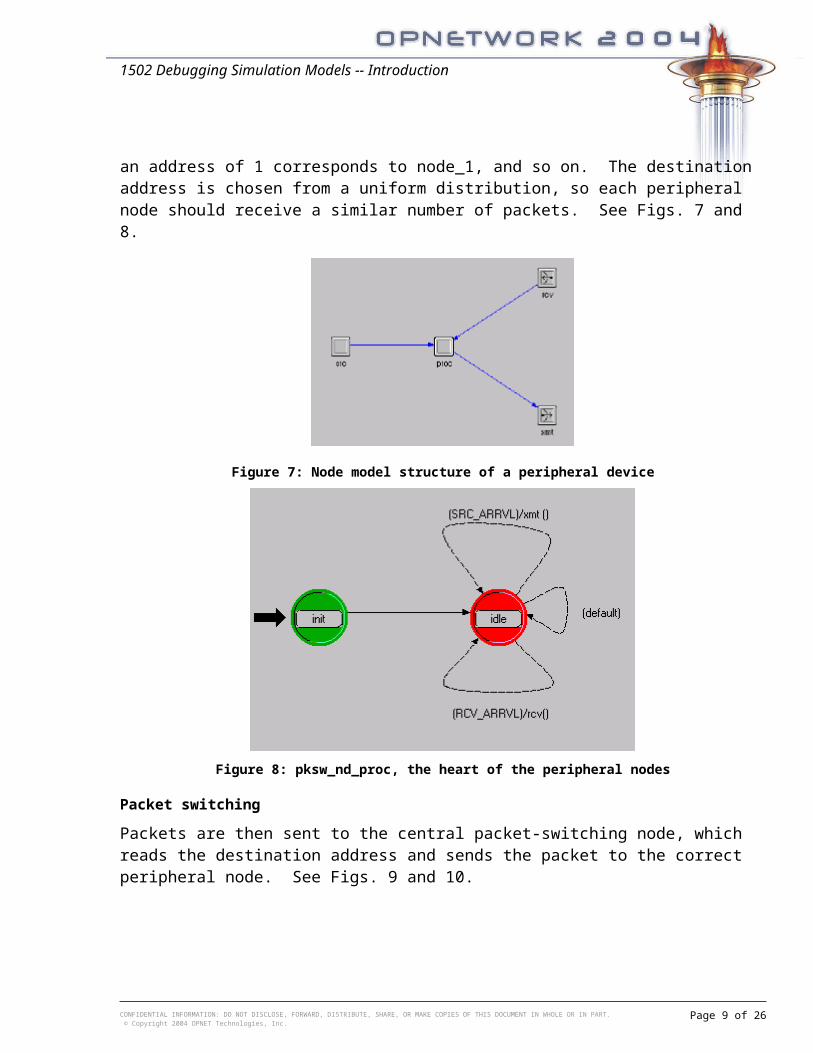
Packets are created from each peripheral node at a user-specified rate; for our exercises, this is a constant rate of 1 packet per second. After creation, each packet is assigned a destination address of 0, 1, 2, 3, where an address of 0 corresponds to node_0, an address of 1 corresponds to node_1, and so on. The destination address is chosen from a uniform distribution, so each peripheral node should receive a similar number of packets. See Figs. 7 and 8.
CONFIDENTIAL INFORMATION: DO NOT DISCLOSE, FORWARD, DISTRIBUTE, SHARE, OR MAKE COPIES OF THIS DOCUMENT IN WHOLE OR IN PART. © Copyright 2004 OPNET Technologies, Inc.
Page 8 of 23
1502 Debugging Simulation Models -- Introduction
Figure 7: Node model structure of a peripheral device
Figure 8: pksw_nd_proc, the heart of the peripheral nodes
Packet switching
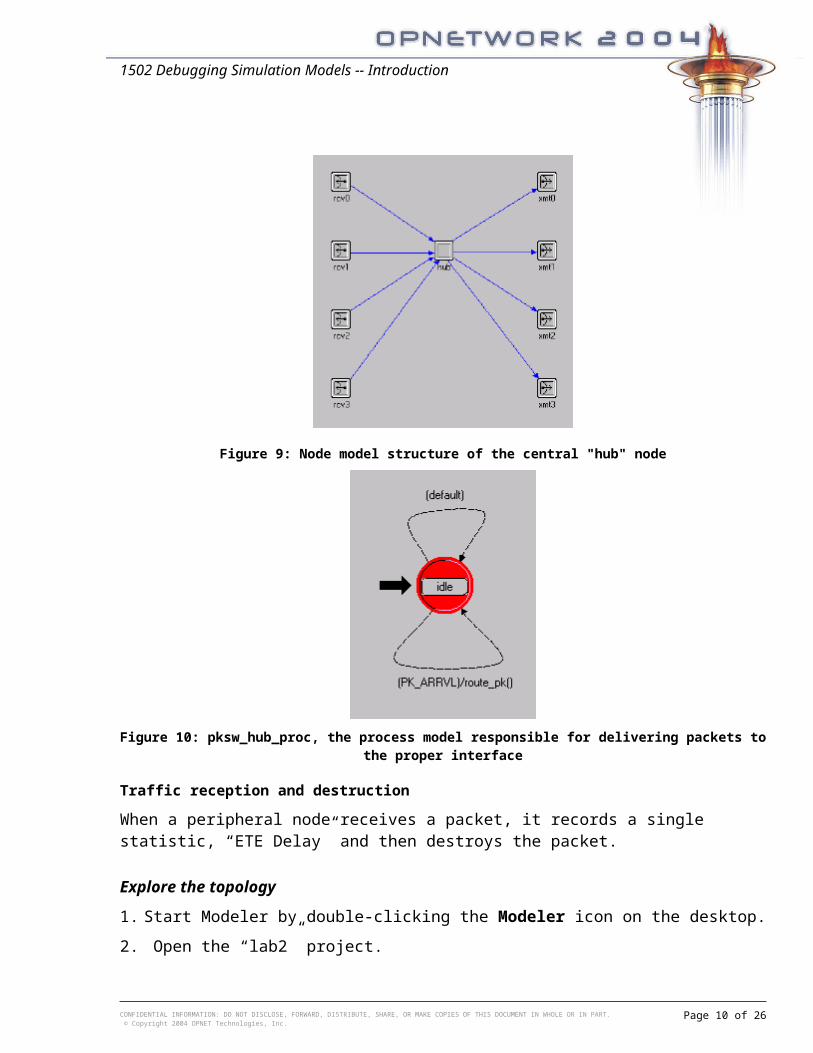
Packets are then sent to the central packet-switching node, which reads the destination address and sends the packet to the correct peripheral node. See Figs. 9 and 10.
CONFIDENTIAL INFORMATION: DO NOT DISCLOSE, FORWARD, DISTRIBUTE, SHARE, OR MAKE COPIES OF THIS DOCUMENT IN WHOLE OR IN PART. © Copyright 2004 OPNET Technologies, Inc.
Page 9 of 23
1502 Debugging Simulation Models -- Introduction
Figure 9: Node model structure of the central "hub" node
Figure 10: pksw_hub_proc, the process model responsible for delivering packets to the proper interface
Traffic reception and destruction
When a peripheral node receives a packet, it records a single statistic, “ETE Delay” and then destroys the packet.
Explore the topology
1. Start Modeler by double-clicking the Modeler icon on the desktop.
2. Open the “lab2” project.
a. Select File > Open from the pull-down menu. The Open dialog box opens.
b. Select the “lab2” project from the list.
CONFIDENTIAL INFORMATION: DO NOT DISCLOSE, FORWARD, DISTRIBUTE, SHARE, OR MAKE COPIES OF THIS DOCUMENT IN WHOLE OR IN PART. © Copyright 2004 OPNET Technologies, Inc.
Page 10 of 23
1502 Debugging Simulation Models -- Introduction
c. Click the OK button. The Project Editor opens with the “baseline” scenario displayed.
3. Explore the project, node models, and process models used in the scenario.
a. Double-click on the nodes to view their node models. The Node Editor opens.
b. Within the Node Editor, double-click on the processor modules to view their process models. The Process Editor opens.
c. Within the Process Editor, double-click on the top or bottom of a state to view its Enter Executives or Exit Executives, respectively. If you wish, view the Header Block, State Variables Block, Temporary Variable Block, Global and Local Statistics, and other process components.
4. When you are finished exploring, close all instances of the Node and Process editors by clicking on the X button in the upper-right corner. Do not save any changes you may have made during your exploration.
Run the simulation
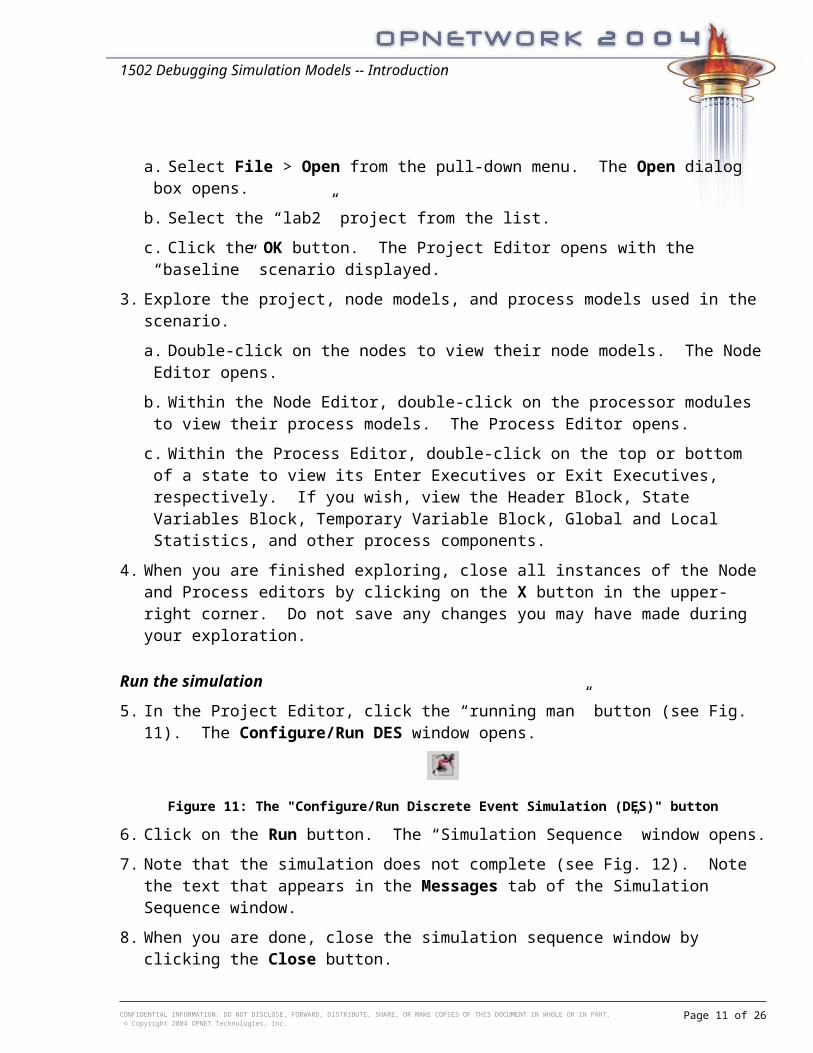
5. In the Project Editor, click the “running man” button (see Fig. 11). The Configure/Run DES window opens.
Figure 11: The "Configure/Run Discrete Event Simulation (DES)" button
6. Click on the Run button. The “Simulation Sequence” window opens.
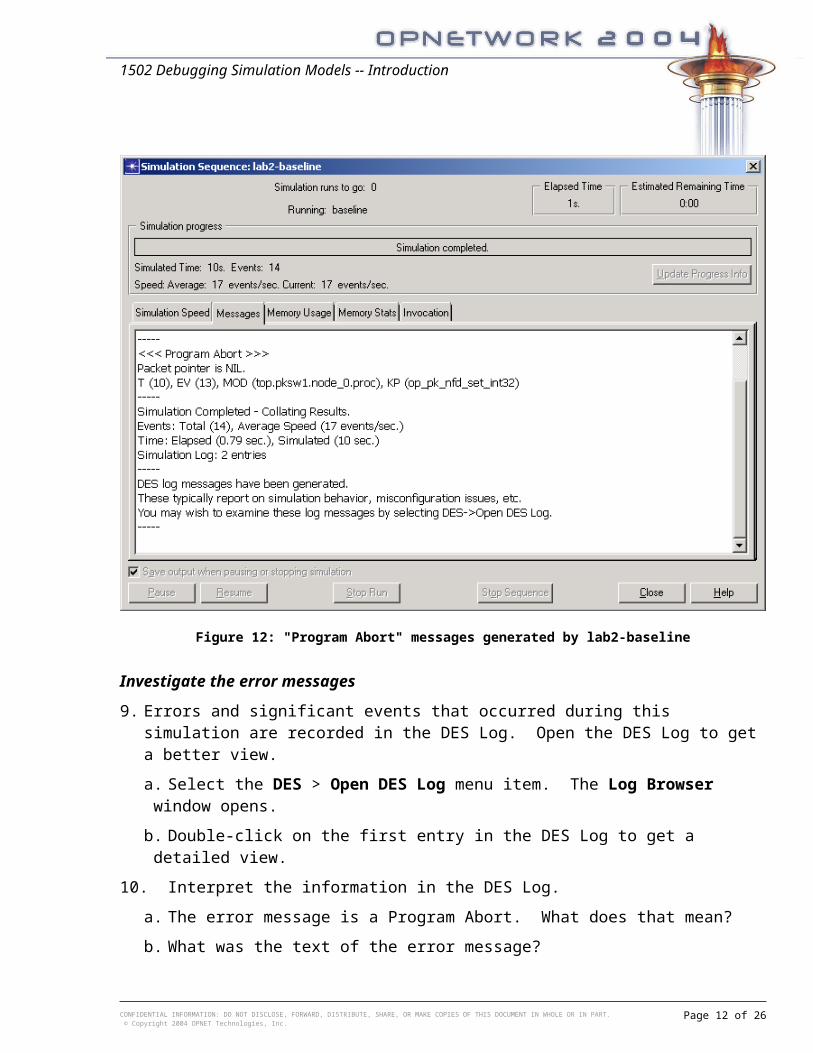
7. Note that the simulation does not complete (see Fig. 12). Note the text that appears in the Messages tab of the Simulation Sequence window.
8. When you are done, close the simulation sequence window by clicking the Close button.
CONFIDENTIAL INFORMATION: DO NOT DISCLOSE, FORWARD, DISTRIBUTE, SHARE, OR MAKE COPIES OF THIS DOCUMENT IN WHOLE OR IN PART. © Copyright 2004 OPNET Technologies, Inc.
Page 11 of 23
1502 Debugging Simulation Models -- Introduction
Figure 12: "Program Abort" messages generated by lab2-baseline
Investigate the error messages
9. Errors and significant events that occurred during this simulation are recorded in the DES Log. Open the DES Log to get a better view.
a. Select the DES > Open DES Log menu item. The Log Browser window opens.
b. Double-click on the first entry in the DES Log to get a detailed view.
10. Interpret the information in the DES Log.
a. The error message is a Program Abort. What does that mean?
b. What was the text of the error message?
c. At what simulation time was the error message recorded?
d. At which event number was the error message recorded?
e. Which module is the error message associated with?
CONFIDENTIAL INFORMATION: DO NOT DISCLOSE, FORWARD, DISTRIBUTE, SHARE, OR MAKE COPIES OF THIS DOCUMENT IN WHOLE OR IN PART. © Copyright 2004 OPNET Technologies, Inc.
Page 12 of 23
1502 Debugging Simulation Models -- Introduction
f. What was the name of the most recent process model in use when the error message was recorded?
g. Which Kernel Procedure was invoked incorrectly to produce the error message? What does this KP do?
h. Close the DES log when you are ready.
11. The DES log only records the header of the error message. Open the error log to see the function call stack (FCS) recorded along with the error message.
a. Select the Help > Error Log > Open menu item. The error log opens.
b. Which state or transition of the process model did the error occur in?
c. Which function did the error occur in?
d. How many times had the KP op_pk_nfd_set_int32 () been called during the simulation when the error was recorded?
e. Close the error log when you are ready.
What additional information is needed to diagnose the problem?
At this point, we know that in node_0 in the proc module in the pksw_nd_proc process during a transition from idle idle, the function xmt () was called for the first time. During this function call, a NIL packet pointer was passed to op_pk_nfd_set_int32 ().
Good questions to ask include: How was the NIL packet pointer obtained in the first place? What field was being set? What happened right before the call to op_pk_nfd_set_int32 ()? These are questions that are difficult to answer analytically, but that OPNET Debugger (ODB) can determine quite easily.
Start the simulation in ODB
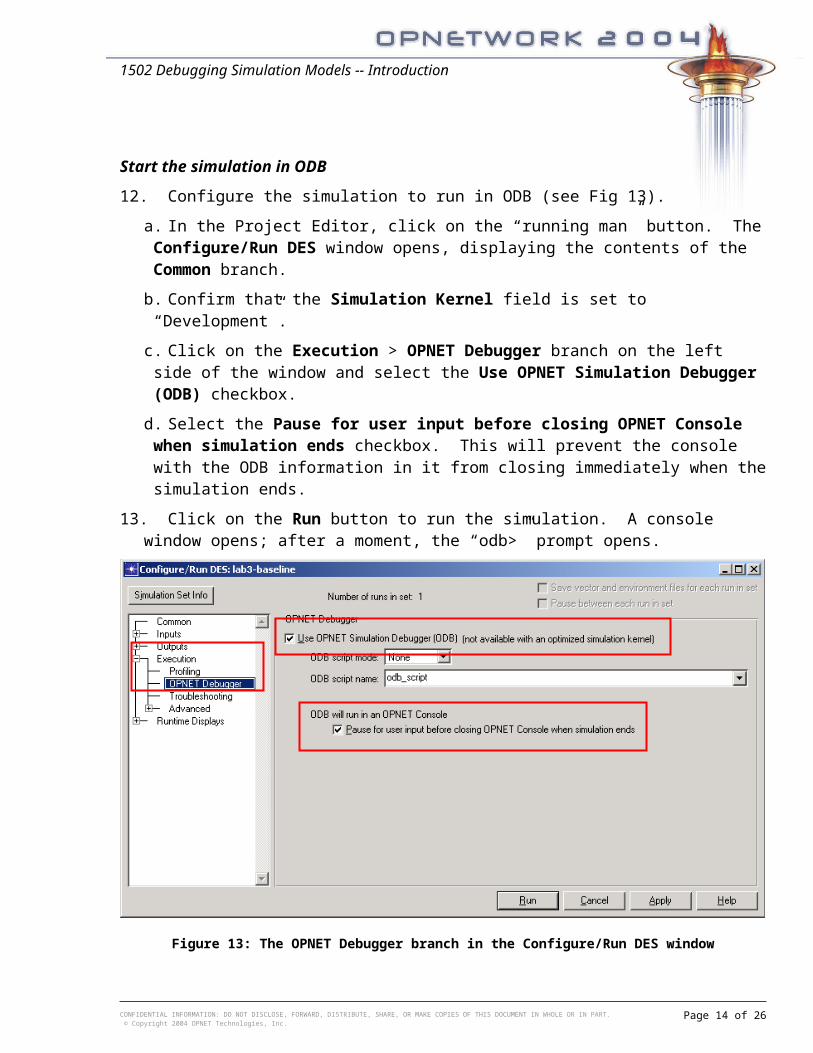
12. Configure the simulation to run in ODB (see Fig 13).
a. In the Project Editor, click on the “running man” button. The Configure/Run DES window opens, displaying the contents of the Common branch.
b. Confirm that the Simulation Kernel field is set to “Development”.
c. Click on the Execution > OPNET Debugger branch on the left side of the window and select the Use OPNET Simulation Debugger (ODB) checkbox.
d. Select the Pause for user input before closing OPNET Console when simulation ends checkbox. This will prevent the console with the ODB information in it from closing immediately when the simulation ends.
13. Click on the Run button to run the simulation. A console window opens; after a moment, the “odb>” prompt opens.
CONFIDENTIAL INFORMATION: DO NOT DISCLOSE, FORWARD, DISTRIBUTE, SHARE, OR MAKE COPIES OF THIS DOCUMENT IN WHOLE OR IN PART. © Copyright 2004 OPNET Technologies, Inc.
Page 13 of 23
1502 Debugging Simulation Models -- Introduction
Figure 13: The OPNET Debugger branch in the Configure/Run DES window
Use ODB to set a breakpoint
14. Enter the command evstop 13. This sets a breakpoint that will stop the simulation just before the error takes place.
a. If you wish, enter the command status to view what breakpoints have been set.
b. If you wish, enter the command help evstop to learn more about the “evstop” command.
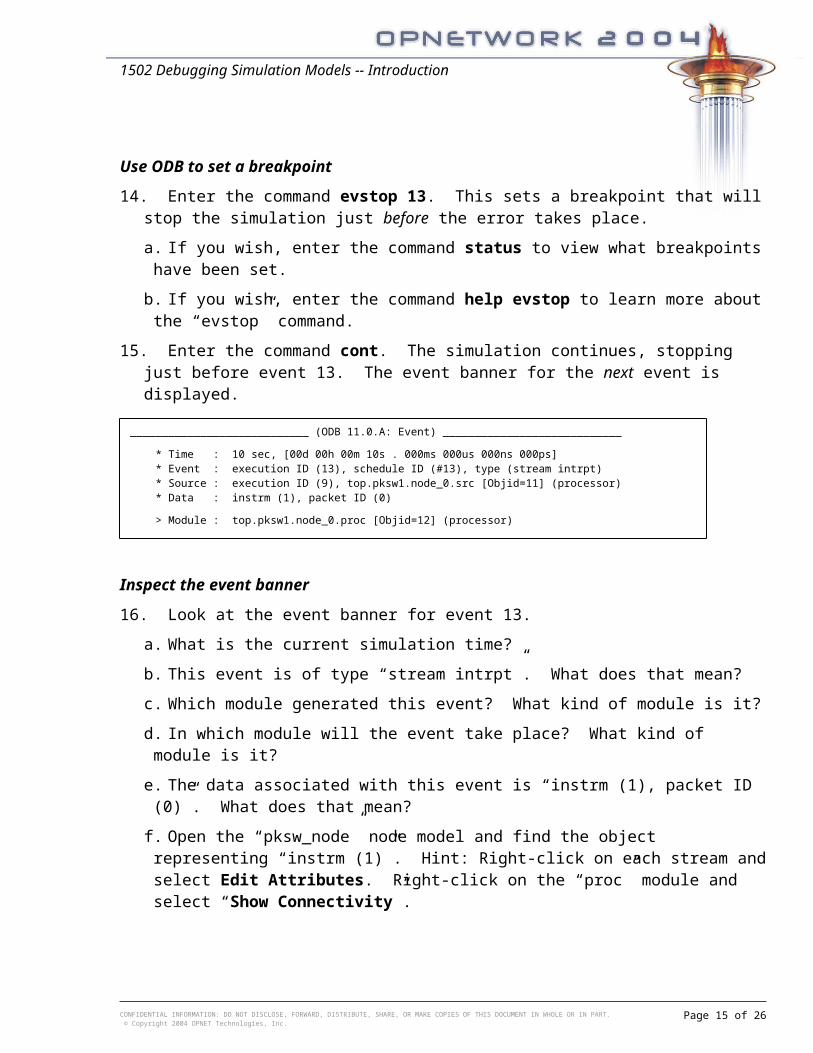
15. Enter the command cont. The simulation continues, stopping just before event 13. The event banner for the next event is displayed.
Inspect the event banner
16. Look at the event banner for event 13.
a. What is the current simulation time?
b. This event is of type “stream intrpt”. What does that mean?
CONFIDENTIAL INFORMATION: DO NOT DISCLOSE, FORWARD, DISTRIBUTE, SHARE, OR MAKE COPIES OF THIS DOCUMENT IN WHOLE OR IN PART. © Copyright 2004 OPNET Technologies, Inc.
Page 14 of 23
____________________________ (ODB 11.0.A: Event) ____________________________
* Time : 10 sec, [00d 00h 00m 10s . 000ms 000us 000ns 000ps] * Event : execution ID (13), schedule ID (#13), type (stream intrpt) * Source : execution ID (9), top.pksw1.node_0.src [Objid=11] (processor) * Data : instrm (1), packet ID (0)
> Module : top.pksw1.node_0.proc [Objid=12] (processor)
breakpoint trapped : "stop at event (13)"
1502 Debugging Simulation Models -- Introduction
c. Which module generated this event? What kind of module is it?
d. In which module will the event take place? What kind of module is it?
e. The data associated with this event is “instrm (1), packet ID (0)”. What does that mean?
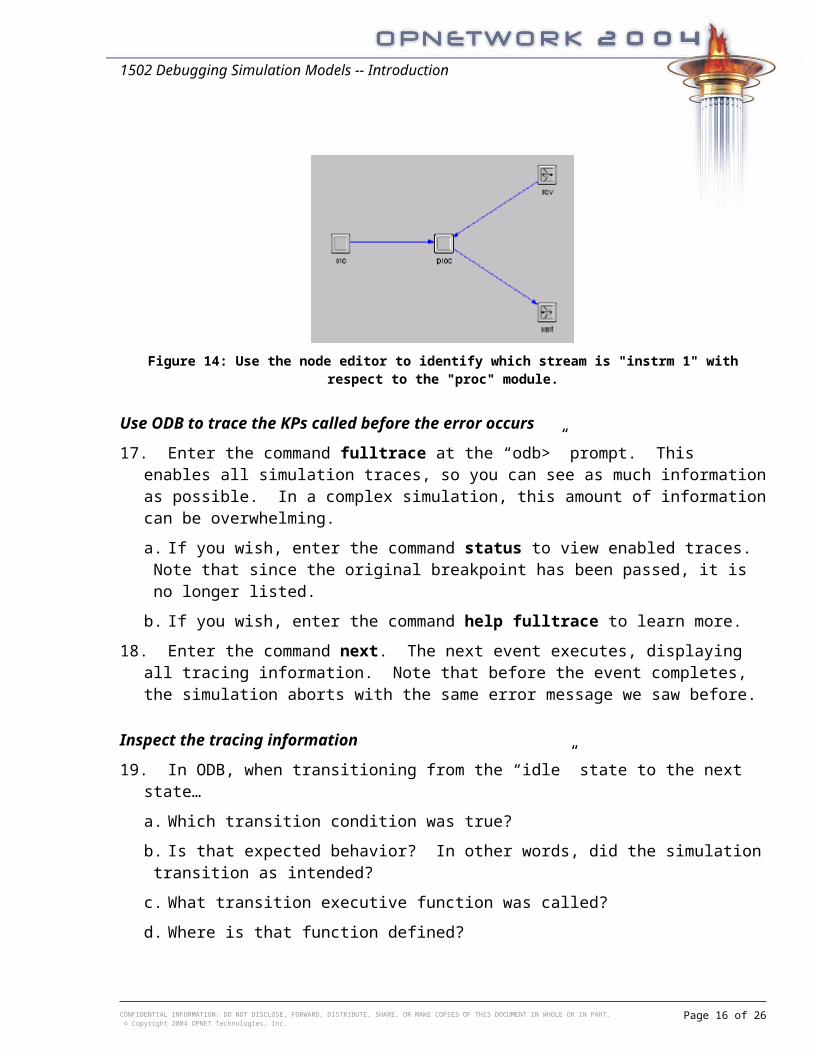
f. Open the “pksw_node” node model and find the object representing “instrm (1)”. Hint: Right-click on each stream and select Edit Attributes. Right-click on the “proc” module and select “Show Connectivity”.
Figure 14: Use the node editor to identify which stream is "instrm 1" with respect to the "proc" module.
Use ODB to trace the KPs called before the error occurs
17. Enter the command fulltrace at the “odb>” prompt. This enables all simulation traces, so you can see as much information as possible. In a complex simulation, this amount of information can be overwhelming.
a. If you wish, enter the command status to view enabled traces. Note that since the original breakpoint has been passed, it is no longer listed.
b. If you wish, enter the command help fulltrace to learn more.
18. Enter the command next. The next event executes, displaying all tracing information. Note that before the event completes, the simulation aborts with the same error message we saw before.
Inspect the tracing information
19. In ODB, when transitioning from the “idle” state to the next state…
a. Which transition condition was true?
b. Is that expected behavior? In other words, did the simulation transition as intended?
c. What transition executive function was called?
d. Where is that function defined?
20. Open the “pksw_nd_proc” process model, so that you can compare the results of the trace in ODB with the structure of the process model.
CONFIDENTIAL INFORMATION: DO NOT DISCLOSE, FORWARD, DISTRIBUTE, SHARE, OR MAKE COPIES OF THIS DOCUMENT IN WHOLE OR IN PART. © Copyright 2004 OPNET Technologies, Inc.
Page 15 of 23
1502 Debugging Simulation Models -- Introduction
a. In Modeler, select the File > Open menu item. The Open window appears.
b. Change the Files of Type field to “Process Model”.
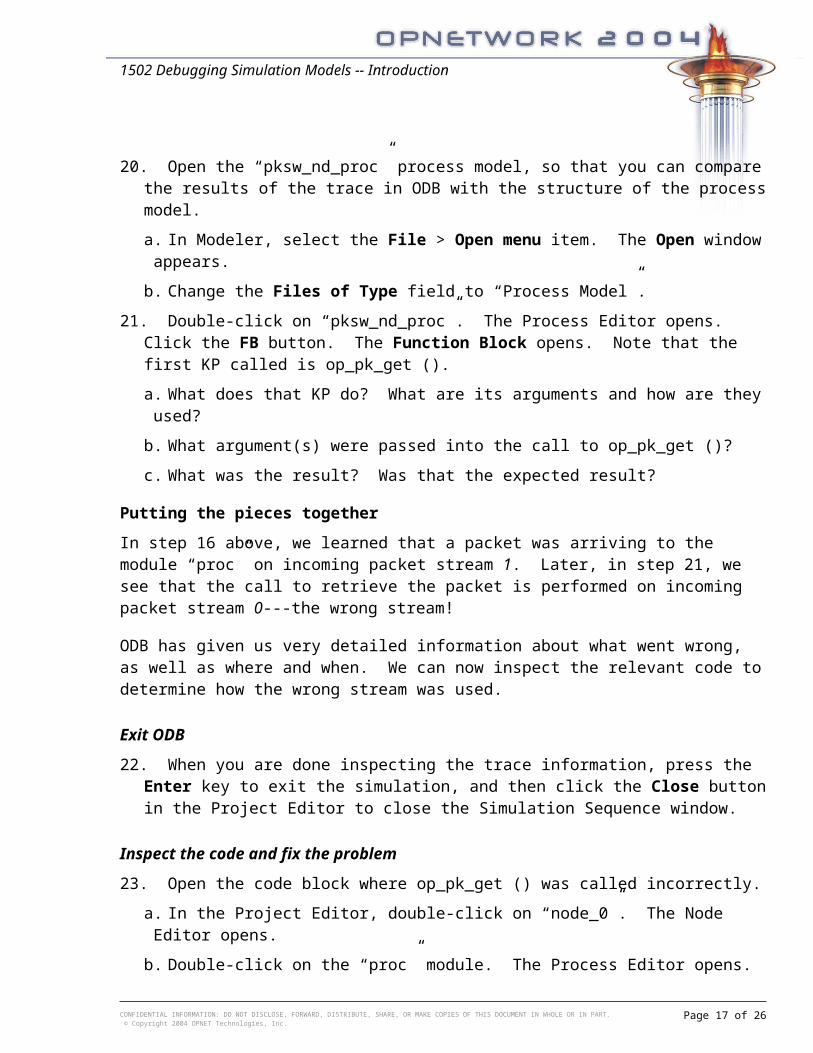
21. Double-click on “pksw_nd_proc”. The Process Editor opens. Click the FB button. The Function Block opens. Note that the first KP called is op_pk_get ().
a. What does that KP do? What are its arguments and how are they used?
b. What argument(s) were passed into the call to op_pk_get ()?
c. What was the result? Was that the expected result?
Putting the pieces together
In step 16 above, we learned that a packet was arriving to the module “proc” on incoming packet stream 1. Later, in step 21, we see that the call to retrieve the packet is performed on incoming packet stream 0---the wrong stream!
ODB has given us very detailed information about what went wrong, as well as where and when. We can now inspect the relevant code to determine how the wrong stream was used.
Exit ODB
22. When you are done inspecting the trace information, press the Enter key to exit the simulation, and then click the Close button in the Project Editor to close the Simulation Sequence window.
Inspect the code and fix the problem
23. Open the code block where op_pk_get () was called incorrectly.
a. In the Project Editor, double-click on “node_0”. The Node Editor opens.
b. Double-click on the “proc” module. The Process Editor opens.
c. Click the FB button. The Function Block opens.
24. Note that op_pk_get () is called with the macro “RCV_IN_STRM”. In order to understand what this macro means, explore the area where it is declared.
a. Click the HB button. The Header Block opens.
b. What does that macro expand to?
c. Which macro should have been used as an argument to op_pk_get () in this situation?
d. When you are done, close the Header Block. Do not save any changes you may have made while inspecting the Header Block.
25. Fix the problem. This packet was generated at a higher-layer and is about to be transmitted.
a. Return to the Function Block.
b. Change the value RCV_IN_STRM to SRC_IN_STRM.
CONFIDENTIAL INFORMATION: DO NOT DISCLOSE, FORWARD, DISTRIBUTE, SHARE, OR MAKE COPIES OF THIS DOCUMENT IN WHOLE OR IN PART. © Copyright 2004 OPNET Technologies, Inc.
Page 16 of 23
1502 Debugging Simulation Models -- Introduction
c. Close the Function Block by clicking on the X button in the upper right. When prompted, click the Save button to retain your changes.
d. Save and compile the “pksw_nd_proc” process model.
i. Click on the File > Save menu item
ii. Click on the yellow Compile Process Model button to compile the process model. Click on the Close button when the compilation is complete.
26. Close all Process Editor and Node Editor windows.
Test if the change worked
27. Configure the simulation to run normally (outside of ODB).
a. In the Project Editor, click the “running man” button. The Configure/Run DES window opens, displaying the contents of the Common branch.
b. Clear the Pause for user input before closing OPNET Console when simulation ends checkbox.
c. Click on the Execution > OPNET Debugger branch on the left side of the window and clear the Use OPNET Simulation Debugger (ODB) checkbox.
28. Click on the Run button. The Simulation Sequence window opens. After a moment, the simulation runs and completes.
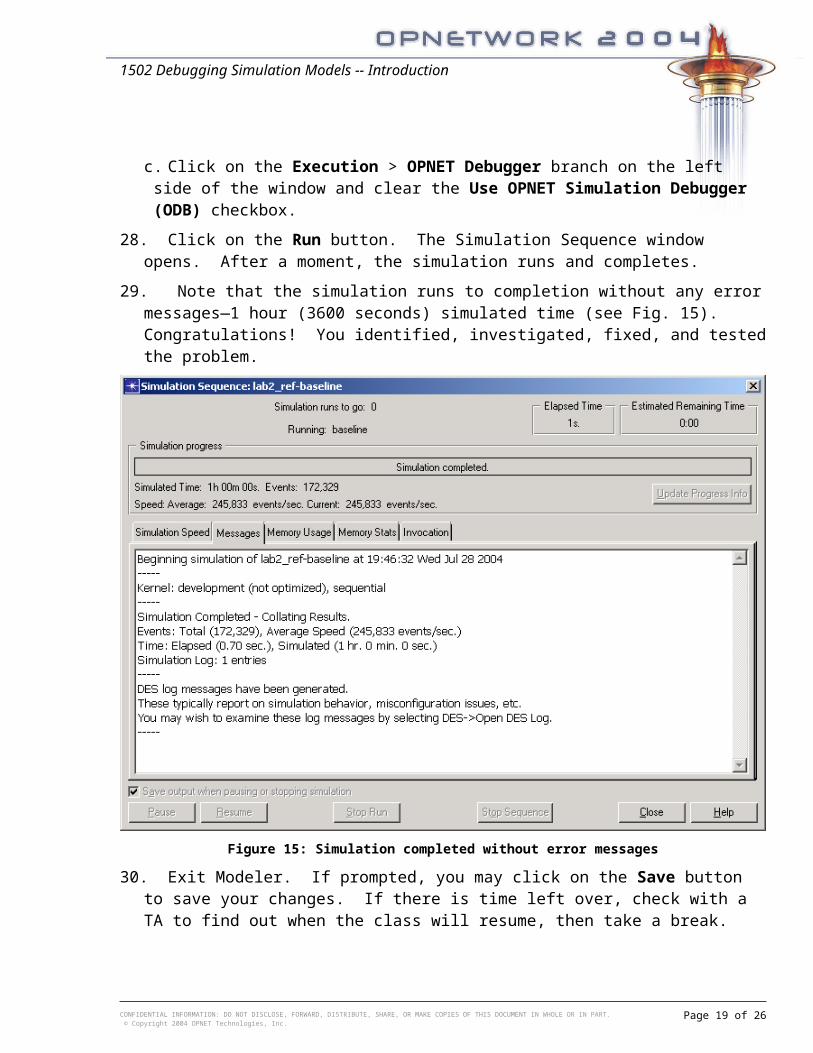
29. Note that the simulation runs to completion without any error messages—1 hour (3600 seconds) simulated time (see Fig. 15). Congratulations! You identified, investigated, fixed, and tested the problem.
CONFIDENTIAL INFORMATION: DO NOT DISCLOSE, FORWARD, DISTRIBUTE, SHARE, OR MAKE COPIES OF THIS DOCUMENT IN WHOLE OR IN PART. © Copyright 2004 OPNET Technologies, Inc.
Page 17 of 23
1502 Debugging Simulation Models -- Introduction
Figure 15: Simulation completed without error messages
30. Exit Modeler. If prompted, you may click on the Save button to save your changes. If there is time left over, check with a TA to find out when the class will resume, then take a break.
CONFIDENTIAL INFORMATION: DO NOT DISCLOSE, FORWARD, DISTRIBUTE, SHARE, OR MAKE COPIES OF THIS DOCUMENT IN WHOLE OR IN PART. © Copyright 2004 OPNET Technologies, Inc.
Page 18 of 23
1502 Debugging Simulation Models -- Introduction
Lab 3: Debugging a behavioral problem using packet-related commands
Purpose of the exercise
In Lab 2, we fixed a structural problem and confirmed that the simulation runs to completion, but we didn’t check if the simulation results were as expected. Using the same network we will identify and fix a behavioral problem in the underlying process model code.
Validating Results
In Lab 2, we made sure that the simulation ran to completion, but we did not validate the results. Let’s do that now.
View and evaluate simulation results
1. Open the project.
a. Run Modeler.
b. Open the lab3 project. This project is identical to “lab2”, but the program abort has been fixed for you.
2. This simulation has already been run, and results have been collected for you. Click the Hide/Show Graph Panels button (see Fig 16). Several analysis panels appear.
Figure 16: The Hide/Show Graph Panels button
3. Inspect the panel on the left.
a. Each of its four stacked graphs shows utilization of a link in the scenario, from the peripheral nodes toward the central node.
b. Note that the links have identical utilization.
c. This is expected behavior, since each node is generating the same amount of traffic (a constant rate of 1 packet per second).
4. Inspect the panel on the right.
a. Each of its four stacked graphs also shows utilization of a link in the scenario, this time from the central node toward the peripheral nodes.
b. Note that three of the links are not utilized, but the link “hub -> node_0” is highly utilized. In fact, it looks like all of the packets are going to the same destination—node 0.
c. This is not intended behavior. Packet destinations are selected based on a uniform distribution; i.e. each destination should see similar throughput.
5. When you are ready, click the Hide/Show Graph Panels button again to hide the panels.
CONFIDENTIAL INFORMATION: DO NOT DISCLOSE, FORWARD, DISTRIBUTE, SHARE, OR MAKE COPIES OF THIS DOCUMENT IN WHOLE OR IN PART. © Copyright 2004 OPNET Technologies, Inc.
Page 19 of 23
1502 Debugging Simulation Models -- Introduction
Develop a hypothesis
All packets are being sent to the same destination. With our knowledge of the model architecture, possible reasons for this include the following (perhaps you can think of more).
The same destination address (0) is being set on every packet
The destination address is set correctly, but is later overwritten
The central packet-switching node is obtaining the destination for each packet from the wrong source.
One debugging approach is to follow the life cycle of a packet, from its creation until its destruction.
Use ODB to trace a packet
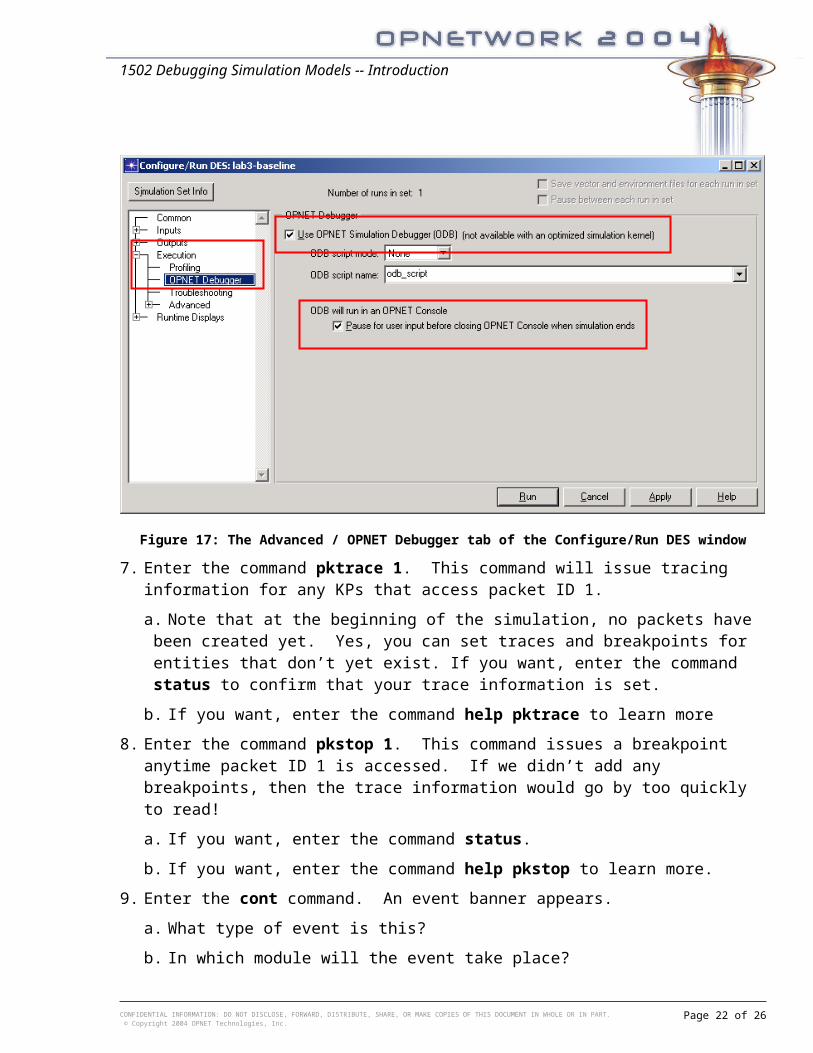
6. Run the simulation in ODB (see Fig. 17). After a moment, a console with the “odb>” prompt opens.
Figure 17: The Advanced / OPNET Debugger tab of the Configure/Run DES window
7. Enter the command pktrace 1. This command will issue tracing information for any KPs that access packet ID 1.
a. Note that at the beginning of the simulation, no packets have been created yet. Yes, you can set traces and breakpoints for entities that don’t yet exist. If you want, enter the command status to confirm that your trace information is set.
b. If you want, enter the command help pktrace to learn more
CONFIDENTIAL INFORMATION: DO NOT DISCLOSE, FORWARD, DISTRIBUTE, SHARE, OR MAKE COPIES OF THIS DOCUMENT IN WHOLE OR IN PART. © Copyright 2004 OPNET Technologies, Inc.
Page 20 of 23
1502 Debugging Simulation Models -- Introduction
8. Enter the command pkstop 1. This command issues a breakpoint anytime packet ID 1 is accessed. If we didn’t add any breakpoints, then the trace information would go by too quickly to read!
a. If you want, enter the command status.
b. If you want, enter the command help pkstop to learn more.
9. Enter the cont command. An event banner appears.
a. What type of event is this?
b. In which module will the event take place?
Creation and initialization
10. Continue to enter the command cont, and note as KPs are invoked during this event. Hint: You’ll know the event is over when a new event banner appears.
a. Which KP is used to create the packet?
b. Which KP is used to set the packet’s size?
c. At the end of the event, which KP is used to send the packet on to another module? Which module is the packet being sent to?
11. The next event is #14. This may look familiar - it’s the same process we inspected in Lab 2.
a. What destination address is set on the packet?
b. Which node should packet to be delivered to?
12. Enter the command pkprint 1 to confirm that the packet was modified as expected.
Through the pipeline stages
13. Continue to enter the command cont (Hint: You can also abbreviate this command as c).
a. The next several breakpoints and trace information show the packet’s traversal through the Transceiver Pipeline Stages.
b. Since the pipeline stage code in this model is standard from the OPNET Model Library, it is unlikely that the packet is being modified unexpectedly in the pipeline stages.
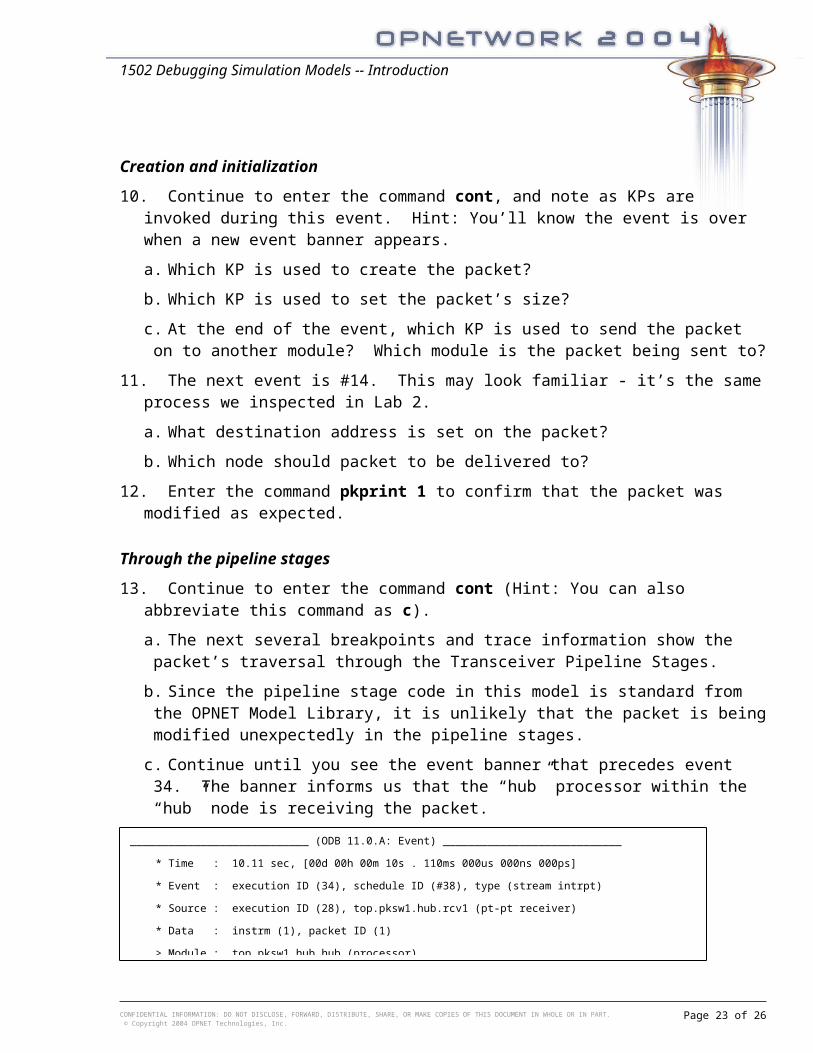
c. Continue until you see the event banner that precedes event 34. The banner informs us that the “hub” processor within the “hub” node is receiving the packet.
CONFIDENTIAL INFORMATION: DO NOT DISCLOSE, FORWARD, DISTRIBUTE, SHARE, OR MAKE COPIES OF THIS DOCUMENT IN WHOLE OR IN PART. © Copyright 2004 OPNET Technologies, Inc.
Page 21 of 23
____________________________ (ODB 11.0.A: Event) ____________________________
* Time : 10.11 sec, [00d 00h 00m 10s . 110ms 000us 000ns 000ps]
* Event : execution ID (34), schedule ID (#38), type (stream intrpt)
* Source : execution ID (28), top.pksw1.hub.rcv1 (pt-pt receiver)
* Data : instrm (1), packet ID (1)
> Module : top.pksw1.hub.hub (processor)
1502 Debugging Simulation Models -- Introduction
In the central node’s processor
14. Enter the command pkprint 1 to confirm that the destination address is still 1, as it should be.
15. Enter the cont command 3 times to see how the packet is manipulated in event #34.
16. Take note of the different KPs that were used to access the packet in event #34.
a. What is the KP op_pk_get () used for?
b. What is the KP op_pk_nfd_set_int32 () used for?
c. What destination is the packet sent to with op_pk_send ()?
17. Enter the command pkprint 1, and note that the packet’s destination address field has changed.
Aha!
Did you catch it? The use of op_pk_nfd_set_int32 () is suspicious. The central hub should only get the value of packet fields, not set them. Looks like the developer may have made a typographical error!
Confirm and fix the problem
18. Stop ODB with the exit or quit command (enter the commands help exit and help quit, if you want, to recall what the difference is). Close the Simulation Sequence window.
19. Locate the code that calls op_pk_nfd_set_int32 ()—recall that we discovered that code in the top.pksw1.hub.hub module.
a. Double-click on the “hub” node. The Node Editor opens.
b. Double-click on the “hub” processor. The “pksw_hub_proc” process model opens.
c. Click the FB button. The Function Block opens.
d. Inspect the code. How would you fix the problem?
20. Find the line containing op_pk_nfd_set_int32 () and fix it as shown in the diagram below. Note that there are two changes required.
a. What does this algorithm do now?
b. Why are both changes required?
Test the fix
21. Save your changes and recompile the process model. Close any open instances of the Node and Process Editors.
22. Run the simulation normally (not in ODB).
CONFIDENTIAL INFORMATION: DO NOT DISCLOSE, FORWARD, DISTRIBUTE, SHARE, OR MAKE COPIES OF THIS DOCUMENT IN WHOLE OR IN PART. © Copyright 2004 OPNET Technologies, Inc.
Page 22 of 23
op_pk_nfd_get_int32 (pkptr, "dest_address", &dest_address);
1502 Debugging Simulation Models -- Introduction
23. View the results by clicking on the Hide/Show Graph Panels button. Preconfigured analysis panels appear, but they still display the same images as before. Reload the new results into each panel.
a. Right-click on the gray area of each panel (on the panel itself, not on a graph) and select Make Panel Template.
b. Right-click on the panel again, and select Load Data Into Template.
c. Note that the values are approximately equal. This is as expected.
d. Why aren’t the utilization values identical?
Extra Credit
Create a new analysis panel that shows the link utilization from the hub to peripheral nodes all on a single graph, as shown in Fig. 18.
Figure 18: The corrected simulation behavior
CONFIDENTIAL INFORMATION: DO NOT DISCLOSE, FORWARD, DISTRIBUTE, SHARE, OR MAKE COPIES OF THIS DOCUMENT IN WHOLE OR IN PART. © Copyright 2004 OPNET Technologies, Inc.
Page 23 of 23


