Embed Size (px)
Citation preview
University of WollongongResearch Online
University of Wollongong Thesis Collection University of Wollongong Thesis Collections
1990
Rock cutting studies using fracture mechanicsprinciplesHua GuoUniversity of Wollongong
Research Online is the open access institutional repository for theUniversity of Wollongong. For further information contact ManagerRepository Services: [email protected].
Recommended CitationGuo, Hua, Rock cutting studies using fracture mechanics principles, Doctor of Philosophy thesis, Department of Civil and MiningEngineering, University of Wollongong, 1990. http://ro.uow.edu.au/theses/1262
ROCK CUTTING STUDIES USING FRACTURE MECHANICS PRINCIPLES
A thesis submitted in fulfilment of the requirements for the award of the degree of
DOCTOR OF PHILOSOPHY
from
THE UNIVERSITY OF WOLLONGONG
by
HUA GUO, BE(HONS), ME
DEPARTMENT OF CIVIL AND MINING ENGINEERING
1990
(ii)
DECLARATION
The work submitted in this thesis has been carried out by the author whilst enrolled as a full-
time postgraduate student at the Department of Civil and Mining Engineering, the University
of Wollongong. The results obtained from this study and the conclusions drawn therefore of
the author efforts, except where otherwise stated.
The work contained in this thesis has not been submitted for a degree to any other university
or similar institution.
Parts of this thesis have been published as follows,
Guo, H., Standish, P., Schmidt, L.C. and Aziz, N.I. 1988. A Method of Mechanical
Efficiency Analysis for Rotary Drag Bits. Second International Conference on Mining
Machinery, Brisbane, pp 322-326.
Schmidt, L.C, Aziz, N.I. and Guo, H. 1988. Mechanics of Rock Drilling, Cutting and
Future Developments, 21st Century Higher Production Coal Mining System Symposium,
Wollongong, pp 221-231.
(iii)
ACKNOWLEDGEMENTS
The author wishes to express his sincere appreciation to Professor L.C. Schmidt, Head,
Department of Civil and Mining Engineering, the University of Wollongong, for his
encouragement, and assistance throughout the study period. Special thanks go to Dr. N.I.
Aziz, Senior Lecturer, the thesis supervisor for his guidance and supervision on the research
work. Special thanks also go to Professor R. N Singh for his discussion and suggestion on
this thesis.
Gratitude is also extended to the other persons who have contributed to the completion of
this thesis. Particular appreciations go to:
Mr. Richard Webb for his assistance with much of the experimental work in the rock cutting
tests and rock toughness measurements.
Messrs Ian Laird and Ian Bridge for their efforts in setting up the 'Rock Cutting Simulation
Rig'.
Mr. Garry Cains for rock specimen collection and preparation.
Mr. Charles Allport for his help on the related photography.
Finally, warm appreciation goes to my wife, Xiaping, for her understanding and continuous
assistance throughout the period of this research work.
The research work was sponsored by Mining Research Centre, Department of Civil and
Mining Engineering, the University of Wollongong.
(iv)
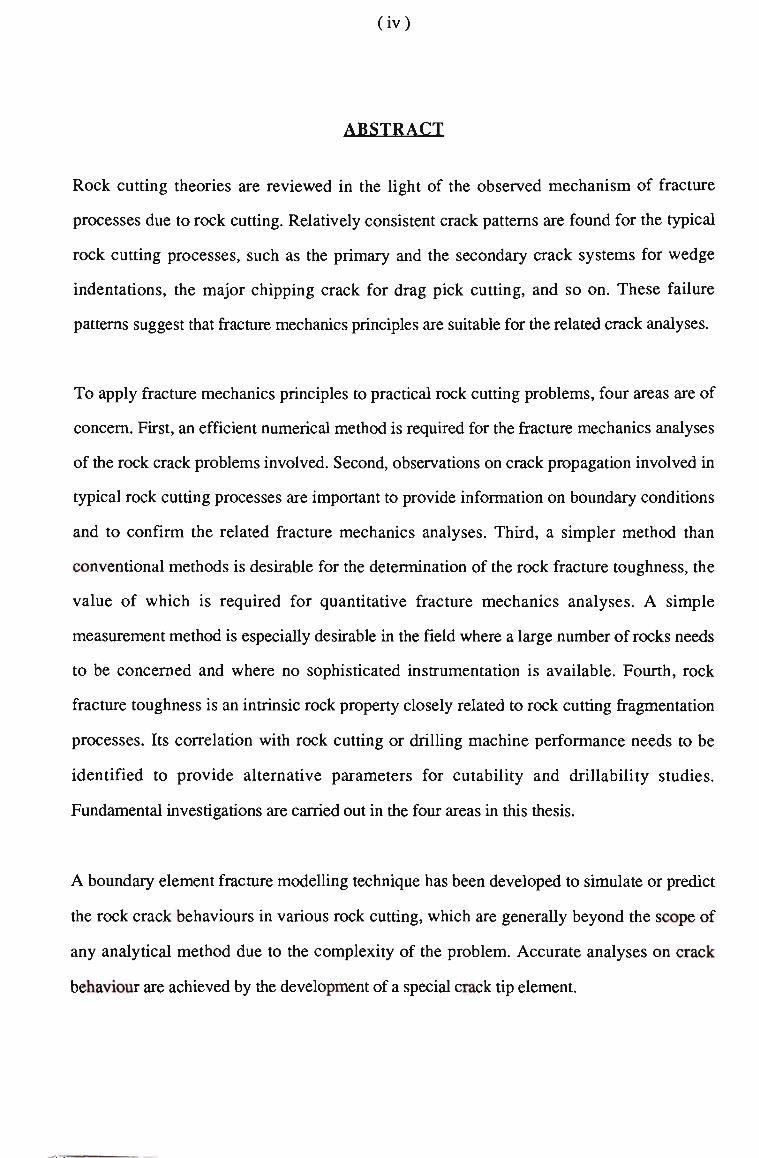
ABSTRACT
Rock cutting theories are reviewed in the light of the observed mechanism of fracture
processes due to rock cutting. Relatively consistent crack patterns are found for the typical
rock cutting processes, such as the primary and the secondary crack systems for wedge
indentations, the major chipping crack for drag pick cutting, and so on. These failure
patterns suggest that fracture mechanics principles are suitable for the related crack analyses.
To apply fracture mechanics principles to practical rock cutting problems, four areas are of
concern. First, an efficient numerical method is required for the fracture mechanics analyses
of the rock crack problems involved. Second, observations on crack propagation involved in
typical rock cutting processes are important to provide information on boundary conditions
and to confirm the related fracture mechanics analyses. Third, a simpler method than
conventional methods is desirable for the determination of the rock fracture toughness, the
value of which is required for quantitative fracture mechanics analyses. A simple
measurement method is especially desirable in the field where a large number of rocks needs
to be concerned and where no sophisticated instrumentation is available. Fourth, rock
fracture toughness is an intrinsic rock property closely related to rock cutting fragmentation
processes. Its correlation with rock cutting or drilling machine performance needs to be
identified to provide alternative parameters for cutability and drillability studies.
Fundamental investigations are carried out in the four areas in this thesis.
A boundary element fracture modelling technique has been developed to simulate or predict
the rock crack behaviours in various rock cutting, which are generally beyond the scope of
any analytical method due to the complexity of the problem. Accurate analyses on crack
behaviour are achieved by the development of a special crack tip element.
(v)
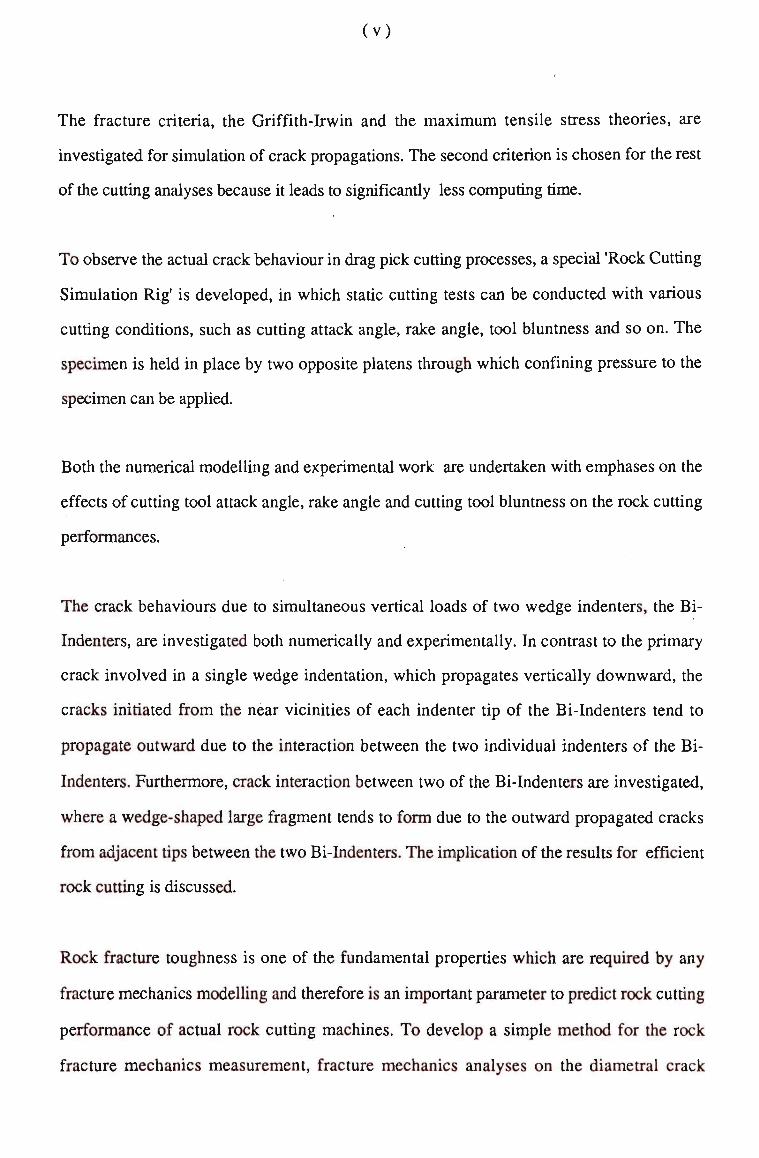
The fracture criteria, the Griffith-Irwin and the maximum tensile stress theories, are
investigated for simulation of crack propagations. The second criterion is chosen for the rest
of the cutting analyses because it leads to significantly less computing time.
To observe the actual crack behaviour in drag pick cutting processes, a special 'Rock Cutting
Simulation Rig' is developed, in which static cutting tests can be conducted with various
cutting conditions, such as cutting attack angle, rake angle, tool bluntness and so on. The
specimen is held in place by two opposite platens through which confining pressure to the
specimen can be applied.
Both the numerical modelling and experimental work are undertaken with emphases on the
effects of cutting tool attack angle, rake angle and cutting tool bluntness on the rock cutting
performances.
The crack behaviours due to simultaneous vertical loads of two wedge indenters, the Bi-
Indenters, are investigated both numerically and experimentally. In contrast to the primary
crack involved in a single wedge indentation, which propagates vertically downward, the
cracks initiated from the near vicinities of each indenter tip of the Bi-Indenters tend to
propagate outward due to the interaction between the two individual indenters of the Bi-
Indenters. Furthermore, crack interaction between two of the Bi-Indenters are investigated,
where a wedge-shaped large fragment tends to form due to the outward propagated cracks
from adjacent tips between the two Bi-Indenters. The implication of the results for efficient
rock cutting is discussed.
Rock fracture toughness is one of the fundamental properties which are required by any
fracture mechanics modelling and therefore is an important parameter to predict rock cutting
performance of actual rock cutting machines. T o develop a simple method for the rock
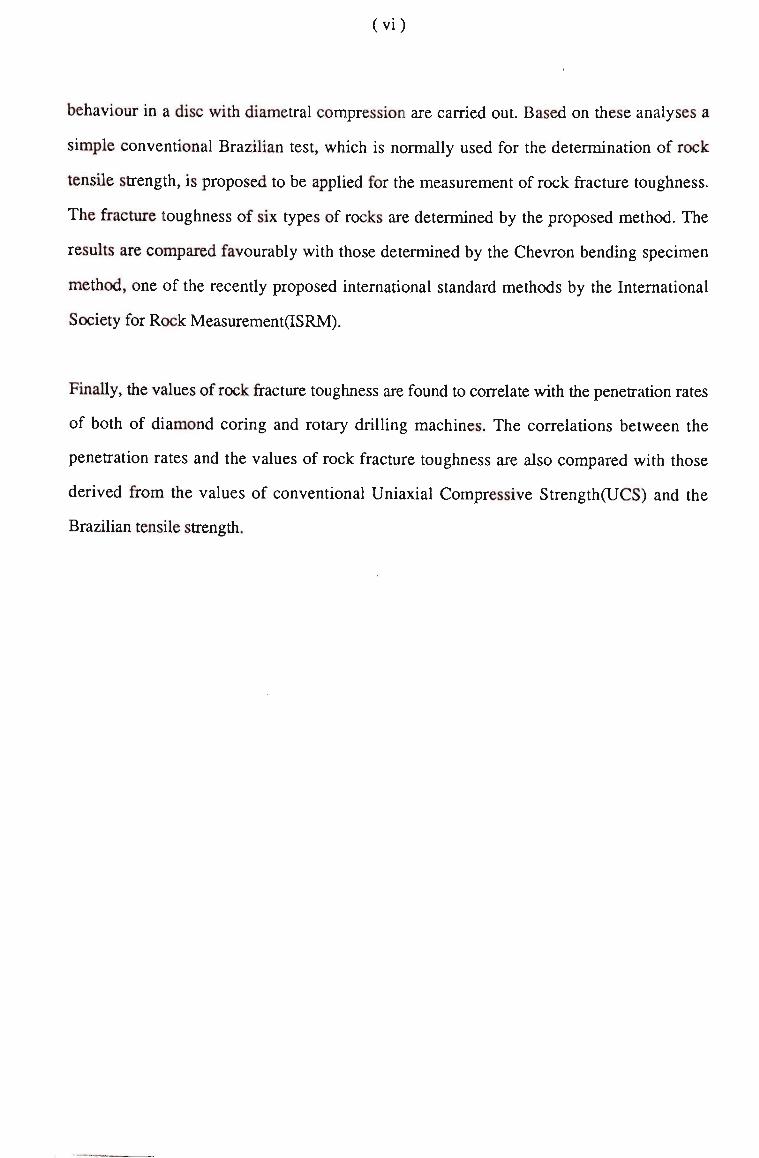
fracture mechanics measurement, fracture mechanics analyses on the diametral crack
(vi)
behaviour in a disc with diametral compression are carried out. Based on these analyses a
simple conventional Brazilian test, which is normally used for the determination of rock
tensile strength, is proposed to be applied for the measurement of rock fracture toughness.
The fracture toughness of six types of rocks are determined by the proposed method. The
results are compared favourably with those determined by the Chevron bending specimen
method, one of the recently proposed international standard methods by the International
Society for Rock Measurement(ISRM).
Finally, the values of rock fracture toughness are found to correlate with the penetration rates
of both of diamond coring and rotary drilling machines. The correlations between the
penetration rates and the values of rock fracture toughness are also compared with those
derived from the values of conventional Uniaxial Compressive Strength (UCS) and the
Brazilian tensile strength.

TABLE OF CONTENTS
(vii)
TABLE
CHAPTER TITLE PAGE
Title Page (i)
Declaration (ii)
Acknowledgement (iii)
Abstract (iv)
Table of Contents (vii)
List of Figures (x)
List of Tables (xv)
Notation ( xvi)
1 INTRODUCTION 1-1
2 ROCK CUTTING MECHANICS - A REVIEW 2-1 2.1 Introduction 2-1 2.2 Fracture by Indenters 2-3
2.2.1 Fracture by Wedge Indenters 2-3 2.2.2 Fracture by Stamps 2-8
2.2.3 Fracture by Spherical Indenters 2-9 2.2.4 Fracture by Sharp Indenters(Point Load) 2-11
2.2.5 The application of Finite Element Methods on Indentation Studies 2-12
2.3 Fracture by Drag Picks 2-14
2.4 Fracture by Disc Cutters 2-19 2.5 Summary 2-21
3 LINEAR ELASTIC CRACK TIP MODELLING BY THE DISPLACEMENT DISCONTINUITY METHOD 3-1

(viii)
CHAPTER TITLE PAGE
3.1 Introduction 3-1
3.2 Crack Tip Singularity 3-3
3.3 Solutions of the Papkovitch Functions 3-4
3.4 Crack Tip Element 3-8
3.5 Theories on Crack Propagation 3-11
3.6 Evaluation of Strain Energy Release Rate 3-13
3.7 Evaluation of KT, KJJ Using Displacement
Correlation Technique 3-18
3.8 Summary 3-20
4 CRACK BEHAVIOUR DUE TO DRAG PICKS 4-1
4.1 Introduction 4-1
4.2 Experimental Apparatus 4-2
4.3 Preliminary Experiments 4-4
4.4 Effects of Cutting Rake Angle 4-5
4.5 Effects of Cutting Tool Bluntness 4-9
4.6 Summary 4-13
5 CRACK BEHAVIOUR DUE TO BI-INDENTERS 5-1
5.1 Introduction 5-1
5.2 Experimental Apparatus and Preliminary Tests 5-2
5.3 Effects of Spacing in Bi-Indenters 5-4
5.4 Implication of the Concept for Disc Rock Cutting Design 5-6
5.5 Summary 5-8
6 ROCK FRACTURE TOUGHNESS DETERMINATION BY THE BRAZILIAN TEST 6-1
6.1 Introduction 6-1
6.2 Stress Distribution in a Disc Due to Diametral
Compression 6-2
6.3 Stress Intensity Factor and Fracture Toughness 6-3
(ix)
CHAPTER TITLE PAGE
6.4 Numerical Evaluation of Dimensionless Stress
Intensity Factor Coefficient 6-5
6.5 Application of the Brazilian Test for the Determination
of Rock Fracture Toughness K J C 6-7
6.6 Comparison with the Results of the Chevron Tests 6-9
6.7 Summary 6-12
7 ROCK FRACTURE TOUGHNESS AS A PARAMETER
FOR PREDICTION OF DRILLING PERFORMANCE 7-1
7.1 Introduction 7-2
7.2 Rock Fracture Toughness, U C S and Brazilian
Tensile Strength 7-3
7.3 Tests on Diamond Coring Machine 7-4
7.4 Tests on Rotary Drilling Machine 7-5
7.5 Evaluations and Discussion on the Results
of the Tests 7-6
7.6 Summary 7-7
8 SUMMARY AND CONCLUSIONS 8-1
REFERENCES R-l

LIST OF FIGURES
(x)
LIST OF FIGURES
FIGURE TITLE PAGE
2.1 Sequence of rock failure and crater formation in percussive drilling 2-25
2.2 Model for wedge penetrating 2-25
2.3 Theoretical relations for Evans-Murrell model 2-26
2.4 Blunt wedge-penetration model 2-26
2.5 Fracture patterns due to wedge indentation 2-27
2.6 Simplified force system in percussive drilling 2-27
2.7 Crater formation by shear failure 2-28
2.8 Brittle crater model 2-28
2.9 Theoretical force-penetration curve for brittle crater model 2-29
2.10 Schematic representation of rock failure mechanism under stamp indentation 2-29
2.11 Normalized stamp-load bearing strength 2-30
2.12 Evolution of the Hertzian crack during spherical indentation 2-30
2.13 The critical load for Hertzian crack on Soda-Lime glass as function of radius of steel sphere indenter 2-31
2.14 The critical cracking load as a function of indenter radius for the four carbide 2-31
2.15 Evolution of the median and lateral crack during sharp indenter loading 2-32
2-16 The fracture mechanics model for the median crack due to point load 2-32
2.17 Data from well-behaved median cracks in soda-lime glass indentation with Vickers pyramid 2-33
2.18 Drag pick cutting sequence 2-33
2.19 Drag pick force-displacement curves 2-34
2.20 Evans's tensile cutting model 2-34
2.21 Potts and Shuttleworth's shear cutting model 2-35
(xi)
FIGURE TITLE PAGE
2.22 Nishimatsu's shear cutting model 2-35
2.23 The predicted crack paths due to rock cutting in two loading conditions 2-36
2.24 Effect of spacing of cuts on vertical force at a fixed cutter penetration of 0.10 inches 2-37
2.25 Side view of stress trajectories of principal stress O n and 033 in
two-point stress field 2-38
2.26 Contours of principal stresses 2-38
3.1 Crack tip coordinate system 3-22
3.2 Crack tip element 3-22
3.3 Numerical and analytical solutions of crack opening displacement distribution 3-23
3.4 Numerical values of normalized strain energy 3-23
3.5 Crack incremental growth 3-24
3.6 Angled crack under tension 3-24
3.7 Arc' crack under biaxial tension 3-25
3.8 Variation of normalized G to intiation angle 0 3-25
3.9 Computing flowchart for numerical crack modelling 3-26
3.10 Prediction path of crack propagation 3-27
3.11 Displacement correlation method 3-29
3.12 Predicted crack paths 3-30
3.13 Stress concentrations as crack grow in length 3-30
4.1 Rake angle influence on cutting forces 4-15
4.2 Evans's experimenal observation 4-15
4.3 Rock cutting simulation rig 4-16
4.4 Force system and parameters involved in cutting 4-17

(xii)
FIGURE TITLE PAGE
4.5 Calibration results for axial and bending forces 4-18
4.6 Typical progressive failure stages on concrete 4-20
4.7 Typical progressive failure stages on sandstone 4-22
4.8 Simplified diagram of drag pick cutting action for major chip formation 4-22
4.9 Boundary condition of numerical cutting model 4-23
4.10 Predicted crack paths due to drag picks 4-24
4.11 Normalized stress concentrations at crack tips 4-24
4.12 Fragments produced on sandstone specimens 4-25
4.13 Fragments produced on concrete specimens 4-25
4.14 Craters formed on concrete specimens 4-26
4.15 Craters formed on sandstone specimens 4-27
4.16 Effects of attack and rake angle on cutting related forces 4-29
4.17 Effects of bluntness 4-30
4.18 Numerical model for bluntness analyses 4-31
4.19 Predicted crack paths due to cutting 4-32
4.20 Normalized stress concentrations at crack tips 4-32
4.21 Sharp (a) and blunt (b) wedge picks used 4-33
4.22 Fragments produced by sharp and blunt picks 4-33
4.23 Drilling test system 4-34
4.24 Drilling parameter signal for sharp bit 4-34
4.25 Drilling parameter signal for blunt bit 4-35
5.1 Bi-Indenters used 5-10
5.2 Test system for Bi-Indenters tests 5-10
5.3 Crack patterns due to single indenter 5-11
5.4 Crack patterns due to Bi-Indenters 5-12
(xiii)
F I G U R E T I T L E P A G E
5.5 Assumed failure conditions under indenter 5-13
5.6 Computing model for single indenter 5-14
5.7 Computing model for Bi-Indenters 5-15
5.8 Predicted primary crack propagation for indenter 5-16
5.9 Predicted primary crack propagation for Bi-Indenters 5-16
5.10 Normalized maximum tensile stresses at crack tips for Bi-Indenters 5-17
5.11 An idea to form a wedge shaped fragment between two Bi-Indenters 5-17
5.12 Experimental observations on interaction between two Bi-Indenters 5-20
5.13 A concept of hybrid rock cutting system 5-21
6.1 Disc with diametral compression and basic notation 6-13
6.2 Dimensionless stresses CTQ for different a 6-13
6.3 Crack loaded by remote tension 6-14
6.4 Calculated dimensionless stress intensity factors for different a 6-14
6.5 Schematic diametral load versus crack length curve for diametral crack propagation in the disc with diametral compression 6-15
6.6 Schematic diametral load versus deformation curve for the disc with diametral compression 6-15
6.7 Dimensionless stress intensity factor for the diametral crack in Brazilian test condition 6-16
6.8 Testing system for Brazilian test 6-16
6.9 The fractured specimens after Brazilian tests 6-17
6.10 One of the typical failure curve (diametral load versus deformation) from Brazilian tests 6-17
6.11 Typical graphic results from Brazilian teats for each rock 6-18
6.12 Chevron bend specimens with bend test fixture and basic notation 6-18
6.13 Testing system for Chevron test 6-19

(xiv)
FIGURE TITLE PAGE
6.14 Typical diamentral load versus displacement curves for Brazilian test 6-20
7.1 Comparison between rock fracture toughness and U C S , and Brazilian tensile strength 7-10
7.2 Diamond coring test system 7-11
7.3 Correlations between penetration rate of diamond coring and toughness, and other properties 7-13
7.4 Rotary drilling test system 7-14
7.5 Correlations between penetration rate of rotary drilling and toughness, and other properties 7-16

LIST OF TABLES
(XV)
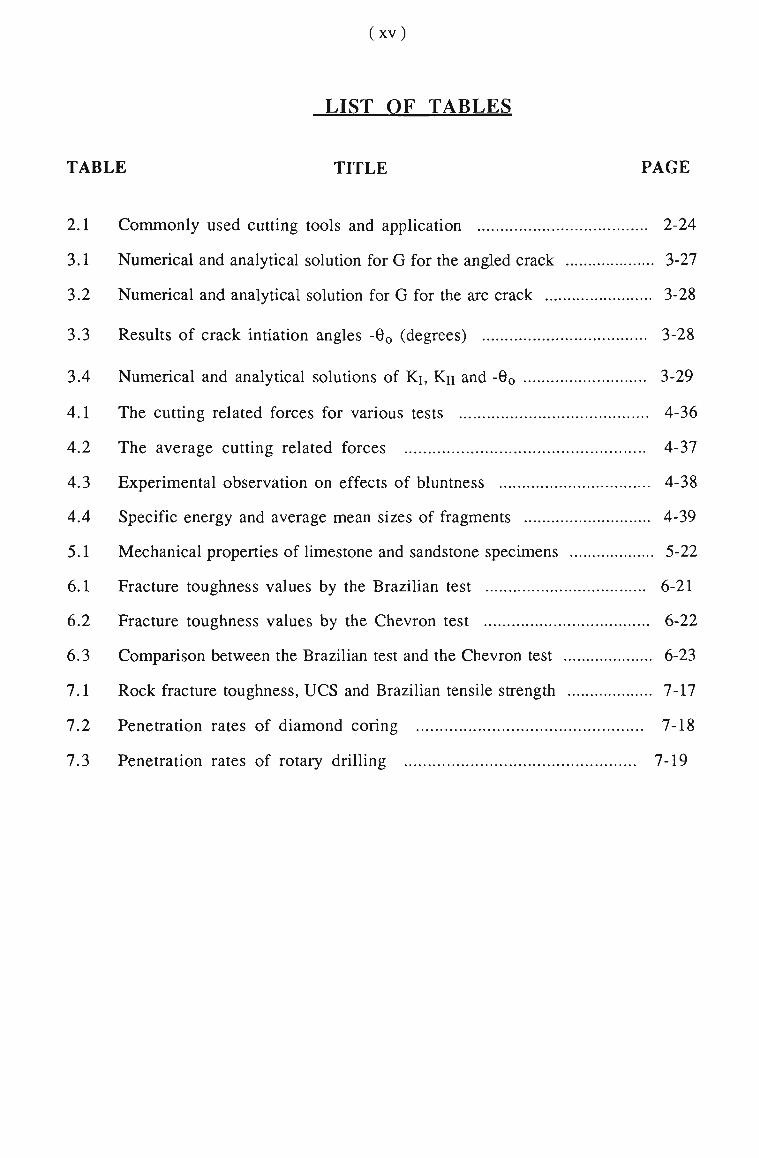
LIST OF TABLES
TABLE TITLE PAGE
2.1 Commonly used cutting tools and application 2-24
3.1 Numerical and analytical solution for G for the angled crack 3-27
3.2 Numerical and analytical solution for G for the arc crack 3-28
3.3 Results of crack intiation angles -0o (degrees) 3-28
3.4 Numerical and analytical solutions of Ki, Kn and -0O 3-29
4.1 The cutting related forces for various tests 4-36
4.2 The average cutting related forces 4-37
4.3 Experimental observation on effects of bluntness 4-38
4.4 Specific energy and average mean sizes of fragments 4-39
5.1 Mechanical properties of limestone and sandstone specimens 5-22
6.1 Fracture toughness values by the Brazilian test 6-21
6.2 Fracture toughness values by the Chevron test 6-22
6.3 Comparison between the Brazilian test and the Chevron test 6-23
7.1 Rock fracture toughness, UCS and Brazilian tensile strength 7-17
7.2 Penetration rates of diamond coring 7-18
7.3 Penetration rates of rotary drilling 7-19
(xvi)
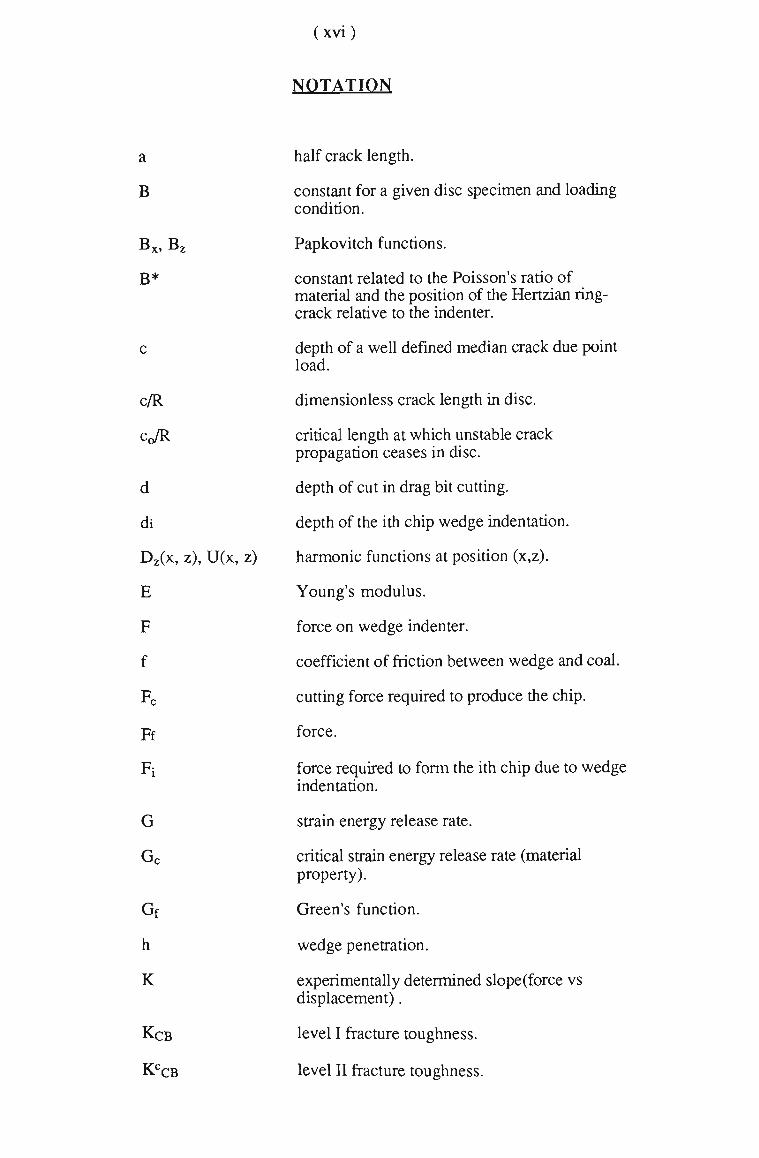
a half crack length.
B constant for a given disc specimen and loading condition.
Bx, Bz Papkovitch functions.
B* constant related to the Poisson's ratio of material and the position of the Hertzian ring-crack relative to the indenter.
c depth of a well defined median crack due point load.
c/R dimensionless crack length in disc.
CQ/R critical length at which unstable crack propagation ceases in disc.
d depth of cut in drag bit cutting.
di depth of the ith chip wedge indentation.
Dz(x, z), U(x, z) harmonic functions at position (x,z).
E Young's modulus.
F force on wedge indenter.
f coefficient of friction between wedge and coal.
Fc cutting force required to produce the chip.
Ff force.
Fi force required to form the ith chip due to wedge indentation.
G strain energy release rate.
Gc critical strain energy release rate (material property).
Gf Green's function.
h wedge penetration.
K experimentally determined slope(force vs displacement).
KCB level I fracture toughness.
KCCB level II fracture toughness.
(xvii)
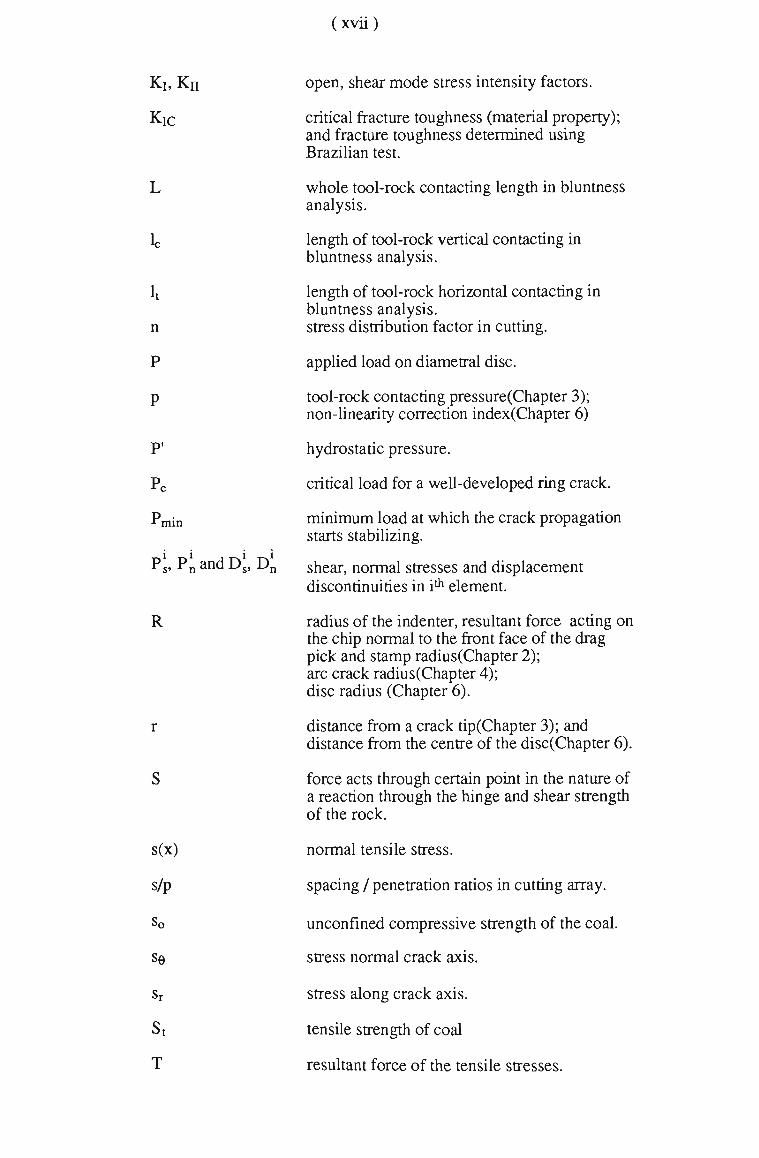
Kj, KJJ open, shear m o d e stress intensity factors.
Kic critical fracture toughness (material property); and fracture toughness determined using Brazilian test.
L whole tool-rock contacting length in bluntness analysis.
lc length of tool-rock vertical contacting in bluntness analysis.
lt length of tool-rock horizontal contacting in bluntness analysis.
n stress distribution factor in cutting.
P applied load on diametral disc.
p tool-rock contacting pressure(Chapter 3); non-linearity correction index(Chapter 6)
P' hydrostatic pressure.
Pc critical load for a well-developed ring crack.
Pmin minimum load at which the crack propagation starts stabilizing.
ki
Ps, P n and Ds, D n shear, normal stresses and displacement discontinuities in i^ element.
R radius of the indenter, resultant force acting on the chip normal to the front face of the drag pick and stamp radius(Chapter 2); arc crack radius(Chapter 4); disc radius (Chapter 6).
r distance from a crack tip(Chapter 3); and distance from the centre of the disc(Chapter 6).
S force acts through certain point in the nature of a reaction through the hinge and shear strength of the rock.
s(x) normal tensile stress.
s/p spacing / penetration ratios in cutting array.
so unconfined compressive strength of the coal.
se stress normal crack axis.
sr stress along crack axis.
St tensile strength of coal
T resultant force of the tensile stresses.
(xviii)
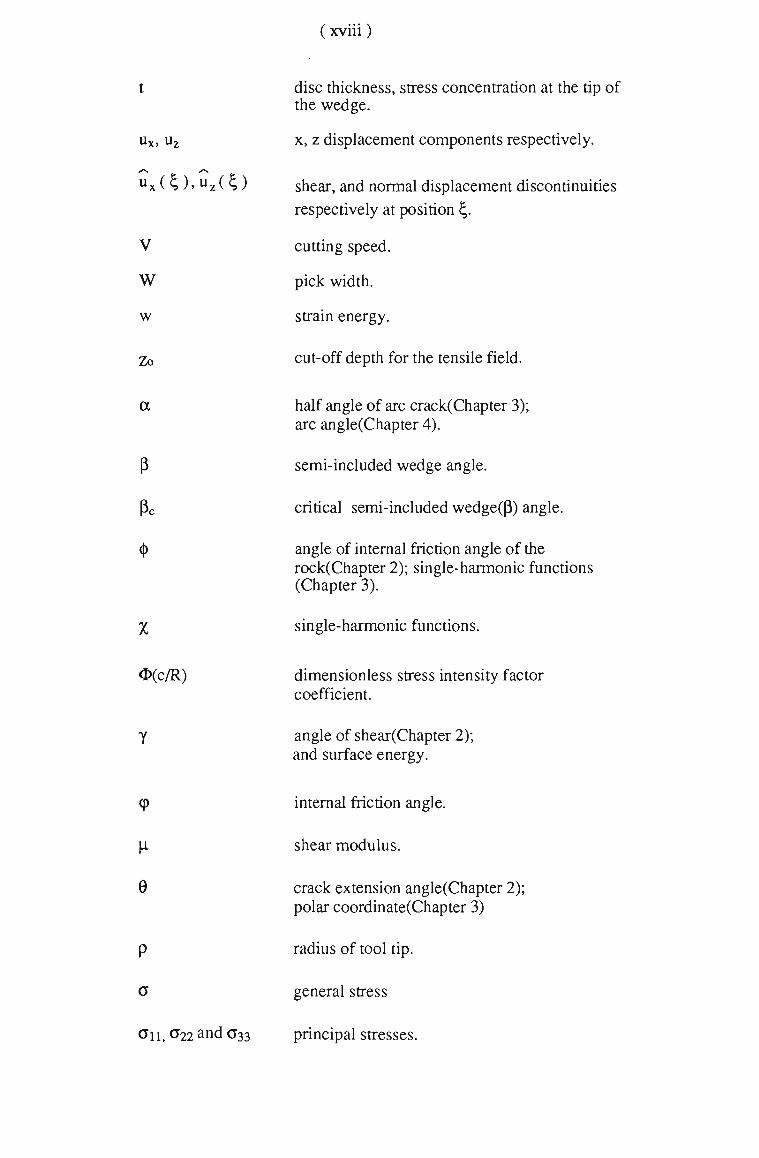
t disc thickness, stress concentration at the tip of the wedge.
ux, uz x, z displacement components respectively.
ux(s)>uz(s) shear, and normal displacement discontinuities
respectively at position \.
V cutting speed.
W pick width.
w strain energy.
Zo cut-off depth for the tensile field.
a half angle of arc crack(Chapter 3); arc angle(Chapter 4).
P semi-included wedge angle.
(3C critical semi-included wedge(P) angle.
<)) angle of internal friction angle of the rock(Chapter 2); single-harmonic functions (Chapter 3).
X single-harmonic functions.
0(c/R) dimensionless stress intensity factor coefficient.
Y angle of shear(Chapter 2); and surface energy.
(p internal friction angle.
LL shear modulus.
0 crack extension angle(Chapter 2); polar coordinate(Chapter 3)
p radius of tool tip.
o general stress
0"n, <*22 and °33 principal stresses.
(xix)
<*xx> CJZZ, a x z x, z stress components respectively, and corresponding shear stress.
T friction angle between the pick and rock, and shear stress(Chapter 2).
v Poisson's ratio.
V dVdxl + dydz*.
\t/ crack inclination to tensile stress direction.

CHAPTER ONE
INTRODUCTION
Chapter 1 Introduction and Objectives 1-1
CHAPTER 1
INTRODUCTION
The most important changes in rock and coal cutting technology over the past two decades
have been made in response to the increasing demand for high excavating (or production)
rates. Heavier and more powerful machines have been the direct results of these response.
A good example of this trend is in longwall mining. The development and use of large
longwall machinery has been motivated by two basic needs, the need to increase longwall
output and the need to improve the rate of gateroad development. In Australia, the commonly
used longwall shearers have motor sizes ranging between 230 kW and 500 kW. A double-
ended-ranging drum shearer is capable of excavating coal at a rate approaching 1500t / h. In
the USA, the 1988 statistics show that the average power of the present day longwall shearer
has exceeded 370 kW (Stein and Martin, 1988). The current generation of continuous miners
for gateroad development have motor sizes ranging between 200 kW and 500 kW and are
capable of excavating at an instantaneous cutting rate of more than 15 t / min..
In underground coal mines, where drivages need to be made in rock, the most commonly
applied machines are the roadheaders. Roadheaders have installed powers, ranging from 45
kW for a light duty machine, to 400 kW for a heavy duty machine and are capable of
excavating at a rate approaching 20 m3 / h. Roadheaders are designed in such a way that
much of the available power is concentrated into a relatively small cutting head, thus enabling
the machine to cut relatively harder rock.
The changes made to the Full-Face Tunnelling Boring Machine (TBM) have been attributed
the demand to excavate in hard rock. Rock such as igneous and metamorphic rocks are
characterized by both relatively higher mechanical strength and abrasiveness than the coal
measure rocks for which that the TBM was designed originally. Boring in such hard rocks
Chapter 1 Introduction and Objectives 1 -2
usually has low cutter penetrations even at high cutter loads, and moderate to low disc cutter
life. Because of the difficulty of boring in hard rock, both the machines and cutters must be
designed for maximum cutter loads. The present day TBM is capable of delivering greater
thrust than before, for example, the average power per machine diameter of Robbins TBM
has increased from 60 kW/m in 1960-1964 to 169 kW/min 1980-1983, and the average
disc cutter diameter has increased from 28 cm to 39 and 43 cm over the same time periods
(Ozdemir and Dollinger, 1984).
Whereas the excavation rates of modern cutting machines have been greatly improved
mainly because the development of more powerful machinery, the understanding of the basic
mechanism of rock cutting is relatively poor, despite the fact that a considerable amount of
experimentation has been carried out to provide guidelines for the design of cutting heads.
The progress of research into rock cutting mechanisms has lagged behind the requirement
for the scientific design for efficient and effective cutting processes. The present designs
have been based on experimental or empirical guidelines only. A better understanding of
basic cutting mechanism will permit a more scientific approach for the design of cutting
heads.
In the past two decade, some radical changes in rock cutting technology has been introduced.
Probably, one of the most promising developments has been in low-pressure water-jet
assisted rock cutting. Laboratory studies have shown that faster cutting and slower cutting
tool wear with reduced cutting load requirements follow from using low pressure water jets.
The potential of water-jet assisted cutting has been realized. The improvements in the cutting
performance have been widely observed in laboratories for hard, abrasive rocks. In
particular, the use of water jets has been demonstrated to give a faster cutting rate, a slower
cutting tool wear, and to reduce cutting load requirement. However, the existing
experimental data have been gathered from cutting tests carried out on a variety of rock,
using cutting tools with various geometries, and employing a variety of jet/tool
configurations. Most of the laboratory studies have been found to concentrate on the effects
Chapter 1 Introduction and Objectives 1-3
of individual parameters such as jet pressure and cutting speed, and have ignored the
interactions which might occur among the parameters. N o systematical theory has yet been
developed sufficiently to explain the observed experimental behaviour. The proposed
various hypotheses for the water-jet assisted mechanism have been found to be contradictory
(Geier, Hood and Thimons, 1987). Commercial development of this technology is greatly
hindered by the lack of understanding of the water-jet assistance mechanism, not only
because design parameters such as jet position and pressure cannot be optimized via a
quantitative theory, but also there is no way of knowing which parameters to consider in the
empirical optimization studies. A n economically accepted design of water-jet assisted cutting
systems calls for a fundamental investigation of the assistance mechanism; and a clear
understanding of the basic cutting mechanism (without water jets) will lead to the solution of
the problem.
The powerful rock cutting machines, which were designed for increased productivity, have
also increased the level of respirable dust concentration in mines. The generation of the
respirable dust during various cutting processes may lead to the incidence of coal workers'
pneumoconiosis. From 1970 to 1980, the U S Federal government has paid over $11.76
billion in compensation to more than 470,000 miners with coal workers pneumoconiosis and
their survivors (Newmeger, 1981). In addition to this cost, the poor environment due to
respirable dust adds to increased equipment wear and decreased operator productivity. Dust
control techniques such as water sprays and dust collectors are only partially effective, and
require additional equipment expenditures. A better approach would be to reduce respirable
dust at the source, particularly at the cutting heads of the rock cutting machines where the
rock fragmentation processes occur. Improving the fragmentation process by understanding
the mechanisms of rock cutting will not only reduce respirable dust at the face, but also it
will decrease the amount of respirable dust that is liberated during secondary handling. A
reduction of the level of fine dust produced will lead to an improvement in terms of machine
energy utilization, as the rock crushing which produces the fine fragments is the most energy

Chapter 1 Introduction and Objectives 1 -4
intensive process. Research on coal dust formation has taken place for 30 years. Most of the
research has been focused on developing empirical correlations between machine operating
parameters and airborne dust concentrations. Only recently is it that fundamental studies of
coal dust formation have been investigated by studying the basic rock cutting
(fragmentation) mechanism involved (Khair, Reddy and Quinn, 1989, Zipf and Bieniawski,
1989).
In summary, rock cutting machines have been developed to such a state that the fundamental
mechanism of cutting fracture processes can no longer be ignored. The full benefits, such as
improvement in rock cutting efficiency, development of exotic cutting systems, e.g., water-
jet assisted cutting systems, and suppression of respirable dust generation, will arise from a
better understanding of the mechanism of crack formation.
The objective of this thesis is to investigate the basic mechanism of rock fracture due to
cutting. Because of the nature of rock fragmentation in cutting processes, fracture mechanics
principles will be applied to the rock cutting mechanism study. Special attention will be paid
to development of a computer technique for rock fracture modelling which is capable of
predicting both crack initiation and the propagation involved. In addition, research will be
carried out on a few related areas, such as experimental observation of the actual crack
development produced using typical cutting methods, development of a simple methods of
rock fracture toughness determination to support fracture mechanics approach for rock
cutting studies. Direct correlation between rock fracture toughness (an intrinsic rock property
for rock cutting and drilling performance prediction) and drilling machine performance, will
also be investigated. It might be expected that the outcome of the research will provide
additional knowledge to rock cutting mechanics and will provide a modelling technique to
become a practical tool for evaluation and design of future cutting heads.
CHAPTER TWO
ROCK CUTTING MECHANICS A REVIEW
Chapter 2 Rock Cutting Mechanics - A Review 2-1
CHAPTER 2
ROCK CUTTING MECHANICS - A REVIEW
2.1 Introduction
Various types of rock cutting machines are used world wide. The most c o m m o n machines
include roadheaders, tunnel boring machines, raise borers, continuous miners, longwall
shearers and longwall ploughs. The basic operations involved in the associated cutting
processes are to force tools of some kind into rock and to break out fragments of the rock
surface. The tools are mounted in some pattern on cutting heads of the machines. A m o n g
these tools, drag picks, disc cutters, roller cutters and button cutters are most commonly
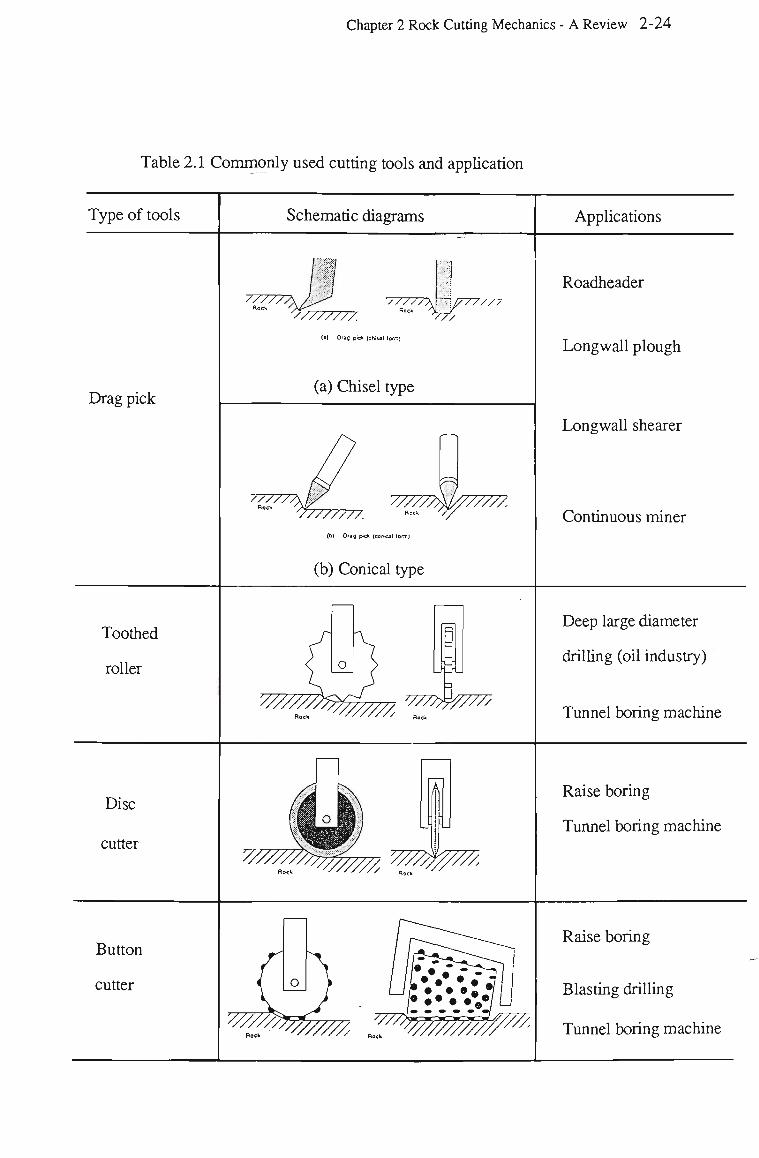
used. The basic forms of these cutters and their applications are shown in Table 2.1.
Reviews on these tools in details are available (e.g., Roxborough, 1986); only brief
descriptions on the major feature of each tool are made here.
Drag picks are the most efficient and versatile cutting tools, basically in chisel and conical
forms. These tools plough into the rock surface, and the rock fragments are formed in front
of them. These tools are assembled on the surface of a rotating cylindrical, conical,
hemispherical drum, or face plate of the cutting machines. The drag picks are essentially
used in coal and soft rock, however, their applications in hard and abrasive rocks are
economically unacceptable due to the high wear rate of the drag picks.
Disc cutters are solid steel discs with a circumferential cutting edge. During operation the
cutting edge is forced into the rock surface, and a superimposed translatory motion causes
the disc to roll along the rock surface. Rock chips form in a lateral direction to the sides of
the disc or between adjoining discs. Disc cutters are designed for application in rocks which
are either too hard or abrasive for drag picks. Disc cutters are generally restricted in use to
circular full face boring situations, such as, tunnel boring, raise boring and shaft boring.
Chapter 2 Rock Cutting Mechanics - A Review 2-2
Roller cutters are similar to disc cutters. However, the circumferential edge of the cutter is
equipped with teeth to combine the advantages of the durability of the disc with the
penetrating ability of the drag pick. A s each tooth penetrates into the rock during rotation of
the cutter, rock fragments are chipped away. The rock cut by toothed roller cutters is
generally weaker than the rock cut by disc cutters. These toothed roller cutters are
extensively used in the oil industry for boring large diameter holes to great depth and has
found further application in tunnel boring.
Button cutters usually take the form of a free rolling cylinder or cone frustum, with their
surface being studded with small tungsten carbide buttons of hemispherical shape. Button
cutters are operated in a similar fashion to disc cutters. However, button cutters are generally
used when the hardness or abrasiveness of the rock is such that heat-treated or hardfaced
alloy steel disc cutters and roller cutters cannot achieve economical excavation. Button cutters
are extensively used in the metalliferous mining industry for drilling large size blast holes
and has also found application in tunnel boring.
A large number of experiments have been done on these cutting tools to understand the basic
mechanism involved and to provide guide-lines for the design. Drag picks and disc cutters
are relatively well studied, whereas roller cutters and button cutters remain less understood
due to several additional variables to be considered.
No matter how complex the cutting tool is, the fragmentation processes can be analysed
basically as one of, or a combination of some fundamental processes. For example, disc
cutter actions are closely related to single indentation and multiple indentation actions, and
the roller cutter action can be treated as a combination of drag pick and disc cutter actions. It
is believed that the fracture (fragmentation) processes involved in indentation, drag pick
cutting and disc cutting are the most important to study.
Chapter 2 Rock Cutting Mechanics - A Review 2-3
2.2 Fracture by Indenters
The actions of indenters with some kind of configuration, such as a wedge and sphere are
closely related to percussive drilling, disc cutting, roller cutting and button cutting. The
fracture processes due to indentation have been extensively studied. It is convenient to
classify them into 'wedge', 'stamp', 'sphere' and 'point load' according to their geometrical
configurations.
2.2.1 Fracture by Wedge Indenters
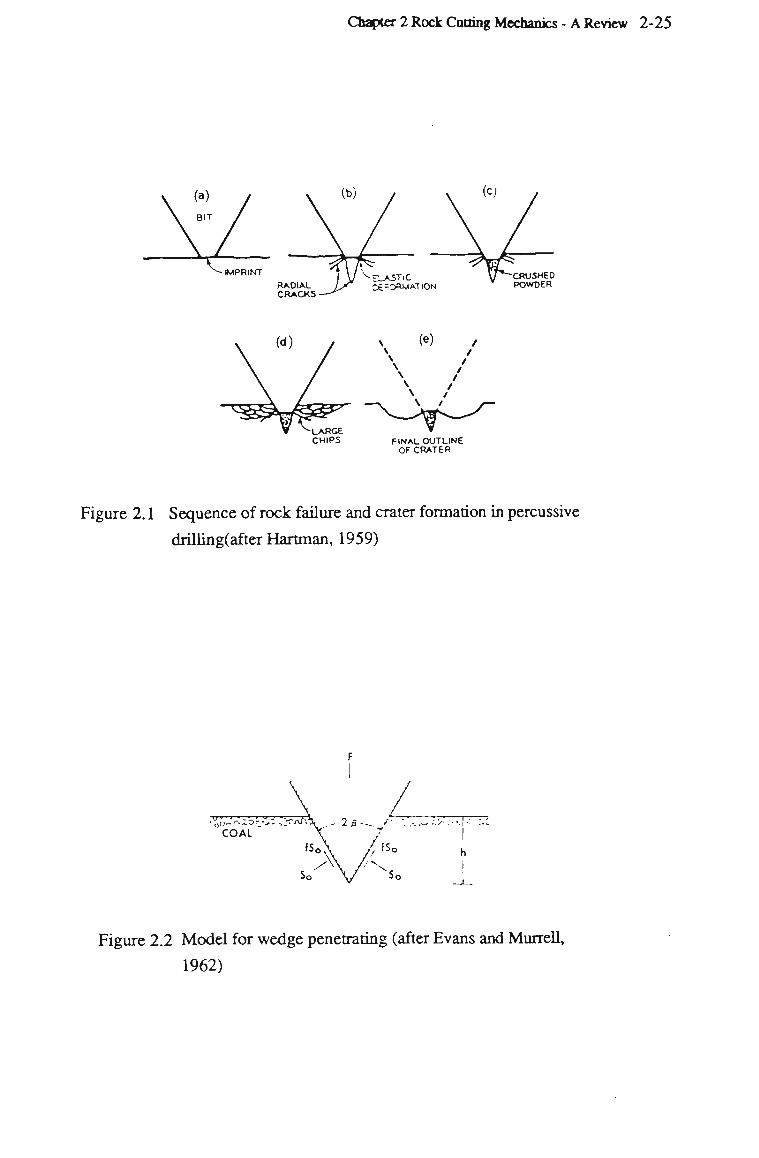
Wedge indentation processes in percussive drilling have been described by Hartman (1959)
and consist of following sequence of events, as shown in Figure 2.1,
1. Crushing of rock surface irregularities
2. Rock elastic deformation
3. Formation of a crushed zone beneath the bit
4. Formation of chips along curved trajectories
5. Repetition of the process
To understand the basic mechanism involved in wedge indentation, many observations have
been undertaken and a few models concerning wedge penetration, surface and subsurface
crack formations have been proposed. The literature related is extensive, and valuable
reviews of the wedge penetration on both elastic-brittle material and plastic material are
available (Maurer, 1967, Sikarskie and Cheatham, 1973). This work deals only with brittle
materials.
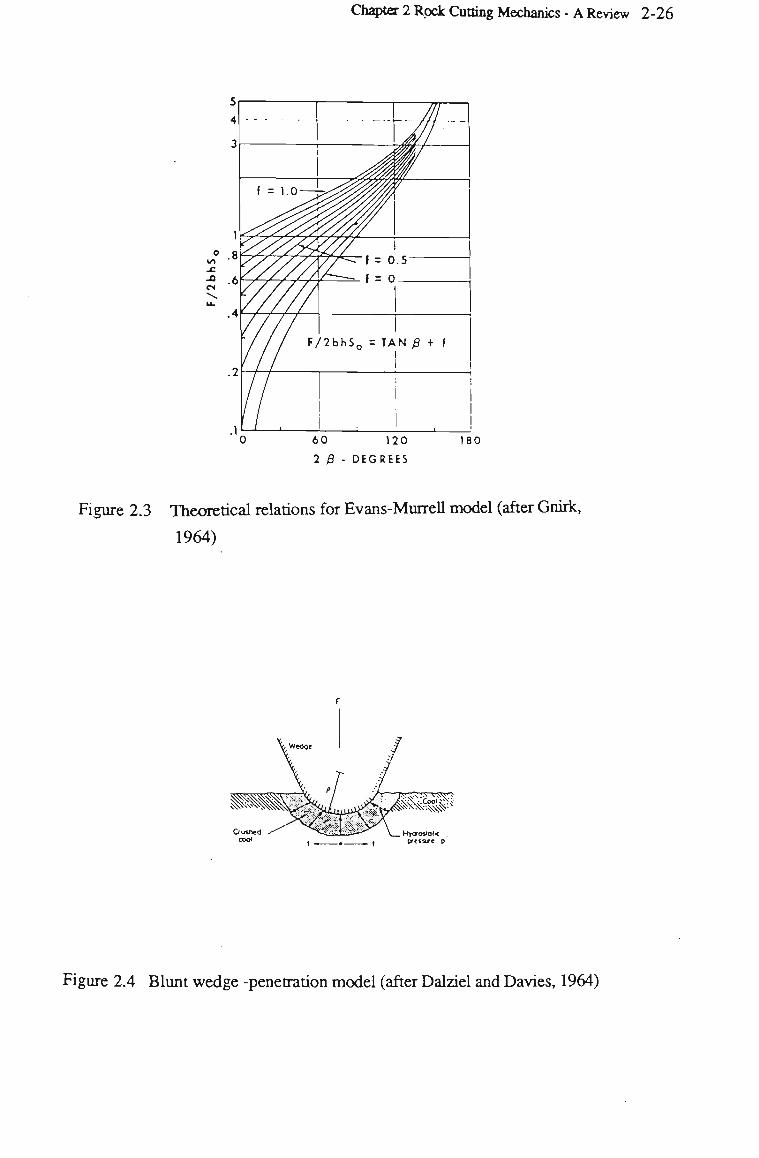
Evans and Murrell (1962) have proposed a model for a wedge penetrating into coal (Figure
2.2). The contact pressure on the wedge is assumed to be equal to the unconfined
compressive strength of coal. The model predicts that the force, F, on the wedge is given by,
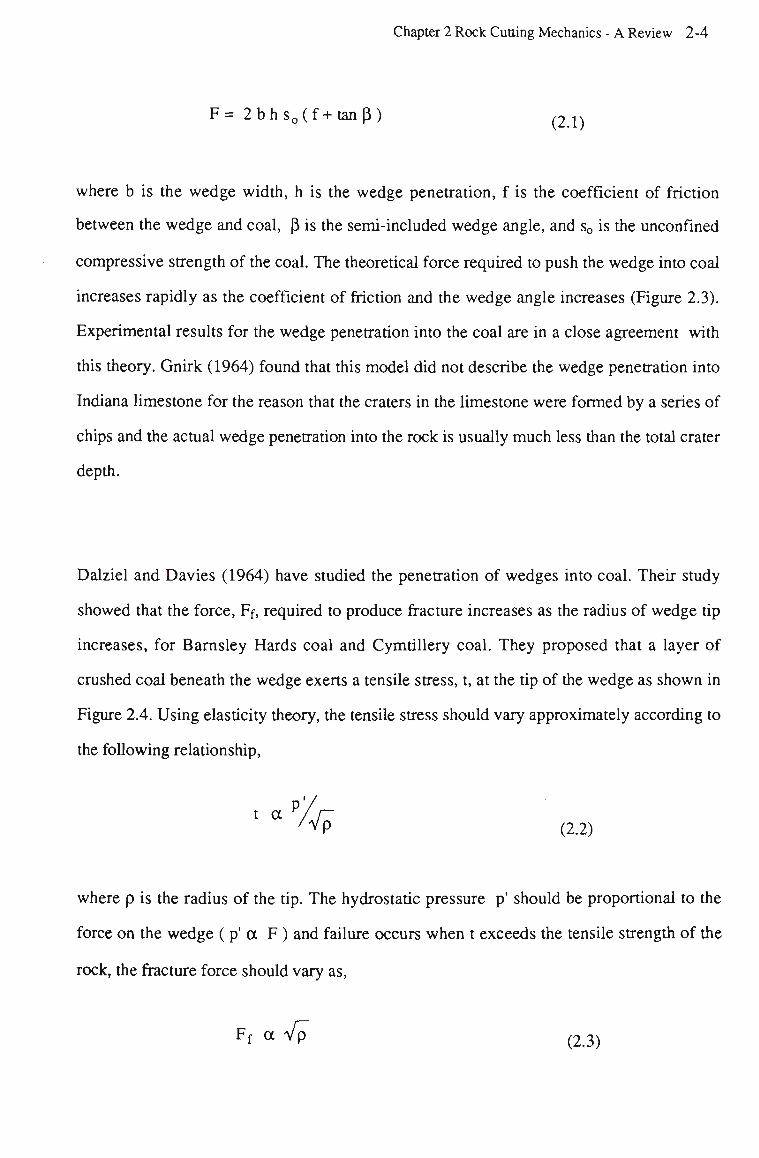
Chapter 2 Rock Cutting Mechanics - A Review 2-4
F = 2 b h s 0 ( f + t a n ( 3 ) ^u
where b is the wedge width, h is the wedge penetration, f is the coefficient of friction
between the wedge and coal, (3 is the semi-included wedge angle, and s0 is the unconfined
compressive strength of the coal. The theoretical force required to push the wedge into coal
increases rapidly as the coefficient of friction and the wedge angle increases (Figure 2.3).
Experimental results for the wedge penetration into the coal are in a close agreement with
this theory. Gnirk (1964) found that this model did not describe the wedge penetration into
Indiana limestone for the reason that the craters in the limestone were formed by a series of
chips and the actual wedge penetration into the rock is usually much less than the total crater
depth.
Dalziel and Davies (1964) have studied the penetration of wedges into coal. Their study
showed that the force, Ff, required to produce fracture increases as the radius of wedge tip
increases, for Barnsley Hards coal and Cymtillery coal. They proposed that a layer of
crushed coal beneath the wedge exerts a tensile stress, t, at the tip of the wedge as shown in
Figure 2.4. Using elasticity theory, the tensile stress should vary approximately according to
the following relationship,
t a P//~ / V P (2.2)
where p is the radius of the tip. The hydrostatic pressure p' should be proportional to the
force on the wedge (p' a F ) and failure occurs when t exceeds the tensile strength of the
rock, the fracture force should vary as,
Ff a Vp (2.3)
Chapter 2 Rock Cutting Mechanics - A Review 2-5
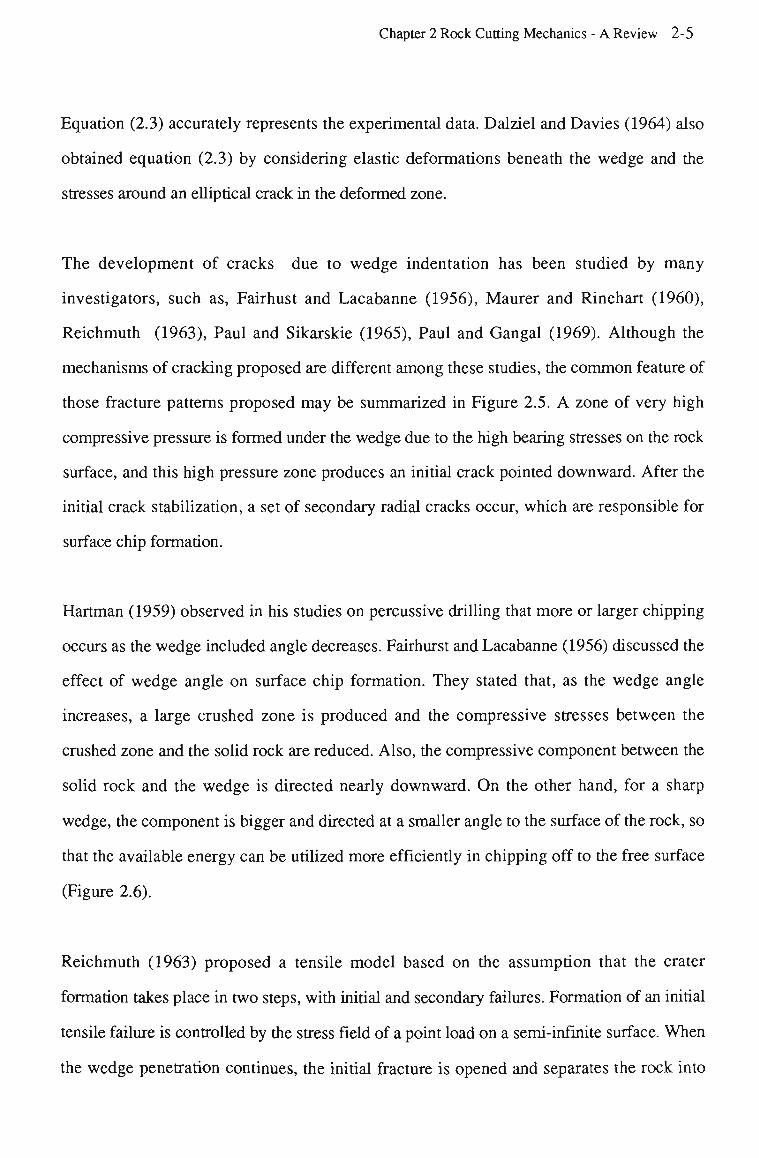
Equation (2.3) accurately represents the experimental data. Dalziel and Davies (1964) also
obtained equation (2.3) by considering elastic deformations beneath the wedge and the
stresses around an elliptical crack in the deformed zone.
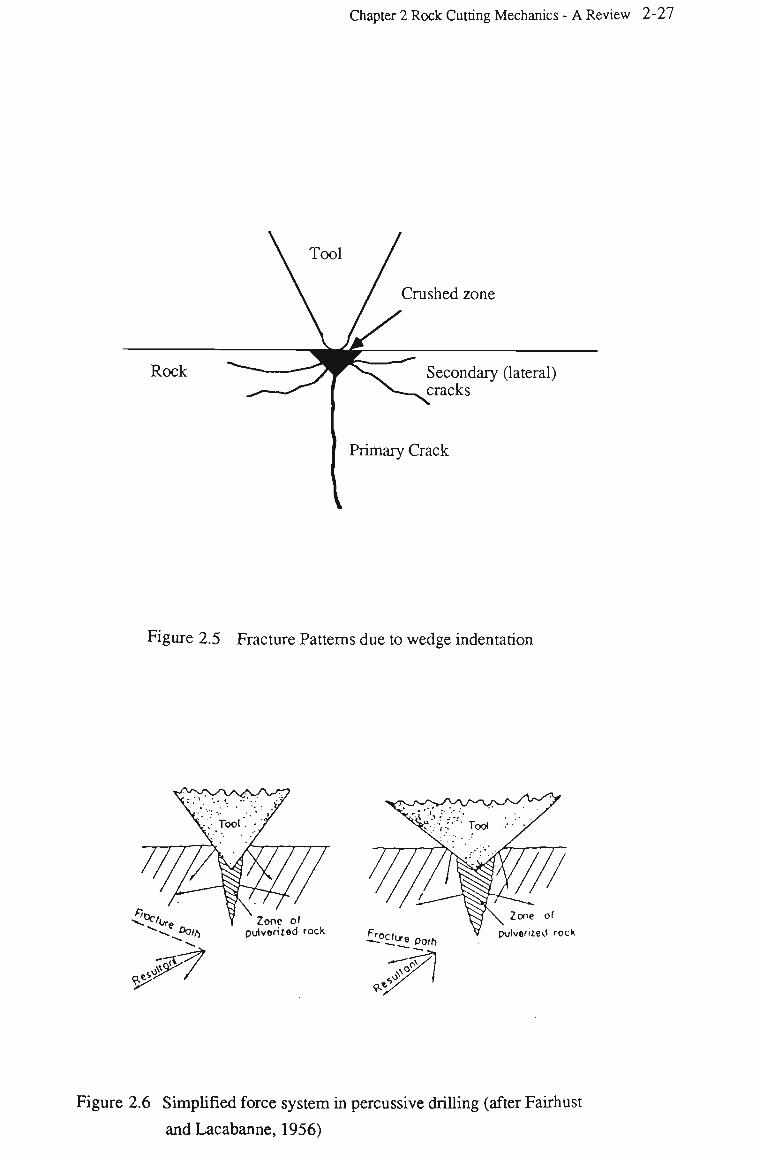
The development of cracks due to wedge indentation has been studied by many
investigators, such as, Fairhust and Lacabanne (1956), Maurer and Rinehart (1960),
Reichmuth (1963), Paul and Sikarskie (1965), Paul and Gangal (1969). Although the
mechanisms of cracking proposed are different among these studies, the common feature of
those fracture patterns proposed may be summarized in Figure 2.5. A zone of very high
compressive pressure is formed under the wedge due to the high bearing stresses on the rock
surface, and this high pressure zone produces an initial crack pointed downward. After the
initial crack stabilization, a set of secondary radial cracks occur, which are responsible for
surface chip formation.
Hartman (1959) observed in his studies on percussive drilling that more or larger chipping
occurs as the wedge included angle decreases. Fairhurst and Lacabanne (1956) discussed the
effect of wedge angle on surface chip formation. They stated that, as the wedge angle
increases, a large crushed zone is produced and the compressive stresses between the
crushed zone and the solid rock are reduced. Also, the compressive component between the
solid rock and the wedge is directed nearly downward. On the other hand, for a sharp
wedge, the component is bigger and directed at a smaller angle to the surface of the rock, so
that the available energy can be utilized more efficiently in chipping off to the free surface
(Figure 2.6).
Reichmuth (1963) proposed a tensile model based on the assumption that the crater
formation takes place in two steps, with initial and secondary failures. Formation of an initial
tensile failure is controlled by the stress field of a point load on a semi-infinite surface. When
the wedge penetration continues, the initial fracture is opened and separates the rock into
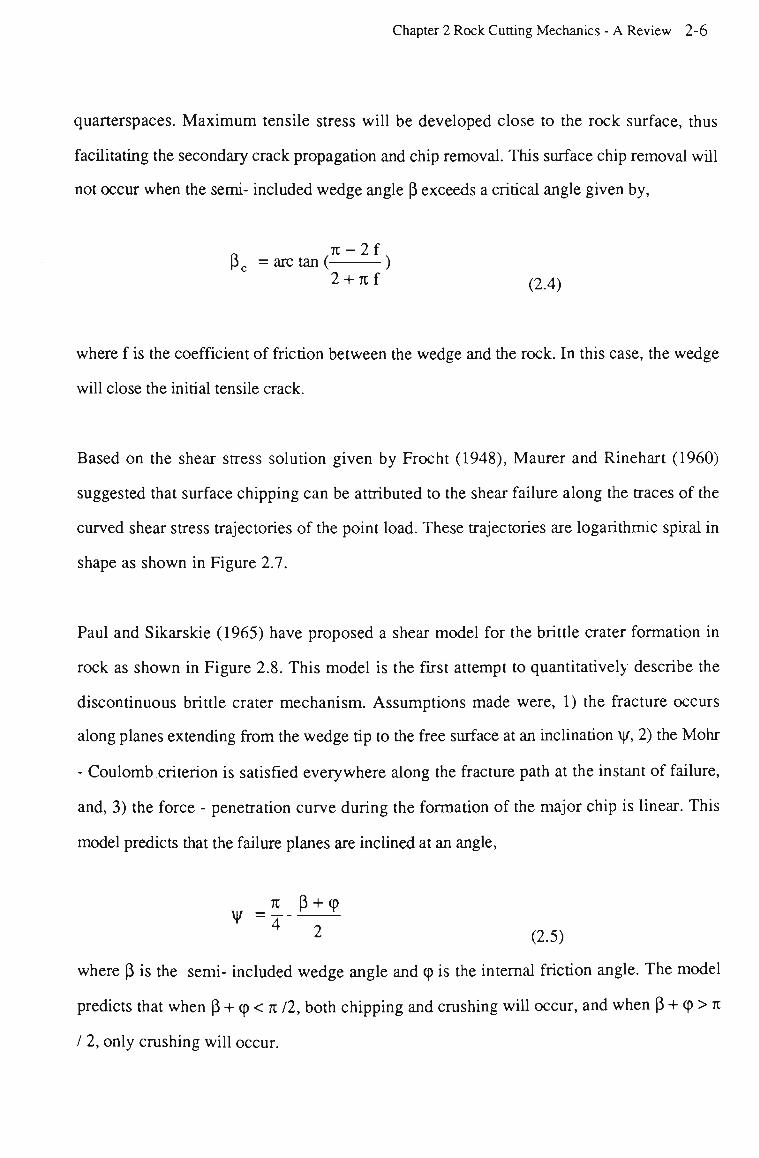
Chapter 2 Rock Cutting Mechanics - A Review 2-6
quarterspaces. M a x i m u m tensile stress will be developed close to the rock surface, thus
facilitating the secondary crack propagation and chip removal. This surface chip removal will
not occur when the semi- included wedge angle P exceeds a critical angle given by,
R , * - 2 f N
p c = arc tan ( ) 2 + K f (2.4)
where f is the coefficient of friction between the wedge and the rock. In this case, the wedge
will close the initial tensile crack.
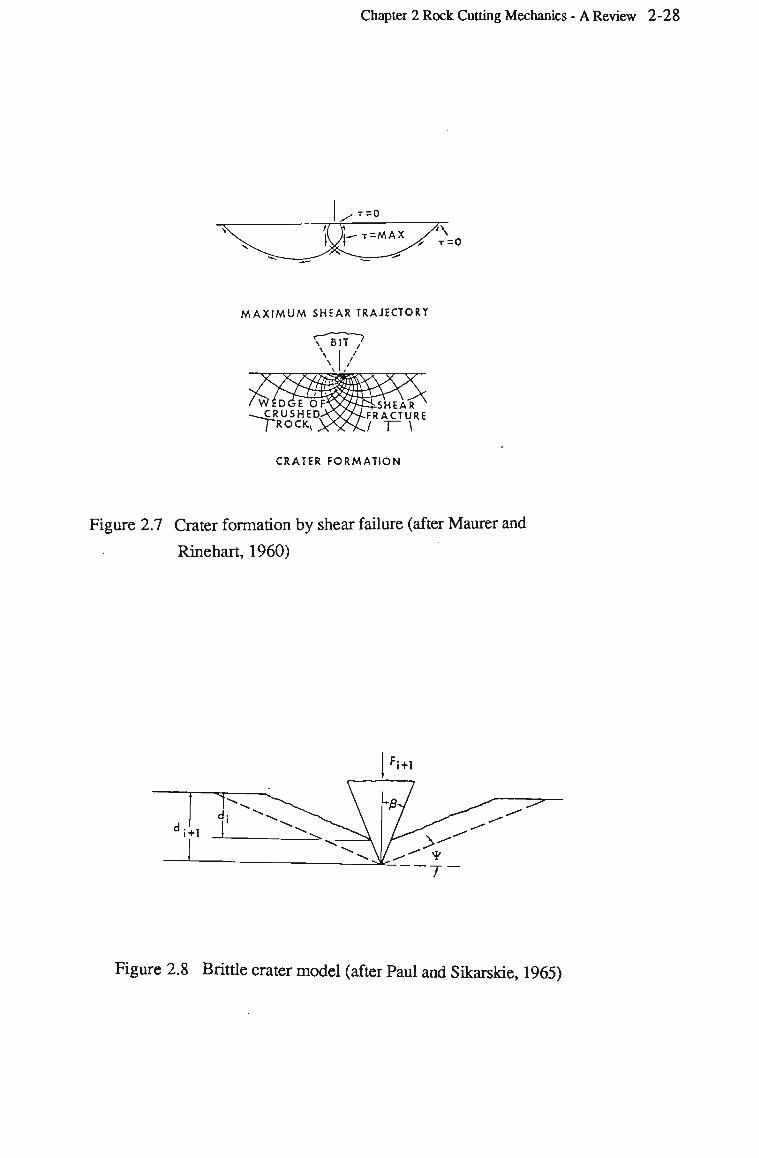
Based on the shear stress solution given by Frocht (1948), Maurer and Rinehart (1960)
suggested that surface chipping can be attributed to the shear failure along the traces of the
curved shear stress trajectories of the point load. These trajectories are logarithmic spiral in
shape as shown in Figure 2.7.
Paul and Sikarskie (1965) have proposed a shear model for the brittle crater formation in
rock as shown in Figure 2.8. This model is the first attempt to quantitatively describe the
discontinuous brittle crater mechanism. Assumptions made were, 1) the fracture occurs
along planes extending from the wedge tip to the free surface at an inclination \|/, 2) the Mohr
- Coulomb criterion is satisfied everywhere along the fracture path at the instant of failure,
and, 3) the force - penetration curve during the formation of the major chip is linear. This
model predicts that the failure planes are inclined at an angle,
7C P + (P
^ =4--r~ 2 (2.5)
where P is the semi- included wedge angle and tp is the internal friction angle. The model
predicts that when P + (p < n 12, both chipping and crushing will occur, and when P + cp > n
12, only crushing will occur.
Chapter 2 Rock Cutting Mechanics - A Review 2-7
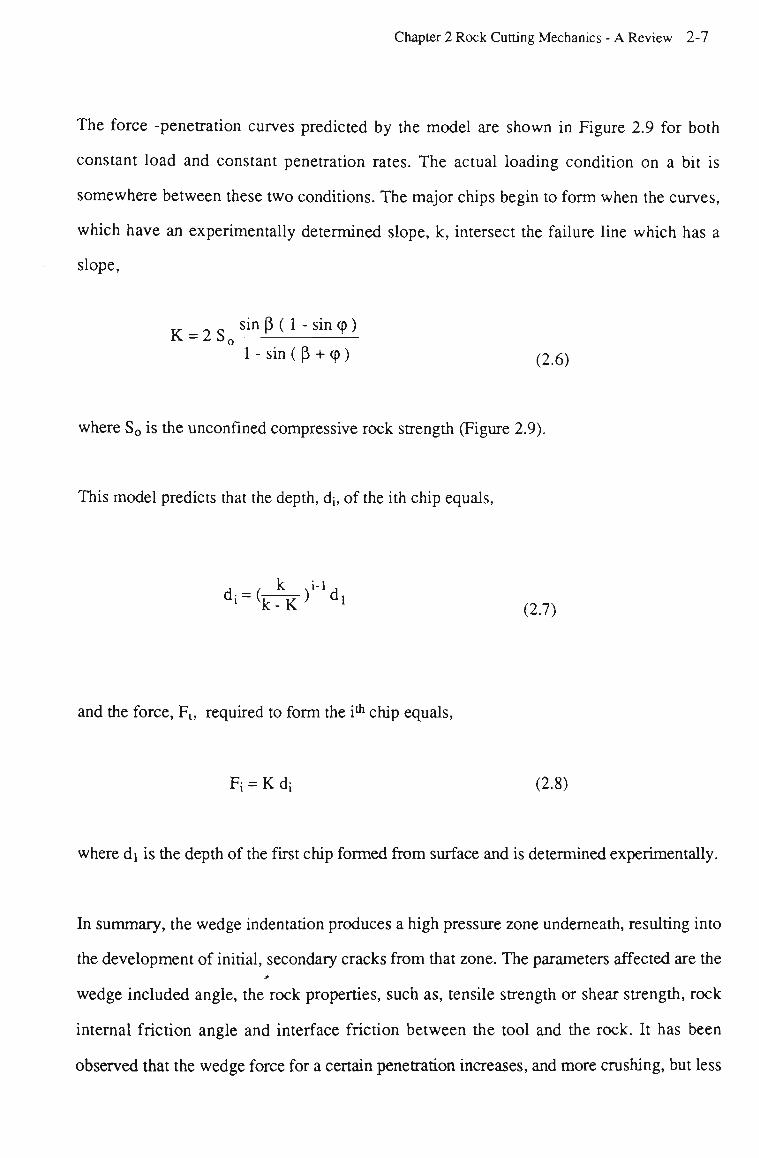
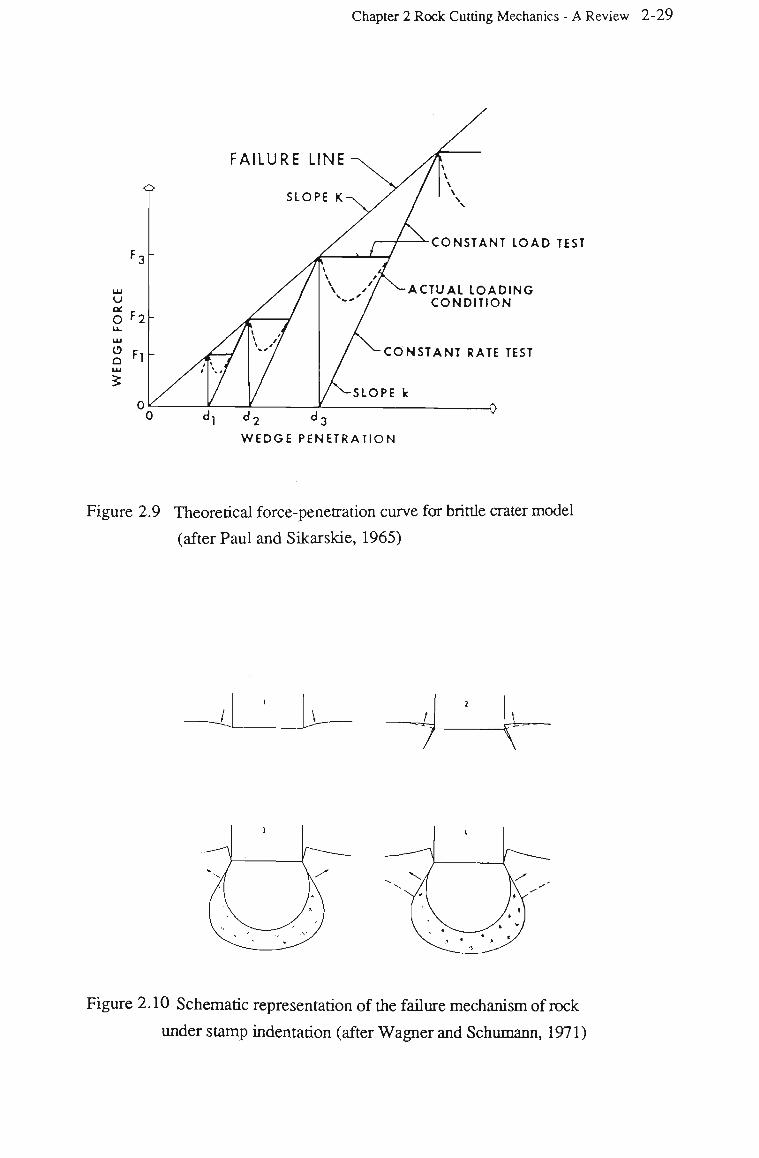
The force -penetration curves predicted by the model are shown in Figure 2.9 for both
constant load and constant penetration rates. The actual loading condition on a bit is
somewhere between these two conditions. The major chips begin to form when the curves,
which have an experimentally determined slope, k, intersect the failure line which has a
slope,
K = 2S sin P ( 1' sin ^ ) 1 - sin ( p + tp) (2>6)
where S 0 is the unconfined compressive rock strength (Figure 2.9).
This model predicts that the depth, d;, of the ith chip equals,
di = ( ^ K , M d l (2.7)
and the force, Ft, required to form the i* chip equals,
Fi = K di (2.8)
where di is the depth of the first chip formed from surface and is determined experimentally.
In summary, the wedge indentation produces a high pressure zone underneath, resulting into
the development of initial, secondary cracks from that zone. The parameters affected are the
wedge included angle, the rock properties, such as, tensile strength or shear strength, rock
internal friction angle and interface friction between the tool and the rock. It has been
observed that the wedge force for a certain penetration increases, and more crushing, but less
Chapter 2 Rock Cutting Mechanics - A Review 2-8
surface chipping occurs when the wedge included angle increases, and vice versa. The mode
of failure (shear or tensile) involved, and the failure (cracking) path need to be justified
through further understanding of the stresses involved.
2.2.2 Fracture by Stamps
In stamp indentation, a circular indenter is pressed into a flat rock surface. The fracture
mechanism has been studied by Wagner and Schumann (1971). The solutions of the three
dimensional stress field induced by an elastic stamp and a rigid stamp derived by Love
(1929) and Sneddon (1946) were used in their analyses. The failure behaviour was
determined by the m a x i m u m and minimum principal stress criterion. The potential failure
zone was predicted, and there was a good agreement between the calculated and the observed
fracture patterns. Based on the study, the failure mechanism of rock under a stamp was
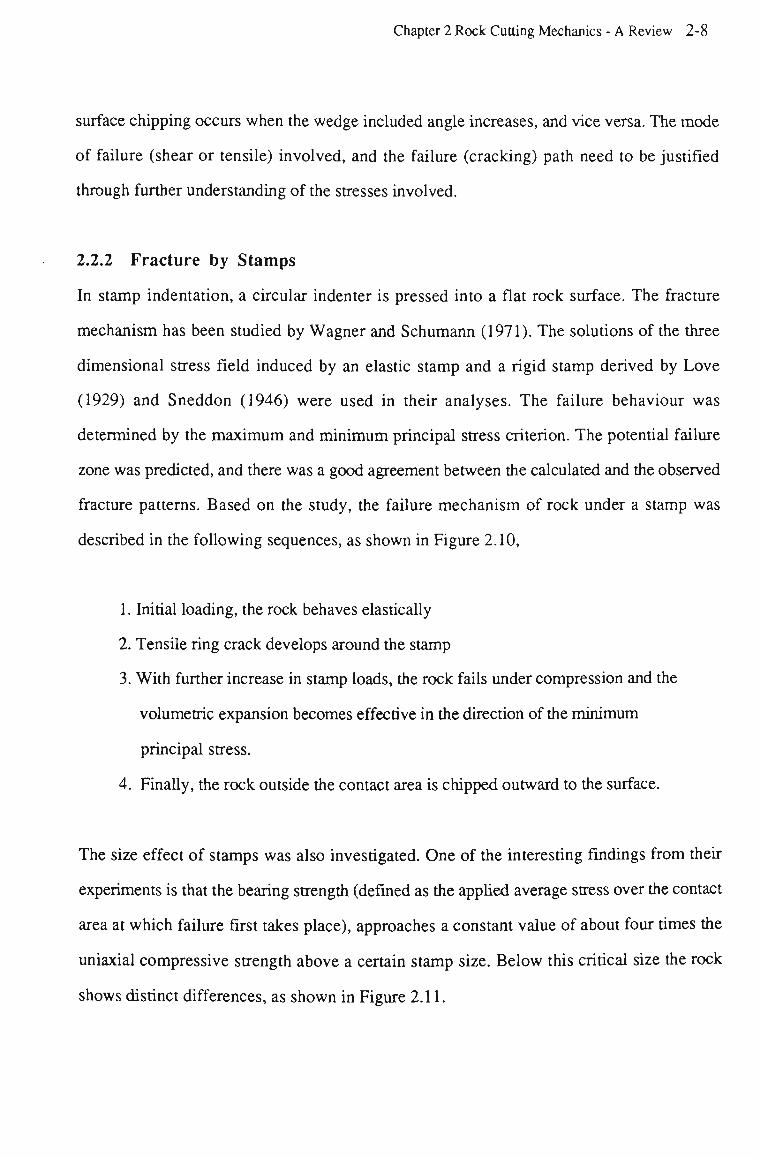
described in the following sequences, as shown in Figure 2.10,
1. Initial loading, the rock behaves elastically
2. Tensile ring crack develops around the stamp
3. With further increase in stamp loads, the rock fails under compression and the
volumetric expansion becomes effective in the direction of the minimum
principal stress.
4. Finally, the rock outside the contact area is chipped outward to the surface.
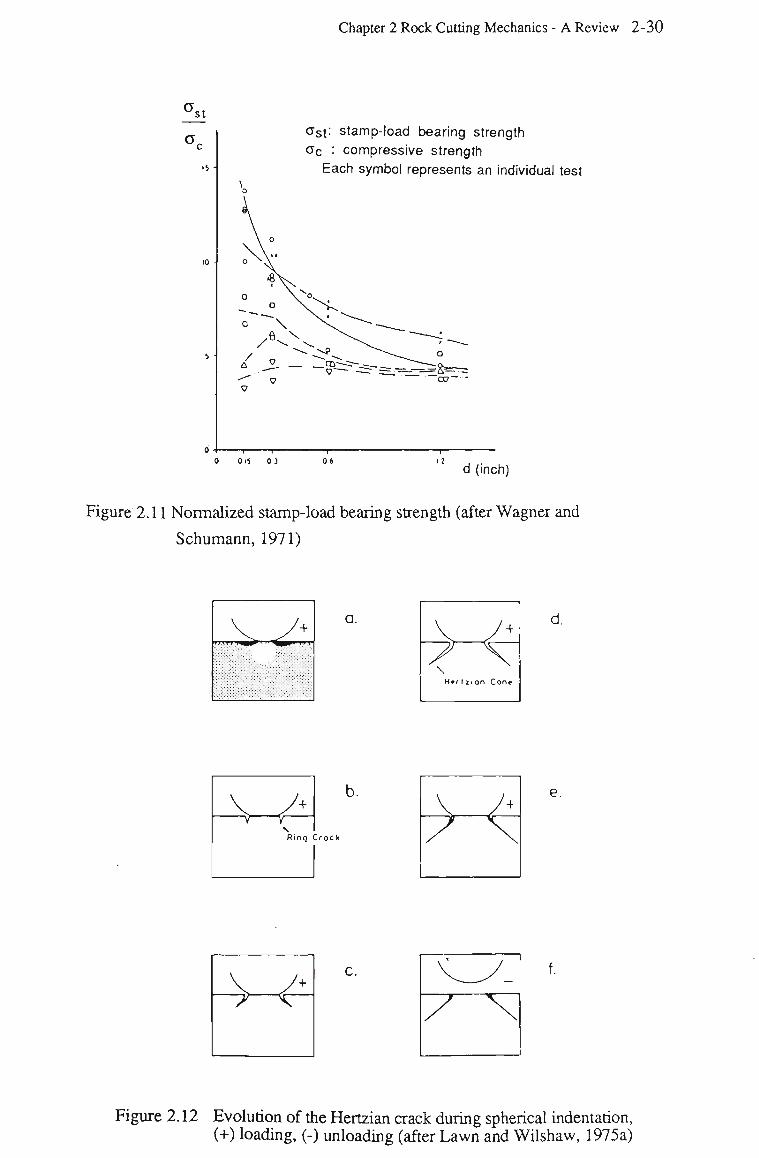
The size effect of stamps was also investigated. One of the interesting findings from their
experiments is that the bearing strength (defined as the applied average stress over the contact
area at which failure first takes place), approaches a constant value of about four times the
uniaxial compressive strength above a certain stamp size. Below this critical size the rock
shows distinct differences, as shown in Figure 2.11.
Chapter 2 Rock Cutting Mechanics - A Review 2-9
Cook, Hood and Tsai (1984) identified similar fracture patterns as those stated above. The
effects of stamp size were investigated on cylindrical specimens of rock confined by a steel
belt. It was found that Sierra granite bearing strength was about 2000 MPa using a 10 mm
diameter stamp, approximately one order of magnitude higher than the uniaxial compressive
strength. The bearing strength was the same for both the 5 mm and the 10 mm diameter
stamps. However, a decrease in this strength of nearly 20% was observed when using a 20
mm stamp.
Wijk (1989) observed that when the stamp radius increases from R = 2 mm to R = 5 mm,
the strength ratio (bearing strength/uniaxial compressive strength) for Lemuda sandstone and
Bohus granite decreases from 12.8 to 9.6 and 11.6 to 8.9 respectively, whereas the strength
ratio for Ekeberg marble remained approximately constant at 10.0.
In summary, the fracture patterns of stamp indentation observed and predicted by the
analytical methods are in a close agreement. Generally, rock exhibits a decrease in the
bearing strength with an increase in the stamp "contact area radius". However, the observed
relations between stamp radius and bearing strength are different from rock to rock ,
requiring further investigation both experimentally and analytically.
2.2.3 Fracture by Spherical Indenters
The case of a smooth spherical indenter loaded on to a flat specimen has been extensively
studied as an elastic contact problem. The first successful attempt for the stress analysis was
that for the Hertzian contact problem.
The fracture due to Hertzian contact has also been studied, the failure sequences being
described as shown in Figure 2.12 (Lawn and Wilshaw, 1975a). As the spherical indenter
contacts the surface, the applied load is distributed over the contact area as compressive
Chapter 2 Rock Cutting Mechanics - A Review 2-10
stresses. Elastic deformation of the material, both at and around the contact area, gives rise to
tensile stresses confined to a shallow 'skin' outside this region immediately blow the
specimen surface. The magnitude of the tensile and compressive stresses increases, as the
contact zone enlarges. When the tensile stresses are sufficiently great, a ring crack in the
sample surface around the indenter is formed. With increase of the load the ring crack grows
in a stable manner into the surface in a direction which is approximately normal to the
principal tensile stress at the crack tip. As loading continues, the stresses reach a condition
whereby the ring crack becomes unstable and spontaneously forms a well-developed
Hertzian cone crack. The penetration depth of the crack is normally limited because the
tensile stresses decreases sharply with depth into the material. The crack continues to
advance into the material in a stable manner until the contact area engulfs the surface ring
crack. This effect results in crack closure and may give rise to secondary crack formation
on unloading. The material attempts to minimize its stored elastic and surface energy by
crack closure and healing.
The load conditions for a well-developed ring crack were studied using fracture mechanics
by Frank and Lawn (1967), Lawn (1968), Warren (1978), and Laugier (1984, 1985). Their
analyses was based on the use of the expressions for the stress intensity factor Ki of an
internal crack due to the principal tensile stress at a crack tip with its length measured along
the crack from the surface. The direction of each crack increment, and consequently the
overall crack path, was determined as the direction normal to the local principal tensile stress.
The results of the analyses well explain the Hertzian crack development sequences and
predict the loading condition for a well-developed ring-crack. The analyses also indicate a
simple way to determine the fracture surface energy or fracture toughness (Kic) of a material
by measurement of the critical cracking load.
Their analyses also indicate that there is proportionality between the critical crack load and
indenter radius which is known as Auerbach's Law, given as,
Chapter 2 Rock Cutting Mechanics - A Review 2-11
P c = B * y R (2.9)
where B* is a constant related to the Poisson's ratio of the material and the position of the
Hertzian ring-crack relative to the indenter, R is the radius of the indenter, and y is the
surface energy, a material property. This phenomenon is observed experimentally. Figures
2.13 and 2.14 show the test results on Soda-Lime glass and carbides respectively. As can be
seen that the critical cracking loads increase with the increase of the spherical radii.
Compared with stamp indentation studies, the sphere indentation has been well investigated
both analytically and experimentally. The successful application of fracture mechanics
principles indicates that fracture mechanics is a useful tool to furnish insight to the cutting
mechanism. This method relies on the accurate determination of the stress fields involved.
However, these models are limited to the 'initial' Hertzian ring cracks, whereas the later
stage of failure development, i.e., the surface chipping off, is of greater concern for the
cutting mechanism study.
2.2.4 Fracture by Sharp Indenters (Point Load)
In contrast to the sphere indenter, point load due to a sharp indenter produces a very high
stress concentration, causing the material immediate underneath to yield. Direct observations
(Lawn and Wilshaw, 1975a) suggest the following sequence of events as shown in Figure
2.15.
1. The sharp point indenter produces an inelastic deformation zone
2. At some threshold, a deformation-induced flow suddenly develops into a
small crack, termed the median crack on a plane of symmetry containing the
contact axis

Chapter 2 Rock Cutting Mechanics - A Review 2-12
3. A n increase in load causes further, stable growth of the median vent
4. On unloading, the median vent begins to close (but not heal)
5. In the course of the indenter removal, sideway extending cracks toward the
lateral vents begin to develop
6. Upon complete removal of the indenter, the lateral vents continue their
extension, toward the specimen surface, and may accordingly lead to the
surface chipping
Fracture mechanics methods were applied by Lawn and Swain (1975), Lawn , Evans and
Marshall (1980) to the median crack and lateral crack formation based on the Boussinesq
solution of stress due to a point load. Consider a well defined median crack caused by the
o"22 (tensile principal stress) field with depth c, at a load F (Figure 2.16), as well as a zone
of plastic deformed rock beneath the singularity point of the indentation to provide a cut-off
depth ZQ for the tensile field. Fracture mechanics calculation were given by Lawn and Swain
(1975). The influence of basic material parameters such as fracture surface energy, hardness,
Young's modulus and Poisson's ratio were considered in predicting the depth of the median
crack. This prediction is in close agreement with the experimental results, as shown in
Figure 2.17. The success of these analyses again indicates that fracture mechanics is an
important tool to study the crack for the cutting problem with the stresses involved known.
However, the ideal sharp indenter which introduces the point load is rarely found in rock
cutting, more often the geometry, such as the wedge included angle, needs to be considered.
2.2.5 The Applications of Finite Element Methods on Indentation Studies
The application of the finite element method has been found to provide solutions of stresses
involved in indentation with general (various) shapes. W a n g and Lehnoff (1976) proposed a
Chapter 2 Rock Cutting Mechanics - A Review 2-13
finite element computer code which allows the simulation of the sequence of indentation and
provides a mathematical description of failure phases - initial cracking, crushing and
chipping. The tool shapes and material properties are considered in the code. In their
programs, the following assumptions were made,
1. Prior to the stress state reaching the maximum failure strength, rock is considered
to be linear-elastic, isotopic and homogeneous.
2. The maximum strength of intact rock can be approximated by a linear Mohr
envelope. Rock failure occurs when the Mohr circle of a stress state of the rock
reaches the envelope. The shape of the linear envelope can be determined by the
uniaxial tensile and compressive strength values.
3. After tensile failure occurs, rock loses its cohesion on the newly created surface
while retaining its strength in the direction parallel to the fracture surface.
4. After compressive failure, the rock strength and stiffness decrease gradually along
with displacement until they finally approach a minimum value corresponding to the
residual strength and stiffness.
An iterative method, using an incremental displacement approach, was applied for the
continuous penetration of the indenter with modifications of material properties and
displacements.
The simulations of force-penetration curves for the stamp indenter are in reasonable
agreement with the penetration experiments on limestone. The shapes of the failure patterns
(failure zones) and the force-penetration curves were analyzed for wedge and spherical
indentures. Cook, Hood and Tsai (1984) used a similar finite element program to investigate
the rock failure patterns due to stamp indenters applied to rock samples applied with
confining stress. The results are in a close agreement with their experimental observations.
Chapter 2 Rock Cutting Mechanics - A Review 2-14
A m o n g the four kinds of indenters reviewed above, the spherical and point load indentations
have been studied systematically due to the thorough stress analyses; consequently the
fracture mechanics predictions are in good agreement with experimental phenomena.
Whereas, for wedge and stamp indenters, due to the difficulty of determining the stresses
involved in the post-failure stage or even the initial failure stage, the studies remain highly
empirical. The size effect of stamp indentations remain to be understood, because of the
inconsistent observations reported. Fracture mechanics methods are an important tool for the
crack behaviour analyses. Compared to some conventional methods, such as rock mechanics
methods, fracture mechanics methods provide detailed information, such as the length or
depth of the crack, the path of the crack, and the load requirement. The finite element
methods can be applied to determine the stresses involved in general indentations, both in the
initial failure and the post-failure stages.
2.3 Fracture by Drag Picks
The cutting processes due to drag picks are discontinuous processes. The stages occurring in
rock cutting have been described by Goodrich (1956), Fish and Barker (1956). Three
distinct stages have been identified, i.e., crushing, crushing-chipping and major chip
formation. Figure 2.18 shows a diagram representing these three distinct stages.
Fairhurst (1964) and Gray, Armstrong and Gatlin (1962) show that the thrust and the
torsional forces on a drag bit undergo rapid oscillations due to the discontinuous nature of
chip formation. Figure 2.19 shows a plot of this phenomenon for a typical drilling cycle.
There is a large number of variables involved in the design of a cutting head with drag picks,
the most important of these variables are,
1. rake angle (a)
Chapter 2 Rock Cutting Mechanics - A Review 2-15
2. clearance angle (P)
3. pick width (w)
4. pick shape
5. depth of cut (d)
6. cutting speed (v), and
7. pick spacing
A considerable amount of experimental work has been undertaken to provide some
guidelines for those cutting head designs which employ drag picks. Evans and Pomerey
(1966), Roxborough (1986) have outlined some of the following basic principles,
1. Picks which approximate the shape of a simple chisel are more efficient than
complex shapes. The conical shape is the least efficient. Although it attracts less
force than a chisel, it also produces less material and generates more dust.
2. Large picks are more efficient than small ones. The front rake angle should be
made as large as possible but no greater than 20°. The back clearance angle should
not be less than 5° and not more than 10°.
3. Specific energy (defined as the work done per unit volume of rock cut) is
reduced for all shapes of the pick as the depth of cut is increased. Shallow cuts are
very inefficient.
4. Cutting speed, within all realistic practical ranges, has no effect on pick forces
and cutting energy.
5. When cutting deeper, the picks in an array can and should be placed further
apart. For maximum cutting efficiency, the spacing between picks should be
between two and three times the intended depth of cut.
Chapter 2 Rock Cutting Mechanics - A Review 2-16
6. Deepening a groove by a succession of repeated cuts is highly inefficient and
thus should be avoided. As grooves are deepened, breakout (0) is inhibited and
adjacent picks are prevented from interaction.
7. Cutting in a comer involves high pick forces and energy. Wherever possible, an
array of picks should provide a cutting sequence that starts with the first pick
taking advantage of any available free face. Successive picks should progressively
extend the free face towards the comer of the excavation. In this way, the cutting
sequence is terminated at the comer.
To explain the observed behaviour, a series of theoretical models have been proposed for
describing drag pick cutting.
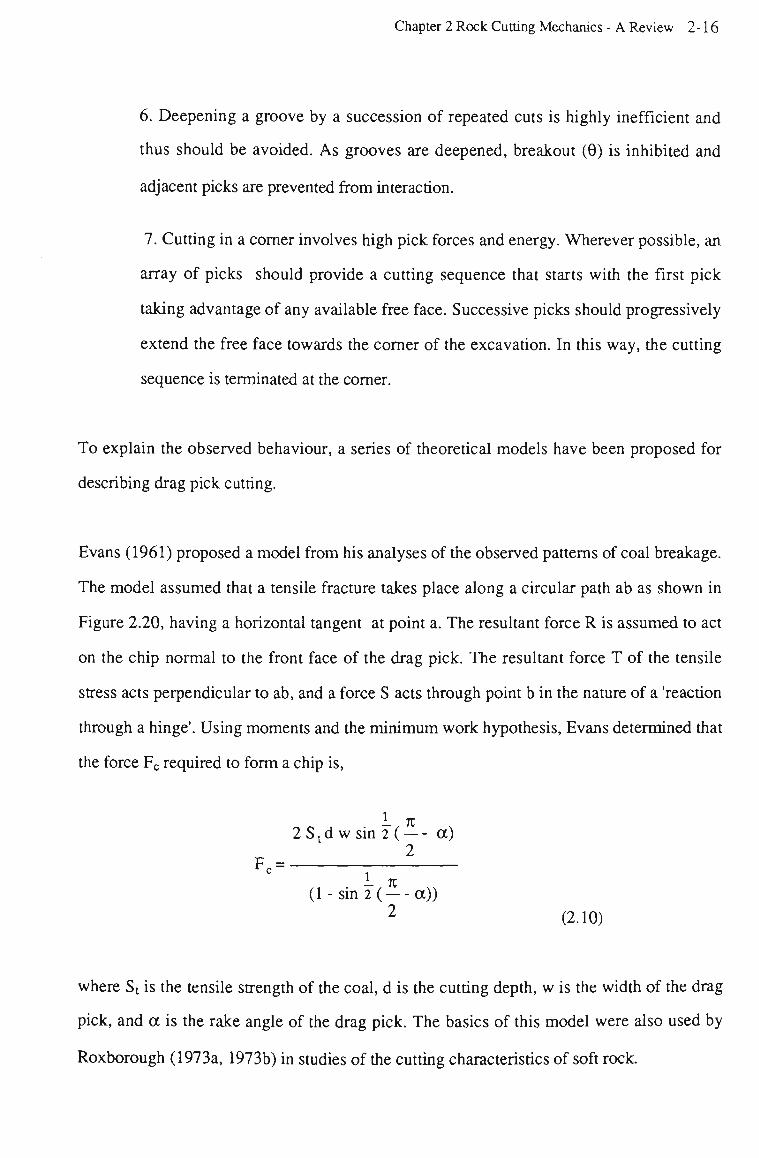
Evans (1961) proposed a model from his analyses of the observed patterns of coal breakage.
The model assumed that a tensile fracture takes place along a circular path ab as shown in
Figure 2.20, having a horizontal tangent at point a. The resultant force R is assumed to act
on the chip normal to the front face of the drag pick. The resultant force T of the tensile
stress acts perpendicular to ab, and a force S acts through point b in the nature of a 'reaction
through a hinge'. Using moments and the minimum work hypothesis, Evans determined that
the force Fc required to form a chip is,
I n 2 S t d w sin 2 (— - a)
2 Fc = ;
(1 - sin 2 ( — -a)) 2 (2.10)
where St is the tensile strength of the coal, d is the cutting depth, w is the width of the drag
pick, and a is the rake angle of the drag pick. The basics of this model were also used by
Roxborough (1973a, 1973b) in studies of the cutting characteristics of soft rock.
Chapter 2 Rock Cutting Mechanics - A Review 2-17
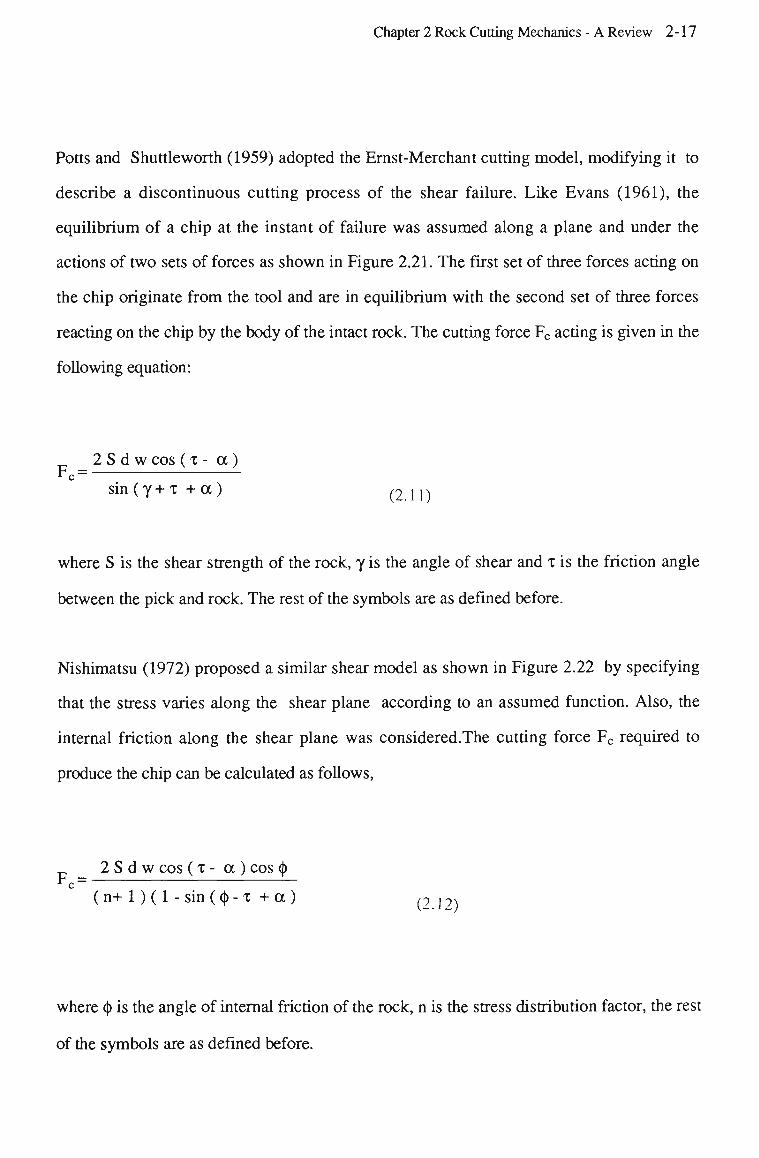
Potts and Shuttleworth (1959) adopted the Ernst-Merchant cutting model, modifying it to
describe a discontinuous cutting process of the shear failure. Like Evans (1961), the
equilibrium of a chip at the instant of failure was assumed along a plane and under the
actions of two sets of forces as shown in Figure 2.21. The first set of three forces acting on
the chip originate from the tool and are in equilibrium with the second set of three forces
reacting on the chip by the body of the intact rock. The cutting force Fc acting is given in the
following equation:
2 S d w cos (x - a )
sin(y+T +cc) (2 n )
where S is the shear strength of the rock, y is the angle of shear and x is the friction angle
between the pick and rock. The rest of the symbols are as defined before.
Nishimatsu (1972) proposed a similar shear model as shown in Figure 2.22 by specifying
that the stress varies along the shear plane according to an assumed function. Also, the
internal friction along the shear plane was considered.The cutting force Fc required to
produce the chip can be calculated as follows,
2 S d w cos (x - a ) cos (()
(n+ 1) (1 - sin ((|) - x + a ) (2 17)
where <j) is the angle of internal friction of the rock, n is the stress distribution factor, the rest
of the symbols are as defined before.
Chapter 2 Rock Cutting Mechanics - A Review 2-18
In general, the trends predicted by these models correlate well with the results of the
experiments (see, for example, Roxborough, 1981).
In all three models, the cutting forces are predicted on the basis of the geometry of the tool,
assumed failure (tensile or shear) plane, and the assumed state of stress along these planes.
The crack propagation which forms the major chip is a sequence which is influenced by the
local state of the stress at the crack tip. A more suitable model should be based on a better
understanding of the stress state involved.
To understand the stress state and the crack propagation behaviour due to the drag pick
cutting, several attempts have been made recently to analyze the problem by the finite element
method. Hardy (1973) studied the rake angle effect by predicting the probable crack growth
direction and strain energy required. Using the maximum strain energy release rate criterion
(e.g. see Lawn and Wilshaw, 1975b), the finite element method was used to calculate
directly the strain energy release rate for a general crack. Saouma and Kleinosky (1984)
simulated the crack propagation in the process of the major chip formation by incorporating
an automatic re-meshing algorithm into their finite element code. A crack will propagate as
long as the strain energy release rate G is equal or larger than the critical strain energy release
rate Gc. The strain energy release rate is determined from the computed stress intensity
factors. The isoparametric quadratic singular element was used to model the stress
singularity, and the displacement correlation method was used to determine stress intensity
factors from the nodal displacement of the singular elements.
Using the maximum tensile stress criterion (Erdogan and Sih, 1963), a similar finite element
code was used by Ingraffea (1987). The prediction for the two loading conditions are shown
in Figure 2.23a,b.
Chapter 2 Rock Cutting Mechanics - A Review 2-19
The boundary element method has become an alternative to the finite element method for the
crack modelling problem because of its inherent reduction in problem dimensionality. A
number of computer codes have been used for the simulation of crack propagation
(Blandford, Ingraffea and Ligget 1981, Matti and Smith, 1983, 1984). Although these codes
have not been used for rock cutting yet, the results indicate that the boundary element method
can be a potential tool for efficient crack modelling in rock cutting studies.
2.4 Fracture by Disc Cutters
Rock-tool interaction involved in single (independent) disc cutting has been studied by Evans
(1974), and Roxborough and Phillips (1975). The indentation theories stated earlier are also
applicable to the single disc indentation problem to some extent. However, the most
dominating fracture in disc cutting is the subsurface crack interaction between adjoining
cutters. Miller (1974), Ozdemir (1975), and Roxborough (1981) have obtained extensive
data on the effect of the subsurface crack interaction on the cutting performance. These
interactions can be classified into three modes according to the spacing between the cutters as
shown in Figure 2.24a,b. Zone I covers relatively small spacing values. This spacing results
in an extensive overlapping of previous cutting paths and completely crushes the rock. The
specific energy is relatively large. Beyond this spacing, in Zone II, chipping of the rock
between adjoining cutters becomes the principal failure mechanism, the minimum energy at
optimum spacing appears, the corresponding spacing is normally called the optimum
spacing. At larger spacings, the interaction between adjoining disc cutters reduces. Zone IE
starts where spacing is so large that the interaction ceases. This behaviour, as determined by
laboratory evidence, is independent of disc cutter geometry and type.
It is obvious that the correct selection of the optimum spacing in a cutting array is important.
Cutting performance and operating costs are closely related to this factor. A large number of
Chapter 2 Rock Cutting Mechanics - A Review 2-20
investigations have been undertaken with both sharp and blunt cutters in order to determine
the optimum s/p (spacing/penetration) ratios. For sharp disc cutters, the optimum s/p ratios
lie between 2.5 and 11.0 (O'Rieily, Roxborough and Hignett, 1976), whereas for blunt
disc cutters the corresponding ratios lie between 5.0 and 18.0 (Crabb and Hignelt, 1980,
Snowdon and Ryley and Temporal 1982, Snowdon, Reley, Temporal and Crabb 1983,
Fenn, Protheroe and Joughin 1985). It has been demonstrated (Phillips, Bilgin and Price,
1978) that the optimum s/p ratios increase with increasing cutter tip radius. Discs with 3 mm
tip radius could be spaced 1.4 times the distance used for sharp discs in order to attain the
optimum s/p ratio for the minimum specific energy. As commercially available blunt discs
tend to have cutter tip geometries significantly blunter than those mentioned above. Studies
on these blunt discs by Howarth and Bridge (1988) showed significant subsurface crack
interactions between the discs. The corresponding s/p ratios range from 10 to 40.
Recently, discs with a constant cross-sectional width were developed (Ozdemir and
Dollinger, 1984) to maintain the same level of dullness and therefore boring performance as
they wear. These discs generally give poorer performance than wedge-shape discs at the
beginning because of their initial dullness. After a small amount of wear has occurred,
however, the performance of the wedge-shape discs drops below that of the constant-section
discs. Because of this effect, constant-section discs can be allowed to wear longer than
wedge-shape discs thus reducing the cutter costs. It appears that there is little or no published
data concerning the optimum s/p ratio for theses kind of disc cutters and the fracture
mechanism involved.
The mechanism involved in the subsurface chipping between adjoining discs is unknown.
The basic problems, such as the stress that initiates chipping, remain to be answered, due
principally to the lack of knowledge of the stress state involved.
An attempt has been made by Lindqvist (1984) to find the stress evidence for the subsurface
chipping. A stress field due to two-indentations (point loads) was calculated from the
Chapter 2 Rock Cutting Mechanics - A Review 2-21
Boussinesq solution. The plot of the two-indentations stress field is drawn with spacing, s =
20a, and x> = 0.20, where a is the width of the indenters, and i> is Poisson's ratio. Stress
trajectories are illustrated in Figure 2.25 and stress magnitudes in Figure 2.26. A conclusion
of the stress plots of the distribution of principal stresses is that the primary stress field of the
indexed indenters is unlikely to cause the side chipping. It is believed that a more realistic
contact condition than the point load m a y provide a better prediction. Nevertheless, from
Figure 2.26(a), it can be seen that the broken lines, with m a x i m u m tensile stress O n along
them, indicate the probable crack propagation paths. The outwardly directed cracks were
observed on a sample cut by a triple tungsten carbide kerf cutter, which indicates that
simultaneous loading on the rock surface provides a possible control on the crack behaviour.
This study, on the other hand, indicates that proper theoretical analysis based on an accurate
stress analysis could lead to new ideas of cutting, rather than only to explain the observed
behaviour and measured data.
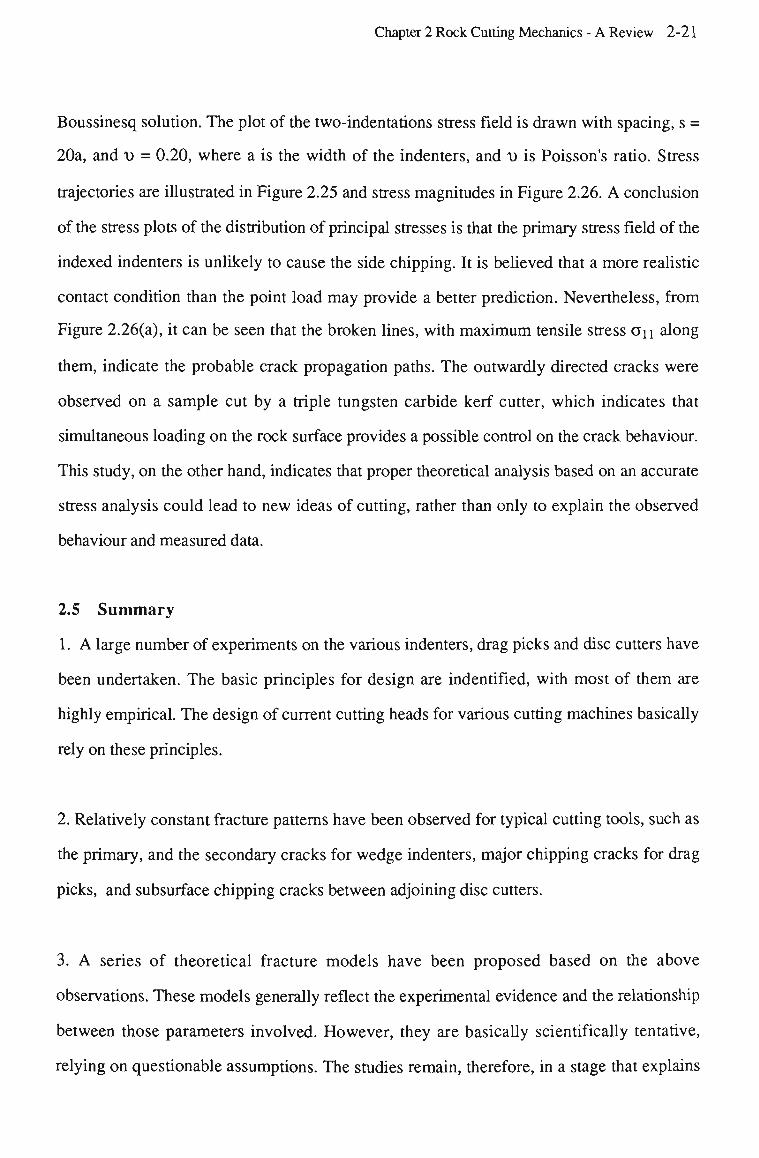
2.5 Summary
1. A large number of experiments on the various indenters, drag picks and disc cutters have
been undertaken. The basic principles for design are indentified, with most of them are
highly empirical. The design of current cutting heads for various cutting machines basically
rely on these principles.
2. Relatively constant fracture patterns have been observed for typical cutting tools, such as
the primary, and the secondary cracks for wedge indenters, major chipping cracks for drag
picks, and subsurface chipping cracks between adjoining disc cutters.
3. A series of theoretical fracture models have been proposed based on the above
observations. These models generally reflect the experimental evidence and the relationship
between those parameters involved. However, they are basically scientifically tentative,
relying on questionable assumptions. The studies remain, therefore, in a stage that explains
Chapter 2 Rock Cutting Mechanics - A Review 2-22
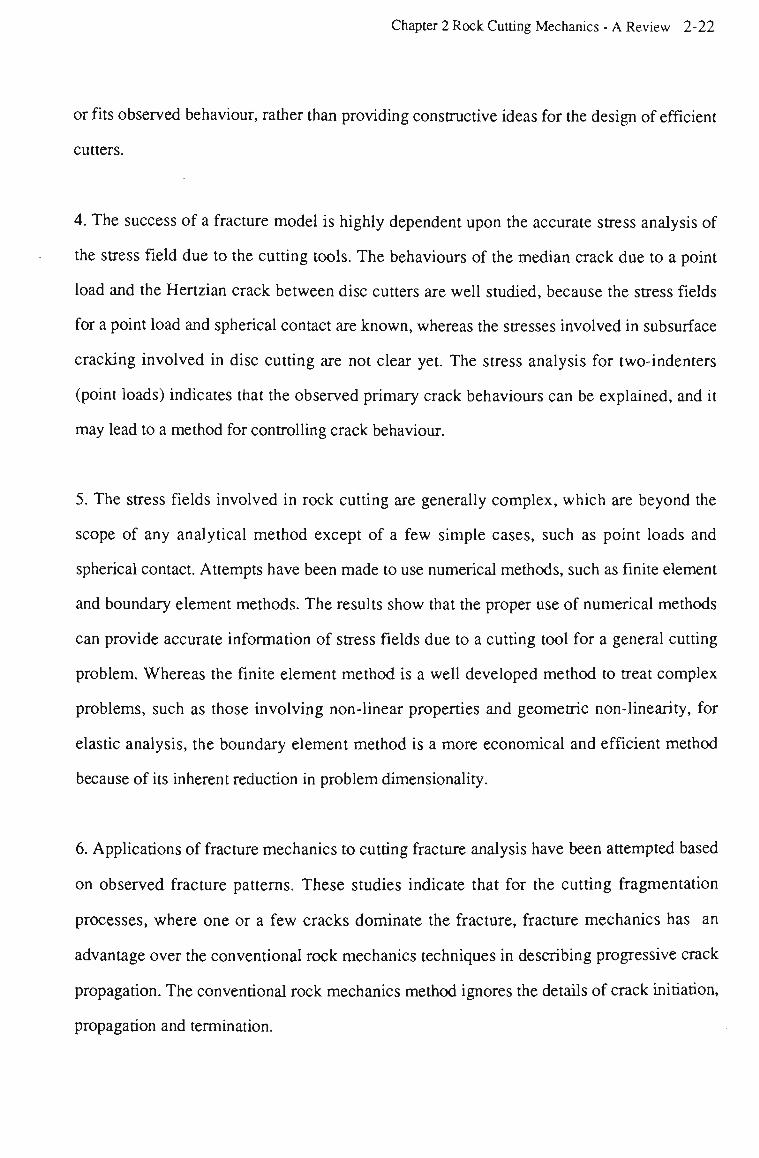
or fits observed behaviour, rather than providing constructive ideas for the design of efficient
cutters.
4. The success of a fracture model is highly dependent upon the accurate stress analysis of
the stress field due to the cutting tools. The behaviours of the median crack due to a point
load and the Hertzian crack between disc cutters are well studied, because the stress fields
for a point load and spherical contact are known, whereas the stresses involved in subsurface
cracking involved in disc cutting are not clear yet. The stress analysis for two-indenters
(point loads) indicates that the observed primary crack behaviours can be explained, and it
may lead to a method for controlling crack behaviour.
5. The stress fields involved in rock cutting are generally complex, which are beyond the
scope of any analytical method except of a few simple cases, such as point loads and
spherical contact. Attempts have been made to use numerical methods, such as finite element
and boundary element methods. The results show that the proper use of numerical methods
can provide accurate information of stress fields due to a cutting tool for a general cutting
problem. Whereas the finite element method is a well developed method to treat complex
problems, such as those involving non-linear properties and geometric non-linearity, for
elastic analysis, the boundary element method is a more economical and efficient method
because of its inherent reduction in problem dimensionality.
6. Applications of fracture mechanics to cutting fracture analysis have been attempted based
on observed fracture patterns. These studies indicate that for the cutting fragmentation
processes, where one or a few cracks dominate the fracture, fracture mechanics has an
advantage over the conventional rock mechanics techniques in describing progressive crack
propagation. The conventional rock mechanics method ignores the details of crack initiation,
propagation and termination.

Chapter 2 Rock Cutting Mechanics - A Review 2-23
7. Further understanding of the rock cutting mechanism is likely to be achieved by
systematic fracture mechanics analysis. The analysis relies on development of a numerical
fracture modelling technique, which predicts the behaviours of cracks due to contact by
various cutting tools. A series of tests are also required to investigate the factors influencing
the shape and direction of the cracks formed. These observations can provide the basic
conditions for the numerical modelling, and confirmation for the numerical modelling
results.
Chapter 2 Rock Cutting Mechanics - A Review 2-24
Table 2.1 Commonly used cutting tools and application
Type of tools Schematic diagrams Applications
Drag pick
Roc* '77777777.
(a) DfJ$ pit* {chtwl (orr.)
(a) Chisel type
W'//ss
77777, 7777777. R"k
(b) Orjg pick (conical form]
(b) Conical type
V7777.
Roadheader
Longwall plough
Longwall shearer
Continuous miner
Toothed
roller
^^m^?,77^777'
Deep large diameter
drilling (oil industry)
Tunnel boring machine
Disc
cutter
"rz7wm?77,^m^7
Raise boring
Tunnel boring machine
Button
cutter
7 Z W m ? 7 , ^y//////////7^-
Raise boring
Blasting drilling
Tunnel boring machine
Chapter 2 Reck Catting Mechanics-A Review 2-25
CRUSHEO POWOER
'LARGE CHIPS FINAL OUTLINE
OF CRATER
Figure 2.1 Sequence of rock failure and crater formation in percussive
drilling(after Hartman, 1959)
COAL
A A
Figure 2.2 Model for wedge penetrating (after Evans and Murrell,
1962)
Criar^er2Rc<iCuriingMeci3aiiics-AReview 2-26
60 120
2 /3 - DEGREES
180
Figure 2.3 Theoretical relations for Evans-Murrell model (after Gnirk,
1964)
Crushed cool
Figure 2.4 Blunt wedge -penetration model (after Dalziel and Davies, 1964)
Chapter 2 Rock Cutting Mechanics - A Review 2
Crushed zone
Secondary (lateral) cracks
Primary Crack
Figure 2.5 Fracture Patterns due to wedge indentation
yc'ire Y "Zone of • ^ 0 0 / / , pulverized rock Frach^
p> j?7
Zone of
pulverized rock
ure 2.6 Simplified force system in percussive drilling (after Fairhust
and Lacabanne, 1956)
Chapter 2 Rock Cutting Mechanics - A Review 2-28
* T=0
MAXIMUM SHEAR TRAJECTORY
FRACTURE / T~ \
CRATER FORMATION
Figure 2.7 Crater formation by shear failure (after Maurer and
Rinehart, 1960)
Figure 2.8 Brittle crater model (after Paul and Sikarskie, 1965)
Chapter 2 Rock Cutting Mechanics - A Review 2
FAILURE LINE
CONSTANT LOAD TEST
ACTUAL LOADING CONDITION
CONSTANT RATE TEST
SLOPE k
WEDGE PENETRATION
ure 2.9 Theoretical force-penetration curve for brittle crater model
(after Paul and Sikarskie, 1965)
ure 2.10 Schematic representation of the failure mechanism of rock
under stamp indentation (after Wagner and Schumann, 1971)
Chapter 2 Rock Cutting Mechanics - A Review 2-30
St
c?st-' stamp-load bearing strength a c : compressive strength
Each symbol represents an individual test
0 I I I i —
0 OiS 0 3 0 6 —r— I 2
d (inch)
Figure 2.11 Normalized stamp-load bearing strength (after Wagner and
Schumann, 1971)
c.
Figure 2.12 Evolution of the Hertzian crack during spherical indentation, (+) loading, (-) unloading (after L a w n and Wilshaw, 1975a)

Chapter 2 Rock Cutting Mechanics - A Review 2-31
CO
o i-O CL
ra o rd o *- L_
O
. .•
. .
*
2r
i __
• ,•
," i
No 240
,
•
• •
Nc 320
!
a No •aoo
•
:'_ _ L
. -
.
.
No 600
• • , 1 1
O 2C O K3 20
Sphere radius, r(mm)
Figure 2.13 The critical load for Hertzian crack on Soda-Lime glass as
function of radius of steel sphere indenter (after Lawn and
Marshall, 1975)
Q
< O
<
a: u
\5
1.0
0.5
n
c) VC (steel)
-
/
/ i i i i i i
0 1 2 3 4 5 6 0 1 2 3 ^ 5 6
INDENTOR RADIUS, R(mm)
Figure 2.14 The critical cracking load as a function of indenter radius
for the four carbides (Warren, 1978)
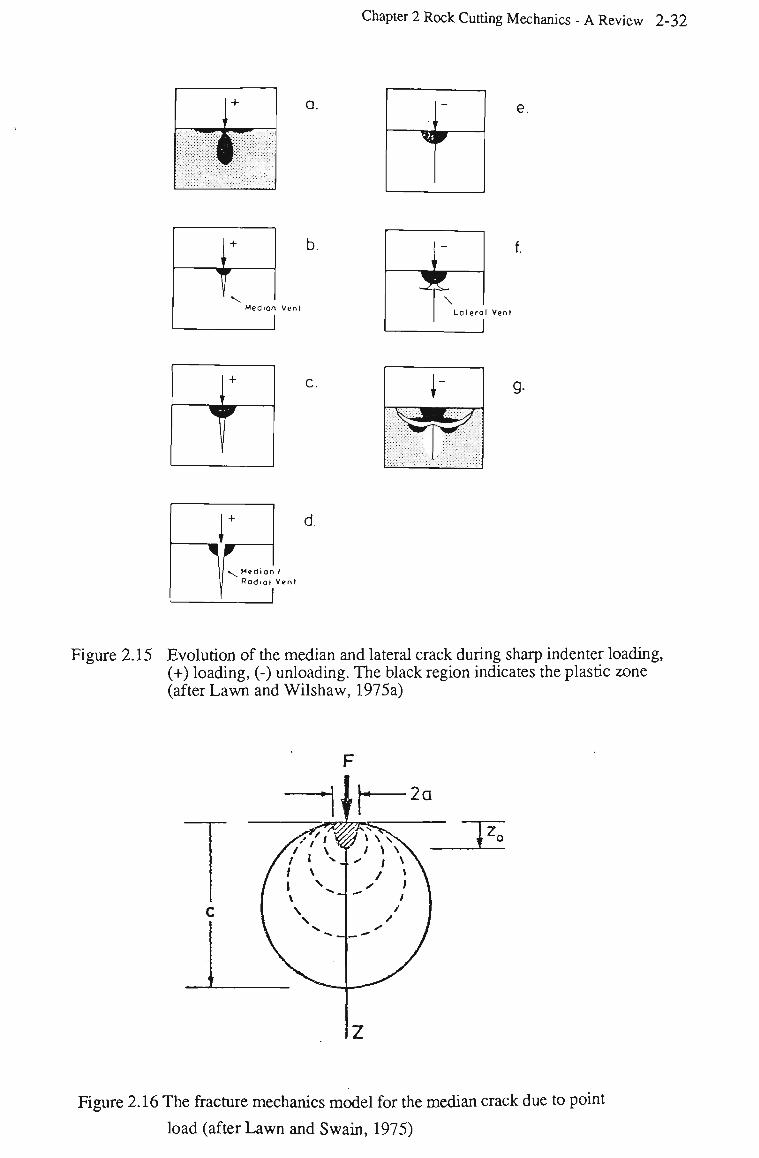
Chapter 2 Rock Cutting Mechanics - A Review 2-32
a.
f d.
Median /
Radial Venl
Figure 2.15 Evolution of the median and lateral crack during sharp indenter loading, (+) loading, (-) unloading. The black region indicates the plastic zone (after Lawn and Wilshaw, 1975a)
Figure 2.16 The fracture mechanics model for the median crack due to point
load (after Lawn and Swain, 1975)
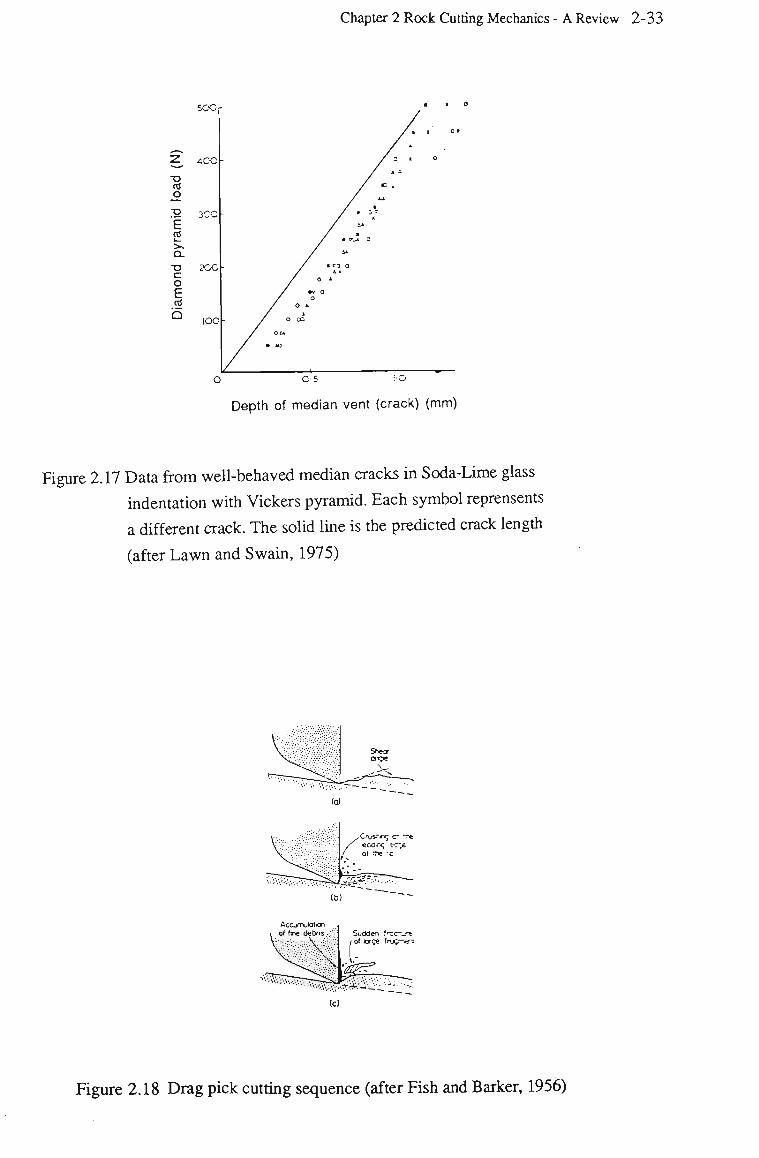
Chapter 2 Rock Cutting Mechanics - A Review 2-33
z ra o •g
'E ts i —
>, Q. T> C o E to
b
Depth of median vent (crack) (mm)
Figure 2.17 Data from well-behaved median cracks in Soda-Lime glass
indentation with Vickers pyramid. Each symbol represents
a different crack. The solid line is the predicted crack length
(after Lawn and Swain, 1975)
Figure 2.18 Drag pick cutting sequence (after Fish and Barker, 1956)
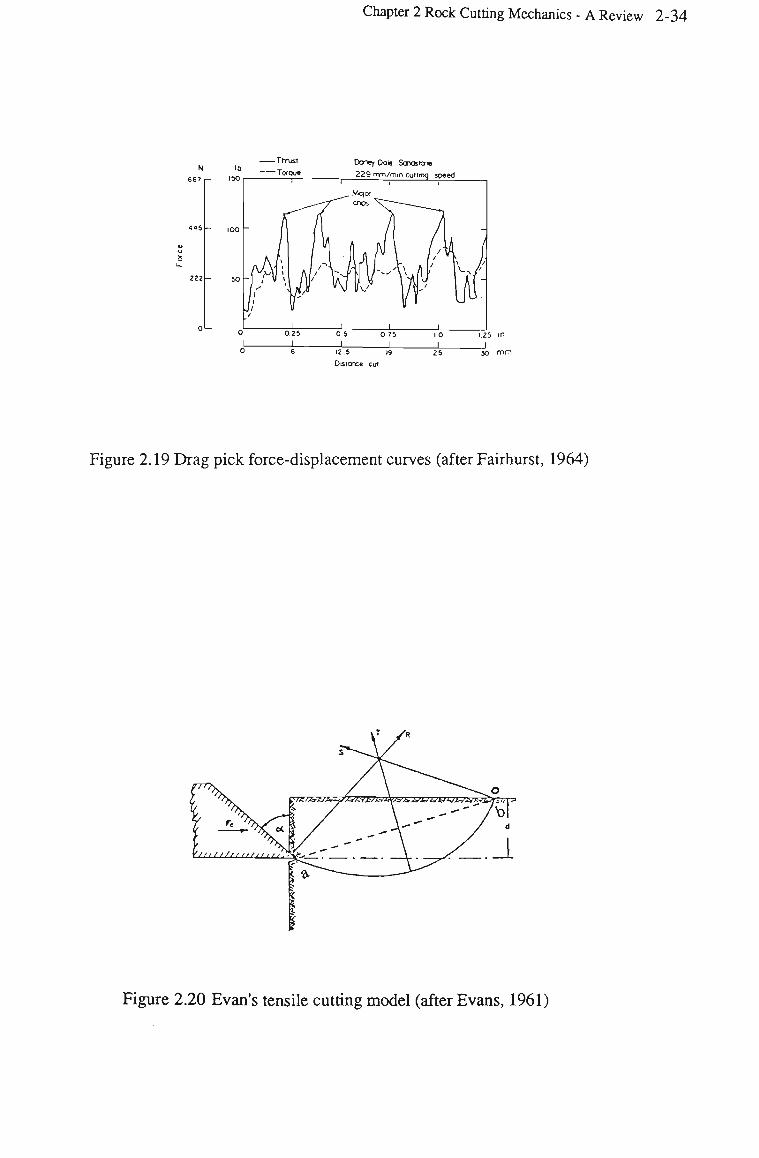
Chapter 2 Rock Cutting Mechanics - A Review 2-34
667,- ISO
Thrust
Torque Daney Dole Sondswie
229 mm/rnm cutting speed
Figure 2.19 Drag pick force-displacement curves (after Fairhurst, 1964)
Figure 2.20 Evan's tensile cutting model (after Evans, 1961)
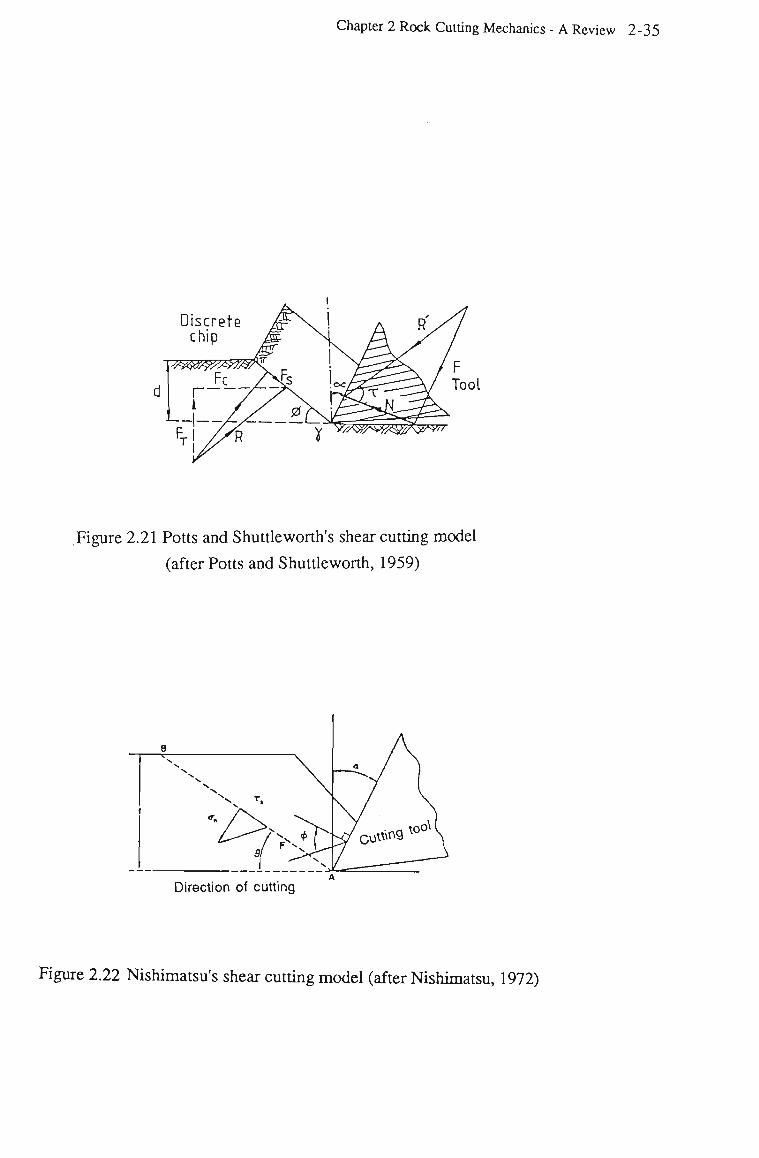
Chapter 2 Rock Cutting Mechanics - A Review 2-35
Discrete chip
Figure 2.21 Potts and Shuttle worth's shear cutting model
(after Potts and Shuttleworth, 1959)
Direction of cutting
Figure 2.22 Nishimatsu's shear cutting model (after Nishimatsu, 1972)
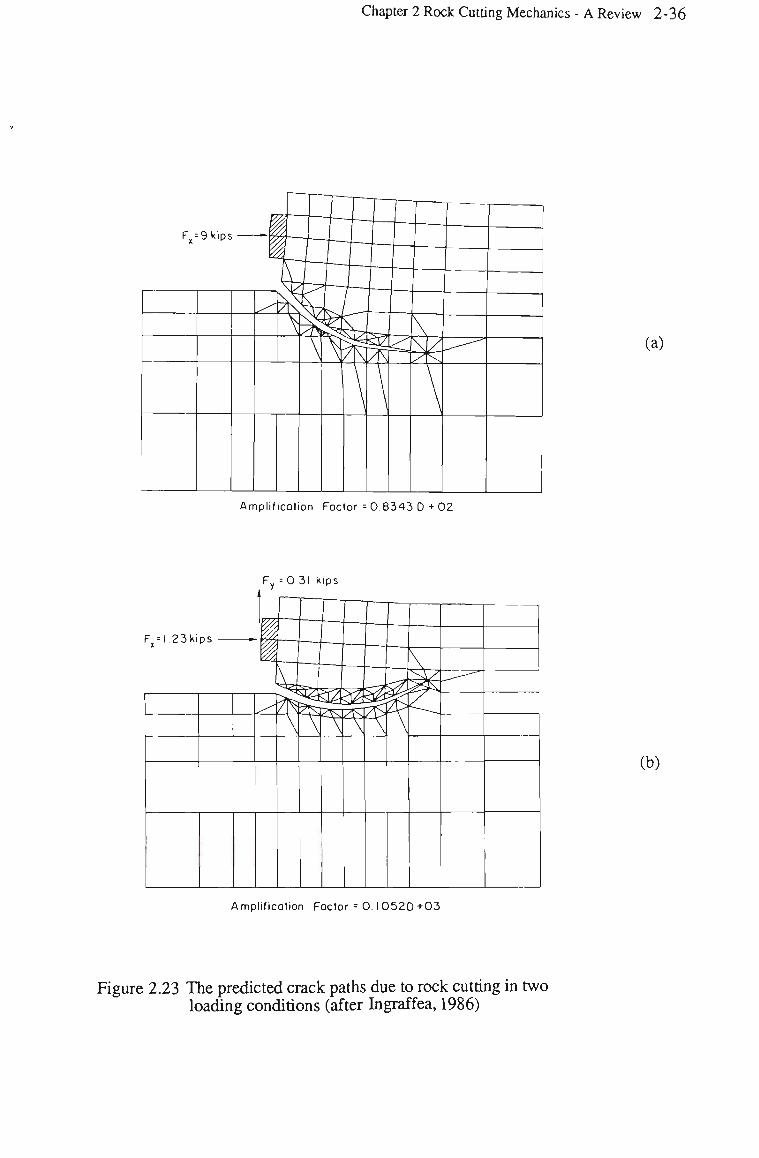
Chapter 2 Rock Cutting Mechanics - A Review 2-36
Fx=9kips . f 4>
\
- " "
Amplification Factor = 0.8343 D + 0 2
Fx= 1 23ki ps -
F y - 0
?77A '
31 k
iffi—\—i
M~T\
ips
(a)
(b)
Amplification Factor = 0 . 1 0 5 2 D + 0 3
ure 2.23 The predicted crack paths due to rock cutting in two loading conditions (after Ingraffea, 1986)
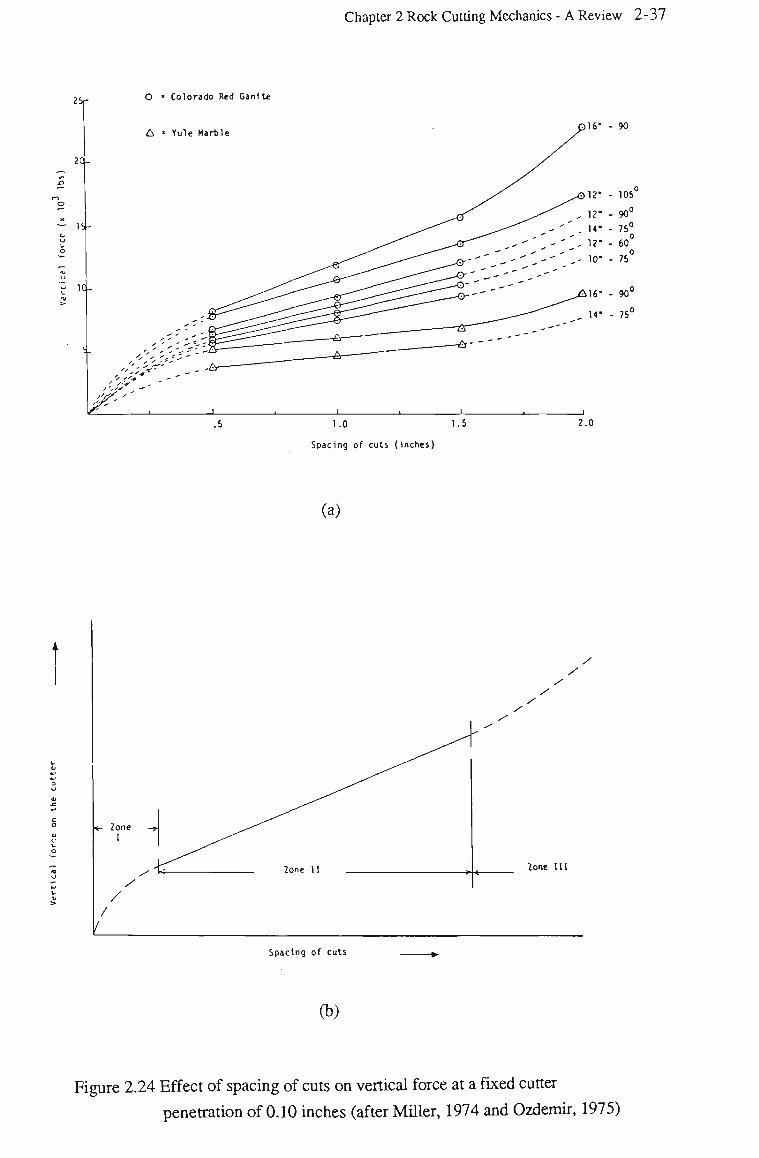
Chapter 2 Rock Cutting Mechanics - A Review 2-37
'T 20-
- 15-
1C-
Colorado Red Gani t*
d. * Yule Marble
-L 1.0 1.5
Spacing of cuts (inches)
_J
2.0
(a)
Zone 111
Spacing of cuts
(b)
Figure 2.24 Effect of spacing of cuts on vertical force at a fixed cutter
penetration of 0.10 inches (after Miller, 1974 and Ozdemir, 1975)
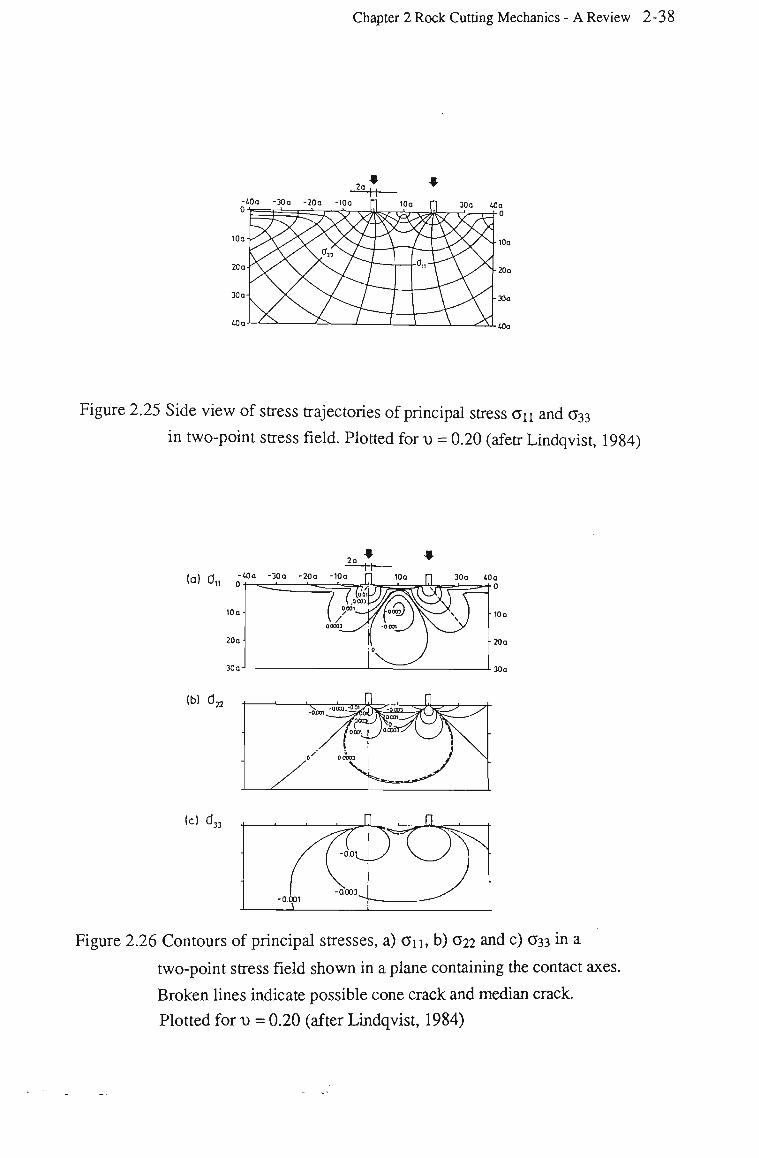
Chapter 2 Rock Cutting Mechanics - A Review 2-38
10a
Figure 2.25 Side view of stress trajectories of principal stress O n and 0-33
in two-point stress field. Plotted for v = 0.20 (afetr Lindqvist, 1984)
2a
(a) ^ o-Ma^-30a -20a^-ina p 10° _ H
~~1 (°'°'P
20a
(b) d.
(c) d,
20a
Figure 2.26 Contours of principal stresses, a) a n , b) 022 and c) 033 in a
two-point stress field shown in a plane containing the contact axes.
Broken lines indicate possible cone crack and median crack
Plotted for \) = 0.20 (after Lindqvist, 1984)
CHAPTER THREE
LINEAR ELASTIC CRACK TIP MODELLING BY THE DISPLACEMENT
DISCONTINUITY METHOD
Chapter 3 Linear Elastic Crack Tip Modeling by the Displacement Discontinuity Method 3-1
CHAPTER 3
LINEAR ELASTIC CRACK TIP MODELLING BY
THE DISPLACEMENT DISCONTINUITY METHOD
3.1 Introduction
What type of loading initiates a rock crack? What is the crack propagation path? These
problems have received considerable attention, both in rock engineering design, and in rock
fragmentation processes (such as rock drilling, cutting , crushing and blasting). The objective
of rock engineering design is to minimize the chance of crack initiation, whereas the objective
of the rock fragmentation is to generate desirable and efficient crack propagation paths.
Further investigations of rock crack behaviour in rock cutting will allow a better
understanding of the cutting mechanism. The control of the crack behaviour may lead to
improvements in rock cutting efficiency.
Well established fracture mechanics techniques for general crack analysis provide alternative
methods for rock cutting studies. Since Griffith (1921) first proposed the energy-balance
concept for elastic, homogeneous systems with a crack lying in a plane normal to a tensile
stress, considerable progress has taken place in extending the applicability of the concept for
more complex crack configurations, and loading conditions (Erdogan and Sih 1963, Sih,
1973a, and Hussian, Pu and Underwood, 1974) and media (Dugdale, 1960, Bareblett,
1962, and Rice, 1962).
An essential step in applying fracture mechanics principles to crack analysis due to rock
cutting is the accurate determination of the related strain energy release rate, or the stress
intensity factors. Based on those parameters, crack propagation path and propagation load
requirements can be determined.
Chapter 3 Linear Elastic Crack Tip Modeling by the Displacement Discontinuity Method 3-2
The importance of evaluating the fracture mechanics parameters has lead to a number of
strategies for numerical crack modelling to analyze the general crack problem (the crack with
an arbitrary configuration and loading condition). These crack problems are, in general,
beyond the scope of any analytical technique.
The finite element method is the most popular technique for numerical analysis of fracture
mechanics problems. In the past two decades, considerable progress has taken place in
extending the applicability and accuracy of the finite element methods (Watwood, 1969,
Anderson, 1976, Tracey, 1975, Barsoum, 1976, 1977, Freese and Tracey, 1977, Ingraffea
and Manu, 1980, Lynn and Ingraffea, 1978, Chan, Tuba and Wilson, 1970, and Gilford and
Hilton, 1978). The boundary element method is becoming established as an alternative to the
finite element method, because of its inherent reduction in problem dimensionality. Direct
boundary integration formulations have been given, using a special Green's function
approach (Cruse, 1975, 1978, Cruse and Wilson, 1978, Snyder and Cruse, 1975). This
method produces a significant efficient and accurate procedure for fracture mechanics
analysis. The limitation of this method is that, except for a special crack configuration, (e.g.,
a straight crack in plane condition), very few of these Green's functions are available.
Multidomain boundary integration methods (Blandford, Ingraffea and Ligett, 1981,
Ingraffea, Blandford and Ligett, 1981, Ingraffea, 1983) allow the crack surface to be
discretized, and therefore can be used for the analysis of a crack with an arbitrary shape. The
isoparametric quadratic boundary elements are transformed to represent the analytically
1/ dominant Vr and' Vr behaviour exhibited by the displacements and tractions, respectively, in
the near vicinity of a crack tip (r is distance from crack tip).
The displacement discontinuity method (DD method) calculates the displacement along the
crack axis (crack sliding displacement) and the displacement normal to the crack axis (crack
Chapter 3 Linear Elastic Crack Tip Modeling by the Displacement Discontinuity Method 3-3
opening displacement) (Crouch, 1976a, 1976b, 1979). The general crack problem can be
analyzed, e.g., a curved crack, an intercept crack and a crack with friction along its surface.
Recently, this method has been used for the study of angled crack initiation and propagation
(Comet, 1980), and the calculation of mixed mode stress intensity factors (Schultz, 1988). A
key feature in crack analysis is the singular stress field at the crack tip. The constant-
displacement elements in the DD method are less accurate at the vicinity of the crack tip; a
special treatment of this singularity in the analysis is required.
In this chapter, a fundamental elastic solution for a variable displacement discontinuity over a
finite segment line in an infinite plane is given and is used for the development of a special
crack tip element to represent the singularity feature of the crack tip. The Griffith-Irwin
criterion and the maximum tensile stress criterion were used for the crack propagation
predictions. The strain energy release rate G was obtained using the energy method, i.e.,
computing the change in the strain energy of two slightly different crack lengths. The
displacement correlation technique was used for the evaluation of the stress intensity factors
used for the determination of the maximum tensile stress. The technique of crack propagation
prediction is illustrated by a few examples. The two criteria are compared, the maximum
tensile stress criterion is selected for the later use because of its modelling efficiency.
3.2 Crack Tip Singularity
Consider the two-dimensional region of a crack tip as shown in Figure 3.1. The stresses for
a traction free crack surfaces were given by Williams (1957) as an infinite series in r, the
distance from the crack tip in the form of,
a = K F(6) r "1/2+ O (r°) (3.1)
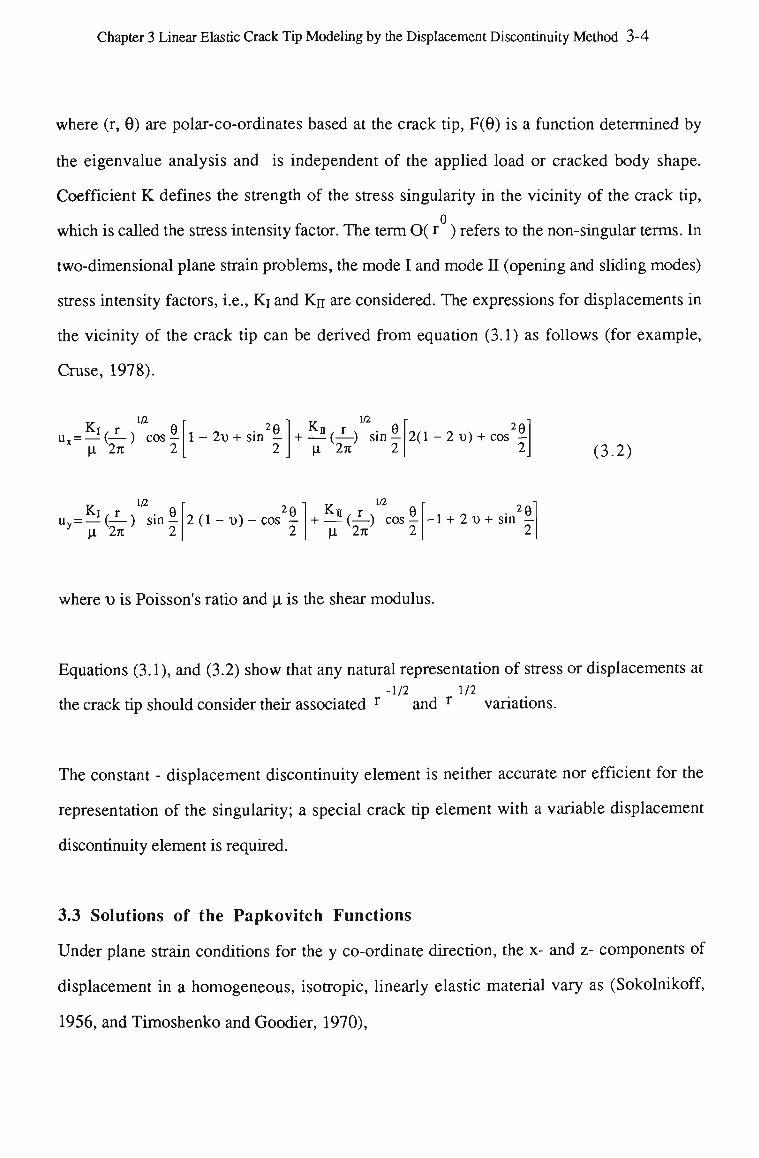
Chapter 3 Linear Elastic Crack Tip Modeling by the Displacement Discontinuity Method 3-4
where (r, 8) are polar-co-ordinates based at the crack tip, F(0) is a function determined by
the eigenvalue analysis and is independent of the applied load or cracked body shape.
Coefficient K defines the strength of the stress singularity in the vicinity of the crack tip,
o which is called the stress intensity factor. The term 0( r ) refers to the non-singular terms. In
two-dimensional plane strain problems, the mode I and mode II (opening and sliding modes)
stress intensity factors, i.e., Ki and Kn are considered. The expressions for displacements in
the vicinity of the crack tip can be derived from equation (3.1) as follows (for example,
Cruse, 1978).
1/2 K-i.r v e
u. = —-(—) cos-p, 2TC 2
2Q 2v + sin —
2
\a + ( J L ) sin°
p. 2% 2 2(1 - 2 u) + cos
(3.2)
K 1/2
uv = — ( — ) sm-y \l 2n 2
2e 2 (l-u)-cos -
2
1/2 Kn, r "' 9
+ — (—) cos -u. 2K 2
-1 + 2u + sin
where x> is Poisson's ratio and |i is the shear modulus.
Equations (3.1), and (3.2) show that any natural representation of stress or displacements at
-1/2 1/2 the crack tip should consider their associated r and r variations.
The constant - displacement discontinuity element is neither accurate nor efficient for the
representation of the singularity; a special crack tip element with a variable displacement
discontinuity element is required.
3.3 Solutions of the Papkovitch Functions
Under plane strain conditions for the y co-ordinate direction, the x- and z- components of
displacement in a homogeneous, isotropic, linearly elastic material vary as (Sokolnikoff,
1956, and Timoshenko and Goodier, 1970),
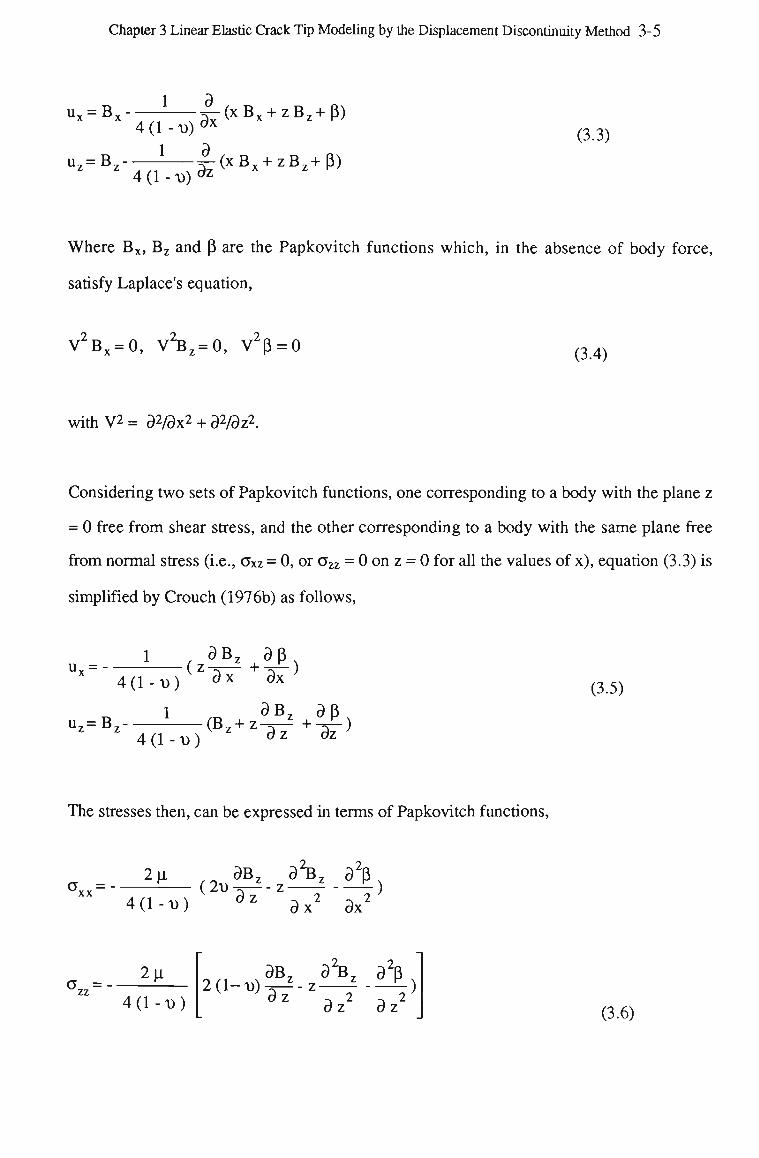
Chapter 3 Linear Elastic Crack Tip Modeling by the Displacement Discontinuity Method 3-5
ux=Bx
1 ^ ( x B x + zBz+p) 4 (1 - v)
1 r) u*=B*-77;—r%r(xBx + zBz+P)
(3.3)
Where Bx, B z and P are the Papkovitch functions which, in the absence of body force,
satisfy Laplace's equation,
V2Bx = 0, V ^ ^ O , V2p = 0 (3.4)
with V 2 = d2/dx* + dVdz2.
Considering two sets of Papkovitch functions, one corresponding to a body with the plane z
= 0 free from shear stress, and the other corresponding to a body with the same plane free
from normal stress (i.e., aXz = 0, or a^ = 0 on z = 0 for all the values of x), equation (3.3) is
simplified by Crouch (1976b) as follows,
ux = 4 (1 - v>) d x 5 x
(3.5)
uz=Bz-1 3 B Z ap
4(1 -D)
The stresses then, can be expressed in terms of Papkovitch functions,
a = XX
2 p. ,„ 9BZ 92BZ a2p (2a)3-^-z - )
4 ( 1 - D ) 3 z a x2 dx2
(yzz=-2»i
4 ( 1 - D ) 2 ( 1 - D ) 7 S - * - Z
o z
3 B Z a'B, a2p
z d z (3.6)
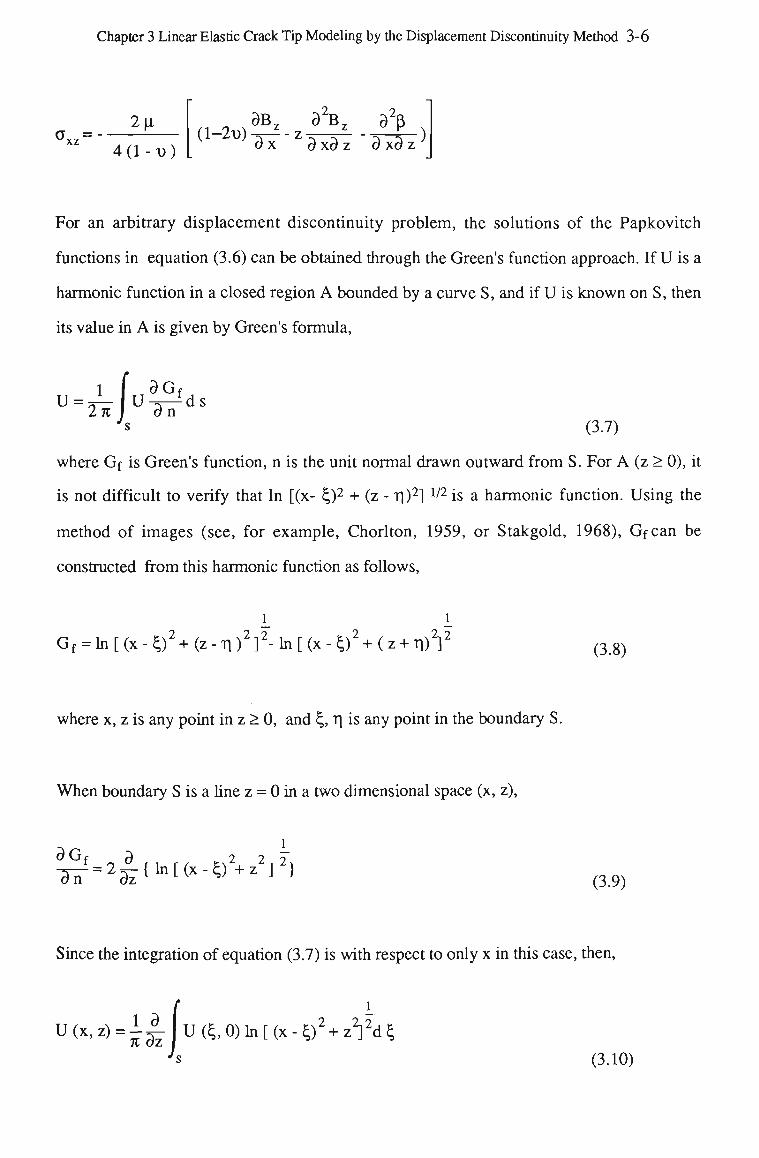
Chapter 3 Linear Elastic Crack Tip Modeling by the Displacement Discontinuity Method 3-6
axz = 2u.
4(1-D)
„ B B Z a2Bz a2p (l-2t))^-Z3-3^ --5-?-)
ox axaz axaz
For an arbitrary displacement discontinuity problem, the solutions of the Papkovitch
functions in equation (3.6) can be obtained through the Green's function approach. If U is a
harmonic function in a closed region A bounded by a curve S, and if U is known on S, then
its value in A is given by Green's formula,
U 2K)
U 3 n ds
'» (3.7)
where Gf is Green's function, n is the unit normal drawn outward from S. For A (z > 0), it
is not difficult to verify that In [(x- I,)2 + (z - T|)2] 1/2 is a harmonic function. Using the
method of images (see, for example, Chorlton, 1959, or Stakgold, 1968), Gfcan be
constructed from this harmonic function as follows,
G f = ln[(x-02 +(z-^) 2 ] 2 -ln[(x-0 2 +(z + Tl)2] (3.8)
where x, z is any point in z > 0, and £, T| is any point in the boundary S.
When boundary S is a line z = 0 in a two dimensional space (x, z),
d Gf a 2 2o Ih^afllnUx-^+z2]2} (3.9)
Since the integration of equation (3.7) is with respect to only x in this case, then,
K 3z I * c
U (x, z) = I J L U ft, 0) In [ (x - c / + z2] 2d \
(3.10)
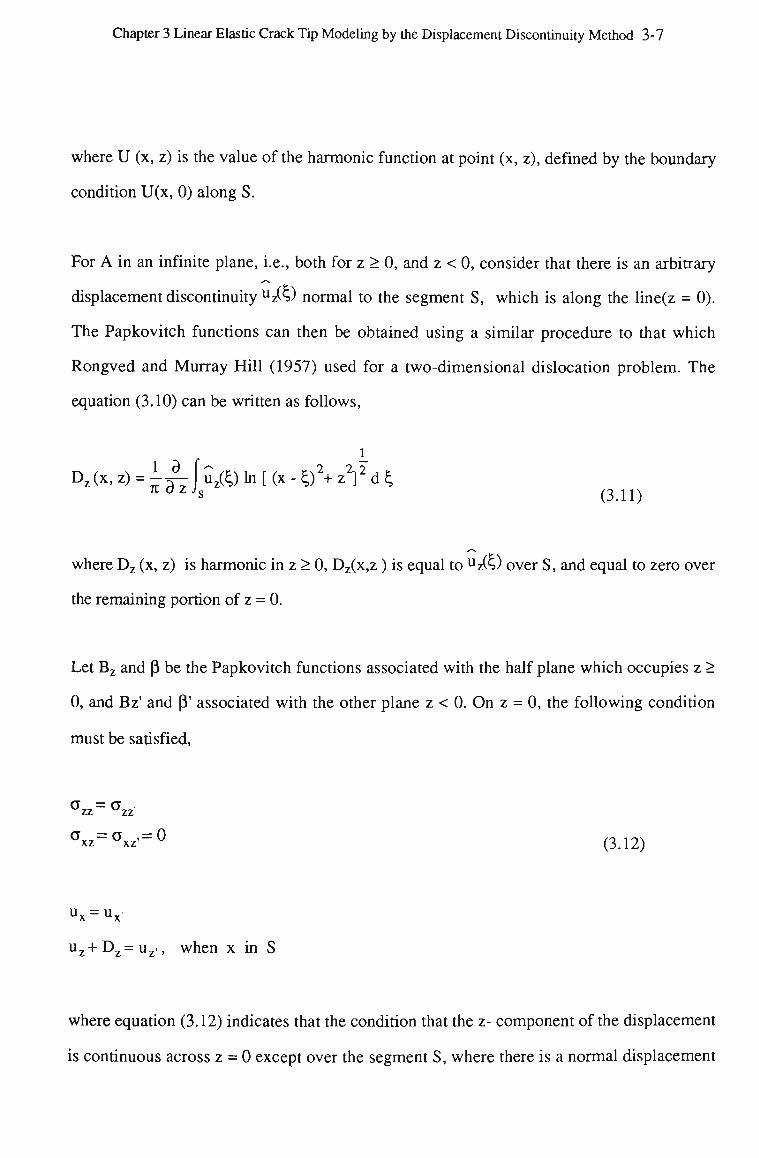
Chapter 3 Linear Elastic Crack Tip Modeling by the Displacement Discontinuity Method 3-7
where U (x, z) is the value of the harmonic function at point (x, z), defined by the boundary
condition U(x, 0) along S.
For A in an infinite plane, i.e., both for z > 0, and z < 0, consider that there is an arbitrary
displacement discontinuity uz(s) normal to the segment S, which is along the line(z = 0).
The Papkovitch functions can then be obtained using a similar procedure to that which
Rongved and Murray Hill (1957) used for a two-dimensional dislocation problem. The
equation (3.10) can be written as follows,
Dz(x,z) = i^fuz(^)ln[(x-^)2-rz2]2d^
KdZJs (3 n )
where D z (x, z) is harmonic in z > 0, Dz(x,z) is equal to uz(s) over S, and equal to zero over
the remaining portion of z = 0.
Let Bz and p be the Papkovitch functions associated with the half plane which occupies z >
0, and Bz' and P' associated with the other plane z < 0. On z = 0, the following condition
must be satisfied,
azz= CTZZ
axz=Oxz'=0 (3.12)
u x = U x
uz+Dz=uz-, when x in S
where equation (3.12) indicates that the condition that the z- component of the displacement
is continuous across z = 0 except over the segment S, where there is a normal displacement
Chapter 3 Linear Elastic Crack Tip Modeling by the Displacement Discontinuity Method 3-8
discontinuity uz(s). Using equations (3.5) and (3.6), and considering the uniqueness
theorem of the Dirichlet problem (Rongved, 1957), the Papkovitch functions are obtained as
follows,
1 a f -
-*4U B z = " - ^ ^(cJlnUx-tjVzVdc.
's
Similarly, for a shear discontinuity ux(s), the solutions are,
±Ajk©* Bz=-LT7 ^©InKx-^+zVd^
2(1^ 3 O X
K
J |ux ©lnflx-^+zVd^dz
(3.13)
s (3.14)
3.4 Crack Tip Element
For a body with plane z = 0 free from shear stress, or free from normal stress, the
displacements and stresses can be expressed in terms of single-harmonic functions f and c
respectively. For the problem with z = 0 free from both shear and normal tractions, the
displacements and stresses can be deduced by superposition of two parts of the problem
(Crouch, 1976a, 1976b),
Chapter 3 Linear Elastic Crack Tip Modeling by the Displacement Discontinuity Method 3-9
3d> 3 Y a 3 y a d>
»^2o-,)|i-(1-2,)^+^(||+||)
and,
a^ ad> ay ay ax =2|i(—^ + z—^- + 2 ^- + z * ) xx 2 3 2
dz 3z 3 x3 z 3 x3 z
dz dz
rr O n r 9 ^ - ^ .3% 3d) axz=2^[—i-zaiT3T(3T+-a7)1
a z
(3.15)
(3.16)
The relationships between the two single-harmonic functions d), % and the Papkovitch
functions (Crouch, 1976a) are, in the case of a = 0 on z = 0,
B x = 0
Bl=4(l-u)i± 3 z (3.17)
p = 4(l--o)(l-2u)<|>
And in the case of azz = 0 on z = 0,
Chapter 3 Linear Elastic Crack Tip Modeling by the Displacement Discontinuity Method 3-10
B =0 X
3 y Bz=4(l-t))^
d z (3.18)
P = 8(l-t))2 dz 3z
J Substitoting equations (3.13), (3.14) into equations (3.17), (3.18), the two single-harmonic
functions d) and % are determined,
^(x,z) = * -ju^)ln[(x-D2+z^d^ d z 47u(l-t))3zJs (319)t
^r(x,z) = -|u^)ln[(x-^)2+z¥d^ d z 47i(l-t))3xJs
In order to represent the V r variation in the displacements at the crack tip, the variable
displacement discontinuities u ^ ) andux(£) in equations (3.19) may be defined along the
crack tip element (2a) as shown in Figure 3.2,
t 1
uz(£) = D z ( ^ ) 2 a (3.20)
u x(cJ=D x(!)2 a.
t The first part of equations (3.19) has appeared in reference (Crouch, 1976a), however, to
the author's knowledge, its derivation and the second equation have not appeared in
references.
Chapter 3 Linear Elastic Crack Tip Modeling by the Displacement Discontinuity Method 3-11
where Dz, Dx are values of the normal and shear displacement discontinuities in the middle
position (x = a), a is the half length of the crack tip element, and ^ is the distance along the
crack from the crack tip. Substituting equations (3.20) and (3.19) into the equations (3.15)
and (3.16), the displacements and stresses due to uz(v and ux(s) can be expressed in terms
of Dz, Dx, and a crack tip element is formed. Incorporating this crack tip element with the
ordinary displacement discontinuity (DD) element (Crouch, 1976b), a crack problem can be
analyzed more accurately. The accuracy improvement is shown in the following example.
For a crack with length 2a in an infinite plane normal to the applied tensile stress, the opening
displacement distribution along the crack (Irwin, 1956) is,
-.. 2(1-1)) n x\i uz(x) = aa(l- —)2 M- a (3.21)
where (x,z) are co-ordinates based on the centre of the crack.
Figures 3.3(a,b) show comparisons of the analytical values with the numerical results with
and without the special crack tip element. The percentage discrepancies between the
computed displacement in the crack tip (in the middle of crack tip element) and the
corresponding analytical value has decreased from 27% (without the special crack tip
element) to 9% (with the special crack tip element) in the case where the crack is discretized
by 10 equal sized elements; and from 26% to 8% in the case of 20 equal sized elements.
3.5 Theories on Crack Propagation
Several theories have been proposed to study the crack propagation problem. The maximum
tensile stress theory was formulated by Erdogan and Sih (1963), while the strain energy
density theory was developed by Sih (1973a). Based on the Griffith - Irwin energy criterion,
in which the direction of crack propagation is predicted from the maximum value of the strain
Chapter 3 Linear Elastic Crack Tip Modeling by the Displacement Discontinuity Method 3-12
energy release rate, Hussian, Pu and Underwood (1974) provided a formula to calculate the
strain energy release rate from stress intensity factors, and then to predict the crack
propagation path. All the three theories have been applied to rock crack propagation problems
by Ingraffea (1981). The comparison between them was given by Ingraffea (1981), Matti
and Smith (1983, 1984), and Chang (1981).
In the work, the original Griffith-Irwin energy criterion (see, for example, Lawn and
Wilshaw, 1975b) and the maximum tensile stress criterion (Erdogan and Sih, 1963) are
considered. The Griffith-Irwin energy criterion states that when the strain energy release rate
G exceeds the critical strain energy release rate Gc, which is a material property, propagation
is initiated. The criterion indicates that the orientation of an incremental extension of a crack
will be that which maximizes the decrease in the strain energy release rate. The propagation
will continue as long as there is sufficient energy, i.e., G > Gc at the current crack position.
To apply this criterion, G needs to be calculated with a small crack extension in every
possible direction. The probable crack initiation angle can be determined in the direction
along which the strain energy release rate approaches its maximum, i.e., Gmax-
The maximum tensile stress theory has been found by many investigators (Swedlow, 1975,
Matti and Smith, 1983,1984, and Chang, 1981)to be reliable and consistent, which gives a
realistic solution for various problems, and involves the least amount of calculation.
The parameter governing crack propagation in the maximum tensile stress theory is the
maximum circumferential tensile stress near the crack tip. Equation (3.1) can be rewritten as
follows,
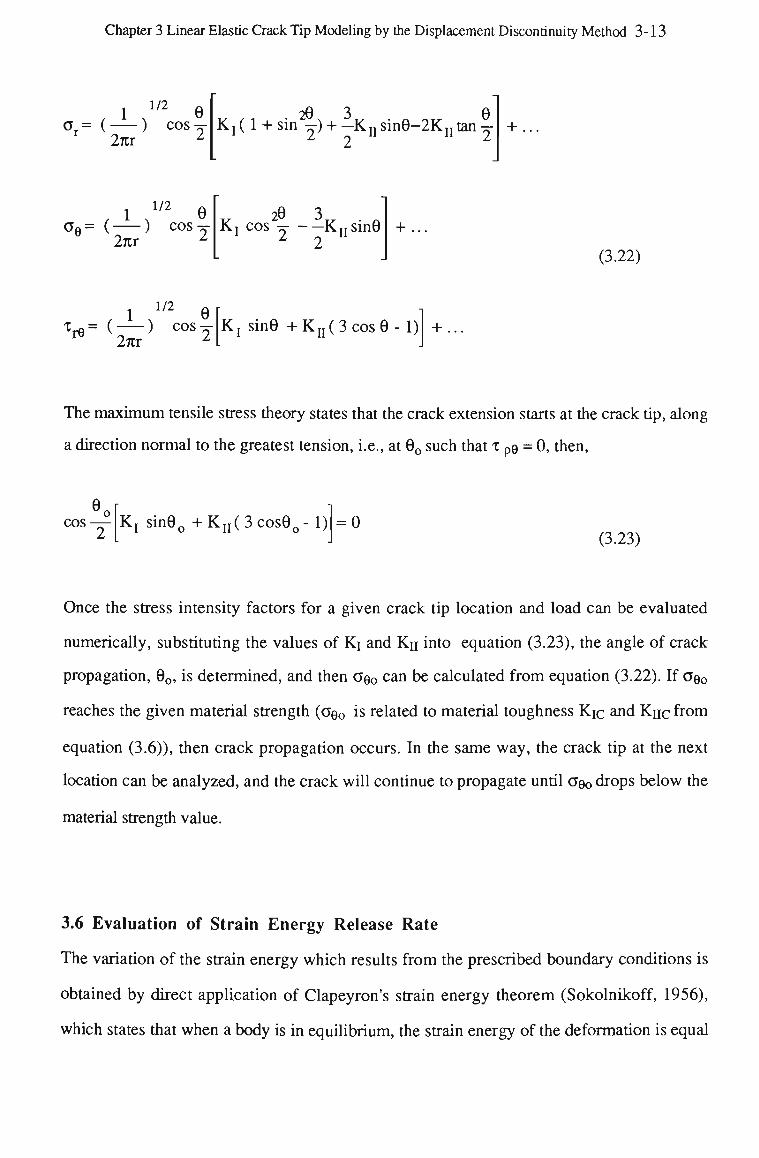
Chapter 3 Linear Elastic Crack Tip Modeling by the Displacement Discontinuity Method 3-13
1 m 8 o = (—) cosT
2KT 2
20 3 Q Kj(1 + sin y ) + —K n sin0-2K n tan •=• +
i m e ae= (—) cosT
2:tr 2
t l ^1/2 6
20 3 KT cos y Knsin6
z 2
+
"ie- 27cr K j sinG + K n ( 3 c o s 0 - 1 ) +
(3.22)
The maximum tensile stress theory states that the crack extension starts at the crack tip, along
a direction normal to the greatest tension, i.e., at 0 O such that x pe = 0, then,
0. cos Kj sin0o + K n ( 3 c o s 0 o - 1) = 0
(3.23)
Once the stress intensity factors for a given crack tip location and load can be evaluated
numerically, substituting the values of Ki and K n into equation (3.23), the angle of crack
propagation, 0O, is determined, and then OQQ can be calculated from equation (3.22). If OQ0
reaches the given material strength (GQQ is related to material toughness Kic and KTJC from
equation (3.6)), then crack propagation occurs. In the same way, the crack tip at the next
location can be analyzed, and the crack will continue to propagate until OQQ drops below the
material strength value.
3.6 Evaluation of Strain Energy Release Rate
The variation of the strain energy which results from the prescribed boundary conditions is
obtained by direct application of Clapeyron's strain energy theorem (Sokolnikoff, 1956),
which states that when a body is in equilibrium, the strain energy of the deformation is equal
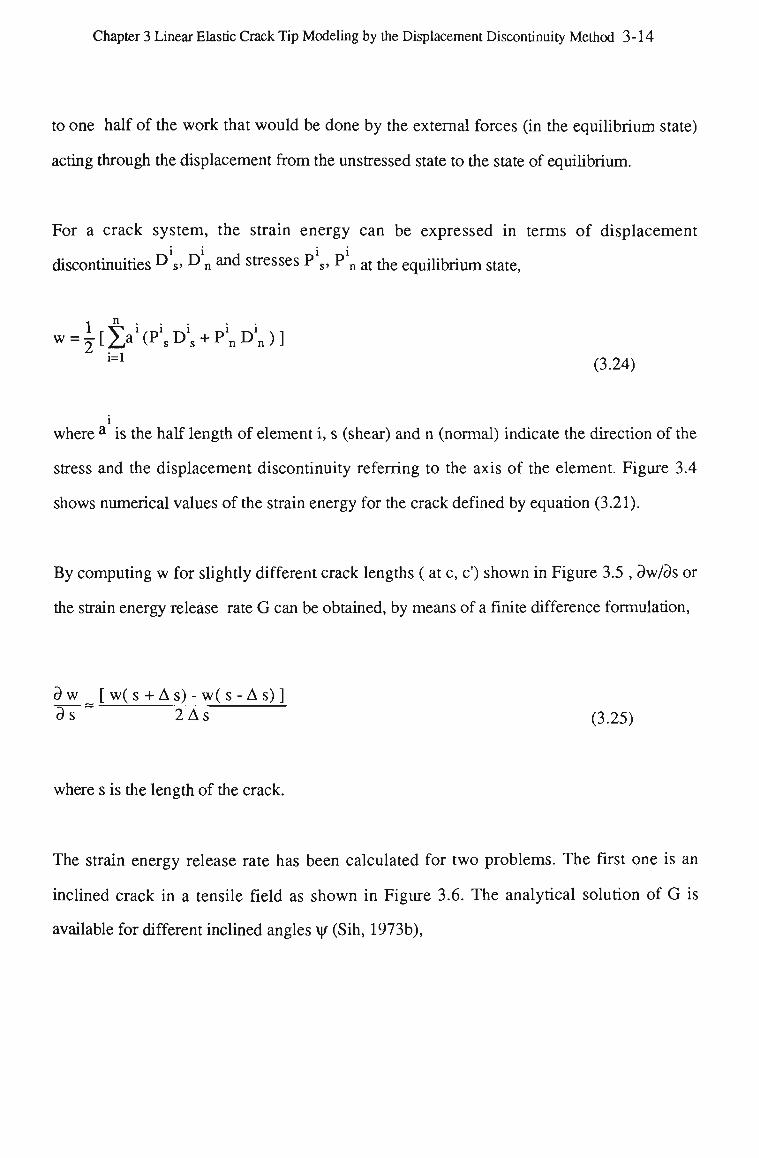
Chapter 3 Linear Elastic Crack Tip Modeling by the Displacement Discontinuity Method 3-14
to one half of the work that would be done by the external forces (in the equilibrium state)
acting through the displacement from the unstressed state to the state of equilibrium.
For a crack system, the strain energy can be expressed in terms of displacement
discontinuities D s, D n and stresses P s> P n at the equilibrium state,
w = i [ t a i ( P is D
is + P
inDin)]
i=1 (3.24)
i
where a is the half length of element i, s (shear) and n (normal) indicate the direction of the
stress and the displacement discontinuity referring to the axis of the element. Figure 3.4
shows numerical values of the strain energy for the crack defined by equation (3.21).
By computing w for slightly different crack lengths ( at c, c') shown in Figure 3.5 , 3w/3s or
the strain energy release rate G can be obtained, by means of a finite difference formulation,
3 w _ [ w( s + A s) - w( s - A s) ]
3 s ~ ~ 2 A s (3.25)
where s is the length of the crack.
The strain energy release rate has been calculated for two problems. The first one is an
inclined crack in a tensile field as shown in Figure 3.6. The analytical solution of G is
available for different inclined angles \j/ (Sih, 1973b),
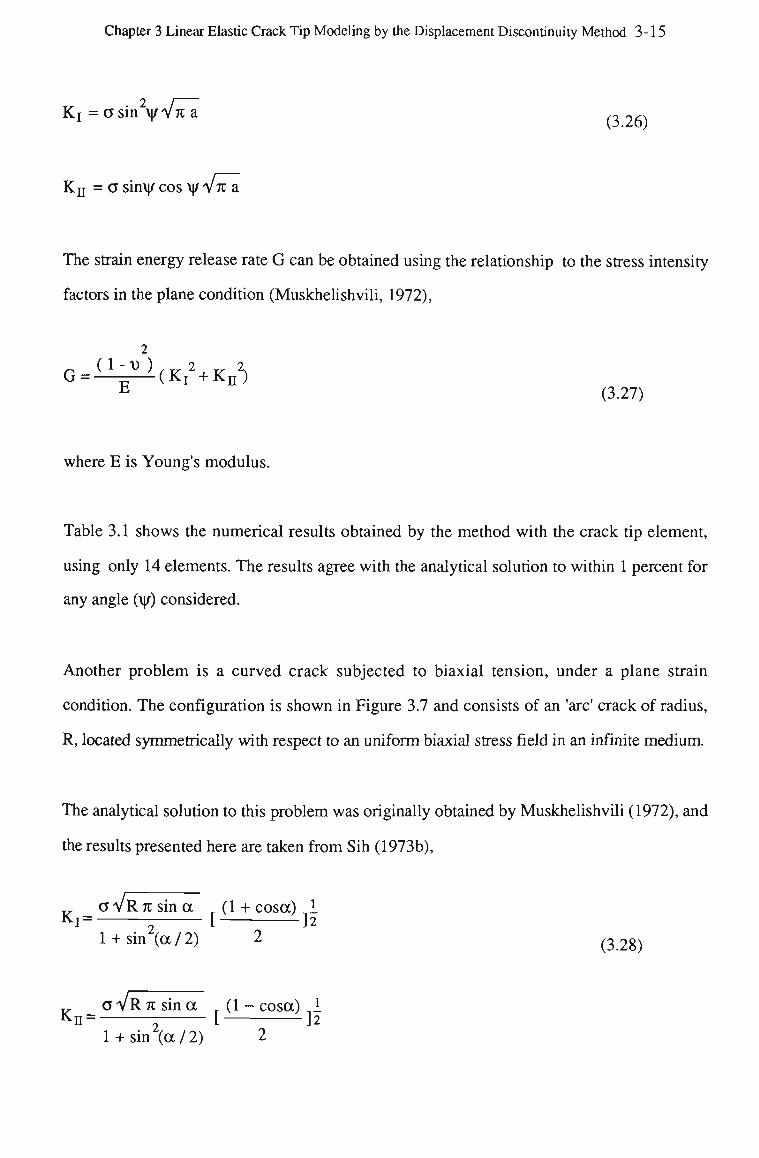
Chapter 3 Linear Elastic Crack Tip Modeling by the Displacement Discontinuity Method 3-15
K j = a sin y v n a ,~ 26\
K n = a sinxj/ cos y VTC a
The strain energy release rate G can be obtained using the relationship to the stress intensity
factors in the plane condition (Muskhelishvili, 1972),
2
G = — - — ( K T + Knj E (3.27)
where E is Young's modulus.
Table 3.1 shows the numerical results obtained by the method with the crack tip element,
using only 14 elements. The results agree with the analytical solution to within 1 percent for
any angle (\|/) considered.
Another problem is a curved crack subjected to biaxial tension, under a plane strain
condition. The configuration is shown in Figure 3.7 and consists of an 'arc' crack of radius,
R, located symmetrically with respect to an uniform biaxial stress field in an infinite medium.
The analytical solution to this problem was originally obtained by Muskhelishvili (1972), and
the results presented here are taken from Sih (1973b),
_. aVRrcsina r (1 + cosa) ,1 KI = ^ t J2
1 +sin (a/2) 2 (3 28)
v a V R JC sin a _ (1 - cosa) ,1 K n = [ ] 2
l + sin(a/2) 2
Chapter 3 Linear Elastic Crack Tip Modeling by the Displacement Discontinuity Method 3-16
Using equation (3.28), G can be determined from equation (3.27) analytically. Table 3.2
shows that the numerical results obtained are consistent and accurate through the range of oc's
considered, even with a small number of elements. The percentage discrepancies between the
numerical and analytical values are within 2 for all a's considered. These results confirm the
suitability of the proposed method for complex crack configurations involving mixed mode
behaviour.
The strain energy release rate calculated above, in most cases, gives no indication of the path
that the crack is likely to take, and how much energy is required to initiate that crack
propagation, which is related to the propagation path. The Griffith-Irwin energy criterion
indicates that the orientation of an incremental extension of a crack will be that which
maximizes the decrease in the strain energy release rate. To apply this criterion, G(0) needs
to be calculated with every possible crack extension angle 0. The probable crack initiation
angle 0O can be determined when G(0) approaches its maximum, i.e., G(0)max-
For the problem shown in Figure 3.6, G(0) is calculated for different inclined angles y. The
numerical results are normalized to G ( 0 ) m a x with \\f = 90°, and are shown in Figure 3.8. As
can be seen, G(0) varies as 0 changes, and reaches its m a x i m u m at different 0O, for different
values of \|/. The direction 0 O is defined as the probable direction of the crack propagation.
The negative values of 0O decrease when \|/ increases, which indicates that the smaller the
inclined angle \|/, the more energy(or loading) is required to initiate crack propagation. The
differences between G(0n) and those G(0=O) indicate the importance of the study on crack
propagation.
Chapter 3 Linear Elastic Crack Tip Modeling by the Displacement Discontinuity Method 3-17
Table 3.3 shows the values of 0O for the various \|/ taken from Figure 3.8 and is compared
with available experimental and analytical results. It can be seen that excellent results are
obtained by the numerical method.
The propagation of a crack can be easily modelled by the numerical method with the
maximum tensile stress and the maximum strain energy release rate theories stated above in
this chapter. Algorithmically, for example, G(0) is calculated for a given crack tip location
with a small extension in every possible direction 0. If, G(0O) > Gc, the extension along 0O
is executed, the extension itself is then automatically transformed to a crack tip element.
G(0) is calculated with this new crack tip element to determine the possible further
propagation. The cumputing flowchart for the modelling is shown in Figure 3.9.
A well-studied crack propagation problem (Figure 3.6) is selected to verify the applicability
of the method to crack propagation modelling. Figure 3.10 shows the predicted crack
propagation path of a crack inclined at \|/ = 60° to the direction of the remote applied tensile
stress. The crack starts its propagation along a direction with about 0 = - 40°, then gradually
changes its propagation to the direction which is normal to the applied tensile stress. This
phenomenon was also observed by Erdogan and Sih (1963).
Perhaps one of the important potential developments of this method will be the case of
handling the crack problem in compression with friction. This benefit arises as the element in
this method is easy to be transformed into a 'physical' element from a 'mathematical' element
as demonstrated by Crouch (1976b). Most of the conventional theories mentioned previously
are derived from a 'traction free' crack, and some difficulties associated with the application
of them to predict crack propagation in compression have been reported (Swedlow, 1975,
Chang, 1981 , and Matti and Smith, 1983, 1984). The 'physical* element allows
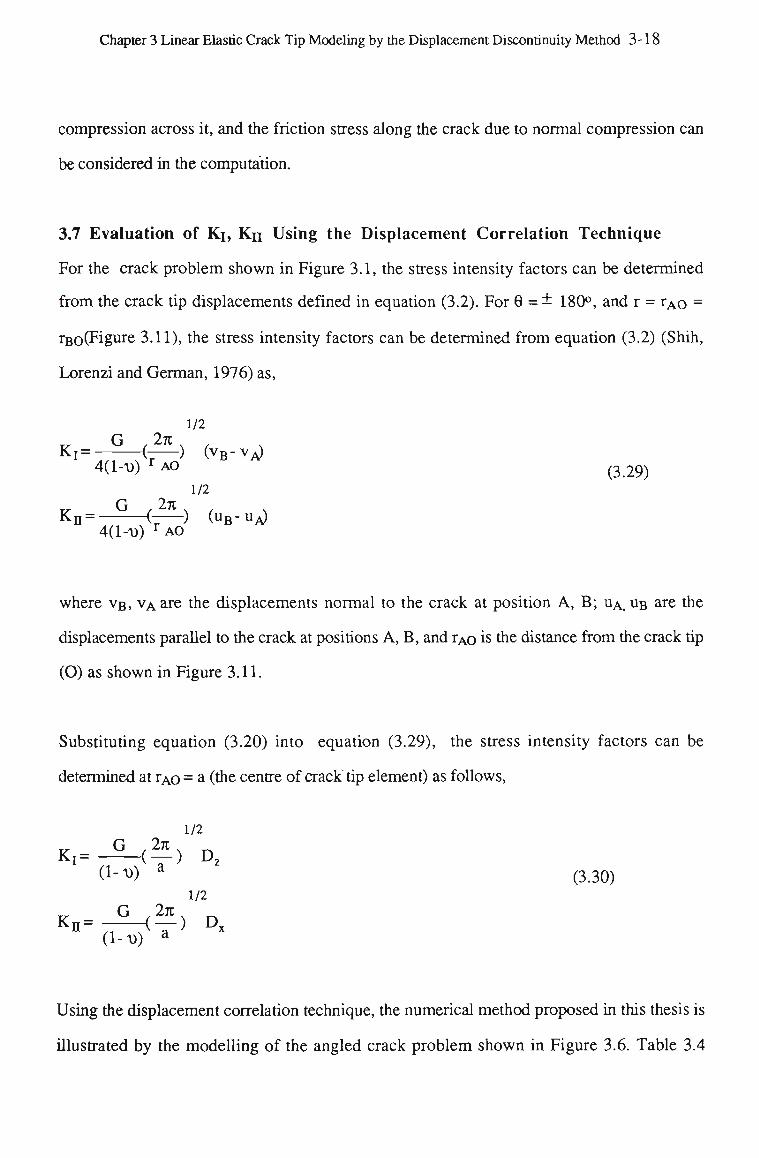
Chapter 3 Linear Elastic Crack Tip Modeling by the Displacement Discontinuity Method 3-18
compression across it, and the friction stress along the crack due to normal compression can
be considered in the computation.
3.7 Evaluation of KT, Kn Using the Displacement Correlation Technique
For the crack problem shown in Figure 3.1, the stress intensity factors can be determined
from the crack tip displacements defined in equation (3.2). For 0 = ± 180°, and r = rAo =
rfio(Figure 3.11), the stress intensity factors can be determined from equation (3.2) (Shih,
Lorenzi and German, 1976) as,
1/2
K^-^-A (VB-VA) 4(1-0)) r AO (3 29)
1/2
Kn = ——<-—) (UB-UJO 4(1-0)) r A O
where V B , V A are the displacements normal to the crack at position A, B; UA, U B are the
displacements parallel to the crack at positions A, B, and TAO is the distance from the crack tip
(O) as shown in Figure 3.11.
Substituting equation (3.20) into equation (3.29), the stress intensity factors can be
determined at TAO = a (the centre of crack tip element) as follows,
1/2
Kl=_^) Dz
d-D) a (3.30) 1/2
Kn=-G_^) Dx (1-0)) a
Using the displacement correlation technique, the numerical method proposed in this thesis is
illustrated by the modelling of the angled crack problem shown in Figure 3.6. Table 3.4
Chapter 3 Linear Elastic Crack Tip Modeling by the Displacement Discontinuity Method 3-19
shows comparisons of computed values of Ki, Kn with those derived from equation (3.26),
and computed values of 0 O with those reported by Erdogan and Sih (1963). The crack (2a)
is discretized into 9 equal sized elements. It can be seen that the numerical values are in close
agreement with the analytical solutions and the experimental evidence.
Furthermore, the crack propagation paths are computed with various inclined angles \|/, and
the results are shown in Figure 3.12. The corresponding tensile stress concentrations are
shown in Figure 3.13. It can be seen from Figure 3.12 that the crack propagation paths are,
in general, curvelinear. The crack propagation paths start with the angle 0 O as reported in
Table 3.4, and gradually change their direction, and finally propagate along a direction
normal to the tensile stress a. Figure 3.13 indicates that the tensile stress concentration at the
crack tip increases, i.e., the load requirement for crack propagation decreases as the crack
inclined angle \|/ increases. Also, for any angle \|/, the tensile stress concentration increases
generally as crack propagation continues, indicating an unstable crack condition. All these
results are in agreement with the experimental observations reported previously (Erdogan,
and Sih, 1963).
Comparing with the modelling using Griffith-Irwin criterion, the maximum tensile stress
criterion give slightly less accurate, but reasonable evaluation on the fracture mechanics
parameters involved. However, the modelling with m a x i m u m tensile stress criterion needs
much less computing time than that with Griffith-Irwin criterion, as the calculation involved
are much less than that with Griffith-Irwin criterion as shown in Figure 3.9. Therefore, the
maximum tensile stress criterion is selected for the later rock cutting modelling work in this
thesis.
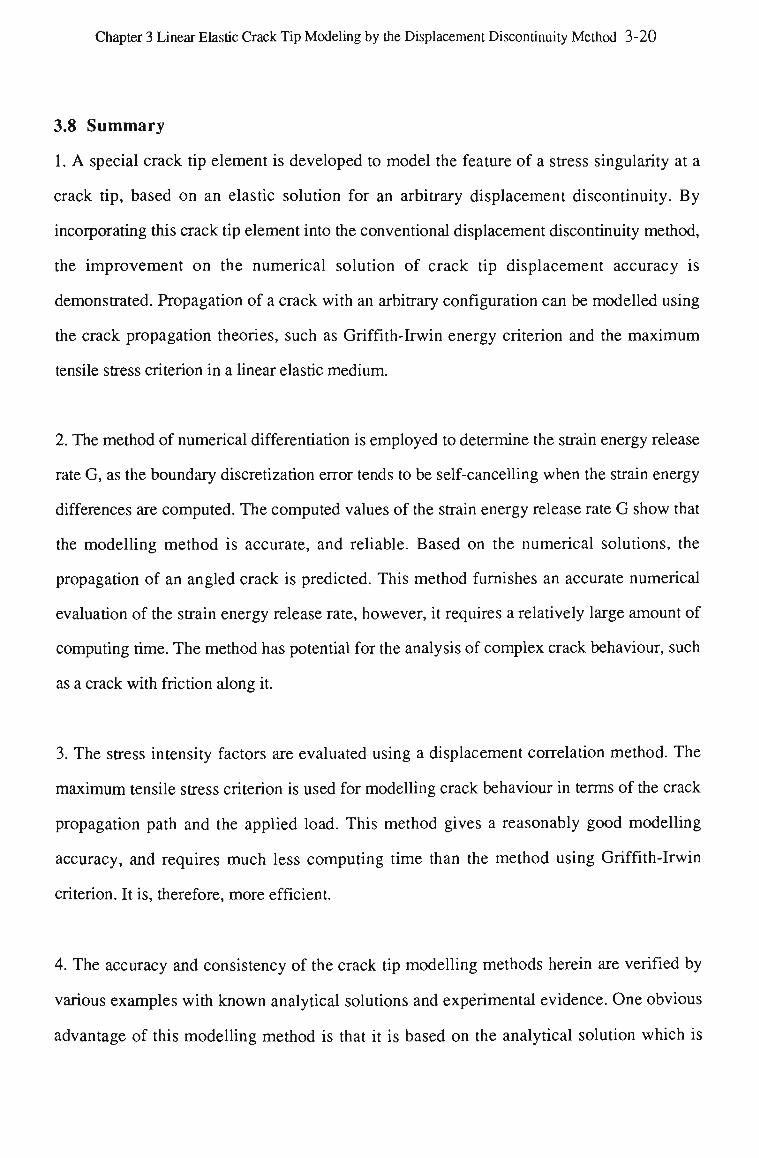
Chapter 3 Linear Elastic Crack Tip Modeling by the Displacement Discontinuity Method 3-20
3.8 Summary
1. A special crack tip element is developed to model the feature of a stress singularity at a
crack tip, based on an elastic solution for an arbitrary displacement discontinuity. By
incorporating this crack tip element into the conventional displacement discontinuity method,
the improvement on the numerical solution of crack tip displacement accuracy is
demonstrated. Propagation of a crack with an arbitrary configuration can be modelled using
the crack propagation theories, such as Griffith-Irwin energy criterion and the maximum
tensile stress criterion in a linear elastic medium.
2. The method of numerical differentiation is employed to determine the strain energy release
rate G, as the boundary discretization error tends to be self-cancelling when the strain energy
differences are computed. The computed values of the strain energy release rate G show that
the modelling method is accurate, and reliable. Based on the numerical solutions, the
propagation of an angled crack is predicted. This method furnishes an accurate numerical
evaluation of the strain energy release rate, however, it requires a relatively large amount of
computing time. The method has potential for the analysis of complex crack behaviour, such
as a crack with friction along it.
3. The stress intensity factors are evaluated using a displacement correlation method. The
maximum tensile stress criterion is used for modelling crack behaviour in terms of the crack
propagation path and the applied load. This method gives a reasonably good modelling
accuracy, and requires much less computing time than the method using Griffith-Irwin
criterion. It is, therefore, more efficient.
4. The accuracy and consistency of the crack tip modelling methods herein are verified by
various examples with known analytical solutions and experimental evidence. One obvious
advantage of this modelling method is that it is based on the analytical solution which is

Chapter 3 Linear Elastic Crack Tip Modeling by the Displacement Discontinuity Method 3-21
accurate near the crack tip, and the established DD method which is reasonably accurate at
distances remote from the crack tip.
5. The numerical technique using the maximum tensile stress criterion is selected for the later
rock cutting modelling work because of its efficiency for the analyses of simple friction-free
cracks.
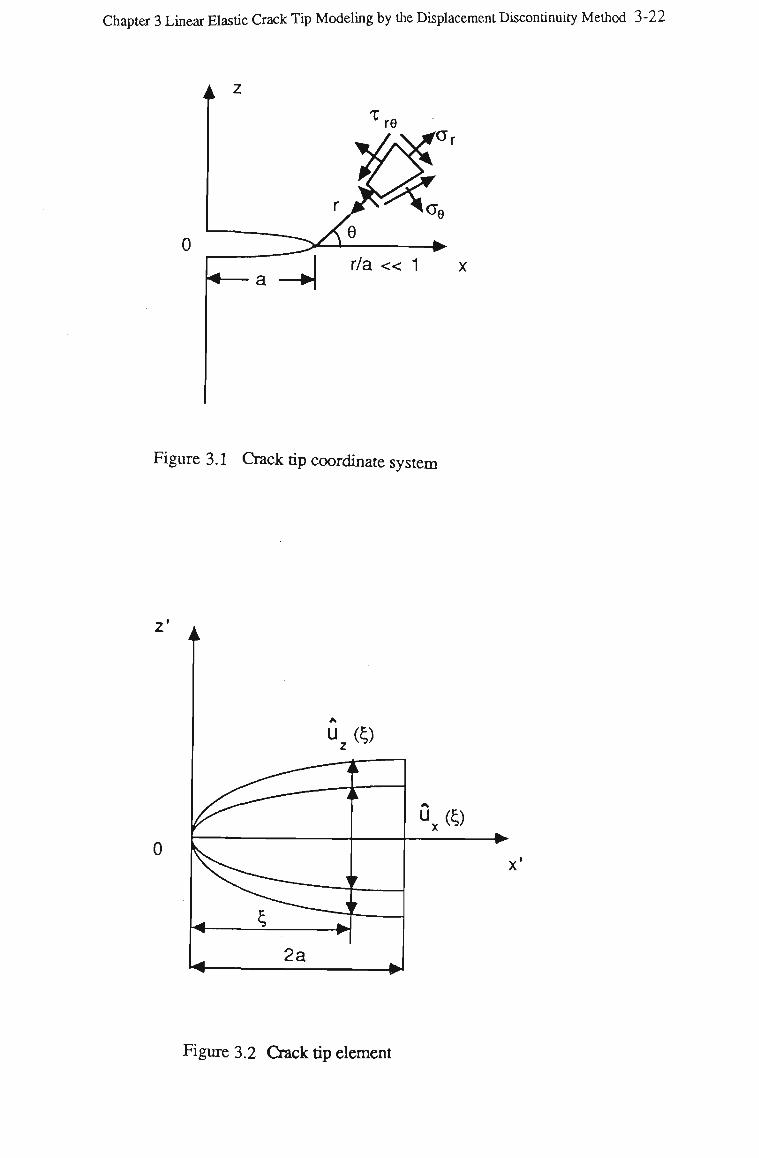
Chapter 3 Linear Elastic Crack Tip Modeling by the Displacement Discontinuity Method 3-22
A 2
0 r/a « 1 x
Figure 3.1 Crack tip coordinate system
Figure 3.2 Crack tip element
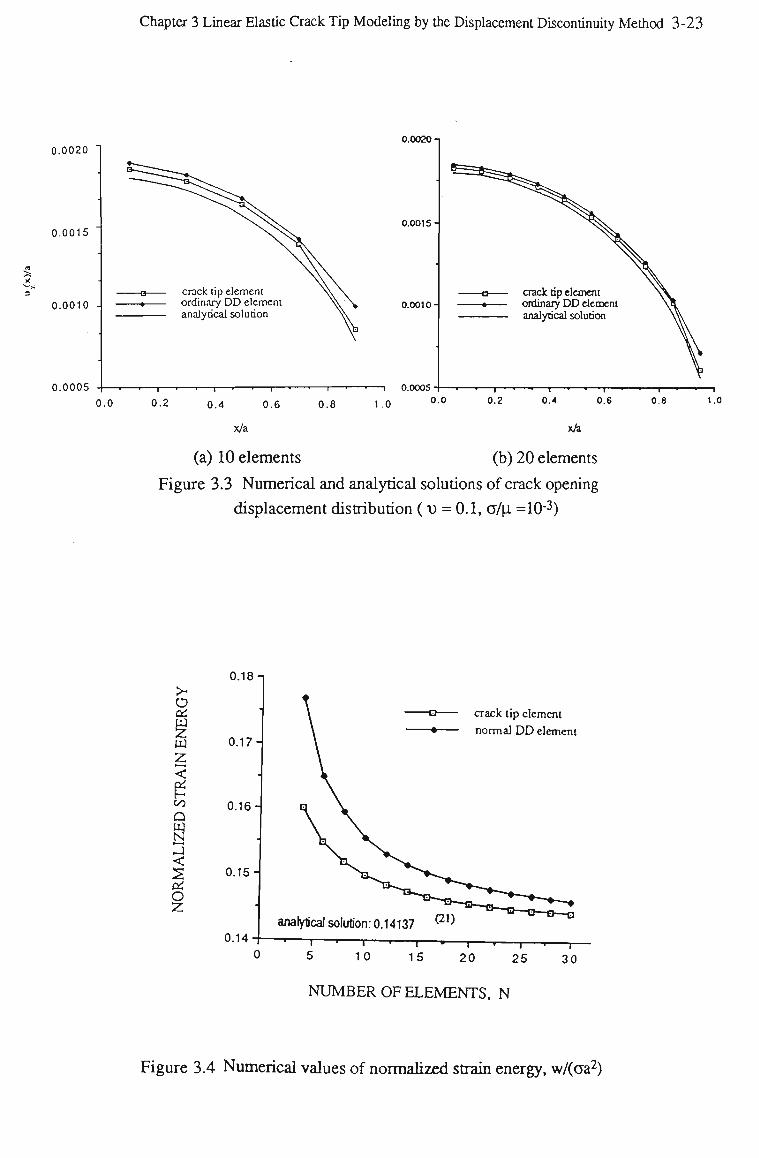
Chapter 3 Linear Elastic Crack Tip Modeling by the Displacement Discontinuity Method 3-23
0.0020 0.0020
0.0015
0.0010 -crack tip element ordinary D D element analytical solution
0.001 S-
0.0010-
0.0005 -| . • 1 • 1 1 • 1 1 • • r
0.0 0.2 0.4 0.6 0.8 1.0
1 0.0005 -( r
0.0
— crack tip element -» ordinaiy D D element
analytical solution
— i — i — i — • « • — i — • — > — i —
0.2 0.4 0.6 0 8
x/a x/a
(a) 10 elements (b) 20 elements
Figure 3.3 Numerical and analytical solutions of crack opening
displacement distribution (0) = 0.1, a/p. =103)
- • — i
t.o
a
V)
a
8 < oi O 2
0.18-1
0.17-
0.16-
0.15-
a crack tip clement
•• normal D D element
analytical solution: 0.14137 ^ anaryncaiso 0.14-| r——, r i • 1 ' I • 1 . 1 —
0 5 10 15 20 25 30
N U M B E R OF ELEMENTS, N
Figure 3.4 Numerical values of normalized strain energy, w/(aa2)
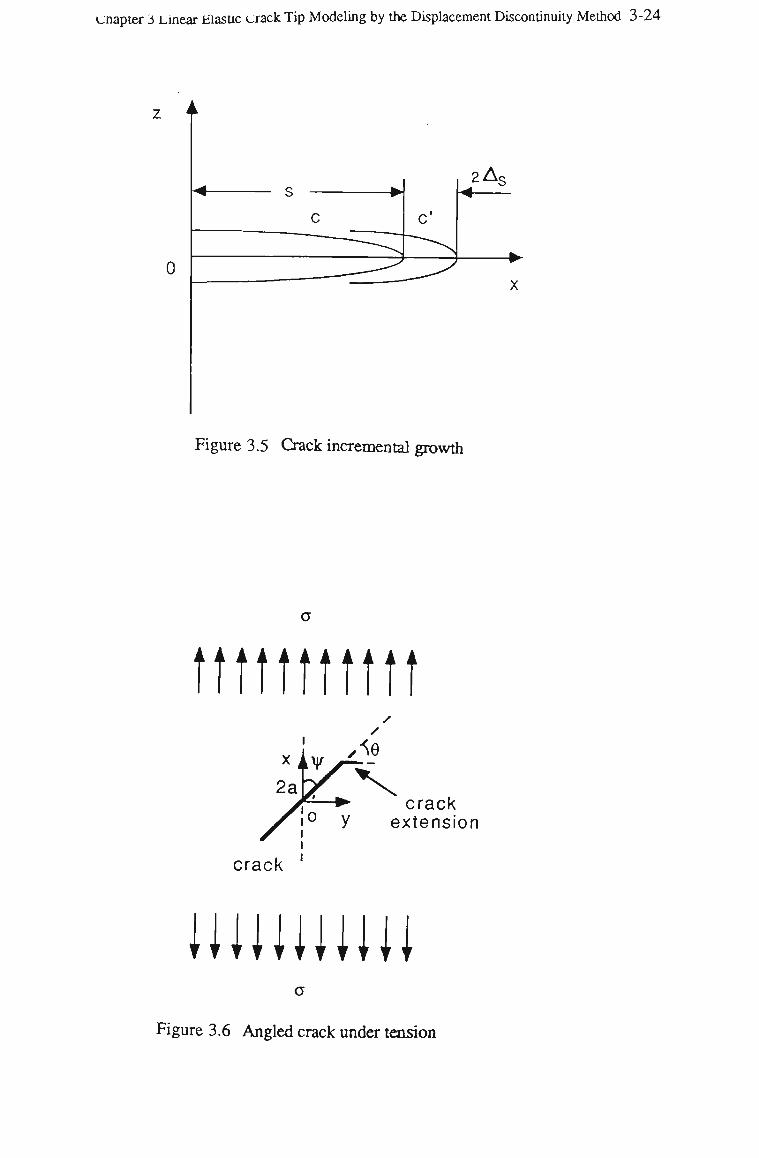
cnapter 3 Linear Elasttc crack Tip Modeling by the Displacement Discontinuity Method 3-24
0
2AS
* s • M
c c*
r_ x
Figure 3.5 Crack incremental growth
fttttttfttt
crack
crack y extension
wwww Figure 3.6 Angled crack under tension
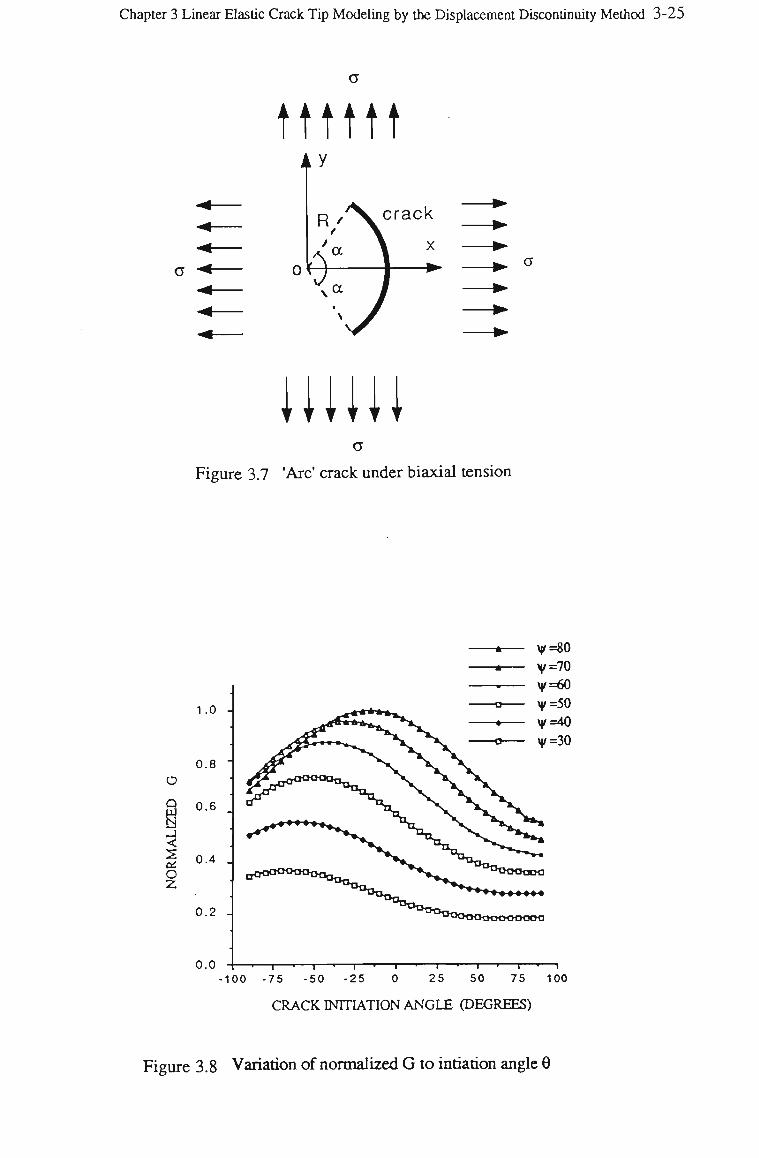
Chapter 3 Linear Elastic Crack Tip Modeling by the Displacement Discontinuity Method 3-25
O
tttttt
crack
mm Figure 3.7 'Arc' crack under biaxial tension
a
1.0 -
0.8 "
0.6
1 | 0.4 O 2 0.2
0.0 -100
— r -
•75 —r— 25
— r — 50 -50 -25 0 25 50 75 100
CRACK INITIATION ANGLE (DEGREES)
Figure 3.8 Variation of normalized G to intiation angle 0
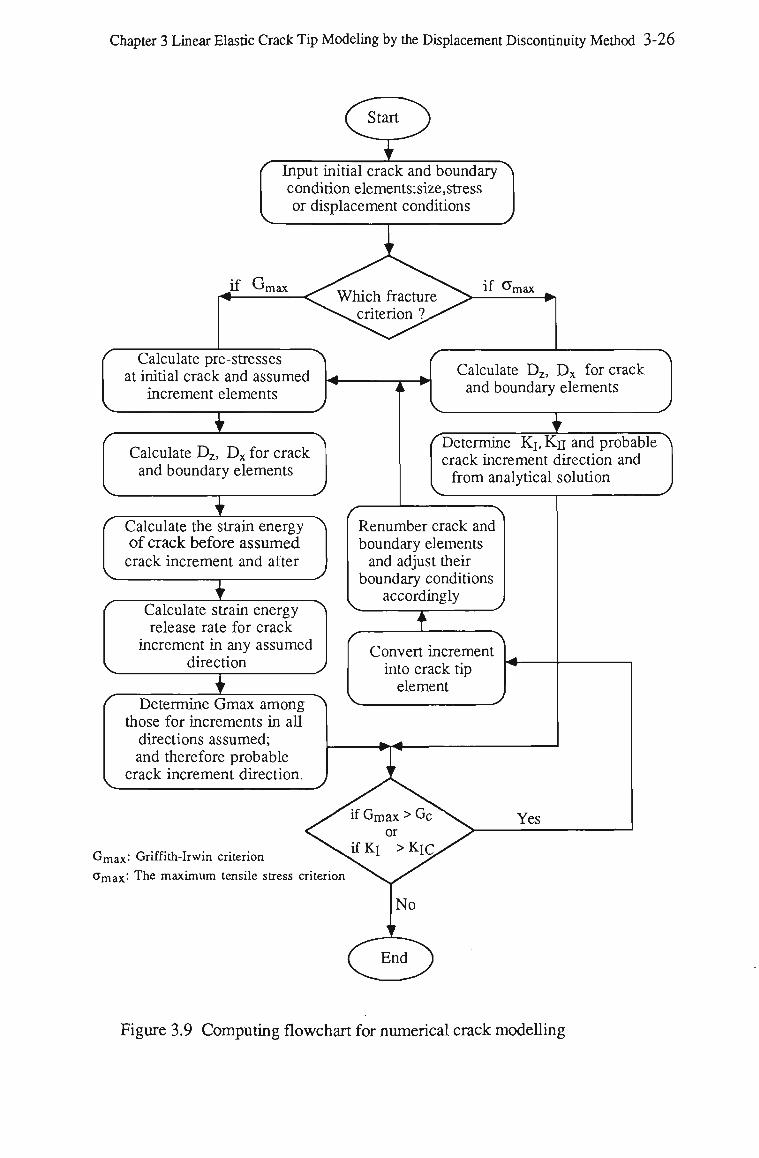
Chapter 3 Linear Elastic Crack Tip Modeling by the Displacement Discontinuity Method 3-26
Q Start J
Input initial crack and boundary condition elements:size,stress or displacement conditions
if G max if a max
Calculate pre-stresses at initial crack and assumed
increment elements
I Calculate Dz, D x for crack and boundary elements
I
Calculate D2, D x for crack and boundary elements
i rDetermine KJ.,KTJ and probable crack increment direction and from analytical solution
Calculate the strain energy of crack before assumed crack increment and after
J Calculate strain energy release rate for crack
increment in any assumed direction )
I Determine G m a x among those for increments in all directions assumed; and therefore probable
crack increment direction.
Renumber crack and boundary elements and adjust their
boundary conditions accordingly
Convert increment into crack tip element
G m a x : Griffith-Irwin criterion
a m a x : The maximum tensile stress criterion
No
End
Figure 3.9 Computing flowchart for numerical crack modelling
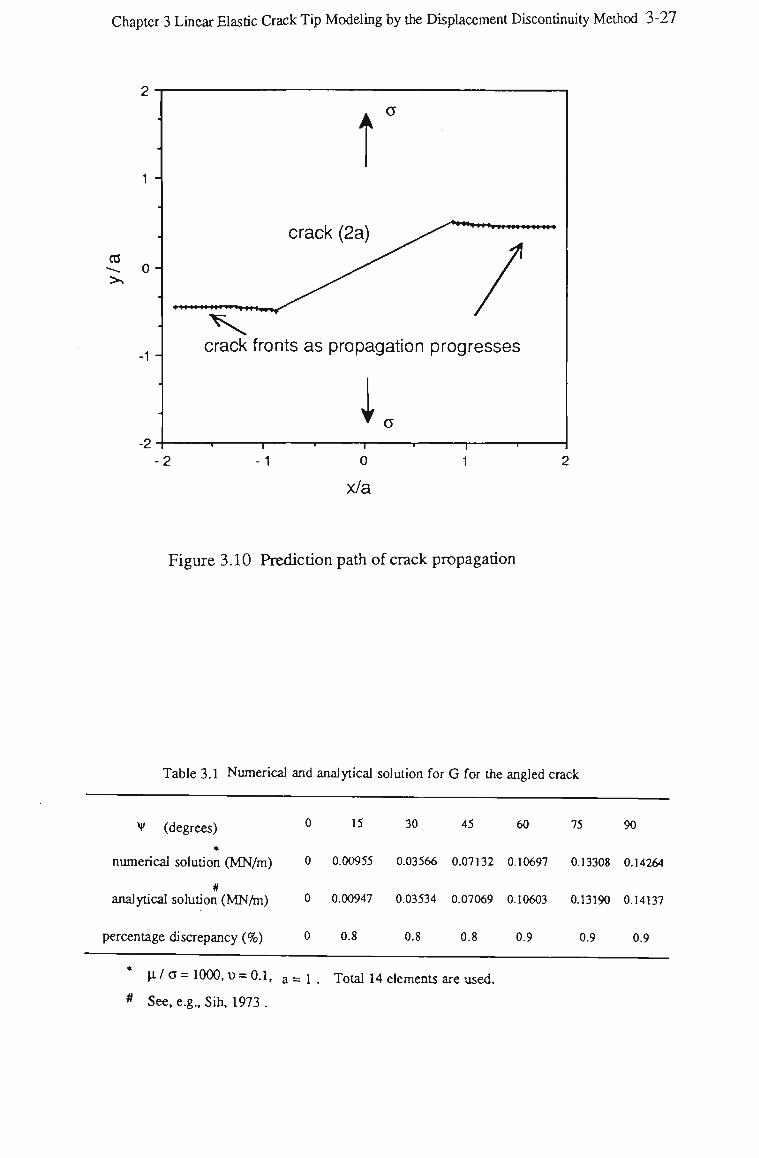
Chapter 3 Linear Elastic Crack Tip Modeling by the Displacement Discontinuity Method 3-27
1 -
cc
-1 -
-2
1 crack (2a) * M<i 99 IIIIMIWI
<tt*tttt»t M »
crack fronts as propagation progresses
i -2
-r~ -1
T 0
x/a
Figure 3.10 Prediction path of crack propagation
Table 3.1 Numerical and analytical solution for G for the angled crack
V (degrees) 0 15 30 45 60 75 90
numerical solution (MN/m) 0 0.00955 0.03566 0.07132 0.10697 0.13308 0.14264
# analytical solution (MNAn) 0 0.00947 0.03534 0.07069 0.10603 0.13190 0.14137
percentage discrepancy (%) 0 0.8 0.8 0.8 0.9 0.9 0.9
u. / a = 1000,-0 = 0.1, a = i . Total 14 elements are used.
# See, e.g., Sih, 1973 .
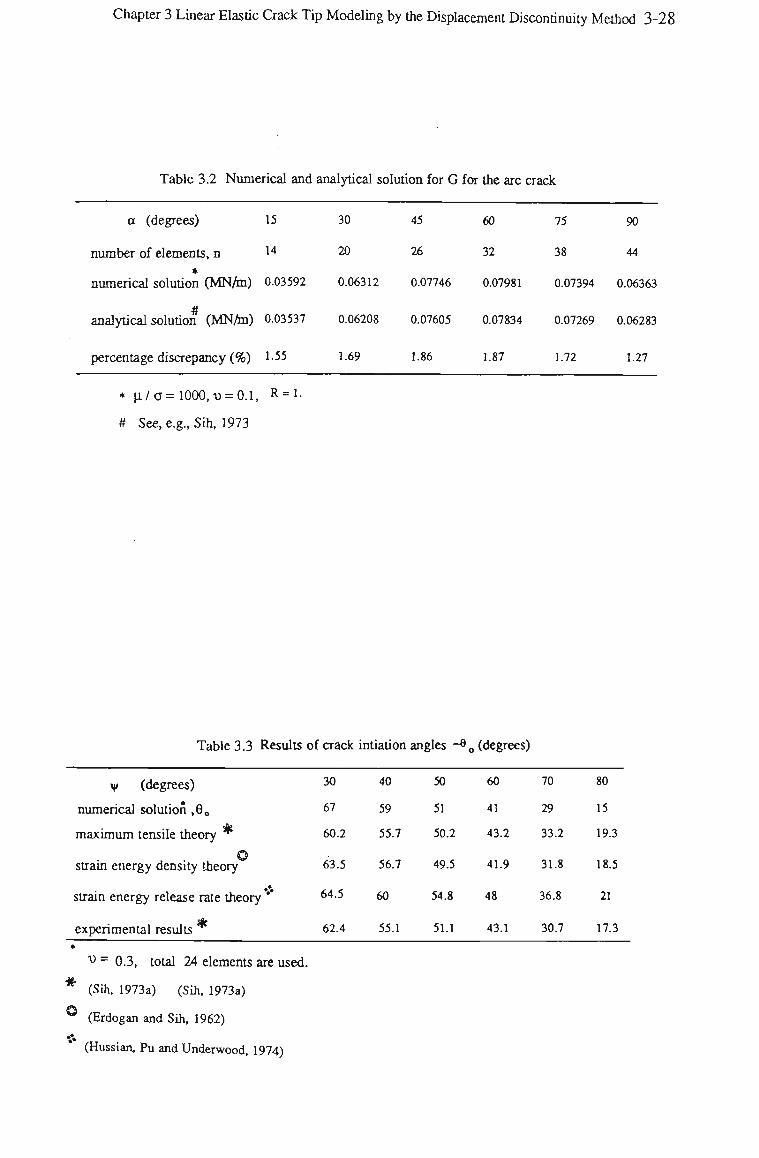
Chapter 3 Linear Elastic Crack Tip Modeling by the Displacement Discontinuity Method 3-28
Table 3.2 Numerical and analytical solution for G for the arc crack
a (degrees) 15
number of elements, n 14
* numerical solution (MN/m) 0.03592
analytical solution (MN/m) 0.03537
percentage discrepancy (%) 1-55 1.69
30 45 60 75 90
20 26 32 38 44
0.06312 0.07746 0.07981 0.07394 0.06363
0.06208 0.07605 0.07834 0.07269 0.06283
1.86 1.87 1.72 1.27
* U/ 0=1000,-0 = 0.1, R = 1-
# See, e.g., Sih, 1973
Table 3.3 Results of crack inflation angles -*0 (degrees)
y (degrees)
numerical solution ,8 0
maximum tensile theory *
O strain energy density theory
strain energy release rate theory **
sk experimental results
30
67
60.2
63.5
64.5
62.4
40
59
55.7
56.7
60
55.1
50
51
50.2
49.5
54.8
51.1
60
41
43.2
41.9
48
43.1
70
29
33.2
31.8
36.8
30.7
80
15
19.3
18.5
21
17.3
©
v - 0.3, total 24 elements are used.
(Sih, 1973a) (Sih, 1973a)
(Erdogan and Sih, 1962)
(Hussian, Pu and Underwood, 1974)
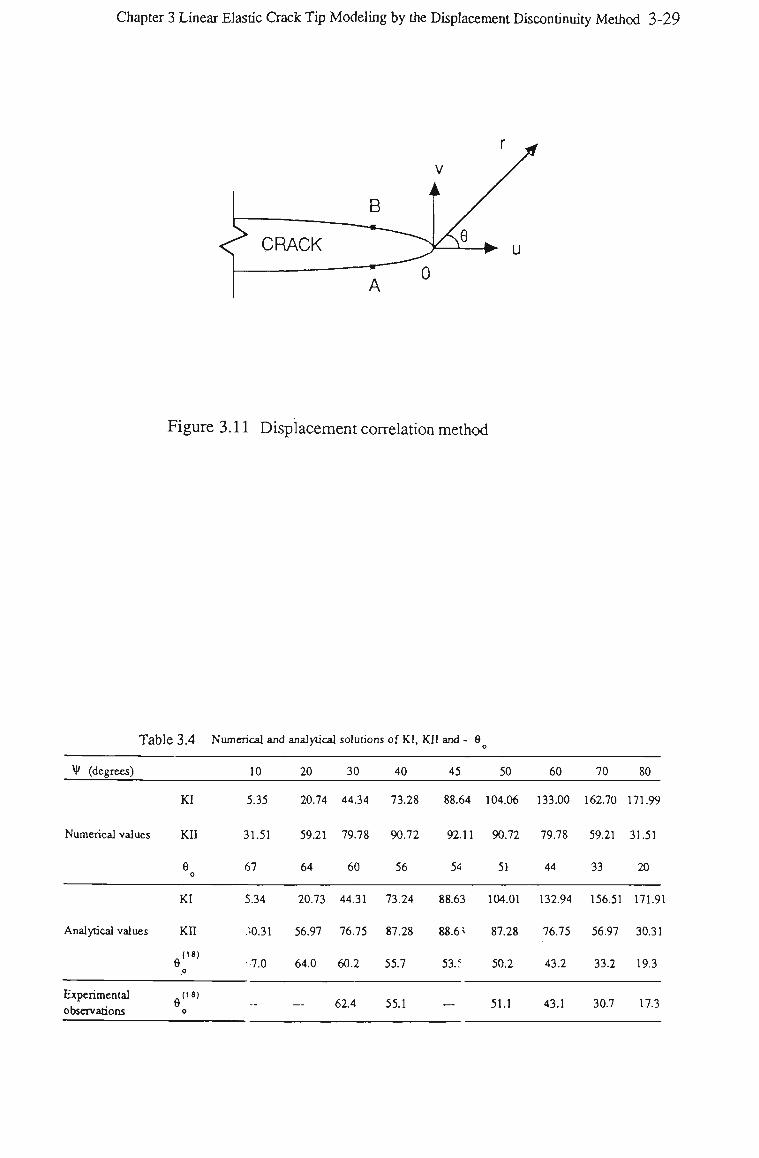
Chapter 3 Linear Elastic Crack Tip Modeling by the Displacement Discontinuity Method 3-29
Figure 3.11 Displacement correlation method
Table 3.4 Numerical and analytical solutions of KI, KJI and - 8
V (degrees) 10 20 30 40 45 50 60 70 80
KI
Numerical values KI1
e
5.35 20.74 44.34 73.28 88.64 104.06 133.00 162.70 171.99
31.51 59.21 79.78 90.72 92.11 90.72 79.78 59.21 31.51
67 64 60 56 54 51 44 33 20
KI
Analytical values KI1
e 0 e ,
Experimental observations
(18)
5.34 20.73 44.31 73.24 88.63 104.01 132.94 156.51 171.91
S0.31 56.97 76.75 87.28 88.6 * 87.28 76.75 56.97 30.31
•7.0 64.0 60.2 55.7 53.f 50.2 43.2 33.2 19.3
— 62.4 55.1 51.1 43.1 30.7 17.3
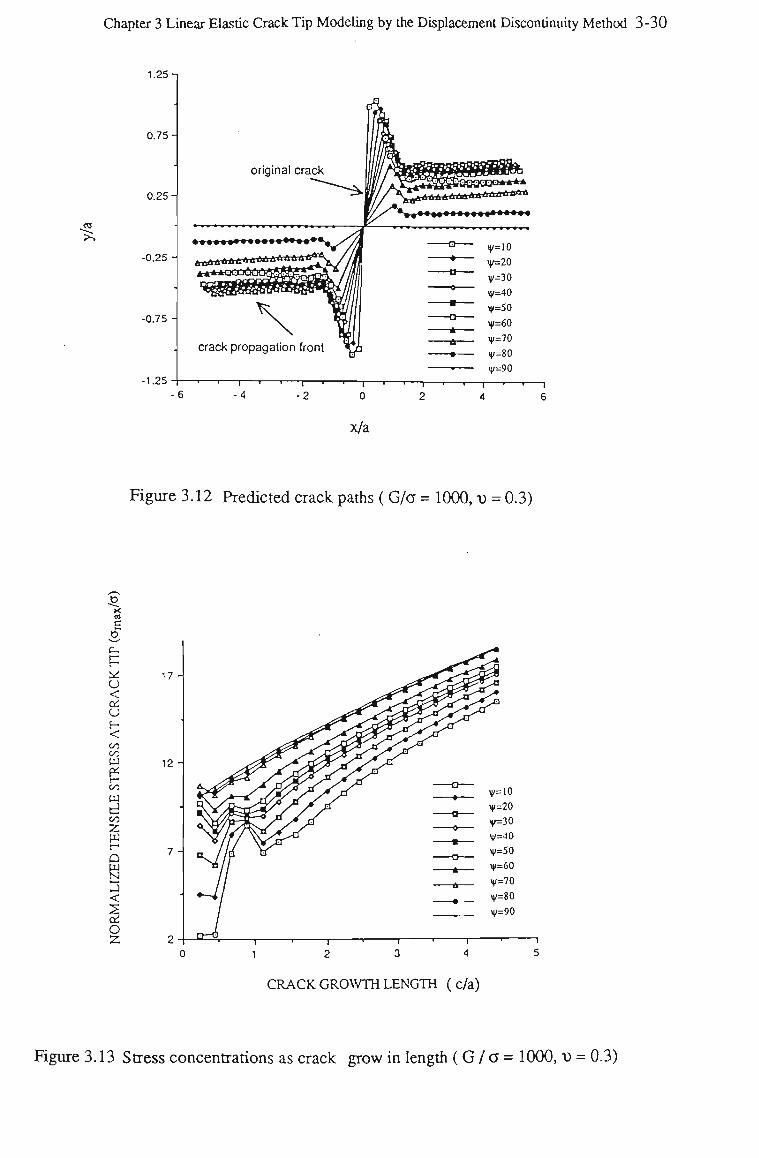
Chapter 3 Linear Elastic Crack Tip Modeling by the Displacement Discontinuity Method 3-30
1.25-1
0.75
0.25
-0.25 -
-0.75 -
-1.25
crack propagation front
- i — r — , — , — . [ —
-4 -2
x/a
Figure 3.12 Predicted crack paths (G/a = 1000, x> = 0.3)
s o
u <
a; u E-< in vz W W
d
Q
<
o 1 2 3 4
CRACK GROWTH LENGTH ( c/a)
Figure 3.13 Stress concentrations as crack grow in length ( G / a = 1000, \) = 0.3)

CHAPTER FOUR
CRACK BEHAVIOURS DUE TO DRAG PICKS
Chapter 4 Crack Behaviour due to Drag Picks 4-1
CHAPTER 4
CRACK BEHAVIOUR DUE TO DRAG PICKS
4.1 Introduction
Drag picks are efficient and versatile cutting tools. The early description of the fragmentation
process due to drag pick cutting has been given by Goodrich (1956), and Fish and Barker
(1956). Three distinct stages of cutting have been defined, they are crushing, crushing and
chipping, and major chip formation stages as reviewed in Chapter 2. Although a considerable
number of experiments has been carried out to provide guide-lines for the design of cutting
heads with drag bits for various cutting machines, the mechanism of the rock fracture
processes involved are not understood satisfactorily. A few rock cutting models have been
proposed to explain the observed behaviour in experiments. Among them the tensile model
proposed by Evans (1962) and the shear models suggested by Potts and Shuttleworth
(1959), and Nishimatsu (1972), are typical. These models assume that tensile or shear
failure occurs along a line, in a two-dimensional plane, with the equilibrium of the major
chip under various force components being considered. The predictions of the cutting force
from these models is in agreement with the experimental results reported (Evans and
Pomeroy, 1966, Roxborough, 1986) over some basic cutting tool parameters, such as, rake
angle, depth of cut and pick width. For example, they all predict that cutting force
requirement decreases as the rake angle of the cutting drag bit increases and the conclusion
from them are similar or close.The examination and comparison between Evans's model and
Nishimatsu's model on cutting forces are given by Roxborough (1986), and shown in Figure
4.1.
The details of these models are described previously in Chapter 2. The basis of all these
models is a discontinuous and repetitive process of a basic material removal by a 'major
chip' formation from the cutting tool tip to the free rock surface. However, little experimental
Chapter 4 Crack Behaviour due to Drag Picks 4-2
evidence of the major chip formation has been published to date, except Evans's early
observation (1962). His experiment involved pushing a steel wedge at slow displacement rate
vertically into small rectangular blocks of rock at the position close one free side of the
specimen, the distance from this position to the free surface is normally defined as cutting
depth. The experiment has shown that during the penetration of the wedge normal to one of
surfaces of the specimen, the wedge tip initially crushed the surface, then a crack spread
from the crushed zone to the other free surface next to the cutting surface, resulting in the
fracture of a buttock as shown in Figure 4.2. In the above experiment, the tool initially was
put at a cutting depth. The problem is, however, simplified. In actual cutting, the cutting
depth achieved depends on many factors, such as thrust force, pick rake angle and clearance
angle. The cutting drag pick needs to achieve a certain cutting depth or maintain its cutting
depth, therefore, to maintain an efficient cutting process. The fragmentation process in which
a cutting drag pick penetrates into a clear rock surface may be relatively close to reality.
4.2 Experimental Apparatus
Because of the reason mentioned above, an experimental apparatus called "Rock Cutting
Simulation Rig" was developed at the Department of Civil and Mining Engineering, the
University of Wollongong, as shown in Figure 4.3. The apparatus is developed for
fundamental observations and study of the crack behaviour due to cutting tools under
controlled laboratory conditions, i.e., cutting parameters such as type of tool, attack angle of
tool, confining stress for rock sample and so on. The rock specimens were in the form of
blocks of 150 mm square section and of the same length as the thickness. A specimen is
placed on the platform, between two steel plates. The supporting plates are forced against the
specimen by a 50 ton capacity hydraulic jack and apply a confining force to the sides of the
rock specimen. The magnitude of the confining force was detected by two 300 kN load cells
at both sides of the specimen. The specimen is, therefore, confined on two opposite sides
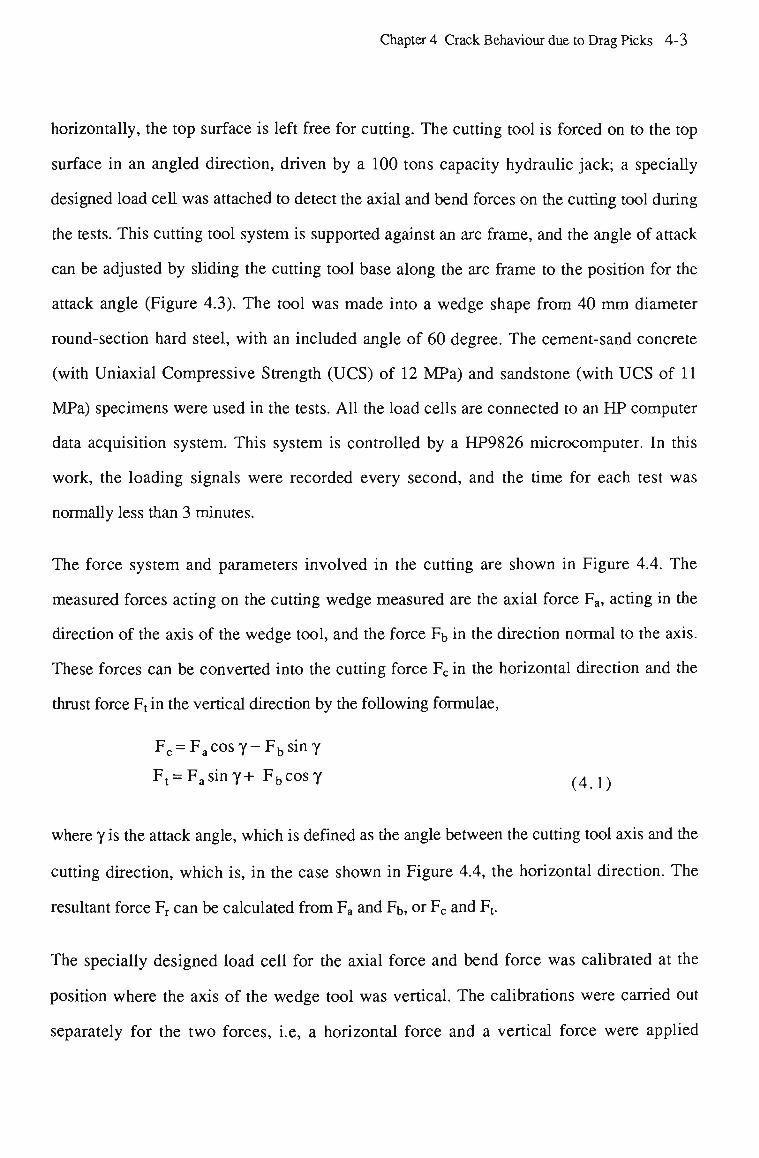
Chapter 4 Crack Behaviour due to Drag Picks 4-3
horizontally, the top surface is left free for cutting. The cutting tool is forced on to the top
surface in an angled direction, driven by a 100 tons capacity hydraulic jack; a specially
designed load cell was attached to detect the axial and bend forces on the cutting tool during
the tests. This cutting tool system is supported against an arc frame, and the angle of attack
can be adjusted by sliding the cutting tool base along the arc frame to the position for the
attack angle (Figure 4.3). The tool was made into a wedge shape from 40 m m diameter
round-section hard steel, with an included angle of 60 degree. The cement-sand concrete
(with Uniaxial Compressive Strength (UCS) of 12 M P a ) and sandstone (with U C S of 11
MPa) specimens were used in the tests. All the load cells are connected to an H P computer
data acquisition system. This system is controlled by a HP9826 microcomputer. In this
work, the loading signals were recorded every second, and the time for each test was
normally less than 3 minutes.
The force system and parameters involved in the cutting are shown in Figure 4.4. The
measured forces acting on the cutting wedge measured are the axial force Fa, acting in the
direction of the axis of the wedge tool, and the force Fb in the direction normal to the axis.
These forces can be converted into the cutting force Fc in the horizontal direction and the
thrust force Ftin the vertical direction by the following formulae,
F c = F a c o s y - F b s i n 7
Ft = F asiny+ F b cosy ( 4 X)
where y is the attack angle, which is defined as the angle between the cutting tool axis and the
cutting direction, which is, in the case shown in Figure 4.4, the horizontal direction. The
resultant force Fr can be calculated from Fa and Ft,, or Fc and Ft.
The specially designed load cell for the axial force and bend force was calibrated at the
position where the axis of the wedge tool was vertical. The calibrations were carried out
separately for the two forces, i.e, a horizontal force and a vertical force were applied
Chapter 4 Crack Behaviour due to Drag Picks 4-4
separately depending on whether the loadcell was calibrated for axial force or bending force.
The calibration curves are shown in Figure 4.5a,b.
4.3 Preliminary Experiment
The preliminary experiment was designed for confirmation of 'major chip' formation in a
relatively more realistic situation, and this process has been the cornerstone for various semi-
empirical rock cutting models. The observations will provide useful information for further
numerical modelling.
The experimental procedure involved the application of the wedge tool at an attack angle of
60°, which gives a neutral rake angle and a clearance angle of 30°. The confining pressure of
1 M P a was applied to the specimen with the hydraulic jack through a hand pump before
starting the penetration of the tool, then the wedge tool penetrated into the top surface at a
slow displacement rate (about 2mm/min), driven with an electrical hydraulic pump. The
loading continued to increase until a large chip of the specimen was formed ahead of the
wedge tool.
Four tests were undertaken, for each concrete and sandstone samples on the condition
mentioned. The progressive failures of the specimens were photographed. The typical failure
sequences of concrete and sandstone specimens are shown in Figures 4.6 and 4.7.
Generally, three failure stages can be identified from those tests.
Similar to what has been described for the rotary bit cutting failure process by Goodrich
(1956), and Fish and Barker (1956), the failure of the specimens in the tests herein can be
defined as a three-stage process. The first stage is defined as initial surface crushing. In this
stage, very fine rock fragments or particles are formed on the specimen surface due to the
crushing by the wedge tip. The second stage starts when small chips form ahead of the
wedge tool. At the same time, more fine fragments like those in the first stage are formed,
Chapter 4 Crack Behaviour due to Drag Picks 4-5
and relatively deeper penetrations into the specimens are achieved. The third stage is marked
by a significant large chip formation ahead of the wedge tool. This major chip is mainly
formed by a curvelinear crack, and can be called a 'major crack", which propagates from the
near vicinity of the wedge tool tip to the free surface of the specimen.
Based on the these observations, the cutting action involved in the major chip formation may
be simplified into a model with an idealized shape rock ledge and cutting pick as shown in
Figure 4.8. With this simplification, a series of numerical models were formulated to
investigate the major crack propagation with emphases on the effect of drag pick cutting rake
angle and the bluntness. Finally, actual drag bit drilling was monitored in the laboratory to
confirm the results of the numerical modelling.
4.4 Effect of Cutting Rake Angle
As found in many experiments, the higher the cutting rake angle, the more efficient is the
cutting process. Based on the experimental observations made on the 'Rock Cutting
Simulation Rig', the cutting rake angle effect was further investigated using the proposed
numerical technique with the m a x i m u m tensile stress criterion. Figure 4.9 a,b shows the
simplified computing model for the analysis of drag pick cutting process. A total of 140
elements was used to discretize the whole initial boundary as shown in Figure 4.9a. The
right, left and bottom sides of the boundary are fixed, along which any displacement is
restricted. A s shown in Figure 4.9b, a constant horizontal cutting force Fc is applied to the
cutting pick, which is assumed to be converted into a normal stress a uniformly distributed
along the contacting surface ab (between the cutting pick and the rock). In this very
simplified case, the friction between the pick and the rock is ignored.
The length of ab is maintained unchanged as the rake angle a changes from 0° to 35° in
increments of 5°. The locations of a and c are defined unchanged, and the location of b
Chapter 4 Crack Behaviour due to Drag Picks 4-6
changes with the rake angle a, as in Figure 4.9b. The modelling of the crack propagation
starts with an initial crack ad assumed to exist due to the stress singularity at the comer a. The
initial crack ad is assumed to be 0.2D long, where D equals the cutting depth, and is declined
at an angle of 45° to the rock free surface.
Figure 4.10 shows the predicted crack propagation paths which form the major chips in the
drag pick cutting. Figure 4.11 shows the normalized tensile maximum stresses at the crack
tips as the crack propagations continue (the crack propagation length is defined as 1).
The following points can be inferred from these figures. Firstly, the major chip formation is
the result of progressive crack propagation which starts from a position in the near vicinity of
the cutting tip. Secondly, the cracks propagate along curved paths, initially in the direction
inclined downward and gradually approaching the horizontal free surface. The smaller the
rake angle, the deeper the crack tends to propagate. Thirdly, the level of the tensile stress
concentration at the crack tip increases as the rake angle a increases, indicating that the
cutting force requirement decreases as the rake angle a increases. This trend is in a general
agreement with the experimental evidence obtained from simplified laboratory tests
(Roxborough, 1981) and the predictions of the semi-empirical models shown in Figure 4.1.
Fourthly, for some of the large rake angles considered, the tensile stress concentration
decreases initially and then increases beyond its lowest value, indicating that a large rake
angle a could assist in generating efficient unstable crack propagation, i.e., the crack will
continue its propagation path beyond the lowest point without further load increase. For small
rake angles, stable crack propagations are generated, i.e., load increases are required to
maintain the crack propagating in any position of the crack propagation path.
Actual cutting tests on the two kind of specimens with the attack angles of 67.5°, 60°, 52.5°
and 45°, correspond to the cutting rake angles of -7.5°, 0°, 7.5° and 15°, and clearance
angles of 37.5°, 30°, 22.5° and 15°. The definitions of the three stages of the failure were
confirmed by all these tests. At least four tests were carried out for each attack angle for one

Chapter 4 Crack Behaviour due to Drag Picks 4-7
kind of the specimens. After each test, the fragments produced were collected. The
comparison of the product/fragment size distribution between all these tests are shown in
Figure 4.12 for sandstone specimens, and Figure 4.13 for concrete specimens. It can be seen
from these figures that the largest major chips among these samples are produced in the test
with the cutting rake angle 0°, the second largest major chips are from the tests with a cutting
rake angle of -7.5°, the next largest major chips are from the tests with the cutting rake angle
of 7.5°, and smallest major chips were from the tests with the cutting rake angle of 15°. In
this last case, a number of median sized chips were also observed.
As predicted by the numerical modelling, the major chip size increases when the rake angle
decreases. However, when the rake angle becomes negative, -7.5°, no trend of further
increase on the major chip size is observed. This effect is believed to be due to the increase of
the contact area between the rock and the tool front surface and in the direction of this contact
stress becoming inclined downward. Consequently, the major chip formation process is
suppressed to some extent.
The craters were examined after removal of all the fragments; it was found that the surface of
fracture (the surface of the crater bottom) consists of two distinguished area as shown in
Figure 4.14 for the concrete specimens, and Figure 4.15 for the sandstone specimens, i.e., a
fresh ruptured area and a fine crushed area. The boundary between the two areas are at the
line along which the wedge tip acted at the moment that the major chip is formed. Ahead of
the wedge tip line, the area featured freshly ruptured surfaces; behind the wedge tip line,
shiny finely crushed surfaces were observed. The fracture processes in the second area are
highly inefficient, and are the primary sources of harmful dust. It can be seen from Figures
4.14 and 4.15 that as the attack angle decreases and the cutting rake angle increases, the areas
of the fine crushed surfaces increase. It is expected that this increase will result in an increase
in the energy loss due to friction.
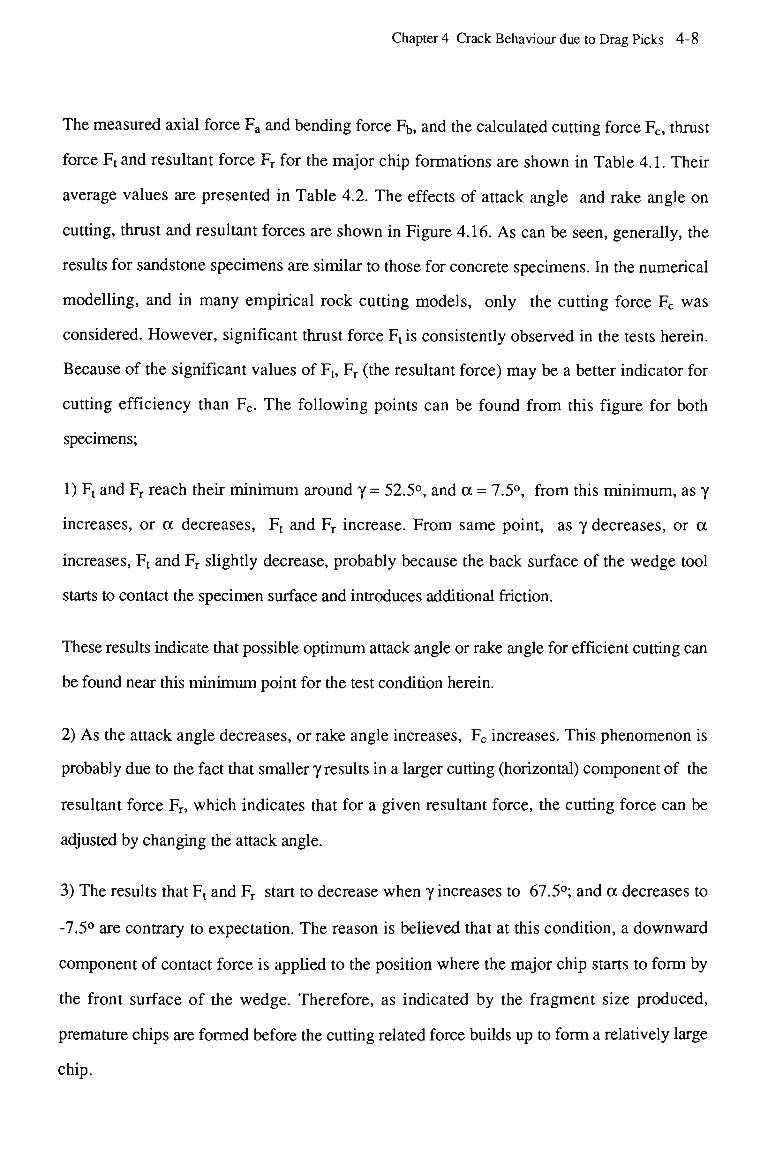
Chapter 4 Crack Behaviour due to Drag Picks 4-8
The measured axial force Fa and bending force Fb, and the calculated cutting force Fc, thrust
force Ft and resultant force Fr for the major chip formations are shown in Table 4.1. Their
average values are presented in Table 4.2. The effects of attack angle and rake angle on
cutting, thrust and resultant forces are shown in Figure 4.16. A s can be seen, generally, the
results for sandstone specimens are similar to those for concrete specimens. In the numerical
modelling, and in many empirical rock cutting models, only the cutting force Fc was
considered. However, significant thrust force Ft is consistently observed in the tests herein.
Because of the significant values of Ft, Fr (the resultant force) may be a better indicator for
cutting efficiency than Fc. The following points can be found from this figure for both
specimens;
1) Ft and Fr reach their minimum around y = 52.5°, and a = 7.5°, from this minimum, as y
increases, or a decreases, Ft and Fr increase. From same point, as y decreases, or a
increases, Ft and Fr slightly decrease, probably because the back surface of the wedge tool
starts to contact the specimen surface and introduces additional friction.
These results indicate that possible optimum attack angle or rake angle for efficient cutting can
be found near this minimum point for the test condition herein.
2) As the attack angle decreases, or rake angle increases, Fc increases. This phenomenon is
probably due to the fact that smaller y results in a larger cutting (horizontal) component of the
resultant force Fr, which indicates that for a given resultant force, the cutting force can be
adjusted by changing the attack angle.
3) The results that Ft and Fr start to decrease when y increases to 67.5°; and a decreases to
-7.5° are contrary to expectation. The reason is believed that at this condition, a downward
component of contact force is applied to the position where the major chip starts to form by
the front surface of the wedge. Therefore, as indicated by the fragment size produced,
premature chips are formed before the cutting related force builds up to form a relatively large
chip.
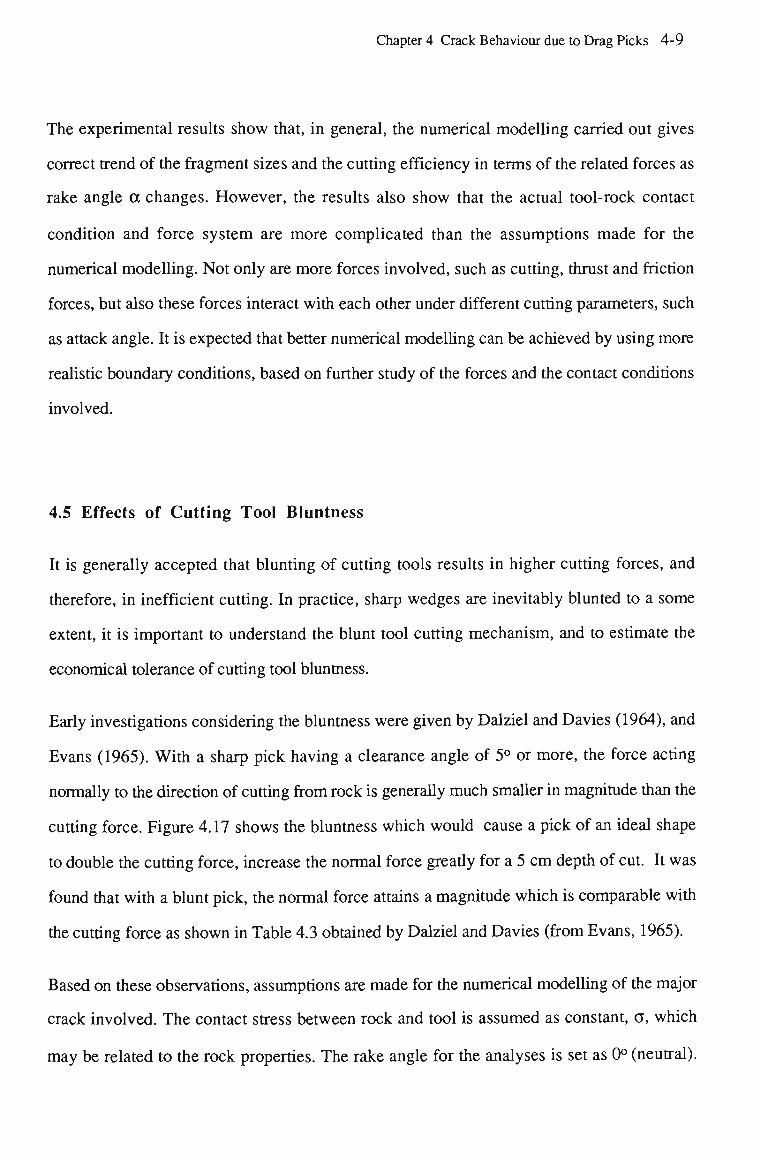
Chapter 4 Crack Behaviour due to Drag Picks 4-9
The experimental results show that, in general, the numerical modelling carried out gives
correct trend of the fragment sizes and the cutting efficiency in terms of the related forces as
rake angle a changes. However, the results also show that the actual tool-rock contact
condition and force system are more complicated than the assumptions made for the
numerical modelling. Not only are more forces involved, such as cutting, thrust and friction
forces, but also these forces interact with each other under different cutting parameters, such
as attack angle. It is expected that better numerical modelling can be achieved by using more
realistic boundary conditions, based on further study of the forces and the contact conditions
involved.
4.5 Effects of Cutting Tool Bluntness
It is generally accepted that blunting of cutting tools results in higher cutting forces, and
therefore, in inefficient cutting. In practice, sharp wedges are inevitably blunted to a some
extent, it is important to understand the blunt tool cutting mechanism, and to estimate the
economical tolerance of cutting tool bluntness.
Early investigations considering the bluntness were given by Dalziel and Davies (1964), and
Evans (1965). With a sharp pick having a clearance angle of 5° or more, the force acting
normally to the direction of cutting from rock is generally much smaller in magnitude than the
cutting force. Figure 4.17 shows the bluntness which would cause a pick of an ideal shape
to double the cutting force, increase the normal force greatly for a 5 c m depth of cut. It was
found that with a blunt pick, the normal force attains a magnitude which is comparable with
the cutting force as shown in Table 4.3 obtained by Dalziel and Davies (from Evans, 1965).
Based on these observations, assumptions are made for the numerical modelling of the major
crack involved. The contact stress between rock and tool is assumed as constant, a, which
may be related to the rock properties. The rake angle for the analyses is set as 0° (neutral).
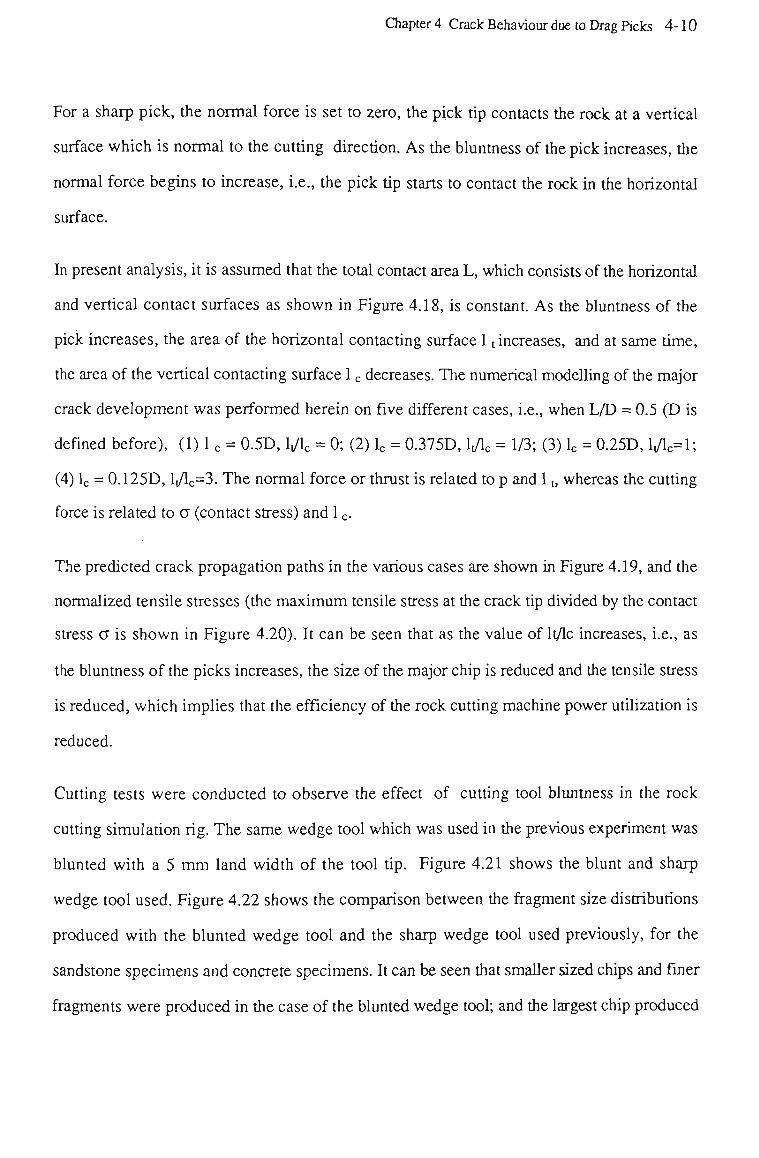
Chapter 4 Crack Behaviour due to Drag Picks 4-10
For a sharp pick, the normal force is set to zero, the pick tip contacts the rock at a vertical
surface which is normal to the cutting direction. A s the bluntness of the pick increases, the
normal force begins to increase, i.e., the pick tip starts to contact the rock in the horizontal
surface.
In present analysis, it is assumed that the total contact area L, which consists of the horizontal
and vertical contact surfaces as shown in Figure 4.18, is constant. A s the bluntness of the
pick increases, the area of the horizontal contacting surface 11 increases, and at same time,
the area of the vertical contacting surface 1 c decreases. The numerical modelling of the major
crack development was performed herein on five different cases, i.e., when L/D = 0.5 (D is
defined before), (1) 1 c = 0.5D, yi c = 0; (2) lc = 0.375D, \J\C = 1/3; (3) lc = 0.25D, l,/lc=l;
(4) lc = 0.125D, lt/lc=3. The normal force or thrust is related to p and 11, whereas the cutting
force is related to a (contact stress) and 1 c.
The predicted crack propagation paths in the various cases are shown in Figure 4.19, and the
normalized tensile stresses (the m a x i m u m tensile stress at the crack tip divided by the contact
stress a is shown in Figure 4.20). It can be seen that as the value of lt/lc increases, i.e., as
the bluntness of the picks increases, the size of the major chip is reduced and the tensile stress
is reduced, which implies that the efficiency of the rock cutting machine power utilization is
reduced.
Cutting tests were conducted to observe the effect of cutting tool bluntness in the rock
cutting simulation rig. The same wedge tool which was used in the previous experiment was
blunted with a 5 m m land width of the tool tip. Figure 4.21 shows the blunt and sharp
wedge tool used. Figure 4.22 shows the comparison between the fragment size distributions
produced with the blunted wedge tool and the sharp wedge tool used previously, for the
sandstone specimens and concrete specimens. It can be seen that smaller sized chips and finer
fragments were produced in the case of the blunted wedge tool; and the largest chip produced
Chapter 4 Crack Behaviour due to Drag Picks 4-11
is significantly smaller than that produced by the sharp wedge tool. Such behaviour is in a
general agreement with the results of the numerical modelling.
As can be seen from Table 4.2, the forces in the case of the blunt wedge tool is generally less
than those in the sharp wedge, which is different from the prediction of the numerical
modelling and other experimental evidence (Evans, 1965). It is believed the reason is that the
premature chip formations often occur before the cutting force built up in the tests herein. The
forces presented were recorded at the moment that the first significant chip was formed in the
test, and the tests were terminated then. The possible further chip (or major chip) formations
remained unknown. The sizes of the craters formed, or the volumes of the fragments
produced with the blunted tool herein were, therefore smaller than those with the sharp tool
as shown in Figure 4.22. The predicted major chip formation from the numerical modelling
for the idealized condition of the blunt wedge tool is not often observed in the present
tests.These results imply that the force system in the case of the blunt wedge tool may be
more complicated than the condition assumed for the numerical modelling in the present tests.
The tests provide useful information on the initial chip formation when cutting starts from a
clear surface of the specimen, however, due to the nature of the experiments, the tests are not
considered to provide full information for continuous cutting. It is expected that a better
comparison between the numerical modelling results and experiment would be made in term
of values of the specific energy involved in a continuous cutting process.
In order to compare the actual cutting performance of a blunted tool with that of a sharp tool
in term of the specific energy, sharp and blunt drag-bit drillings using a pneumatic drill were
monitored in the laboratory. The reason for choosing to study drag-bit drilling is that the rock
breakage action of the rotary drag-bit drilling is similar to that of the drag pick in nature. In
addition, the pneumatic rotary drill is relatively easy to monitor in the laboratory.
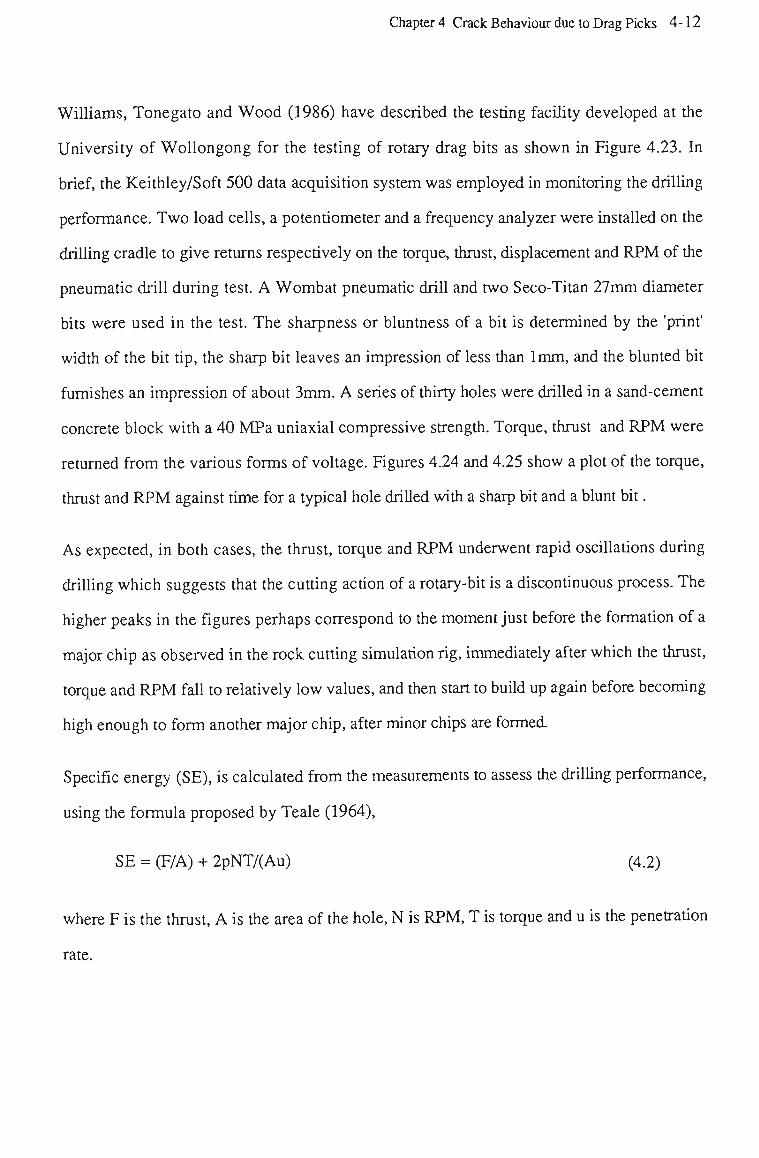
Chapter 4 Crack Behaviour due to Drag Picks 4-12
Williams, Tonegato and W o o d (1986) have described the testing facility developed at the
University of Wollongong for the testing of rotary drag bits as shown in Figure 4.23. In
brief, the Keithley/Soft 500 data acquisition system was employed in monitoring the drilling
performance. Two load cells, a potentiometer and a frequency analyzer were installed on the
drilling cradle to give returns respectively on the torque, thrust, displacement and RPM of the
pneumatic drill during test. A Wombat pneumatic drill and two Seco-Titan 27mm diameter
bits were used in the test. The sharpness or bluntness of a bit is determined by the 'print'
width of the bit tip, the sharp bit leaves an impression of less than 1mm, and the blunted bit
furnishes an impression of about 3mm. A series of thirty holes were drilled in a sand-cement
concrete block with a 40 MPa uniaxial compressive strength. Torque, thrust and RPM were
returned from the various forms of voltage. Figures 4.24 and 4.25 show a plot of the torque,
thrust and RPM against time for a typical hole drilled with a sharp bit and a blunt bit.
As expected, in both cases, the thrust, torque and RPM underwent rapid oscillations during
drilling which suggests that the cutting action of a rotary-bit is a discontinuous process. The
higher peaks in the figures perhaps correspond to the moment just before the formation of a
major chip as observed in the rock cutting simulation rig, immediately after which the thrust,
torque and RPM fall to relatively low values, and then start to build up again before becoming
high enough to form another major chip, after minor chips are formed
Specific energy (SE), is calculated from the measurements to assess the drilling performance,
using the formula proposed by Teale (1964),
SE = (F/A) + 2pNT/(Au) (4.2)
where F is the thrust, A is the area of the hole, N is RPM, T is torque and u is the penetration
rate.
Chapter 4 Crack Behaviour due to Drag Picks 4-13
In addition, the fragments produced by each drilling were collected, and a size analysis was
performed. The mean size was calculated on the basis of the weight retained for each
successive screen as,
n
I WJSJ - _ 1
wt (4.3)
Table 4.4 presents the specific energy results and the average mean sizes among the groups
of holes drilled. The specific energy results show an obvious increase in the specific energy
required for drilling with the blunt bit. The average mean size results indicate a significant
drop in chip size for the holes drilled with the blunt bit. These results are in general agreement
with what the numerical modelling indicated: smaller fragment sizes and inefficient utilization
of cutting energy in the case of the blunt tool cutting.
4.6 Summary
1. An experimental apparatus called the "Rock Cutting Simulation Rig" was developed. This
rig allows a drag pick type tool to penetrate into the clear surface of a confined specimen with
various attack angles. The fragmentation process in such a condition is, therefore, close to
that involved in actual rock cutting.
2. Three stages of the failure of the specimens was identified, these are, a) surface initial
crushing; b) small chipping and crushing; c) and major chip formation. Based on these
observations, the boundary condition of major chip formation is determined for later
numerical modelling.
3. The effects of drag pick cutting rake angle on major chip formation were investigated both
experimentally and numerically. The paths of the major crack propagation, and therefore, the
size of the major chip were modelled by the numerical method, and the corresponding load
requirements for crack propagation were predicted. In the conditions assumed in this
Chapter 4 Crack Behaviour due to Drag Picks 4-14
work, the numerical method predicted that the cutting forces increase as well as the sizes of
the major chip as the positive cutting rake angles decrease. These numerical results generally
agree with those observed from the cutting tests on concrete and sandstone. However, the
actual forces and the contact conditions involved in the cutting tests are more complicated than
what were assumed in the numerical modelling, especially when rake angle is negative and
attack angle( or clearance angle) is small. Improvements on results of the numerical modelling
rely on further experimental investigation.
4. The effects of cutting tool bluntness on the major chip formation and the load requirements
were studied both experimentally and numerically. The numerical modelling indicates that, as
the bluntness of the cutting tool increases, the forces required increase, at same time as the
size of the major chip decreases, indicating inefficient cutting and generation of relatively
large amounts of harmful fine fragments. The results on the fragment sizes produced using
the sharp and blunt tools show general agreement with the numerical modelling. However,
the forces recorded and the fragments produced in the tests indicate that more complex chip
formation behaviour is involved in blunt tool cutting than the numerically predicted major
chip formation. In the complex cutting, such as the case involved in blunt tool cutting,
monitoring on continuous cutting provide reliable information on cutting efficiency. The
specific energy and the average size distribution data obtained from the actual drag-bit
drilling experiments, using sharp and blunt bits with the pneumatic drilling machine are in
agreement with the indication of the numerical modelling.

Chapter 4 Crack Behaviour due to Drag Picks 4-15
10
z
£ a u Di
o n. o 2:
Evans's model
Nishimatsu's model
— i —
10 — i —
15 5 10 15 20
RAKE ANGLE (degrees)
25
Figure 4.1 Rake angle influence on cutting forces (after Roxborough, 1986).
(Rock properties:
tensile strength of 1.75MPa; shear strength of 10 MPa;
angle of internal friction of 25°; angle of interface friction of 30°)
Figure 4:2 Evans's experimental observation (after Evans ,1962)
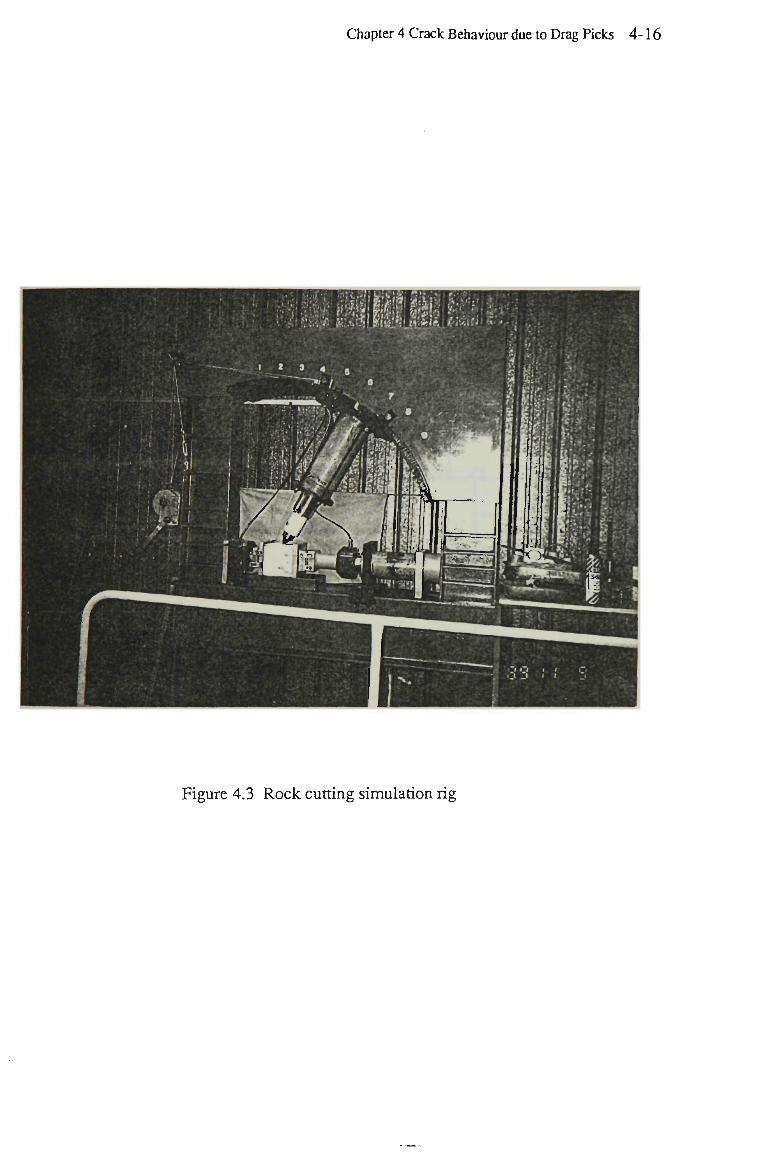
Chapter 4 Crack Behaviour due to Drag Picks 4-16
7 Jk l
1 1
1
1
I \
Figure 4.3 Rock cutting simulation rig
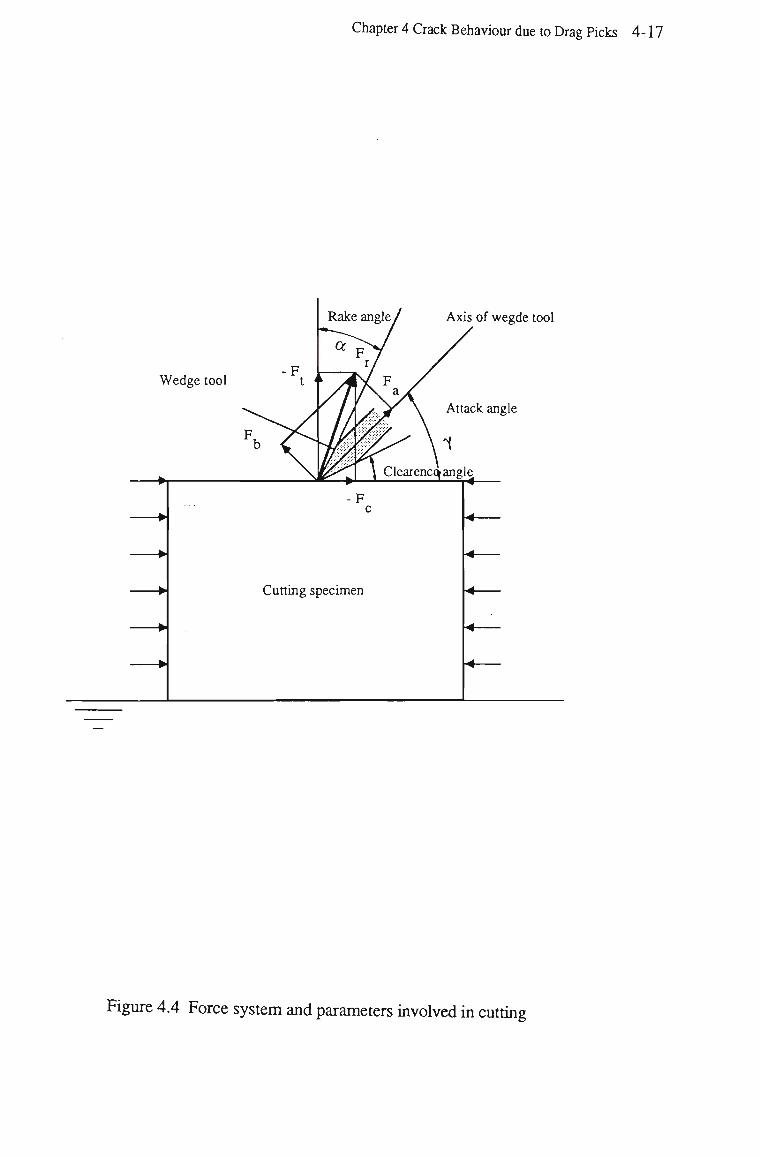
Chapter 4 Crack Behaviour due to Drag Picks 4-17
Rake angle / Axis of wegde tool
Or"
Wedge tool
Cutting specimen
Figure 4.4 Force system and parameters involved in cutting
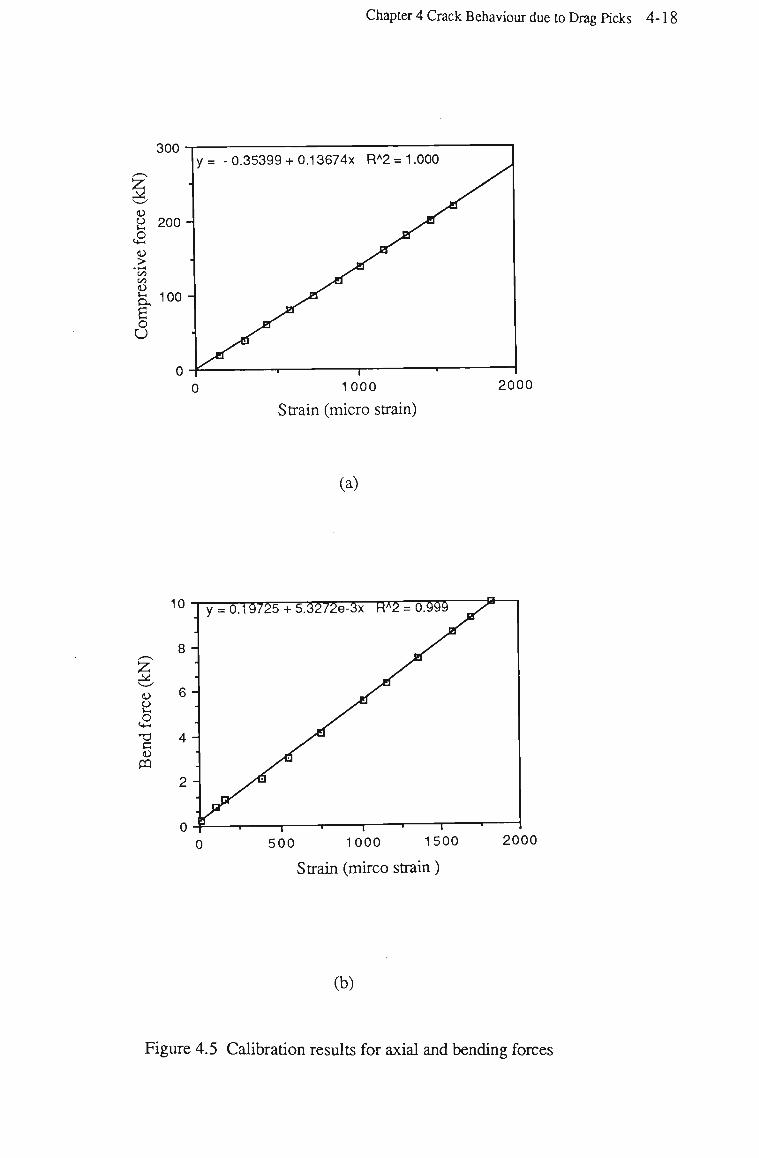
Chapter 4 Crack Behaviour due to Drag Picks 4-18
300
<o
a a <D
J> 'vi Vi O U
200 -
100 -
1000
Strain (micro strain)
2000
(a)
a X) C U
m
500 1000 1500
Strain (mirco strain)
2000
(b)
Figure 4.5 Calibration results for axial and bending forces
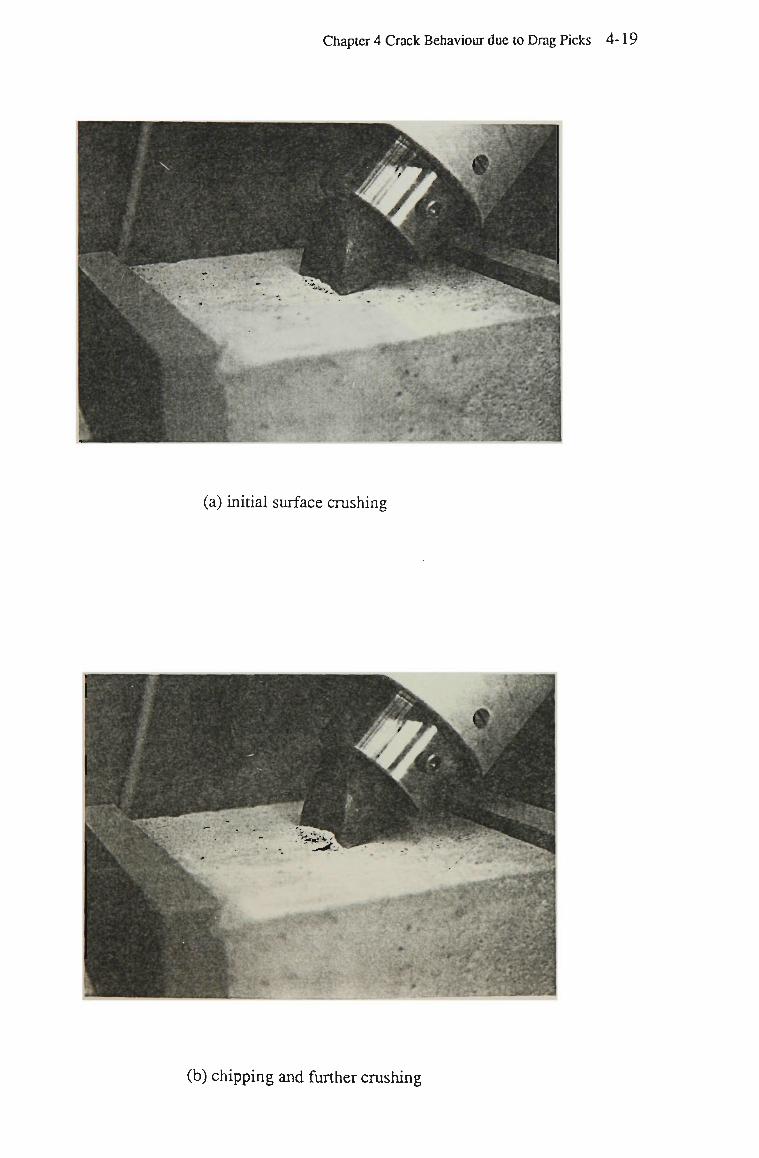
Chapter 4 Crack Behaviour due to Drag Picks 4-19
(a) initial surface crushing
(b) chipping and further crushing
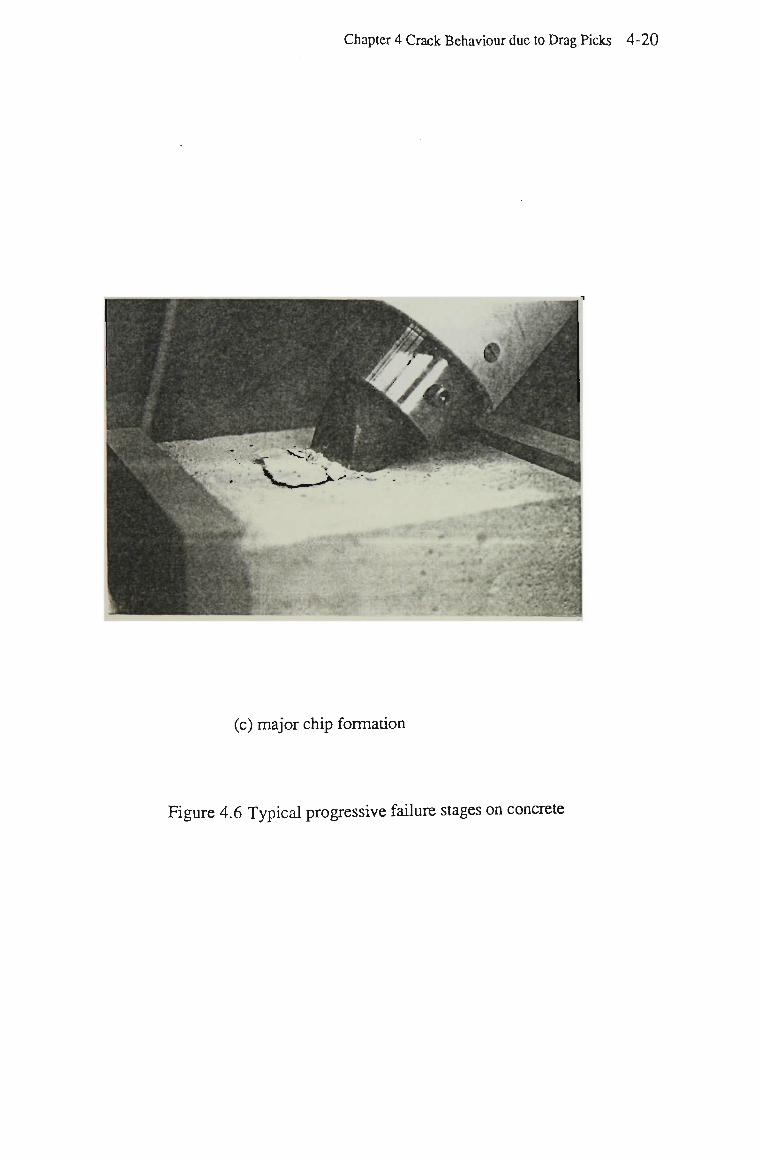
Chapter 4 Crack Behaviour due to Drag Picks 4-20
(c) major chip formation
Figure 4.6 Typical progressive failure stages on concrete
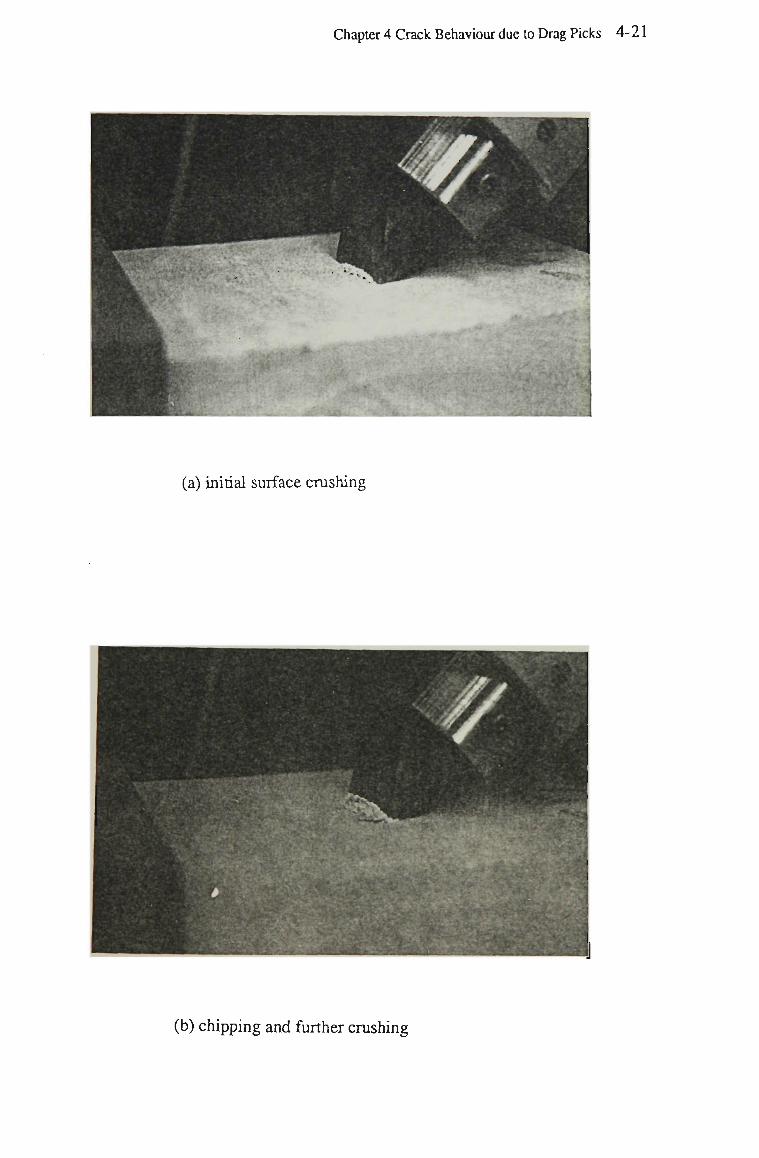
Chapter 4 Crack Behaviour due to Drag Picks 4-21
(a) initial surface crushing
(b) chipping and further crushing
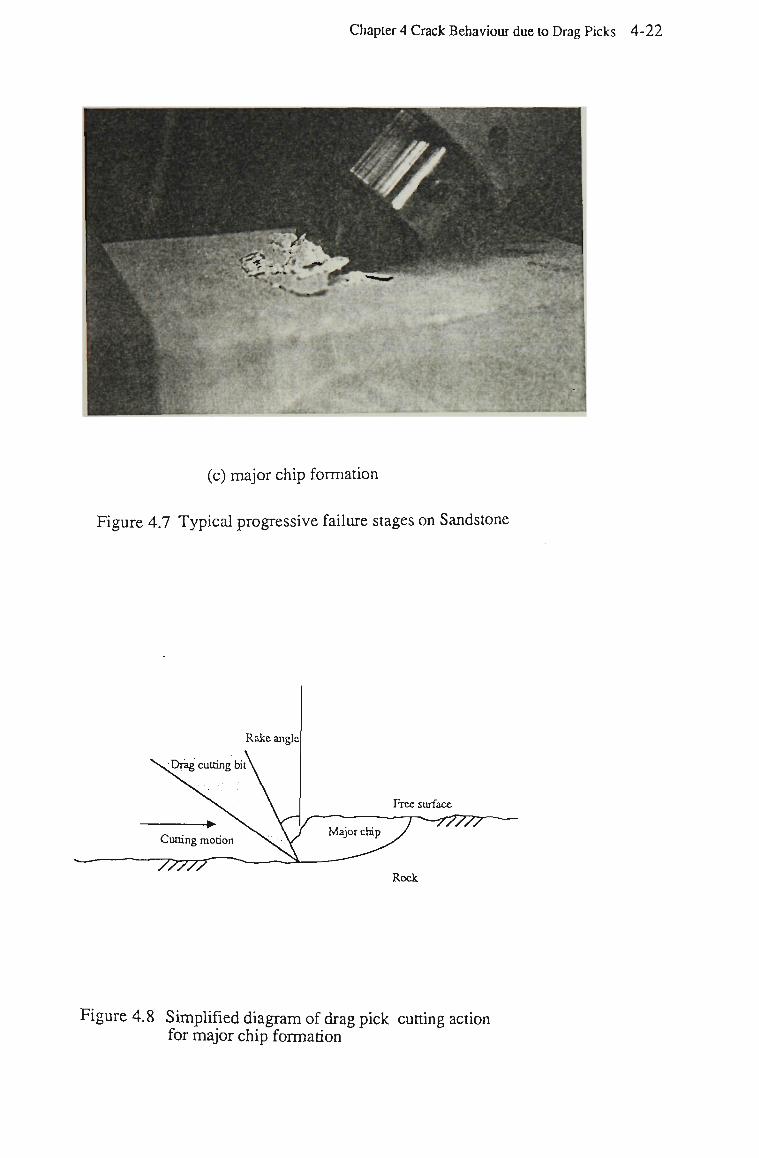
Chapter 4 Crack Behaviour due to Drag Picks 4-22
(c) major chip formation
Figure 4.7 Typical progressive failure stages on Sandstone
Cutting motion
"77777
Free surface
^-777Zr
Rock
Figure 4.8 Simplified diagram of drag pick cutting action for major chip formation
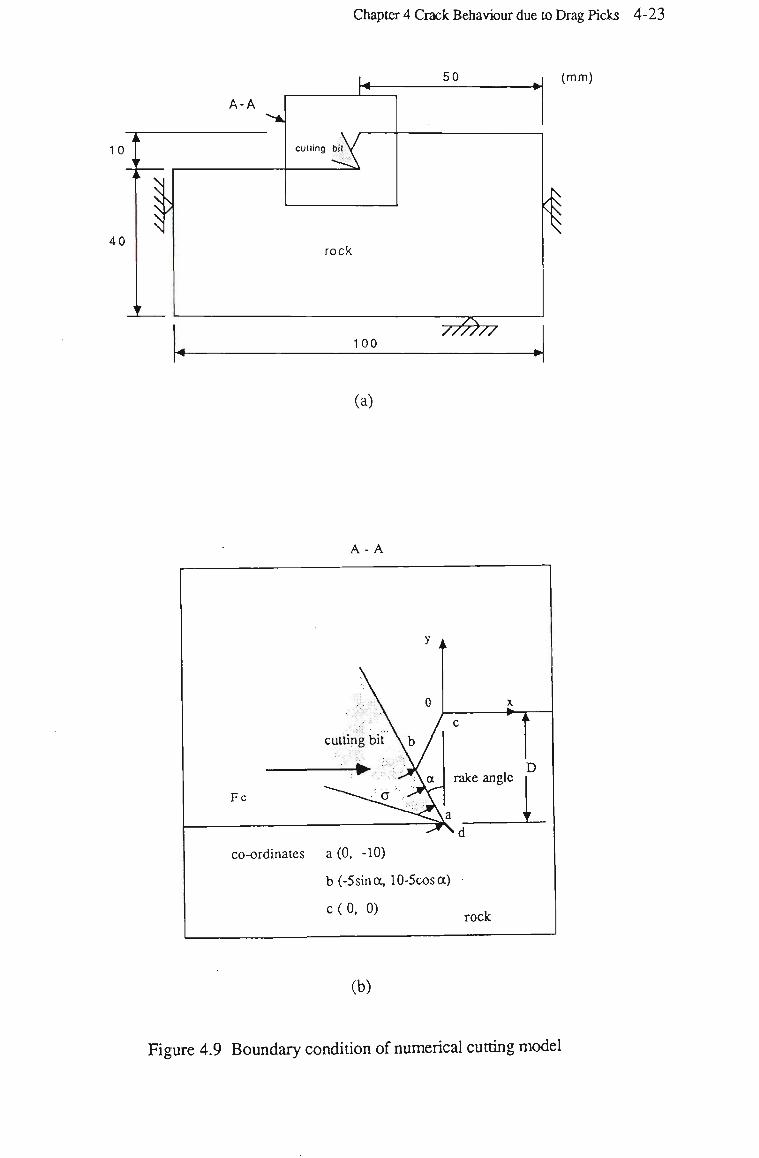
Chapter 4 Crack Behaviour due to Drag Picks 4
(mm)
(a)
A - A
co-ordinates a (0, -10)
b (-5 sin a, 10-5cosa)
c(0, 0) rock
(b)
Figure 4.9 Boundary condition of numerical cutting model
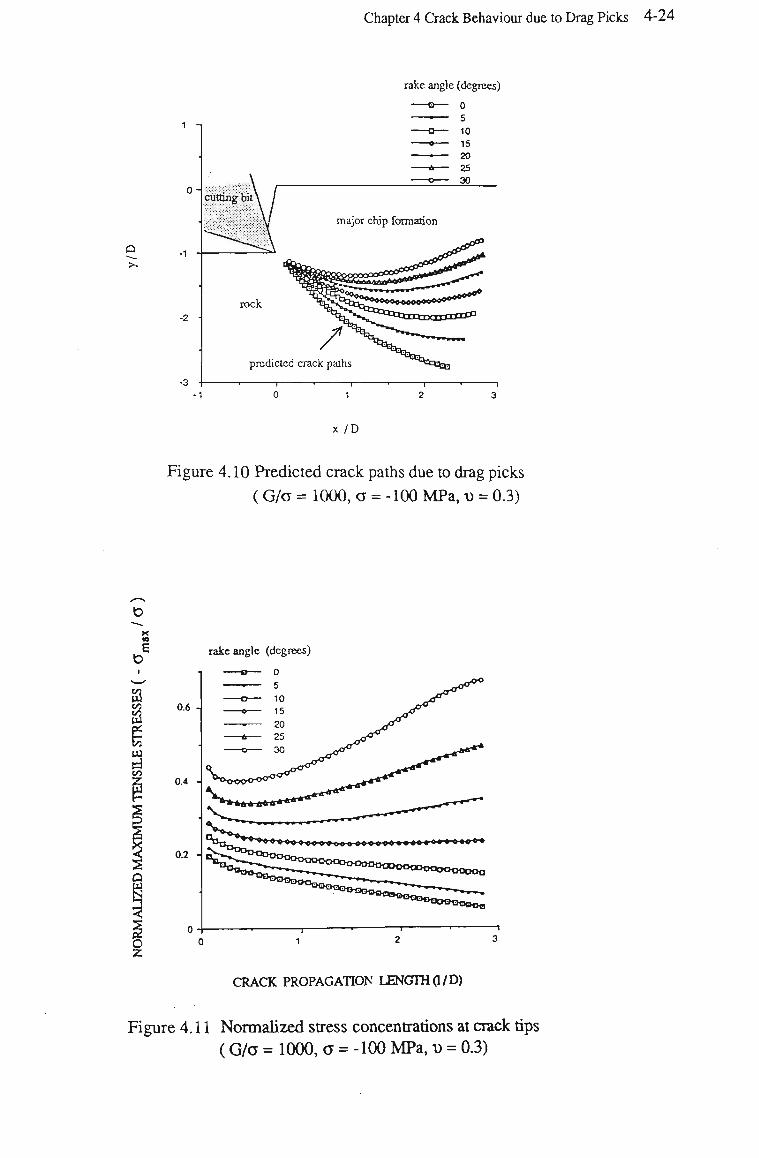
Chapter 4 Crack Behaviour due to Drag Picks 4-24
rake angle (degrees)
Q
0-
-Q 0 — 5 - o — 10 -• 15 -• 20 - A — 25 - o — 30
major chip formation
7 predicted crack paths
x /D
Figure 4.10 Predicted crack paths due to drag picks
(G/a = 1000, a = -100 MPa, v = 0.3)
X M
E
0.6
0.4
0.2 -
rake angle (degrees)
0
CRACK PROPAGATION LENGTH (1/D)
Figure 4.11 Normalized stress concentrations at crack tips (G/a = 1000, a = -100 MPa, x> = 0.3)
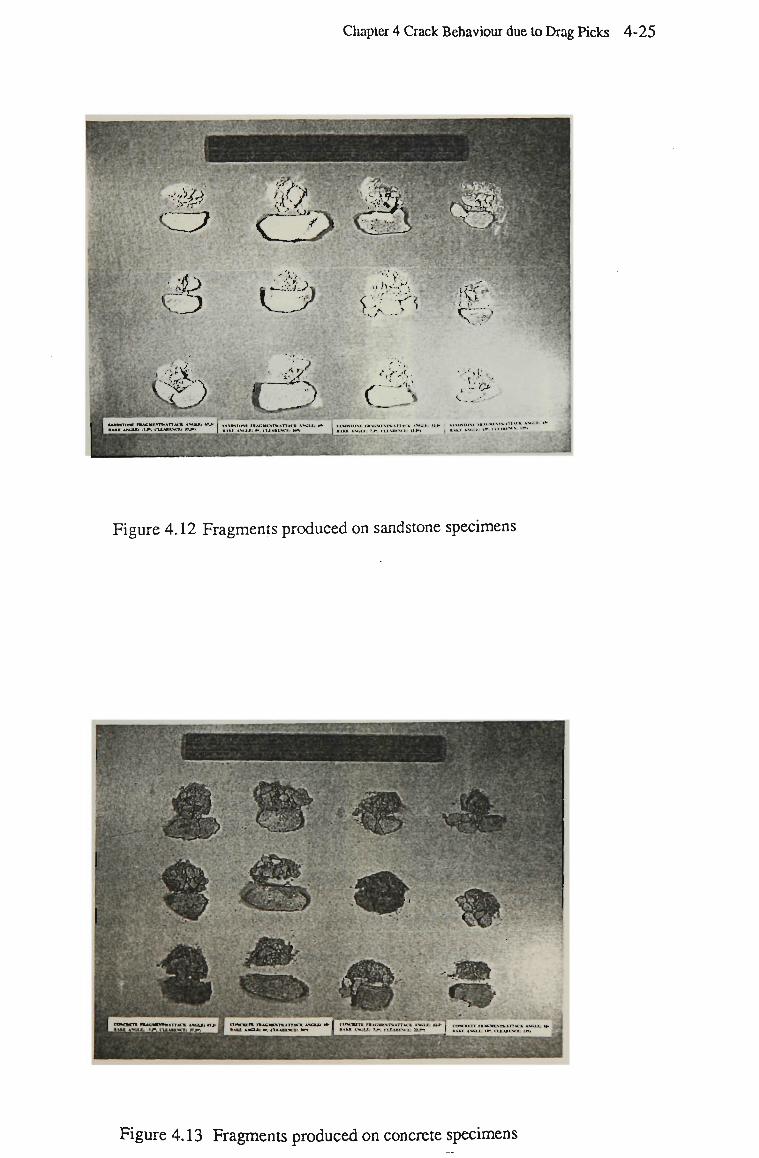
Chapter 4 Crack Behaviour due lo Drag Picks 4-25
ssHffnMHQfl^BEHBHBHHBBHI
£3i>
a • = & # ',-r-<<
•CJ> & .'life <-•*£>
Figure 4.12 Fragments produced on sandstone specimens
Figure 4.13 Fragments produced on concrete specimens
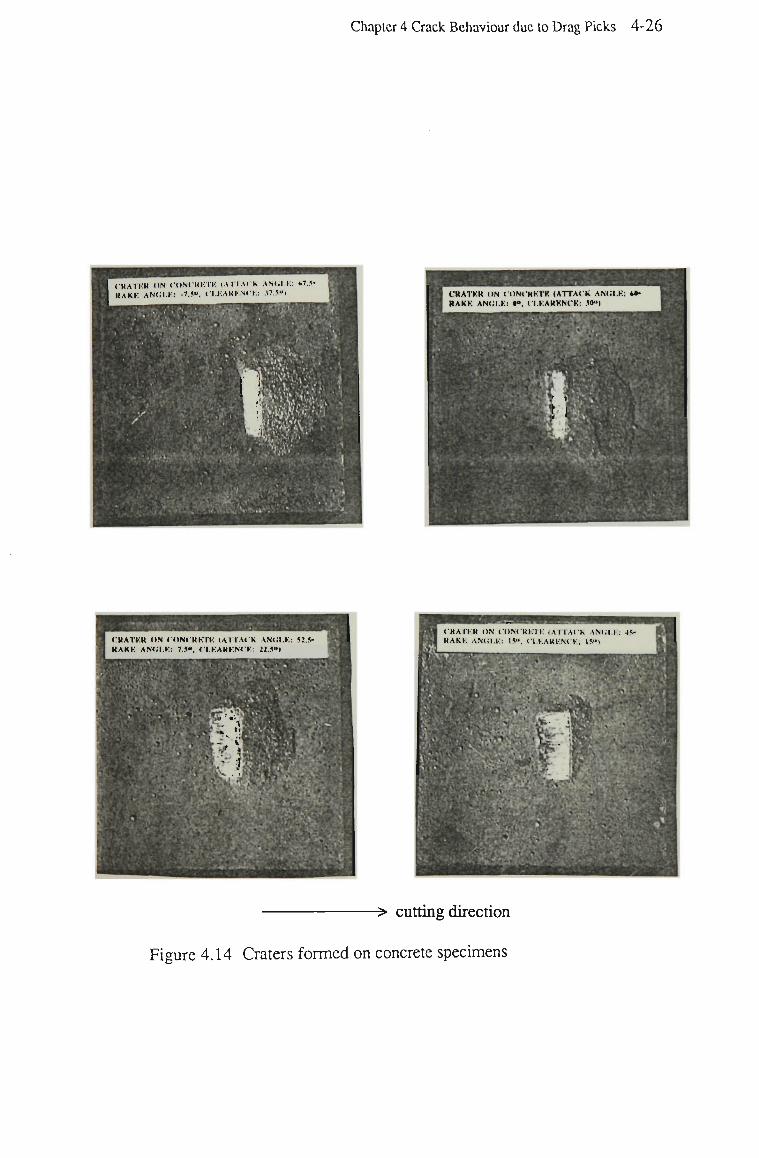
Chapter 4 Crack Behaviour due to Drag Picks 4-26
-> cutting direction
Figure 4.14 Craters formed on concrete specimens
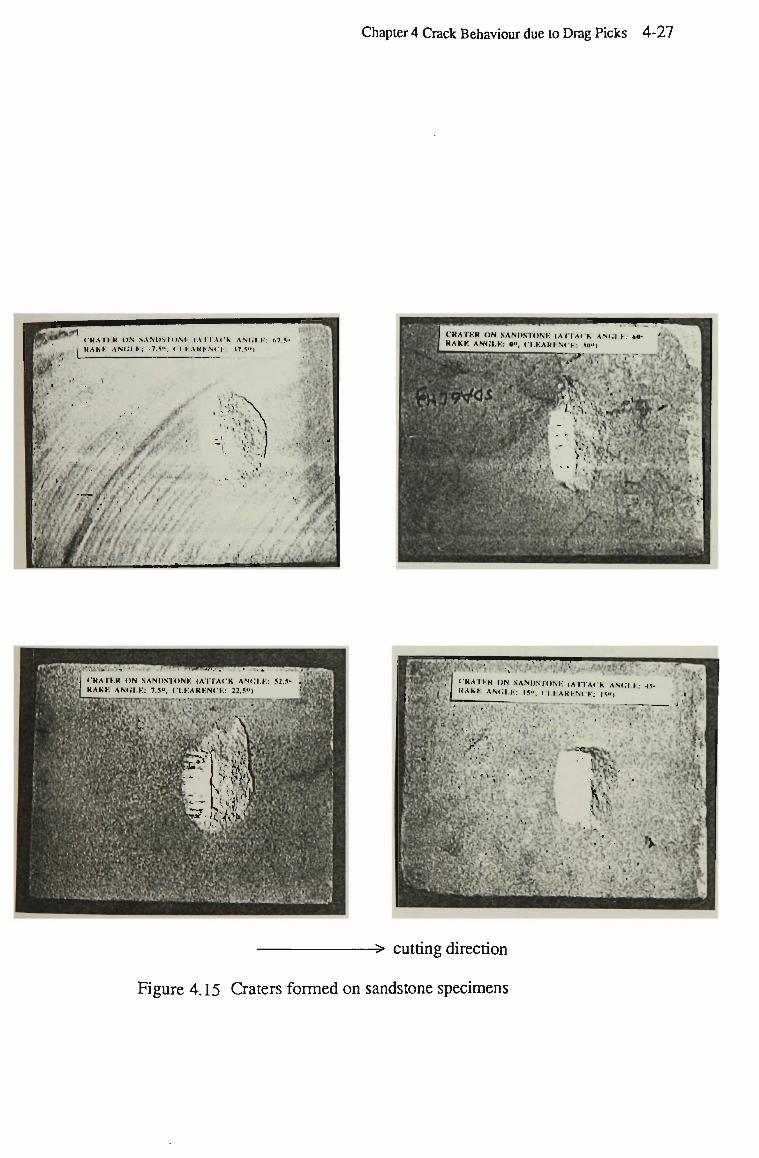
Chapter 4 Crack Behaviour due to Drag Picks 4-27
• -; L CII.MI H O N N A N D M O M ' lAITAI'k ANOI.K: (.7.*-
KAKI' ANIJI.K: •!.»». I I I AMI • N< I : I7..1"!
y .• ir.
•?£$£/ <•'• /' t, .•• './ i
- I ' .''
•• 1
•it
. •' • ' f II Willi.
mmimmmmmmmmmmmmm CRATKM ON SANDVIONI-: lATTAt'K AN<;I I M> HAKK AMlMCl 0", <I.KAKIN< >.: lu"i
vU •••.,. "TT--V
^ .V:
4 .• ••..""• . , ' ' , :
AN(;i K: 45-PGjr;1 I'HAIIM ON SANIISTONI-: |AITA( K AN &¥t J "AK* AN<;l H: ""• 'IIAKI-MK: IV)
Mb
Y m
v'f-:;
1 1 V'
-^ cutting direction
Figure 4.15 Craters formed on sandstone specimens
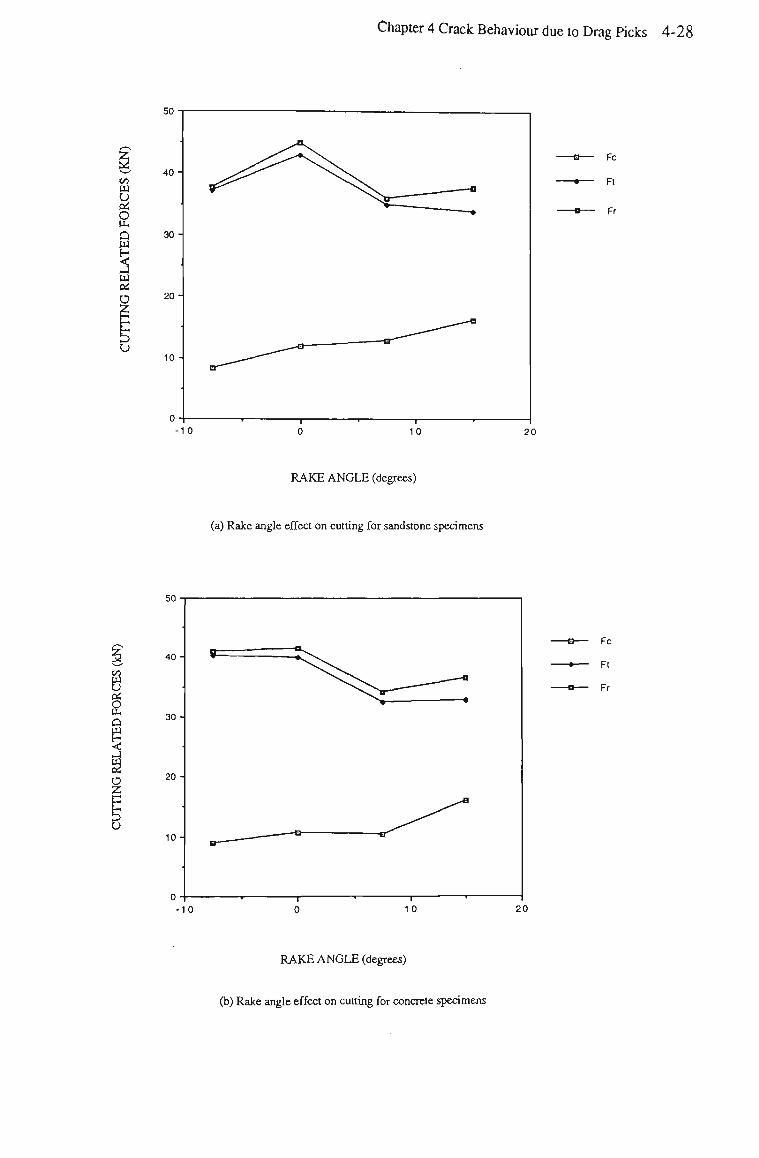
Chapter 4 Crack Behaviour due to Drag Picks 4-28
Vi
W u
2 Q W
s w OS u
- D — Fc
-•— Fl
-a— Fr
R A K E A N G L E (degrees)
(a) Rake angle effect on cutting for sandstone specimens
P
g
- G — Fc
-• Ft
-a— Fr
R A K E A N G L E (degrees)
(b) Rake angle effect on cutting for concrete specimens
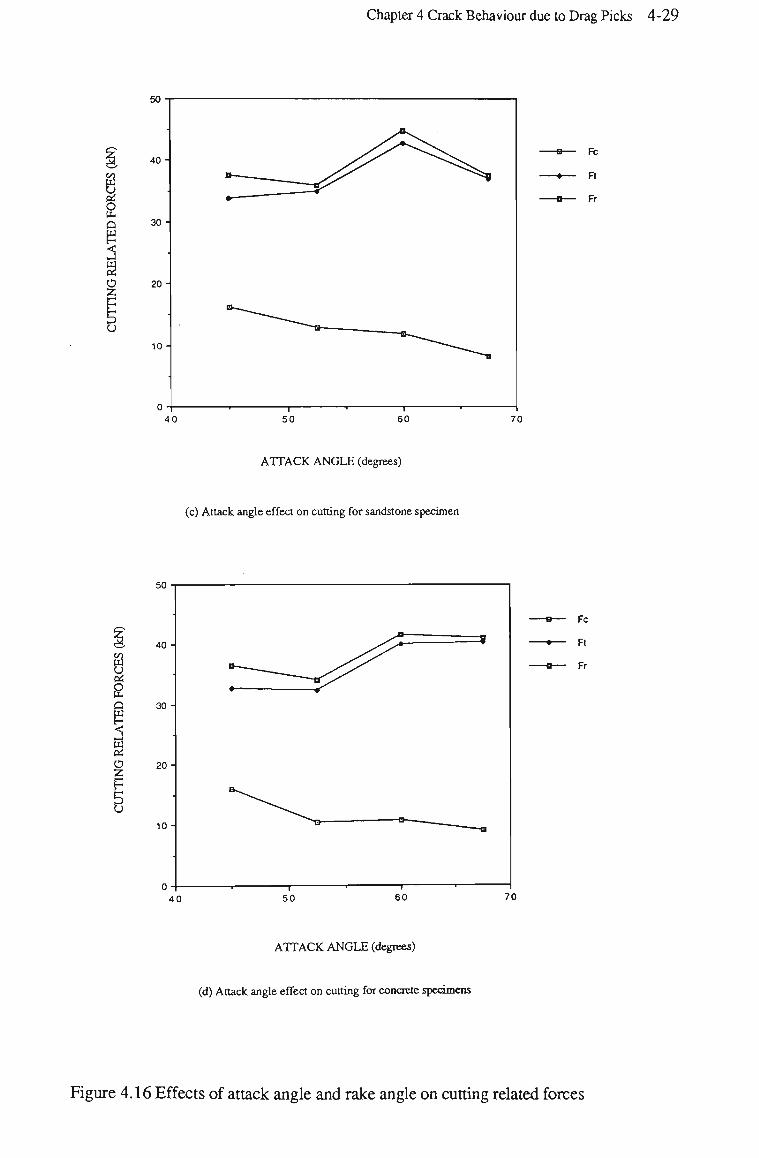
Chapter 4 Crack Behaviour due to Drag Picks 4-29
u. Q
P 3 o z
u
B
0
Fc
Ft
Fr
A T T A C K A N G L E (degrees)
(c) Attack angle effect on cutting for sandstone specimen
B3 U
g o
o z
u
- o — Fc
-•— Ft
-•— Fr
A T T A C K A N G L E (degrees)
(d) Attack angle effect on cutting for concrete specimens
Figure 4.16 Effects of attack angle and rake angle on cutting related forces
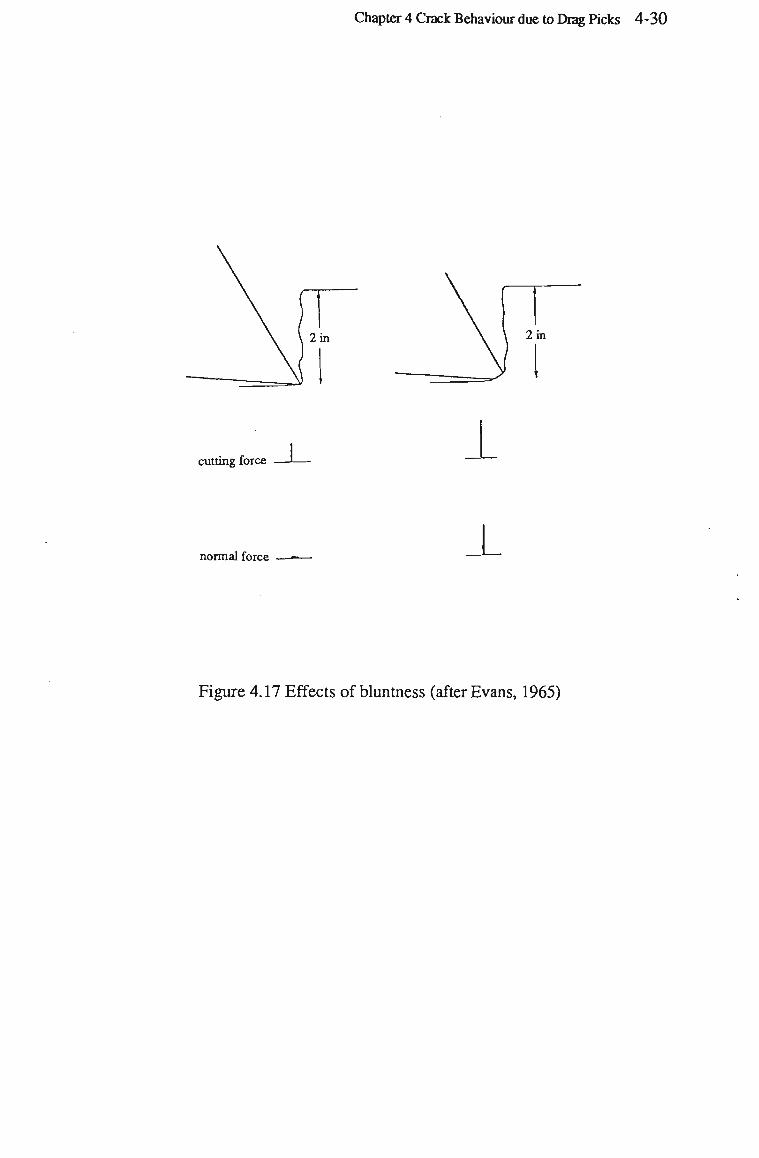
Chapter 4 Crack Behaviour due to Drag Picks 4-30
cutting force
normal force _L
Figure 4.17 Effects of bluntness (after Evans, 1965)
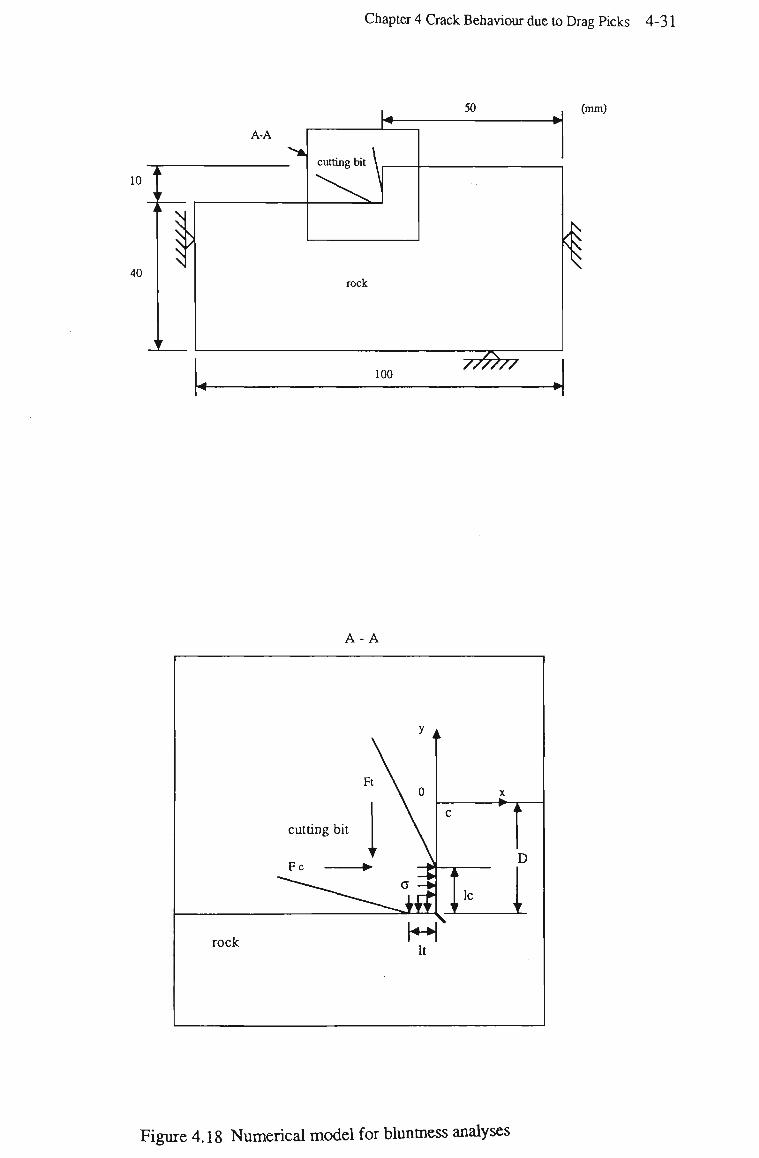
Chapter 4 Crack Behaviour due to Drag Picks 4-31
(mm)
A-A
F
cutting bit
P r a**
y i
\ °
r \
X
C * <
i
lc f 1
D
r
rock ' . '
Figure 4.18 Numerical model for bluntness analyses
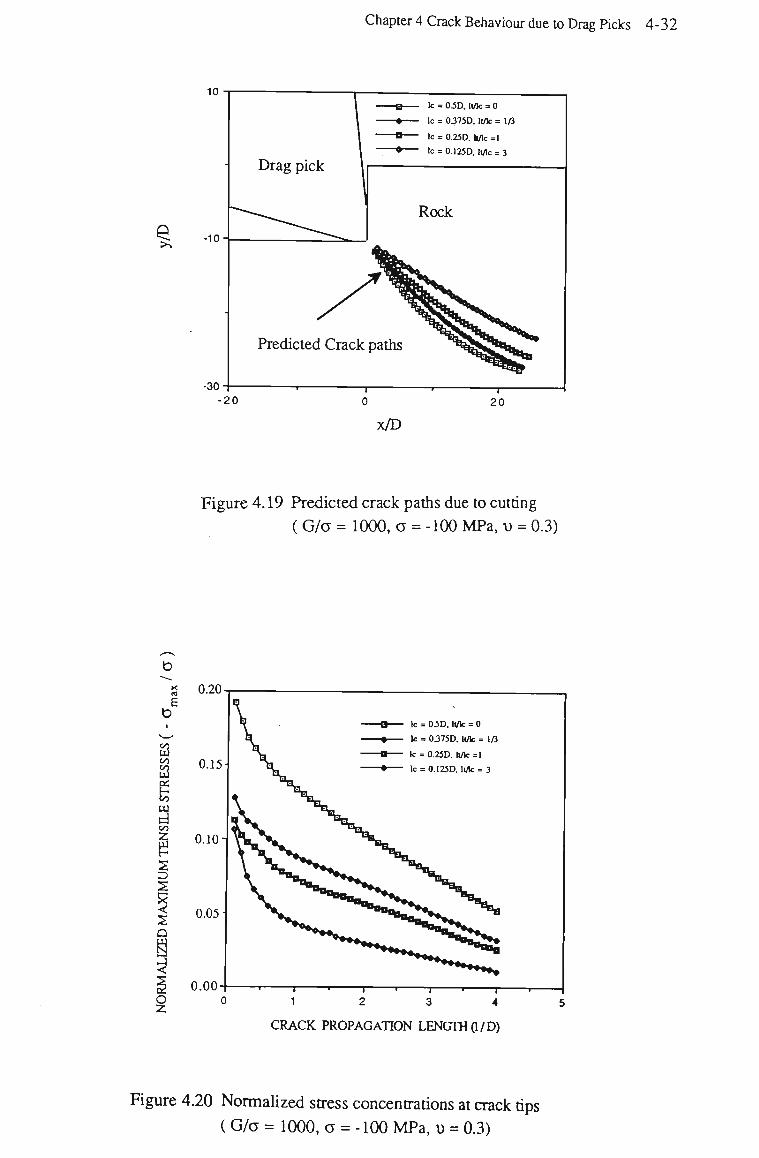
Chapter 4 Crack Behaviour due to Drag Picks 4-32
10
X n
E
S3 Vi
d
s s <
Q
s o z
-30
-a lc = 0.5D. llflc = 0
• lc = OJ75D. Me = 1/3
-O lc = 0.25D. Mc =1
Drag pick "• lc = 0.125D. M c = 3
Rock
Predicted Crack paths
-20 20
x/D
Figure 4.19 Predicted crack paths due to cutting
(G/a = 1000, a = -100 MPa, v = 0.3)
0.20
0.15
0.10-
0.05-
0.00
CRACK PROPAGATION LENGTH (1/D)
Figure 4.20 Normalized stress concentrations at crack tips
(G/o = 1000, a = -100 MPa, u = 0.3)
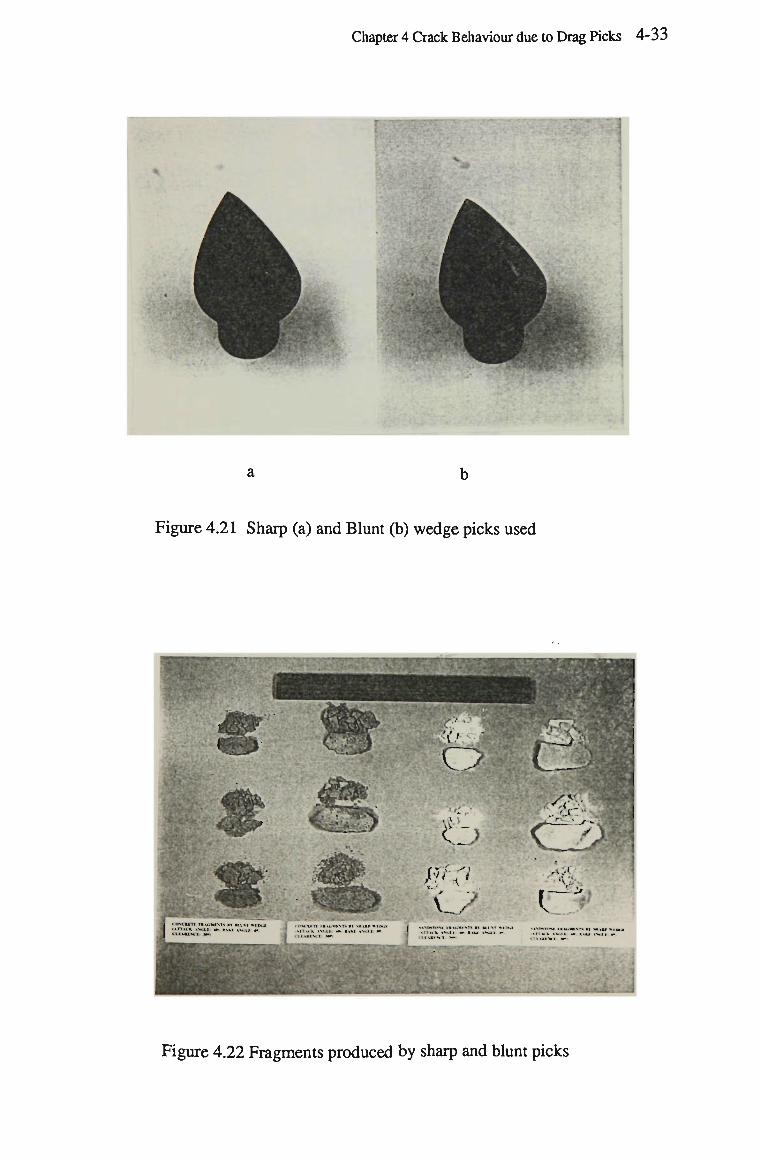
Chapter 4 Crack Behaviour due to Drag Picks
Figure 4.21 Sharp (a) and Blunt (b) wedge picks used
Figure 4.22 Fragments produced by sharp and blunt picks
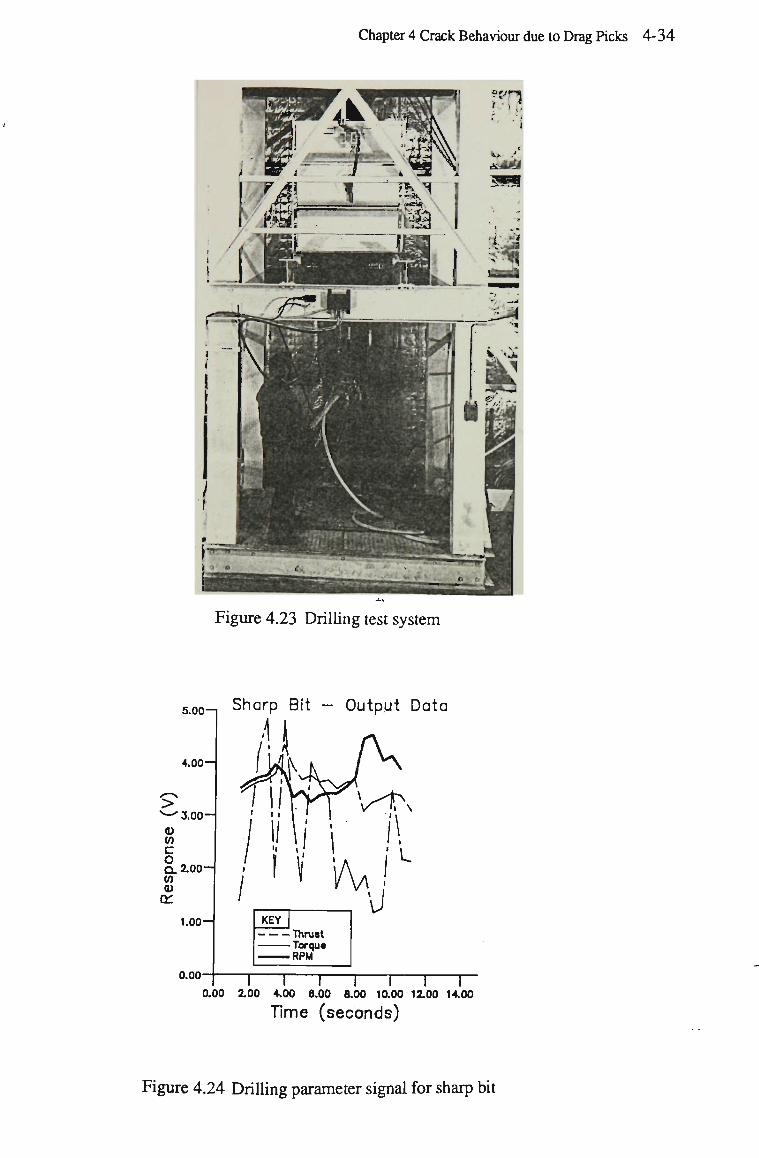
Chapter 4 Crack Behaviour due to Drag Picks 4
! • 11
v •'
\ m
Figure 4.23 Drilling test system
soo^ Sharp Bit - Output Data
i I 4.00—
^ 3.00-
V)
c o Q.2.00-W <D
on 1.00-
0.00
/! I' i ''I KEY
Thrust Torque RPM
—l ! j j j ! j _ 0.00 2.00 4.00 6.00 8.00 10.00 12.00 14.00
Time (seconds)
Figure 4.24 Drilling parameter signal for sharp bit
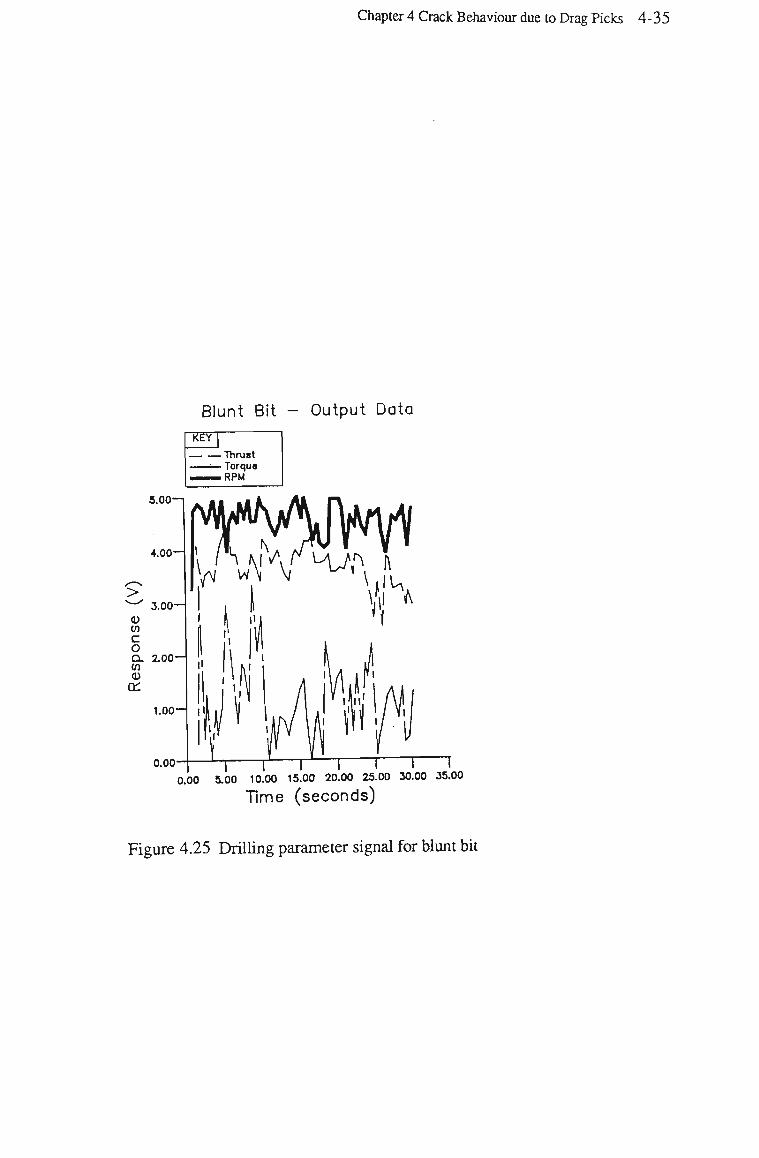
Chapter 4 Crack Behaviour due to Drag Picks 4-35
Blunt Bit - Output Data
kEY|
Thrust ••— Torque
— — R P M
5.00—1
4.00-
> ^ 3.00 V
w c o D L 2.00-1 V) <D
rr i.oo-
I
o.oo-|—'-i rJ f- | | | [ 0.00 5.00 10.00 15.00 20.00 25.00 30.00 35.00
Time (seconds)
Figure 4.25 Drilling parameter signal for blunt bit
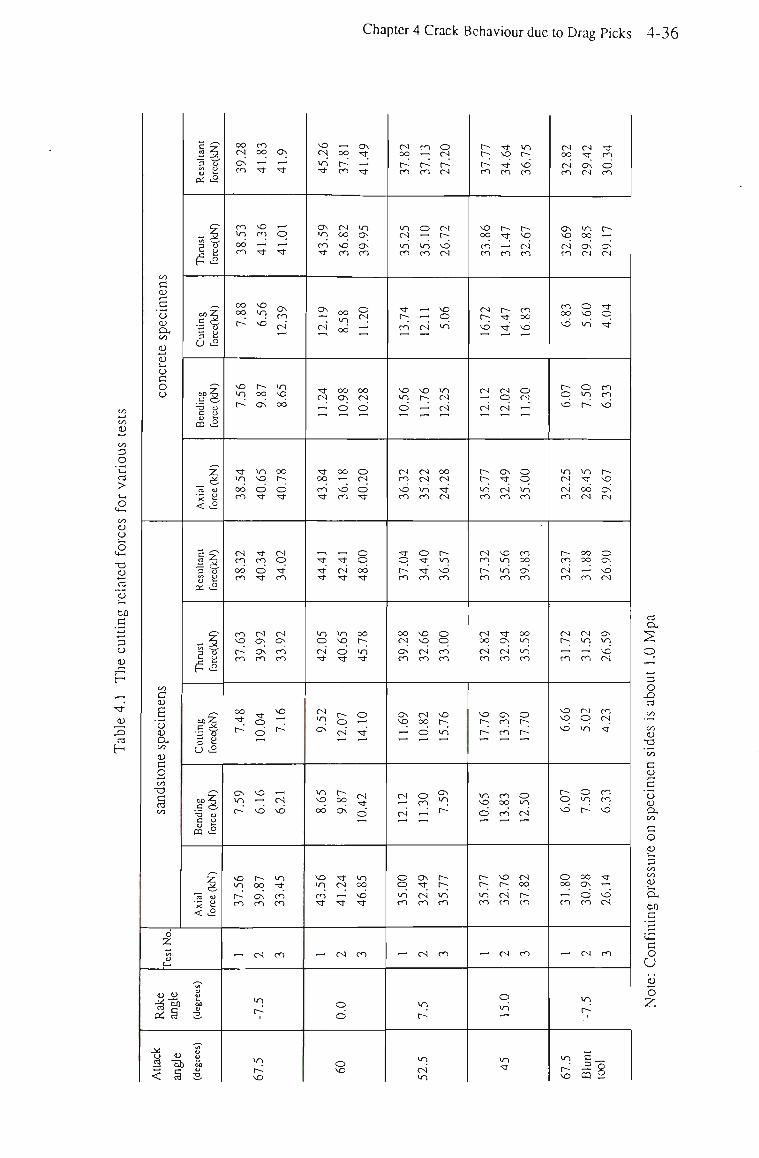
Chapter 4 Crack Behaviour due to Drag Picks
a ti
B o 0) a, 00 £ u Ui
o c o o
00
c CD
S o CO &, oo
a o •* — »
OC "O
oc
J o 2
Rake
angle
M
Atlac
angle
II 3 v u t: oi <2
— 2 3 "s" ^ K H <2
eoZ c cS
^ £ a c°
-O ty C o o fe m <2
2* o
*<3 CJ
* B < £
II 3 ~tf </) O
£ £
-• 2
to 2 •E v s a u v2
•o o c p ££
„
3-'rt CJ
* a < £
,_ aj
u u T3
O
3
oo cs Ov CO
ro vo CO CO
oo oo t>
vo
r~
•tf >o od ro
CS CO
od ro
ro vo r~ ro
oo •tf
f-
Os >o t-
vo VO
r- CO
,-,
ro oo •—> -tf
vo ro T~'
"tf
VO <o vd
oo OS
IO vo O tf
tf CO
d tf
CS OS
Os ro
tf o d i — i
VO
vd
r 00
Os ro
cs
VO
r-"
vo
VO
Os
•—' "tf
o T 1
tf
OS CO cs p~l
io vo od
oo C-; O tf
CS
p tf" CO
cs OS
coco
vo
r~
CS
vd
vo tf ro CO
ro
vo CN VO
"tf
Os 'O
ro "tf
Os
CS .—.
• t f
CN ,_'
Tr oo CO
tf
5 "tf tf
vo O CS
tf-
CS IO Os
vo VO od
VO in ro "tf
.-H
OO
r ro
CS OO
vd CO
oo vo od
oo Os d
oo ^ vd CO
"tf cs "tf
in vo d "tf
r-o cs
oo OS
"tf CS t — <
tf
cs
q d
o VO
Os •tf
^ •tf
vo Os Os ro
O CS ,-.' -
OO
cs d
o CS d •tf
o o od -tf
oo r-; IO
"tf
o
"tf
cs "tf d
IO oo vd • t f
ro
CS oo r> co
io cs <o ro
tf-r> ro "
vo VO
d
cs co vd ro
-tf q r~ ro
oo cs OS-CO
Os vo _
cs
cs
o q vo-ro
.—
CO
r~ ro
O ~ vo ro
-
CS •—*
SO
^J,
CS cs IO ro
o "tf tf ro
VO VO
CS CO
rs oo o
O CO ,_:
Os
tf CN CO
CN
lO
IO
oi VO
o cs r~ cs
CN r-; vd cs
VO
q vo"
lO cs cs"
oo cs tf" cs
r lO
vd CO
o q ro CO
VO
>o
OS >o r~
r— f"; io" ro
ro
r~ r-; r-~ ro
VO OO
ro" ro
CS
vd *—
CS
CN
r t-; vo-ro
CN CO
t~ ro
CS 00
cs CO
VO
r--
VO VO
d
r— r~; IO CO
—
•tf
VO
•tf CO
r~ tf ^ CO
• t f
•tf T—
CS
q CN
OS
tf CS CO
VO IO io ro
tf Cs CS ro
Os CO ro
ro oc ro
vo t-cs CO
cs
q vo
vo
tf
IO r vd CO
r-vq cs' CO
ro oc vd •—•
o oi _'
o q vo CO
ro oo Os CO
oo IO IO ro
O
r-
o VO oi
OI oo r~ ro
ro
CN oo oi ro
Os VO
oi CO
ro oo vd
o vd
VO cs oi ro
r~ ro oi CO
CN r~; ^ CO
vo VO vd
r-o vd
o oo T-*
CO
< - l
>o
VO
CN
"tf Os CN
in 00
Os CN
O SO VO
a lO r
vo tf oc CN
OO 00
« ro
CN in
—'. CO
CN
q io"
o IO r
OO OS
d CO
CN
in
r~ i
tf ro d ro
r~
Os CN
tf
•tf-
CO CO
vd
r~ vq Cv CN
Os
vd CN
Os in VO OI
ro O)
tf
ro ro vd
tf "-- vd cs
co
1
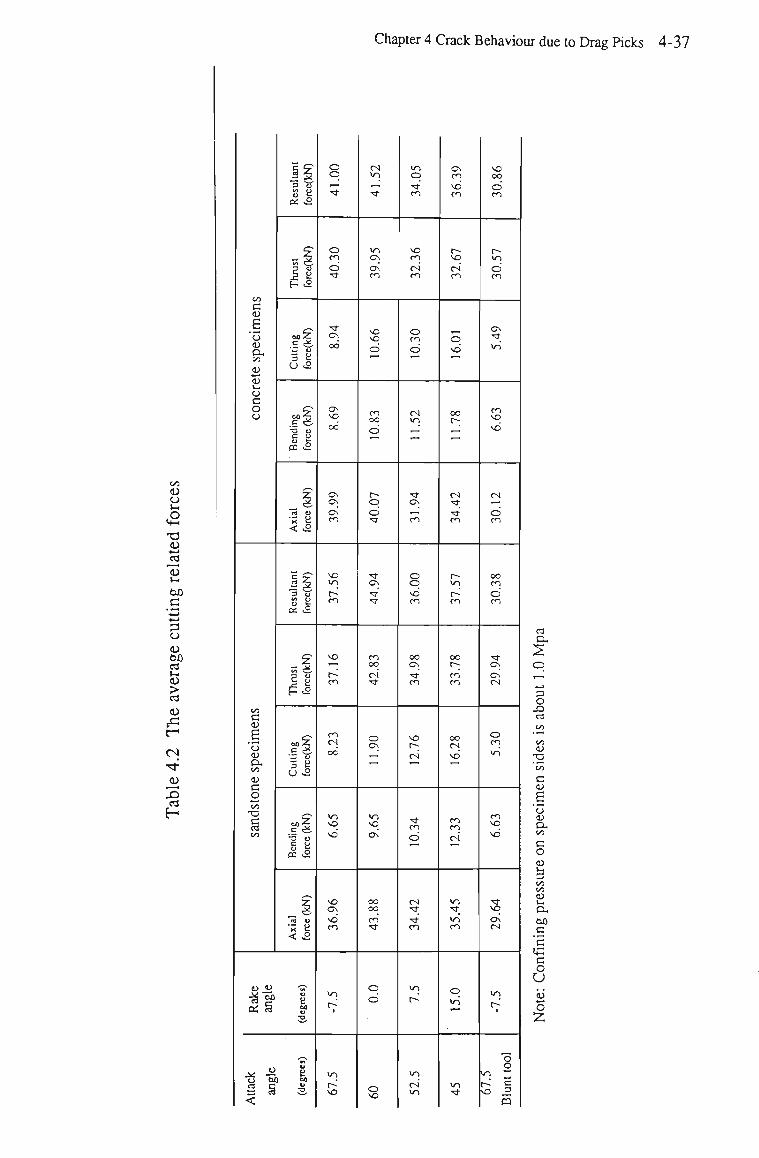
Chapter 4 Crack Behaviour due to Drag Picks 4-37
oo D CJ
S et l-H
M
2 o CvO
> CsJ
CN
00
C <U
6 o CU CX OO IU 4—t
<u 1—
o c o o
oo c CD
E o CD
ex oo CD C o 00
-a
oo
Rake
angle
ttack
anele
<
<2 3 3 O S e oi v2
*- 2
H £ £
to 2
3 g O v2
T> o
S M « £
*jr
5. "rt o "5 H < &
C y — 2 3 a s a os v£
,1
£-,
3 S 3.2
.s * •o o
S "rt ft> x K < <S
M U
K u u
3 M
u B ) OS
•a
O q *-H
"tf
o ro d tf-
•tf
Cs od
OS
vq oc
Cs CS
Cs CO
vo vo p~ co
VO
»-; i> CO
CO CS
od
<o VO
vd
VO OS
vd CO
vo
i
WO
r-" VO
CN <o f-H
•t f
<o Cs os ro
VO
vq d
CO oc d »—
r-o d • t f
tf-OS
-tf" tf
CO CO
cs" •tf
o CS
_' t—1
>o VO OS
oo CO
co" •t f
q o"
o VO
vo q •tf'
co
VO ro oi co
o CO d
cs vo , — •
f — '
•tf
OS
.—. CO
o q vd CO
oo Cs •tf CO
VO l> oi
tf-ro d f - H
CN tf
•tf
CO
l>
vo
oi vo
CS co vd CO
t-~ vq oi co
o vd
co
,-J »—»
CN •tf
•tf' co
r— vo r-' co
oc C~;
coco
OO CN
vd .—'
co CO cs" »-H
IO • t f
m" CO
q <o"
VO
•tf
VO OO
d CO
r~-<o d co
OS
"tf vo"
co VO
vd
cs
d CO
OO CO
d CO
•tf OS
CS-CS
o CO
vo-
co VO
vd
•tf
vq Os cs
vq
8 VO ~
r-' S VO j2
ca
C3
ex
3 O C3
CD
T3
c CD
B o CD
ex 00 C O
oo
a ex c c c o U ii -— O
Z
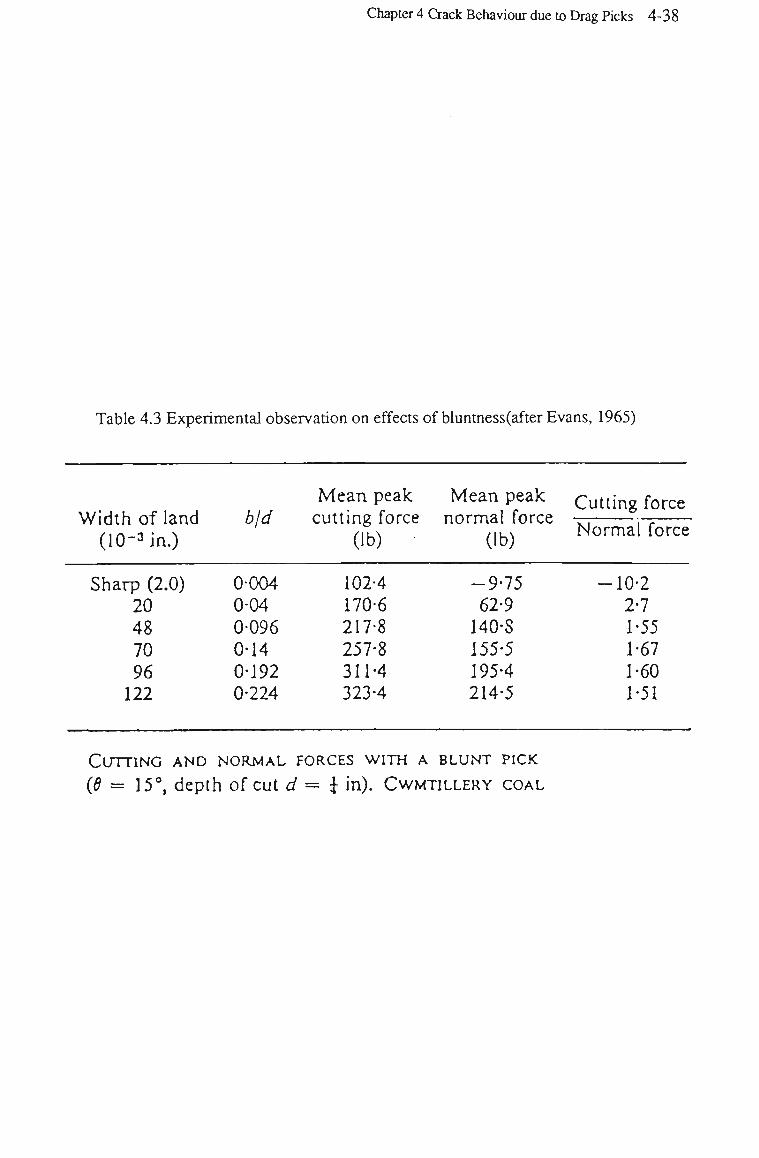
Chapter 4 Crack Behaviour due to Drag Picks 4-38
Table 4.3 Experimental observation on effects of bluntness(after Evans, 1965)
Width of land (I0~3 in.)
Sharp (2.0) 20 48 70 96 122
b}d
0-004 0-04 0-096 0-14 0-192 0-224
Mean peak cutting force
(lb)
102-4 170-6 217-8 257-8 311-4 323-4
Mean peak normal force
(ib)
-9-75 62-9
140-S 155-5 195-4 214-5
Cutting fo
Normal fc
-10-2 2-7 1-55 1-67 1-60 1-51
CUTTING AND NORMAL FORCES WITH A BLUNT PICK
(0 = 15°, depth of cut d = \ in). CWMTILLERY COAL
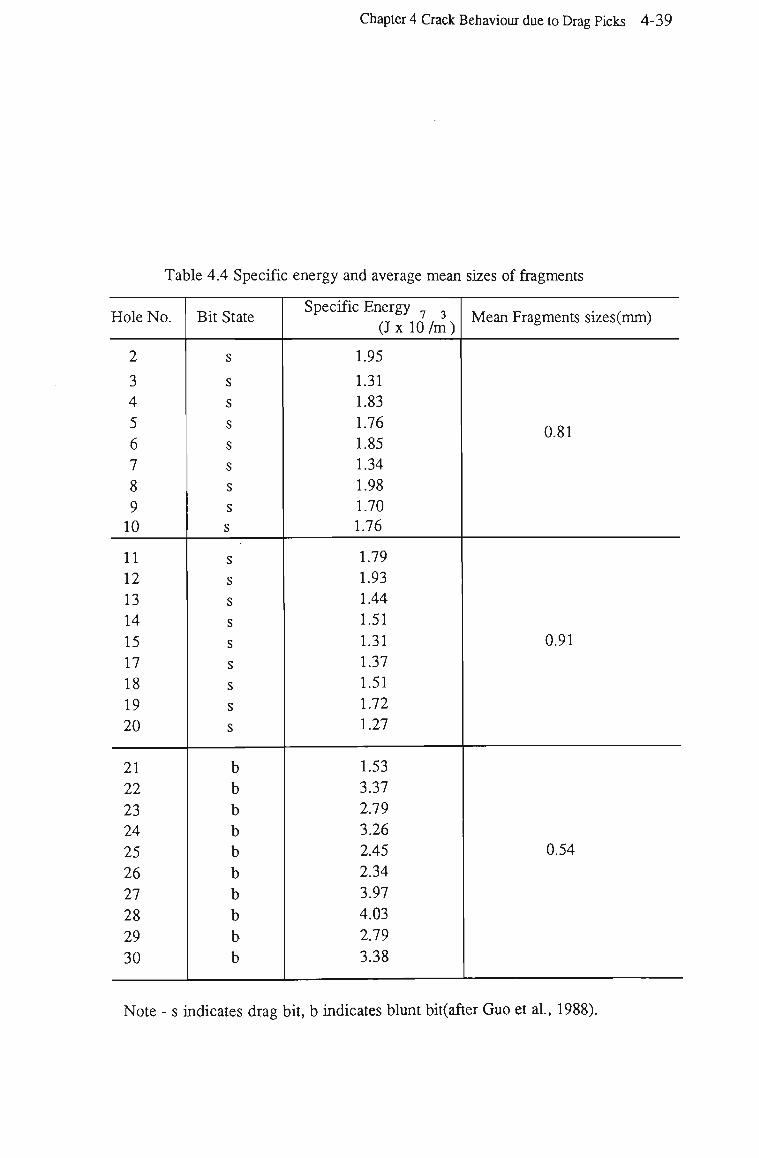
Chapter 4 Crack Behaviour due to Drag Picks 4-39
Table 4.4 Specific energy and average mean sizes of fragments
Hole No.
2
3 4
5
6
7 8
9 10
11 12
13 14
15
17
18
19
20
21
22
23 24
25
26
27
28
29
30
Bit State
s
s
s
s
s
s s s s
s s
s
s
s
s s
s
s
b
b
b
b
b
b
b
b
b
b
Specific Energy
(J x 10/m)
1.95
1.31
1.83
1.76 1.85 1.34
1.98 1.70 1.76
1.79
1.93 1.44
1.51
1.31 1.37
1.51 1.72
1.27
1.53
3.37
2.79 3.26
2.45 2.34
3.97
4.03
2.79
3.38
Mean Fragments sizes(mm)
0.81
0.91
0.54
Note - s indicates drag bit, b indicates blunt bit(after Guo et al., 1988).

CHAPTER FIVE
CRACK BEHAVIOURS DUE TO BI-INDENTERS
Chapter 5 Crack Behaviour due to Bi-Indenters 5-1
CHAPTER 5
CRACK BEHAVIOUR DUE TO BI-INDENTERS
5.1 Introduction
It is generally accepted by the mining industry that further developments in mechanization
and automation are required, and one of the major developments has been motivated for the
need to improve the efficiency of hard rock mechanical excavation. Disc cutters are generally
applied to this kind of rock. A better understanding of this type of tools is critically important
for hard rock excavation development.
Subsurface crack interaction(subsurface chipping) between adjoining disc cutters has been
regarded as the most dominating fracture process in disc cutter cutting. A large number of
experiments has been undertaken to investigate the mechanism involved (Miller, 1974,
Ozdemir, 1975, and Roxborough, 1981). The details of these works are reviewed in Chapter
2. One of the purpose of the investigation is to select the optimum spacing between
adjoining disc cutters. Cutting performance, and therefore operating costs, are closely related
to this factor.
Whereas subsurface chipping has received significant attention from investigators, primary
crack development involved in the disc cutting, which propagates mainly downward into
relatively large depths, has been ignored for most disc cutting studies. The reason may be
that these cracks are generally not visible from the rock surface.
Primary cracks were found to interact with each other in the case of indexed indenters
(Lindqvist, 1984). The outwardly directed primary cracks were observed on the rock sample
cut by a triple tungsten carbide kerf cutter. A stress field due to two-indentations (point
loads) was calculated from Boussinesq solution. The results indicate that the directions along
which the maximum tensile stress act on are close to the direction of the outward directed
Chapter 5 Crack Behaviour due to Bi-Indenters 5-2
primary crack, observed experimentally. This study implies a way of possible control of the
primary crack behaviour, and therefore, a possible approach to improve the rock cutting
performance. The study reported is rather preliminary, and further investigations on the
controlled experimental condition and theoretical analyses are required.
Crack systems due to static indentations by single indenter and simultaneously by two
indenters(Bi-Indenters) are closely related to those involved in actual disc cutting. The work
in Chapter 5 was aimed to investigate basic primary crack behaviour involved in the
simplified indentation systems, i.e., single indenter and Bi-Indenters. It is believed that the
phenomena observed from these systems will generally reflect reality in actual disc cutting.
The work in this chapter is reported in two parts, i.e., the experiments and the numerical
modelling results. Firstly, preliminary experiments were designed to provide information on
the crack patterns and the crushed or failure zone immediately underneath the tip of the
indenter. The information observed was also used later for the boundary conditions for
numerical modelling. Secondly, numerical modelling was conducted to investigate the effects
of some basic parameters on the crack behaviours involved in Bi-Indenters, i.e., the spacing
between the individual indenters of Bi-Indenters. Thirdly, additional experiments were
undertaken to confirm the finding of the numerical modelling. Finally, the implications of
this finding for disc cutting design are discussed.
5.2 Experimental Apparatus and Preliminary Tests
The experimental apparatus called "Bi-Indenters" is shown in Figure 5.1. The Bi-Indenters
was made from two percussive chisel bits with tungsten carbide tips. The bits were wedge
shaped with included angle of 120 degrees, the carbide tips were close to sharp. The bits
were welded onto small steel blocks which were able to slide along a guiding channel of a
specially made holder. In this way the spacing between the two bits was adjusted. By using
Chapter 5 Crack Behaviour due to Bi-Indenters 5-3
only one bit on the holder, a single indentation can be performed. The holder was attached to
a 1800 k N Avery testing machine, as shown in Figure 5.2.
The rock specimens have a length of approximately 300 mm, a height of 200 mm and a
width of 100 m m . Only one side of each block was used for the indentation tests to avoid the
possibility of introducing interaction between different crack systems. The tests were
conducted on sandstone and limestone, a summary of some mechanical properties of which
are given in Table 5.1.
At first, the single bit indentation test was carried out under loads of 20 kN, 40 kN, 60 kN
upto 100 kN. Then, the test on the Bi-Indenters was carried out, the spacing between the bits
was set to 20 m m apart. The loads of 20 kN, 40 kN, 60 k N up to 140 k N were used. For all
these tests, the loading rate was fixed at 10 kN/min..
Following the tests, the rock specimens were cut by diamond saw to reveal primary crack
systems. The rock surface to be examined was polished with sand paper. In order to
highlight crack, failure or crushed zones produced, a blue dye which was mixed with a
solution of araldite resin was used. The specimen was heated up to 100°C, then the solution
was applied to the polished rock surface to penetrate into major cracks and failure zones, and
extra solution formed a thin film on the section surface. After the film set (it took about 30
minutes depending on the amount of araldite hardener in the solution), the surface film was
removed using sand paper. The processed surfaces of rock samples were examined using a
standard laboratory microscope, and photographs were taken.
Typical photographs of subsurface primary crack and fracture zone due to the single indenter
and Bi-Indenters on both sandstone and limestone specimens are shown in Figure 5.3a,b
and 5.4a,b respectively. Three significant features can be seen from these photographs.
Firstly, fracture or crushed zones are found immediately underneath the tips of the indenters,
the rock in this zone is intensively fractured. Secondly, two types of cracks are observed, in
both cases, i.e., lateral cracks which propagate roughly parallel to the rock free surface, or
Chapter 5 Crack Behaviour due to Bi-Indenters 5-4
approach the surface, and the primary cracks which propagate vertically downward, or with
some angle to the vertical. Both types of the cracks are initiated from these observed crashed
zones. In term of crack length, the primary cracks are more significant than the lateral cracks.
Lateral cracks which form subsurface chips between the adjoining disc cutters have been
observed and studied by many investigators(Miller, 1974, Ozdemir, 1975, and Roxborough,
1981). However, the primary crack or use of it has been ignored for disc cutting research in
the past. In contrast to the observation that primary cracks penetrate into rock vertically along
the direction of indenting in the case of a single wedge indentation, the primary cracks due to
Bi-Indenters propagate into rock outwardly with some angle to the vertical direction. For the
tests herein on sandstone and limestone specimens, the angles between the primary crack
propagation direction and the vertical direction are close to 37°. The fact indicates that it is
possible to control the direction of the primary crack propagation. The mechanism is
investigated later in this chapter both numerically and experimentally.
Based on the observations on the failure zone, it is assumed that the geometrical shape of
these zones for the wedge type of indenters is close to triangular shape, as shown in Figure
5.5. The material within the zone is in a compressive hydrostatic state, exterting a uniform
pressure on to the surrounding virgin rock. The size of crushed zone normally depends on
the load or thrust applied to the indenters, and the rock properties such as hardness. In the
following analyses, a constant load, rock properties, and therefore a constant shape of
crushed zone are assumed.
5.3 The Effects of Spacing of Bi-Indenters
A series of numerical modellings and laboratory tests were undertaken to investigate the
effects of spacing of the Bi-Indenters on the primary crack behaviour. Based on the
assumption made on the crushed zone, simplified computing models are shown in Figure
Chapter 5 Crack Behaviour due to Bi-Indenters 5-5
5.6 and Figure 5.7 for the primary crack analyses for single indenter and Bi-Indenters
respectively. Similar to the computing model for drag-pick cutting in Chapter 4, the right,
left, and bottom sides of the boundary are fixed, along which any displacement is restricted.
The dimensions of these model are shown in Figure 5.6 for the single indenter, and in
Figure 5.7 for the Bi-Indenters. A total 100 elements and 160 elements were used to
discretize the initial boundaries for the single indenter and for the Bi-Indenters, respectively.
The modelling of the primary crack propagation started with an initial crack with a length of
5 mm (Figure 5.6, Figure 5.7).
Figure 5.8 shows the predicted crack propagation in the case of the single indenter. It can be
seen that the path of the crack predicted is in a close agreement with the crack observed in the
tests (Figure 5.3a, Figure 5.3b).
The effect of spacing of the Bi-Indenters on the primary behaviour was modelled. A series of
spacings, i.e., 20 mm, 40 mm, 60 mm, 80 mm and 100 mm were considered. The predicted
crack propagation paths for these spacings are shown in Figure 5.9. As can be seen that
outwardly propagated primary cracks were predicted by the numerical model. The predicted
primary crack propagation angle to the vertical is about 27°, in the case with 20 mm spacing,
which is less than that observed. A closer prediction of these angles is expected on further
study of the tool-rock contact condition. Figure 5.9 also indicates that the direction of the
primary crack propagation can be, at least partly, controlled by the spacing between
indenters. As the spacing increases, the angle of the primary crack propagation to the vertical
direction decreases. In the case with 100 mm spacing, the direction is close to the vertical,
which implies that the interaction between each indenter of the Bi-Indenters has ceased.
Figure 5.10 shows the normalized maximum tensile stresses at the crack tips as the cracks
propagate. The normalized maximum tensile stresses decrease as the cracks propagate,
which indicate that increasing load needs to maintain the crack propagations, i.e., the crack
propagations in all the case are stable. It can be seen that, at the beginning of the
Chapter 5 Crack Behaviour due to Bi-Indenters 5-6
propagations, higher normalized m a x i m u m tensile stress is observed in the cut with larger
spacing, which indicates that the crack is easy to initiate (small load is required). Otherwise,
a large load is required to initiate crack propagation. However, as cracks propagate, the
normalized m a x i m u m tensile stress decreases at a higher rate in the cut with a larger spacing,
which implies that less load increase is required to maintain the crack propagation for the cut
with a smaller spacing. In other words, once the crack propagation starts, for the same
amount of load, the longer crack propagation can be achieved in the cut with a smaller
spacing.
The above results indicate, one very interesting finding for the first time in disc rock cutting
studies, that it is possible to control the primary crack propagation in disc cutting by
selecting the spacing between indexed indenters. Further experimental work is required to
verify the concept on different rocks and different cutters. Ideal rock cutting processes can
be achieved when the fragment formation, such as fragment size and the load required can be
controlled. For example, more relatively large fragments and less small or fine fragments
imply the energy intensive process involved in the fine fragment formation is eliminated,
which will not only improve the overall cutting efficiency but will also reduce the level of
fine dust produced.
Fragment formation can possibly be controlled if the major cracks which form the fragment,
can be controlled. Research for methods of controlling related crack propagation and design
for cutting systems to make use of controlled cracks are highly recommended. The following
idea is one example of use of these controlled cracks.
5.4 Implication of the Concept for Disc Rock Cutting Design
It can be imaged that some kind of fragment will be formed if primary cracks from different
Bi-Indenters interact each other. If large rock fragments can be obtained, a method may be
Chapter 5 Crack Behaviour due to Bi-Indenters 5-7
found which could lead to efficient cutting. Based on this idea, the tests were designed to
produce a triangular fragment between the two set of Bi-Indenters, as shown in Figure 5.11.
At first, Bi-Indenters is used to produce a pair of outwardly directed primary cracks in
position 1. Then, at the position 2 at some distance away, the Bi-Indenters is used to
produce another pair of outwardly directed cracks with the aim of forcing the two adjoining
cracks from the two Bi-Indenters to form a wedge-shaped rock fragment between them.
Figure 5.12 shows the typical results of the tests, with distances of 30 mm, 40 mm, 50 mm,
60 mm and 80 mm between the adjoining indenter tips on the two Bi-Indenters. As can be
seen, the expected fragments tend to form between the two Bi-Indenters. The interactions
between the two Bi-Indenters are more apparent for small distances between the adjoining
indenter tips, such as 30 mm and 40 mm, than those for large spacing, such as 80 mm.
Based on the observations described above, a concept for an efficient cutting system is
proposed. The basic action of this proposed cutting system is to produce primary cracks in
the first pass of the Bi-Indenters, and to produce the secondary crack in the successive path
by another set of Bi-Indenters, and then the wedge fragment is formed between the two
passes. Finally, the drag pick is used to remove the fractured rock as shown in the Figure
5.13.
The cutting concept is a combination of disc cutting and drag-pick cutting. It is anticipated
that this system will be more energy efficient for hard rock cutting over conventional disc
cutting or drag pick cutting, not only because relatively large fragments can be produced, but
also because this system combines the advantages of both tools. The disc cutter is used for
pre-fracturing of rock, and the fractured rock is mainly removed by efficient drag pick. Geier
and Hood (1987) have demonstrated that pre-weakening a surface with parallel water jet
slots reduces the mechanical specific energy when subsequently excavating the rock with
drag picks. It is anticipated that improvement on overall energy usage and control of the level
of dust produced can be achieved by the proposed system herein.
Chapter 5 Crack Behaviour due to Bi-Indenters 5-8
Whereas the concept appears to have significant implications for hard rock cutting design,
the following factors should be realized. They are, 1) Tests were static, and the wedge bit
was used to simulate disc cutting. In the plane which contains the indenter load axes, with
the direction normal to disc plane, the tests are believed to be close to reality in disc cutting.
However, the rolling effects of the disc cutter were not considered. The fracture patterns
involved in the actual disc cutting might be somewhat different to those observed herein. 2)
The effects of disc cutter shape were not considered in this work. The fracture patterns due
to the blunt disc cutters have been reported elsewhere(Howarth, 1988, Howarth and Bridge,
1988), which are different from the fracture patterns due to sharp (or wedge) disc cutters. 3)
Only sandstone and limestone were used in the tests.
All three factors listed above may have influences on the fracture patterns produced in some
extent. Further research work is recommended in these directions. Despite the large amount
of research work still remained to be carried out, potential benefits of the proposed concept
can be realized from the work reported herein.
The advantage of the numerical modelling was again noticed, considering physical rock
cutting tests were rather labour intensive and time consuming, especially in the case of large
scale tests or in-situ rock cutting tests.
5.5 Summary
A series of laboratory tests and numerical modelling studies have been reported in this
chapter, the results can be summarized as follows,
1. Preliminary tests on the single indenter and Bi-Indenters were carried out to identify the
fracture patterns produced with particular attention to the primary crack system and the
crushed zone immediately underneath the indenter tip.
Chapter 5 Crack Behaviour due to Bi-Indenters 5-9
2. Both the primary crack, and the lateral crack were observed in the two cases, i.e., single
indenter, and the Bi-Indenters. These crack propagations initiated from the crushed zones. In
contrast to the vertically propagated primary crack due to the single indenter, in the case of
the Bi-Indenters, the primary cracks propagated outwardly into the rock when the spacing
was sufficiently small.
3. Based on the observations made, a simplified computing model was created for the
numerical analyses of the primary crack behaviour. The modelling results are in general
agreement with that observed in the tests. In addition, the numerical modelling predicts that
the spacing between the two indenter tips of the Bi-Indenters partly control the direction of
the primary crack propagation, i.e., the primary cracks tend to propagate away from the
central vertical line of the Bi-Indenters as the two indenters on it move closer to each other,
and wise versa.
4. These results lead to an idea that a relatively large rock fragment can be developed from
two primary cracks which approach to each other produced by the adjoining indenters of
two set of Bi-Indenters. This prediction was confirmed by further tests. A new concept of a
combined cutting system was proposed based on the idea, which basically involves two sets
of Bi-Discs to form the wedge shaped rock fragments between them, and a drag pick which
is designed to remove the wedge shaped fragments.
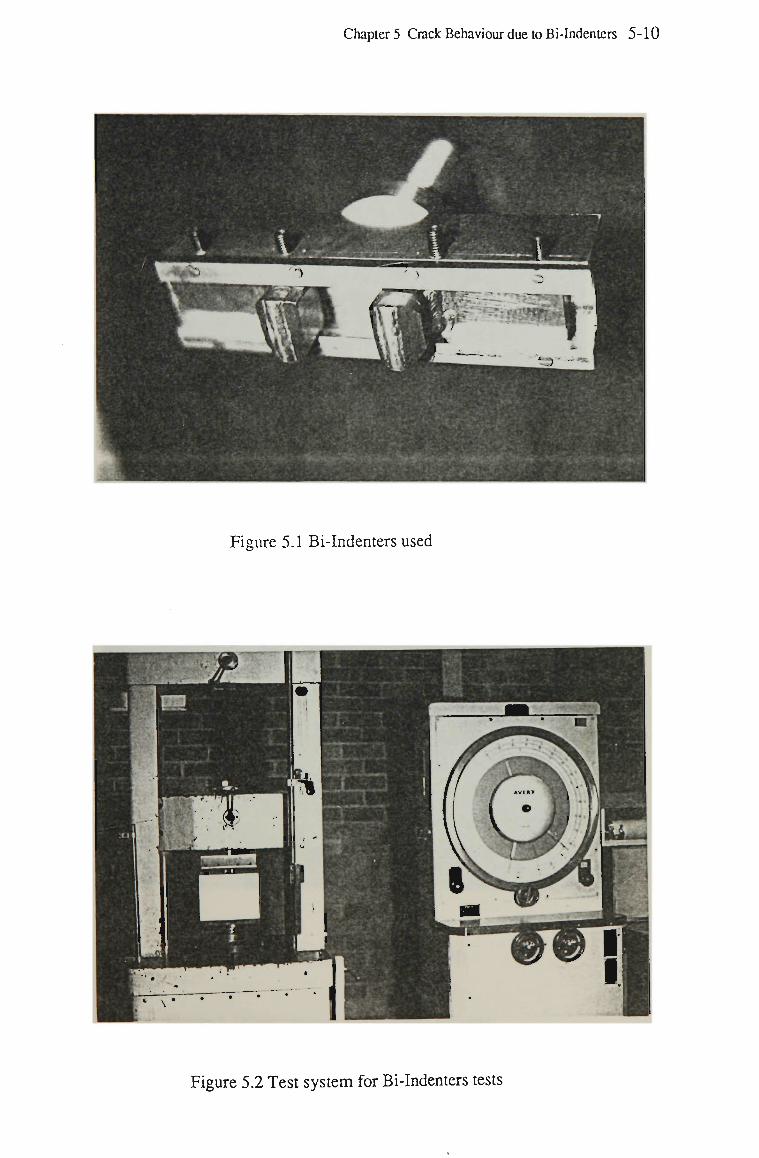
Chapter 5 Crack Behaviour due to Bi-Indenters 5-10
l"".-"
I
Figure 5.1 Bi-Indenters used
Figure 5.2 Test system for Bi-Indenters tests
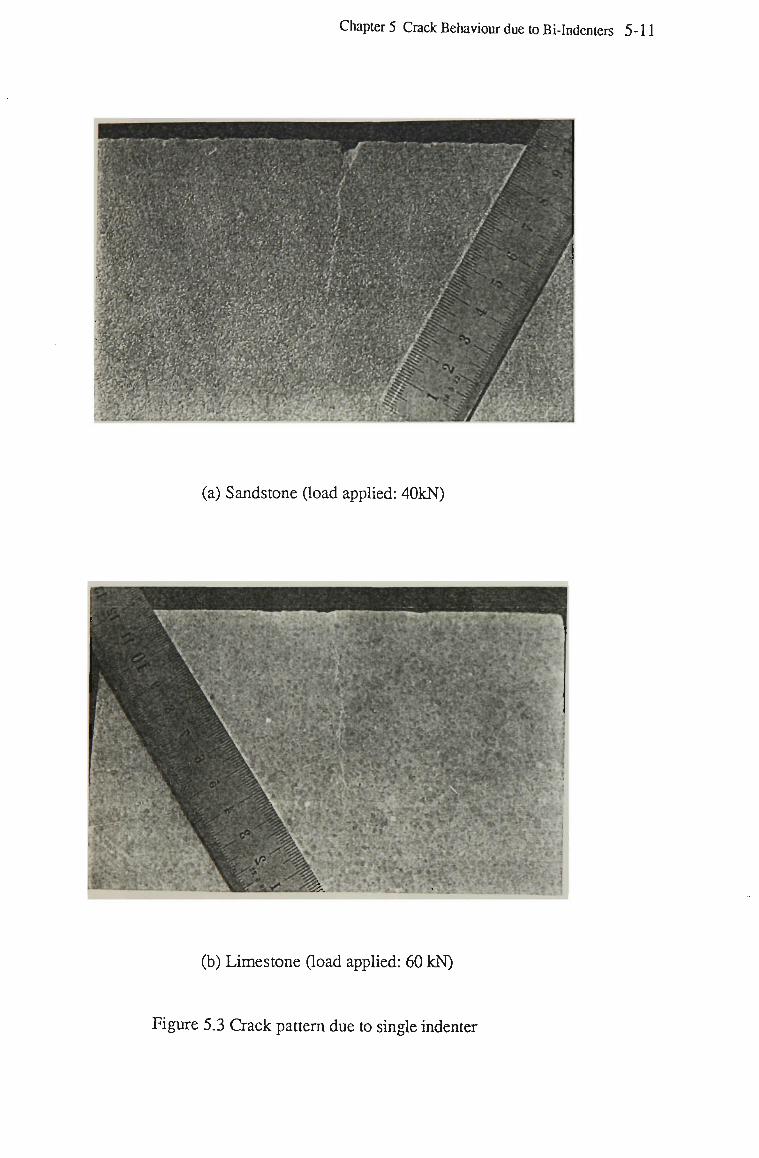
Chapter 5 Crack Behaviour due to Bi-Indenters 5-11
**
^ •;" N? ^ CV:
*v*
(a) Sandstone (load applied: 40kN)
-
(b) Limestone (load applied: 60 kN)
Figure 5.3 Crack pattern due to single indenter
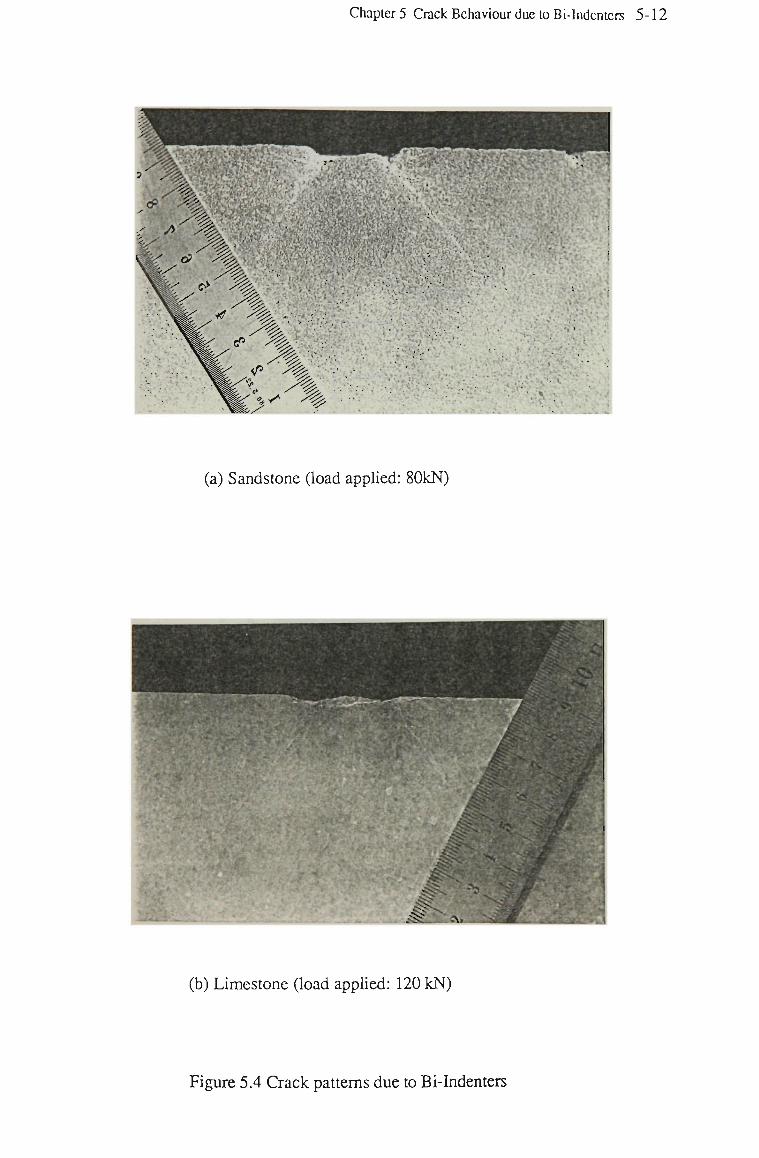
Chapter 5 Crack Behaviour due to Bi-Indcntcrs 5-12
(a) Sandstone (load applied: 80kN)
# :
^
^ :\>
(b) Limestone (load applied: 120 kN)
Figure 5.4 Crack patterns due to Bi-Indenters
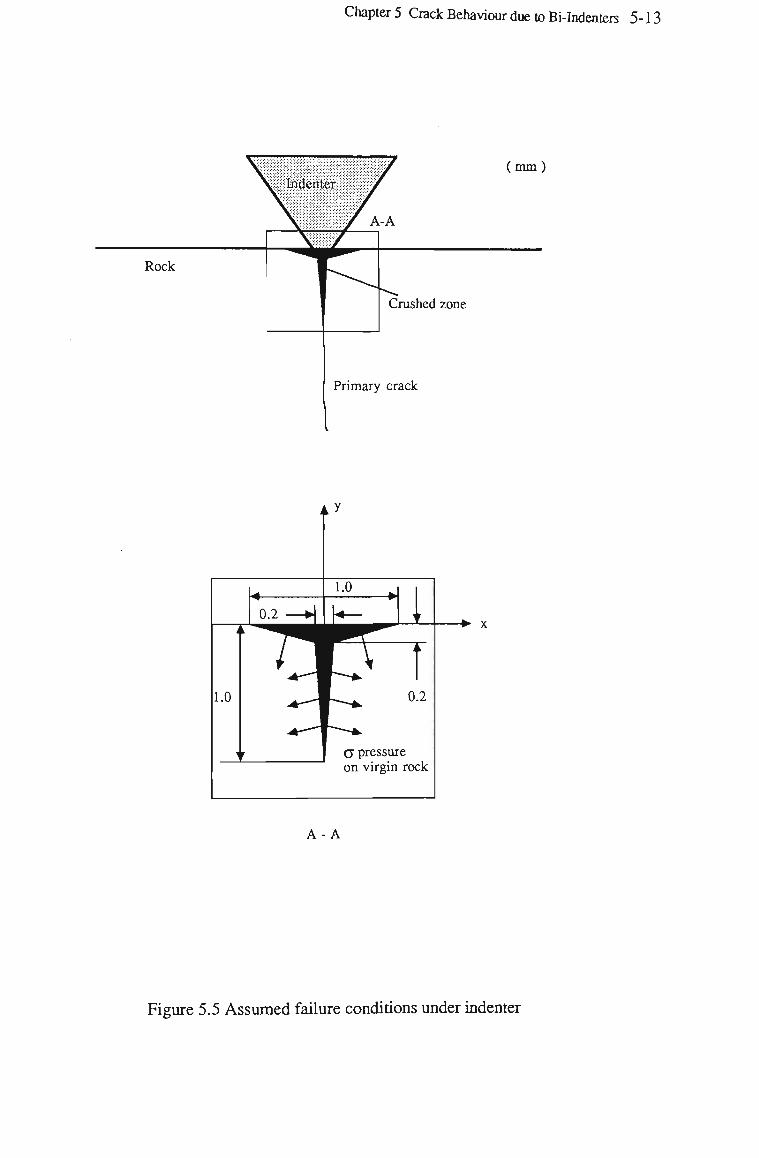
Chapter 5 Crack Behaviour due to Bi-Indenters 5-13
Rock
(mm)
Crushed zone
Primary crack
*- x
A - A
Figure 5.5 Assumed failure conditions under indenter
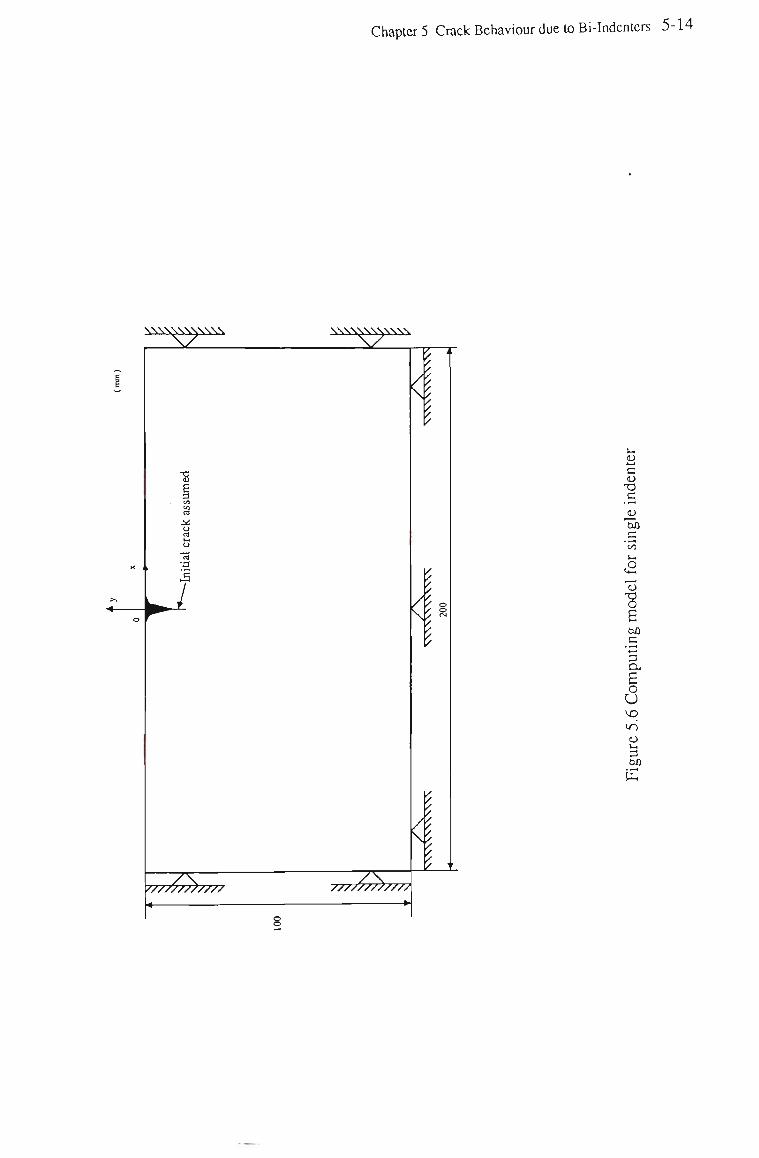
Chapter 5 Crack Behaviour due to Bi-Indcnters 5-14
\\\\\\\y\\\ ^
\\\\\Vv\\\Vx. ^
•8
o
•a a
^ 4
v/7>; '/////////// /T77/7. 777777777777
<
4—<
c CU
-a
.5 u c Vi l-H
.O cu T3 O
c
E o U so lO CU 3 bJQ
• t — <
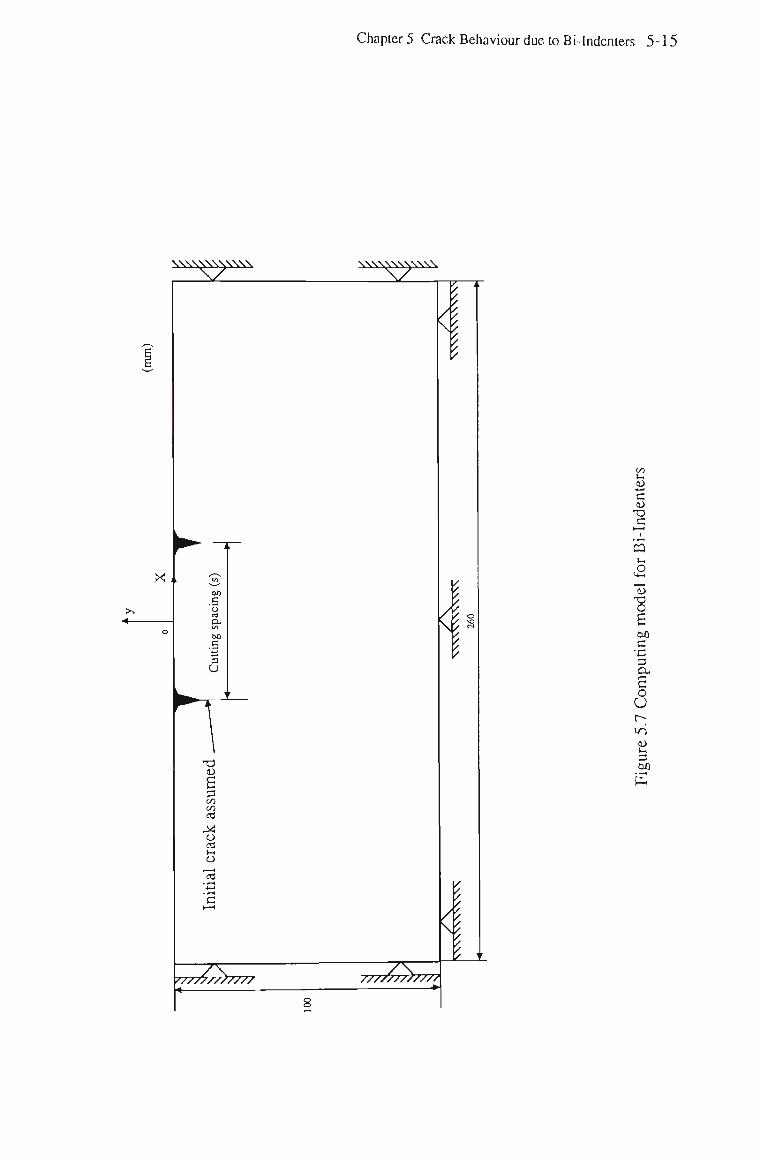
Chapter 5 Crack Behaviour due to Bi-Indenters 5-15
W V i V W v N W V
D C CU T3 C
ffl u
13 •8
bJQ C •c
a DH
E o U r-; in
u t-, 3 bfl
HH
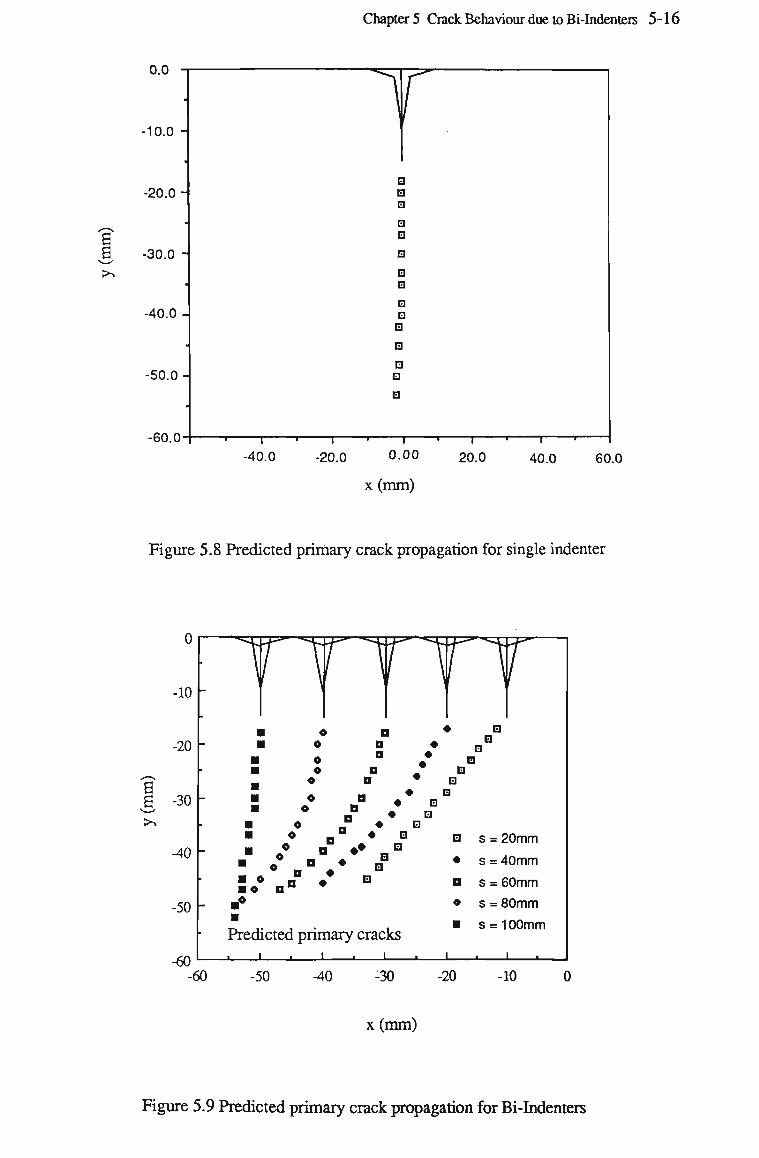
Chapter 5 Crack Behaviour due to Bi-Indenters 5-16
0.0
-10.0
-20.0 -
-30.0
-40.0
-50.0 -
-60.0
Figure 5.8 Predicted primary crack propagation for single indenter
-10
-20
E S -30
-40
-50
-60 -60
o D D
a • n •
Predicted primary cracks
•
•
D
O
•
s = 20mm
s = 40mm
s = 60mm
s = 80mm
s = 100mm
-50 -40 -30 -20 -10
x (mm)
Figure 5.9 Predicted primary crack propagation for Bi-Indenters
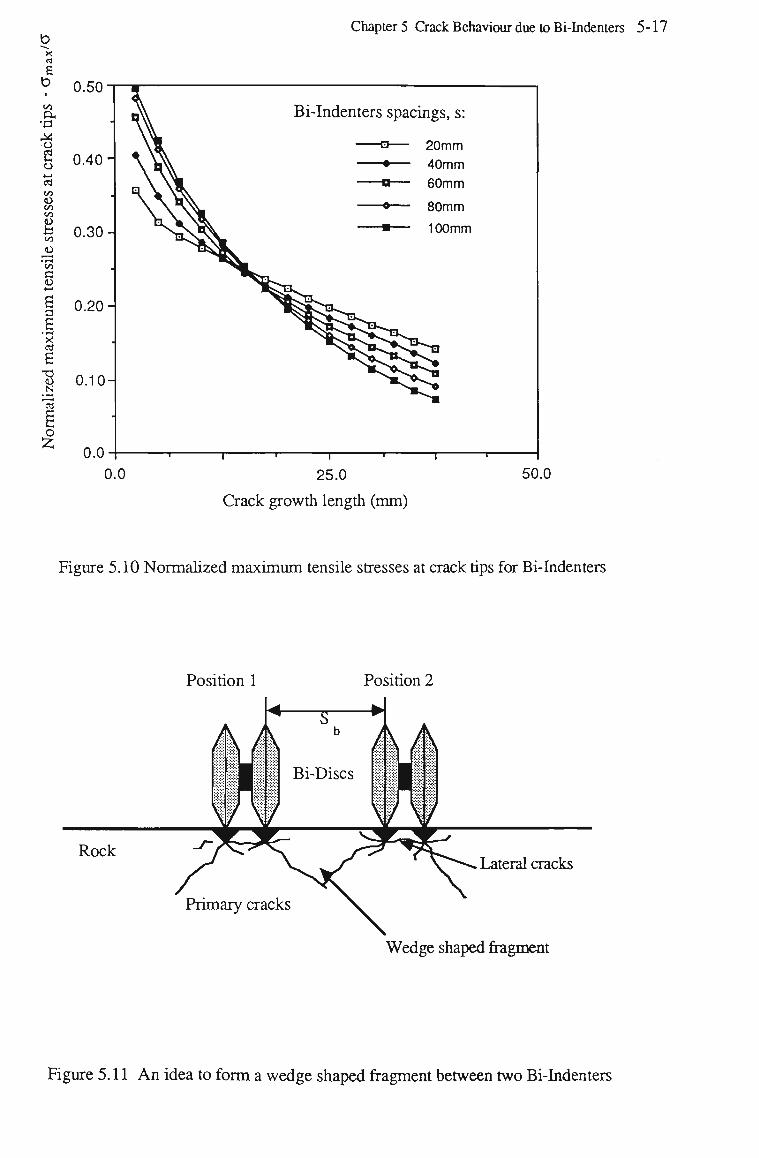
Chapter 5 Crack Behaviour due to Bi-Indenters 5-17
X
6 b c/5 OH
'CJ
fi O •l-H
ccj c/a O oo fi C/3 CU • rH
C <U +-J
e 3 E
T3 (U
13
I
0.50
0.40"
0.30-
0.20-
0.10
0.0 0.0
Bi-Indenters spacings, s:
Q — 20mm ••— 40mm •a— 60mm
«— 80mm
100mm
25.0
Crack growth length (mm)
50.0
Figure 5.10 Normalized maximum tensile stresses at crack tips for Bi-Indenters
Position 1 Position 2
Rock
Primary cracks
Lateral cracks
Wedge shaped fragment
Figure 5.11 A n idea to form a wedge shaped fragment between two Bi-Indenters
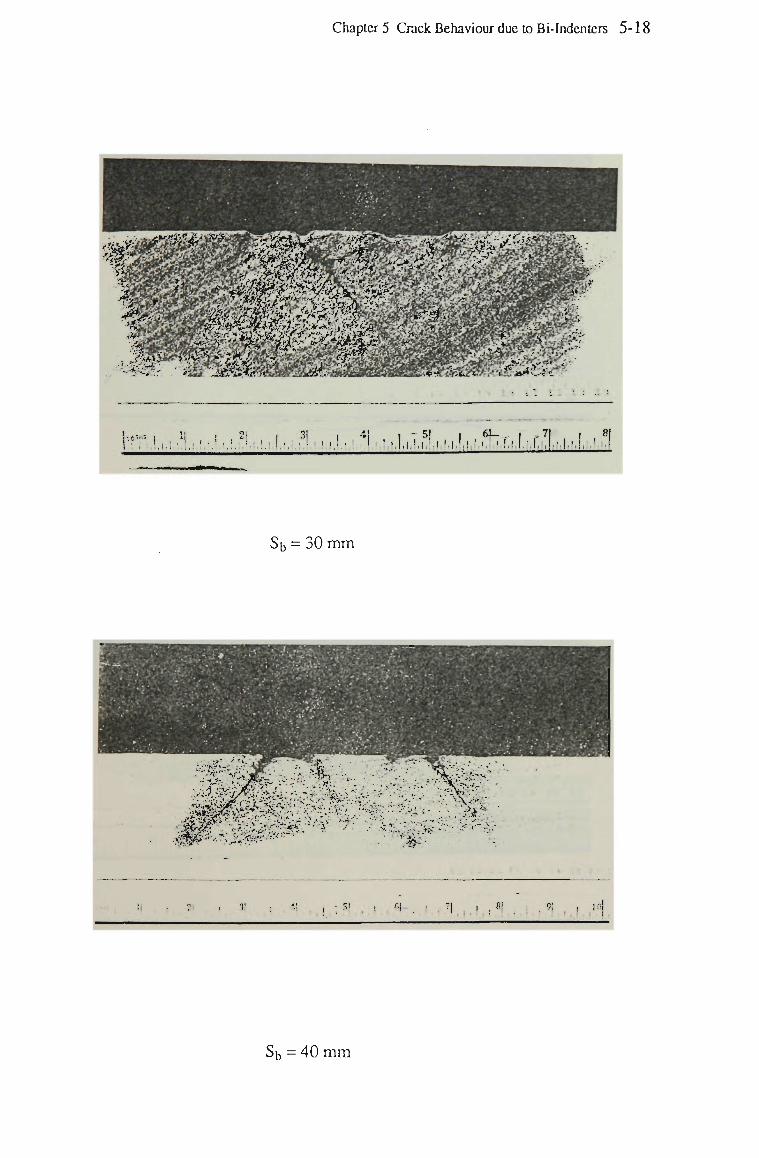
Chapter 5 Crack Behaviour due to Bi-Indenters 5-18
Ira, ~
,|A,.!,.I • * _ ,
!,(,du, Jit.ld.lil.lil 1 6h I.I.I.ITI.I;!,
,71 (.I,1,!:!,!-! |,,,l ,i
Sb = 30 mm
Sb = 40 mm
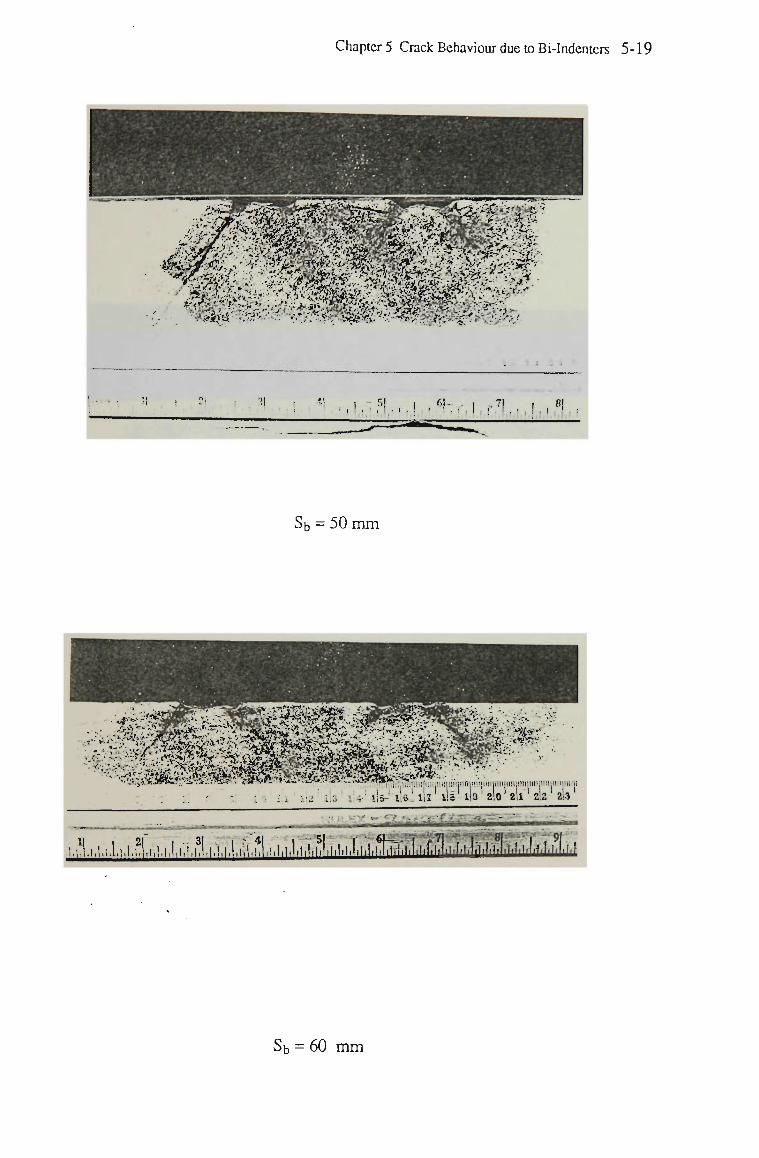
Chapter 5 Crack Behaviour due to Bi-Indentcrs 5-19
Sb = 50 mm
Sb = 60 m m
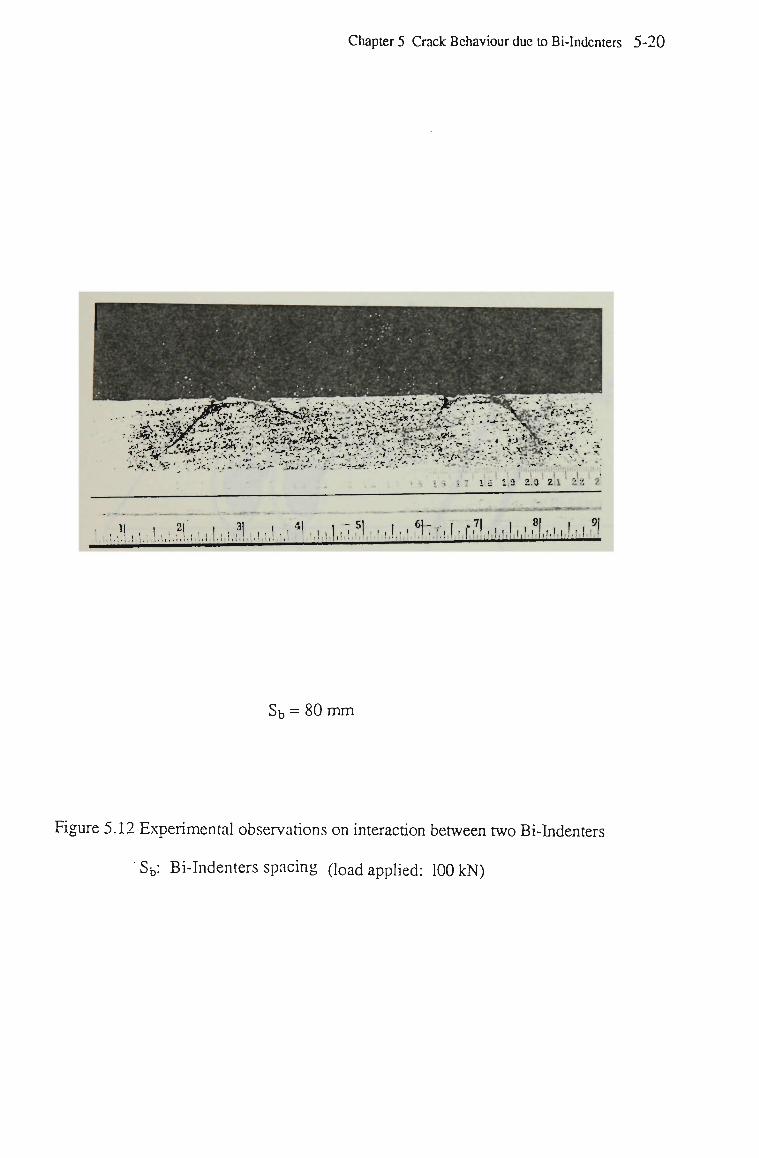
Chapter 5 Crack Behaviour due to Bi-Indenters 5-20
WK£C*.>. :r«. n-vv •TV
. * - f:i- -i
i r ' i IS l.l lie 119 2,0 2,1 2:2 2
2! ,1,nl/lfl..l.i.!.n •5'--!.i.=.--6rT.r.!.h.ril,i..,l..li.' .I.'J'.I.I.
S b = 80 m m
Figure 5.12 Experimental observations on interaction between two Bi-Indenters
Sb: Bi-Indenters spacing (load applied: 100 kN)
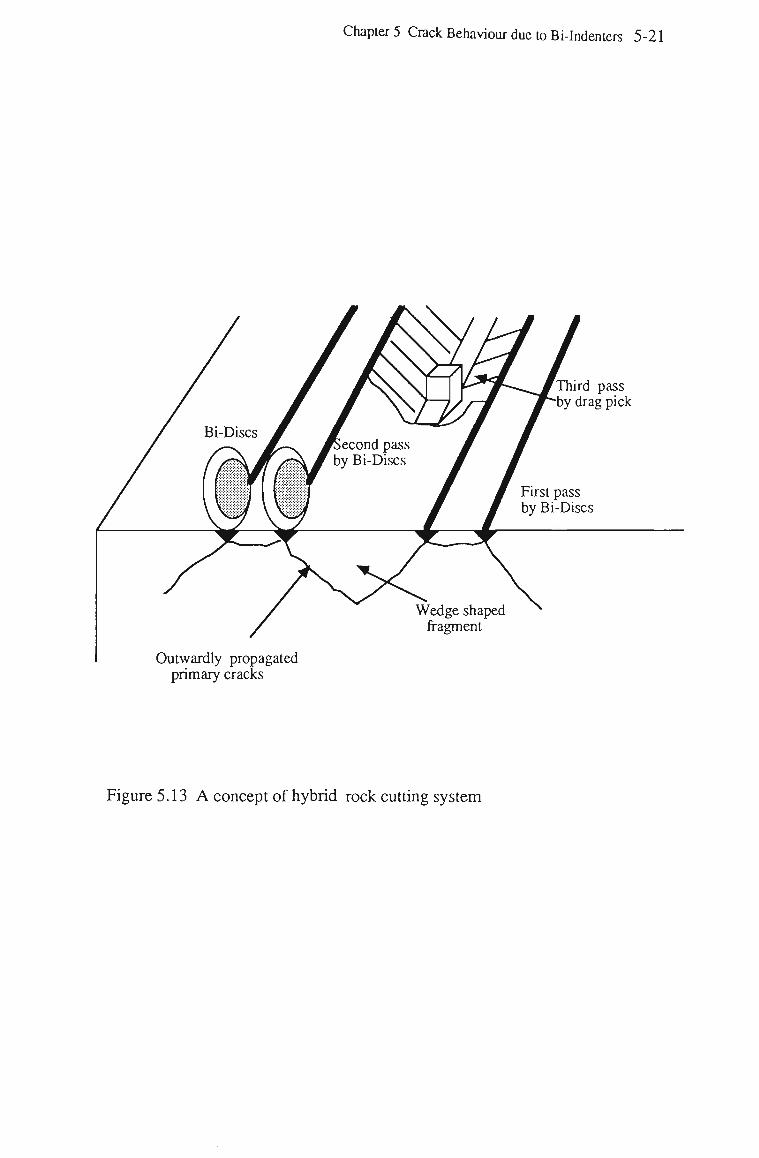
Chapter 5 Crack Behaviour due to Bi-Indenters 5-21
Third pass by drag pick
Wedge shaped fragment
Outwardly propagated primary cracks
Figure 5.13 A concept of hybrid rock cutting system
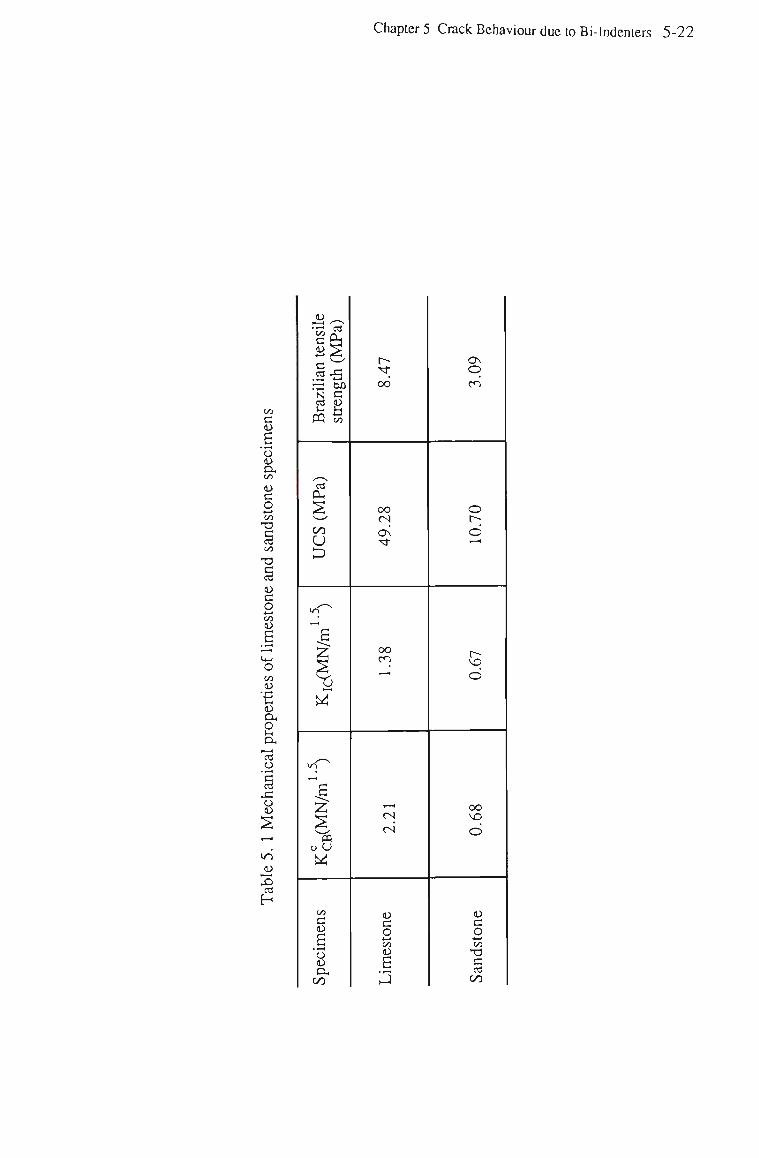
Chapter 5 Crack Behaviour due to Bi-Indenters 5-22
cu /_^
V,* o a o J^ . v •
i-s a w SI c cd CU
'cd OH
§, 00
o p
w-p 1-H
.6 |
"6 t — t
W
>o
,_:
E £ s ' PQ
o U
W
OT
c CU
6 °o <u OH 00
r-t-0O
oo CN ON -*t
OO
T~t
i—<
CN CN
CU c o 4—»
OT cu E •r-»
J
Os O
en
O t--o *-H
o
oo VO
O
CU C o -t—>
OT X)
c cd OO
CHAPTER SIX
ROCK FRACTURE TOUGHNESS
DETERMINATION BY THE BRAZILIAN TEST
Chapter 6 Rock Fracture Toughness Determination by the Brazilian Test 6.1
CHAPTER 6
ROCK FRACTURE TOUGHNESS DETERMINATION
BY THE BRAZILIAN TEST
6.1 Introduction
Fracture toughness (the critical stress intensity factor), Kic, is an intrinsic material property,
and is a measure of the energy required to create a new surface area in a material. W h e n the
stress intensity factor in the region of the fracture tip KT > Kic, the fracture is presumed to
initiate and propagate until K T is less than Kic-
An understanding of the mechanisms of rock fracture is a key element in solving many rock
engineering problems, such as rock cutting, blasting and rock mass structure stability
problems. Any fracture analysis requires the measurement of the toughness to evaluate the
conditions of the fracture growth. As fracture mechanics principals have received more and
more attention recently in rock engineering, there is a need for the development of a simple
and convenient technique for rock fracture toughness measurement.
Early measurements (Schmidt, 1976) of the fracture toughness of rocks were made
following the American Society for Testing Method (ASTM) E399, the standard test method
for metallic materials. As most rocks are brittle, fatigue precracking as required by the A S T M
recommendations has seldom succeeded. Test methods for rock have been developed on
testing of core-based specimens, which are easily and inexpensively prepared with minimal
wastage. Typical of these method are the hollow pressured cylinder (PC) (Abou-Sayed and
Simonson, 1977), the short-rod (SR) (Barker, 1977), the chevron-edge-notched round bar
in bending ( C E N R B B ) (Ouchterlony, 1980), and the disc-shaped compact specimen (DCT))
(Newman, 1979). These methods are based on a firm analytical basis in the form of
compliance and stress intensity factor calibration, and have also been used intensively on
rocks. A m o n g them, the chevron bend specimen method ( C E N R B B ) and the short rod
Chapter 6 Rock Fracture Toughness Determination by the Brazilian Test 6-2
specimen method (SR) have been recently recommended as international standard methods
by the International Society for Rock Mechanics (ISRM) Commission on Testing Methods
(ISRM, 1988, Ouchterlony, 1989).
Nevertheless, it can be appreciated that these tests are still too difficult and expensive for
routine application to large numbers of specimens. A number of investigations have been
undertaken aimed at the development of a simpler and more convenient method, such as the
Vicker indentation method (Atkinson and Avdis, 1980), the Hertzian indentation methods
(Lawn and Wilshaw, 1975a, Warren, 1978, Laugier, 1984, 1985), and notch disc diametral
compression methods (Szendi-Horvath, 1980, 1982, Singh and Pathan, 1988). The notched
disc with diametral compression is a method based on testing of disc specimens slotted along
the loading diameter. The disc is diametrally loaded in such a way that the notch remains
parallel to the loading line while the load is being applied through flat platens. The formula
for calculating the fracture toughness is based on the expression of the opening-mode stress
intensity factor KT for an edge crack in a semi-infinite medium subject to tension.
The Brazilian test is a well known indirect method for determining rock tensile strength. The
method has found great application in rock engineering because specimens can be easily
prepared, and the test is simple to perform. The test is based on the observation that most
rocks in biaxial stress fields fail in tension along the loading diameter of the disc specimen,
and diametral crack propagation in disc specimens due to tension is often observed.
In the present study, the diametral crack propagation behaviour in the simple Brazilian test is
further studied analytically and experimentally in an attempt to establish a simple method for
the determination of rock fracture toughness.
6.2 Stress Distribution in a Disc due to Diametral Compression
The initial point in fracture analysis is the determination of the stress field involved.
Assuming that the material is homogeneous, isotopic and linearly elastic, a stress solution for
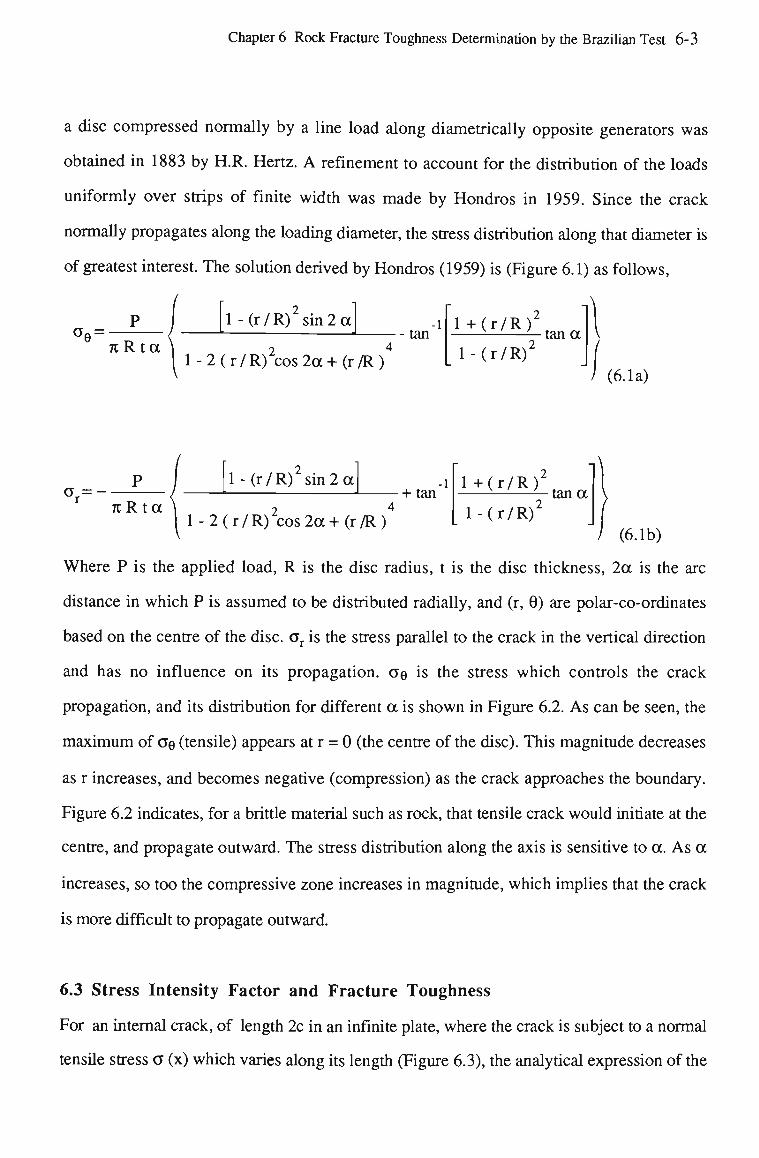
Chapter 6 Rock Fracture Toughness Determination by the Brazilian Test 6-3
a disc compressed normally by a line load along diametrically opposite generators was
obtained in 1883 by H.R. Hertz. A refinement to account for the distribution of the loads
uniformly over strips of finite width was made by Hondros in 1959. Since the crack
normally propagates along the loading diameter, the stress distribution along that diameter is
of greatest interest. The solution derived by Hondros (1959) is (Figure 6.1) as follows,
°e = TiRtrx l-(r/R) sin2a
- tan -l
l-2(r/R) cos2rx+(r/R)
l + (r/R)' tan a
l-(r/R)' (6.1a)
°r=-7URtOC
l-(r/R) sin 2 a + tan
-l
l-2(r/R) cos2oc+(r/R)
l+(r/RV tan a
l-(r/R)'
(6.1b)
Where P is the applied load, R is the disc radius, t is the disc thickness, 2a is the arc
distance in which P is assumed to be distributed radially, and (r, 0) are polar-co-ordinates
based on the centre of the disc. ar is the stress parallel to the crack in the vertical direction
and has no influence on its propagation, ae is the stress which controls the crack
propagation, and its distribution for different a is shown in Figure 6.2. As can be seen, the
maximum of GQ (tensile) appears at r = 0 (the centre of the disc). This magnitude decreases
as r increases, and becomes negative (compression) as the crack approaches the boundary.
Figure 6.2 indicates, for a brittle material such as rock, that tensile crack would initiate at the
centre, and propagate outward. The stress distribution along the axis is sensitive to a. As a
increases, so too the compressive zone increases in magnitude, which implies that the crack
is more difficult to propagate outward.
6.3 Stress Intensity Factor and Fracture Toughness
For an internal crack, of length 2c in an infinite plate, where the crack is subject to a normal
tensile stress a (x) which varies along its length (Figure 6.3), the analytical expression of the
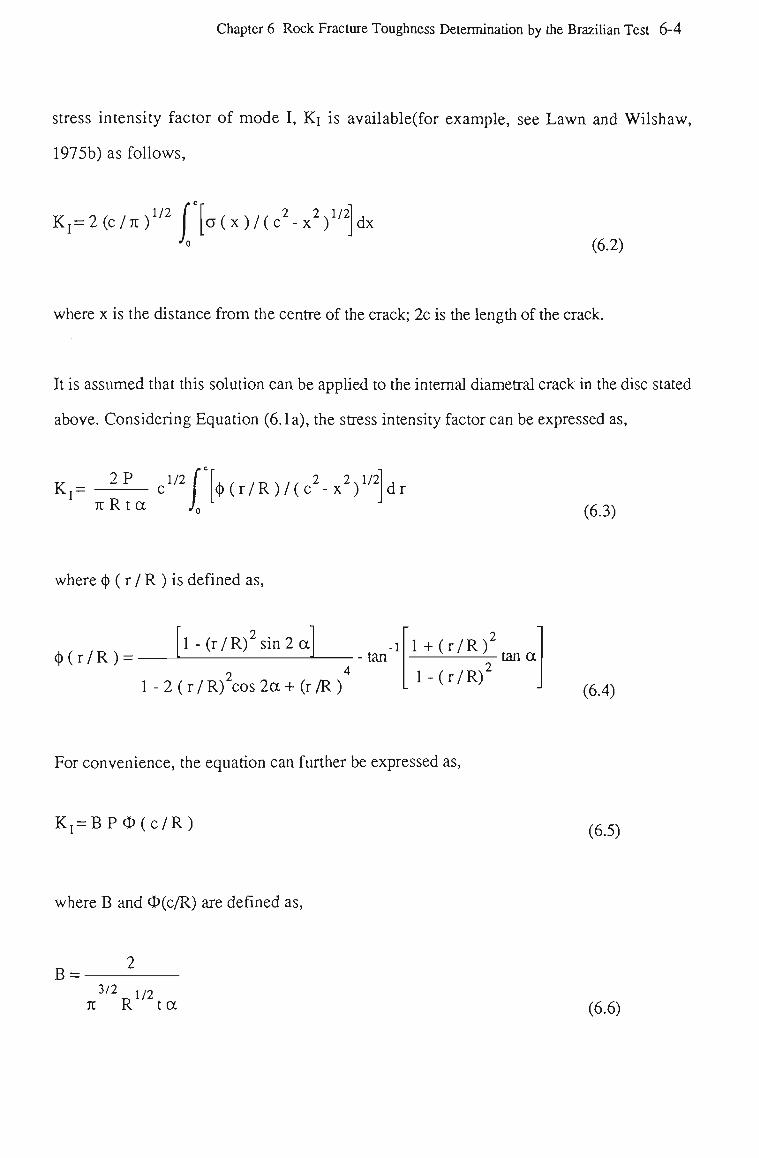
Chapter 6 Rock Fracture Toughness Determination by the Brazilian Test 6-4
stress intensity factor of mode I, Kj. is available(for example, see Lawn and Wilshaw,
1975b) as follows,
K I = 2 ( C / T T )1 / 2 f [ a ( x ) / ( c 2 - x 2 ) 1 / 2
•'o
dx (6.2)
where x is the distance from the centre of the crack; 2c is the length of the crack.
It is assumed that this solution can be applied to the internal diametral crack in the disc stated
above. Considering Equation (6.1a), the stress intensity factor can be expressed as,
K,= _i^ cl« n 7cRta L L
< K r / R ) / ( c 2 - x 2 ) 1 / 2 dr
(6.3)
where tt (r / R ) is defined as,
4>(r/R) = l-(r/R) sin 2 a
tan
1 -2(r/R) cos2a+(r/R)
l + (r/RV tana
l-(r/R)' (6.4)
For convenience, the equation can further be expressed as,
K,= BPO(c/R) (6.5)
where B and 0(c/R) are defined as,
B = 3/2 1/2
TU R ta (6.6)
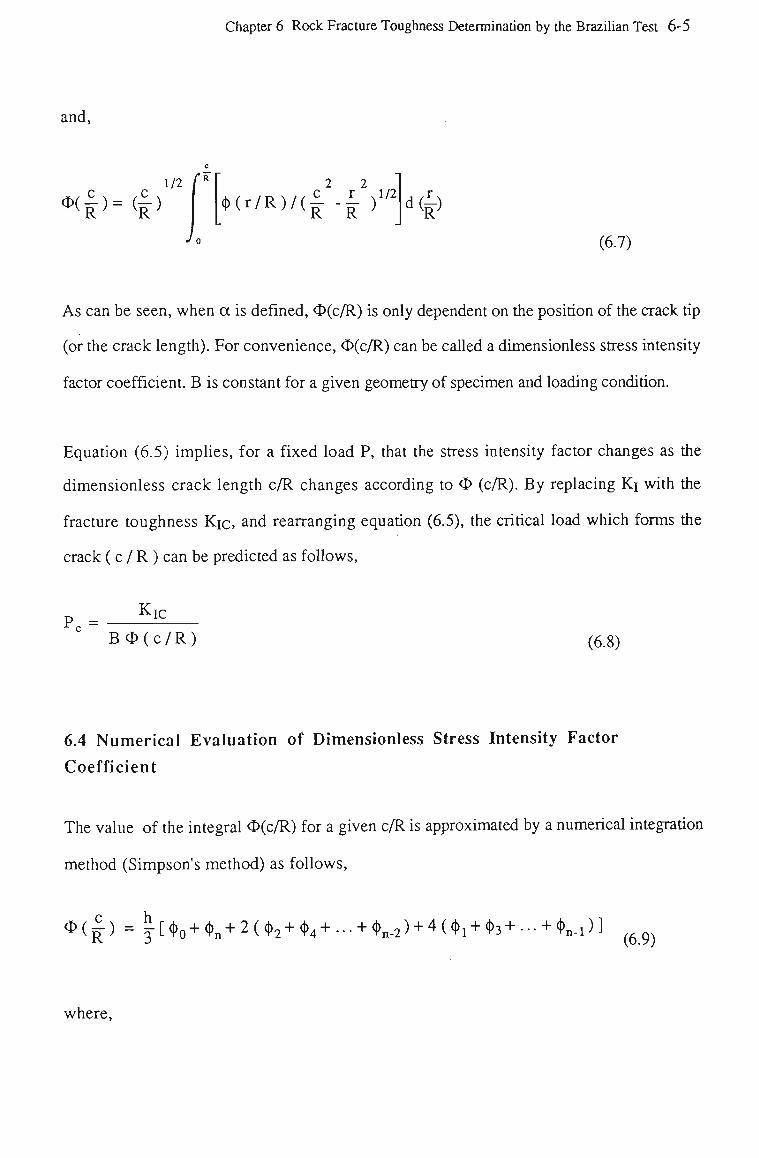
Chapter 6 Rock Fracture Toughness Determination by the Brazilian Test 6-5
and,
< )
1/2
4>(r/R)/( R
r R
1/2 d£) (6.7)
As can be seen, when a is defined, <D(c/R) is only dependent on the position of the crack tip
(or the crack length). For convenience, <5(c/R) can be called a dimensionless stress intensity
factor coefficient. B is constant for a given geometry of specimen and loading condition.
Equation (6.5) implies, for a fixed load P, that the stress intensity factor changes as the
dimensionless crack length c/R changes according to O (c/R). By replacing Ki with the
fracture toughness Kic, and rearranging equation (6.5), the critical load which forms the
crack (c / R ) can be predicted as follows,
Pc = K ic
B<E>(c/R) (6.8)
6.4 Numerical Evaluation of Dimensionless Stress Intensity Factor
Coefficient
The value of the integral 0(c/R) for a given c/R is approximated by a numerical integration
method (Simpson's method) as follows,
* ( £ ) = j[^0 + ( ^ n + 2 ( ( t ) 2 + ( t >4 + --- + <I)n-2) + 4(<t)l+(t)3+---+<l>n-l)3 (6.9)
where,
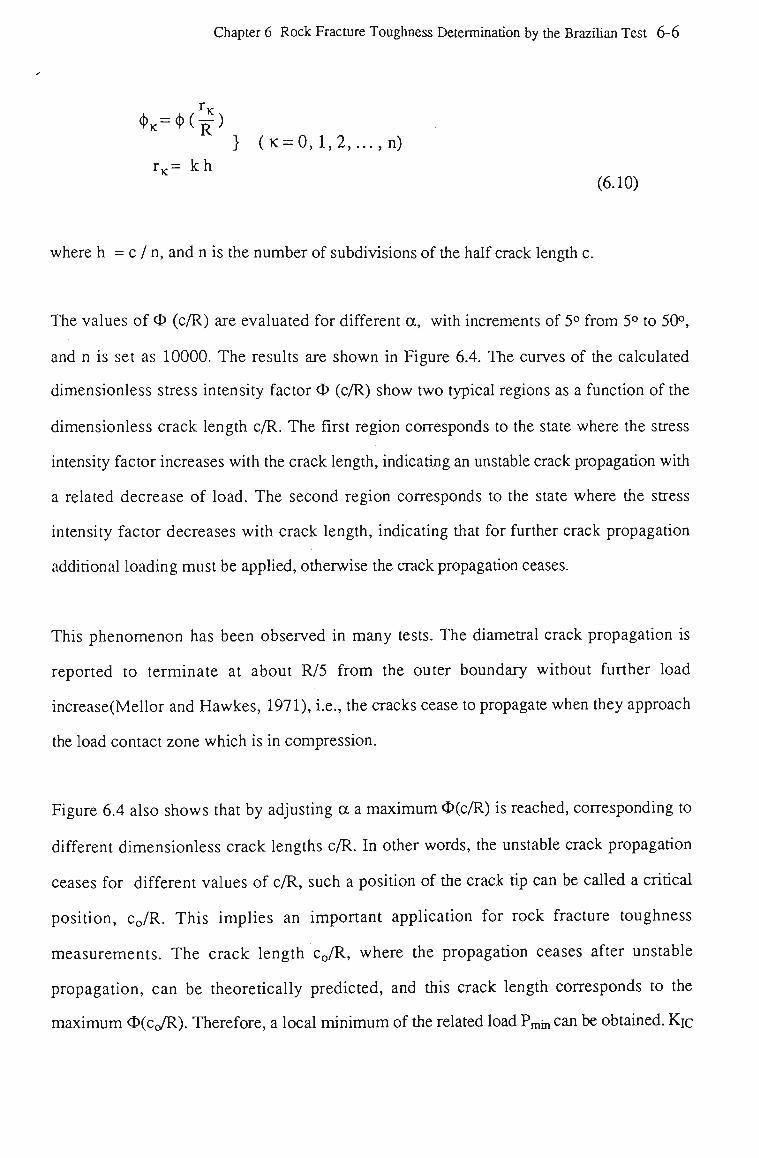
Chapter 6 Rock Fracture Toughness Determination by the Brazilian Test 6-6
} (K=0,l,2,...,n)
r K = k h (6.10)
where h = c / n, and n is the number of subdivisions of the half crack length c.
The values of <D (c/R) are evaluated for different a, with increments of 5° from 5° to 50°,
and n is set as 10000. The results are shown in Figure 6.4. The curves of the calculated
dimensionless stress intensity factor O (c/R) show two typical regions as a function of the
dimensionless crack length c/R. The first region corresponds to the state where the stress
intensity factor increases with the crack length, indicating an unstable crack propagation with
a related decrease of load. The second region corresponds to the state where the stress
intensity factor decreases with crack length, indicating that for further crack propagation
additional loading must be applied, otherwise the crack propagation ceases.
This phenomenon has been observed in many tests. The diametral crack propagation is
reported to terminate at about R/5 from the outer boundary without further load
increase(Mellor and Hawkes, 1971), i.e., the cracks cease to propagate when they approach
the load contact zone which is in compression.
Figure 6.4 also shows that by adjusting a a maximum 0(c/R) is reached, corresponding to
different dimensionless crack lengths c/R. In other words, the unstable crack propagation
ceases for different values of c/R, such a position of the crack tip can be called a critical
position, c0/R. This implies an important application for rock fracture toughness
measurements. The crack length c0/R, where the propagation ceases after unstable
propagation, can be theoretically predicted, and this crack length corresponds to the
maximum 0(cJR). Therefore, a local minimum of the related load Pmh, can be obtained. Kic
Chapter 6 Rock Fracture Toughness Determination by the Brazilian Test 6-7
can be determined from P,^ and the calculated <D(CQ/R) from Equation 6.8, without actually
measuring the critical crack length CQ/R.
When a material is defined, i.e., Kic is given, from Figure 6.4 and Equation 6.8, a load P
versus crack length c/R curve is expected to vary in the way shown in Figure 6.5. It is
assumed that the curve of load versus diametral displacement will be similar to that in Figure
6.5. Immediately after the crack initiated, then the overall curve is predicted in the form as
shown in Figure 6.6. That is, initially, the rock disc specimen behaves as an intact elastic
material; increasing the load results in an increasing diametral displacement until the diametral
crack initiates and propagates unstably. There is an accompanying drop in load. Then, the
load will reach its local minimum corresponding to the maximum of the dimensionless stress
intensity factor, and after this point an increase in the applied load application is required to
make the crack propagate further. The fracture toughness is measured from the local
minimum load during unstable crack propagation from Equation 6.5.
6.5 Application of the Brazilian Test for Determination of Rock Fracture
Toughness Kic
The background of the test was described by Mellor and Hawkes(1971), and the test
procedure was recommended by I S R M (ISRM, 1971). Only the outline of test is briefly
described here. A disc- shape rock sample is loaded by two steel jaws at diametrically
opposite surfaces over an arc of contact of approximately 10° at failure. The radius of the
specimen is 27 m m , and the thickness is equal to the specimen radius. The radius of the jaws
equals 1.5 times of the specimen radius. A guide pin clearance permits rotation of one jaw
relative to the other.
In the study herein, the Brazilian test is applied for the determination of rock fracture
toughness based on the fracture mechanics analyses of the diametral crack. Assuming the
pressure on the specimen due to the steel jaws is distributed uniformly along the contact arc,
Chapter 6 Rock Fracture Toughness Determination by the Brazilian Test 6-8
the corresponding a equals 5° at failure. For the geometry of the specimen, i.e., R = 27
mm, t = 27 mm, the constant B equals 920 (m 3/2) and Omax (c/R) equals 0.112, as shown
in Figure 6.7. For this case, Equation 6.11 can be written as ,
KK = 104.1 P^ (6.11)
where, Pmin is the local minimum of the loading, and can be determined from the load-
deformation curve.
A servo-controlled hydraulic testing machine was used for this series of tests as shown
Figure 6.8. The machine is microprocessor controlled; its load capacity is 500 kN and the
frame stiffness is greater than 1060 kN/mm. The test was displacement controlled at a rate of
0.01 mm/sec. Load versus diametral deformations were plotted on an xy-plotter.
Tests were conducted on six Australian rocks. Typical specimens after test are shown in
Figure 6.9. The diametral cracks developed along the loading axis are clearly visible along
the load axis. They tend to cease propagation when approaching the loading platens.
Figure 6.10 shows a typical graph from testing a fine grain marble specimen. The fracture
process can be defined in three stages. In the first stage 'oa', the specimen behaves
elastically as an intact disc. When the load reaches such a critical value that the induced
tensile stress at the centre of disc exceeds the material tensile strength, a crack is initiated,
and the second stage 'ab' starts with unstable crack propagation. The load keeps decreasing
as the crack propagates until its crack propagation is stabilized, and the load reaches its local
minimum Pmjn. Then, the third stage 'be' starts where the load starts to increase for the
diametral crack to propagate further. With further load increase, the zones which are
immediately close to the loading platens are crushed, and secondary cracks are developed
Chapter 6 Rock Fracture Toughness Determination by the Brazilian Test 6-9
from these zones. This process is reflected in the curve by a random oscillation of the load
involved.
Most of the tests were stopped at the beginning of the third stage, when the Pmin can be
clearly identified from the recorded graph. For the six types of rocks tested, six tests were
conducted for each of them. Typical graphs of the load versus the deformation for each type
of rock are shown in Figure 6.11. The values of Pmin and the calculated fracture toughness
are listed in the Table 6.1. As can be seen, the results are reasonably consistent for each type
of rock tested.
6.6 Comparison with the Results of Chevron Tests
One of the ISRM standard tests for rock fracture toughness measurement , the Chevron
bending test, was chosen as an alternative method to confirm the results of the Brazilian
tests. The Chevron bending specimen has a notch cut perpendicular to the core axis(Figure
6.12), the alignment of the notched section having the form of a "V" or chevron. This shape
results in a relatively long period of stable crack growth under increasing load before the
point at which the fracture toughness is evaluated. Two levels of test are proposed. The level
I test requires only the maximum load during the test, whereas the level II test requires
continuous load displacement measurements (Load Point Displacement, LPD, or Crack
Opening Displacement, COD) to be made during the test. While the level I test is simple and
cheap to perform, it has been reported that level I testing of normal core sizes tends to
furnish fracture toughness values which are lower than values obtained from larger
specimens. The level II test is more complicated, and in some cases furnishes values that are
independent of core size.
For level I testing, the fracture toughness of the specimen is calculated by the following
formula:
KCB = AminFmax/D " (6.12)
Chapter 6 Rock Fracture Toughness Determination by the Brazilian Test 6-10
where
A _ r 1 QI*L _L n 1 c o /T\ I O O C t~ /T\\2I C IT\
(6.13) A m i n = [ L835 + 7.15 a 0/D + 9.85 (a0/D)
2] S / D
With the failure load, Fmax, in kN, and the specimen diameter, D, in cm, and Amin being
dimensionless, the fracture toughness is in MPa/m1-5 or MN/m1-5. The rest of the symbols
are defined in Figure 6.12.
In reality, most rocks show some micro-cracking and/or plasticity at the crack tip process
zone; level II testing is then introduced to account for it. A nonlinear correction factor for
fracture toughness needs to be considered in the calculation, which is evaluated in the load vs
C O D record. The corrected fracture toughness is then given by
K £ B = V [ (1 + p ) / (1 - p ) ] (F c /F m a x ) K C B (6.14)
or
K£B = V[(l+p)/(l-p)] K C B (615)
where p is the nonlinearity correction index which defines the degree of the nonlinearity. p
can be determined graphically from the load vs C O D record in the way suggested by
ISRM(1989). Fc is the load corresponding to the critical crack length, at which , for an
elastic-brittle material, the maximum load, Fm a x occurs. In the nonlinear case, Fc may not be
the maximum load F m a x recorded. Whether Equation(6.14), or Equation (6.15) is used for
the determination of fracture toughness is dependent on the difference between Fc and
Fmax(ISRM, 1989). The descriptions in details are omitted here.
The standard 54 mm diameter core specimens were used throughout the tests. The chevron
notch (with thickness about 1 m m ) was cut by a slitting diamond saw. To ensure consistency
in the shape of the chevron notch, a specially designed cradle was built to fix the specimens
while cutting the notch as recommended by ISRM. Level II tests were conducted on the
same rocks investigated by the Brazilian test. The load and the displacement(COD) were
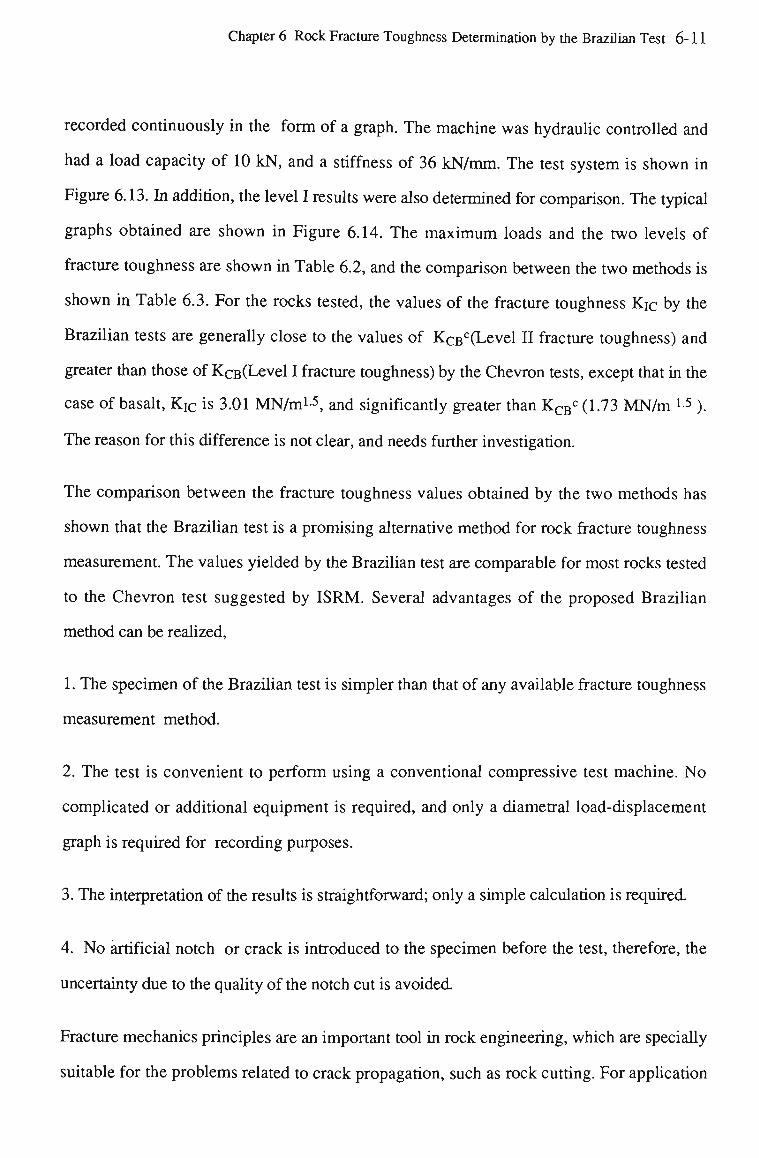
Chapter 6 Rock Fracture Toughness Determination by the Brazilian Test 6-11
recorded continuously in the form of a graph. The machine was hydraulic controlled and
had a load capacity of 10 kN, and a stiffness of 36 kN/mm. The test system is shown in
Figure 6.13. In addition, the level I results were also determined for comparison. The typical
graphs obtained are shown in Figure 6.14. The m a x i m u m loads and the two levels of
fracture toughness are shown in Table 6.2, and the comparison between the two methods is
shown in Table 6.3. For the rocks tested, the values of the fracture toughness Kic by the
Brazilian tests are generally close to the values of KcBc(Level II fracture toughness) and
greater than those of KcB(Level I fracture toughness) by the Chevron tests, except that in the
case of basalt, K i C is 3.01 MN/m1-5, and significantly greater than K C B
C (1.73 M N / m L5 ).
The reason for this difference is not clear, and needs further investigation.
The comparison between the fracture toughness values obtained by the two methods has
shown that the Brazilian test is a promising alternative method for rock fracture toughness
measurement. The values yielded by the Brazilian test are comparable for most rocks tested
to the Chevron test suggested by ISRM. Several advantages of the proposed Brazilian
method can be realized,
1. The specimen of the Brazilian test is simpler than that of any available fracture toughness
measurement method.
2. The test is convenient to perform using a conventional compressive test machine. No
complicated or additional equipment is required, and only a diametral load-displacement
graph is required for recording purposes.
3. The interpretation of the results is straightforward; only a simple calculation is required.
4. No artificial notch or crack is introduced to the specimen before the test, therefore, the
uncertainty due to the quality of the notch cut is avoided.
Fracture mechanics principles are an important tool in rock engineering, which are specially
suitable for the problems related to crack propagation, such as rock cutting. For application
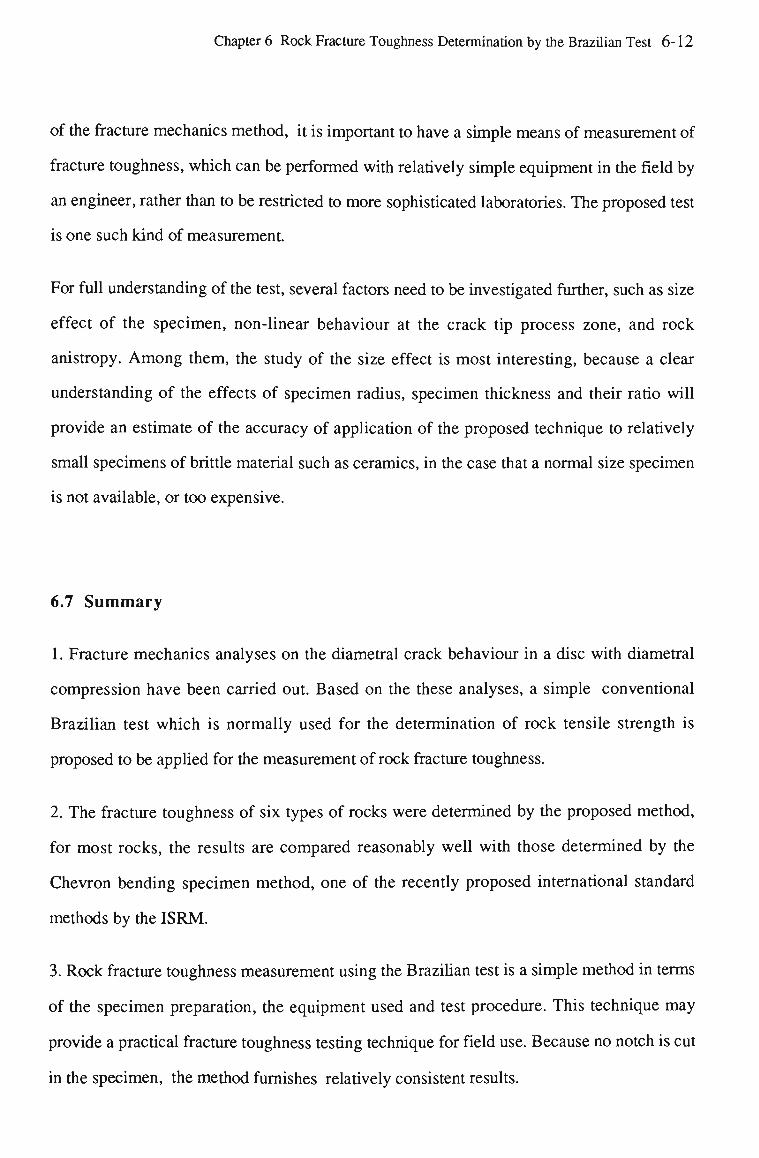
Chapter 6 Rock Fracture Toughness Determination by the Brazilian Test 6-12
of the fracture mechanics method, it is important to have a simple means of measurement of
fracture toughness, which can be performed with relatively simple equipment in the field by
an engineer, rather than to be restricted to more sophisticated laboratories. The proposed test
is one such kind of measurement.
For full understanding of the test, several factors need to be investigated further, such as size
effect of the specimen, non-linear behaviour at the crack tip process zone, and rock
anistropy. Among them, the study of the size effect is most interesting, because a clear
understanding of the effects of specimen radius, specimen thickness and their ratio will
provide an estimate of the accuracy of application of the proposed technique to relatively
small specimens of brittle material such as ceramics, in the case that a normal size specimen
is not available, or too expensive.
6.7 Summary
1. Fracture mechanics analyses on the diametral crack behaviour in a disc with diametral
compression have been carried out. Based on the these analyses, a simple conventional
Brazilian test which is normally used for the determination of rock tensile strength is
proposed to be applied for the measurement of rock fracture toughness.
2. The fracture toughness of six types of rocks were determined by the proposed method,
for most rocks, the results are compared reasonably well with those determined by the
Chevron bending specimen method, one of the recently proposed international standard
methods by the ISRM.
3. Rock fracture toughness measurement using the Brazilian test is a simple method in terms
of the specimen preparation, the equipment used and test procedure. This technique may
provide a practical fracture toughness testing technique for field use. Because no notch is cut
in the specimen, the method furnishes relatively consistent results.
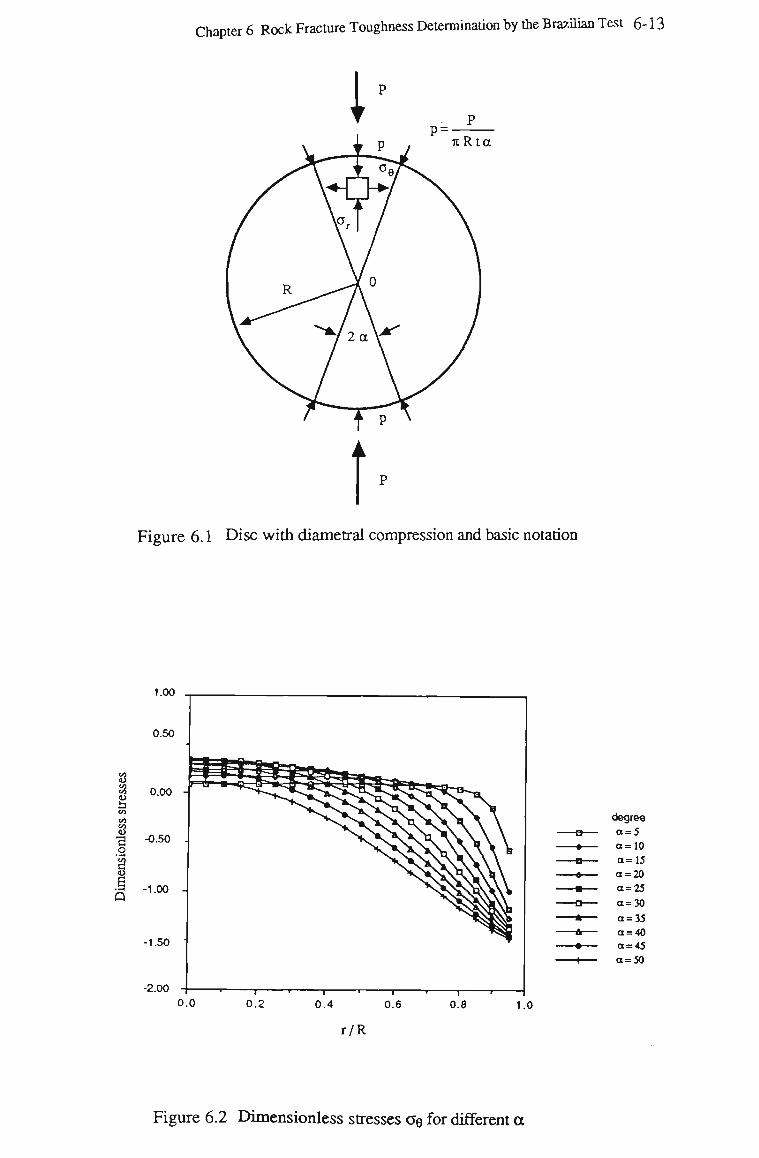
Chapter 6 Rock Fracture Toughness Determination by the Brazilian Test 6-13
t Figure 6.1 Disc with diametral compression and basic notation
1.00
0.50
-1.50
-2.00
0.0 1 r-
0.2 0.4 0.6
r/R
— I —
0.8 1.0
degree o=5 o=l0 a=15 o = 20 a=25 o = 30 a = 35 a = 40 a=45 a=50
Figure 6.2 Dimensionless stresses OQ for different a
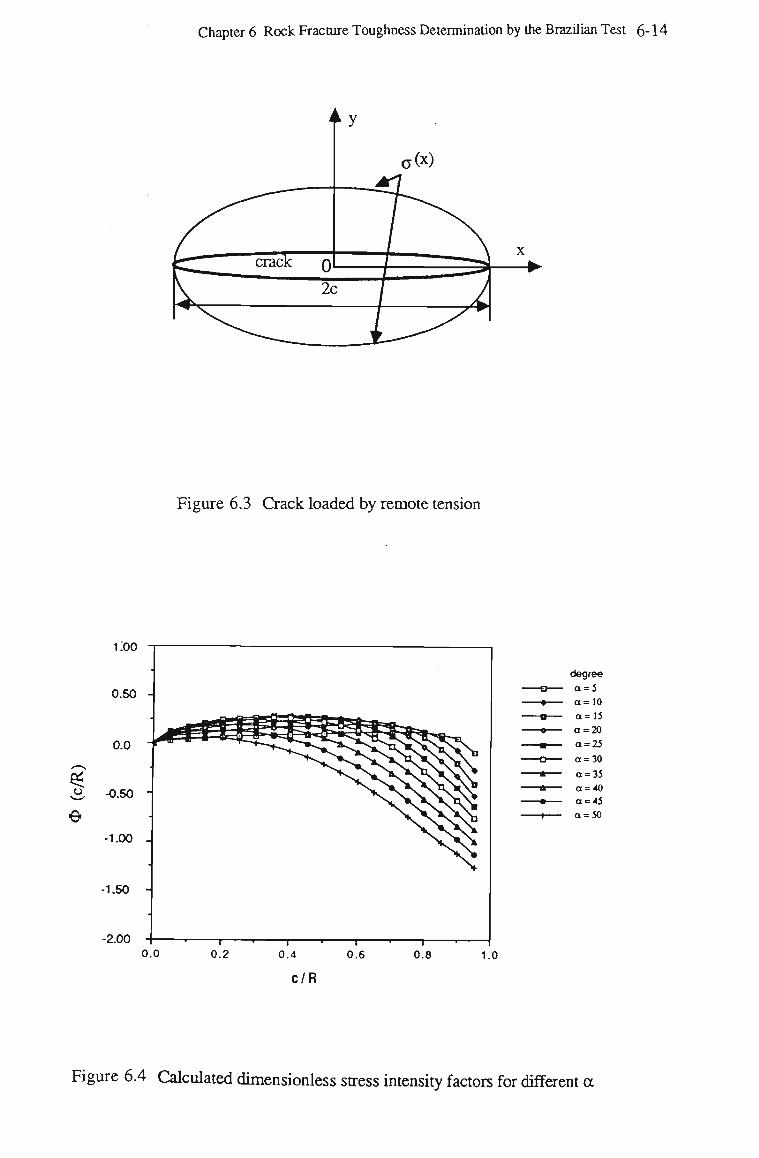
Chapter 6 Rock Fracture Toughness Determination by the Brazilian Test 6-14
Figure 6.3 Crack loaded by remote tension
i:oo
degree
o = 5 o = 10
o=13
o = 20
o = 2J
a=30
a=35 a = 40 o = 4J
o = 50
Figure 6.4 Calculated dimensionless stress intensity factors for different a
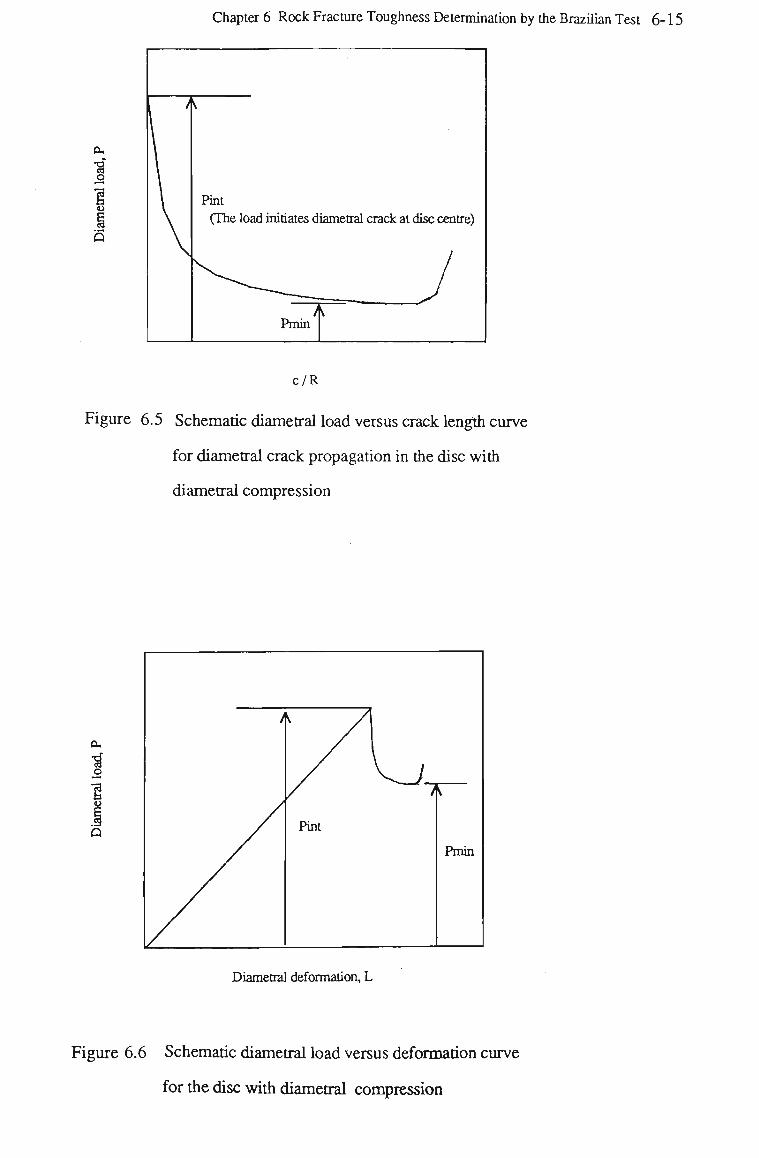
Chapter 6 Rock Fracture Toughness Determination by the Brazilian Test 6-15
1 <U
/
Pint
(The load initiates diametral crack at disc centre)
A Pmin
c/R
Figure 6.5 Schematic diametral load versus crack length curve
for diametral crack propagation in the disc with
diametral compression
O
i Q
1 \ A
Pint
Pmin
Diametral deformation, L
Figure 6.6 Schematic diametral load versus deformation curve
for the disc with diametral compression
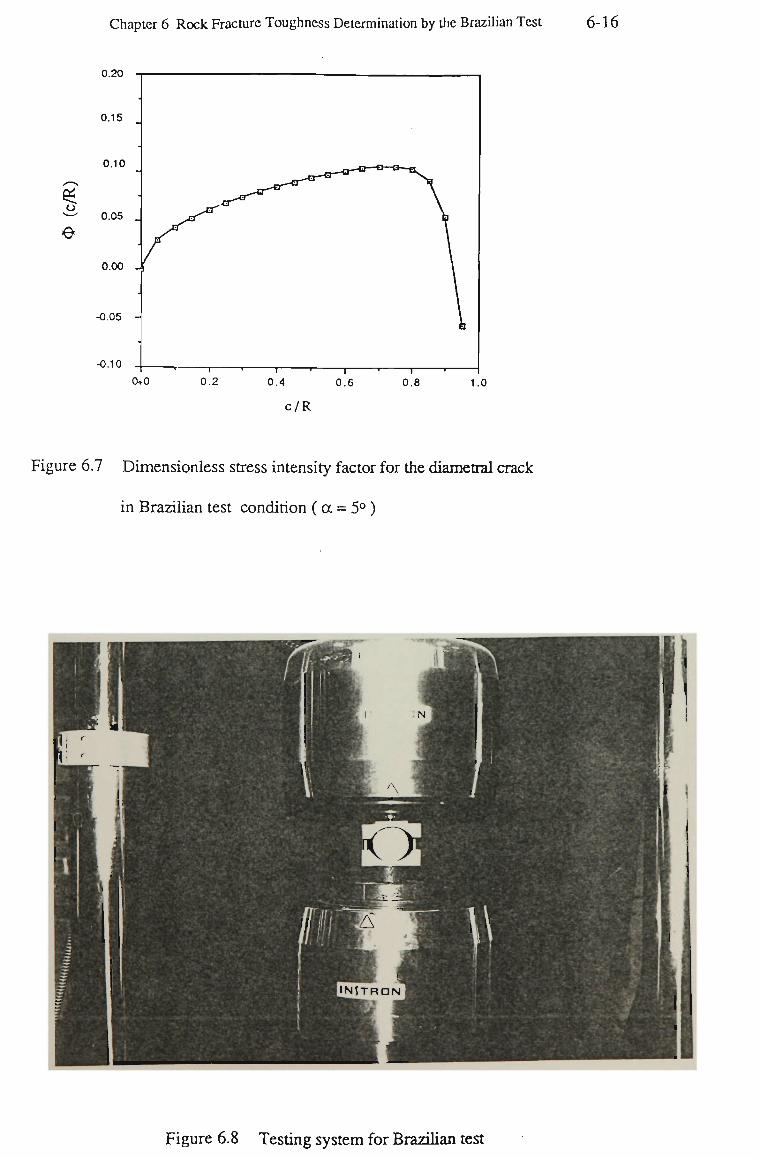
Chapter 6 Rock Fracture Toughness Determination by the Brazilian Test 6-16
0.20
0.15
0.10
0.05 _
o.oo
-0.05
-0.10
C%0
c/R
6.7 Dimensionless stress intensity factor for the diametral crack
in Brazilian test condition ( a = 5° )
c
~-^Jm
B ' lN 1
M E \W\v urn m '-w m
•TNTTRDNJ
1 1 1 1
Figure 6.8 Testing system for Brazilian test
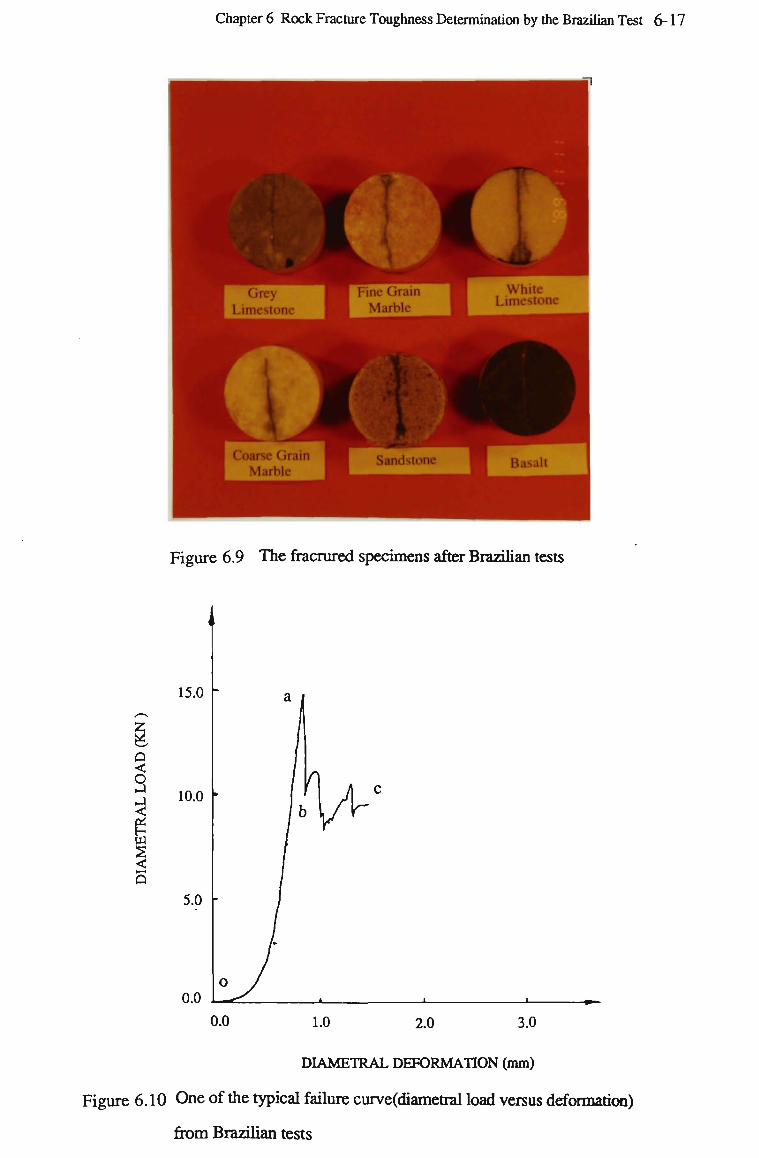
Chapter 6 Rock Fracture Toughness Determination by the Brazilian Test 6-17
Grey 1 Limestone
• J 1 Coarse Grain
Marble
w^LW ^t^L\
1 Fine Grain
Marble I
I Sandstone
• '
White Limestone
Basalt
Figure 6.9 The fracrured specimens after Brazilian tests
G <
O J <
<
5
15.0
10.0
5.0
0.0 0.0 1.0 2.0 3.0
DIAMETRAL DEFORMATION (mm)
Figure 6.10 One of the typical failure curve(diametral load versus deformation)
from Brazilian tests
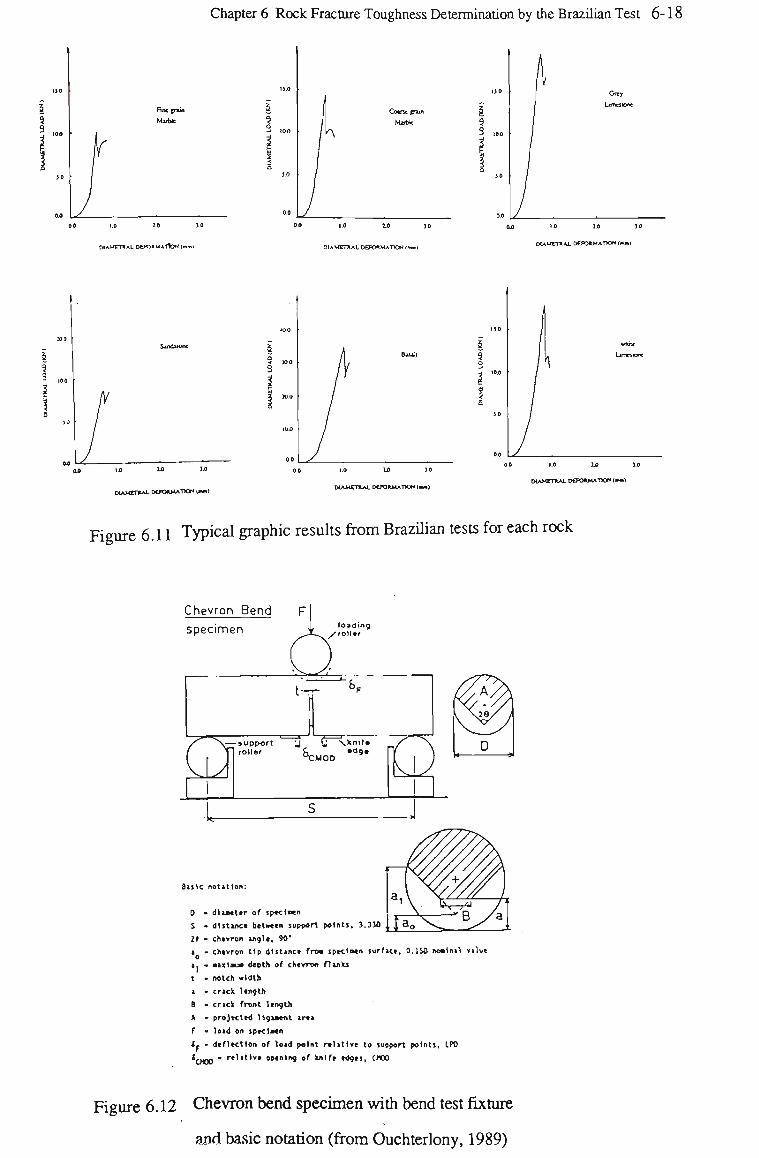
Chapter 6 Rock Fracture Toughness Determination by die Brazilian Test 6-18
Fine {run
Mart*
DO 10 2 0 3
DIAMETRAL OEPOaMAttoN (<wm1
Cotrse grain
Mart*
DIAMETRAL DEFORMATION (mm)
9 3 io.a
Grey
aj io j.o jo
DIAMETRAL DEFORMATION (m|
10 10 >0
DIAMETRAL DOOW4ATION (—• I
< 100
3
DIAMETRAL DEFORMATION I — I
130
10.0
10
00
1 1 / 1
white
Lunroonc
1.0 10 10
DIAMETRAL DePORMATRX • -->
Figure 6.11 Typical graphic results from Brazilian tests for each rock
Chevron Bend
specimen oading /roller
— support J Q xknile-
roller & c V — *,l9• :uoo
Baste notation:
0 • dlaaetir of speet»en
S - distance between support points. 3.330 , J a o \ ^
Zi - chevron angle, 90'
a • chevron tip distance fro* specimen surface. 0.150 noatnal value o a, • aaxtau* depth of chevron flanks t • notch width
a • crack length
S - crack front length
*. » projected llgaaent area
F • load on specimen
<F • deflection of load paint relative to support points, IPO
truga " relative opening of knife edges, OCO
Figure 6.12 Chevron bend specimen with bend test fixture
and basic notation (from Ouchterlony, 1989)
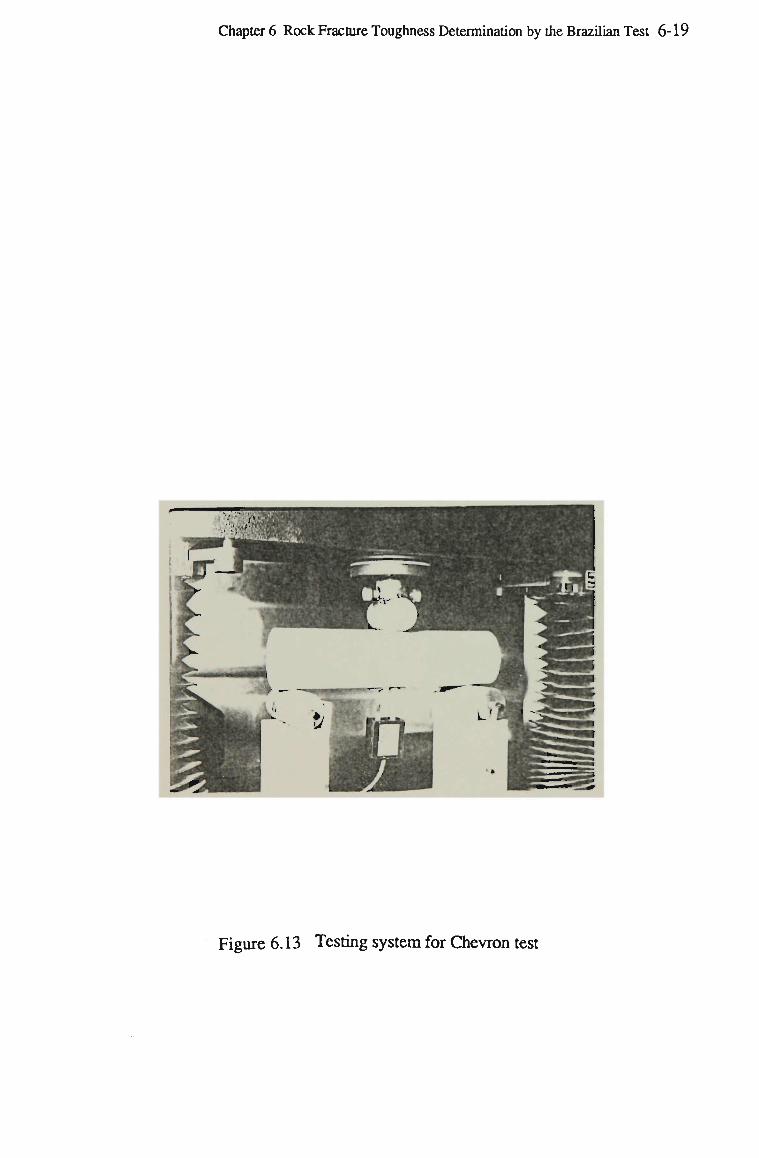
Chapter 6 Rock Fracture Toughness Determination by the Brazilian Test 6-19
Figure 6.13 Testing system for Chevron test
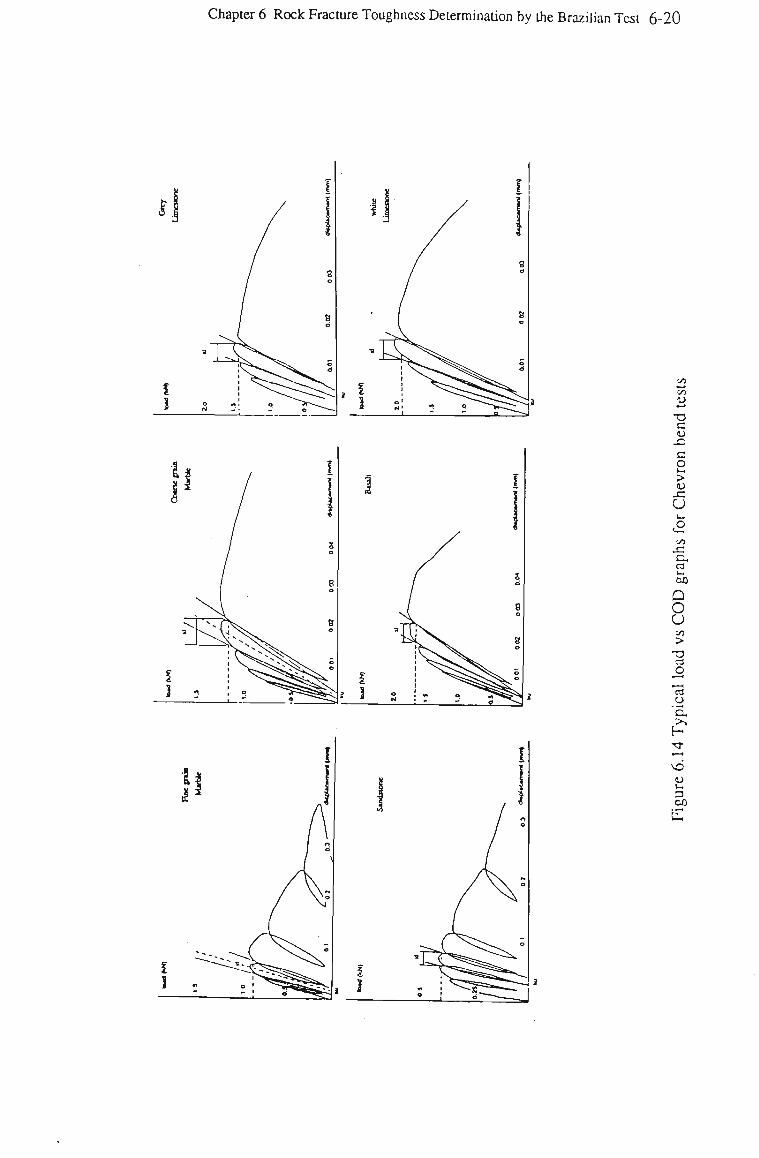
Chapter 6 Rock Fracture Toughness Determination by the Brazilian Test 6-20
Vi ti
— - •
•a c V C
a > o .c U
Vi
Si
a,
a o u t/J
> T3
u
u 3 bfl
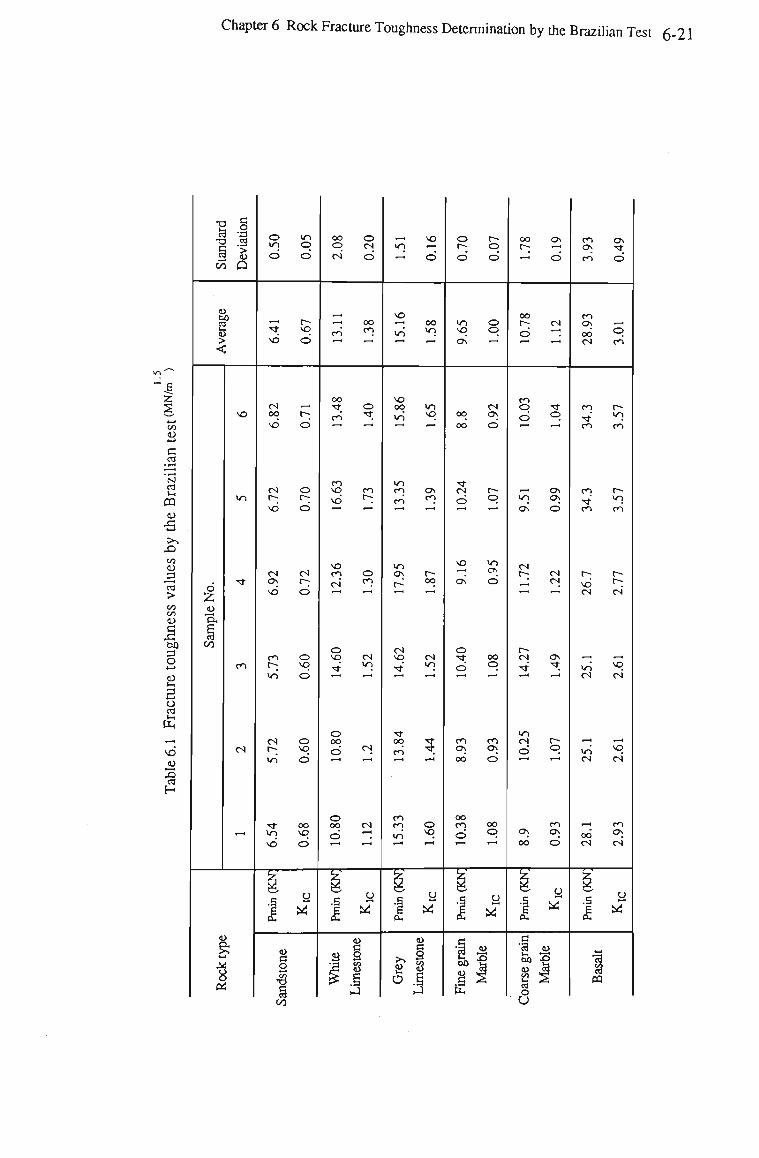
Chapter 6 Rock Fracture Toughness Determination by the Brazilian Test 6-21
I ^ Vi
•a
s a
o to
6 3
O IO
>n o d d
•"-• r-
vd d
00 q CN
o cs
— vo
-.' d
•-i oo ^ CO
vo oo
o r-
r-o
>o VO
O o OS —i
00 r~
Ov
d
00
d
ro OS
OS
d
co Ov —' od O cs co
z § -t—*
c
N cd Ii OQ ti •3
oo CO 3 cd > Vi Vi co 3 O *->
o cd
VO
o
Z ex
00
VO
cs
cs -< oq r-_ vd d
cs r-; vd
o r-d
oo •* o
cn VO CO
VO 00 vi
Vi VO 00
00
cs Os
CO
o o
vo
V~t CO OS rA CO
cs r» d <=>
cs cs Ov t~;
vd d
CO o VO
CS o VO
>o vd
00 vo
VO CO O cs n
Ov 00
VO wn
ov d
in o\
cs r~
Os Os
CS CS
o vo cs
m
cs VO cs
<n
o "3-d
00
o cs Os
o 00 cs
00 5 CO Ov
CO OS
m cs o
o oo cs CO O
OO CO 00 Ov
00
CO Ov
CO
-a-co
vo cs
>o cs
cs
00 cs
in co
1-; cs"
VO cs"
VO cs
—. CO Ov cs
u ^
y y
o 4—>
•3
CO
O
M
•a
PQ
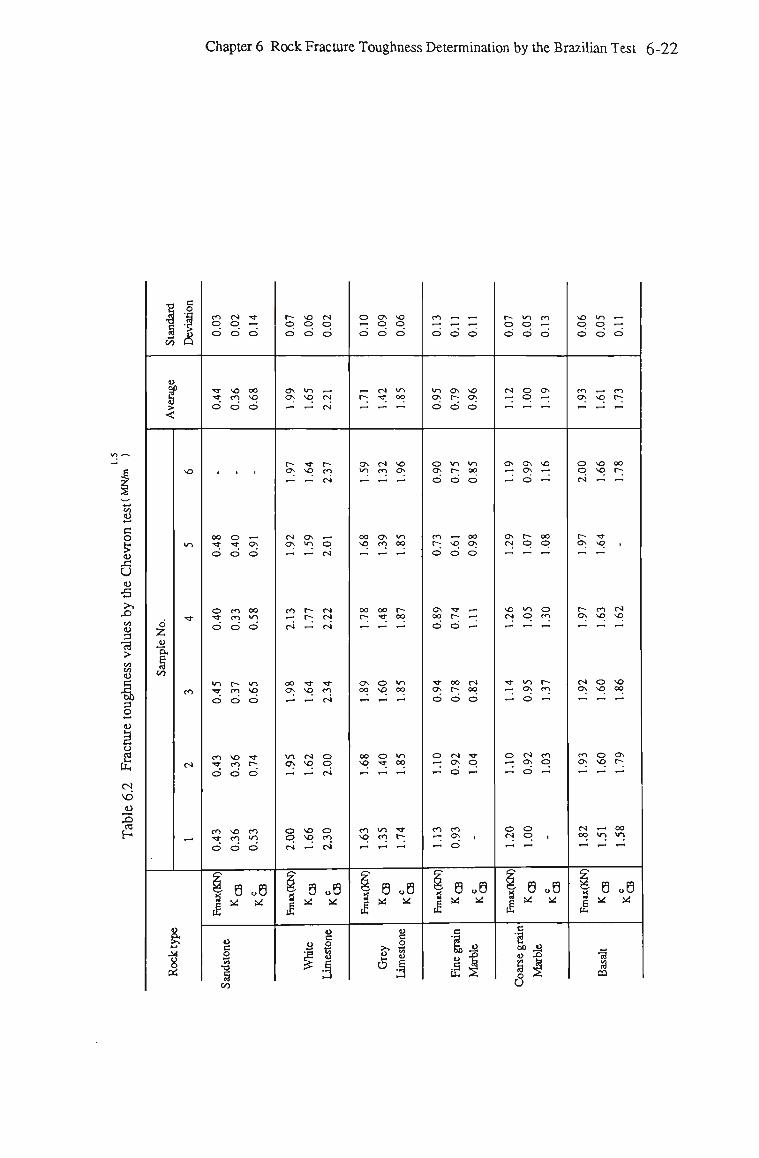
Chapter 6 Rock Fracture Toughness Determination by the Brazilian Test 6-22
{3
•3 S 4-4
CO
u
If 8 > <
6
z o ex, I Vi
4-1
1 oi
a _o **3 •9
a
SO
m
Tf
<o
cs
,_,
CO <s
© o d d
Tf >o Tf cn
d d
i >
oo o Tf Tf
d d
o co Tf CO
d d
m t— Tf CO
d d
co vo Tf co
d d
CO vo ** co d d
| B
u c o •a
00
Tf l-H
d
00 VO
d
•
c\ d
00 in
d
in vq d
Tf
d
CO in
d
o5 *
r~ q d
Ov Ov
,-J
r~ Ov
cs Ov I—"
CO
CS
00 Ov ,-H
m Ov
O O
cs
S
1
VO O
d
IO
vq ,_i
f vq
Ov in
r-t-;
-•
Tf
vq l—<
CS vq
vo vq r-i
B X
a |
CM
q d
,-H
cs cs
t-~ co CN
o is"
cs cs CS
Tf CO
CS
o q
o CO
cs'
08 X
o 13
S3 j
o »—• d
,_•
C-;
^
Ov m
00
vq
00
r~ '-
Ov OO
*—»
00
vq
CO
\q ,-H
3
1
Ov o d
es TT
r—
cs CO
Ov CO l-H
00 Tf
-•
© vq .—*
o Tf
in CO
1—»
8 ^
>s
$
vo O d
in 00 I—^
vo Ov l-H
in oo
t-> oo -"
>n oo l-H
m 00
Tf t>
08 X
o B
2 .§ 3
CO l-H
d
in Ov
d
o Ov
d
CO f;
d
Ov 00
d
Tf Ov
d
o »—«
CO
*-; T-H
s
1
r _
1 —
d
Ov C;
d
m C-;
d
vq d
• »
t-
d
00
r-d
cs Ov
CO Ov
d
8 *
c
I o .3 fi
,_. • —
d
vO Ov
d
in oo
d
00 Ov
d
--; ~
cs 00
d
Tf
q
i
UB «
a> -O
-i
t— m co o O — o d d
CS O Ov
—_ q —• •-• •-« .-•
Ov Ov vo •— Ov —
—: d -
OV o oo cs q q
vo m o cs q co —• — •—
•» in t» i—• Ov CO
^ d i-i
o cs co rt Oj O
o o cs q i »—1 « — •
| S u8 p X X
1 c •g So u
§ 1 o «< U
VO O
d
CO ON I—1
o o cs
r-OV
f-Ov »-H
CS Ov 1—i
CO
ov
cs 00
S
1
m o d
,-H
vq J
VO
vq
Tf
vq
CO
vq • —
o vq
o vq
in I-H
8 Ui
•3 3 m
.—• i—•
d
CO C-;
,-i
oo t-;
i
CS
vq —
VO 00
1—"
Ov t-;
oo m
08
x
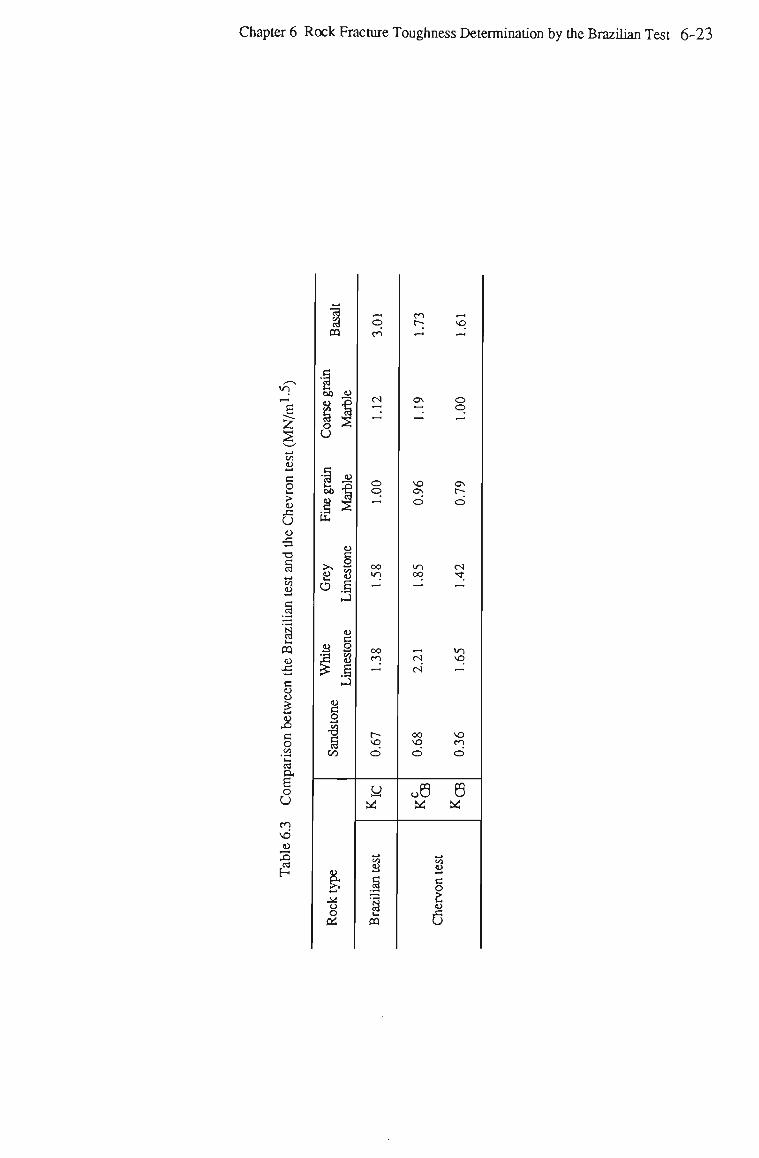
Chapter 6 Rock Fracture Toughness Determination by the Brazilian Test 6-23
cn q CO
co r-~ vo
60 O
00
•J
CO
I
1 •a co
cs Ov
o o
00
m
oo CO ~
cs cs
in
vo —•
vo
o o
vo Ov
Ov r-
m oo
cs
00 VO
VO CO
•a
08 8
2
I 1 ii
m
c o
6
CHAPTER SEVEN
ROCK FRACTURE TOUGHNESS AS PARAMETER
FOR PREDICTION OF DRILLING PERFORMANCE
Chapter 7 Rock Fracture Toughness as a Parameter for Prediction of Drilling Performance 7.1
CHAPTER 7
ROCK FRACTURE TOUGHNESS AS A PARAMETER
FOR PREDICTION OF DRILLING PERFORMANCE
7.1 Introduction
Rock cutting machinery requires capital investment, especially for large scale machines such
as roadheaders, continuous miners and longwall shearers. Production is highly dependent on
performance and stability of the system used. It is therefore very important to determine what
is the most suitable cutting machine, and to assess the performance of the machine for
particular rocks. As mentioned previously, an excavating process is influenced by many
factors such as rock properties, attack features of the cutting tool, and machine operating
parameters, i.e., thrust, torque and RPM etc.. Prediction or assessment of cutting
performance of rock cutting machine should therefore be based on these factors.
In the search for a suitable measure of rock properties to assess cutting performance of rock
cutting machines, many methods have been proposed. Uniaxial Compressive Strength
(UCS) has been the most widely used parameter. Specific energy (SE) is proposed by Teale
(1965) as a parameter to measure the relative efficiency of various cutting tools, machines
and cutting processes in a given rock, and, alternatively, has been used by many
investigators to assess the relative resistances of various rocks to a given tool or machine. A
number of indentation tests have also been proposed, which normally involve an indenter
with a some kind of configuration being forced into surface of rock. The typical tests
include: cone indenter (Szlavin, 1974), dye penetration (Aleman, 1983) and so on. Realizing
that rock cutting performance is closely related to the nature of the associated breakage
process, a few empirical tests have been proposed as means of assessing rock cutting (or
drilling) performance. A generally applicable impact test has been proposed by
Chapter 7 Reck Fracture Toughness as a Parameter for Prediction of Drilling Performance 7.2
Protodyakonov (1962). The test has been modified by Evans and Pomeroy (1966),
Tandarand (1975), and recently by Rabia and Brook (1980, 1981). This kind of test has
been used widely and the measurements correlate well with the penetration rate of down-hole
drills for a wide range of rock types, probably because the breakage nature of the test itself
is very much similar to that of percussive type of drilling.
In searching for a fundamental rock property which is independent of the breakage feature of
rock cutting tools, Howarth and Rowland (1987) suggested that rock texture has a
significant effect on the crack behaviour in rock cutting and drilling process, and examination
of the relationship between texture coefficient and the drillability data shows a significant
correlation between them.
As studied previously, any rock cutting and drilling tool, such as drag picks, disc cutters and
roller cutters involves a similar rock response, i.e. , as the tool penetrate into the rock, the
rock beneath the tool is crushed. As penetration continues, the crushed zone expands, and
then so-called primary and secondary cracks are developed from this zone. The propagations
of these cracks result in rock fragments, which are removed by further movement of the
cutting or drilling tool. This fracture mechanism suggests that rock cutting performance
should be linked to rock fracture properties, i.e., rock fracture toughness. The early attempts
in this direction were made by Ingraffea et al. (1982) and Nelson, Ingraffea and O'Rourke
(1985) to correlate the Tunnel Boring Machine's (TBM's) performance and the rock fracture
parameters, such as, fracture toughness Kic or strain energy release rate Gic.
In this chapter, tests on performance of a diamond coring machine and a rotary drilling
machine were carried out in the laboratory. Six rocks, including basalt, sandstone, limestone
(fine and coarse grain types) and marble (fine and corse grain types). The values of rock
fracture toughness on these rock were measured at Chapter 6 and are correlated with
penetration rates measured in the tests. The correlations are also compared with those
between the penetration rates and conventional U C S and Brazilian tensile strength.
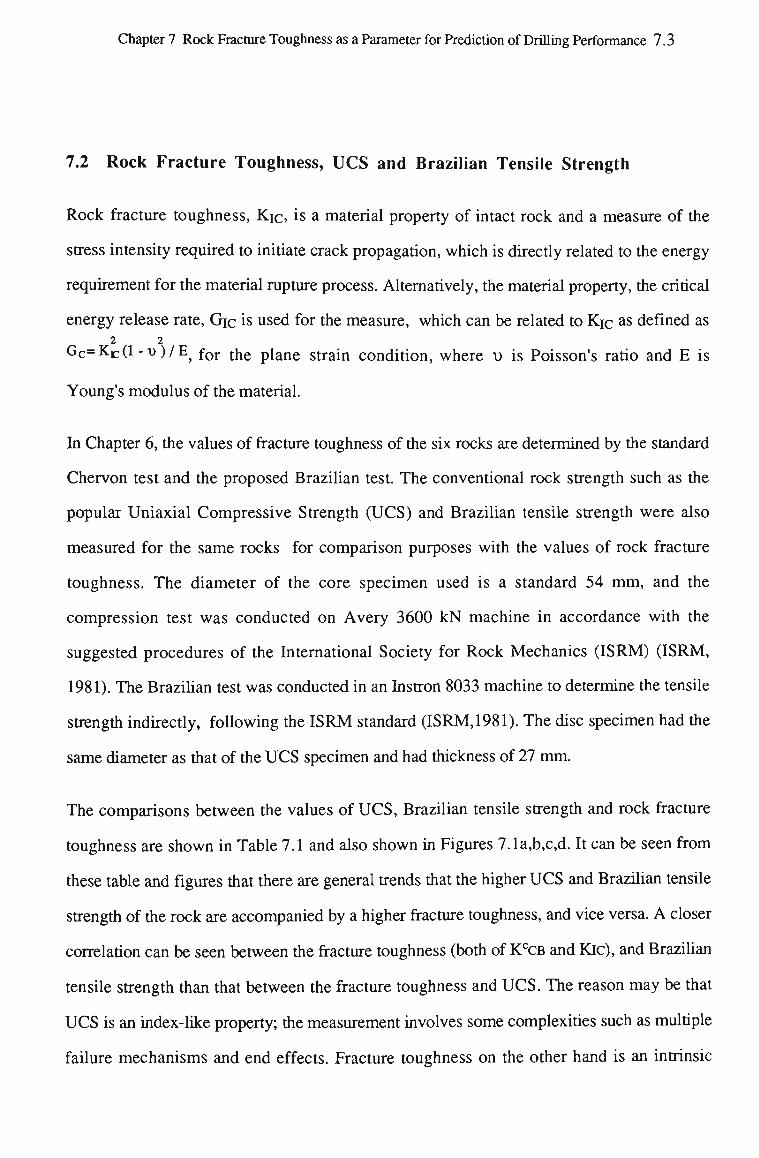
Chapter 7 Rock Fracture Toughness as a Parameter for Prediction of Drilling Performance 7.3
7.2 Rock Fracture Toughness, U C S and Brazilian Tensile Strength
Rock fracture toughness, Kic, is a material property of intact rock and a measure of the
stress intensity required to initiate crack propagation, which is directly related to the energy
requirement for the material rupture process. Alternatively, the material property, the critical
energy release rate, Gic is used for the measure, which can be related to Kic as defined as 2 2
G C = K J C ( 1 -u)/E5 for t h e p i a n e strain condition, where o is Poisson's ratio and E is
Young's modulus of the material.
In Chapter 6, the values of fracture toughness of the six rocks are determined by the standard
Chervon test and the proposed Brazilian test. The conventional rock strength such as the
popular Uniaxial Compressive Strength (UCS) and Brazilian tensile strength were also
measured for the same rocks for comparison purposes with the values of rock fracture
toughness. The diameter of the core specimen used is a standard 54 mm, and the
compression test was conducted on Avery 3600 kN machine in accordance with the
suggested procedures of the International Society for Rock Mechanics (ISRM) (ISRM,
1981). The Brazilian test was conducted in an Instron 8033 machine to determine the tensile
strength indirectly, following the ISRM standard (ISRM, 1981). The disc specimen had the
same diameter as that of the UCS specimen and had thickness of 27 mm.
The comparisons between the values of UCS, Brazilian tensile strength and rock fracture
toughness are shown in Table 7.1 and also shown in Figures 7.1a,b,c,d. It can be seen from
these table and figures that there are general trends that the higher UCS and Brazilian tensile
strength of the rock are accompanied by a higher fracture toughness, and vice versa. A closer
correlation can be seen between the fracture toughness (both of KCCB and Kic), and Brazilian
tensile strength than that between the fracture toughness and UCS. The reason may be that
UCS is an index-like property; the measurement involves some complexities such as multiple
failure mechanisms and end effects. Fracture toughness on the other hand is an intrinsic
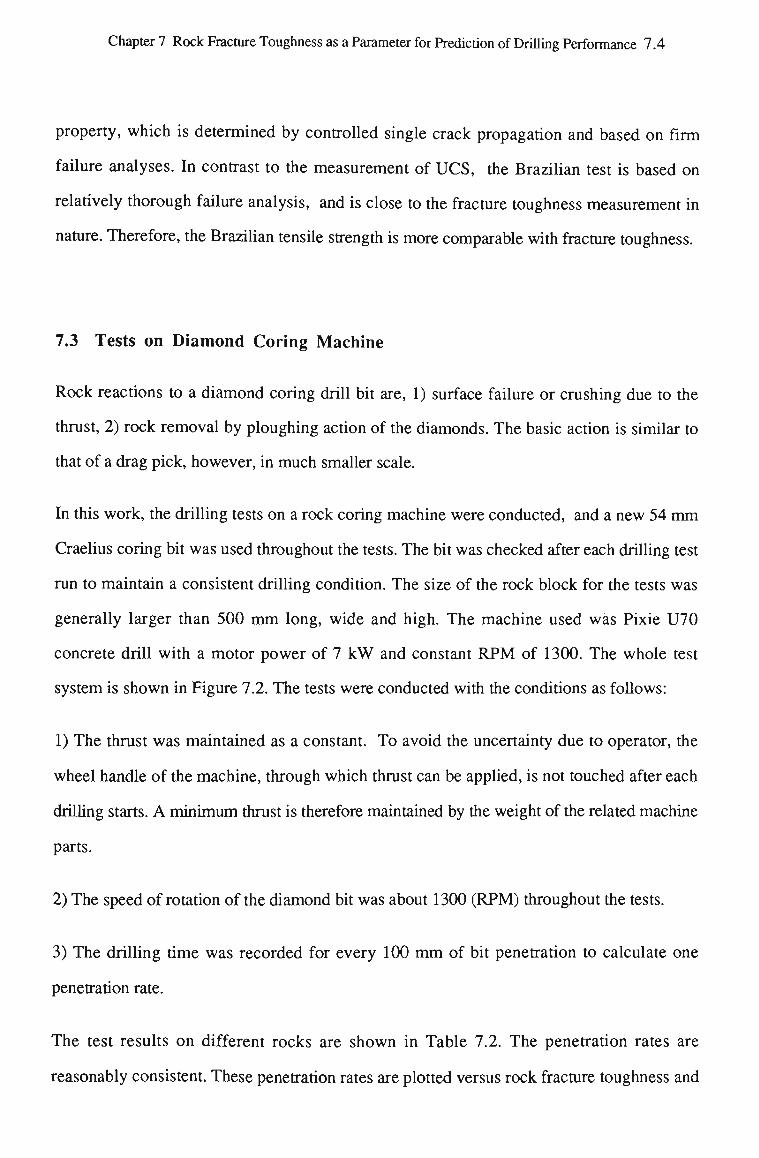
Chapter 7 Rock Fracture Toughness as a Parameter for Prediction of Drilling Performance 7.4
property, which is determined by controlled single crack propagation and based on firm
failure analyses. In contrast to the measurement of UCS, the Brazilian test is based on
relatively thorough failure analysis, and is close to the fracture toughness measurement in
nature. Therefore, the Brazilian tensile strength is more comparable with fracture toughness.
7.3 Tests on Diamond Coring Machine
Rock reactions to a diamond coring drill bit are, 1) surface failure or crushing due to the
thrust, 2) rock removal by ploughing action of the diamonds. The basic action is similar to
that of a drag pick, however, in much smaller scale.
In this work, the drilling tests on a rock coring machine were conducted, and a new 54 mm
Craelius coring bit was used throughout the tests. The bit was checked after each drilling test
run to maintain a consistent drilling condition. The size of the rock block for the tests was
generally larger than 500 mm long, wide and high. The machine used was Pixie U70
concrete drill with a motor power of 7 kW and constant RPM of 1300. The whole test
system is shown in Figure 7.2. The tests were conducted with the conditions as follows:
1) The thrust was maintained as a constant. To avoid the uncertainty due to operator, the
wheel handle of the machine, through which thrust can be applied, is not touched after each
drilling starts. A minimum thrust is therefore maintained by the weight of the related machine
parts.
2) The speed of rotation of the diamond bit was about 1300 (RPM) throughout the tests.
3) The drilling time was recorded for every 100 mm of bit penetration to calculate one
penetration rate.
The test results on different rocks are shown in Table 7.2. The penetration rates are
reasonably consistent. These penetration rates are plotted versus rock fracture toughness and
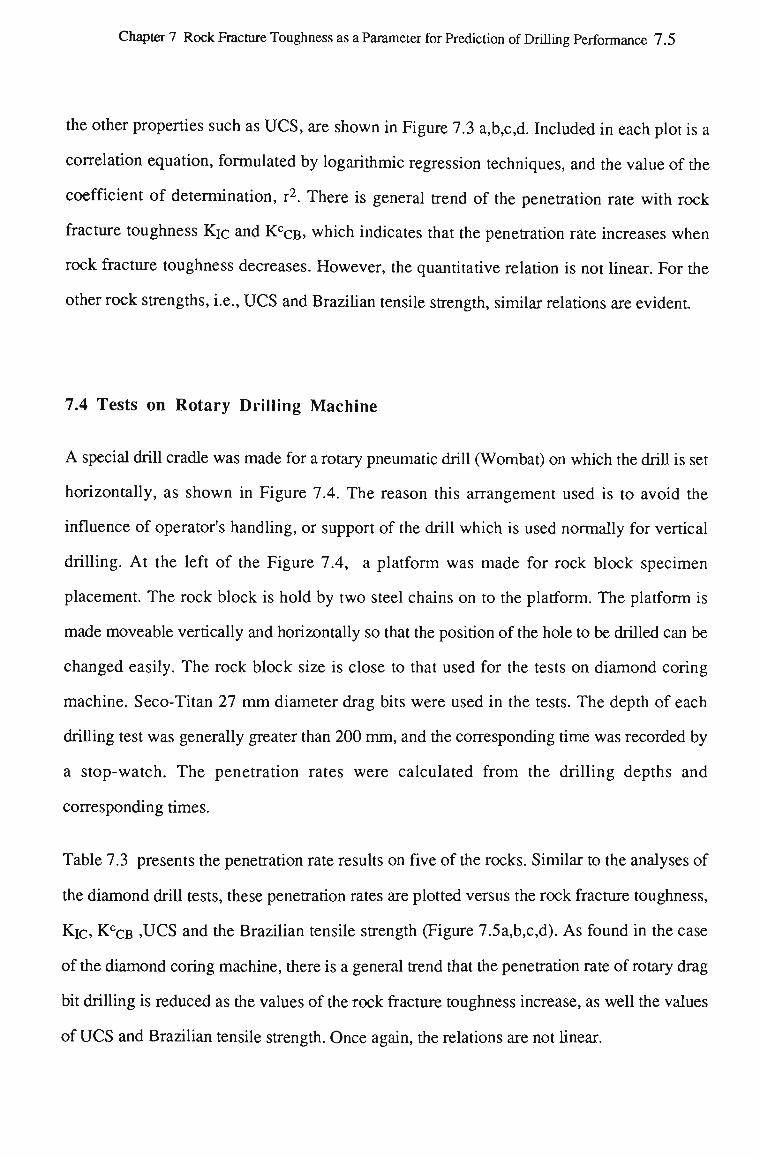
Chapter 7 Rock Fracture Toughness as a Parameter for Prediction of Drilling Performance 7.5
the other properties such as UCS, are shown in Figure 7.3 a,b,c,d. Included in each plot is a
correlation equation, formulated by logarithmic regression techniques, and the value of the
coefficient of determination, r2. There is general trend of the penetration rate with rock
fracture toughness Kic and KCCB, which indicates that the penetration rate increases when
rock fracture toughness decreases. However, the quantitative relation is not linear. For the
other rock strengths, i.e., UCS and Brazilian tensile strength, similar relations are evident
7.4 Tests on Rotary Drilling Machine
A special drill cradle was made for a rotary pneumatic drill (Wombat) on which the drill is set
horizontally, as shown in Figure 7.4. The reason this arrangement used is to avoid the
influence of operator's handling, or support of the drill which is used normally for vertical
drilling. At the left of the Figure 7.4, a platform was made for rock block specimen
placement. The rock block is hold by two steel chains on to the platform. The platform is
made moveable vertically and horizontally so that the position of the hole to be drilled can be
changed easily. The rock block size is close to that used for the tests on diamond coring
machine. Seco-Titan 27 mm diameter drag bits were used in the tests. The depth of each
drilling test was generally greater than 200 mm, and the corresponding time was recorded by
a stop-watch. The penetration rates were calculated from the drilling depths and
corresponding times.
Table 7.3 presents the penetration rate results on five of the rocks. Similar to the analyses of
the diamond drill tests, these penetration rates are plotted versus the rock fracture toughness,
Kic, KCCB ,UCS and the Brazilian tensile strength (Figure 7.5a,b,c,d). As found in the case
of the diamond coring machine, there is a general trend that the penetration rate of rotary drag
bit drilling is reduced as the values of the rock fracture toughness increase, as well the values
of UCS and Brazilian tensile strength. Once again, the relations are not linear.
Chapter 7 Rock Fracture Toughness as a Parameter for Prediction of Drilling Performance 7.6
7.5 Evaluation and Discussion on the Results of the Tests
As expected, rock fracture toughness is an important rock property, which indicates a
measure of drillability. The results show that the penetration rates decrease as rock fracture
toughness increases. However, correlations between the rock fracture toughness and the
penetration rates do not show that rock fracture toughness is better parameter to predict
drilling performance than the other parameters. Rock fracture toughness is one of the best
measures of rock intrinsic properties available for evaluation of drilling and cutting
processes, not only because the method of the measurement is based upon the most thorough
analysis among the all the rock property measurements, but also because rock drilling and
cutting fracture processes are directly related to rock fracture toughness. These results once
more confirm a commonly accepted conclusion drawn by many investigators that no single
rock property alone can be used to predict rock cutting and drilling performance
satisfactorily. As observed in the tests for drag-pick cutting, single indentation and disc
cutting, crushing and cracking (primary, secondary or lateral) are two of the most
fundamental processes which control fragmentation processes. It is reasonable to expect that
the rock fracture toughness may be the best rock property which can be related to the
cracking processes. However, additional rock property is required to assess overall
fragmentation performance, which relates to another fundamental and important processes,
i.e., crushing. Rock hardness is generally believed to be such a property to reflect the feature
in rock crushing processes. Various hardness tests have been proposed for the crushing
process, these are: Schmidt hammer (Tarkoy, 1974), cone indenter (McFeat-Smith, 1975),
Cerchar hardness (see, e.g., Bamford, 1984), Shore hardness (Tarkoy, 1974, ISRM, 1981)
and so on. One such kind of hardness needs to be included into any rock drilling and cutting
performance prediction. It is anticipated that the combined prediction (toughness and
hardness) will provide a better prediction for rock drilling and cutting performance. Reseach
in this area is recommended.
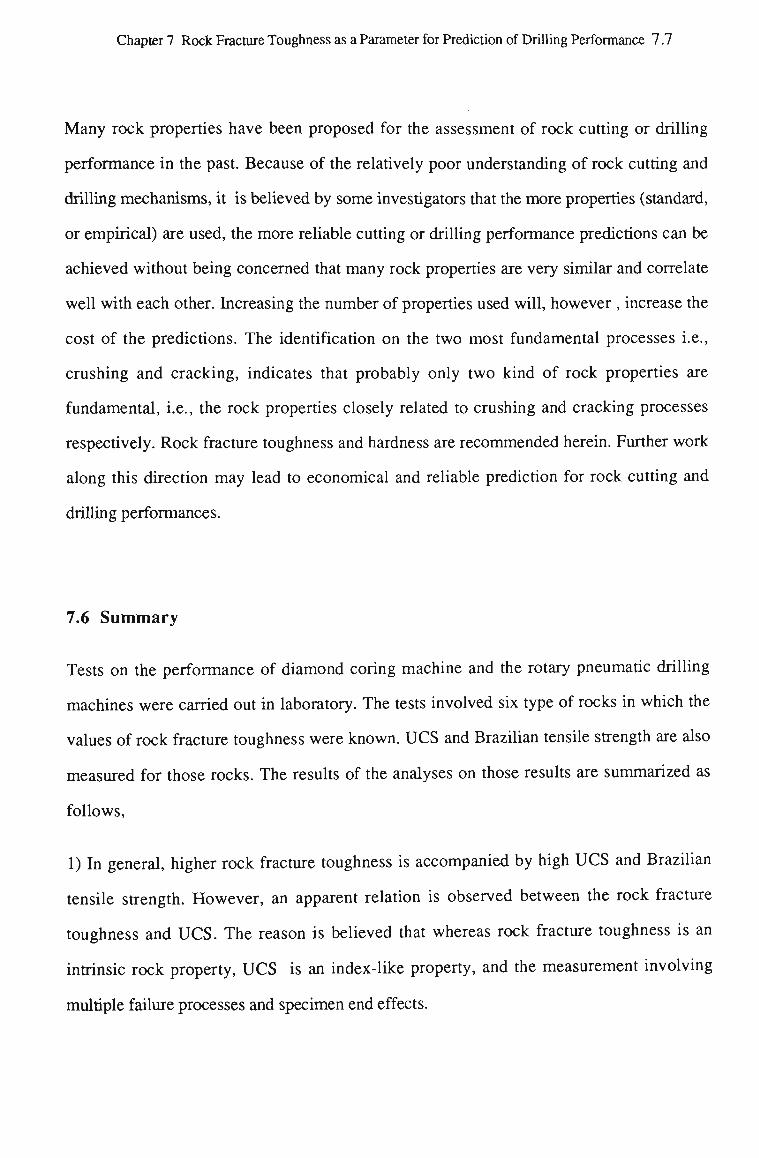
Chapter 7 Rock Fracture Toughness as a Parameter for Prediction of Drilling Performance 7.7
M a n y rock properties have been proposed for the assessment of rock cutting or drilling
performance in the past. Because of the relatively poor understanding of rock cutting and
drilling mechanisms, it is believed by some investigators that the more properties (standard,
or empirical) are used, the more reliable cutting or drilling performance predictions can be
achieved without being concerned that many rock properties are very similar and correlate
well with each other. Increasing the number of properties used will, however , increase the
cost of the predictions. The identification on the two most fundamental processes i.e.,
crushing and cracking, indicates that probably only two kind of rock properties are
fundamental, i.e., the rock properties closely related to crushing and cracking processes
respectively. Rock fracture toughness and hardness are recommended herein. Further work
along this direction may lead to economical and reliable prediction for rock cutting and
drilling performances.
7.6 Summary
Tests on the performance of diamond coring machine and the rotary pneumatic drilling
machines were carried out in laboratory. The tests involved six type of rocks in which the
values of rock fracture toughness were known. UCS and Brazilian tensile strength are also
measured for those rocks. The results of the analyses on those results are summarized as
follows,
1) In general, higher rock fracture toughness is accompanied by high UCS and Brazilian
tensile strength. However, an apparent relation is observed between the rock fracture
toughness and UCS. The reason is believed that whereas rock fracture toughness is an
intrinsic rock property, UCS is an index-like property, and the measurement involving
multiple failure processes and specimen end effects.
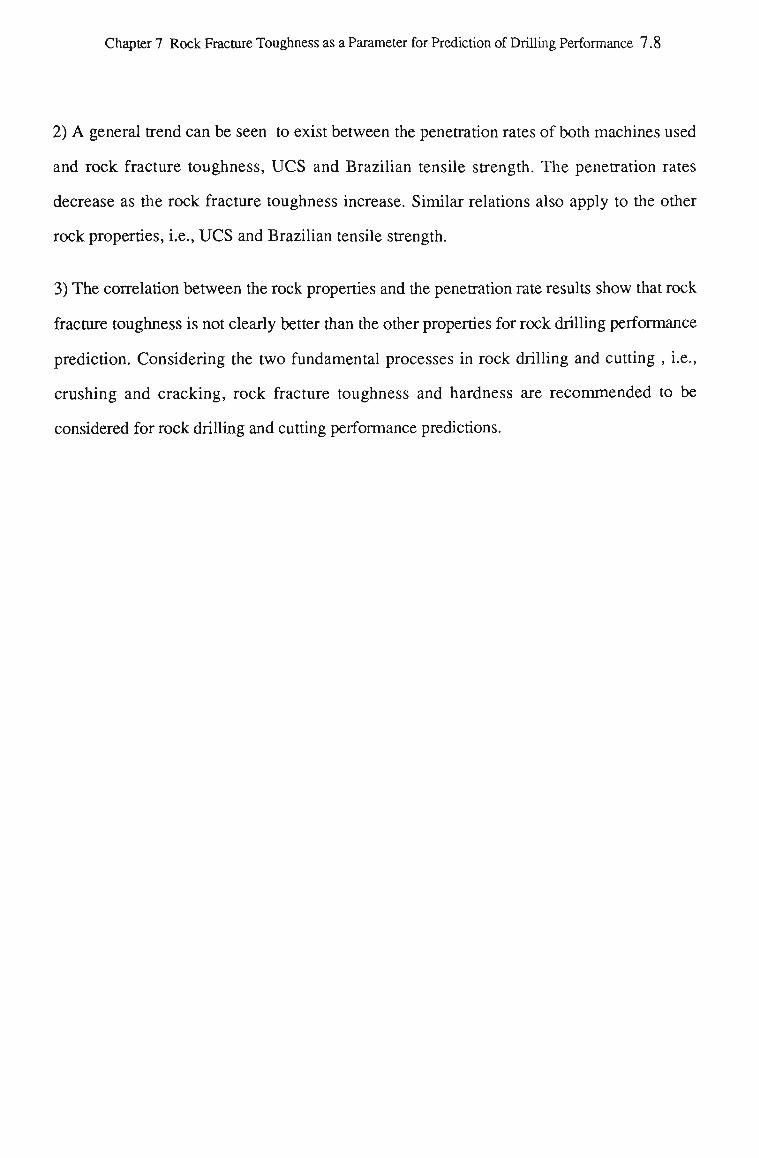
Chapter 7 Rock Fracture Toughness as a Parameter for Prediction of Drilling Performance 7.8
2) A general trend can be seen to exist between the penetration rates of both machines used
and rock fracture toughness, UCS and Brazilian tensile strength. The penetration rates
decrease as the rock fracture toughness increase. Similar relations also apply to the other
rock properties, i.e., UCS and Brazilian tensile strength.
3) The correlation between the rock properties and the penetration rate results show that rock
fracture toughness is not clearly better than the other properties for rock drilling performance
prediction. Considering the two fundamental processes in rock drilling and cutting , i.e.,
crushing and cracking, rock fracture toughness and hardness are recommended to be
considered for rock drilling and cutting performance predictions.
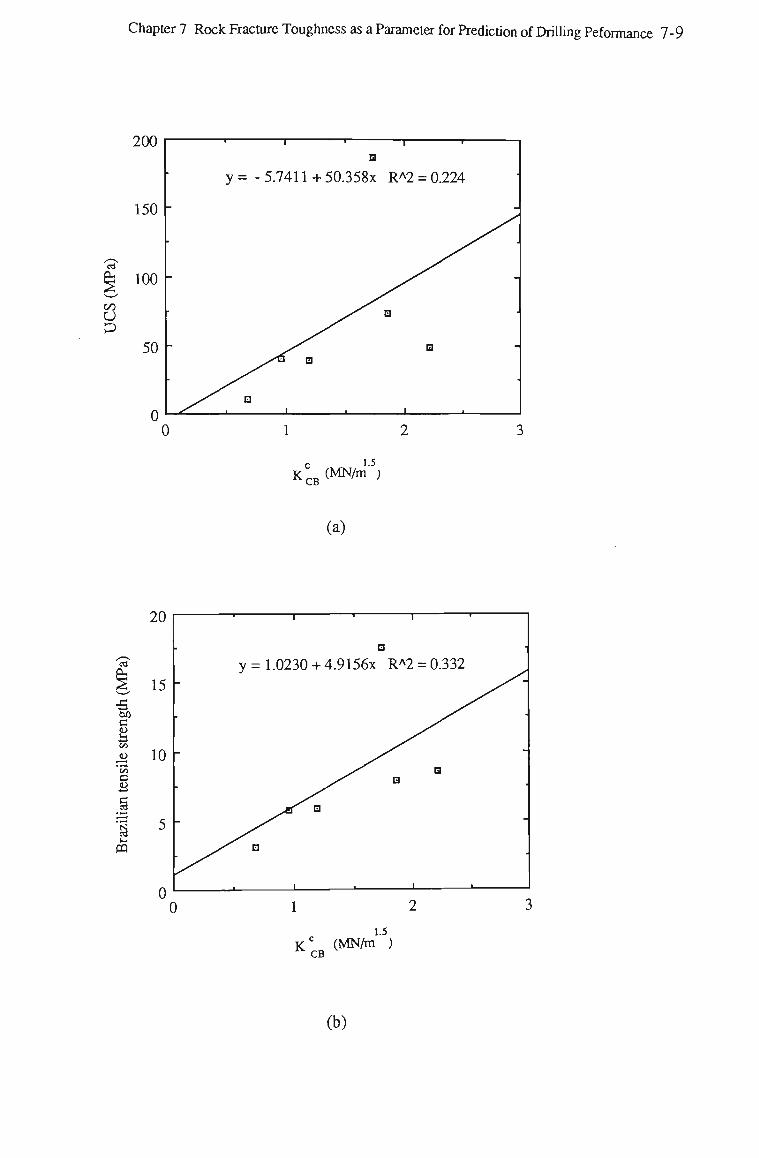
Chapter 7 Rock Fracture Toughness as a Parameter for Prediction of Drilling Peformance 7-9
CJ
Vi
U P
KCB O^™ ->
(a)
1.5
Kc (MN/m ) c CB
(b)
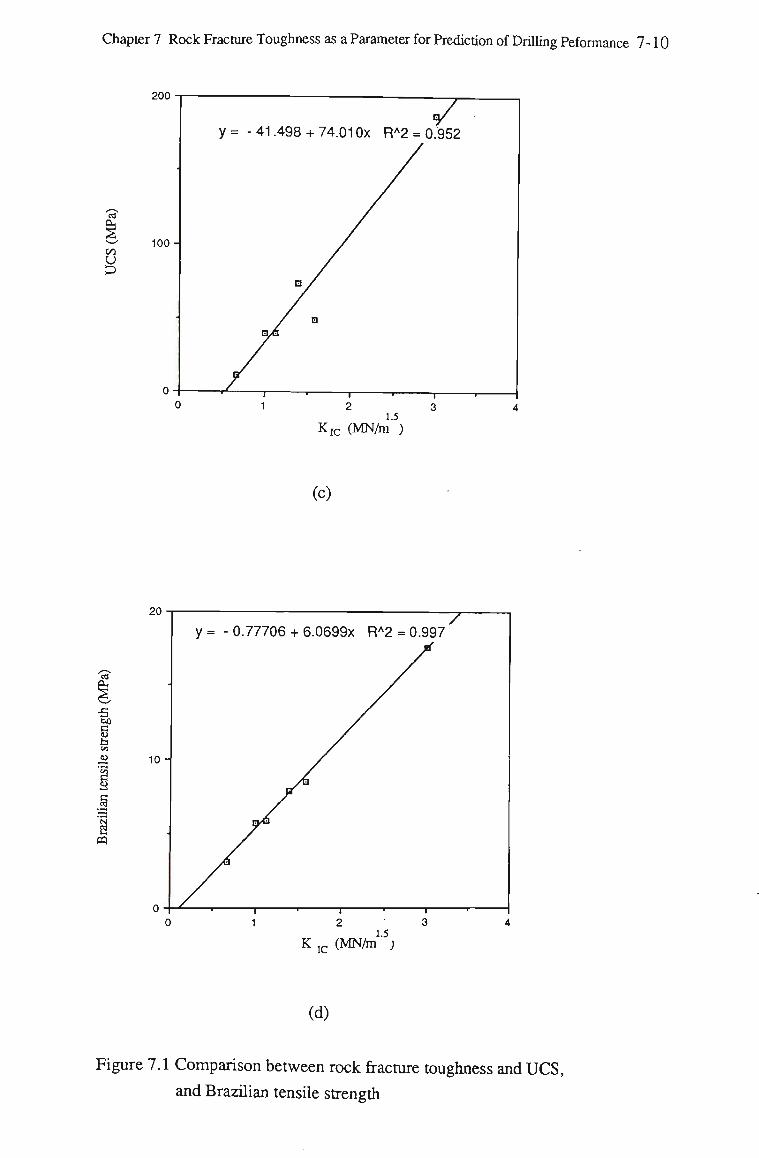
Chapter 7 Rock Fracture Toughness as a Parameter for Prediction of Drilling Peformance 7-10
200
Vi
U £3
100
T 2 3
1.5 KIC (MN/m )
(C)
20
•5 00
c
s
1
10-
y= - 0.77706 + 6.0699X RA2 = 0.997 ^ r _
(d)
Figure 7.1 Comparison between rock fracture toughness and U C S ,
and Brazilian tensile strength
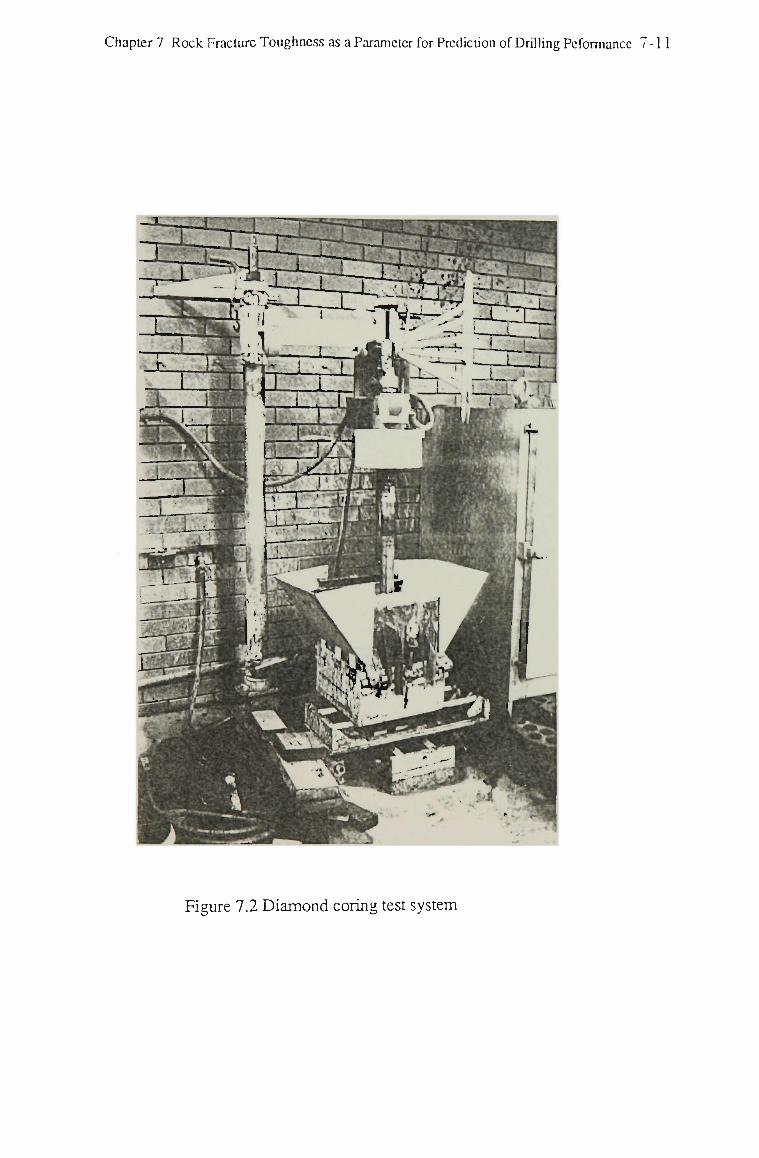
Chapter 7 Rock Fracture Toughness as a Parameter for Prediction of Drilling Peformancc 7-11
;*\ IJr • ',
?1i • » •
v r - • j.
—J-f—1 •
\ Jj3hfc-JB
Figure 7.2 Diamond coring test system
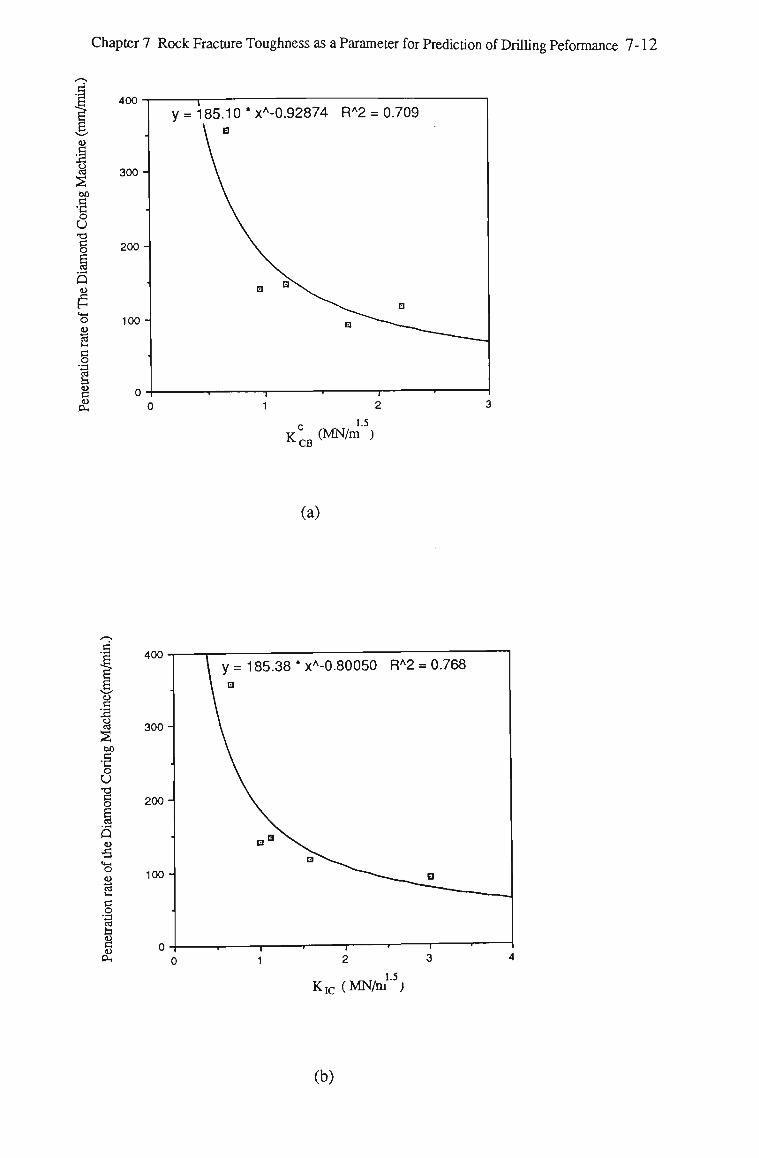
Chapter 7 Rock Fracture Toughness as a Parameter for Prediction of Drilling Peformance 7-12
OO
o U
1 Q
"3 <o cd l - c
s "i 1 DH
400
300-
200-
100
KCCB (MN/m'
5J
(a)
c o
1
§ OH
400
300 -
200-
100-
K I C (MN/m-5;
(b)
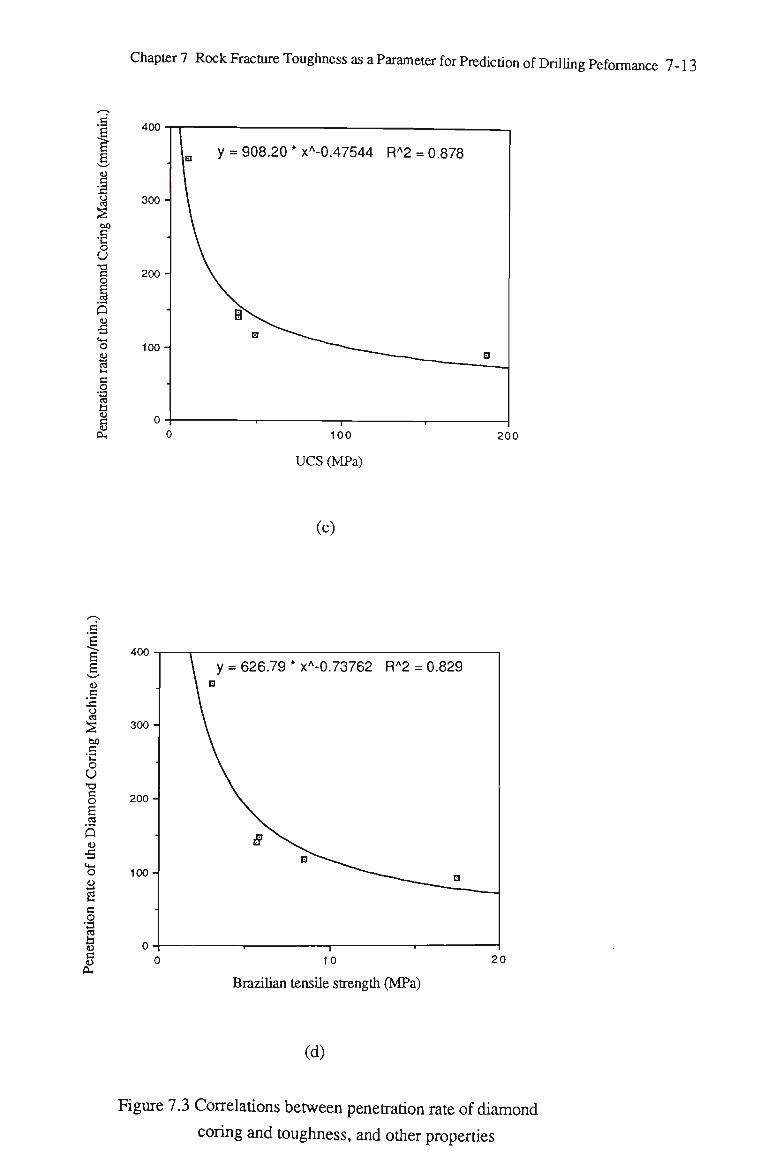
Chapter 7 Rock Fracture Toughness as a Parameter for Prediction of Drilling Peformance 7-13
400
300-
200-
100
100
UCS (MPa)
200
(c)
400
300
200-
100-
Brazilian tensile strength (MPa)
(d)
Figure 7.3 Correlations between penetration rate of diamond
coring and toughness, and other properties
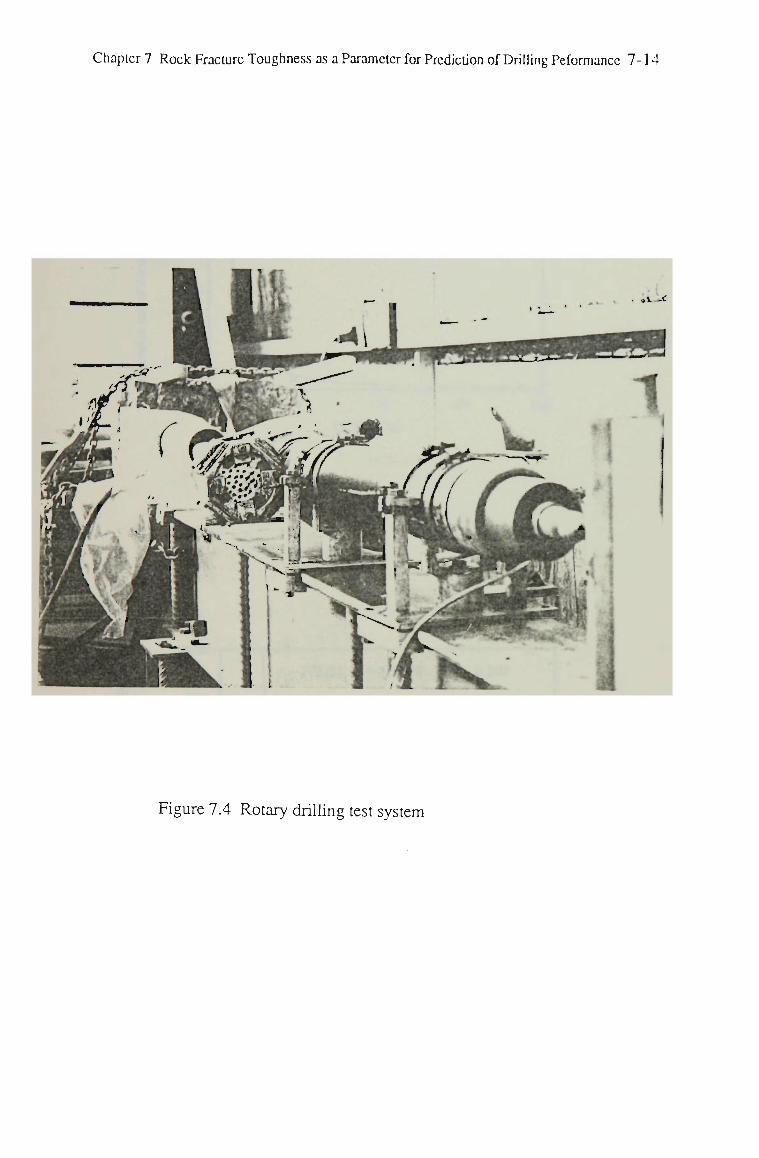
Chapter 7 Rock Fracture Toughness as a Parameter for Prediction of Drilling Peformance 7-14
l-c-
Figure 7.4 Rotary drilling test system
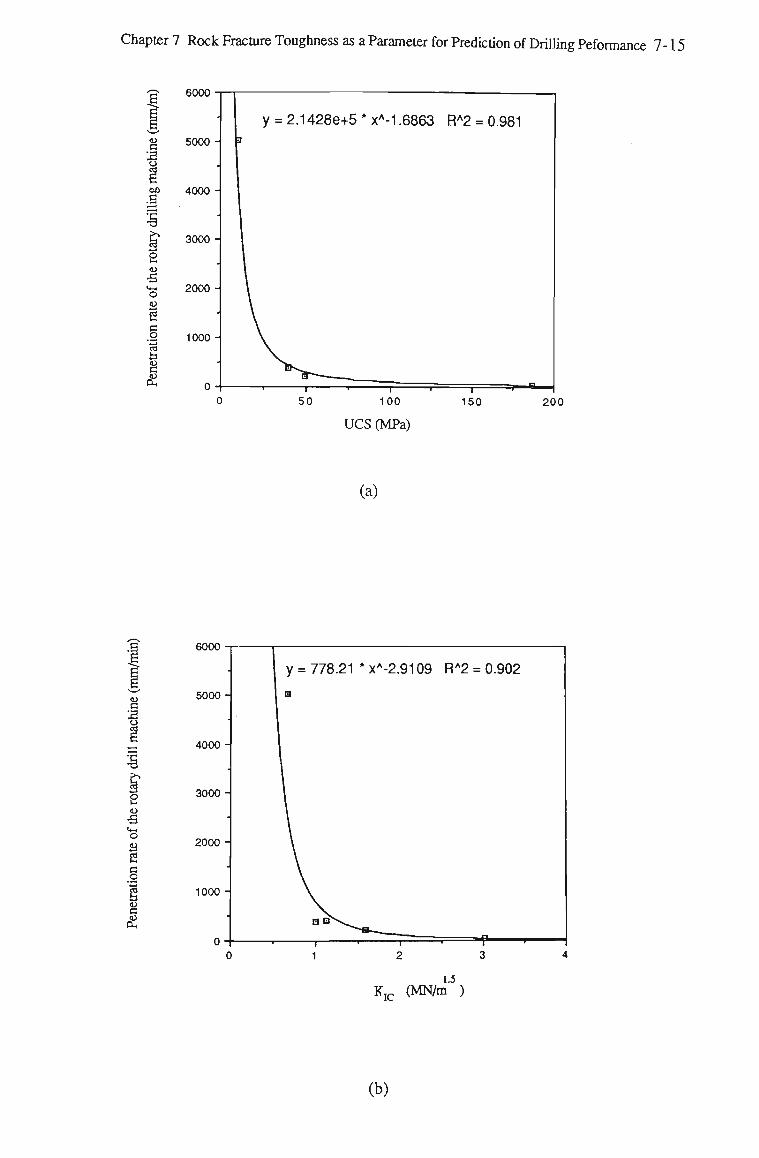
Chapter 7 Rock Fracture Toughness as a Parameter for Prediction of Drilling Peformance 7-15
8 3 oo
.S
•5 •s CQ
c _o
s
ouuo -
5000-
4000 -
3000-
2000-
1000 -
0 -
y = 2.1428e+5 * xA-1.6863 RA2 = 0.981 3
l l
1 1 1 1 , ( 1 n
50 100
UCS (MPa)
150 200
(a)
o
i—(
fi
g
I
1
ouuu -
5000-
4000-
3000-
1000-
o-
y = 778.21 * xA-2.9109 RA2 = 0.902
I H
I \
, .— . r . f—>—
1.5 KIC (MN/m )
(b)
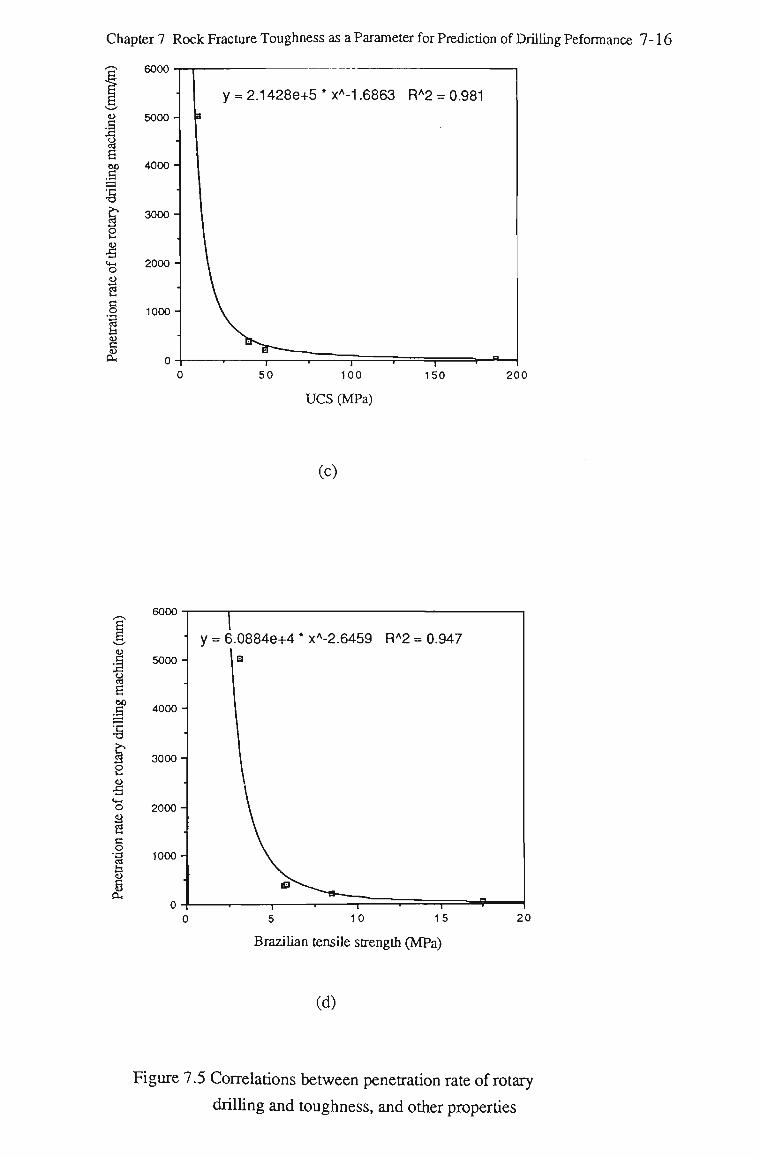
Chapter 7 Rock Fracture Toughness as a Parameter for Prediction of Drilling Peformance 7-16
I 60
.3
H-l
o 1>
g
1
1 OH
WJUU -
5000-
4000-
3000-
2000-
1000 -
0 -
y = 2.1428e+5 * xA-1.6863 RA2 = 0.981
i
1 \
. 1 • , , , f—B
50 100
UCS (MPa)
150 200
(c)
U
S
%
fi c o
"9
6000
5000
4000
3000-
2000-
1000-
5 10 15
Brazilian tensile strength (MPa)
(d)
Figure 7.5 Correlations between penetration rate of rotary
drilling and toughness, and other properties
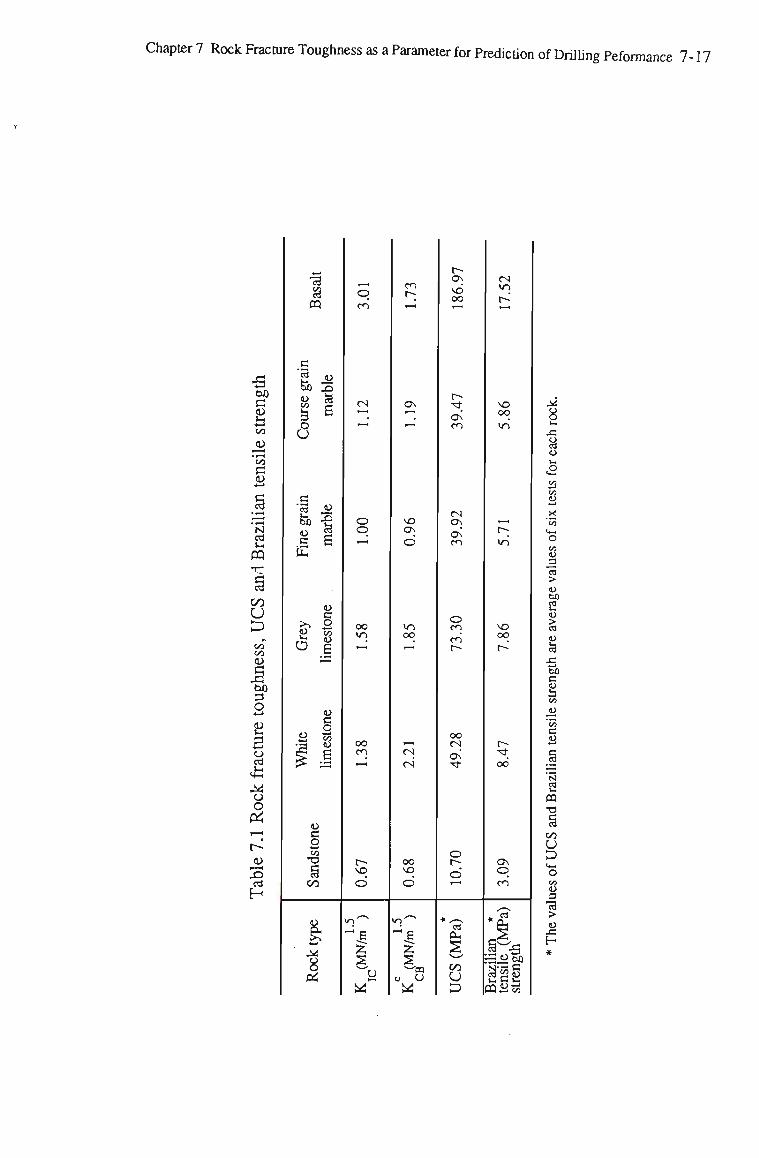
Chapter 7 Rock Fracture Toughness as a Parameter for Prediction of Drilling Peformance 7-17
•5 tm
c
s Vi
JV •l-H
ti
N ed S-H
PQ
00
U
oo
bJQ
O
3 a cd
CJ
O
r— u ed
H
-*—> 1 3
C Q
.S 2 ° 00 JO
urse
mar
o U
c
inegrai
marble
UH
o
Irey
eston
« S ^
n> c o
1 s 1 6 I?* IT!
u c 2 oo "O
u Vi
1 '•8
o
CS t—1
1—'
o p 1-H
OO vn •—'
oo cn
f-VO
O
•—N
*n
Z,
*
OS •"l 1—H
VO ON
O
in oo •- 1
f—i
CS
cs"
oo vo
d ._ ',,™,,^
»o
z o u W
r-Ov vd oo 1-H
r-OV CO
CS ov Ov cn
o cn cn t-
oo cs Ov' *
o t-; d i— i
* ^v ea
Vi
U P
cs >o r-»"
VO oo >o
_ r-;
VO oo r~
r--^ od
Ov <q cn
^ * *
iw-s 111 PQS2to
.->
ei o
a o
§3
> o so
G u > u £3 ,c Sb c
£ 00
g
N fi PQ •a
on U D o
S 3 73 >
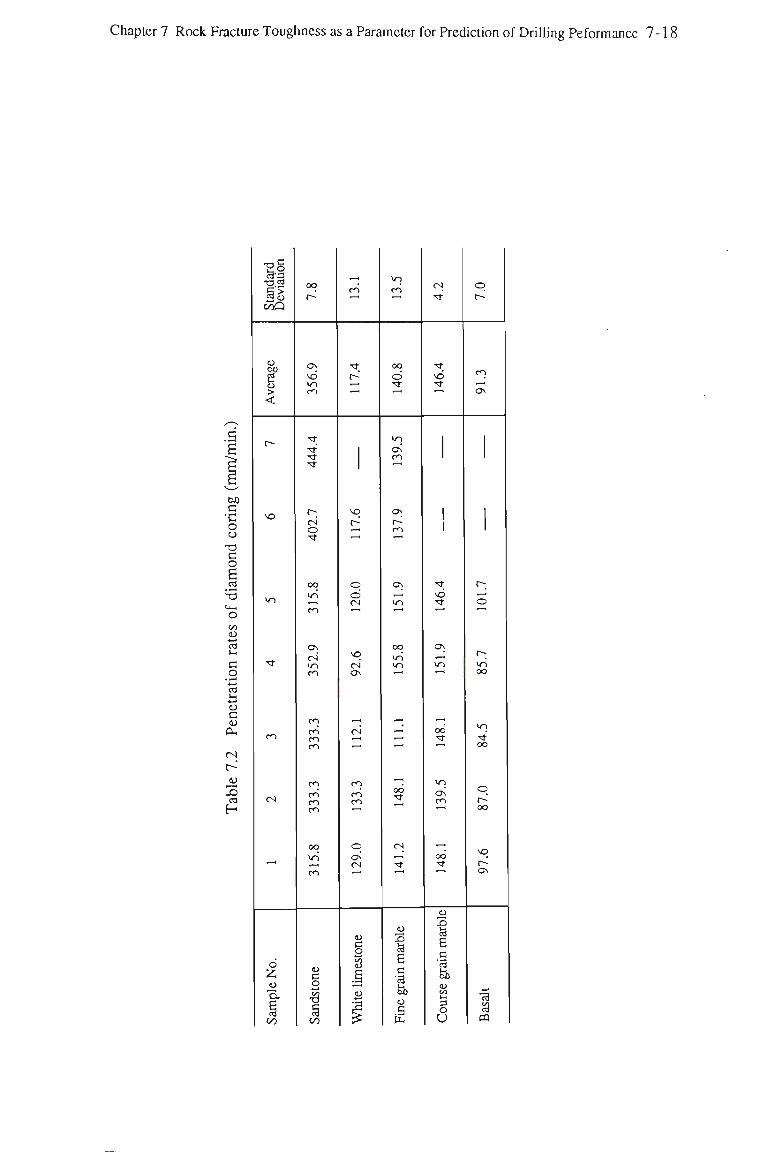
Chapter 7 Rock Fracture Toughness as a Parameter for Prediction of Drilling Peformancc 7-18
•gS oo
in ro CS q
u SP
6 3
Ov
d in co
•tf
r- o tf
• t f
d tf
r—I
Ov
•tf
tf
in Ov ro
vo r-CN
o •tf
vq r^
Ov
r~ ro
oq in o
CN
OV
in
•tf
d r-; o
Ov CN in cn
vq CN Os
in in in in
oo
ro ro m
CN 00
tf tf 00
CN ro ro ro
ro ro
00
tf
wo ON
r-00
00 in Ov
CN
CN i 1
tf 00
tf r-Ov
o
o
to
c o
I Vi
E c •a u
.S
6 'J3
o U
73 % CQ
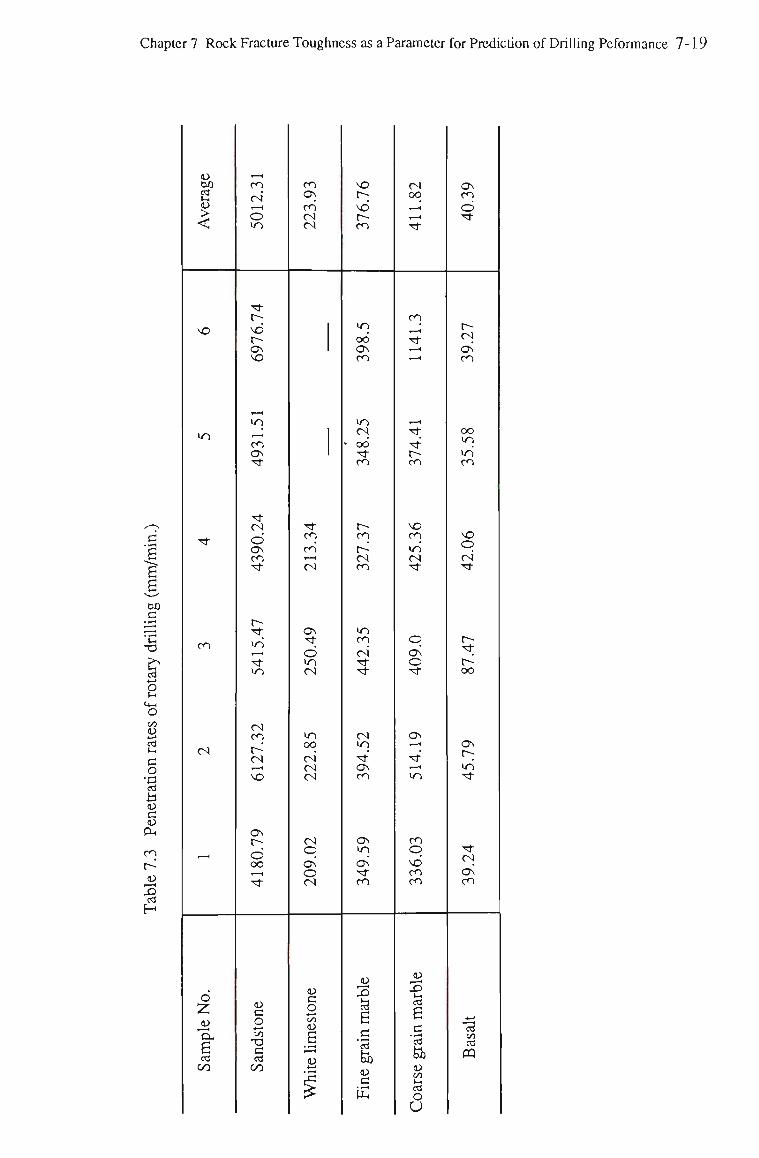
Chapter 7 Rock Fracture Toughness as a Parameter for Prediction of Drilling Peformance 7-19
D bo
£ 3
VO
in
Tf
cn
CN
T — <
6
in
£ ed oo
l-H
cn CN l-H
o in
Tt t-~ vd r-Ov VO
l-H
in ,_; cn OS Tf
Tf CN O Ov cn Tf
r-Tf in T-H
Tf in
CN cn
CN
vo
Ov r-o OO l-H
'et
C o e/3
CO
cn Ov cn CN CN
| 1 !
Tf cn cn l-H
CN
Os Tf
© in CN
in oo CN CN CN
CN O Os O CN
<o c o •*—»
Vi ti E ti £5
vo t--
vd r cn
•n od Os cn
>n CN • od 'et cn
r-cn r CN cn
in cn CN Tf Tf
CN <o Tf Ov en
Ov in Ov 'et cn
3H
3 6 c cd
feb c •f-H
CN oq i — <
i — <
Tf
cn l-H
'et i — <
. — i
l-H
Tf Tf r— cn
vo cn un CN Tt
O Ov O Tf
OS i—i
Tf I — l
m
cn q vd cn cn
<o
1 a •a feb <0 Vi
la o U
Ov cn cd Tf
CN Ov cn
oo in in cn
vo © CN Tf
Tf
r OO
Ov r~; >n Tf
Tf CN Os cn
4~*
13 GO cd
PQ

CHAPTER EIGHT
SUMMARY AND CONCLUSIONS
Chapter 8 Summary and Conclusions 8-1
CHAPTER 8
SUMMARY AND CONCLUSIONS
Mechanical rock excavation techniques have been greatly improved in recent years. Research
and development in this area have been motivated by the demand for high excavating(or
production rate) rates in the mining industry and civil engineering developments. As the
result, powerful and heavy machines, such as longwall shearers, roadheaders, continuous
miner, tunnelling boring machine(TBM) have been developed for different tasks and widely
used worldwide. Exotic techniques such as water-jet assisted rock cutting are currently under
development for improvement on hard rock cutting. Despite what have happened, the
fundamental processes involved in those machines are not well understood due to the
complexity of the rock reactions to excavating tools under various conditions. Current
designs for those machines are generally based on empirical data. Better understanding of
these fundamental processes will lead to more efficient excavating machines, and in addition,
will promote the development of water-jet assisted rock excavating. Moreover, harmful fine
dust due to rock excavating can be reduced by designing rock excavation in such a way that
the fine fragment producing processes are suppressed.
Relatively consistent rock fracture patterns due to rock drilling and cutting tools suggested
that fracture mechanics principles should be applied to the related fracture analyses. In this
thesis, efforts have been made for the development of numerical methods for the related
fracture analyses. Evaluation of the applications of fracture mechanics principles were made
on a few aspects. The results of the work are summarized as follows,
1) The first step of the work is to find an efficient and accurate numerical method to analyze
the complex crack behaviour involved in rock fragmentation processes. A special crack tip
element is developed to model the feature of the stress singularity at a crack tip, based on an
Chapter 8 Summary and Conclusions 8-2
elastic solution for an arbitrary displacement discontinuity. B y incorporating this crack tip
element into the conventional displacement discontinuity method, the crack displacements
can be accurately determined.
2) Based on the crack displacements, strain energy release rate and stress intensity factors
have been evaluated numerically for straight crack, and curved crack problems. The results
show the calculations are accurate and reliable for various problems. Then, the propagation
of angled cracks was modelled according to both Griffith-Irwin and maximum tensile stress
criteria. The predictions of the crack propagation are in good agreement with available
analytical solution and experimental evidence. Compared with the Griffith-Irwin criterion,
the maximum tensile stress criterion involved less computation and reasonable accuracy, and
therefore was selected for the modelling of the crack problems involved in the various types
of cutting.
3) A special 'Rock Cutting Simulation Rig' was developed to observe the actual crack
behaviour in drag-pick cutting. Major chip formation as one of fundamental process was
identified in various conditions. Based on this information, the computing models were
created for the numerical analyses. The crack propagation which forms the major chip was
modelled. The results shows that as rake angle decreases, the size of the major chip
increases, and so does the cutting force requirement to form the major chip. The effect of
tool bluntness was also modelled. As the bluntness of the tool increases, the smaller the
major chip sizes and the higher force requirement were predicted. Further tests on the Rock
Cutting Simulation Rig and drag-bit drilling monitoring in laboratory indicates that the
numerical modelling generally reflects the trend observed. However, the actual cutting
process is controlled by many factors such as tool attack angle, rake angle, clearance angle
and their combination. In some cases, the numerical predicted major chip formation is
seldom observed. A better quality of numerically modelling can only be achieved based
upon further experimental studies on the effects of these factors.
Chapter 8 Summary and Conclusions 8-3
4) In the disc cutting area, both the experimental and numerical modelling were undertaken
to investigate the crack behaviour due to the Bi-Indenters. The results show that the primary
cracks produced by each individual indenter are forced to propagate outward due to the
interaction between them. The spacing between the two indenters of a Bi-Indenters has been
found to affect the primary crack propagation angle; the primary cracks propagate at a large
angle when the spacing is small. This effect indicate that it is possible to control the crack
behaviour, and the behaviour leads to an idea to produce large wedge-shaped rock fragments
between two set of the Bi-Indenters. The idea was confirmed experimentally. Furthermore,
the concept of a hybrid rock cutting system based on the above study was proposed, which
involved disc cutters to produce wedge shaped fragments, followed by drag picks to remove
these fragments.
5) Fracture mechanics analyses on the diametral crack behaviour in a disc with diametral
compression have been carried out. A simple conventional Brazilian test, which is normally
used for the determination of rock tensile strength is proposed to be applied for the
measurement of rock fracture toughness. The rock fracture toughness of six types of rocks
were determined by the proposed method; for most rocks, the results compared reasonably
well with those determined by the Chevron bending specimen method, one of the recently
proposed international standard methods by the ISRM. The rock fracture toughness
measurement using the Brazilian test may provide a practical testing technique for field use as
no sophisticated instrumentation is required, specimen preparation is simple, and the test
procedure is easy.
6) The rock cracking behaviour involved in rock cutting processes suggests that rock fracture
toughness, an intrinsic property of rock, can be closely related to the rock cutting or drilling
performance. Tests on the performance of diamond coring machine and the rotary pneumatic
drilling machine were carried out in the laboratory. The tests involved six type of rocks. The
Chapter 8 Summary and Conclusions 8-4
rock fracture toughness, U C S and Brazilian tensile strength were measured for these rocks
for comparison purpose. In general, higher rock fracture toughness is accompanied by high
U C S and Brazilian tensile strength.
A general trend can be seen to exist between the penetration rates of both machines used and
rock fracture toughness, U C S and Brazilian tensile strength. The penetration rates decrease
as the rock fracture toughness increases. Similar relations also apply to the other rock
properties, i.e., U C S and Brazilian tensile strength. The correlation between the rock
properties and the penetration rate results show that rock fracture toughness is not clearly
better than the other properties as a single rock property for rock drilling performance
prediction. Considering the two fundamental processes in rock drilling and cutting, i.e.,
crushing and cracking, in addition to rock fracture toughness, rock hardness related to
crushing process needs to be incorporated for rock drilling and cutting performance
predictions.
7) Further research are recommended as follows:
i) Most of conventional crack propagation theories, such as the maximum tensile stress
theory and the strain energy density theory are derived from a 'traction free' crack, and
experienced some difficulties associated with the application of them to predict crack
propagation in compression. The displacement discontinuity method can transform its
element from 'mathematical element' into 'physical element'. In contrast to the 'traction free'
element, the 'physical element' permit stress across it and the friction between the two crack
surfaces can be considered. Crack problem in compression with friction is especially
important for rock fracture mechanics study, development and evaluation of the displacement
discontinuity method in this direction is recommended.

Chapter 8 Summary and Conclusions 8-5
ii) Further observation on effect of cutting parameters such as attack, rake and clearance
angles on major chip formation due to drag pick are recommended, based on those
observation, numerical modelling are suggested for a large range of the cutting parameters.
iii) Further experimental observation on the primary crack behaviour due to the Bi-Indenters
for a large range of rocks, especially for hard rock, with confining pressure to rock specimen
and numerical modelling are recommended. The evaluation and experiment on the concept of
hybrid cutting system are also suggested.
iv) The Brazilian test for the rock fracture toughness determination needs further evaluation
for a large range of rocks.
v) The further investigation on the fundamental rock properties, rock fracture toughness and
rock hardness is recommended for rock drilling and cutting performance predictions.

REFERENCES
References R-l
REFERENCES
Abou-Sayed, A.S. and Simonson, E.R., 1977 Fracture toughness, KIC, of triaxially-loaded
Indiana Limestone, Proceedings of 18th U S Symposium on Rock Mechanics, 2A3-1, 2A3-
8.
Aleman, V.P., 1983 Prediction of cutting rates for boom type roadheaders, Tunnels and
Tunnelling, pp. 23-25.
Anderson, G. et al., 1976 Use of finite element computer program in fracture mechanics,
Int. J. Fracture Mech. Vol. 7 N o 1, pp.63-76.
Atkinson, B.K. and Avdis, V., 1980 Fracture mechanics parameters of some rock-forming
minerals determined using an indentation technique. Int. J. Rock Mech. Min. sci. &
Geomech. Abstr. 17, pp.383-386.
Bamford, W.E., 1984 Tests for assessing the drillability, cuttability and rippability of rocks
are being internationally stardardised, Australian Geomechanics Society - Excavation
Characteristics Seminar, 14, November.
Bareblett, G.T., 1962 The mathematical theory of equilibrium cracks in brittle fracture. Adv.
Appl. Mech. 7, p.55.
Barker, L.M. 1977 A simplified method for measuring plane strain fracture toughness,
Engineering Fracture Mechanics, 9, p.361.
Barsoum, R.S., 1976 On the use of isoparametric finite elements in linear fracture mechanics
, Int. J. Num. Meth. Engrg. 10, p.25.
Barsoum, R.S., 1977 Triangular quarter-point elements as elastic and perfectly-plastic crack
tip elements, Int. J. Num. Meth. Engrg. 11, p.85.
Blandford, G., Ingraffea, A.R. and Ligett, J.A., 1981 Two-dimensional stress intensity
factor calculations using boundary elements methods, Int. J. Num. Meth, Engrg. 17, p.387.
Chan, S.K., Tuba, I.S. and Wilson, W.K., 1970 On the finite element method in linear
fracture mechanics, Engrg. Fracture Mech. 2, pp. 1-17.
References R-2
Chang, KJ., 1981 Further Studies of the maximum stress criterion on the angled crack
problem. Engr. Fracture Mech. Vol. 14, pp. 125-142.
Chorlton, F., 1959 Boundary Value Problems in Physics and Engineering, Vanostrand
Reinhold Company Ltd, London, pp. 128-129.
Cook, N.G.W., Hood, M. and Tasi, F., 1984 Observation of crack growth in hard rock
loaded by an indenter, Int. J. Rock Mech. Min. Sci, pp.97-107.
Cornet, F. H., 1980 Comparative analysis by the displacement-discontinuity method of two
energy criteria of fracture, J. Appl. Mech. 46, pp.349-355.
Crabb, G.I. and Mignett, H.J., 1980 A laboratory and pilot scale study on the cutting of
chalk containing flints, Tunnels and Tunnelling 12, pp.29-33.
Crouch, S.L., 1976a Analysis of stresses and displacements around underground
excavations: an application of displacement discontinuity method, Geomechanics report to
the National Science Foundation, Minneapolis, The University of Minnesota (unpublished).
Crouch, S.L., 1976b Solution of plane elastic problems by the displacement discontinuity
method, Int. J. Num. Meth. Engrg. 10, pp.301-343.
Crouch, S.L., 1979 Computer simulation of mining in faulted ground, J.S. Afr. Int. Min.
Metall. 79, pp. 159-173.
Cruse, T.A. and Wilson, R.B. 1978 Advanced application of boundary-integral equation
method, Nucl. Engrg. Design 46, pp.223-234.
Cruse, T.A., 1975 Boundary-integral equation fracture mechanics analysis, in Boundary-
Integral Equation Method: Computation Applications in Applied Mechanics (Eds, Cruse,
T.A. and Rizzo, F.J.), A S M E Appl. Mech. Sym. Series, AMD-Vol. 11, pp.31-48.
Cruse, T.A., 1978 Two-dimensional BIE fracture mechanics analysis, App. Math.
Modelling 2, pp.287-293.
Dalziel, J.A. and Davies, E., 1964 Initiation of cracks in coal specimens by blunted wedges,
The Engineer, Vol. 217, p.217
Dugdale, D.S., 1960 Yielding of steel sheets containing slits. J. Mech. Phys. Solids 8,
p.100.
References R-3
Erdogan, F and Sih, G.C., 1963 O n the crack extension in plates under plane loading and
transverse shear. A S M E J. Basic Engr. 85, pp.519-527.
Evans, I. and Murrell, S.A.F., 1962 Wedge Penetratiomn into Coal, Colliery Engineer, Vol.
39, No. 455, p.ll.
Evans, I. and Pomeroy, CD., 1966 The strength, fracture & workability of coal, First Ed.,
Pergamon Press, London, p. 270.
Evans, I., 1961 A theory on the basic mechanics of coal ploughing. Proc. Int. Symp. on
Mining Research., Univ. of Missouri, Vol. 2, Pergamon Press, p.761.
Evans, I., 1962 A theory of the basic mechanics of coal ploughing, Proc. Int. Symp. on
Min. Research, Pergamon, London.
Evans, I., 1965 The force required to cut coal with blunt wedges, Int. J. Rock Mech.
Mining Sci. Vol. 2, pp. 1-12.
Evans, I., 1974 Relative efficiency of picks and Discs for cutting rock, Proc. of 3rd
I.S.R.M. Congress, Vol. 11-13, Denver.
Fairhurst, C, 1964 Discussion of J. Furby, Strain wave behaviour in the percussive drilling
process. Trans. Inst. Min. Metall. 73, pp.671-411.
Fairhust, C. and Lacabanne, W.D., 1956 Some principles and Developments in hard rock
drilling techniques, Proceedings of 6th Drilling and Blasting Symposium, University of
Minnesota, p. 15.
Fenn, O., Protheroe, B.E. and Joughin, N.C., 1985 Enhancement of roller cutting by
means of water jets, In Proc. R.E.T.C., A I M M E , Vol.1, N e w York, pp.341-356.
Fish, B.R. and Barker, J.S., 1956 Studies in rotary drilling, National Coal Board, MRE
Report No. 209.
Frank, F.C. and Lawn, B.R., 1967 Proc. Roy. Soc. London, A299, p.291.
Freese, C.E. and Tracey, D.M., 1977 The nature isoparametric triangle versus collapsed
quadrilateral for elastic crack analysis, Int. J. Fracture, 12, p.767.
Frocht, M.M., 1948 Photoelasticity, Vol.2, John Wiley & Sons Inc., New York.
References R-4
Geier, J.E. and Hood, M., 1987 The effect of pre-weakening a rock surface by water jet
kerfing, on cutting tool forces, 4th U S Water Jet Confrence, Berkeley, August
Geier, J.E., Hood, M. and Thimons, E.D., 1987 Water jet-assisted drag bit cutting in
medium strength rock: A fundamental investigation, 28th U S symposium on Rock
Mechanics, Tucson, 29 June - 1 July, pp.953-961.
Gilford, L.N. and Hilton, P.D., 1978 Stress intensity factors by enriched finite elements,
Engng Fracture Mech. 10, pp.485-496.
Gnirk, P.F., 1964 An experimental investigation of the indexing phenomenon for static
single-tooth penetration in Indiana Limestone at Atmospheric Conditions, Research Report
for School of Mines & Metallurgy, University of Minnesota, USA.
Goodrich, R.H., 1956 High pressure rotary drilling machines, Proc. 2nd Ann. Symp. on
Min. Res, University of Missouri, p.25.
Gray, K.E., Armstrong, F. and Gatlin, C, 1978 Two dimensional study of rock breakage
in drag bit drilling at atmospheric pressure, J. Petrolem.
Griffith, A., 1921 The phenomena of rupture and flow in solids. Philosophical Trans.,
London Royol Society, Series A, Vol. 221, pp.163-198.
Guo, H., Aziz, N.I. and Schmidt, L.C, 1990 Crack tip modeling by the displacement
discontinuity method( to be published).
Guo, H., Standish, P., Schmidt, L.C. and Aziz, N.I. 1988. A Method of Mechanical
Efficiency Analysis for Rotary Drag Bits. Second International Conference on Mining
Machinery, Brisbane, pp. 322-326.
Hardy, M.P., 1973 Fracture mechanical applied to rock, Ph.D thesis, University of
Minnesota, USA.
Hartman,H.L., 1959 Basic Studies of percussion drilling, The Mining Engineer, U.K.
p.28.
Hondros, J. R., 1959 The evaluation of Poisson's ratio and the modulus of materials of a
low tensile resistance by the Brazilian (indirect tensile) test with particular reference to
concrete. Australian J. Appl. Sci. 10, pp.243-268.
References R-5
Howarth, D.F. and Bridge, E.J., 1988 Microfracture beneath blunt disc cutters in rock, Int.
J. Rock Mech. Min. Sci. & Geomech. Abstr. vol. 15, No. 1, pp.35-38.
Howarth, D.F. and Bridge, E.J., 1988 Observation of cracks at the bottom of percussion
and diamond drill holes, Int. J. Rock Mech. Min. Sci. & Geomech. Abstr.,Vol. 25, pp.39-
43.
Howarth, D.F. and Rowland, J.C,1987 Quantitative assessment of rock texture and
correlation with drillability and sterngth properties, Rock Mechanics and Rock Engineering,
20, pp. 57-85.
Howarth, D.F., 1988 Hybrid rock cutting systems - New concepts in machine design,
Second International Conference on Mining Machinery, Brisbane, May, pp.9 -11.
Hussian, M.A., Pu, S.L. and Underwood, J., 1974 Strain energy release rate for a crack
under combined Mode I and Mode II. Frac. Analysis, ASTM-STP 560, A m . Soc. Testing
Materials, Philadephia, pp.2-28.
Ingraffea and Rabia, H. and Brook, N., 1980 An empirical equation for drill performance
prediction, 21st U.S. Sympsium on Rock Mechanics, University of Missouri-Rolla,
pp.103-111.
Ingraffea, A.R. 1983 Numerical modeling of fracture propagation, Rock Fracture Mechanics
(ed, Rossimanith, H.P.), Springer Verlag Wien- New York, pp.170-174.
Ingraffea, A.R. and Manu, C 1980 Stress-intensity factor computation in three dimensions
with quarter-point elements, Int. J. Num. Meth. Engrg. 15, 10, p. 1427.
Ingraffea, A.R., 1981 Mixed-mode fracture initiation in Indiana Limestone and Westerly
Granite. The Proceedings of 22nd U.S. Symposium on Rock Mechanics, Cambridge, M A ,
p.186.
Ingraffea, A.R., 1987 Theory of crack initiation and propagation in rock, Fracture
Mechanics of Rock, (ed., Atkinson, B.K.), Academic Press Geology Series, pp. 101-107.
Ingraffea, A.R., Blandford, G and Liggett, J.A., 1981 Automatic modeling of mixed-mode
fatigue and quasi-static crack propagation using the boundary element method. Proceedings
14th National Symposium on Fracture Mechanics, ASTM-STP, p.791.
References R-6
Ingraffea, A.R., Gunsallus, J.F., Beech, J.F. and Nelson, P., 1982 A Fracture toughness
testing system for prediction of tunnel boring machine performance, 23rd Symposium on
Rock Mechanics, pp. 463-470.
Irwin, G.R., 1956 Relation of stresses near a crack to the crack extension force, Ninth
Congress of Applied Mechanics, Brussels, p.245.
ISRM (Editor: E. T., Brown), 1981 Rock Characterization Testing and Monitoring (ISRM
Suggested Methods), Pergamon Press, pp.120-121.
ISRM(Co-ordinator, F., Ouchterlony), 1988 Suggested methods for determining the
fracture toughness of rock. Int. J. Rock Mech. Min. sci. & Geomech. Abstr. 25, pp.71-96.
Khair, A.W., Reddy, N.P. and Quinn, M.K., 1989 Mechanisms of coal fragmentation by a
continuous miner, Mining Science and Technology, 8, pp.189-214.
Laugier, M.T., 1984 Hertzian indentation of sintered alumina, J. of Materials Science 19,
pp.254-258.
Laugier, M.T., 1985 Toughness determination of some ceramic tool materials using the
method of Hertzian indentation fracture J. of Materials Science Letters 4, pp. 1542-1544.
Lawn, B.R. and Swain, M.V., 1975 Microfracture beneath point indentations in brittle
solid, J. of Material Science, 10, pp.113-122.
Lawn, B.R. and Wilshaw, R. 1975a Review - Indentation fracture: principles and
applications, J. Mater. Sci. 10, pp. 1049-1081.
Lawn, B.R. and Wilshaw, T. R. 1975b Fracture of Brittle Solids, Cambridge University
Press, Cambridge.
Lawn, B.R., 1968, J. Appl. Phys. 39, p.4828.
Lawn, B.R., Evans, A.G. and Marshall, D.B., 1980 Elastic/plastic indentation damage in
ceramics: The median/radical crack crack system, J. A m . Ceram. Soc. 63, pp.574-581.
Lindqvist, P.A., 1984 Stress fields and subsurface crack propagation of single and multiple
rock indentation and disc cutting. Rock Mechanics and Rock Engineering 17, pp.7-112.
Love, A.E.H., 1929 The stress produced in a semi-infinite solid by pressure on part of the
boundary, Roy, Soc. Phil. Trans. 228, A, pp.377-420.
References R-7
Lynn, P.P. and Ingraffea, A.R., 1978 Transition elements to be used with quarter-point
crack-tip elements, Int. J. Num. Meth. Engrg. 12, 6, p. 1031.
Matti, J.K. and Smith, R.A., 1983 Comparison of the criteria for mixed mode brittle fracture
based on the preinstability stress-strain field, Part I: Slit and elliptical cracks under uniaxial
tensile loading, Int. J. Fracture 23, pp.281-295.
Matti, J.K. and Smith, R.A., 1984 Comparison of the criteria for mixed mode britde fracture
based on the preinstability stress-strain field, Part II: Pure shear and uniaxial compressive
loading, Int. J. Fracture, 24, pp.5 - 22.
Matti, J.K., 1980 Prediction of the path of unstable extension of internal and edge cracks, J.
of Strain analysis, Vol. 15 No. 4, pp. 183-194.
Maurer, W.C and Rinehart, J.S., 1960 Impact crater formation in rock, J. of Applied
Physics, Vol. 31, No.7, p. 1247.
Maurer, W.C, 1967 The state of rock mechanics knowledge in drilling, in Eighth
Symposium on Rock Mechanics, AIME, N e w York, pp.355-395.
McFeat - Smith, I., 1975 Correlation of rock properties and tunnel machine performance in
selected sedimentary rock, Ph.D. Thesis, University of Newcastle - upon - Tyne, p. 130.
Mellor, M and Hawkes, I, 1971 Measurement of tensile strength by diametral compression
of disc and annuli. Engng. Geol. 5, pp. 173-225.
Miller, R.J., 1974 Laboratory Analysis of small and Large scale cutting of rock for
improvement of tunnel boreability prediction and machine design, Ph.D Thesis, No. T1629,
Colorado School of Mines, Golden, Colo., USA.
Muskhelishvili, N., 1972 Some Basic Problems of Mathematical Theory of Elasticity,
Noordhoff, Groningen.
Nelson, P.P., Ingraffea, A.R. and O'Rourke, T.D., 1985 TBM performance and prediction
using rock fracture parameters, Int. J. Rock Mech. Min. Sci. & Geomech.Abstr., Vol. 22,
No. 3, pp. 189-192.
Newman, J.C, 1979 Stress intensity factors and crack opening displacements for round
compact specimens, N A S A T M 80174, Langley Research Centre, Oct.
References R-8
Newmeyer, G.E., 1981 Cost of the black lung program, Mining Congr. J., 67(11), pp.74-
75.
Nishimatsu, Y., 1972 The mechanics of rock cutting, Int. J. Rock Mech. Min. Sci., Vol. 9,
pp.261- 270.
O'Rielly, M.P., Roxborough, F.F., and Hignett, H.J., 1976 Programme of laboratory pilot
and full-scale experiments in tunnel boring, Tunnelling'76, I M M , London, pp.287-299.
Ouchterlony, F., 1989 On the background to the formula and Accuracy of rock fracture
toughness Measurements using I S R M standard core specimens. Int. J. Rock Mech. Min.
sci. & Geomech. Abstr. 26, No. 1, pp. 13-23.
Ouchterlony, F., 1980 A new core specimen for the fracture toughness testing of rock, DS
1980:17, Swedish Detonic Research Foundation (SveDeFo), Stockholm, Sweden, p. 18.
Ozdemir, L. and Dollinger, G.L., 1984 Recent developments in mechanical and water jet
assisted tunnel boring technology for civil and mining engineering applications, Design and
Performance of underground excavations, ISRM/BGS, Cambridge, pp.295-303.
Ozdemir, L., 1975 A laboratory and field investigation of tunnel boreability, Master of
Science Thesis, No. T1755, Colorado School of Mines, Golden, Colo., USA.
Paul, B. and Gangal, M.D., 1969 Why compressive loads on drill bits produce tensile
splitting in rock, SPE 2392, Proc. Fourth Conf. on Drilling and Rock Mech., University of
Texas at Austin 109.
Paul, B. and Sikarskie, D.L., 1965 A preliminary theory of static penetration by a rigid
wedge into a brittle material, A I M E Transactions 232, pp.372-383
Phillips, H.R., Bilgin, N. and Price, D.C, 1978 The influence of type tip geometry on the
design of disc cutter arrays, 3rd Australian Tunnelling Conf., Australian Institute of Mining
and Metallurgy, Melbourne, pp.48-52.
Potts, E.J. and Shuttleworth, P., 1959 A study of the ploughability of coal, with special
reference to the effects of blade shapes, direction of planning to the cleat, planning speed and
the influence of water infusion, Trans. Inst. Min. Engr., London, Vol. 117, pp.520-548.
Protodyakonov, M.M., 1962 Mechanical properties and drillability of rocks, in 5th
Symposium on Rock Mechanics, University of Minnesota, pp. 103-118.
References R-9
Rabia, H. and Brook, N., 1981 The effects of apparatus size and surface area of charge on
the impact sterngth of rock, Int. J. Rock Mech. Min. Sci. &Geomech.Abstr., 18, pp. 211-
219.
Reichmuth, P.R., 1963 Correlation of force and displacement data with physical rock
properties for percussive drilling systems, Rock Mechanics, pp.33-57.
Rice, J.R., 1962 A path-independent integral and the approximate analysis of strain
concentration by notches and cracks. J. Appl. Mech. 35,379.
Rongved, L. and Murray Hill, N.J., 1957 Dislocation over a bounded plane area in an
infinite solid, J. of Applied Mechanics, pp.252-254.
Roxborough, F.F. and Phillips, G., 1975 Rock Excavation by Disc Cutter, Int. J. of Rock
Mechanics and Mining Science, Vol.12.
Roxborough, F.F., 1973a Cutting rock with picks, The Mining Engineer, pp.445-452.
Roxborough, F.F., 1973b The mechanical cutting characteristics of the lower chalk, Tunnels
and Tunnelling, Vol. 1, pp.44-67.
Roxborough, F.F., 1981 Applied rock and coal cutting mechanics, Workshop Course,
Australian Mineral Foundation Inc.
Roxborough, F.F., 1986 A review of research progress in coal and rock cutting, The coal
Journal, No. 13, pp.37-48.
Saouma, V.E. and Kleinosky, M. J., 1984 Finite mechanics applied to rock - A fracture
mechanics approach, 25th U.S. Symposium on Rock Mechanics, pp.792-799.
Schmidt, R.A., 1976 Fracture toughness testing of Limestone, Exp. Mech. 16, pp.161-
167.
Schultz, R.A., 1988 Stress intensity factors for curved cracks obtained with the
displacement discontinuity method, Int. J. Fracture 37, R31-R34.
Shih, C F., de Lorenzi, H.H. and German, M.D. 1976 Crack extension modelling with
singular quadratic isoparametric elements. Int. J. of Fracture 12, pp.647-651.
Sih, G.C, 1973a Some basic problems in fracture mechanics and new concepts,
Engrg.Fracture Mech. 5, pp.365-377.
References R-10
Sih, G.C, 1973b Handbook of Stress Intensity Factors, Lehigh University, Bethlehem,
Pennsylvania.
Sikarskie, D.L. and Cheatman, J.B., Jr., 1973 Penetration problems in rock mechanics, in
Eleventh Symposium on Rock Mechanics, AIME, New York, pp.41-71.
Singh, R. N. and Pathan, A. G. 1988 Fracture toughness of some British rocks by
diametral loading of discs, Mining Science and Technology, 6, pp.179-190.
Sneddon, I.N., 1946 Boussinesq's problem for a flat-ended cylinder, Cambridge Phil. Soc.
Proc. 42.
Snowdon, R.A., Reley, M.D. and Temporal, J.A., 1982 A study of disc cutting in selected
British rocks, Int. J. Rock Mech. Min. Sci. & Geomech. Abstr. 19, pp.107-121.
Snowdon, R.A., Reley, M.D., Temporal, J. and Crabb, G.I., 1983 The effect of hydraulic
stiffness on tunnel boring machine performannce, Int. J. Rock Mech. Min. Sci. &
Geomech. Abstr. pp.203-214.
Snyder, M.D. and Cruse, T.A., 1975 Boundary-integral equation analysis of cracked
anisotropic plates, Int. J. Fracture 11(2), pp.315-328.
Sokolnikoff, I.S., 1956 Mathematical theory of elasticity, McGraw-Hill, New York, 2nd
edn.
Stakgold, I., 1968 Boundary Value Problems of Mathematical Physics, The Macmillan
Company, N e w York, p. 149.
Stein, R.R. and Martin, T.W., 1989 Coal mining equipment, Mining Engineering, May,
p.338.
Swain, M.V. and Lawn, B.R. 1976 Indentation fracture in brittle rocks and glasses, Int. J.
Rock Mech. Min. Sci. & Geomech. Abstr. 13, pp.311-319.
Swedlow, J.L., 1975 Criteria for growth of the angled crack, Crack and Fracture,
Proceedings of the Ninth National Symposium in Fracture Mechanics, The University of
Pittsburgh, pp.506-521.
Szendi-Hovrath, G., 1980 Fracture toughness determination on brittle materials using small
to extremely small specimens, Engineering Fracture Mechanics, Vol. 13, pp.955-961.
References R-11
Szendi-Hovrath, G., 1982 O n the fracture toughness of coal, The Australian J. of Coal
Mining Technology and Research, No.2, pp.51-57.
Szlavin, J., 1974 Relationships between some physical properties of rock determined by
laboratory tests, Int. J. Rock Mech. Min. Sci. 11, pp.57-66
Tandanand, S. and Unger, H.F., 1975 Drillability determination - a drillability index of
percussive drills, Bureau fo Mines, RI 8073.
Tarkoy, P.J. 1974 Rock index properties to predict tunnel boring machine penetration rates.
Rept to NSF. No. NSFG136468-PB239 644, p.68.
Teale, R., 1965 The concept of specific enrgy in rock drilling, Int. J. Rock Mech. Min. Sci.
2, pp.57-73.
Timoshenko, S.P. and Goodier, J.N., 1970 Theory of Elasticity, McGraw-Hill, New York,
p.242.
Tracey, D.M., 1975 Finite elements for determination of crack tip elastic stress intensity
factors, Engng. Fracture Mech. 3, p.255.
Wagner, H. and Schumann, E.H.R., 1971 The stamp-load bearing strength of rock, An
experimental and theoretical investigation, Rock Mechanics 3, pp. 185-207.
Wan, F.D., Ozdemir, L. and Snyder, L., 1978 Prediction and verification of tunnel boring
machine performance. Euro. Tunnel, Basel, Switzerland.
Wang, J.K. and Lehnoff, T.F., 1976 Bit penetration into rock - A finite element study, Int.
J. Rock Mech. Min. Sci. and Geomech. Abstr. 13, pp.11-16.
Warren, R, 1978 Measurement of the fracture properties of brittle solids by Hertzian
Indentation, Acta Metallurgies Vol. 26, pp. 1759-1769.
Warren, R., 1978 Measurement of the fracture properties of brittle solids by Hertzian
indentation, Acta Metallurgica, Vol. 26, pp. 1759-1769.
Watwood, V.B., 1969 The finite element method for prediction of crack behaviour, Nuclear
Engrg. Des. 11, pp.323-332.
Wijk, G., 1989 The stamp test for rock drillability classification, Int. J. Rock Mech. Min.
Sci. & Geomech. Abstr. Vol.1, pp.37-44.

References R-12
Williams, I., Tonegato, S. and Wood, M., 1986, Investigation into roof bolt drilling,
University of Wollongong, Mining Research Centre Report, June.
Williams, M.L., 1957 On the stress distribution at the base of a stationary crack, J. Appl.
Mech. 24, pp. 109-114.
Zip Jr., R.K. and Bieniawski, Z.T., 1989 A fundamental study of respirable dust generation
in coal, Mining Science and Technology, 9, pp.87-99.