Embed Size (px)
Citation preview
Engineering Fracture Mechanics 78 (2011) 205–225
Contents lists available at ScienceDirect
Engineering Fracture Mechanics
journal homepage: www.elsevier .com/locate /engfracmech
Microstructural effects on ductile fracture in heterogeneousmaterials. Part I: Sensitivity analysis with LE-VCFEM
Daniel Paquet, Somnath Ghosh *
Department of Mechanical Engineering, The Ohio State University, 201 West 19th Avenue, Columbus, OH 43210, United States
a r t i c l e i n f o
Article history:Available online 18 July 2010
Keywords:Rate-dependent ductile fractureHeterogeneous materialsSensitivity analysisLE-VCFEM
0013-7944/$ - see front matter � 2010 Elsevier Ltddoi:10.1016/j.engfracmech.2010.07.009
* Corresponding author. Tel.: +1 614 292 2599; faE-mail address: [email protected] (S. Ghosh).
a b s t r a c t
Ductile failure of heterogeneous materials, such as cast aluminum alloys and discretelyreinforced aluminums or DRA’s, initiates with cracking, fragmentation or interface separa-tion of inclusions, that is followed by propagation in the matrix by a ductile mechanism ofvoid nucleation and growth. Damage localizes in bands of intense plastic deformationbetween inclusions and coalesces into a macroscopic crack leading to overall failure. Duc-tile fracture is very sensitive to the local variations of the microstructure morphology. Thisis the first of a two part paper on the effect of microstructural morphology and propertieson the ductile fracture in heterogeneous ductile materials. In this paper the locally enhancedVoronoi cell finite element method (LE-VCFEM) for rate-dependent porous elastic–viscoplas-tic materials is used to investigate the sensitivity of strain to failure to loading rates, micro-structural morphology and material properties. A model is also proposed for strain tofailure, incorporating the effects of important morphological parameters.
� 2010 Elsevier Ltd. All rights reserved.
1. Introduction
Ductile failure in metals and alloys containing heterogeneities such as particulates, fibers or precipitates, generally initi-ates at the heterogeneity with fragmentation or interface separation. Subsequently, the microstructural damage propagatesinto the matrix by mechanisms of void growth. Often, the damage localizes in bands of intense plastic deformation betweenheterogeneities, which subsequently coalesce into macroscopic cracks leading to complete failure. Experimental studies onductile failure have shown strong connections between the microstructural morphology and damage nucleation and growth.A robust understanding of the influence of the microstructure on ductile fracture is essential for material design.
A variety of experimental studies have been undertaken on the influence of morphology on ductile failure, particularlyrelated to cast aluminum alloys and DRA’s [1–12]. In their studies on cast aluminum alloys, Caceres et al. [13,14,6,15–17]have shown that ductility of the Al–7%Si–0.4%Mg cast alloy depends on both the dendrite cell size and the size and shapeof silicon inclusions. While these experimental studies offer good qualitative understanding, they do not quantify the influ-ence of microstructure parameters on ductile fracture. Often, the difficulty arises with isolating the effect of individual mor-phological parameters like shape, size or spatial distribution [15]. Analytical and computational models have beenimplemented for fulfilling this need. Computational studies have been conducted to study elastic–plastic deformation andductile failure of heterogeneous materials in [18–24]. A majority of these are unit cell models with size scales exceeding1 lm, that use continuum micromechanics for modeling inclusions and matrix [25]. There is a paucity of image-based mod-els that consider aspects of the real microstructural morphology, such as non-uniformities in inclusion shape, size, orienta-tion and spatial distribution. The predictive capability of unit cell models for failure properties is very limited due to
. All rights reserved.
x: +1 614 292 7369.
Nomenclature
a, b inclusion major and minor axesd inclusion size d ¼ 2
ffiffiffiffiffiffiabp
�d inclusion normalized size �d ¼ d=LMD
e macroscopic strain tensorE Young’s modulusf0 initial void volume fractionL material characteristic lengthLMD characteristic length of microstructural domainm Weibull modulus for crack initiation criterionN work-hardening exponentPcr
frag critical probability for cracking of inclusionsv0 reference volume for crack initiation criterionVf inclusion volume fractiona inclusion aspect ratio a = a/bc0 viscosity constant� microscopic strain tensor�fail strain to failureh inclusion orientationi cluster contour indexj cluster indexm Poisson’s ratioq inclusion roundness q = b/ar microscopic stress tensorrmax maximum tensile strengthrw characteristic strength of inclusionsry initial yield stress of the underlying matrix without voidsr0 yield stress of the underlying matrix without voidsR macroscopic stress tensor
AbbreviationsClus-1 single cluster hard coreClus-3 triple cluster hard coreDOF degree of freedomDRA discretely reinforced aluminumGTN Gurson–Tvergaard–NeedlemanHC hard coreLE-VCFEM locally enhanced Voronoi cell finite element modelMAF mean local area fractionMNND mean near neighbor distanceMPD minimum permissible distanceMPD-CL cluster minimum permissible distanceSDAF standard deviation of local area fractionSDNND standard deviation of near neighbor distanceSEM scanning electron microscopyVCFEM Voronoi cell finite element method#CL number of clusters#INC number of inclusions#INC-CL number of inclusions in cluster
206 D. Paquet, S. Ghosh / Engineering Fracture Mechanics 78 (2011) 205–225
over-simplification of the microstructure. Quite often, critical local features necessary to model strain to failure are lost inthese models. Ductile fracture depends strongly on the extreme values of microstructural characteristics, e.g. nearest neigh-bor distances, highest local volume/area fraction, etc. and computational models must feature some of these characteristicsfor accuracy. Additionally, many of the existing studies have focused only on the initial stages of ductile damage, e.g. cracknucleation in the inclusions, and have not considered evolution of ductile failure by matrix void growth and coalescence.
Computational models developed by Ghosh et al. [26–32] have focused on more realistic representation of microstruc-tures with non-uniform dispersion of heterogeneities. The microstructural Voronoi cell finite element model or VCFEM byGhosh et. al. [26–31] offers significant promise for accurate micromechanical analysis of arbitrary heterogeneous micro-structures with high efficiency. Morphological non-uniformities in dispersions, shapes and sizes, obtained from micrographsare readily modeled by this method [33]. This method has been extended in the locally enhanced VCFEM (LE-VCFEM) [32] to
D. Paquet, S. Ghosh / Engineering Fracture Mechanics 78 (2011) 205–225 207
model ductile fracture in heterogeneous microstructures. In LE-VCFEM, the stress-based hybrid VCFEM formulation is adap-tively enhanced in regions of localized plastic flow to model stages of ductile fracture, from inclusion fragmentation to ma-trix cracking in the form of void nucleation, growth and coalescence. These regions are overlaid with finite deformation,displacement-based elements to accommodate strain softening in the constitutive behavior. LE-VCFEM has been demon-strated to be quite effective for simulating ductile fracture in [32].
This is the first of a two part paper on the effect of microstructural morphology and properties on ductile fracture in het-erogeneous materials. In this part, extensive sensitivity studies are conducted with results of LE-VCFEM based micromechan-ical analyses of rate-dependent porous elastic–viscoplastic materials, to quantify the effects of loading rates, microstructuralmorphology and material properties on strain to failure. Based on the sensitivity study, a model is proposed for strain to fail-ure, incorporating the effects of important morphological parameters. The 2D locally enhanced VCFEM is extended to rate-dependent porous elastic–viscoplastic materials in Section 2. In Section 3, sensitivity analyses with LE-VCFEM simulationsare used to study the quantitative effect of applied strain rate, inclusion volume fraction, size, shape, orientation and spatialdispersion, as well as material properties on ductile fracture.
2. Locally enhanced VCFEM for ductile failure of heterogeneous rate-dependent ductile materials
In the locally enhanced Voronoi cell finite element model or LE-VCFEM [32], inclusions in a 2D microstructural section areassumed to be elastic and undergoing brittle fracture, while the matrix is represented by a pressure-dependent elasto-plasticmodel for porous materials undergoing ductile fracture. The assumed stress hybrid VCFEM formulation is modified in LE-VCFEM to admit local softening by the adaptive enrichment of critical regions of localized damage with displacement ele-ments. Details of the LE-VCFEM formulation for ductile fracture of rate-independent microstructures are provided in [32].In this paper, the LE-VCFEM formulation is extended to rate-dependent porous elastic–viscoplastic matrix materials. Rate-dependent models are important for modeling load conditions at elevated temperatures and high strain rates. The LE-VCFEMformulation for pressure-dependent elasto-viscoplastic porous material is discussed in this section.
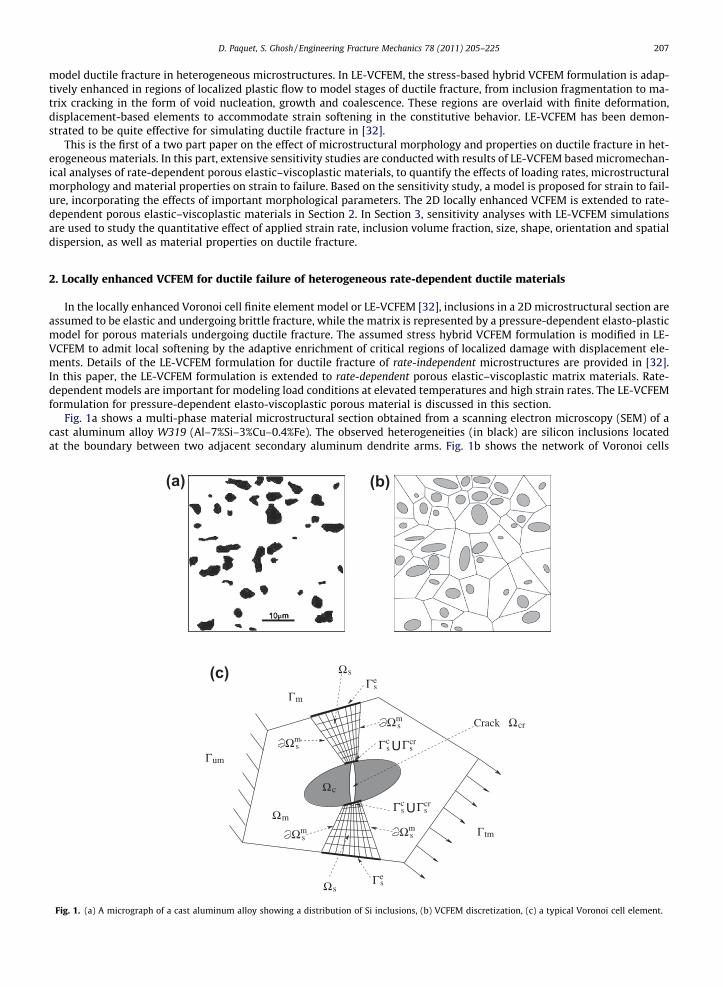
Fig. 1a shows a multi-phase material microstructural section obtained from a scanning electron microscopy (SEM) of acast aluminum alloy W319 (Al–7%Si–3%Cu–0.4%Fe). The observed heterogeneities (in black) are silicon inclusions locatedat the boundary between two adjacent secondary aluminum dendrite arms. Fig. 1b shows the network of Voronoi cells
(a) (b)
Ωs
Ωs
Ωm
Γm
Γum
Γtm
ΩcrCrack
Ωc
Γse
Γse
Ω sm
Ω sm Ω s
m
ΓcsUΓs
cr
Ω sm
ΓcsUΓs
cr
(c)
Fig. 1. (a) A micrograph of a cast aluminum alloy showing a distribution of Si inclusions, (b) VCFEM discretization, (c) a typical Voronoi cell element.
208 D. Paquet, S. Ghosh / Engineering Fracture Mechanics 78 (2011) 205–225
obtained by a tessellation process that takes into account the location, size and shape of inclusions [34]. Each cell representsthe immediate neighborhood of an inclusion. The matrix and inclusion phases in each Voronoi cell are designated as Xm andXc respectively as in Fig. 1c, while the inclusion crack phase is labeled as Xcr. Each Voronoi cell, containing the inclusionand crack phases in the matrix, is designated as an element in the Voronoi cell finite element (VCFE) formulation.Thus, Xe = Xm [Xc [Xcr. The element boundary oXe is assumed to be comprised of a prescribed traction boundary Ctm, aprescribed displacement boundary Cum, and an inter-element boundary Cm, i.e. oXe = Ctm [ Cum [Cm. The VCFEM formula-tion is based on an assumed stress hybrid formulation as detailed in [26].
In ductile fracture, inclusion cracking is followed by localization in ligaments of intense void evolution that results in atransition of the local stress–strain response from a strain hardening to a strain softening behavior. The assumed stress-based VCFEM formulation faces numerical instabilities associated with strain non-uniqueness in this regime. This can causeconvergence problems, especially near the peak of the stress–strain curve, corresponding to the onset of softening. To avertinstabilities, the stress-based VCFEM formulation adaptively incorporates a patch of high resolution displacement-based fi-nite element in the strain softening region Xs of the matrix Xm in a Voronoi cell element [32]. This region is shown in Fig. 1c.Finite deformation porous elasto-viscoplasticity formulation governs the behavior of displacement-based elements in Xs.oXs is the boundary of Xs and may consist of four distinct regions, depending on its overlap with pre-existing topologicalregions in the Voronoi cell element, i.e. @Xs ¼ Ce
s
SCc
s
SCcr
s
S@Xm
s . Here Ces ¼ @Xe \ @Xs, Cc
s ¼ @Xc \ @Xs and Ccrs ¼ @Xcr\
@Xs represent the intersections of oXs with the element, inclusion and crack boundaries respectively. The aggregate of thesecommon boundaries is represented as Cs ¼ Ce
s
SCc
s
SCcr
s .Once the displacement-based local finite element region Xs is overlaid, a mapping procedure described in [35] is used to
transfer local stresses, strains and material internal variables from the Voronoi cell element domain Xe to displacement ele-ments in Xs. Superscript s labels variables associated with Xs. The mapping should guarantee displacement compatibility onthe shared boundaries Cs between the stress and displacement interpolated regions as shown in Fig. 1c, i.e.
us ¼ u on Ces ; us ¼ u0 on Cc
s ; us ¼ u00 on Ccrs ð1Þ
Here u, u0
and u00
are the displacements DOF’s on the boundaries oXe, oXc and oXcr respectively.
2.1. Constitutive and damage relations for inclusion and matrix phases in each voronoi cell
2.1.1. Inclusion phaseThe inclusion phase in each Voronoi cell element is assumed to be isotropic, linear elastic. Instantaneous cracking of an
inclusion is assumed once a crack initiation criterion is satisfied at a point. A Weibull distribution based initiation criterionhas been shown to represent experimental results accurately in [30,33]. In this criterion, a crack initiates when the proba-bility function Pfrag at any point in the inclusion exceeds a critical value. The probability function is defined as:
Pfrag v ;rcI
� �¼ 1� exp � v
v0
rcI
rw
� �m� �ð2Þ
where m and rw are the Weibull modulus and the characteristic strength respectively and v0 is a reference volume thatscales with the microstructure. The probability function incorporates the inclusion size v and the maximum principal stressrc
I in its interior. The introduction of inclusion size v in Eq. (2) follows experimental observations that larger inclusions havelower strengths due to a higher probability of having defects. The critical probability is taken to be Pcr
frag ¼ 95%. Once thiscriterion is met, a high aspect ratio elliptical crack is introduced at this point. An aspect ratio of a/b = 10 has been estimatedto provide adequate resolution in representing inclusion splitting in [31]. Instantaneous inclusion splitting has been modeledin [30,33]. In this model, the ellipse extends slightly beyond the boundary of the inclusion from the point of initiation, man-ifesting complete inclusion splitting. The principal axis of this elliptical crack is normal to the direction of the maximumprincipal stress at the point.
2.1.2. Matrix phaseThe matrix phase in each Voronoi cell element is modeled as a rate-dependent elastic–viscoplastic material containing
microscopic voids. The corresponding matrix phase constitutive equations are developed as a rate-dependent viscoplasticityextension of the conventional rate-independent Gurson–Tvergaard–Needleman (GTN) model in [36–38]. In this constitutivemodel, the total strain rate is assumed to admit an additive decomposition into an elastic and viscoplastic part as:
_� ¼ _�e þ _�p ð3Þ
For small elastic strains, the rate of Cauchy stress _r is related to the elastic part of the strain rate tensor as: _r ¼ Ce : _�e, whereCe is the fourth order isotropic elasticity tensor. The viscoplastic behavior of the porous ductile matrix is governed by theGTN yield function [39,40,37], given as:
/vp ¼ q�rM
� �2
þ 2f �q1cosh �3q2p2�rM
� �� ð1þ q3f �2Þ ¼ 0 ð4Þ
D. Paquet, S. Ghosh / Engineering Fracture Mechanics 78 (2011) 205–225 209
where q ¼ffiffiffiffiffiffiffiffiffiffiffiffiffiffiffiffi32 r0 : r0
qand p ¼ � 1
3 r : I are the Von-Mises equivalent stress and the hydrostatic pressure respectively, r0is the
deviatoric stress, f* is a function of the void volume fraction f expressed in Eq. (20), and q1, q2, q3 are void growth relatedparameters introduced in [40]. The denominator �rM is the equivalent stress acting in the pure underlying matrix withoutvoids. The subscript M is used to designate association with the pure underlying matrix without voids. Deformation inthe matrix material is assumed to be governed by the viscoplastic over-stress model of Perzyna [41]. In this model, the visco-plastic strain rate is expressed in terms of a function UM(F) of the over-stress F as (see [42]):
_�pM ¼ c0hUMðFÞi
@�rM=@rM
k@�rM=@rMkð5Þ
where c0 is a temperature dependent viscosity coefficient and h i is the MacCauley operator. A constant valuec0 = 10 GPa�1 s�1 is used for the sensitivity study of this paper. The viscoplastic strain rate in Eq. (5) follows the associatedflow rule and hence satisfies normality and incompressibility conditions. The over-stress F corresponds to the measure ofexcess loading stress over the rate-independent local yield strength r0 (an internal state variable), i.e.
F ¼ �rM � r0ðWpÞ ð6Þ
Here Wp is the inelastic work and �rMð¼ffiffiffiffiffiffiffiffiffiffiffiffiffiffiffiffiffiffiffiffi32 r0M : r0M
qÞ in Eq. (4) is the effective matrix stress. The function UM(F) may be cho-
sen according to the material being modeled and the experimental conditions. In [41,42] a power law expression, i.e.UM(F) = Fp has been discussed to adequately represent the behavior of most metals. The set of viscoplastic constitutive equa-tions for the matrix material is complete with the evolution law of the yield strength r0. A linear hardening law, in which the
rate of evolution of r0 linearly depends on the matrix equivalent plastic strain rate _��pM ¼
ffiffiffiffiffiffiffiffiffiffiffiffiffiffiffiffiffiffiffi23
_�pM : _�p
M
q , is assumed, i.e.:
_r0 ¼ hðWpÞ _��pM ð7Þ
where h(Wp) is the instantaneous plastic modulus. Using Eq. (5), the equivalent plastic strain rate _��pM can be expressed in
terms of the over-stress function as:
_��pM ¼
ffiffiffi23
rc0hUMðFÞi ð8Þ
Returning to the rate-dependent porous plasticity equations governing the porous matrix material behavior in each Voro-noi cell element, the overall plastic strain rate is derived from the associated flow rule as:
_�p ¼ _k@/vp
@rð9Þ
where _k is a viscoplastic multiplier that can be derived in terms of the matrix plastic strain rate _�pM . Assuming that the Hill-
Mandel micro-macro energy condition [43] governs homogenization conditions for the porous matrix material, the rate ofdissipative energy in the porous matrix material can be expressed as the product of the local equivalent stress �rM and equiv-alent strain rate _��p
M [44], i.e.
r : _�p ¼ rM : _�pM ¼ ð1� f Þ�rM
_��pM ð10Þ
The overbar in Eq. (10) corresponds to the ensemble average over a representative volume element. The viscoplastic multi-plier _k may then be obtained by substituting the flow rule (9) into the energy Eq. (10) as:
_k ¼ ð1� f Þffiffiffi23
r�rM
r : @/vp
@r
c0hUMðFÞi ð11Þ
The resulting flow rule is stated as:
_�p ¼ ð1� f Þffiffiffi23
r�rM
r : @/vp
@r
c0hUMðFÞi@/vp
@rð12Þ
The rate of evolution of the local macroscopic void volume fraction f is divided into growth and nucleation parts, as dis-cussed in [36–38], as:
_f ¼ _f growth þ _f nucleation ð13Þ
The matrix void growth rate due to the dilatation is written as:
_f growth ¼ ð1� f Þ _�pkk ð14Þ
This expression accounts for plastic incompressibility in the underlying matrix. The rate of plastic strain controlled voidnucleation is expressed in terms of the effective plastic strain ��p
M in the underlying matrix [36] as:
_f nucleation ¼ A ��pM
� �_��p
M ð15Þ
210 D. Paquet, S. Ghosh / Engineering Fracture Mechanics 78 (2011) 205–225
where
A ��pM
� �¼ fN
sN
ffiffiffiffiffiffiffi2pp exp �1
2��p
M � �N
sN
� �2" #
ð16Þ
Here �N is the mean nucleation strain, sN is its standard deviation, and fN is the intensity of void nucleation.The rate-dependent porous plasticity model does not incorporate a material length scale, and hence numerical simula-
tions of ductile fracture exhibit mesh sensitivity. To avoid this pathological shortcoming, a non-local evolution equationfor the void volume fraction has been proposed in [38]. In this formulation, the non-local growth rate of the void volumefraction at a material point �x is given as:
_f non-local ¼ 1Wð�xÞ
ZXm
_f ðxÞwðjx� �xjÞdX ð17Þ
where
Wð�xÞ ¼Z
Xm
wðjx� �xjÞdX and wðjxjÞ ¼ 11þ ðjxj=LÞp� �q
ð18Þ
Here p = 8, q = 2 and L > 0 is a material characteristic length, which regularizes the localization problem. The weightingfunction w(jxj) = 1 at jxj = 0, w(jxj) = 0.25 at jxj = L and w(jxj) ? 0"jxj > L with a narrow transition region. Non-locality isassociated with spatial gradients of _f . Evolution of the local void volume fraction f is expressed in terms of its non-localrate _f non-local as:
f,f0 þZ
df non-local ð19Þ
where f0 is the inital void volume fraction in the matrix.Finally, an acceleration function f* is introduced in Eq. (4) to model the complete loss of material stress carrying capacity
due to void coalescence [37] as:
f � ¼f f 6 fc
fc þ f �u�fc
ff�fcðf � fcÞ f > fc
(ð20Þ
fc is the critical void volume fraction at which void coalescence first occurs and ff is the value at final failure. As the void vol-ume fraction f ? ff, the acceleration function f � ! f �u ¼ 1=q1. At this value, the yield surface shrinks to a point manifestingloss of material load capacity. To avoid numerical difficulties, f ? 0.95ff is used in Eq. (20). The value of f is frozen once itreaches 0.95ff at an element quadrature point, implying local ductile material failure.
2.1.3. Finite deformation constitutive relations for the enhanced region Xs
Finite deformation kinematics and constitutive laws are considered for the locally enhanced matrix region Xs 2Xm in aVoronoi cell element undergoing strain localization (see Fig. 1). The finite deformation formulation of the rate-dependentporous plasticity constitutive relations follows a framework developed in [42]. In this formulation, the constitutive relationsare written in a rotated Lagrangian system in terms of the rotated Cauchy stress tensor rs
R ¼ RTrsR and the rotated rate ofdeformation tensor Ds
R ¼ RT DsR, as described in [45]. Here R is a proper orthogonal tensor representing a pure rotation ob-tained from the polar RU decomposition of the deformation gradient tensor Fs =r0xs, where the subscript 0 refers to thereference configuration.
2.2. Time integration schemes for strain and stress updates in the voronoi cell element
Voronoi cell element partitioning into subregions Xs and Xm0 ¼ Xm nXs requires different integration schemes for therate-dependent plasticity constitutive relations in the two subregions. In the stress interpolated region of the matrixXm0 ¼ Xm nXs, an implicit strain update algorithm is implemented using the Newton–Raphson method. In the enhanced sub-domain Xs with displacement interpolated elements, a stress update algorithm is used. These algorithms are briefly dis-cussed next.
2.2.1. Strain update algorithm for the stress interpolated subdomain Xm0
An implicit strain update algorithm is developed for Xm0 using the unconditionally stable backward Euler algorithm. Theincremental update method considers small strain kinematics for the generalized plane strain condition. With prescribed in-plane stress increments Drij, (i, j = 1,2) and incremental out-of-plane strain D�33, the algorithm computes increments in thetotal strain D�ij, (i, j = 1,2), plastic strain D�p
ij; ði; j ¼ 1;2;3Þ, out-of-plane stress Dr33, as well as the state variables f, r0, and ��pM .
By expressing the constitutive relations in terms of the hydrostatic stress p and the equivalent stress q, the strain updatealgorithm can be reduced to a three-parameter nonlinear problem. The corresponding three nonlinear equations, used to
D. Paquet, S. Ghosh / Engineering Fracture Mechanics 78 (2011) 205–225 211
solve the system are derived from the flow rule, the viscoplastic law and the generalized plane strain condition as enumer-ated below.
(1) Rate-dependent flow rule: Eq. (9) can be divided into hydrostatic and deviatoric parts as:
_�p ¼ _k@/vp
@r¼ _k �1
3@/vp
@pIþ @/
vp
@qn
� �ð21Þ
where n ¼ 32q r
0 is a unit normal tensor representing the flow direction of the deviatoric plastic strain, and the stress is
decomposed into hydrostatic and deviatoric parts as r ¼ �pIþ 23 qn. The strain rate in Eq. (21) is integrated in the time
step Dt between tn and tn+1 by the backward Euler algorithm, as:
D�p ¼ 13
D�pIþ D�qnnþ1 ð22Þ
All quantities in the backward Euler algorithm are evaluated at the end of the increment at tn+1, yielding:
D�p ¼ �Dk@/vp
@p
� �nþ1
and D�q ¼ Dk@/vp
@q
� �nþ1
ð23Þ
Eliminating Dk from the two expressions in Eq. (23) leads to:
D�p@/vp
@q
� �nþ1
þ D�q@/vp
@p
� �nþ1
¼ 0 ð24Þ
(2) Viscoplastic law: Integrating Eq. (11) for the increment of viscoplastic multiplier, i.e. Dk ¼ Dt _knþ1, and incorporatingthe second relation in (23) results in:
D�q � Dk@/vp
@q
� �nþ1
¼ 0 ð25Þ
(3) Generalized plane strain condition: This condition is expressed with a specified out-of-plane normal strain increment,i.e. D�33 ¼ D�e
33 þ D�p33 ¼ �̂constant . Substituting the expression for D�e
33 from the generalized Hooke’s law into the planestrain condition and using Eq. (22), yields (see [32]):
1E
Dr33 � mDr11 � mDr22ð Þ þ Dk �13@/vp
@pþ 3r033
2q@/vp
@q
� �nþ1
� �̂constant ¼ 0 ð26Þ
where m and E are the Poisson’s ratio and Young’s modulus respectively. The expressions of D�p or D�q in Eq. (23) maybe used to eliminate the plastic multiplier Dk.
At each integration point in Xm0 , Eqs. (24)–(26) are iteratively solved for D�p, D�q, and Dr33 using the Newton–Raphsonmethod. Specifically three nonlinear algebraic equations
Ai1cp þ Ai2cq þ Ai3cr ¼ bi i ¼ 1;2;3 ð27Þ
are solved for the iterative correction parameters cp, cq and cr to the solution variables D�p, D�q and Dr33. The coefficients Aij
and bi are given in Appendix A. The state variables are then updated using the evolution equations:
Df ¼ ð1� f ÞD�p þ AD��pM; Dr0ðWpÞ ¼ hðWpÞD��p
M ð28Þ
where the increment of equivalent matrix plastic strain is expressed as:
D��pM ¼�pD�p þ qD�q
ð1� f Þ�rMð29Þ
Finally, the increment of the total strain tensor is computed as D� = D�e + D�p. The increment D�e is obtained from elasticityrelations at tn+1 and D�p is calculated from Eq. (22).
2.2.2. Stress update algorithm for the displacement interpolated subdomain Xs
Finite deformation rate-dependent porous plasticity constitutive relations in Xs are integrated by a rate-dependent finitedeformation extension of the backward Euler algorithm proposed in [46]. The rotated Cauchy stress is updated in the incre-ment Dt between configurations Xn
s and Xnþ1s as:
212 D. Paquet, S. Ghosh / Engineering Fracture Mechanics 78 (2011) 205–225
rsR
� �nþ1 ¼ rsR
� �n þ DrsR ¼ rs
R
� �n þ Ce : D�seR ð30Þ
¼ rsR
� �n þ Ce : D�sR � D�sp
R
� �¼ rse
R � Ce : D�spR
The superscript s is associated with the subdomain Xs. The elastic predictor for this integration algorithm is defined as:
rseR ¼ rs
R
� �n þ Ce : D�sR ð31Þ
Here D�seR ¼ Dt Dse
R
� �nþ1 and D�spR ¼ Dt Dsp
R
� �nþ1 are increments of the rotated elastic and plastic strain tensors respectively. Therotated stress increment Drs
R is calculated using an update algorithm, corresponding to a known increment in the strain ten-sor D�s, which is related to the rotated strain increment as:
D�sR ¼ ðR
TÞnþ1D�sRnþ1 ð32Þ
¼ ðRTÞnþ1 12
@Dus
@x
� �þ @Dus
@x
� �T( )
Rnþ1
Dus corresponds to the displacement increment in the interval. The stress increment is obtained by solving the nonlinearconstitutive relations of Section 2.1.2 in the rotated Lagrangian coordinates.
With known in-plane strain increments D�sij; ði; j ¼ 1;2Þ and the incremental out-of-plane strain D�s
33, the following vari-ables are evaluated in the time increment tn+1 � tn.
(1) Increments of in-plane stress components Drsij; i; j ¼ 1;2.
(2) Increments of out-of-plane stress Drs33.
(3) Increments of plastic strain tensor D�spij .
(4) Internal variables f, r0 and ��pM .
The dependence of the constitutive relations on the stress tensor can be reduced to dependence on the hydrostaticpressure ps
R and equivalent stress qsR in the rotated Lagrangian system. Consequently, the stress update algorithm can be
reduced to a two-parameter nonlinear problem involving the hydrostatic and deviatoric parts of the constitutive relations.The generalized plane strain condition need not be added as a third equation, since it is automatically enforced asD�s
33 ¼ �̂constant .The rotated Cauchy stress rs
R
� �nþ1 is related to hydrostatic and deviatoric components of the incremental rotated plasticstrain D�Rp and D�Rq by substituting Eq. (22) in Eq. (30) and expressing the elasticity tensor in terms of the shear and bulkmoduli as Ce
ijkl ¼ 2Gdikdjl þ K � 23 G
� �dijdkl. This yields:
rsR
� �nþ1 ¼ rseR � KD�RpI� 2GD�Rq ns
R
� �nþ1 ð33Þ
The deviatoric part of the stress update is along ðnsRÞ
nþ1, which implies that rseR
� �0 and the deviatoric part of rsR
� �nþ1 are coax-ial and therefore ns
R
� �nþ1 can be computed from the elastic predictor rseR [46] as:
nsR
� �nþ1 ¼ 32qse
Rrse
R
� �0 ð34Þ
The two nonlinear equations to be solved for D�Rp and D�Rq are then derived from the flow rule and the viscoplastic law inthe rotated Lagrangian frame, as discussed in Section 2.2.1.
(1) Rate-dependent flow rule:
D�Rp@/vp
@qs
� �nþ1
R
þ D�Rq@/vp
@ps
� �nþ1
R
¼ 0 ð35Þ
(2) Viscoplastic law:
D�Rq � Dk@/vp
@qs
� �nþ1
R¼ 0 ð36Þ
Eqs. (35) and (36) are solved in conjunction with the evolution laws (28) and (29) using the Newton–Raphson iterationmethod. Corrections cp and cq to the primary solution variables D�Rp and D �Rq are solved from the equations
Ai1cp þ Ai2cq ¼ bi i ¼ 1;2 ð37Þ
The coefficients Aij and bi are given in Appendix B. The rotated Cauchy stress rsR
� �nþ1 is then calculated from Eq. (33). The
state variables ��pM , f, and r0 are updated using relations (28) and (29) and the rotated plastic strain tensor �sp
R
� �nþ1 is obtainedfrom Eq. (22) as:
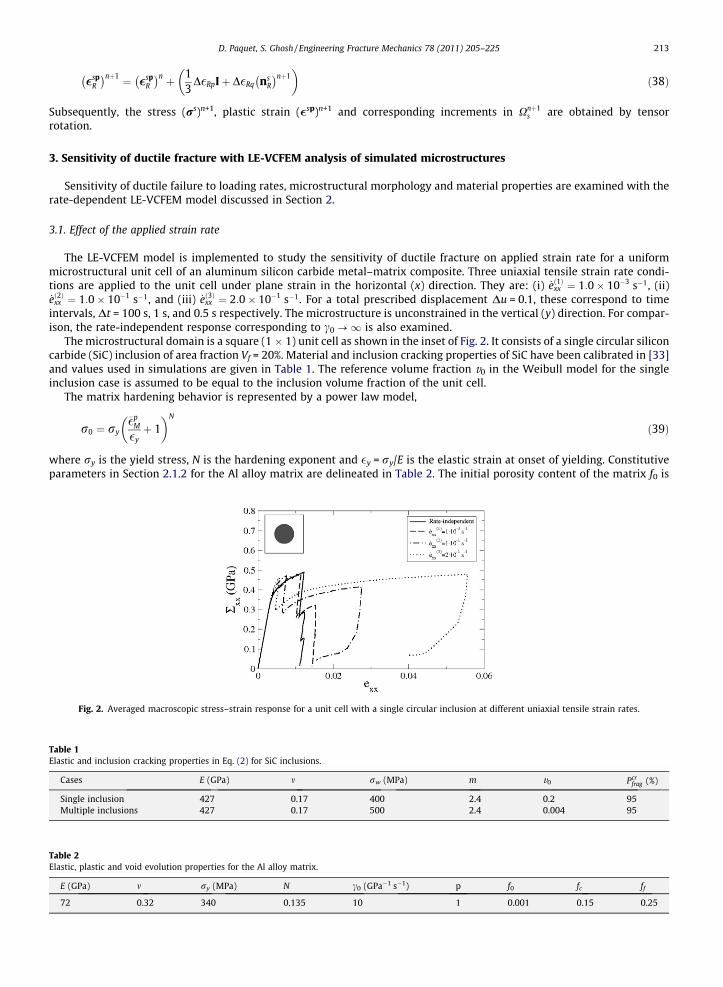
Table 1Elastic
Case
SingMult
Table 2Elastic,
E (G
72
D. Paquet, S. Ghosh / Engineering Fracture Mechanics 78 (2011) 205–225 213
�spR
� �nþ1 ¼ �spR
� �n þ 13
D�RpIþ D�Rq nsR
� �nþ1� �
ð38Þ
Subsequently, the stress (rs)n+1, plastic strain (�sp)n+1 and corresponding increments in Xnþ1s are obtained by tensor
rotation.
3. Sensitivity of ductile fracture with LE-VCFEM analysis of simulated microstructures
Sensitivity of ductile failure to loading rates, microstructural morphology and material properties are examined with therate-dependent LE-VCFEM model discussed in Section 2.
3.1. Effect of the applied strain rate
The LE-VCFEM model is implemented to study the sensitivity of ductile fracture on applied strain rate for a uniformmicrostructural unit cell of an aluminum silicon carbide metal–matrix composite. Three uniaxial tensile strain rate condi-tions are applied to the unit cell under plane strain in the horizontal (x) direction. They are: (i) _eð1Þxx ¼ 1:0� 10�3 s�1, (ii)_eð2Þxx ¼ 1:0� 10�1 s�1, and (iii) _eð3Þxx ¼ 2:0� 10�1 s�1. For a total prescribed displacement Du = 0.1, these correspond to timeintervals, Dt = 100 s, 1 s, and 0.5 s respectively. The microstructure is unconstrained in the vertical (y) direction. For compar-ison, the rate-independent response corresponding to c0 ?1 is also examined.
The microstructural domain is a square (1 � 1) unit cell as shown in the inset of Fig. 2. It consists of a single circular siliconcarbide (SiC) inclusion of area fraction Vf = 20%. Material and inclusion cracking properties of SiC have been calibrated in [33]and values used in simulations are given in Table 1. The reference volume fraction v0 in the Weibull model for the singleinclusion case is assumed to be equal to the inclusion volume fraction of the unit cell.
The matrix hardening behavior is represented by a power law model,
r0 ¼ ry
��pM
�yþ 1
� �N
ð39Þ
where ry is the yield stress, N is the hardening exponent and �y = ry/E is the elastic strain at onset of yielding. Constitutiveparameters in Section 2.1.2 for the Al alloy matrix are delineated in Table 2. The initial porosity content of the matrix f0 is
Fig. 2. Averaged macroscopic stress–strain response for a unit cell with a single circular inclusion at different uniaxial tensile strain rates.
and inclusion cracking properties in Eq. (2) for SiC inclusions.
s E (GPa) m rw (MPa) m v0 Pcrfrag (%)
le inclusion 427 0.17 400 2.4 0.2 95iple inclusions 427 0.17 500 2.4 0.004 95
plastic and void evolution properties for the Al alloy matrix.
Pa) m ry (MPa) N c0 (GPa�1 s�1) p f0 fc ff
0.32 340 0.135 10 1 0.001 0.15 0.25
214 D. Paquet, S. Ghosh / Engineering Fracture Mechanics 78 (2011) 205–225
assumed to be 0.1% and the void evolution related constants are set to q1 = 1.5, q2 = 1, q3 = 2.25. The void nucleation param-eters in Eq. (16) are �N = 0.3, sN = 0.1 and fN = 0.04. In classical homogenization theories, the size of the microstructural do-main is immaterial and does not affect the solution. The use of a non-local evolution law for void volume fraction f in Eq. (19)introduces a length scale L to the problem and hence, the size of the microstructural region affects the solution. For the oneinclusion microstructural domain of size 1 � 1, the authors have determined from numerical experiments that a value L = 0.1regularizes the solution adequately.
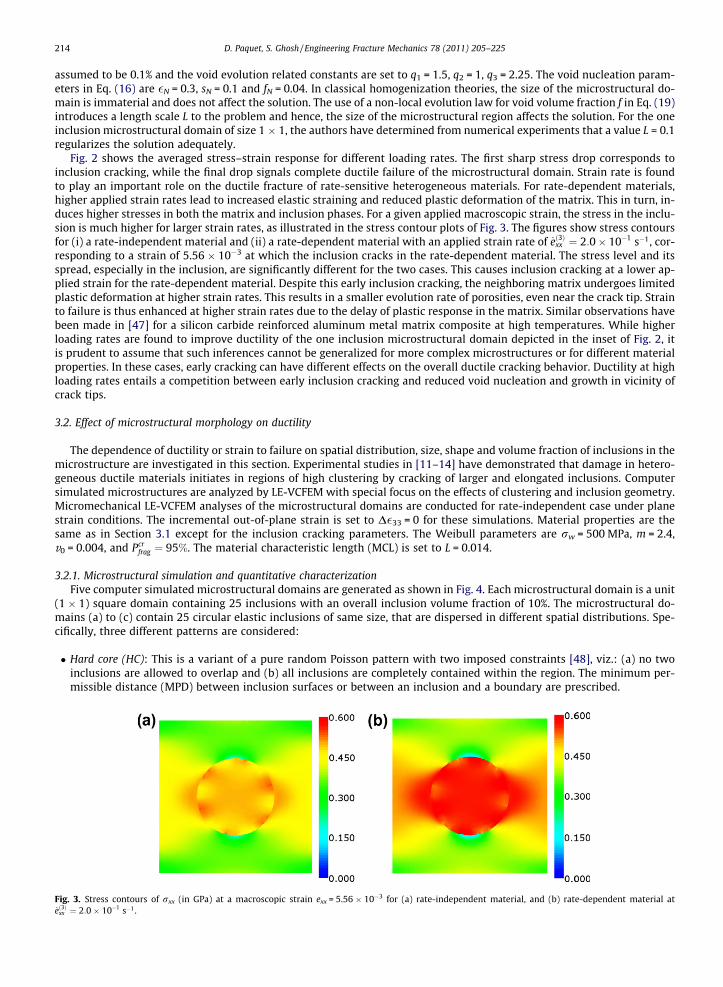
Fig. 2 shows the averaged stress–strain response for different loading rates. The first sharp stress drop corresponds toinclusion cracking, while the final drop signals complete ductile failure of the microstructural domain. Strain rate is foundto play an important role on the ductile fracture of rate-sensitive heterogeneous materials. For rate-dependent materials,higher applied strain rates lead to increased elastic straining and reduced plastic deformation of the matrix. This in turn, in-duces higher stresses in both the matrix and inclusion phases. For a given applied macroscopic strain, the stress in the inclu-sion is much higher for larger strain rates, as illustrated in the stress contour plots of Fig. 3. The figures show stress contoursfor (i) a rate-independent material and (ii) a rate-dependent material with an applied strain rate of _eð3Þxx ¼ 2:0� 10�1 s�1, cor-responding to a strain of 5.56 � 10�3 at which the inclusion cracks in the rate-dependent material. The stress level and itsspread, especially in the inclusion, are significantly different for the two cases. This causes inclusion cracking at a lower ap-plied strain for the rate-dependent material. Despite this early inclusion cracking, the neighboring matrix undergoes limitedplastic deformation at higher strain rates. This results in a smaller evolution rate of porosities, even near the crack tip. Strainto failure is thus enhanced at higher strain rates due to the delay of plastic response in the matrix. Similar observations havebeen made in [47] for a silicon carbide reinforced aluminum metal matrix composite at high temperatures. While higherloading rates are found to improve ductility of the one inclusion microstructural domain depicted in the inset of Fig. 2, itis prudent to assume that such inferences cannot be generalized for more complex microstructures or for different materialproperties. In these cases, early cracking can have different effects on the overall ductile cracking behavior. Ductility at highloading rates entails a competition between early inclusion cracking and reduced void nucleation and growth in vicinity ofcrack tips.
3.2. Effect of microstructural morphology on ductility
The dependence of ductility or strain to failure on spatial distribution, size, shape and volume fraction of inclusions in themicrostructure are investigated in this section. Experimental studies in [11–14] have demonstrated that damage in hetero-geneous ductile materials initiates in regions of high clustering by cracking of larger and elongated inclusions. Computersimulated microstructures are analyzed by LE-VCFEM with special focus on the effects of clustering and inclusion geometry.Micromechanical LE-VCFEM analyses of the microstructural domains are conducted for rate-independent case under planestrain conditions. The incremental out-of-plane strain is set to D�33 = 0 for these simulations. Material properties are thesame as in Section 3.1 except for the inclusion cracking parameters. The Weibull parameters are rw = 500 MPa, m = 2.4,v0 = 0.004, and Pcr
frag ¼ 95%. The material characteristic length (MCL) is set to L = 0.014.
3.2.1. Microstructural simulation and quantitative characterizationFive computer simulated microstructural domains are generated as shown in Fig. 4. Each microstructural domain is a unit
(1 � 1) square domain containing 25 inclusions with an overall inclusion volume fraction of 10%. The microstructural do-mains (a) to (c) contain 25 circular elastic inclusions of same size, that are dispersed in different spatial distributions. Spe-cifically, three different patterns are considered:
� Hard core (HC): This is a variant of a pure random Poisson pattern with two imposed constraints [48], viz.: (a) no twoinclusions are allowed to overlap and (b) all inclusions are completely contained within the region. The minimum per-missible distance (MPD) between inclusion surfaces or between an inclusion and a boundary are prescribed.
Fig. 3. Stress contours of rxx (in GPa) at a macroscopic strain exx = 5.56 � 10�3 for (a) rate-independent material, and (b) rate-dependent material at_eð3Þxx ¼ 2:0� 10�1 s�1.
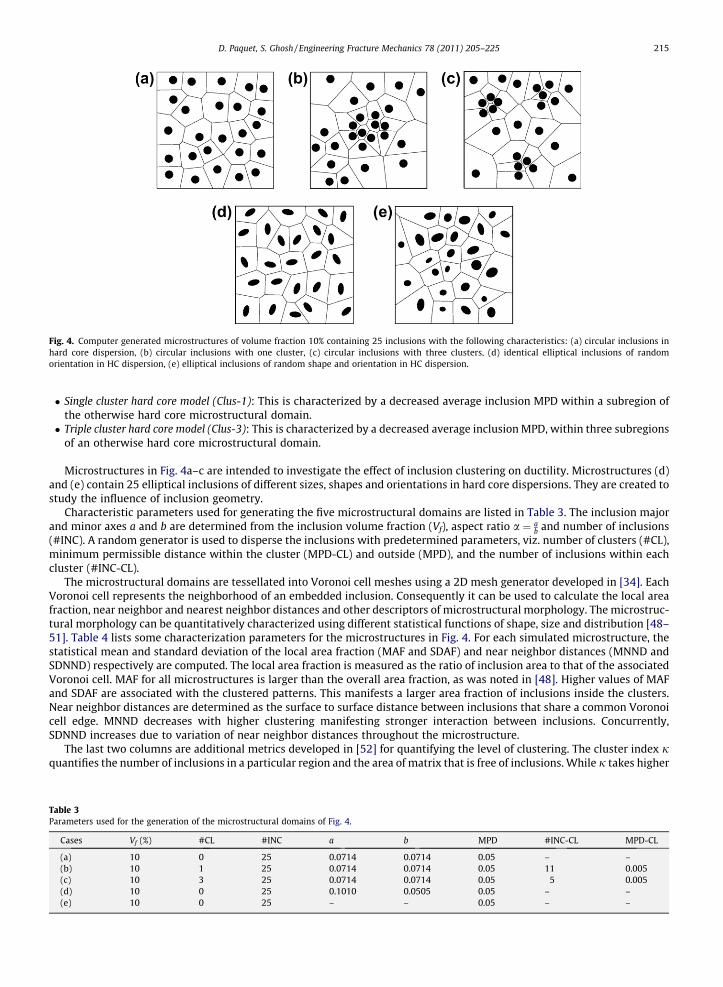
Fig. 4. Computer generated microstructures of volume fraction 10% containing 25 inclusions with the following characteristics: (a) circular inclusions inhard core dispersion, (b) circular inclusions with one cluster, (c) circular inclusions with three clusters, (d) identical elliptical inclusions of randomorientation in HC dispersion, (e) elliptical inclusions of random shape and orientation in HC dispersion.
D. Paquet, S. Ghosh / Engineering Fracture Mechanics 78 (2011) 205–225 215
� Single cluster hard core model (Clus-1): This is characterized by a decreased average inclusion MPD within a subregion ofthe otherwise hard core microstructural domain.� Triple cluster hard core model (Clus-3): This is characterized by a decreased average inclusion MPD, within three subregions
of an otherwise hard core microstructural domain.
Microstructures in Fig. 4a–c are intended to investigate the effect of inclusion clustering on ductility. Microstructures (d)and (e) contain 25 elliptical inclusions of different sizes, shapes and orientations in hard core dispersions. They are created tostudy the influence of inclusion geometry.
Characteristic parameters used for generating the five microstructural domains are listed in Table 3. The inclusion majorand minor axes a and b are determined from the inclusion volume fraction (Vf), aspect ratio a ¼ a
b and number of inclusions(#INC). A random generator is used to disperse the inclusions with predetermined parameters, viz. number of clusters (#CL),minimum permissible distance within the cluster (MPD-CL) and outside (MPD), and the number of inclusions within eachcluster (#INC-CL).
The microstructural domains are tessellated into Voronoi cell meshes using a 2D mesh generator developed in [34]. EachVoronoi cell represents the neighborhood of an embedded inclusion. Consequently it can be used to calculate the local areafraction, near neighbor and nearest neighbor distances and other descriptors of microstructural morphology. The microstruc-tural morphology can be quantitatively characterized using different statistical functions of shape, size and distribution [48–51]. Table 4 lists some characterization parameters for the microstructures in Fig. 4. For each simulated microstructure, thestatistical mean and standard deviation of the local area fraction (MAF and SDAF) and near neighbor distances (MNND andSDNND) respectively are computed. The local area fraction is measured as the ratio of inclusion area to that of the associatedVoronoi cell. MAF for all microstructures is larger than the overall area fraction, as was noted in [48]. Higher values of MAFand SDAF are associated with the clustered patterns. This manifests a larger area fraction of inclusions inside the clusters.Near neighbor distances are determined as the surface to surface distance between inclusions that share a common Voronoicell edge. MNND decreases with higher clustering manifesting stronger interaction between inclusions. Concurrently,SDNND increases due to variation of near neighbor distances throughout the microstructure.
The last two columns are additional metrics developed in [52] for quantifying the level of clustering. The cluster index jquantifies the number of inclusions in a particular region and the area of matrix that is free of inclusions. While j takes higher
Table 3Parameters used for the generation of the microstructural domains of Fig. 4.
Cases Vf (%) #CL #INC a b MPD #INC-CL MPD-CL
(a) 10 0 25 0.0714 0.0714 0.05 – –(b) 10 1 25 0.0714 0.0714 0.05 11 0.005(c) 10 3 25 0.0714 0.0714 0.05 5 0.005(d) 10 0 25 0.1010 0.0505 0.05 – –(e) 10 0 25 – – 0.05 – –
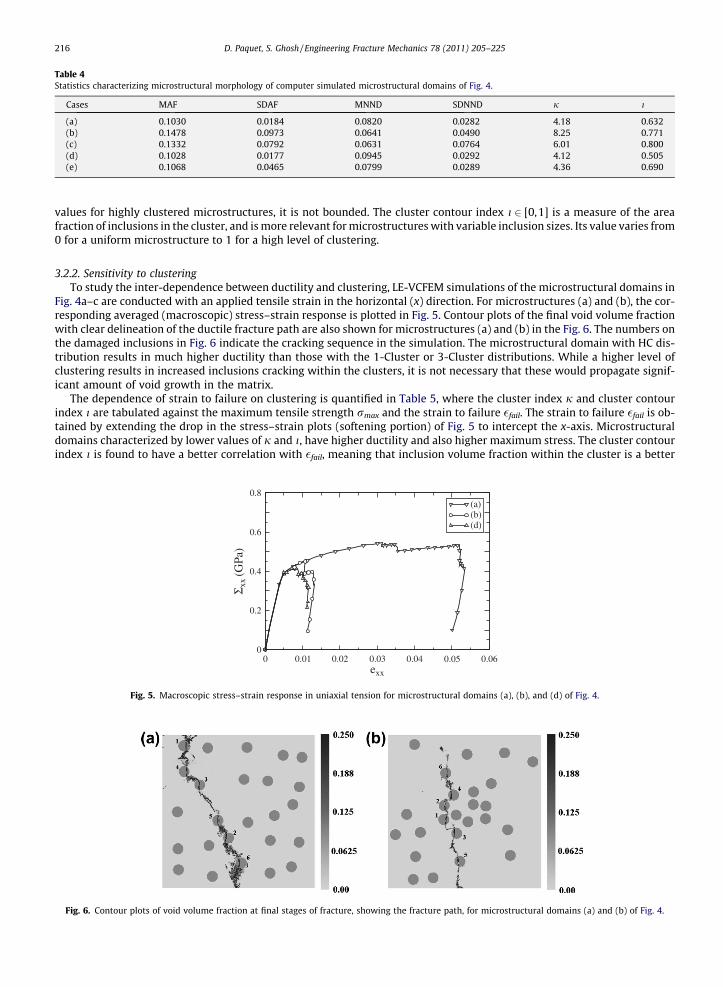
Table 4Statistics characterizing microstructural morphology of computer simulated microstructural domains of Fig. 4.
Cases MAF SDAF MNND SDNND j i
(a) 0.1030 0.0184 0.0820 0.0282 4.18 0.632(b) 0.1478 0.0973 0.0641 0.0490 8.25 0.771(c) 0.1332 0.0792 0.0631 0.0764 6.01 0.800(d) 0.1028 0.0177 0.0945 0.0292 4.12 0.505(e) 0.1068 0.0465 0.0799 0.0289 4.36 0.690
216 D. Paquet, S. Ghosh / Engineering Fracture Mechanics 78 (2011) 205–225
values for highly clustered microstructures, it is not bounded. The cluster contour index i 2 [0,1] is a measure of the areafraction of inclusions in the cluster, and is more relevant for microstructures with variable inclusion sizes. Its value varies from0 for a uniform microstructure to 1 for a high level of clustering.
3.2.2. Sensitivity to clusteringTo study the inter-dependence between ductility and clustering, LE-VCFEM simulations of the microstructural domains in
Fig. 4a–c are conducted with an applied tensile strain in the horizontal (x) direction. For microstructures (a) and (b), the cor-responding averaged (macroscopic) stress–strain response is plotted in Fig. 5. Contour plots of the final void volume fractionwith clear delineation of the ductile fracture path are also shown for microstructures (a) and (b) in the Fig. 6. The numbers onthe damaged inclusions in Fig. 6 indicate the cracking sequence in the simulation. The microstructural domain with HC dis-tribution results in much higher ductility than those with the 1-Cluster or 3-Cluster distributions. While a higher level ofclustering results in increased inclusions cracking within the clusters, it is not necessary that these would propagate signif-icant amount of void growth in the matrix.
The dependence of strain to failure on clustering is quantified in Table 5, where the cluster index j and cluster contourindex i are tabulated against the maximum tensile strength rmax and the strain to failure �fail. The strain to failure �fail is ob-tained by extending the drop in the stress–strain plots (softening portion) of Fig. 5 to intercept the x-axis. Microstructuraldomains characterized by lower values of j and i, have higher ductility and also higher maximum stress. The cluster contourindex i is found to have a better correlation with �fail, meaning that inclusion volume fraction within the cluster is a better
0 0.01 0.02 0.03 0.04 0.05 0.06exx
0
0.2
0.4
0.6
0.8
Σ xx
(GPa
)
(a)(b)(d)
Fig. 5. Macroscopic stress–strain response in uniaxial tension for microstructural domains (a), (b), and (d) of Fig. 4.
Fig. 6. Contour plots of void volume fraction at final stages of fracture, showing the fracture path, for microstructural domains (a) and (b) of Fig. 4.
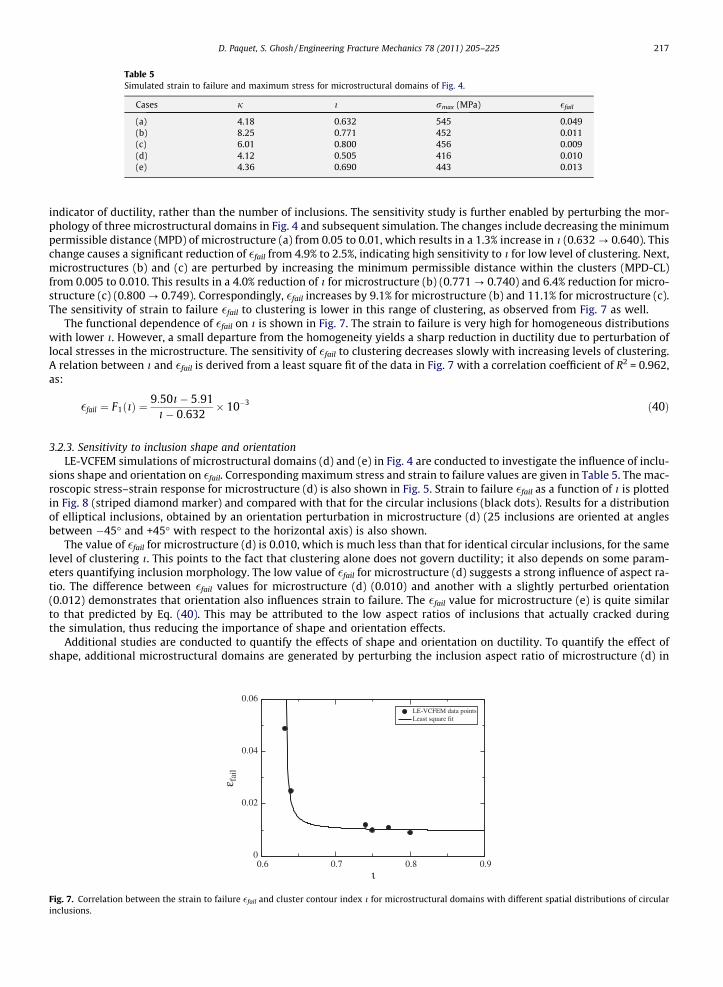
Table 5Simulated strain to failure and maximum stress for microstructural domains of Fig. 4.
Cases j i rmax (MPa) �fail
(a) 4.18 0.632 545 0.049(b) 8.25 0.771 452 0.011(c) 6.01 0.800 456 0.009(d) 4.12 0.505 416 0.010(e) 4.36 0.690 443 0.013
D. Paquet, S. Ghosh / Engineering Fracture Mechanics 78 (2011) 205–225 217
indicator of ductility, rather than the number of inclusions. The sensitivity study is further enabled by perturbing the mor-phology of three microstructural domains in Fig. 4 and subsequent simulation. The changes include decreasing the minimumpermissible distance (MPD) of microstructure (a) from 0.05 to 0.01, which results in a 1.3% increase in i (0.632 ? 0.640). Thischange causes a significant reduction of �fail from 4.9% to 2.5%, indicating high sensitivity to i for low level of clustering. Next,microstructures (b) and (c) are perturbed by increasing the minimum permissible distance within the clusters (MPD-CL)from 0.005 to 0.010. This results in a 4.0% reduction of i for microstructure (b) (0.771 ? 0.740) and 6.4% reduction for micro-structure (c) (0.800 ? 0.749). Correspondingly, �fail increases by 9.1% for microstructure (b) and 11.1% for microstructure (c).The sensitivity of strain to failure �fail to clustering is lower in this range of clustering, as observed from Fig. 7 as well.
The functional dependence of �fail on i is shown in Fig. 7. The strain to failure is very high for homogeneous distributionswith lower i. However, a small departure from the homogeneity yields a sharp reduction in ductility due to perturbation oflocal stresses in the microstructure. The sensitivity of �fail to clustering decreases slowly with increasing levels of clustering.A relation between i and �fail is derived from a least square fit of the data in Fig. 7 with a correlation coefficient of R2 = 0.962,as:
Fig. 7.inclusio
�fail ¼ F1ðiÞ ¼9:50i� 5:91i� 0:632
� 10�3 ð40Þ
3.2.3. Sensitivity to inclusion shape and orientationLE-VCFEM simulations of microstructural domains (d) and (e) in Fig. 4 are conducted to investigate the influence of inclu-
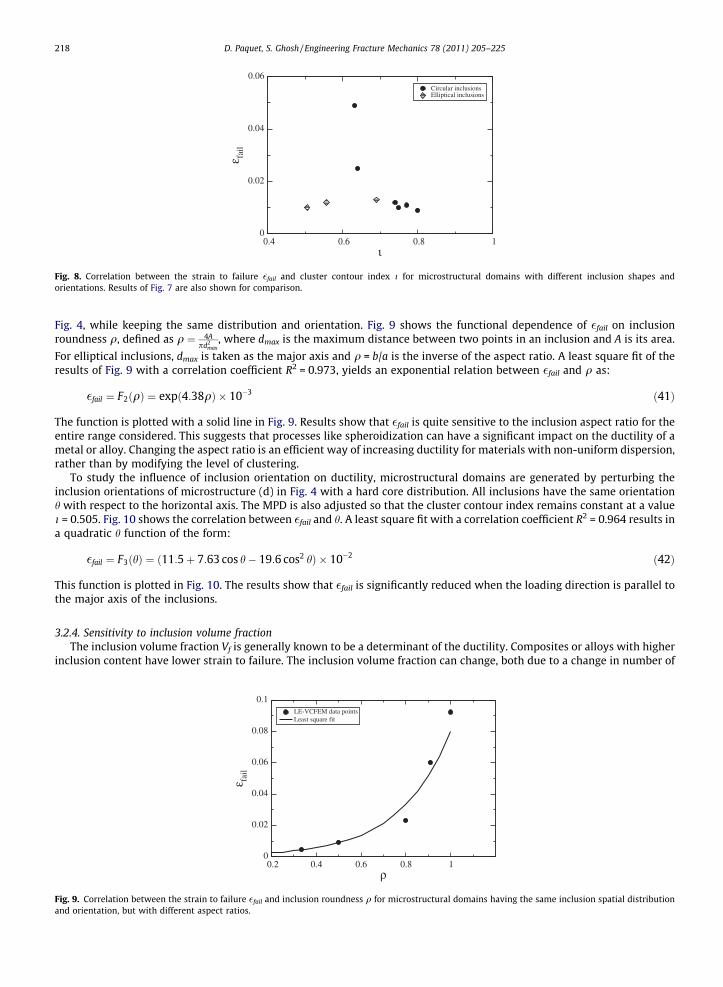
sions shape and orientation on �fail. Corresponding maximum stress and strain to failure values are given in Table 5. The mac-roscopic stress–strain response for microstructure (d) is also shown in Fig. 5. Strain to failure �fail as a function of i is plottedin Fig. 8 (striped diamond marker) and compared with that for the circular inclusions (black dots). Results for a distributionof elliptical inclusions, obtained by an orientation perturbation in microstructure (d) (25 inclusions are oriented at anglesbetween �45� and +45� with respect to the horizontal axis) is also shown.
The value of �fail for microstructure (d) is 0.010, which is much less than that for identical circular inclusions, for the samelevel of clustering i. This points to the fact that clustering alone does not govern ductility; it also depends on some param-eters quantifying inclusion morphology. The low value of �fail for microstructure (d) suggests a strong influence of aspect ra-tio. The difference between �fail values for microstructure (d) (0.010) and another with a slightly perturbed orientation(0.012) demonstrates that orientation also influences strain to failure. The �fail value for microstructure (e) is quite similarto that predicted by Eq. (40). This may be attributed to the low aspect ratios of inclusions that actually cracked duringthe simulation, thus reducing the importance of shape and orientation effects.
Additional studies are conducted to quantify the effects of shape and orientation on ductility. To quantify the effect ofshape, additional microstructural domains are generated by perturbing the inclusion aspect ratio of microstructure (d) in
0.6 0.7 0.8 0.9ι
0
0.02
0.04
0.06
ε fai
l
LE-VCFEM data pointsLeast square fit
Correlation between the strain to failure �fail and cluster contour index i for microstructural domains with different spatial distributions of circularns.
0.4 0.6 0.8 1ι
0
0.02
0.04
0.06
ε fail
Circular inclusionsElliptical inclusions
Fig. 8. Correlation between the strain to failure �fail and cluster contour index i for microstructural domains with different inclusion shapes andorientations. Results of Fig. 7 are also shown for comparison.
218 D. Paquet, S. Ghosh / Engineering Fracture Mechanics 78 (2011) 205–225
Fig. 4, while keeping the same distribution and orientation. Fig. 9 shows the functional dependence of �fail on inclusionroundness q, defined as q ¼ 4A
pd2max
, where dmax is the maximum distance between two points in an inclusion and A is its area.
For elliptical inclusions, dmax is taken as the major axis and q = b/a is the inverse of the aspect ratio. A least square fit of theresults of Fig. 9 with a correlation coefficient R2 = 0.973, yields an exponential relation between �fail and q as:
Fig. 9.and ori
�fail ¼ F2ðqÞ ¼ expð4:38qÞ � 10�3 ð41Þ
The function is plotted with a solid line in Fig. 9. Results show that �fail is quite sensitive to the inclusion aspect ratio for theentire range considered. This suggests that processes like spheroidization can have a significant impact on the ductility of ametal or alloy. Changing the aspect ratio is an efficient way of increasing ductility for materials with non-uniform dispersion,rather than by modifying the level of clustering.
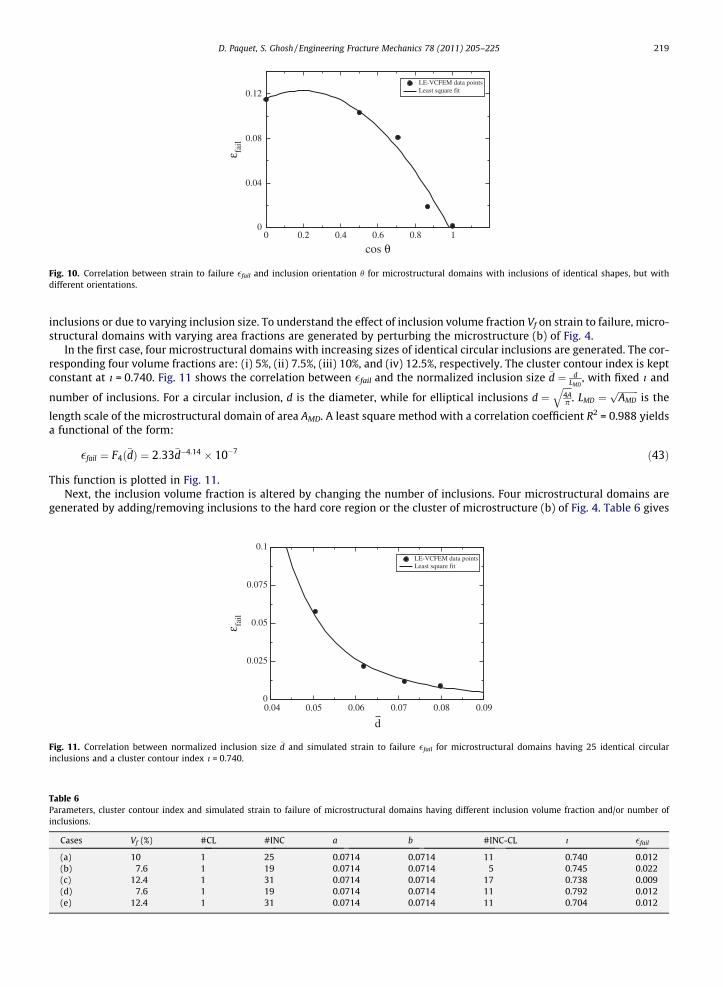
To study the influence of inclusion orientation on ductility, microstructural domains are generated by perturbing theinclusion orientations of microstructure (d) in Fig. 4 with a hard core distribution. All inclusions have the same orientationh with respect to the horizontal axis. The MPD is also adjusted so that the cluster contour index remains constant at a valuei = 0.505. Fig. 10 shows the correlation between �fail and h. A least square fit with a correlation coefficient R2 = 0.964 results ina quadratic h function of the form:
�fail ¼ F3ðhÞ ¼ ð11:5þ 7:63 cos h� 19:6 cos2 hÞ � 10�2 ð42Þ
This function is plotted in Fig. 10. The results show that �fail is significantly reduced when the loading direction is parallel tothe major axis of the inclusions.
3.2.4. Sensitivity to inclusion volume fractionThe inclusion volume fraction Vf is generally known to be a determinant of the ductility. Composites or alloys with higher
inclusion content have lower strain to failure. The inclusion volume fraction can change, both due to a change in number of
0.2 0.4 0.6 0.8 1ρ
0
0.02
0.04
0.06
0.08
0.1
ε fail
LE-VCFEM data pointsLeast square fit
Correlation between the strain to failure �fail and inclusion roundness q for microstructural domains having the same inclusion spatial distributionentation, but with different aspect ratios.
0 0.2 0.4 0.6 0.8 1cos θ
0
0.04
0.08
0.12
ε fail
LE-VCFEM data pointsLeast square fit
Fig. 10. Correlation between strain to failure �fail and inclusion orientation h for microstructural domains with inclusions of identical shapes, but withdifferent orientations.
D. Paquet, S. Ghosh / Engineering Fracture Mechanics 78 (2011) 205–225 219
inclusions or due to varying inclusion size. To understand the effect of inclusion volume fraction Vf on strain to failure, micro-structural domains with varying area fractions are generated by perturbing the microstructure (b) of Fig. 4.
In the first case, four microstructural domains with increasing sizes of identical circular inclusions are generated. The cor-responding four volume fractions are: (i) 5%, (ii) 7.5%, (iii) 10%, and (iv) 12.5%, respectively. The cluster contour index is keptconstant at i = 0.740. Fig. 11 shows the correlation between �fail and the normalized inclusion size �d ¼ d
LMD, with fixed i and
number of inclusions. For a circular inclusion, d is the diameter, while for elliptical inclusions d ¼ffiffiffiffi4Ap
q. LMD ¼
ffiffiffiffiffiffiffiffiffiAMDp
is the
length scale of the microstructural domain of area AMD. A least square method with a correlation coefficient R2 = 0.988 yieldsa functional of the form:
Fig. 11inclusio
Table 6Parameinclusio
Case
(a)(b)(c)(d)(e)
�fail ¼ F4ð�dÞ ¼ 2:33�d�4:14 � 10�7 ð43Þ
This function is plotted in Fig. 11.Next, the inclusion volume fraction is altered by changing the number of inclusions. Four microstructural domains are
generated by adding/removing inclusions to the hard core region or the cluster of microstructure (b) of Fig. 4. Table 6 gives
0.04 0.05 0.06 0.07 0.08 0.09
d
0
0.025
0.05
0.075
0.1
ε fail
LE-VCFEM data pointsLeast square fit
. Correlation between normalized inclusion size �d and simulated strain to failure �fail for microstructural domains having 25 identical circularns and a cluster contour index i = 0.740.
ters, cluster contour index and simulated strain to failure of microstructural domains having different inclusion volume fraction and/or number ofns.
s Vf (%) #CL #INC a b #INC-CL i �fail
10 1 25 0.0714 0.0714 11 0.740 0.0127.6 1 19 0.0714 0.0714 5 0.745 0.022
12.4 1 31 0.0714 0.0714 17 0.738 0.0097.6 1 19 0.0714 0.0714 11 0.792 0.012
12.4 1 31 0.0714 0.0714 11 0.704 0.012
220 D. Paquet, S. Ghosh / Engineering Fracture Mechanics 78 (2011) 205–225
the parameters used to generate these microstructural domains (b–e), as well as the cluster contour index and the simulatedstrains to failure. Characteristics of a reference microstructure (a) containing 25 inclusions are also provided for comparison.
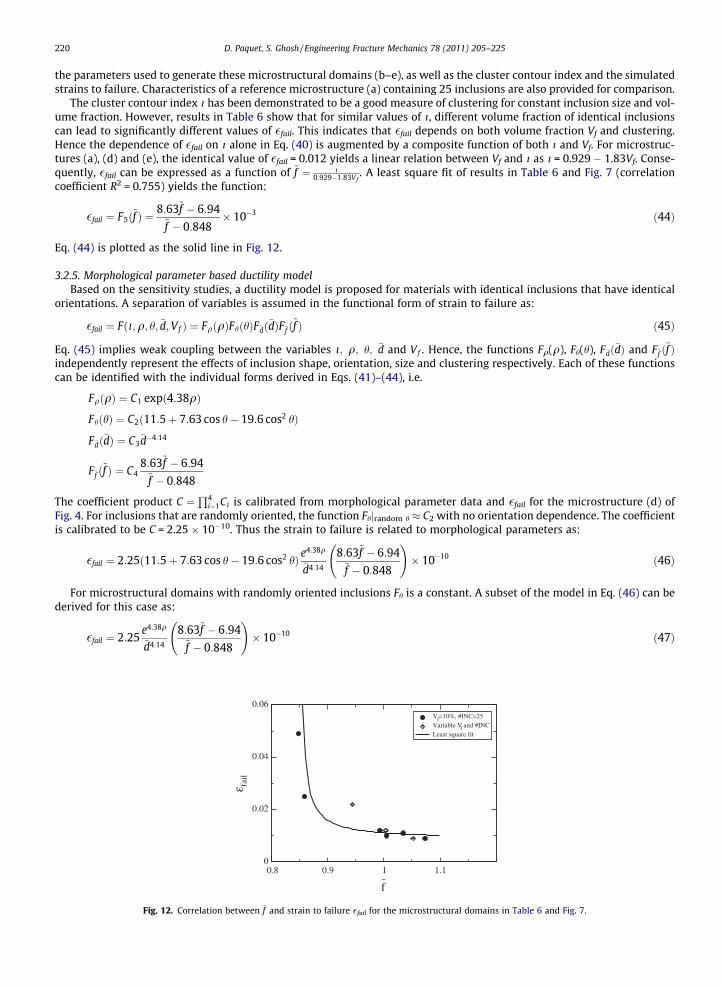
The cluster contour index i has been demonstrated to be a good measure of clustering for constant inclusion size and vol-ume fraction. However, results in Table 6 show that for similar values of i, different volume fraction of identical inclusionscan lead to significantly different values of �fail. This indicates that �fail depends on both volume fraction Vf and clustering.Hence the dependence of �fail on i alone in Eq. (40) is augmented by a composite function of both i and Vf. For microstruc-tures (a), (d) and (e), the identical value of �fail = 0.012 yields a linear relation between Vf and i as i = 0.929 � 1.83Vf. Conse-quently, �fail can be expressed as a function of ~f ¼ i
0:929�1:83Vf. A least square fit of results in Table 6 and Fig. 7 (correlation
coefficient R2 = 0.755) yields the function:
�fail ¼ F5ð~f Þ ¼8:63~f � 6:94
~f � 0:848� 10�3 ð44Þ
Eq. (44) is plotted as the solid line in Fig. 12.
3.2.5. Morphological parameter based ductility modelBased on the sensitivity studies, a ductility model is proposed for materials with identical inclusions that have identical
orientations. A separation of variables is assumed in the functional form of strain to failure as:
�fail ¼ Fði;q; h; �d;Vf Þ ¼ FqðqÞFhðhÞF�dð�dÞF~f ð~f Þ ð45Þ
Eq. (45) implies weak coupling between the variables i; q; h; �d and Vf . Hence, the functions Fq(q), Fh(h), F�dð�dÞ and F~f ð~f Þindependently represent the effects of inclusion shape, orientation, size and clustering respectively. Each of these functionscan be identified with the individual forms derived in Eqs. (41)–(44), i.e.
FqðqÞ ¼ C1 expð4:38qÞ
FhðhÞ ¼ C2ð11:5þ 7:63 cos h� 19:6 cos2 hÞ
F�dð�dÞ ¼ C3�d�4:14
F~f ð~f Þ ¼ C48:63~f � 6:94
~f � 0:848
The coefficient product C ¼Q4
i¼1Ci is calibrated from morphological parameter data and �fail for the microstructure (d) ofFig. 4. For inclusions that are randomly oriented, the function Fhjrandom h � C2 with no orientation dependence. The coefficientis calibrated to be C = 2.25 � 10�10. Thus the strain to failure is related to morphological parameters as:
�fail ¼ 2:25ð11:5þ 7:63 cos h� 19:6 cos2 hÞ e4:38q
�d4:14
8:63~f � 6:94~f � 0:848
!� 10�10 ð46Þ
For microstructural domains with randomly oriented inclusions Fh is a constant. A subset of the model in Eq. (46) can bederived for this case as:
�fail ¼ 2:25e4:38q
�d4:14
8:63~f � 6:94~f � 0:848
!� 10�10 ð47Þ
0.8 0.9 1 1.1
f
0
0.02
0.04
0.06
ε fail
Vf=10%, #INC=25Variable Vf and #INCLeast square fit
~
Fig. 12. Correlation between ~f and strain to failure �fail for the microstructural domains in Table 6 and Fig. 7.
D. Paquet, S. Ghosh / Engineering Fracture Mechanics 78 (2011) 205–225 221
This predictive model for strain to failure is used in the second part of this paper to estimate �fail of microstructural domainsobtained from micrographs of a cast aluminum alloy.
3.3. Effect of material properties on ductility
The effect of matrix and inclusion material properties on strain to failure is studied in this section. LE-VCFEM simulationsof microstructure (e) in Fig. 4 are undertaken for different values of matrix work-hardening exponent, matrix yield stress andfailure strength of inclusions.
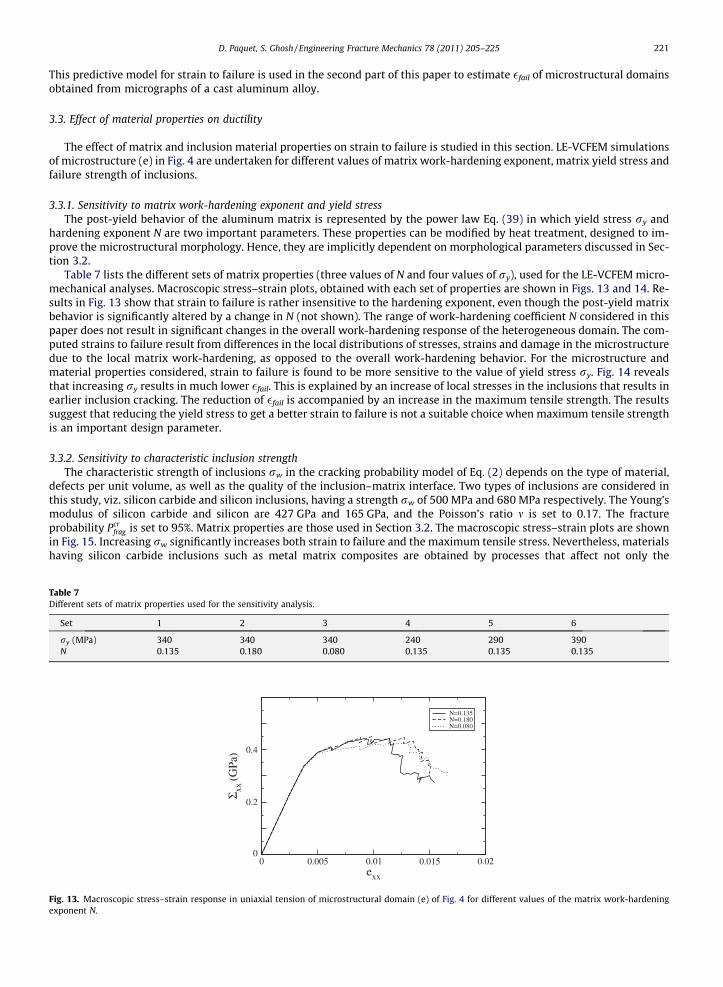
3.3.1. Sensitivity to matrix work-hardening exponent and yield stressThe post-yield behavior of the aluminum matrix is represented by the power law Eq. (39) in which yield stress ry and
hardening exponent N are two important parameters. These properties can be modified by heat treatment, designed to im-prove the microstructural morphology. Hence, they are implicitly dependent on morphological parameters discussed in Sec-tion 3.2.
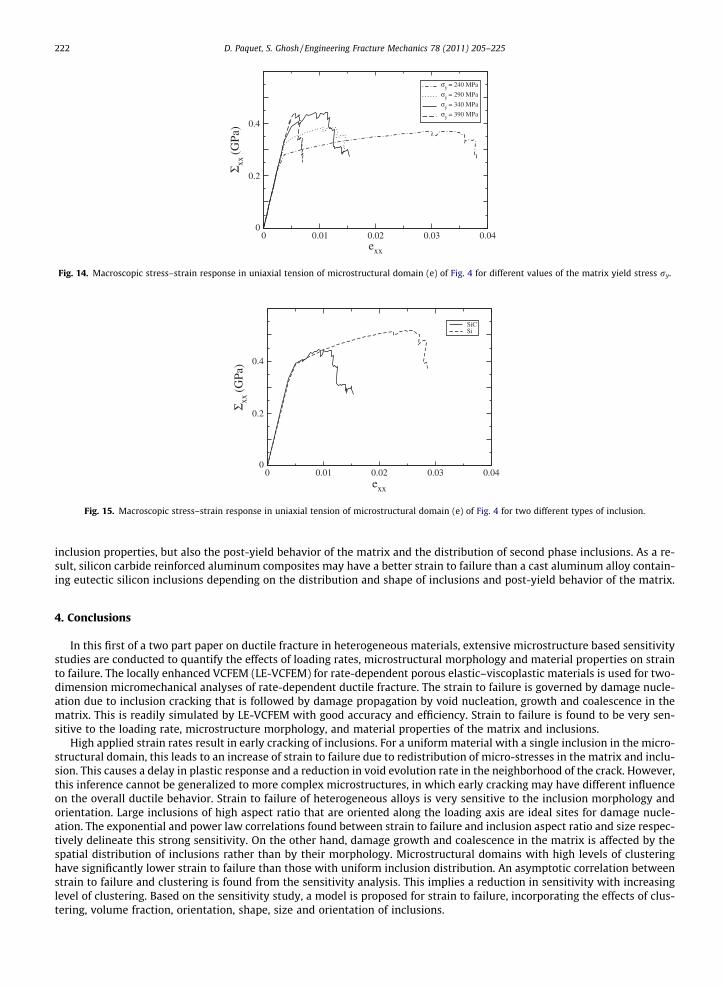
Table 7 lists the different sets of matrix properties (three values of N and four values of ry), used for the LE-VCFEM micro-mechanical analyses. Macroscopic stress–strain plots, obtained with each set of properties are shown in Figs. 13 and 14. Re-sults in Fig. 13 show that strain to failure is rather insensitive to the hardening exponent, even though the post-yield matrixbehavior is significantly altered by a change in N (not shown). The range of work-hardening coefficient N considered in thispaper does not result in significant changes in the overall work-hardening response of the heterogeneous domain. The com-puted strains to failure result from differences in the local distributions of stresses, strains and damage in the microstructuredue to the local matrix work-hardening, as opposed to the overall work-hardening behavior. For the microstructure andmaterial properties considered, strain to failure is found to be more sensitive to the value of yield stress ry. Fig. 14 revealsthat increasing ry results in much lower �fail. This is explained by an increase of local stresses in the inclusions that results inearlier inclusion cracking. The reduction of �fail is accompanied by an increase in the maximum tensile strength. The resultssuggest that reducing the yield stress to get a better strain to failure is not a suitable choice when maximum tensile strengthis an important design parameter.
3.3.2. Sensitivity to characteristic inclusion strengthThe characteristic strength of inclusions rw in the cracking probability model of Eq. (2) depends on the type of material,
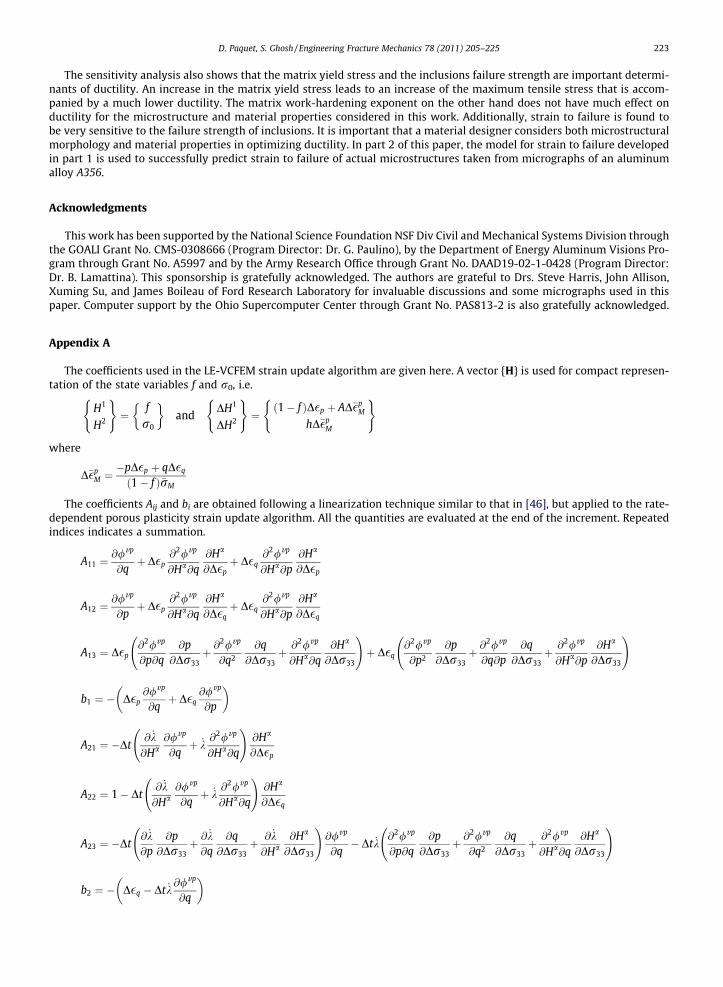
defects per unit volume, as well as the quality of the inclusion–matrix interface. Two types of inclusions are considered inthis study, viz. silicon carbide and silicon inclusions, having a strength rw of 500 MPa and 680 MPa respectively. The Young’smodulus of silicon carbide and silicon are 427 GPa and 165 GPa, and the Poisson’s ratio m is set to 0.17. The fractureprobability Pcr
frag is set to 95%. Matrix properties are those used in Section 3.2. The macroscopic stress–strain plots are shownin Fig. 15. Increasing rw significantly increases both strain to failure and the maximum tensile stress. Nevertheless, materialshaving silicon carbide inclusions such as metal matrix composites are obtained by processes that affect not only the
Table 7Different sets of matrix properties used for the sensitivity analysis.
Set 1 2 3 4 5 6
ry (MPa) 340 340 340 240 290 390N 0.135 0.180 0.080 0.135 0.135 0.135
0 0.005 0.01 0.015 0.02exx
0
0.2
0.4
Σ xx (G
Pa)
N=0.135N=0.180N=0.080
Fig. 13. Macroscopic stress–strain response in uniaxial tension of microstructural domain (e) of Fig. 4 for different values of the matrix work-hardeningexponent N.
0 0.01 0.02 0.03 0.04exx
0
0.2
0.4
Σ xx (G
Pa)
σy = 240 MPa
σy = 290 MPa
σy = 340 MPa
σy = 390 MPa
Fig. 14. Macroscopic stress–strain response in uniaxial tension of microstructural domain (e) of Fig. 4 for different values of the matrix yield stress ry.
0 0.01 0.02 0.03 0.04exx
0
0.2
0.4
Σ xx (G
Pa)
SiCSi
Fig. 15. Macroscopic stress–strain response in uniaxial tension of microstructural domain (e) of Fig. 4 for two different types of inclusion.
222 D. Paquet, S. Ghosh / Engineering Fracture Mechanics 78 (2011) 205–225
inclusion properties, but also the post-yield behavior of the matrix and the distribution of second phase inclusions. As a re-sult, silicon carbide reinforced aluminum composites may have a better strain to failure than a cast aluminum alloy contain-ing eutectic silicon inclusions depending on the distribution and shape of inclusions and post-yield behavior of the matrix.
4. Conclusions
In this first of a two part paper on ductile fracture in heterogeneous materials, extensive microstructure based sensitivitystudies are conducted to quantify the effects of loading rates, microstructural morphology and material properties on strainto failure. The locally enhanced VCFEM (LE-VCFEM) for rate-dependent porous elastic–viscoplastic materials is used for two-dimension micromechanical analyses of rate-dependent ductile fracture. The strain to failure is governed by damage nucle-ation due to inclusion cracking that is followed by damage propagation by void nucleation, growth and coalescence in thematrix. This is readily simulated by LE-VCFEM with good accuracy and efficiency. Strain to failure is found to be very sen-sitive to the loading rate, microstructure morphology, and material properties of the matrix and inclusions.
High applied strain rates result in early cracking of inclusions. For a uniform material with a single inclusion in the micro-structural domain, this leads to an increase of strain to failure due to redistribution of micro-stresses in the matrix and inclu-sion. This causes a delay in plastic response and a reduction in void evolution rate in the neighborhood of the crack. However,this inference cannot be generalized to more complex microstructures, in which early cracking may have different influenceon the overall ductile behavior. Strain to failure of heterogeneous alloys is very sensitive to the inclusion morphology andorientation. Large inclusions of high aspect ratio that are oriented along the loading axis are ideal sites for damage nucle-ation. The exponential and power law correlations found between strain to failure and inclusion aspect ratio and size respec-tively delineate this strong sensitivity. On the other hand, damage growth and coalescence in the matrix is affected by thespatial distribution of inclusions rather than by their morphology. Microstructural domains with high levels of clusteringhave significantly lower strain to failure than those with uniform inclusion distribution. An asymptotic correlation betweenstrain to failure and clustering is found from the sensitivity analysis. This implies a reduction in sensitivity with increasinglevel of clustering. Based on the sensitivity study, a model is proposed for strain to failure, incorporating the effects of clus-tering, volume fraction, orientation, shape, size and orientation of inclusions.
D. Paquet, S. Ghosh / Engineering Fracture Mechanics 78 (2011) 205–225 223
The sensitivity analysis also shows that the matrix yield stress and the inclusions failure strength are important determi-nants of ductility. An increase in the matrix yield stress leads to an increase of the maximum tensile stress that is accom-panied by a much lower ductility. The matrix work-hardening exponent on the other hand does not have much effect onductility for the microstructure and material properties considered in this work. Additionally, strain to failure is found tobe very sensitive to the failure strength of inclusions. It is important that a material designer considers both microstructuralmorphology and material properties in optimizing ductility. In part 2 of this paper, the model for strain to failure developedin part 1 is used to successfully predict strain to failure of actual microstructures taken from micrographs of an aluminumalloy A356.
Acknowledgments
This work has been supported by the National Science Foundation NSF Div Civil and Mechanical Systems Division throughthe GOALI Grant No. CMS-0308666 (Program Director: Dr. G. Paulino), by the Department of Energy Aluminum Visions Pro-gram through Grant No. A5997 and by the Army Research Office through Grant No. DAAD19-02-1-0428 (Program Director:Dr. B. Lamattina). This sponsorship is gratefully acknowledged. The authors are grateful to Drs. Steve Harris, John Allison,Xuming Su, and James Boileau of Ford Research Laboratory for invaluable discussions and some micrographs used in thispaper. Computer support by the Ohio Supercomputer Center through Grant No. PAS813-2 is also gratefully acknowledged.
Appendix A
The coefficients used in the LE-VCFEM strain update algorithm are given here. A vector {H} is used for compact represen-tation of the state variables f and r0, i.e.
H1
H2
( )¼
f
r0
� �and
DH1
DH2
( )¼
ð1� f ÞD�p þ AD��pM
hD��pM
( )
where
D��pM ¼�pD�p þ qD�q
ð1� f Þ�rM
The coefficients Aij and bi are obtained following a linearization technique similar to that in [46], but applied to the rate-dependent porous plasticity strain update algorithm. All the quantities are evaluated at the end of the increment. Repeatedindices indicates a summation.
A11 ¼@/vp
@qþ D�p
@2/vp
@Ha@q@Ha
@D�pþ D�q
@2/vp
@Ha@p@Ha
@D�p
A12 ¼@/vp
@pþ D�p
@2/vp
@Ha@q@Ha
@D�qþ D�q
@2/vp
@Ha@p@Ha
@D�q
A13 ¼ D�p@2/vp
@p@q@p
@Dr33þ @
2/vp
@q2
@q@Dr33
þ @2/vp
@Ha@q@Ha
@Dr33
!þ D�q
@2/vp
@p2
@p@Dr33
þ @2/vp
@q@p@q
@Dr33þ @2/vp
@Ha@p@Ha
@Dr33
!
b1 ¼ � D�p@/vp
@qþ D�q
@/vp
@p
� �
A21 ¼ �Dt@ _k
@Ha@/vp
@qþ _k
@2/vp
@Ha@q
!@Ha
@D�p
A22 ¼ 1� Dt@ _k
@Ha@/vp
@qþ _k
@2/vp
@Ha@q
!@Ha
@D�q
A23 ¼ �Dt@ _k@p
@p@Dr33
þ @_k
@q@q
@Dr33þ @ _k
@Ha@Ha
@Dr33
!@/vp
@q� Dt _k
@2/vp
@p@q@p
@Dr33þ @
2/vp
@q2
@q@Dr33
þ @2/vp
@Ha@q@Ha
@Dr33
!
b2 ¼ � D�q � Dt _k@/vp
@q
� �
224 D. Paquet, S. Ghosh / Engineering Fracture Mechanics 78 (2011) 205–225
A31 ¼ D�q �13
1@/vp=@q
@2/vp
@Ha@pþ 1
3@/vp=@p
ð@/vp=@qÞ2@2/vp
@Ha@q
!@Ha
@D�p
A32 ¼ �13@/vp=@p@/vp=@q
þ 32q
r033 þ D�q �13
1@/vp=@q
@2/vp
@Ha@pþ 1
3@/vp=@p
ð@/vp=@qÞ2@2/vp
@Ha@q
!@Ha
@D�q
A33 ¼1Eþ D�q �
13
1@/vp=@q
@2/vp
@p2
@p@Dr33
þ @2/vp
@q@p@q
@Dr33þ @2/vp
@Ha@p@Ha
@Dr33
!
þ13
@/vp=@p
ð@/vp=@qÞ2@2/vp
@p@q@p
@Dr33þ @
2/vp
@q2
@q@Dr33
þ @2/vp
@Ha@q@Ha
@Dr33
!þ 3
2q@r033
@Dr33� 3
2q2 r033@q
@Dr33
!
b3 ¼ �1EðDr33 � mDr11 � mDr22Þ þ D�q �
13@/vp=@p@/vp=@q
þ 32q
r033
� �� �̂constant
� �
with
@p@Dr33
¼ �13;
@q@Dr33
¼ 32q
r033;@r033
@Dr33¼ 2
3
The state variables derivatives are defined as follows [46]:
@Ha
@D�p¼ cab
@DHb
@D�pþ K
@DHb
@p
!;
@Ha
@D�q¼ cab
@DHb
@D�q� 3G
@DHb
@q
!
where c�1ab ¼ dab � @DHa
@Hb .
Appendix B
The coefficients used for stress update in the displacement-based elements of LE-VCFEM formulation are:
A11 ¼@/vp
@qþ D�p K
@2/vp
@p@qþ @2/vp
@q@Ha@Ha
@D�p
!þ D�q K
@2/vp
@p2 þ@2/vp
@p@Ha@Ha
@D�p
!
A12 ¼@/vp
@pþ D�p �3G
@2/vp
@q2 þ@2/vp
@q@Ha@Ha
@D�q
!þ D�q �3G
@2/vp
@q@pþ @2/vp
@p@Ha@Ha
@D�q
!
b1 ¼ �D�p@/vp
@q� D�q
@/vp
@p
A21 ¼ �Dt K@ _k@pþ @ _k
@Ha@Ha
@D�p
!@/vp
@q� Dt _k K
@2/vp
@p@qþ @2/vp
@q@Ha@Ha
@D�p
!
A22 ¼ 1� Dt �3G@ _k@qþ @ _k
@Ha@Ha
@D�q
!@/vp
@q� Dt _k �3G
@2/vp
@q2 þ@2/vp
@q@Ha@Ha
@D�q
!
b2 ¼ �D�q þ Dt _k@/vp
@q
References
[1] Edelson BI, Baldwin Jr WM. The effect of second phases on the mechanical properties of alloys. Trans ASM 1962;55:230–50.[2] Meyers CW, Saigal A, Berry JT. Fracture related properties of A357-T6 cast alloy and their interrelation with microstructure. AFS Trans 1983;35:281–8.[3] Hahn GT, Rosenfield AR. Metallurgical factors affecting fracture toughness of aluminum alloys. Metall Trans A 1975;6A(4):653–68.[4] Gangulee A, Gurland J. On the fracture of silicon particles in aluminum–silicon alloys. Trans Met Soc AIME 1967;239(2):269–72.[5] Frederick SF, Bailey WA. The relation of ductility to dendrite cell size in cast Al–Si–Mg alloy. Trans Met Soc AIME 1968;242(10):2063–7.[6] Caceres C, Griffiths J. Damage by the cracking of silicon particles in an Al–7Si–0.4Mg casting alloy. Acta Mater 1996;44:25–33.[7] Llorca J, Martin A, Ruiz J, Elices M. Particulate fracture during deformation of a spray formed metal–matrix composite. Metall Trans A
1993;24A:1575–88.[8] Guiglionda G, Poole WJ. The role of damage on the deformation and fracture of Al–Si eutectic alloys. Mater Sci Engng 2002;A336:159–69.
D. Paquet, S. Ghosh / Engineering Fracture Mechanics 78 (2011) 205–225 225
[9] Yang J, Cady C, Hu MS, Zok F, Methrabian R, Evans G. Effects of damage on the flow strength and ductility of a ductile Al alloy reinforced with SiCparticulates. Acta Metall Mater 1990;38(12):2613–9.
[10] Lloyd DJ. Aspects of fracture in particulate reinforced metal matrix composites. Acta Metall Mater 1991;39(1):59–71.[11] Li M, Ghosh S, Richmond O, Weiland H, Rouns T. Three dimensional characterization and modeling of particle reinforced metal matrix composites part
I: quantitative description of microstructural morphology. Mater Sci Engng 1999;265:153–73.[12] Li M, Ghosh S, Richmond O, Weiland H, Rouns T. Three dimensional characterization and modeling of particle reinforced metal matrix composites part
II: damage characterization. Mater Sci Engng 1999;266:221–40.[13] Caceres C, Davidson C, Griffiths J. The deformation and fracture behaviour of an Al–Si–Mg casting alloy. Mater Sci Engng 1995;A197:171–9.[14] Caceres C, Griffiths J, Reiner P. The influence of microstructure on the bauschinger effect in an Al–Si–Mg casting alloy. Acta Mater 1996;44:15–23.[15] Caceres C. Particle cracking and the tensile ductility of a model Al–Si–Mg composite system. Aluminum Trans 1999;1:1–13.[16] Wang Q, Caceres C, Griffiths J. Damage by eutectic particle cracking in aluminum casting alloys A356/357. Metall Mater Trans A 2003;34A:2901–12.[17] Wang Q. Microstructural effects on the tensile and fracture behavior of aluminum casting alloys A356/357. Metall Mater Trans A 2003;34A:2887–99.[18] Ghosal A, Narasimhan R. Mixed-mode fracture initiation in a ductile material with a dual population of second-phase particles. Mater Sci Engng
1996;A211:117–27.[19] Steglich D, Brocks W. Micromechanical modeling of the behavior of ductile materials including particles. Comput Mater Sci 1997;9:7–17.[20] Lim L, Dunne F. Modeling void nucleation and growth processes in a particle-reinforced metal matrix composite material. Comput Mater Sci
1996;5:177–86.[21] Negre P, Steglich D, Brocks W, Kocak M. Numerical simulation of crack extension in aluminium welds. Comput Mater Sci 2003;28:723–31.[22] Huber G, Brechet Y, Pardoen T. Predictive model for void nucleation and void growth controlled ductility in quasi-eutectic cast aluminium alloys. Acta
Mater 2005;53:2739–49.[23] Llorca J, Gonzalez C. Microstructural factors controlling the strength and ductility of particle-reinforced metal–matrix composites. J Mech Phys Solids
1998;46:1–28.[24] Llorca J, Segurado J. Three-dimensional multiparticle cell simulations of deformation and damage in sphere-reinforced composites. Mater Sci Engng
2004;A365:267–74.[25] Kiser M, Zok F, Wilkinson D. Plastic flow and fracture of a particulate metal matrix composite. Acta Metall Mater 1996;9:3465–76.[26] Moorthy S, Ghosh S. Adaptivity and convergence in the Voronoi Cell finite element model for analyzing heterogeneous materials. Comput Method Appl
Mech Engng 2000;185:37–74.[27] Ghosh S, Ling Y, Majumdar B, Kim R. Interfacial debonding analysis in multiple fiber reinforced composites. Mech Mater 2000;32:561–91.[28] Li S, Ghosh S. Extended Voronoi Cell finite element model for multiple cohesive crack propagation in brittle materials. Int J Numer Methods Engng
2006;65:1028–67.[29] Li S, Ghosh S. Multiple cohesive crack growth in brittle materials by the extended Voronoi Cell finite element model. Int J Fract 2006;141:373–93.[30] Moorthy S, Ghosh S. A Voronoi Cell finite element model for particle cracking in elastic–plastic composite materials. Comput Method Appl Mech Engng
1998;151:377–400.[31] Ghosh S, Moorthy S. Particle fracture simulation in non-uniform microstructures of metal–matrix composites. Acta Mater 1998;46:965–82.[32] Hu C, Ghosh S. Locally enhanced Voronoi Cell finite element model (LE-VCFEM) for simulating evolving fracture in ductile microstructures containing
inclusions. Int J Numer Methods Engng 2008;76:1955–92.[33] Li M, Ghosh S, Richmond O. An experimental–computational approach to the investigation of damage evolution in discontinuously reinforced
aluminum matrix composite. Acta Mater 1999;47:3515–32.[34] Ghosh S, Mukhopadhyay S. A two dimensional automatic mesh generator for finite element analysis of random composites. Comput Struct
1991;41:245–56.[35] Zienkiewicz O, Zhu J. The superconvergent patch recovery and a posteriori error estimates. Part 1: the recovery technique. Int J Numer Methods Engng
1992;33:1331–64.[36] Chu CC, Needleman A. Void nucleation effects in biaxially stretched sheets. J Engng Mater Technol 1980;102:249–56.[37] Tvergaard V, Needleman A. Analysis of cup-cone fracture in a round tensile bar. Acta Metall 1984;32:157–69.[38] Tvergaard V, Needleman A. Effect of nonlocal damage in porous plastic solids. Int J Solids Struct 1995;32:1063–77.[39] Gurson A. Continuum theory of ductile rupture by void nucleation and growth. J Engng Mater Trans ASME 1977;99:2–15.[40] Tvergaard V. Influence of voids on shear band instabilities under plane strain conditions. Int J Fract Mech 1981;17:389–407.[41] Perzyna P. Fundamental problems in viscoplasticity. Adv Appl Mech 1966;9:243–377.[42] Ghosh S, Kikuchi N. An arbitrary Lagrangian–Eulerian finite element method for large deformation analysis of elastic–viscoplastic solids. Comput
Method Appl Mech Engng 1991;86:127–88.[43] Hill R. On constitutive macro-variables for heterogeneous solids at finite strain. Proc Roy Soc Lond 1972;326:131–47.[44] Kroner E. Statistical modeling. In: Gittus JZJ, editor. Modeling small deformations of polycrystals. London: Elsevier; 1986. p. 229–91.[45] Green AE, Naghdi PM. A general theory of an elastic–plastic continuum. Arch Ration Mech Anal 1965;18:251–81.[46] Aravas N. On the numerical integration of a class of pressure-dependent plasticity models. Int J Numer Methods Engng 1987;24:1395–416.[47] Kwon D, Lee S, Roh B-I. Strain-rate effects on high-temperature fracture behavior of a 2124Al–SiCw composite. Metall Trans A 1993;24A:1125–993.[48] Ghosh S, Nowak Z, Lee K. Quantitative characterization and modeling of composite microstructures by Voronoi cells. Acta Mater 1997;45:2215–34.[49] Wray PJ, Richmond O, Morrison HL. Use of the dirichlet tessellation for characterizing and modeling nonregular dispersions of second-phase particles.
Metallography 1983;16:39–58.[50] Pyrz R. Correlation of microstructure variability and local stress field in two-phase materials. Mater Sci Engng 1994;A177:253–9.[51] Everett RK. Quantification of random fiber arrangements using a radial distribution function approach. J Compos Mater 1996;30(6):748–58.[52] Ghosh S, Valiveti D, Harris S, Boileau J. A domain partitioning based pre-processor for multi-scale modeling of cast aluminum alloys. Modell Simul
Mater Sci Engng 2006;14:1363–96.


![[D. Broek] Elementary Engineering Fracture Mechanics](https://img.pdfslide.net/doc/110x75/544fc455b1af9f07188b4595/d-broek-elementary-engineering-fracture-mechanics.jpg)
![Deformation and Fracture Mechanics of Engineering Material [RichardW.hertzberg]](https://img.pdfslide.net/doc/110x75/5695d03c1a28ab9b029195f8/deformation-and-fracture-mechanics-of-engineering-material-richardwhertzberg.jpg)