Embed Size (px)
Citation preview
1996 SCA Conference Paper Number 9639
CORE PETROPHYSICAL GROUPS IN W G G Y CARBONATE RESERVOIRS
H. N. Greder, B. Ferreol, L. Sabatier, F. M. Pelterin
Elf Aquitaine Production
ABSTRACT
An important step when developing a reservoir description is to provide a subdivision of the cored intervals into groups whch are precisely characterized in terms of petrophysical properties and whch have enough geological significance to be used for aerial extrapolation. However in many practical cases, such a subdvision is often guided by geological factors and less consideration is paid to the petrophysical behaviors.
This study explains how a robust subdivision was obtained in a vuggy carbonate oil reservoir. This subdivision was based on physical parameters measured on cores and satisfies the previously stated objectives.
We focused on four parameters: Porosity, Gas Permeability, Grain Density and Cementation Factor for two major reasons. Firstly, measurements of these parameters can be easily obtained on a large number of representative core samples. Secondly, porosity and permeability are related to reservoir quality whereas grain density and cementation factor are related to geological factors, which are easier to describe for lateral continuity. Grain density is directly related to lithology and the cementation factor is related to the intensity of dissolution in vuggy carbonates. Hence, measurements of these parameters were performed on more than seven hundred core samples representative of the reservoir. A clustering technique based on Ward's minimum variance method was then applied to the four parameter values to &vide the core data set into five groups (so called Petrophysical Groups). The dispersion of each parameter is relatively narrow within each group. Representative capillary pressure and relative permeability data, enabled us to characterize each group in terms of water saturation and relative permeability in a consistent and reliable way.
Thls robust and quantitative sub&vision was then compared with a more conventional one (so called lithofacies subdivision) whch was based on a visual geological description of the cores, thin section observations and porosity values. We found that, on a geological point of view, the Petrophysical Groups were as significant as the (( old fashoned >) lithofacies. This suggests that, compared with the conventional lithofacies, the geologist will not find it more difficult to estimate the lateral continuity of these groups. The study proves that a quantitative subdivision allows a more precise characterization of the productive zones in terms of porosity, permeability and initial water saturation. Moreover, the petrophysical groups take into account the connectivity and the amount of vugs in the reservoir much better than the classical subdivision and tkis is essential for the assignment of relative permeability curves in a vuggy environment.
1996 SCA Conference Paper Number 9639
INTRODUCTION
More and more productive reservoirs are characterized by hghly variable petrophysical properties due to complex combinations of sedimentary and diagenetic effects. Hence, it is more and more &fficult for the production geologst to determine the relationship between sedimentologicd features and petrophysical properties in reservoir modeling. Deterministic approaches where petrophysical properties are assigned through maps of sedimentological facies have proven their limits in such reservoirs because they are not enough discriminant in terms of reservoir properties. An alternative to this deadlock, consists in providing production geologists with a subdivision of cored intervals into consistent petrophysical groups and to h d out, with the assistance of a sedimentologist the geological parameters that discriminate the various petrophysical behaviors. Such a team effort contributes to the construction of more accurate reservoir models (Greder et al., 1995, Petit et al., 1995).
In this paper, we explain how we obtained this sGbdivision of cored intervals in a complex lithological formation.
CONSTRUCTION OF THE PETROPHYSICAL GROUPS
The focus is on albian series characterized by a mixed platform environment with a very flat paleotopography allowing all sedimentary events to be recorded. Dlagenesis (mainly dolornitization and oo'id dissolution) is an early process, mainly controlled by the paleotopography prevailing during deposition time. Sandstone facies and vuggy dolomites are dominant in this formation. Four wells were cored continuously and conventional laboratory measurements were performed on small core plugs sampled regularly, every foot. The samples were washed with chl~roform and dried at 80°C for several days. Gas permeability (Kg) and grain density (p) were measured. Porosity (4) and the formation factor (FF) were measured by fully saturating the samples with brine. The factor of cementation (m) was then computed (FF=l/$").
At this point, all the measurements belonged to a common data set. Our objective was to classify the data into groups according to the four properties (Kg, 0, p, m). The difkent steps of the subdivision are explained below and summarized in Figure 1.
1. Firstly, on the general porosityfpermeability plot which represents all the samples, anomalous measurements were detected (see Figure 1, top). Some anomalous measurements were performed twice for quality control revealing that the permeability had been overestimated. Permeability measurements of these samples were therefore eliminated.
2. Secondly, all the samples with low permeability values (less than 0.1 mD) were classified into a special group (called group # 0). This group will later be used in well log analysis to determine the net to gross. The 0.1 cutoff value was chosen because conventional permemeters are not precise for values less than 0.1 rnD.
3. The remaining porosityfgrain density plot (Figure 1) shows two trends. This plot can be separated into two families by using a cutoff of 2.78 gfcm3 on grain density.
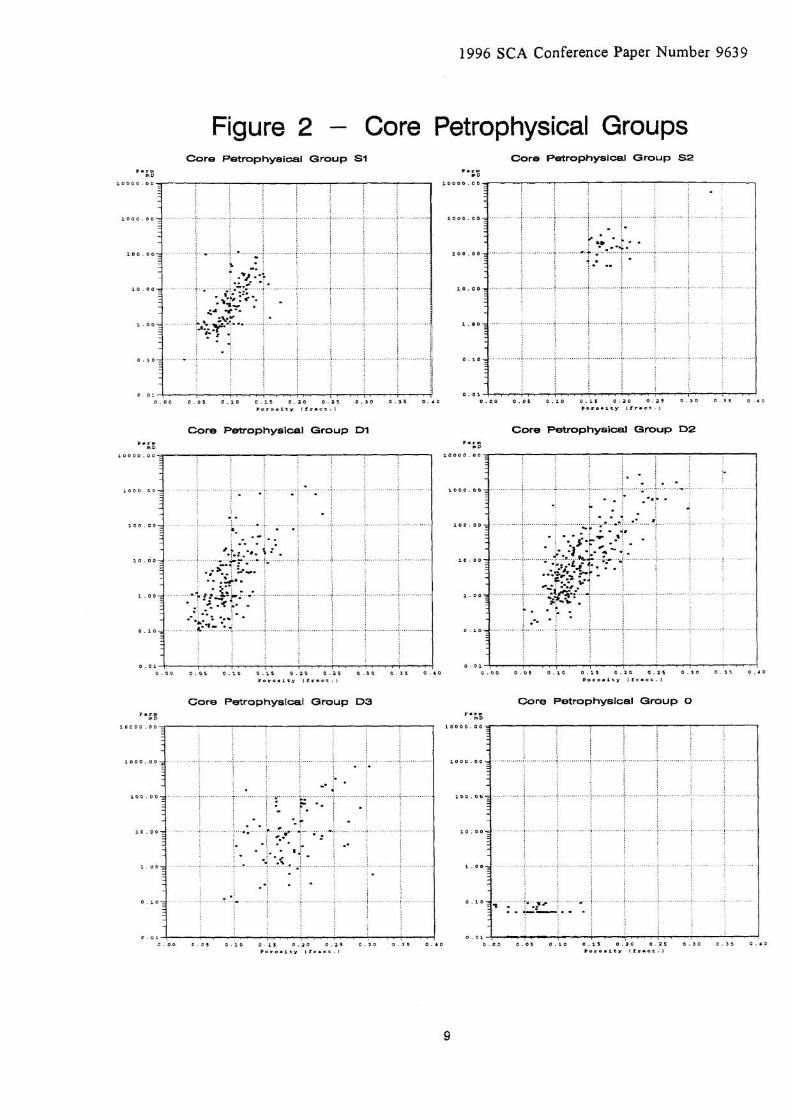
4. By studying the porosity/permeability plot and the cementation factorfporosity plot (figure 1, bottom), the samples with high grain density values can be divided into three groups. The first group (D 1) is composed of the samples that have a cementation factor less than 2.05 while the second (D2) contains the samples with values of m between 2.05 and 2.35. The last group (D3) contains samples with higher values of m. The first two groups (Dl and D2) show rather good correlations between porosity and permeability whereas the more porous one shows a very poor one (Figure 2). The 2.35 value for the factor of cementation - chosen to demarcate group D2 and D3 - is the best choice to separate samples where a poro/perrn relationshp stands and samples where permeability and porosity are considered to be independent parameters.
1996 SCA Conference Paper Number 9639
5. The data set with core samples having grain density values mferior to 2.78gJcm3 was divided into two groups because the poro/perm relationship showed two different trends. A statistical clustering technique (see Appendix A) based on three parameters (porosity, log1 0 of permeability and grain density) was used to demarcate the two groups S1 and S2 (see Figure 2, top). The more porous samples have the lowest grain density values.
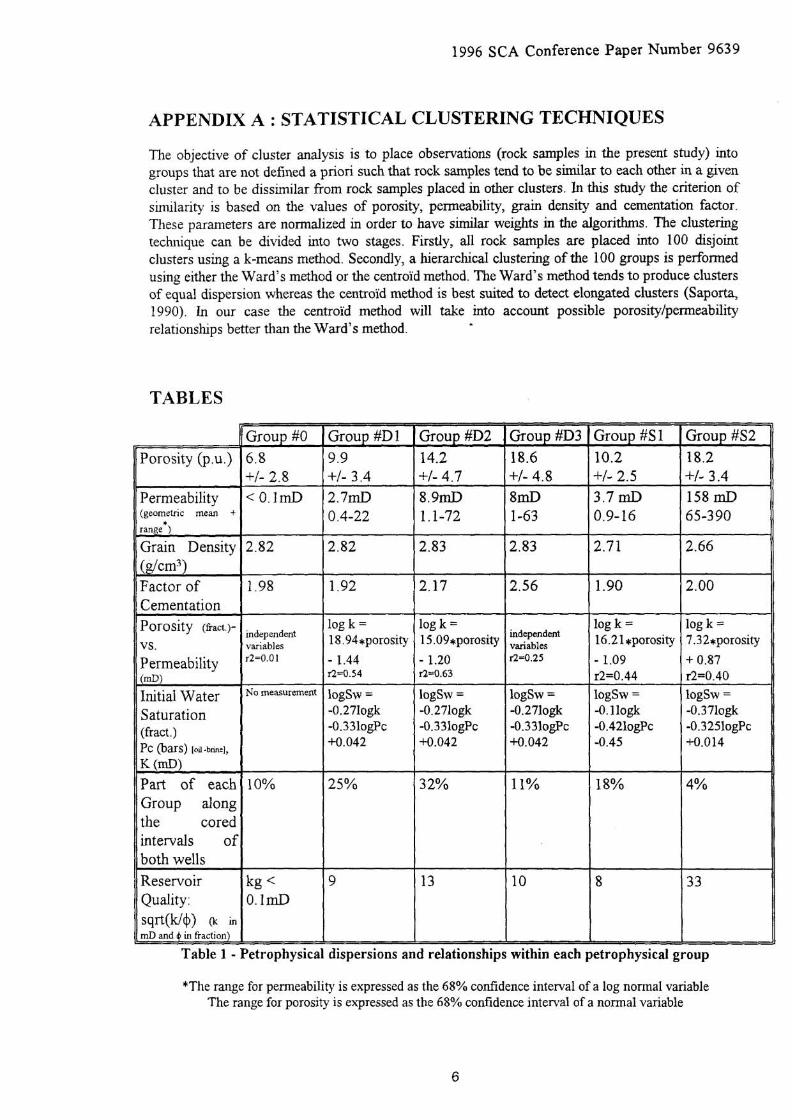
At the end of thls stage, all the characteristics of the six groups were computed (see tablel). Four groups (0, D l , D2, D3) have a hgh average value for grain density (2.83 glcc) close to the one of pure dolomite(2.87g/cc). Groups S1 and S2 have lower values for grain density closer to the one of quartz (2.65glcc). Group D3 has the worst porositylpermeability relationshp for reasons that will be explained below.
CHARACTERIZATION OF THE GROUPS IN TERMS OF INITIAL WATER SATURATION AND RELATIVE PERMEABILITIES
Petrophysical groups are intended as a basis for the construction of Rock-Types in reservoir modeling and must therefore be characterized in terms of water saturation and relative permeabilities. Such experiments can only be conducted on a limited number of sampIes for cost reasons. Therefore samples representative of the groups were selected.
Capillary Pressure Measurements
Adbrine drainage capillary pressure measurements were performed in lab concbtions with the classical restored state technique on samples representative of the preceding groups. OiYbrine drainage capillary pressure measurements were also performed under isotropic stress and temperature on a limited number of samples. For each group, we derived a relationship law between water saturation, permeabiIity and capilIary pressure (see Table 1).
Relative Permeabilities derived from waterflooding experiments
Waterflooding experiments were conducted on large vertical full size samples (diameter IOcm, length 20cm). One to three representative full size samples per petrophysical groups were selected (except for petrophysical group #O). Their homogeneity was controlled through scanner analysis.
Waterflooding experiments were conducted at two different rates on each sample : a high flow rate and a low flow rate. A constant water injection rate was applied during these experiments. In the hlgh flow rate case, capillary effects are negligible compared to the viscous forces. The injection rate for the low flow rate case is chosen so that the front velocity is equivalent to the reservoir one and capillary forces are no longer negligible.
Each sample was set into a core holder cell under an hydrostatic confining pressure of 100 bars. Cyclic cleaning was acheved with miscible solvents (toluene and isopropanol) in order to extract from the rock the heavy oil, then the light oil as well as possible salt. Cleaning was finished by isopropanol to exqract water from the sample and drying was realized by nitrogen circulation. The sample had then been MIy saturated with a recombined brine similar to the one of the reservoir and flooded with a neutral viscous oil in order to set the irreducible brine saturation. Wettability was restored by replacing the neutral oil by stock tank oil and aging the sample several days under reservoir temperature and back pressure. Stock tank oil was flushed by neutral oil to stop the aging process. The waterfloodmg is the displacement of thls neutral oil by a recombined brine. This displacement is conducted under reservoir temperature and with the use of a back pressure. Oil and water productions as well as the pressure drop are recorded during the waterfloodmg experiments.
Relative permeabilities are determined through history matchmg of experimental data with a one dimensional black oil model. The history matching of high rate and low rate waterflooodings has to be achieved with the same relative permeabilities and capillary pressure curves. Some hfferences
1996 SCA Conference Paper Number 9639
may occur. In this case, a critical analysis of the waterflooding results must be performed to provide the best set of curves.
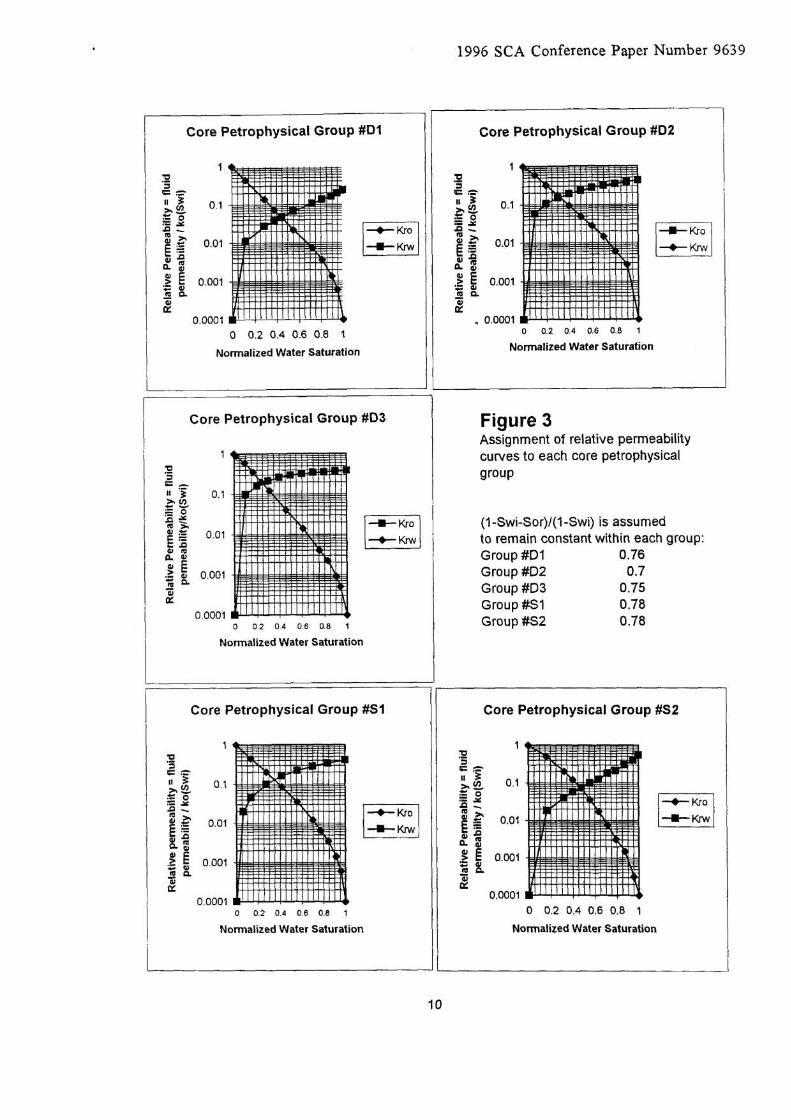
For each petrophysical group, we were able to define a constant value for the oil recovery and for Kw(Sor)/Ko(Swi) (see Figure 3). The shapes of the relative permeability curves were consistent within each group and enabled us to assign a set of curves valid for each group (see Figure 3).
GEOLOGICAL CHARACTERIZATION OF THE GROUPS
As explained earlier, no geological information was used to define the petrophysical groups. However, the petrophysical groups must have a geological sigmficance in reservoir modeling for aerial extrapolation accross the reservoir. For t h s purpose a geologist was asked to perform a quick macrolithological description of all rock samples. For each sample, the dominant facies (dolomite or sandstone) was indexed as well as the amount of vugs. With this last objective in mind, vugs were classified into three types depending on their average width : vugs less than 21nm wide, vugs between 2 and 5 mrn and vugs wider than 5 mm. The amount of each type of vugs was evaluated qualitatively from 0 to 3 . For a given sample and a given type of vug, 0 means that the geologist did not see any vug of this type whereas 3 means that he saw a lot of them.
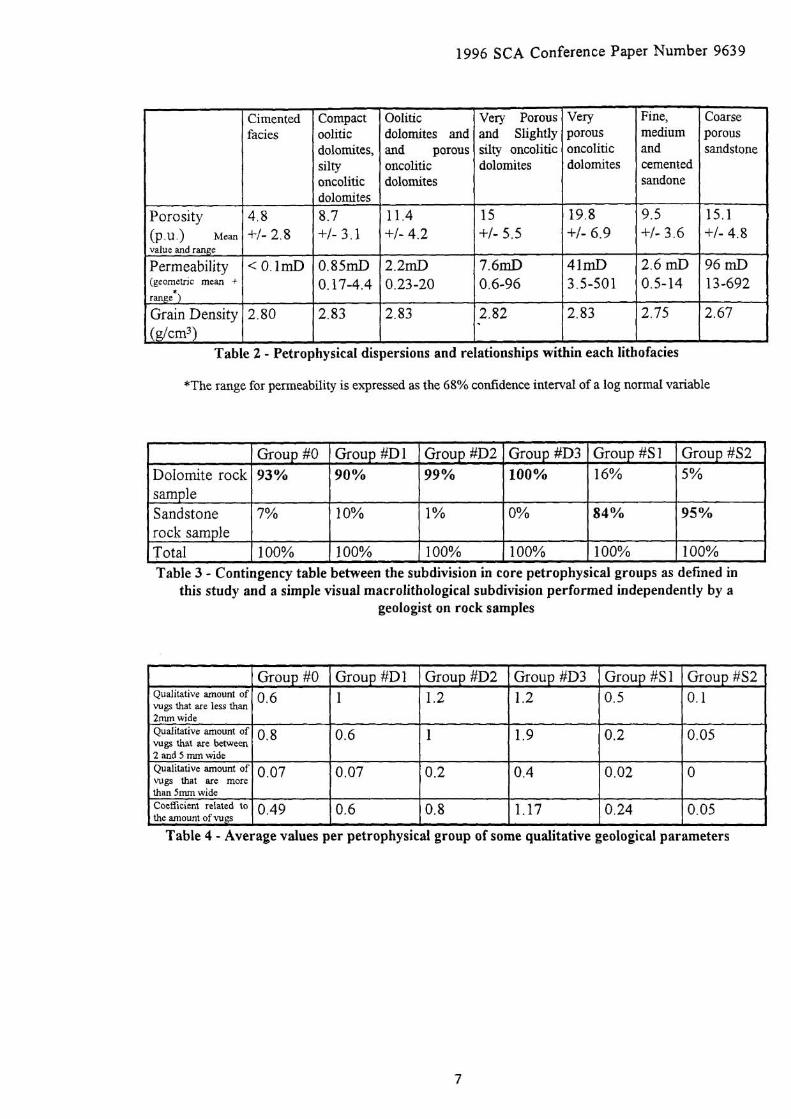
Table 3, clearly shows that 4 out of the 6 groups correspond to dolomite types of facies whereas the two others correspond to sandstones. Thls means that petrophysical groups are somehow related to lithological facies .
Table 4 shows that among groups that are dolomite dominant (Dl, D2, D3), the amount of vugs is a discriminant variable. Group D3 sigmficantly contains more vugs than group D2 and Dl . Therefore these groups correspond to oncolitic or oolitic intervals in the reservoir where diagenesis acted differently. Thls piece of mformation is crucial for the geologist because if he can predict the areas where dissolution effects were important across the reservoir, he will then be able to map the petrophysical groups.
Hence, we can conclude at this point that the petrophysical groups have a sedimentological and diagenetic meaning. This suggests that mapping petrophysical groups will be as easy (or as difficult) as mapping regular geological facies across the reservoir.
PETROPHYSICAL DISPERSION OF LITHOFACIES
In order to quantifj; the advantages of thls petrophysical subdivision of reservoir intervals for the construction of reservoir models, a former classical subdivision based on geological parameters was analyzed. Twenty geological facies were first identified on cores and were then grouped into seven ensembles for reservoir modeling purposes as the number of Rock-Types in a model must be limited limited. Table 4 shonrs the dispersions of porosity and permeabilrty within these seven ensembles. Firstly, let us study the sandstone type of facies in the petrophysical subdivision (S 1 and 52) and the facies entitled (( fine, medium and cemented coarse sandstones )) and coarse porous sandstones )) in the classical subdivision. The comparison of the last two columns of table 1 and 2 shows that porosity values are more dispersed in the classical facies. Permeability dispersion w i h the t( coarse porous sandstone )) facies is more important than within the S2 facies.
For the facies where dolomite is dominant (petrophysical groups Dl , D2, D3 and four lithofacies), it can also be noticed that porosity and permeability hspersions within lithofacies are more important than within the petrophysical groups. The use of petrophysical groups can therefore yield to a more precise assignment of petrophysical properties in reservoir modeling.
1996 SCA Conference Paper Number 9639
CONCLUSIONS
1. This study presented a subdivision into petrophysicd groups of the cored intervals of a complex formation. Thls subdivision was based on 4 quantitative parameters (porositJI, absolute permeability, grain density and factor of cementation). The fictor of cementation enabled us to discriminate different petrophysical behaviors in vuggy carbonates. This subdvision was based on quantitative parameters without geological input.
2. Such a robust subdivision is very useful in special core analysis. Costly and special measurements performed on samples representative of these groups are most unlikely to yield useless redundant information because all groups are different from one another as regards flow properties. Resampling on a geological parameter is not always reliable if the geological parameter is not related to flow properties. For example, in the present study, the fact that wgs originate from oo1d dissolution instead of oncolit dissolution has very littie impact on flow properties.
3. Each petrophysical group has a geological meaning related to both sedirnentological and diagenetic effects. The intensity of dissolution has an important h c t i o n in the differentiation of the petrophysical groups. If a geologist can map the trends of d~ssolution, he wiIl be able to map the groups in three dimensions.
4 . Dispersion of petrophysical properties within petrophysical groups is less than within geologcal facies, resulting in a more precise assignment of flow properties in reservoir models.
ACKNOWLEDGEMENTS
The authors would like to ackowledge Thibault Huon de Kermadec fiom the Ecole Centrale de Paris for his participation in this work and also Michel Thomas, Nicolas Kessler and Philippe Retail from Elf for helpll discussions on reservoir modeling.
REFERENCES CITED
Greder, H. N., Caline, B., Petit, F. M., Pellerin, F. M. : cr Constructing Core Petrophysical Groups : A Key Step to Reconcile Petrophysical and Geological Core Data in Reservoir Modeling )> SCA paper #9517, SCA annual Symposium, Sept. 12-14, 1995.
Petit, F. M., Caline, B., Greder, H. N. : cc Multi-Step Geostatistical Modeling of a Complex Reservoir Based on Quantdied Sedimentary Models and Charaterization of Core Petrophysical Groups )), SPE 30618, presented at the SPE Annual Technical Conference & Exhibition held in Dallas, U. S. A., Oct. 22-25, 1995.
Saporta, G., 1990 : (( Probabilites, Analyse des Donnees, et Statistique )) Editions T e c h p , ISBN 2- 7108-0565-0, p. 241.
1996 SCA Conference Paper Number 9639
APPENDIX A : STATISTICAL CLUSTERING TECHNIQUES
The objective of cluster analysis is to place observations (rock samples in the present study) into groups that are not defined a priori such that rock samples tend to be similar to each other in a given cluster and to be dissimilar from rock samples placed in other clusters. In this study the criterion of similarity is based on the values of porosity, permeability, grain density and cementation factor. These parameters are normalized in order to have similar weights in the algorithms. The clustering technique can be divided into two stages. Firstly, all rock samples are placed into 100 disjoint clusters using a k-means method. Secondly, a hierarchical clustering of ?he 100 groups is performed using either the Ward's method or the cent~o'id method. The Ward's method tends to produce clusters of equal dispersion whereas the centro'id method is best suited to detect elongated clusters (Saporta, 1990). In our case the centrold method will take into account possible porosity/permeability relationships better than the Ward's method.
TABLES
Permeability (geometric mean +
L range )
Grain Density
js/cm3> Factor of Cementation
Porosity (&act.)-
VS.
Permeability (mD)
Initial Water Saturation (fract. ) PC (bars) [nil -brine],
< K (mD) Part of each Group along the cored intervals of both wells
Reservoir Quality:
sqrt(W0) (k in mD and 4 hi fraction)
Table 1 -
' Group #O 6.8 +/- 2.8 < 0. ImD
independent ' variables rZ=O.Ol
No measurement
Petrophysica
Group #D 1 1 Group #D2 1 Group #D3 1 Group #S 1 1 Group #S2
log k = 7.32*porosity + 0.87
I r2=0.40
1.92 2.17 2.56 1.90
log k = 18.94 *porosity - 1.44 r2=0.54
dispersions and relationships within each petrophysical group
IogSw = -0.2710gk -0.3310gPc M.042
*The range for permeability is expressed as the 68% confidence intenal of a log normal variable The range for porosity is expressed as the 68% confidence interval of a normal variable
log k = 15.09*porosity - 1.20 r2=0.63
logSw = -0.2710gk -0.3310gPc +0.042
independent variables r~=0.25
log k = 16.21*porosity - 2.09 r2=0.44
logSw = -0.2710gk -0.3310gPc M.042
logSw = -0. llogk -0.4210gPc -0.45
10gSw =
-0.3710gk -0.32510gPc +0.014
1996 SCA Conference Paper Number 9639
*The range far permeability is expressed as the 68% confidence interval of a log normal variable
Table 2 - Petrophysical dispersions and relationships within each lithofacies
Fine, medium and cemented sandone
9.5 +I-3.6
2.6 rnD 0.5-14
2.75
Very porous oncolitic dolomites
19.8 +I-6.9
41mD 3.5-501
2.83
Table 4 - Average values per petrophysical group of some qualitative geological parameters
Coarse porous sandstone
15.1 +I-4.8
96 mD 13-692
2.67
Porosity ( p . ~ . ) value and range
Permeability (geometric mean
* range
Grain Density (g/cm3)
Oolitic dolomites and and porous oncolitic dolomites
11.4 +I-4.2
2.2mD 0.23-20
2.83
Table 3 - Contingency table between the subdivision in core petrophysical groups as defined in this study and a simple visual macrolithological subdivision performed independently by a
geologist on rock sampIes
Group #S 1 16%
84%
100%
Dolomite rock sample Sandstone rock sample Total
Group #S2 0.1
0.05
0
0.05
Ve~y Porous and Slightly silty oncolitic dolomites
15 +/- 5 . 5
7.6mD 0.6-96
2.82
Cimented facies
4.8 +/-2.8
< 0. lmD
2.80
Group #S2 5%
95 %
100%
Group #D 1 90%
10%
100%
Group #O 93%
7%
100%
Qualitative amount of wgs that are less than 2mm wide Qualitative amount of vugs that are between 2 and 5 mrn wide Qualitative amount of wgs that are more than 5mm wide Coescient related to , the amount of vugs
Compact oolitic dolomites, silty oncolitic dolomites 8.7 +/-3.1
0.85mD 0.17-4.4
2.83
Group #Dl 1
0.6
0.07
0.6
Group #O 0.6
0 8 '
0 07 '
0.49
Group #D2 99 %
1%
100%
Group #D3 100%
0%
100%
Group #D2 1.2
1
0.2
0.8
Group #D3 1.2
1.9
0.4
1.17
Group #S1 0.5
0.2
0.02
0.24
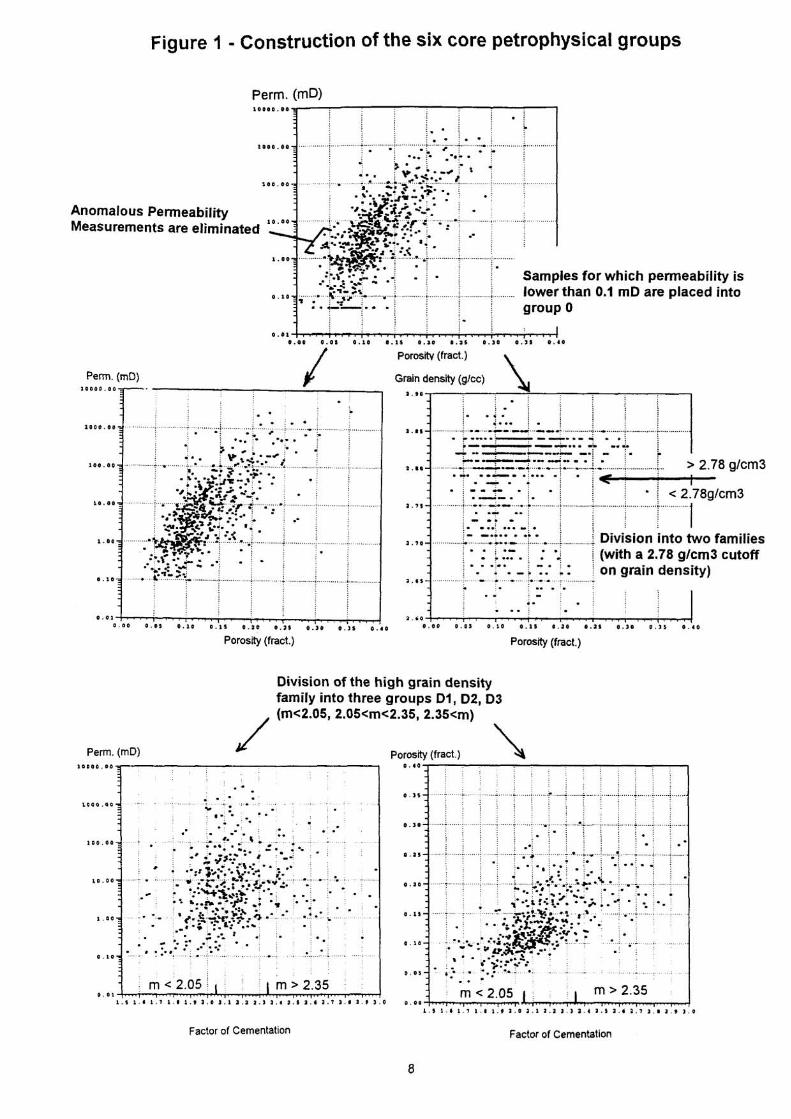
Figure 1 - Construction of the six core petrophysical groups
Porosity (fract.) Porosity (fract.)
Perm. (mD) 1 0 0 0 0 . 0 0
! . :
Division of the high grain density family into three groups Dl , D2, D3 , (rn<2.05, 2.05cm<2.35, 2.35<rn)
1 0 0 o ~ O o ~
P e n . (mD)
: . j - - . / . - ;. . : .. . . . . . . . . . . . . . . .. ....... ... . """"" " .*. "' "... I . j :. - i * ! * * ; ... a. *-a- .
Porosity (fract.) \
Anomalous Permeability Measurements are eliminated
for which permeability is n 0.1 rnD are placed into
4 . 1 0 4 . 1 s 0 0 0 . 1 s 0 . 3 0 0 . 9 s 0 . 4 0
Porositv (fract.)
Penn. (mD) Grain density (glcc) 1 0 0 0 P . 0 0
2 . 1 0 I :
: - :
. . . : 5 . i
................. ....... ............. ........ ........................ .................... .... .............. i... : I i ~ 0 0 * . 0 0 ~ ...: : .
. . . . I -......... . > * .:.. .- e - 7 j a , , * - a *-.-...--- *..* - .---..;I< --*.- i ; . . ; . i . - . . i '.----+-..-.; .. i .
" - . i ...... .......... ......,.. ......... ............ ............. .... ........... ................ l o o . o o l j. * . - - i i , . , , - ;- .,.,....,..,... + -.......- .+ ., i > 2.78 glcm3 . - ..+. *.;--. .;... -: ; : . . I - I / - - - . : I j : . : / .j-. i t i
1 0 . 00 . . . . . . . ...... ........... ....... .-.-....... .............. .............. . . i 1 . 1 % - i ....- *.. -- i .; i i j . 1 < 2.78glcm3
...a H /
: - . . - j ... j . ..1 -:. j . :- -.... .i r j ......... . ............... ................................. L ...............- . .+.. 1 Division into two families
j . . l l - : . .; I
. i . j : . ' * * * . ' . 3
. ..*"- .; . j (with a 2.78 glcm3 cutoff - - * .* . I . . . * . : I . ; . ..... . . . ; - : on grain density)
............ .............. .............. ............... ......--........ . 0 . 1 0 - .......... t3L..:.'i, , .............. ............. ; j 1 , ( 1 - - .*. --... ..*..* * -. .. * . - .. . -
. . . . . . . . . . . . 0 . 0 1 . . . . , , , , . . , , . , , ' a . .o
0 . 0 0 0 . 0 5 0 . 1 0 0 . 1 5 0 . 2 0 0 . 2 1 0 . 3 0 0 . J I 0 . 4 0 0 . 0 0 0 . 0 1 0 . 1 0 0 . 1 1 0 . 2 0 0 . 1 s 0 . 1 0 0 . 3 5 0 . 4 0
Factor of Cementation Factor of Cementation
1996 SCA Conference Paper Number 963 9
Figure 2 - Core Petrophysical Groups Core Petrophysical Group S1
* . r m m B
Core Petrophpical Group 52 P.=n n D
Core PetrophysicBl Group Dl P.rm a n
Core Petrophysical Group D2 P.rn no
1996 SCA Conference Paper Number 9639
S 3 EL'
[ I 3 0.1 =c ;r 0 - y P ,
0.01
m u - d
I Core Petrophysical Group #Dl
-
Normalized Water Saturation
Core Petrophysical Group #D2
0 0.2 0.4 0.6 0.8 1
Normalized Water Saturation
Core Petrophysical Group #D3
Normalized Water Saturation
Figure 3 Assignment of relative permeability curves to each core petrophysical group
( I -Swi-Sor)/(l -Swi) is assumed to remain constant within each group: Group #Dl 0.76 Group #D2 0.7 Group #D3 0.75 Group #S1 0.78 Group #S2 0.78
Core Petrophysical Group #S1
Normalized Water Saturation
Core Petrophysical Group #S2
4
0 0.2 0.4 0.6 0.8 1
Normalized Water Saturation


![International Journal of Engineering RESEARCH · carbonate oil reservoirs [15-17] is their natural fracture networks. Oil is mainly stored in these fractured carbonate reservoirs](https://img.pdfslide.net/doc/110x75/5f237153f145bd1f082637d4/international-journal-of-engineering-carbonate-oil-reservoirs-15-17-is-their-natural.jpg)