Embed Size (px)
DESCRIPTION
EOR in Fractured Carbonate Reservoirs – low salinity low temperature conditions. By Aparna Raju Sagi, Maura C. Puerto, Clarence A. Miller, George J. Hirasaki Rice University Mehdi Salehi, Charles Thomas TIORCO April 26, 2011. Outline. EOR strategy for fractured reservoirs - PowerPoint PPT Presentation
Citation preview
EOR in Fractured Carbonate Reservoirs – low salinity low temperature conditions
By
Aparna Raju Sagi, Maura C. Puerto, Clarence A. Miller, George J. Hirasaki
Rice University
Mehdi Salehi, Charles Thomas
TIORCO
April 26, 2011
Outline
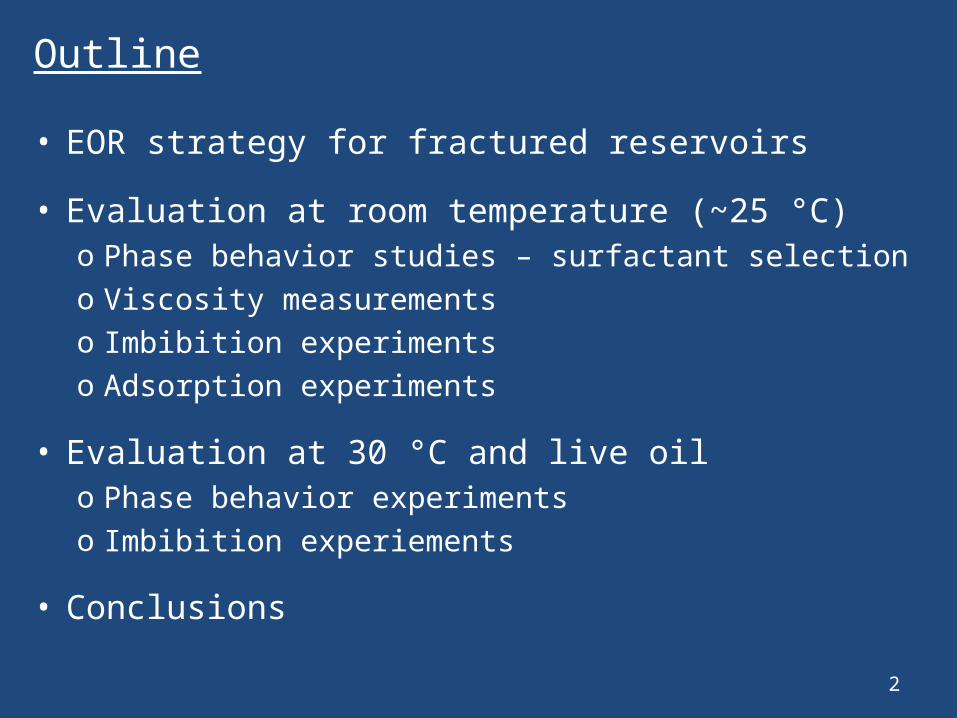
• EOR strategy for fractured reservoirs
• Evaluation at room temperature (~25 °C)o Phase behavior studies – surfactant selectiono Viscosity measurementso Imbibition experimentso Adsorption experiments
• Evaluation at 30 °C and live oilo Phase behavior experimentso Imbibition experiements
• Conclusions
2

3
EOR strategy
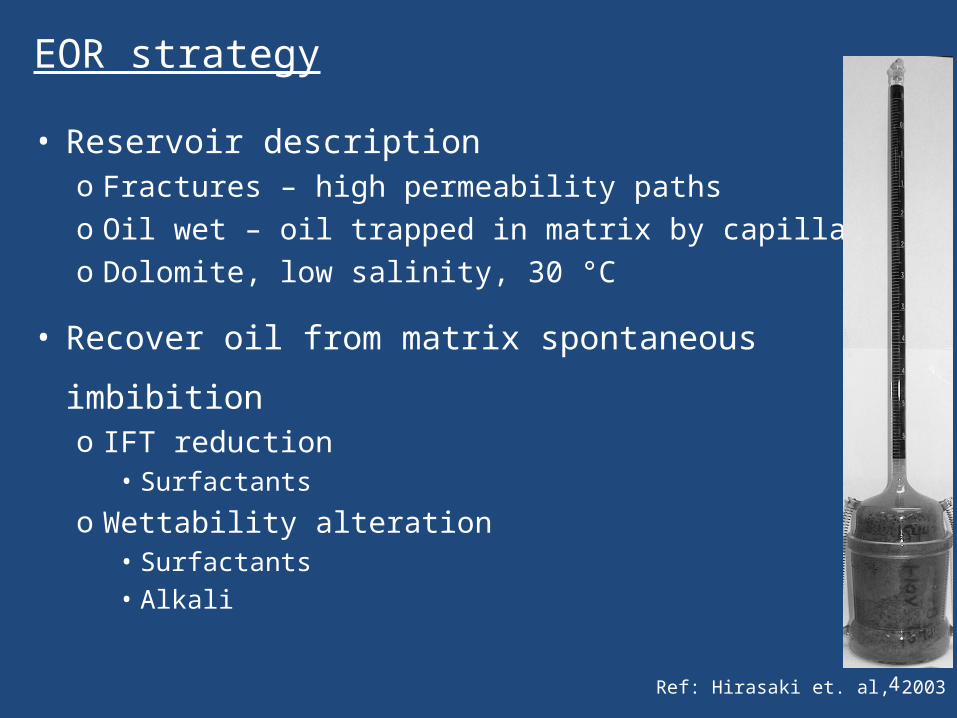
• Reservoir description o Fractures – high permeability pathso Oil wet – oil trapped in matrix by capillarityo Dolomite, low salinity, 30 °C
• Recover oil from matrix spontaneous imbibitiono IFT reduction
• Surfactants
o Wettability alteration• Surfactants
• Alkali
EOR strategy
4Ref: Hirasaki et. al, 2003
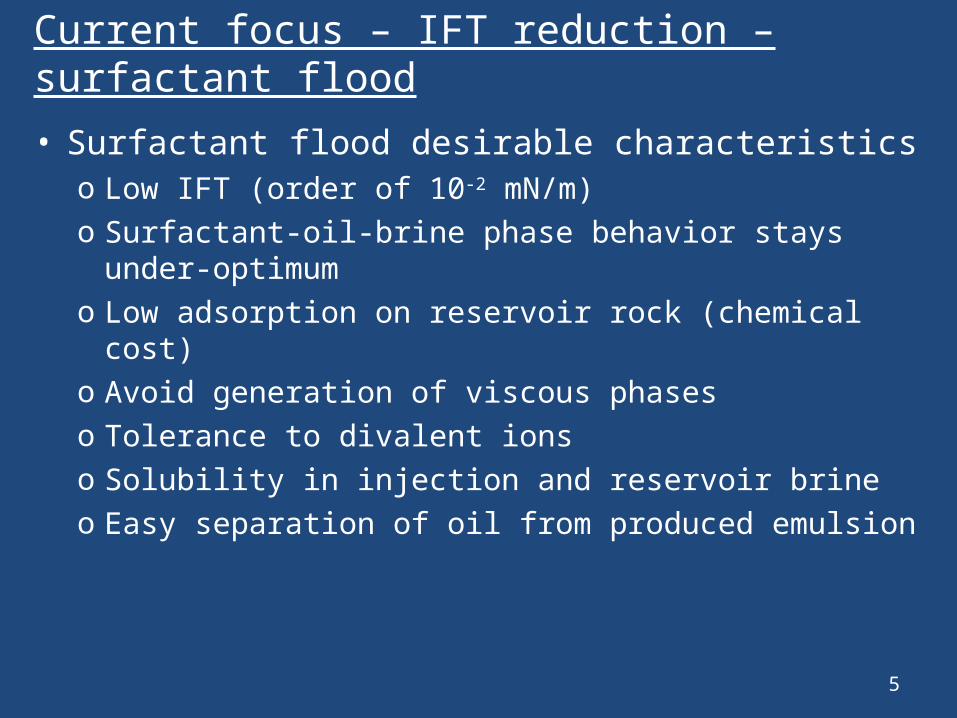
Current focus – IFT reduction – surfactant flood
• Surfactant flood desirable characteristicso Low IFT (order of 10-2 mN/m)o Surfactant-oil-brine phase behavior stays under-
optimumo Low adsorption on reservoir rock (chemical cost)o Avoid generation of viscous phases o Tolerance to divalent ionso Solubility in injection and reservoir brineo Easy separation of oil from produced emulsion
5

6
Phase behavior studies at ~ 25 °C
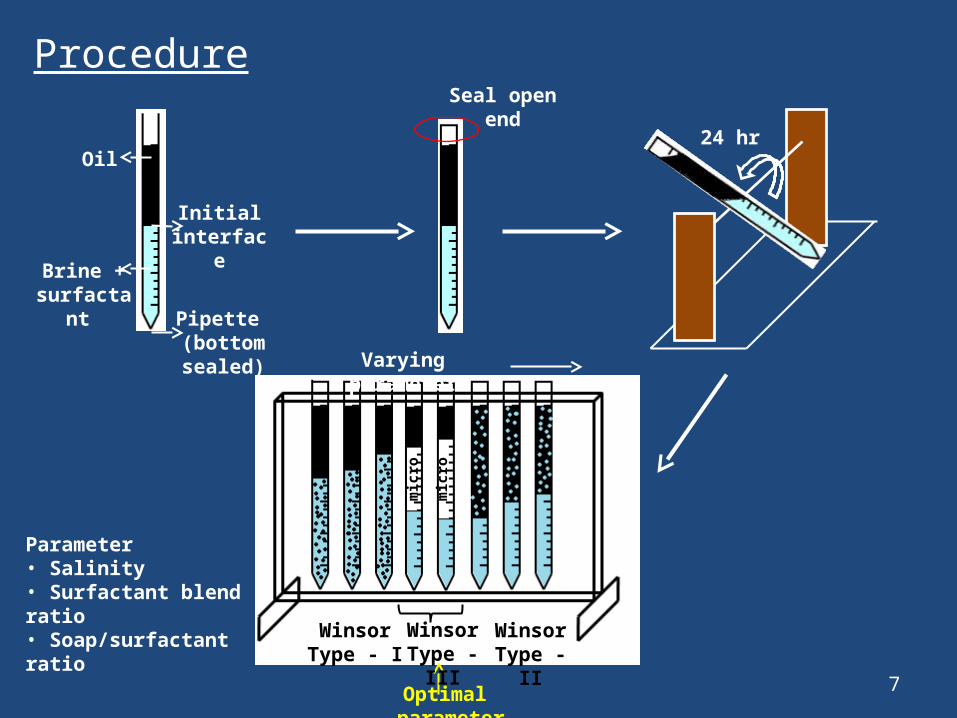
Parameter• Salinity• Surfactant blend ratio• Soap/surfactant ratio
Optimal parameter
Winsor Type - I
Winsor Type - II
Varying parameter
Winsor Type - III
mic
ro
mic
ro
Procedure
7
Pipette (bottom sealed)
Brine + surfactant
Oil
Initial interface
Seal open end
24 hr
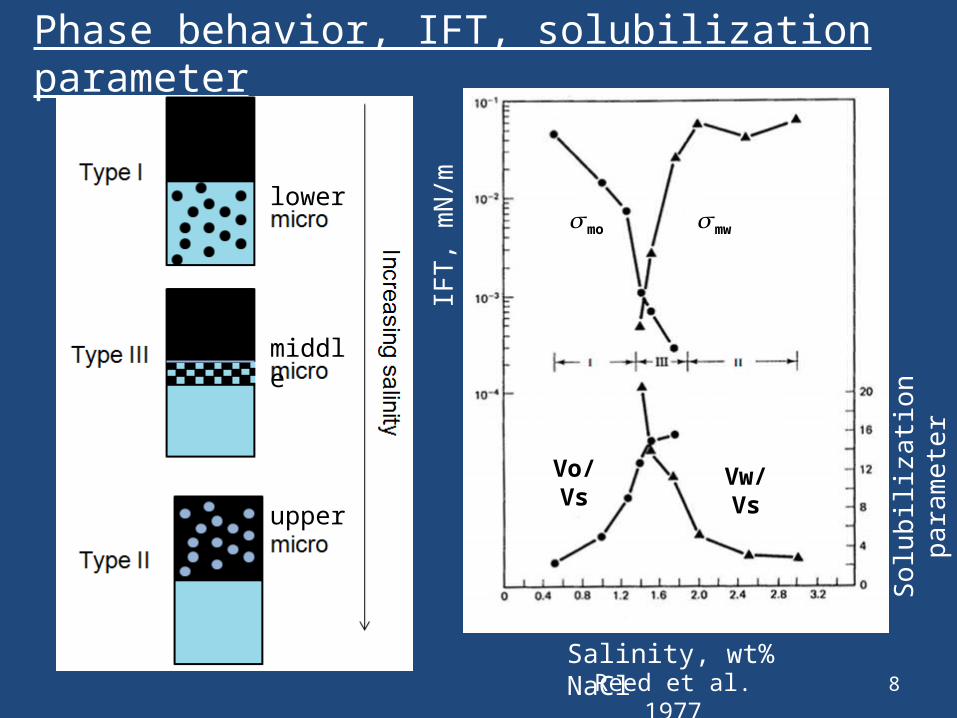
Phase behavior, IFT, solubilization parameter
8Reed et al. 1977Salinity, wt% NaCl
IFT
, mN
/m
So
lub
iliza
tion
pa
ram
ete
r
𝜎mo
𝜎mw
Vo/Vs Vw/Vs
middle
upper
lower
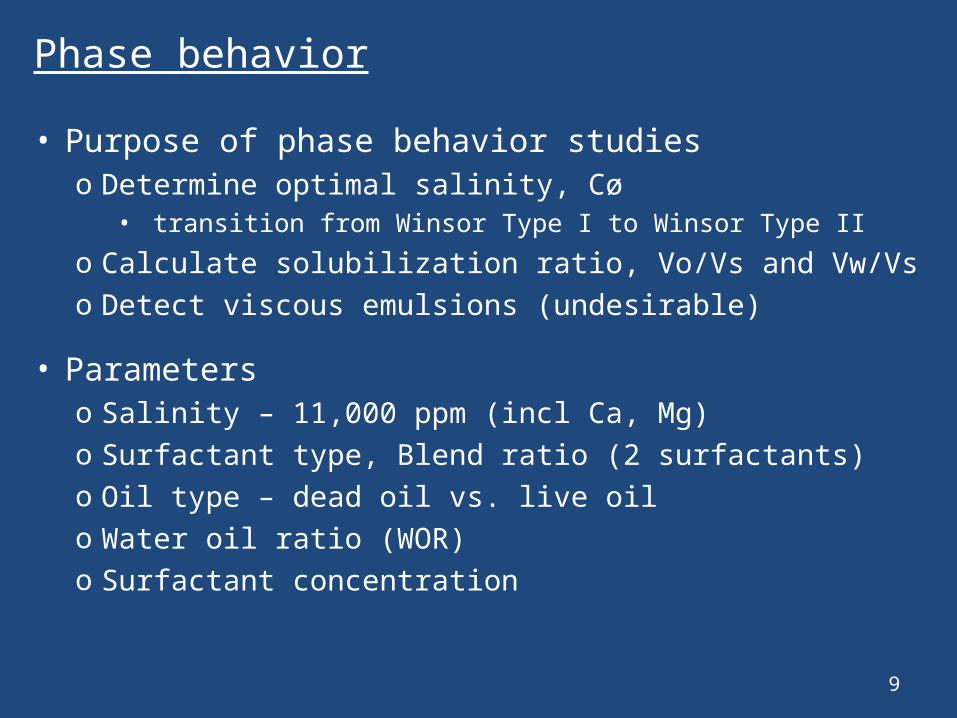
Phase behavior
• Purpose of phase behavior studieso Determine optimal salinity, Cø
• transition from Winsor Type I to Winsor Type II
o Calculate solubilization ratio, Vo/Vs and Vw/Vso Detect viscous emulsions (undesirable)
• Parameterso Salinity – 11,000 ppm (incl Ca, Mg)o Surfactant type, Blend ratio (2 surfactants)o Oil type – dead oil vs. live oilo Water oil ratio (WOR)o Surfactant concentration
9
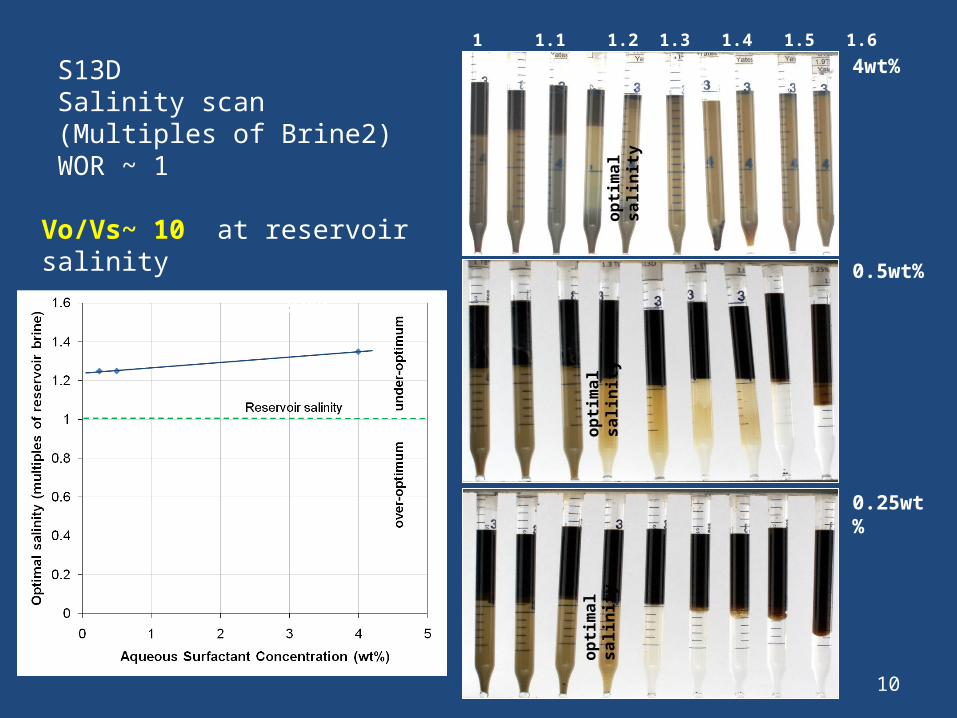
4wt%1 1.1 1.2 1.3 1.4 1.5 1.6 1.7 1.8 1.9 Brine2
S13D Salinity scan (Multiples of Brine2)WOR ~ 1
0.5wt%
0.25wt%
op
tim
al
sa
lin
ity
op
tim
al
sa
lin
ity
op
tim
al
sa
lin
ity
Vo/Vs~ 10 at reservoir salinity
10

11
Viscosity studiesat ~ 25 °C
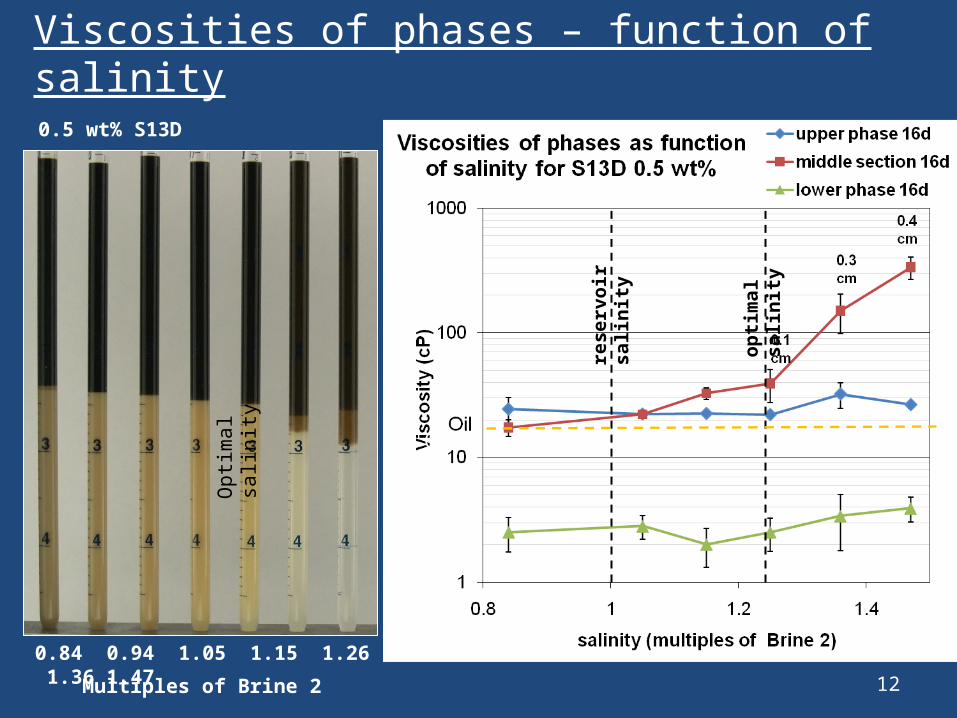
Viscosities of phases – function of salinity
12
0.84 0.94 1.05 1.15 1.26 1.36 1.47
Multiples of Brine 2
Op
tima
l sa
linity
rese
rvo
ir s
alin
ity
op
tim
al s
alin
ity
Oil
0.5 wt% S13D

13
Imbibition studiesat ~ 25 °C
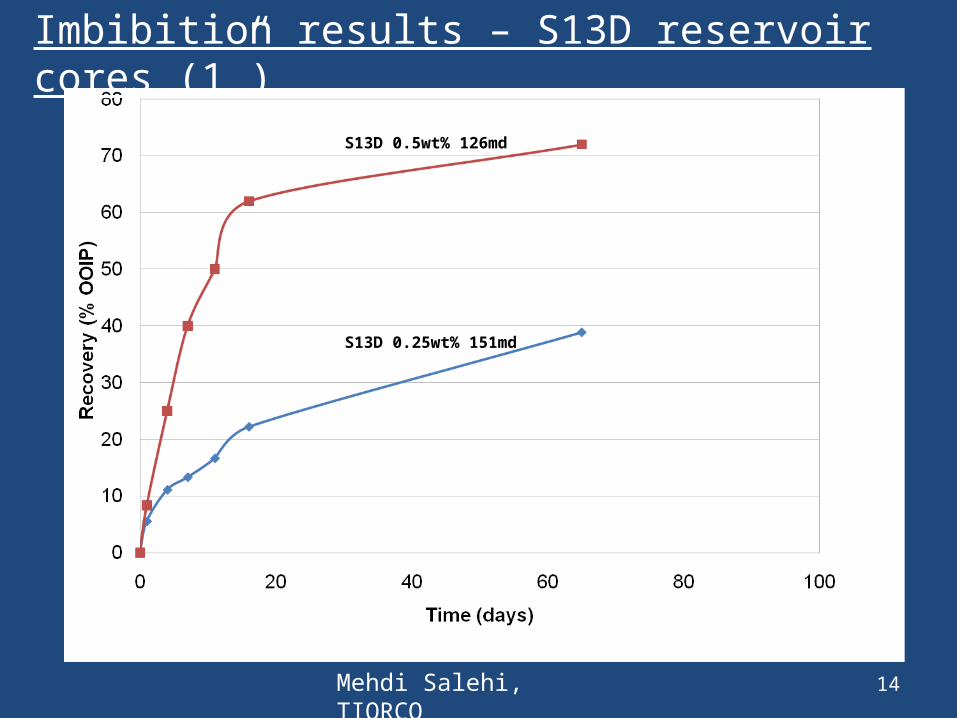
Imbibition results – S13D reservoir cores (1”)
14
S13D 0.5wt% 126md
S13D 0.25wt% 151md
Mehdi Salehi, TIORCO
S13D candidate for EORo under-optimum at reservoir salinityo stays under-optimum upon dilutiono Vo/Vs~10 (at 4wt% surfactant concentration)
indicative of low IFToNo high viscosity phases at reservoir salinityo ~ 70% recovery in imbibition tests
15
16
Adsorption studiesat ~ 25 °C
Dynamic adsorption – procedure
• Sand pack o Limestone sand ~ 20-40 mesh o Washed to remove fines & dried in oven
• Core holdero Core cleaned with Toluene, THF, Chloroform, methanolo Core holder with 400 – 800psi overburden pressure
• Vacuum saturation (~ -27 to -29 in Hg) o measure pore volume
• Permeability measurement
17
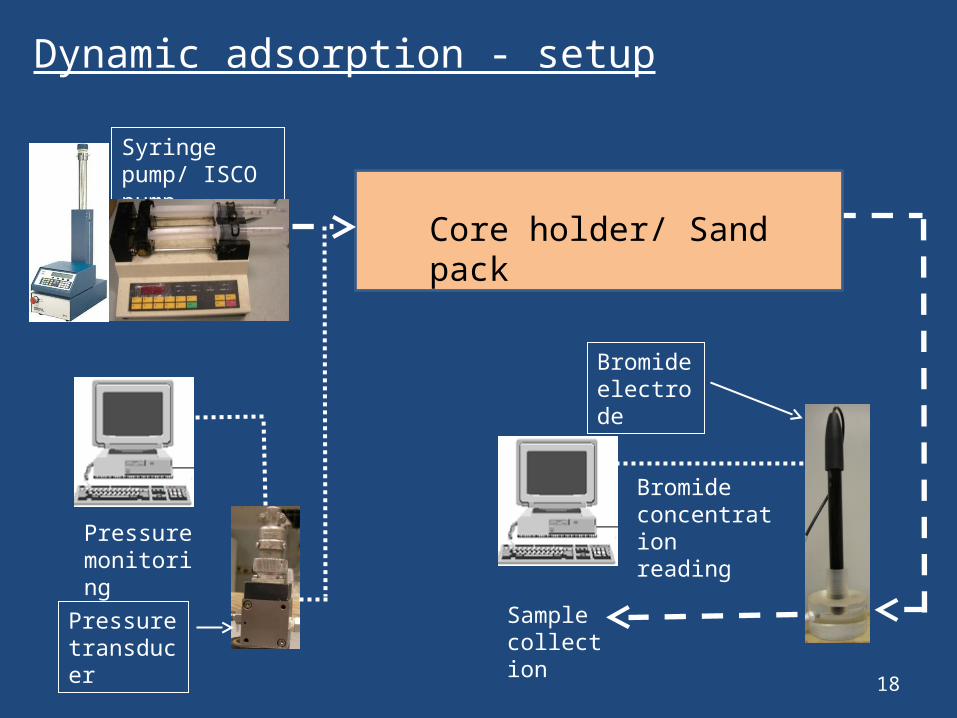
Dynamic adsorption - setup
18
Sample collection
Bromide concentration reading
Bromide electrode
Pressure transducer
Pressure monitoring
Core holder/ Sand pack
Syringe pump/ ISCO pump
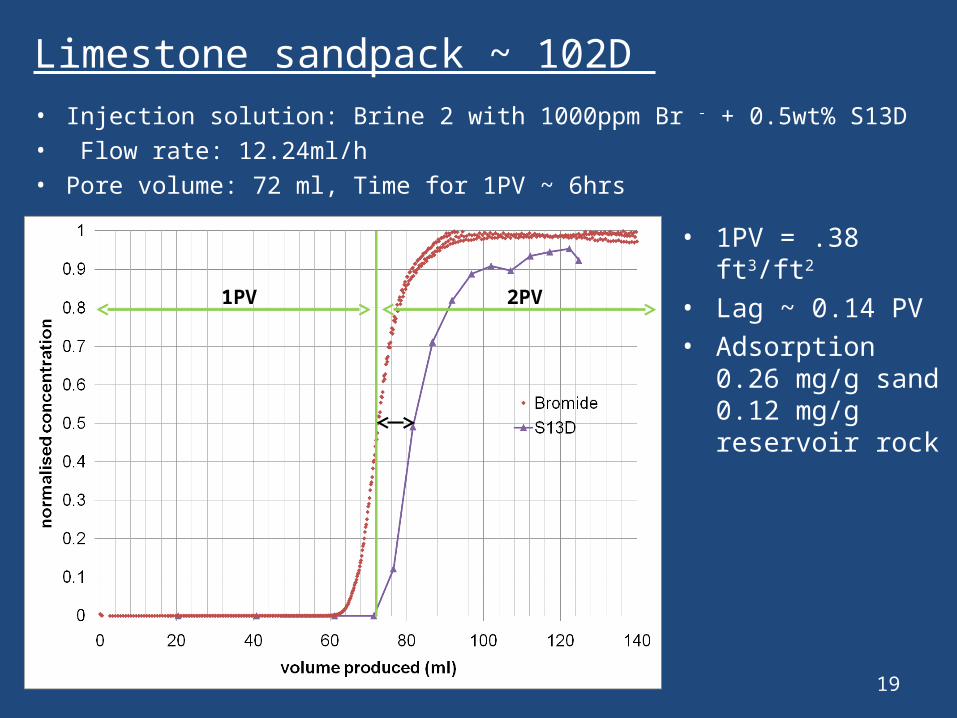
Limestone sandpack ~ 102D
• Injection solution: Brine 2 with 1000ppm Br - + 0.5wt% S13D• Flow rate: 12.24ml/h• Pore volume: 72 ml, Time for 1PV ~ 6hrs
19
• 1PV = .38 ft3/ft2
• Lag ~ 0.14 PV• Adsorption
0.26 mg/g sand0.12 mg/g reservoir rock
1PV 2PV
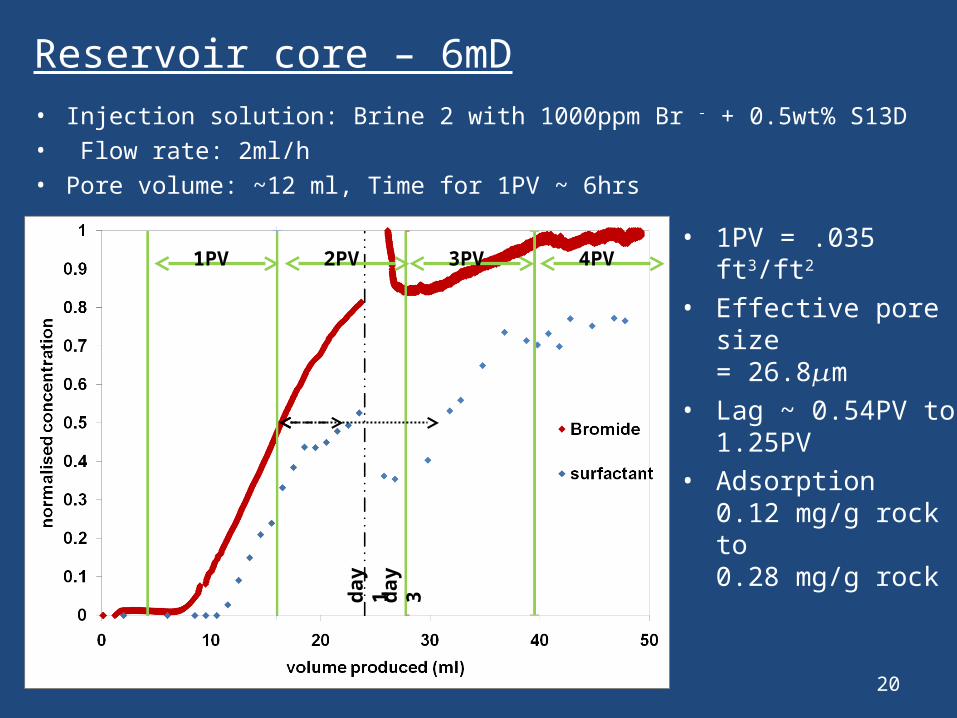
Reservoir core – 6mD
20
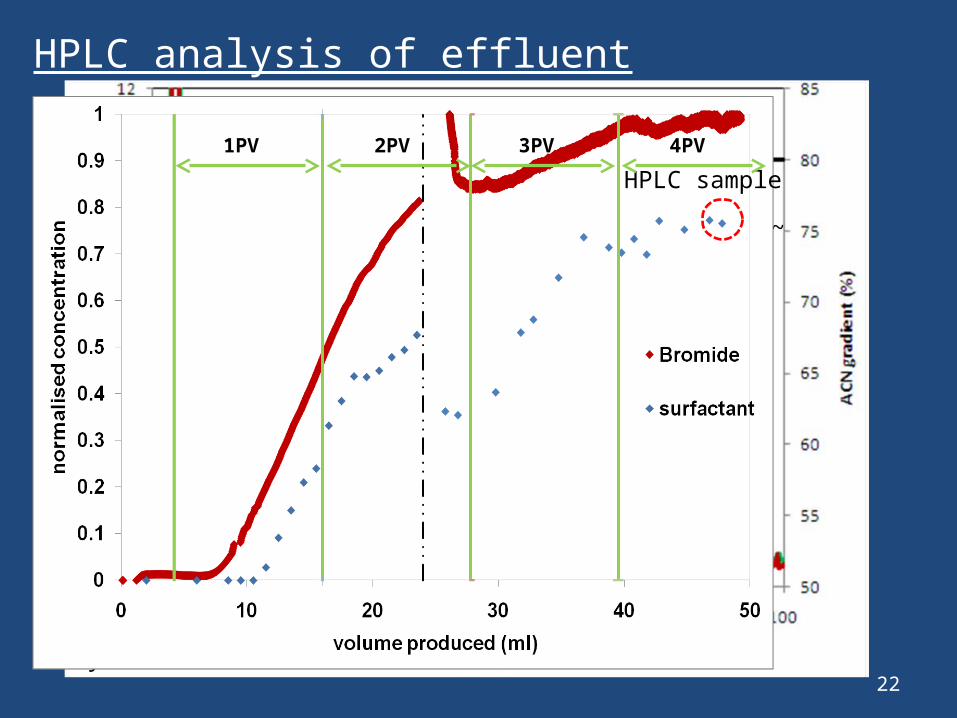
• Injection solution: Brine 2 with 1000ppm Br - + 0.5wt% S13D• Flow rate: 2ml/h• Pore volume: ~12 ml, Time for 1PV ~ 6hrs
• 1PV = .035 ft3/ft2
• Effective pore size = 26.8𝜇m
• Lag ~ 0.54PV to 1.25PV
• Adsorption0.12 mg/g rock to0.28 mg/g rock
3PV 4PV
da
y 1
da
y 3
2PV1PV
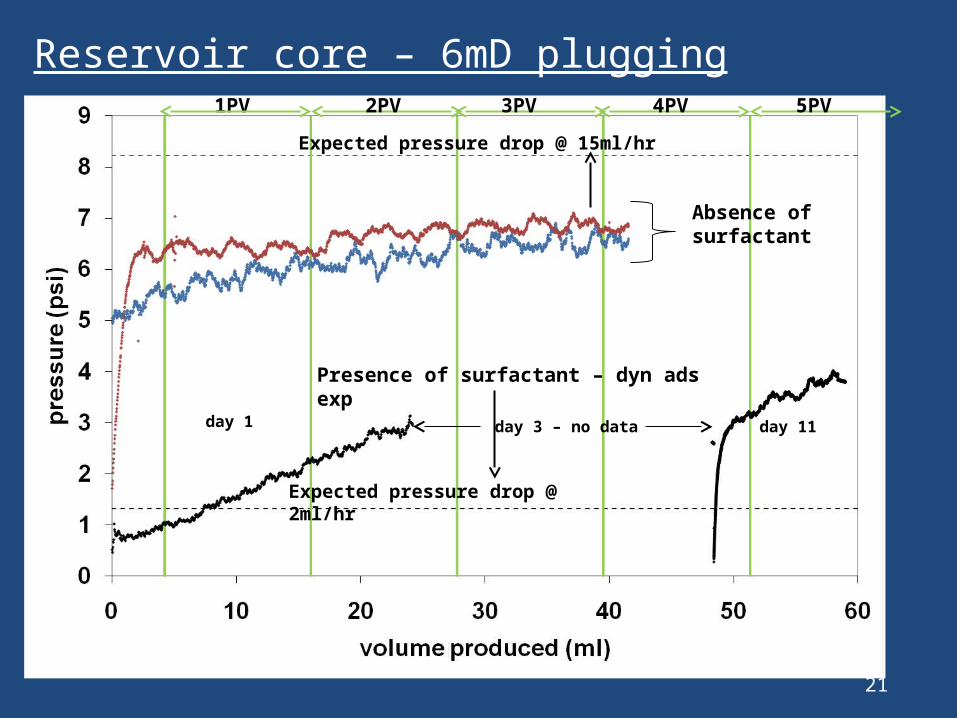
Reservoir core – 6mD plugging
21
Expected pressure drop @ 15ml/hr
Expected pressure drop @ 2ml/hr
Absence of surfactant
Presence of surfactant – dyn ads exp
day 1 day 11day 3 – no data
1PV 2PV 3PV 4PV 5PV
By Yu Bian
diff in area ~ 21 %
3PV 4PV
da
y 1
da
y 3
2PV1PV
HPLC sample
HPLC analysis of effluent
22
3PV 4PV2PV1PV
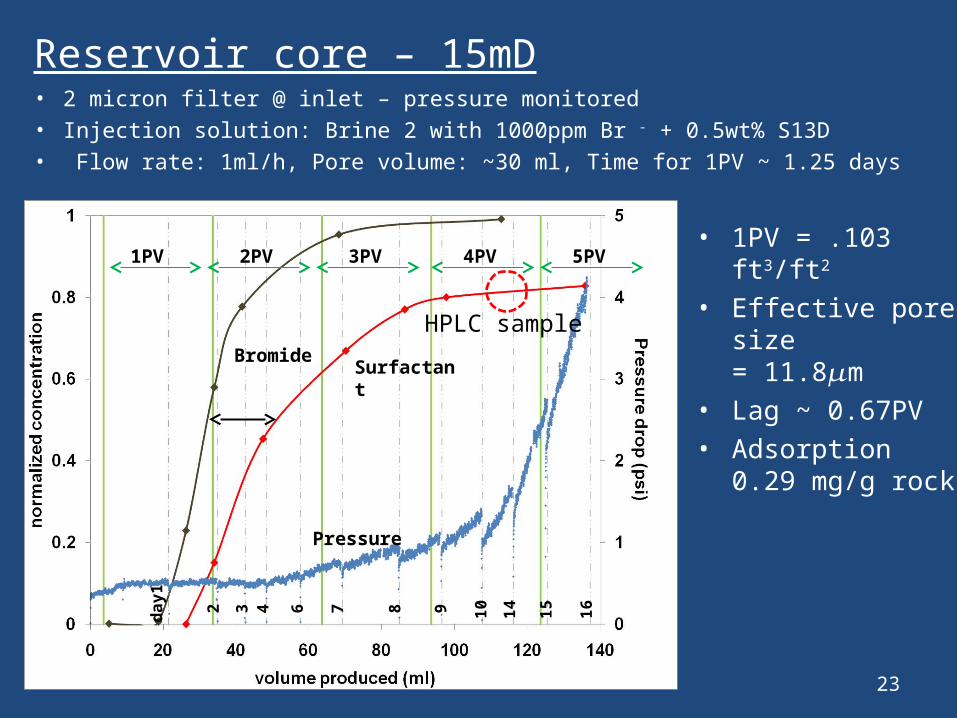
Reservoir core – 15mD
23
• 2 micron filter @ inlet – pressure monitored• Injection solution: Brine 2 with 1000ppm Br - + 0.5wt% S13D• Flow rate: 1ml/h, Pore volume: ~30 ml, Time for 1PV ~ 1.25 days
• 1PV = .103 ft3/ft2
• Effective pore size= 11.8𝜇m
• Lag ~ 0.67PV• Adsorption
0.29 mg/g rock
Surfactant
Pressure
Bromide
1PV 2PV 3PV 4PV 5PV
da
y1
2 3 4 6 7 8 9 10
14
15
16
HPLC sample
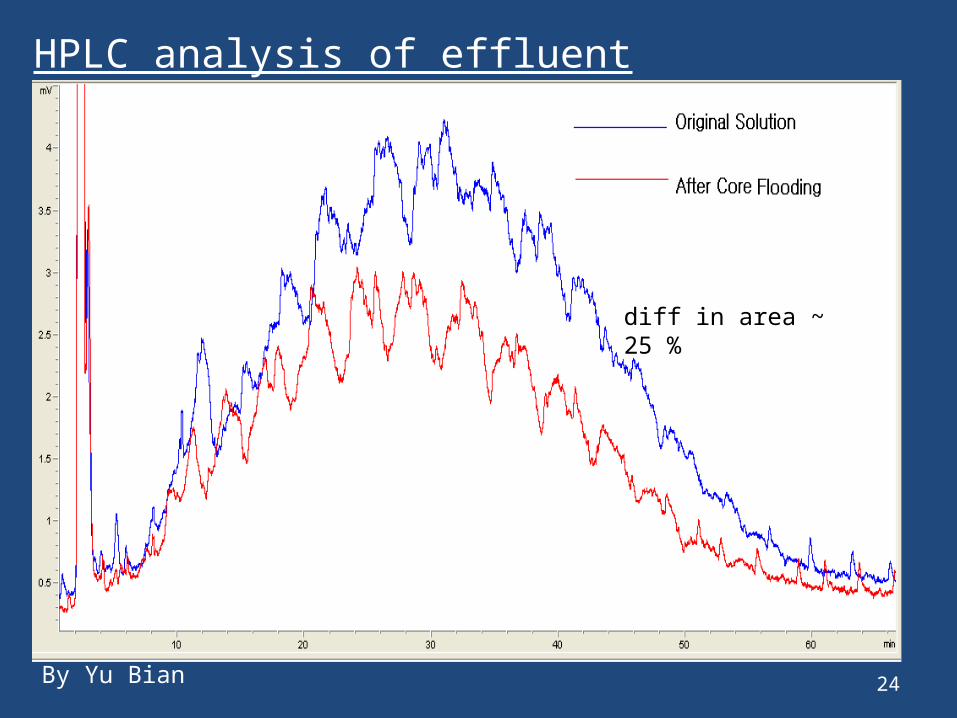
HPLC analysis of effluent
24
diff in area ~ 25 %
By Yu Bian
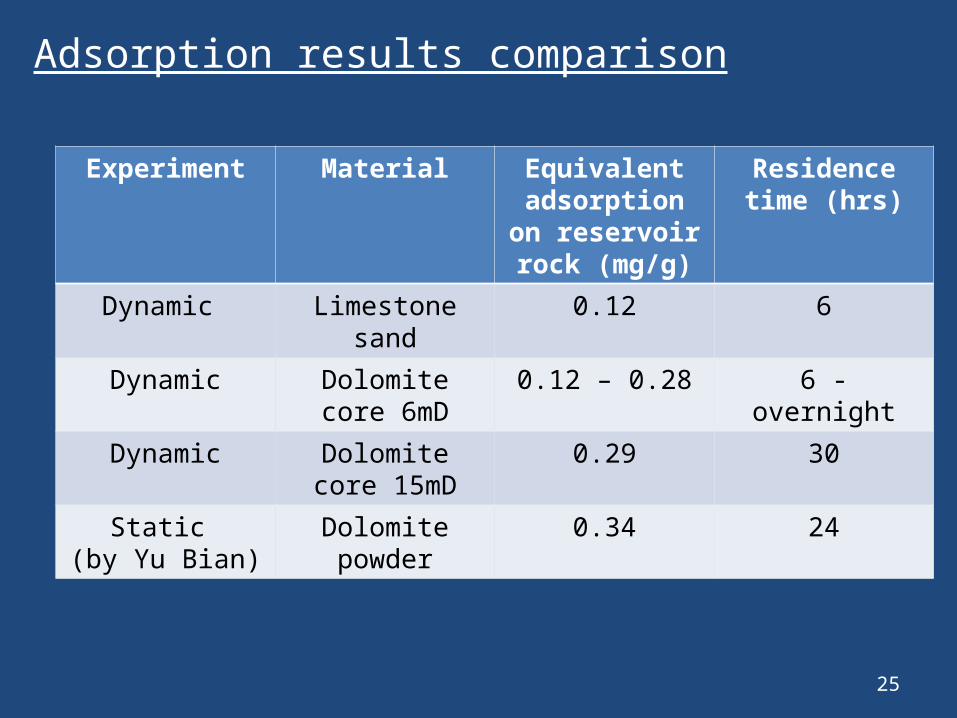
Adsorption results comparison
25
Experiment Material Equivalent adsorption on reservoir rock
(mg/g)
Residence time (hrs)
Dynamic Limestone sand 0.12 6
Dynamic Dolomite core 6mD
0.12 – 0.28 6 - overnight
Dynamic Dolomite core 15mD
0.29 30
Static (by Yu Bian)
Dolomite powder 0.34 24
26
Phase behavior studies at ~ 30 °C
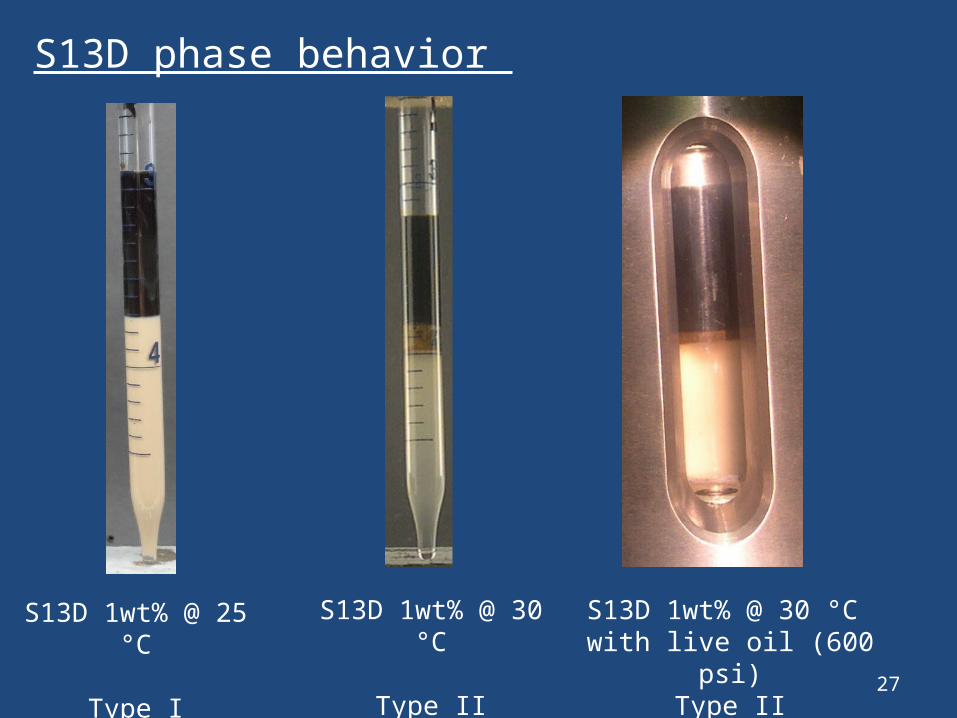
S13D phase behavior
27
S13D 1wt% @ 25 °C
Type I microemulsion
S13D 1wt% @ 30 °C
Type II microemulsion
S13D 1wt% @ 30 °C with live oil (600 psi)
Type II microemulsion
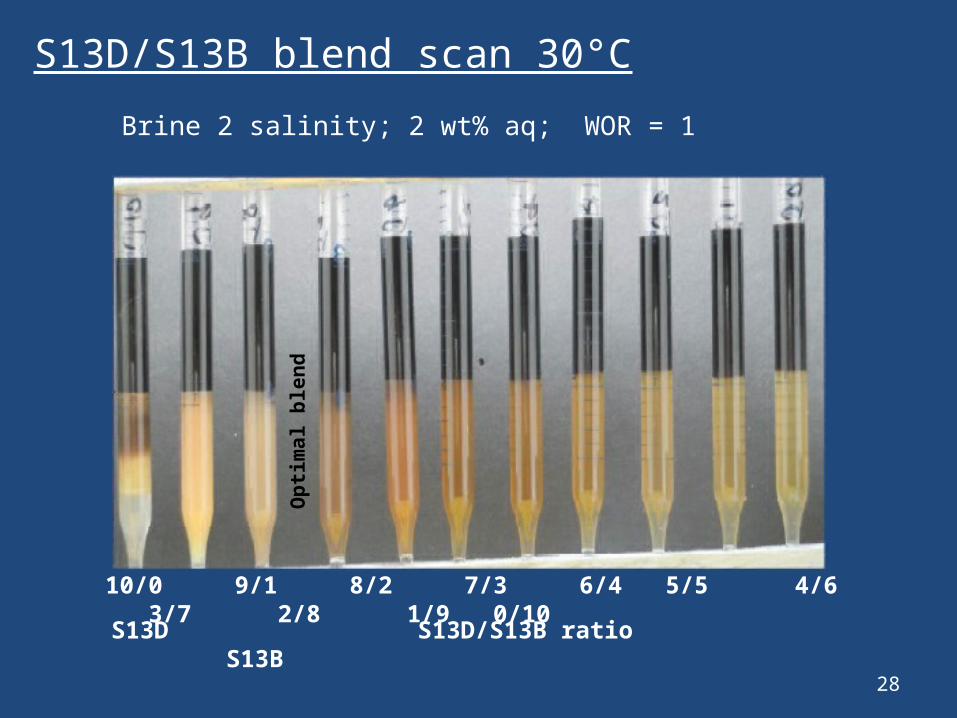
S13D/S13B blend scan 30°C
28
10/0 9/1 8/2 7/3 6/4 5/5 4/6 3/7 2/8 1/9 0/10
S13D S13D/S13B ratio S13B
Brine 2 salinity; 2 wt% aq; WOR = 1
Op
tim
al
ble
nd
29
5
4
3
2
1
0S13D 10 9 8 7 6 5 4 3 2 1 0S13B 0 1 2 3 4 5 6 7 8 9 10
5
4
3
2
1
0
% Cs
°C
50
40
30
20
10
0S13D 10 9 8 7 6 5 4 3 2 1 0S13B 0 1 2 3 4 5 6 7 8 9 10
50
40
30
20
10
0
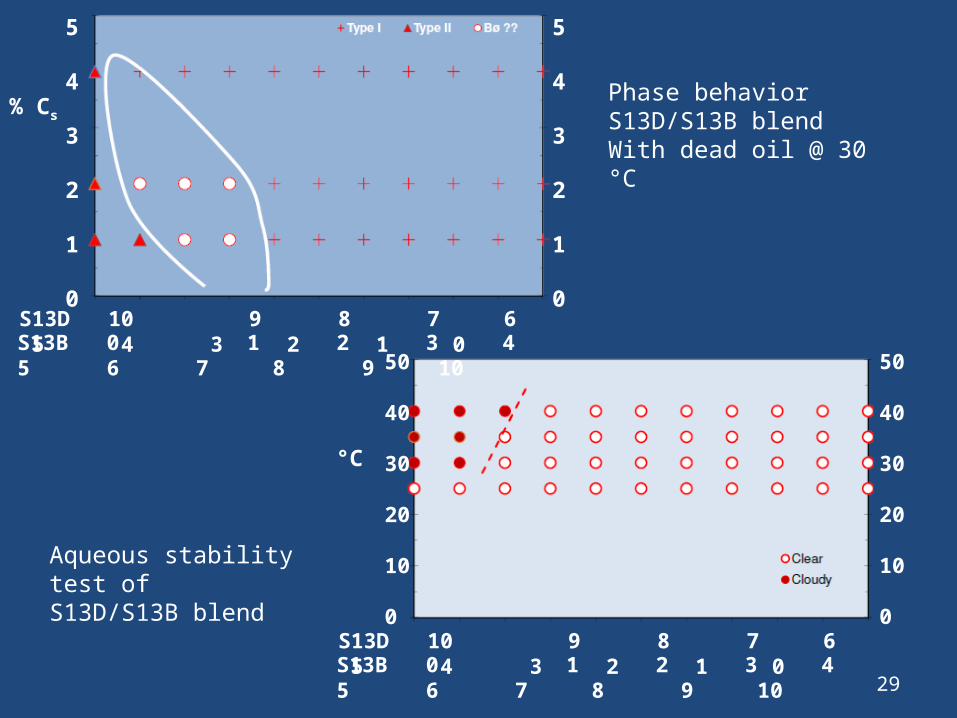
Phase behavior S13D/S13B blend With dead oil @ 30 °C
Aqueous stability test ofS13D/S13B blend
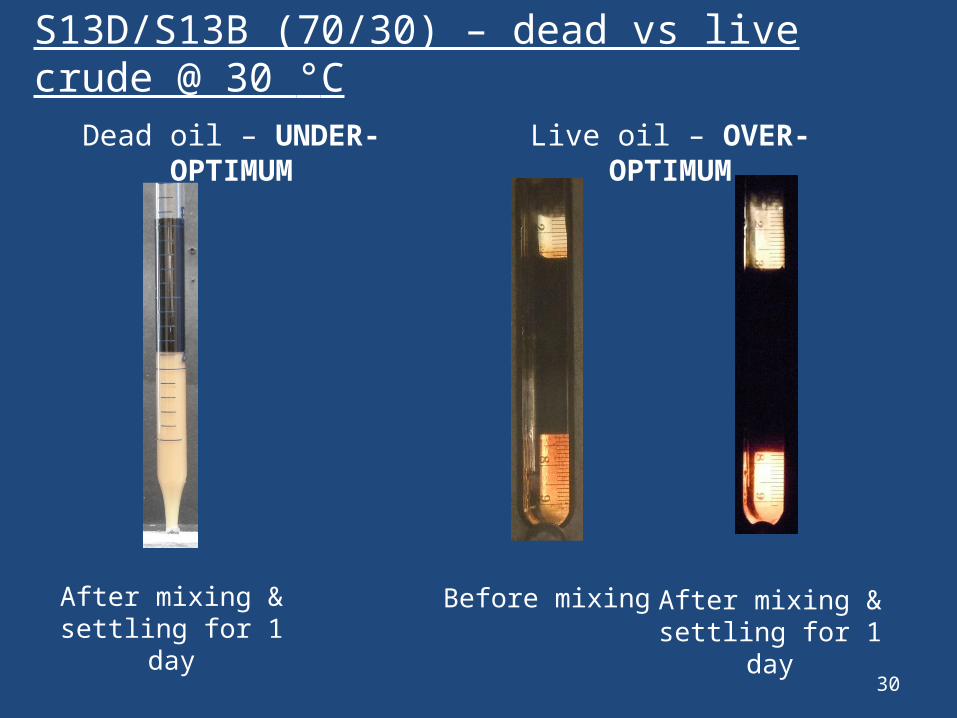
S13D/S13B (70/30) – dead vs live crude @ 30 °C
30
Dead oil – UNDER-OPTIMUM Live oil – OVER-OPTIMUM
After mixing & settling for 1 day
Before mixingAfter mixing & settling for 1 day

31
Imbibition studiesat ~ 30 °C
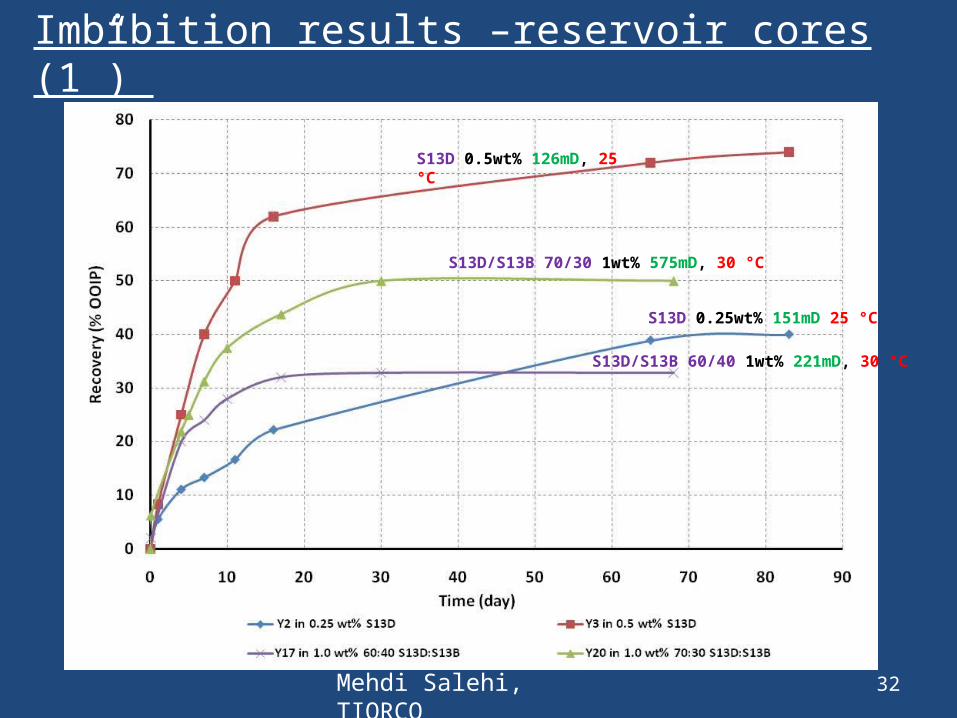
Imbibition results –reservoir cores (1”)
32
S13D 0.5wt% 126mD, 25 °C
S13D 0.25wt% 151mD 25 °C
Mehdi Salehi, TIORCO
S13D/S13B 70/30 1wt% 575mD, 30 °C
S13D/S13B 60/40 1wt% 221mD, 30 °C

33
Conclusions
Conclusions
• Dynamic adsorption experiments (absence of oil)o Effluent surfactant concentration plateaus at ~80%
injected concentrationo Higher PO components are deficient in the effluent
sample (in plateau region)o Increase in pressure drop with volume throughput
• Sensitivity of phase behavior to temperature and oil
(dead vs. live)
• S13D/S13B 70/30 @ 30 °C performance poor
compared to S13D @ 25 °C34

35
Questions