Embed Size (px)
Citation preview
2. Regional profile of the Lake Eyre Basin catchments
Alexander Herr
Tim Smith
Lynn Brake
Desert Knowledge CRC42 People, communit ies and economies of the Lake Eyre Basin
Ch 2: Regional prof i le of the Lake Eyre Basin catchments pp. 41–88
Enquiries should be addressed to:
Alexander HerrCSIRO Sustainable EcosystemsGungahlin Homestead, Barton HighwayGPO Box 284, Canberra, ACT 2601Email: [email protected]
The views and opinions expressed in this publication are those of the authors and do not necessarily reflect those of the Australian Government. The Commonwealth does not accept responsibility for the accuracy or completeness of the contents, and shall not be liable for any loss or damage that may be occasioned directly or indirectly thorough the use of, or reliance on, the contents of this publication.
The work reported in this publication was supported by funding from the Australian Government. The views expressed herein do not necessarily represent the views of Desert Knowledge CRC or its Participants.
CitationHerr A, Smith T and Brake L. 2009. Regional profile of the Lake Eyre Basin catchments. In Measham TG, Brake L (Eds.).
People, communities and economies of the Lake Eyre Basin, DKCRC Research Report 45, Desert Knowledge Cooperative Research Centre, Alice Springs. pp. 41–88.
AcknowledgementsFunding for this study was provided by
Natural Heritage Trust (NHT, http://www.nht.gov.au/)Desert Knowledge Cooperative Research Centre (DKCRC, http://www.desertknowledgecrc.com.au/) Commonwealth Scientific and Industrial Research Organisation Division of Sustainable Ecosystems (CSIRO CSE, http://www.cse.csiro.au/).
The authors acknowledge the valuable contributions to the regional profiles made by the project steering group (Angus Emmott, Geoff Lawrence, Alwyn Mckenzie, John Childs, John Gavin, Krista Hancy, and Mike Chuk), and other CSIRO project researchers (Silva Larson, Cathy Robinson, Tom Measham, Angela Wardell-Johnson, Mark Stafford Smith, Tim Lynam, Anne Leitch and Beau Hug), by DWLBC in SA and DNRMW in Qld, and BRS in Canberra. Also thanks to the Desert Knowledge CRC, in particular Ange Vincent, Alice Roughley, and Jan Ferguson.
Kris Kleeman (MDBC), Krista Hancy (DEH), Jane Hoskins (DEH), John Maconochie (DWLBC), Michael Malavazos (PIRSA), Vol Norris (DEH), Mark Pierson (DNREA), Tim Ransley (BRS) and James Shaddick (DCQLD) are thanked for providing support in obtaining spatial data.
This document was circulated as a draft at the Lake Eyre Basin Conference in September 2006, particularly through the Lake Eyre Basin Ministerial Forum’s Community Advisory Committee (‘CAC’) and the State and Commonwealth agency staff (‘officers’) involved. Comments received from various community and agency readers were incorporated in the document. The edited draft was then made available to the CAC and government officers on a private website location for finalisation through the remainder of 2006. The CAC meeting in Canberra on 28th March 2007 agreed that the document should be released publicly and committed resources to its circulation. It was published separately from this volume as Herr A, Smith, T and Brake L 2007, Regional Profile of the Lake Eyre Basin Catchments, Desert Knowledge CRC, Alice Springs.
•••
Desert Knowledge CRC 43People, communit ies and economies of the Lake Eyre Basin
Ch 2: Regional prof i le of the Lake Eyre Basin catchments pp. 41–88
Contents
Preface .................................................................................................................................................. ....................... 461. Introduction ...................................................................................................................................... ....................... 47
1.1 The Lake Eyre Basin context .............................................................................................. ....................... 471.2 Natural resource management in the LEB .......................................................................... ....................... 481.3 Overview of key findings .................................................................................................... ....................... 48
2. Topography and management arrangements .................................................................................... ....................... 502.1 LEB roads, major population centres and management boundaries ................................... ....................... 502.2 Floodplain areas .................................................................................................................. ....................... 502.3 Remoteness and health services .......................................................................................... ....................... 50
3. Land use and tenure ......................................................................................................................... ....................... 533.1 Land use in the LEB ........................................................................................................... ....................... 533.2 Tenure arrangement in the LEB .......................................................................................... ....................... 533.3 Native title and Aboriginal tenures ..................................................................................... ....................... 54
4. Biogeographical regions and landscape health ................................................................................ ....................... 544.1 Landscape health ................................................................................................................. ....................... 564.2 Landscape stress ................................................................................................................. ....................... 564.3 Hydrological conditions ..................................................................................................... ....................... 57
5. Biological and physical land conditions .......................................................................................... ....................... 575.1 Rainfall and evaporation ..................................................................................................... ....................... 595.2 Soil limitations of the LEB ................................................................................................. ....................... 595.3 The Great Artesian Basin groundwater source ................................................................... ....................... 59
6. Population statistics, sectorial information and wellbeing indices .................................................. ....................... 626.1 Administrative regions ........................................................................................................ ....................... 626.2 Aboriginal statistics ............................................................................................................. ....................... 646.3 General employment statistics and sectorial employment .................................................. ....................... 676.4 Socio-economic indices for areas – SEIFA ......................................................................... ....................... 696.5 Methods and data sources ................................................................................................... ....................... 70
7. Tourism and mining ......................................................................................................................... ....................... 708. Conclusion ....................................................................................................................................... ....................... 739. References ........................................................................................................................................ ....................... 74Appendix A: Description of IBRA regions ......................................................................................... ....................... 76Appendix B: Soil mapping descriptors and lookup table .................................................................... ....................... 78Appendix C: Australian Standard Geographical Classification ........................................................... ....................... 79Appendix D: Variable specifications for the SEIFA Indices ................................................................ ....................... 80Appendix E: Further details to Figure 42 ............................................................................................ ....................... 84
Desert Knowledge CRC44 People, communit ies and economies of the Lake Eyre Basin
Ch 2: Regional prof i le of the Lake Eyre Basin catchments pp. 41–88
Figures
Figure 1: LEB sub-catchments and regions ......................................................................................... ....................... 51Figure 2: LEB state-based management authorities ............................................................................ ....................... 51Figure 3: Multi-resolution Valley bottom flatness index of the LEB also showing ephemeral rivers and saltlakes ... 51Figure 4: Remoteness score of LEB locations and remoteness classification of the LEB ................. ....................... 51Figure 5: Health services in the LEB ................................................................................................... ....................... 52Figure 6: Land use in the LEB ............................................................................................................. ....................... 52Figure 7: Interpolated property sizes ................................................................................................... ....................... 52Figure 8: Tenure arrangement in the LEB ........................................................................................... ....................... 52Figure 9: Native title, Indigenous Land Use Agreements (ILUA) and Aboriginal tenure in the LEB ....................... 55Figure 10: LEB bioregions ................................................................................................................... ....................... 55Figure 11: Priority bioregions in the LEB for developing the National Reserves System .................. ....................... 55Figure 12: Landscape stress in the LEB .............................................................................................. ....................... 55Figure 13: Hydrological conditions in the LEB ................................................................................... ....................... 58Figure 14: Potential evaporation divided by mean annual rainfall ...................................................... ....................... 58Figure 15: Mean annual rainfall ........................................................................................................... ....................... 58Figure 16: LEB soil limitations............................................................................................................ ....................... 58Figure 17: Great Artesian Basin ........................................................................................................... ....................... 61Figure 18: Wetlands in the LEB ........................................................................................................... ....................... 61Figure 19: Location of springs in the LEB .......................................................................................... ....................... 61Figure 20: Location of artesian bores in the LEB ................................................................................ ....................... 61Figure 21: Administrative boundaries .................................................................................................. ....................... 63Figure 22: Urban Centre/Location (UCL) residents counted at home during census night ................ ....................... 63Figure 23: Population density based on residents at home during census night .................................. ....................... 63Figure 24: Total number of residents counted at home during census night ....................................... ....................... 63Figure 25: Indigenous proportion of the population based on usual residents data at Statistical Local Area level .... 65Figure 26: Indigenous proportion of the population based on enumerated persons at CD level ......... ....................... 65Figure 27: Indigenous language boundaries in the LEB ...................................................................... ....................... 65Figure 28: Unemployment rate ............................................................................................................ ....................... 65Figure 29: Labour force participation rate ........................................................................................... ....................... 66Figure 30: Employment in agriculture, forestry and fishing ................................................................ ....................... 66Figure 31: Employment in the government sector ............................................................................... ....................... 66Figure 32: Employment in retail .......................................................................................................... ....................... 66Figure 33: Employment in health services ........................................................................................... ....................... 68Figure 34: Employment in education ................................................................................................... ....................... 68Figure 35: Index of education and occupation ..................................................................................... ....................... 68Figure 36: Index of economic resources .............................................................................................. ....................... 68Figure 37: Index of relative socio-economic disadvantage ................................................................. ....................... 71Figure 38: Index of relative socio-economic advantage/disadvantage ................................................ ....................... 71Figure 39: Visitors to the LEB at census night .................................................................................... ....................... 71
Desert Knowledge CRC 45People, communit ies and economies of the Lake Eyre Basin
Ch 2: Regional prof i le of the Lake Eyre Basin catchments pp. 41–88
Tables
Table 1: Land use statistics of the LEB................................................................................................ ....................... 53Table 2: Tenure use statistics of the LEB ............................................................................................. ....................... 53Table 3: Bioregions (IBRA 5.1) in the LEB and their priority ranking for the National Reserve System ......... 54Table 4: Land condition indicators for devising landscape stress ........................................................ ....................... 56Table 5: Descriptors of hydrological change for defining the hydrological landscape condition........ ....................... 57Table 6: Census-based sectoral employment for CDs intersecting the LEB ....................................... ....................... 67
Figures (cont’d)
Shortened forms
ABS Australian Bureau of Statistics
CD collection district
ESD ecological sustainable development
GAB Great Artesian Basin
LEB Lake Eyre Basin
LFPR labour force participation rate
LGA local government area
MEE monitoring and evaluation of engagement
MERI monitoring, evaluation, reporting and improvement
NRM Natural resources management
NSW New South Wales
NT Northern Territory
Qld Queensland
SA South Australia
SLA statistical local area
UCL Urban Centre/Locations
Figure 40: Employment in accommodation, cafés and restaurants ..................................................... ....................... 71Figure 41: Tourism sectors in the LEB ................................................................................................ ....................... 72Figure 42: Tourism activity in the LEB .............................................................................................. ....................... 72Figure 43: Major mines and oil/gas extraction and processing facilities ............................................. ....................... 72Figure 44: Employment in mining ....................................................................................................... ....................... 72
Desert Knowledge CRC46 People, communit ies and economies of the Lake Eyre Basin
Ch 2: Regional prof i le of the Lake Eyre Basin catchments pp. 41–88
The Lake Eyre Basin is a huge and truly unique system. Its rivers are the most variable in the world by a large degree, and they are among the last major unregulated dryland rivers on the planet. The Basin itself ranks among the largest internally draining river basins in the world, and supports a unique flora and fauna adapted to extreme patterns of boom and bust tied to cycles of flood and drought. The ephemeral wetlands of the Basin support enormous feeding and breeding opportunities for waterfowl and shorebirds, which are becoming even more important as the wetlands of the Murray Darling Basin disappear.
It is both a rare privilege and a sobering responsibility to be living in such a Basin and to be involved in its sustainable management.
The challenges of looking after the Lake Eyre Basin have been recognised for some time, and scientific research and monitoring is beginning to fill the large gaps in our knowledge of the Basin. For many years, the communities of the Basin have also drawn attention to the complex balance required between natural resource sustainability and economic or social development. The importance of learning about the people, communities and economies in the Basin, in addition to its rivers and catchments, has been recognised more and more by governments.
In early 2004, the Lake Eyre Basin Community Advisory Committee and the Lake Eyre Basin Scientific Advisory Panel reached a consensus that a study of the people, cultures and communities of the Lake Eyre Basin, along with their social, economic and other circumstances, was required as an essential tool for the effective implementation of the Lake Eyre Basin Agreement. The regional profile presented here is a product of that consensus, and of the growing recognition that people and communities are central to our efforts to bring a better balance to our natural resource decision making. Without people and communities, the best knowledge of the natural resources will get us nowhere.
After a hundred and fifty years of European settlement, the Lake Eyre Basin is in relatively good condition when benchmarked against the rest of the world. However, we have some way to go to match the sustainable approaches of the Aboriginal people who lived on this land for thousands of generations. This regional profile is an important step towards getting the balance right for the Lake Eyre Basin, and I commend it to all people who seek a sustainable future based on better knowledge of both ourselves and our environment.
Angus Emmott
Chair, Lake Eyre Basin Community Advisory Committee
October 2006
Preface
Desert Knowledge CRC 47People, communit ies and economies of the Lake Eyre Basin
Ch 2: Regional prof i le of the Lake Eyre Basin catchments pp. 41–88
1.1 The Lake Eyre Basin contextThe Lake Eyre Basin (LEB) is Australia’s largest inland catchment with a size of approximately 1.2 million square kilometres (SKM 2005) and is home to almost 60 000 people. The sparsely populated desert landscapes in the LEB make natural systems and human activities fundamentally different from wetter and more populated regions in Australia.
Over most of the LEB the climate is arid and semi-arid, and biological processes are driven by episodic weather events that generally do not follow predictable annual cycles. Infrequent rains and hot-drying winds shape the landscape and drive production in natural ecosystems. In these landscapes evaporation far exceeds annual rainfall.
Most of the water in the LEB enters from the eastern river catchments, where coastal cyclones and tropical rains spill over the dividing ranges to recharge catchments. These rain depressions occasionally extend across the LEB, but are usually restricted to the upper reaches of the ephemeral rivers. Creek flows and floods then slowly move across the flat landscape toward Lake Eyre. Sometimes rain enters the LEB from the west to recharge the western rivers, but these are less frequent and usually smaller. Flows and floods from rains fill water holes, revitalise riparian vegetation and support water dependent ecosystems along the ephemeral river systems. Except for the occasional very large floods, water in the LEB rivers evaporates in the drying winds of the arid landscape well before it reaches the salty expanse of Lake Eyre, leaving only the occasional waterhole as drought refuge.
The Great Artesian Basin (GAB) extends under much of the LEB. The GAB is one of the largest fresh water artesian aquifer systems in the world. It underlies about one-fifth of the Australian continent and contains 64 000 million ML of mostly potable groundwater, which is approximately 2000 times the total surface water storage of the combined Murray–Darling Basin. The GAB is also recharged from rainfall on the Great Dividing Range. Water enters exposed aquifer systems in the Great Dividing Range and slowly moves through permeable sandstone confined between layers of shale. The water takes more than 2 million years to reach the other side of the LEB.
Water in the GAB naturally discharges through springs (mainly in the western margin of the LEB) and through leaking from the surface into the water table. Springs provide the only natural permanent water in an otherwise dry landscape. Thousands of artesian bores have been drilled into the GAB since the first artesian bore was drilled late in the nineteenth century. Bores provide the only reliable source of water to support all human activity over much of the LEB.
Long dry periods and infrequent rainfall means that the landscape experiences dramatic changes in plant and animal populations, natural process, and the productivity of natural resource based industries. The timing, scope and duration of these natural fluctuations are extremely difficult to predict, making it very difficult to recognise and evaluate the impact of human activities in this changing environment.
The life patterns of early Aboriginal inhabitants of the LEB were largely determined by the wetting and drying cycles in the landscape. Food production associated with rain events and floods and the refuge offered by widely scattered springs and waterholes during dry periods remain an integral part of Aboriginal culture and life on their traditional country.
1. Introduction
Desert Knowledge CRC48 People, communit ies and economies of the Lake Eyre Basin
Ch 2: Regional prof i le of the Lake Eyre Basin catchments pp. 41–88
Wet and dry periods in the LEB continue to determine life patterns of all those who depend on its ecosystems. European settlers introduced new technologies to modify natural patterns and relationships in an attempt to produce new products of interest such as meat from livestock and minerals from mining. The impacts of these technologies and practices on natural processes and ecosystems were not well understood and were often difficult to predict, especially in such a variable landscape.
Some ways to use the land productively were successful and continue to be used by industries and in natural resource management practices; others have been abandoned. Although the natural ecosystems of the LEB are generally intact, a legacy of human-caused changes remains in the landscape. People living in the LEB have always tried to understand the natural relationships and processes of the LEB and use this understanding to support their wellbeing.
1.2 Natural resource management in the LEBNatural resources management (NRM) is where people manage natural resources for their desired outcomes. Whether these desired outcomes relate to improved productivity or conservation of biodiversity, the desired outcomes and means to achieve them are constructed by, and dependent upon, people. Hence, effective community engagement is critical in achieving NRM.
Remote regions face numerous NRM challenges. Some of these challenges relate to sparse populations and limited resources; large distances; high seasonal variability; remoteness in terms of support and influence; pronounced disconnection of resources, rights and responsibilities; and variability of costs and value of natural resources. These challenges are compounded by the extreme dependence of communities in remote regions on natural resources and subsequent ecosystem services for their wellbeing.
1.3 Overview of key findingsThis publication has been produced to provide a context for the challenges of natural resource management in the LEB. It documents the resources, industries and people of the LEB. It presents 43 maps that describe the current natural, social, economic, and institutional attributes of the LEB. The key findings are as follows:
The administrative setting in the LEB straddles four jurisdictions and four regional management authorities. Except for Queensland (Qld), regional management arrangements extend beyond the borders of the LEB. Lack of alignment in the other boundaries such as catchment management, conservation management, and local and state government boundaries further complicates the aim of achieving coordinated and integrated natural resource management (NRM).Most areas in the basin are classified as remote and people living in the basin have to travel large distances to the major health and service centres. The major land use in the basin is grazing followed by conservation, and most land is under leasehold tenure.Mining is the most economically important industry in the LEB. Aboriginal tenures and native title determination cover approximately 2% of area and there is further Aboriginal involvement in NRM through Indigenous Land Use Agreements. Conservation planning in the LEB has identified large areas that support healthy ecosystems and maintain important biodiversity. There are some areas that show signs of increased landscape stress and hydrological condition changes as a result of humans trying to gain a livelihood from one of the driest parts of the Australian continent, where evaporation exceeds precipitation significantly and soils limit production.
•
•
•
••
•
•
Desert Knowledge CRC 49People, communit ies and economies of the Lake Eyre Basin
Ch 2: Regional prof i le of the Lake Eyre Basin catchments pp. 41–88
The major water supply for people and industries comes from the GAB and periodic flooding. There are concerns for the sustainability of the ground water extraction, though the management of this is continuously improving. GAB springs and associated wetlands are highly important for natural habitats, culture and for nature based tourism.Large deep waterholes along the ephemeral river systems provide drought refuge for water dependent species. During floods these species populate the rivers and drive aquatic production.Uncontrolled flows and floods in the LEB are essential for the survival of river-side vegetation and aquatic ecosystems. There are few urban locations in the LEB and population density is generally less than 1 person per 1000 square kilometre. For most of the area Aboriginal proportions are low, although there are 59 Aboriginal language groups. However, there are some settlements where Aboriginal people are the majority of residents. Major employment sectors in the LEB are agriculture followed by government, retail, health, education and personal services, and construction. The LEB scores low in all four socio-economic indices that the Australian Bureau of Statistics developed to describe the wellbeing of the nation. Tourism and mining are two locally important industries in the LEB. Tourism relies heavily on infrastructure, services and access to nature based destinations including waterholes and wetlands associated with GAB springs. Mining is a localised activity, and with the current commodity price boom, exploration and mining activity continues to increase in the LEB. This is not captured in the 2001 Census analysis.
•
•
•
•
•
•
•
••
•
Desert Knowledge CRC50 People, communit ies and economies of the Lake Eyre Basin
Ch 2: Regional prof i le of the Lake Eyre Basin catchments pp. 41–88
2. Topography and management arrangements
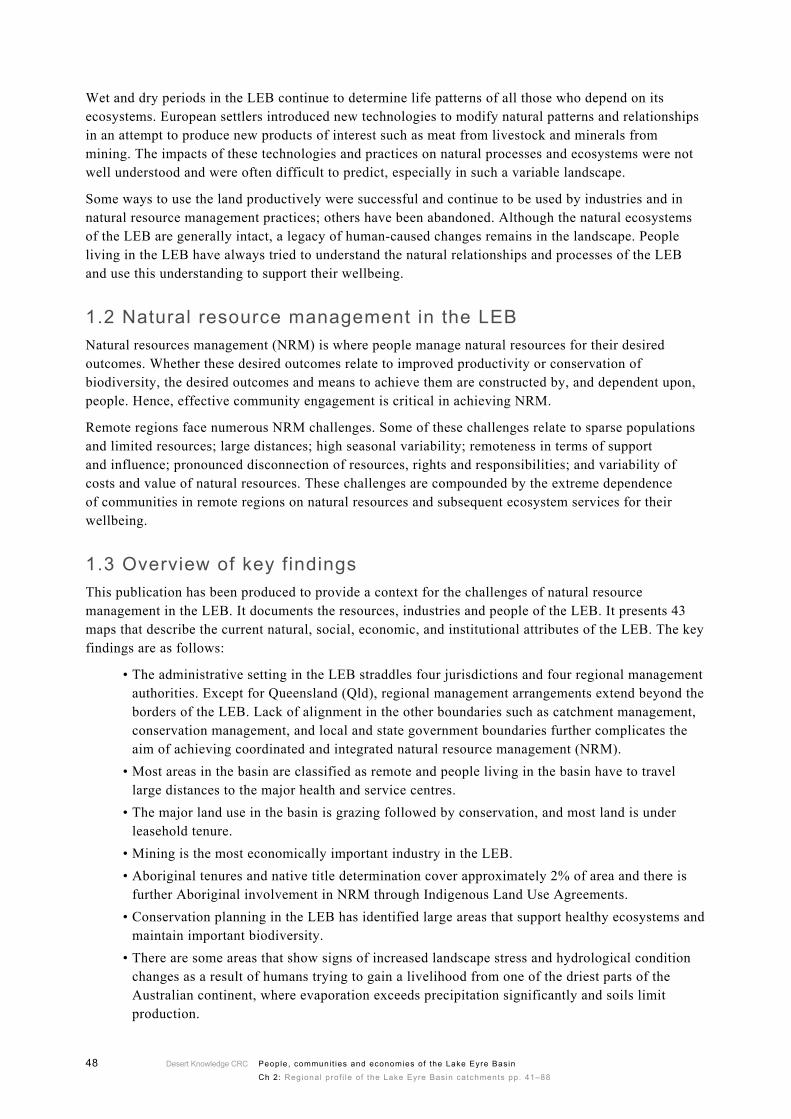
2.1 LEB roads, major population centres and management boundariesThe Lake Eyre catchments form the world’s largest inland basin. Figure 1 shows the catchment boundaries. The LEB is generally sparsely settled with major population centres (Alice Springs, Mount Isa, Broken Hill) occurring at the fringe. Nevertheless, some of the settlements in the LEB with very small populations are important regional centres.
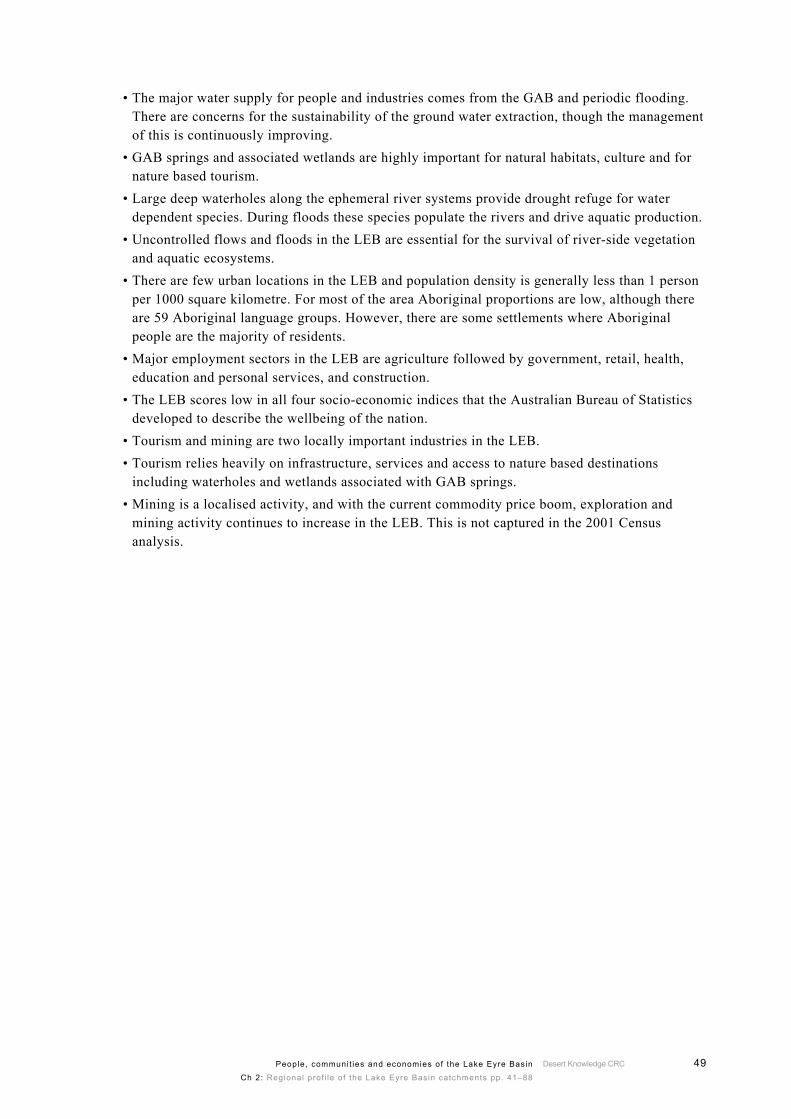
Management of the catchment is under the control of State, Northern Territory (NT) and Australian Government legislation, supported by regional NRM Boards in each jurisdiction. The LEB Regional NRM Boards are Desert Channels Queensland NRM Board, South Australian Arid Lands NRM Board, the Western Catchment Management Authority in New South Wales (NSW) and the NT NRM Board. Only the Qld management arrangement is focused entirely on the LEB; all other regional management authorities extend beyond the borders of the LEB (Figure 2).
2.1.1 Data sourcesThe Catchment Committee boundaries are approximately aligned based on the LEB Coordinating Group (Lake Eyre Basin Coordinating Group undated). NRM bodies are based on NHT2 region boundaries.
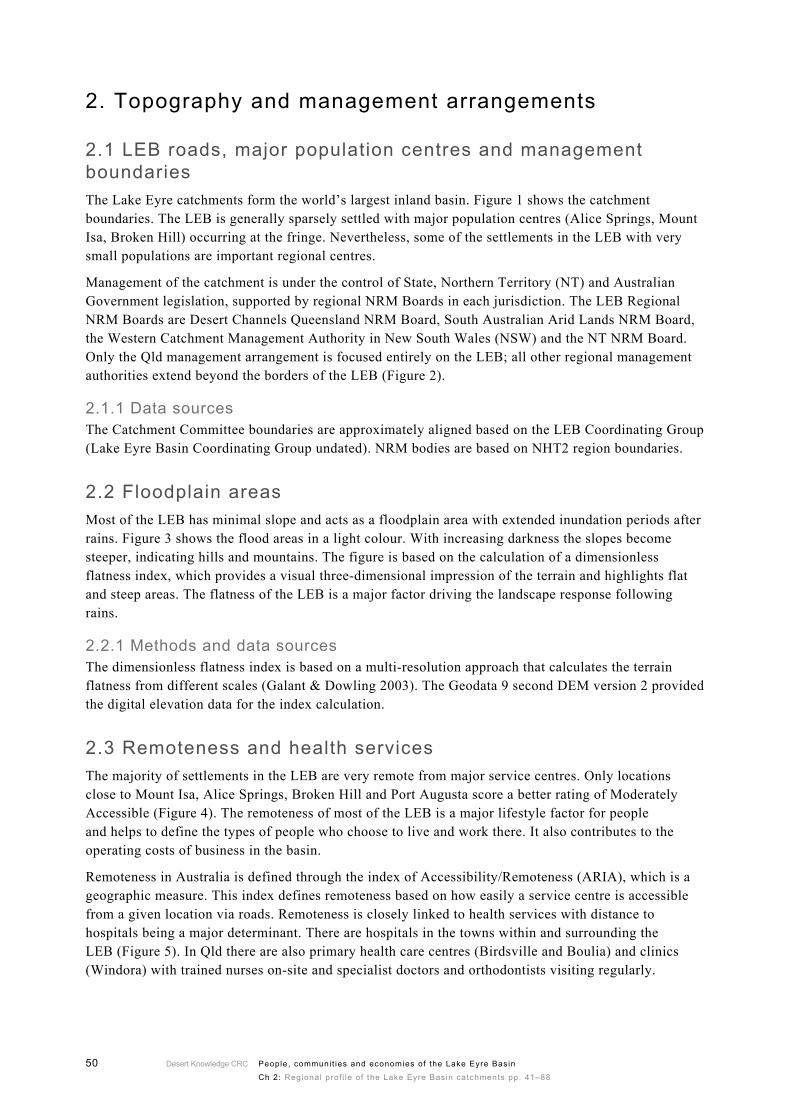
2.2 Floodplain areasMost of the LEB has minimal slope and acts as a floodplain area with extended inundation periods after rains. Figure 3 shows the flood areas in a light colour. With increasing darkness the slopes become steeper, indicating hills and mountains. The figure is based on the calculation of a dimensionless flatness index, which provides a visual three-dimensional impression of the terrain and highlights flat and steep areas. The flatness of the LEB is a major factor driving the landscape response following rains.
2.2.1 Methods and data sourcesThe dimensionless flatness index is based on a multi-resolution approach that calculates the terrain flatness from different scales (Galant & Dowling 2003). The Geodata 9 second DEM version 2 provided the digital elevation data for the index calculation.
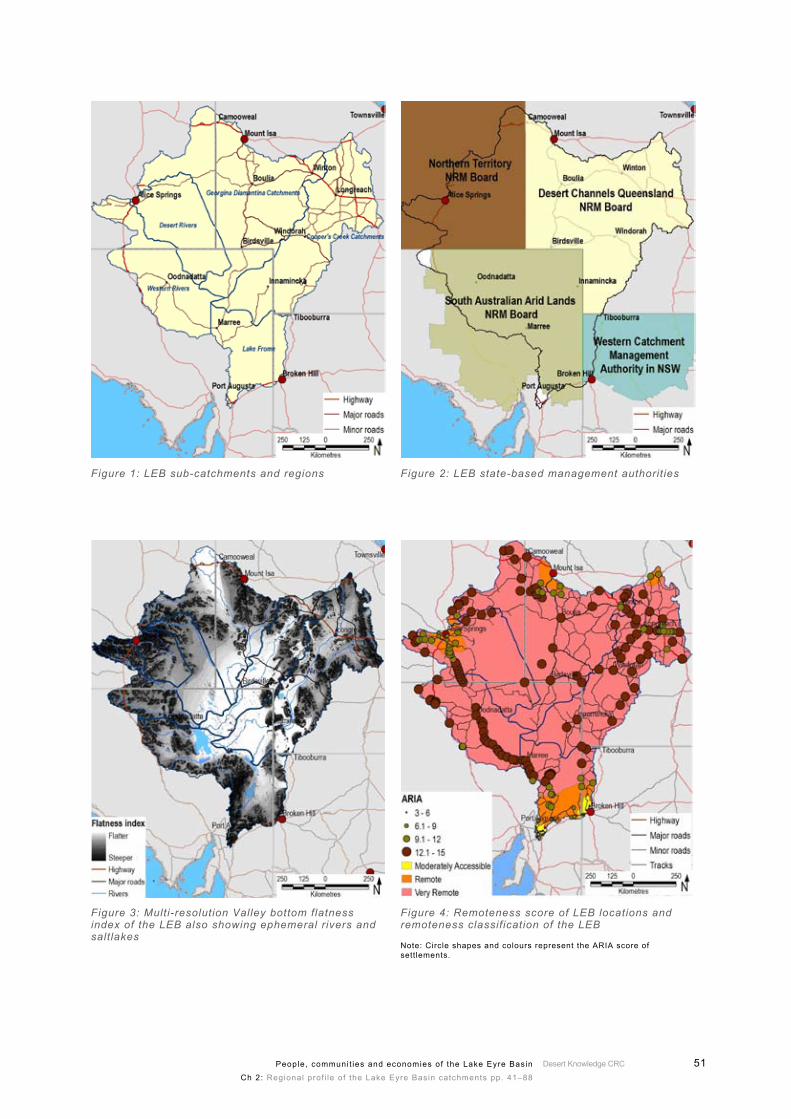
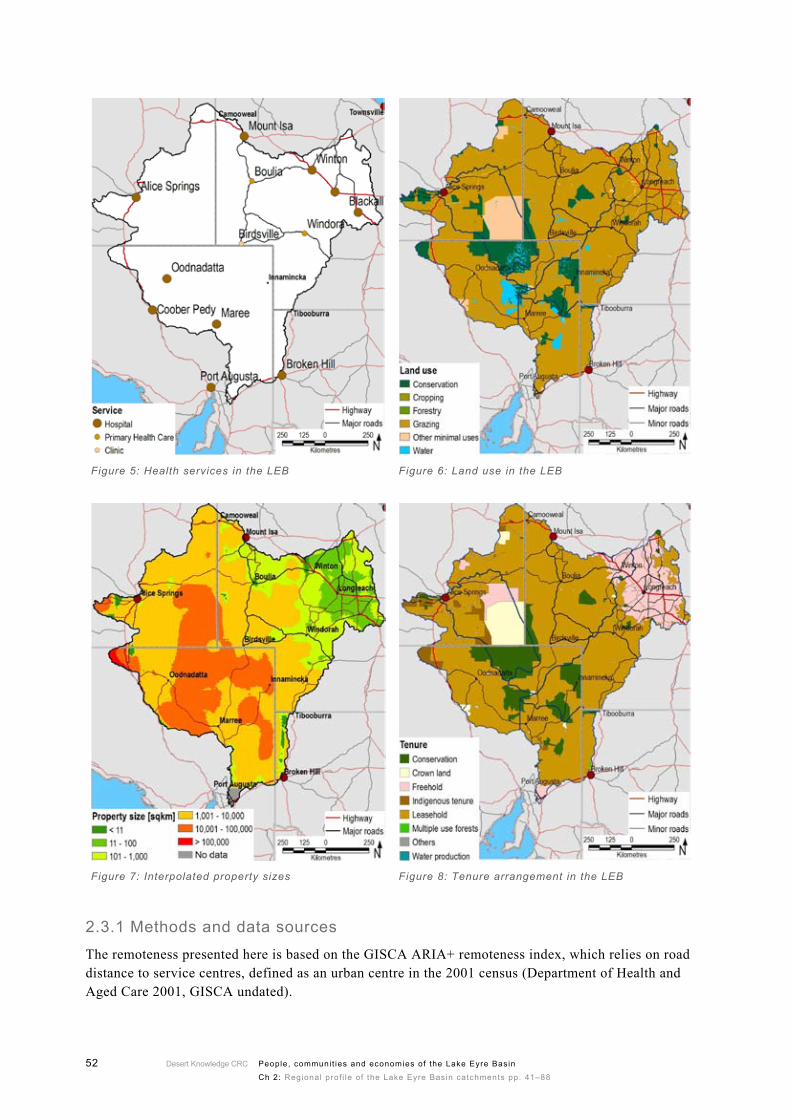
2.3 Remoteness and health servicesThe majority of settlements in the LEB are very remote from major service centres. Only locations close to Mount Isa, Alice Springs, Broken Hill and Port Augusta score a better rating of Moderately Accessible (Figure 4). The remoteness of most of the LEB is a major lifestyle factor for people and helps to define the types of people who choose to live and work there. It also contributes to the operating costs of business in the basin.
Remoteness in Australia is defined through the index of Accessibility/Remoteness (ARIA), which is a geographic measure. This index defines remoteness based on how easily a service centre is accessible from a given location via roads. Remoteness is closely linked to health services with distance to hospitals being a major determinant. There are hospitals in the towns within and surrounding the LEB (Figure 5). In Qld there are also primary health care centres (Birdsville and Boulia) and clinics (Windora) with trained nurses on-site and specialist doctors and orthodontists visiting regularly.
Desert Knowledge CRC 51People, communit ies and economies of the Lake Eyre Basin
Ch 2: Regional prof i le of the Lake Eyre Basin catchments pp. 41–88
Figure 1: LEB sub-catchments and regions Figure 2: LEB state-based management authorities
Figure 3: Multi-resolution Valley bottom flatness index of the LEB also showing ephemeral rivers and saltlakes
Figure 4: Remoteness score of LEB locations and remoteness classification of the LEB
Note: Circle shapes and colours represent the ARIA score of settlements.
Desert Knowledge CRC52 People, communit ies and economies of the Lake Eyre Basin
Ch 2: Regional prof i le of the Lake Eyre Basin catchments pp. 41–88
Figure 5: Health services in the LEB Figure 6: Land use in the LEB
Figure 7: Interpolated property sizes Figure 8: Tenure arrangement in the LEB
2.3.1 Methods and data sources
The remoteness presented here is based on the GISCA ARIA+ remoteness index, which relies on road distance to service centres, defined as an urban centre in the 2001 census (Department of Health and Aged Care 2001, GISCA undated).
Desert Knowledge CRC 53People, communit ies and economies of the Lake Eyre Basin
Ch 2: Regional prof i le of the Lake Eyre Basin catchments pp. 41–88
3. Land use and tenure
3.1 Land use in the LEBTable 1: Land use statistics of the LEB
Landuse %Grazing 82%
Conservation 11%
Others minimal uses 5%
Water and dry salt lakes 2%
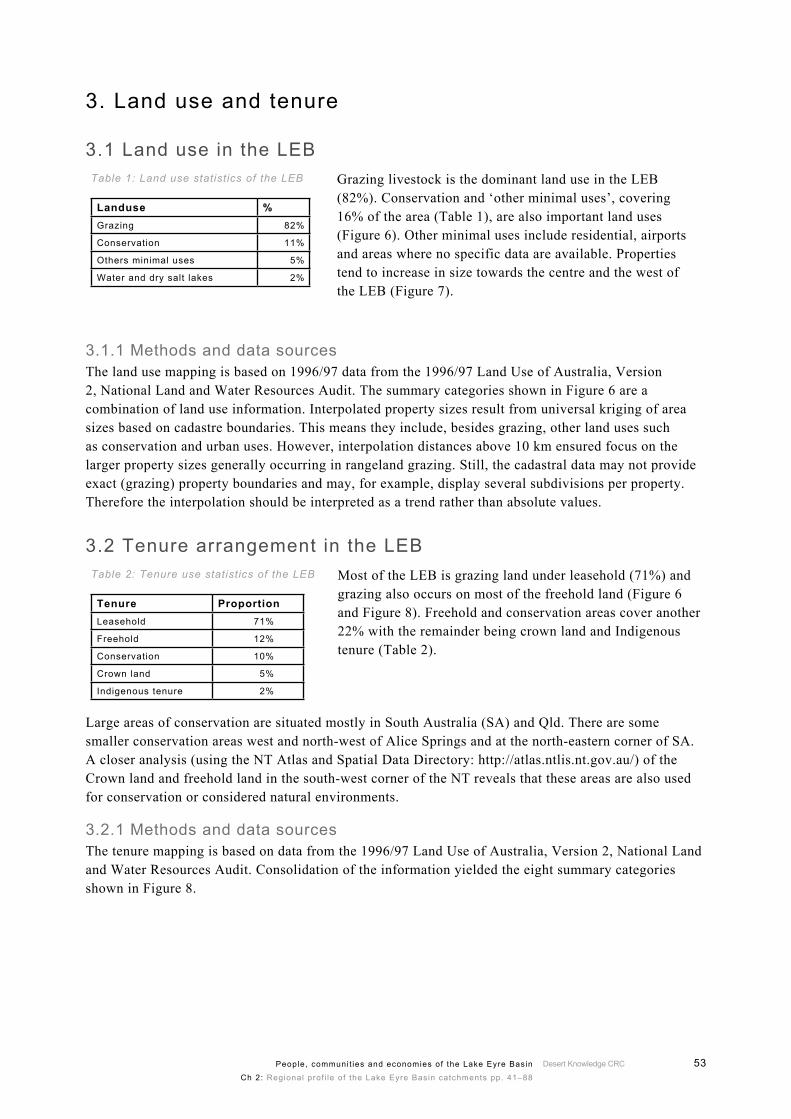
Grazing livestock is the dominant land use in the LEB (82%). Conservation and ‘other minimal uses’, covering 16% of the area (Table 1), are also important land uses (Figure 6). Other minimal uses include residential, airports and areas where no specific data are available. Properties tend to increase in size towards the centre and the west of the LEB (Figure 7).
3.1.1 Methods and data sourcesThe land use mapping is based on 1996/97 data from the 1996/97 Land Use of Australia, Version 2, National Land and Water Resources Audit. The summary categories shown in Figure 6 are a combination of land use information. Interpolated property sizes result from universal kriging of area sizes based on cadastre boundaries. This means they include, besides grazing, other land uses such as conservation and urban uses. However, interpolation distances above 10 km ensured focus on the larger property sizes generally occurring in rangeland grazing. Still, the cadastral data may not provide exact (grazing) property boundaries and may, for example, display several subdivisions per property. Therefore the interpolation should be interpreted as a trend rather than absolute values.
3.2 Tenure arrangement in the LEBTable 2: Tenure use statistics of the LEB
Tenure ProportionLeasehold 71%
Freehold 12%
Conservation 10%
Crown land 5%
Indigenous tenure 2%
Most of the LEB is grazing land under leasehold (71%) and grazing also occurs on most of the freehold land (Figure 6 and Figure 8). Freehold and conservation areas cover another 22% with the remainder being crown land and Indigenous tenure (Table 2).
Large areas of conservation are situated mostly in South Australia (SA) and Qld. There are some smaller conservation areas west and north-west of Alice Springs and at the north-eastern corner of SA. A closer analysis (using the NT Atlas and Spatial Data Directory: http://atlas.ntlis.nt.gov.au/) of the Crown land and freehold land in the south-west corner of the NT reveals that these areas are also used for conservation or considered natural environments.
3.2.1 Methods and data sourcesThe tenure mapping is based on data from the 1996/97 Land Use of Australia, Version 2, National Land and Water Resources Audit. Consolidation of the information yielded the eight summary categories shown in Figure 8.
Desert Knowledge CRC54 People, communit ies and economies of the Lake Eyre Basin
Ch 2: Regional prof i le of the Lake Eyre Basin catchments pp. 41–88
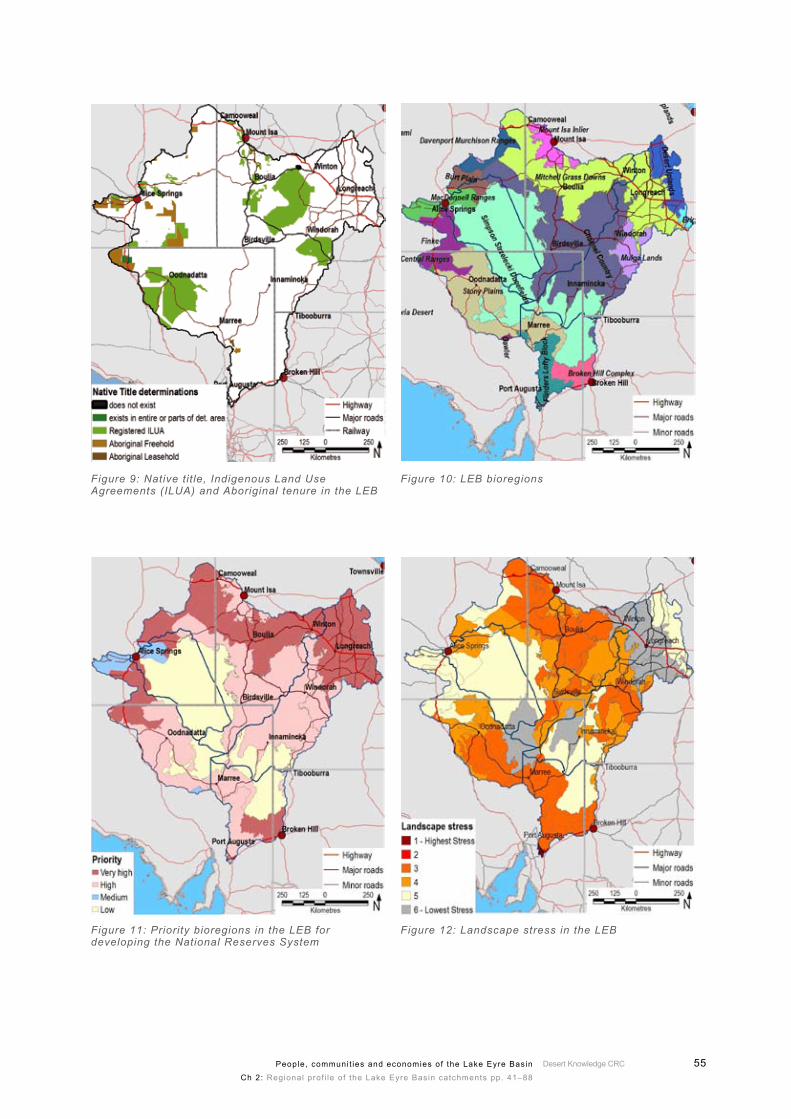
3.3 Native tit le and Aboriginal tenuresSmall areas of Aboriginal freehold and leasehold occur throughout the NT and South Australian parts of the LEB. There are two major native title determinations: one determining the existence of native title in the north-western corner of SA, and one extinguished native title in northern Qld near the road between Boulia and Winton. Indigenous Land Use Agreements (registered ILUA) exist in all states with large areas in central Qld and the western South Australia LEB (Figure 9).
3.3.1 Methods and data sourcesNative title determinations and Indigenous Land Use Agreements are valid up to and including the year 2005. Data from Geoscience Australia (http://www.ga.gov.au).
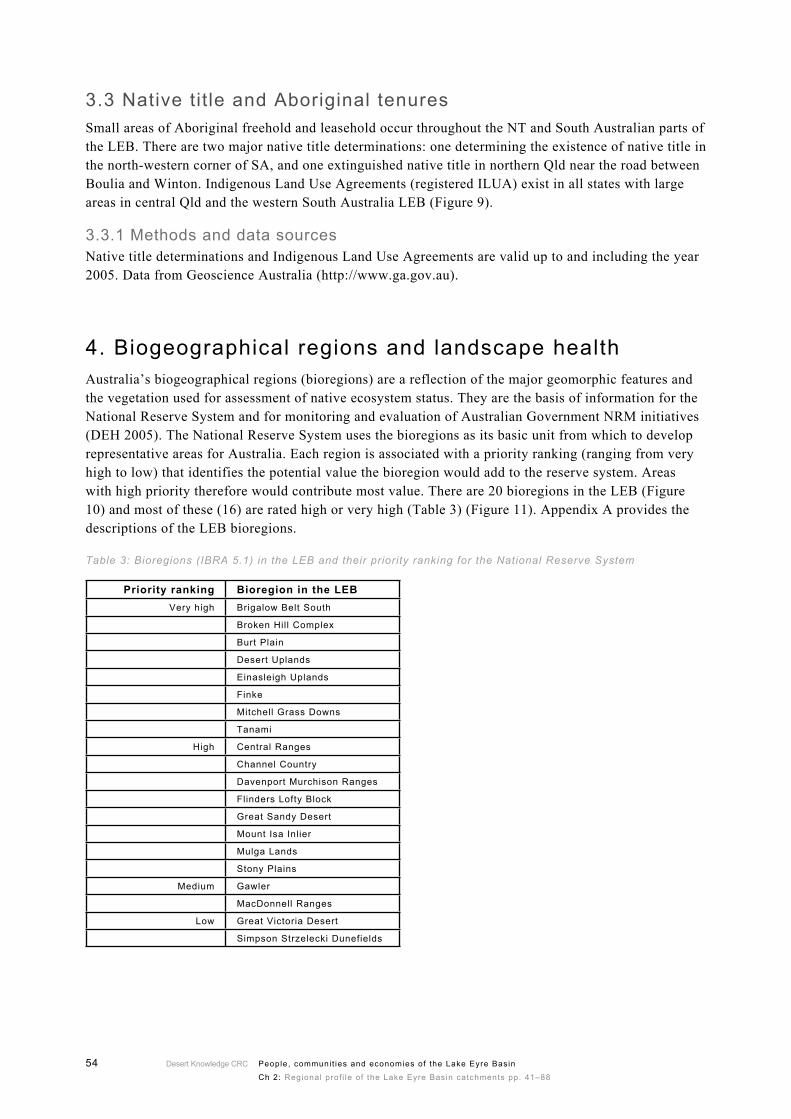
4. Biogeographical regions and landscape healthAustralia’s biogeographical regions (bioregions) are a reflection of the major geomorphic features and the vegetation used for assessment of native ecosystem status. They are the basis of information for the National Reserve System and for monitoring and evaluation of Australian Government NRM initiatives (DEH 2005). The National Reserve System uses the bioregions as its basic unit from which to develop representative areas for Australia. Each region is associated with a priority ranking (ranging from very high to low) that identifies the potential value the bioregion would add to the reserve system. Areas with high priority therefore would contribute most value. There are 20 bioregions in the LEB (Figure 10) and most of these (16) are rated high or very high (Table 3) (Figure 11). Appendix A provides the descriptions of the LEB bioregions.
Table 3: Bioregions (IBRA 5.1) in the LEB and their priority ranking for the National Reserve System
Priority ranking Bioregion in the LEBVery high Brigalow Belt South
Broken Hill Complex
Burt Plain
Desert Uplands
Einasleigh Uplands
Finke
Mitchell Grass Downs
Tanami
High Central Ranges
Channel Country
Davenport Murchison Ranges
Flinders Lofty Block
Great Sandy Desert
Mount Isa Inlier
Mulga Lands
Stony Plains
Medium Gawler
MacDonnell Ranges
Low Great Victoria Desert
Simpson Strzelecki Dunefields
Desert Knowledge CRC 55People, communit ies and economies of the Lake Eyre Basin
Ch 2: Regional prof i le of the Lake Eyre Basin catchments pp. 41–88
Figure 9: Native tit le, Indigenous Land Use Agreements (ILUA) and Aboriginal tenure in the LEB
Figure 10: LEB bioregions
Figure 11: Priority bioregions in the LEB for developing the National Reserves System
Figure 12: Landscape stress in the LEB
Desert Knowledge CRC56 People, communit ies and economies of the Lake Eyre Basin
Ch 2: Regional prof i le of the Lake Eyre Basin catchments pp. 41–88
4.1 Landscape healthMaintaining healthy landscapes is a goal of ecological sustainable development (ESD). ESD integrates economic, social and environmental issues into the management of Australia’s natural resources and forms an integral part of the decision-making process in natural resource management (e.g. Australian Government’s Environmental Protection and Biodiversity Conservation Act 1999, Queensland’s Nature Conservation Act 1992, Queensland’s Environmental Protection Act 1994).
The national action plan for water quality and salinity arises from the concept of ESD and addresses two important issues: water quality and salinity. These are also key issues for healthy landscapes. However, the healthy landscape concept goes beyond these issues and takes a big approach, to include systemic interaction within and between landscapes. A landscape includes uniform landforms, soils, geology and hydrogeology of an area. By this definition, a landscape can contain several catchments or alternatively may be part of a single catchment (National Land and Water Resource Audit 2001).
The national land and water resource audit (NLWRA) assesses landscapes’ health on the basis of the interim biogeographic regionalisation for Australia (Thackway & Cresswell 1995). The LEB intersects these bioregions (Figure 10), each of which is divided into subregions. The health of these subregions is assessed on a range of indicators. These indicators are:
native vegetation and land usesoil and hydrologyweeds and feral animalsthreatened species and ecosystems.
The NLWRA report on landscape health (Morgan 2001) provides an assessment of these indicators against several criteria and the combined measure of landscape stress. The analysis separates land into two zones: intensive use zones that have more than 10% of their native vegetation cleared, and the extensive use zones that have less than 10% cleared (Morgan 2001). The LEB lies within the extensive use zone. The following sections provide a selection of the assessments of the current condition using landscape stress as a combination of the terrestrial condition and hydrological conditions to show degradation.
4.2 Landscape stressLandscape stress describes landscape health over time on the basis of the different criteria discussed in the NLWRA. It uses land condition indicators such as grazing pressure, pests and threatened species (Table 4) of the extensive use zone to derive a combined landscape stress value (Morgan 2000).
A visual inspection of Figure 12 indicates that approximately half of the LEB is in the lowest stress categories (categories 5 and 6) and almost all the remainder belongs to the medium stress categories 3 and 4. There is only a small area at the southern tip of the LEB that shows high stress.
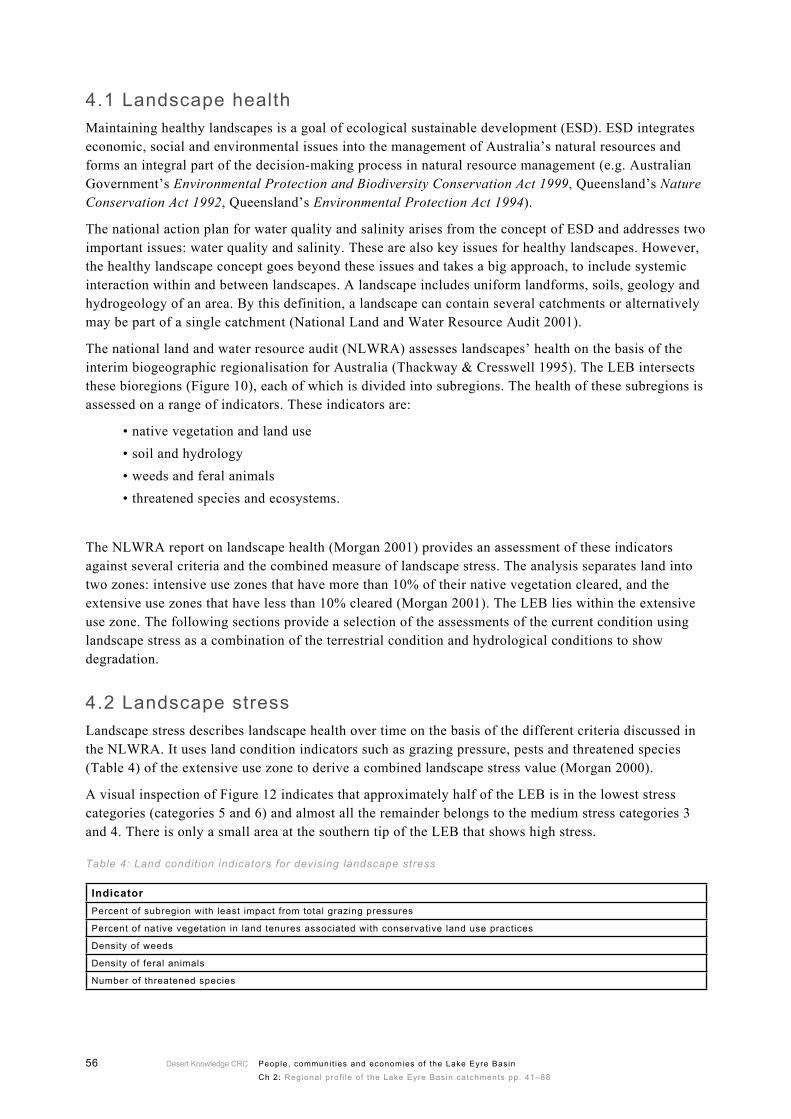
Table 4: Land condition indicators for devising landscape stress
Indicator Percent of subregion with least impact from total grazing pressures
Percent of native vegetation in land tenures associated with conservative land use practices
Density of weeds
Density of feral animals
Number of threatened species
••••
Desert Knowledge CRC 57People, communit ies and economies of the Lake Eyre Basin
Ch 2: Regional prof i le of the Lake Eyre Basin catchments pp. 41–88
4.2.1 Methods and data sourcesLinking of landscape health attributes from the NLWRA (Morgan 2000) for each bioregion (Thackway & Cresswell 1995) in the LEB is presented in Figure 12.
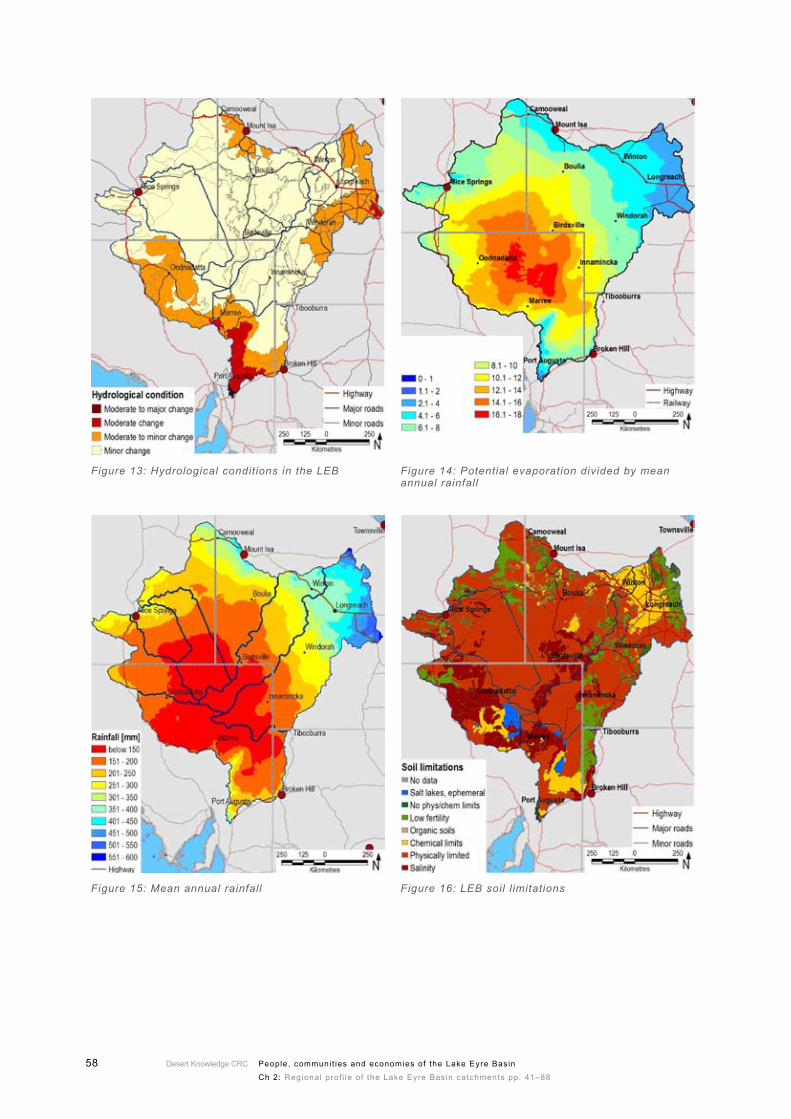
4.3 Hydrological conditions The hydrological conditions give an indication of the anthropogenic change that is caused by landuse. Impacts on the hydrology of terrestrial components (i.e. excluding rivers and lakes) may result from land surface use and activities that have caused soil degradation. These include, but are not limited to, overgrazing, vegetation clearing, levelling and draining of land, levee and dam construction, all of which relate to land use practices (Morgan 2001).
The hydrological condition of the LEB’s bioregions indicates only minor change for most of the central area and the NT with the exception of a small area in the south of SA. Bordering fringes around Mount Isa, the eastern Qld part of the LEB, the southern fringes of SA and a significant part of western SA show moderate changes to their hydrology.
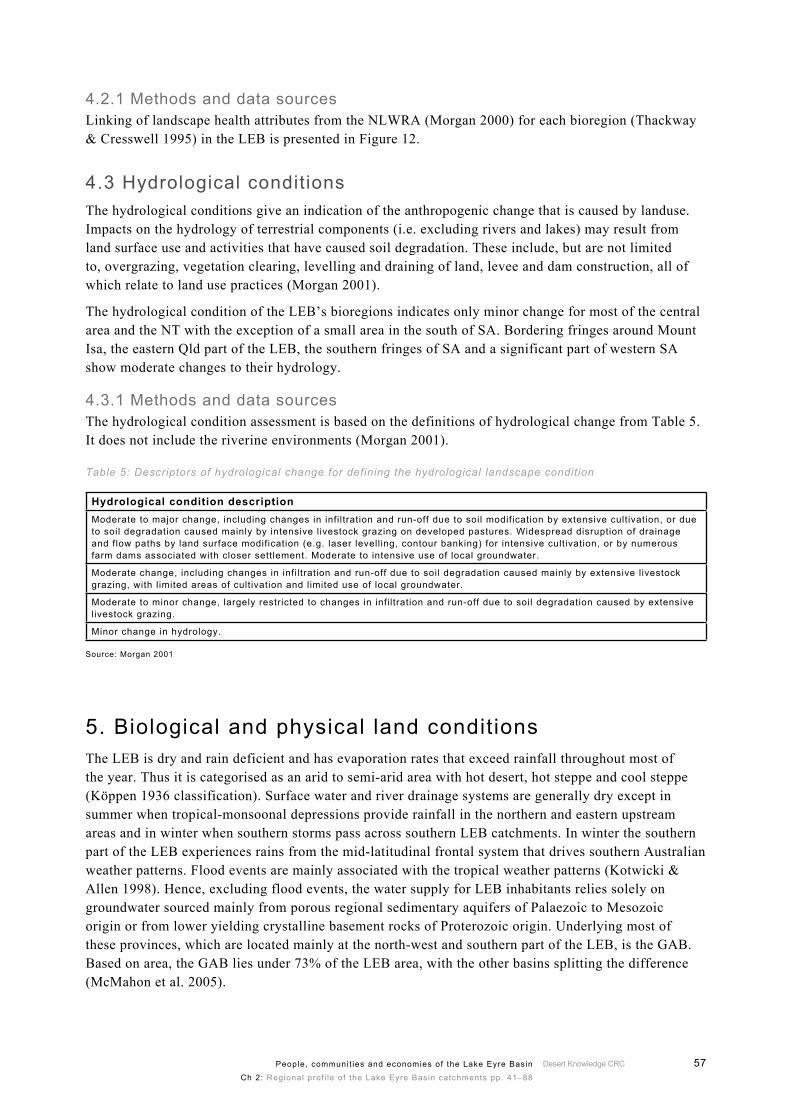
4.3.1 Methods and data sourcesThe hydrological condition assessment is based on the definitions of hydrological change from Table 5. It does not include the riverine environments (Morgan 2001).
Table 5: Descriptors of hydrological change for defining the hydrological landscape condition
Hydrological condition descriptionModerate to major change, including changes in infiltration and run-off due to soil modification by extensive cultivation, or due to soil degradation caused mainly by intensive livestock grazing on developed pastures. Widespread disruption of drainage and flow paths by land surface modification (e.g. laser levelling, contour banking) for intensive cultivation, or by numerous farm dams associated with closer settlement. Moderate to intensive use of local groundwater.
Moderate change, including changes in infiltration and run-off due to soil degradation caused mainly by extensive livestock grazing, with limited areas of cultivation and limited use of local groundwater.
Moderate to minor change, largely restricted to changes in infiltration and run-off due to soil degradation caused by extensive livestock grazing.
Minor change in hydrology.
Source: Morgan 2001
5. Biological and physical land conditionsThe LEB is dry and rain deficient and has evaporation rates that exceed rainfall throughout most of the year. Thus it is categorised as an arid to semi-arid area with hot desert, hot steppe and cool steppe (Köppen 1936 classification). Surface water and river drainage systems are generally dry except in summer when tropical-monsoonal depressions provide rainfall in the northern and eastern upstream areas and in winter when southern storms pass across southern LEB catchments. In winter the southern part of the LEB experiences rains from the mid-latitudinal frontal system that drives southern Australian weather patterns. Flood events are mainly associated with the tropical weather patterns (Kotwicki & Allen 1998). Hence, excluding flood events, the water supply for LEB inhabitants relies solely on groundwater sourced mainly from porous regional sedimentary aquifers of Palaezoic to Mesozoic origin or from lower yielding crystalline basement rocks of Proterozoic origin. Underlying most of these provinces, which are located mainly at the north-west and southern part of the LEB, is the GAB. Based on area, the GAB lies under 73% of the LEB area, with the other basins splitting the difference (McMahon et al. 2005).
Desert Knowledge CRC58 People, communit ies and economies of the Lake Eyre Basin
Ch 2: Regional prof i le of the Lake Eyre Basin catchments pp. 41–88
Figure 13: Hydrological conditions in the LEB Figure 14: Potential evaporation divided by mean annual rainfall
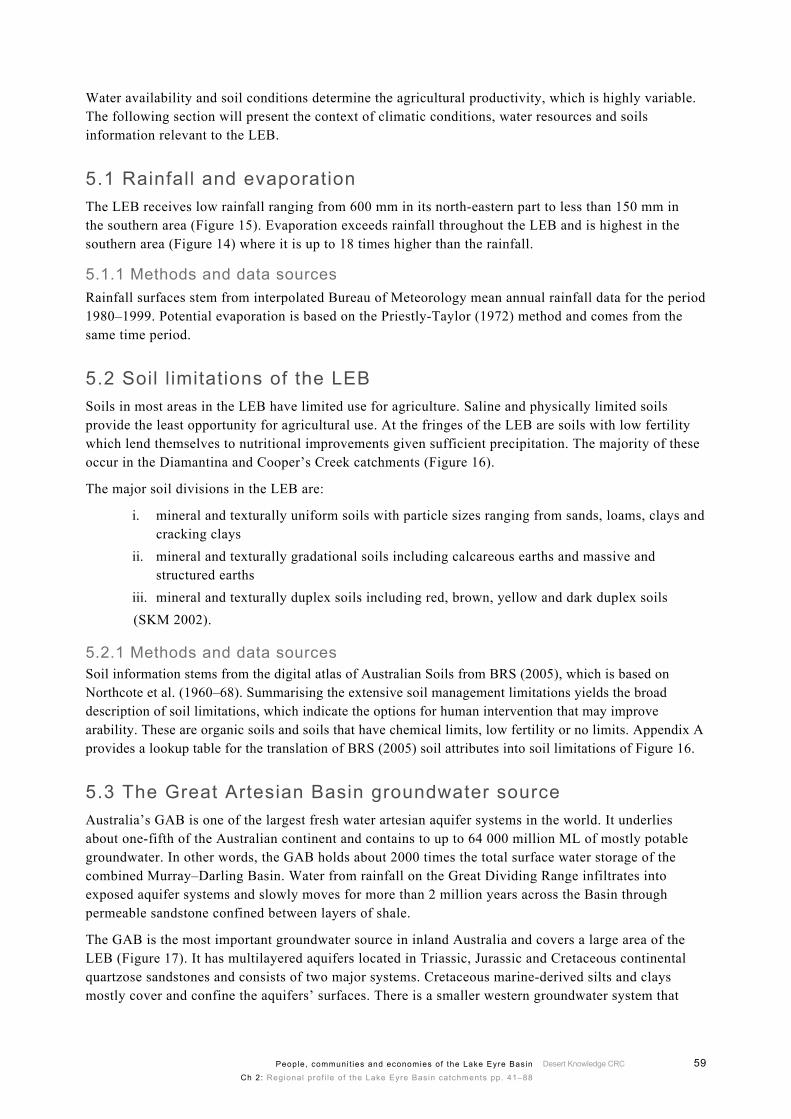
Figure 15: Mean annual rainfall Figure 16: LEB soil l imitations
Desert Knowledge CRC 59People, communit ies and economies of the Lake Eyre Basin
Ch 2: Regional prof i le of the Lake Eyre Basin catchments pp. 41–88
Water availability and soil conditions determine the agricultural productivity, which is highly variable. The following section will present the context of climatic conditions, water resources and soils information relevant to the LEB.
5.1 Rainfall and evaporationThe LEB receives low rainfall ranging from 600 mm in its north-eastern part to less than 150 mm in the southern area (Figure 15). Evaporation exceeds rainfall throughout the LEB and is highest in the southern area (Figure 14) where it is up to 18 times higher than the rainfall.
5.1.1 Methods and data sourcesRainfall surfaces stem from interpolated Bureau of Meteorology mean annual rainfall data for the period 1980–1999. Potential evaporation is based on the Priestly-Taylor (1972) method and comes from the same time period.
5.2 Soil l imitations of the LEBSoils in most areas in the LEB have limited use for agriculture. Saline and physically limited soils provide the least opportunity for agricultural use. At the fringes of the LEB are soils with low fertility which lend themselves to nutritional improvements given sufficient precipitation. The majority of these occur in the Diamantina and Cooper’s Creek catchments (Figure 16).
The major soil divisions in the LEB are:
mineral and texturally uniform soils with particle sizes ranging from sands, loams, clays and cracking claysmineral and texturally gradational soils including calcareous earths and massive and structured earths mineral and texturally duplex soils including red, brown, yellow and dark duplex soils
(SKM 2002).
5.2.1 Methods and data sourcesSoil information stems from the digital atlas of Australian Soils from BRS (2005), which is based on Northcote et al. (1960–68). Summarising the extensive soil management limitations yields the broad description of soil limitations, which indicate the options for human intervention that may improve arability. These are organic soils and soils that have chemical limits, low fertility or no limits. Appendix A provides a lookup table for the translation of BRS (2005) soil attributes into soil limitations of Figure 16.
5.3 The Great Artesian Basin groundwater sourceAustralia’s GAB is one of the largest fresh water artesian aquifer systems in the world. It underlies about one-fifth of the Australian continent and contains to up to 64 000 million ML of mostly potable groundwater. In other words, the GAB holds about 2000 times the total surface water storage of the combined Murray–Darling Basin. Water from rainfall on the Great Dividing Range infiltrates into exposed aquifer systems and slowly moves for more than 2 million years across the Basin through permeable sandstone confined between layers of shale.
The GAB is the most important groundwater source in inland Australia and covers a large area of the LEB (Figure 17). It has multilayered aquifers located in Triassic, Jurassic and Cretaceous continental quartzose sandstones and consists of two major systems. Cretaceous marine-derived silts and clays mostly cover and confine the aquifers’ surfaces. There is a smaller western groundwater system that
i.
ii.
iii.
Desert Knowledge CRC60 People, communit ies and economies of the Lake Eyre Basin
Ch 2: Regional prof i le of the Lake Eyre Basin catchments pp. 41–88
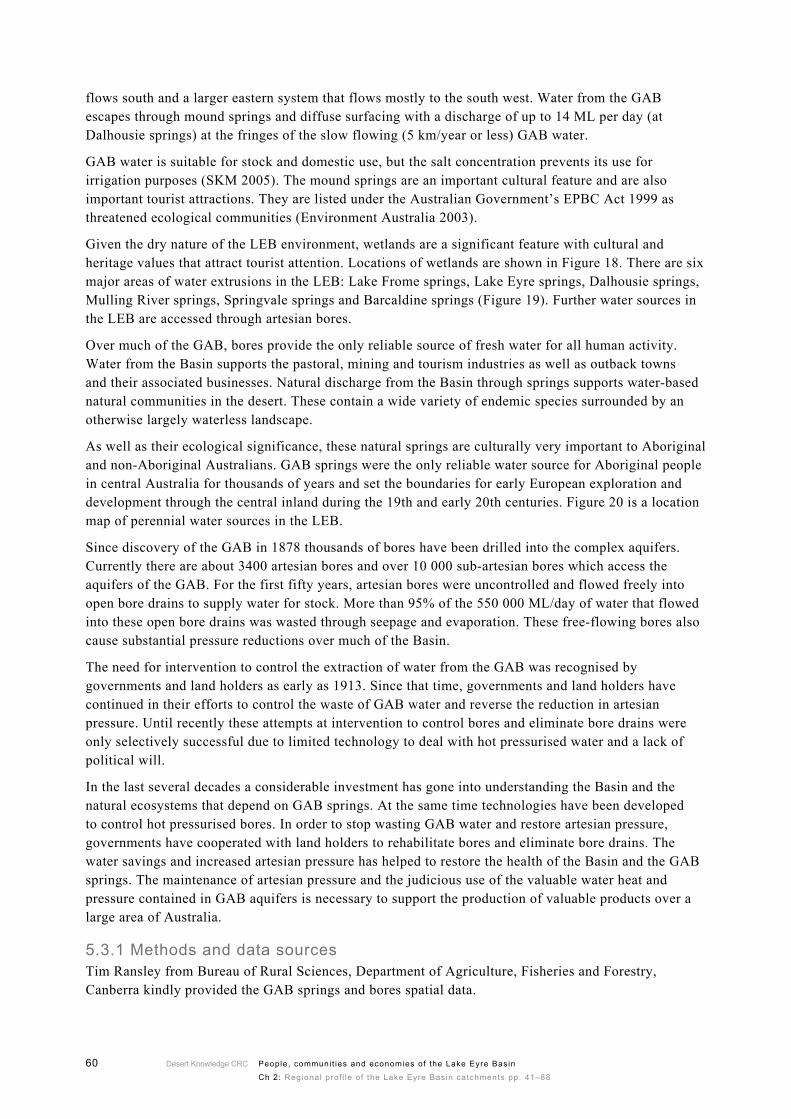
flows south and a larger eastern system that flows mostly to the south west. Water from the GAB escapes through mound springs and diffuse surfacing with a discharge of up to 14 ML per day (at Dalhousie springs) at the fringes of the slow flowing (5 km/year or less) GAB water.
GAB water is suitable for stock and domestic use, but the salt concentration prevents its use for irrigation purposes (SKM 2005). The mound springs are an important cultural feature and are also important tourist attractions. They are listed under the Australian Government’s EPBC Act 1999 as threatened ecological communities (Environment Australia 2003).
Given the dry nature of the LEB environment, wetlands are a significant feature with cultural and heritage values that attract tourist attention. Locations of wetlands are shown in Figure 18. There are six major areas of water extrusions in the LEB: Lake Frome springs, Lake Eyre springs, Dalhousie springs, Mulling River springs, Springvale springs and Barcaldine springs (Figure 19). Further water sources in the LEB are accessed through artesian bores.
Over much of the GAB, bores provide the only reliable source of fresh water for all human activity. Water from the Basin supports the pastoral, mining and tourism industries as well as outback towns and their associated businesses. Natural discharge from the Basin through springs supports water-based natural communities in the desert. These contain a wide variety of endemic species surrounded by an otherwise largely waterless landscape.
As well as their ecological significance, these natural springs are culturally very important to Aboriginal and non-Aboriginal Australians. GAB springs were the only reliable water source for Aboriginal people in central Australia for thousands of years and set the boundaries for early European exploration and development through the central inland during the 19th and early 20th centuries. Figure 20 is a location map of perennial water sources in the LEB.
Since discovery of the GAB in 1878 thousands of bores have been drilled into the complex aquifers. Currently there are about 3400 artesian bores and over 10 000 sub-artesian bores which access the aquifers of the GAB. For the first fifty years, artesian bores were uncontrolled and flowed freely into open bore drains to supply water for stock. More than 95% of the 550 000 ML/day of water that flowed into these open bore drains was wasted through seepage and evaporation. These free-flowing bores also cause substantial pressure reductions over much of the Basin.
The need for intervention to control the extraction of water from the GAB was recognised by governments and land holders as early as 1913. Since that time, governments and land holders have continued in their efforts to control the waste of GAB water and reverse the reduction in artesian pressure. Until recently these attempts at intervention to control bores and eliminate bore drains were only selectively successful due to limited technology to deal with hot pressurised water and a lack of political will.
In the last several decades a considerable investment has gone into understanding the Basin and the natural ecosystems that depend on GAB springs. At the same time technologies have been developed to control hot pressurised bores. In order to stop wasting GAB water and restore artesian pressure, governments have cooperated with land holders to rehabilitate bores and eliminate bore drains. The water savings and increased artesian pressure has helped to restore the health of the Basin and the GAB springs. The maintenance of artesian pressure and the judicious use of the valuable water heat and pressure contained in GAB aquifers is necessary to support the production of valuable products over a large area of Australia.
5.3.1 Methods and data sourcesTim Ransley from Bureau of Rural Sciences, Department of Agriculture, Fisheries and Forestry, Canberra kindly provided the GAB springs and bores spatial data.
Desert Knowledge CRC 61People, communit ies and economies of the Lake Eyre Basin
Ch 2: Regional prof i le of the Lake Eyre Basin catchments pp. 41–88
Figure 17: Great Artesian Basin
(Map provided by Vol Norris, Lake Eyre Basin Community Advisory Committee)
Figure 18: Wetlands in the LEB
(copied from Schmiechen 2004)
Figure 19: Location of springs in the LEB Figure 20: Location of artesian bores in the LEB
Desert Knowledge CRC62 People, communit ies and economies of the Lake Eyre Basin
Ch 2: Regional prof i le of the Lake Eyre Basin catchments pp. 41–88
6. Population statistics, sectorial information and wellbeing indices
The main source of socio-economic data in Australia is the five-yearly census. The latest information available at the time this data was compiled was the 2001 census. The following section uses this data to describe the socio-economic status quo of the LEB. The Australian Bureau of Statistics (ABS) undertakes the census, in which information is collected from households in collection districts (CD), which is the smallest unit of data collection. The statistical local areas (SLA) combines data from several collection districts. A local government area (LGA) in turn consists of one or more SLAs, with combinations of LGAs then forming higher units for statistical data dissemination. The Australian Standard Geographic Classification shown in Appendix C defines the relationship between the statistical data collection units.
Administrative boundaries of local government areas and collection district boundaries do not overlap with catchments and catchment management boundaries anywhere in Australia. This presents a dilemma for natural resource management, which aims to integrate information from socio-economic and biophysical systems to achieve sustainable resource management. It is even more confounded by the temporal difference of data collections which may result in a mismatch of up to several years between socio-economic and biophysical systems data. Such differences become a problem when processes underlying the systems are driving rapid changes and are not captured simultaneously. Fortunately, the biophysical drivers discussed in the previous section do not change significantly within the time frame important for this study, so the main issue faced here is the mismatch between administrative/socio-economic data collection boundaries and catchment management boundaries (e.g. Figure 21).
The integration of socio-economic information with the catchment management boundaries is based on a best-fit option. The following section uses the CDs, SLAs and LGAs within and adjoining the LEB for visual description of the socio-economic status quo. For presentation purposes of ABS statistics at the CD level, the section presents only the parts of the CDs that lay within the LEB, cutting off areas outside the LEB boundary.
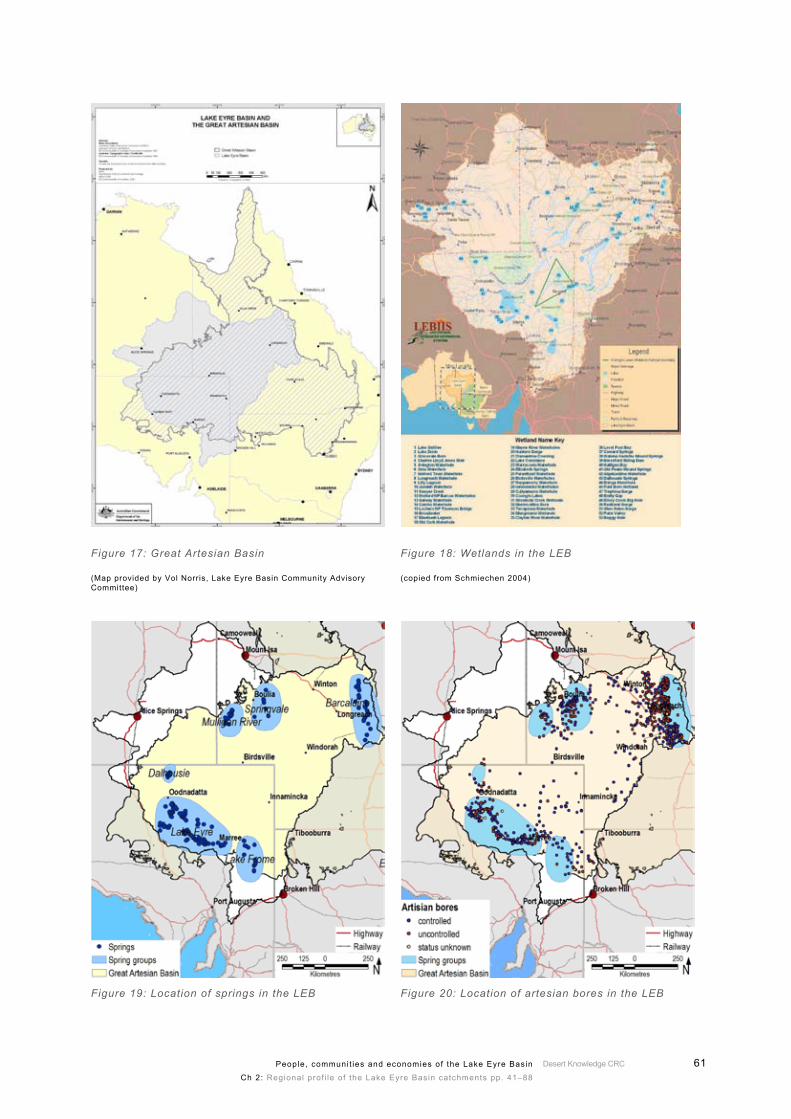
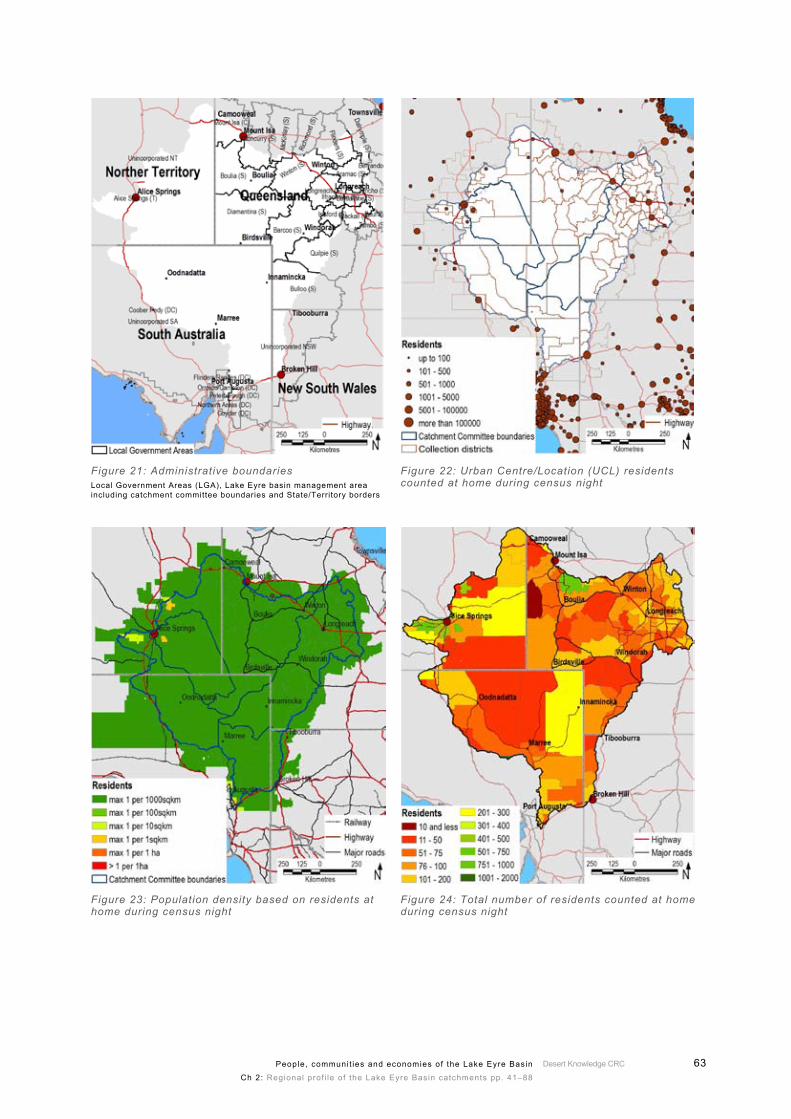
6.1 Administrative regionsFigure 21 shows the mismatch of administrative boundaries including States/Territories, local governments and catchment management boundaries in the LEB. For the Qld part of the LEB, local government areas are comparatively small when compared with the others States. For example, the LEB is only a small part of the large unincorporated NT administration area. A similar situation exists in SA and NSW, where the unincorporated parts exceed the LEB extensively. For socio-economic statistics at the LGA level this means that socio-economic information for the non-Qld parts is of limited use for this study. These non-overlapping institutional boundaries pose a complication for land and resource management across states and local government boundaries and are overlaid by another layer of biophysical boundaries (here reflected by catchment committee boundaries) which are more relevant to managing natural resources.
6.1.1 Data sourcesThe Catchment Committee boundaries are approximately aligned and are based on the Lake Eyre Basin Coordinating Group (Lake Eyre Basin Coordinating Group undated). Local Government Areas are based on the Australian Standard Geographical Definition 2001 (Trewin 2003).
Desert Knowledge CRC 63People, communit ies and economies of the Lake Eyre Basin
Ch 2: Regional prof i le of the Lake Eyre Basin catchments pp. 41–88
Figure 21: Administrative boundariesLocal Government Areas (LGA), Lake Eyre basin management area including catchment committee boundaries and State/Territory borders
Figure 22: Urban Centre/Location (UCL) residents counted at home during census night
Figure 23: Population density based on residents at home during census night
Figure 24: Total number of residents counted at home during census night
Desert Knowledge CRC64 People, communit ies and economies of the Lake Eyre Basin
Ch 2: Regional prof i le of the Lake Eyre Basin catchments pp. 41–88
6.1.2 Urban locations within and adjacent to the LEB, and population densityThe ABS defines urban centres and localities based on the number of people living in close proximity. An urban centre has a population of 1000 or more persons while a locality has less than this, but a minimum of 40 occupied dwellings in a non-farm setting (Trewin 2003). Urban Centre/Locations (UCLs) allow the identification of regions in which the production base (agricultural or industrial) supports urban development and associated high population numbers. There is a distinct lack of UCLs within the LEB; most urban concentrations occur at its fringes and mainly to the south and east. This pattern follows the agricultural resource base and climate (see Section 5) which identifies the interior of the LEB as low productivity based on water availability and soil limitations. Mainly the north-east Qld part has a higher number of urban areas that are located in the freehold areas around Winton and Longreach along the Matilda Highway and Matilda Development Road (Figure 22). The population density throughout the LEB is very low and seldom achieves more than 1 person per square kilometre (Figure 23) except for areas defined as urban centres/locations (Figure 22).
6.1.3 Methods and data sourcesPopulation densities calculated from residents counted at home during the census night. This means that the numbers underestimate the population slightly because people away from home are not counted. Data is based on the 2001 census.
6.1.4 Estimating the number of residentsThe ABS provides socio-economic information from the 2001 census (ABS 2001a) in a range of standard data packages such as CDATA (CD level and above information) and IRDB (SLA level or above). All data provided at the CD level is based on the amount of people counted, so includes visitors as well as residents. This is usually not a major problem in the larger urban centres where the population is high. However, in areas with high visitor numbers and small populations – as is the case in the outback – this can lead to major distortions. In the LEB there are several areas where ABS statistics based on counted data provide only a limited account of the real socio-economic conditions. Figure 24 shows residents at home during census night – a result of subtracting all visitors from the enumerated population. To this effect the population and residents counted at home give the upper and lower boundary of actual resident numbers.
This also means that the reliability of ABS statistics is restricted in areas with low population density. Subsequent maps that use ABS data show low confidence areas where visitors exceed 25% (arbitrarily chosen) to remind the reader of the issue.
6.2 Aboriginal statisticsWhile there is a range of Aboriginal information, this regional profile only provides limited details. This is firstly due to the limited availability of Aboriginal-specific information from census data at the fine scale. Secondly, a range of Aboriginal information is culturally sensitive; an example is that locations of culturally significant places are generally unavailable. Hence the following will focus on Aboriginal population and language boundaries.
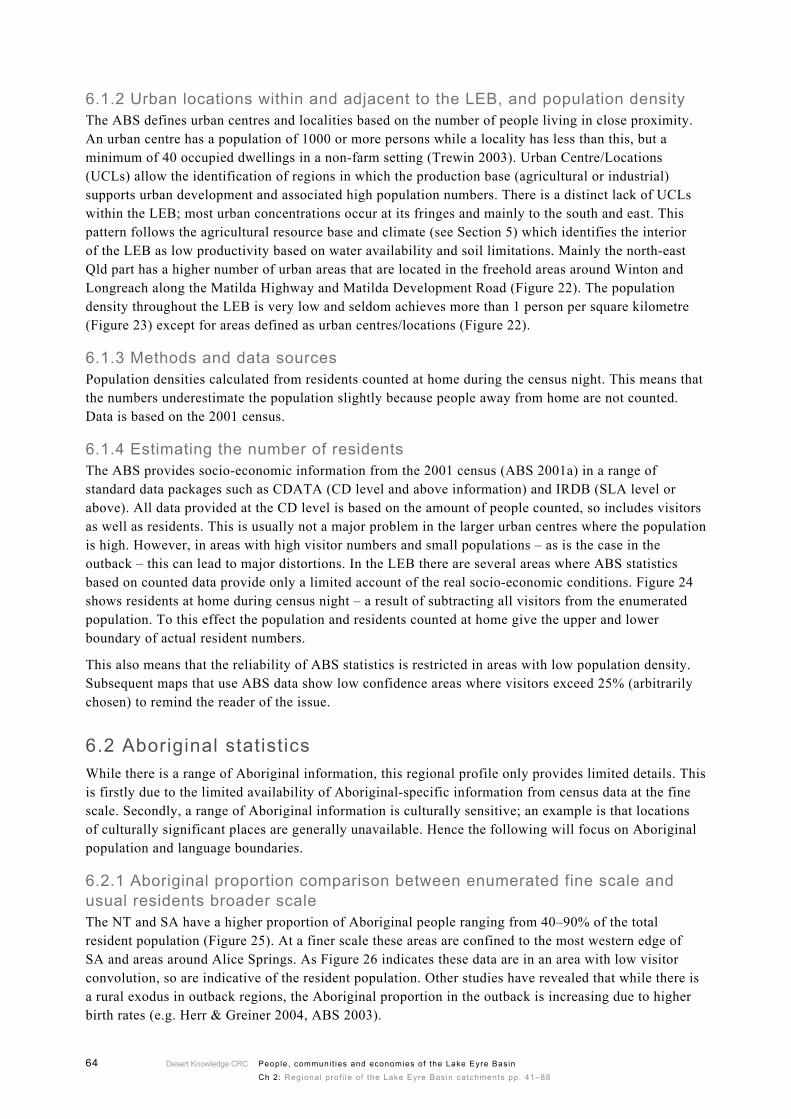
6.2.1 Aboriginal proportion comparison between enumerated fine scale and usual residents broader scaleThe NT and SA have a higher proportion of Aboriginal people ranging from 40–90% of the total resident population (Figure 25). At a finer scale these areas are confined to the most western edge of SA and areas around Alice Springs. As Figure 26 indicates these data are in an area with low visitor convolution, so are indicative of the resident population. Other studies have revealed that while there is a rural exodus in outback regions, the Aboriginal proportion in the outback is increasing due to higher birth rates (e.g. Herr & Greiner 2004, ABS 2003).
Desert Knowledge CRC 65People, communit ies and economies of the Lake Eyre Basin
Ch 2: Regional prof i le of the Lake Eyre Basin catchments pp. 41–88
Figure 25: Indigenous proportion of the population based on usual residents data at Statistical Local Area level
Figure 26: Indigenous proportion of the population based on enumerated persons at CD level
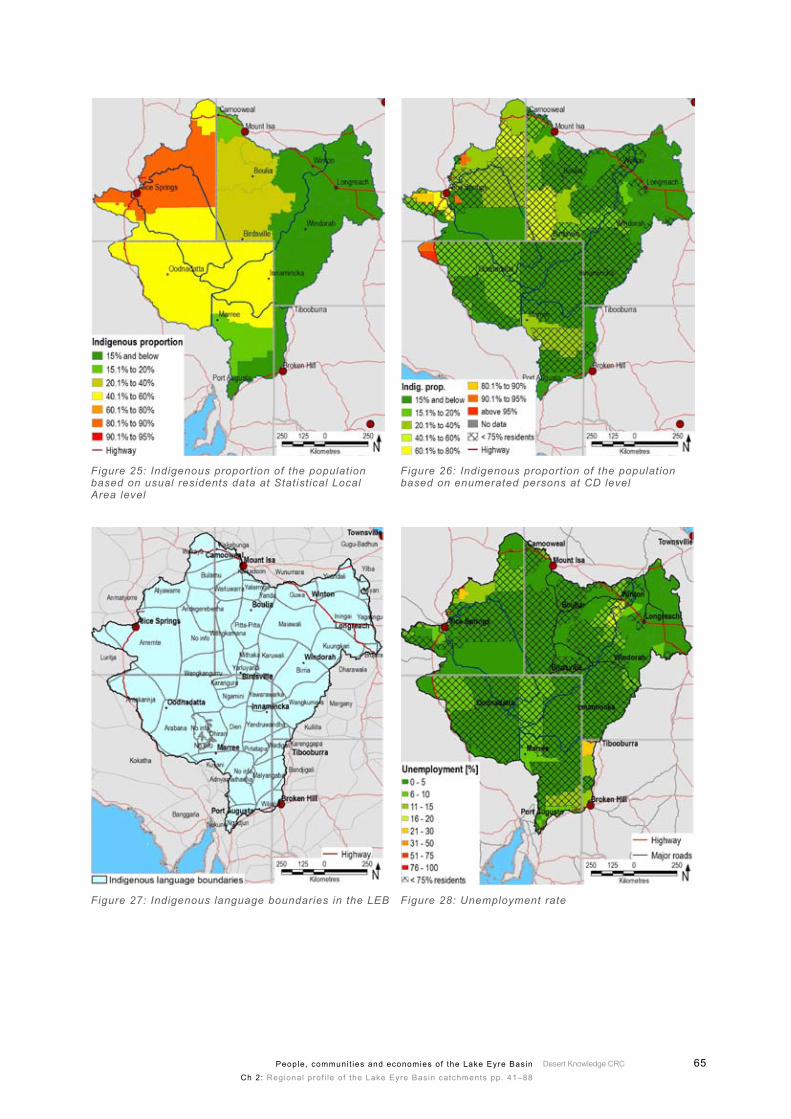
Figure 27: Indigenous language boundaries in the LEB Figure 28: Unemployment rate
Desert Knowledge CRC66 People, communit ies and economies of the Lake Eyre Basin
Ch 2: Regional prof i le of the Lake Eyre Basin catchments pp. 41–88
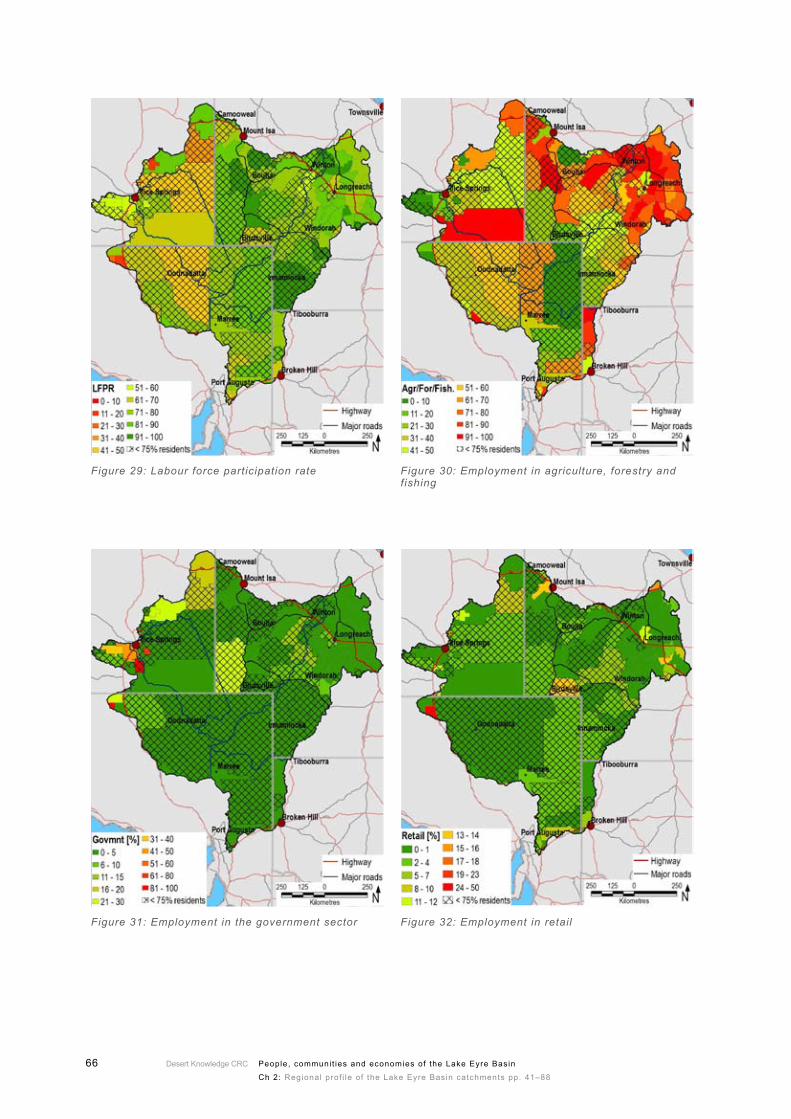
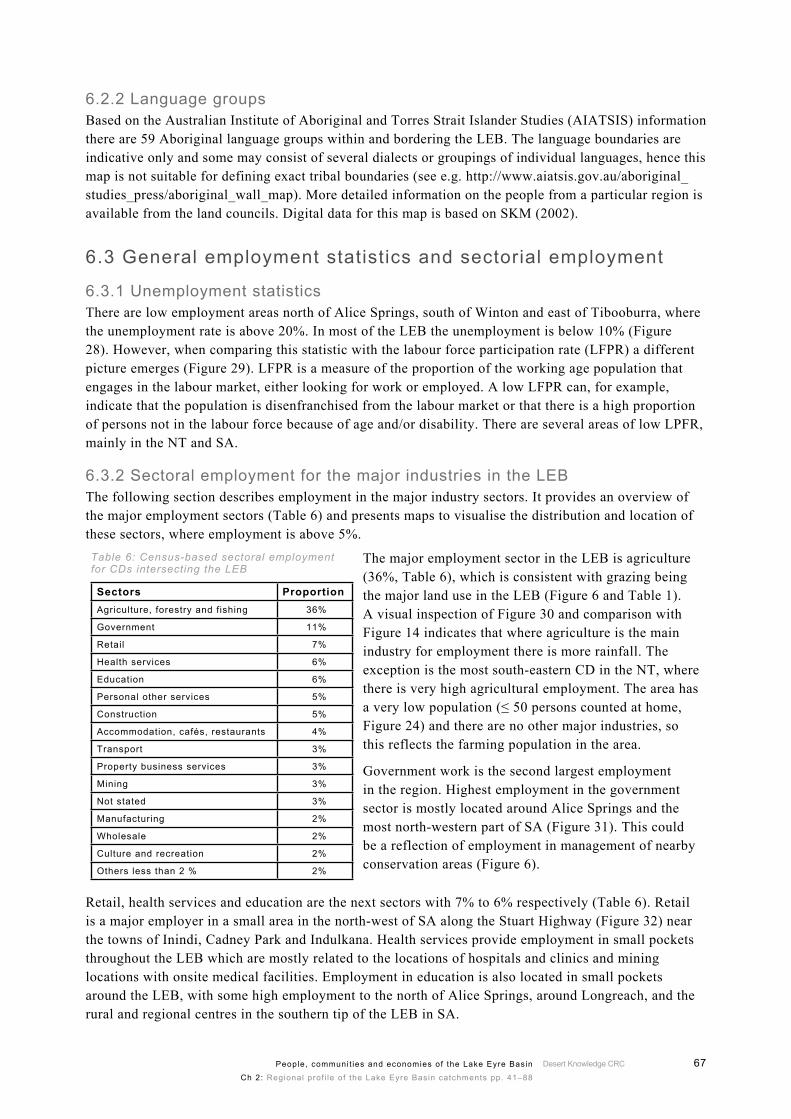
Figure 29: Labour force participation rate Figure 30: Employment in agriculture, forestry and fishing
Figure 31: Employment in the government sector Figure 32: Employment in retail
Desert Knowledge CRC 67People, communit ies and economies of the Lake Eyre Basin
Ch 2: Regional prof i le of the Lake Eyre Basin catchments pp. 41–88
6.2.2 Language groupsBased on the Australian Institute of Aboriginal and Torres Strait Islander Studies (AIATSIS) information there are 59 Aboriginal language groups within and bordering the LEB. The language boundaries are indicative only and some may consist of several dialects or groupings of individual languages, hence this map is not suitable for defining exact tribal boundaries (see e.g. http://www.aiatsis.gov.au/aboriginal_studies_press/aboriginal_wall_map). More detailed information on the people from a particular region is available from the land councils. Digital data for this map is based on SKM (2002).
6.3 General employment statistics and sectorial employment
6.3.1 Unemployment statisticsThere are low employment areas north of Alice Springs, south of Winton and east of Tibooburra, where the unemployment rate is above 20%. In most of the LEB the unemployment is below 10% (Figure 28). However, when comparing this statistic with the labour force participation rate (LFPR) a different picture emerges (Figure 29). LFPR is a measure of the proportion of the working age population that engages in the labour market, either looking for work or employed. A low LFPR can, for example, indicate that the population is disenfranchised from the labour market or that there is a high proportion of persons not in the labour force because of age and/or disability. There are several areas of low LPFR, mainly in the NT and SA.
6.3.2 Sectoral employment for the major industries in the LEBThe following section describes employment in the major industry sectors. It provides an overview of the major employment sectors (Table 6) and presents maps to visualise the distribution and location of these sectors, where employment is above 5%. Table 6: Census-based sectoral employment for CDs intersecting the LEB
Sectors ProportionAgriculture, forestry and fishing 36%
Government 11%
Retail 7%
Health services 6%
Education 6%
Personal other services 5%
Construction 5%
Accommodation, cafés, restaurants 4%
Transport 3%
Property business services 3%
Mining 3%
Not stated 3%
Manufacturing 2%
Wholesale 2%
Culture and recreation 2%
Others less than 2 % 2%
The major employment sector in the LEB is agriculture (36%, Table 6), which is consistent with grazing being the major land use in the LEB (Figure 6 and Table 1). A visual inspection of Figure 30 and comparison with Figure 14 indicates that where agriculture is the main industry for employment there is more rainfall. The exception is the most south-eastern CD in the NT, where there is very high agricultural employment. The area has a very low population (≤ 50 persons counted at home, Figure 24) and there are no other major industries, so this reflects the farming population in the area.
Government work is the second largest employment in the region. Highest employment in the government sector is mostly located around Alice Springs and the most north-western part of SA (Figure 31). This could be a reflection of employment in management of nearby conservation areas (Figure 6).
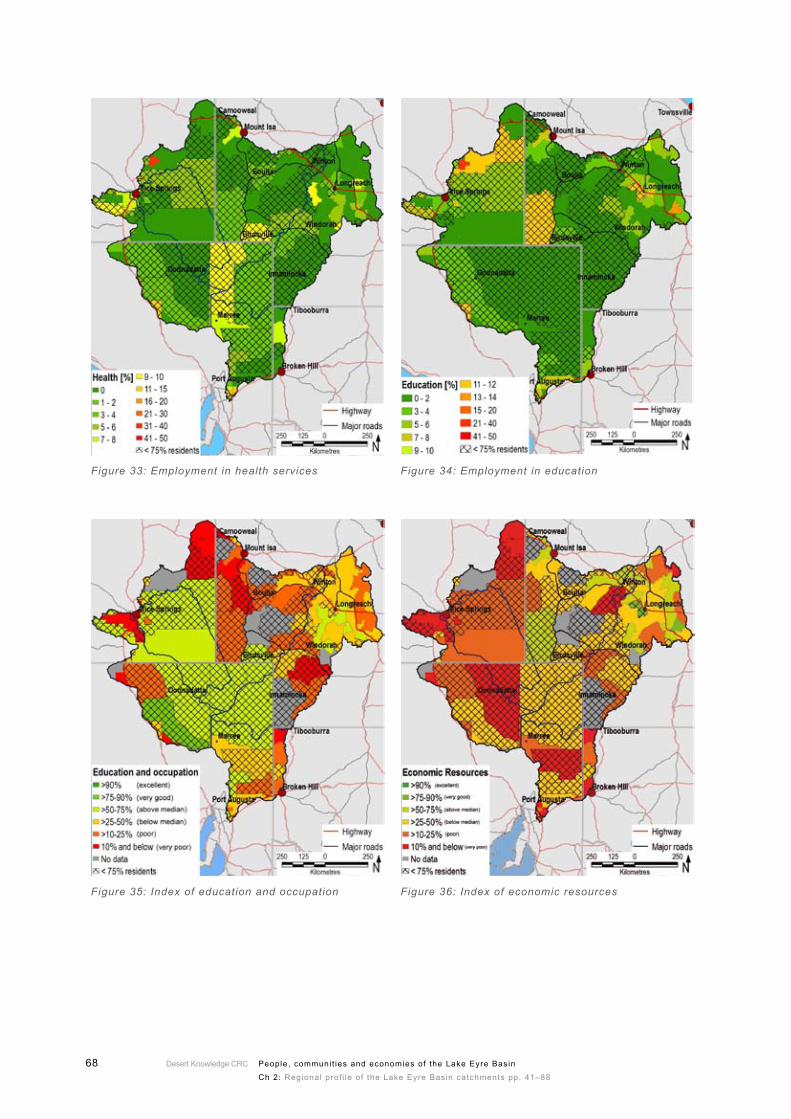
Retail, health services and education are the next sectors with 7% to 6% respectively (Table 6). Retail is a major employer in a small area in the north-west of SA along the Stuart Highway (Figure 32) near the towns of Inindi, Cadney Park and Indulkana. Health services provide employment in small pockets throughout the LEB which are mostly related to the locations of hospitals and clinics and mining locations with onsite medical facilities. Employment in education is also located in small pockets around the LEB, with some high employment to the north of Alice Springs, around Longreach, and the rural and regional centres in the southern tip of the LEB in SA.
Desert Knowledge CRC68 People, communit ies and economies of the Lake Eyre Basin
Ch 2: Regional prof i le of the Lake Eyre Basin catchments pp. 41–88
Figure 33: Employment in health services Figure 34: Employment in education
Figure 35: Index of education and occupation Figure 36: Index of economic resources
Desert Knowledge CRC 69People, communit ies and economies of the Lake Eyre Basin
Ch 2: Regional prof i le of the Lake Eyre Basin catchments pp. 41–88
6.4 Socio-economic indices for areas – SEIFAThe ABS provides four socio-economic indices describing the wellbeing of the nation (ABS 2001b):
the index of education and occupation the index of economic resourcesthe index of relative socio-economic advantage (termed disadvantage in the following)1
the index of relative socio-economic advantage/disadvantage.
The variables for each indicator are based on a theoretical model of disadvantage, which the ABS developed through literature review (Trewin 2001). Each of the indices consists of the core variables: education, income and occupation and other variables measuring the level of disadvantage in relation to living standard, living conditions and access to services. The indices show disadvantaged areas with a lower value (Trewin 2001) and they are standardised to a mean of 1000 and a standard deviation of 100 for all CDs in Australia. Although they only capture a limited number of the factors contributing to wellbeing, normative measures enable us to compare wellbeing between different areas based on a set norm (e.g. Larson et al. 2006, ABS 2001b).
The following figures present these indices for CD level census 2001 Australia. There are large areas of Australia without CD-level SEIFA information, where a low population made index calculation impractical. As with most ABS census data the SEIFA indices are based on counted populations, so are restricted in their ability to convey the real status of wellbeing. This study suggests that, in general, areas with high visitor numbers will display a better SEIFA index value because it assumes that visitors to outback regions have better financial means and/or other factors included in the wellbeing.
6.4.1 The index of education and occupation This index provides a summary of the educational and occupational status of an area. A low score indicates a concentration of people with low educational attainment (i.e. low number of persons with secondary or better education) and/or high unemployment and/or low unskilled employment. The LEB generally scores low in this index; most areas are below the 75% and approximately half of the area is in the 50% or less quintile. Tourism areas such as Innamincka, the Oodnadatta track, areas in south-west SA and areas around Alice Springs (eastern MacDonnell Ranges) are in a higher bracket (50% or above) indicating the influence of visitors on the index. An exception is the southern corner of the NT, where the number of residents counted at home is below 75%.
6.4.2 The index of economic resourcesThis index provides a summary of the economic resources available to the families of a collection district. The variables included in this index are measures of income, expenditure and wealth (e.g. dwelling size). Economic resources in the LEB are generally below the Australian average (50% and below). Only some areas in Qld have a higher score, with Longreach and surrounds being in the highest quintile (Figure 36).
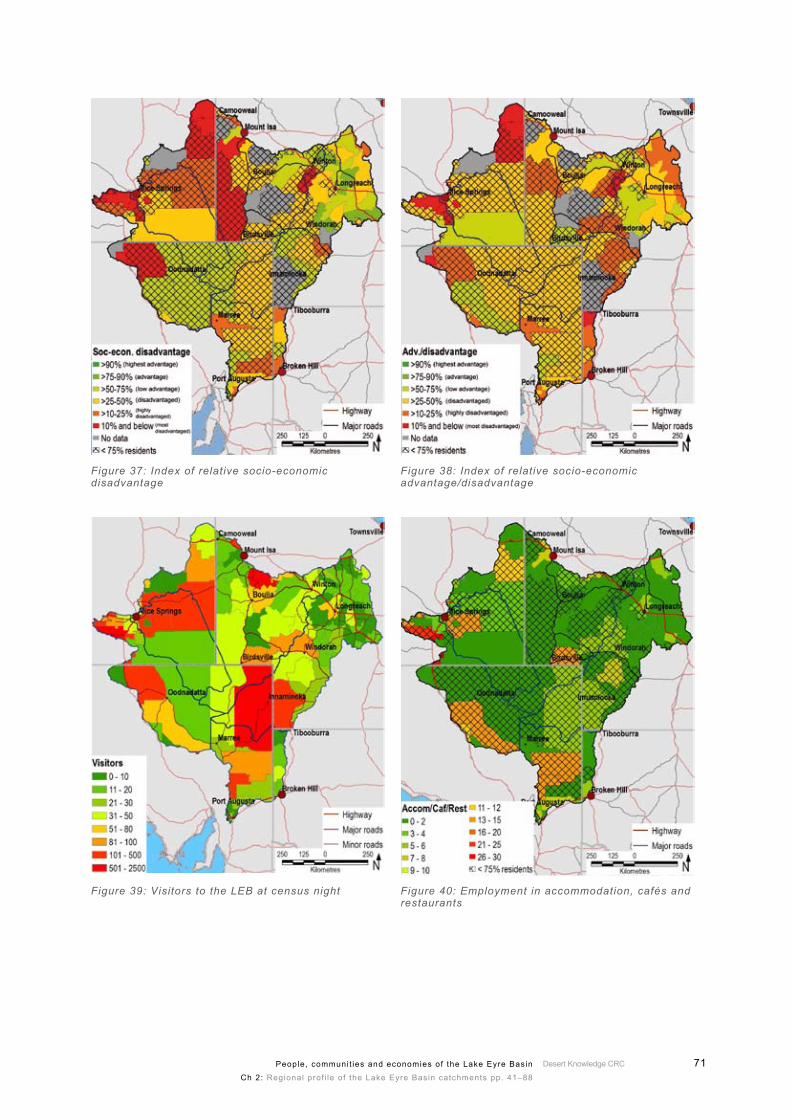
6.4.3 The index of relative socio-economic disadvantageThis index is a measure of low income, low education, high unemployment and employment in unskilled occupations. High score on the disadvantage counter-intuitively indicates areas with few low income families and few people with low training and unskilled work. A high score means a reduced disadvantage rather than an advantage. The north-east areas around Winton and Longreach have a low disadvantage (Figure 37), whereas most other areas score below the second quintile (75% or less) in this measure, indicating more socio-economic disadvantages.
1 We have grappled with how to best explain this index and decided to change its name to be more intuitive. This means we changed the ABS naming to disadvantage, which we then explain more in 6.4.3.
••••
Desert Knowledge CRC70 People, communit ies and economies of the Lake Eyre Basin
Ch 2: Regional prof i le of the Lake Eyre Basin catchments pp. 41–88
6.4.4 The index of relative socio-economic advantage/disadvantageAreas with highly skilled people on bigger incomes and low proportions of persons with low incomes score highly on the index of relative socio-economic advantage/disadvantage. A low score means the area has more people on low incomes and in unskilled positions. The LEB scores generally in the lower quintile (50% and less). There are only few areas above this level (Figure 38). However, it is important to remember the caveats of using counted data, so tourist areas are likely to have a higher score than for residents, assuming that tourists have a more disposable income.
6.5 Methods and data sourcesSocio-economic data comes from the ABS standard package CDATA 2001 Release 2 (see http://www.abs.gov.au for more information). Local government areas and ABS data collation units are the product of the ASGC 2001 (Trewin 2003, ABS 2001c). The Catchment Committee boundaries are approximately aligned and based on the Lake Eyre Basin Coordinating Group (Lake Eyre Basin Coordinating Group undated). Other topographical data is from the AUSLIG TOPO 2.5M (1:2.5 million) data and CSIRO derived spatial information.
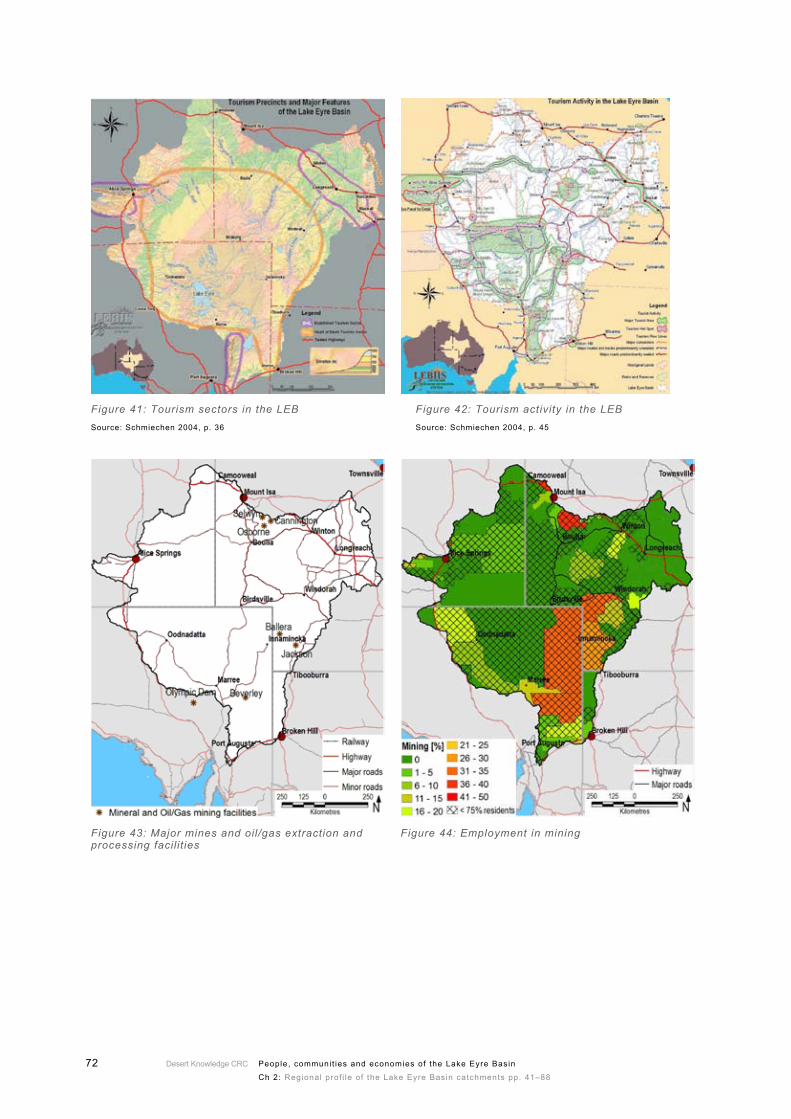
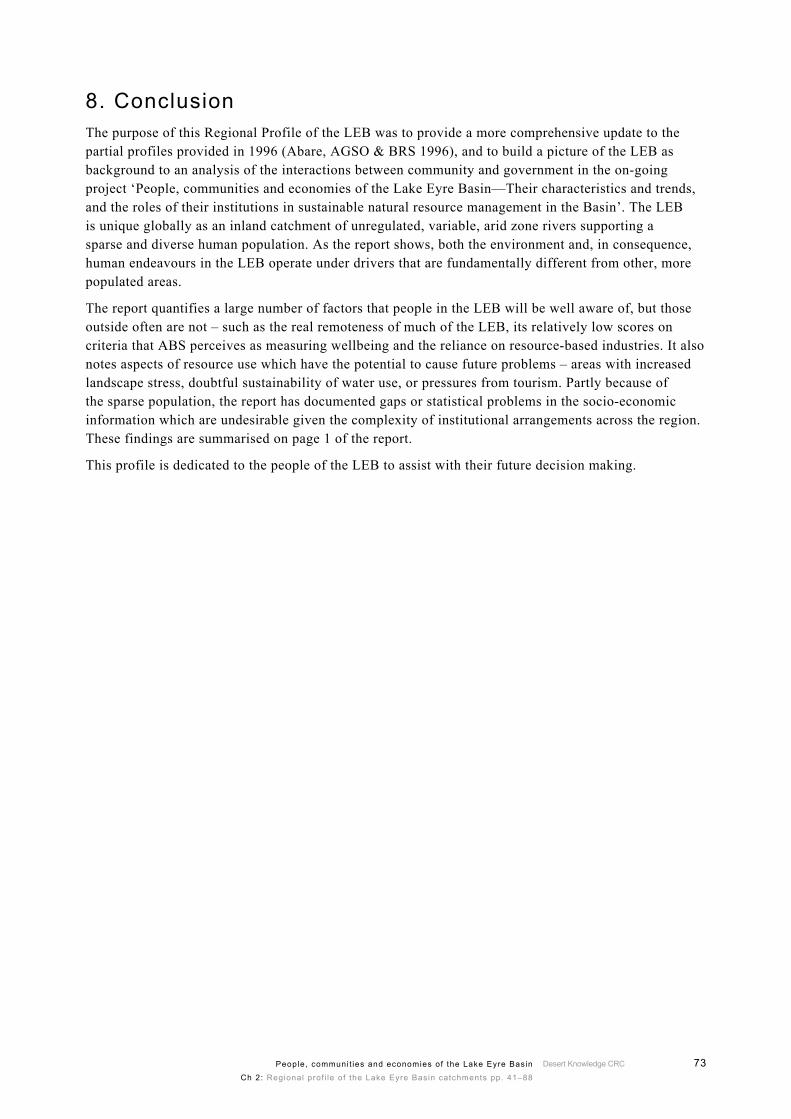
7. Tourism and miningBesides grazing, tourism and mining are the other two important natural resource based industries in the LEB. While mining and agriculture rely on the extraction of natural resources, tourism uses resources directly through hunting, fishing (e.g. Bauer & Herr 2004), fossicking, amenity, services and infrastructure (e.g. roads, tours). The vast expanses of the LEB provide a tourist experience based on natural and cultural heritage features. Commercial interest is growing since visitor numbers are increasing. Visitor estimates for 2001 are well over two million people for the key tourism areas within and adjacent to the LEB (Schmiechen 2004). This classifies tourism as a major industry with the potential to significantly contribute to the economic viability and livelihoods of the LEB. Unfortunately there is no tourism-specific census data that would allow direct tourism assessment. Instead, visitor numbers and employment in accommodation, cafés and restaurants can serve as indicators for areas where tourism is important. Transport, retail, trade, cultural activities and recreation are other sectors that may incorporate tourism elements, but the tourism contribution to these industries is not quantifiable from the data. Visitors are a good indication of tourism activities (albeit only showing a one-day snapshot) because the census occurred during the peak tourism season. The high visitor numbers (>500 persons) in Figure 39 allows identification of the major tourist centres: Alice Springs with the MacDonnell Ranges, Innamincka, Oodnadatta and Flinders ranges. This is supported through the heritage tourism report (Schmiechen 2004) that identified these areas as major tourist sectors (Figure 41) and tourism hotspots (Figure 42). Further details for Figure 42 are given in Appendix E.
Employment in accommodation, cafés and restaurants (Figure 40) further highlights the major tourism areas around Alice Springs, along the Oodnadatta track, Birdsville and the Flinders ranges. A visual comparison with Figure 42 identifies these as tourism hotspots along the travelling routes.
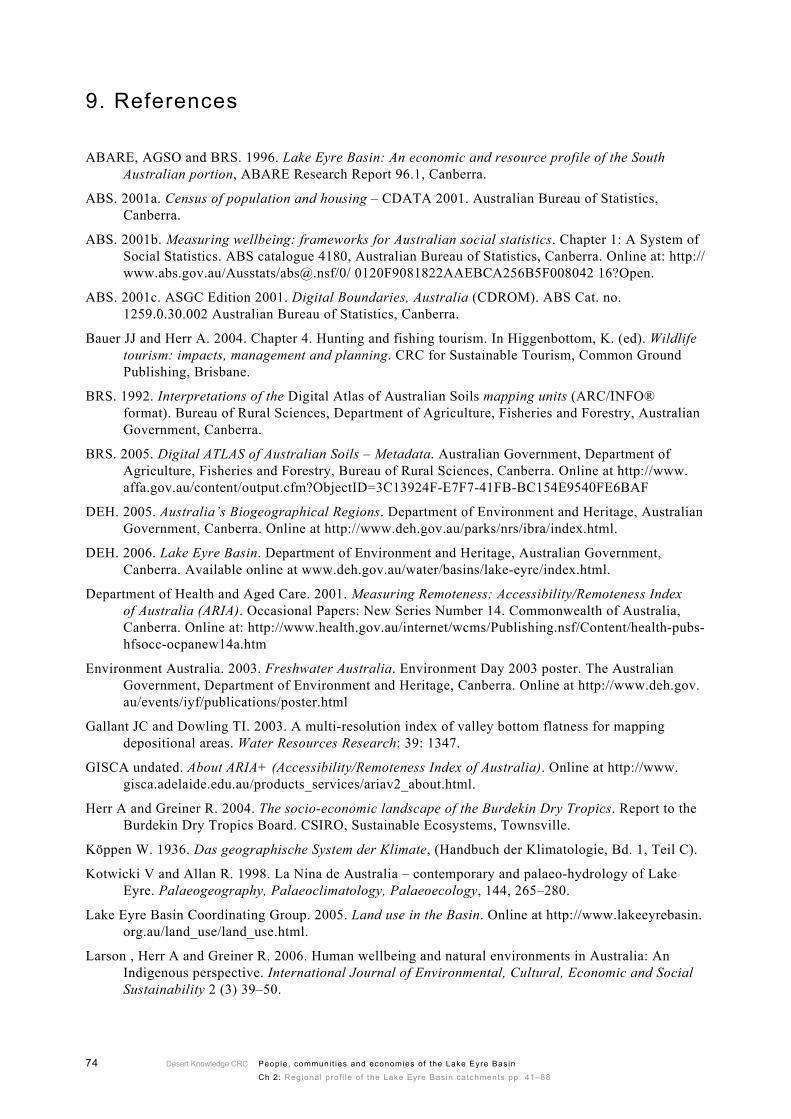
Mining is another, albeit more localised, potentially important contributor to the LEB economy. Increasing commodity prices over the last years have sparked exploration efforts and new mine developments. However, this increase is not captured in the 2001 census analysis. The LEB has important gold, copper, zinc, and uranium deposits and contains Australia’s only onshore oil/gas extraction facility. The spatial arrangement of employment in mining (Figure 44) reflects the location of the major mines in the LEB. However, mines often provide fly-in/fly-out services to their employees who may live in larger centres. This also means that flow-on effects from mining wages are mostly distributed outside the LEB. The census data includes miners living outside the LEB.
Desert Knowledge CRC 71People, communit ies and economies of the Lake Eyre Basin
Ch 2: Regional prof i le of the Lake Eyre Basin catchments pp. 41–88
Figure 37: Index of relative socio-economic disadvantage
Figure 38: Index of relative socio-economic advantage/disadvantage
Figure 39: Visitors to the LEB at census night Figure 40: Employment in accommodation, cafés and restaurants
Desert Knowledge CRC72 People, communit ies and economies of the Lake Eyre Basin
Ch 2: Regional prof i le of the Lake Eyre Basin catchments pp. 41–88
Figure 41: Tourism sectors in the LEBSource: Schmiechen 2004, p. 36
Figure 42: Tourism activity in the LEB Source: Schmiechen 2004, p. 45
Figure 43: Major mines and oil/gas extraction and processing facilit ies
Figure 44: Employment in mining
Desert Knowledge CRC 73People, communit ies and economies of the Lake Eyre Basin
Ch 2: Regional prof i le of the Lake Eyre Basin catchments pp. 41–88
8. ConclusionThe purpose of this Regional Profile of the LEB was to provide a more comprehensive update to the partial profiles provided in 1996 (Abare, AGSO & BRS 1996), and to build a picture of the LEB as background to an analysis of the interactions between community and government in the on-going project ‘People, communities and economies of the Lake Eyre Basin—Their characteristics and trends, and the roles of their institutions in sustainable natural resource management in the Basin’. The LEB is unique globally as an inland catchment of unregulated, variable, arid zone rivers supporting a sparse and diverse human population. As the report shows, both the environment and, in consequence, human endeavours in the LEB operate under drivers that are fundamentally different from other, more populated areas.
The report quantifies a large number of factors that people in the LEB will be well aware of, but those outside often are not – such as the real remoteness of much of the LEB, its relatively low scores on criteria that ABS perceives as measuring wellbeing and the reliance on resource-based industries. It also notes aspects of resource use which have the potential to cause future problems – areas with increased landscape stress, doubtful sustainability of water use, or pressures from tourism. Partly because of the sparse population, the report has documented gaps or statistical problems in the socio-economic information which are undesirable given the complexity of institutional arrangements across the region. These findings are summarised on page 1 of the report.
This profile is dedicated to the people of the LEB to assist with their future decision making.
Desert Knowledge CRC74 People, communit ies and economies of the Lake Eyre Basin
Ch 2: Regional prof i le of the Lake Eyre Basin catchments pp. 41–88
9. References
ABARE, AGSO and BRS. 1996. Lake Eyre Basin: An economic and resource profile of the South Australian portion, ABARE Research Report 96.1, Canberra.
ABS. 2001a. Census of population and housing – CDATA 2001. Australian Bureau of Statistics, Canberra.
ABS. 2001b. Measuring wellbeing: frameworks for Australian social statistics. Chapter 1: A System of Social Statistics. ABS catalogue 4180, Australian Bureau of Statistics, Canberra. Online at: http://www.abs.gov.au/Ausstats/[email protected]/0/ 0120F9081822AAEBCA256B5F008042 16?Open.
ABS. 2001c. ASGC Edition 2001. Digital Boundaries, Australia (CDROM). ABS Cat. no. 1259.0.30.002 Australian Bureau of Statistics, Canberra.
Bauer JJ and Herr A. 2004. Chapter 4. Hunting and fishing tourism. In Higgenbottom, K. (ed). Wildlife tourism: impacts, management and planning. CRC for Sustainable Tourism, Common Ground Publishing, Brisbane.
BRS. 1992. Interpretations of the Digital Atlas of Australian Soils mapping units (ARC/INFO® format). Bureau of Rural Sciences, Department of Agriculture, Fisheries and Forestry, Australian Government, Canberra.
BRS. 2005. Digital ATLAS of Australian Soils – Metadata. Australian Government, Department of Agriculture, Fisheries and Forestry, Bureau of Rural Sciences, Canberra. Online at http://www.affa.gov.au/content/output.cfm?ObjectID=3C13924F-E7F7-41FB-BC154E9540FE6BAF
DEH. 2005. Australia’s Biogeographical Regions. Department of Environment and Heritage, Australian Government, Canberra. Online at http://www.deh.gov.au/parks/nrs/ibra/index.html.
DEH. 2006. Lake Eyre Basin. Department of Environment and Heritage, Australian Government, Canberra. Available online at www.deh.gov.au/water/basins/lake-eyre/index.html.
Department of Health and Aged Care. 2001. Measuring Remoteness: Accessibility/Remoteness Index of Australia (ARIA). Occasional Papers: New Series Number 14. Commonwealth of Australia, Canberra. Online at: http://www.health.gov.au/internet/wcms/Publishing.nsf/Content/health-pubs-hfsocc-ocpanew14a.htm
Environment Australia. 2003. Freshwater Australia. Environment Day 2003 poster. The Australian Government, Department of Environment and Heritage, Canberra. Online at http://www.deh.gov.au/events/iyf/publications/poster.html
Gallant JC and Dowling TI. 2003. A multi-resolution index of valley bottom flatness for mapping depositional areas. Water Resources Research: 39: 1347.
GISCA undated. About ARIA+ (Accessibility/Remoteness Index of Australia). Online at http://www.gisca.adelaide.edu.au/products_services/ariav2_about.html.
Herr A and Greiner R. 2004. The socio-economic landscape of the Burdekin Dry Tropics. Report to the Burdekin Dry Tropics Board. CSIRO, Sustainable Ecosystems, Townsville.
Köppen W. 1936. Das geographische System der Klimate, (Handbuch der Klimatologie, Bd. 1, Teil C).
Kotwicki V and Allan R. 1998. La Nina de Australia – contemporary and palaeo-hydrology of Lake Eyre. Palaeogeography, Palaeoclimatology, Palaeoecology, 144, 265–280.
Lake Eyre Basin Coordinating Group. 2005. Land use in the Basin. Online at http://www.lakeeyrebasin.org.au/land_use/land_use.html.
Larson , Herr A and Greiner R. 2006. Human wellbeing and natural environments in Australia: An Indigenous perspective. International Journal of Environmental, Cultural, Economic and Social Sustainability 2 (3) 39–50.
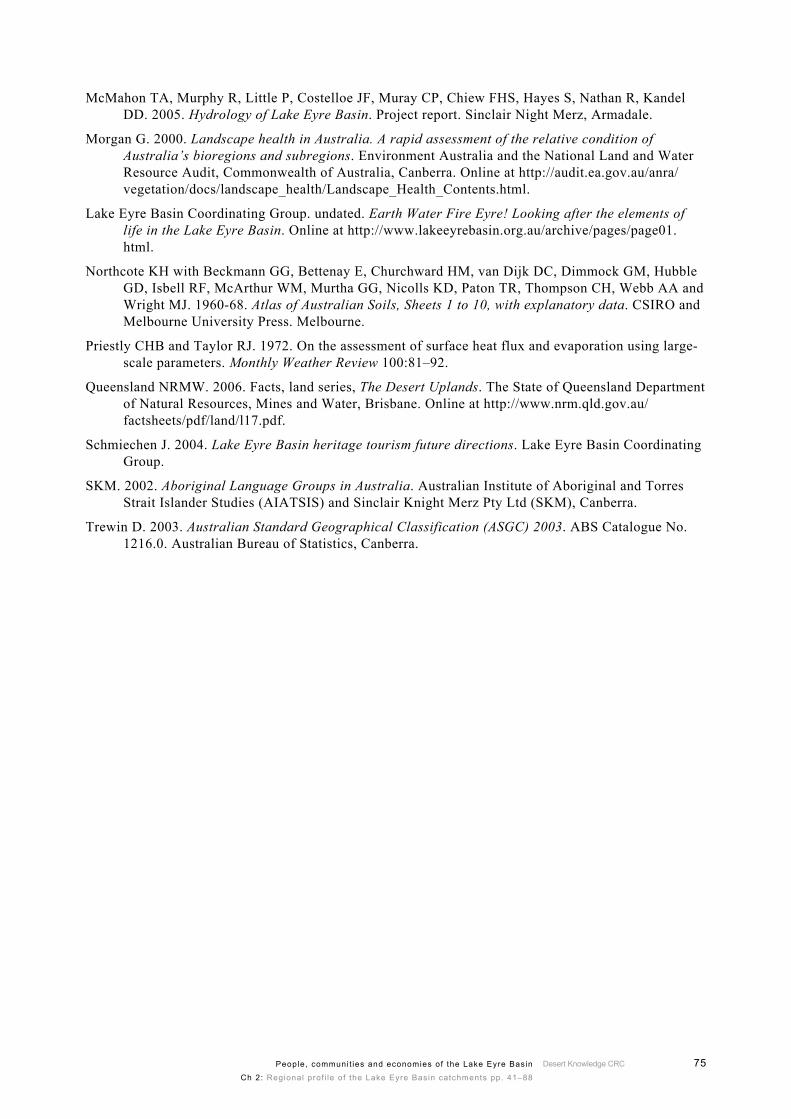
Desert Knowledge CRC 75People, communit ies and economies of the Lake Eyre Basin
Ch 2: Regional prof i le of the Lake Eyre Basin catchments pp. 41–88
McMahon TA, Murphy R, Little P, Costelloe JF, Muray CP, Chiew FHS, Hayes S, Nathan R, Kandel DD. 2005. Hydrology of Lake Eyre Basin. Project report. Sinclair Night Merz, Armadale.
Morgan G. 2000. Landscape health in Australia. A rapid assessment of the relative condition of Australia’s bioregions and subregions. Environment Australia and the National Land and Water Resource Audit, Commonwealth of Australia, Canberra. Online at http://audit.ea.gov.au/anra/vegetation/docs/landscape_health/Landscape_Health_Contents.html.
Lake Eyre Basin Coordinating Group. undated. Earth Water Fire Eyre! Looking after the elements of life in the Lake Eyre Basin. Online at http://www.lakeeyrebasin.org.au/archive/pages/page01.html.
Northcote KH with Beckmann GG, Bettenay E, Churchward HM, van Dijk DC, Dimmock GM, Hubble GD, Isbell RF, McArthur WM, Murtha GG, Nicolls KD, Paton TR, Thompson CH, Webb AA and Wright MJ. 1960-68. Atlas of Australian Soils, Sheets 1 to 10, with explanatory data. CSIRO and Melbourne University Press. Melbourne.
Priestly CHB and Taylor RJ. 1972. On the assessment of surface heat flux and evaporation using large-scale parameters. Monthly Weather Review 100:81–92.
Queensland NRMW. 2006. Facts, land series, The Desert Uplands. The State of Queensland Department of Natural Resources, Mines and Water, Brisbane. Online at http://www.nrm.qld.gov.au/factsheets/pdf/land/l17.pdf.
Schmiechen J. 2004. Lake Eyre Basin heritage tourism future directions. Lake Eyre Basin Coordinating Group.
SKM. 2002. Aboriginal Language Groups in Australia. Australian Institute of Aboriginal and Torres Strait Islander Studies (AIATSIS) and Sinclair Knight Merz Pty Ltd (SKM), Canberra.
Trewin D. 2003. Australian Standard Geographical Classification (ASGC) 2003. ABS Catalogue No. 1216.0. Australian Bureau of Statistics, Canberra.
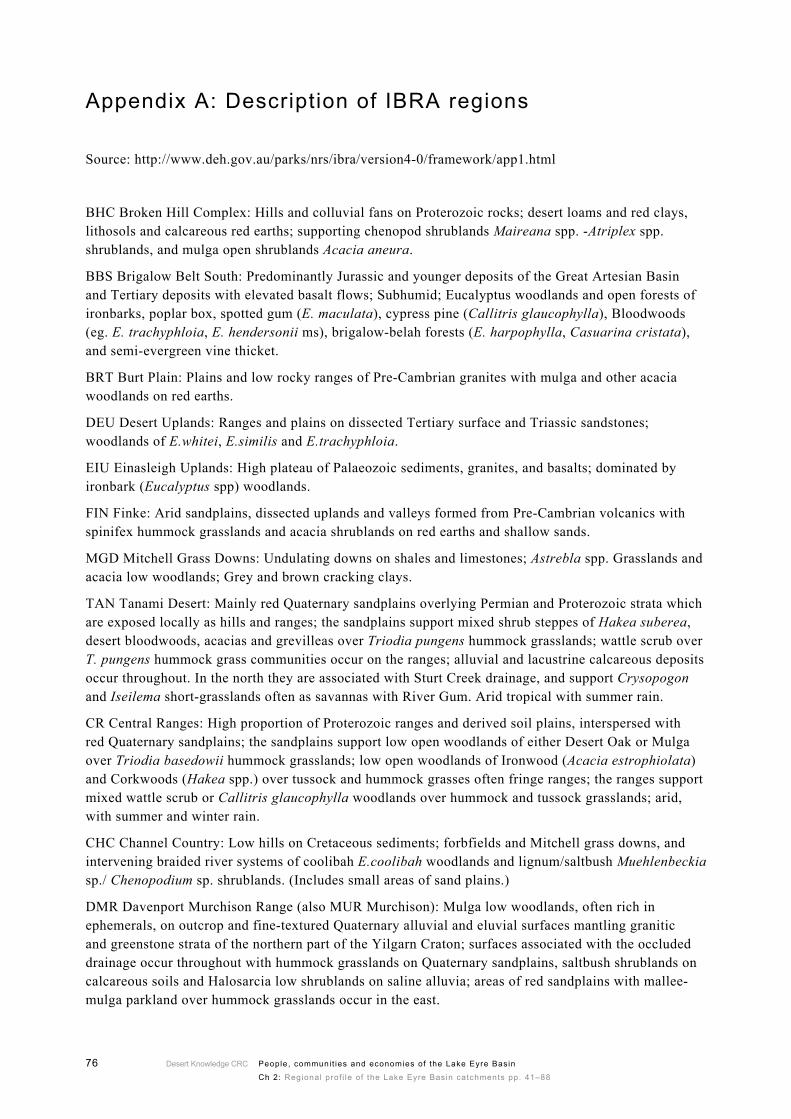
Desert Knowledge CRC76 People, communit ies and economies of the Lake Eyre Basin
Ch 2: Regional prof i le of the Lake Eyre Basin catchments pp. 41–88
Appendix A: Description of IBRA regions
Source: http://www.deh.gov.au/parks/nrs/ibra/version4-0/framework/app1.html
BHC Broken Hill Complex: Hills and colluvial fans on Proterozoic rocks; desert loams and red clays, lithosols and calcareous red earths; supporting chenopod shrublands Maireana spp. -Atriplex spp. shrublands, and mulga open shrublands Acacia aneura.
BBS Brigalow Belt South: Predominantly Jurassic and younger deposits of the Great Artesian Basin and Tertiary deposits with elevated basalt flows; Subhumid; Eucalyptus woodlands and open forests of ironbarks, poplar box, spotted gum (E. maculata), cypress pine (Callitris glaucophylla), Bloodwoods (eg. E. trachyphloia, E. hendersonii ms), brigalow-belah forests (E. harpophylla, Casuarina cristata), and semi-evergreen vine thicket.
BRT Burt Plain: Plains and low rocky ranges of Pre-Cambrian granites with mulga and other acacia woodlands on red earths.
DEU Desert Uplands: Ranges and plains on dissected Tertiary surface and Triassic sandstones; woodlands of E.whitei, E.similis and E.trachyphloia.
EIU Einasleigh Uplands: High plateau of Palaeozoic sediments, granites, and basalts; dominated by ironbark (Eucalyptus spp) woodlands.
FIN Finke: Arid sandplains, dissected uplands and valleys formed from Pre-Cambrian volcanics with spinifex hummock grasslands and acacia shrublands on red earths and shallow sands.
MGD Mitchell Grass Downs: Undulating downs on shales and limestones; Astrebla spp. Grasslands and acacia low woodlands; Grey and brown cracking clays.
TAN Tanami Desert: Mainly red Quaternary sandplains overlying Permian and Proterozoic strata which are exposed locally as hills and ranges; the sandplains support mixed shrub steppes of Hakea suberea, desert bloodwoods, acacias and grevilleas over Triodia pungens hummock grasslands; wattle scrub over T. pungens hummock grass communities occur on the ranges; alluvial and lacustrine calcareous deposits occur throughout. In the north they are associated with Sturt Creek drainage, and support Crysopogon and Iseilema short-grasslands often as savannas with River Gum. Arid tropical with summer rain.
CR Central Ranges: High proportion of Proterozoic ranges and derived soil plains, interspersed with red Quaternary sandplains; the sandplains support low open woodlands of either Desert Oak or Mulga over Triodia basedowii hummock grasslands; low open woodlands of Ironwood (Acacia estrophiolata) and Corkwoods (Hakea spp.) over tussock and hummock grasses often fringe ranges; the ranges support mixed wattle scrub or Callitris glaucophylla woodlands over hummock and tussock grasslands; arid, with summer and winter rain.
CHC Channel Country: Low hills on Cretaceous sediments; forbfields and Mitchell grass downs, and intervening braided river systems of coolibah E.coolibah woodlands and lignum/saltbush Muehlenbeckia sp./ Chenopodium sp. shrublands. (Includes small areas of sand plains.)
DMR Davenport Murchison Range (also MUR Murchison): Mulga low woodlands, often rich in ephemerals, on outcrop and fine-textured Quaternary alluvial and eluvial surfaces mantling granitic and greenstone strata of the northern part of the Yilgarn Craton; surfaces associated with the occluded drainage occur throughout with hummock grasslands on Quaternary sandplains, saltbush shrublands on calcareous soils and Halosarcia low shrublands on saline alluvia; areas of red sandplains with mallee-mulga parkland over hummock grasslands occur in the east.
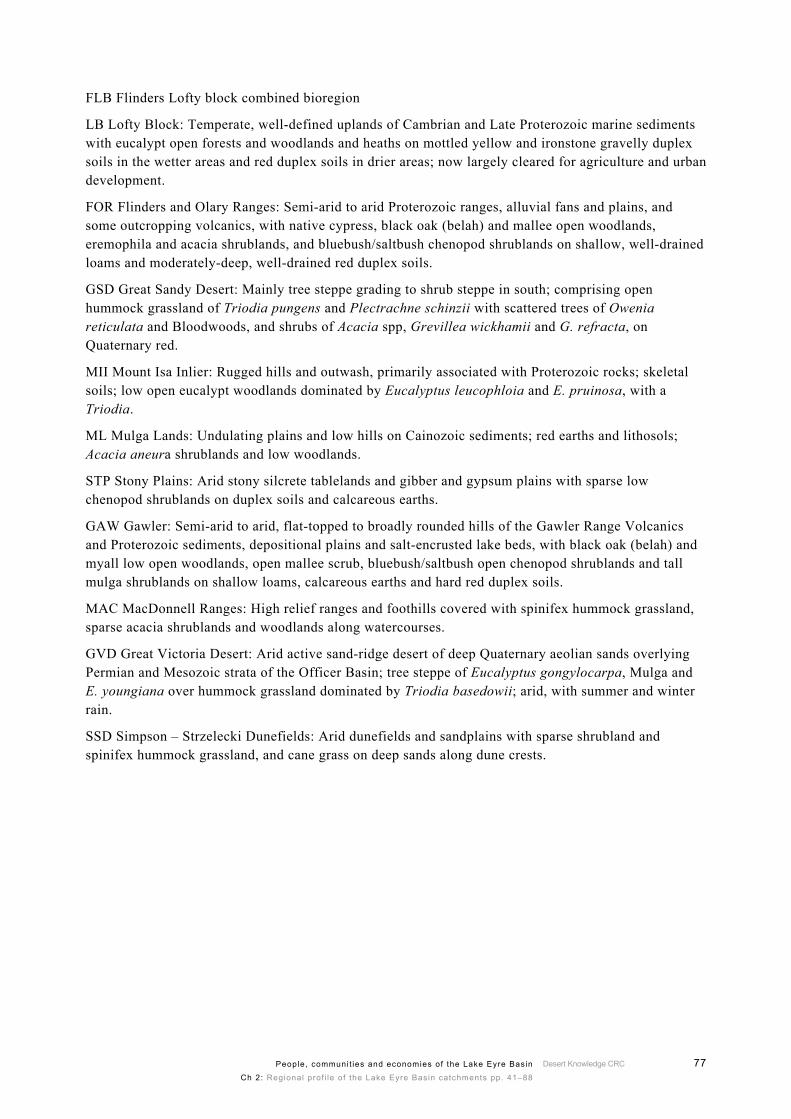
Desert Knowledge CRC 77People, communit ies and economies of the Lake Eyre Basin
Ch 2: Regional prof i le of the Lake Eyre Basin catchments pp. 41–88
FLB Flinders Lofty block combined bioregion
LB Lofty Block: Temperate, well-defined uplands of Cambrian and Late Proterozoic marine sediments with eucalypt open forests and woodlands and heaths on mottled yellow and ironstone gravelly duplex soils in the wetter areas and red duplex soils in drier areas; now largely cleared for agriculture and urban development.
FOR Flinders and Olary Ranges: Semi-arid to arid Proterozoic ranges, alluvial fans and plains, and some outcropping volcanics, with native cypress, black oak (belah) and mallee open woodlands, eremophila and acacia shrublands, and bluebush/saltbush chenopod shrublands on shallow, well-drained loams and moderately-deep, well-drained red duplex soils.
GSD Great Sandy Desert: Mainly tree steppe grading to shrub steppe in south; comprising open hummock grassland of Triodia pungens and Plectrachne schinzii with scattered trees of Owenia reticulata and Bloodwoods, and shrubs of Acacia spp, Grevillea wickhamii and G. refracta, on Quaternary red.
MII Mount Isa Inlier: Rugged hills and outwash, primarily associated with Proterozoic rocks; skeletal soils; low open eucalypt woodlands dominated by Eucalyptus leucophloia and E. pruinosa, with a Triodia.
ML Mulga Lands: Undulating plains and low hills on Cainozoic sediments; red earths and lithosols; Acacia aneura shrublands and low woodlands.
STP Stony Plains: Arid stony silcrete tablelands and gibber and gypsum plains with sparse low chenopod shrublands on duplex soils and calcareous earths.
GAW Gawler: Semi-arid to arid, flat-topped to broadly rounded hills of the Gawler Range Volcanics and Proterozoic sediments, depositional plains and salt-encrusted lake beds, with black oak (belah) and myall low open woodlands, open mallee scrub, bluebush/saltbush open chenopod shrublands and tall mulga shrublands on shallow loams, calcareous earths and hard red duplex soils.
MAC MacDonnell Ranges: High relief ranges and foothills covered with spinifex hummock grassland, sparse acacia shrublands and woodlands along watercourses.
GVD Great Victoria Desert: Arid active sand-ridge desert of deep Quaternary aeolian sands overlying Permian and Mesozoic strata of the Officer Basin; tree steppe of Eucalyptus gongylocarpa, Mulga and E. youngiana over hummock grassland dominated by Triodia basedowii; arid, with summer and winter rain.
SSD Simpson – Strzelecki Dunefields: Arid dunefields and sandplains with sparse shrubland and spinifex hummock grassland, and cane grass on deep sands along dune crests.
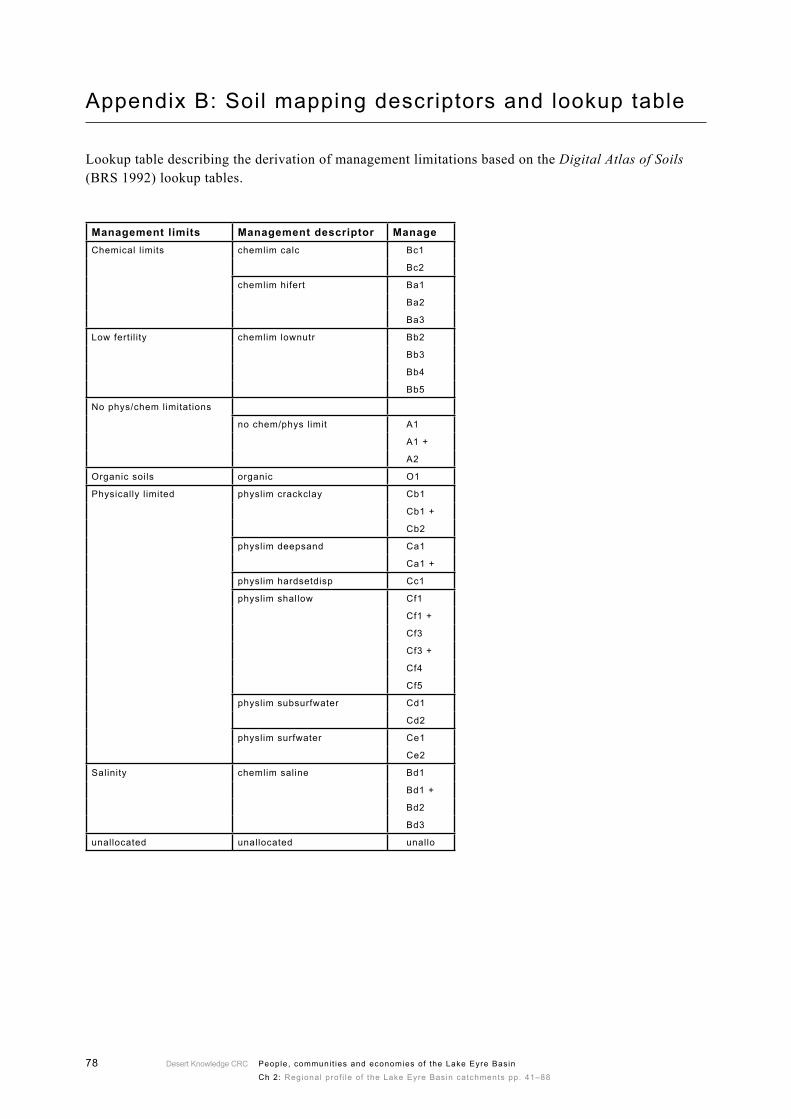
Desert Knowledge CRC78 People, communit ies and economies of the Lake Eyre Basin
Ch 2: Regional prof i le of the Lake Eyre Basin catchments pp. 41–88
Appendix B: Soil mapping descriptors and lookup table
Lookup table describing the derivation of management limitations based on the Digital Atlas of Soils (BRS 1992) lookup tables.
Management limits Management descriptor ManageChemical l imits chemlim calc Bc1
Bc2
chemlim hifert Ba1
Ba2
Ba3
Low fertil ity chemlim lownutr Bb2
Bb3
Bb4
Bb5
No phys/chem limitations
no chem/phys limit A1
A1 +
A2
Organic soils organic O1
Physically limited physlim crackclay Cb1
Cb1 +
Cb2
physlim deepsand Ca1
Ca1 +
physlim hardsetdisp Cc1
physlim shallow Cf1
Cf1 +
Cf3
Cf3 +
Cf4
Cf5
physlim subsurfwater Cd1
Cd2
physlim surfwater Ce1
Ce2
Salinity chemlim saline Bd1
Bd1 +
Bd2
Bd3
unallocated unallocated unallo
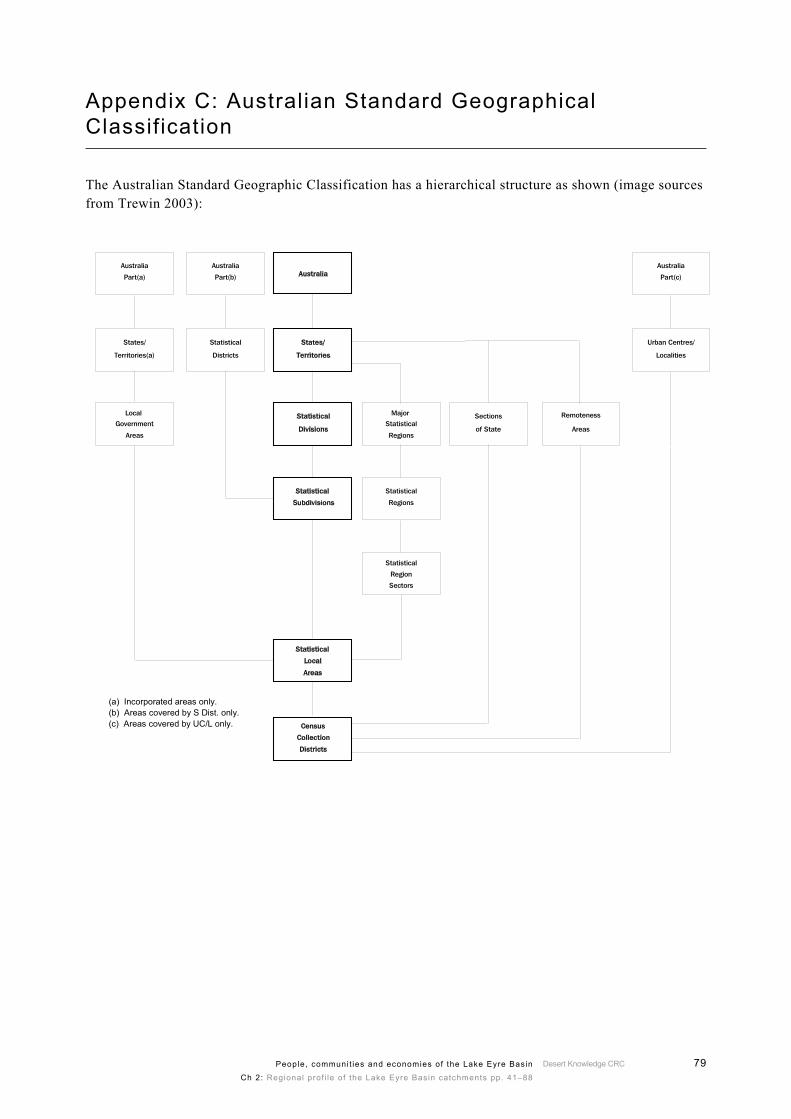
Desert Knowledge CRC 79People, communit ies and economies of the Lake Eyre Basin
Ch 2: Regional prof i le of the Lake Eyre Basin catchments pp. 41–88
Appendix C: Australian Standard Geographical Classification
The Australian Standard Geographic Classification has a hierarchical structure as shown (image sources from Trewin 2003):
Australia
Part(a)
States/
Territories(a)
Local
Government
Areas
Australia
Part(b)
Statistical
Districts
Australia
Part(c)
Urban Centres/
Localities
Major
Statistical
Regions
Statistical
Regions
Statistical
Region
Sectors
Sections
of State
Area g of State y
������������������������������������������������������������������������������������������������
Remoteness
Areas
Australia
States/
Territories
Statistical
Divisions
Statistical
Subdivisions
Statistical
Local
Areas
Census
Collection
Districts
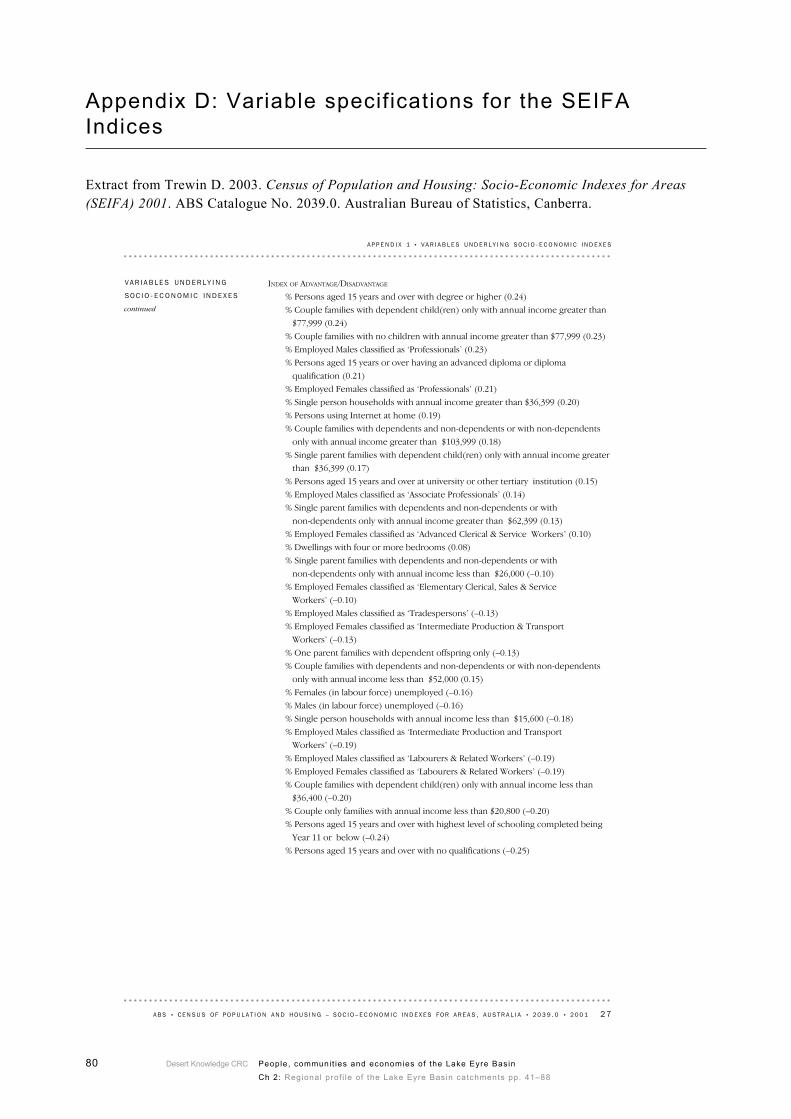
Desert Knowledge CRC80 People, communit ies and economies of the Lake Eyre Basin
Ch 2: Regional prof i le of the Lake Eyre Basin catchments pp. 41–88
Appendix D: Variable specifications for the SEIFA Indices
Extract from Trewin D. 2003. Census of Population and Housing: Socio-Economic Indexes for Areas (SEIFA) 2001. ABS Catalogue No. 2039.0. Australian Bureau of Statistics, Canberra.
INDEX OF ADVANTAGE/DISADVANTAGE
% Persons aged 15 years and over with degree or higher (0.24)
% Couple families with dependent child(ren) only with annual income greater than
$77,999 (0.24)
% Couple families with no children with annual income greater than $77,999 (0.23)
% Employed Males classified as ‘Professionals’ (0.23)
% Persons aged 15 years or over having an advanced diploma or diploma
qualification (0.21)
% Employed Females classified as ‘Professionals’ (0.21)
% Single person households with annual income greater than $36,399 (0.20)
% Persons using Internet at home (0.19)
% Couple families with dependents and non-dependents or with non-dependents
only with annual income greater than $103,999 (0.18)
% Single parent families with dependent child(ren) only with annual income greater
than $36,399 (0.17)
% Persons aged 15 years and over at university or other tertiary institution (0.15)
% Employed Males classified as ‘Associate Professionals’ (0.14)
% Single parent families with dependents and non-dependents or with
non-dependents only with annual income greater than $62,399 (0.13)
% Employed Females classified as ‘Advanced Clerical & Service Workers’ (0.10)
% Dwellings with four or more bedrooms (0.08)
% Single parent families with dependents and non-dependents or with
non-dependents only with annual income less than $26,000 (–0.10)
% Employed Females classified as ‘Elementary Clerical, Sales & Service
Workers’ (–0.10)
% Employed Males classified as ‘Tradespersons’ (–0.13)
% Employed Females classified as ‘Intermediate Production & Transport
Workers’ (–0.13)
% One parent families with dependent offspring only (–0.13)
% Couple families with dependents and non-dependents or with non-dependents
only with annual income less than $52,000 (0.15)
% Females (in labour force) unemployed (–0.16)
% Males (in labour force) unemployed (–0.16)
% Single person households with annual income less than $15,600 (–0.18)
% Employed Males classified as ‘Intermediate Production and Transport
Workers’ (–0.19)
% Employed Males classified as ‘Labourers & Related Workers’ (–0.19)
% Employed Females classified as ‘Labourers & Related Workers’ (–0.19)
% Couple families with dependent child(ren) only with annual income less than
$36,400 (–0.20)
% Couple only families with annual income less than $20,800 (–0.20)
% Persons aged 15 years and over with highest level of schooling completed being
Year 11 or below (–0.24)
% Persons aged 15 years and over with no qualifications (–0.25)
VA R I A B L E S UN D E R L Y I N G
SO C I O - E C O N O M I C IN D E X E S
continued
A B S • CE N S U S OF P O P U L A T I O N A N D HO U S I N G – SO C I O – E C O N O M I C I N D E X E S FO R A R E A S , A U S T R A L I A • 2 0 3 9 . 0 • 2 0 0 1 27
A P P E N D I X 1 • V A R I A B L E S U N D E R L Y I N G SO C I O - E C O N O M I C I N D E X E S
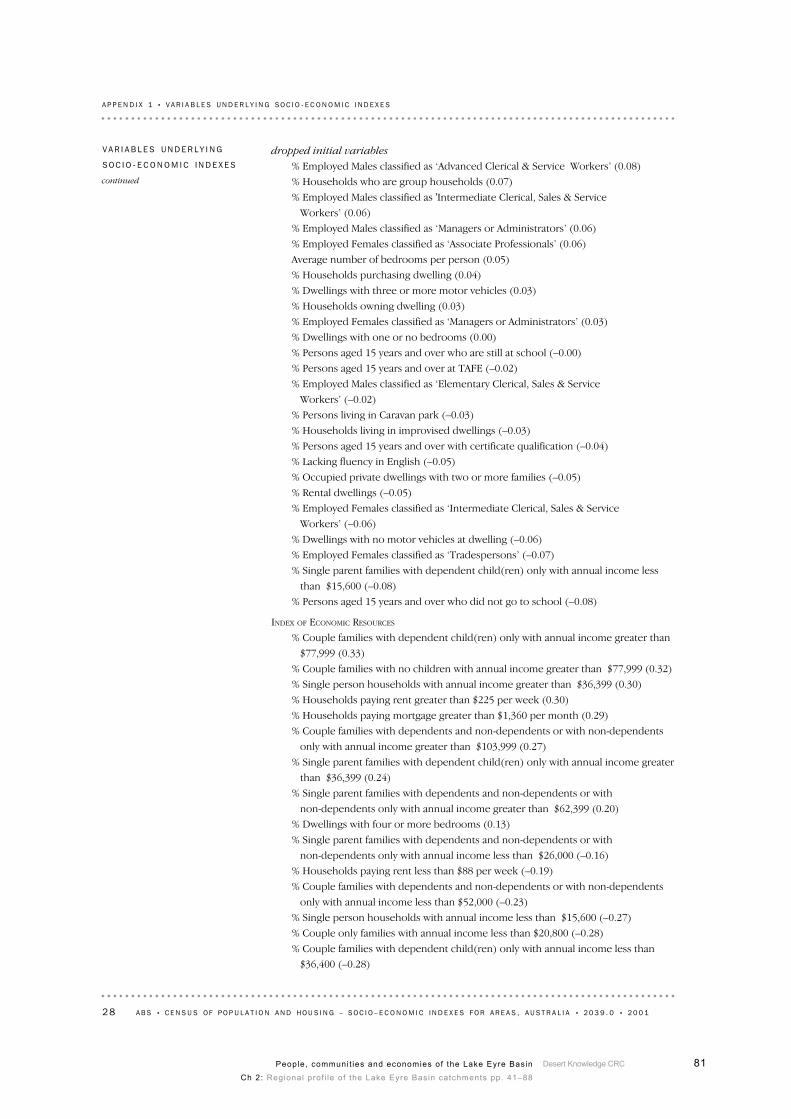
Desert Knowledge CRC 81People, communit ies and economies of the Lake Eyre Basin
Ch 2: Regional prof i le of the Lake Eyre Basin catchments pp. 41–88
dropped initial variables
% Employed Males classified as ‘Advanced Clerical & Service Workers’ (0.08)
% Households who are group households (0.07)
% Employed Males classified as 'Intermediate Clerical, Sales & Service
Workers’ (0.06)
% Employed Males classified as ‘Managers or Administrators’ (0.06)
% Employed Females classified as ‘Associate Professionals’ (0.06)
Average number of bedrooms per person (0.05)
% Households purchasing dwelling (0.04)
% Dwellings with three or more motor vehicles (0.03)
% Households owning dwelling (0.03)
% Employed Females classified as ‘Managers or Administrators’ (0.03)
% Dwellings with one or no bedrooms (0.00)
% Persons aged 15 years and over who are still at school (–0.00)
% Persons aged 15 years and over at TAFE (–0.02)
% Employed Males classified as ‘Elementary Clerical, Sales & Service
Workers’ (–0.02)
% Persons living in Caravan park (–0.03)
% Households living in improvised dwellings (–0.03)
% Persons aged 15 years and over with certificate qualification (–0.04)
% Lacking fluency in English (–0.05)
% Occupied private dwellings with two or more families (–0.05)
% Rental dwellings (–0.05)
% Employed Females classified as ‘Intermediate Clerical, Sales & Service
Workers’ (–0.06)
% Dwellings with no motor vehicles at dwelling (–0.06)
% Employed Females classified as ‘Tradespersons’ (–0.07)
% Single parent families with dependent child(ren) only with annual income less
than $15,600 (–0.08)
% Persons aged 15 years and over who did not go to school (–0.08)
INDEX OF ECONOMIC RESOURCES
% Couple families with dependent child(ren) only with annual income greater than
$77,999 (0.33)
% Couple families with no children with annual income greater than $77,999 (0.32)
% Single person households with annual income greater than $36,399 (0.30)
% Households paying rent greater than $225 per week (0.30)
% Households paying mortgage greater than $1,360 per month (0.29)
% Couple families with dependents and non-dependents or with non-dependents
only with annual income greater than $103,999 (0.27)
% Single parent families with dependent child(ren) only with annual income greater
than $36,399 (0.24)
% Single parent families with dependents and non-dependents or with
non-dependents only with annual income greater than $62,399 (0.20)
% Dwellings with four or more bedrooms (0.13)
% Single parent families with dependents and non-dependents or with
non-dependents only with annual income less than $26,000 (–0.16)
% Households paying rent less than $88 per week (–0.19)
% Couple families with dependents and non-dependents or with non-dependents
only with annual income less than $52,000 (–0.23)
% Single person households with annual income less than $15,600 (–0.27)
% Couple only families with annual income less than $20,800 (–0.28)
% Couple families with dependent child(ren) only with annual income less than
$36,400 (–0.28)
VA R I A B L E S UN D E R L Y I N G
SO C I O - E C O N O M I C IN D E X E S
continued
28 A B S • CE N S U S OF P O P U L A T I O N A N D HO U S I N G – SO C I O – E C O N O M I C I N D E X E S FO R A R E A S , A U S T R A L I A • 2 0 3 9 . 0 • 2 0 0 1
A P P E N D I X 1 • V A R I A B L E S U N D E R L Y I N G SO C I O - E C O N O M I C I N D E X E S
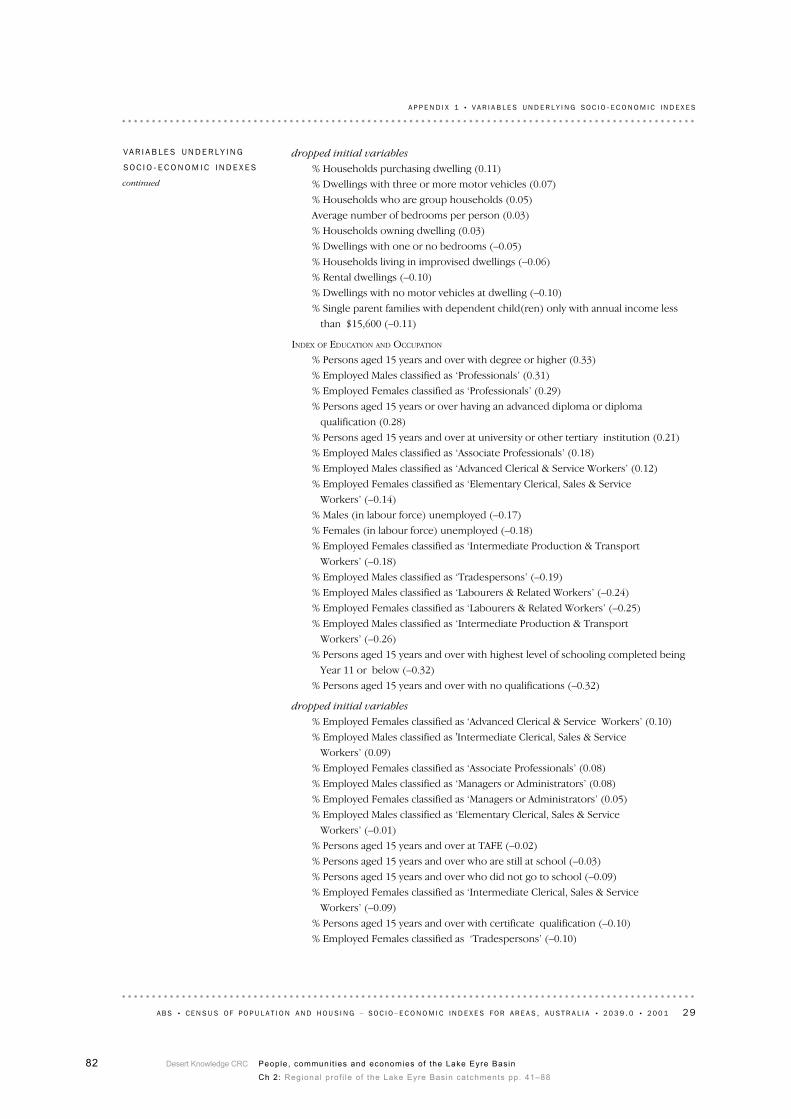
Desert Knowledge CRC82 People, communit ies and economies of the Lake Eyre Basin
Ch 2: Regional prof i le of the Lake Eyre Basin catchments pp. 41–88
dropped initial variables
% Households purchasing dwelling (0.11)
% Dwellings with three or more motor vehicles (0.07)
% Households who are group households (0.05)
Average number of bedrooms per person (0.03)
% Households owning dwelling (0.03)
% Dwellings with one or no bedrooms (–0.05)
% Households living in improvised dwellings (–0.06)
% Rental dwellings (–0.10)
% Dwellings with no motor vehicles at dwelling (–0.10)
% Single parent families with dependent child(ren) only with annual income less
than $15,600 (–0.11)
INDEX OF EDUCATION AND OCCUPATION
% Persons aged 15 years and over with degree or higher (0.33)
% Employed Males classified as ‘Professionals’ (0.31)
% Employed Females classified as ‘Professionals’ (0.29)
% Persons aged 15 years or over having an advanced diploma or diploma
qualification (0.28)
% Persons aged 15 years and over at university or other tertiary institution (0.21)
% Employed Males classified as ‘Associate Professionals’ (0.18)
% Employed Males classified as ‘Advanced Clerical & Service Workers’ (0.12)
% Employed Females classified as ‘Elementary Clerical, Sales & Service
Workers’ (–0.14)
% Males (in labour force) unemployed (–0.17)
% Females (in labour force) unemployed (–0.18)
% Employed Females classified as ‘Intermediate Production & Transport
Workers’ (–0.18)
% Employed Males classified as ‘Tradespersons’ (–0.19)
% Employed Males classified as ‘Labourers & Related Workers’ (–0.24)
% Employed Females classified as ‘Labourers & Related Workers’ (–0.25)
% Employed Males classified as ‘Intermediate Production & Transport
Workers’ (–0.26)
% Persons aged 15 years and over with highest level of schooling completed being
Year 11 or below (–0.32)
% Persons aged 15 years and over with no qualifications (–0.32)
dropped initial variables
% Employed Females classified as ‘Advanced Clerical & Service Workers’ (0.10)
% Employed Males classified as 'Intermediate Clerical, Sales & Service
Workers’ (0.09)
% Employed Females classified as ‘Associate Professionals’ (0.08)
% Employed Males classified as ‘Managers or Administrators’ (0.08)
% Employed Females classified as ‘Managers or Administrators’ (0.05)
% Employed Males classified as ‘Elementary Clerical, Sales & Service
Workers’ (–0.01)
% Persons aged 15 years and over at TAFE (–0.02)
% Persons aged 15 years and over who are still at school (–0.03)
% Persons aged 15 years and over who did not go to school (–0.09)
% Employed Females classified as ‘Intermediate Clerical, Sales & Service
Workers’ (–0.09)
% Persons aged 15 years and over with certificate qualification (–0.10)
% Employed Females classified as ‘Tradespersons’ (–0.10)
VA R I A B L E S UN D E R L Y I N G
SO C I O - E C O N O M I C IN D E X E S
continued
A B S • CE N S U S OF P O P U L A T I O N A N D HO U S I N G – SO C I O – E C O N O M I C I N D E X E S FO R A R E A S , A U S T R A L I A • 2 0 3 9 . 0 • 2 0 0 1 29
A P P E N D I X 1 • V A R I A B L E S U N D E R L Y I N G SO C I O - E C O N O M I C I N D E X E S
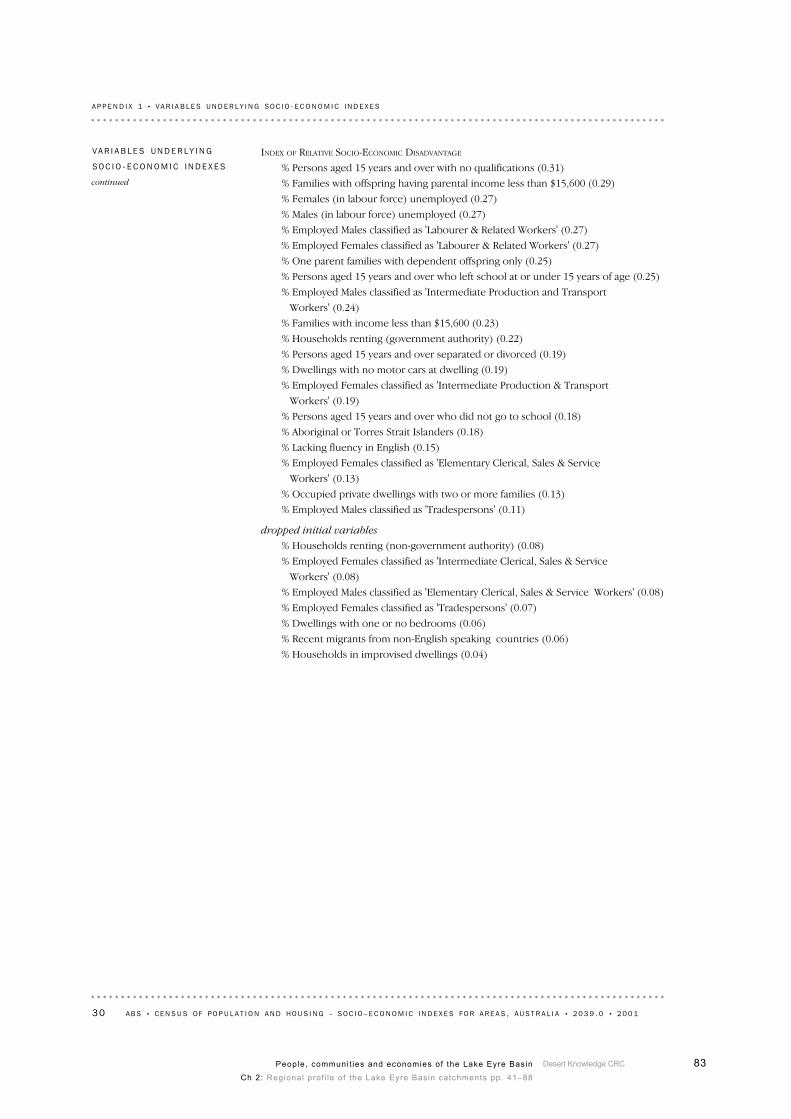
Desert Knowledge CRC 83People, communit ies and economies of the Lake Eyre Basin
Ch 2: Regional prof i le of the Lake Eyre Basin catchments pp. 41–88
INDEX OF RELATIVE SOCIO-ECONOMIC DISADVANTAGE
% Persons aged 15 years and over with no qualifications (0.31)
% Families with offspring having parental income less than $15,600 (0.29)
% Females (in labour force) unemployed (0.27)
% Males (in labour force) unemployed (0.27)
% Employed Males classified as 'Labourer & Related Workers' (0.27)
% Employed Females classified as 'Labourer & Related Workers' (0.27)
% One parent families with dependent offspring only (0.25)
% Persons aged 15 years and over who left school at or under 15 years of age (0.25)
% Employed Males classified as 'Intermediate Production and Transport
Workers' (0.24)
% Families with income less than $15,600 (0.23)
% Households renting (government authority) (0.22)
% Persons aged 15 years and over separated or divorced (0.19)
% Dwellings with no motor cars at dwelling (0.19)
% Employed Females classified as 'Intermediate Production & Transport
Workers' (0.19)
% Persons aged 15 years and over who did not go to school (0.18)
% Aboriginal or Torres Strait Islanders (0.18)
% Lacking fluency in English (0.15)
% Employed Females classified as 'Elementary Clerical, Sales & Service
Workers' (0.13)
% Occupied private dwellings with two or more families (0.13)
% Employed Males classified as 'Tradespersons' (0.11)
dropped initial variables
% Households renting (non-government authority) (0.08)
% Employed Females classified as 'Intermediate Clerical, Sales & Service
Workers' (0.08)
% Employed Males classified as 'Elementary Clerical, Sales & Service Workers' (0.08)
% Employed Females classified as 'Tradespersons' (0.07)
% Dwellings with one or no bedrooms (0.06)
% Recent migrants from non-English speaking countries (0.06)
% Households in improvised dwellings (0.04)
VA R I A B L E S UN D E R L Y I N G
SO C I O - E C O N O M I C IN D E X E S
continued
30 A B S • CE N S U S OF P O P U L A T I O N A N D HO U S I N G – SO C I O – E C O N O M I C I N D E X E S FO R A R E A S , A U S T R A L I A • 2 0 3 9 . 0 • 2 0 0 1
A P P E N D I X 1 • V A R I A B L E S U N D E R L Y I N G SO C I O - E C O N O M I C I N D E X E S
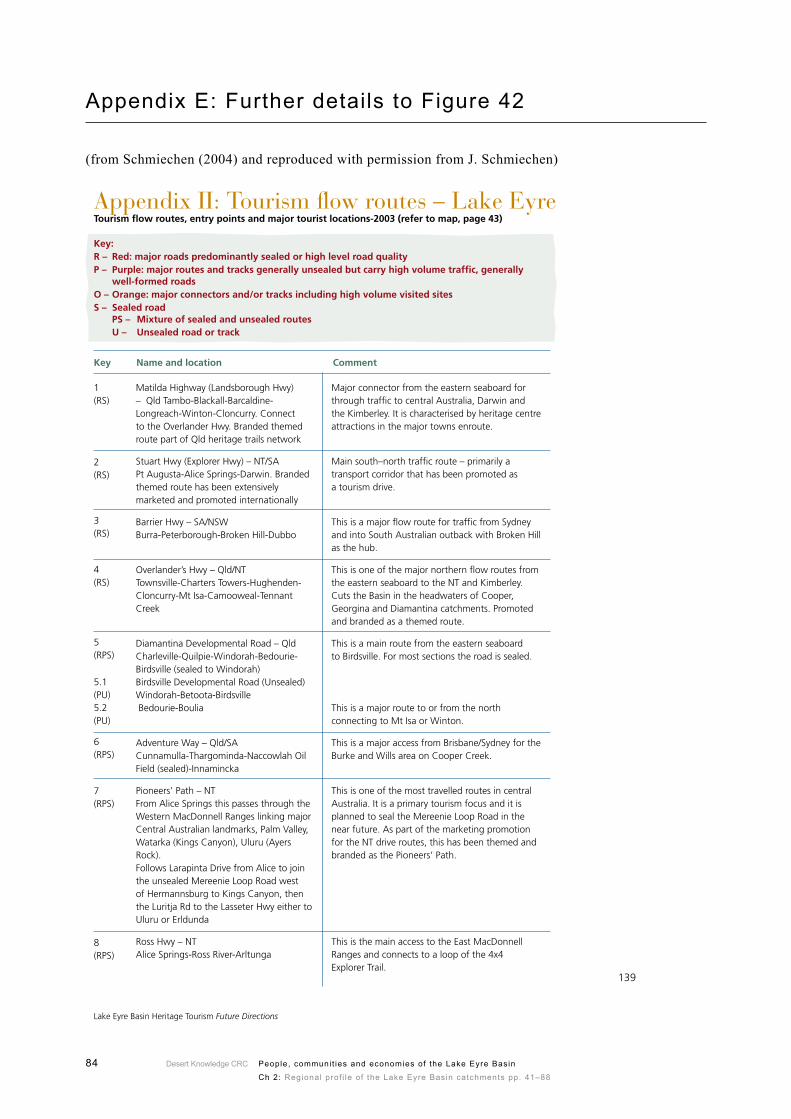
Desert Knowledge CRC84 People, communit ies and economies of the Lake Eyre Basin
Ch 2: Regional prof i le of the Lake Eyre Basin catchments pp. 41–88
Appendix E: Further details to Figure 42
(from Schmiechen (2004) and reproduced with permission from J. Schmiechen)
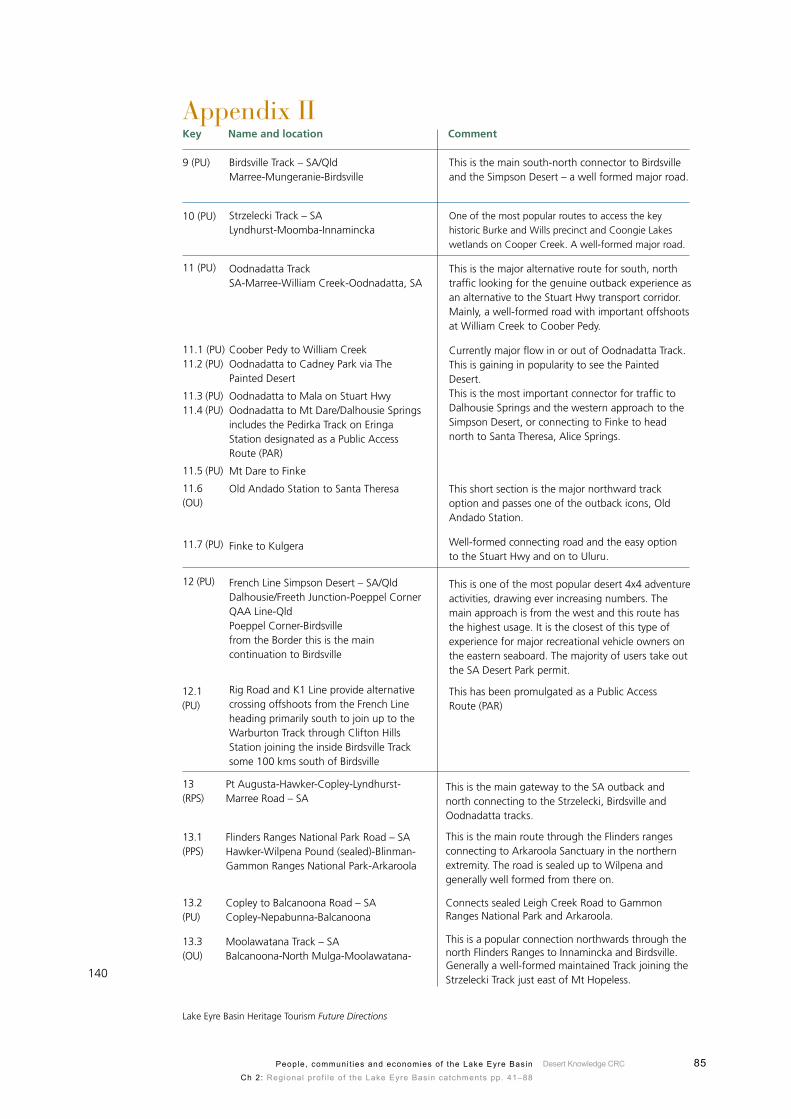
Desert Knowledge CRC 85People, communit ies and economies of the Lake Eyre Basin
Ch 2: Regional prof i le of the Lake Eyre Basin catchments pp. 41–88
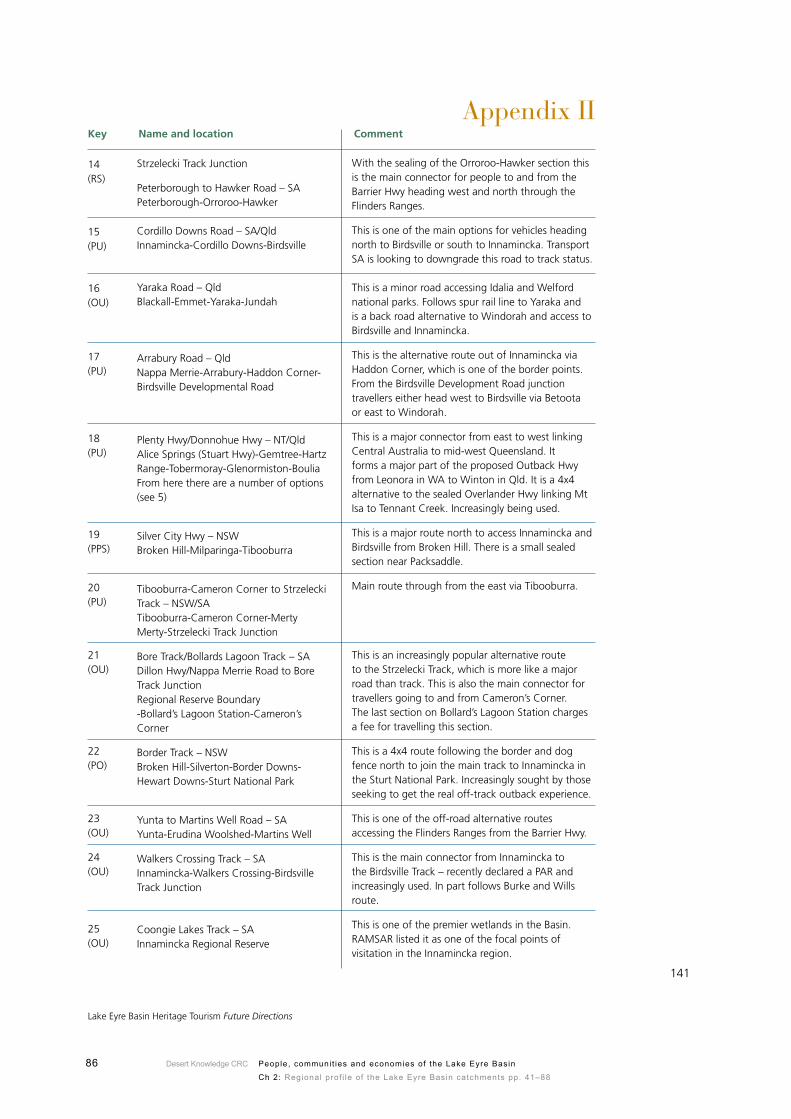
Desert Knowledge CRC86 People, communit ies and economies of the Lake Eyre Basin
Ch 2: Regional prof i le of the Lake Eyre Basin catchments pp. 41–88
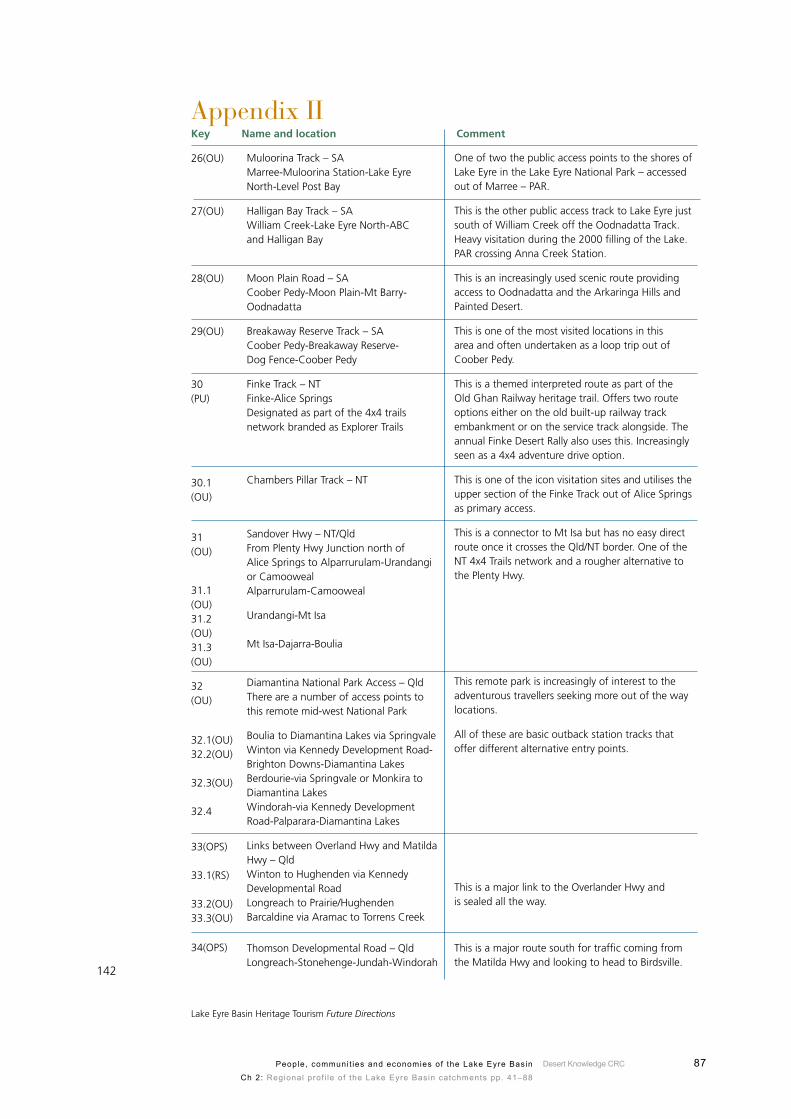
Desert Knowledge CRC 87People, communit ies and economies of the Lake Eyre Basin
Ch 2: Regional prof i le of the Lake Eyre Basin catchments pp. 41–88

Desert Knowledge CRC88 People, communit ies and economies of the Lake Eyre Basin
Ch 2: Regional prof i le of the Lake Eyre Basin catchments pp. 41–88