Embed Size (px)
Citation preview

LEB Rivers Assessment Implementation Plan Report No.2: Proposed Methodology
1 | P a g e
Lake Eyre Basin Rivers Assessment Implementation Plan Project
Milestone 2 Report: Proposed LEB Rivers Assessment Methodology Revised December 2009
Martin Thoms
Samantha Capon
Richard Price
Doug Watkins

LEB Rivers Assessment Implementation Plan Report No.2: Proposed Methodology
2 | P a g e
ABOUT KIRI-GANAI RESEARCH
Kiri-ganai Research Pty Ltd is a Canberra based company that undertakes consultancy and analytical studies concerned with environmental policy, industry performance, natural resource management and sustainable agriculture. Our strength is in turning knowledge gained from public policy, markets, business operations, science, and research into ideas, options, strategies and response plans for industries, governments, communities and businesses.
Kiri-ganai Research Pty Ltd GPO Box 103 CANBERRA ACT 2601 AUSTRALIA ph: +62 2 62956300 fax: +61 2 62327727 www.kiri-ganai.com.au
Project team The LEB River Assessment Implementation Plan Project is managed by Kiri-ganai Research Pty Ltd. The project team comprises Dr Richard Price, Professor Martin Thoms and Dr Samantha Capon. Doug Watkins contributed to the “pressure’ indicators section.
Acknowledgements The project team gratefully acknowledges the many individuals who are giving their valuable time, insight and knowledge during meetings with the consultants as this project progresses. We have been impressed by the professionalism of all the people that we have met and spoken to so far, and we trust that their passion and commitment to achieving a positive contribution to the Lake Eyre Basin is reflected in this report.
Disclaimer Care has been taken to ensure that the information contained in this report is reliable and that the conclusions reflect considerable professional judgment. Kiri-ganai Research Pty Ltd, however, does not guarantee that the report is without flaw or is wholly appropriate for all purposes and, therefore, disclaims all liability for any loss or other consequence which may arise from reliance on any information contained herein.

LEB Rivers Assessment Implementation Plan Report No.2: Proposed Methodology
3 | P a g e
Contents
Overview .......................................................................................................................6
What we say ................................................................................................................6
What we recommend ..................................................................................................7
1. Background ..............................................................................................................8
2. Introduction to the Lake Eyre Basin ....................................................................10
The biophysical environment ...................................................................................10
Pressures of development .........................................................................................11
Catchment management in the Lake Eyre Basin: a brief history .............................11
Values of the Lake Eyre Basin .................................................................................12
3. Current monitoring within the Lake Eyre Basin .................................................14
Hydrology component ..............................................................................................14
Physical form of waterholes component ..................................................................14
Biota component .......................................................................................................15
Water quality component .........................................................................................15
Landscape stress component ....................................................................................16
4. Recommendations for monitoring activities within the Lake Eyre Basin ........17
Past recommendations .............................................................................................17
State of the Basin Report ..........................................................................................23
Consultant’s assessment ...........................................................................................24
5. Indicators to include in the Method for Assessing the Health of the LEB: some considerations.............................................................................................................25
Selecting indicators ..................................................................................................25
Other factors to consider for the Lake Eyre Basin Rivers Assessment ....................31
Towards a thresholds approach: selecting indicators for the Lake Eyre Basin ......34
6. Linkages with national monitoring, evaluation and reporting frameworks. ...36
The First National Assessment of River Health. ......................................................36
National Land and Water Resources Audit ..............................................................37
The Sustainable Rivers Audit of the Murray Darling Basin ....................................38
Framework for the Assessment of River and Wetland Health .................................39
The Australian Rangelands Information System ......................................................40
The Index of Stream Condition (ISC) .......................................................................40
Integrated Monitoring of Environmental Flows (IMEF) .........................................42

LEB Rivers Assessment Implementation Plan Report No.2: Proposed Methodology
4 | P a g e
Queensland State of the Rivers ................................................................................43
Considerations for monitoring and evaluating ........................................................44
7. Monitoring actions that can be undertaken immediately ..................................45
Fish assemblage diversity indicator .........................................................................46
Colonial waterbirds diversity and breeding indicator .............................................53
Riparian vegetation structure indicator ...................................................................57
Wetland vegetation condition indicator (DIWA wetlands) ......................................61
Physical habitat indicator ........................................................................................66
Water quality indicator ............................................................................................70
Hydrology indicator .................................................................................................75
Pressure Indicators ..................................................................................................81
Setting Thresholds of Potential Concern (TPCs) .....................................................84
8. Monitoring actions that require further research and development ................86
Strategic adaptive management ...............................................................................86
Flow and flood theme ...............................................................................................90
Waterholes and wetlands theme ...............................................................................92
Riparian and floodplain theme .................................................................................92
Physical form theme .................................................................................................93
Water quality theme .................................................................................................93
9. Appropriateness of reporting timeframe.............................................................94
The assessment challenge ........................................................................................94
An alternate approach ..............................................................................................95
10. Recommendations .............................................................................................101
Appendix A: Terms of Reference .............................................................................102
Appendix B: References ...........................................................................................105
Appendix C: Stakeholders consulted to date ..........................................................111
LEB Rivers Assessment Implementation Plan Report No.2: Proposed Methodology
5 | P a g e
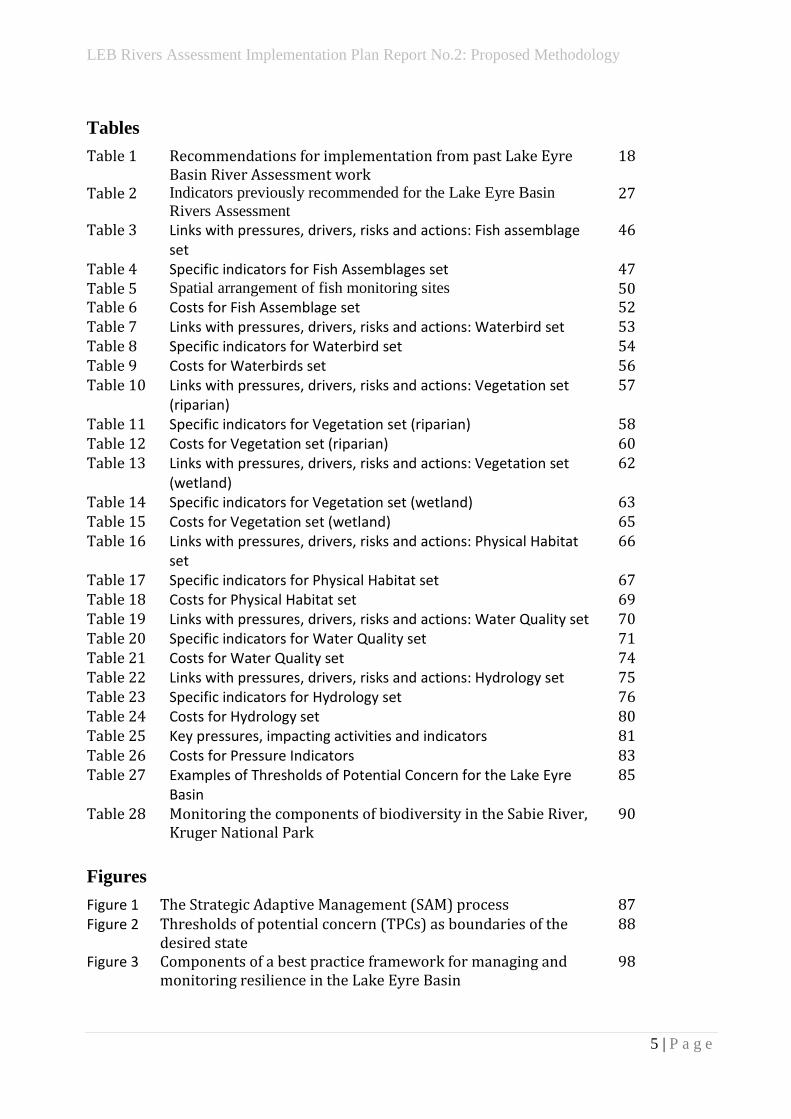
Tables
Table 1 Recommendations for implementation from past Lake Eyre Basin River Assessment work
18
Table 2 Indicators previously recommended for the Lake Eyre Basin
Rivers Assessment 27
Table 3 Links with pressures, drivers, risks and actions: Fish assemblage set
46
Table 4 Specific indicators for Fish Assemblages set 47 Table 5 Spatial arrangement of fish monitoring sites 50 Table 6 Costs for Fish Assemblage set 52 Table 7 Links with pressures, drivers, risks and actions: Waterbird set 53 Table 8 Specific indicators for Waterbird set 54 Table 9 Costs for Waterbirds set 56 Table 10 Links with pressures, drivers, risks and actions: Vegetation set
(riparian) 57
Table 11 Specific indicators for Vegetation set (riparian) 58 Table 12 Costs for Vegetation set (riparian) 60 Table 13 Links with pressures, drivers, risks and actions: Vegetation set
(wetland) 62
Table 14 Specific indicators for Vegetation set (wetland) 63 Table 15 Costs for Vegetation set (wetland) 65 Table 16 Links with pressures, drivers, risks and actions: Physical Habitat
set 66
Table 17 Specific indicators for Physical Habitat set 67 Table 18 Costs for Physical Habitat set 69 Table 19 Links with pressures, drivers, risks and actions: Water Quality set 70 Table 20 Specific indicators for Water Quality set 71 Table 21 Costs for Water Quality set 74 Table 22 Links with pressures, drivers, risks and actions: Hydrology set 75 Table 23 Specific indicators for Hydrology set 76 Table 24 Costs for Hydrology set 80 Table 25 Key pressures, impacting activities and indicators 81 Table 26 Costs for Pressure Indicators 83 Table 27 Examples of Thresholds of Potential Concern for the Lake Eyre
Basin 85
Table 28 Monitoring the components of biodiversity in the Sabie River, Kruger National Park
90
Figures
Figure 1 The Strategic Adaptive Management (SAM) process 87 Figure 2 Thresholds of potential concern (TPCs) as boundaries of the
desired state 88
Figure 3 Components of a best practice framework for managing and monitoring resilience in the Lake Eyre Basin
98

LEB Rivers Assessment Implementation Plan Report No.2: Proposed Methodology
6 | P a g e
Overview
What we say
This is the second report covering a series of steps leading to the development of an
implementation plan for resource assessments in the Lake Eyre Basin. Like the first
report, this report covers the technical aspects of the resource assessment
methodology. Future reports will focus on governance and business planning to
support effective assessments.
As reported previously, Kiri-ganai Research found the resource assessment process in
the Lake Eyre Basin indeed required improvement, as had been flagged by the
Basin’s Scientific Advisory Panel. The agreed method established in 2005 was not
used in the assessment undertaken in 2008. Neither the original method nor the
subsequent method adopted were designed to provide a comprehensive landscape
scale assessment of the Lake Eyre Basin, and although supplemented with a socio-
economic study undertaken separately, a comprehensive understanding of the
Basin’s condition is yet to emerge.
This report considers the efficacy of the current assessment process and makes
suggestions as to its improvement. Agreement on the purpose, nature and
constituent activities of the assessment is a fundamental precursor to establishing
the governance principles and arrangement to enable effective assessments to be
undertaken. Form must follow function if governance arrangements are to have a
legitimate role and work effectively. It is because of this that this report represents
the critical point at which agreement on function (the assessment process) must be
reached.
A proposed assessment process is dealt with in two complementary ways. The report
makes recommendations on the indicators to be used in future assessments that
provide a more comprehensive understanding of Basin-wide condition. However, the
report also proposes a strategic adaptive approach to monitoring and the
management of the natural resources of the Lake Eyre Basin based around the
concept of thresholds of probable concern (TCPs).
Many river health issues are directly related to the connectivity between rivers and
their catchments, floodplains and wetlands; therefore working at the landscape scale
is a suitable means of gaining a proper understanding of condition. No single
indicator alone is best and a synthetic approach that adopts a group of relevant
metrics may prove most effective. It is the variability and complexity of
environmental processes at multiple spatial and temporal scales in response to a
range of disturbances that needs to be captured in a management and monitoring
programme for the Lake Eyre Basin. While this may seem daunting, frameworks exist
for incorporating such characteristics into management and monitoring programmes.

LEB Rivers Assessment Implementation Plan Report No.2: Proposed Methodology
7 | P a g e
Essentially the original approach taken for the recommended Lake Eyre Basin Rivers
Assessment was a trend based assessment. As suggested, the challenges to this are
in not only selecting appropriate indicators but also in incorporating the enhanced
spatial and temporal variations in natural “condition” that are evident across the
Lake Eyre Basin. At any one point in time, natural variations in flooding and rainfall
will mean sections will naturally be in “good” condition while others are in “poor”
condition. Therefore a traditional trend assessment may not be appropriate to the
Lake Eyre Basin because of the length of time required in data collection to construct
statistical relevant trends.
What we recommend
In progressing to the next stages of this project, which deal directly with the
implementation plan and governance arrangements covering future assessments
(Milestones 3 and 4), Kiri-ganai Research makes the following recommendations:
i. A revised LEB assessment method should be agreed to be based around whole-of-
Basin condition, in line with the terms of the LEB Intergovernmental Agreement.
An outline of such a method is provided in this report. Six components are
considered to be able to monitored immediately; these being physical habitat,
fish, water birds and riparian vegetation.
ii. It is the variability and complexity of environmental processes at multiple spatial
and temporal scales in response to a range of disturbances that needs to be
captured in any future development of a management and monitoring
programme for the Lake Eyre Basin. A Strategic Adaptive Management system is
recommended for an assessment of the Lake Eyre Basin with resilience of the
natural resources of the basin being the ultimate aim of the programme. This
provides the context for the selection of indicators, collection of data and
establishment of Thresholds of Probable Concern.
iii. The timing of future assessments should be every 5 to 10 years, with ongoing
monitoring reported annually, even where this is minimal monitroring.
iv. Governance arrangements in respect to future Assessments should be adopted
that support a strategic adaptive management approach. Such arrangements
should allow for continuous learning and improvement, and ensure that
assessments inform stakeholders responses.
v. The workshop proposed for August 2009 should include discussion around the
technical component of the assessment process as well as the governance and
implementation components.

LEB Rivers Assessment Implementation Plan Report No.2: Proposed Methodology
8 | P a g e
1. Background The Australian Department of the Environment, Water, Heritage and the Arts
(DEWHA) requires the development of a Lake Eyre Basin Rivers Assessment
Implementation Plan to identify how regular on-going monitoring of key indicators
will be implemented within the Lake Eyre Basin Agreement Area. To meet this aim
DEWHA has engaged the services of Kiri-ganai Research Pty. Ltd to undertake a
consultancy for this purpose.
The main objectives of this consultancy are to undertake:
a review of achievements to-date under the Lake Eyre Basin Rivers
Assessment;
a review of the Lake Eyre Basin Rivers Assessment methodology and
recommend on an approach and key indicators to be monitored, their
scale and frequency (including rationale for decisions);
support development and documentation of governance arrangements;
development of a business model (including the cost of monitoring,
managing data and report; funding for future monitoring and possible
funding arrangement).
In accordance with the project contract, there are six milestones for this consultancy:
Review of achievements to date under the Lake Eyre Basin Rivers
Assessment (Step 1)
An agreed Lake Eyre Basin Rivers Assessment Methodology (Step 2)
Development and documentation of governance arrangements (Step 3).
Development of a business model (Step 4)
Lake Eyre Basin Rivers Assessment Implementation Plan (Step 5)
Workshop ( Step 6)
This report is submitted in accordance with the terms of reference for this
consultancy and addresses Step 2 (review of the agreed Lake Eyre Basin Rivers
Assessment Methodology). Building on the first report, submitted in May 2009, this
report reviews documents and activities pertaining to the Lake Eyre Basin Rivers
Assessment Methodology in terms of the successes and failures in meeting their
original aims and objectives. As part of this task Kiri-ganai Research was asked to:
1. identify the monitoring already being undertaken within the Lake Eyre
Basin which will be included in the Implementation Plan (addressed in
Section 3 of this report);

LEB Rivers Assessment Implementation Plan Report No.2: Proposed Methodology
9 | P a g e
2. identify the recommendations from previous Lake Eyre Basin work that
will be included in the Implementation Plan (addressed in Section 4 of
this report);
3. identify the indicators that were suggested in Method for Assessing the
Health of Lake Eyre Basin Rivers that will be included in the
Implementation Plan (addressed in Section 5 of this report);
4. identify linkages with national monitoring, evaluation and reporting
frameworks (addressed in Section 6 of this report);
5. identify monitoring actions that can be undertaken immediately –
summarise their methods and costs (addressed in Section 7 of this
report);
6. identify monitoring actions that require further research and
development(addressed in Section 8 of this report); and
7. advise on the appropriateness of reporting on a ten year basis or other
timeframe (addressed in Section 9 of this report).

LEB Rivers Assessment Implementation Plan Report No.2: Proposed Methodology
10 | P a g e
2. Introduction to the Lake Eyre Basin
The biophysical environment
The Lake Eyre Basin covers an area of 1,140,000 km2 (15 percent of the Australian
landmass) and is similar in size to the Murray-Darling Basin (MDB). There are a
number of large iconic river systems within the Lake Eyre Basin, notably Cooper
Creek (catchment area 306,000 km2, river length 1500 km) and the Diamantina River
(catchment area 160,000 km2, river length 1000 km), that are important
international and national ecosystems. These ecosystems are amongst a handful of
large river systems that remain relatively untouched by human development,
especially water resource development, and they are Australian folklore icons –
especially the Cooper and Diamantina.
The Lake Eyre Basin contains areas of high economic value. These include activities
such as pastoralism, tourism, oil and gas extraction and mining, as well as areas of
social, cultural and heritage value. Sustainability of the environmental and economic
significance of the Lake Eyre Basin depends, in part, upon the continued health of its
riverine landscape; its sub catchments, main river channels, flood plains, lakes,
wetlands and overflow channels.
The rivers of the Lake Eyre Basin are dryland rivers being characterized by extremely
variable and unpredictable flows, low gradients and complex flow paths. Lake Eyre
Basin rivers, namely the Thompson, Barcoo. Cooper Creek, Georgina, Diamantina,
Neales and the Warburton, and their tributaries, change from a series of waterholes
in dry times to slow moving ‘inland seas’ that are often kilometres wide during large
flood events. Although the rivers of the Lake Eyre Basin are largely unmodified by
large-scale water resource developments there are a range of activities in the
broader catchment that could potentially impact on the ‘health’ of these river
systems.
“Dryland” rivers typically occur where annual rainfall is less than 500 mm and the
annual evaporation rate exceed rainfall. Australian dryland rivers have some of the
most variable flow patterns in the world. Large floods, which cover large areas of the
riverine landscape, and extensive droughts, when water availability is restricted to a
few permanent waterholes, are prominent features. Despite the variable and
unpredictable nature of flow in dryland rivers, the animals and plants inhabiting the
rivers and associated floodplains are well adapted to the nature of this flood-drought
variability. Indeed, the integrity of dryland river ecosystems, especially in their
lowland areas, depend upon the irregular inundation of the floodplain (period of
flooding) and the drying out of the majority of the riverine landscape during periods
of drought.
LEB Rivers Assessment Implementation Plan Report No.2: Proposed Methodology
11 | P a g e
Pressures of development
In 1995 a consortium of cotton growers put forward a proposal for irrigated cotton
farming at Currareva, on the headwaters of Cooper Creek in the Queensland section
of the Lake Eyre Basin. The development proposed to withdraw 42 000ML of water
from the Cooper each summer to irrigate 3 600 ha of cotton, and to construct two
off-stream storages (total capacity 15 000ML) as reservoirs for low-flow years. While
this diversion represents only 2.5% of the median annual flow (1.7 million ML) it
potentially would have significant impact on the river ecosystem especially during
low or no flow periods. The Currareva proposal provoked dismay among river
scientists and conservationists because the development would be in sharp contrast
to the boom-and-bust character of the regional dryland environment. On 29 October
1996 the Queensland Minister for Natural Resources announced that the Currareva
proposal would be rejected by a special Act of Parliament citing the `overwhelming
weight' of ecological evidence predicting environmental damage from the
development.
Catchment management in the Lake Eyre Basin: a brief history
The Lake Eyre Basin Intergovernmental Agreement grew from a process that began
in the mid 1990s. People from various Lake Eyre Basin community groups and from
government began discussing how to ensure the long-term sustainability of the
Basin's natural resources. The Lake Eyre Basin Steering group, formed in 1995,
brought together stakeholders and interest groups from the pastoral industry, the
Queensland and South Australian governments, conservation groups, the mining and
petroleum industries, Landcare groups, Indigenous organisations and local
government. The task of this group was to find out from people interested in the
Basin whether they would like to set up a mechanism for community input into, and
coordination of, natural resource management decision-making. Several years later it
was decided to adopt a catchment management approach for the Basin and the Lake
Eyre Basin Coordinating Group was established with the support of Natural Heritage
Trust funds. This was followed by the establishment of the Cooper's Creek
Catchment Committee and the Georgina Diamantina Catchment Committee in 1998.
Collectively, the Lake Eyre Basin Coordinating Group and the two catchment
committees developed a series of catchment management strategies that were
based on issues identified through wide public consultation.
At the same time, the Commonwealth, Queensland and South Australian
Governments began negotiating an intergovernmental agreement for the Lake Eyre
Basin. The Lake Eyre Basin Heads of Agreement was signed in 1997 as the basis to
negotiate a formal inter-governmental cooperative agreement for integrated
catchment management and water resources management of the Lake Eyre Basin.
The Lake Eyre Basin Intergovernmental Agreement was signed by Ministers of the

LEB Rivers Assessment Implementation Plan Report No.2: Proposed Methodology
12 | P a g e
Commonwealth, Queensland and South Australian governments in October 2000,
and ratified by Acts of Parliament in all three jurisdictions in 2001. The Agreement
applied to the Coopers Creek and Georgina Diamantina River systems in South
Australia and Queensland, and established the Lake Eyre Basin Ministerial Forum,
with responsibility for achieving the objectives of the Agreement. Part of the
Agreement required the Ministerial Forum to appoint a Community Advisory
Committee, a role previously performed by the Lake Eyre Basin Coordinating Group
until late 2002. The Ministerial Forum also appointed a Scientific Advisory Panel to
provide scientific and technical advice, in particular to provide advice on monitoring
the condition of rivers and catchments within the Lake Eyre Basin Agreement Area.
Values of the Lake Eyre Basin
The following environmental and social values in the Lake Eyre Basin have been
identified by various community groups and government agencies.
Values identified in the Lake Eyre Basin Intergovernmental Agreement
Continued health of the Thomson/Barcoo/Cooper, Georgina and
Diamantina river systems (to maintain nationally and internationally
significant areas and other values dependent on the health of the river
systems);
Conservation and promotion of important social, environmental,
economic and cultural values;
Landscapes and watercourses that are valuable for aesthetic, wilderness,
cultural and tourism purposes;
Aquatic ecosystem health which is maintained by naturally variable flow
regimes and water quality;
Flow variability and seasonality to maintain ecological processes and
biodiversity;
Maintenance of beneficial flooding for pastoralism and floodplain
ecosystem processes;
Integrated management;
Precautionary management to protect environmental attributes;
Management to be undertaken within a framework of ESD principles and
national and international obligations;
Local knowledge and experience;
Best available scientific and technical information.

LEB Rivers Assessment Implementation Plan Report No.2: Proposed Methodology
13 | P a g e
Values identified by the Ministerial Forum and included in the agreed policies adopted on 25 October 2002
Maintenance of ecological integrity and natural functioning of in-stream
and floodplain ecosystems;
Viable economic, social, cultural and other activities which do not
threaten the above environmental values.
Values identified by the LEB community in its strategic plans for the Lake Eyre Basin Basin-wide
Sustainable and wise use of natural resources;
Conserving biodiversity;
Economic prosperity;
Respect for and use of local knowledge;
Outback lifestyle;
Healthy systems with high ecological integrity;
Forward looking, vibrant communities;
Sustainable and diverse regional economy.

LEB Rivers Assessment Implementation Plan Report No.2: Proposed Methodology
14 | P a g e
3. Current monitoring within the Lake Eyre Basin
Regular monitoring of a range of components is currently being undertaken across
the Lake Eyre Basin by various state government jurisdictions. However, there is a
high degree of inconsistency in terms of what is being or has been monitored by the
different State jurisdictions, the scale and the applicability of various components
used for an assessment of the Lake Eyre Basin as a whole. In addition, the quality of
the data collected and the length of time over which monitoring has been
undertaken is also highly variable. Monitoring activities undertaken within the Lake
Eyre Basin can be grouped into the components of hydrology, the physical form of
waterholes, biota and water quality and landscape factors. The details of each are
provided below.
Hydrology component
The hydrology of the Lake Eyre Basin has been analysed by McMahon et
al (2008) using data from gauging stations with >10yrs of data.
Overall, the hydrology of the Lake Eyre Basin was assessed in the Lake
Eyre Basin State of the Basin Report (2008). Here the hydrological
condition was assessed by Lake Eyre Basin Scientific Advisory Panel and
Lake Eyre Basin Steering Committee using expert opinion and best
available data (not specified). This assessment was based on storage
water volumes and percentage of flow diverted from the channel
network within the basin as monitored by State Agencies.
There is a surface water monitoring network within the Lake Eyre Basin
and this has been reviewed by Ladson et al (2006) who provided
recommendations for additional monitoring sites and instrumentation.
A limited number of water level loggers have been installed in the South
Australian section of the Lake Eyre Basin as part of the ARIDFLO project,
as outlined in Good et al (2008). Data from these loggers have been
downloaded from and analysed by Costelloe (2007; 2008).
A pilot study is underway to evaluate the potential for use of Remote
Sensing (Lake Eyre Basin Scientific Advisory Panel 2009) for the
determination of the extent of flooding throughout the Lake Eyre Basin.
Physical form of waterholes component
The location, permanency and connectivity of various waterholes have
been mapped in the Queensland, eastern South Australia and Northern
Territory sections the Basin using a series of remotely sensed images. The

LEB Rivers Assessment Implementation Plan Report No.2: Proposed Methodology
15 | P a g e
methods used and analysis of this exercise is outlined in Lake Eyre Basin
Scientific Advisory Panel (2009) report.
Biota component
Regular monitoring of two biotic components has occurred throughout the
Lake Eyre Basin:
Fish
Fish were monitored as part of the ARIDFLO (Good et al 2008) and the
CRC for Freshwater Ecology Dryland Refugia projects.
In addition there have been regular surveys of fish within the Queensland
section of the Lake Eyre Basin as well as the Northern Territory Section as
noted in Bailey and Long (2001) and Duguid et al (2005) respectively.
A project to determine the natural trajectory of fish diversity and
abundance in relation to hydrology and season within the Lake Eyre Basin
has been undertaken by Humphries et al (2007). The resultant model has
been tested in the South Australian section of the Lake Eyre Basin by
McNeil and Reid (2008) and in the Queensland section by Balcombe and
Kerezy (2008).
Overall fish communities within the Lake Eyre Basin were assessed as
part of the Lake Eyre Basin State of the Basin Report in 2008 using the
using data outlined above but the actual methods employed were not
stated.
Waterbirds
Surveys of waterbirds have been undertaken in some parts of Lake Eyre
Basin for up to 24 years. Kingsford and Porter (2008) have reviewed the
validity of using waterbird data for assessing river condition.
Water birds were assessed in the Lake Eyre Basin State of the Basin
report (2008) using the expert knowledge of Professor Richard Kingsford
who utilized the above long-term datasets.
Water quality component
Ongoing water quality monitoring has been undertaken in the
Queensland section of the Lake Eyre Basin. Assessments of the water
quality of rivers in the Queensland section of the Lake Eyre Basin are
provided by Bailey (2001) and Choy et al (2002).
Water quality was a component included in the Lake Eyre Basin State of
the Basin report of 2008 and this used data from the State-based water

LEB Rivers Assessment Implementation Plan Report No.2: Proposed Methodology
16 | P a g e
quality monitoring programmes (information has not been provided on
this) as well as an expert review of results by the Lake Eyre Basin
Scientific Advisory Panel and Steering Committee. This assessment was
done using the ANZECC Ecosystem Protection Guidelines.
Landscape stress component
A landscape stress component was included in the Lake Eyre Basin State
of the Basin Report (2008) and was based on the method developed for
the National Land and Water Resources Audit. The landscape health
assessment as outlined by Morgan (2000), and further elaborated in Herr
et al (2007), is based on the following variables:
o percentage of subregion with least impact from total grazing
pressures
o value of native vegetation in land tenures associated with
conservative land use practices
o weed density
o feral animal density
o number of threatened species
o susceptibility of resources to degradation.
The National Land and Water Resources Audits landscape stress rating
was conducted on a sub-regional basis with the majority of the Lake Eyre
Basin being assessed as ‘extensive land use zone’ and ‘intensive land use
zone’ for the Cooper catchment headwaters. Conversion to a sub-
catchment scale has been undertaken by the Lake Eyre Basin Steering
Committee through visually overlaying layers.

LEB Rivers Assessment Implementation Plan Report No.2: Proposed Methodology
17 | P a g e
4. Recommendations for monitoring activities within the Lake Eyre Basin
Past recommendations
The Lake Eyre Basin Intergovernmental Agreement provides for the sustainable
management of the water and related natural resources associated with the major
river systems of the Lake Eyre Basin. In terms of natural resource management and
conservation, the Agreement is important for two reasons. First it allows for the
protection of economic, social and environmental values that depend on the natural
resources of the basin, especially its river systems. Second, it serves to avoid
potential cross-border impacts. The literature contains numerous examples of cross
border jurisdictional conflicts both here in Australia and elsewhere, and in the
majority of circumstances this has been associated with a decline in the condition or
functioning and the overall integrity of natural resources. Part of the Lake Eyre Basin
Agreement requires an assessment of the condition of the major river systems and
catchments within the Agreement Area and for the assessment to be repeated every
10 years.
The Lake Eyre Basin Rivers Assessment (LEBRA) required the following:
development of an appropriate assessment methodology;
a number of conceptual models of the river systems and how they
function;
the identification of suitable indicators of condition; and
the development of monitoring and reporting protocols (including
identification of representative monitoring sites).
Further, the methodology that was to be developed for the LEBRA was required to
be scientifically rigorous and credible, and deal effectively with the challenges of
remoteness, vast distances, lack of existing monitoring infrastructure and baseline
data, and the complexity and variability of the Lake Eyre Basin system.
Recommendations for monitoring activities within the Lake Eyre Basin have been
made from the LEBRA and other environmental studies undertaken in the Basin.
These past recommendations are outlined in Table 1 according to the themes noted
in the Lake Eyre Basin Implementation Plan. The themes being: 1) flow and flood,
2) waterholes and wetlands, 3) riparian and floodplain, 4) physical form and
5) general.

LEB Rivers Assessment Implementation Plan Report No.2: Proposed Methodology
18 | P a g e
Table 1. Recommendations for implementation from past Lake Eyre Basin River Assessment work.
THEME Report Recommendations
1) FLOW and FLOOD
General Lake Eyre Basin Data Logging Review, December 2006
Priorities for monitoring locations are provided but should be confirmed in consultation with scientists involved in Lake Eyre Basin projects, governments and stakeholders. Stakeholder workshop suggested to consider report findings and ‘Methods’. Sites to be prioritised on basis of information needs of Lake Eyre Basin assessment and budget scenarios. The way to move beyond a ‘wish list’ of monitoring sites is to apply discipline in prioritising sites and information needs (p.27).
Suggested that 2 types of sites are considered: 1. Long-term sites: with ‘sensor to web’ technology, to develop rating curves and 2. Large number of stage recording sites (without telemetered data), similar to existing ARIDFLO sites (p.27).
Selection of new instrumentation and measurement techniques require expert advice to be drawn from within Lake Eyre Basin jurisdiction. Recommendations for a committee (people listed in Table 6).
Water use
Notes from March 2005 Lake Eyre Basin Rivers Workshop, March 22 & 23
To be calculated initially for pilot region, e.g. upper Thomson River. Volumes of water held in storages to be calculated initially using area of storage and assuming average depths.
Waterhole depth Notes from March 2005 Lake Eyre Basin Rivers Workshop, March 22 & 23
Need to address question of wether permanency of water is affected by water removal at low levels and assess change in duration of inundation at key sties.
Flood extent Notes from March 2005 Lake Eyre Basin Rivers Workshop, March 22 & 23
Errors too large to determine accurate discharge/flood extent relationships. This area requires research and development.
Alluvial groundwater Important to monitor for Upper Georgina waterholes in the Northern Territory only. Need piezometers associated with depth loggers.

LEB Rivers Assessment Implementation Plan Report No.2: Proposed Methodology
19 | P a g e
THEME Report Recommendations
2) WATERHOLES and
WETLANDS
General Notes from March 2005 Lake Eyre Basin Rivers Workshop, March 22 & 23
Site-based, regular monitoring and frequent reporting.
Augmented waterholes, e.g. Longreach town water supply need further consideration.
Sufficient data exists to conduct Power analysis for water quality, fish and macro invertebrate data.
Need to develop conceptual model for impacts of cane toads.
Water quality Notes from March 2005 Lake Eyre Basin Rivers Workshop, March 22 & 23
Need to consider more useful data loggers to get dissolved oxygen and temperature.
Total Nitrogen and Phosphorus very costly and not very informative.
State of the Basin 2008: Rivers Assessment - Background and Reference, April 2009
Need to develop regional and local water quality guidelines.
Waterhole process and
function
Notes from March 2005 Lake Eyre Basin Rivers Workshop, March 22 & 23
Some indicators too expensive and not all indicators necessary for routine analysis.
Blue-green algal dominance may be useful. Pilot study required.
Fish Report on the LEBRA Workshop: Determining the natural trajectory of fish within the Lake Eyre Basin, November 2006
Fish monitoring must be linked with hydrological and water quality monitoring (p. 7).
Fish sampling should occur biannually; once after wet season recedes in March/April and again near end of dry season in November (p. 7).
Recommended spatial arrangement for sampling and reporting is at 1. catchment level, 2. biogeographic/climatic/hydrological regions within each catchment and 3. representative reaches and critical sites. Minimum of 2 representative reaches required for each region with 3 being best (p. 8).
Research into Lake Eyre Basin fish taxonomy, conservation status, genetics etc. required (p. 8).
LEB Rivers Assessment Implementation Plan Report No.2: Proposed Methodology
20 | P a g e
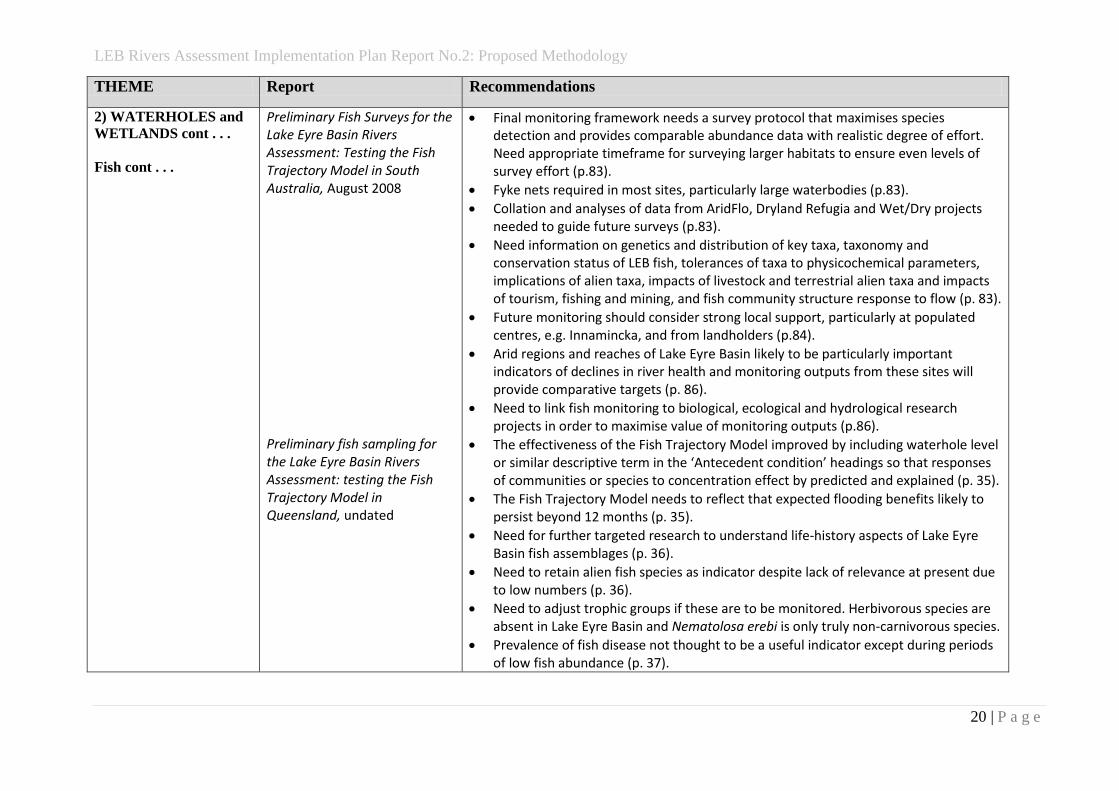
THEME Report Recommendations
2) WATERHOLES and
WETLANDS cont . . .
Fish cont . . .
Preliminary Fish Surveys for the Lake Eyre Basin Rivers Assessment: Testing the Fish Trajectory Model in South Australia, August 2008
Final monitoring framework needs a survey protocol that maximises species detection and provides comparable abundance data with realistic degree of effort. Need appropriate timeframe for surveying larger habitats to ensure even levels of survey effort (p.83).
Fyke nets required in most sites, particularly large waterbodies (p.83).
Collation and analyses of data from AridFlo, Dryland Refugia and Wet/Dry projects needed to guide future surveys (p.83).
Need information on genetics and distribution of key taxa, taxonomy and conservation status of LEB fish, tolerances of taxa to physicochemical parameters, implications of alien taxa, impacts of livestock and terrestrial alien taxa and impacts of tourism, fishing and mining, and fish community structure response to flow (p. 83).
Future monitoring should consider strong local support, particularly at populated centres, e.g. Innamincka, and from landholders (p.84).
Arid regions and reaches of Lake Eyre Basin likely to be particularly important indicators of declines in river health and monitoring outputs from these sites will provide comparative targets (p. 86).
Need to link fish monitoring to biological, ecological and hydrological research projects in order to maximise value of monitoring outputs (p.86).
Preliminary fish sampling for the Lake Eyre Basin Rivers Assessment: testing the Fish Trajectory Model in Queensland, undated
The effectiveness of the Fish Trajectory Model improved by including waterhole level or similar descriptive term in the ‘Antecedent condition’ headings so that responses of communities or species to concentration effect by predicted and explained (p. 35).
The Fish Trajectory Model needs to reflect that expected flooding benefits likely to persist beyond 12 months (p. 35).
Need for further targeted research to understand life-history aspects of Lake Eyre Basin fish assemblages (p. 36).
Need to retain alien fish species as indicator despite lack of relevance at present due to low numbers (p. 36).
Need to adjust trophic groups if these are to be monitored. Herbivorous species are absent in Lake Eyre Basin and Nematolosa erebi is only truly non-carnivorous species.
Prevalence of fish disease not thought to be a useful indicator except during periods of low fish abundance (p. 37).

LEB Rivers Assessment Implementation Plan Report No.2: Proposed Methodology
21 | P a g e
THEME Report Recommendations
2) WATERHOLES and
WETLANDS cont . . .
Fish cont . . .
Joint recommendations for fish monitoring in Lake Eyre Basin Rivers: testing the Fish Trajectory Model in Queensland and South Australia, undated
Analysis of fish species richness, abundance in arid systems needs to be more than site specific and consider broader spatial patterns (p. 1).
Length/weight curves need to be developed for species and catchments so biomass can be estimated from length (p. 1).
Alterations needed to recruitment indicator with allowances made for variability in responses between species, climates and hydrological conditions (p. 2)
Research required into spawning and biology of Lake Eyre Basin fish species (p. 2).
Population size structure response curves needed for different species (p. 2)
Abundance of herbivores indicator to be replaced by abundance of detritivores (p. 2). Abundance of macro-carnivores and microcarnivores not as useful as species-specific data and ontogenetic classes within species (p. 2).
3) RIPARIAN and
FLOODPLAIN
General Notes from March 2005 Lake Eyre Basin Rivers Workshop, March 22 & 23
Should be based on site measurements able to be upgraded to catchment measures.
Riparian vegetation
condition
Notes from March 2005 Lake Eyre Basin Rivers Workshop, March 22 & 23
Same dataset to pick up all indicators. Floating macrophytes should be included. Woody perennials should be identified to species.
Floodplain vegetation
condition
Notes from March 2005 Lake Eyre Basin Rivers Workshop, March 22 & 23
Same as above but lower priority.
Waterbirds Scientific validity of using waterbird measures to assess river condition in the Lake Eyre Basin, September 2008
Inclusion of waterbirds as key biological indicator in LEBRA
Identification of thresholds for waterbird abundance, diversity and composition for important wetland sites in Lake Eyre Basin
Development of a program focusing on surveys of iconic and important sites at least annually using repeatable methodology. More frequent surveys required during significant flow events.
Identify major colonial waterbird breeding sites in LEB and monitor breeding events.
Integration of river flow data and waterbird data.
Analysis of long-term waterbird data sets to determine current status of waterbirds
Use of aerial survey data to identify wetlands of importance in the Lake Eyre Basin.

LEB Rivers Assessment Implementation Plan Report No.2: Proposed Methodology
22 | P a g e
THEME Report Recommendations
4) PHYSCIAL FORM
General
Notes from March 2005 Lake Eyre Basin Rivers Workshop, March 22 & 23
Should be reviewed regionally on 5 year cycle
Channel system integrity Notes from March 2005 Lake Eyre Basin Rivers Workshop, March 22 & 23
Need pilot to assess validity of using aerial photography to assess disappearance of anabranches etc with flow changes
Need pilot study to develop rapid appraisal methodology for assessing within-waterhole complexity (e.g. from Ausrivas). Also, need to consider using snags as subsidiary. Noted that large amount of work required to collect data for within-waterhole complexity indicator.
Erosion potential and
land use and landscape
change
Notes from March 2005 Lake Eyre Basin Rivers Workshop, March 22 & 23
Need to look at changes in vegetation cover in response to events. Requires research and development and pilot study.
Floodplain salinisation Notes from March 2005 Lake Eyre Basin Rivers Workshop, March 22 & 23
Probably data readily available for pilot studies in lower Goyder’s Lagoon, Diamantina NP and Durham Downs floodplain.
Frequency should be between 2 and 5 years in areas where salt transition is going to occur.
5. GENERAL Notes from March 2005 Lake Eyre Basin Rivers Workshop, March 22 & 23
Indicators developed under Ephemeral Rivers project need to be considered for inclusion for headwaters of the Northern Territory rivers.
Conceptual models need to be re-addressed to demonstrate links with selected indicators with references to literature in order to justify selection of indicators.
Notes from March 2005 Lake Eyre Basin Rivers Workshop, March 22 & 23
Need to define what moderate and poor condition classes constitute (p. 10)
Future Lake Eyre Basin assessments should align with nationally agreed resource condition indicators from NRM MERI Framework and with FARWH for national reporting (p. 10)
FARWH recommends use of hydrology indicators developed for MDB SRA by SKM plus NWC groundwater assessment. Since no model for natural flows in Lake Eyre Basin, SRA methods cannot be directly applied to Lake Eyre Basin and time series approach is required (p. 12)

LEB Rivers Assessment Implementation Plan Report No.2: Proposed Methodology
23 | P a g e
In summary, the reports reviewed, suggest:
The sole focus of hydrological activities has been on the installation of data loggers
for recording water levels which can be used to construct reliable rating tables of
water level and discharge.
Biological monitoring appears to relatively advanced although poor in comparison to
other river assessment programs in Australia.
State of the Basin Report
Data collected from the various monitoring activities have been used to construct the
State of the Basin Report (2008). Two documents outlining the State of the Basin
2008 have been produced. The first is essentially a score card of condition for various
regions across the basin while the second provides technical information
underpinning the score card. The State of the Basin reports on broad measures of
hydrology, landscape stress, water quality, fish and waterbirds. The methods
supporting the report card are based on the FARWH approach of condition
assessment and does not use the method developed in the Lake Eyre Basin River
Assessment Project.
The four key points of the State of the Basin Assessment are:
The rivers and catchments of the Lake Eyre Basin are in generally good
condition. A low degree of hydrological modification was stress as being
particularly important.
Intact aquatic ecosystem within the basin the Lake Eyre Basin rivers
unique compared to other arid rivers in Australia and globally.
Cooper Creek is the most studied river in the basin but knowledge of the
structure and function of this system is considered to be below that of
other Australian river systems.
Potential threats to the condition of rivers within the basin include water
resource development, invasive pests and land use intensification.
Conclusions of the State of the Basin Report were based on the following:
Five indicators were used in this assessment; hydrological condition,
landscape stress, water quality, fish and waterbirds.
The actual approach to assessing the condition of rivers within the basin
appears to follow the FAWRH framework rather than that proposed by
the Lake Eyre Basin River Assessment Methodology.
Apart from the Hydrological Condition, which was reported at a
catchment scale, the other indicators were reported at the sub
catchment scale of Headwaters, Channels and Waterholes and Terminal

LEB Rivers Assessment Implementation Plan Report No.2: Proposed Methodology
24 | P a g e
Wetlands, as recommended by the Lake Eyre Basin River Assessment
Methodology.
Some of the data used in the river assessment were accessed from
regional data sets that were complied before 2000.
The assessment was based on a variety of sources of information, these
being; existing reports, scientific data (but these were not stipulated) and
expert opinion and once again the experts and their views are not noted.
Most indicators were reported to be in ‘good’ condition across the basin
but a clear definition of what ‘good’ was not provided.
In addition, it was noted that defining what constituted ‘moderate’ and
‘poor’ condition must be developed.
Consultant’s assessment
A total of 39 cited actions were noted as part of the implementation
recommendations from the Rivers Assessment Methodology and these address the
four main themes of Flow and Flood, Riparian and Floodplain, Waterholes and
Wetlands and Physical Form. These listed actions can be grouped as addressing 11
different attributes like hydrological variability, fish assemblage diversity and
ecosystem processes as examples.
35 of the 39 listed actions have either not been addressed or reported. Completed
achievements that have been listed include those on the broad scale assessment of
hydrological condition, a review of data logging, the hydrology of the Lake Eyre Basin
and a vegetation condition report for the basin.
The assessment of the State of the Lake Eyre Basin is not a comprehensive substitute
for an assessment of the rivers (river network) of the basin, despite it being
undertaken with best available data and information at the time. Catchment and
river ecosystems are different entities. Despite being interlinked, they are primarily
shaped and controlled by different variables operating over different spatial and
temporal scales. Because of this they require separate strategies, study designs and
indicators for monitoring their respective states and conditions.

LEB Rivers Assessment Implementation Plan Report No.2: Proposed Methodology
25 | P a g e
5. Indicators to include in the Method for Assessing the Health of the LEB: some considerations
Selecting indicators
An important role for the river manager and river scientist in determining the
condition, health or resilience of river systems is to identify and employ appropriate
indicators. This task is often not easy as indicators must be unambiguous in terms of
their response to the threats to river health. Because environmental river processes
interact in complex ways the task of measuring river health is often difficult. Finding
a single robust, sensitive indicator is unlikely (Fairweather 1999) and some trade-offs
are needed. Occasionally, indicators may be chosen because they are `charismatic'
and it may be a species that has a high public profile (e.g. platypus) or is readily
associated with a sensitive high profile issue (e.g. cyanobacteria – blue green algae).
Indicators must be able to be validated.
In practice, the choice of an indicator, or group of indicators, often reflects personal
bias, technical considerations, and constraints of knowledge. There are three types of
indicators: those that are early warning indicators that signify impending decline in
health; compliance indicators that reveal deviations from acceptable limits; and
diagnostic indicators that show the causes of the deviations (Cairns and McCormick
1992). Most of the suite of indicators used by the various state jurisdictions for river
monitoring in the Lake Eyre Basin is for compliance purposes and not directly
applicable for use in assessing the condition of highly variable large systems.
Three contemporary approaches for selecting indicators of river health have been
identified by Fairweather (1999). The first group of approaches essentially represent
a haphazard selection of indicators from divergent perspectives, such as chemistry or
biology. Here the selection of indicators is based on personal biases of managers and
politicians. Second, there is the adoption of a single perspective that is either better
developed, favoured by circumstance or seen as an umbrella for protecting other
sets of values (e.g. the Australian River Assessment System – ‘AusRivAS’). Synthetic
approaches that integrate distinct perspectives, such as in the Sustainable Rivers
Audit of the Murray Darling Basin, represent the third group. Of these Fairweather
(1999) suggest the synthetic approach may best suit the current requirements of
determining river health in large, highly variable Australian river systems like those of
the Lake Eyre Basin. This type of approach requires a larger suite of variables to be
used and integrated but is heavily scale-dependent (Townsend and Riley 1999). The
selection of appropriate spatial and temporal scales for measures (indicators) of river
condition is crucial. Commonly, measurements are spot samples (e.g. concentration,
abundance, species richness) and the assessment of river health is based on changes

LEB Rivers Assessment Implementation Plan Report No.2: Proposed Methodology
26 | P a g e
in ecological processes. Many have commented that this is not appropriate in river
systems where process events operate at large spatial and temporal scales.
Indicators that have previously been recommended to be included in assessing the
condition of the Lake Eyre Basin are outlined in Table 2. These indicators are grouped
according to the components of hydrology, physical form of waterholes, biota and
water quality and landscape factors. It is pertinent to note that these indicators do
collect data at different scales and therefore provide data that may of may not be
relevant to the current condition of the river network within the Lake Eyre Basin
because of this.

LEB Rivers Assessment Implementation Plan Report No.2: Proposed Methodology
27 | P a g e
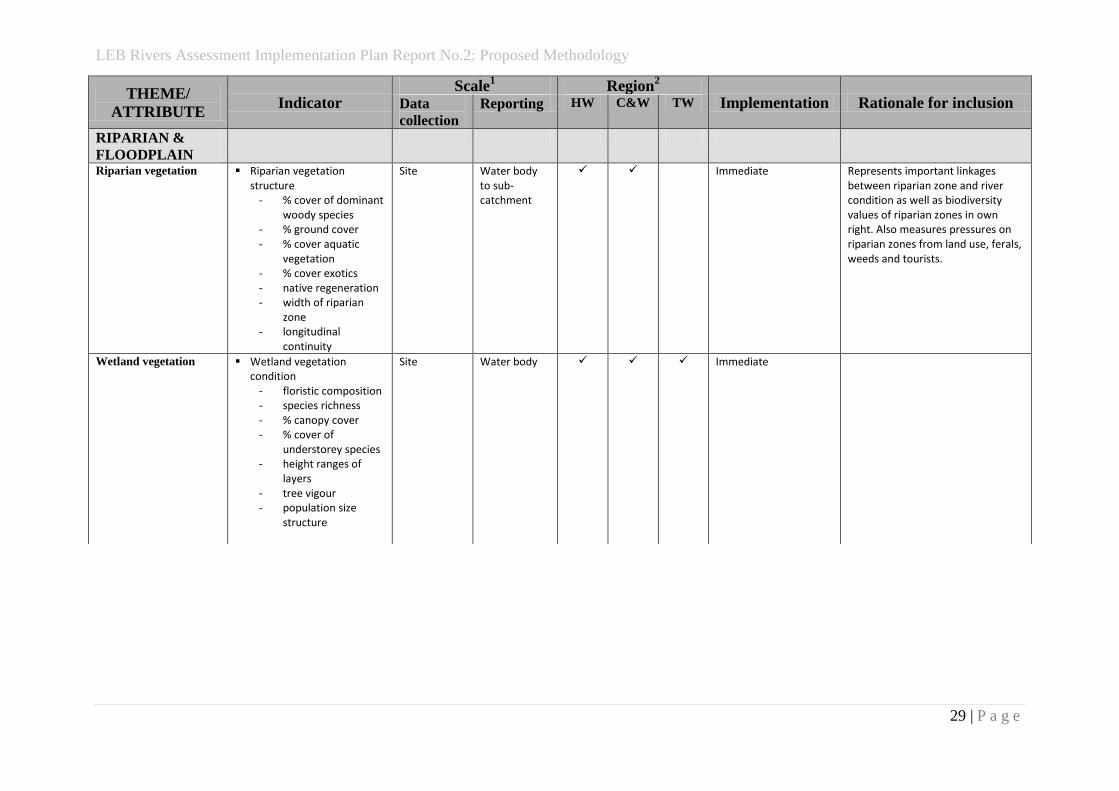
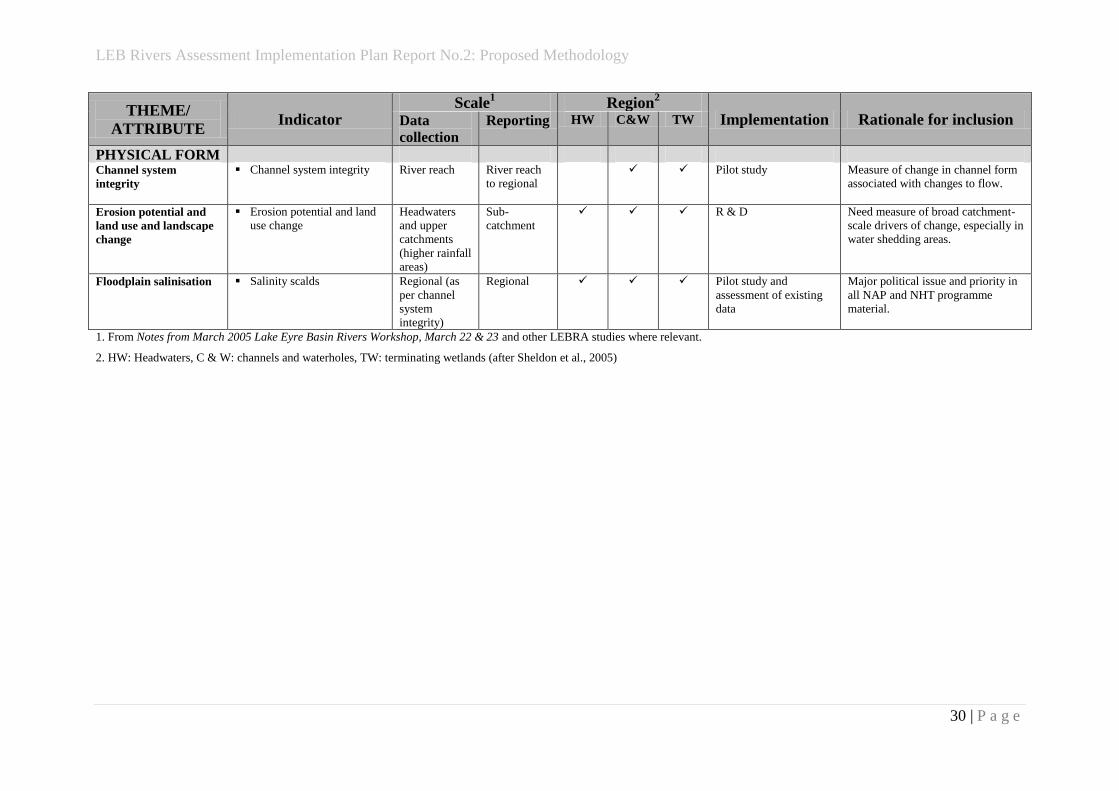
Table 2. Indicators previously recommended for the Lake Eyre Basin Rivers Assessment
THEME/
ATTRIBUTE Indicator
Scale1
Region2
Implementation Rationale for inclusion Data
collection
Reporting HW C&W TW
FLOW & FLOOD Water use Volume of water held in
storage
Whole basin Sub-
catchment
Immediate with pilot
study using existing
data
Fundamental driver of catchment
condition and function.
Percent of flow diverted Whole basin Sub-
catchment
Immediate with pilot
study using existing
data
Hydrological variability Flow variability Pilot study using
existing data
Waterhole depth Depth Site/waterhol
e
Waterhole Immediate
Importance of refugial waterholes to
water-dependent fauna.
Flood extent Flood extent
R & D
Alluvial groundwater Depth to alluvial
groundwater
Upper
Georgina
only (NT)
Upper
Georgina only
(NT)
Pilot study using
existing data

LEB Rivers Assessment Implementation Plan Report No.2: Proposed Methodology
28 | P a g e
THEME/
ATTRIBUTE Indicator
Scale1
Region2
Implementation Rationale for inclusion Data
collection
Reporting HW C&W TW
WATERHOLES &
WETLANDS
Waterhole & wetland
biodiversity
Fish assemblage diversity
- sp. richness
- abundance
- abundance of alien
sp.
- recruitment
- population size
structure
- abundance of
detritivores
- prevalence of
disease
Water body/
critical sites
Catchment,
sub-
catchment/
regional,
water body &
critical sites
Immediate and
assessment of existing
data
Community priority, iconic and
cultural asset. Good indicator of
ecosystem health.
Colonial water birds
diversity and breeding
- total abundance
- species richness
- abundance of
functional groups
- community
composition
- presence/absence of
selectedspecies
- abundance of
breeding birds
- species richness of
breeding birds
Breeding
colony
Breeding
colony
Immediate and
assessment of existing
data
Iconic group. Indicates ‘booms are
booming’.
Iconic species R & D
Cane toads R & D
Waterhole & wetland
water quality
Water quality
- conductivity
- pH
- DO
- turbidity
- water temperature
Water body Water body Immediate and
assessment of existing
data
Easy to measure for little extra cost.
Need to relate to biological trends.
Waterhole process &
function
Ecosystem processes Water body Water body Pilot study
LEB Rivers Assessment Implementation Plan Report No.2: Proposed Methodology
29 | P a g e
THEME/
ATTRIBUTE Indicator
Scale1
Region2
Implementation Rationale for inclusion Data
collection
Reporting HW C&W TW
RIPARIAN &
FLOODPLAIN
Riparian vegetation Riparian vegetation structure
- % cover of dominant woody species
- % ground cover - % cover aquatic
vegetation - % cover exotics - native regeneration - width of riparian
zone - longitudinal
continuity
Site Water body to sub-catchment
Immediate Represents important linkages between riparian zone and river condition as well as biodiversity values of riparian zones in own right. Also measures pressures on riparian zones from land use, ferals, weeds and tourists.
Wetland vegetation Wetland vegetation condition
- floristic composition - species richness - % canopy cover - % cover of
understorey species - height ranges of
layers - tree vigour - population size
structure
Site Water body Immediate
LEB Rivers Assessment Implementation Plan Report No.2: Proposed Methodology
30 | P a g e
THEME/
ATTRIBUTE Indicator
Scale1
Region2
Implementation Rationale for inclusion Data
collection
Reporting HW C&W TW
PHYSICAL FORM Channel system
integrity
Channel system integrity River reach River reach
to regional
Pilot study Measure of change in channel form
associated with changes to flow.
Erosion potential and
land use and landscape
change
Erosion potential and land
use change
Headwaters
and upper
catchments
(higher rainfall
areas)
Sub-
catchment
R & D Need measure of broad catchment-
scale drivers of change, especially in
water shedding areas.
Floodplain salinisation Salinity scalds Regional (as
per channel
system
integrity)
Regional Pilot study and
assessment of existing
data
Major political issue and priority in
all NAP and NHT programme
material.
1. From Notes from March 2005 Lake Eyre Basin Rivers Workshop, March 22 & 23 and other LEBRA studies where relevant.
2. HW: Headwaters, C & W: channels and waterholes, TW: terminating wetlands (after Sheldon et al., 2005)

LEB River Assessment Implementation Plan Project: Milestone 1 Report
31 | P a g e
Other factors to consider for the Lake Eyre Basin Rivers
Assessment
Recent advances in the area of Resilience and Strategic Adaptive Management have
implications for the Lake Eyre Basin River Assessment. Like much of the world,
Australian practices of terrestrial and aquatic ecosystem management have relied on
notions of an equilibrium state, where the focus has been on increasing or optimizing
efficiency and performance in order to deliver defined benefits, including supply or
sustainability. This paradigm continues despite the recognition of the enhanced
natural variability, in pattern and process, and its importance within Australia’s river
systems. Indeed, variability, unpredictability and resource scarcity are a feature of
the river network of the Lake Eyre Basin and are key components of the ‘dryland
syndrome’ (Stafford Smith et al., 2009) that characterise much of inland Australia.
Yet Australian river ecosystems are still under pressure and continue to degrade
under existing management practices. This is not surprising. Ecosystems are moving
targets characterized by episodic change, patchiness, cross-scale interaction and
multiple equilibria, or multiple stable states. Time and time again, ecosystems
managed for some type of equilibrium carrying capacity have been thwarted by
surprise events, changes in thresholds and market failures. Time and time again it
has been shown that optimizing efficiency to deliver a defined benefit does not lead
to sustainability, but rather to collapse. New ideas are required to improve the
management of Australian river and floodplain ecosystems. We suggest that such
ideas should consider emerging paradigms that move away from notions of optimal
efficiency for delivering a defined benefit, and consider rivers as complex social-
ecological systems characterised by variability, heterogeneity, adaptability, diversity,
multi-scaled dynamics, change and innovation in interacting social, economic and
ecological spheres.
Resilience thinking provides one umbrella under which to consider the sustainable
management of natural resources especially water. Resilience in terms of system
change, is the amount of change a system can undergo (its capacity to absorb
disturbance) and remain within the same regime that essentially retains the same
function, structure and feedbacks (Walker and Salt, 2006). The ability of an
ecosystem to absorb disturbance is a function of several properties: adaptive loops,
thresholds, slow variables, cross scale interactions, multiple states, regime shifts,
adaptability, transformation and adaptive management. In terms of river
assessment and monitoring it is the first building block which is important and this
pertains to the concepts of thresholds, multiple states, slow variables,
transformation and regime shifts.
Resilience thinking recognises that rivers change and do so naturally. Change is
driven by two types of variables – fast and slow variables. Current understanding of
LEB River Assessment Implementation Plan Project: Milestone 1 Report
32 | P a g e
thresholds between regime states in ecosystems suggest that although system
dynamics are driven by many variables operating at different scales, system
trajectories will be driven by a small set of controlling (or slow) variables. These
variables determine the boundaries beyond which disturbances may push the system
into another state. As such, changes in controlling variables must be the focus for a
regime shift across a threshold (Carpenter et al., 2001) and the primary focus for
monitoring, especially in highly variable systems. Some demonstrated examples of
controlling variables include land use, nutrient stocks, soil properties, river channel
morphology, vegetation pattern, biomass of long-lived organisms and biodiversity.
These types of variables are often slower than the types of variables that tend to be
monitored currently in many resource management programmes, which have
important implications for detecting the position and status of systems in relation to
thresholds.
Groffman et al. (2006) reviewed the utility of thresholds for environmental
management. There are three main applications of thresholds in environmental
management:
Analysis of surprising and dramatic shifts in ecosystem state – where a small
change in a driver causes a marked change in ecosystem condition. An example
is the switch from an oligotrophic clear water system dominated by sea grass to
a turbid system dominated by phytoplankton in Florida Bay.
The determination of critical loads – which represent the amount of pollutant
that an ecosystem can safely absorb before there is a change in ecosystem state
and/or in a particular ecosystem function. An example is emissions standards
for air pollutants.
Analysis of extrinsic factor thresholds – where change in a variable at a large
scale alters relationships between drivers and responses at a small scale. An
example is the threshold of incipient movement for streambed particles under a
certain velocity. Extrinsic factor thresholds are common in riverine ecosystems,
but we lack an understanding of how drivers interact to regulate ecological
responses or processes.
The identification of thresholds can be undertaken using a number of methods,
including statistical identification from empirical data (Scheffer and Carpenter, 2003;
Carpenter and Brock, 2006), rule-based modelling (Mackenzie et al., 1999) and
conceptual modelling (Rogers and Bestbier, 1997). In general, however, there is a
critical need for the development of variables and monitoring approaches that can
determine if an ecosystem is approaching a threshold (Groffman et al., 2006).
A form of Strategic Adaptive Management was developed over a number of years as
a local tool for the management of rivers within Kruger National Park, South Africa
(Biggs and Rogers, 2003). Strategic Adaptive Management offers a framework for

LEB River Assessment Implementation Plan Project: Milestone 1 Report
33 | P a g e
natural resource management and decision making in environmental, social and
institutional situations characterized by variability, uncertainty, incomplete
knowledge and multiple stakeholders. Three key tenets form the basis for the
management and decision-making process in Strategic Adaptive Management (SAM):
Strategic and value based - Purposeful and goal-directed, with the first step in
planning and management being the description of a desired future state of the
protected area based on scientific and societal needs and values;
Adaptive - In the face of uncertainty, management actions are treated as an
opportunity to learn by doing. Management is planned as a learning experience
and improves through frequent review of policy and action; and,
Participatory - Meaningfully involving all stakeholders to serve their needs,
access their inputs and secure their cooperation. Governing cooperatively with
other agencies to coordinate and integrate goals and actions (Rogers et al.,
2008).
Generation of a set of Thresholds of Potential Concern to define the acceptable
levels of change in ecosystem / biodiversity composition, structure and function is a
key component of monitoring and assessing the rivers of the park. Essentially, the
desired outcomes of management are expressed as limits of acceptable change –
termed Thresholds of Potential Concern. Thresholds of potential concern (TPCs) are
upper and lower levels of change in selected indicators.
Strategic Adaptive Management has been used to manage the rivers of Kruger
National Park. Within an overarching vision for the park, a biodiversity objective to
‘maintain biodiversity in all its facets and fluxes’ guides an ecosystem objective to
understand and manage the KNP as part of the lowveld savanna and its river
catchment areas in such a manner as to conserve and restore its varied natural
structure, function and composition over time and space, and its wilderness
qualities, through an approach integrating the different scales and types of
objectives’. The water in the landscape objective sits within the ecosystem objective
and aims to ‘develop an integrated understanding of non-terrestrial ecosystem
diversity and dynamics (including sub-surface water) and its links with terrestrial
systems, and to maintain the intrinsic biodiversity as an integral component of the
landscape and maintain or where necessary restore natural structure, function,
composition and processes’. Commensurate with the goals of these objectives, TPCs
have been set for the Sabie River to facilitate prediction and monitoring of
biodiversity in response to hydrology, sediment supply and water quality (Rogers and
Biggs, 1999). Geomorphological and vegetation indicators were developed to
indicate ecosystem response to the main agents of change. Thresholds of Potential
Concern that fall outside upper and lower limits of acceptable change are flagged
and investigated further.

LEB River Assessment Implementation Plan Project: Milestone 1 Report
34 | P a g e
What does all this mean for monitoring and the selection of indicators in the Lake
Eyre Basin? There are two points to consider. First, the selection of indicators must
focus on the ‘controlling variables’ that drive change. Variables that address land use,
vegetation patterns, channel morphology and relatively long live organisms such as
fish and water birds. Second, in the absence of a historical data base, monitoring
must be orientated to establish ‘threshold of potential concern’. The initial
development and selection of thresholds of potential concern can be guided from
reliable conceptual models.
Towards a thresholds approach: selecting indicators for the Lake
Eyre Basin
The Lake Eyre Basin River Assessment Project along with a host of other individual
studies in the Lake Eyre Basin have produced an extensive and detailed list of
indicators that could be used in a Lake Eyre Basin River Assessment Implementation
Plan. An important outcome of this review process is that there is no `holy grail' of
indicators of river health common to all riverine landscapes let alone the Lake Eyre
Basin. Ideal indicator variables have features that include ease of measurement and
relevance to river health, and can deliver early warning, or check compliance, or
diagnose causes of poor health. Sampling to evaluate the indicators must be as
stringent as any river science study and it is in the choice, scale, sampling and
analyses of these variables that is the key to their applicability and success of
determining the health of riverine landscapes. Issues of temporal and spatial scale
are crucial when collecting data and interpreting the results. Many river health issues
are directly related to the connectivity between rivers and their catchments,
floodplains and wetlands; therefore working at the landscape scale is the most
suitable. No single indicator alone is best and a synthetic approach that adopts a
group of relevant metrics may prove most effective.
Management of rivers in semi-arid and arid regions does pose special problems when
synthetic approaches are employed. This is because of the over-riding influence of
the highly variable river-flow regime. Enhanced natural variability within the Basin
has been used as an excuse in some jurisdictions to do as little as possible in terms of
monitoring. It is recommended that indicators of river health that are selected take
into account the scale of the Basin and its inherent flow variability and be used to
generate hypotheses about or define the limits of acceptable change in river
ecosystem structure and function. Monitoring for monitoring sake cannot be justified
and is not sustainable in the long term for efficient natural resource management.
Establishing a monitoring program that is orientated to establishing `Thresholds of
Probable Concern' or TPCs; (Rogers & Biggs 1999) provides a clear and concise
objective for monitoring and makes the choice of indicator (s) to be used in a whole
of basin assessment easier.

LEB River Assessment Implementation Plan Project: Milestone 1 Report
35 | P a g e
Careful choice of TPCs provides indicators of threats to river health in the Basin. In
Kruger National Park, for example, sedimentation threatens the biodiversity of
bedrock-controlled rivers so a TPC reflecting permissible rates of change in bedrock
in specific reaches is generated (Rogers & Biggs 1999). This approach extends to
other aspects of the rivers in the park and yields a subset of the possible criteria that
indicate threats to river health, resulting in a manageable number of indicators with
which to assess ecosystem condition relative to stated goals. Choice of indicator
must always be based on specific hypotheses of changes in response to threats.

LEB River Assessment Implementation Plan Project: Milestone 1 Report
36 | P a g e
6. Linkages with national monitoring, evaluation and reporting frameworks.
The Australian federal government and the various state and territory
governments have a history of investment in developing methods for and
assessing the health or condition of the nation’s streams, rivers and
watercourses. At the time of commencing the Lake Eyre Basin River Assessment
Methodology project there were several other national programs on river
health that were either in the final throes of completion, being developed or
just about to be implemented. A short summary of each of these is provided in
the following section in order to place the work done in a broader context of
river health assessment within Australia. Three particular programs are of direct
relevance to the Lake Eyre Basin River Assessment Methodology project; the
first National Assessment of River Health and its precursors undertaken within
the intensive land zone of Australia, the Sustainable Rivers Audit of river
systems within the Murray Darling Basin and the development of the First
Assessment of Wetlands and River Health, Australia.
The First National Assessment of River Health.
The first major investment in a river health program on Australia began with the
development and implementation of the First National Assessment of River
Health. This river health program focused on the in-channel environment and
relied upon the routine collection of water and biological (macro invertebrates)
samples and essentially provides a rapid assessment of the ‘health’ of rivers.
While aquatic biota have been widely recognised as good indicators of river
health and were a major focus of this assessment program, it is recognised that
catchment and habitat conditions are important drivers of river health and
these factors were not considered strongly in this program. The objectives of
this River Health Program were to:
Provide a sound information base on which to establish
environmental flows;
Undertake a comprehensive assessment of the health of inland
waters, identify key areas for the maintenance of aquatic and
riparian health and biodiversity, and identify stressed inland waters;
Consolidate and apply techniques for improving the health of inland
waters, particularly those identified as stressed; and
Develop community, industry, and management expertise in
sustainable water resources management and raise awareness of
environmental health issues and needs of our rivers.

LEB River Assessment Implementation Plan Project: Milestone 1 Report
37 | P a g e
The AUSRIVAS (Australian River Assessment System) was a key component of
the First National Assessment of River Health and one that has been
implemented either it is entirety or derivations, in many regions of Australia.
AUSRIVAS has two streams, Bioassessment and Physical assessment, that
correspond with rapid biological assessment protocols and rapid geomorphic,
physical and chemical assessment protocols respectively. There are different
bioassessment streams: Macroinvertebrates, Fish, Diatoms, Macrophytes and
Riparian Vegetation. Of these, the macroinvertebrate stream is the most highly
developed. There have been a number of derivatives of the approach including
the development of “Dirty Water Models” for streams in highly disturbed
landscapes. Essentially AUSRIVAS is a multivariate approach to river assessment
and like all methodologies has a number of advantages and disadvantages.
AUSRIVAS either samples and processes a variety of habitats separately or
focuses on only one habitat. In this way it avoids confounding differences due to
habitat representation with differences in community structure. The method
does have temporal replication which indicates a degree of stability between
years in only some regions. However, seasonal fluctuations are considered
important, and therefore autumn and spring models have been developed. The
methods have an objective procedure for matching environmental variables and
macroinvertebrate community structure.
Noted disadvantages of the method include O/E ratio cutoff for impairment
being arbitrary. This will require testing in other ecoregions like the Lake Eyre
Basin. Indeed, there are limited data for systems like those in the Lake Eyre
Basin that demonstrate how the O/E score responds to natural variability.
Research has shown that O/E score for rivers within the Lake Eyre Basin do have
considerable variability even in the absence of any major human disturbances.
This variability can only be attributed to natural changes in assemblages
associated with waterbodies drying. Thus there is a risk that AUSRIVAS only
detects severely degraded sites, particularly in large floodplain rivers such as
those of the Lake-Eyre Basin.
Since the inception of First National Assessment of River Health there has
followed a number of other similar programs, most notably the National Land
and Water Audit conducted in 2000.
National Land and Water Resources Audit
In 2000 the National Land and Water Resources Audit was commissioned to
assess the condition of rivers within the intensive land zone of Australia. It
provided an assessment of river condition (ARC) in terms of the environmental
and biological condition for more than 14 000 river reaches (average length 14
km) within 193 catchments (average area 13 500 km2) that covered most of the

LEB River Assessment Implementation Plan Project: Milestone 1 Report
38 | P a g e
Australian Capital Territory, New South Wales, Queensland, Victoria and
significant areas of South Australia, Western Australia and Northern Territory
(ASRIS 2001). The ARC assumes that a series of environment indices (ARCE)
measure important environmental drivers to which biota respond, with the
biota themselves being important measures of condition. Essentially the Biota
Index (ARCB) represents the response of biota to environmental changes and in
this audit it was calculated only using aquatic invertebrate data because there
was a widespread and consistently collected data set. Invertebrate data
collected at a site had been previously used extensively to assess the biological
health of Australian rivers. The ARCE was composed of four sub indices, these
being a Hydrological Disturbance Index; Suspended Sediment and Nutrient Load
Index, Habitat Index and a Catchment Disturbance Index. The ARCE was used for
general assessment and the sub-indices for more specific interpretation of the
physical condition. All indices were calculated at the scale of river ‘reach’,
defined on geomorphological principles. Details of the approach taken,
development of methods, their application, analysis, and the preliminary
interpretation of results are provided in Norris et al (2007).
The Sustainable Rivers Audit of the Murray Darling Basin
The Sustainable Rivers Audit (SRA) is a program designed to measure the health
of the rivers at this large Basin scale. It aims to:
determine the ecological condition and health of river valleys in the
Murray-Darling Basin;
provide a better insight into the variability of river health indicators
across the Basin and over time;
eventually help us detect trends in river health over time; and
trigger changes to natural resource management by providing a
more comprehensive picture of river health than is currently
available.
The SRA was initiated by the Murray-Darling Basin Commission involving
partner agencies in each state and territory within the Basin. It uses scientific
indicators of health to determine the current status of the Basin's rivers and any
potential trends. Groups of indicators or “themes” for immediate
implementation include fish, macroinvertebrates and hydrology. Indicator
themes to be further developed over the forthcoming years include floodplains;
riparian vegetation and the physical form of river channels. Fish communities
and populations are sampled during normal flow conditions, across entire river
valleys in the one season, and once every three years at all 23 valleys in the
Basin. Macroinvertebrate populations are also be sampled during normal flow

LEB River Assessment Implementation Plan Project: Milestone 1 Report
39 | P a g e
conditions, across entire river valleys in the one season, but once every two
years across the Basin. Hydrology information is also collected every six years
and evaluated using long term river flow sequences developed by the States.
When there are major changes to river flows through new structures being built
or environmental flow allocations, additional computer modelling will be
needed. The assessment and interpretation of the SRA's results are done by an
Independent Sustainable Rivers Audit Group (ISRAG) which reviews data from
each valley in detail by looking at results related to each indicator theme (fish,
macroinvertebrates, hydrology); across indicator themes; across valleys; and
over time.
Framework for the Assessment of River and Wetland Health
The National Water Commission has developed a national framework that aims
to form the basis of future national river and wetland health assessments, and
to provide the capacity to bring together results of existing broad-scale
assessments conducted at state, territory and basin scales.
Understanding the environmental condition of Australia's aquatic ecosystems is
central to their management. The Framework for the Assessment of River and
Wetland Health (FARWH) was developed when scoping undertaken for the
Australian Water Resources 2005 baseline assessment identified difficulties in
reporting on river and wetland health in a comparable manner within and
across jurisdictions, and deficiencies in the level of information available for
current NWI reporting requirements.
The FARWH aims to:
develop an approach that can be used by the Australian
Government and all states and territories to provide nationally
comparable assessments of river and wetland health;
incorporate a critical suite of river and wetland attributes that
indicate key ecological processes and are conceptually appropriate
for comprehensive assessments of river and wetland health; and
interpret and prioritise the causes of observed environmental
degradation using the measured attributes.
The FARWH does not generate data itself or replace existing monitoring and
assessment programs. Rather, it provides a methodology to integrate and
aggregate the data collected by the states and territories to be reported at a
water management area scale. This provides an important link between aquatic
ecosystem health and water management planning. It has also been designed
to ensure that the outputs from previously conducted and future monitoring

LEB River Assessment Implementation Plan Project: Milestone 1 Report
40 | P a g e
and assessment activities in the states and territories are nationally
comparable.
The FARWH uses a conceptual model of river and wetland function, based on six
ecologically significant components that should be represented in all future
river and wetland health assessments. These key ecological components are:
catchment disturbance;
hydrological change;
water quality and soils;
physical form;
fringing zone; and
aquatic biota.
The Australian Rangelands Information System
The Australian Rangelands Information system is based on four key types of
information
1. changes in biophysical resources (eg. Nutrients, water, plants and
wildlife);
2. changes in impacts on these biophysical resources (eg. Trends in land
use intensity, climate and fire history, land clearing, spread of
weeds);
3. trends in social and economic factors; and
4. institutional responses.
Landsat satellite data for vegetation cover is a particular relevant tool from the
Australian Rangelands Information System Operational Manual seen as
potentially useful in ephemeral river catchments. This involves the use of
Landsat MSS and TM data to indicate change in the capacity of landscapes to
conserve resources. The method employs a landscape-cover change analysis
measuring changes in the trend of a cover index (such as perennial species vs.
bare ground) or changes in the variability of cover over time (such as perennial
species vs. annual species). The method is an extremely useful approach for
determining floodplain and catchment scale indicators of ecosystem health.
The Index of Stream Condition (ISC)
The Index of Stream Conditions (ISC) was developed in Victoria as a tool to
assist the management of Victoria’s waterways. It was designed to assess the

LEB River Assessment Implementation Plan Project: Milestone 1 Report
41 | P a g e
“health” or condition of rural streams, with results reported approximately
every 5 years for stream reaches of lengths between 10 and 30 kilometres long.
For each stream reach the ISC provides a summary of the extent of changes to:
hydrology (flow volume and seasonality);
physical Form (stream bank and bed condition, presence of, and
access to, physical habitat);
streamside zone (quantity and quality of streamside vegetation and
condition of billabongs);
water quality (nutrient concentration, turbidity, salinity and acidity);
and
aquatic life (diversity of macroinvertebrates).
The ISC was intended to provide measures of the health of both the aquatic
biota and the drivers that may impact on this health. The following sub-indices
are included in the overall condition index.
Hydrology Sub-Index
This sub-index had the following indicators:
The Annual Proportional Flow Deviation
Flow variation due to a change in catchment permeability
Flow variation due to peaking hydroelectric stations
Water Quality Sub-Index
This sub-index had the following indicators:
Total phosphorous
Turbidity
Salinity / Conductivity
Alkalinity / Acidity (pH)
Physical Form Sub-Index
This sub-index had the following indicators:
Bank and bed stability
Impact of artificial barriers on fish migration
Instream physical habitat
Aquatic Life Sub-Index
This sub-index had the following indicators:
AUSRIVAS Scores
SIGNAL Scores
Streamside Zone Sub-Index
This sub-index had the following indicators:
Width of streamside zone
Longitudinal continuity
Structural intactness

LEB River Assessment Implementation Plan Project: Milestone 1 Report
42 | P a g e
Cover of exotic vegetation
Regeneration of indigenous woody vegetation
Billabong condition
The inclusion of both pressure and response indicators makes the ISC is
appealing for many assessment studies. However, the ISC has only one
component measuring the aquatic life of rivers systems; that being
macroinvertebrates. These are not the ideal biotic monitor for the large, highly
variable rivers systems like those in the Lake Eyre Basin.
Integrated Monitoring of Environmental Flows (IMEF)
IMEF was established by the former New South Wales Department of Land and
Water Conservation to provide an understanding of the response of seven
major rivers and associated floodplains and wetlands to the provision of
environmental water allocations.
The objectives of the IMEF were to:
investigate the relationships between water regimes, biodiversity
and ecosystem processes in the major regulated rivers systems of
NSW and the Barwon-Darling River;
assess responses in hydrology, habitats, biota and ecological
processes associated with specific flow events targeted by
environmental flow rules, and
use the resulting knowledge to estimate likely long-term effects of
environmental flow rules and provide information to assist in future
adjustment of rules.
Variables suggested for measurement were:
Flow volume (use of gauge data) Organic matter (dissolved and
particulate organic carbon)
Wetted Area (surveying, satellite
data)
Cyanobacteria (chlorophyll a)
Current velocity (hydraulic current
meters)
Bioflims (floristic analysis; pigment
analysis)
Channel Morphology (surveying) Water plants (transect / Quadrat
surveys)
Temperature Invertebrates (sweep and kick nets)
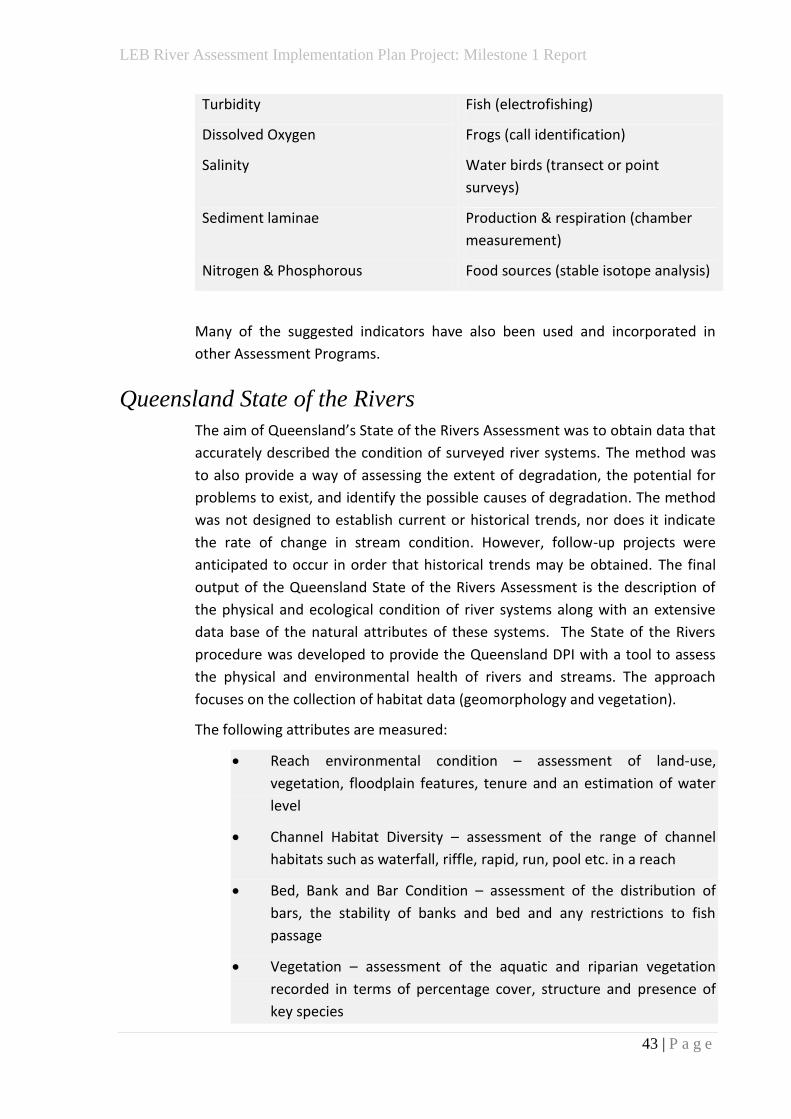
LEB River Assessment Implementation Plan Project: Milestone 1 Report
43 | P a g e
Turbidity Fish (electrofishing)
Dissolved Oxygen Frogs (call identification)
Salinity Water birds (transect or point
surveys)
Sediment laminae Production & respiration (chamber
measurement)
Nitrogen & Phosphorous Food sources (stable isotope analysis)
Many of the suggested indicators have also been used and incorporated in
other Assessment Programs.
Queensland State of the Rivers
The aim of Queensland’s State of the Rivers Assessment was to obtain data that
accurately described the condition of surveyed river systems. The method was
to also provide a way of assessing the extent of degradation, the potential for
problems to exist, and identify the possible causes of degradation. The method
was not designed to establish current or historical trends, nor does it indicate
the rate of change in stream condition. However, follow-up projects were
anticipated to occur in order that historical trends may be obtained. The final
output of the Queensland State of the Rivers Assessment is the description of
the physical and ecological condition of river systems along with an extensive
data base of the natural attributes of these systems. The State of the Rivers
procedure was developed to provide the Queensland DPI with a tool to assess
the physical and environmental health of rivers and streams. The approach
focuses on the collection of habitat data (geomorphology and vegetation).
The following attributes are measured:
Reach environmental condition – assessment of land-use,
vegetation, floodplain features, tenure and an estimation of water
level
Channel Habitat Diversity – assessment of the range of channel
habitats such as waterfall, riffle, rapid, run, pool etc. in a reach
Bed, Bank and Bar Condition – assessment of the distribution of
bars, the stability of banks and bed and any restrictions to fish
passage
Vegetation – assessment of the aquatic and riparian vegetation
recorded in terms of percentage cover, structure and presence of
key species

LEB River Assessment Implementation Plan Project: Milestone 1 Report
44 | P a g e
Aquatic Habitat – assessment of the diversity of in-stream habitat
types (eg. Logs, branches, substrate etc).
Scenic, recreational and conservation values – assessment of the
recreational opportunities, scenic quality and conservation status of
the stream
Considerations for monitoring and evaluating
Monitoring programs need to be specifically developed or modified for use in
arid zone rivers, like those within the Lake Eyre Basin, because of their naturally
high levels of hydrological variability and associated high degree of spatial
heterogeneity in biophysical character. Any monitoring program is dependent
on the researcher having first articulated the desired state to which the system
should conform. Within arid zone river systems ‘state’ will by necessity be a
dynamic state with a range of characters, populations or communities over
space and time. Thus any monitoring of arid zone river systems will require
knowledge of the system’s attributes and behaviour (structure, composition,
function and dynamics), either gained through intensive prior study (baseline
surveys) or through modelling (which itself must be based on a combination of
sound theory and intensive study of comparable systems elsewhere).
It is evident that at the time of development there was no program or method
specifically available to assess the condition of rivers within the Lake Eyre Basin.
Indeed, as further demonstrated by the results of two significant aquatic
research programs conducted on the river systems of the Lake Eyre Basin
(Aridflow and the CRC for Freshwater Ecology’s Dryland Refugia Program),
important components of a sound adaptive management cycle must include
theory-driven hypothesis articulation (conceptual models of river function,
health and predicted responses); focussed study (gap identification, data
acquisition, information gain); indicator selection; target setting (incorporating
ecosystem modelling); and monitoring of selective indicators. In this way the
twin objectives of (i) increasing understanding of how and why ecosystems
function, and (ii) refinement of indicators and their expected response to
drivers of change, can be met through time with each repetition of the
management cycle.

LEB River Assessment Implementation Plan Project: Milestone 1 Report
45 | P a g e
7. Monitoring actions that can be undertaken immediately
The following outlines those monitoring actions that can be undertaken
immediately and the methods for the collection of these data. It is pertinent to
note that the components recommended represent a combination of
‘controlling or slow variables’, ‘responding or fast variables’ and potential
drivers of change that can be used to assess resilience of the river ecosystems
within the Lake Eyre Basin. This list does not represent as exhaustive list as
there is much Research and Development to be undertaken. The six
components recommended are Physical Habitat, Fish, Waterbirds, Riparian
Vegetation (controlling variables), Water Quality (responding or fast variable)
and Hydrology (both a driver of change and a controlling variable). In order for
hydrology to be used as a controlling variable, a catchment based hydrological
model would need to be constructed. This hydrological model would then
enable the effects of climate and land use to be assessed on the spatial and
temporal availability of water through out the Lake Eyre Basin. Detailed for
each of these six components are:
the value and pressures to the component
drivers and risks to the component as well as management actions to
be taken
a list of indicators for each component
recommended sampling methods, including frequency and scale of
sampling
analysis and reporting methods and the costs of undertaking this
monitoring exercise.

LEB River Assessment Implementation Plan Project: Milestone 1 Report
46 | P a g e
Fish assemblage diversity indicator
(Waterholes and wetlands theme, Waterholes and Wetland Biodiversity Attribute)
Acknowledgements
Stephen Balcombe, ARI, Griffith University
Values
iconic element
cultural significance
indicator of cumulative aquatic ecosystem condition
Pressures, drivers, risks and management actions
Table 3: Links with pressures, drivers, risks and actions: Fish assemblage set
Pressure /
driver / risk Potential impacts Level of risk
Water resource development
floodplain
harvesting
creation of barriers to fish movement across
floodplain channels
High
damming reduced habitat complexity of waterholes
reduced connectivity between waterholes
form barriers fish movement
High
water
extraction
alterations to amount and quality of habitat
removal of juvenile life stages
Moderate - High
pumping from
shallow
groundwater
alterations to amount and quality of habitat
removal of juvenile life stages
Moderate - High
Grazing
floodplain
grazing during
dry phase
altered water quality (increased nutrients)
reductions in primary productivity through
trampling of algal ‘bath-tub ring’
Moderate
total grazing on
floodplain
altered soil structure, nutrient content and
vegetation may influence amount & quality
of food for fish on re-flooding.
changes to amount and quality of nursery
habitat in riparian and floodplain areas
Moderate
Tourism
tourism during
dry phase
increased nutrient inputs
removal of woody debris and vegetation
(for firewood)
Moderate
recreational
fishing
reductions in refugial fish stocks and
potential to re-populate satellite waterholes
following flows/floods
removal of large-bodied adults and
recruitment potential
use of non-LEB live bait may introduce
alien fish and invertebrates
Moderate

LEB River Assessment Implementation Plan Project: Milestone 1 Report
47 | P a g e
Pressure /
driver / risk Potential impacts Level of risk
Fishing
overfishing reductions of refugial fish stocks Moderate
introduced
species
shifts in fish assemblages Moderate
failure to
recognise key
species, e.g.
Cooper catfish,
Finke goby and
Finke
hardyhead.
shifts in fish assemblages Low - Moderate
translocation of
native fish from
other basins
shifts in fish assemblages Low - Moderate
Other
road crossings
and culverts
local threat to fish assemblages and
ecological functioning of waterholes
Low
toxic impacts of
stock
vaccination via
faeces
reductions in water quality Uncertain at present
feral animals as for grazing Uncertain at present
climate change altered ecological functioning of waterholes Moderate - High
(Sourced from information in McNeil et al. 2006)
Alignment with national reporting frameworks
1. FARWH
Aquatic biota index
2. National Framework for NRM Standards and Targets
Fish community assemblages (Integrity of inland aquatic ecosystems
(rivers and other wetlands): river condition)
Significant native species and ecological communities
Ecologically significant invasive species
Specific indicators
Table 4: Specific indicators for Fish Assemblages set
Indicator Links to pressures/drivers/risks
Species richness - overall indicator of fish assemblage condition
- narrow range but should be relatively stable at regional and within-
catchment scales
- changes indicate anthropogenic disturbance
Abundance - broad ranges and sensitive to antecedent flow conditions
- increases indicate recruitment
- decrease indicate mortality during disconnection phase
Abundance of alien
species
- narrow range and relatively stable
- increases indicate changed conditions (e.g. increase number of weirs
pools)
- increased number of species indicates new introductions (eg.

LEB River Assessment Implementation Plan Project: Milestone 1 Report
48 | P a g e
Indicator Links to pressures/drivers/risks
common carp & tilapia)
Recruitment - indicates successful spawning
- broad range depending on antecedent flow conditions
- absence of recruitment in most species in any year should indicate
anthropogenic disturbance
Population size
structure
- indicator of past recruitment
- truncated length frequencies may indicate fishing pressure
Abundance of
detritivores
- sensitive to antecedent flow conditions
Prevalence of
disease
- may be useful as warning of poor waterhole condition
(Sourced from information in McNeil et al. 2006)
Sampling
Sampling methods
A combination of seine, fyke and dip nets may be used depending on the
amount of surface water present at the time of survey (McNeil & Reid, 2008).
Standard mesh sizes and inlet diameters should be selected and fyke nets
should be set overnight (c. 15 hours). Fish from emptied nets should be
identified to species, measured (standard length in mm), visually inspected for
signs of external disease and returned to the water alive.
Water quality parameters should be measured in conjunction with fish sampling
(see below).
Sampling frequency
Sampling should be conducted twice a year; once near the end of the dry
season (November) and once after the wet season recedes (March/April). This
will enable assessment of fish assemblage resistance, i.e. tolerance of dry and
disconnected conditions, and resilience, i.e. response to flows or floods (McNeil
et al. 2006).
Spatial scale of sampling
The spatial arrangement of sites should be broadly based on recommendations
provided by Sheldon et al. (2005) with each catchment divided into 3 regions as
appropriate; Headwaters, River Channels & Waterholes and Terminating
Wetlands. Sheldon et al. (2005) recommend a minimum of i) 20 sites across all
of the headwater zones of the Thompson, Barcoo, Georgina and Diamantina
Rivers, ii) 50 sites across the River Channels & Waterholes zone of the Cooper
channel country, lower Cooper, Diamantina channel country, lower Diamantina
and the western rivers, including the Neales, and iii) 10 terminal wetland sites
including Lake Galilee, Buchanan and Yamma Yamma in Queensland and Lakes
Frome, Blanche and Eyre in South Australia.
Sampling should be conducted from waterbodies (or sites) within
representative reaches that comprise a permanent waterhole (persistently
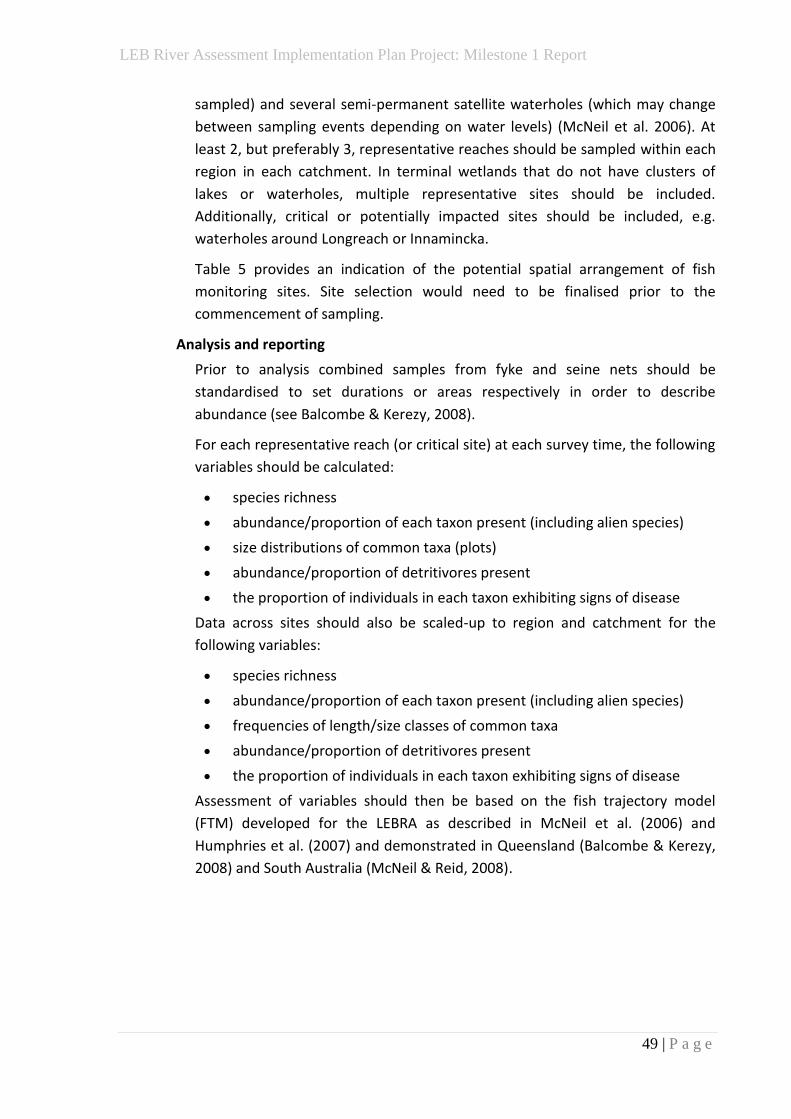
LEB River Assessment Implementation Plan Project: Milestone 1 Report
49 | P a g e
sampled) and several semi-permanent satellite waterholes (which may change
between sampling events depending on water levels) (McNeil et al. 2006). At
least 2, but preferably 3, representative reaches should be sampled within each
region in each catchment. In terminal wetlands that do not have clusters of
lakes or waterholes, multiple representative sites should be included.
Additionally, critical or potentially impacted sites should be included, e.g.
waterholes around Longreach or Innamincka.
Table 5 provides an indication of the potential spatial arrangement of fish
monitoring sites. Site selection would need to be finalised prior to the
commencement of sampling.
Analysis and reporting
Prior to analysis combined samples from fyke and seine nets should be
standardised to set durations or areas respectively in order to describe
abundance (see Balcombe & Kerezy, 2008).
For each representative reach (or critical site) at each survey time, the following
variables should be calculated:
species richness
abundance/proportion of each taxon present (including alien species)
size distributions of common taxa (plots)
abundance/proportion of detritivores present
the proportion of individuals in each taxon exhibiting signs of disease
Data across sites should also be scaled-up to region and catchment for the
following variables:
species richness
abundance/proportion of each taxon present (including alien species)
frequencies of length/size classes of common taxa
abundance/proportion of detritivores present
the proportion of individuals in each taxon exhibiting signs of disease
Assessment of variables should then be based on the fish trajectory model
(FTM) developed for the LEBRA as described in McNeil et al. (2006) and
Humphries et al. (2007) and demonstrated in Queensland (Balcombe & Kerezy,
2008) and South Australia (McNeil & Reid, 2008).
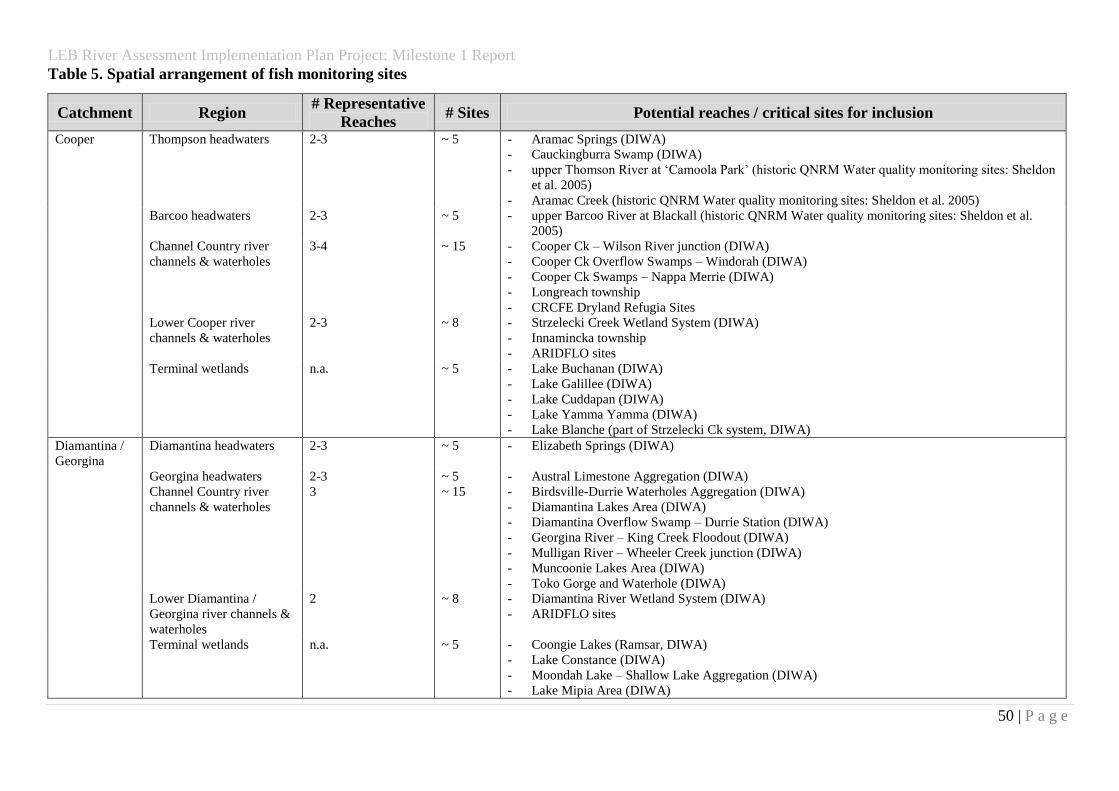
LEB River Assessment Implementation Plan Project: Milestone 1 Report
50 | P a g e
Table 5. Spatial arrangement of fish monitoring sites
Catchment Region # Representative
Reaches # Sites Potential reaches / critical sites for inclusion
Cooper Thompson headwaters 2-3 ~ 5 - Aramac Springs (DIWA)
- Cauckingburra Swamp (DIWA)
- upper Thomson River at ‘Camoola Park’ (historic QNRM Water quality monitoring sites: Sheldon
et al. 2005)
- Aramac Creek (historic QNRM Water quality monitoring sites: Sheldon et al. 2005)
Barcoo headwaters 2-3 ~ 5 - upper Barcoo River at Blackall (historic QNRM Water quality monitoring sites: Sheldon et al.
2005)
Channel Country river
channels & waterholes
3-4 ~ 15 - Cooper Ck – Wilson River junction (DIWA)
- Cooper Ck Overflow Swamps – Windorah (DIWA)
- Cooper Ck Swamps – Nappa Merrie (DIWA)
- Longreach township
- CRCFE Dryland Refugia Sites
Lower Cooper river
channels & waterholes
2-3 ~ 8 - Strzelecki Creek Wetland System (DIWA)
- Innamincka township
- ARIDFLO sites
Terminal wetlands n.a. ~ 5 - Lake Buchanan (DIWA)
- Lake Galillee (DIWA)
- Lake Cuddapan (DIWA)
- Lake Yamma Yamma (DIWA)
- Lake Blanche (part of Strzelecki Ck system, DIWA)
Diamantina /
Georgina
Diamantina headwaters 2-3 ~ 5 - Elizabeth Springs (DIWA)
Georgina headwaters 2-3 ~ 5 - Austral Limestone Aggregation (DIWA)
Channel Country river
channels & waterholes
3 ~ 15 - Birdsville-Durrie Waterholes Aggregation (DIWA)
- Diamantina Lakes Area (DIWA)
- Diamantina Overflow Swamp – Durrie Station (DIWA)
- Georgina River – King Creek Floodout (DIWA)
- Mulligan River – Wheeler Creek junction (DIWA)
- Muncoonie Lakes Area (DIWA)
- Toko Gorge and Waterhole (DIWA)
Lower Diamantina /
Georgina river channels &
waterholes
2 ~ 8 - Diamantina River Wetland System (DIWA)
- ARIDFLO sites
Terminal wetlands n.a. ~ 5 - Coongie Lakes (Ramsar, DIWA)
- Lake Constance (DIWA)
- Moondah Lake – Shallow Lake Aggregation (DIWA)
- Lake Mipia Area (DIWA)

LEB River Assessment Implementation Plan Project: Milestone 1 Report
51 | P a g e
Catchment Region # Representative
Reaches # Sites Potential reaches / critical sites for inclusion
- Lake Phillipi (DIWA
- Lake Torquinie Area (DIWA)
- Lake Eyre (DIWA)
Western
Rivers
Channels & waterholes 1-2 ~ 4
Terminating wetlands 1-2 n.a. - Lake Frome (Inland Saline Lakes: DIWA)
Total # sites in headwater regions ~ 20
Total # sites in river channels & waterholes region ~ 50
Total # sites in terminating wetlands ~ 12
TOTAL # sites ~ 82
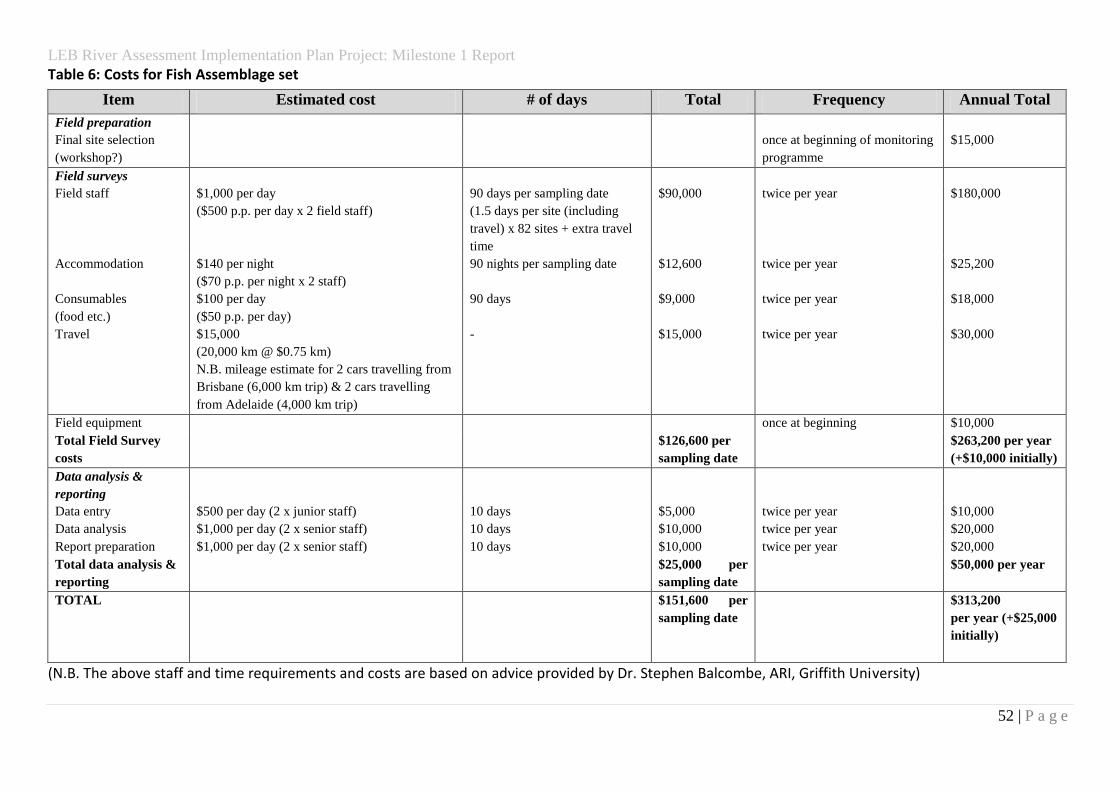
LEB River Assessment Implementation Plan Project: Milestone 1 Report
52 | P a g e
Table 6: Costs for Fish Assemblage set
Item Estimated cost # of days Total Frequency Annual Total
Field preparation
Final site selection
(workshop?)
once at beginning of monitoring
programme
$15,000
Field surveys
Field staff $1,000 per day
($500 p.p. per day x 2 field staff)
90 days per sampling date
(1.5 days per site (including
travel) x 82 sites + extra travel
time
$90,000
twice per year $180,000
Accommodation $140 per night
($70 p.p. per night x 2 staff)
90 nights per sampling date $12,600 twice per year $25,200
Consumables
(food etc.)
$100 per day
($50 p.p. per day)
90 days $9,000 twice per year $18,000
Travel $15,000
(20,000 km @ $0.75 km)
N.B. mileage estimate for 2 cars travelling from
Brisbane (6,000 km trip) & 2 cars travelling
from Adelaide (4,000 km trip)
- $15,000 twice per year $30,000
Field equipment once at beginning $10,000
Total Field Survey
costs
$126,600 per
sampling date
$263,200 per year
(+$10,000 initially)
Data analysis &
reporting
Data entry $500 per day (2 x junior staff) 10 days $5,000 twice per year $10,000
Data analysis $1,000 per day (2 x senior staff) 10 days $10,000 twice per year $20,000
Report preparation $1,000 per day (2 x senior staff) 10 days $10,000 twice per year $20,000
Total data analysis &
reporting
$25,000 per
sampling date
$50,000 per year
TOTAL $151,600 per
sampling date
$313,200
per year (+$25,000
initially)
(N.B. The above staff and time requirements and costs are based on advice provided by Dr. Stephen Balcombe, ARI, Griffith University)

LEB River Assessment Implementation Plan Project: Milestone 1 Report
53 | P a g e
Colonial waterbirds diversity and breeding indicator
(Waterholes and wetlands theme, Waterholes and Wetland Biodiversity Attribute)
Acknowledgements:
John Porter, Australian Rivers & Wetlands Group, University of New South Wales
Values
iconic element
cultural and political significance
indicator of broad-scale environmental health
existence of long-term data sets for trends-based analyses
Pressures, drivers, risks and management actions
Table 7: Links with pressures, drivers, risks and actions: Waterbird set
Pressure / driver / risk Potential impacts Level of risk
Water resource development
reduction of flows to wetlands reductions in waterbird
abundance, diversity
and breeding
Moderate - High
reduced durations and depths of
wetland flooding
reductions in waterbird
abundance, diversity
and breeding
Moderate - High
conversion of floodplain lakes to
storages
reductions in waterbird
abundance, diversity
and breeding
Moderate - High
Grazing
vegetation management (e.g. lignum
burning, clearing)
reduced quantity and
quality of nesting
habitat
Moderate
Tourism
tourism during dry phase disturbance of
waterbirds at refugial
sites
Low
Other
invasive species potential colonisation
of wetland habitats
and reduction of
primary productivity
and food availability
Low - Moderate
climate change altered ecological
functioning of
wetlands
Moderate - High
(Sourced from information in Kingsford & Porter 2008)
Alignment with national reporting frameworks
1. FARWH

LEB River Assessment Implementation Plan Project: Milestone 1 Report
54 | P a g e
Aquatic biota index
2. National Framework for Natural Resource Management Standards and Targets
Significant native species and ecological communities
Ecologically significant invasive species
Specific indicators
Table 8: Specific indicators for Waterbird set
Indicator Links to pressures/drivers/risks
total abundance of colonial
waterbirds
- overall indicator of waterbird assemblage condition
- changes may indicate altered water quality or flow regime
species richness of colonial
waterbirds
- reflects changes in flooding regime
abundance of functional
groups of waterbirds
- reflects changes in flooding regime
- reflects condition of habitat and food supply
community composition - overall indicator of waterbird assemblage condition
- changes may indicate altered water quality or flow regime
presence/absence of particular
species (e.g. threatened
species)
- reflects changes in flooding regime
abundance of breeding birds - sensitive to antecedent flow conditions
- reflects condition of habitat, e.g. lignum and reed swamps
species richness of breeding
birds
- sensitive to antecedent flow conditions
- reflects condition of habitat, e.g. lignum and reed swamps
(Sourced from information in Kingsford & Porter 2008)
Existing monitoring
The Aerial survey of waterbirds in eastern Australia, currently managed by NSW
DECC and executed by the Australian Rivers and Wetlands Group at the University of
New South Wales, has been conducted annually in October since 1983. One of the
ten 30 km wide survey bands passes through Lake Eyre and the lower Cooper and
some other significant wetlands in the eastern part of the basin, e.g. Lake Galilee, are
also covered by this survey. A list of other waterbird monitoring data from historical
surveys, mostly at finer spatial resolutions, is provided in Kingsford and Porter
(2008).
Sampling
Sampling methods
Waterbirds should be monitored using aerial surveys following the existing
methodology currently employed in the ongoing Aerial survey of waterbirds in
eastern Australia (see Kingsford & Porter 2008 for a summary). Kingsford & Porter
(2008) also recommend monitoring of key breeding events using additional on-
ground surveys. Whilst likely to be very valuable and informative, these are
considerably more expensive than aerial surveys and are not included in this initial
proposal for immediate monitoring.

LEB River Assessment Implementation Plan Project: Milestone 1 Report
55 | P a g e
Sampling frequency
Aerial surveys should be conducted once a year during the spring period (October)
and more frequently in years with significant flow events. It is recommended that the
current eastern aerial survey which is conducted in October be extended to
incorporate wetlands of known significance for waterbirds in the parts of the Lake
Eyre Basin not currently covered by the survey. In wet years, it is proposed that an
additional stand-alone aerial survey of flooded wetlands in the basin also be
undertaken in order to monitor breeding colonies. This would be best conducted a
month or two following maximum wetland inundation, e.g. March or April. The
proposed timing of these surveys would also allow comparisons between waterbird
and fish monitoring data.
Spatial scale of sampling
Waterbirds should be monitored at the wetland scale. Wetlands significant to
waterbirds in the Lake Eyre Basin are reasonably well known (pers comm. John
Porter) from previous aerial surveys, e.g. eastern aerial survey, 2008 National
Waterbirds Survey and additional surveys within the basin as listed in Kingsford and
Porter (2008). The survey would concentrate on wetlands listed in the Directory of
Important Wetlands (see Table X above) and those known to support high
concentrations of waterbirds following inundation, e.g. Lake Eyre, Lake Galilee, Lake
Hope, Lakes Torquinie and Mubmleberry, Lake Machattie, Lakes Koolivoo and Mippia
(Kingsford & Porter, 2008).
Analysis and reporting
Analysis and reporting could be done at wetland, catchment and whole-of-basin
scales.
Costs
The following costs have been developed in consultation with Dr. John Porter of the
Australian Rivers & Wetlands Unit at the University of NSW.

LEB River Assessment Implementation Plan Project: Milestone 1 Report
56 | P a g e
Table 9: Costs for Waterbirds set
Item Estimated cost Annual Total
Expansion of existing eastern aerial waterbird survey (October annually)
Aircraft & pilot $450 hr x approx. x ~ 30 hrs (+30 % multiplier) $17,550
Project coordinator
(0.5 FTP – surveys, data entry,
analysis & reporting)
$60,00 (+ 30 % multiplier) $78,000
Survey staff $1000 p.p. per day x 2 staff members x 3 days (+ 30 % multiplier)
(salary and travel expenses)
$7,800
Total for expansion of existing survey $103,350
Stand-alone survey in wet years (March/April)
Aircraft & pilot $450 hr x approx. x ~ 96 hrs (+30 % multiplier) $56,160
Project coordinator
(0.5 FTP – surveys, data entry,
analysis & reporting)
already covered by expansion of existing survey (above) $0
Survey staff $1000 p.p. per day x 2 staff members x 12 days (+ 30 % multiplier)
(salary and travel expenses)
$31,200
Total for expansion of existing survey $103,350 $87,360
TOTAL in dry year
in wet year
$103,350
$190,710

LEB River Assessment Implementation Plan Project: Milestone 1 Report
57 | P a g e
Riparian vegetation structure indicator
(Riparian and floodplain theme, Riparian and Floodplain Biodiversity Attribute)
Values
iconic
social and cultural significance
economic importance
significant for ecosystem function
Links with pressures, drivers, risks and management actions
Table 10: Links with pressures, drivers, risks and actions: Vegetation set (riparian)
Pressure / driver /
risk Potential impacts Level of risk
Water resource development
altered hydrological
regimes
changes in composition, structure and
condition of riparian vegetation communities
declining condition and mortality of structural
perennial species, i.e. red gums, coolabah,
lignum, reeds
reduced recruitment in woody species
increased invasion by exotic species
encroachment by mesic and xeric species
High
pumping from
shallow groundwater
changes in composition, structure and
condition of ground-water dependent/influenced
communities
Moderate
Grazing
floodplain grazing
during dry phase
changes in composition, structure and
condition of riparian vegetation communities
reduced recruitment of riparian trees
Moderate - High
Tourism
tourism during dry
phase
removal of vegetation
introduction of exotic species
Moderate
Other
road crossings and
culverts
altered flooding patterns may result in
changes in composition, structure and condition
of riparian vegetation communities
Low
feral animals as for grazing Uncertain at present
climate change altered ecological functioning of waterholes
and wetlands
Moderate - High
Alignment with national reporting frameworks
1. FARWH
Fringing zone index
2. National Framework for Natural Resource Management Standards and Targets

LEB River Assessment Implementation Plan Project: Milestone 1 Report
58 | P a g e
Riparian vegetation community assemblages (Integrity of inland aquatic
ecosystems (rivers and other wetlands): river condition)
Vegetation (Integrity of inland aquatic ecosystems (rivers and other wetlands):
wetland condition)
Significant native species and ecological communities
Ecologically significant invasive species
Specific indicators
Table 11: Specific indicators for Vegetation set (riparian)
Indicator Links to pressures/drivers/risks
% cover of 3-5 dominant woody species
in upper (e.g. red gum, coolabah, river
cooba) and middle (e.g. lignum) layers
- changes may indicate altered flow regime or
anthropogenic disturbance
% herbaceous ground cover - sensitive to antecedent flow conditions
% cover aquatic vegetation (submerged,
floating, emergent)
- sensitive to antecedent flow conditions
% cover of exotics - changes may indicate altered water quality or flow
regime or anthropogenic disturbance
native regeneration - reflects changes in flooding regime
width of riparian zone - changes may indicate altered flooding regime or
anthropogenic disturbance
longitudinal connectivity - changes may indicate altered flooding regime or
anthropogenic disturbance
(Adapted from Appendix A, River Condition Indicator Status:
http://www.nrm.gov.au/publications/factsheets/me-indicators/index.html)
N.B. It should be noted that the above indicators, recommended by the NRM
Standards and Targets, differ slightly from those in the most recent Index of Stream
Condition. A decision on final indicator selection will be necessary prior to initiation
of monitoring and may depend on expertise of field staff.
Sampling
Sampling methods
Sampling methods should follow those developed for the Index of Stream Condition,
until a nationally applicable monitoring technique, currently under review, is
developed (see Victorian DSE, 2006. Index of Stream Condition: User’s Manual 2nd
edition).
Spatial scale of sampling
Riparian vegetation structure should be surveyed at the site or waterbody level in
conjunction with fish sampling.
Sampling frequency
Riparian vegetation structure should be surveyed annually in conjunction with
March/April fish sampling, i.e. following recession of floodwaters.

LEB River Assessment Implementation Plan Project: Milestone 1 Report
59 | P a g e
Analysis and reporting
Analysis and reporting should follow methods developed for the index of Stream
Condition as per ‘Streamside Zone sub-index’ (see ISC Factsheets
http://www.ourwater.vic.gov.au/monitoring/river-health/isc/resources).
Costs
It is recommended that riparian vegetation structure be assessed in conjunction with
fish surveys. As most of the specific indicators require minimal training, an additional
staff member could join fish survey teams. Due to the timing of fish survey activities,
field staff could then assist each other as required. This would also reduce travel
costs significantly. Reporting and analysis would need to be conducted separately.
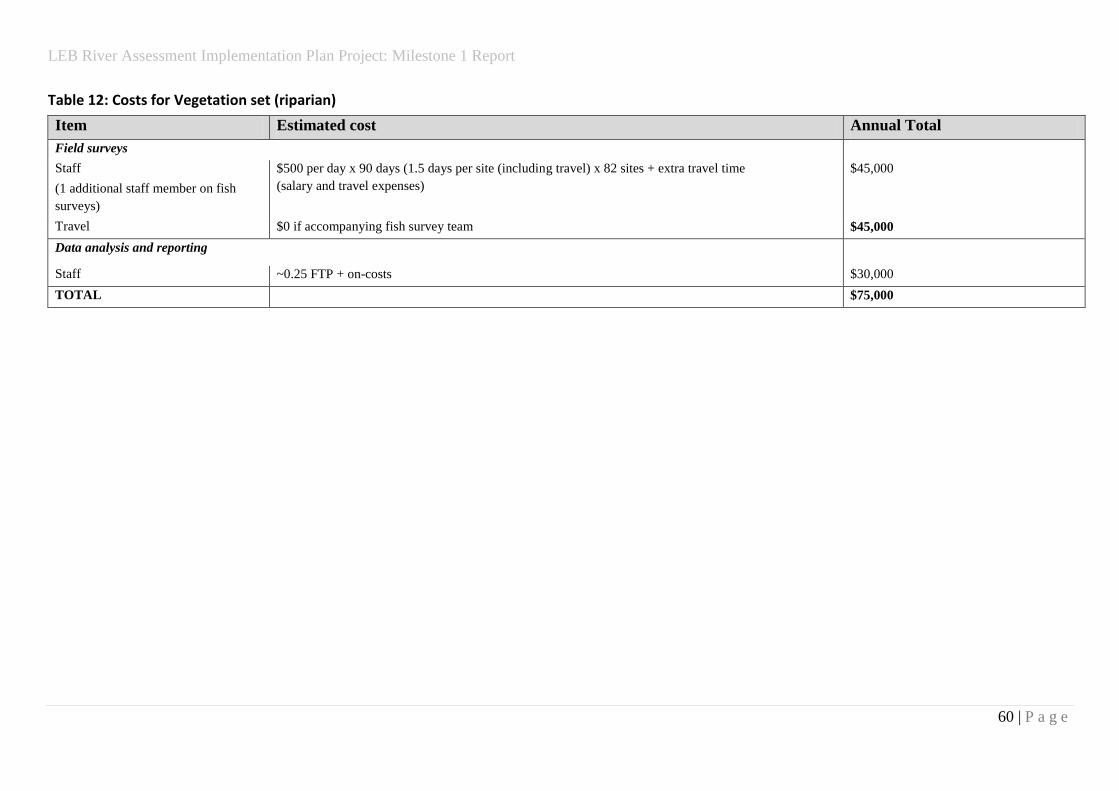
LEB River Assessment Implementation Plan Project: Milestone 1 Report
60 | P a g e
Table 12: Costs for Vegetation set (riparian)
Item Estimated cost Annual Total
Field surveys
Staff
(1 additional staff member on fish
surveys)
$500 per day x 90 days (1.5 days per site (including travel) x 82 sites + extra travel time
(salary and travel expenses)
$45,000
Travel $0 if accompanying fish survey team $45,000
Data analysis and reporting
Staff ~0.25 FTP + on-costs $30,000
TOTAL $75,000

LEB River Assessment Implementation Plan Project: Milestone 1 Report
61 | P a g e
Wetland vegetation condition indicator (DIWA wetlands)
(Riparian and floodplain theme, Riparian and Floodplain Biodiversity Attribute)
Background
The state and territory governments have identified 33 nationally important wetland
complexes covering over 5 million ha within the LEB (Directory of Important Wetlands in
Australia). These are:
Aramac Springs, Austral Limestone Aggregation, Birdsville - Durrie Waterholes
Aggregation, Cauckingburra Swamp, Coongie Lakes, Cooper Creek - Wilson River
Junction, Cooper Creek Overflow Swamps - Windorah, Cooper Creek Swamps -
Nappa Merrie, Dalhousie Springs, Diamantina Lakes Area, Diamantina Overflow
Swamp - Durrie Station, Diamantina River Wetland System, Elizabeth Springs, Finke
River Headwater Gorges System, Georgina River - King Creek Floodout, Inland Saline
Lakes, Lake Buchanan, Lake Constance, Lake Cuddapan, Lake Eyre, Lake Eyre Mound
Springs, Lake Galilee, Lake Mipia Area, Lake Phillipi, Lake Torquinie Area, Lake
Yamma Yamma, Mitchell Swamp, Moonda Lake - Shallow Lake Aggregation, Mulligan
River - Wheeler Creek Junction, Muncoonie Lakes Area, Strzelecki Creek Wetland
System, Sturt National Park Wetlands, Toko Gorge and Waterhole.
Two of these wetlands (Coongie Lakes and Lake Pinaroo) are listed under the Ramsar
Convention on Wetlands of International Importance.
Values
iconic
social and cultural significance
economic and political importance
significant for ecosystem function
Alignment with national reporting frameworks
1. FARWH
Fringing zone index
2. National Framework for Natural Resource Management Standards and Targets
Riparian vegetation community assemblages (Integrity of inland aquatic
ecosystems (rivers and other wetlands): river condition)
Vegetation (Integrity of inland aquatic ecosystems (rivers and other wetlands):
wetland condition)
Significant native species and ecological communities
Ecologically significant invasive species
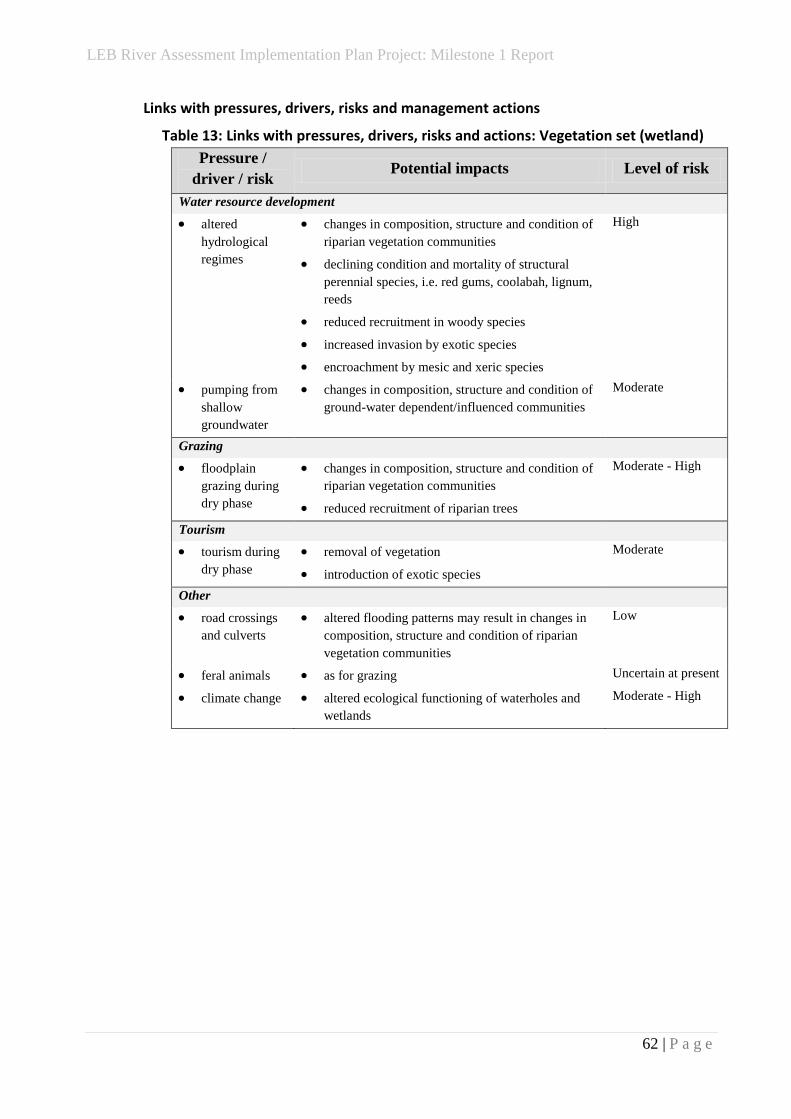
LEB River Assessment Implementation Plan Project: Milestone 1 Report
62 | P a g e
Links with pressures, drivers, risks and management actions
Table 13: Links with pressures, drivers, risks and actions: Vegetation set (wetland)
Pressure /
driver / risk Potential impacts Level of risk
Water resource development
altered
hydrological
regimes
changes in composition, structure and condition of
riparian vegetation communities
declining condition and mortality of structural
perennial species, i.e. red gums, coolabah, lignum,
reeds
reduced recruitment in woody species
increased invasion by exotic species
encroachment by mesic and xeric species
High
pumping from
shallow
groundwater
changes in composition, structure and condition of
ground-water dependent/influenced communities
Moderate
Grazing
floodplain
grazing during
dry phase
changes in composition, structure and condition of
riparian vegetation communities
reduced recruitment of riparian trees
Moderate - High
Tourism
tourism during
dry phase
removal of vegetation
introduction of exotic species
Moderate
Other
road crossings
and culverts
altered flooding patterns may result in changes in
composition, structure and condition of riparian
vegetation communities
Low
feral animals as for grazing Uncertain at present
climate change altered ecological functioning of waterholes and
wetlands
Moderate - High

LEB River Assessment Implementation Plan Project: Milestone 1 Report
63 | P a g e
Specific indicators
Table 14: Specific indicators for Vegetation set (wetland)
Indicator Links to pressures/drivers/risks
Floristic composition - sensitive to antecedent flow conditions
- changes may indicate altered flow regime, water quality or
anthropogenic disturbance
- changes may indicate impacts of exotic species
species richness - sensitive to antecedent flow conditions
- changes may indicate altered water quality or flow regime or
anthropogenic disturbance
- changes may indicate impacts of exotic species
% canopy cover - changes may indicate altered flooding regime or anthropogenic
disturbance
% foliage cover of
understorey species
- sensitive to antecedent flow conditions
- changes may indicate altered water quality or flow regime or
anthropogenic disturbance
- changes may indicate impacts of exotic species
foliage cover - changes may indicate altered flooding regime or anthropogenic
disturbance
height ranges of
vegetation layers
(trees, shrubs,
understorey)
- changes may indicate altered flooding regime or anthropogenic
disturbance
tree vigour - changes may indicate altered flooding regime, water quality or
anthropogenic disturbance
population size structure - changes may indicate altered flooding regime or anthropogenic
disturbance
(Adapted Wetland Ecosystem Condition: Vegetation - Indicator Status:
http://www.nrm.gov.au/publications/factsheets/me-indicators/index.html)
Sampling
Sampling methods
Sampling methods should follow those described in detail in the Wetland Ecosystem
Condition: Vegetation - Indicator Status fact sheet (part of the National Framework
for Natural Resource Management Standards and Targets) available at:
http://www.nrm.gov.au/publications/factsheets/me-indicators/index.html.
In summary, these methods involve surveying between 3 and 6 permanently
established transects running from upland areas into the lowest elevations of the
wetland, preferably where emergent macrophytes are present. The number and
location of transects per wetland will depend on its vegetation diversity and should
be selected from aerial photos etc. prior to the first field survey. Transects should
comprise contiguous 20m x 20m quadrats in which measurements will be taken at
varying scales including % canopy cover, % cover of understorey speciesand DBH of
trees.

LEB River Assessment Implementation Plan Project: Milestone 1 Report
64 | P a g e
Spatial scale of sampling
Wetland vegetation composition should be conducted in all of the wetlands listed in
the Directory of Important Wetlands.
Sampling frequency
Wetland vegetation condition should be surveyed annually. The timing of surveys
may vary depending on hydrological conditions but should be conducted at the same
time of year where possible. An April survey date may be appropriate for many
wetlands in the Lake Eyre Basin as this should enable access following floodwater
recession whilst still allowing surveys of flood-responsive vegetation to occur.
Analysis and reporting
Analysis and reporting will need to be conducted at the scale of individual wetlands.

LEB River Assessment Implementation Plan Project: Milestone 1 Report
65 | P a g e
Table 15: Costs for Vegetation set (nationally important wetlands)
(Based on 28 DIWA wetland sites.)
Item Estimated cost # of days Annual Total
Field preparation
Transect selection using aerial photos etc. 0.5 days per wetland x $500 per day $14,000
(once at beginning)
Field surveys
Field staff $1,000 per day
($500 p.p. per day x 2 field staff)
90 days
(3 days per wetland (including
travel) x 28 sites + extra travel
time
$90,000
Accommodation $140 per night
($70 p.p. per night x 2 staff)
90 nights $12,600
Consumables
(food etc.)
$100 per day
($50 p.p. per day)
90 days $9,000
Travel $12,000
(20,000 km @ $0.75 km)
N.B. mileage estimate for 2 cars travelling from Brisbane (6,000 km trip) & 1
car travelling from Adelaide (4,000 km trip)
- $12,000
Field equipment $5,000
Total Field Survey costs $128,600
Data analysis & reporting
Data entry $500 per day (2 x junior staff) 10 days $10,000
Data analysis $1,000 per day (2 x senior staff) 10 days $20,000
Report preparation $1,000 per day (2 x senior staff) 10 days $20,000
Total data analysis & reporting $50,000
TOTAL $178,600
per year (+$14,000
initially)

LEB River Assessment Implementation Plan Project: Milestone 1 Report
66 | P a g e
Physical habitat indicator
(Physical form theme, Channel system integrity and erosion potential/land use/ landscape
change Attribute)
Values
maintenance of healthy aquatic ecosystems
contributes to social, cultural and aesthetic values of channels and waterholes
potential indicator of climate change and anthropogenic disturbance including
land use
Links with pressures, drivers, risks and management actions
Table 16: Links with pressures, drivers, risks and actions: Physical Habitat set
Pressure / driver
/ risk Potential impacts Level of risk
Water resource development
water storage and
diversion
changes in the flow regime resulting from
alterations in in-stream flows and
floodplain inundation and therefore
changes to sediment regime
loss of physical diversity within the
channel network and on key floodplain
surfaces
Moderate - High
construction of
barriers across
floodplain
surfaces and
within the
channel network
interruptions to the natural flow and
sediment regime within the channel
network and across key floodplain
surfaces
Moderate - High
Land use change
shift from
grazing to
cropping
altered water quality in channels and
wetlands as a result of changes in runoff
patterns and nutrient and sediment supply
Moderate
overgrazing on
floodplain
altered soil structure, nutrient content and
vegetation may influence nutrient and
sediment loads entering channels and
wetlands
Moderate
Other
feral animals as for grazing Uncertain at present
climate change altered flow and sediment regimes
resulting from changed runoff and flow
patterns and sediment and nutrient loads
Moderate - High
(Sourced from information in Parsons et al. 2004)
Alignment with national reporting frameworks
1. FARWH
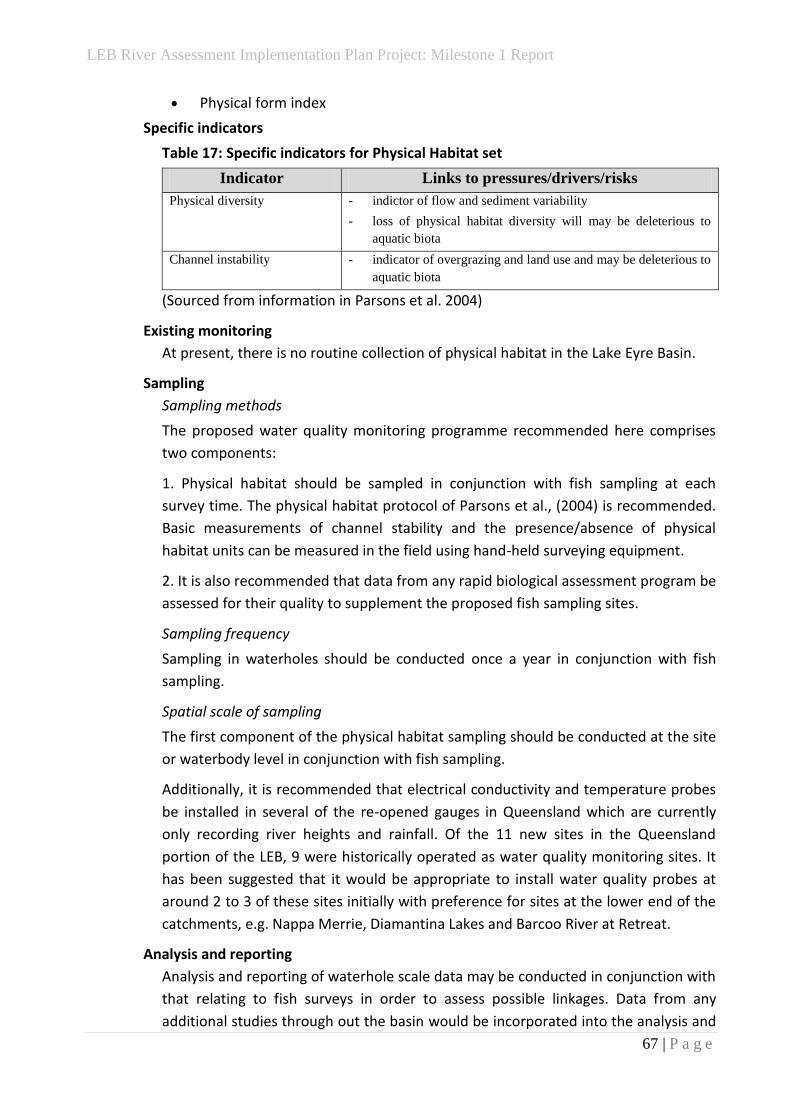
LEB River Assessment Implementation Plan Project: Milestone 1 Report
67 | P a g e
Physical form index
Specific indicators
Table 17: Specific indicators for Physical Habitat set
Indicator Links to pressures/drivers/risks
Physical diversity - indictor of flow and sediment variability
- loss of physical habitat diversity will may be deleterious to
aquatic biota
Channel instability - indicator of overgrazing and land use and may be deleterious to
aquatic biota
(Sourced from information in Parsons et al. 2004)
Existing monitoring
At present, there is no routine collection of physical habitat in the Lake Eyre Basin.
Sampling
Sampling methods
The proposed water quality monitoring programme recommended here comprises
two components:
1. Physical habitat should be sampled in conjunction with fish sampling at each
survey time. The physical habitat protocol of Parsons et al., (2004) is recommended.
Basic measurements of channel stability and the presence/absence of physical
habitat units can be measured in the field using hand-held surveying equipment.
2. It is also recommended that data from any rapid biological assessment program be
assessed for their quality to supplement the proposed fish sampling sites.
Sampling frequency
Sampling in waterholes should be conducted once a year in conjunction with fish
sampling.
Spatial scale of sampling
The first component of the physical habitat sampling should be conducted at the site
or waterbody level in conjunction with fish sampling.
Additionally, it is recommended that electrical conductivity and temperature probes
be installed in several of the re-opened gauges in Queensland which are currently
only recording river heights and rainfall. Of the 11 new sites in the Queensland
portion of the LEB, 9 were historically operated as water quality monitoring sites. It
has been suggested that it would be appropriate to install water quality probes at
around 2 to 3 of these sites initially with preference for sites at the lower end of the
catchments, e.g. Nappa Merrie, Diamantina Lakes and Barcoo River at Retreat.
Analysis and reporting
Analysis and reporting of waterhole scale data may be conducted in conjunction with
that relating to fish surveys in order to assess possible linkages. Data from any
additional studies through out the basin would be incorporated into the analysis and

LEB River Assessment Implementation Plan Project: Milestone 1 Report
68 | P a g e
reporting framework currently implemented in that State. Collation and analysis of
physical habitat data from 1. fish monitoring, 2. Queensland rapid biological
assessment sites and 3. South Australian rapid biological assessment sites could be
incorporated if undertaken and this would require collation and analysis at a
catchment and basin scale within the reporting timeframe of the LEBRA.
Costs
Costs of sampling in waterholes should be minimal as measurements can be taken in
conjunction with fish sampling. Equipment, e.g. theodolites, may present an initial
expense depending on the access of these to fish sampling project teams. There may
be an additional cost for data analysis and reporting beyond the scope of the fish
monitoring programme. An estimate of costs associated with this component based
on advice provided by researchers experienced with rapid physical habitat surveys, is
provided below.

LEB River Assessment Implementation Plan Project: Milestone 1 Report
69 | P a g e
Table 18: Costs for Physical Habitat set
Item Estimated cost Total Frequency Annual Total
Equipment $10,000 per survey item $10,000
once at beginning of
monitoring programme
$5,000
Staff
(3 people required)
$500 p.p. per day
(salary and travel expenses)
$13,500
once at beginning of
monitoring programme
$13,500
Total Installation costs $23,500 $18,500

LEB River Assessment Implementation Plan Project: Milestone 1 Report
70 | P a g e
Water quality indicator
Acknowledgements:
Bill Reurich, QLD Department of Environment and Resource Management
Peter Old, QLD Department of Environment and Resource Management
Values
maintenance of healthy aquatic ecosystems
contributes to social, cultural and aesthetic values of channels and waterholes
potential early indicator of anthropogenic disturbance
existence of long-term data sets for trends-based analyses
Links with pressures, drivers, risks and management actions
Table 19: Links with pressures, drivers, risks and actions: Water Quality set
Pressure / driver /
risk
Potential impacts Level of risk
Water resource development
water storage and
diversion
changes in water quality resulting from
alterations in in-stream flows and
floodplain inundation and therefore
sediment and nutrient loads
Moderate - High
change in depth of
alluvial
groundwater
alterations to quality of water in refugial
waterholes
Moderate
Land use change
shift from grazing
to cropping
altered water quality in channels and
wetlands as a result of changes in runoff
patterns and nutrient and sediment
supply
Moderate
overgrazing on
floodplain
altered soil structure, nutrient content
and vegetation may influence nutrient
and sediment loads entering channels
and wetlands
Moderate
Tourism
tourism during dry
phase
increased nutrient inputs Moderate
Other
toxic impacts of
stock vaccination
via faeces
reductions in water quality Uncertain at present
feral animals as for grazing Uncertain at present
climate change altered water quality resulting from
changed runoff and flow patterns and
sediment and nutrient loads
Moderate - High
(Sourced from information in Sheldon et al. 2005)

LEB River Assessment Implementation Plan Project: Milestone 1 Report
71 | P a g e
Alignment with national reporting frameworks
1. FARWH
Water quality index
2. National Framework for Natural Resource Management Standards and Targets
Water quality (Integrity of inland aquatic ecosystems (rivers and other
wetlands): river condition)
Dissolved oxygen and temperature (Wetland ecosystem condition)
Transparency (Wetland ecosystem condition)
Turbidity (Turbidity/suspended particulate matter in aquatic environments)
Electrical conductivity (Surface water salinity in freshwater aquatic
environments)
Specific indicators
Table 20: Specific indicators for Water Quality set
Indicator Links to pressures/drivers/risks
conductivity - indictor of salinity
- elevated salinities may be deleterious to aquatic biota
pH - extreme pH may be deleterious to aquatic biota
dissolved oxygen (diel range) - highly significant for aquatic biota
- high DO levels during and levels close to zero in the evening
may indicate a high pollution load
turbidity - indicator of amount of suspended solids in water
- influences light penetration and primary production
- decreases in turbidity may result in increased primary
productivity
water temperature (diel range) - highly significant for aquatic biota
(Sourced from information in Sheldon et al. 2006)
Existing monitoring
At present, the Queensland Department of Environment and Resource Management
continuously monitor conductivity and temperature (as well as river height and
rainfall) at a single location in the Queensland portion of the Lake Eyre Basin:
Thompson River @ Longreach (003202A). A further 11 sites have operational
instantaneous river height and rainfall gauges. There is historic water quality data
available for 9 of these sites.
In South Australia, water quality is currently assessed by the EPA for 7 sites in the
Lake Eyre Basin: Cooper Creek, Warburton Creek, Yardaparinna Creek, Neales River,
Margaret Creek, Mount Chambers Creek and Arakola Creek. Water quality
parameters, including oxidised nitrogen, total nitrogen, total phosphours, soluble
phosphorus, turbidity and salinity, are measured every 3 months in these remote
locations.

LEB River Assessment Implementation Plan Project: Milestone 1 Report
72 | P a g e
Sampling
Sampling methods
The proposed water quality monitoring programme recommended here comprises
two components:
1. Water quality should be sampled in conjunction with fish sampling during each
survey time. Conductivity, pH and turbidity can be measured in the field using hand-
held probes and diel ranges in dissolved oxygen and water temperature can be
measured over 24 hours using probes and data loggers.
2. It is also recommended that additional water quality monitoring probes be
installed in the Queensland portion of the Lake Eyre Basin to supplement the existing
network of gauges and enable the assessment of long-term trends through analyses
against historic data. As per the remainder of Queensland’s water quality monitoring
network, these should comprise in situ electrical conductivity and temperature
probes.
Sampling frequency
Sampling in waterholes should be conducted twice per year in conjunction with fish
sampling. Water quality monitoring via in situ probes will occur continuously.
Spatial scale of sampling
The first component of water quality sampling should be conducted at the site or
waterbody level in conjunction with fish sampling. Additionally, it is recommended
that electrical conductivity and temperature probes be installed in several of the re-
opened gauges in Queensland which are currently only recording river heights and
rainfall. Of the 11 new sites in the Queensland portion of the LEB, 9 were historically
operated as water quality monitoring sites. It has been suggested that it would be
appropriate to install water quality probes at around 2 to 3 of these sites initially
with preference for sites at the lower end of the catchments, e.g. Nappa Merrie,
Diamantina Lakes and Barcoo River at Retreat.
Analysis and reporting
Analysis and reporting of waterhole scale data may be conducted in conjunction with
that relating to fish surveys in order to assess possible linkages. Data from any
additional water quality monitoring stations in Queensland would be incorporated
into the analysis and reporting framework currently implemented in that State.
Collation and analysis of water quality data from 1. fish monitoring, 2. Queensland
water quality monitoring sites and 3. South Australian water quality monitoring sites
would require collation and analysis at a catchment and basin scale within the
reporting timeframe of the LEBRA, i.e. once every 10 years.
Costs
Costs of sampling in waterholes should be minimal as measurements can be taken in
conjunction with fish sampling. Equipment, e.g. probes and data loggers, may

LEB River Assessment Implementation Plan Project: Milestone 1 Report
73 | P a g e
present an initial expense depending on the access of these to fish sampling project
teams. There may be an additional cost for data analysis and reporting beyond the
scope of the fish monitoring programme. An estimate of costs associated with the
installation and maintenance of additional water quality probes in Queensland,
based on advice provided by staff members of QLD Department of Environment and
Resource Management, is provided below.

LEB River Assessment Implementation Plan Project: Milestone 1 Report
74 | P a g e
Table 21: Costs for Water Quality set
Item Estimated cost Total Frequency Annual Total
Installation of probes (3)
Equipment $15,000 per probe $45,000
(3 new probes)
once at beginning of
monitoring programme
$45,000
Staff
(3 people required)
$500 p.p. per day
(salary and travel expenses)
$13,500
(3 days per probe
including travel)
once at beginning of
monitoring programme
$13,500
Total Installation costs $58,500 $58,500
Maintenance and calibration
Staff and travel $1,000 per day
($500 p.p. per day x 2 field staff x 1 probe per day)
$3,000
annually $3,000
Equipment $1,000 per probe $3,000 annually $63,000
Total Maintenance costs $6,000 per year $6,000 per year
TOTAL $6,000
per year (+$58,500
initially)

LEB River Assessment Implementation Plan Project: Milestone 1 Report
75 | P a g e
Hydrology indicator
Acknowledgements
Tony Ladson, Erwin Weinmann, Justin Costelloe, John Tilleard
Values
maintenance of healthy aquatic and floodplain ecosystems
contributes to social, cultural and aesthetic values of floodplains, channels and
waterholes
potential indicator of anthropogenic disturbance, especially climate, land use
and floodplain
existence of long-term data sets for some trend-based analyses
Links with pressures, drivers, risks and management actions
Table 22: Links with pressures, drivers, risks and actions: Hydrology set
Pressure / driver
/ risk Potential impacts Level of risk
Water resource development
water storage and
diversion
changes in the spatial and temporal availability
of water through the basin resulting from
alterations in in-channel flows and floodplain
inundation
reduced filling of terminal lakes and wetlands
High
pumping from
water holes
alterations to the availability of water in
refugial waterholes
High
Land use change
vegetation
structure changes
via mining,
grazing and other
development
changes in the spatial and temporal availability
of water
less water for waterhole filling
Moderate
floodplain
developments
altered patterns of floodplain inundation Moderate
Other
climate change altered water availability resulting from
changed runoff and flow patterns
High
Alignment with national reporting frameworks
1. FARWH
Hydrological change

LEB River Assessment Implementation Plan Project: Milestone 1 Report
76 | P a g e
Specific indicators
Table 23: Specific indicators for Hydrology set
Indicator Links to pressures/drivers/risks
Total surface water availability - Water resources development
- Climate change
- Land use change
Water storage capacity - Water resources development
Water licensing - Water resources development
Filling of terminal lakes - Water resources development
- Climate change
- Floodplain development
- Land use change
- Presence of in-channel structures
Floodplain inundation - Water resources development
- Climate change
- Floodplain development
- Land use change
In- channel events - Water resources development
- Climate change
- Floodplain development
- Land use change
- Presence of in-channel structures
Persistence of key waterholes - Water resources development
- Climate change
Existing monitoring
Water surface information has been collected at over 150 locations throughout the
Lake Eyre Basin and the available data are of variable quality, length of record and
availability. These networks include:
• Stream monitoring stations maintained by the governments of South
Australia, Queensland and Northern Territory;
• Flood warning stations maintained by the Bureau of Meteorology;
• Sites established as part of the Arid Flow Project to investigate floodplain,
waterhole and wetland ecology;
• Sites used in the Dryland Refugia Project to investigate waterhole ecology;
and,
• A hydrologic network set up by Santos Ltd for the specific purpose of warning
of flood threats to mining infrastructure.
Stream monitoring stations are specifically set up to provide long term records of
flow information. These are reviewed in detail in the report Hydrology of Lake Eyre
Basin (HLEB) including, length of record, and adequacy of gauging. Much of the
stream monitoring data are available via the internet. According to HLEB, there are

LEB River Assessment Implementation Plan Project: Milestone 1 Report
77 | P a g e
only 17 stations in the Lake Eyre Basin with at least 10 years of record and only 12
stations have at least 20 years of record. In order to undertake a valid statistical
analysis of the frequency of floods at least 30 years of data are recommended by the
Institution of Australian Engineers. The HLEB also includes an assessment of accuracy
of flow information at these gauging stations in terms of how adequately the streams
are rated. Only four gauges had good high flow ratings: Cooper Creek at Nappa
Merrie (003103a), Cooper Creek at Callamurra Water Hole (AW003501), Thomson
River at Longreach (003202A) and Thomson River at Stonehenge (003202A). It may
be appropriate to improve the high flow ratings at other gauges (see section 7).
Three gauges have recently been reinstated which is consistent with the
recommendations of the HLEB report: Diamantina River at Diamantina Lakes, Burke
River at Boulia and Georgina River at Roxborough Downs.
In addition to the state network of water level recorders, a series of 17 water level
loggers have been installed by the ARIDFLO Project in three sub catchments of the
Lake Eyre Basin in South Australia.
Sampling
Sampling methods
It is proposed that two types of surface water monitoring should occur in the Lake
Eyre Basin:
A network of surface water level recorders should be used to determine flows at
various locations through out the Basin. The number, location and type of
measurements required for monitoring depend on the specific issues to be
addressed, the variability of the natural system, and of course, the available budget.
For efficient and cost-effective operation of the networks that serve the Rivers
Assessment Program, it is desirable that these networks be integrated with
monitoring networks set up and operated for other purposes. Ladson et al., (2008)
proposes the following priorities for the hydrology network in the Lake Eyre Basin.
Priority 1:
Highest priority sites are those that assist in the understanding large scale hydrology
of the multi-channel, ecologically diverse reaches of the Cooper Creek, Diamantina
River and Georgina Rivers. Good flow data is required at the upstream and
downstream ends of these reaches.
Cooper - Improve the high flow rating of the Barcoo River at Retreat. The other
sites on the Cooper are probably adequate.
Diamantina – continue with the re-establishment of the site Diamantina River
at Diamantina Lakes, in particular, the high flow rating at this site needs to be
improved and data needs to be brought online (data from this site are not
currently accessible via the Queensland Watershed database).

LEB River Assessment Implementation Plan Project: Milestone 1 Report
78 | P a g e
Georgina (upstream) – continue restablishment of gauging stations, Georgina
River at Roxborough Downs and Burke River at Boulia. We understand that
stage data are currently being collected and telemetered from these sites, but
the information is not accessible via the Queensland Watershed database. The
publicly available records for these sites suggest they ceased operation in 1988.
Additional work will be required to establish reliable ratings at these sites.
Georgina (downstream) – a new site is required at the downstream end of the
multichannel reach of the Georgia River. We recommend that the gauging
station, Eyre Creek at Glenglyle, be restablished as it has about 20 years of data
before ceasing operation in about 1990. This site should incorporate telemetry,
via satellite phone if necessary, and ‘sensor to web’ technology.
In addition, remotely sensed data on flood pattern and extent should be
captured as this can guide hydrologic modelling and ecological assessment of
these reaches.
Priority 2:
Priority 2 sites should be established to monitor land use influences on the hydrology
of the Lake Eyre Basin. These influences include activities such as mining and
catchment clearing in the headwaters of Cooper Creek, Diamantina River and
Georgina River. These sites need to be located in areas where impacts are greatest
so that there is the highest change of detecting changes. There would need to be
further work to identify areas with the highest land use and the best sites for
monitoring, but the following should be considered:
Torrens Creek at Torrens Creek (003206A) – reinstate
Mistake Creek at Wololla (003305A) - reinstate
Diamantina at Tulmur (002903) – install
Priority 3:
Other monitoring sites could include:
1. Neales River near Algebukina Bridge (or Macumba River at Macumba Station)
(AW004104) – install full gauging stations (currently stage measurements are
recorded). These sites are importance because these western LEB tributaries are
poorly gauged. The Neales site is an excellent location to measure flows and there is
a ecologically important wetland nearby. There may also be some high flow
information available this site from debris line surveys undertaken in the 1980s.
2. A series of water recorders for determining the persistence of key wetlands and
waterholes through out the Lake Eyre Basin. Here the similar procedures as in the
Arid Flow project where low cost stage loggers are set up and downloaded during
site visits.
LEB River Assessment Implementation Plan Project: Milestone 1 Report
79 | P a g e
Priority sites could include:
Durrie waterholes aggregation, Birdsville
Cooper Creek Overflow swamps, Windorah
Cooper Creek – Wilson River Junction
Diamantina Overflow Swamp, Durrie Station
Georgina River, King Creek Floodout
Mulligan River – Wheeler Creek junction
These sites would need to be confirmed with ecologists. In addition, the
existing Arid Flow sites should be continued.
Sampling frequency
Technological improvements have meant that daily readings can now be obtained
from most sensors. Issues concerned with instrumental servicing and calibration are
dealt with below.
Analysis and reporting
Analysis and reporting of waterhole scale data may be conducted in conjunction with
that relating to fish surveys in order to assess possible linkages. Data from any
additional water quality monitoring stations in Queensland would be incorporated
into the analysis and reporting framework currently implemented in that State.
Collation and analysis of water quality data from 1. fish monitoring, 2. Queensland
water quality monitoring sites and 3. South Australian water quality monitoring sites
would require collation and analysis at a catchment and basin scale within the
reporting timeframe of the LEBRA, i.e. once every 10 years.
Costs
Typical costs for the hydrological monitoring component are listed in Table 24. These
are approximate as actual costs will be dependent upon site conditions and
remoteness. It is recommended that monitoring to be done by the state agencies
and the data collected should also be handled by the state agencies and incorporated
into their databases. In general, site visits by technical staff are much more costly
than the purchase price of instruments. Reliable sensors, data loggers and telemetry
systems, even if they have a higher initial cost, may be a way of reducing the total
cost of measuring systems.
Two types of sites should be considered. Long term sites with ‘sensor to web’
technology i.e. where data are collected, telemetered via satellite phone if
necessary, and made available in the internet in close to real time. These sites would
require development of rating curves. In addition there should be a larger number of
cheaper sites where stage is measured but where data are not telemetered. These
sites would be similar to the existing arid flow sites. The selection process for any
new instrumentation and the techniques to undertake the actual measurements
would benefit from technical advice from experts drawn from all the jurisdiction
covering the Lake Eyre Basin.

LEB River Assessment Implementation Plan Project: Milestone 1 Report
80 | P a g e
Table 24: Costs for Hydrology set
(Typical costs for monitoring system components)
No. Item Cost
1 Field visit by a team of two people $2,000 per day
2 Satellite phone modem $2,000 to $3,000
3 Satellite phone network access and phone calls $1,000 per year
4 Data logger $1,000 to $10,000
5 Sensor $1,000 to $5,000
6 Set up costs for high quality long-term gauging site that $20,000 to $100,000 depending on stream size, remoteness, and chosen
equipment.
7 High flow gauging of a remote site e.g. Diamantina River at Diamantina Lakes $30,000 This includes helicopter access
8 Set up costs for ‘project’ sites e.g. an Aridflo sites. These could be used to monitor a series of
waterholes
$40,000 for 10 sites within a radius of a few hundred kilometres.

LEB River Assessment Implementation Plan Project: Milestone 1 Report
81 | P a g e
Pressure Indicators
The indicators listed in the previous section will provide an assessment of the
“condition” of the aquatic ecosystems of the LEB. However these indicators do not
provide information on what activities may be causing the changes in condition. To
address this issue an additional set of “pressure indicators” have been developed to
provide a context of the major changes in landuse and land management impacting
on the aquatic ecosystems of the LEB.
The key pressures impacting of the condition of the aquatic ecosystems of the LAB
have been identified in the development of the condition indicators (Table 3, 7, 10,
13, 16, 19 and 22). The high and moderate pressures identified are:
Land use changes impacting on water use
Management of grazing lands
Tourism
Invasive species
Climate Change
Table 25 Key pressures, impacting activities and indicators Pressures Impacting activities
associated with the pressure
Indicator areas
Land use changes, especially
those impacting on water use
Irrigated agriculture
Intensification of
grazing
Mining and petroleum
extraction
Road construction
Earthworks to harvest
water
Water extraction, water storage
and diversion, construction of
barriers across floodplain
surfaces and within the channel
network, damming, conversion
of floodplain lakes to storages,
floodplain harvesting, pumping
from shallow groundwater,
pumping from water holes
Development applications,
Environmental Impact
Assessments, water permits
issued, updates of water
management plans
Management of grazing lands Increased grazing pressure,
vegetation management
Vegetation cover, burnt areas
Tourism Recreational visitors, localized
fishing impacts
Number of visitors
Invasive species Establishment/spread of exotic
animal and plant species (on the
floodplains)
Occurrence of Weeds of
National Importance, exotic fish
species
Climate Change Changes in the amount and
pattern of rainfall and the
associated changes in river
flows, intensity of storm events
National level conclusions on
changes in climate
Existing Monitoring
While the state indicators are to be assessed on the basis of data collected during
field programs, a more cost effective approach can be used for the pressure
indicators. Government agencies have existing procedures and programs that collect
information on many of the pressures in the LEB. Accordingly, the approach will be
collate the information available on changes in relation to each pressure.

LEB River Assessment Implementation Plan Project: Milestone 1 Report
82 | P a g e
Reporting
Information on the pressure indicators will be collated and reported in the mid-term
and 5 years reports.
Costs
Costs will be limited to the time involved in identifying and collating information on
the pressures.

LEB River Assessment Implementation Plan Project: Milestone 1 Report
83 | P a g e
Table 26 Costs for Pressure Indicators
Item Estimated Cost Total Frequency Total Data collation and reporting
Initial identification of data sets
Collation of information
Report preparation
$1000 / day * 20 days
$1000 / day * 15 days
$1000 / day * 15 days
$20 000
$10 000
$15 000
Year 2
Mid term and Final Assessment
Mid term and Final Assessment
$20 000
$20 000
$30 000
LEB River Assessment Implementation Plan Project: Milestone 1 Report
84 | P a g e
Setting Thresholds of Potential Concern (TPCs)
An important component of natural resource management is to ensure the
maintenance of determinants that influence all vital attributes of the system under
consideration. This must then involve listing all the determinants of, and the
constraints and threats to, the condensed list of vital attributes. Determinants are
those factors or processes that determine, strengthen or ensure persistence, while
threats are those factors or processes that threaten, erode or inhibit these attributes
or their determinants. Threats can also be factors within, or outside, a partnership
that undermine its values and inhibit the pursuit of the mission or future desired
state. Knowledge of the environmental and cultural “goods and services” the system
has the potential to deliver is essential part of this process.
Development of a desired state is important in nay natural resource management
exercise and is one based on a vision for a set of desired future ecosystem
conditions. It is important to note that this refers to a ‘desired set of varying
conditions’ rather than a static state. Ecosystem conditions are not fixed but
inherently dynamic. We cannot aim to achieve specific and unchanging ecosystem
conditions, but only to maintain natural variation and processes as the basis for
ecosystem resilience – resilient ecosystems are able to absorb environmental
stressors without undergoing an irreversible change in their state.
Some changes are undesirable as they form part of a long-term trend moving the
ecosystem away from the desired state to another less preferred state. Over time
this trend may become irreversible. The desired outcomes of management are
therefore expressed as limits of acceptable change – termed Thresholds of Potential
Concern (TPCs). TPCs are upper and lower levels of change in selected indicators. If
TPCs are reached it is very likely that the desired state will not be achieved or will not
be able to be achieved into the future.
In essence TPCs should be seen as red flags to managers warning that management
intervention could be necessary to defend the desired state. They also indicate what
management actions should be done, where it should occur and when the actions
should take place. Modelling is also used to predict the results of future monitoring
and thus give early warning that a TPC is likely to be breached. Indeed, any
management process that is working towards the rehabilitation of a desired state,
TPCs represent achievable goals for management to work toward. A collective of
TPCs represent a multidimensional envelope in which natural resource managers and
stakeholders wish the system to remain, “bouncing around” as much as possible,
without going to the undesirable zone.
Examples of possible Thresholds of Potential Concern for the Lake Eyre Basin are
provided in Table 25.

LEB River Assessment Implementation Plan Project: Milestone 1 Report
85 | P a g e
Table 27. Examples of Thresholds of Potential Concern for the Lake Eyre Basin
Trigger Thresholds exceeded or expected to be exceeded
Reduction in waterhole
persistence
Significant change in the cumulative duration of water availability
within the key waterholes of the Lake Eyre Basin
In-channel flow events or
flow pulses
Significant change in the flow duration curve of no flow events for
gauging within the Lake Eyre Basin
Total surface water
availability
Reduction in total annual volume of surface water expected from
catchment rainfall at key gauging stations located throughout the
Lake Eyre Basin
Silt and pollutant release
episode from upstream
mining operation
Increased turbidity in waterholes resulting in fish kills
River sedimentation Loss of physical habitat diversity between and within waterholes
Change in community of
native fish
- New occurrence of an alien fish with a high index of potential threat
- Significant change in size distribution of fish communities within
the individual sub catchments of the Lake Eyre Basin
Change in riparian
vegetation structure
- New occurrence of an alien plant with a high index of potential
threat

LEB River Assessment Implementation Plan Project: Milestone 1 Report
86 | P a g e
8. Monitoring actions that require further research and development
It is the variability and complexity of environmental processes at multiple spatial and
temporal scales in response to a range of disturbances that needs to be captured in a
management and monitoring programme for the Lake Eyre Basin. While this may
seem daunting, frameworks exist for incorporating such characteristics into
management and monitoring programmes. In particular, Kruger National Park, South
Africa, has developed a successful Strategic Adaptive Management system that
supports that park’s mission to preserve biodiversity in all it’s facets and fluxes (Biggs
and Rogers 2003). This system was initially developed as part of a river-research
programme, where it was realized that river management approaches needed to
capture the heterogeneity and variability of pattern and process in space and time
because this was the driver of biodiversity in the park’s rivers – a situation similar to
the scenario observed in the Lake Eyre Basin. Here we outline the basics of Strategic
Adaptive Management as used in Kruger National Park, and suggest how this type of
approach might be used to for management and a monitoring programme in the
Lake Eyre Basin.
Strategic adaptive management
With its roots in management theory, Strategic Adaptive Management was
developed over a number of years as a local tool for the management of Kruger
National Park (Biggs and Rogers 2003) and more recently as part of the framework
for managing all National Parks in South Africa (Rogers et al 2008). Strategic
Adaptive Management offers a framework for natural resource management and
decision making in environmental, social and institutional situations characterized by
variability, uncertainty, incomplete knowledge and multiple stakeholders. Three key
tenets form the basis for the management and decision-making process in Strategic
Adaptive Management (SAM):
Strategic and value based - Purposeful and goal-directed, with the first step in
planning and management being the description of a desired future state of the
protected area based on scientific and societal needs and values;
Adaptive - In the face of uncertainty, management actions are treated as an
opportunity to learn by doing. Management is planned as a learning experience and
improves through frequent review of policy and action; and,
Participatory - Meaningfully involving all stakeholders to serve their needs, access
their inputs and secure their cooperation. Governing cooperatively with other
agencies to coordinate and integrate goals and actions (Rogers et al 2008).

LEB River Assessment Implementation Plan Project: Milestone 1 Report
87 | P a g e
There are five interacting steps in Strategic Adaptive Management (Figure 1), each of
which will be described in the following sections.
Describe the desired state
The description of the desired state involves developing a shared vision of the
system, translating that vision into ecosystem objectives/outcomes and generating a
set of thresholds of potential concern.
Visioning – Understand, with stakeholders, the social, economic and ecological
context of the system to be managed, and the principles/values that guide
management. Develop a broadly acceptable vision of the future (Rogers et al 2008).
Translate the vision into ecosystem objectives/outcomes – Develop an ‘objectives
hierarchy’ that documents the sequential reasoning used in translating a broad
societal values-based vision into science-based ecosystem outcomes (Rogers et al
2008).
Figure 1. The Strategic Adaptive Management (SAM) process. After Rogers et al (2008).

LEB River Assessment Implementation Plan Project: Milestone 1 Report
88 | P a g e
Generate a set of TPCs to define the acceptable levels of change in ecosystem /
biodiversity composition, structure and function – The desired state refers to a
range of varying conditions, acknowledging that ecosystems are variable and
heterogeneous in time and space. The desired outcomes of management are
therefore expressed as limits of acceptable change – termed Thresholds of Potential
Concern (Figure 2). Thresholds of potential concern (TPCs) are upper and lower
levels of change in selected indicators. If TPCs are reached it is very likely that the
desired state will not be achieved or will not be able to be achieved into the future
(Rogers et al 2008).
Develop a plan to achieve or maintain the desired state
Expect the unexpected – Use a variety of tools (scenario planning, systems thinking,
models, historical records, etc.) to scope the range, and likely spatiotemporal limits,
of unusual events and their implications for management towards the desired future
conditions (Rogers et al 2008).
Scope the range of management options – Scoping is undertaken to achieve the
desired future conditions and predict (formally or informally) their likely outcomes
under different scenarios (Rogers et al 2008).
Select the best options – In co-operation with stakeholders decide which
management options provide the best potential learning opportunities, and social-
ecological system outcomes (Rogers et al 2008).
Figure 2. Thresholds of potential concern (TPCs) as boundaries of the desired state.
After Rogers et al (2008).
Implement
Implement the planned management interventions
LEB River Assessment Implementation Plan Project: Milestone 1 Report
89 | P a g e
Monitor
Monitor and audit achievements – Use a range of research projects, traditional
monitoring, modeling and surveys to understand system response to natural flux and
management intervention. Weigh this against the desired outcomes (Rogers et al.,
2008).
Review
Reflect at each step – Is thinking and action congruent with principles, values and
vision? What does knowledge gained tell us about (1) our understanding of the
ecosystem, (2) its responses, (3) how realistic are the desired outcomes and (4) how
useful are the processes used to achieve them (Rogers et al 2008)?
Strategic Adaptive Management has been used to manage the rivers of Kruger
National Park. Within an overarching vision for the park, a biodiversity objective to
‘maintain biodiversity in all its facets and fluxes’ guides an ecosystem objective to
understand and manage the KNP as part of the lowveld savanna and its river
catchment areas in such a manner as to conserve and restore its varied natural
structure, function and composition over time and space, and its wilderness
qualities, through an approach integrating the different scales and types of
objectives’. The water in the landscape objective sits within the ecosystem objective
and aims to ‘develop an integrated understanding of non-terrestrial ecosystem
diversity and dynamics (including sub-surface water) and its links with terrestrial
systems, and to maintain the intrinsic biodiversity as an integral component of the
landscape and maintain or where necessary restore natural structure, function,
composition and processes’. Commensurate with the goals of these objectives, TPCs
have been set for the Sabie River to facilitate prediction and monitoring of
biodiversity in response to hydrology, sediment supply and water quality (Rogers and
Biggs 1999). Geomorphological and vegetation indicators were developed to
indicate ecosystem response to the main agents of change (Table 26). Thresholds of
Potential Concern that fall outside upper and lower limits of acceptable change
(Figure 2) are flagged and investigated further.

LEB River Assessment Implementation Plan Project: Milestone 1 Report
90 | P a g e
Table 28. Monitoring the a) geomorphic and b) riparian vegetation components of
biodiversity in the Sabie River, Kruger National Park. Thresholds of Potential Concern
(TPCs) represent the use of an indicator to monitor the effects of driving processes.
After Rogers and Biggs (1999).
More specifically the following recommendations for the individual components of
the Lake Eyre Basin Implementation Plan are provided.
Flow and flood theme
Development of catchment based flow model is a priority. It would allow the
hydrological impacts of climate and land use to be assessed, thereby treating the
hydrology of the basin as a response variable. It would also enhance the ability to
model these potential impacts on the other ecosystem components of the rivers
assessment.
Modelled stream flow is important for any river assessment. There have been several
attempts to model flows through the rivers of the Lake Eyre Basin. All of these
approaches are constrained by the limited data available, but the results may be
useful for assessing hydrologic characteristics and change in Lake Eyre Basin Rivers
and floodplains. In some circumstances, modelling could be used to extend the
usefulness of measured data and can provide input to ecological studies. A key
(a)
(b)

LEB River Assessment Implementation Plan Project: Milestone 1 Report
91 | P a g e
challenge in modelling the major rivers of the Lake Eyre Basin is to simulate the
complex flow patterns on the vast floodplains of these rivers. Each of the main
waterways, Cooper Creek, the Diamantina River and the Georgina River has large,
multichannelled reaches with wide floodplains and many ecologically important
waterholes. There are key stream gauging sites which would assist with monitoring
and modelling these reaches.
Existing modelling approaches The existing modelling approaches are outlined below.
• IQQM Modelling of Cooper Creek
An IQQM (Integrated Quantity and Quality Model) daily flow simulation
model has been developed for Cooper Creek as part of the preparation of a
water management plan. Thoms and Cullen comment on the limitations of
this approach for assessing the ecological impacts of water withdrawals from
Cooper Creek.
• Flow transmission modelling
Flow transmission modelling was undertaken by Knighton and Nanson. They
showed that a 3 parameter Muskingum model can be used to route flood
waves down Cooper Creek.
• Modelling of the Diamantina River and part of Cooper Creek
Justin Costelloe and others at the University of Melbourne have modelled
flow and flood extents in the Diamantina River and Cooper Creek.
• Modelling of Lake Eyre floods
Modelling of floods and flow extents in the whole of the Lake Eyre Basin has
been undertaken using the RORB computer model
• Rainfall runoff modelling of the Lake Eyre Basin
The SIMHYD rainfall runoff model was used by McMahon et al. to determine
the spatial distribution of mean annual runoff throughout the Lake Eyre Basin.
Peel et al used SIMHYD to derive unimpaired i.e. ‘natural’ monthly
streamflows for 331 catchments in Australia. Unfortunately, there was only
one station in the LEB, Todd River at Wigley Gorge. However, because of this
work unimpaired streamflows are now available at this site from 1901 to
1998. It is likely to be possible to extend this methodology to other small to
medium catchments in the LEB. The approach will be less accurate in large
catchments with high transmission losses.
LEB River Assessment Implementation Plan Project: Milestone 1 Report
92 | P a g e
Flood Extent Attribute
Flood extent indicator
Objectives: Investigation into relationships between discharge and flood
extent relationships using flow data and analysis of satellite imagery are
required. Linked projects include WLD wetland mapping, SA projects
SGFP (Phelps), Santos and Dave Roshier’s work (Notes from March 2005
Lake Eyre Basin Rivers Workshop, March 22 & 23). Justin Costelloe’s
recent work conducted at University of Melbourne may have addressed
some of these knowledge gaps but this report has not been provided.
Waterholes and wetlands theme
Waterhole and Wetland Biodiversity Attribute
Iconic species indicator
Objectives: develop conceptual models and identify indicators for species
under threat, e.g. frogs, turtles, water rats, monitors, brush tail possum,
Cooper Ck catfish etc.
Cane toads indicator
Objectives: Development of a conceptual model to consider cane toad
impacts in LEB is required.
Riparian and floodplain theme
Riparian and Floodplain Biodiversity Attribute
Bird biodiversity indicator could be developed.
Riparian Vegetation Condition Attribute
Riparian vegetation composition and extent indicator
Objectives: To develop techniques for assessing regional, catchment and
basin-scale indicators of riparian vegetation condition and extent using
remotely sensed data and explore collaboration with existing State
programmes, eg. SLATS (Qld).
Floodplain Vegetation Condition Attribute
Floodplain vegetation composition and extent indicator
Objectives: develop techniques for assessing regional, catchment and
basin-scale indicators of floodplain vegetation condition and extent using
remotely sensed data. Explore collaboration with existing State
programmes, eg. Rapid Mobile Data Collection (see

LEB River Assessment Implementation Plan Project: Milestone 1 Report
93 | P a g e
http://www.environment.gov.au/land/publications/acris/report08.html)
(Qld) or National programmes, eg. ACRIS, AussieGrass.
Physical form theme
Erosion Potential and Land Use and Landscape Change Attribute
Erosion potential and land use change indicator
Objectives: The development of models that are able to predict
responses to events, e.g. expected vegetation cover changes in response
to rainfall work (Notes from March 2005 Lake Eyre Basin Rivers
Workshop, March 22 & 23).
Stream network model to assess impact of land use and climate change
Objectives: Development of a model that characterises the entire stream
network of the Lake Eyre Basin and compares this against a reference
stream network.
Water quality theme
River bed sediment geochemistry audit
Sediment geochemistry indicator
Objectives: Development of a geochemical data base of river bed
sediment through out the basin to determine the longer term impact of
mining and land uses in the Lake Eyre Basin.

LEB River Assessment Implementation Plan Project: Milestone 1 Report
94 | P a g e
9. Appropriateness of reporting timeframe.
The assessment challenge
The Lake Eyre Basin River Assessment project recommended a “hybrid approach” for
the assessment of rivers within the Basin. This involved the collection of data at three
spatial scales – local, regional and catchment and over a range of time scales. A
network of locations across the basin was to be employed where strategic sites and a
number of randomly selected sites were to be sampled for a “site-based” or local
assessment. This was to be done in order to quantify within location variability. Site
based indicators were then to be up-scaled into providing the larger catchment
based assessment. In conjunction with this network of strategic sites, a network of
regions was also to be assessed for landscape change and physical form indicators.
Some of the suggested indicators recommended to be sampled at either a local scale
(site based measurements), regional scale (multiple site measurements, regional
surveys or remotely sensed data) or for the hydrological indicators at the catchment
scale are presented in Table 2.
Essentially the approach taken for the recommended Lake Eyre Basin Rivers
Assessment was a trend based assessment. However, challenges to this are in not
only selecting appropriate indicators but also in incorporating the enhanced spatial
and temporal variations in natural “condition” that are evident across the Lake Eyre
Basin. At any one point in time, natural variations in flooding and rainfall will mean
sections will naturally be in “good” condition while others are in “poor” condition.
Therefore a traditional trend and assessment may not be appropriate to the Lake
Eyre Basin because of the length of time required in data collection to constructed
statistical relevant trends. In excess of 30 years of high quality data, collected at a
single site, are required in order to provide statistical significant trends in highly
variable systems (Ladson 2000). Instead, the dynamic and changing nature of these
natural conditions must be captured in the interpretation of any indicator
assessment and from a management perspective should be incorporated in
managing the dynamic mosaics of the Lake Eyre Basin.
Furthermore, the exact number of sites required to make an assessment of condition
and detect possible change (power) for each indicator will ultimately need to be
determined for the Lake Eyre Basin from continued analysis of assessment data and a
series of Pilot Studies. In the Murray Darling Basin Sustainable Rivers Audit between
18 and 30 sites per river valley (sub-catchment) were needed for various indicators
to make a catchment assessment of condition. Indeed, this estimate of the number
of sites required, was made by assuming a nested sampling design, with replicate
sites sampled within different locations; giving broad geographic coverage, but also
the ability to quantify the within-site variability.

LEB River Assessment Implementation Plan Project: Milestone 1 Report
95 | P a g e
For the Lake Eyre Basin assessment at the local scale strategic sites were to include
Wetlands of National significance, Ramsar sites or other strategic conservation sites
as well as established monitoring or research sites with existing data. Additional sites
were to be located in the Headwaters, where sites should be nested within sub-
catchments along with sites in the Channels & Waterholes and Terminal Wetlands. In
terms of the regional scale assessment, it was recommended the Physical Form
indicators be measured only. The catchment based assessment focused on the Flow
Theme indicators.
Given the reliance on trends based assessment a standard assessment timeframe for
each indicator was recommended combined with ad-hoc events based monitoring. In
particular, the events based monitoring was to be based around rainfall and flows in
the headwater regions. Any assessment of trends in this region needs to consider the
initial condition and variability associated with seasonal extremes. Scale factors and
indicators chosen will determine the choice of frequency of assessment. Different
indicators will be assessed at different frequencies within the 10 year reporting
framework. The suggested frequency of assessment is provided in the summary
table.
The recommendations for spatial and temporal sampling within the assessment
program have been made based on professional opinion.
An alternate approach
It is widely acknowledged that Australian river landscapes are under pressure and
continue to degrade under existing management practices. This is not surprising.
Landscapes and ecosystems are moving targets characterized by episodic change,
patchiness, variability, multiple scales of operation and multiple stable states in both
the social and biophysical domains (Gunderson and Holling 2002). Time and time
again, landscapes and ecosystems managed for some type of equilibrium carrying
capacity have been thwarted by surprise events, changes in thresholds and market
failures (Carpenter and Folke 2006). Time and time again it has been shown that
optimizing efficiency to deliver a defined benefit does not lead to sustainability, but
rather to collapse (Walker and Salt 2006). New ideas are required to improve the
management and monitoring of Australian river landscapes and ecosystems.
Resilience Thinking provides one umbrella under which to consider the future
management of river ecosystems.
Resilience is the amount of change a system can undergo (its capacity to absorb
disturbance) and remain within the same regime that essentially retains the same
function, structure and feedbacks (Walker and Salt 2006). Resilience Thinking seeks
to determine how societies, economies and ecosystems can be managed to confer
resilience, that is, how to maintain the capacity of a system to absorb disturbance
without changing to a different state.

LEB River Assessment Implementation Plan Project: Milestone 1 Report
96 | P a g e
Resilience Thinking offers nine fundamental principles that may form components of
a framework for managing and monitoring the resilience of the Lake Eyre Basin:
1. Recognition of the potential for alternate stable states to exist within riverine
landscapes.
2. Recognition that riverine landscapes properties can vary significantly within a
stable state.
3. Riverine landscapes properties can display significant spatial and temporal
variability at different scales within a stable state.
4. Thresholds do exist within riverine landscapes and act as tipping points
between alternate stable states.
5. Thresholds exist at multiple scales but not all result in a shift to an alternate
state.
6. Slow variables are important in driving regime shifts.
7. Riverine landscapes cycle through adaptive loops and their position within the
loop sets their form and function.
8. Riverine landscapes are essentially social-ecological systems integrating
ecosystems and human society.
9. Managing and monitoring riverine landscapes for resilience requires
adaptability or the capacity to adapt to and influence change.
There are two additional approaches that are complementary to Resilience Thinking,
which provide different components of a framework for managing and monitoring of
resilience in riverine landscapes. The ecosystem approach focuses on the
interactions among ecological entities and their environments, and thus, takes an
encompassing and synthetic view of nature rather than a fragmented view (Likens
1992). The ecosystem approach recognizes the influences of disturbance, scale
spatial heterogeneity and spatial variability on the relationships between ecological
entities and their environments. Contemporary views of ecosystems also view
humans as a keystone species within the ecosystem.
The ecosystem approach offers six fundamental principles that may form
components of a framework for managing and monitoring resilience in riverine
landscapes:
1. Variability and heterogeneity are fundamental drivers of pattern and process in
riverine landscapes.
2. Fluxes and cycling of materials and energy are important drivers of riverine
landscapes.
3. Riverine landscapes are hierarchically organised whereby patterns and
processes must be viewed at different scales.

LEB River Assessment Implementation Plan Project: Milestone 1 Report
97 | P a g e
4. Understanding riverine landscapes requires a focus on interactions between
different disciplinary elements (e.g. biological, chemical geomorphological,
hydrological, social and economic).
5. Riverine landscapes can be understood via causal or correlative approaches:
the choice of method depends on prior knowledge and the scale of focus.
6. Human are keystone elements of riverine landscapes: they are drivers of
change and users of ecosystem goods and services.
Strategic Adaptive Management was developed as a local tool for the management
of biodiversity in Kruger National Park, South Africa (Biggs and Rogers 2003).
Strategic Adaptive Management offers a framework for natural resource
management and decision making in environmental, social and institutional
situations characterized by variability, uncertainty, incomplete knowledge and
multiple stakeholders. Three key tenets form the basis for the management and
decision-making process in Strategic Adaptive Management: strategic and value-
based planning based on scientific and societal needs and values; a learning by doing
approach to management planning; and, participatory engagement of all
stakeholders to serve their needs, access their inputs and secure their cooperation
(Rogers et al 2008).
Strategic Adaptive Management offers six fundamental principles that may form
components of a framework for managing and monitoring resilience in riverine
landscapes:
1. All stakeholders are involved in the process of developing a vision for the
desired state of riverine landscape condition.
2. A vision for the desired state of riverine landscape condition is translated into
an objectives hierarchy.
3. TPCs (Thresholds of Potential Concern) are generated to define acceptable
levels of change in riverine landscape form and function.
4. Research and observations of riverine landscape form and function are used to
audit and understand river ecosystem condition in relation to TPCs.
5. Management interventions are an accepted part of ecosystem processes but
only occur in context of TPCs.
6. Learning by doing is an essential part of SAM: knowledge of river ecosystems is
constantly reviewed in order to update TPCs and management options.
The principles of Resilience Thinking, the ecosystem approach and Strategic Adaptive
Management are here collated to form the components of a good practice
framework for managing and monitoring resilience in the Lake Eyre Basin.
Frameworks are used widely in many disciplines as a means to organise ideas,
understand systems, identify direct cause and effect links and guide decision making

LEB River Assessment Implementation Plan Project: Milestone 1 Report
98 | P a g e
about system management. Frameworks often fail in these functions, especially in
complex systems, because of the lack of recognition of the hierarchical organisation
of ideas, contexts and methods. The ‘why’, ‘what’ and ‘how’ components of any
framework are often mixed together, resulting in confused logical levels of
organisation and thinking.
The components of a best practice framework for managing and monitoring
resilience in the Lake Eyre Basin form three levels of organisation representing the
‘why’, ‘what’ and ‘how’ of managing and monitoring riverine landscapes.
The first level places river ecosystem resilience as the highest component. Resilience
forms the principle that guides the other levels of the framework. Without this
anchor, other levels of the framework have no context. In short, it should be viewed
as an aim. In this case, the context is that managing for the resilience of river
ecosystems means maintaining the capacity of the system to absorb change or
disturbance while remaining in essentially the same state that retains the same
function, structure and feedbacks.
River ecosystem resilience
The capacity to absorb change or disturbance without moving to a new stateWhy are we
managing
river
ecosystems?
What we
need
to understand
to manage
river
ecosystems
How we will
understand
river
ecosystems
Ecosystem Understanding
- Heterogeneity & variability
- Hierarchy & scale
- Flux & cycling
- Slow variables
- Multiple stable states
Adaptive Cycles
- Interdisciplinarity
Social systems
- Learning by doing
- Stakeholder engagement
- Values
Research
practice
Desired
states
Thresholds &
thresholds of
potential concern
Auditing &
monitoring
Pattern &
process
Governance &
institutional
arrangements
Figure 3: Components of a best practice framework for managing and monitoring resilience in the Lake Eyre Basin.
This second level defines the essential elements needed for an understanding of
managing and monitoring for resilience in the riverine landscapes of the lake Eyre
Basin. Each component of this level must be viewed in the context of the higher
level to ensure that it maintains this focus. The second level of the framework is
comprised of three components:
Ecosystem understanding is essentially about understanding the biophysical
system. This component is characterized by paradigms and concepts that have
LEB River Assessment Implementation Plan Project: Milestone 1 Report
99 | P a g e
been shown in the scientific literature to describe the properties inherent in the
structure and functioning of riverine landscapes.
Adaptive cycles pertain to understanding riverine landscapes in terms of cycles
of collapse and renewal. The position of the ecosystem within the adaptive loop
influences the characteristics of the system, vulnerability to change and
opportunity for change.
Social systems represent the social components of managing resilience in
riverine landscapes, and pertain to communities, stakeholders, governance and
institutions.
The third level describes how the components of understanding will be achieved.
Components at this level are essentially methods and tools that can be used to
operationalize the understanding about managing and monitoring resilience in the
riverine landscapes of the Lake Eyre Basin that is the goal of the second level. The
third level of the framework is comprised of six components:
Pattern and process expresses the need to include structural and functional
elements of ecosystems that may be important in maintaining resilience.
Auditing and monitoring pertains to the ways that the state or condition of an
ecosystem is assessed or measured, within the context of the overall aim to
manage resilience.
Research practices highlight that the choice of paradigms, methods and scales of
observation must be set within the context of managing resilience.
Thresholds and Thresholds of Potential Concern can be used in managing
resilience to indicated demonstrated or actual tipping point between alternate
stable states.
Desired states describe the states towards which the management of resilience
should aim. Desired states are set with the input of all stakeholders.
Governance and institutional arrangements represent the policy, legislation and
governance instruments to facilitate the implementation of an approach to
managing the resilience of river ecosystems.
It is important to reiterate here that these components are not the framework itself,
but rather, represent the underlying philosophy of an approach for managing
resilience in the riverine landscapes of the Lake Eyre Basin. Development of
components is essentially the first step in a three step process for introducing these
ideas into the management arena of the Lake Eyre Basin. The remaining steps are:
Turning the components into a framework – this step will require the formation
and ordering of components between and within the components of the
framework. Essentially, a framework is a map outlining the various routes that
can be taken to manage resilience in riverine landscapes.

LEB River Assessment Implementation Plan Project: Milestone 1 Report
100 | P a g e
Implementing the framework – this step involves developing the management,
policy and governance structures and attitudes required to go about managing
for resilience in the Lake Eyre Basin riverine landscapes. This step is not simple
or easy. As Rogers (2006) points out, the real river management challenge lies in
developing a collective understanding, and integration, within and between
scientists, citizens and management agencies. However, the experiences of
biodiversity management in the rivers of Kruger National Park suggest that this
can be achieved though participatory and cooperative approaches and a
commitment to long-term co-learning.

LEB River Assessment Implementation Plan Project: Milestone 1 Report
101 | P a g e
10. Recommendations
In progressing to the next stages of this project, which deal directly with the
implementation plan and governance arrangements covering future assessments
(Milestones 3 and 4), Kiri-ganai Research makes the following recommendations:
i. A revised LEB assessment method should be agreed to be based around whole-of-
Basin condition, in line with the terms of the LEB Intergovernmental Agreement.
An outline of such a method is provided in this report. Six components are
considered to be able to monitored immediately; these being physical habitat,
fish, water birds and riparian vegetation.
ii. It is the variability and complexity of environmental processes at multiple spatial
and temporal scales in response to a range of disturbances that needs to be
captured in any future development of a management and monitoring
programme for the Lake Eyre Basin. A Strategic Adaptive Management system is
recommended for an assessment of the Lake Eyre Basin with resilience of the
natural resources of the basin being the ultimate aim of the programme. This
provides the context for the selection of indicators, collection of data and
establishment of Thresholds of Probable Concern.
iii. The timing of future assessments should be every 5 to 10 years, with ongoing
monitoring reported annually, even where this is minimal monitroring.
iv. Governance arrangements in respect to future Assessments should be adopted
that support a strategic adaptive management approach. Such arrangements
should allow for continuous learning and improvement, and ensure that
assessments inform stakeholders responses.
v. The workshop proposed for August 2009 should include discussion around the
technical component of the assessment process as well as the governance and
implementation components.

LEB River Assessment Implementation Plan Project: Milestone 1 Report
102 | P a g e
Appendix A: Terms of Reference
LEB Rivers Assessment Implementation Plan
The Department of Environment, Water, Heritage and the Arts requires the development of a Lake Eyre Basin Rivers Assessment Implementation Plan (Implementation Plan) to identify how regular on-going monitoring of key indicators of the condition of river ecosystems and catchments will be implemented within the Lake Eyre Basin Intergovernmental Agreement Area. The process of developing the Plan will involve:
1) Review of achievements to date under the Lake Eyre Basin (LEB) Rivers
Assessment (Milestone 1)
a. A number of activities have been undertaken as part of the LEB Rivers Assessment to date. As part of developing the Implementation Plan, reports from these activities are to be reviewed and recommendations incorporated into the Plan for future on-going monitoring.
b. The Service Provider is to provide a draft report to the Department, for review and comment, indicating how the recommendations have been considered. The Service Provider will be required to address all comments received and provide a final document to the Department. The report should include, but is not limited to:
the title of the report addressed;
how the recommendations have been considered in developing the Methodology/Implementation Plan;
any further action required.
2) An agreed LEB Rivers Assessment Methodology (Milestone 2)
As part of developing the Implementation Plan, the Service Provider is to finalise a methodology for monitoring that can be undertaken immediately, recognising that there will be a need for continued research and development of some indicators for future use.
This task will require the Service Provider to perform services including but not limited to:
a) identify the monitoring already being undertaken within the Lake Eyre Basin which will be included in the Implementation Plan;
b) identify the recommendations from previous LEBRA work that will be included in the Implementation Plan;
c) identify the indicators that were suggested in Method for Assessing the Health of Lake Eyre Basin Rivers that will be included in the Implementation Plan;
d) identify linkages with national monitoring, evaluation and reporting frameworks; e) identify monitoring actions that can be undertaken immediately – summarise
their methods and costs; f) identify monitoring actions that require further research and development; and

LEB River Assessment Implementation Plan Project: Milestone 1 Report
103 | P a g e
g) advise on the appropriateness of reporting on a ten year basis or other timeframe.
3) Support development and documentation of governance arrangements
(Milestone 3)
The Implementation Plan should briefly review the current responsibilities of the jurisdictions with the Agreement area and make recommendations on the options for governance associated with ongoing monitoring. The Service Provider is to provide a draft written report to the Department indicating suggested governance arrangements which includes but is not limited to:
a) reporting requirements; b) the role of the Lake Eyre Basin Scientific Advisory Panel; c) the role of Government officers; d) the role of Regional Natural Resource Management groups; e) links with Bureau of Meteorology; f) scientific review of the program; g) Quality assurance/quality control; h) research and development issues independent of the assessment.
4) Development of a business model (Milestone 4)
The LEBRA Implementation Plan is to include an outline of how the monitoring activities will be funded or supported.
The Service Provider is to provide a draft report to the Department, for review and comment, indicating suggested governance arrangements. The Service Provider will be required to address all comments received and provide a final document to the Department. The report should include, but is not limited to:
a) the organisation committed to providing funding or support; b) the funding or support to be provided; c) the source of the funding or support; and d) duration of commitment
5) LEB Rivers Assessment Implementation Plan (Milestone 5)
Using information from Milestone Reports 2, 3 and 4 the Service Provider will prepare a draft LEB Rivers Assessment Implementation Plan. The Service Provider will be required to address all comments received and provide a final document to the Department. Detail on what is to be included in the Implementation Plan is to be discussed with the Steering Committee.
6) Workshop (Milestone 6)
After completion of Milestone 5 the Service Provider is required to organise and participate at a workshop with relevant stakeholders. The location and duration of the workshop will be determined by the Steering Committee and the Service Provider together, and may include participation of some stakeholders by telephone. The services that will be required include, but are not limited to:

LEB River Assessment Implementation Plan Project: Milestone 1 Report
104 | P a g e
a) Organisation of the workshop (location to be agreed with the Steering Committee, will be a capital city).
b) Attendance and presentation at the workshop which will include:
- outlining the approach undertaken to develop the Implementation Plan;
- feedback received from stakeholders;
- commitment to regular on-going monitoring of key indicators of the condition of river ecosystems and catchments.

LEB River Assessment Implementation Plan Project: Milestone 1 Report
105 | P a g e
Appendix B: References Bailey, V. 2001. Western Streams Water Quality Monitoring Project. Queensland
Department of Natural Resources and Mines, Brisbane.
Bailey, V. and Long, P. 2001. Wetland, Fish and Habitat Survey in the Lake Eyre Basin,
Queensland: Final Report. Queensland Department of Natural Resources and
Mines, Brisbane.
Balcombe, S.R. and Kerezy, A. 2008. Preliminary Fish Sampling for the Lake Eyre Basin
Rivers Assessment: Testing the Fish Trajectory Model. Australian Rivers Institute,
Griffith University.
Balcombe, S.R. and McNeil, D.G. 2008. Joint Recommendations for fish monitoring in
Lake Eyre Basin Rivers: testing the Fish Trajectory Model in Queensland and
South Australia.
Biggs H.C., Rogers K.H., 2003. An adaptive system to link science, monitoring and
management in practice. In: du Toit J.T., Rogers K.H., Biggs H.C. (Eds). The
Kruger Experience: Ecology and Management of Savanna Heterogeneity. Island
Press: Washington.
Bunn SE, Thoms MC, Hamilton SK and Capon SJ (2006) Flow variability in dryland
rivers: boom, bust and the bits in between. River Research Applications 22: 179-
186
Carpenter S.R., Folke, C., 2006. Ecology for transformation. Trends in Ecology and
Evolution, 21: 309-315.
Chapin III FS, Kofinas GP and Folke C (2009) Principles of Ecosystem Stewardship: Resilience-Based Natural Resource Management in a Changing World (Springer, New York)
Choy S (2009) Enhanced Water Resource Assessment and the Aquatic Ecosystem Framework. (Internal working document) DNRM: Brisbane
Choy SC, Thompson CB and Marshal JC (2002) ‘Ecological condition of central Australian aridzone rivers’ Water Science and Technology 45(11): 225–232
Commonwealth of Australia (2001) Lake Eyre Basin (Intergovernmental Agreement)
Act 2001: Consolidated Agreement.
Costelloe, J. 2008. Updating and Analysis of the ARIDFLOD water level data in the
Lake Eyre Basin. Report to the South Australian Department of Water Land and
Biodiversity Conservation, Adelaide. University of Melbourne.
Costelloe, J. 2007. Final Report: Maintenance of ARIDFLOD Logger Network.
University of Melbourne.

LEB River Assessment Implementation Plan Project: Milestone 1 Report
106 | P a g e
Desert Channels Queensland Inc. (2009) Caring for Our Country Application on behalf
of LEB Partners. DCQ: Longreach
Desert Channels Queensland Inc. (2004) Our country: Our community. A community
information paper for the Queensland section of the Lake Eyre Basin. DCQ:
Longreach
Dept of Environment, Water, Heritage and the Arts. (2009) LEB CAC Rivers Assessment Actions 2003 to 2009. Internal Working Document. DEWHA: Canberra
Dept of Environment, Water, Heritage and the Arts. (2005) Notes from the LEB Rivers Assessment Workshop March 22 & 23 2005, Brisbane. DEWHA: Canberra
Dept of Environment, Water, Heritage and the Arts. (2003) LEB Rivers Assessment Brochure. DEWHA Canberra
Dept of Environment, Water, Heritage and the Arts. (2003) LEB Rivers Assessment Brochure. DEWHA Canberra
Dept of Environment, Water, Heritage and the Arts. (2003) Agreement for Provision of [funds] to Land and Water Australia for managing the project: “Lake Eyre Basin Rivers Assessment”. DEWHA: Canberra
Dept of Natural Resources & Mining (2009a) Stream & Estuary Assessment Program Aquatic Ecosystem Monitoring: A new approach (Brochure) DNRM: Brisbane Dept of Natural Resources & Mining (2009) Development of Conceptual Pressure-Vector-Response Models for Queensland’s Riverine Ecosystems. (SEAP technical paper 1)
Dept of Natural Resources & Mining (2009b) Stream & Estuary Assessment Program Aquatic Ecosystem Monitoring: A new approach (Brochure) DNRM, Brisbane
(2009c) Development of Conceptual Pressure-Vector-Response Models for Queensland’s Riverine Ecosystems. (SEAP technical paper 1) DNRM, Brisbane
Duguid A, Barnetson J, Clifford B, Pavey C, Albrecht D, Risler J and McNellie M (2005) Wetlands in the arid Northern Territory. A report to the Australian Government Department of the Environment and Heritage on the inventory and significance of wetlands in the arid NT. (Northern Territory Government Department of Natural Resources, Environment and the Arts. Alice Springs.) (http://www.nt.gov.au/nreta/wildlife/nature/aridwetlands.html)
Fairweather, P.G. (1999). State of environment indicator of ‘river health’: exploring the metaphor. Freshwater Biology 41: 211-220
Good, M., Bailey, V., Pritchard, J. and Wedderburn, S. 2008. ARIDFLO Building Our Knolwedge of Lake Eyre Basin Rivers: A Report to the Community. South Australian Department of Water, Land and Biodiversity Conservation, Adelaide
Groffman, P. M., J. S. Baron, T. Blett, A. J. Gold, I. Goodman, L. H. Gunderson, et al. 2006. Ecological thresholds: the key to successful environmental management or an important concept with no practi-cal application? Ecosystems 9:1–13

LEB River Assessment Implementation Plan Project: Milestone 1 Report
107 | P a g e
Gunderson L.H., Holling C.S. (eds), 2002. Panarchy: Understanding transformations in human and natural systems. Island Press, Washington, DC.
Hamilton SK, Bunn SE, Thoms MC and Marshal JC (2005) Persistence of Aquatic Refugia between Flow Pulses in a Dryland River System (Cooper Creek, Australia) Limnology and Oceanography 50 (3): 743-754
Herr, A., Smith, T. and Brake, L. 2007. Regional Profile of the Lake Eyre Basin Catchments, CSIRO Sustainable Ecosystems, Townsville and Desert Knowledge CRC, Alice Springs
Holling CS (ed.) (1978). Adaptive Environmental Assessment and Management. (Chichester, Wiley)
Humphries, P., George, A., Balcombe, S., van Daele, D., Larson, H., Harris, J. and Kennard, M. 2007. Report on the LEBRA Workshop: Determining the Natural Trajectory of Fish with the Lake Eyre Basin, November 20-21, 2006. Report to the Department for Water, Land and Biodiversity Conservation, South Australia.
Hunt J and Smith D (2007) Indigenous Community Governance Project: Year two research findings. (CAEPR, ANU, Canberra)
Jaensch R (2008) Floodplain wetlands and waterbirds of the channel country. South Australian Arid Lands NRM: Adelaide
Kingsford, R.T. and Porter, J.L. 2008. Scientific Validity of Using Waterbird Measures to Assess River Condition in the Lake Eyre Basin. University of New South Wales, Sydney
Ladson, T., Weinmann, E. Costelloe, J. and Tillard, J. 2006. Lake Eyre Basin Data Logging Review. Moroko Pty Ltd.
Lake Eyre Basin Community Advisory Committee (2008) Report to the Sixth Meeting of the Lake Eyre Basin Ministerial Forum 18 April 2008, Melbourne. DEWHA: Canberra
Lake Eyre Basin Ministerial Forum Scientific Advisory Panel (2009). Lake Eyre Basin Knowledge Strategy. (Internal Working Document) DEWHA: Canberra
Lake Eyre Basin Government Officers Working Group (2006) Lake Eyre Basin Agreement Strategy Implementation. DEWHA: Canberra
Lake Eyre Basin Ministerial Forum (2005) Agenda Papers for Ministerial Forum Meeting No.4 (14 October 2005). DEWHA: Canberra
Lake Eyre Basin Ministerial Forum (2004) Agenda Papers for Ministerial Forum Meeting No.3 (10 June 2004). DEWHA: Canberra
Lake Eyre Basin Ministerial Forum (2002) Agenda Papers for Ministerial Forum Meeting No.2 (25 October 2002). DEWHA: Canberra
Lake Eyre Basin Rivers Assessment Project Steering Committee (2004) Minutes of Meeting Thursday 20 May 2004. DEWHA: Canberra
Lake Eyre Basin Scientific Advisory Panel (2009) State of the Basin 2008: Rivers Assessment. DEWHA: Canberra

LEB River Assessment Implementation Plan Project: Milestone 1 Report
108 | P a g e
Land & Water Australia (2003) Lake Eyre Basin Rivers Assessment Methodology Development: Project Brief. LWA: Canberra
LEBSAP. 2009. State of the Basin 2008: Rivers Assessment. Background and Reference. Lake Eyre Basin Scientific Advisory Panel
Likens G.E., 1992. The Ecosystem Approach: Its Use and Abuse. Ecology Institute: Germany.
McMahon, T.A., Murphy, R., Peel, M.C., Costelloe, J.F. and Chiew, F.H.S. 2008. Understanding the surface hydrology of the Lake Eyrre Basin: Part 2 – Streamflow. Journal of Arid Environments 72: 1869-1886
McNeil, D. and Reid, D. 2008. Preliminary Fish Sampling for the Lake Eyre Basin Rivers Assessment: Testing the Fish Trajectory Model in South Australia. South Australian Research and Development Institute
McNeil, D., van Dele, J., Larson, H., Humphries, P., Harris, J., Balcombe, S. and Kennard, M. 2006. Report on the LEBRA Workshop: Determining the natural trajectory of fish within the Lake Eyre Basin, November 20-21, 2006
Moran M and Elvin R (2009) ‘Coping with complexity: adaptation of the governance system of Aboriginal affairs in desert Australia’. GeoJournal: in press.
Morgan, G. 2000. Landscape Health in Australia. A Rapid Assessment of the Relative Condition of Australia’s Bioregions and Subregions. Environment Australia and the National Land and Water Resources Audit, Commonwealth of Australia, Canberra.
Norris, R.H., Linke, S., Prosser, I., Young, W.J., Liston, P., Bauer, N., Sloane, N., Dyer, F., Thoms, M.C., (2007). Very-broad-scale assessment of human impacts on river condition. Freshwater Biology, 52, 959-976.
Office of the United Nation High Commissioner for Human Rights (OUNHCHR) (200&) Good Governance practices for the protection of human rights. (United Nations, Geneva)
Ostrom E (1999) ‘Coping with tragedies of the commons’. Annual Review of Political Science 2:493-535.
Parsons ME, Thoms MC, Norris RH (2004). Development of a standardised approach to river habitat assessment in Australia. Environmental Assessment and Monitoring. 98, 109-130.
Phelps D, Lynes BC, Connelly PT, Horrocks DJ, Fraser GW and Jeffery MR (2007) Sustainable Grazing in the Channel Country Floodplains (phase 2): A technical report on findings between March 2003 and June 2006. Meat & Livestock Australia: Sydney
Price P and Lovett S (2008) Consultancy to develop a draft Five Year Action Plan for the Lake Eyre Basin. DEWHA: Canberra
Rogers K. & Biggs H. (1999). Integrating indicators, endpoints and value systems in strategic management of the rivers of the Kruger National Park. Freshwater Biology 41, 439-451

LEB River Assessment Implementation Plan Project: Milestone 1 Report
109 | P a g e
Rogers K.H., Sherwill T., Grant R., Freitag-Ronaldson S., Hofmeyr M., 2008. A Framework for Developing and Implementing Management Plans for South African National Parks. South African National Parks, Pretoria. Available from http://www.sanparks.org/parks/kruger/conservation/scientific/key_issues/plans/adaptive/default.php
Sheldon F, McKenzie-Smith F, Brunner P, Hoggett A, Shephard J, Bunn S, McTainsh G, Bailey V and Phelps D (2005) Lake Eyre Basin Rivers Assessment Methods Development Project Methods for Assessing the Health of Lake Eyre Basin Rivers: Final report to Land & Water Australia. (LWA, Canberra)
Sheldon F, Brunner P and Hoggett A (2005) A Lake Eyre Basin Rivers Assessment Methodology Development Project Background Document 2: Classification of the Lake Eyre Basin Rivers. (Griffith University, Brisbane)
Sheldon F and Leigh C (2005) Lake Eyre Basin Rivers Assessment Methodology Development Project Background Document 4: Review of Ecological Indicators and Assessment Programs. (Griffith University: Brisbane)
Sheldon F (2003) Lake Eyre Basin Assessment Methodology Development Project Milestone Report No. 1 31st October 2003 (LWA, Canberra)
Stafford Smith M (In publication) ‘Contribution to report on Vulnerability of Remote Indigenous Communities in Northern Australia to Climate Change: Adaptive capacity and governance dimensions’
Stafford Smith M (2008) The 'desert syndrome' - causally-linked factors that characterise outback Australia. The Rangeland Journal 30:3-14.
Stafford Smith M and Cribb J (2009) Dry Times: A Blueprint for a Red Land. (CSIRO Publishing, Melbourne: forthcoming)
Stafford Smith DM, Abel NO, Walker BH and Chapin III FS (2009). ‘Drylands: coping with uncertainty, thresholds, and changes in state’ In: Principles of Ecosystem Stewardship: Resilience-Based Natural Resource Management in a Changing World. (Eds F. S. Chapin, III, G. P. Kofinas and C. Folke.) pp. 171-195
Stafford Smith M, Moran M and Seemann K (2008) The 'viability' and resilience of communities and settlements in desert Australia. The Rangeland Journal 30:123-135.
Stewardson M, Costelloe J, Siggins A and Sims N and Turral H (2009) Using Remote Sensing to Monitor River Health in the Lake Eyre Basin. Draft report to Department of Water, Land and Biodiversity Conservation (DWLBC, Adelaide)
Townsend C.R. & Riley R.H. (1999). Assessment of river health: accounting for perturbation pathways in physical and ecological space. Freshwater Biology 41, 393-405
Thoms, M.C., Dyer, F (2004). Hydraulic diversity in a regulated river. Fifth International Sympoium on Ecohydraulics. Aquatic habitats: Analysis and restoration, Madrid, Spain, 1289-1293
Walker B., Salt, D., 2006. Resilience thinking: Sustaining ecosystems and people in a changing world. Island Press, Washington, DC.

LEB River Assessment Implementation Plan Project: Milestone 1 Report
110 | P a g e
Walker KF, Puckridge JT and Blanch SJ (1997) Irrigation development on Cooper Creek, central Australia: Prospects for a regulated economy in a boom-and-bust ecology. Aquatic Conservation: Marine and Freshwater Ecosystems 7: 63-73
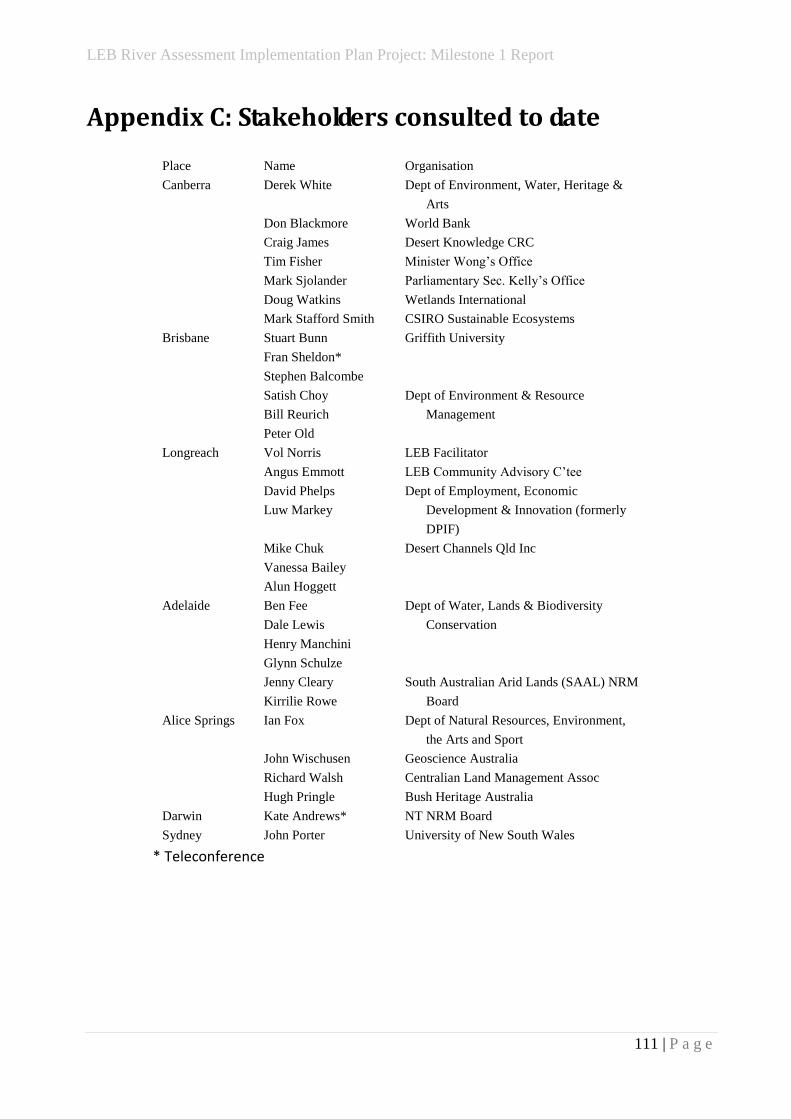
LEB River Assessment Implementation Plan Project: Milestone 1 Report
111 | P a g e
Appendix C: Stakeholders consulted to date Place Name Organisation
Canberra Derek White
Don Blackmore
Craig James
Tim Fisher
Mark Sjolander
Doug Watkins
Mark Stafford Smith
Dept of Environment, Water, Heritage &
Arts
World Bank
Desert Knowledge CRC
Minister Wong’s Office
Parliamentary Sec. Kelly’s Office
Wetlands International
CSIRO Sustainable Ecosystems
Brisbane Stuart Bunn
Fran Sheldon*
Stephen Balcombe
Satish Choy
Bill Reurich
Peter Old
Griffith University
Dept of Environment & Resource
Management
Longreach Vol Norris
Angus Emmott
David Phelps
Luw Markey
Mike Chuk
Vanessa Bailey
Alun Hoggett
LEB Facilitator
LEB Community Advisory C’tee
Dept of Employment, Economic
Development & Innovation (formerly
DPIF)
Desert Channels Qld Inc
Adelaide Ben Fee
Dale Lewis
Henry Manchini
Glynn Schulze
Jenny Cleary
Kirrilie Rowe
Dept of Water, Lands & Biodiversity
Conservation
South Australian Arid Lands (SAAL) NRM
Board
Alice Springs Ian Fox
John Wischusen
Richard Walsh
Hugh Pringle
Dept of Natural Resources, Environment,
the Arts and Sport
Geoscience Australia
Centralian Land Management Assoc
Bush Heritage Australia
Darwin Kate Andrews* NT NRM Board
Sydney John Porter University of New South Wales
* Teleconference