Embed Size (px)
Citation preview
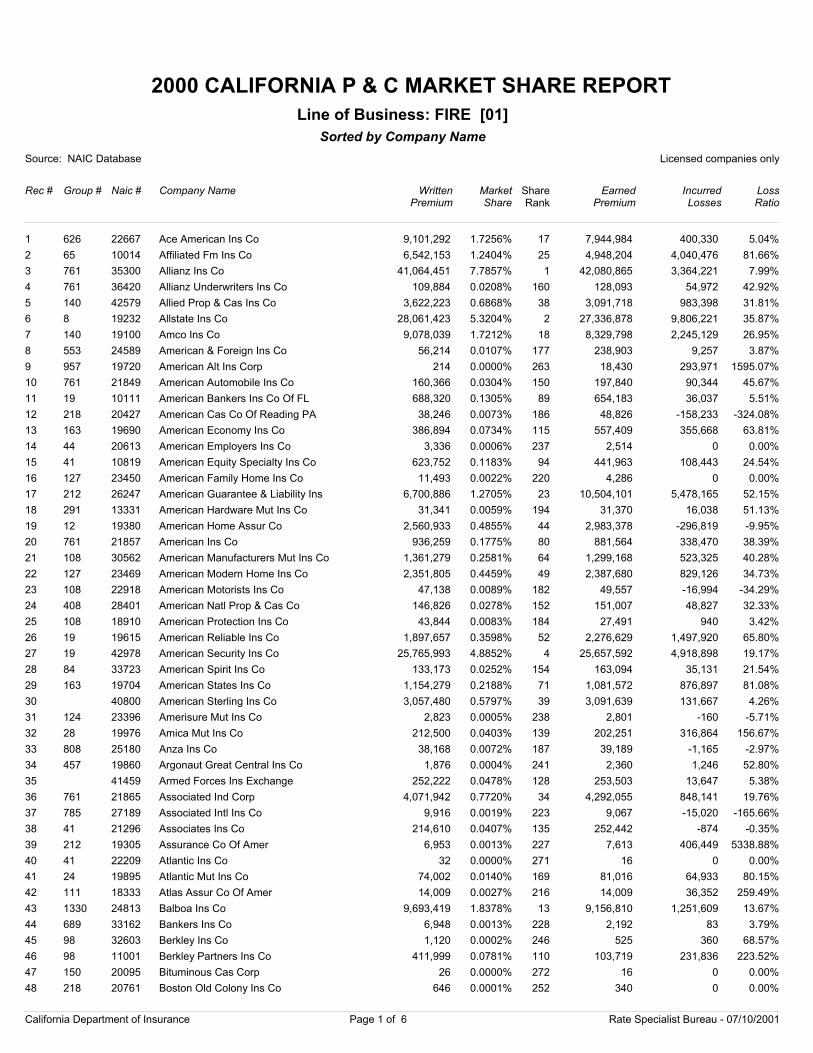
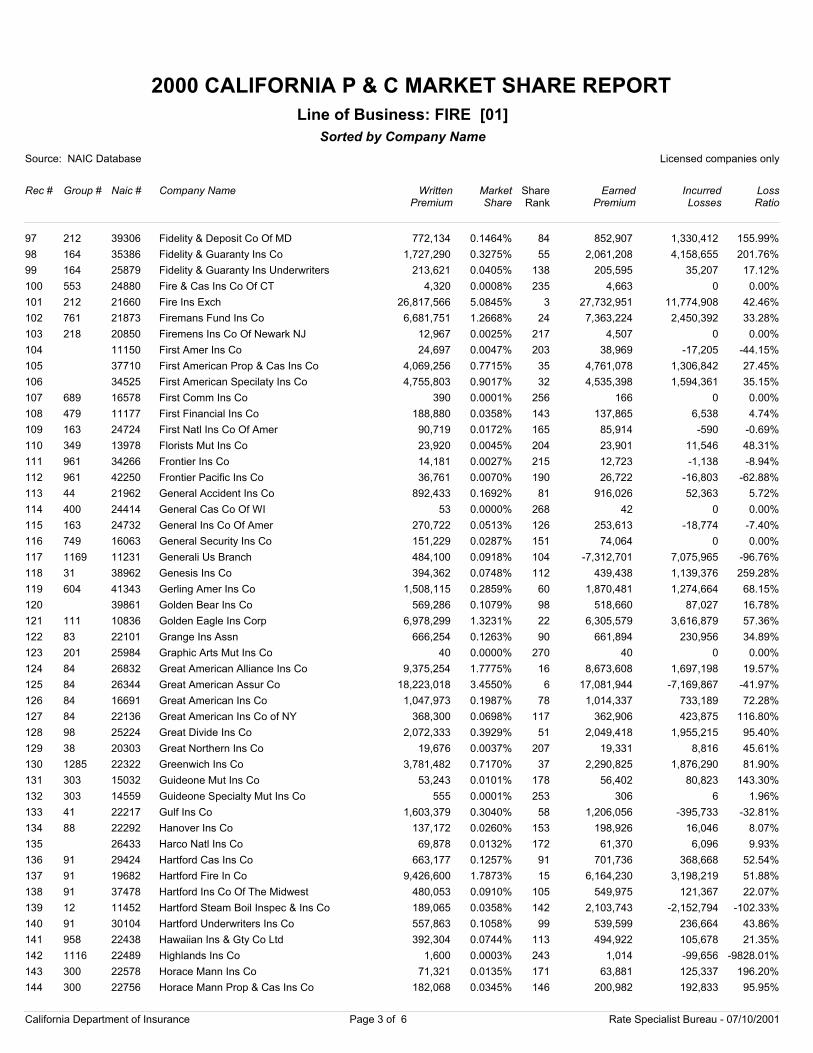
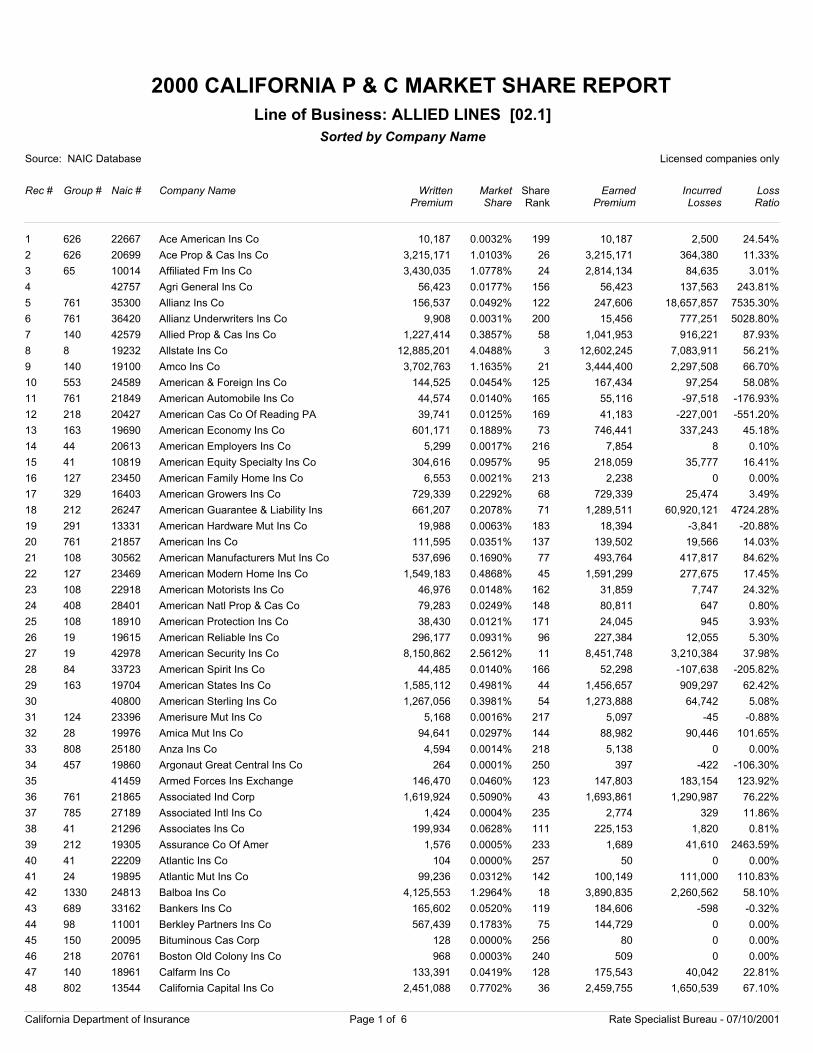
2000 CALIFORNIA P & C MARKET SHARE REPORT
Source: NAIC Database Licensed companies only
Rec # Group # Naic # Company Name
Sorted by Company Name
WrittenPremium
Market Share
EarnedPremium
IncurredLosses
LossRatio
Line of Business: FIRE [01]
ShareRank
1 626 22667 Ace American Ins Co 9,101,292 1.7256% 7,944,984 400,330 5.04%17
2 65 10014 Affiliated Fm Ins Co 6,542,153 1.2404% 4,948,204 4,040,476 81.66%25
3 761 35300 Allianz Ins Co 41,064,451 7.7857% 42,080,865 3,364,221 7.99%1
4 761 36420 Allianz Underwriters Ins Co 109,884 0.0208% 128,093 54,972 42.92%160
5 140 42579 Allied Prop & Cas Ins Co 3,622,223 0.6868% 3,091,718 983,398 31.81%38
6 8 19232 Allstate Ins Co 28,061,423 5.3204% 27,336,878 9,806,221 35.87%2
7 140 19100 Amco Ins Co 9,078,039 1.7212% 8,329,798 2,245,129 26.95%18
8 553 24589 American & Foreign Ins Co 56,214 0.0107% 238,903 9,257 3.87%177
9 957 19720 American Alt Ins Corp 214 0.0000% 18,430 293,971 1595.07%263
10 761 21849 American Automobile Ins Co 160,366 0.0304% 197,840 90,344 45.67%150
11 19 10111 American Bankers Ins Co Of FL 688,320 0.1305% 654,183 36,037 5.51%89
12 218 20427 American Cas Co Of Reading PA 38,246 0.0073% 48,826 -158,233 -324.08%186
13 163 19690 American Economy Ins Co 386,894 0.0734% 557,409 355,668 63.81%115
14 44 20613 American Employers Ins Co 3,336 0.0006% 2,514 0 0.00%237
15 41 10819 American Equity Specialty Ins Co 623,752 0.1183% 441,963 108,443 24.54%94
16 127 23450 American Family Home Ins Co 11,493 0.0022% 4,286 0 0.00%220
17 212 26247 American Guarantee & Liability Ins 6,700,886 1.2705% 10,504,101 5,478,165 52.15%23
18 291 13331 American Hardware Mut Ins Co 31,341 0.0059% 31,370 16,038 51.13%194
19 12 19380 American Home Assur Co 2,560,933 0.4855% 2,983,378 -296,819 -9.95%44
20 761 21857 American Ins Co 936,259 0.1775% 881,564 338,470 38.39%80
21 108 30562 American Manufacturers Mut Ins Co 1,361,279 0.2581% 1,299,168 523,325 40.28%64
22 127 23469 American Modern Home Ins Co 2,351,805 0.4459% 2,387,680 829,126 34.73%49
23 108 22918 American Motorists Ins Co 47,138 0.0089% 49,557 -16,994 -34.29%182
24 408 28401 American Natl Prop & Cas Co 146,826 0.0278% 151,007 48,827 32.33%152
25 108 18910 American Protection Ins Co 43,844 0.0083% 27,491 940 3.42%184
26 19 19615 American Reliable Ins Co 1,897,657 0.3598% 2,276,629 1,497,920 65.80%52
27 19 42978 American Security Ins Co 25,765,993 4.8852% 25,657,592 4,918,898 19.17%4
28 84 33723 American Spirit Ins Co 133,173 0.0252% 163,094 35,131 21.54%154
29 163 19704 American States Ins Co 1,154,279 0.2188% 1,081,572 876,897 81.08%71
30 40800 American Sterling Ins Co 3,057,480 0.5797% 3,091,639 131,667 4.26%39
31 124 23396 Amerisure Mut Ins Co 2,823 0.0005% 2,801 -160 -5.71%238
32 28 19976 Amica Mut Ins Co 212,500 0.0403% 202,251 316,864 156.67%139
33 808 25180 Anza Ins Co 38,168 0.0072% 39,189 -1,165 -2.97%187
34 457 19860 Argonaut Great Central Ins Co 1,876 0.0004% 2,360 1,246 52.80%241
35 41459 Armed Forces Ins Exchange 252,222 0.0478% 253,503 13,647 5.38%128
36 761 21865 Associated Ind Corp 4,071,942 0.7720% 4,292,055 848,141 19.76%34
37 785 27189 Associated Intl Ins Co 9,916 0.0019% 9,067 -15,020 -165.66%223
38 41 21296 Associates Ins Co 214,610 0.0407% 252,442 -874 -0.35%135
39 212 19305 Assurance Co Of Amer 6,953 0.0013% 7,613 406,449 5338.88%227
40 41 22209 Atlantic Ins Co 32 0.0000% 16 0 0.00%271
41 24 19895 Atlantic Mut Ins Co 74,002 0.0140% 81,016 64,933 80.15%169
42 111 18333 Atlas Assur Co Of Amer 14,009 0.0027% 14,009 36,352 259.49%216
43 1330 24813 Balboa Ins Co 9,693,419 1.8378% 9,156,810 1,251,609 13.67%13
44 689 33162 Bankers Ins Co 6,948 0.0013% 2,192 83 3.79%228
45 98 32603 Berkley Ins Co 1,120 0.0002% 525 360 68.57%246
46 98 11001 Berkley Partners Ins Co 411,999 0.0781% 103,719 231,836 223.52%110
47 150 20095 Bituminous Cas Corp 26 0.0000% 16 0 0.00%272
48 218 20761 Boston Old Colony Ins Co 646 0.0001% 340 0 0.00%252
California Department of Insurance Page 1 of 6 Rate Specialist Bureau - 07/10/2001
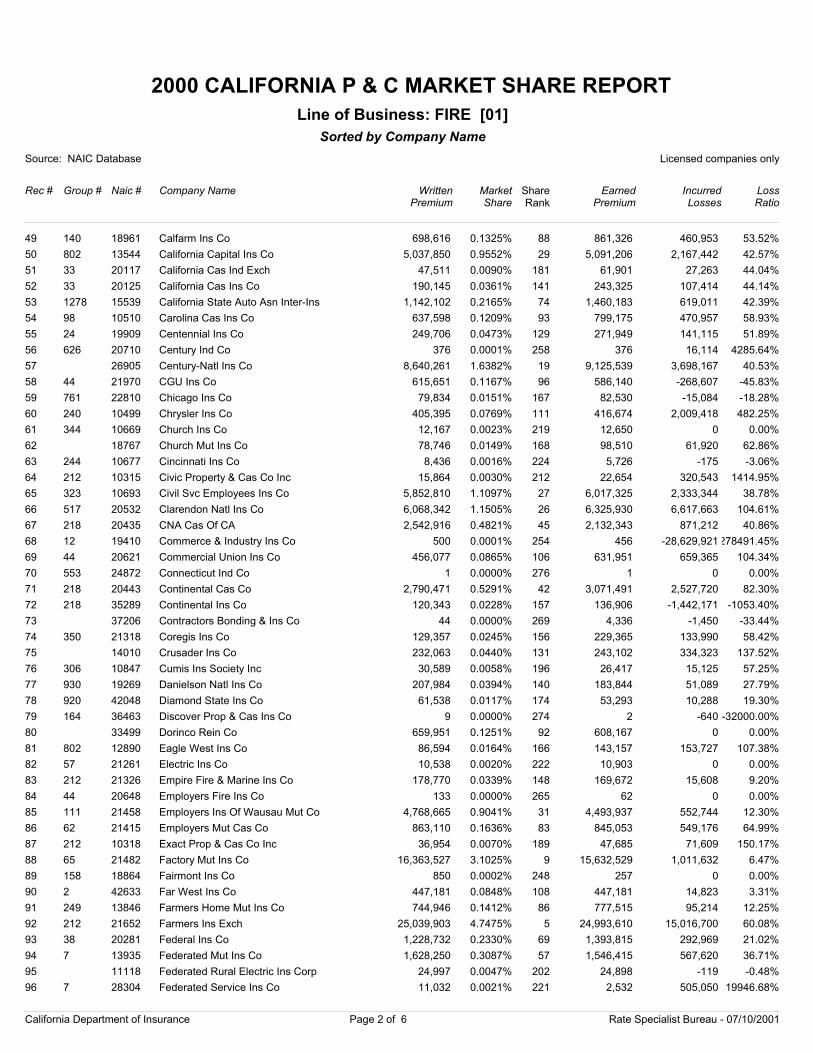
2000 CALIFORNIA P & C MARKET SHARE REPORT
Source: NAIC Database Licensed companies only
Rec # Group # Naic # Company Name
Sorted by Company Name
WrittenPremium
Market Share
EarnedPremium
IncurredLosses
LossRatio
Line of Business: FIRE [01]
ShareRank
49 140 18961 Calfarm Ins Co 698,616 0.1325% 861,326 460,953 53.52%88
50 802 13544 California Capital Ins Co 5,037,850 0.9552% 5,091,206 2,167,442 42.57%29
51 33 20117 California Cas Ind Exch 47,511 0.0090% 61,901 27,263 44.04%181
52 33 20125 California Cas Ins Co 190,145 0.0361% 243,325 107,414 44.14%141
53 1278 15539 California State Auto Asn Inter-Ins 1,142,102 0.2165% 1,460,183 619,011 42.39%74
54 98 10510 Carolina Cas Ins Co 637,598 0.1209% 799,175 470,957 58.93%93
55 24 19909 Centennial Ins Co 249,706 0.0473% 271,949 141,115 51.89%129
56 626 20710 Century Ind Co 376 0.0001% 376 16,114 4285.64%258
57 26905 Century-Natl Ins Co 8,640,261 1.6382% 9,125,539 3,698,167 40.53%19
58 44 21970 CGU Ins Co 615,651 0.1167% 586,140 -268,607 -45.83%96
59 761 22810 Chicago Ins Co 79,834 0.0151% 82,530 -15,084 -18.28%167
60 240 10499 Chrysler Ins Co 405,395 0.0769% 416,674 2,009,418 482.25%111
61 344 10669 Church Ins Co 12,167 0.0023% 12,650 0 0.00%219
62 18767 Church Mut Ins Co 78,746 0.0149% 98,510 61,920 62.86%168
63 244 10677 Cincinnati Ins Co 8,436 0.0016% 5,726 -175 -3.06%224
64 212 10315 Civic Property & Cas Co Inc 15,864 0.0030% 22,654 320,543 1414.95%212
65 323 10693 Civil Svc Employees Ins Co 5,852,810 1.1097% 6,017,325 2,333,344 38.78%27
66 517 20532 Clarendon Natl Ins Co 6,068,342 1.1505% 6,325,930 6,617,663 104.61%26
67 218 20435 CNA Cas Of CA 2,542,916 0.4821% 2,132,343 871,212 40.86%45
68 12 19410 Commerce & Industry Ins Co 500 0.0001% 456 -28,629,921278491.45%254
69 44 20621 Commercial Union Ins Co 456,077 0.0865% 631,951 659,365 104.34%106
70 553 24872 Connecticut Ind Co 1 0.0000% 1 0 0.00%276
71 218 20443 Continental Cas Co 2,790,471 0.5291% 3,071,491 2,527,720 82.30%42
72 218 35289 Continental Ins Co 120,343 0.0228% 136,906 -1,442,171 -1053.40%157
73 37206 Contractors Bonding & Ins Co 44 0.0000% 4,336 -1,450 -33.44%269
74 350 21318 Coregis Ins Co 129,357 0.0245% 229,365 133,990 58.42%156
75 14010 Crusader Ins Co 232,063 0.0440% 243,102 334,323 137.52%131
76 306 10847 Cumis Ins Society Inc 30,589 0.0058% 26,417 15,125 57.25%196
77 930 19269 Danielson Natl Ins Co 207,984 0.0394% 183,844 51,089 27.79%140
78 920 42048 Diamond State Ins Co 61,538 0.0117% 53,293 10,288 19.30%174
79 164 36463 Discover Prop & Cas Ins Co 9 0.0000% 2 -640 -32000.00%274
80 33499 Dorinco Rein Co 659,951 0.1251% 608,167 0 0.00%92
81 802 12890 Eagle West Ins Co 86,594 0.0164% 143,157 153,727 107.38%166
82 57 21261 Electric Ins Co 10,538 0.0020% 10,903 0 0.00%222
83 212 21326 Empire Fire & Marine Ins Co 178,770 0.0339% 169,672 15,608 9.20%148
84 44 20648 Employers Fire Ins Co 133 0.0000% 62 0 0.00%265
85 111 21458 Employers Ins Of Wausau Mut Co 4,768,665 0.9041% 4,493,937 552,744 12.30%31
86 62 21415 Employers Mut Cas Co 863,110 0.1636% 845,053 549,176 64.99%83
87 212 10318 Exact Prop & Cas Co Inc 36,954 0.0070% 47,685 71,609 150.17%189
88 65 21482 Factory Mut Ins Co 16,363,527 3.1025% 15,632,529 1,011,632 6.47%9
89 158 18864 Fairmont Ins Co 850 0.0002% 257 0 0.00%248
90 2 42633 Far West Ins Co 447,181 0.0848% 447,181 14,823 3.31%108
91 249 13846 Farmers Home Mut Ins Co 744,946 0.1412% 777,515 95,214 12.25%86
92 212 21652 Farmers Ins Exch 25,039,903 4.7475% 24,993,610 15,016,700 60.08%5
93 38 20281 Federal Ins Co 1,228,732 0.2330% 1,393,815 292,969 21.02%69
94 7 13935 Federated Mut Ins Co 1,628,250 0.3087% 1,546,415 567,620 36.71%57
95 11118 Federated Rural Electric Ins Corp 24,997 0.0047% 24,898 -119 -0.48%202
96 7 28304 Federated Service Ins Co 11,032 0.0021% 2,532 505,050 19946.68%221
California Department of Insurance Page 2 of 6 Rate Specialist Bureau - 07/10/2001
2000 CALIFORNIA P & C MARKET SHARE REPORT
Source: NAIC Database Licensed companies only
Rec # Group # Naic # Company Name
Sorted by Company Name
WrittenPremium
Market Share
EarnedPremium
IncurredLosses
LossRatio
Line of Business: FIRE [01]
ShareRank
97 212 39306 Fidelity & Deposit Co Of MD 772,134 0.1464% 852,907 1,330,412 155.99%84
98 164 35386 Fidelity & Guaranty Ins Co 1,727,290 0.3275% 2,061,208 4,158,655 201.76%55
99 164 25879 Fidelity & Guaranty Ins Underwriters 213,621 0.0405% 205,595 35,207 17.12%138
100 553 24880 Fire & Cas Ins Co Of CT 4,320 0.0008% 4,663 0 0.00%235
101 212 21660 Fire Ins Exch 26,817,566 5.0845% 27,732,951 11,774,908 42.46%3
102 761 21873 Firemans Fund Ins Co 6,681,751 1.2668% 7,363,224 2,450,392 33.28%24
103 218 20850 Firemens Ins Co Of Newark NJ 12,967 0.0025% 4,507 0 0.00%217
104 11150 First Amer Ins Co 24,697 0.0047% 38,969 -17,205 -44.15%203
105 37710 First American Prop & Cas Ins Co 4,069,256 0.7715% 4,761,078 1,306,842 27.45%35
106 34525 First American Specilaty Ins Co 4,755,803 0.9017% 4,535,398 1,594,361 35.15%32
107 689 16578 First Comm Ins Co 390 0.0001% 166 0 0.00%256
108 479 11177 First Financial Ins Co 188,880 0.0358% 137,865 6,538 4.74%143
109 163 24724 First Natl Ins Co Of Amer 90,719 0.0172% 85,914 -590 -0.69%165
110 349 13978 Florists Mut Ins Co 23,920 0.0045% 23,901 11,546 48.31%204
111 961 34266 Frontier Ins Co 14,181 0.0027% 12,723 -1,138 -8.94%215
112 961 42250 Frontier Pacific Ins Co 36,761 0.0070% 26,722 -16,803 -62.88%190
113 44 21962 General Accident Ins Co 892,433 0.1692% 916,026 52,363 5.72%81
114 400 24414 General Cas Co Of WI 53 0.0000% 42 0 0.00%268
115 163 24732 General Ins Co Of Amer 270,722 0.0513% 253,613 -18,774 -7.40%126
116 749 16063 General Security Ins Co 151,229 0.0287% 74,064 0 0.00%151
117 1169 11231 Generali Us Branch 484,100 0.0918% -7,312,701 7,075,965 -96.76%104
118 31 38962 Genesis Ins Co 394,362 0.0748% 439,438 1,139,376 259.28%112
119 604 41343 Gerling Amer Ins Co 1,508,115 0.2859% 1,870,481 1,274,664 68.15%60
120 39861 Golden Bear Ins Co 569,286 0.1079% 518,660 87,027 16.78%98
121 111 10836 Golden Eagle Ins Corp 6,978,299 1.3231% 6,305,579 3,616,879 57.36%22
122 83 22101 Grange Ins Assn 666,254 0.1263% 661,894 230,956 34.89%90
123 201 25984 Graphic Arts Mut Ins Co 40 0.0000% 40 0 0.00%270
124 84 26832 Great American Alliance Ins Co 9,375,254 1.7775% 8,673,608 1,697,198 19.57%16
125 84 26344 Great American Assur Co 18,223,018 3.4550% 17,081,944 -7,169,867 -41.97%6
126 84 16691 Great American Ins Co 1,047,973 0.1987% 1,014,337 733,189 72.28%78
127 84 22136 Great American Ins Co of NY 368,300 0.0698% 362,906 423,875 116.80%117
128 98 25224 Great Divide Ins Co 2,072,333 0.3929% 2,049,418 1,955,215 95.40%51
129 38 20303 Great Northern Ins Co 19,676 0.0037% 19,331 8,816 45.61%207
130 1285 22322 Greenwich Ins Co 3,781,482 0.7170% 2,290,825 1,876,290 81.90%37
131 303 15032 Guideone Mut Ins Co 53,243 0.0101% 56,402 80,823 143.30%178
132 303 14559 Guideone Specialty Mut Ins Co 555 0.0001% 306 6 1.96%253
133 41 22217 Gulf Ins Co 1,603,379 0.3040% 1,206,056 -395,733 -32.81%58
134 88 22292 Hanover Ins Co 137,172 0.0260% 198,926 16,046 8.07%153
135 26433 Harco Natl Ins Co 69,878 0.0132% 61,370 6,096 9.93%172
136 91 29424 Hartford Cas Ins Co 663,177 0.1257% 701,736 368,668 52.54%91
137 91 19682 Hartford Fire In Co 9,426,600 1.7873% 6,164,230 3,198,219 51.88%15
138 91 37478 Hartford Ins Co Of The Midwest 480,053 0.0910% 549,975 121,367 22.07%105
139 12 11452 Hartford Steam Boil Inspec & Ins Co 189,065 0.0358% 2,103,743 -2,152,794 -102.33%142
140 91 30104 Hartford Underwriters Ins Co 557,863 0.1058% 539,599 236,664 43.86%99
141 958 22438 Hawaiian Ins & Gty Co Ltd 392,304 0.0744% 494,922 105,678 21.35%113
142 1116 22489 Highlands Ins Co 1,600 0.0003% 1,014 -99,656 -9828.01%243
143 300 22578 Horace Mann Ins Co 71,321 0.0135% 63,881 125,337 196.20%171
144 300 22756 Horace Mann Prop & Cas Ins Co 182,068 0.0345% 200,982 192,833 95.95%146
California Department of Insurance Page 3 of 6 Rate Specialist Bureau - 07/10/2001
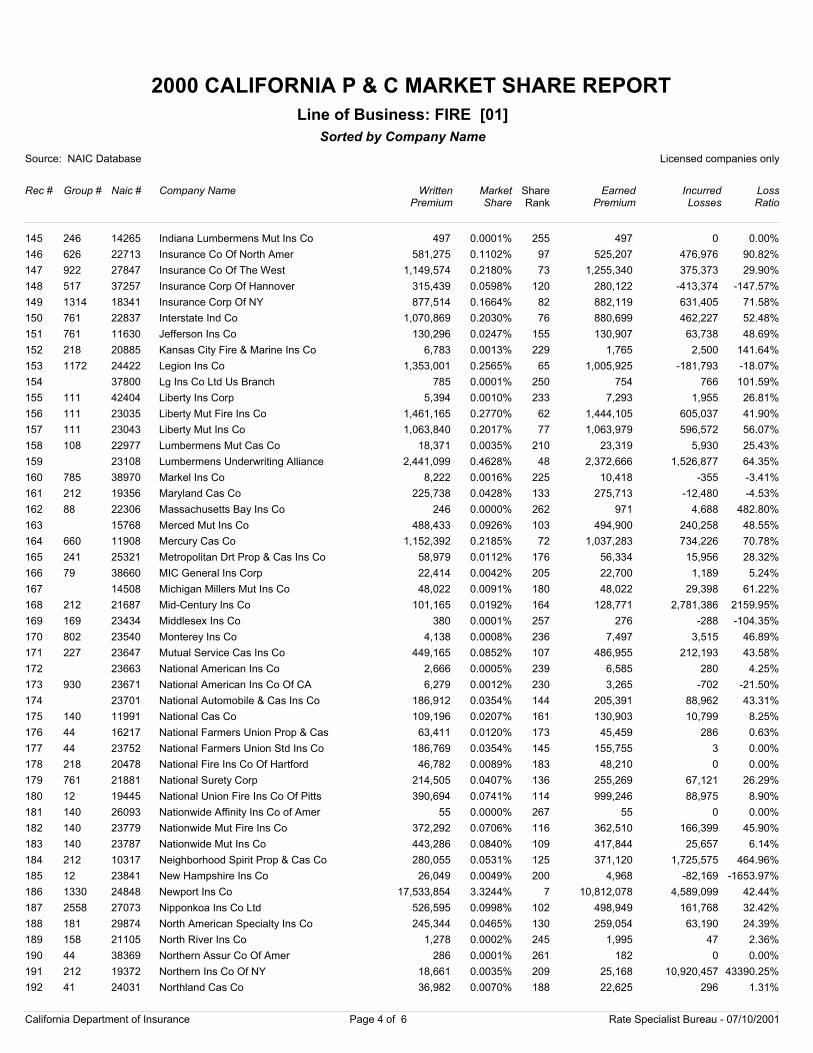
2000 CALIFORNIA P & C MARKET SHARE REPORT
Source: NAIC Database Licensed companies only
Rec # Group # Naic # Company Name
Sorted by Company Name
WrittenPremium
Market Share
EarnedPremium
IncurredLosses
LossRatio
Line of Business: FIRE [01]
ShareRank
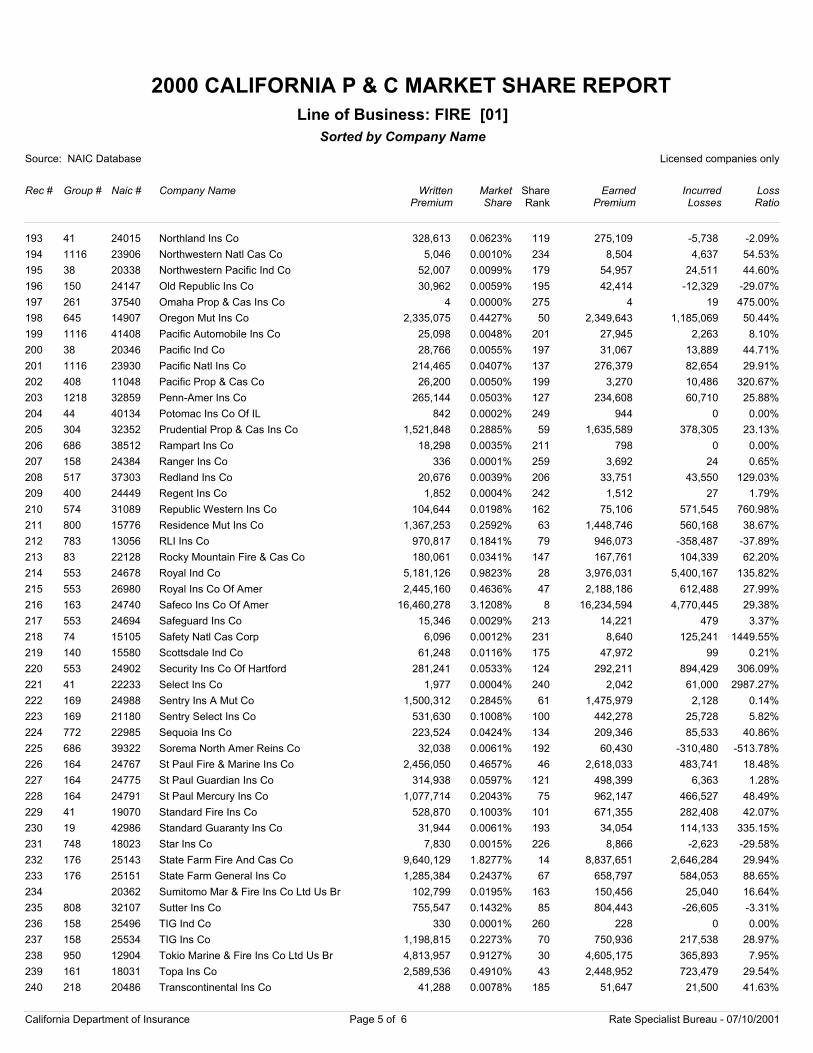
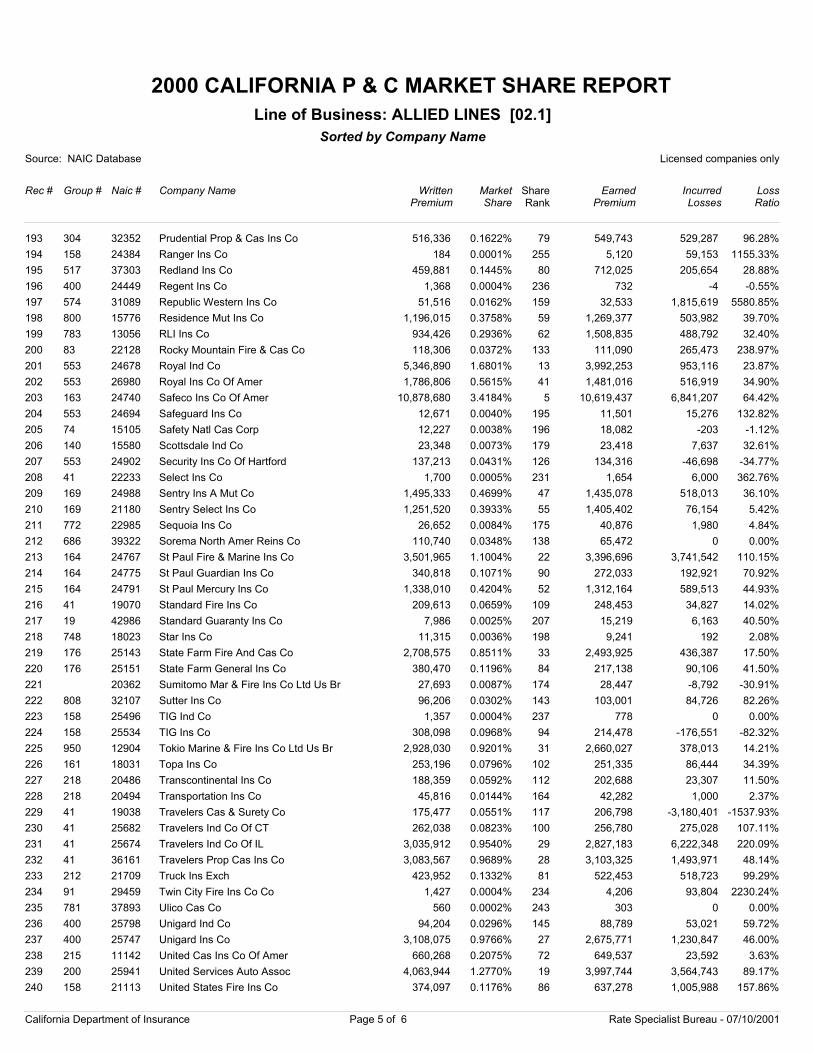
145 246 14265 Indiana Lumbermens Mut Ins Co 497 0.0001% 497 0 0.00%255
146 626 22713 Insurance Co Of North Amer 581,275 0.1102% 525,207 476,976 90.82%97
147 922 27847 Insurance Co Of The West 1,149,574 0.2180% 1,255,340 375,373 29.90%73
148 517 37257 Insurance Corp Of Hannover 315,439 0.0598% 280,122 -413,374 -147.57%120
149 1314 18341 Insurance Corp Of NY 877,514 0.1664% 882,119 631,405 71.58%82
150 761 22837 Interstate Ind Co 1,070,869 0.2030% 880,699 462,227 52.48%76
151 761 11630 Jefferson Ins Co 130,296 0.0247% 130,907 63,738 48.69%155
152 218 20885 Kansas City Fire & Marine Ins Co 6,783 0.0013% 1,765 2,500 141.64%229
153 1172 24422 Legion Ins Co 1,353,001 0.2565% 1,005,925 -181,793 -18.07%65
154 37800 Lg Ins Co Ltd Us Branch 785 0.0001% 754 766 101.59%250
155 111 42404 Liberty Ins Corp 5,394 0.0010% 7,293 1,955 26.81%233
156 111 23035 Liberty Mut Fire Ins Co 1,461,165 0.2770% 1,444,105 605,037 41.90%62
157 111 23043 Liberty Mut Ins Co 1,063,840 0.2017% 1,063,979 596,572 56.07%77
158 108 22977 Lumbermens Mut Cas Co 18,371 0.0035% 23,319 5,930 25.43%210
159 23108 Lumbermens Underwriting Alliance 2,441,099 0.4628% 2,372,666 1,526,877 64.35%48
160 785 38970 Markel Ins Co 8,222 0.0016% 10,418 -355 -3.41%225
161 212 19356 Maryland Cas Co 225,738 0.0428% 275,713 -12,480 -4.53%133
162 88 22306 Massachusetts Bay Ins Co 246 0.0000% 971 4,688 482.80%262
163 15768 Merced Mut Ins Co 488,433 0.0926% 494,900 240,258 48.55%103
164 660 11908 Mercury Cas Co 1,152,392 0.2185% 1,037,283 734,226 70.78%72
165 241 25321 Metropolitan Drt Prop & Cas Ins Co 58,979 0.0112% 56,334 15,956 28.32%176
166 79 38660 MIC General Ins Corp 22,414 0.0042% 22,700 1,189 5.24%205
167 14508 Michigan Millers Mut Ins Co 48,022 0.0091% 48,022 29,398 61.22%180
168 212 21687 Mid-Century Ins Co 101,165 0.0192% 128,771 2,781,386 2159.95%164
169 169 23434 Middlesex Ins Co 380 0.0001% 276 -288 -104.35%257
170 802 23540 Monterey Ins Co 4,138 0.0008% 7,497 3,515 46.89%236
171 227 23647 Mutual Service Cas Ins Co 449,165 0.0852% 486,955 212,193 43.58%107
172 23663 National American Ins Co 2,666 0.0005% 6,585 280 4.25%239
173 930 23671 National American Ins Co Of CA 6,279 0.0012% 3,265 -702 -21.50%230
174 23701 National Automobile & Cas Ins Co 186,912 0.0354% 205,391 88,962 43.31%144
175 140 11991 National Cas Co 109,196 0.0207% 130,903 10,799 8.25%161
176 44 16217 National Farmers Union Prop & Cas 63,411 0.0120% 45,459 286 0.63%173
177 44 23752 National Farmers Union Std Ins Co 186,769 0.0354% 155,755 3 0.00%145
178 218 20478 National Fire Ins Co Of Hartford 46,782 0.0089% 48,210 0 0.00%183
179 761 21881 National Surety Corp 214,505 0.0407% 255,269 67,121 26.29%136
180 12 19445 National Union Fire Ins Co Of Pitts 390,694 0.0741% 999,246 88,975 8.90%114
181 140 26093 Nationwide Affinity Ins Co of Amer 55 0.0000% 55 0 0.00%267
182 140 23779 Nationwide Mut Fire Ins Co 372,292 0.0706% 362,510 166,399 45.90%116
183 140 23787 Nationwide Mut Ins Co 443,286 0.0840% 417,844 25,657 6.14%109
184 212 10317 Neighborhood Spirit Prop & Cas Co 280,055 0.0531% 371,120 1,725,575 464.96%125
185 12 23841 New Hampshire Ins Co 26,049 0.0049% 4,968 -82,169 -1653.97%200
186 1330 24848 Newport Ins Co 17,533,854 3.3244% 10,812,078 4,589,099 42.44%7
187 2558 27073 Nipponkoa Ins Co Ltd 526,595 0.0998% 498,949 161,768 32.42%102
188 181 29874 North American Specialty Ins Co 245,344 0.0465% 259,054 63,190 24.39%130
189 158 21105 North River Ins Co 1,278 0.0002% 1,995 47 2.36%245
190 44 38369 Northern Assur Co Of Amer 286 0.0001% 182 0 0.00%261
191 212 19372 Northern Ins Co Of NY 18,661 0.0035% 25,168 10,920,457 43390.25%209
192 41 24031 Northland Cas Co 36,982 0.0070% 22,625 296 1.31%188
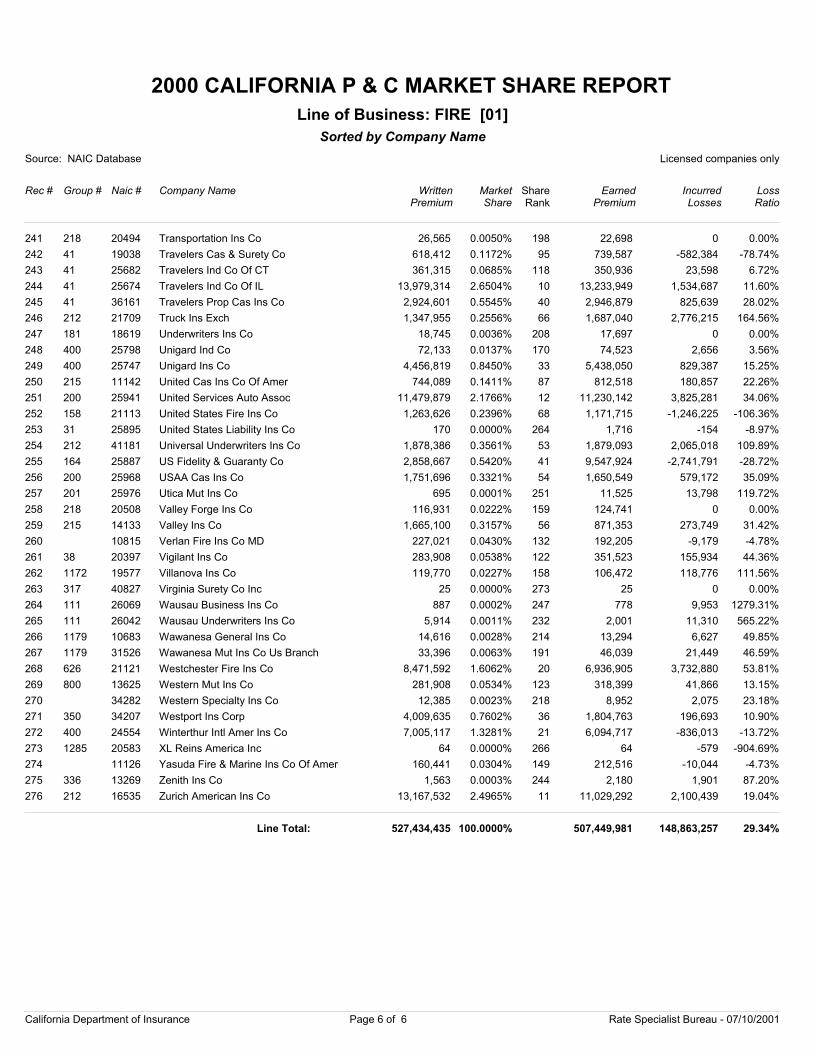
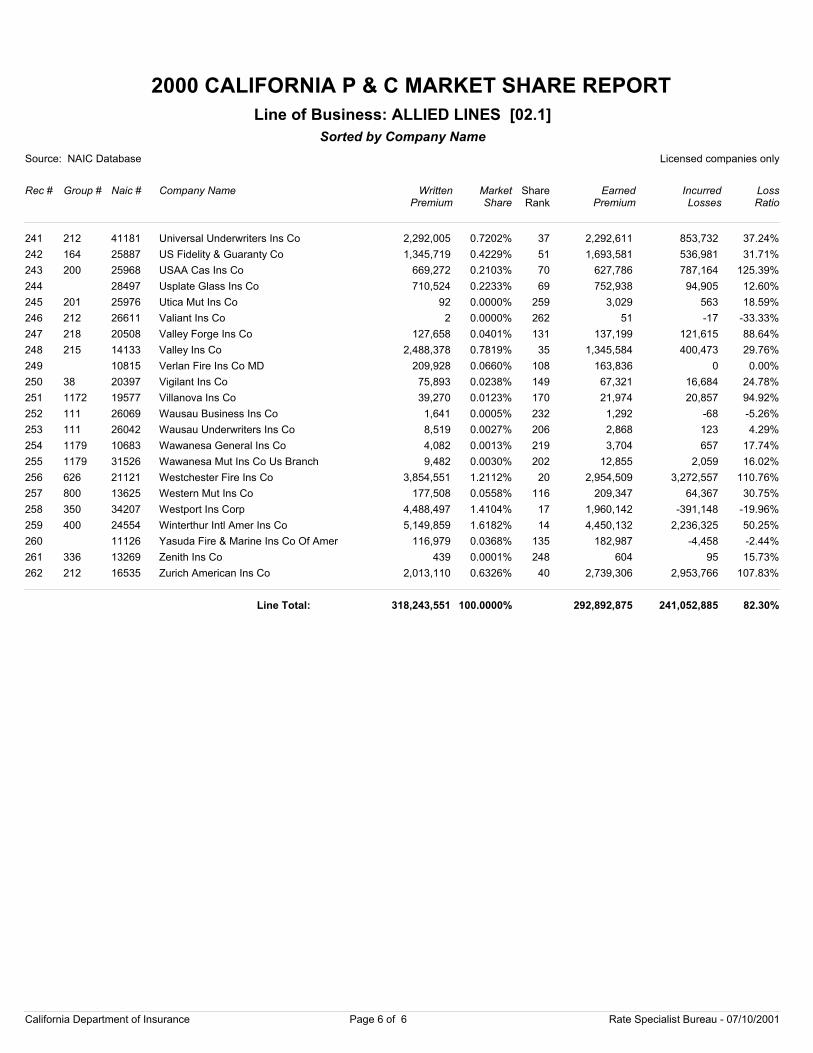
California Department of Insurance Page 4 of 6 Rate Specialist Bureau - 07/10/2001
2000 CALIFORNIA P & C MARKET SHARE REPORT
Source: NAIC Database Licensed companies only
Rec # Group # Naic # Company Name
Sorted by Company Name
WrittenPremium
Market Share
EarnedPremium
IncurredLosses
LossRatio
Line of Business: FIRE [01]
ShareRank
193 41 24015 Northland Ins Co 328,613 0.0623% 275,109 -5,738 -2.09%119
194 1116 23906 Northwestern Natl Cas Co 5,046 0.0010% 8,504 4,637 54.53%234
195 38 20338 Northwestern Pacific Ind Co 52,007 0.0099% 54,957 24,511 44.60%179
196 150 24147 Old Republic Ins Co 30,962 0.0059% 42,414 -12,329 -29.07%195
197 261 37540 Omaha Prop & Cas Ins Co 4 0.0000% 4 19 475.00%275
198 645 14907 Oregon Mut Ins Co 2,335,075 0.4427% 2,349,643 1,185,069 50.44%50
199 1116 41408 Pacific Automobile Ins Co 25,098 0.0048% 27,945 2,263 8.10%201
200 38 20346 Pacific Ind Co 28,766 0.0055% 31,067 13,889 44.71%197
201 1116 23930 Pacific Natl Ins Co 214,465 0.0407% 276,379 82,654 29.91%137
202 408 11048 Pacific Prop & Cas Co 26,200 0.0050% 3,270 10,486 320.67%199
203 1218 32859 Penn-Amer Ins Co 265,144 0.0503% 234,608 60,710 25.88%127
204 44 40134 Potomac Ins Co Of IL 842 0.0002% 944 0 0.00%249
205 304 32352 Prudential Prop & Cas Ins Co 1,521,848 0.2885% 1,635,589 378,305 23.13%59
206 686 38512 Rampart Ins Co 18,298 0.0035% 798 0 0.00%211
207 158 24384 Ranger Ins Co 336 0.0001% 3,692 24 0.65%259
208 517 37303 Redland Ins Co 20,676 0.0039% 33,751 43,550 129.03%206
209 400 24449 Regent Ins Co 1,852 0.0004% 1,512 27 1.79%242
210 574 31089 Republic Western Ins Co 104,644 0.0198% 75,106 571,545 760.98%162
211 800 15776 Residence Mut Ins Co 1,367,253 0.2592% 1,448,746 560,168 38.67%63
212 783 13056 RLI Ins Co 970,817 0.1841% 946,073 -358,487 -37.89%79
213 83 22128 Rocky Mountain Fire & Cas Co 180,061 0.0341% 167,761 104,339 62.20%147
214 553 24678 Royal Ind Co 5,181,126 0.9823% 3,976,031 5,400,167 135.82%28
215 553 26980 Royal Ins Co Of Amer 2,445,160 0.4636% 2,188,186 612,488 27.99%47
216 163 24740 Safeco Ins Co Of Amer 16,460,278 3.1208% 16,234,594 4,770,445 29.38%8
217 553 24694 Safeguard Ins Co 15,346 0.0029% 14,221 479 3.37%213
218 74 15105 Safety Natl Cas Corp 6,096 0.0012% 8,640 125,241 1449.55%231
219 140 15580 Scottsdale Ind Co 61,248 0.0116% 47,972 99 0.21%175
220 553 24902 Security Ins Co Of Hartford 281,241 0.0533% 292,211 894,429 306.09%124
221 41 22233 Select Ins Co 1,977 0.0004% 2,042 61,000 2987.27%240
222 169 24988 Sentry Ins A Mut Co 1,500,312 0.2845% 1,475,979 2,128 0.14%61
223 169 21180 Sentry Select Ins Co 531,630 0.1008% 442,278 25,728 5.82%100
224 772 22985 Sequoia Ins Co 223,524 0.0424% 209,346 85,533 40.86%134
225 686 39322 Sorema North Amer Reins Co 32,038 0.0061% 60,430 -310,480 -513.78%192
226 164 24767 St Paul Fire & Marine Ins Co 2,456,050 0.4657% 2,618,033 483,741 18.48%46
227 164 24775 St Paul Guardian Ins Co 314,938 0.0597% 498,399 6,363 1.28%121
228 164 24791 St Paul Mercury Ins Co 1,077,714 0.2043% 962,147 466,527 48.49%75
229 41 19070 Standard Fire Ins Co 528,870 0.1003% 671,355 282,408 42.07%101
230 19 42986 Standard Guaranty Ins Co 31,944 0.0061% 34,054 114,133 335.15%193
231 748 18023 Star Ins Co 7,830 0.0015% 8,866 -2,623 -29.58%226
232 176 25143 State Farm Fire And Cas Co 9,640,129 1.8277% 8,837,651 2,646,284 29.94%14
233 176 25151 State Farm General Ins Co 1,285,384 0.2437% 658,797 584,053 88.65%67
234 20362 Sumitomo Mar & Fire Ins Co Ltd Us Br 102,799 0.0195% 150,456 25,040 16.64%163
235 808 32107 Sutter Ins Co 755,547 0.1432% 804,443 -26,605 -3.31%85
236 158 25496 TIG Ind Co 330 0.0001% 228 0 0.00%260
237 158 25534 TIG Ins Co 1,198,815 0.2273% 750,936 217,538 28.97%70
238 950 12904 Tokio Marine & Fire Ins Co Ltd Us Br 4,813,957 0.9127% 4,605,175 365,893 7.95%30
239 161 18031 Topa Ins Co 2,589,536 0.4910% 2,448,952 723,479 29.54%43
240 218 20486 Transcontinental Ins Co 41,288 0.0078% 51,647 21,500 41.63%185
California Department of Insurance Page 5 of 6 Rate Specialist Bureau - 07/10/2001
2000 CALIFORNIA P & C MARKET SHARE REPORT
Source: NAIC Database Licensed companies only
Rec # Group # Naic # Company Name
Sorted by Company Name
WrittenPremium
Market Share
EarnedPremium
IncurredLosses
LossRatio
Line of Business: FIRE [01]
ShareRank
241 218 20494 Transportation Ins Co 26,565 0.0050% 22,698 0 0.00%198
242 41 19038 Travelers Cas & Surety Co 618,412 0.1172% 739,587 -582,384 -78.74%95
243 41 25682 Travelers Ind Co Of CT 361,315 0.0685% 350,936 23,598 6.72%118
244 41 25674 Travelers Ind Co Of IL 13,979,314 2.6504% 13,233,949 1,534,687 11.60%10
245 41 36161 Travelers Prop Cas Ins Co 2,924,601 0.5545% 2,946,879 825,639 28.02%40
246 212 21709 Truck Ins Exch 1,347,955 0.2556% 1,687,040 2,776,215 164.56%66
247 181 18619 Underwriters Ins Co 18,745 0.0036% 17,697 0 0.00%208
248 400 25798 Unigard Ind Co 72,133 0.0137% 74,523 2,656 3.56%170
249 400 25747 Unigard Ins Co 4,456,819 0.8450% 5,438,050 829,387 15.25%33
250 215 11142 United Cas Ins Co Of Amer 744,089 0.1411% 812,518 180,857 22.26%87
251 200 25941 United Services Auto Assoc 11,479,879 2.1766% 11,230,142 3,825,281 34.06%12
252 158 21113 United States Fire Ins Co 1,263,626 0.2396% 1,171,715 -1,246,225 -106.36%68
253 31 25895 United States Liability Ins Co 170 0.0000% 1,716 -154 -8.97%264
254 212 41181 Universal Underwriters Ins Co 1,878,386 0.3561% 1,879,093 2,065,018 109.89%53
255 164 25887 US Fidelity & Guaranty Co 2,858,667 0.5420% 9,547,924 -2,741,791 -28.72%41
256 200 25968 USAA Cas Ins Co 1,751,696 0.3321% 1,650,549 579,172 35.09%54
257 201 25976 Utica Mut Ins Co 695 0.0001% 11,525 13,798 119.72%251
258 218 20508 Valley Forge Ins Co 116,931 0.0222% 124,741 0 0.00%159
259 215 14133 Valley Ins Co 1,665,100 0.3157% 871,353 273,749 31.42%56
260 10815 Verlan Fire Ins Co MD 227,021 0.0430% 192,205 -9,179 -4.78%132
261 38 20397 Vigilant Ins Co 283,908 0.0538% 351,523 155,934 44.36%122
262 1172 19577 Villanova Ins Co 119,770 0.0227% 106,472 118,776 111.56%158
263 317 40827 Virginia Surety Co Inc 25 0.0000% 25 0 0.00%273
264 111 26069 Wausau Business Ins Co 887 0.0002% 778 9,953 1279.31%247
265 111 26042 Wausau Underwriters Ins Co 5,914 0.0011% 2,001 11,310 565.22%232
266 1179 10683 Wawanesa General Ins Co 14,616 0.0028% 13,294 6,627 49.85%214
267 1179 31526 Wawanesa Mut Ins Co Us Branch 33,396 0.0063% 46,039 21,449 46.59%191
268 626 21121 Westchester Fire Ins Co 8,471,592 1.6062% 6,936,905 3,732,880 53.81%20
269 800 13625 Western Mut Ins Co 281,908 0.0534% 318,399 41,866 13.15%123
270 34282 Western Specialty Ins Co 12,385 0.0023% 8,952 2,075 23.18%218
271 350 34207 Westport Ins Corp 4,009,635 0.7602% 1,804,763 196,693 10.90%36
272 400 24554 Winterthur Intl Amer Ins Co 7,005,117 1.3281% 6,094,717 -836,013 -13.72%21
273 1285 20583 XL Reins America Inc 64 0.0000% 64 -579 -904.69%266
274 11126 Yasuda Fire & Marine Ins Co Of Amer 160,441 0.0304% 212,516 -10,044 -4.73%149
275 336 13269 Zenith Ins Co 1,563 0.0003% 2,180 1,901 87.20%244
276 212 16535 Zurich American Ins Co 13,167,532 2.4965% 11,029,292 2,100,439 19.04%11
527,434,435 100.0000% 507,449,981 148,863,257 29.34%Line Total:
California Department of Insurance Page 6 of 6 Rate Specialist Bureau - 07/10/2001
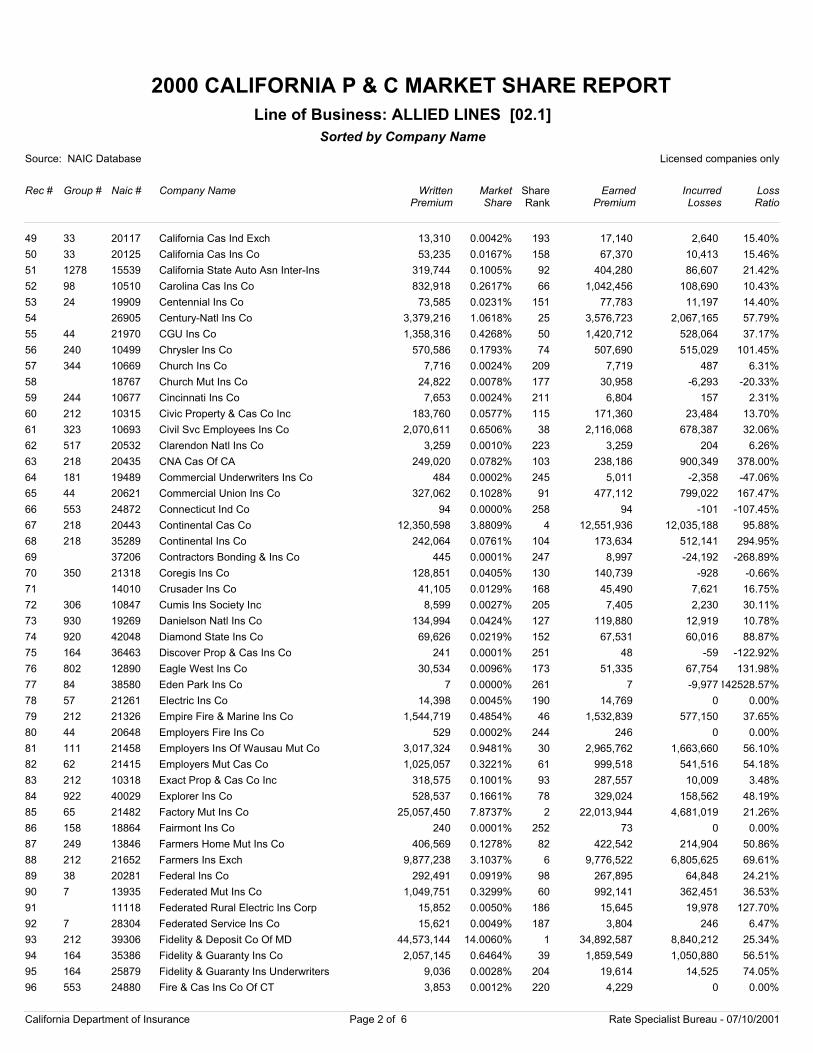
2000 CALIFORNIA P & C MARKET SHARE REPORT
Source: NAIC Database Licensed companies only
Rec # Group # Naic # Company Name
Sorted by Company Name
WrittenPremium
Market Share
EarnedPremium
IncurredLosses
LossRatio
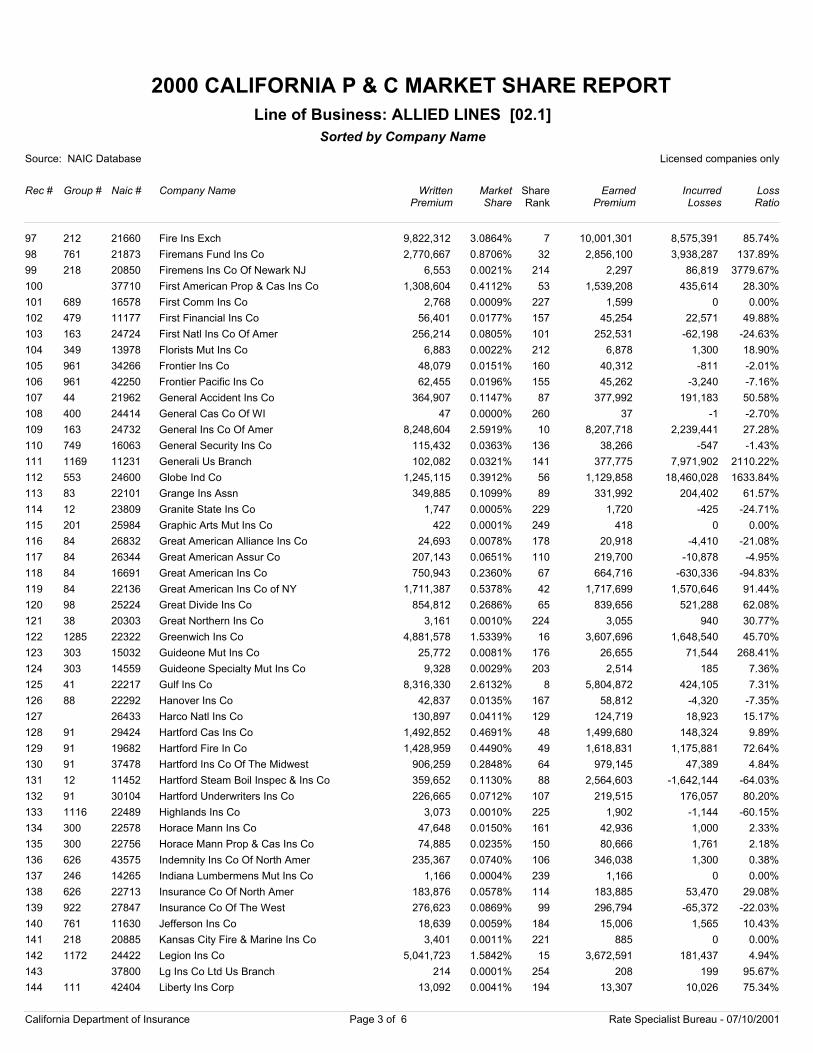
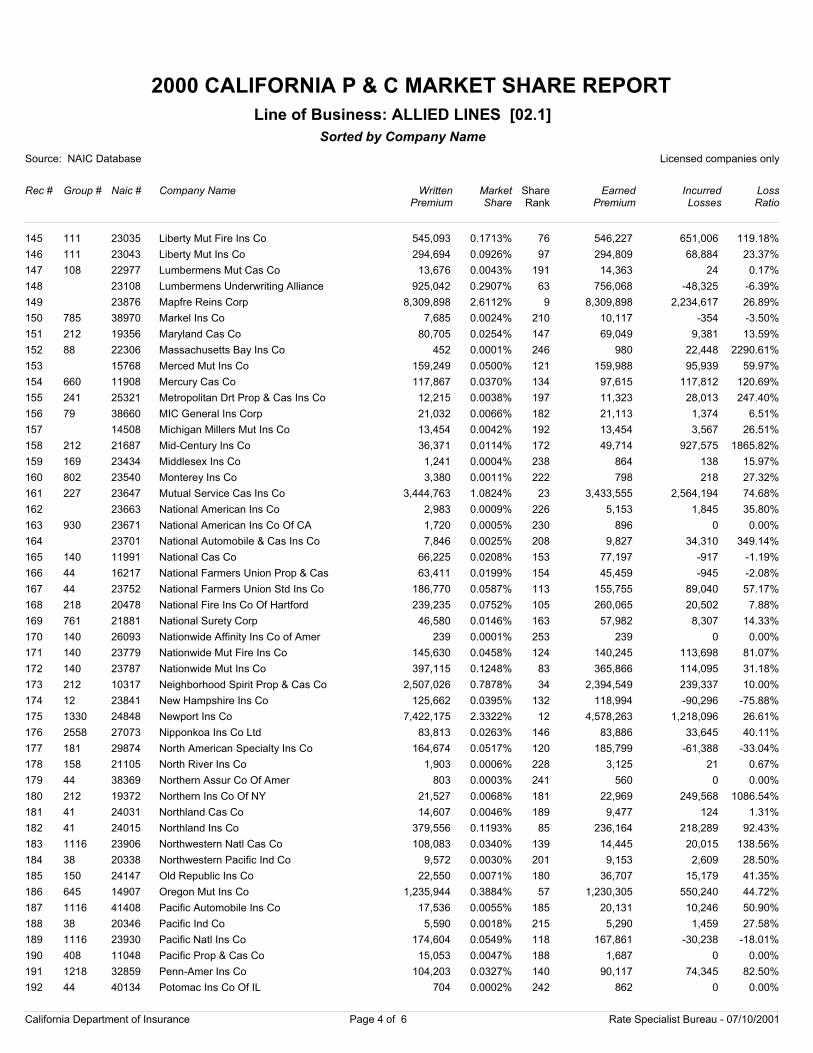
Line of Business: ALLIED LINES [02.1]
ShareRank
1 626 22667 Ace American Ins Co 10,187 0.0032% 10,187 2,500 24.54%199
2 626 20699 Ace Prop & Cas Ins Co 3,215,171 1.0103% 3,215,171 364,380 11.33%26
3 65 10014 Affiliated Fm Ins Co 3,430,035 1.0778% 2,814,134 84,635 3.01%24
4 42757 Agri General Ins Co 56,423 0.0177% 56,423 137,563 243.81%156
5 761 35300 Allianz Ins Co 156,537 0.0492% 247,606 18,657,857 7535.30%122
6 761 36420 Allianz Underwriters Ins Co 9,908 0.0031% 15,456 777,251 5028.80%200
7 140 42579 Allied Prop & Cas Ins Co 1,227,414 0.3857% 1,041,953 916,221 87.93%58
8 8 19232 Allstate Ins Co 12,885,201 4.0488% 12,602,245 7,083,911 56.21%3
9 140 19100 Amco Ins Co 3,702,763 1.1635% 3,444,400 2,297,508 66.70%21
10 553 24589 American & Foreign Ins Co 144,525 0.0454% 167,434 97,254 58.08%125
11 761 21849 American Automobile Ins Co 44,574 0.0140% 55,116 -97,518 -176.93%165
12 218 20427 American Cas Co Of Reading PA 39,741 0.0125% 41,183 -227,001 -551.20%169
13 163 19690 American Economy Ins Co 601,171 0.1889% 746,441 337,243 45.18%73
14 44 20613 American Employers Ins Co 5,299 0.0017% 7,854 8 0.10%216
15 41 10819 American Equity Specialty Ins Co 304,616 0.0957% 218,059 35,777 16.41%95
16 127 23450 American Family Home Ins Co 6,553 0.0021% 2,238 0 0.00%213
17 329 16403 American Growers Ins Co 729,339 0.2292% 729,339 25,474 3.49%68
18 212 26247 American Guarantee & Liability Ins 661,207 0.2078% 1,289,511 60,920,121 4724.28%71
19 291 13331 American Hardware Mut Ins Co 19,988 0.0063% 18,394 -3,841 -20.88%183
20 761 21857 American Ins Co 111,595 0.0351% 139,502 19,566 14.03%137
21 108 30562 American Manufacturers Mut Ins Co 537,696 0.1690% 493,764 417,817 84.62%77
22 127 23469 American Modern Home Ins Co 1,549,183 0.4868% 1,591,299 277,675 17.45%45
23 108 22918 American Motorists Ins Co 46,976 0.0148% 31,859 7,747 24.32%162
24 408 28401 American Natl Prop & Cas Co 79,283 0.0249% 80,811 647 0.80%148
25 108 18910 American Protection Ins Co 38,430 0.0121% 24,045 945 3.93%171
26 19 19615 American Reliable Ins Co 296,177 0.0931% 227,384 12,055 5.30%96
27 19 42978 American Security Ins Co 8,150,862 2.5612% 8,451,748 3,210,384 37.98%11
28 84 33723 American Spirit Ins Co 44,485 0.0140% 52,298 -107,638 -205.82%166
29 163 19704 American States Ins Co 1,585,112 0.4981% 1,456,657 909,297 62.42%44
30 40800 American Sterling Ins Co 1,267,056 0.3981% 1,273,888 64,742 5.08%54
31 124 23396 Amerisure Mut Ins Co 5,168 0.0016% 5,097 -45 -0.88%217
32 28 19976 Amica Mut Ins Co 94,641 0.0297% 88,982 90,446 101.65%144
33 808 25180 Anza Ins Co 4,594 0.0014% 5,138 0 0.00%218
34 457 19860 Argonaut Great Central Ins Co 264 0.0001% 397 -422 -106.30%250
35 41459 Armed Forces Ins Exchange 146,470 0.0460% 147,803 183,154 123.92%123
36 761 21865 Associated Ind Corp 1,619,924 0.5090% 1,693,861 1,290,987 76.22%43
37 785 27189 Associated Intl Ins Co 1,424 0.0004% 2,774 329 11.86%235
38 41 21296 Associates Ins Co 199,934 0.0628% 225,153 1,820 0.81%111
39 212 19305 Assurance Co Of Amer 1,576 0.0005% 1,689 41,610 2463.59%233
40 41 22209 Atlantic Ins Co 104 0.0000% 50 0 0.00%257
41 24 19895 Atlantic Mut Ins Co 99,236 0.0312% 100,149 111,000 110.83%142
42 1330 24813 Balboa Ins Co 4,125,553 1.2964% 3,890,835 2,260,562 58.10%18
43 689 33162 Bankers Ins Co 165,602 0.0520% 184,606 -598 -0.32%119
44 98 11001 Berkley Partners Ins Co 567,439 0.1783% 144,729 0 0.00%75
45 150 20095 Bituminous Cas Corp 128 0.0000% 80 0 0.00%256
46 218 20761 Boston Old Colony Ins Co 968 0.0003% 509 0 0.00%240
47 140 18961 Calfarm Ins Co 133,391 0.0419% 175,543 40,042 22.81%128
48 802 13544 California Capital Ins Co 2,451,088 0.7702% 2,459,755 1,650,539 67.10%36
California Department of Insurance Page 1 of 6 Rate Specialist Bureau - 07/10/2001
2000 CALIFORNIA P & C MARKET SHARE REPORT
Source: NAIC Database Licensed companies only
Rec # Group # Naic # Company Name
Sorted by Company Name
WrittenPremium
Market Share
EarnedPremium
IncurredLosses
LossRatio
Line of Business: ALLIED LINES [02.1]
ShareRank
49 33 20117 California Cas Ind Exch 13,310 0.0042% 17,140 2,640 15.40%193
50 33 20125 California Cas Ins Co 53,235 0.0167% 67,370 10,413 15.46%158
51 1278 15539 California State Auto Asn Inter-Ins 319,744 0.1005% 404,280 86,607 21.42%92
52 98 10510 Carolina Cas Ins Co 832,918 0.2617% 1,042,456 108,690 10.43%66
53 24 19909 Centennial Ins Co 73,585 0.0231% 77,783 11,197 14.40%151
54 26905 Century-Natl Ins Co 3,379,216 1.0618% 3,576,723 2,067,165 57.79%25
55 44 21970 CGU Ins Co 1,358,316 0.4268% 1,420,712 528,064 37.17%50
56 240 10499 Chrysler Ins Co 570,586 0.1793% 507,690 515,029 101.45%74
57 344 10669 Church Ins Co 7,716 0.0024% 7,719 487 6.31%209
58 18767 Church Mut Ins Co 24,822 0.0078% 30,958 -6,293 -20.33%177
59 244 10677 Cincinnati Ins Co 7,653 0.0024% 6,804 157 2.31%211
60 212 10315 Civic Property & Cas Co Inc 183,760 0.0577% 171,360 23,484 13.70%115
61 323 10693 Civil Svc Employees Ins Co 2,070,611 0.6506% 2,116,068 678,387 32.06%38
62 517 20532 Clarendon Natl Ins Co 3,259 0.0010% 3,259 204 6.26%223
63 218 20435 CNA Cas Of CA 249,020 0.0782% 238,186 900,349 378.00%103
64 181 19489 Commercial Underwriters Ins Co 484 0.0002% 5,011 -2,358 -47.06%245
65 44 20621 Commercial Union Ins Co 327,062 0.1028% 477,112 799,022 167.47%91
66 553 24872 Connecticut Ind Co 94 0.0000% 94 -101 -107.45%258
67 218 20443 Continental Cas Co 12,350,598 3.8809% 12,551,936 12,035,188 95.88%4
68 218 35289 Continental Ins Co 242,064 0.0761% 173,634 512,141 294.95%104
69 37206 Contractors Bonding & Ins Co 445 0.0001% 8,997 -24,192 -268.89%247
70 350 21318 Coregis Ins Co 128,851 0.0405% 140,739 -928 -0.66%130
71 14010 Crusader Ins Co 41,105 0.0129% 45,490 7,621 16.75%168
72 306 10847 Cumis Ins Society Inc 8,599 0.0027% 7,405 2,230 30.11%205
73 930 19269 Danielson Natl Ins Co 134,994 0.0424% 119,880 12,919 10.78%127
74 920 42048 Diamond State Ins Co 69,626 0.0219% 67,531 60,016 88.87%152
75 164 36463 Discover Prop & Cas Ins Co 241 0.0001% 48 -59 -122.92%251
76 802 12890 Eagle West Ins Co 30,534 0.0096% 51,335 67,754 131.98%173
77 84 38580 Eden Park Ins Co 7 0.0000% 7 -9,977142528.57%261
78 57 21261 Electric Ins Co 14,398 0.0045% 14,769 0 0.00%190
79 212 21326 Empire Fire & Marine Ins Co 1,544,719 0.4854% 1,532,839 577,150 37.65%46
80 44 20648 Employers Fire Ins Co 529 0.0002% 246 0 0.00%244
81 111 21458 Employers Ins Of Wausau Mut Co 3,017,324 0.9481% 2,965,762 1,663,660 56.10%30
82 62 21415 Employers Mut Cas Co 1,025,057 0.3221% 999,518 541,516 54.18%61
83 212 10318 Exact Prop & Cas Co Inc 318,575 0.1001% 287,557 10,009 3.48%93
84 922 40029 Explorer Ins Co 528,537 0.1661% 329,024 158,562 48.19%78
85 65 21482 Factory Mut Ins Co 25,057,450 7.8737% 22,013,944 4,681,019 21.26%2
86 158 18864 Fairmont Ins Co 240 0.0001% 73 0 0.00%252
87 249 13846 Farmers Home Mut Ins Co 406,569 0.1278% 422,542 214,904 50.86%82
88 212 21652 Farmers Ins Exch 9,877,238 3.1037% 9,776,522 6,805,625 69.61%6
89 38 20281 Federal Ins Co 292,491 0.0919% 267,895 64,848 24.21%98
90 7 13935 Federated Mut Ins Co 1,049,751 0.3299% 992,141 362,451 36.53%60
91 11118 Federated Rural Electric Ins Corp 15,852 0.0050% 15,645 19,978 127.70%186
92 7 28304 Federated Service Ins Co 15,621 0.0049% 3,804 246 6.47%187
93 212 39306 Fidelity & Deposit Co Of MD 44,573,144 14.0060% 34,892,587 8,840,212 25.34%1
94 164 35386 Fidelity & Guaranty Ins Co 2,057,145 0.6464% 1,859,549 1,050,880 56.51%39
95 164 25879 Fidelity & Guaranty Ins Underwriters 9,036 0.0028% 19,614 14,525 74.05%204
96 553 24880 Fire & Cas Ins Co Of CT 3,853 0.0012% 4,229 0 0.00%220
California Department of Insurance Page 2 of 6 Rate Specialist Bureau - 07/10/2001
2000 CALIFORNIA P & C MARKET SHARE REPORT
Source: NAIC Database Licensed companies only
Rec # Group # Naic # Company Name
Sorted by Company Name
WrittenPremium
Market Share
EarnedPremium
IncurredLosses
LossRatio
Line of Business: ALLIED LINES [02.1]
ShareRank
97 212 21660 Fire Ins Exch 9,822,312 3.0864% 10,001,301 8,575,391 85.74%7
98 761 21873 Firemans Fund Ins Co 2,770,667 0.8706% 2,856,100 3,938,287 137.89%32
99 218 20850 Firemens Ins Co Of Newark NJ 6,553 0.0021% 2,297 86,819 3779.67%214
100 37710 First American Prop & Cas Ins Co 1,308,604 0.4112% 1,539,208 435,614 28.30%53
101 689 16578 First Comm Ins Co 2,768 0.0009% 1,599 0 0.00%227
102 479 11177 First Financial Ins Co 56,401 0.0177% 45,254 22,571 49.88%157
103 163 24724 First Natl Ins Co Of Amer 256,214 0.0805% 252,531 -62,198 -24.63%101
104 349 13978 Florists Mut Ins Co 6,883 0.0022% 6,878 1,300 18.90%212
105 961 34266 Frontier Ins Co 48,079 0.0151% 40,312 -811 -2.01%160
106 961 42250 Frontier Pacific Ins Co 62,455 0.0196% 45,262 -3,240 -7.16%155
107 44 21962 General Accident Ins Co 364,907 0.1147% 377,992 191,183 50.58%87
108 400 24414 General Cas Co Of WI 47 0.0000% 37 -1 -2.70%260
109 163 24732 General Ins Co Of Amer 8,248,604 2.5919% 8,207,718 2,239,441 27.28%10
110 749 16063 General Security Ins Co 115,432 0.0363% 38,266 -547 -1.43%136
111 1169 11231 Generali Us Branch 102,082 0.0321% 377,775 7,971,902 2110.22%141
112 553 24600 Globe Ind Co 1,245,115 0.3912% 1,129,858 18,460,028 1633.84%56
113 83 22101 Grange Ins Assn 349,885 0.1099% 331,992 204,402 61.57%89
114 12 23809 Granite State Ins Co 1,747 0.0005% 1,720 -425 -24.71%229
115 201 25984 Graphic Arts Mut Ins Co 422 0.0001% 418 0 0.00%249
116 84 26832 Great American Alliance Ins Co 24,693 0.0078% 20,918 -4,410 -21.08%178
117 84 26344 Great American Assur Co 207,143 0.0651% 219,700 -10,878 -4.95%110
118 84 16691 Great American Ins Co 750,943 0.2360% 664,716 -630,336 -94.83%67
119 84 22136 Great American Ins Co of NY 1,711,387 0.5378% 1,717,699 1,570,646 91.44%42
120 98 25224 Great Divide Ins Co 854,812 0.2686% 839,656 521,288 62.08%65
121 38 20303 Great Northern Ins Co 3,161 0.0010% 3,055 940 30.77%224
122 1285 22322 Greenwich Ins Co 4,881,578 1.5339% 3,607,696 1,648,540 45.70%16
123 303 15032 Guideone Mut Ins Co 25,772 0.0081% 26,655 71,544 268.41%176
124 303 14559 Guideone Specialty Mut Ins Co 9,328 0.0029% 2,514 185 7.36%203
125 41 22217 Gulf Ins Co 8,316,330 2.6132% 5,804,872 424,105 7.31%8
126 88 22292 Hanover Ins Co 42,837 0.0135% 58,812 -4,320 -7.35%167
127 26433 Harco Natl Ins Co 130,897 0.0411% 124,719 18,923 15.17%129
128 91 29424 Hartford Cas Ins Co 1,492,852 0.4691% 1,499,680 148,324 9.89%48
129 91 19682 Hartford Fire In Co 1,428,959 0.4490% 1,618,831 1,175,881 72.64%49
130 91 37478 Hartford Ins Co Of The Midwest 906,259 0.2848% 979,145 47,389 4.84%64
131 12 11452 Hartford Steam Boil Inspec & Ins Co 359,652 0.1130% 2,564,603 -1,642,144 -64.03%88
132 91 30104 Hartford Underwriters Ins Co 226,665 0.0712% 219,515 176,057 80.20%107
133 1116 22489 Highlands Ins Co 3,073 0.0010% 1,902 -1,144 -60.15%225
134 300 22578 Horace Mann Ins Co 47,648 0.0150% 42,936 1,000 2.33%161
135 300 22756 Horace Mann Prop & Cas Ins Co 74,885 0.0235% 80,666 1,761 2.18%150
136 626 43575 Indemnity Ins Co Of North Amer 235,367 0.0740% 346,038 1,300 0.38%106
137 246 14265 Indiana Lumbermens Mut Ins Co 1,166 0.0004% 1,166 0 0.00%239
138 626 22713 Insurance Co Of North Amer 183,876 0.0578% 183,885 53,470 29.08%114
139 922 27847 Insurance Co Of The West 276,623 0.0869% 296,794 -65,372 -22.03%99
140 761 11630 Jefferson Ins Co 18,639 0.0059% 15,006 1,565 10.43%184
141 218 20885 Kansas City Fire & Marine Ins Co 3,401 0.0011% 885 0 0.00%221
142 1172 24422 Legion Ins Co 5,041,723 1.5842% 3,672,591 181,437 4.94%15
143 37800 Lg Ins Co Ltd Us Branch 214 0.0001% 208 199 95.67%254
144 111 42404 Liberty Ins Corp 13,092 0.0041% 13,307 10,026 75.34%194
California Department of Insurance Page 3 of 6 Rate Specialist Bureau - 07/10/2001
2000 CALIFORNIA P & C MARKET SHARE REPORT
Source: NAIC Database Licensed companies only
Rec # Group # Naic # Company Name
Sorted by Company Name
WrittenPremium
Market Share
EarnedPremium
IncurredLosses
LossRatio
Line of Business: ALLIED LINES [02.1]
ShareRank
145 111 23035 Liberty Mut Fire Ins Co 545,093 0.1713% 546,227 651,006 119.18%76
146 111 23043 Liberty Mut Ins Co 294,694 0.0926% 294,809 68,884 23.37%97
147 108 22977 Lumbermens Mut Cas Co 13,676 0.0043% 14,363 24 0.17%191
148 23108 Lumbermens Underwriting Alliance 925,042 0.2907% 756,068 -48,325 -6.39%63
149 23876 Mapfre Reins Corp 8,309,898 2.6112% 8,309,898 2,234,617 26.89%9
150 785 38970 Markel Ins Co 7,685 0.0024% 10,117 -354 -3.50%210
151 212 19356 Maryland Cas Co 80,705 0.0254% 69,049 9,381 13.59%147
152 88 22306 Massachusetts Bay Ins Co 452 0.0001% 980 22,448 2290.61%246
153 15768 Merced Mut Ins Co 159,249 0.0500% 159,988 95,939 59.97%121
154 660 11908 Mercury Cas Co 117,867 0.0370% 97,615 117,812 120.69%134
155 241 25321 Metropolitan Drt Prop & Cas Ins Co 12,215 0.0038% 11,323 28,013 247.40%197
156 79 38660 MIC General Ins Corp 21,032 0.0066% 21,113 1,374 6.51%182
157 14508 Michigan Millers Mut Ins Co 13,454 0.0042% 13,454 3,567 26.51%192
158 212 21687 Mid-Century Ins Co 36,371 0.0114% 49,714 927,575 1865.82%172
159 169 23434 Middlesex Ins Co 1,241 0.0004% 864 138 15.97%238
160 802 23540 Monterey Ins Co 3,380 0.0011% 798 218 27.32%222
161 227 23647 Mutual Service Cas Ins Co 3,444,763 1.0824% 3,433,555 2,564,194 74.68%23
162 23663 National American Ins Co 2,983 0.0009% 5,153 1,845 35.80%226
163 930 23671 National American Ins Co Of CA 1,720 0.0005% 896 0 0.00%230
164 23701 National Automobile & Cas Ins Co 7,846 0.0025% 9,827 34,310 349.14%208
165 140 11991 National Cas Co 66,225 0.0208% 77,197 -917 -1.19%153
166 44 16217 National Farmers Union Prop & Cas 63,411 0.0199% 45,459 -945 -2.08%154
167 44 23752 National Farmers Union Std Ins Co 186,770 0.0587% 155,755 89,040 57.17%113
168 218 20478 National Fire Ins Co Of Hartford 239,235 0.0752% 260,065 20,502 7.88%105
169 761 21881 National Surety Corp 46,580 0.0146% 57,982 8,307 14.33%163
170 140 26093 Nationwide Affinity Ins Co of Amer 239 0.0001% 239 0 0.00%253
171 140 23779 Nationwide Mut Fire Ins Co 145,630 0.0458% 140,245 113,698 81.07%124
172 140 23787 Nationwide Mut Ins Co 397,115 0.1248% 365,866 114,095 31.18%83
173 212 10317 Neighborhood Spirit Prop & Cas Co 2,507,026 0.7878% 2,394,549 239,337 10.00%34
174 12 23841 New Hampshire Ins Co 125,662 0.0395% 118,994 -90,296 -75.88%132
175 1330 24848 Newport Ins Co 7,422,175 2.3322% 4,578,263 1,218,096 26.61%12
176 2558 27073 Nipponkoa Ins Co Ltd 83,813 0.0263% 83,886 33,645 40.11%146
177 181 29874 North American Specialty Ins Co 164,674 0.0517% 185,799 -61,388 -33.04%120
178 158 21105 North River Ins Co 1,903 0.0006% 3,125 21 0.67%228
179 44 38369 Northern Assur Co Of Amer 803 0.0003% 560 0 0.00%241
180 212 19372 Northern Ins Co Of NY 21,527 0.0068% 22,969 249,568 1086.54%181
181 41 24031 Northland Cas Co 14,607 0.0046% 9,477 124 1.31%189
182 41 24015 Northland Ins Co 379,556 0.1193% 236,164 218,289 92.43%85
183 1116 23906 Northwestern Natl Cas Co 108,083 0.0340% 14,445 20,015 138.56%139
184 38 20338 Northwestern Pacific Ind Co 9,572 0.0030% 9,153 2,609 28.50%201
185 150 24147 Old Republic Ins Co 22,550 0.0071% 36,707 15,179 41.35%180
186 645 14907 Oregon Mut Ins Co 1,235,944 0.3884% 1,230,305 550,240 44.72%57
187 1116 41408 Pacific Automobile Ins Co 17,536 0.0055% 20,131 10,246 50.90%185
188 38 20346 Pacific Ind Co 5,590 0.0018% 5,290 1,459 27.58%215
189 1116 23930 Pacific Natl Ins Co 174,604 0.0549% 167,861 -30,238 -18.01%118
190 408 11048 Pacific Prop & Cas Co 15,053 0.0047% 1,687 0 0.00%188
191 1218 32859 Penn-Amer Ins Co 104,203 0.0327% 90,117 74,345 82.50%140
192 44 40134 Potomac Ins Co Of IL 704 0.0002% 862 0 0.00%242
California Department of Insurance Page 4 of 6 Rate Specialist Bureau - 07/10/2001
2000 CALIFORNIA P & C MARKET SHARE REPORT
Source: NAIC Database Licensed companies only
Rec # Group # Naic # Company Name
Sorted by Company Name
WrittenPremium
Market Share
EarnedPremium
IncurredLosses
LossRatio
Line of Business: ALLIED LINES [02.1]
ShareRank
193 304 32352 Prudential Prop & Cas Ins Co 516,336 0.1622% 549,743 529,287 96.28%79
194 158 24384 Ranger Ins Co 184 0.0001% 5,120 59,153 1155.33%255
195 517 37303 Redland Ins Co 459,881 0.1445% 712,025 205,654 28.88%80
196 400 24449 Regent Ins Co 1,368 0.0004% 732 -4 -0.55%236
197 574 31089 Republic Western Ins Co 51,516 0.0162% 32,533 1,815,619 5580.85%159
198 800 15776 Residence Mut Ins Co 1,196,015 0.3758% 1,269,377 503,982 39.70%59
199 783 13056 RLI Ins Co 934,426 0.2936% 1,508,835 488,792 32.40%62
200 83 22128 Rocky Mountain Fire & Cas Co 118,306 0.0372% 111,090 265,473 238.97%133
201 553 24678 Royal Ind Co 5,346,890 1.6801% 3,992,253 953,116 23.87%13
202 553 26980 Royal Ins Co Of Amer 1,786,806 0.5615% 1,481,016 516,919 34.90%41
203 163 24740 Safeco Ins Co Of Amer 10,878,680 3.4184% 10,619,437 6,841,207 64.42%5
204 553 24694 Safeguard Ins Co 12,671 0.0040% 11,501 15,276 132.82%195
205 74 15105 Safety Natl Cas Corp 12,227 0.0038% 18,082 -203 -1.12%196
206 140 15580 Scottsdale Ind Co 23,348 0.0073% 23,418 7,637 32.61%179
207 553 24902 Security Ins Co Of Hartford 137,213 0.0431% 134,316 -46,698 -34.77%126
208 41 22233 Select Ins Co 1,700 0.0005% 1,654 6,000 362.76%231
209 169 24988 Sentry Ins A Mut Co 1,495,333 0.4699% 1,435,078 518,013 36.10%47
210 169 21180 Sentry Select Ins Co 1,251,520 0.3933% 1,405,402 76,154 5.42%55
211 772 22985 Sequoia Ins Co 26,652 0.0084% 40,876 1,980 4.84%175
212 686 39322 Sorema North Amer Reins Co 110,740 0.0348% 65,472 0 0.00%138
213 164 24767 St Paul Fire & Marine Ins Co 3,501,965 1.1004% 3,396,696 3,741,542 110.15%22
214 164 24775 St Paul Guardian Ins Co 340,818 0.1071% 272,033 192,921 70.92%90
215 164 24791 St Paul Mercury Ins Co 1,338,010 0.4204% 1,312,164 589,513 44.93%52
216 41 19070 Standard Fire Ins Co 209,613 0.0659% 248,453 34,827 14.02%109
217 19 42986 Standard Guaranty Ins Co 7,986 0.0025% 15,219 6,163 40.50%207
218 748 18023 Star Ins Co 11,315 0.0036% 9,241 192 2.08%198
219 176 25143 State Farm Fire And Cas Co 2,708,575 0.8511% 2,493,925 436,387 17.50%33
220 176 25151 State Farm General Ins Co 380,470 0.1196% 217,138 90,106 41.50%84
221 20362 Sumitomo Mar & Fire Ins Co Ltd Us Br 27,693 0.0087% 28,447 -8,792 -30.91%174
222 808 32107 Sutter Ins Co 96,206 0.0302% 103,001 84,726 82.26%143
223 158 25496 TIG Ind Co 1,357 0.0004% 778 0 0.00%237
224 158 25534 TIG Ins Co 308,098 0.0968% 214,478 -176,551 -82.32%94
225 950 12904 Tokio Marine & Fire Ins Co Ltd Us Br 2,928,030 0.9201% 2,660,027 378,013 14.21%31
226 161 18031 Topa Ins Co 253,196 0.0796% 251,335 86,444 34.39%102
227 218 20486 Transcontinental Ins Co 188,359 0.0592% 202,688 23,307 11.50%112
228 218 20494 Transportation Ins Co 45,816 0.0144% 42,282 1,000 2.37%164
229 41 19038 Travelers Cas & Surety Co 175,477 0.0551% 206,798 -3,180,401 -1537.93%117
230 41 25682 Travelers Ind Co Of CT 262,038 0.0823% 256,780 275,028 107.11%100
231 41 25674 Travelers Ind Co Of IL 3,035,912 0.9540% 2,827,183 6,222,348 220.09%29
232 41 36161 Travelers Prop Cas Ins Co 3,083,567 0.9689% 3,103,325 1,493,971 48.14%28
233 212 21709 Truck Ins Exch 423,952 0.1332% 522,453 518,723 99.29%81
234 91 29459 Twin City Fire Ins Co Co 1,427 0.0004% 4,206 93,804 2230.24%234
235 781 37893 Ulico Cas Co 560 0.0002% 303 0 0.00%243
236 400 25798 Unigard Ind Co 94,204 0.0296% 88,789 53,021 59.72%145
237 400 25747 Unigard Ins Co 3,108,075 0.9766% 2,675,771 1,230,847 46.00%27
238 215 11142 United Cas Ins Co Of Amer 660,268 0.2075% 649,537 23,592 3.63%72
239 200 25941 United Services Auto Assoc 4,063,944 1.2770% 3,997,744 3,564,743 89.17%19
240 158 21113 United States Fire Ins Co 374,097 0.1176% 637,278 1,005,988 157.86%86
California Department of Insurance Page 5 of 6 Rate Specialist Bureau - 07/10/2001
2000 CALIFORNIA P & C MARKET SHARE REPORT
Source: NAIC Database Licensed companies only
Rec # Group # Naic # Company Name
Sorted by Company Name
WrittenPremium
Market Share
EarnedPremium
IncurredLosses
LossRatio
Line of Business: ALLIED LINES [02.1]
ShareRank
241 212 41181 Universal Underwriters Ins Co 2,292,005 0.7202% 2,292,611 853,732 37.24%37
242 164 25887 US Fidelity & Guaranty Co 1,345,719 0.4229% 1,693,581 536,981 31.71%51
243 200 25968 USAA Cas Ins Co 669,272 0.2103% 627,786 787,164 125.39%70
244 28497 Usplate Glass Ins Co 710,524 0.2233% 752,938 94,905 12.60%69
245 201 25976 Utica Mut Ins Co 92 0.0000% 3,029 563 18.59%259
246 212 26611 Valiant Ins Co 2 0.0000% 51 -17 -33.33%262
247 218 20508 Valley Forge Ins Co 127,658 0.0401% 137,199 121,615 88.64%131
248 215 14133 Valley Ins Co 2,488,378 0.7819% 1,345,584 400,473 29.76%35
249 10815 Verlan Fire Ins Co MD 209,928 0.0660% 163,836 0 0.00%108
250 38 20397 Vigilant Ins Co 75,893 0.0238% 67,321 16,684 24.78%149
251 1172 19577 Villanova Ins Co 39,270 0.0123% 21,974 20,857 94.92%170
252 111 26069 Wausau Business Ins Co 1,641 0.0005% 1,292 -68 -5.26%232
253 111 26042 Wausau Underwriters Ins Co 8,519 0.0027% 2,868 123 4.29%206
254 1179 10683 Wawanesa General Ins Co 4,082 0.0013% 3,704 657 17.74%219
255 1179 31526 Wawanesa Mut Ins Co Us Branch 9,482 0.0030% 12,855 2,059 16.02%202
256 626 21121 Westchester Fire Ins Co 3,854,551 1.2112% 2,954,509 3,272,557 110.76%20
257 800 13625 Western Mut Ins Co 177,508 0.0558% 209,347 64,367 30.75%116
258 350 34207 Westport Ins Corp 4,488,497 1.4104% 1,960,142 -391,148 -19.96%17
259 400 24554 Winterthur Intl Amer Ins Co 5,149,859 1.6182% 4,450,132 2,236,325 50.25%14
260 11126 Yasuda Fire & Marine Ins Co Of Amer 116,979 0.0368% 182,987 -4,458 -2.44%135
261 336 13269 Zenith Ins Co 439 0.0001% 604 95 15.73%248
262 212 16535 Zurich American Ins Co 2,013,110 0.6326% 2,739,306 2,953,766 107.83%40
318,243,551 100.0000% 292,892,875 241,052,885 82.30%Line Total:
California Department of Insurance Page 6 of 6 Rate Specialist Bureau - 07/10/2001
2000 CALIFORNIA P & C MARKET SHARE REPORT
Source: NAIC Database Licensed companies only
Rec # Group # Naic # Company Name
Sorted by Company Name
WrittenPremium
Market Share
EarnedPremium
IncurredLosses
LossRatio
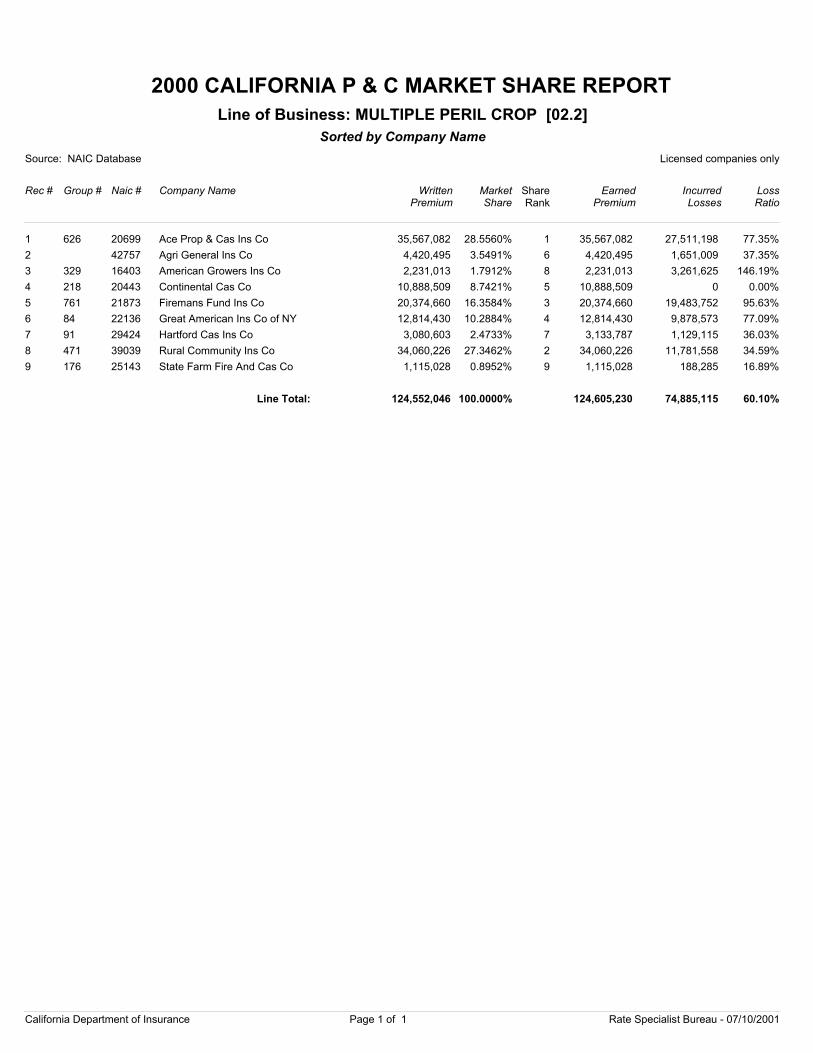
Line of Business: MULTIPLE PERIL CROP [02.2]
ShareRank
1 626 20699 Ace Prop & Cas Ins Co 35,567,082 28.5560% 35,567,082 27,511,198 77.35%1
2 42757 Agri General Ins Co 4,420,495 3.5491% 4,420,495 1,651,009 37.35%6
3 329 16403 American Growers Ins Co 2,231,013 1.7912% 2,231,013 3,261,625 146.19%8
4 218 20443 Continental Cas Co 10,888,509 8.7421% 10,888,509 0 0.00%5
5 761 21873 Firemans Fund Ins Co 20,374,660 16.3584% 20,374,660 19,483,752 95.63%3
6 84 22136 Great American Ins Co of NY 12,814,430 10.2884% 12,814,430 9,878,573 77.09%4
7 91 29424 Hartford Cas Ins Co 3,080,603 2.4733% 3,133,787 1,129,115 36.03%7
8 471 39039 Rural Community Ins Co 34,060,226 27.3462% 34,060,226 11,781,558 34.59%2
9 176 25143 State Farm Fire And Cas Co 1,115,028 0.8952% 1,115,028 188,285 16.89%9
124,552,046 100.0000% 124,605,230 74,885,115 60.10%Line Total:
California Department of Insurance Page 1 of 1 Rate Specialist Bureau - 07/10/2001
2000 CALIFORNIA P & C MARKET SHARE REPORT
Source: NAIC Database Licensed companies only
Rec # Group # Naic # Company Name
Sorted by Company Name
WrittenPremium
Market Share
EarnedPremium
IncurredLosses
LossRatio
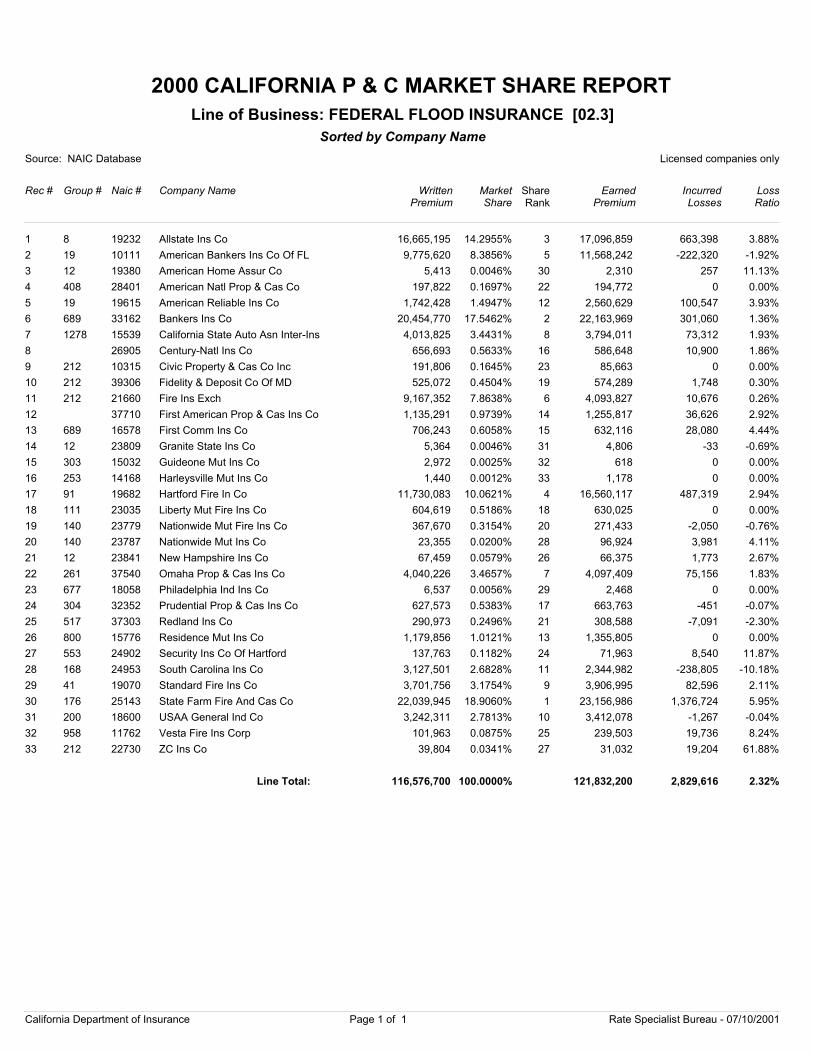
Line of Business: FEDERAL FLOOD INSURANCE [02.3]
ShareRank
1 8 19232 Allstate Ins Co 16,665,195 14.2955% 17,096,859 663,398 3.88%3
2 19 10111 American Bankers Ins Co Of FL 9,775,620 8.3856% 11,568,242 -222,320 -1.92%5
3 12 19380 American Home Assur Co 5,413 0.0046% 2,310 257 11.13%30
4 408 28401 American Natl Prop & Cas Co 197,822 0.1697% 194,772 0 0.00%22
5 19 19615 American Reliable Ins Co 1,742,428 1.4947% 2,560,629 100,547 3.93%12
6 689 33162 Bankers Ins Co 20,454,770 17.5462% 22,163,969 301,060 1.36%2
7 1278 15539 California State Auto Asn Inter-Ins 4,013,825 3.4431% 3,794,011 73,312 1.93%8
8 26905 Century-Natl Ins Co 656,693 0.5633% 586,648 10,900 1.86%16
9 212 10315 Civic Property & Cas Co Inc 191,806 0.1645% 85,663 0 0.00%23
10 212 39306 Fidelity & Deposit Co Of MD 525,072 0.4504% 574,289 1,748 0.30%19
11 212 21660 Fire Ins Exch 9,167,352 7.8638% 4,093,827 10,676 0.26%6
12 37710 First American Prop & Cas Ins Co 1,135,291 0.9739% 1,255,817 36,626 2.92%14
13 689 16578 First Comm Ins Co 706,243 0.6058% 632,116 28,080 4.44%15
14 12 23809 Granite State Ins Co 5,364 0.0046% 4,806 -33 -0.69%31
15 303 15032 Guideone Mut Ins Co 2,972 0.0025% 618 0 0.00%32
16 253 14168 Harleysville Mut Ins Co 1,440 0.0012% 1,178 0 0.00%33
17 91 19682 Hartford Fire In Co 11,730,083 10.0621% 16,560,117 487,319 2.94%4
18 111 23035 Liberty Mut Fire Ins Co 604,619 0.5186% 630,025 0 0.00%18
19 140 23779 Nationwide Mut Fire Ins Co 367,670 0.3154% 271,433 -2,050 -0.76%20
20 140 23787 Nationwide Mut Ins Co 23,355 0.0200% 96,924 3,981 4.11%28
21 12 23841 New Hampshire Ins Co 67,459 0.0579% 66,375 1,773 2.67%26
22 261 37540 Omaha Prop & Cas Ins Co 4,040,226 3.4657% 4,097,409 75,156 1.83%7
23 677 18058 Philadelphia Ind Ins Co 6,537 0.0056% 2,468 0 0.00%29
24 304 32352 Prudential Prop & Cas Ins Co 627,573 0.5383% 663,763 -451 -0.07%17
25 517 37303 Redland Ins Co 290,973 0.2496% 308,588 -7,091 -2.30%21
26 800 15776 Residence Mut Ins Co 1,179,856 1.0121% 1,355,805 0 0.00%13
27 553 24902 Security Ins Co Of Hartford 137,763 0.1182% 71,963 8,540 11.87%24
28 168 24953 South Carolina Ins Co 3,127,501 2.6828% 2,344,982 -238,805 -10.18%11
29 41 19070 Standard Fire Ins Co 3,701,756 3.1754% 3,906,995 82,596 2.11%9
30 176 25143 State Farm Fire And Cas Co 22,039,945 18.9060% 23,156,986 1,376,724 5.95%1
31 200 18600 USAA General Ind Co 3,242,311 2.7813% 3,412,078 -1,267 -0.04%10
32 958 11762 Vesta Fire Ins Corp 101,963 0.0875% 239,503 19,736 8.24%25
33 212 22730 ZC Ins Co 39,804 0.0341% 31,032 19,204 61.88%27
116,576,700 100.0000% 121,832,200 2,829,616 2.32%Line Total:
California Department of Insurance Page 1 of 1 Rate Specialist Bureau - 07/10/2001
2000 CALIFORNIA P & C MARKET SHARE REPORT
Source: NAIC Database Licensed companies only
Rec # Group # Naic # Company Name
Sorted by Company Name
WrittenPremium
Market Share
EarnedPremium
IncurredLosses
LossRatio
Line of Business: FARMOWNERS MULTIPLE PERIL [03]
ShareRank
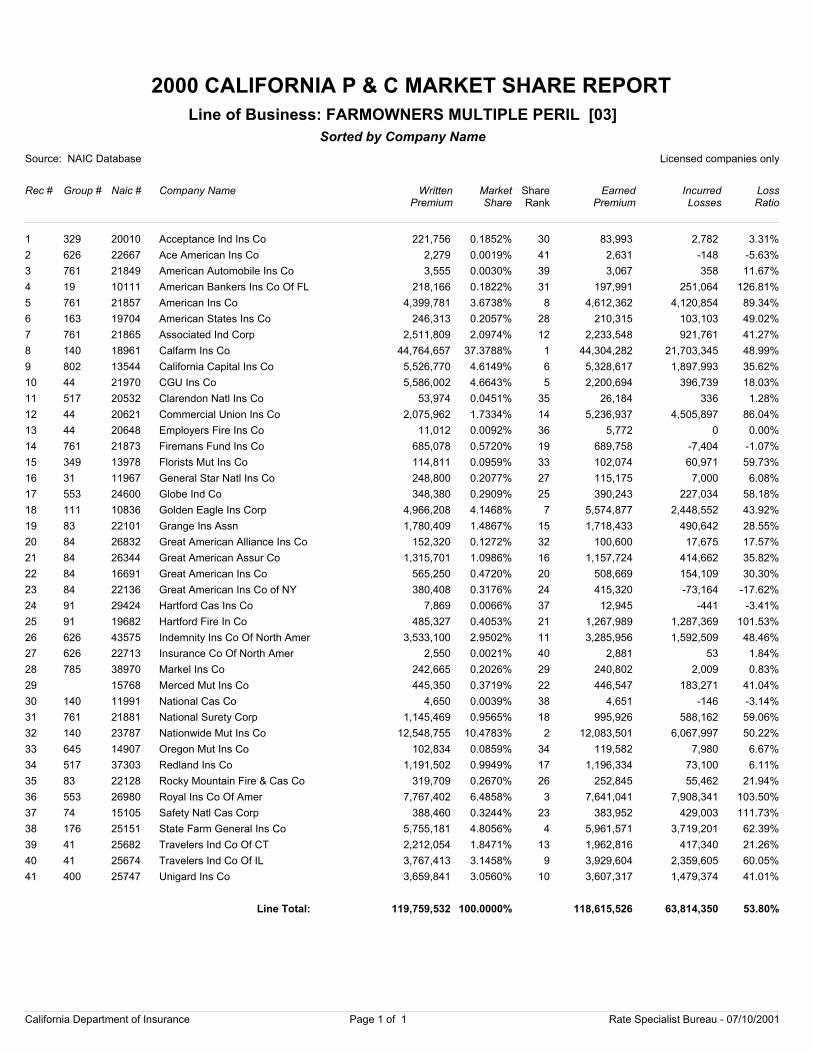
1 329 20010 Acceptance Ind Ins Co 221,756 0.1852% 83,993 2,782 3.31%30
2 626 22667 Ace American Ins Co 2,279 0.0019% 2,631 -148 -5.63%41
3 761 21849 American Automobile Ins Co 3,555 0.0030% 3,067 358 11.67%39
4 19 10111 American Bankers Ins Co Of FL 218,166 0.1822% 197,991 251,064 126.81%31
5 761 21857 American Ins Co 4,399,781 3.6738% 4,612,362 4,120,854 89.34%8
6 163 19704 American States Ins Co 246,313 0.2057% 210,315 103,103 49.02%28
7 761 21865 Associated Ind Corp 2,511,809 2.0974% 2,233,548 921,761 41.27%12
8 140 18961 Calfarm Ins Co 44,764,657 37.3788% 44,304,282 21,703,345 48.99%1
9 802 13544 California Capital Ins Co 5,526,770 4.6149% 5,328,617 1,897,993 35.62%6
10 44 21970 CGU Ins Co 5,586,002 4.6643% 2,200,694 396,739 18.03%5
11 517 20532 Clarendon Natl Ins Co 53,974 0.0451% 26,184 336 1.28%35
12 44 20621 Commercial Union Ins Co 2,075,962 1.7334% 5,236,937 4,505,897 86.04%14
13 44 20648 Employers Fire Ins Co 11,012 0.0092% 5,772 0 0.00%36
14 761 21873 Firemans Fund Ins Co 685,078 0.5720% 689,758 -7,404 -1.07%19
15 349 13978 Florists Mut Ins Co 114,811 0.0959% 102,074 60,971 59.73%33
16 31 11967 General Star Natl Ins Co 248,800 0.2077% 115,175 7,000 6.08%27
17 553 24600 Globe Ind Co 348,380 0.2909% 390,243 227,034 58.18%25
18 111 10836 Golden Eagle Ins Corp 4,966,208 4.1468% 5,574,877 2,448,552 43.92%7
19 83 22101 Grange Ins Assn 1,780,409 1.4867% 1,718,433 490,642 28.55%15
20 84 26832 Great American Alliance Ins Co 152,320 0.1272% 100,600 17,675 17.57%32
21 84 26344 Great American Assur Co 1,315,701 1.0986% 1,157,724 414,662 35.82%16
22 84 16691 Great American Ins Co 565,250 0.4720% 508,669 154,109 30.30%20
23 84 22136 Great American Ins Co of NY 380,408 0.3176% 415,320 -73,164 -17.62%24
24 91 29424 Hartford Cas Ins Co 7,869 0.0066% 12,945 -441 -3.41%37
25 91 19682 Hartford Fire In Co 485,327 0.4053% 1,267,989 1,287,369 101.53%21
26 626 43575 Indemnity Ins Co Of North Amer 3,533,100 2.9502% 3,285,956 1,592,509 48.46%11
27 626 22713 Insurance Co Of North Amer 2,550 0.0021% 2,881 53 1.84%40
28 785 38970 Markel Ins Co 242,665 0.2026% 240,802 2,009 0.83%29
29 15768 Merced Mut Ins Co 445,350 0.3719% 446,547 183,271 41.04%22
30 140 11991 National Cas Co 4,650 0.0039% 4,651 -146 -3.14%38
31 761 21881 National Surety Corp 1,145,469 0.9565% 995,926 588,162 59.06%18
32 140 23787 Nationwide Mut Ins Co 12,548,755 10.4783% 12,083,501 6,067,997 50.22%2
33 645 14907 Oregon Mut Ins Co 102,834 0.0859% 119,582 7,980 6.67%34
34 517 37303 Redland Ins Co 1,191,502 0.9949% 1,196,334 73,100 6.11%17
35 83 22128 Rocky Mountain Fire & Cas Co 319,709 0.2670% 252,845 55,462 21.94%26
36 553 26980 Royal Ins Co Of Amer 7,767,402 6.4858% 7,641,041 7,908,341 103.50%3
37 74 15105 Safety Natl Cas Corp 388,460 0.3244% 383,952 429,003 111.73%23
38 176 25151 State Farm General Ins Co 5,755,181 4.8056% 5,961,571 3,719,201 62.39%4
39 41 25682 Travelers Ind Co Of CT 2,212,054 1.8471% 1,962,816 417,340 21.26%13
40 41 25674 Travelers Ind Co Of IL 3,767,413 3.1458% 3,929,604 2,359,605 60.05%9
41 400 25747 Unigard Ins Co 3,659,841 3.0560% 3,607,317 1,479,374 41.01%10
119,759,532 100.0000% 118,615,526 63,814,350 53.80%Line Total:
California Department of Insurance Page 1 of 1 Rate Specialist Bureau - 07/10/2001
2000 CALIFORNIA P & C MARKET SHARE REPORT
Source: NAIC Database Licensed companies only
Rec # Group # Naic # Company Name
Sorted by Company Name
WrittenPremium
Market Share
EarnedPremium
IncurredLosses
LossRatio
Line of Business: HOMEOWNERS MULTIPLE PERIL [04]
ShareRank
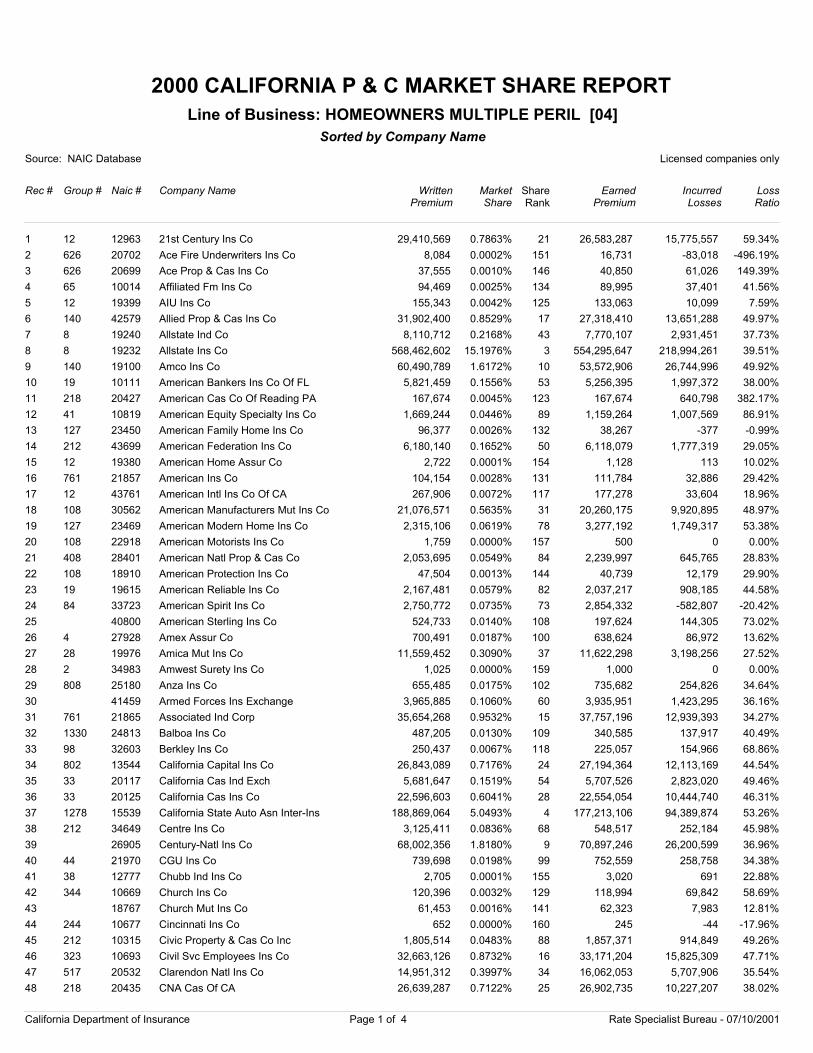
1 12 12963 21st Century Ins Co 29,410,569 0.7863% 26,583,287 15,775,557 59.34%21
2 626 20702 Ace Fire Underwriters Ins Co 8,084 0.0002% 16,731 -83,018 -496.19%151
3 626 20699 Ace Prop & Cas Ins Co 37,555 0.0010% 40,850 61,026 149.39%146
4 65 10014 Affiliated Fm Ins Co 94,469 0.0025% 89,995 37,401 41.56%134
5 12 19399 AIU Ins Co 155,343 0.0042% 133,063 10,099 7.59%125
6 140 42579 Allied Prop & Cas Ins Co 31,902,400 0.8529% 27,318,410 13,651,288 49.97%17
7 8 19240 Allstate Ind Co 8,110,712 0.2168% 7,770,107 2,931,451 37.73%43
8 8 19232 Allstate Ins Co 568,462,602 15.1976% 554,295,647 218,994,261 39.51%3
9 140 19100 Amco Ins Co 60,490,789 1.6172% 53,572,906 26,744,996 49.92%10
10 19 10111 American Bankers Ins Co Of FL 5,821,459 0.1556% 5,256,395 1,997,372 38.00%53
11 218 20427 American Cas Co Of Reading PA 167,674 0.0045% 167,674 640,798 382.17%123
12 41 10819 American Equity Specialty Ins Co 1,669,244 0.0446% 1,159,264 1,007,569 86.91%89
13 127 23450 American Family Home Ins Co 96,377 0.0026% 38,267 -377 -0.99%132
14 212 43699 American Federation Ins Co 6,180,140 0.1652% 6,118,079 1,777,319 29.05%50
15 12 19380 American Home Assur Co 2,722 0.0001% 1,128 113 10.02%154
16 761 21857 American Ins Co 104,154 0.0028% 111,784 32,886 29.42%131
17 12 43761 American Intl Ins Co Of CA 267,906 0.0072% 177,278 33,604 18.96%117
18 108 30562 American Manufacturers Mut Ins Co 21,076,571 0.5635% 20,260,175 9,920,895 48.97%31
19 127 23469 American Modern Home Ins Co 2,315,106 0.0619% 3,277,192 1,749,317 53.38%78
20 108 22918 American Motorists Ins Co 1,759 0.0000% 500 0 0.00%157
21 408 28401 American Natl Prop & Cas Co 2,053,695 0.0549% 2,239,997 645,765 28.83%84
22 108 18910 American Protection Ins Co 47,504 0.0013% 40,739 12,179 29.90%144
23 19 19615 American Reliable Ins Co 2,167,481 0.0579% 2,037,217 908,185 44.58%82
24 84 33723 American Spirit Ins Co 2,750,772 0.0735% 2,854,332 -582,807 -20.42%73
25 40800 American Sterling Ins Co 524,733 0.0140% 197,624 144,305 73.02%108
26 4 27928 Amex Assur Co 700,491 0.0187% 638,624 86,972 13.62%100
27 28 19976 Amica Mut Ins Co 11,559,452 0.3090% 11,622,298 3,198,256 27.52%37
28 2 34983 Amwest Surety Ins Co 1,025 0.0000% 1,000 0 0.00%159
29 808 25180 Anza Ins Co 655,485 0.0175% 735,682 254,826 34.64%102
30 41459 Armed Forces Ins Exchange 3,965,885 0.1060% 3,935,951 1,423,295 36.16%60
31 761 21865 Associated Ind Corp 35,654,268 0.9532% 37,757,196 12,939,393 34.27%15
32 1330 24813 Balboa Ins Co 487,205 0.0130% 340,585 137,917 40.49%109
33 98 32603 Berkley Ins Co 250,437 0.0067% 225,057 154,966 68.86%118
34 802 13544 California Capital Ins Co 26,843,089 0.7176% 27,194,364 12,113,169 44.54%24
35 33 20117 California Cas Ind Exch 5,681,647 0.1519% 5,707,526 2,823,020 49.46%54
36 33 20125 California Cas Ins Co 22,596,603 0.6041% 22,554,054 10,444,740 46.31%28
37 1278 15539 California State Auto Asn Inter-Ins 188,869,064 5.0493% 177,213,106 94,389,874 53.26%4
38 212 34649 Centre Ins Co 3,125,411 0.0836% 548,517 252,184 45.98%68
39 26905 Century-Natl Ins Co 68,002,356 1.8180% 70,897,246 26,200,599 36.96%9
40 44 21970 CGU Ins Co 739,698 0.0198% 752,559 258,758 34.38%99
41 38 12777 Chubb Ind Ins Co 2,705 0.0001% 3,020 691 22.88%155
42 344 10669 Church Ins Co 120,396 0.0032% 118,994 69,842 58.69%129
43 18767 Church Mut Ins Co 61,453 0.0016% 62,323 7,983 12.81%141
44 244 10677 Cincinnati Ins Co 652 0.0000% 245 -44 -17.96%160
45 212 10315 Civic Property & Cas Co Inc 1,805,514 0.0483% 1,857,371 914,849 49.26%88
46 323 10693 Civil Svc Employees Ins Co 32,663,126 0.8732% 33,171,204 15,825,309 47.71%16
47 517 20532 Clarendon Natl Ins Co 14,951,312 0.3997% 16,062,053 5,707,906 35.54%34
48 218 20435 CNA Cas Of CA 26,639,287 0.7122% 26,902,735 10,227,207 38.02%25
California Department of Insurance Page 1 of 4 Rate Specialist Bureau - 07/10/2001
2000 CALIFORNIA P & C MARKET SHARE REPORT
Source: NAIC Database Licensed companies only
Rec # Group # Naic # Company Name
Sorted by Company Name
WrittenPremium
Market Share
EarnedPremium
IncurredLosses
LossRatio
Line of Business: HOMEOWNERS MULTIPLE PERIL [04]
ShareRank
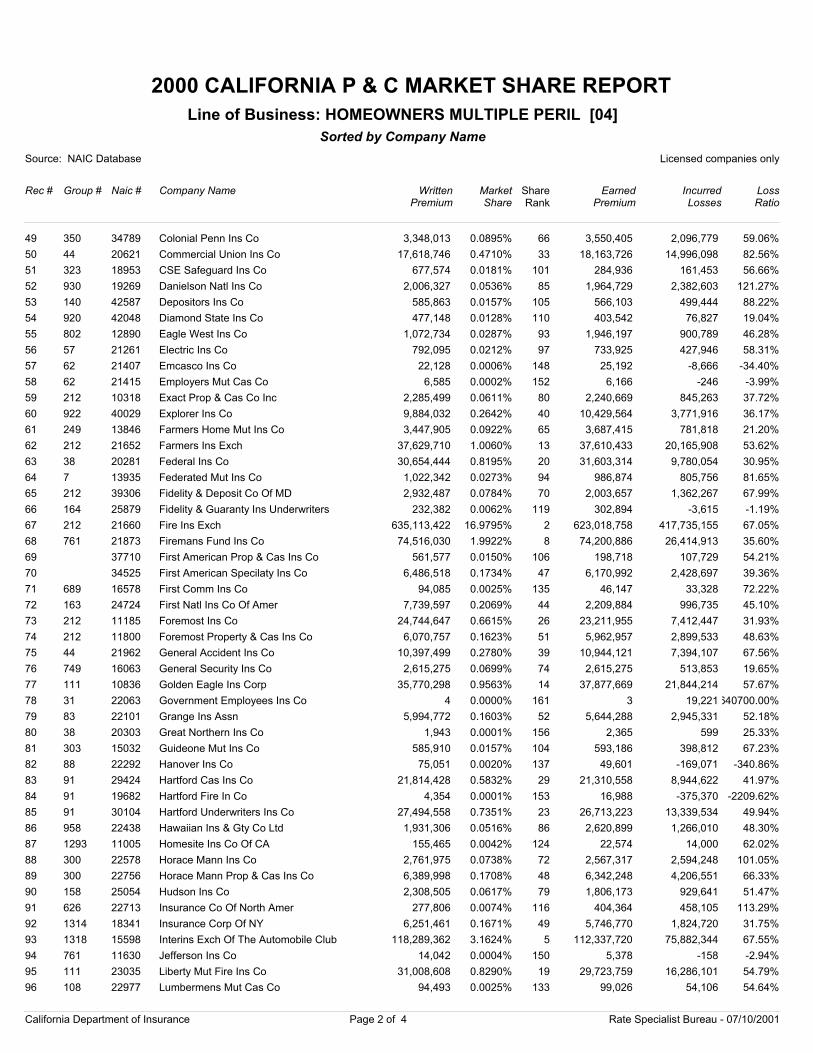
49 350 34789 Colonial Penn Ins Co 3,348,013 0.0895% 3,550,405 2,096,779 59.06%66
50 44 20621 Commercial Union Ins Co 17,618,746 0.4710% 18,163,726 14,996,098 82.56%33
51 323 18953 CSE Safeguard Ins Co 677,574 0.0181% 284,936 161,453 56.66%101
52 930 19269 Danielson Natl Ins Co 2,006,327 0.0536% 1,964,729 2,382,603 121.27%85
53 140 42587 Depositors Ins Co 585,863 0.0157% 566,103 499,444 88.22%105
54 920 42048 Diamond State Ins Co 477,148 0.0128% 403,542 76,827 19.04%110
55 802 12890 Eagle West Ins Co 1,072,734 0.0287% 1,946,197 900,789 46.28%93
56 57 21261 Electric Ins Co 792,095 0.0212% 733,925 427,946 58.31%97
57 62 21407 Emcasco Ins Co 22,128 0.0006% 25,192 -8,666 -34.40%148
58 62 21415 Employers Mut Cas Co 6,585 0.0002% 6,166 -246 -3.99%152
59 212 10318 Exact Prop & Cas Co Inc 2,285,499 0.0611% 2,240,669 845,263 37.72%80
60 922 40029 Explorer Ins Co 9,884,032 0.2642% 10,429,564 3,771,916 36.17%40
61 249 13846 Farmers Home Mut Ins Co 3,447,905 0.0922% 3,687,415 781,818 21.20%65
62 212 21652 Farmers Ins Exch 37,629,710 1.0060% 37,610,433 20,165,908 53.62%13
63 38 20281 Federal Ins Co 30,654,444 0.8195% 31,603,314 9,780,054 30.95%20
64 7 13935 Federated Mut Ins Co 1,022,342 0.0273% 986,874 805,756 81.65%94
65 212 39306 Fidelity & Deposit Co Of MD 2,932,487 0.0784% 2,003,657 1,362,267 67.99%70
66 164 25879 Fidelity & Guaranty Ins Underwriters 232,382 0.0062% 302,894 -3,615 -1.19%119
67 212 21660 Fire Ins Exch 635,113,422 16.9795% 623,018,758 417,735,155 67.05%2
68 761 21873 Firemans Fund Ins Co 74,516,030 1.9922% 74,200,886 26,414,913 35.60%8
69 37710 First American Prop & Cas Ins Co 561,577 0.0150% 198,718 107,729 54.21%106
70 34525 First American Specilaty Ins Co 6,486,518 0.1734% 6,170,992 2,428,697 39.36%47
71 689 16578 First Comm Ins Co 94,085 0.0025% 46,147 33,328 72.22%135
72 163 24724 First Natl Ins Co Of Amer 7,739,597 0.2069% 2,209,884 996,735 45.10%44
73 212 11185 Foremost Ins Co 24,744,647 0.6615% 23,211,955 7,412,447 31.93%26
74 212 11800 Foremost Property & Cas Ins Co 6,070,757 0.1623% 5,962,957 2,899,533 48.63%51
75 44 21962 General Accident Ins Co 10,397,499 0.2780% 10,944,121 7,394,107 67.56%39
76 749 16063 General Security Ins Co 2,615,275 0.0699% 2,615,275 513,853 19.65%74
77 111 10836 Golden Eagle Ins Corp 35,770,298 0.9563% 37,877,669 21,844,214 57.67%14
78 31 22063 Government Employees Ins Co 4 0.0000% 3 19,221640700.00%161
79 83 22101 Grange Ins Assn 5,994,772 0.1603% 5,644,288 2,945,331 52.18%52
80 38 20303 Great Northern Ins Co 1,943 0.0001% 2,365 599 25.33%156
81 303 15032 Guideone Mut Ins Co 585,910 0.0157% 593,186 398,812 67.23%104
82 88 22292 Hanover Ins Co 75,051 0.0020% 49,601 -169,071 -340.86%137
83 91 29424 Hartford Cas Ins Co 21,814,428 0.5832% 21,310,558 8,944,622 41.97%29
84 91 19682 Hartford Fire In Co 4,354 0.0001% 16,988 -375,370 -2209.62%153
85 91 30104 Hartford Underwriters Ins Co 27,494,558 0.7351% 26,713,223 13,339,534 49.94%23
86 958 22438 Hawaiian Ins & Gty Co Ltd 1,931,306 0.0516% 2,620,899 1,266,010 48.30%86
87 1293 11005 Homesite Ins Co Of CA 155,465 0.0042% 22,574 14,000 62.02%124
88 300 22578 Horace Mann Ins Co 2,761,975 0.0738% 2,567,317 2,594,248 101.05%72
89 300 22756 Horace Mann Prop & Cas Ins Co 6,389,998 0.1708% 6,342,248 4,206,551 66.33%48
90 158 25054 Hudson Ins Co 2,308,505 0.0617% 1,806,173 929,641 51.47%79
91 626 22713 Insurance Co Of North Amer 277,806 0.0074% 404,364 458,105 113.29%116
92 1314 18341 Insurance Corp Of NY 6,251,461 0.1671% 5,746,770 1,824,720 31.75%49
93 1318 15598 Interins Exch Of The Automobile Club 118,289,362 3.1624% 112,337,720 75,882,344 67.55%5
94 761 11630 Jefferson Ins Co 14,042 0.0004% 5,378 -158 -2.94%150
95 111 23035 Liberty Mut Fire Ins Co 31,008,608 0.8290% 29,723,759 16,286,101 54.79%19
96 108 22977 Lumbermens Mut Cas Co 94,493 0.0025% 99,026 54,106 54.64%133
California Department of Insurance Page 2 of 4 Rate Specialist Bureau - 07/10/2001
2000 CALIFORNIA P & C MARKET SHARE REPORT
Source: NAIC Database Licensed companies only
Rec # Group # Naic # Company Name
Sorted by Company Name
WrittenPremium
Market Share
EarnedPremium
IncurredLosses
LossRatio
Line of Business: HOMEOWNERS MULTIPLE PERIL [04]
ShareRank
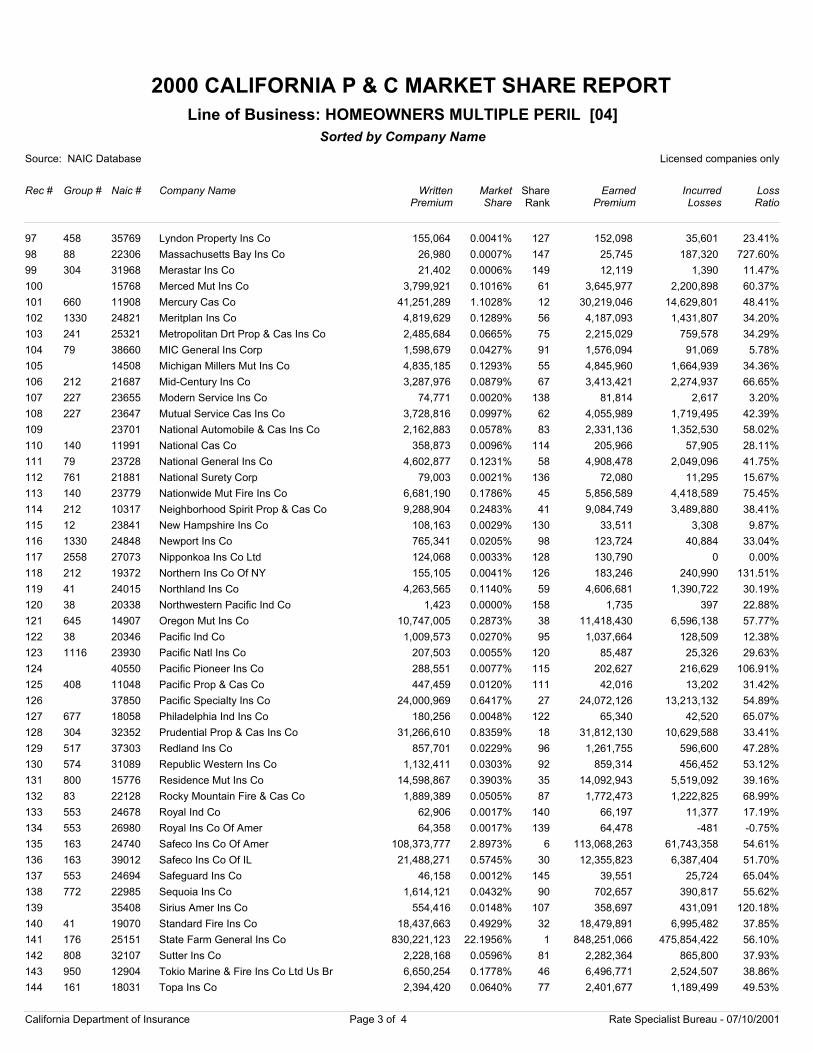
97 458 35769 Lyndon Property Ins Co 155,064 0.0041% 152,098 35,601 23.41%127
98 88 22306 Massachusetts Bay Ins Co 26,980 0.0007% 25,745 187,320 727.60%147
99 304 31968 Merastar Ins Co 21,402 0.0006% 12,119 1,390 11.47%149
100 15768 Merced Mut Ins Co 3,799,921 0.1016% 3,645,977 2,200,898 60.37%61
101 660 11908 Mercury Cas Co 41,251,289 1.1028% 30,219,046 14,629,801 48.41%12
102 1330 24821 Meritplan Ins Co 4,819,629 0.1289% 4,187,093 1,431,807 34.20%56
103 241 25321 Metropolitan Drt Prop & Cas Ins Co 2,485,684 0.0665% 2,215,029 759,578 34.29%75
104 79 38660 MIC General Ins Corp 1,598,679 0.0427% 1,576,094 91,069 5.78%91
105 14508 Michigan Millers Mut Ins Co 4,835,185 0.1293% 4,845,960 1,664,939 34.36%55
106 212 21687 Mid-Century Ins Co 3,287,976 0.0879% 3,413,421 2,274,937 66.65%67
107 227 23655 Modern Service Ins Co 74,771 0.0020% 81,814 2,617 3.20%138
108 227 23647 Mutual Service Cas Ins Co 3,728,816 0.0997% 4,055,989 1,719,495 42.39%62
109 23701 National Automobile & Cas Ins Co 2,162,883 0.0578% 2,331,136 1,352,530 58.02%83
110 140 11991 National Cas Co 358,873 0.0096% 205,966 57,905 28.11%114
111 79 23728 National General Ins Co 4,602,877 0.1231% 4,908,478 2,049,096 41.75%58
112 761 21881 National Surety Corp 79,003 0.0021% 72,080 11,295 15.67%136
113 140 23779 Nationwide Mut Fire Ins Co 6,681,190 0.1786% 5,856,589 4,418,589 75.45%45
114 212 10317 Neighborhood Spirit Prop & Cas Co 9,288,904 0.2483% 9,084,749 3,489,880 38.41%41
115 12 23841 New Hampshire Ins Co 108,163 0.0029% 33,511 3,308 9.87%130
116 1330 24848 Newport Ins Co 765,341 0.0205% 123,724 40,884 33.04%98
117 2558 27073 Nipponkoa Ins Co Ltd 124,068 0.0033% 130,790 0 0.00%128
118 212 19372 Northern Ins Co Of NY 155,105 0.0041% 183,246 240,990 131.51%126
119 41 24015 Northland Ins Co 4,263,565 0.1140% 4,606,681 1,390,722 30.19%59
120 38 20338 Northwestern Pacific Ind Co 1,423 0.0000% 1,735 397 22.88%158
121 645 14907 Oregon Mut Ins Co 10,747,005 0.2873% 11,418,430 6,596,138 57.77%38
122 38 20346 Pacific Ind Co 1,009,573 0.0270% 1,037,664 128,509 12.38%95
123 1116 23930 Pacific Natl Ins Co 207,503 0.0055% 85,487 25,326 29.63%120
124 40550 Pacific Pioneer Ins Co 288,551 0.0077% 202,627 216,629 106.91%115
125 408 11048 Pacific Prop & Cas Co 447,459 0.0120% 42,016 13,202 31.42%111
126 37850 Pacific Specialty Ins Co 24,000,969 0.6417% 24,072,126 13,213,132 54.89%27
127 677 18058 Philadelphia Ind Ins Co 180,256 0.0048% 65,340 42,520 65.07%122
128 304 32352 Prudential Prop & Cas Ins Co 31,266,610 0.8359% 31,812,130 10,629,588 33.41%18
129 517 37303 Redland Ins Co 857,701 0.0229% 1,261,755 596,600 47.28%96
130 574 31089 Republic Western Ins Co 1,132,411 0.0303% 859,314 456,452 53.12%92
131 800 15776 Residence Mut Ins Co 14,598,867 0.3903% 14,092,943 5,519,092 39.16%35
132 83 22128 Rocky Mountain Fire & Cas Co 1,889,389 0.0505% 1,772,473 1,222,825 68.99%87
133 553 24678 Royal Ind Co 62,906 0.0017% 66,197 11,377 17.19%140
134 553 26980 Royal Ins Co Of Amer 64,358 0.0017% 64,478 -481 -0.75%139
135 163 24740 Safeco Ins Co Of Amer 108,373,777 2.8973% 113,068,263 61,743,358 54.61%6
136 163 39012 Safeco Ins Co Of IL 21,488,271 0.5745% 12,355,823 6,387,404 51.70%30
137 553 24694 Safeguard Ins Co 46,158 0.0012% 39,551 25,724 65.04%145
138 772 22985 Sequoia Ins Co 1,614,121 0.0432% 702,657 390,817 55.62%90
139 35408 Sirius Amer Ins Co 554,416 0.0148% 358,697 431,091 120.18%107
140 41 19070 Standard Fire Ins Co 18,437,663 0.4929% 18,479,891 6,995,482 37.85%32
141 176 25151 State Farm General Ins Co 830,221,123 22.1956% 848,251,066 475,854,422 56.10%1
142 808 32107 Sutter Ins Co 2,228,168 0.0596% 2,282,364 865,800 37.93%81
143 950 12904 Tokio Marine & Fire Ins Co Ltd Us Br 6,650,254 0.1778% 6,496,771 2,524,507 38.86%46
144 161 18031 Topa Ins Co 2,394,420 0.0640% 2,401,677 1,189,499 49.53%77
California Department of Insurance Page 3 of 4 Rate Specialist Bureau - 07/10/2001
2000 CALIFORNIA P & C MARKET SHARE REPORT
Source: NAIC Database Licensed companies only
Rec # Group # Naic # Company Name
Sorted by Company Name
WrittenPremium
Market Share
EarnedPremium
IncurredLosses
LossRatio
Line of Business: HOMEOWNERS MULTIPLE PERIL [04]
ShareRank
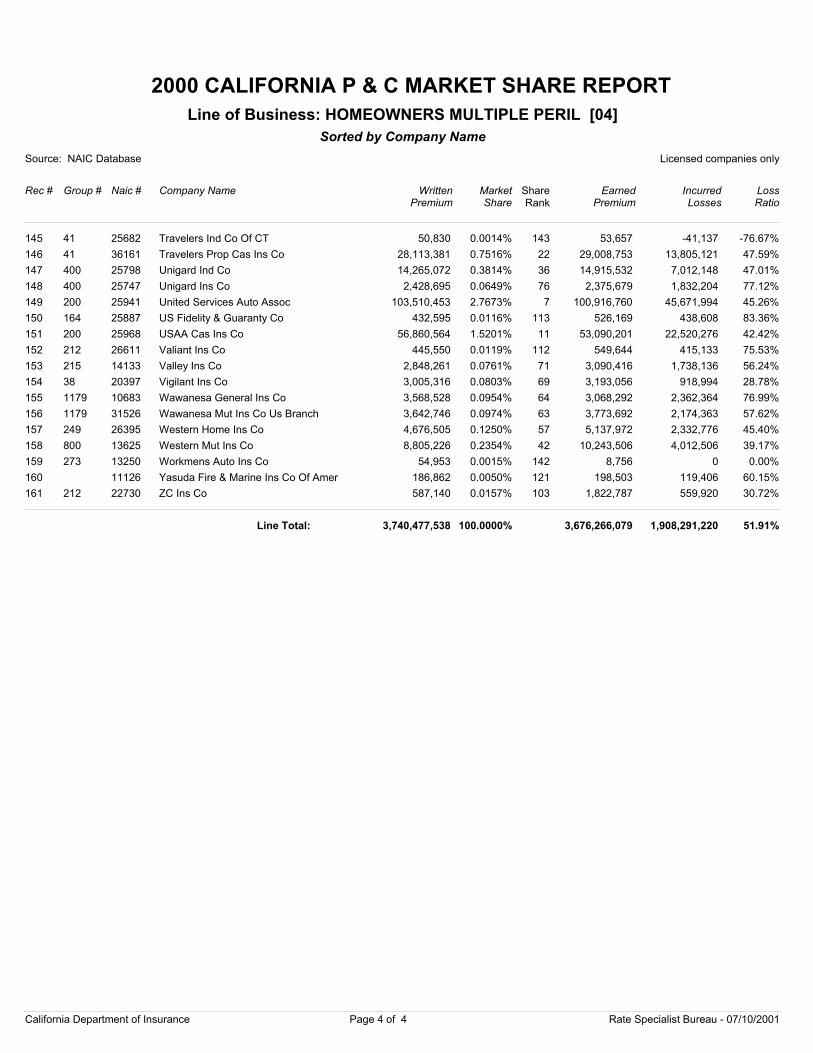
145 41 25682 Travelers Ind Co Of CT 50,830 0.0014% 53,657 -41,137 -76.67%143
146 41 36161 Travelers Prop Cas Ins Co 28,113,381 0.7516% 29,008,753 13,805,121 47.59%22
147 400 25798 Unigard Ind Co 14,265,072 0.3814% 14,915,532 7,012,148 47.01%36
148 400 25747 Unigard Ins Co 2,428,695 0.0649% 2,375,679 1,832,204 77.12%76
149 200 25941 United Services Auto Assoc 103,510,453 2.7673% 100,916,760 45,671,994 45.26%7
150 164 25887 US Fidelity & Guaranty Co 432,595 0.0116% 526,169 438,608 83.36%113
151 200 25968 USAA Cas Ins Co 56,860,564 1.5201% 53,090,201 22,520,276 42.42%11
152 212 26611 Valiant Ins Co 445,550 0.0119% 549,644 415,133 75.53%112
153 215 14133 Valley Ins Co 2,848,261 0.0761% 3,090,416 1,738,136 56.24%71
154 38 20397 Vigilant Ins Co 3,005,316 0.0803% 3,193,056 918,994 28.78%69
155 1179 10683 Wawanesa General Ins Co 3,568,528 0.0954% 3,068,292 2,362,364 76.99%64
156 1179 31526 Wawanesa Mut Ins Co Us Branch 3,642,746 0.0974% 3,773,692 2,174,363 57.62%63
157 249 26395 Western Home Ins Co 4,676,505 0.1250% 5,137,972 2,332,776 45.40%57
158 800 13625 Western Mut Ins Co 8,805,226 0.2354% 10,243,506 4,012,506 39.17%42
159 273 13250 Workmens Auto Ins Co 54,953 0.0015% 8,756 0 0.00%142
160 11126 Yasuda Fire & Marine Ins Co Of Amer 186,862 0.0050% 198,503 119,406 60.15%121
161 212 22730 ZC Ins Co 587,140 0.0157% 1,822,787 559,920 30.72%103
3,740,477,538 100.0000% 3,676,266,079 1,908,291,220 51.91%Line Total:
California Department of Insurance Page 4 of 4 Rate Specialist Bureau - 07/10/2001
2000 CALIFORNIA P & C MARKET SHARE REPORT
Source: NAIC Database Licensed companies only
Rec # Group # Naic # Company Name
Sorted by Company Name
WrittenPremium
Market Share
EarnedPremium
IncurredLosses
LossRatio
Line of Business: COMMERCIAL MULTIPLE PERIL(NON-LIABILITY) [05.1]
ShareRank
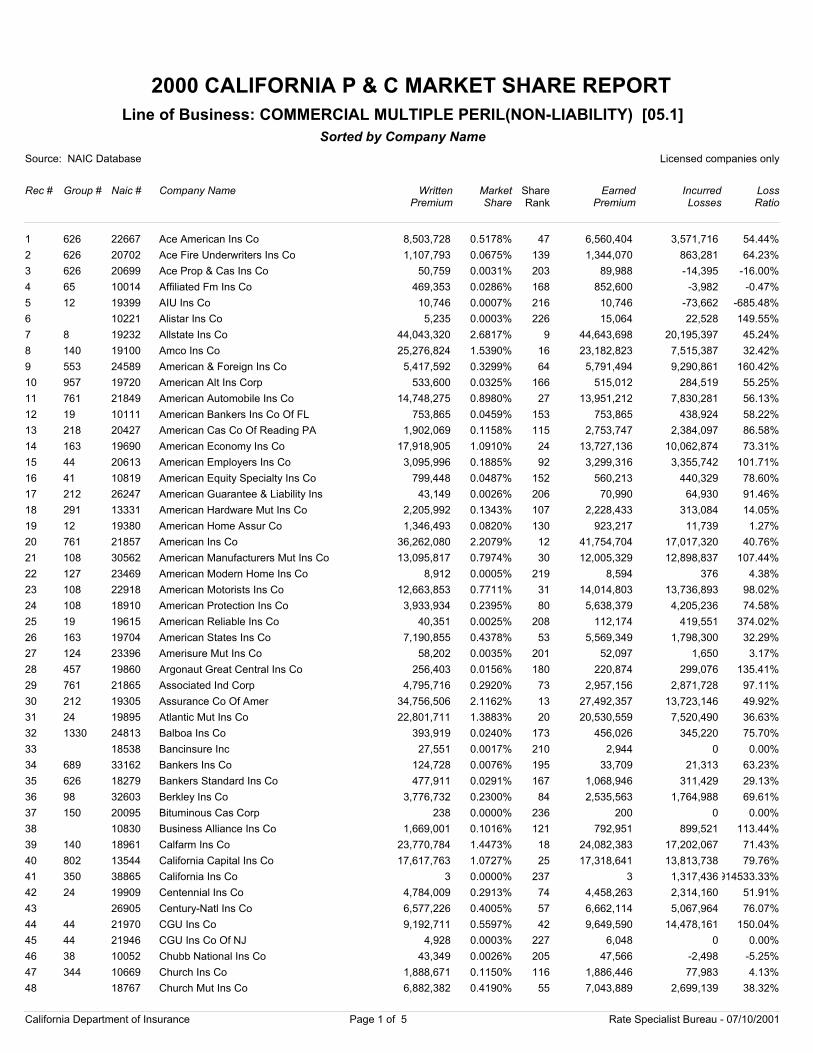
1 626 22667 Ace American Ins Co 8,503,728 0.5178% 6,560,404 3,571,716 54.44%47
2 626 20702 Ace Fire Underwriters Ins Co 1,107,793 0.0675% 1,344,070 863,281 64.23%139
3 626 20699 Ace Prop & Cas Ins Co 50,759 0.0031% 89,988 -14,395 -16.00%203
4 65 10014 Affiliated Fm Ins Co 469,353 0.0286% 852,600 -3,982 -0.47%168
5 12 19399 AIU Ins Co 10,746 0.0007% 10,746 -73,662 -685.48%216
6 10221 Alistar Ins Co 5,235 0.0003% 15,064 22,528 149.55%226
7 8 19232 Allstate Ins Co 44,043,320 2.6817% 44,643,698 20,195,397 45.24%9
8 140 19100 Amco Ins Co 25,276,824 1.5390% 23,182,823 7,515,387 32.42%16
9 553 24589 American & Foreign Ins Co 5,417,592 0.3299% 5,791,494 9,290,861 160.42%64
10 957 19720 American Alt Ins Corp 533,600 0.0325% 515,012 284,519 55.25%166
11 761 21849 American Automobile Ins Co 14,748,275 0.8980% 13,951,212 7,830,281 56.13%27
12 19 10111 American Bankers Ins Co Of FL 753,865 0.0459% 753,865 438,924 58.22%153
13 218 20427 American Cas Co Of Reading PA 1,902,069 0.1158% 2,753,747 2,384,097 86.58%115
14 163 19690 American Economy Ins Co 17,918,905 1.0910% 13,727,136 10,062,874 73.31%24
15 44 20613 American Employers Ins Co 3,095,996 0.1885% 3,299,316 3,355,742 101.71%92
16 41 10819 American Equity Specialty Ins Co 799,448 0.0487% 560,213 440,329 78.60%152
17 212 26247 American Guarantee & Liability Ins 43,149 0.0026% 70,990 64,930 91.46%206
18 291 13331 American Hardware Mut Ins Co 2,205,992 0.1343% 2,228,433 313,084 14.05%107
19 12 19380 American Home Assur Co 1,346,493 0.0820% 923,217 11,739 1.27%130
20 761 21857 American Ins Co 36,262,080 2.2079% 41,754,704 17,017,320 40.76%12
21 108 30562 American Manufacturers Mut Ins Co 13,095,817 0.7974% 12,005,329 12,898,837 107.44%30
22 127 23469 American Modern Home Ins Co 8,912 0.0005% 8,594 376 4.38%219
23 108 22918 American Motorists Ins Co 12,663,853 0.7711% 14,014,803 13,736,893 98.02%31
24 108 18910 American Protection Ins Co 3,933,934 0.2395% 5,638,379 4,205,236 74.58%80
25 19 19615 American Reliable Ins Co 40,351 0.0025% 112,174 419,551 374.02%208
26 163 19704 American States Ins Co 7,190,855 0.4378% 5,569,349 1,798,300 32.29%53
27 124 23396 Amerisure Mut Ins Co 58,202 0.0035% 52,097 1,650 3.17%201
28 457 19860 Argonaut Great Central Ins Co 256,403 0.0156% 220,874 299,076 135.41%180
29 761 21865 Associated Ind Corp 4,795,716 0.2920% 2,957,156 2,871,728 97.11%73
30 212 19305 Assurance Co Of Amer 34,756,506 2.1162% 27,492,357 13,723,146 49.92%13
31 24 19895 Atlantic Mut Ins Co 22,801,711 1.3883% 20,530,559 7,520,490 36.63%20
32 1330 24813 Balboa Ins Co 393,919 0.0240% 456,026 345,220 75.70%173
33 18538 Bancinsure Inc 27,551 0.0017% 2,944 0 0.00%210
34 689 33162 Bankers Ins Co 124,728 0.0076% 33,709 21,313 63.23%195
35 626 18279 Bankers Standard Ins Co 477,911 0.0291% 1,068,946 311,429 29.13%167
36 98 32603 Berkley Ins Co 3,776,732 0.2300% 2,535,563 1,764,988 69.61%84
37 150 20095 Bituminous Cas Corp 238 0.0000% 200 0 0.00%236
38 10830 Business Alliance Ins Co 1,669,001 0.1016% 792,951 899,521 113.44%121
39 140 18961 Calfarm Ins Co 23,770,784 1.4473% 24,082,383 17,202,067 71.43%18
40 802 13544 California Capital Ins Co 17,617,763 1.0727% 17,318,641 13,813,738 79.76%25
41 350 38865 California Ins Co 3 0.0000% 3 1,317,436914533.33%237
42 24 19909 Centennial Ins Co 4,784,009 0.2913% 4,458,263 2,314,160 51.91%74
43 26905 Century-Natl Ins Co 6,577,226 0.4005% 6,662,114 5,067,964 76.07%57
44 44 21970 CGU Ins Co 9,192,711 0.5597% 9,649,590 14,478,161 150.04%42
45 44 21946 CGU Ins Co Of NJ 4,928 0.0003% 6,048 0 0.00%227
46 38 10052 Chubb National Ins Co 43,349 0.0026% 47,566 -2,498 -5.25%205
47 344 10669 Church Ins Co 1,888,671 0.1150% 1,886,446 77,983 4.13%116
48 18767 Church Mut Ins Co 6,882,382 0.4190% 7,043,889 2,699,139 38.32%55
California Department of Insurance Page 1 of 5 Rate Specialist Bureau - 07/10/2001
2000 CALIFORNIA P & C MARKET SHARE REPORT
Source: NAIC Database Licensed companies only
Rec # Group # Naic # Company Name
Sorted by Company Name
WrittenPremium
Market Share
EarnedPremium
IncurredLosses
LossRatio
Line of Business: COMMERCIAL MULTIPLE PERIL(NON-LIABILITY) [05.1]
ShareRank
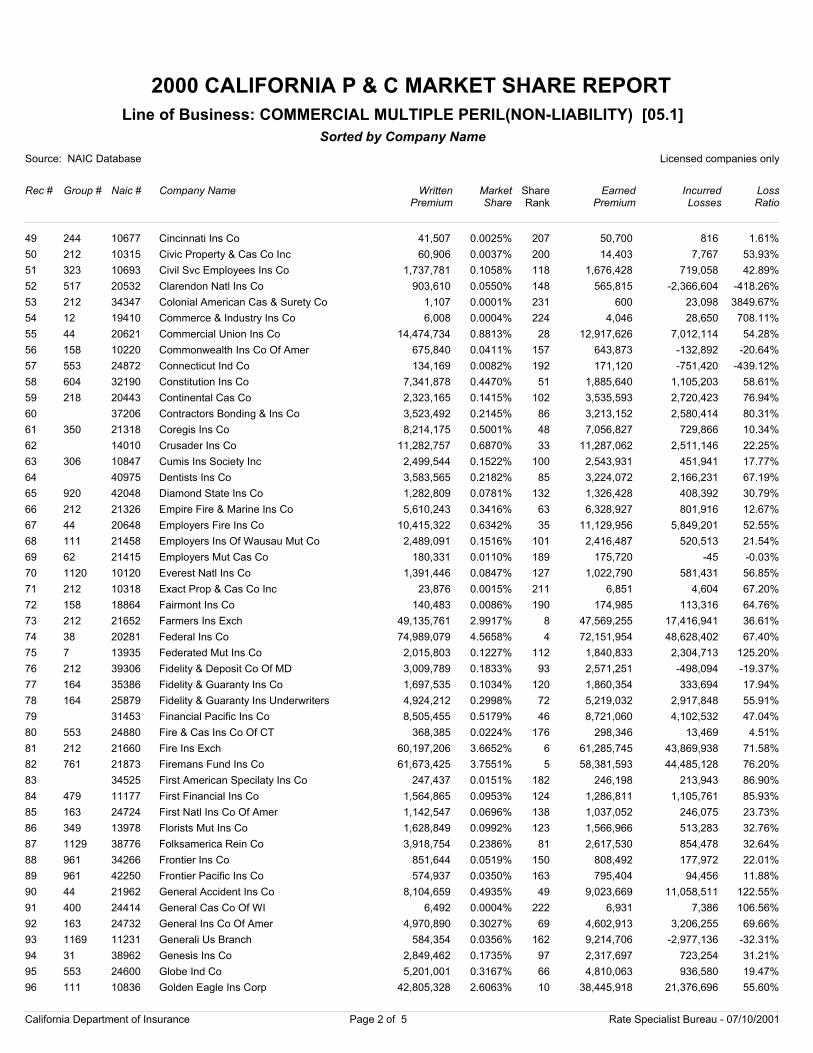
49 244 10677 Cincinnati Ins Co 41,507 0.0025% 50,700 816 1.61%207
50 212 10315 Civic Property & Cas Co Inc 60,906 0.0037% 14,403 7,767 53.93%200
51 323 10693 Civil Svc Employees Ins Co 1,737,781 0.1058% 1,676,428 719,058 42.89%118
52 517 20532 Clarendon Natl Ins Co 903,610 0.0550% 565,815 -2,366,604 -418.26%148
53 212 34347 Colonial American Cas & Surety Co 1,107 0.0001% 600 23,098 3849.67%231
54 12 19410 Commerce & Industry Ins Co 6,008 0.0004% 4,046 28,650 708.11%224
55 44 20621 Commercial Union Ins Co 14,474,734 0.8813% 12,917,626 7,012,114 54.28%28
56 158 10220 Commonwealth Ins Co Of Amer 675,840 0.0411% 643,873 -132,892 -20.64%157
57 553 24872 Connecticut Ind Co 134,169 0.0082% 171,120 -751,420 -439.12%192
58 604 32190 Constitution Ins Co 7,341,878 0.4470% 1,885,640 1,105,203 58.61%51
59 218 20443 Continental Cas Co 2,323,165 0.1415% 3,535,593 2,720,423 76.94%102
60 37206 Contractors Bonding & Ins Co 3,523,492 0.2145% 3,213,152 2,580,414 80.31%86
61 350 21318 Coregis Ins Co 8,214,175 0.5001% 7,056,827 729,866 10.34%48
62 14010 Crusader Ins Co 11,282,757 0.6870% 11,287,062 2,511,146 22.25%33
63 306 10847 Cumis Ins Society Inc 2,499,544 0.1522% 2,543,931 451,941 17.77%100
64 40975 Dentists Ins Co 3,583,565 0.2182% 3,224,072 2,166,231 67.19%85
65 920 42048 Diamond State Ins Co 1,282,809 0.0781% 1,326,428 408,392 30.79%132
66 212 21326 Empire Fire & Marine Ins Co 5,610,243 0.3416% 6,328,927 801,916 12.67%63
67 44 20648 Employers Fire Ins Co 10,415,322 0.6342% 11,129,956 5,849,201 52.55%35
68 111 21458 Employers Ins Of Wausau Mut Co 2,489,091 0.1516% 2,416,487 520,513 21.54%101
69 62 21415 Employers Mut Cas Co 180,331 0.0110% 175,720 -45 -0.03%189
70 1120 10120 Everest Natl Ins Co 1,391,446 0.0847% 1,022,790 581,431 56.85%127
71 212 10318 Exact Prop & Cas Co Inc 23,876 0.0015% 6,851 4,604 67.20%211
72 158 18864 Fairmont Ins Co 140,483 0.0086% 174,985 113,316 64.76%190
73 212 21652 Farmers Ins Exch 49,135,761 2.9917% 47,569,255 17,416,941 36.61%8
74 38 20281 Federal Ins Co 74,989,079 4.5658% 72,151,954 48,628,402 67.40%4
75 7 13935 Federated Mut Ins Co 2,015,803 0.1227% 1,840,833 2,304,713 125.20%112
76 212 39306 Fidelity & Deposit Co Of MD 3,009,789 0.1833% 2,571,251 -498,094 -19.37%93
77 164 35386 Fidelity & Guaranty Ins Co 1,697,535 0.1034% 1,860,354 333,694 17.94%120
78 164 25879 Fidelity & Guaranty Ins Underwriters 4,924,212 0.2998% 5,219,032 2,917,848 55.91%72
79 31453 Financial Pacific Ins Co 8,505,455 0.5179% 8,721,060 4,102,532 47.04%46
80 553 24880 Fire & Cas Ins Co Of CT 368,385 0.0224% 298,346 13,469 4.51%176
81 212 21660 Fire Ins Exch 60,197,206 3.6652% 61,285,745 43,869,938 71.58%6
82 761 21873 Firemans Fund Ins Co 61,673,425 3.7551% 58,381,593 44,485,128 76.20%5
83 34525 First American Specilaty Ins Co 247,437 0.0151% 246,198 213,943 86.90%182
84 479 11177 First Financial Ins Co 1,564,865 0.0953% 1,286,811 1,105,761 85.93%124
85 163 24724 First Natl Ins Co Of Amer 1,142,547 0.0696% 1,037,052 246,075 23.73%138
86 349 13978 Florists Mut Ins Co 1,628,849 0.0992% 1,566,966 513,283 32.76%123
87 1129 38776 Folksamerica Rein Co 3,918,754 0.2386% 2,617,530 854,478 32.64%81
88 961 34266 Frontier Ins Co 851,644 0.0519% 808,492 177,972 22.01%150
89 961 42250 Frontier Pacific Ins Co 574,937 0.0350% 795,404 94,456 11.88%163
90 44 21962 General Accident Ins Co 8,104,659 0.4935% 9,023,669 11,058,511 122.55%49
91 400 24414 General Cas Co Of WI 6,492 0.0004% 6,931 7,386 106.56%222
92 163 24732 General Ins Co Of Amer 4,970,890 0.3027% 4,602,913 3,206,255 69.66%69
93 1169 11231 Generali Us Branch 584,354 0.0356% 9,214,706 -2,977,136 -32.31%162
94 31 38962 Genesis Ins Co 2,849,462 0.1735% 2,317,697 723,254 31.21%97
95 553 24600 Globe Ind Co 5,201,001 0.3167% 4,810,063 936,580 19.47%66
96 111 10836 Golden Eagle Ins Corp 42,805,328 2.6063% 38,445,918 21,376,696 55.60%10
California Department of Insurance Page 2 of 5 Rate Specialist Bureau - 07/10/2001
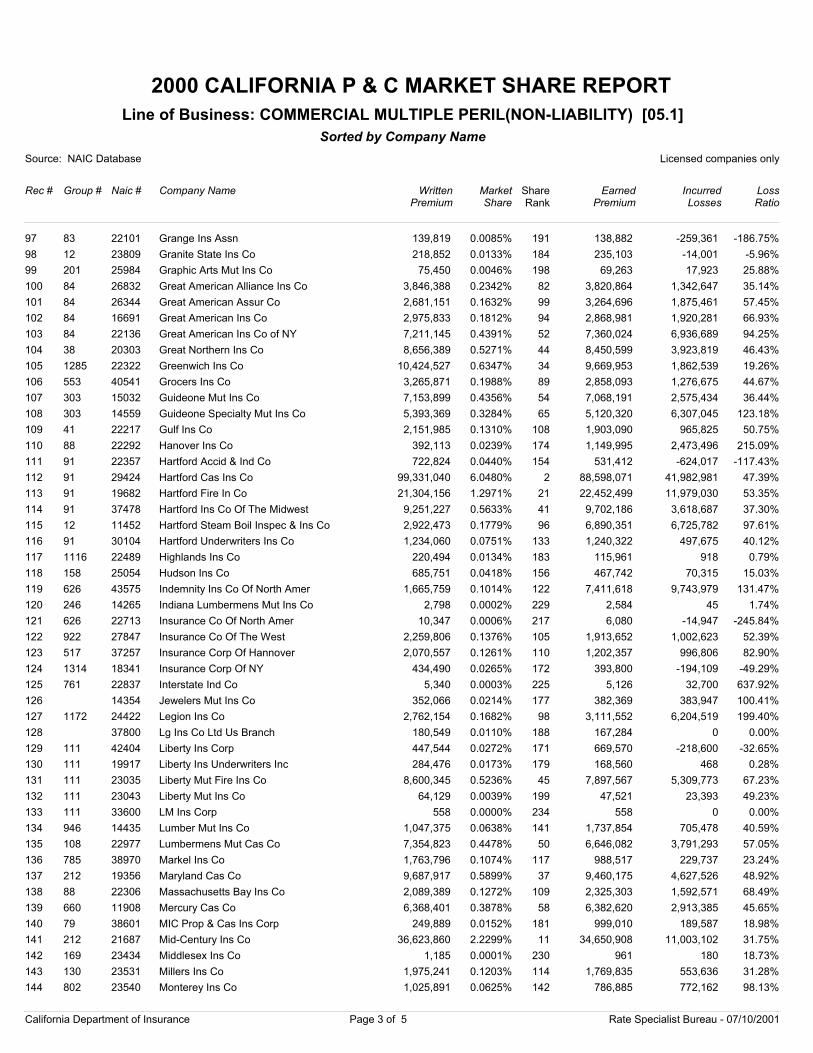
2000 CALIFORNIA P & C MARKET SHARE REPORT
Source: NAIC Database Licensed companies only
Rec # Group # Naic # Company Name
Sorted by Company Name
WrittenPremium
Market Share
EarnedPremium
IncurredLosses
LossRatio
Line of Business: COMMERCIAL MULTIPLE PERIL(NON-LIABILITY) [05.1]
ShareRank
97 83 22101 Grange Ins Assn 139,819 0.0085% 138,882 -259,361 -186.75%191
98 12 23809 Granite State Ins Co 218,852 0.0133% 235,103 -14,001 -5.96%184
99 201 25984 Graphic Arts Mut Ins Co 75,450 0.0046% 69,263 17,923 25.88%198
100 84 26832 Great American Alliance Ins Co 3,846,388 0.2342% 3,820,864 1,342,647 35.14%82
101 84 26344 Great American Assur Co 2,681,151 0.1632% 3,264,696 1,875,461 57.45%99
102 84 16691 Great American Ins Co 2,975,833 0.1812% 2,868,981 1,920,281 66.93%94
103 84 22136 Great American Ins Co of NY 7,211,145 0.4391% 7,360,024 6,936,689 94.25%52
104 38 20303 Great Northern Ins Co 8,656,389 0.5271% 8,450,599 3,923,819 46.43%44
105 1285 22322 Greenwich Ins Co 10,424,527 0.6347% 9,669,953 1,862,539 19.26%34
106 553 40541 Grocers Ins Co 3,265,871 0.1988% 2,858,093 1,276,675 44.67%89
107 303 15032 Guideone Mut Ins Co 7,153,899 0.4356% 7,068,191 2,575,434 36.44%54
108 303 14559 Guideone Specialty Mut Ins Co 5,393,369 0.3284% 5,120,320 6,307,045 123.18%65
109 41 22217 Gulf Ins Co 2,151,985 0.1310% 1,903,090 965,825 50.75%108
110 88 22292 Hanover Ins Co 392,113 0.0239% 1,149,995 2,473,496 215.09%174
111 91 22357 Hartford Accid & Ind Co 722,824 0.0440% 531,412 -624,017 -117.43%154
112 91 29424 Hartford Cas Ins Co 99,331,040 6.0480% 88,598,071 41,982,981 47.39%2
113 91 19682 Hartford Fire In Co 21,304,156 1.2971% 22,452,499 11,979,030 53.35%21
114 91 37478 Hartford Ins Co Of The Midwest 9,251,227 0.5633% 9,702,186 3,618,687 37.30%41
115 12 11452 Hartford Steam Boil Inspec & Ins Co 2,922,473 0.1779% 6,890,351 6,725,782 97.61%96
116 91 30104 Hartford Underwriters Ins Co 1,234,060 0.0751% 1,240,322 497,675 40.12%133
117 1116 22489 Highlands Ins Co 220,494 0.0134% 115,961 918 0.79%183
118 158 25054 Hudson Ins Co 685,751 0.0418% 467,742 70,315 15.03%156
119 626 43575 Indemnity Ins Co Of North Amer 1,665,759 0.1014% 7,411,618 9,743,979 131.47%122
120 246 14265 Indiana Lumbermens Mut Ins Co 2,798 0.0002% 2,584 45 1.74%229
121 626 22713 Insurance Co Of North Amer 10,347 0.0006% 6,080 -14,947 -245.84%217
122 922 27847 Insurance Co Of The West 2,259,806 0.1376% 1,913,652 1,002,623 52.39%105
123 517 37257 Insurance Corp Of Hannover 2,070,557 0.1261% 1,202,357 996,806 82.90%110
124 1314 18341 Insurance Corp Of NY 434,490 0.0265% 393,800 -194,109 -49.29%172
125 761 22837 Interstate Ind Co 5,340 0.0003% 5,126 32,700 637.92%225
126 14354 Jewelers Mut Ins Co 352,066 0.0214% 382,369 383,947 100.41%177
127 1172 24422 Legion Ins Co 2,762,154 0.1682% 3,111,552 6,204,519 199.40%98
128 37800 Lg Ins Co Ltd Us Branch 180,549 0.0110% 167,284 0 0.00%188
129 111 42404 Liberty Ins Corp 447,544 0.0272% 669,570 -218,600 -32.65%171
130 111 19917 Liberty Ins Underwriters Inc 284,476 0.0173% 168,560 468 0.28%179
131 111 23035 Liberty Mut Fire Ins Co 8,600,345 0.5236% 7,897,567 5,309,773 67.23%45
132 111 23043 Liberty Mut Ins Co 64,129 0.0039% 47,521 23,393 49.23%199
133 111 33600 LM Ins Corp 558 0.0000% 558 0 0.00%234
134 946 14435 Lumber Mut Ins Co 1,047,375 0.0638% 1,737,854 705,478 40.59%141
135 108 22977 Lumbermens Mut Cas Co 7,354,823 0.4478% 6,646,082 3,791,293 57.05%50
136 785 38970 Markel Ins Co 1,763,796 0.1074% 988,517 229,737 23.24%117
137 212 19356 Maryland Cas Co 9,687,917 0.5899% 9,460,175 4,627,526 48.92%37
138 88 22306 Massachusetts Bay Ins Co 2,089,389 0.1272% 2,325,303 1,592,571 68.49%109
139 660 11908 Mercury Cas Co 6,368,401 0.3878% 6,382,620 2,913,385 45.65%58
140 79 38601 MIC Prop & Cas Ins Corp 249,889 0.0152% 999,010 189,587 18.98%181
141 212 21687 Mid-Century Ins Co 36,623,860 2.2299% 34,650,908 11,003,102 31.75%11
142 169 23434 Middlesex Ins Co 1,185 0.0001% 961 180 18.73%230
143 130 23531 Millers Ins Co 1,975,241 0.1203% 1,769,835 553,636 31.28%114
144 802 23540 Monterey Ins Co 1,025,891 0.0625% 786,885 772,162 98.13%142
California Department of Insurance Page 3 of 5 Rate Specialist Bureau - 07/10/2001
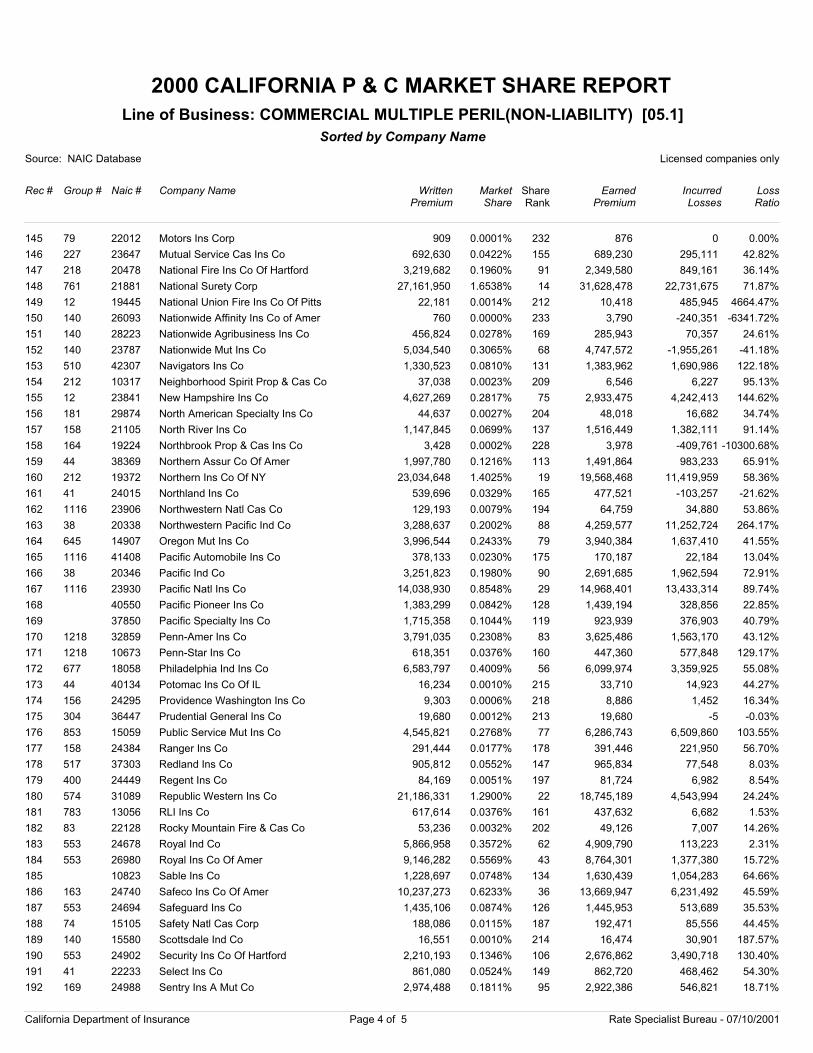
2000 CALIFORNIA P & C MARKET SHARE REPORT
Source: NAIC Database Licensed companies only
Rec # Group # Naic # Company Name
Sorted by Company Name
WrittenPremium
Market Share
EarnedPremium
IncurredLosses
LossRatio
Line of Business: COMMERCIAL MULTIPLE PERIL(NON-LIABILITY) [05.1]
ShareRank
145 79 22012 Motors Ins Corp 909 0.0001% 876 0 0.00%232
146 227 23647 Mutual Service Cas Ins Co 692,630 0.0422% 689,230 295,111 42.82%155
147 218 20478 National Fire Ins Co Of Hartford 3,219,682 0.1960% 2,349,580 849,161 36.14%91
148 761 21881 National Surety Corp 27,161,950 1.6538% 31,628,478 22,731,675 71.87%14
149 12 19445 National Union Fire Ins Co Of Pitts 22,181 0.0014% 10,418 485,945 4664.47%212
150 140 26093 Nationwide Affinity Ins Co of Amer 760 0.0000% 3,790 -240,351 -6341.72%233
151 140 28223 Nationwide Agribusiness Ins Co 456,824 0.0278% 285,943 70,357 24.61%169
152 140 23787 Nationwide Mut Ins Co 5,034,540 0.3065% 4,747,572 -1,955,261 -41.18%68
153 510 42307 Navigators Ins Co 1,330,523 0.0810% 1,383,962 1,690,986 122.18%131
154 212 10317 Neighborhood Spirit Prop & Cas Co 37,038 0.0023% 6,546 6,227 95.13%209
155 12 23841 New Hampshire Ins Co 4,627,269 0.2817% 2,933,475 4,242,413 144.62%75
156 181 29874 North American Specialty Ins Co 44,637 0.0027% 48,018 16,682 34.74%204
157 158 21105 North River Ins Co 1,147,845 0.0699% 1,516,449 1,382,111 91.14%137
158 164 19224 Northbrook Prop & Cas Ins Co 3,428 0.0002% 3,978 -409,761 -10300.68%228
159 44 38369 Northern Assur Co Of Amer 1,997,780 0.1216% 1,491,864 983,233 65.91%113
160 212 19372 Northern Ins Co Of NY 23,034,648 1.4025% 19,568,468 11,419,959 58.36%19
161 41 24015 Northland Ins Co 539,696 0.0329% 477,521 -103,257 -21.62%165
162 1116 23906 Northwestern Natl Cas Co 129,193 0.0079% 64,759 34,880 53.86%194
163 38 20338 Northwestern Pacific Ind Co 3,288,637 0.2002% 4,259,577 11,252,724 264.17%88
164 645 14907 Oregon Mut Ins Co 3,996,544 0.2433% 3,940,384 1,637,410 41.55%79
165 1116 41408 Pacific Automobile Ins Co 378,133 0.0230% 170,187 22,184 13.04%175
166 38 20346 Pacific Ind Co 3,251,823 0.1980% 2,691,685 1,962,594 72.91%90
167 1116 23930 Pacific Natl Ins Co 14,038,930 0.8548% 14,968,401 13,433,314 89.74%29
168 40550 Pacific Pioneer Ins Co 1,383,299 0.0842% 1,439,194 328,856 22.85%128
169 37850 Pacific Specialty Ins Co 1,715,358 0.1044% 923,939 376,903 40.79%119
170 1218 32859 Penn-Amer Ins Co 3,791,035 0.2308% 3,625,486 1,563,170 43.12%83
171 1218 10673 Penn-Star Ins Co 618,351 0.0376% 447,360 577,848 129.17%160
172 677 18058 Philadelphia Ind Ins Co 6,583,797 0.4009% 6,099,974 3,359,925 55.08%56
173 44 40134 Potomac Ins Co Of IL 16,234 0.0010% 33,710 14,923 44.27%215
174 156 24295 Providence Washington Ins Co 9,303 0.0006% 8,886 1,452 16.34%218
175 304 36447 Prudential General Ins Co 19,680 0.0012% 19,680 -5 -0.03%213
176 853 15059 Public Service Mut Ins Co 4,545,821 0.2768% 6,286,743 6,509,860 103.55%77
177 158 24384 Ranger Ins Co 291,444 0.0177% 391,446 221,950 56.70%178
178 517 37303 Redland Ins Co 905,812 0.0552% 965,834 77,548 8.03%147
179 400 24449 Regent Ins Co 84,169 0.0051% 81,724 6,982 8.54%197
180 574 31089 Republic Western Ins Co 21,186,331 1.2900% 18,745,189 4,543,994 24.24%22
181 783 13056 RLI Ins Co 617,614 0.0376% 437,632 6,682 1.53%161
182 83 22128 Rocky Mountain Fire & Cas Co 53,236 0.0032% 49,126 7,007 14.26%202
183 553 24678 Royal Ind Co 5,866,958 0.3572% 4,909,790 113,223 2.31%62
184 553 26980 Royal Ins Co Of Amer 9,146,282 0.5569% 8,764,301 1,377,380 15.72%43
185 10823 Sable Ins Co 1,228,697 0.0748% 1,630,439 1,054,283 64.66%134
186 163 24740 Safeco Ins Co Of Amer 10,237,273 0.6233% 13,669,947 6,231,492 45.59%36
187 553 24694 Safeguard Ins Co 1,435,106 0.0874% 1,445,953 513,689 35.53%126
188 74 15105 Safety Natl Cas Corp 188,086 0.0115% 192,471 85,556 44.45%187
189 140 15580 Scottsdale Ind Co 16,551 0.0010% 16,474 30,901 187.57%214
190 553 24902 Security Ins Co Of Hartford 2,210,193 0.1346% 2,676,862 3,490,718 130.40%106
191 41 22233 Select Ins Co 861,080 0.0524% 862,720 468,462 54.30%149
192 169 24988 Sentry Ins A Mut Co 2,974,488 0.1811% 2,922,386 546,821 18.71%95
California Department of Insurance Page 4 of 5 Rate Specialist Bureau - 07/10/2001
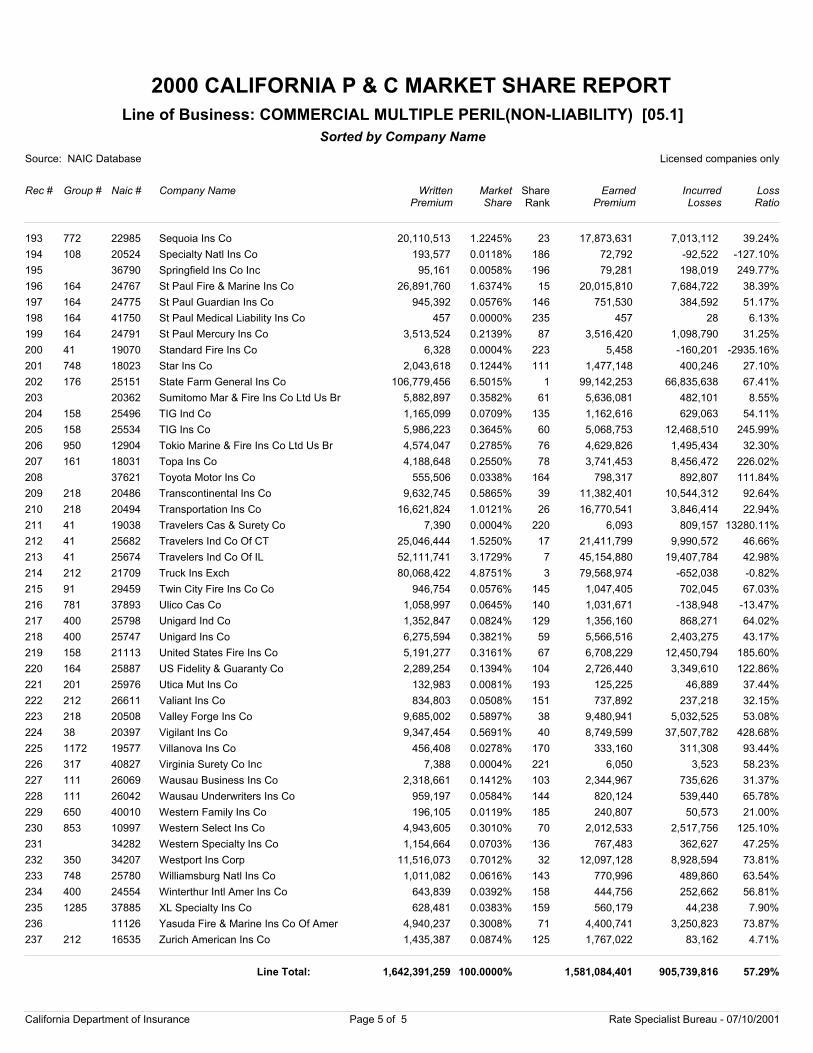
2000 CALIFORNIA P & C MARKET SHARE REPORT
Source: NAIC Database Licensed companies only
Rec # Group # Naic # Company Name
Sorted by Company Name
WrittenPremium
Market Share
EarnedPremium
IncurredLosses
LossRatio
Line of Business: COMMERCIAL MULTIPLE PERIL(NON-LIABILITY) [05.1]
ShareRank
193 772 22985 Sequoia Ins Co 20,110,513 1.2245% 17,873,631 7,013,112 39.24%23
194 108 20524 Specialty Natl Ins Co 193,577 0.0118% 72,792 -92,522 -127.10%186
195 36790 Springfield Ins Co Inc 95,161 0.0058% 79,281 198,019 249.77%196
196 164 24767 St Paul Fire & Marine Ins Co 26,891,760 1.6374% 20,015,810 7,684,722 38.39%15
197 164 24775 St Paul Guardian Ins Co 945,392 0.0576% 751,530 384,592 51.17%146
198 164 41750 St Paul Medical Liability Ins Co 457 0.0000% 457 28 6.13%235
199 164 24791 St Paul Mercury Ins Co 3,513,524 0.2139% 3,516,420 1,098,790 31.25%87
200 41 19070 Standard Fire Ins Co 6,328 0.0004% 5,458 -160,201 -2935.16%223
201 748 18023 Star Ins Co 2,043,618 0.1244% 1,477,148 400,246 27.10%111
202 176 25151 State Farm General Ins Co 106,779,456 6.5015% 99,142,253 66,835,638 67.41%1
203 20362 Sumitomo Mar & Fire Ins Co Ltd Us Br 5,882,897 0.3582% 5,636,081 482,101 8.55%61
204 158 25496 TIG Ind Co 1,165,099 0.0709% 1,162,616 629,063 54.11%135
205 158 25534 TIG Ins Co 5,986,223 0.3645% 5,068,753 12,468,510 245.99%60
206 950 12904 Tokio Marine & Fire Ins Co Ltd Us Br 4,574,047 0.2785% 4,629,826 1,495,434 32.30%76
207 161 18031 Topa Ins Co 4,188,648 0.2550% 3,741,453 8,456,472 226.02%78
208 37621 Toyota Motor Ins Co 555,506 0.0338% 798,317 892,807 111.84%164
209 218 20486 Transcontinental Ins Co 9,632,745 0.5865% 11,382,401 10,544,312 92.64%39
210 218 20494 Transportation Ins Co 16,621,824 1.0121% 16,770,541 3,846,414 22.94%26
211 41 19038 Travelers Cas & Surety Co 7,390 0.0004% 6,093 809,157 13280.11%220
212 41 25682 Travelers Ind Co Of CT 25,046,444 1.5250% 21,411,799 9,990,572 46.66%17
213 41 25674 Travelers Ind Co Of IL 52,111,741 3.1729% 45,154,880 19,407,784 42.98%7
214 212 21709 Truck Ins Exch 80,068,422 4.8751% 79,568,974 -652,038 -0.82%3
215 91 29459 Twin City Fire Ins Co Co 946,754 0.0576% 1,047,405 702,045 67.03%145
216 781 37893 Ulico Cas Co 1,058,997 0.0645% 1,031,671 -138,948 -13.47%140
217 400 25798 Unigard Ind Co 1,352,847 0.0824% 1,356,160 868,271 64.02%129
218 400 25747 Unigard Ins Co 6,275,594 0.3821% 5,566,516 2,403,275 43.17%59
219 158 21113 United States Fire Ins Co 5,191,277 0.3161% 6,708,229 12,450,794 185.60%67
220 164 25887 US Fidelity & Guaranty Co 2,289,254 0.1394% 2,726,440 3,349,610 122.86%104
221 201 25976 Utica Mut Ins Co 132,983 0.0081% 125,225 46,889 37.44%193
222 212 26611 Valiant Ins Co 834,803 0.0508% 737,892 237,218 32.15%151
223 218 20508 Valley Forge Ins Co 9,685,002 0.5897% 9,480,941 5,032,525 53.08%38
224 38 20397 Vigilant Ins Co 9,347,454 0.5691% 8,749,599 37,507,782 428.68%40
225 1172 19577 Villanova Ins Co 456,408 0.0278% 333,160 311,308 93.44%170
226 317 40827 Virginia Surety Co Inc 7,388 0.0004% 6,050 3,523 58.23%221
227 111 26069 Wausau Business Ins Co 2,318,661 0.1412% 2,344,967 735,626 31.37%103
228 111 26042 Wausau Underwriters Ins Co 959,197 0.0584% 820,124 539,440 65.78%144
229 650 40010 Western Family Ins Co 196,105 0.0119% 240,807 50,573 21.00%185
230 853 10997 Western Select Ins Co 4,943,605 0.3010% 2,012,533 2,517,756 125.10%70
231 34282 Western Specialty Ins Co 1,154,664 0.0703% 767,483 362,627 47.25%136
232 350 34207 Westport Ins Corp 11,516,073 0.7012% 12,097,128 8,928,594 73.81%32
233 748 25780 Williamsburg Natl Ins Co 1,011,082 0.0616% 770,996 489,860 63.54%143
234 400 24554 Winterthur Intl Amer Ins Co 643,839 0.0392% 444,756 252,662 56.81%158
235 1285 37885 XL Specialty Ins Co 628,481 0.0383% 560,179 44,238 7.90%159
236 11126 Yasuda Fire & Marine Ins Co Of Amer 4,940,237 0.3008% 4,400,741 3,250,823 73.87%71
237 212 16535 Zurich American Ins Co 1,435,387 0.0874% 1,767,022 83,162 4.71%125
1,642,391,259 100.0000% 1,581,084,401 905,739,816 57.29%Line Total:
California Department of Insurance Page 5 of 5 Rate Specialist Bureau - 07/10/2001
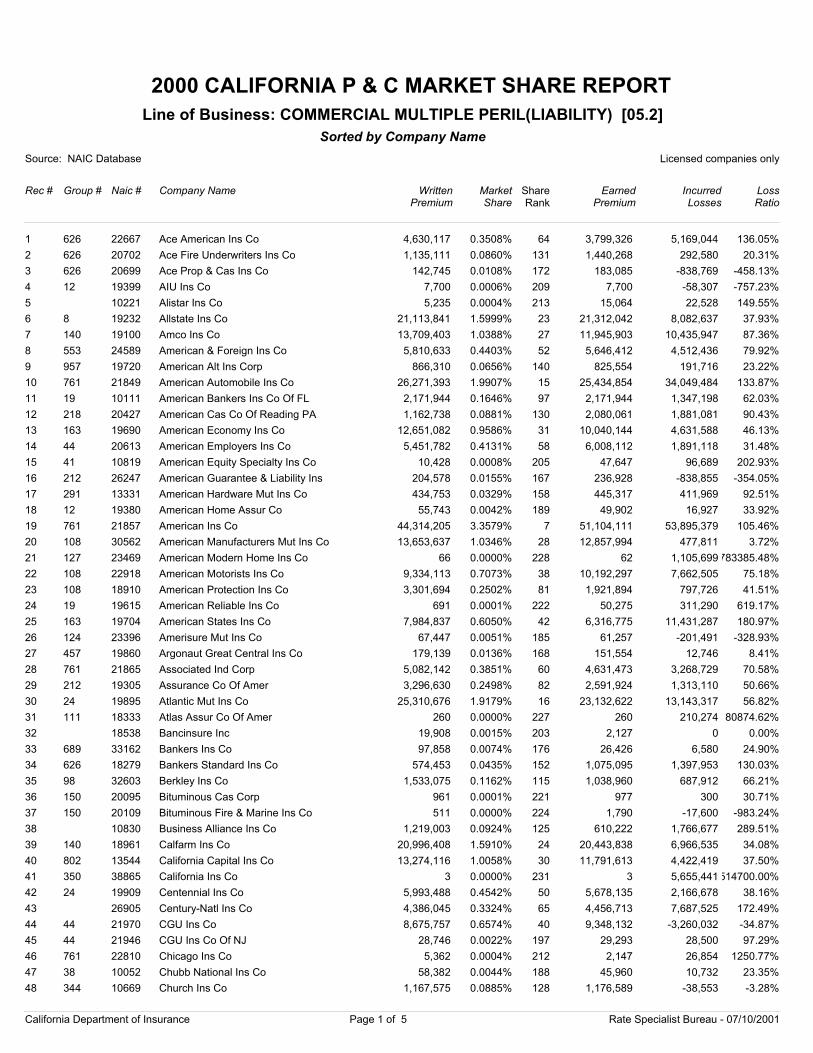
2000 CALIFORNIA P & C MARKET SHARE REPORT
Source: NAIC Database Licensed companies only
Rec # Group # Naic # Company Name
Sorted by Company Name
WrittenPremium
Market Share
EarnedPremium
IncurredLosses
LossRatio
Line of Business: COMMERCIAL MULTIPLE PERIL(LIABILITY) [05.2]
ShareRank
1 626 22667 Ace American Ins Co 4,630,117 0.3508% 3,799,326 5,169,044 136.05%64
2 626 20702 Ace Fire Underwriters Ins Co 1,135,111 0.0860% 1,440,268 292,580 20.31%131
3 626 20699 Ace Prop & Cas Ins Co 142,745 0.0108% 183,085 -838,769 -458.13%172
4 12 19399 AIU Ins Co 7,700 0.0006% 7,700 -58,307 -757.23%209
5 10221 Alistar Ins Co 5,235 0.0004% 15,064 22,528 149.55%213
6 8 19232 Allstate Ins Co 21,113,841 1.5999% 21,312,042 8,082,637 37.93%23
7 140 19100 Amco Ins Co 13,709,403 1.0388% 11,945,903 10,435,947 87.36%27
8 553 24589 American & Foreign Ins Co 5,810,633 0.4403% 5,646,412 4,512,436 79.92%52
9 957 19720 American Alt Ins Corp 866,310 0.0656% 825,554 191,716 23.22%140
10 761 21849 American Automobile Ins Co 26,271,393 1.9907% 25,434,854 34,049,484 133.87%15
11 19 10111 American Bankers Ins Co Of FL 2,171,944 0.1646% 2,171,944 1,347,198 62.03%97
12 218 20427 American Cas Co Of Reading PA 1,162,738 0.0881% 2,080,061 1,881,081 90.43%130
13 163 19690 American Economy Ins Co 12,651,082 0.9586% 10,040,144 4,631,588 46.13%31
14 44 20613 American Employers Ins Co 5,451,782 0.4131% 6,008,112 1,891,118 31.48%58
15 41 10819 American Equity Specialty Ins Co 10,428 0.0008% 47,647 96,689 202.93%205
16 212 26247 American Guarantee & Liability Ins 204,578 0.0155% 236,928 -838,855 -354.05%167
17 291 13331 American Hardware Mut Ins Co 434,753 0.0329% 445,317 411,969 92.51%158
18 12 19380 American Home Assur Co 55,743 0.0042% 49,902 16,927 33.92%189
19 761 21857 American Ins Co 44,314,205 3.3579% 51,104,111 53,895,379 105.46%7
20 108 30562 American Manufacturers Mut Ins Co 13,653,637 1.0346% 12,857,994 477,811 3.72%28
21 127 23469 American Modern Home Ins Co 66 0.0000% 62 1,105,699783385.48%228
22 108 22918 American Motorists Ins Co 9,334,113 0.7073% 10,192,297 7,662,505 75.18%38
23 108 18910 American Protection Ins Co 3,301,694 0.2502% 1,921,894 797,726 41.51%81
24 19 19615 American Reliable Ins Co 691 0.0001% 50,275 311,290 619.17%222
25 163 19704 American States Ins Co 7,984,837 0.6050% 6,316,775 11,431,287 180.97%42
26 124 23396 Amerisure Mut Ins Co 67,447 0.0051% 61,257 -201,491 -328.93%185
27 457 19860 Argonaut Great Central Ins Co 179,139 0.0136% 151,554 12,746 8.41%168
28 761 21865 Associated Ind Corp 5,082,142 0.3851% 4,631,473 3,268,729 70.58%60
29 212 19305 Assurance Co Of Amer 3,296,630 0.2498% 2,591,924 1,313,110 50.66%82
30 24 19895 Atlantic Mut Ins Co 25,310,676 1.9179% 23,132,622 13,143,317 56.82%16
31 111 18333 Atlas Assur Co Of Amer 260 0.0000% 260 210,274 80874.62%227
32 18538 Bancinsure Inc 19,908 0.0015% 2,127 0 0.00%203
33 689 33162 Bankers Ins Co 97,858 0.0074% 26,426 6,580 24.90%176
34 626 18279 Bankers Standard Ins Co 574,453 0.0435% 1,075,095 1,397,953 130.03%152
35 98 32603 Berkley Ins Co 1,533,075 0.1162% 1,038,960 687,912 66.21%115
36 150 20095 Bituminous Cas Corp 961 0.0001% 977 300 30.71%221
37 150 20109 Bituminous Fire & Marine Ins Co 511 0.0000% 1,790 -17,600 -983.24%224
38 10830 Business Alliance Ins Co 1,219,003 0.0924% 610,222 1,766,677 289.51%125
39 140 18961 Calfarm Ins Co 20,996,408 1.5910% 20,443,838 6,966,535 34.08%24
40 802 13544 California Capital Ins Co 13,274,116 1.0058% 11,791,613 4,422,419 37.50%30
41 350 38865 California Ins Co 3 0.0000% 3 5,655,441514700.00%231
42 24 19909 Centennial Ins Co 5,993,488 0.4542% 5,678,135 2,166,678 38.16%50
43 26905 Century-Natl Ins Co 4,386,045 0.3324% 4,456,713 7,687,525 172.49%65
44 44 21970 CGU Ins Co 8,675,757 0.6574% 9,348,132 -3,260,032 -34.87%40
45 44 21946 CGU Ins Co Of NJ 28,746 0.0022% 29,293 28,500 97.29%197
46 761 22810 Chicago Ins Co 5,362 0.0004% 2,147 26,854 1250.77%212
47 38 10052 Chubb National Ins Co 58,382 0.0044% 45,960 10,732 23.35%188
48 344 10669 Church Ins Co 1,167,575 0.0885% 1,176,589 -38,553 -3.28%128
California Department of Insurance Page 1 of 5 Rate Specialist Bureau - 07/10/2001
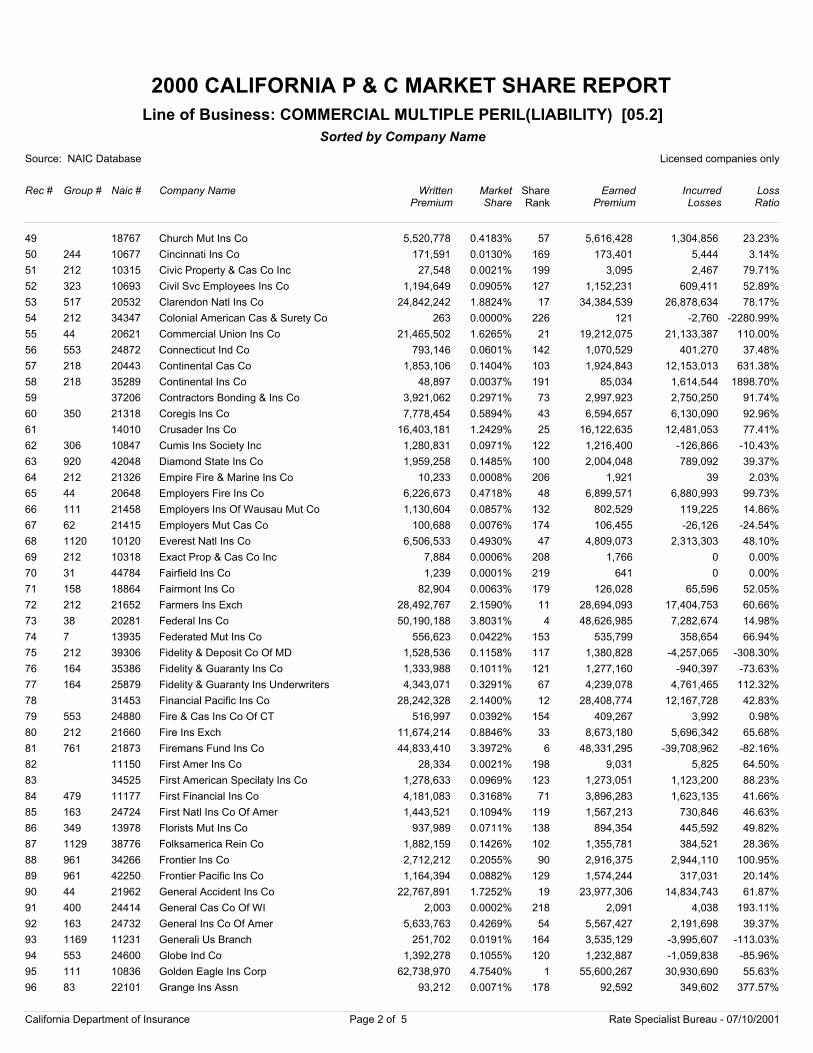
2000 CALIFORNIA P & C MARKET SHARE REPORT
Source: NAIC Database Licensed companies only
Rec # Group # Naic # Company Name
Sorted by Company Name
WrittenPremium
Market Share
EarnedPremium
IncurredLosses
LossRatio
Line of Business: COMMERCIAL MULTIPLE PERIL(LIABILITY) [05.2]
ShareRank
49 18767 Church Mut Ins Co 5,520,778 0.4183% 5,616,428 1,304,856 23.23%57
50 244 10677 Cincinnati Ins Co 171,591 0.0130% 173,401 5,444 3.14%169
51 212 10315 Civic Property & Cas Co Inc 27,548 0.0021% 3,095 2,467 79.71%199
52 323 10693 Civil Svc Employees Ins Co 1,194,649 0.0905% 1,152,231 609,411 52.89%127
53 517 20532 Clarendon Natl Ins Co 24,842,242 1.8824% 34,384,539 26,878,634 78.17%17
54 212 34347 Colonial American Cas & Surety Co 263 0.0000% 121 -2,760 -2280.99%226
55 44 20621 Commercial Union Ins Co 21,465,502 1.6265% 19,212,075 21,133,387 110.00%21
56 553 24872 Connecticut Ind Co 793,146 0.0601% 1,070,529 401,270 37.48%142
57 218 20443 Continental Cas Co 1,853,106 0.1404% 1,924,843 12,153,013 631.38%103
58 218 35289 Continental Ins Co 48,897 0.0037% 85,034 1,614,544 1898.70%191
59 37206 Contractors Bonding & Ins Co 3,921,062 0.2971% 2,997,923 2,750,250 91.74%73
60 350 21318 Coregis Ins Co 7,778,454 0.5894% 6,594,657 6,130,090 92.96%43
61 14010 Crusader Ins Co 16,403,181 1.2429% 16,122,635 12,481,053 77.41%25
62 306 10847 Cumis Ins Society Inc 1,280,831 0.0971% 1,216,400 -126,866 -10.43%122
63 920 42048 Diamond State Ins Co 1,959,258 0.1485% 2,004,048 789,092 39.37%100
64 212 21326 Empire Fire & Marine Ins Co 10,233 0.0008% 1,921 39 2.03%206
65 44 20648 Employers Fire Ins Co 6,226,673 0.4718% 6,899,571 6,880,993 99.73%48
66 111 21458 Employers Ins Of Wausau Mut Co 1,130,604 0.0857% 802,529 119,225 14.86%132
67 62 21415 Employers Mut Cas Co 100,688 0.0076% 106,455 -26,126 -24.54%174
68 1120 10120 Everest Natl Ins Co 6,506,533 0.4930% 4,809,073 2,313,303 48.10%47
69 212 10318 Exact Prop & Cas Co Inc 7,884 0.0006% 1,766 0 0.00%208
70 31 44784 Fairfield Ins Co 1,239 0.0001% 641 0 0.00%219
71 158 18864 Fairmont Ins Co 82,904 0.0063% 126,028 65,596 52.05%179
72 212 21652 Farmers Ins Exch 28,492,767 2.1590% 28,694,093 17,404,753 60.66%11
73 38 20281 Federal Ins Co 50,190,188 3.8031% 48,626,985 7,282,674 14.98%4
74 7 13935 Federated Mut Ins Co 556,623 0.0422% 535,799 358,654 66.94%153
75 212 39306 Fidelity & Deposit Co Of MD 1,528,536 0.1158% 1,380,828 -4,257,065 -308.30%117
76 164 35386 Fidelity & Guaranty Ins Co 1,333,988 0.1011% 1,277,160 -940,397 -73.63%121
77 164 25879 Fidelity & Guaranty Ins Underwriters 4,343,071 0.3291% 4,239,078 4,761,465 112.32%67
78 31453 Financial Pacific Ins Co 28,242,328 2.1400% 28,408,774 12,167,728 42.83%12
79 553 24880 Fire & Cas Ins Co Of CT 516,997 0.0392% 409,267 3,992 0.98%154
80 212 21660 Fire Ins Exch 11,674,214 0.8846% 8,673,180 5,696,342 65.68%33
81 761 21873 Firemans Fund Ins Co 44,833,410 3.3972% 48,331,295 -39,708,962 -82.16%6
82 11150 First Amer Ins Co 28,334 0.0021% 9,031 5,825 64.50%198
83 34525 First American Specilaty Ins Co 1,278,633 0.0969% 1,273,051 1,123,200 88.23%123
84 479 11177 First Financial Ins Co 4,181,083 0.3168% 3,896,283 1,623,135 41.66%71
85 163 24724 First Natl Ins Co Of Amer 1,443,521 0.1094% 1,567,213 730,846 46.63%119
86 349 13978 Florists Mut Ins Co 937,989 0.0711% 894,354 445,592 49.82%138
87 1129 38776 Folksamerica Rein Co 1,882,159 0.1426% 1,355,781 384,521 28.36%102
88 961 34266 Frontier Ins Co 2,712,212 0.2055% 2,916,375 2,944,110 100.95%90
89 961 42250 Frontier Pacific Ins Co 1,164,394 0.0882% 1,574,244 317,031 20.14%129
90 44 21962 General Accident Ins Co 22,767,891 1.7252% 23,977,306 14,834,743 61.87%19
91 400 24414 General Cas Co Of WI 2,003 0.0002% 2,091 4,038 193.11%218
92 163 24732 General Ins Co Of Amer 5,633,763 0.4269% 5,567,427 2,191,698 39.37%54
93 1169 11231 Generali Us Branch 251,702 0.0191% 3,535,129 -3,995,607 -113.03%164
94 553 24600 Globe Ind Co 1,392,278 0.1055% 1,232,887 -1,059,838 -85.96%120
95 111 10836 Golden Eagle Ins Corp 62,738,970 4.7540% 55,600,267 30,930,690 55.63%1
96 83 22101 Grange Ins Assn 93,212 0.0071% 92,592 349,602 377.57%178
California Department of Insurance Page 2 of 5 Rate Specialist Bureau - 07/10/2001
2000 CALIFORNIA P & C MARKET SHARE REPORT
Source: NAIC Database Licensed companies only
Rec # Group # Naic # Company Name
Sorted by Company Name
WrittenPremium
Market Share
EarnedPremium
IncurredLosses
LossRatio
Line of Business: COMMERCIAL MULTIPLE PERIL(LIABILITY) [05.2]
ShareRank
97 12 23809 Granite State Ins Co 67,755 0.0051% 64,314 605,676 941.75%184
98 201 25984 Graphic Arts Mut Ins Co 72,756 0.0055% 64,820 9,330 14.39%182
99 84 26832 Great American Alliance Ins Co 3,129,009 0.2371% 3,338,197 993,215 29.75%84
100 84 26344 Great American Assur Co 2,457,417 0.1862% 2,255,999 -587,035 -26.02%95
101 84 16691 Great American Ins Co 5,765,192 0.4369% 6,056,485 926,114 15.29%53
102 84 22136 Great American Ins Co of NY 7,203,824 0.5459% 7,189,696 841,386 11.70%45
103 38 20303 Great Northern Ins Co 7,743,653 0.5868% 7,409,129 4,832,543 65.22%44
104 1285 22322 Greenwich Ins Co 3,519,357 0.2667% 3,097,928 -2,703,692 -87.27%77
105 553 40541 Grocers Ins Co 2,573,284 0.1950% 2,308,805 280,898 12.17%91
106 303 15032 Guideone Mut Ins Co 8,971,859 0.6798% 9,035,237 2,256,440 24.97%39
107 303 14559 Guideone Specialty Mut Ins Co 8,116,847 0.6151% 7,754,390 4,338,122 55.94%41
108 41 22217 Gulf Ins Co 2,460,524 0.1864% 2,231,545 510,601 22.88%94
109 88 22292 Hanover Ins Co 691,072 0.0524% 724,682 7,337,352 1012.49%146
110 517 21806 Harbor Specialty Ins Co 2,931 0.0002% 24,690 36,268 146.89%216
111 91 22357 Hartford Accid & Ind Co 741,056 0.0562% 733,516 191,433 26.10%144
112 91 29424 Hartford Cas Ins Co 27,118,640 2.0549% 24,763,556 5,290,621 21.36%14
113 91 19682 Hartford Fire In Co 21,175,822 1.6046% 18,782,111 11,016,742 58.66%22
114 91 37478 Hartford Ins Co Of The Midwest 29,939,202 2.2686% 28,189,223 7,990,972 28.35%9
115 91 30104 Hartford Underwriters Ins Co 1,844,863 0.1398% 1,724,467 320,947 18.61%104
116 1116 22489 Highlands Ins Co 96,412 0.0073% 51,740 762,820 1474.33%177
117 158 25054 Hudson Ins Co 981,111 0.0743% 432,839 162,644 37.58%136
118 626 43575 Indemnity Ins Co Of North Amer 21,324 0.0016% -226,559 1,641,381 -724.48%202
119 626 22713 Insurance Co Of North Amer 70,493 0.0053% 18,284 -428,456 -2343.34%183
120 922 27847 Insurance Co Of The West 1,766,932 0.1339% 1,777,327 4,090,928 230.17%107
121 517 37257 Insurance Corp Of Hannover 1,198,309 0.0908% 666,835 240,262 36.03%126
122 761 11630 Jefferson Ins Co 30,337 0.0023% 18,250 19,965 109.40%195
123 14354 Jewelers Mut Ins Co 270,417 0.0205% 302,736 510,523 168.64%163
124 1172 24422 Legion Ins Co 3,291,438 0.2494% 3,532,818 6,991,166 197.89%83
125 37800 Lg Ins Co Ltd Us Branch 1,018,441 0.0772% 1,160,424 1,041,195 89.73%135
126 111 42404 Liberty Ins Corp 674,529 0.0511% 739,544 -772,075 -104.40%148
127 111 23035 Liberty Mut Fire Ins Co 1,577,654 0.1195% 2,075,519 3,069,840 147.91%114
128 111 23043 Liberty Mut Ins Co 63,372 0.0048% 39,380 -122,540 -311.17%186
129 111 33600 LM Ins Corp 17 0.0000% 17 -600 -3529.41%230
130 946 14435 Lumber Mut Ins Co 1,082,480 0.0820% 1,725,070 909,345 52.71%133
131 108 22977 Lumbermens Mut Cas Co 4,283,219 0.3246% 4,025,778 784,320 19.48%68
132 785 38970 Markel Ins Co 3,541,636 0.2684% 2,290,639 1,236,904 54.00%76
133 212 19356 Maryland Cas Co 2,499,885 0.1894% 2,331,941 -178,945 -7.67%93
134 88 22306 Massachusetts Bay Ins Co 1,926,293 0.1460% 2,478,605 12,404,805 500.48%101
135 660 11908 Mercury Cas Co 2,843,074 0.2154% 2,852,260 271,929 9.53%88
136 79 38601 MIC Prop & Cas Ins Corp 215,558 0.0163% 869,371 3,254,375 374.34%166
137 212 21687 Mid-Century Ins Co 24,313,906 1.8424% 24,164,860 23,199,513 96.01%18
138 169 23434 Middlesex Ins Co 619 0.0000% 502 88 17.53%223
139 130 23531 Millers Ins Co 2,028,969 0.1537% 1,838,040 1,729,016 94.07%99
140 802 23540 Monterey Ins Co 683,928 0.0518% 613,937 159,396 25.96%147
141 227 23647 Mutual Service Cas Ins Co 490,660 0.0372% 440,906 223,114 50.60%155
142 140 11991 National Cas Co 1,105 0.0001% 791 -5,448 -688.75%220
143 218 20478 National Fire Ins Co Of Hartford 3,989,330 0.3023% 2,314,483 2,527,356 109.20%72
144 761 21881 National Surety Corp 29,807,633 2.2587% 35,068,034 38,124,739 108.72%10
California Department of Insurance Page 3 of 5 Rate Specialist Bureau - 07/10/2001
2000 CALIFORNIA P & C MARKET SHARE REPORT
Source: NAIC Database Licensed companies only
Rec # Group # Naic # Company Name
Sorted by Company Name
WrittenPremium
Market Share
EarnedPremium
IncurredLosses
LossRatio
Line of Business: COMMERCIAL MULTIPLE PERIL(LIABILITY) [05.2]
ShareRank
145 140 28223 Nationwide Agribusiness Ins Co 74,181 0.0056% 25,533 0 0.00%181
146 140 23787 Nationwide Mut Ins Co 5,093,049 0.3859% 4,779,230 8,180,770 171.17%59
147 510 42307 Navigators Ins Co 2,350,467 0.1781% 2,380,558 1,483,478 62.32%96
148 212 10317 Neighborhood Spirit Prop & Cas Co 24,228 0.0018% 4,257 0 0.00%201
149 12 23841 New Hampshire Ins Co 5,616,813 0.4256% 3,868,305 1,244,572 32.17%55
150 2558 27073 Nipponkoa Ins Co Ltd 6,205 0.0005% 4,933 -5,583 -113.18%211
151 158 21105 North River Ins Co 878,862 0.0666% 1,243,087 795,199 63.97%139
152 164 19224 Northbrook Prop & Cas Ins Co 432 0.0000% 4,118 -863,962 -20980.14%225
153 44 38369 Northern Assur Co Of Amer 2,527,885 0.1915% 1,939,177 134,594 6.94%92
154 212 19372 Northern Ins Co Of NY 10,910,213 0.8267% 9,862,982 5,227,893 53.01%35
155 41 24015 Northland Ins Co 45,437 0.0034% 38,772 -1,627 -4.20%193
156 1116 23906 Northwestern Natl Cas Co 60,540 0.0046% 6,991 -50,667 -724.75%187
157 38 20338 Northwestern Pacific Ind Co 2,152,666 0.1631% 2,766,384 1,248,208 45.12%98
158 645 14907 Oregon Mut Ins Co 964,416 0.0731% 950,752 1,163,835 122.41%137
159 1116 41408 Pacific Automobile Ins Co 140,814 0.0107% 46,369 -16,593 -35.78%173
160 38 20346 Pacific Ind Co 1,786,777 0.1354% 1,534,488 200,507 13.07%106
161 1116 23930 Pacific Natl Ins Co 6,611,669 0.5010% 7,211,827 4,025,196 55.81%46
162 40550 Pacific Pioneer Ins Co 1,659,475 0.1257% 2,054,152 3,085,107 150.19%110
163 37850 Pacific Specialty Ins Co 3,405,882 0.2581% 1,904,892 969,483 50.89%80
164 1218 32859 Penn-Amer Ins Co 4,191,349 0.3176% 3,966,017 1,434,534 36.17%69
165 1218 10673 Penn-Star Ins Co 463,066 0.0351% 339,833 129,815 38.20%157
166 677 18058 Philadelphia Ind Ins Co 10,252,000 0.7768% 9,814,903 5,092,286 51.88%36
167 44 40134 Potomac Ins Co Of IL 51,227 0.0039% 201,975 146,288 72.43%190
168 156 24295 Providence Washington Ins Co 7,477 0.0006% 6,284 39,264 624.82%210
169 304 36447 Prudential General Ins Co 24,728 0.0019% 24,728 57,306 231.75%200
170 853 15059 Public Service Mut Ins Co 4,379,164 0.3318% 6,516,163 5,414,661 83.10%66
171 158 24384 Ranger Ins Co 1,588,938 0.1204% 2,266,569 3,947,371 174.16%113
172 517 37303 Redland Ins Co 1,819,286 0.1379% 1,776,352 -387,080 -21.79%105
173 400 24449 Regent Ins Co 98,417 0.0075% 104,510 12,989 12.43%175
174 574 31089 Republic Western Ins Co 12,191,287 0.9238% 10,924,880 7,099,393 64.98%32
175 783 13056 RLI Ins Co 163,271 0.0124% 115,691 150,213 129.84%170
176 83 22128 Rocky Mountain Fire & Cas Co 35,490 0.0027% 32,752 12,878 39.32%194
177 553 24678 Royal Ind Co 380,680 0.0288% 326,450 105,034 32.17%160
178 553 26980 Royal Ins Co Of Amer 6,123,083 0.4640% 6,308,317 4,219,388 66.89%49
179 10823 Sable Ins Co 4,689,748 0.3554% 5,852,233 4,362,182 74.54%63
180 163 24740 Safeco Ins Co Of Amer 13,338,128 1.0107% 17,336,830 7,089,799 40.89%29
181 553 24694 Safeguard Ins Co 3,469,524 0.2629% 3,386,519 1,697,417 50.12%78
182 74 15105 Safety Natl Cas Corp 219,907 0.0167% 228,213 234,892 102.93%165
183 140 15580 Scottsdale Ind Co 8,286 0.0006% 8,998 -4,906 -54.52%207
184 553 24902 Security Ins Co Of Hartford 481,289 0.0365% 540,848 -4,149,019 -767.13%156
185 41 22233 Select Ins Co 706,510 0.0535% 756,717 70,917 9.37%145
186 169 24988 Sentry Ins A Mut Co 1,643,839 0.1246% 1,567,759 -119,004 -7.59%111
187 772 22985 Sequoia Ins Co 9,668,768 0.7326% 8,636,232 6,771,068 78.40%37
188 108 20524 Specialty Natl Ins Co 794,309 0.0602% 214,652 -3,536 -1.65%141
189 36790 Springfield Ins Co Inc 82,797 0.0063% 71,395 42,837 60.00%180
190 164 24767 St Paul Fire & Marine Ins Co 4,184,049 0.3170% 3,859,150 3,767,387 97.62%70
191 164 24775 St Paul Guardian Ins Co 5,079 0.0004% 8,044 -10,451 -129.92%214
192 164 41750 St Paul Medical Liability Ins Co 43 0.0000% 43 -22 -51.16%229
California Department of Insurance Page 4 of 5 Rate Specialist Bureau - 07/10/2001
2000 CALIFORNIA P & C MARKET SHARE REPORT
Source: NAIC Database Licensed companies only
Rec # Group # Naic # Company Name
Sorted by Company Name
WrittenPremium
Market Share
EarnedPremium
IncurredLosses
LossRatio
Line of Business: COMMERCIAL MULTIPLE PERIL(LIABILITY) [05.2]
ShareRank
193 164 24791 St Paul Mercury Ins Co 45,885 0.0035% 61,816 55,499 89.78%192
194 41 19070 Standard Fire Ins Co 3,356 0.0003% 5,108 191,053 3740.27%215
195 748 18023 Star Ins Co 2,883,284 0.2185% 2,380,218 3,341,173 140.37%87
196 176 25151 State Farm General Ins Co 50,480,420 3.8251% 69,878,170 31,533,923 45.13%3
197 20362 Sumitomo Mar & Fire Ins Co Ltd Us Br 3,040,946 0.2304% 2,932,619 1,632,375 55.66%85
198 158 25496 TIG Ind Co 357,626 0.0271% 277,210 491,705 177.38%161
199 158 25534 TIG Ins Co 3,718,222 0.2817% 3,145,841 -8,880,219 -282.28%75
200 950 12904 Tokio Marine & Fire Ins Co Ltd Us Br 4,719,423 0.3576% 4,701,656 4,529,763 96.34%62
201 161 18031 Topa Ins Co 2,745,032 0.2080% 2,633,457 2,699,624 102.51%89
202 37621 Toyota Motor Ins Co 416,627 0.0316% 846,501 1,664,299 196.61%159
203 218 20486 Transcontinental Ins Co 21,801,428 1.6520% 25,600,787 153,305,098 598.83%20
204 218 20494 Transportation Ins Co 10,965,854 0.8309% 11,328,777 7,768,290 68.57%34
205 41 19038 Travelers Cas & Surety Co 2,342 0.0002% 4,044 1,234,208 30519.49%217
206 41 25682 Travelers Ind Co Of CT 28,069,943 2.1270% 25,848,321 10,225,656 39.56%13
207 41 25674 Travelers Ind Co Of IL 61,596,984 4.6675% 58,228,265 33,924,835 58.26%2
208 212 21709 Truck Ins Exch 49,168,352 3.7257% 50,595,895 18,878,267 37.31%5
209 91 29459 Twin City Fire Ins Co Co 1,702,114 0.1290% 1,701,107 526,523 30.95%108
210 781 37893 Ulico Cas Co 1,025,622 0.0777% 859,161 2,691,243 313.24%134
211 400 25798 Unigard Ind Co 1,678,789 0.1272% 1,627,596 594,233 36.51%109
212 400 25747 Unigard Ins Co 5,551,486 0.4207% 4,983,538 2,361,705 47.39%56
213 158 21113 United States Fire Ins Co 3,004,776 0.2277% 4,528,287 132,694 2.93%86
214 164 25887 US Fidelity & Guaranty Co 1,529,278 0.1159% 1,697,364 -1,131,257 -66.65%116
215 201 25976 Utica Mut Ins Co 29,550 0.0022% 30,501 -175,981 -576.97%196
216 212 26611 Valiant Ins Co 1,272,423 0.0964% 956,883 446,743 46.69%124
217 218 20508 Valley Forge Ins Co 15,038,644 1.1395% 14,334,945 11,432,839 79.76%26
218 38 20397 Vigilant Ins Co 5,854,186 0.4436% 5,344,293 381,260 7.13%51
219 1172 19577 Villanova Ins Co 611,169 0.0463% 556,823 2,840,657 510.15%150
220 317 40827 Virginia Surety Co Inc 18,740 0.0014% 16,657 0 0.00%204
221 111 26069 Wausau Business Ins Co 3,429,910 0.2599% 3,054,817 875,602 28.66%79
222 111 26042 Wausau Underwriters Ins Co 1,523,240 0.1154% 1,081,278 822,797 76.09%118
223 650 40010 Western Family Ins Co 272,751 0.0207% 311,137 114,045 36.65%162
224 853 10997 Western Select Ins Co 4,984,897 0.3777% 2,034,448 1,021,795 50.22%61
225 34282 Western Specialty Ins Co 1,601,094 0.1213% 1,070,539 131,559 12.29%112
226 350 34207 Westport Ins Corp 30,976,727 2.3472% 32,501,712 22,797,283 70.14%8
227 748 25780 Williamsburg Natl Ins Co 787,055 0.0596% 654,693 717,754 109.63%143
228 400 24554 Winterthur Intl Amer Ins Co 159,223 0.0121% 159,053 45,732 28.75%171
229 1285 37885 XL Specialty Ins Co 631,285 0.0478% 500,283 223,066 44.59%149
230 11126 Yasuda Fire & Marine Ins Co Of Amer 3,728,717 0.2825% 3,686,804 3,088,533 83.77%74
231 212 16535 Zurich American Ins Co 600,708 0.0455% 845,758 1,711,289 202.34%151
1,319,704,258 100.0000% 1,323,986,601 875,934,466 66.16%Line Total:
California Department of Insurance Page 5 of 5 Rate Specialist Bureau - 07/10/2001
2000 CALIFORNIA P & C MARKET SHARE REPORT
Source: NAIC Database Licensed companies only
Rec # Group # Naic # Company Name
Sorted by Company Name
WrittenPremium
Market Share
EarnedPremium
IncurredLosses
LossRatio
Line of Business: MORTGAGE GUARANTY [06]
ShareRank
1 766 30872 Amerin Guaranty Corp 23,540,787 4.9534% 24,505,631 1,373,376 5.60%7
2 306 40266 CMG Mortgage Ins Co 4,944,335 1.0404% 4,971,137 -66,677 -1.34%9
3 350 29823 Ge Residential Mortgage Ins Corp NC 97,390 0.0205% 138,351 -155,917 -112.70%13
4 350 16675 Gen Elec Mortgage Ins Corp Of NC 2,866 0.0006% 3,652 -5,998 -164.24%14
5 350 38458 General Electric Mortgage Ins Corp 74,021,593 15.5756% 75,797,378 -2,296,736 -3.03%4
6 105 10682 MGIC Credit Assur Corp 3,625,230 0.7628% 3,625,230 3,446,429 95.07%10
7 105 29858 Mortgage Guaranty Ins Corp 101,771,817 21.4148% 101,413,381 45,847,202 45.21%1
8 1135 27251 PMI Mortgage Ins Co 83,041,375 17.4735% 85,630,551 6,169,430 7.20%2
9 766 33790 Radian Guaranty Inc 77,193,282 16.2430% 69,199,906 10,917,722 15.78%3
10 150 28452 Republic Mortgage Ins Co 31,536,253 6.6358% 32,237,126 -2,007,956 -6.23%6
11 421 24350 Triad Guaranty Ins Corp 12,130,209 2.5524% 12,018,079 1,450,769 12.07%8
12 12 15873 United Gty Residential Ins Co 62,939,760 13.2437% 64,387,128 -2,036,816 -3.16%5
13 12 40525 United Guaranty Credit Ins Co 240,940 0.0507% 239,619 5,000 2.09%11
14 350 18759 Verex Assure Inc 155,721 0.0328% 196,688 -487,529 -247.87%12
475,241,558 100.0000% 474,363,857 62,152,299 13.10%Line Total:
California Department of Insurance Page 1 of 1 Rate Specialist Bureau - 07/10/2001

2000 CALIFORNIA P & C MARKET SHARE REPORT
Source: NAIC Database Licensed companies only
Rec # Group # Naic # Company Name
Sorted by Company Name
WrittenPremium
Market Share
EarnedPremium
IncurredLosses
LossRatio
Line of Business: OCEAN MARINE [08]
ShareRank
1 626 22667 Ace American Ins Co 839,269 0.4938% 858,288 150,379 17.52%36
2 65 10014 Affiliated Fm Ins Co 711,312 0.4185% 614,506 246,553 40.12%39
3 38733 Alaska Nat Ins Co 127,825 0.0752% 127,614 30,459 23.87%51
4 761 35300 Allianz Ins Co 2,065,646 1.2154% 2,366,354 904,100 38.21%19
5 44 20613 American Employers Ins Co 441 0.0003% 441 0 0.00%76
6 12 19380 American Home Assur Co 18,501,634 10.8860% 17,925,174 15,885,391 88.62%2
7 108 30562 American Manufacturers Mut Ins Co 116,763 0.0687% 109,148 15,167 13.90%52
8 127 23469 American Modern Home Ins Co 13,251 0.0078% 29,837 -333 -1.12%68
9 108 22918 American Motorists Ins Co 608,712 0.3582% 639,992 764,278 119.42%41
10 28 19976 Amica Mut Ins Co 59,432 0.0350% 57,240 -4,376 -7.65%60
11 24 19895 Atlantic Mut Ins Co 1,137,996 0.6696% 927,247 87,235 9.41%28
12 24 19909 Centennial Ins Co 2,447,993 1.4404% 2,454,142 1,191,529 48.55%18
13 517 20532 Clarendon Natl Ins Co 980,415 0.5769% 304,733 189,357 62.14%33
14 218 20435 CNA Cas Of CA 442,882 0.2606% 443,816 160,941 36.26%43
15 44 20621 Commercial Union Ins Co 10,938,778 6.4362% 10,750,000 8,006,202 74.48%3
16 553 24872 Connecticut Ind Co 2,023 0.0012% 5,637 -9,761 -173.16%73
17 218 20443 Continental Cas Co 3,309 0.0019% 2,212 12,903 583.32%71
18 218 35289 Continental Ins Co 8,439,992 4.9659% 8,162,265 6,431,053 78.79%7
19 57 21261 Electric Ins Co 3,823 0.0022% 3,846 3,205 83.33%69
20 44 20648 Employers Fire Ins Co 85,265 0.0502% 86,710 28,364 32.71%54
21 65 21482 Factory Mut Ins Co 965,691 0.5682% 957,524 530,302 55.38%35
22 38 20281 Federal Ins Co 6,361,370 3.7429% 5,892,648 2,684,526 45.56%9
23 761 21873 Firemans Fund Ins Co 19,337,530 11.3779% 18,297,145 13,177,215 72.02%1
24 218 20850 Firemens Ins Co Of Newark NJ 5,142,274 3.0256% 3,593,287 1,607,481 44.74%11
25 1129 38776 Folksamerica Rein Co 1,613 0.0009% 1,613 111,750 6928.08%74
26 84 22136 Great American Ins Co of NY 8,054,008 4.7388% 8,135,204 2,209,374 27.16%8
27 1285 22322 Greenwich Ins Co 354,861 0.2088% 293,700 102,121 34.77%46
28 88 22292 Hanover Ins Co 81,758 0.0481% 101,292 1,015,183 1002.23%55
29 91 29424 Hartford Cas Ins Co 69,165 0.0407% 64,859 14,582 22.48%59
30 91 19682 Hartford Fire In Co 3,745,150 2.2036% 3,602,647 241,213 6.70%15
31 91 30104 Hartford Underwriters Ins Co 43,542 0.0256% 39,879 5,104 12.80%63
32 1116 22489 Highlands Ins Co 16,412 0.0097% 20,958 8,252 39.37%67
33 10048 Hyundai Marine & Fire Ins Co Ltd 1,102,072 0.6484% 946,317 206,293 21.80%29
34 626 43575 Indemnity Ins Co Of North Amer 4,707,204 2.7696% 4,535,689 1,330,485 29.33%13
35 626 22713 Insurance Co Of North Amer 75,270 0.0443% 39,822 137,747 345.91%57
36 922 27847 Insurance Co Of The West 673,400 0.3962% 425,224 330,094 77.63%40
37 517 37257 Insurance Corp Of Hannover 388,630 0.2287% 270,949 800,567 295.47%44
38 761 11630 Jefferson Ins Co 71,563 0.0421% 94,759 25,585 27.00%58
39 37800 Lg Ins Co Ltd Us Branch 86,006 0.0506% 86,185 109,714 127.30%53
40 111 19917 Liberty Ins Underwriters Inc 733,206 0.4314% 960,188 105,414 10.98%38
41 111 23035 Liberty Mut Fire Ins Co 78,672 0.0463% 72,041 15,592 21.64%56
42 108 22977 Lumbermens Mut Cas Co 387,357 0.2279% 394,997 19,913 5.04%45
43 785 28932 Markel American Ins Co 3,993,640 2.3498% 3,433,824 1,862,457 54.24%14
44 785 38970 Markel Ins Co 20 0.0000% 12 -1,885 -15708.33%77
45 212 21687 Mid-Century Ins Co 53,099 0.0312% 41,062 -25,317 -61.66%61
46 22551 Mitsui Marine & Fire Ins Co 1,044,087 0.6143% 1,050,884 -62,070 -5.91%31
47 140 11991 National Cas Co 45,869 0.0270% 92,671 73,030 78.81%62
48 31 20052 National Liab & Fire Ins Co 454 0.0003% 454 0 0.00%75
California Department of Insurance Page 1 of 2 Rate Specialist Bureau - 07/10/2001
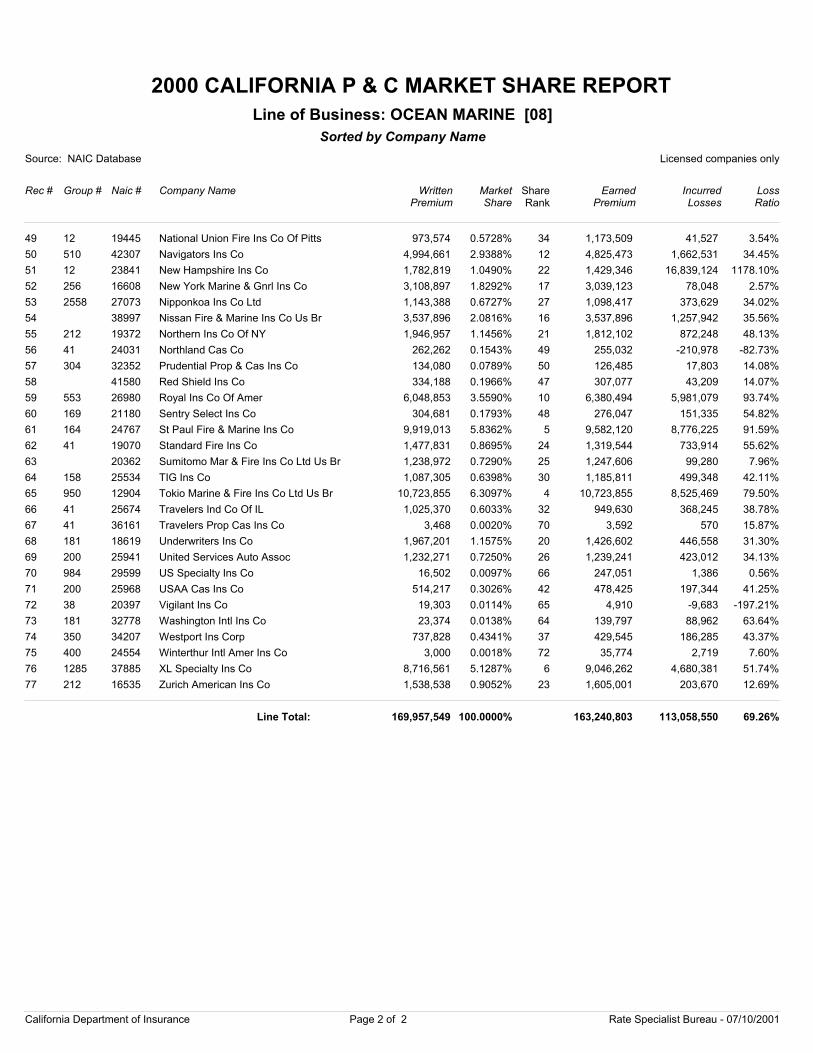
2000 CALIFORNIA P & C MARKET SHARE REPORT
Source: NAIC Database Licensed companies only
Rec # Group # Naic # Company Name
Sorted by Company Name
WrittenPremium
Market Share
EarnedPremium
IncurredLosses
LossRatio
Line of Business: OCEAN MARINE [08]
ShareRank
49 12 19445 National Union Fire Ins Co Of Pitts 973,574 0.5728% 1,173,509 41,527 3.54%34
50 510 42307 Navigators Ins Co 4,994,661 2.9388% 4,825,473 1,662,531 34.45%12
51 12 23841 New Hampshire Ins Co 1,782,819 1.0490% 1,429,346 16,839,124 1178.10%22
52 256 16608 New York Marine & Gnrl Ins Co 3,108,897 1.8292% 3,039,123 78,048 2.57%17
53 2558 27073 Nipponkoa Ins Co Ltd 1,143,388 0.6727% 1,098,417 373,629 34.02%27
54 38997 Nissan Fire & Marine Ins Co Us Br 3,537,896 2.0816% 3,537,896 1,257,942 35.56%16
55 212 19372 Northern Ins Co Of NY 1,946,957 1.1456% 1,812,102 872,248 48.13%21
56 41 24031 Northland Cas Co 262,262 0.1543% 255,032 -210,978 -82.73%49
57 304 32352 Prudential Prop & Cas Ins Co 134,080 0.0789% 126,485 17,803 14.08%50
58 41580 Red Shield Ins Co 334,188 0.1966% 307,077 43,209 14.07%47
59 553 26980 Royal Ins Co Of Amer 6,048,853 3.5590% 6,380,494 5,981,079 93.74%10
60 169 21180 Sentry Select Ins Co 304,681 0.1793% 276,047 151,335 54.82%48
61 164 24767 St Paul Fire & Marine Ins Co 9,919,013 5.8362% 9,582,120 8,776,225 91.59%5
62 41 19070 Standard Fire Ins Co 1,477,831 0.8695% 1,319,544 733,914 55.62%24
63 20362 Sumitomo Mar & Fire Ins Co Ltd Us Br 1,238,972 0.7290% 1,247,606 99,280 7.96%25
64 158 25534 TIG Ins Co 1,087,305 0.6398% 1,185,811 499,348 42.11%30
65 950 12904 Tokio Marine & Fire Ins Co Ltd Us Br 10,723,855 6.3097% 10,723,855 8,525,469 79.50%4
66 41 25674 Travelers Ind Co Of IL 1,025,370 0.6033% 949,630 368,245 38.78%32
67 41 36161 Travelers Prop Cas Ins Co 3,468 0.0020% 3,592 570 15.87%70
68 181 18619 Underwriters Ins Co 1,967,201 1.1575% 1,426,602 446,558 31.30%20
69 200 25941 United Services Auto Assoc 1,232,271 0.7250% 1,239,241 423,012 34.13%26
70 984 29599 US Specialty Ins Co 16,502 0.0097% 247,051 1,386 0.56%66
71 200 25968 USAA Cas Ins Co 514,217 0.3026% 478,425 197,344 41.25%42
72 38 20397 Vigilant Ins Co 19,303 0.0114% 4,910 -9,683 -197.21%65
73 181 32778 Washington Intl Ins Co 23,374 0.0138% 139,797 88,962 63.64%64
74 350 34207 Westport Ins Corp 737,828 0.4341% 429,545 186,285 43.37%37
75 400 24554 Winterthur Intl Amer Ins Co 3,000 0.0018% 35,774 2,719 7.60%72
76 1285 37885 XL Specialty Ins Co 8,716,561 5.1287% 9,046,262 4,680,381 51.74%6
77 212 16535 Zurich American Ins Co 1,538,538 0.9052% 1,605,001 203,670 12.69%23
169,957,549 100.0000% 163,240,803 113,058,550 69.26%Line Total:
California Department of Insurance Page 2 of 2 Rate Specialist Bureau - 07/10/2001
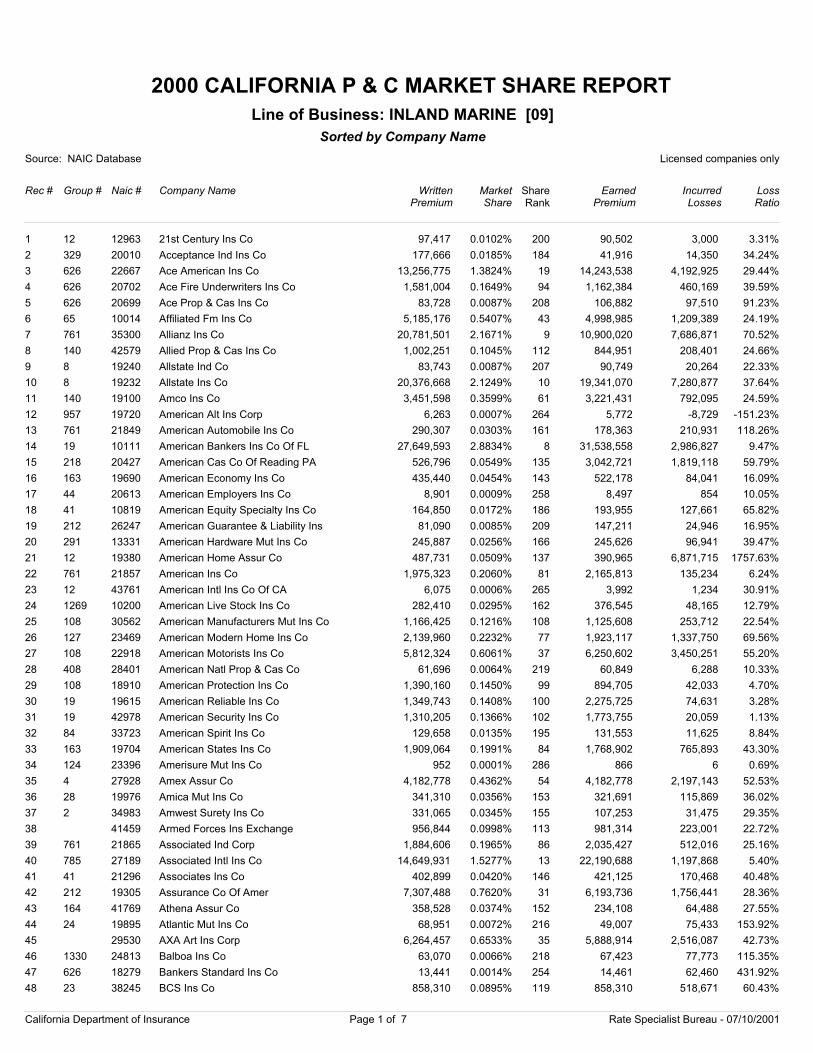
2000 CALIFORNIA P & C MARKET SHARE REPORT
Source: NAIC Database Licensed companies only
Rec # Group # Naic # Company Name
Sorted by Company Name
WrittenPremium
Market Share
EarnedPremium
IncurredLosses
LossRatio
Line of Business: INLAND MARINE [09]
ShareRank
1 12 12963 21st Century Ins Co 97,417 0.0102% 90,502 3,000 3.31%200
2 329 20010 Acceptance Ind Ins Co 177,666 0.0185% 41,916 14,350 34.24%184
3 626 22667 Ace American Ins Co 13,256,775 1.3824% 14,243,538 4,192,925 29.44%19
4 626 20702 Ace Fire Underwriters Ins Co 1,581,004 0.1649% 1,162,384 460,169 39.59%94
5 626 20699 Ace Prop & Cas Ins Co 83,728 0.0087% 106,882 97,510 91.23%208
6 65 10014 Affiliated Fm Ins Co 5,185,176 0.5407% 4,998,985 1,209,389 24.19%43
7 761 35300 Allianz Ins Co 20,781,501 2.1671% 10,900,020 7,686,871 70.52%9
8 140 42579 Allied Prop & Cas Ins Co 1,002,251 0.1045% 844,951 208,401 24.66%112
9 8 19240 Allstate Ind Co 83,743 0.0087% 90,749 20,264 22.33%207
10 8 19232 Allstate Ins Co 20,376,668 2.1249% 19,341,070 7,280,877 37.64%10
11 140 19100 Amco Ins Co 3,451,598 0.3599% 3,221,431 792,095 24.59%61
12 957 19720 American Alt Ins Corp 6,263 0.0007% 5,772 -8,729 -151.23%264
13 761 21849 American Automobile Ins Co 290,307 0.0303% 178,363 210,931 118.26%161
14 19 10111 American Bankers Ins Co Of FL 27,649,593 2.8834% 31,538,558 2,986,827 9.47%8
15 218 20427 American Cas Co Of Reading PA 526,796 0.0549% 3,042,721 1,819,118 59.79%135
16 163 19690 American Economy Ins Co 435,440 0.0454% 522,178 84,041 16.09%143
17 44 20613 American Employers Ins Co 8,901 0.0009% 8,497 854 10.05%258
18 41 10819 American Equity Specialty Ins Co 164,850 0.0172% 193,955 127,661 65.82%186
19 212 26247 American Guarantee & Liability Ins 81,090 0.0085% 147,211 24,946 16.95%209
20 291 13331 American Hardware Mut Ins Co 245,887 0.0256% 245,626 96,941 39.47%166
21 12 19380 American Home Assur Co 487,731 0.0509% 390,965 6,871,715 1757.63%137
22 761 21857 American Ins Co 1,975,323 0.2060% 2,165,813 135,234 6.24%81
23 12 43761 American Intl Ins Co Of CA 6,075 0.0006% 3,992 1,234 30.91%265
24 1269 10200 American Live Stock Ins Co 282,410 0.0295% 376,545 48,165 12.79%162
25 108 30562 American Manufacturers Mut Ins Co 1,166,425 0.1216% 1,125,608 253,712 22.54%108
26 127 23469 American Modern Home Ins Co 2,139,960 0.2232% 1,923,117 1,337,750 69.56%77
27 108 22918 American Motorists Ins Co 5,812,324 0.6061% 6,250,602 3,450,251 55.20%37
28 408 28401 American Natl Prop & Cas Co 61,696 0.0064% 60,849 6,288 10.33%219
29 108 18910 American Protection Ins Co 1,390,160 0.1450% 894,705 42,033 4.70%99
30 19 19615 American Reliable Ins Co 1,349,743 0.1408% 2,275,725 74,631 3.28%100
31 19 42978 American Security Ins Co 1,310,205 0.1366% 1,773,755 20,059 1.13%102
32 84 33723 American Spirit Ins Co 129,658 0.0135% 131,553 11,625 8.84%195
33 163 19704 American States Ins Co 1,909,064 0.1991% 1,768,902 765,893 43.30%84
34 124 23396 Amerisure Mut Ins Co 952 0.0001% 866 6 0.69%286
35 4 27928 Amex Assur Co 4,182,778 0.4362% 4,182,778 2,197,143 52.53%54
36 28 19976 Amica Mut Ins Co 341,310 0.0356% 321,691 115,869 36.02%153
37 2 34983 Amwest Surety Ins Co 331,065 0.0345% 107,253 31,475 29.35%155
38 41459 Armed Forces Ins Exchange 956,844 0.0998% 981,314 223,001 22.72%113
39 761 21865 Associated Ind Corp 1,884,606 0.1965% 2,035,427 512,016 25.16%86
40 785 27189 Associated Intl Ins Co 14,649,931 1.5277% 22,190,688 1,197,868 5.40%13
41 41 21296 Associates Ins Co 402,899 0.0420% 421,125 170,468 40.48%146
42 212 19305 Assurance Co Of Amer 7,307,488 0.7620% 6,193,736 1,756,441 28.36%31
43 164 41769 Athena Assur Co 358,528 0.0374% 234,108 64,488 27.55%152
44 24 19895 Atlantic Mut Ins Co 68,951 0.0072% 49,007 75,433 153.92%216
45 29530 AXA Art Ins Corp 6,264,457 0.6533% 5,888,914 2,516,087 42.73%35
46 1330 24813 Balboa Ins Co 63,070 0.0066% 67,423 77,773 115.35%218
47 626 18279 Bankers Standard Ins Co 13,441 0.0014% 14,461 62,460 431.92%254
48 23 38245 BCS Ins Co 858,310 0.0895% 858,310 518,671 60.43%119
California Department of Insurance Page 1 of 7 Rate Specialist Bureau - 07/10/2001
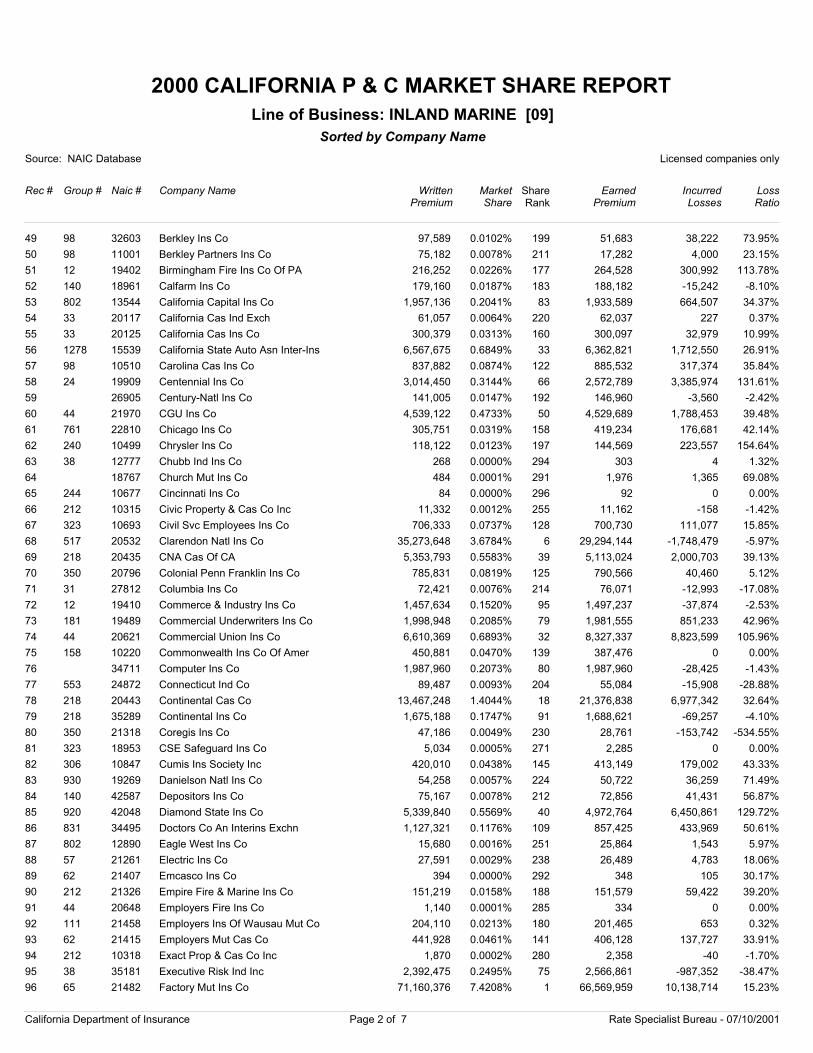
2000 CALIFORNIA P & C MARKET SHARE REPORT
Source: NAIC Database Licensed companies only
Rec # Group # Naic # Company Name
Sorted by Company Name
WrittenPremium
Market Share
EarnedPremium
IncurredLosses
LossRatio
Line of Business: INLAND MARINE [09]
ShareRank
49 98 32603 Berkley Ins Co 97,589 0.0102% 51,683 38,222 73.95%199
50 98 11001 Berkley Partners Ins Co 75,182 0.0078% 17,282 4,000 23.15%211
51 12 19402 Birmingham Fire Ins Co Of PA 216,252 0.0226% 264,528 300,992 113.78%177
52 140 18961 Calfarm Ins Co 179,160 0.0187% 188,182 -15,242 -8.10%183
53 802 13544 California Capital Ins Co 1,957,136 0.2041% 1,933,589 664,507 34.37%83
54 33 20117 California Cas Ind Exch 61,057 0.0064% 62,037 227 0.37%220
55 33 20125 California Cas Ins Co 300,379 0.0313% 300,097 32,979 10.99%160
56 1278 15539 California State Auto Asn Inter-Ins 6,567,675 0.6849% 6,362,821 1,712,550 26.91%33
57 98 10510 Carolina Cas Ins Co 837,882 0.0874% 885,532 317,374 35.84%122
58 24 19909 Centennial Ins Co 3,014,450 0.3144% 2,572,789 3,385,974 131.61%66
59 26905 Century-Natl Ins Co 141,005 0.0147% 146,960 -3,560 -2.42%192
60 44 21970 CGU Ins Co 4,539,122 0.4733% 4,529,689 1,788,453 39.48%50
61 761 22810 Chicago Ins Co 305,751 0.0319% 419,234 176,681 42.14%158
62 240 10499 Chrysler Ins Co 118,122 0.0123% 144,569 223,557 154.64%197
63 38 12777 Chubb Ind Ins Co 268 0.0000% 303 4 1.32%294
64 18767 Church Mut Ins Co 484 0.0001% 1,976 1,365 69.08%291
65 244 10677 Cincinnati Ins Co 84 0.0000% 92 0 0.00%296
66 212 10315 Civic Property & Cas Co Inc 11,332 0.0012% 11,162 -158 -1.42%255
67 323 10693 Civil Svc Employees Ins Co 706,333 0.0737% 700,730 111,077 15.85%128
68 517 20532 Clarendon Natl Ins Co 35,273,648 3.6784% 29,294,144 -1,748,479 -5.97%6
69 218 20435 CNA Cas Of CA 5,353,793 0.5583% 5,113,024 2,000,703 39.13%39
70 350 20796 Colonial Penn Franklin Ins Co 785,831 0.0819% 790,566 40,460 5.12%125
71 31 27812 Columbia Ins Co 72,421 0.0076% 76,071 -12,993 -17.08%214
72 12 19410 Commerce & Industry Ins Co 1,457,634 0.1520% 1,497,237 -37,874 -2.53%95
73 181 19489 Commercial Underwriters Ins Co 1,998,948 0.2085% 1,981,555 851,233 42.96%79
74 44 20621 Commercial Union Ins Co 6,610,369 0.6893% 8,327,337 8,823,599 105.96%32
75 158 10220 Commonwealth Ins Co Of Amer 450,881 0.0470% 387,476 0 0.00%139
76 34711 Computer Ins Co 1,987,960 0.2073% 1,987,960 -28,425 -1.43%80
77 553 24872 Connecticut Ind Co 89,487 0.0093% 55,084 -15,908 -28.88%204
78 218 20443 Continental Cas Co 13,467,248 1.4044% 21,376,838 6,977,342 32.64%18
79 218 35289 Continental Ins Co 1,675,188 0.1747% 1,688,621 -69,257 -4.10%91
80 350 21318 Coregis Ins Co 47,186 0.0049% 28,761 -153,742 -534.55%230
81 323 18953 CSE Safeguard Ins Co 5,034 0.0005% 2,285 0 0.00%271
82 306 10847 Cumis Ins Society Inc 420,010 0.0438% 413,149 179,002 43.33%145
83 930 19269 Danielson Natl Ins Co 54,258 0.0057% 50,722 36,259 71.49%224
84 140 42587 Depositors Ins Co 75,167 0.0078% 72,856 41,431 56.87%212
85 920 42048 Diamond State Ins Co 5,339,840 0.5569% 4,972,764 6,450,861 129.72%40
86 831 34495 Doctors Co An Interins Exchn 1,127,321 0.1176% 857,425 433,969 50.61%109
87 802 12890 Eagle West Ins Co 15,680 0.0016% 25,864 1,543 5.97%251
88 57 21261 Electric Ins Co 27,591 0.0029% 26,489 4,783 18.06%238
89 62 21407 Emcasco Ins Co 394 0.0000% 348 105 30.17%292
90 212 21326 Empire Fire & Marine Ins Co 151,219 0.0158% 151,579 59,422 39.20%188
91 44 20648 Employers Fire Ins Co 1,140 0.0001% 334 0 0.00%285
92 111 21458 Employers Ins Of Wausau Mut Co 204,110 0.0213% 201,465 653 0.32%180
93 62 21415 Employers Mut Cas Co 441,928 0.0461% 406,128 137,727 33.91%141
94 212 10318 Exact Prop & Cas Co Inc 1,870 0.0002% 2,358 -40 -1.70%280
95 38 35181 Executive Risk Ind Inc 2,392,475 0.2495% 2,566,861 -987,352 -38.47%75
96 65 21482 Factory Mut Ins Co 71,160,376 7.4208% 66,569,959 10,138,714 15.23%1
California Department of Insurance Page 2 of 7 Rate Specialist Bureau - 07/10/2001
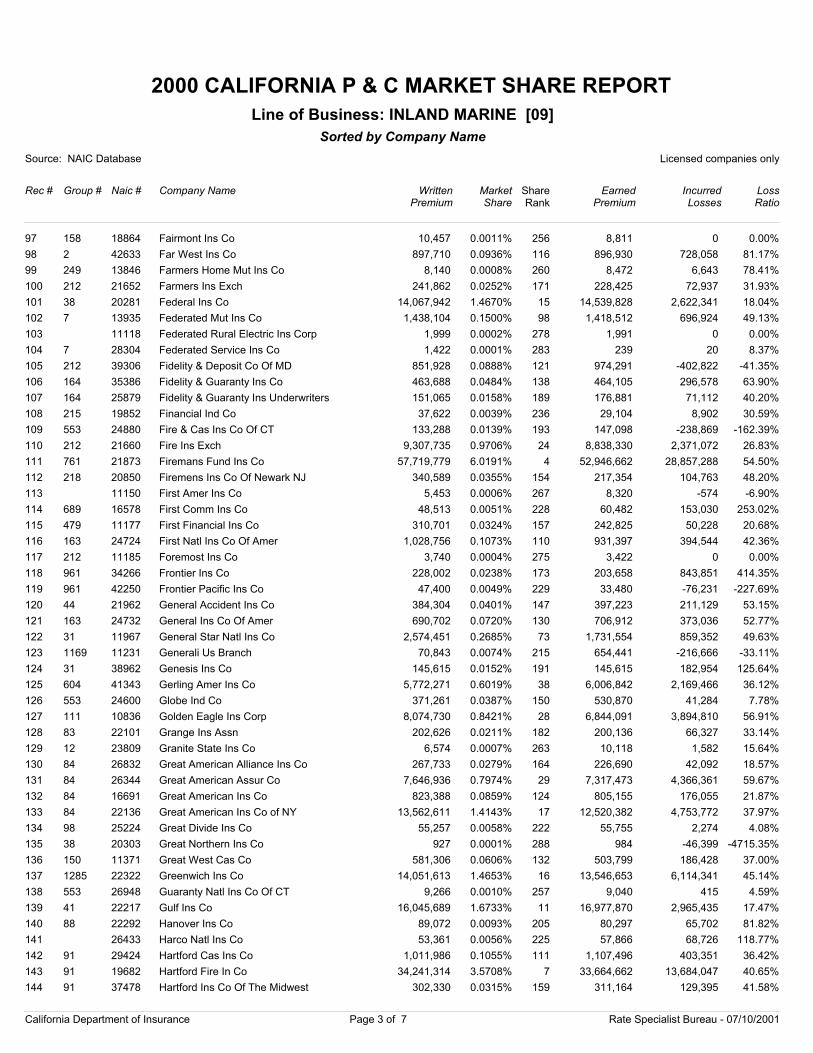
2000 CALIFORNIA P & C MARKET SHARE REPORT
Source: NAIC Database Licensed companies only
Rec # Group # Naic # Company Name
Sorted by Company Name
WrittenPremium
Market Share
EarnedPremium
IncurredLosses
LossRatio
Line of Business: INLAND MARINE [09]
ShareRank
97 158 18864 Fairmont Ins Co 10,457 0.0011% 8,811 0 0.00%256
98 2 42633 Far West Ins Co 897,710 0.0936% 896,930 728,058 81.17%116
99 249 13846 Farmers Home Mut Ins Co 8,140 0.0008% 8,472 6,643 78.41%260
100 212 21652 Farmers Ins Exch 241,862 0.0252% 228,425 72,937 31.93%171
101 38 20281 Federal Ins Co 14,067,942 1.4670% 14,539,828 2,622,341 18.04%15
102 7 13935 Federated Mut Ins Co 1,438,104 0.1500% 1,418,512 696,924 49.13%98
103 11118 Federated Rural Electric Ins Corp 1,999 0.0002% 1,991 0 0.00%278
104 7 28304 Federated Service Ins Co 1,422 0.0001% 239 20 8.37%283
105 212 39306 Fidelity & Deposit Co Of MD 851,928 0.0888% 974,291 -402,822 -41.35%121
106 164 35386 Fidelity & Guaranty Ins Co 463,688 0.0484% 464,105 296,578 63.90%138
107 164 25879 Fidelity & Guaranty Ins Underwriters 151,065 0.0158% 176,881 71,112 40.20%189
108 215 19852 Financial Ind Co 37,622 0.0039% 29,104 8,902 30.59%236
109 553 24880 Fire & Cas Ins Co Of CT 133,288 0.0139% 147,098 -238,869 -162.39%193
110 212 21660 Fire Ins Exch 9,307,735 0.9706% 8,838,330 2,371,072 26.83%24
111 761 21873 Firemans Fund Ins Co 57,719,779 6.0191% 52,946,662 28,857,288 54.50%4
112 218 20850 Firemens Ins Co Of Newark NJ 340,589 0.0355% 217,354 104,763 48.20%154
113 11150 First Amer Ins Co 5,453 0.0006% 8,320 -574 -6.90%267
114 689 16578 First Comm Ins Co 48,513 0.0051% 60,482 153,030 253.02%228
115 479 11177 First Financial Ins Co 310,701 0.0324% 242,825 50,228 20.68%157
116 163 24724 First Natl Ins Co Of Amer 1,028,756 0.1073% 931,397 394,544 42.36%110
117 212 11185 Foremost Ins Co 3,740 0.0004% 3,422 0 0.00%275
118 961 34266 Frontier Ins Co 228,002 0.0238% 203,658 843,851 414.35%173
119 961 42250 Frontier Pacific Ins Co 47,400 0.0049% 33,480 -76,231 -227.69%229
120 44 21962 General Accident Ins Co 384,304 0.0401% 397,223 211,129 53.15%147
121 163 24732 General Ins Co Of Amer 690,702 0.0720% 706,912 373,036 52.77%130
122 31 11967 General Star Natl Ins Co 2,574,451 0.2685% 1,731,554 859,352 49.63%73
123 1169 11231 Generali Us Branch 70,843 0.0074% 654,441 -216,666 -33.11%215
124 31 38962 Genesis Ins Co 145,615 0.0152% 145,615 182,954 125.64%191
125 604 41343 Gerling Amer Ins Co 5,772,271 0.6019% 6,006,842 2,169,466 36.12%38
126 553 24600 Globe Ind Co 371,261 0.0387% 530,870 41,284 7.78%150
127 111 10836 Golden Eagle Ins Corp 8,074,730 0.8421% 6,844,091 3,894,810 56.91%28
128 83 22101 Grange Ins Assn 202,626 0.0211% 200,136 66,327 33.14%182
129 12 23809 Granite State Ins Co 6,574 0.0007% 10,118 1,582 15.64%263
130 84 26832 Great American Alliance Ins Co 267,733 0.0279% 226,690 42,092 18.57%164
131 84 26344 Great American Assur Co 7,646,936 0.7974% 7,317,473 4,366,361 59.67%29
132 84 16691 Great American Ins Co 823,388 0.0859% 805,155 176,055 21.87%124
133 84 22136 Great American Ins Co of NY 13,562,611 1.4143% 12,520,382 4,753,772 37.97%17
134 98 25224 Great Divide Ins Co 55,257 0.0058% 55,755 2,274 4.08%222
135 38 20303 Great Northern Ins Co 927 0.0001% 984 -46,399 -4715.35%288
136 150 11371 Great West Cas Co 581,306 0.0606% 503,799 186,428 37.00%132
137 1285 22322 Greenwich Ins Co 14,051,613 1.4653% 13,546,653 6,114,341 45.14%16
138 553 26948 Guaranty Natl Ins Co Of CT 9,266 0.0010% 9,040 415 4.59%257
139 41 22217 Gulf Ins Co 16,045,689 1.6733% 16,977,870 2,965,435 17.47%11
140 88 22292 Hanover Ins Co 89,072 0.0093% 80,297 65,702 81.82%205
141 26433 Harco Natl Ins Co 53,361 0.0056% 57,866 68,726 118.77%225
142 91 29424 Hartford Cas Ins Co 1,011,986 0.1055% 1,107,496 403,351 36.42%111
143 91 19682 Hartford Fire In Co 34,241,314 3.5708% 33,664,662 13,684,047 40.65%7
144 91 37478 Hartford Ins Co Of The Midwest 302,330 0.0315% 311,164 129,395 41.58%159
California Department of Insurance Page 3 of 7 Rate Specialist Bureau - 07/10/2001
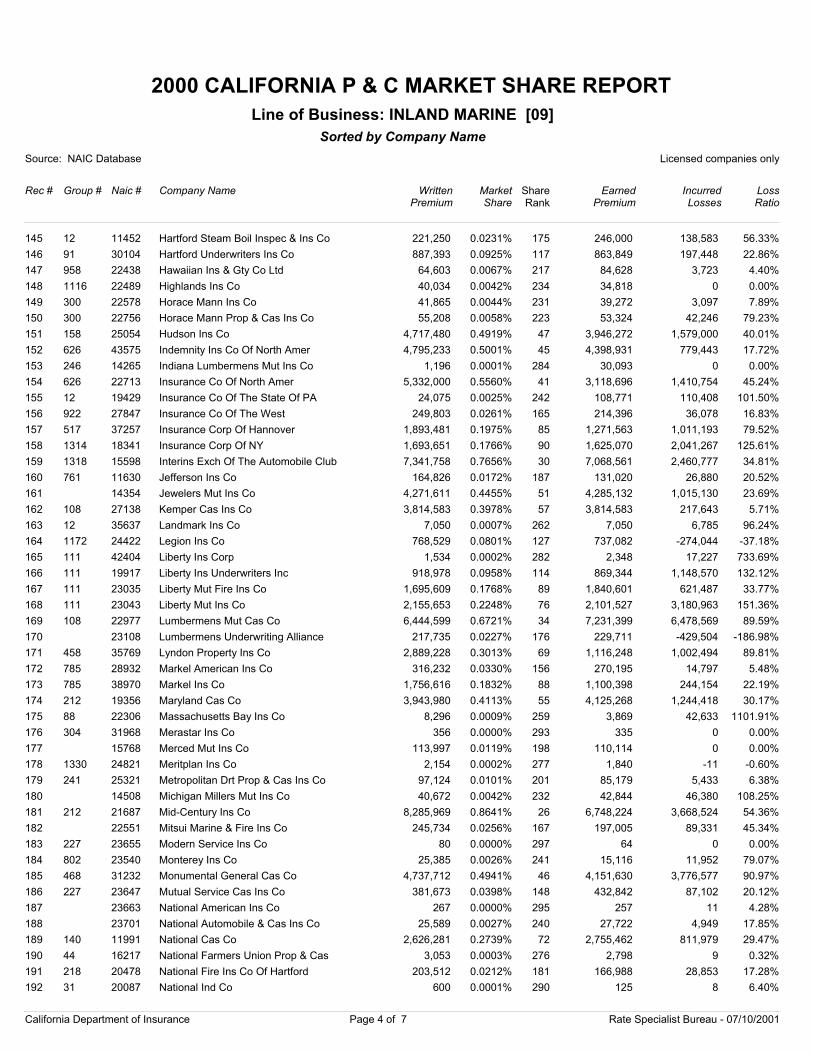
2000 CALIFORNIA P & C MARKET SHARE REPORT
Source: NAIC Database Licensed companies only
Rec # Group # Naic # Company Name
Sorted by Company Name
WrittenPremium
Market Share
EarnedPremium
IncurredLosses
LossRatio
Line of Business: INLAND MARINE [09]
ShareRank
145 12 11452 Hartford Steam Boil Inspec & Ins Co 221,250 0.0231% 246,000 138,583 56.33%175
146 91 30104 Hartford Underwriters Ins Co 887,393 0.0925% 863,849 197,448 22.86%117
147 958 22438 Hawaiian Ins & Gty Co Ltd 64,603 0.0067% 84,628 3,723 4.40%217
148 1116 22489 Highlands Ins Co 40,034 0.0042% 34,818 0 0.00%234
149 300 22578 Horace Mann Ins Co 41,865 0.0044% 39,272 3,097 7.89%231
150 300 22756 Horace Mann Prop & Cas Ins Co 55,208 0.0058% 53,324 42,246 79.23%223
151 158 25054 Hudson Ins Co 4,717,480 0.4919% 3,946,272 1,579,000 40.01%47
152 626 43575 Indemnity Ins Co Of North Amer 4,795,233 0.5001% 4,398,931 779,443 17.72%45
153 246 14265 Indiana Lumbermens Mut Ins Co 1,196 0.0001% 30,093 0 0.00%284
154 626 22713 Insurance Co Of North Amer 5,332,000 0.5560% 3,118,696 1,410,754 45.24%41
155 12 19429 Insurance Co Of The State Of PA 24,075 0.0025% 108,771 110,408 101.50%242
156 922 27847 Insurance Co Of The West 249,803 0.0261% 214,396 36,078 16.83%165
157 517 37257 Insurance Corp Of Hannover 1,893,481 0.1975% 1,271,563 1,011,193 79.52%85
158 1314 18341 Insurance Corp Of NY 1,693,651 0.1766% 1,625,070 2,041,267 125.61%90
159 1318 15598 Interins Exch Of The Automobile Club 7,341,758 0.7656% 7,068,561 2,460,777 34.81%30
160 761 11630 Jefferson Ins Co 164,826 0.0172% 131,020 26,880 20.52%187
161 14354 Jewelers Mut Ins Co 4,271,611 0.4455% 4,285,132 1,015,130 23.69%51
162 108 27138 Kemper Cas Ins Co 3,814,583 0.3978% 3,814,583 217,643 5.71%57
163 12 35637 Landmark Ins Co 7,050 0.0007% 7,050 6,785 96.24%262
164 1172 24422 Legion Ins Co 768,529 0.0801% 737,082 -274,044 -37.18%127
165 111 42404 Liberty Ins Corp 1,534 0.0002% 2,348 17,227 733.69%282
166 111 19917 Liberty Ins Underwriters Inc 918,978 0.0958% 869,344 1,148,570 132.12%114
167 111 23035 Liberty Mut Fire Ins Co 1,695,609 0.1768% 1,840,601 621,487 33.77%89
168 111 23043 Liberty Mut Ins Co 2,155,653 0.2248% 2,101,527 3,180,963 151.36%76
169 108 22977 Lumbermens Mut Cas Co 6,444,599 0.6721% 7,231,399 6,478,569 89.59%34
170 23108 Lumbermens Underwriting Alliance 217,735 0.0227% 229,711 -429,504 -186.98%176
171 458 35769 Lyndon Property Ins Co 2,889,228 0.3013% 1,116,248 1,002,494 89.81%69
172 785 28932 Markel American Ins Co 316,232 0.0330% 270,195 14,797 5.48%156
173 785 38970 Markel Ins Co 1,756,616 0.1832% 1,100,398 244,154 22.19%88
174 212 19356 Maryland Cas Co 3,943,980 0.4113% 4,125,268 1,244,418 30.17%55
175 88 22306 Massachusetts Bay Ins Co 8,296 0.0009% 3,869 42,633 1101.91%259
176 304 31968 Merastar Ins Co 356 0.0000% 335 0 0.00%293
177 15768 Merced Mut Ins Co 113,997 0.0119% 110,114 0 0.00%198
178 1330 24821 Meritplan Ins Co 2,154 0.0002% 1,840 -11 -0.60%277
179 241 25321 Metropolitan Drt Prop & Cas Ins Co 97,124 0.0101% 85,179 5,433 6.38%201
180 14508 Michigan Millers Mut Ins Co 40,672 0.0042% 42,844 46,380 108.25%232
181 212 21687 Mid-Century Ins Co 8,285,969 0.8641% 6,748,224 3,668,524 54.36%26
182 22551 Mitsui Marine & Fire Ins Co 245,734 0.0256% 197,005 89,331 45.34%167
183 227 23655 Modern Service Ins Co 80 0.0000% 64 0 0.00%297
184 802 23540 Monterey Ins Co 25,385 0.0026% 15,116 11,952 79.07%241
185 468 31232 Monumental General Cas Co 4,737,712 0.4941% 4,151,630 3,776,577 90.97%46
186 227 23647 Mutual Service Cas Ins Co 381,673 0.0398% 432,842 87,102 20.12%148
187 23663 National American Ins Co 267 0.0000% 257 11 4.28%295
188 23701 National Automobile & Cas Ins Co 25,589 0.0027% 27,722 4,949 17.85%240
189 140 11991 National Cas Co 2,626,281 0.2739% 2,755,462 811,979 29.47%72
190 44 16217 National Farmers Union Prop & Cas 3,053 0.0003% 2,798 9 0.32%276
191 218 20478 National Fire Ins Co Of Hartford 203,512 0.0212% 166,988 28,853 17.28%181
192 31 20087 National Ind Co 600 0.0001% 125 8 6.40%290
California Department of Insurance Page 4 of 7 Rate Specialist Bureau - 07/10/2001
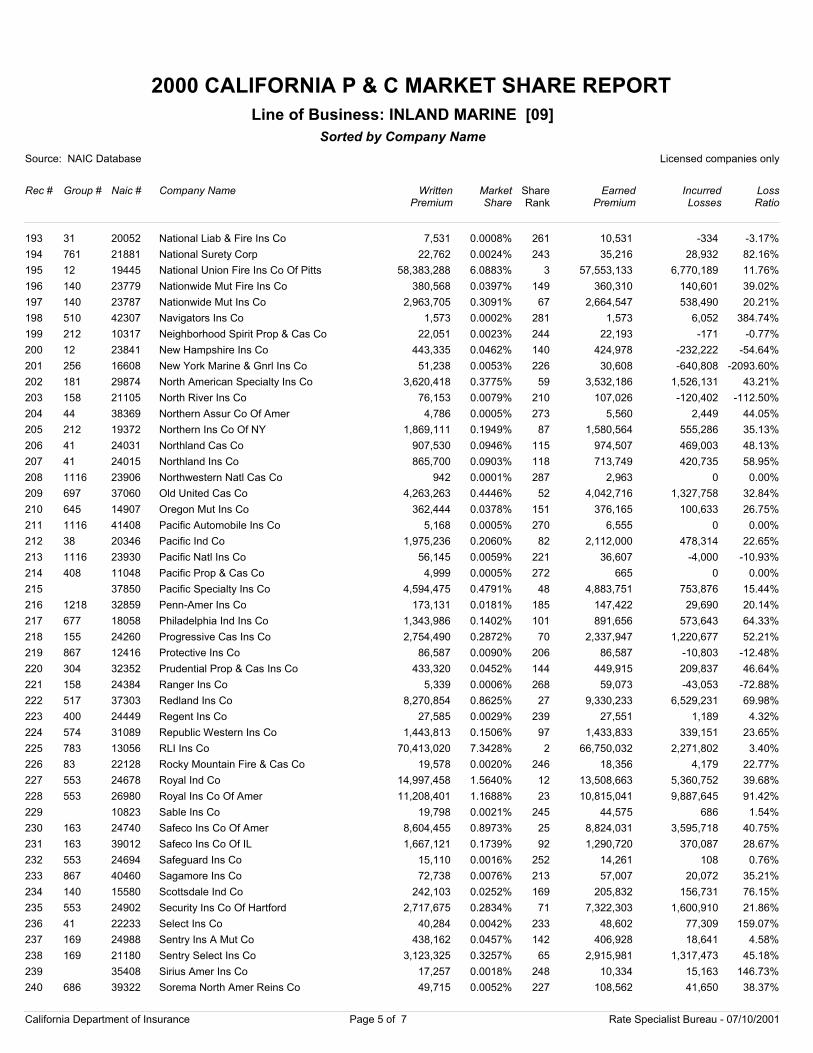
2000 CALIFORNIA P & C MARKET SHARE REPORT
Source: NAIC Database Licensed companies only
Rec # Group # Naic # Company Name
Sorted by Company Name
WrittenPremium
Market Share
EarnedPremium
IncurredLosses
LossRatio
Line of Business: INLAND MARINE [09]
ShareRank
193 31 20052 National Liab & Fire Ins Co 7,531 0.0008% 10,531 -334 -3.17%261
194 761 21881 National Surety Corp 22,762 0.0024% 35,216 28,932 82.16%243
195 12 19445 National Union Fire Ins Co Of Pitts 58,383,288 6.0883% 57,553,133 6,770,189 11.76%3
196 140 23779 Nationwide Mut Fire Ins Co 380,568 0.0397% 360,310 140,601 39.02%149
197 140 23787 Nationwide Mut Ins Co 2,963,705 0.3091% 2,664,547 538,490 20.21%67
198 510 42307 Navigators Ins Co 1,573 0.0002% 1,573 6,052 384.74%281
199 212 10317 Neighborhood Spirit Prop & Cas Co 22,051 0.0023% 22,193 -171 -0.77%244
200 12 23841 New Hampshire Ins Co 443,335 0.0462% 424,978 -232,222 -54.64%140
201 256 16608 New York Marine & Gnrl Ins Co 51,238 0.0053% 30,608 -640,808 -2093.60%226
202 181 29874 North American Specialty Ins Co 3,620,418 0.3775% 3,532,186 1,526,131 43.21%59
203 158 21105 North River Ins Co 76,153 0.0079% 107,026 -120,402 -112.50%210
204 44 38369 Northern Assur Co Of Amer 4,786 0.0005% 5,560 2,449 44.05%273
205 212 19372 Northern Ins Co Of NY 1,869,111 0.1949% 1,580,564 555,286 35.13%87
206 41 24031 Northland Cas Co 907,530 0.0946% 974,507 469,003 48.13%115
207 41 24015 Northland Ins Co 865,700 0.0903% 713,749 420,735 58.95%118
208 1116 23906 Northwestern Natl Cas Co 942 0.0001% 2,963 0 0.00%287
209 697 37060 Old United Cas Co 4,263,263 0.4446% 4,042,716 1,327,758 32.84%52
210 645 14907 Oregon Mut Ins Co 362,444 0.0378% 376,165 100,633 26.75%151
211 1116 41408 Pacific Automobile Ins Co 5,168 0.0005% 6,555 0 0.00%270
212 38 20346 Pacific Ind Co 1,975,236 0.2060% 2,112,000 478,314 22.65%82
213 1116 23930 Pacific Natl Ins Co 56,145 0.0059% 36,607 -4,000 -10.93%221
214 408 11048 Pacific Prop & Cas Co 4,999 0.0005% 665 0 0.00%272
215 37850 Pacific Specialty Ins Co 4,594,475 0.4791% 4,883,751 753,876 15.44%48
216 1218 32859 Penn-Amer Ins Co 173,131 0.0181% 147,422 29,690 20.14%185
217 677 18058 Philadelphia Ind Ins Co 1,343,986 0.1402% 891,656 573,643 64.33%101
218 155 24260 Progressive Cas Ins Co 2,754,490 0.2872% 2,337,947 1,220,677 52.21%70
219 867 12416 Protective Ins Co 86,587 0.0090% 86,587 -10,803 -12.48%206
220 304 32352 Prudential Prop & Cas Ins Co 433,320 0.0452% 449,915 209,837 46.64%144
221 158 24384 Ranger Ins Co 5,339 0.0006% 59,073 -43,053 -72.88%268
222 517 37303 Redland Ins Co 8,270,854 0.8625% 9,330,233 6,529,231 69.98%27
223 400 24449 Regent Ins Co 27,585 0.0029% 27,551 1,189 4.32%239
224 574 31089 Republic Western Ins Co 1,443,813 0.1506% 1,433,833 339,151 23.65%97
225 783 13056 RLI Ins Co 70,413,020 7.3428% 66,750,032 2,271,802 3.40%2
226 83 22128 Rocky Mountain Fire & Cas Co 19,578 0.0020% 18,356 4,179 22.77%246
227 553 24678 Royal Ind Co 14,997,458 1.5640% 13,508,663 5,360,752 39.68%12
228 553 26980 Royal Ins Co Of Amer 11,208,401 1.1688% 10,815,041 9,887,645 91.42%23
229 10823 Sable Ins Co 19,798 0.0021% 44,575 686 1.54%245
230 163 24740 Safeco Ins Co Of Amer 8,604,455 0.8973% 8,824,031 3,595,718 40.75%25
231 163 39012 Safeco Ins Co Of IL 1,667,121 0.1739% 1,290,720 370,087 28.67%92
232 553 24694 Safeguard Ins Co 15,110 0.0016% 14,261 108 0.76%252
233 867 40460 Sagamore Ins Co 72,738 0.0076% 57,007 20,072 35.21%213
234 140 15580 Scottsdale Ind Co 242,103 0.0252% 205,832 156,731 76.15%169
235 553 24902 Security Ins Co Of Hartford 2,717,675 0.2834% 7,322,303 1,600,910 21.86%71
236 41 22233 Select Ins Co 40,284 0.0042% 48,602 77,309 159.07%233
237 169 24988 Sentry Ins A Mut Co 438,162 0.0457% 406,928 18,641 4.58%142
238 169 21180 Sentry Select Ins Co 3,123,325 0.3257% 2,915,981 1,317,473 45.18%65
239 35408 Sirius Amer Ins Co 17,257 0.0018% 10,334 15,163 146.73%248
240 686 39322 Sorema North Amer Reins Co 49,715 0.0052% 108,562 41,650 38.37%227
California Department of Insurance Page 5 of 7 Rate Specialist Bureau - 07/10/2001
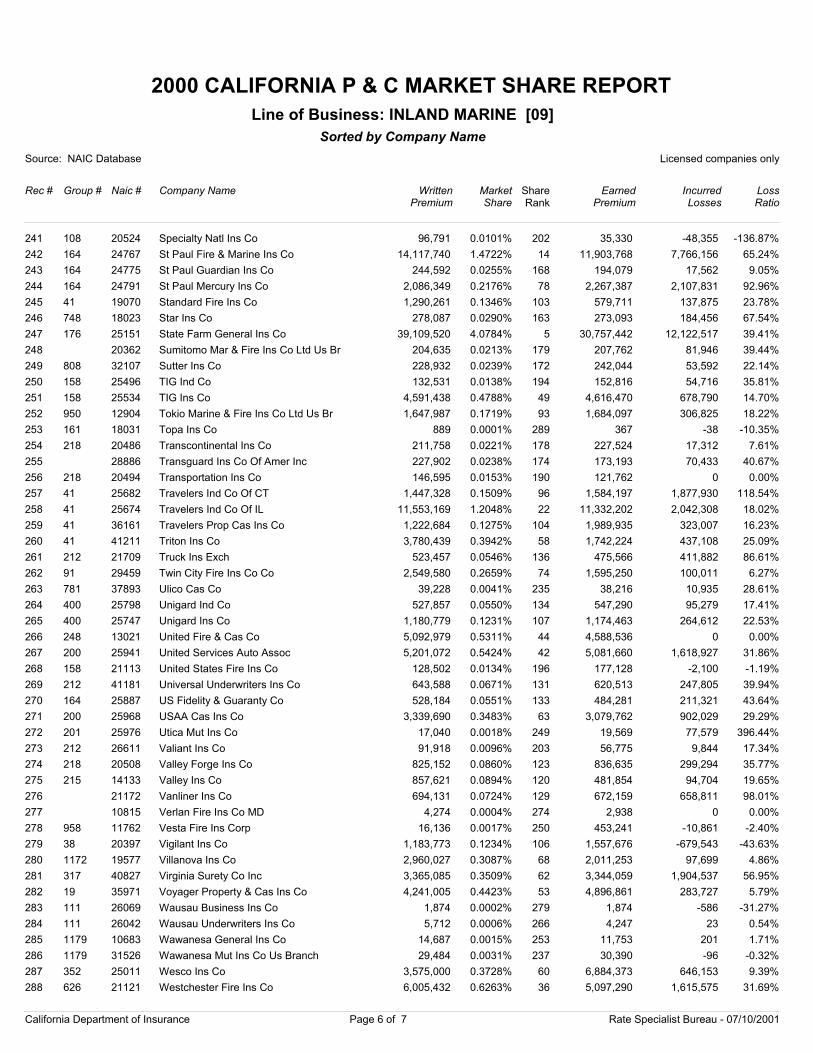
2000 CALIFORNIA P & C MARKET SHARE REPORT
Source: NAIC Database Licensed companies only
Rec # Group # Naic # Company Name
Sorted by Company Name
WrittenPremium
Market Share
EarnedPremium
IncurredLosses
LossRatio
Line of Business: INLAND MARINE [09]
ShareRank
241 108 20524 Specialty Natl Ins Co 96,791 0.0101% 35,330 -48,355 -136.87%202
242 164 24767 St Paul Fire & Marine Ins Co 14,117,740 1.4722% 11,903,768 7,766,156 65.24%14
243 164 24775 St Paul Guardian Ins Co 244,592 0.0255% 194,079 17,562 9.05%168
244 164 24791 St Paul Mercury Ins Co 2,086,349 0.2176% 2,267,387 2,107,831 92.96%78
245 41 19070 Standard Fire Ins Co 1,290,261 0.1346% 579,711 137,875 23.78%103
246 748 18023 Star Ins Co 278,087 0.0290% 273,093 184,456 67.54%163
247 176 25151 State Farm General Ins Co 39,109,520 4.0784% 30,757,442 12,122,517 39.41%5
248 20362 Sumitomo Mar & Fire Ins Co Ltd Us Br 204,635 0.0213% 207,762 81,946 39.44%179
249 808 32107 Sutter Ins Co 228,932 0.0239% 242,044 53,592 22.14%172
250 158 25496 TIG Ind Co 132,531 0.0138% 152,816 54,716 35.81%194
251 158 25534 TIG Ins Co 4,591,438 0.4788% 4,616,470 678,790 14.70%49
252 950 12904 Tokio Marine & Fire Ins Co Ltd Us Br 1,647,987 0.1719% 1,684,097 306,825 18.22%93
253 161 18031 Topa Ins Co 889 0.0001% 367 -38 -10.35%289
254 218 20486 Transcontinental Ins Co 211,758 0.0221% 227,524 17,312 7.61%178
255 28886 Transguard Ins Co Of Amer Inc 227,902 0.0238% 173,193 70,433 40.67%174
256 218 20494 Transportation Ins Co 146,595 0.0153% 121,762 0 0.00%190
257 41 25682 Travelers Ind Co Of CT 1,447,328 0.1509% 1,584,197 1,877,930 118.54%96
258 41 25674 Travelers Ind Co Of IL 11,553,169 1.2048% 11,332,202 2,042,308 18.02%22
259 41 36161 Travelers Prop Cas Ins Co 1,222,684 0.1275% 1,989,935 323,007 16.23%104
260 41 41211 Triton Ins Co 3,780,439 0.3942% 1,742,224 437,108 25.09%58
261 212 21709 Truck Ins Exch 523,457 0.0546% 475,566 411,882 86.61%136
262 91 29459 Twin City Fire Ins Co Co 2,549,580 0.2659% 1,595,250 100,011 6.27%74
263 781 37893 Ulico Cas Co 39,228 0.0041% 38,216 10,935 28.61%235
264 400 25798 Unigard Ind Co 527,857 0.0550% 547,290 95,279 17.41%134
265 400 25747 Unigard Ins Co 1,180,779 0.1231% 1,174,463 264,612 22.53%107
266 248 13021 United Fire & Cas Co 5,092,979 0.5311% 4,588,536 0 0.00%44
267 200 25941 United Services Auto Assoc 5,201,072 0.5424% 5,081,660 1,618,927 31.86%42
268 158 21113 United States Fire Ins Co 128,502 0.0134% 177,128 -2,100 -1.19%196
269 212 41181 Universal Underwriters Ins Co 643,588 0.0671% 620,513 247,805 39.94%131
270 164 25887 US Fidelity & Guaranty Co 528,184 0.0551% 484,281 211,321 43.64%133
271 200 25968 USAA Cas Ins Co 3,339,690 0.3483% 3,079,762 902,029 29.29%63
272 201 25976 Utica Mut Ins Co 17,040 0.0018% 19,569 77,579 396.44%249
273 212 26611 Valiant Ins Co 91,918 0.0096% 56,775 9,844 17.34%203
274 218 20508 Valley Forge Ins Co 825,152 0.0860% 836,635 299,294 35.77%123
275 215 14133 Valley Ins Co 857,621 0.0894% 481,854 94,704 19.65%120
276 21172 Vanliner Ins Co 694,131 0.0724% 672,159 658,811 98.01%129
277 10815 Verlan Fire Ins Co MD 4,274 0.0004% 2,938 0 0.00%274
278 958 11762 Vesta Fire Ins Corp 16,136 0.0017% 453,241 -10,861 -2.40%250
279 38 20397 Vigilant Ins Co 1,183,773 0.1234% 1,557,676 -679,543 -43.63%106
280 1172 19577 Villanova Ins Co 2,960,027 0.3087% 2,011,253 97,699 4.86%68
281 317 40827 Virginia Surety Co Inc 3,365,085 0.3509% 3,344,059 1,904,537 56.95%62
282 19 35971 Voyager Property & Cas Ins Co 4,241,005 0.4423% 4,896,861 283,727 5.79%53
283 111 26069 Wausau Business Ins Co 1,874 0.0002% 1,874 -586 -31.27%279
284 111 26042 Wausau Underwriters Ins Co 5,712 0.0006% 4,247 23 0.54%266
285 1179 10683 Wawanesa General Ins Co 14,687 0.0015% 11,753 201 1.71%253
286 1179 31526 Wawanesa Mut Ins Co Us Branch 29,484 0.0031% 30,390 -96 -0.32%237
287 352 25011 Wesco Ins Co 3,575,000 0.3728% 6,884,373 646,153 9.39%60
288 626 21121 Westchester Fire Ins Co 6,005,432 0.6263% 5,097,290 1,615,575 31.69%36
California Department of Insurance Page 6 of 7 Rate Specialist Bureau - 07/10/2001
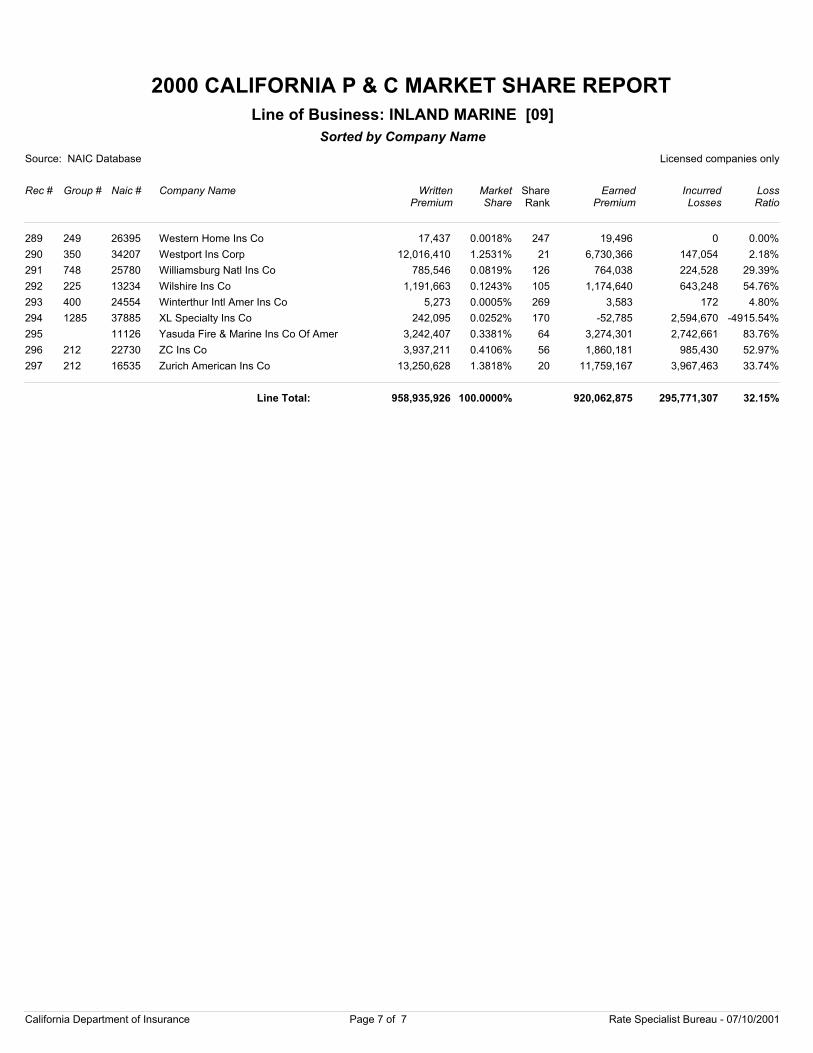
2000 CALIFORNIA P & C MARKET SHARE REPORT
Source: NAIC Database Licensed companies only
Rec # Group # Naic # Company Name
Sorted by Company Name
WrittenPremium
Market Share
EarnedPremium
IncurredLosses
LossRatio
Line of Business: INLAND MARINE [09]
ShareRank
289 249 26395 Western Home Ins Co 17,437 0.0018% 19,496 0 0.00%247
290 350 34207 Westport Ins Corp 12,016,410 1.2531% 6,730,366 147,054 2.18%21
291 748 25780 Williamsburg Natl Ins Co 785,546 0.0819% 764,038 224,528 29.39%126
292 225 13234 Wilshire Ins Co 1,191,663 0.1243% 1,174,640 643,248 54.76%105
293 400 24554 Winterthur Intl Amer Ins Co 5,273 0.0005% 3,583 172 4.80%269
294 1285 37885 XL Specialty Ins Co 242,095 0.0252% -52,785 2,594,670 -4915.54%170
295 11126 Yasuda Fire & Marine Ins Co Of Amer 3,242,407 0.3381% 3,274,301 2,742,661 83.76%64
296 212 22730 ZC Ins Co 3,937,211 0.4106% 1,860,181 985,430 52.97%56
297 212 16535 Zurich American Ins Co 13,250,628 1.3818% 11,759,167 3,967,463 33.74%20
958,935,926 100.0000% 920,062,875 295,771,307 32.15%Line Total:
California Department of Insurance Page 7 of 7 Rate Specialist Bureau - 07/10/2001
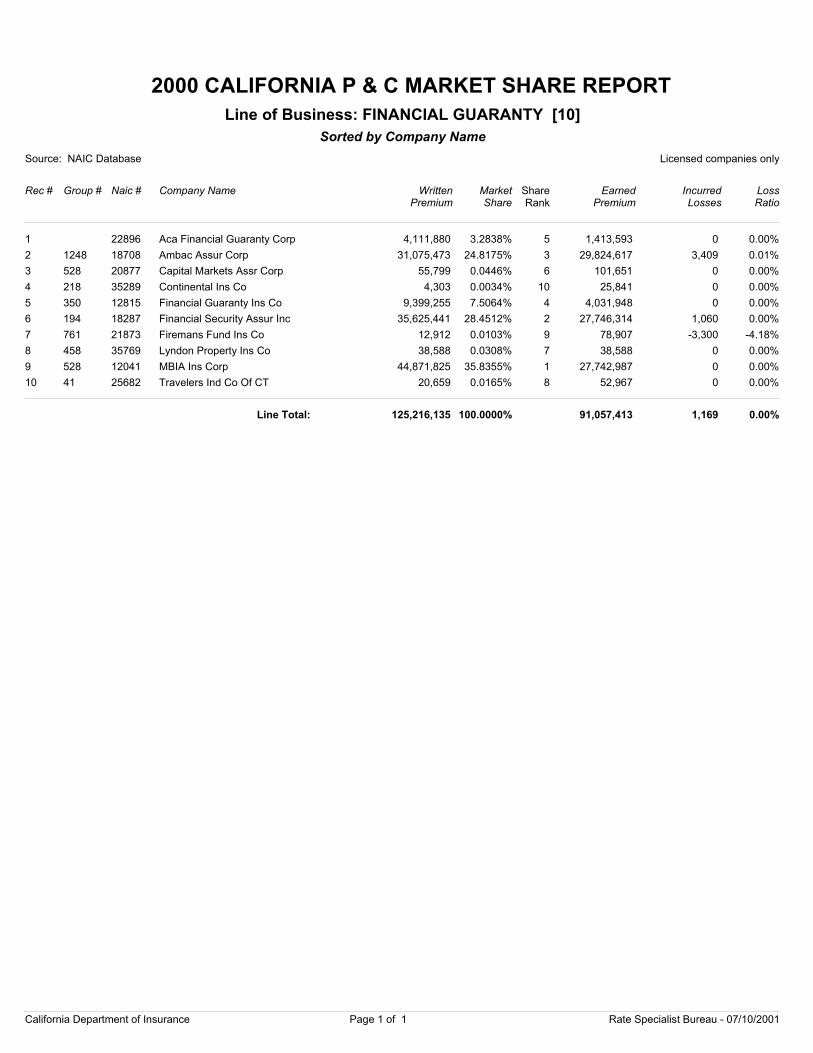
2000 CALIFORNIA P & C MARKET SHARE REPORT
Source: NAIC Database Licensed companies only
Rec # Group # Naic # Company Name
Sorted by Company Name
WrittenPremium
Market Share
EarnedPremium
IncurredLosses
LossRatio
Line of Business: FINANCIAL GUARANTY [10]
ShareRank
1 22896 Aca Financial Guaranty Corp 4,111,880 3.2838% 1,413,593 0 0.00%5
2 1248 18708 Ambac Assur Corp 31,075,473 24.8175% 29,824,617 3,409 0.01%3
3 528 20877 Capital Markets Assr Corp 55,799 0.0446% 101,651 0 0.00%6
4 218 35289 Continental Ins Co 4,303 0.0034% 25,841 0 0.00%10
5 350 12815 Financial Guaranty Ins Co 9,399,255 7.5064% 4,031,948 0 0.00%4
6 194 18287 Financial Security Assur Inc 35,625,441 28.4512% 27,746,314 1,060 0.00%2
7 761 21873 Firemans Fund Ins Co 12,912 0.0103% 78,907 -3,300 -4.18%9
8 458 35769 Lyndon Property Ins Co 38,588 0.0308% 38,588 0 0.00%7
9 528 12041 MBIA Ins Corp 44,871,825 35.8355% 27,742,987 0 0.00%1
10 41 25682 Travelers Ind Co Of CT 20,659 0.0165% 52,967 0 0.00%8
125,216,135 100.0000% 91,057,413 1,169 0.00%Line Total:
California Department of Insurance Page 1 of 1 Rate Specialist Bureau - 07/10/2001
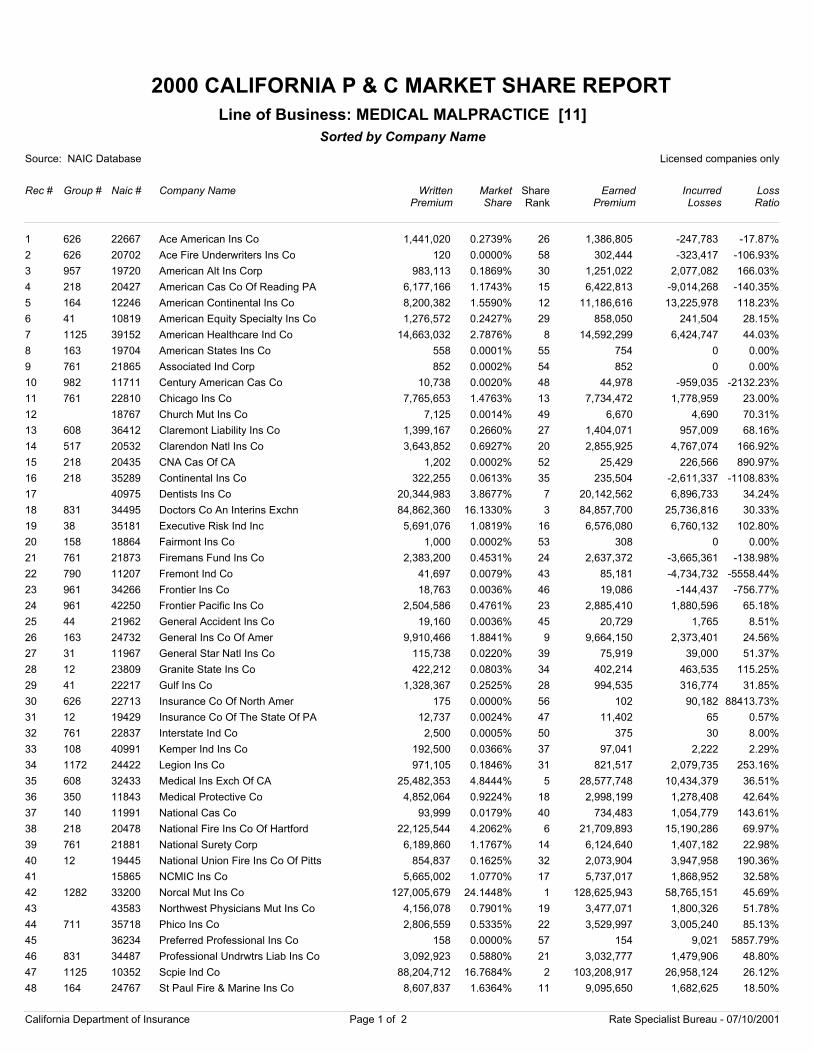
2000 CALIFORNIA P & C MARKET SHARE REPORT
Source: NAIC Database Licensed companies only
Rec # Group # Naic # Company Name
Sorted by Company Name
WrittenPremium
Market Share
EarnedPremium
IncurredLosses
LossRatio
Line of Business: MEDICAL MALPRACTICE [11]
ShareRank
1 626 22667 Ace American Ins Co 1,441,020 0.2739% 1,386,805 -247,783 -17.87%26
2 626 20702 Ace Fire Underwriters Ins Co 120 0.0000% 302,444 -323,417 -106.93%58
3 957 19720 American Alt Ins Corp 983,113 0.1869% 1,251,022 2,077,082 166.03%30
4 218 20427 American Cas Co Of Reading PA 6,177,166 1.1743% 6,422,813 -9,014,268 -140.35%15
5 164 12246 American Continental Ins Co 8,200,382 1.5590% 11,186,616 13,225,978 118.23%12
6 41 10819 American Equity Specialty Ins Co 1,276,572 0.2427% 858,050 241,504 28.15%29
7 1125 39152 American Healthcare Ind Co 14,663,032 2.7876% 14,592,299 6,424,747 44.03%8
8 163 19704 American States Ins Co 558 0.0001% 754 0 0.00%55
9 761 21865 Associated Ind Corp 852 0.0002% 852 0 0.00%54
10 982 11711 Century American Cas Co 10,738 0.0020% 44,978 -959,035 -2132.23%48
11 761 22810 Chicago Ins Co 7,765,653 1.4763% 7,734,472 1,778,959 23.00%13
12 18767 Church Mut Ins Co 7,125 0.0014% 6,670 4,690 70.31%49
13 608 36412 Claremont Liability Ins Co 1,399,167 0.2660% 1,404,071 957,009 68.16%27
14 517 20532 Clarendon Natl Ins Co 3,643,852 0.6927% 2,855,925 4,767,074 166.92%20
15 218 20435 CNA Cas Of CA 1,202 0.0002% 25,429 226,566 890.97%52
16 218 35289 Continental Ins Co 322,255 0.0613% 235,504 -2,611,337 -1108.83%35
17 40975 Dentists Ins Co 20,344,983 3.8677% 20,142,562 6,896,733 34.24%7
18 831 34495 Doctors Co An Interins Exchn 84,862,360 16.1330% 84,857,700 25,736,816 30.33%3
19 38 35181 Executive Risk Ind Inc 5,691,076 1.0819% 6,576,080 6,760,132 102.80%16
20 158 18864 Fairmont Ins Co 1,000 0.0002% 308 0 0.00%53
21 761 21873 Firemans Fund Ins Co 2,383,200 0.4531% 2,637,372 -3,665,361 -138.98%24
22 790 11207 Fremont Ind Co 41,697 0.0079% 85,181 -4,734,732 -5558.44%43
23 961 34266 Frontier Ins Co 18,763 0.0036% 19,086 -144,437 -756.77%46
24 961 42250 Frontier Pacific Ins Co 2,504,586 0.4761% 2,885,410 1,880,596 65.18%23
25 44 21962 General Accident Ins Co 19,160 0.0036% 20,729 1,765 8.51%45
26 163 24732 General Ins Co Of Amer 9,910,466 1.8841% 9,664,150 2,373,401 24.56%9
27 31 11967 General Star Natl Ins Co 115,738 0.0220% 75,919 39,000 51.37%39
28 12 23809 Granite State Ins Co 422,212 0.0803% 402,214 463,535 115.25%34
29 41 22217 Gulf Ins Co 1,328,367 0.2525% 994,535 316,774 31.85%28
30 626 22713 Insurance Co Of North Amer 175 0.0000% 102 90,182 88413.73%56
31 12 19429 Insurance Co Of The State Of PA 12,737 0.0024% 11,402 65 0.57%47
32 761 22837 Interstate Ind Co 2,500 0.0005% 375 30 8.00%50
33 108 40991 Kemper Ind Ins Co 192,500 0.0366% 97,041 2,222 2.29%37
34 1172 24422 Legion Ins Co 971,105 0.1846% 821,517 2,079,735 253.16%31
35 608 32433 Medical Ins Exch Of CA 25,482,353 4.8444% 28,577,748 10,434,379 36.51%5
36 350 11843 Medical Protective Co 4,852,064 0.9224% 2,998,199 1,278,408 42.64%18
37 140 11991 National Cas Co 93,999 0.0179% 734,483 1,054,779 143.61%40
38 218 20478 National Fire Ins Co Of Hartford 22,125,544 4.2062% 21,709,893 15,190,286 69.97%6
39 761 21881 National Surety Corp 6,189,860 1.1767% 6,124,640 1,407,182 22.98%14
40 12 19445 National Union Fire Ins Co Of Pitts 854,837 0.1625% 2,073,904 3,947,958 190.36%32
41 15865 NCMIC Ins Co 5,665,002 1.0770% 5,737,017 1,868,952 32.58%17
42 1282 33200 Norcal Mut Ins Co 127,005,679 24.1448% 128,625,943 58,765,151 45.69%1
43 43583 Northwest Physicians Mut Ins Co 4,156,078 0.7901% 3,477,071 1,800,326 51.78%19
44 711 35718 Phico Ins Co 2,806,559 0.5335% 3,529,997 3,005,240 85.13%22
45 36234 Preferred Professional Ins Co 158 0.0000% 154 9,021 5857.79%57
46 831 34487 Professional Undrwtrs Liab Ins Co 3,092,923 0.5880% 3,032,777 1,479,906 48.80%21
47 1125 10352 Scpie Ind Co 88,204,712 16.7684% 103,208,917 26,958,124 26.12%2
48 164 24767 St Paul Fire & Marine Ins Co 8,607,837 1.6364% 9,095,650 1,682,625 18.50%11
California Department of Insurance Page 1 of 2 Rate Specialist Bureau - 07/10/2001
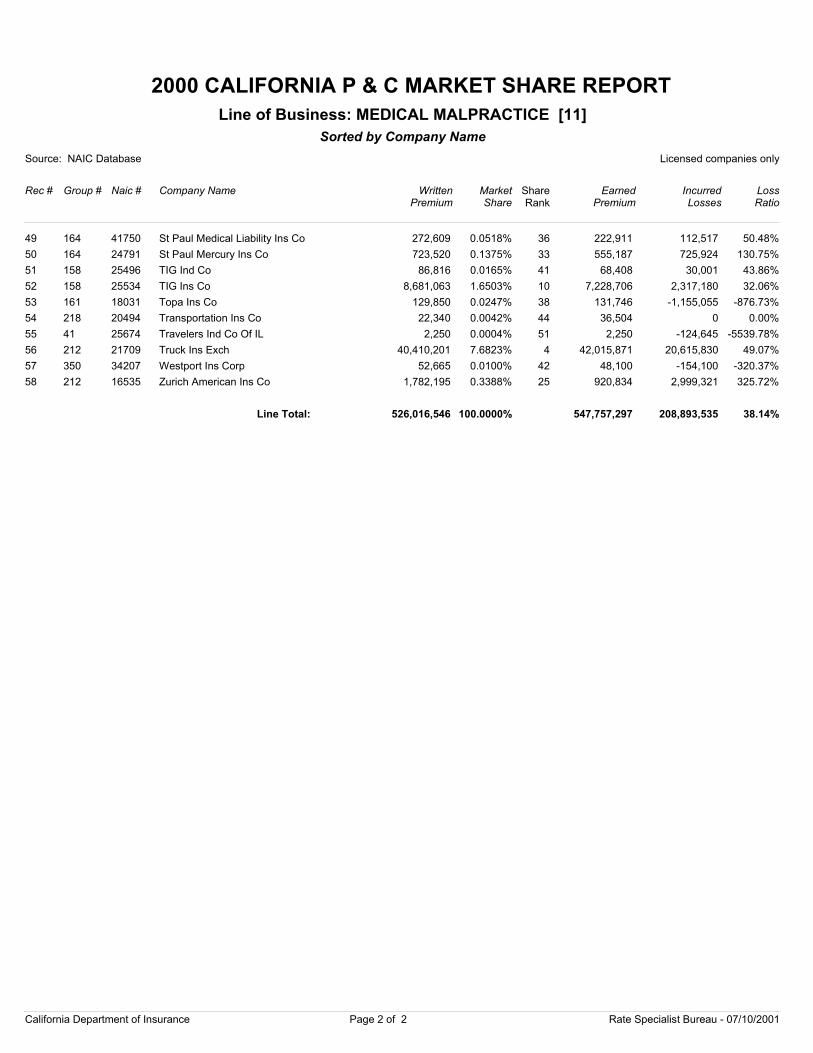
2000 CALIFORNIA P & C MARKET SHARE REPORT
Source: NAIC Database Licensed companies only
Rec # Group # Naic # Company Name
Sorted by Company Name
WrittenPremium
Market Share
EarnedPremium
IncurredLosses
LossRatio
Line of Business: MEDICAL MALPRACTICE [11]
ShareRank
49 164 41750 St Paul Medical Liability Ins Co 272,609 0.0518% 222,911 112,517 50.48%36
50 164 24791 St Paul Mercury Ins Co 723,520 0.1375% 555,187 725,924 130.75%33
51 158 25496 TIG Ind Co 86,816 0.0165% 68,408 30,001 43.86%41
52 158 25534 TIG Ins Co 8,681,063 1.6503% 7,228,706 2,317,180 32.06%10
53 161 18031 Topa Ins Co 129,850 0.0247% 131,746 -1,155,055 -876.73%38
54 218 20494 Transportation Ins Co 22,340 0.0042% 36,504 0 0.00%44
55 41 25674 Travelers Ind Co Of IL 2,250 0.0004% 2,250 -124,645 -5539.78%51
56 212 21709 Truck Ins Exch 40,410,201 7.6823% 42,015,871 20,615,830 49.07%4
57 350 34207 Westport Ins Corp 52,665 0.0100% 48,100 -154,100 -320.37%42
58 212 16535 Zurich American Ins Co 1,782,195 0.3388% 920,834 2,999,321 325.72%25
526,016,546 100.0000% 547,757,297 208,893,535 38.14%Line Total:
California Department of Insurance Page 2 of 2 Rate Specialist Bureau - 07/10/2001
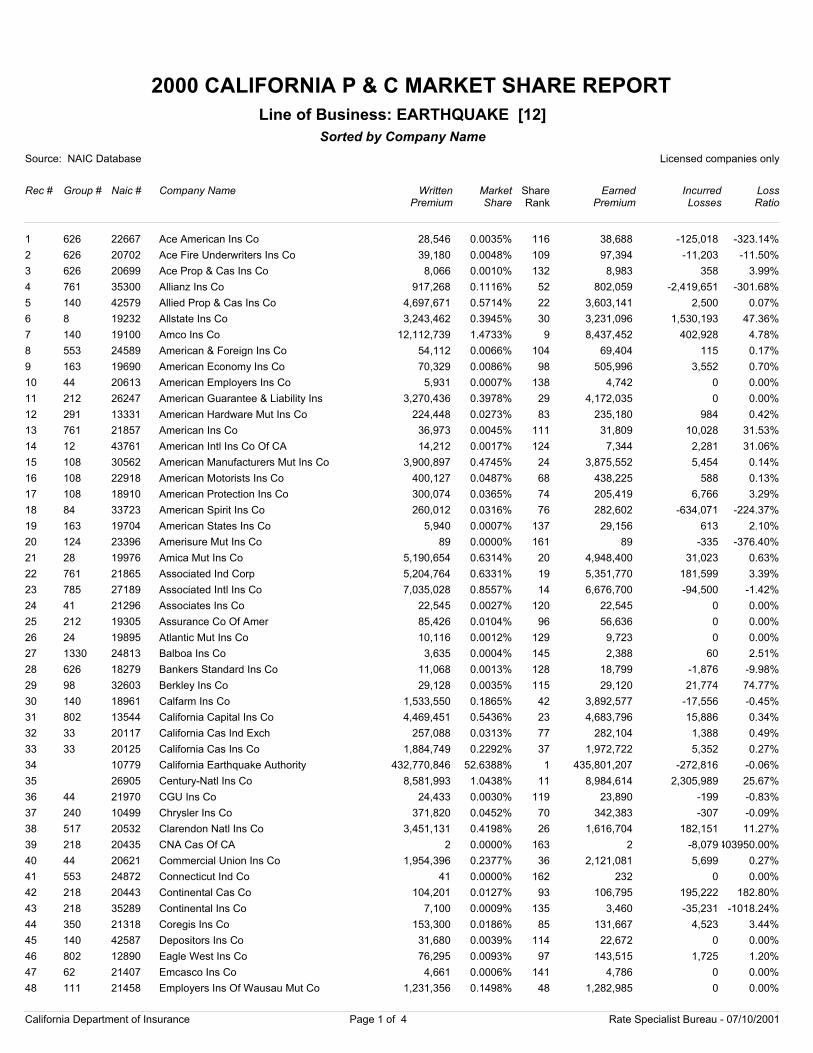
2000 CALIFORNIA P & C MARKET SHARE REPORT
Source: NAIC Database Licensed companies only
Rec # Group # Naic # Company Name
Sorted by Company Name
WrittenPremium
Market Share
EarnedPremium
IncurredLosses
LossRatio
Line of Business: EARTHQUAKE [12]
ShareRank
1 626 22667 Ace American Ins Co 28,546 0.0035% 38,688 -125,018 -323.14%116
2 626 20702 Ace Fire Underwriters Ins Co 39,180 0.0048% 97,394 -11,203 -11.50%109
3 626 20699 Ace Prop & Cas Ins Co 8,066 0.0010% 8,983 358 3.99%132
4 761 35300 Allianz Ins Co 917,268 0.1116% 802,059 -2,419,651 -301.68%52
5 140 42579 Allied Prop & Cas Ins Co 4,697,671 0.5714% 3,603,141 2,500 0.07%22
6 8 19232 Allstate Ins Co 3,243,462 0.3945% 3,231,096 1,530,193 47.36%30
7 140 19100 Amco Ins Co 12,112,739 1.4733% 8,437,452 402,928 4.78%9
8 553 24589 American & Foreign Ins Co 54,112 0.0066% 69,404 115 0.17%104
9 163 19690 American Economy Ins Co 70,329 0.0086% 505,996 3,552 0.70%98
10 44 20613 American Employers Ins Co 5,931 0.0007% 4,742 0 0.00%138
11 212 26247 American Guarantee & Liability Ins 3,270,436 0.3978% 4,172,035 0 0.00%29
12 291 13331 American Hardware Mut Ins Co 224,448 0.0273% 235,180 984 0.42%83
13 761 21857 American Ins Co 36,973 0.0045% 31,809 10,028 31.53%111
14 12 43761 American Intl Ins Co Of CA 14,212 0.0017% 7,344 2,281 31.06%124
15 108 30562 American Manufacturers Mut Ins Co 3,900,897 0.4745% 3,875,552 5,454 0.14%24
16 108 22918 American Motorists Ins Co 400,127 0.0487% 438,225 588 0.13%68
17 108 18910 American Protection Ins Co 300,074 0.0365% 205,419 6,766 3.29%74
18 84 33723 American Spirit Ins Co 260,012 0.0316% 282,602 -634,071 -224.37%76
19 163 19704 American States Ins Co 5,940 0.0007% 29,156 613 2.10%137
20 124 23396 Amerisure Mut Ins Co 89 0.0000% 89 -335 -376.40%161
21 28 19976 Amica Mut Ins Co 5,190,654 0.6314% 4,948,400 31,023 0.63%20
22 761 21865 Associated Ind Corp 5,204,764 0.6331% 5,351,770 181,599 3.39%19
23 785 27189 Associated Intl Ins Co 7,035,028 0.8557% 6,676,700 -94,500 -1.42%14
24 41 21296 Associates Ins Co 22,545 0.0027% 22,545 0 0.00%120
25 212 19305 Assurance Co Of Amer 85,426 0.0104% 56,636 0 0.00%96
26 24 19895 Atlantic Mut Ins Co 10,116 0.0012% 9,723 0 0.00%129
27 1330 24813 Balboa Ins Co 3,635 0.0004% 2,388 60 2.51%145
28 626 18279 Bankers Standard Ins Co 11,068 0.0013% 18,799 -1,876 -9.98%128
29 98 32603 Berkley Ins Co 29,128 0.0035% 29,120 21,774 74.77%115
30 140 18961 Calfarm Ins Co 1,533,550 0.1865% 3,892,577 -17,556 -0.45%42
31 802 13544 California Capital Ins Co 4,469,451 0.5436% 4,683,796 15,886 0.34%23
32 33 20117 California Cas Ind Exch 257,088 0.0313% 282,104 1,388 0.49%77
33 33 20125 California Cas Ins Co 1,884,749 0.2292% 1,972,722 5,352 0.27%37
34 10779 California Earthquake Authority 432,770,846 52.6388% 435,801,207 -272,816 -0.06%1
35 26905 Century-Natl Ins Co 8,581,993 1.0438% 8,984,614 2,305,989 25.67%11
36 44 21970 CGU Ins Co 24,433 0.0030% 23,890 -199 -0.83%119
37 240 10499 Chrysler Ins Co 371,820 0.0452% 342,383 -307 -0.09%70
38 517 20532 Clarendon Natl Ins Co 3,451,131 0.4198% 1,616,704 182,151 11.27%26
39 218 20435 CNA Cas Of CA 2 0.0000% 2 -8,079403950.00%163
40 44 20621 Commercial Union Ins Co 1,954,396 0.2377% 2,121,081 5,699 0.27%36
41 553 24872 Connecticut Ind Co 41 0.0000% 232 0 0.00%162
42 218 20443 Continental Cas Co 104,201 0.0127% 106,795 195,222 182.80%93
43 218 35289 Continental Ins Co 7,100 0.0009% 3,460 -35,231 -1018.24%135
44 350 21318 Coregis Ins Co 153,300 0.0186% 131,667 4,523 3.44%85
45 140 42587 Depositors Ins Co 31,680 0.0039% 22,672 0 0.00%114
46 802 12890 Eagle West Ins Co 76,295 0.0093% 143,515 1,725 1.20%97
47 62 21407 Emcasco Ins Co 4,661 0.0006% 4,786 0 0.00%141
48 111 21458 Employers Ins Of Wausau Mut Co 1,231,356 0.1498% 1,282,985 0 0.00%48
California Department of Insurance Page 1 of 4 Rate Specialist Bureau - 07/10/2001
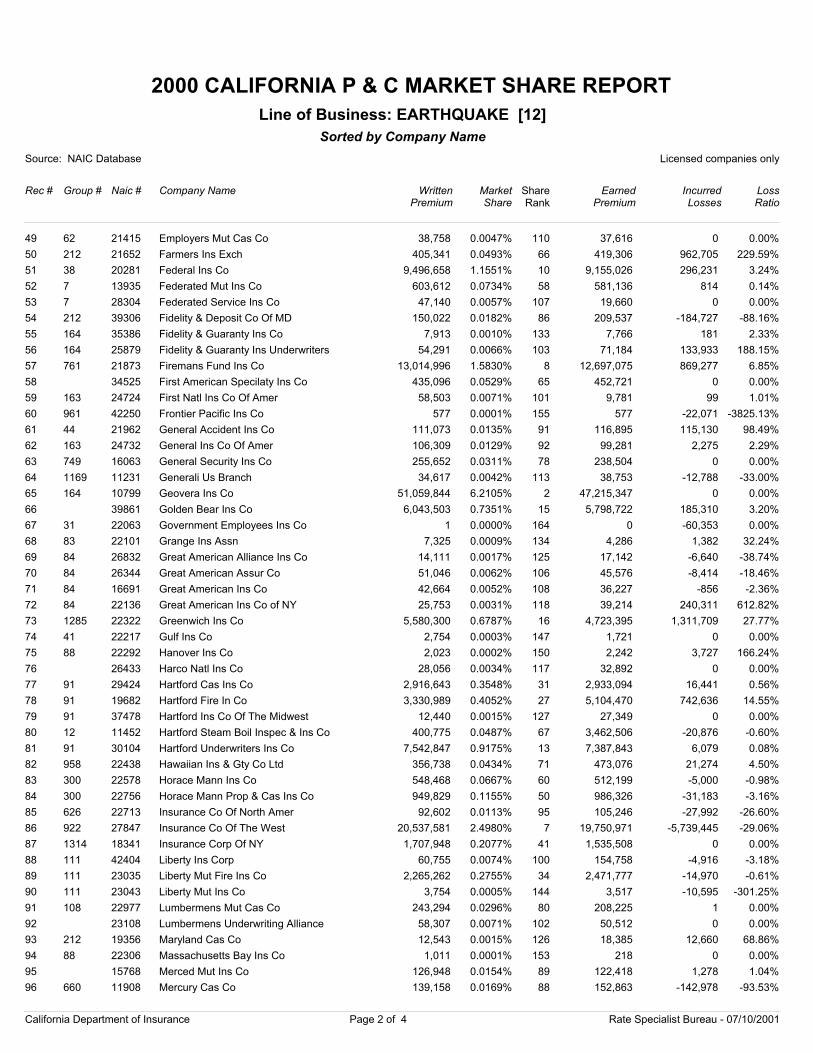
2000 CALIFORNIA P & C MARKET SHARE REPORT
Source: NAIC Database Licensed companies only
Rec # Group # Naic # Company Name
Sorted by Company Name
WrittenPremium
Market Share
EarnedPremium
IncurredLosses
LossRatio
Line of Business: EARTHQUAKE [12]
ShareRank
49 62 21415 Employers Mut Cas Co 38,758 0.0047% 37,616 0 0.00%110
50 212 21652 Farmers Ins Exch 405,341 0.0493% 419,306 962,705 229.59%66
51 38 20281 Federal Ins Co 9,496,658 1.1551% 9,155,026 296,231 3.24%10
52 7 13935 Federated Mut Ins Co 603,612 0.0734% 581,136 814 0.14%58
53 7 28304 Federated Service Ins Co 47,140 0.0057% 19,660 0 0.00%107
54 212 39306 Fidelity & Deposit Co Of MD 150,022 0.0182% 209,537 -184,727 -88.16%86
55 164 35386 Fidelity & Guaranty Ins Co 7,913 0.0010% 7,766 181 2.33%133
56 164 25879 Fidelity & Guaranty Ins Underwriters 54,291 0.0066% 71,184 133,933 188.15%103
57 761 21873 Firemans Fund Ins Co 13,014,996 1.5830% 12,697,075 869,277 6.85%8
58 34525 First American Specilaty Ins Co 435,096 0.0529% 452,721 0 0.00%65
59 163 24724 First Natl Ins Co Of Amer 58,503 0.0071% 9,781 99 1.01%101
60 961 42250 Frontier Pacific Ins Co 577 0.0001% 577 -22,071 -3825.13%155
61 44 21962 General Accident Ins Co 111,073 0.0135% 116,895 115,130 98.49%91
62 163 24732 General Ins Co Of Amer 106,309 0.0129% 99,281 2,275 2.29%92
63 749 16063 General Security Ins Co 255,652 0.0311% 238,504 0 0.00%78
64 1169 11231 Generali Us Branch 34,617 0.0042% 38,753 -12,788 -33.00%113
65 164 10799 Geovera Ins Co 51,059,844 6.2105% 47,215,347 0 0.00%2
66 39861 Golden Bear Ins Co 6,043,503 0.7351% 5,798,722 185,310 3.20%15
67 31 22063 Government Employees Ins Co 1 0.0000% 0 -60,353 0.00%164
68 83 22101 Grange Ins Assn 7,325 0.0009% 4,286 1,382 32.24%134
69 84 26832 Great American Alliance Ins Co 14,111 0.0017% 17,142 -6,640 -38.74%125
70 84 26344 Great American Assur Co 51,046 0.0062% 45,576 -8,414 -18.46%106
71 84 16691 Great American Ins Co 42,664 0.0052% 36,227 -856 -2.36%108
72 84 22136 Great American Ins Co of NY 25,753 0.0031% 39,214 240,311 612.82%118
73 1285 22322 Greenwich Ins Co 5,580,300 0.6787% 4,723,395 1,311,709 27.77%16
74 41 22217 Gulf Ins Co 2,754 0.0003% 1,721 0 0.00%147
75 88 22292 Hanover Ins Co 2,023 0.0002% 2,242 3,727 166.24%150
76 26433 Harco Natl Ins Co 28,056 0.0034% 32,892 0 0.00%117
77 91 29424 Hartford Cas Ins Co 2,916,643 0.3548% 2,933,094 16,441 0.56%31
78 91 19682 Hartford Fire In Co 3,330,989 0.4052% 5,104,470 742,636 14.55%27
79 91 37478 Hartford Ins Co Of The Midwest 12,440 0.0015% 27,349 0 0.00%127
80 12 11452 Hartford Steam Boil Inspec & Ins Co 400,775 0.0487% 3,462,506 -20,876 -0.60%67
81 91 30104 Hartford Underwriters Ins Co 7,542,847 0.9175% 7,387,843 6,079 0.08%13
82 958 22438 Hawaiian Ins & Gty Co Ltd 356,738 0.0434% 473,076 21,274 4.50%71
83 300 22578 Horace Mann Ins Co 548,468 0.0667% 512,199 -5,000 -0.98%60
84 300 22756 Horace Mann Prop & Cas Ins Co 949,829 0.1155% 986,326 -31,183 -3.16%50
85 626 22713 Insurance Co Of North Amer 92,602 0.0113% 105,246 -27,992 -26.60%95
86 922 27847 Insurance Co Of The West 20,537,581 2.4980% 19,750,971 -5,739,445 -29.06%7
87 1314 18341 Insurance Corp Of NY 1,707,948 0.2077% 1,535,508 0 0.00%41
88 111 42404 Liberty Ins Corp 60,755 0.0074% 154,758 -4,916 -3.18%100
89 111 23035 Liberty Mut Fire Ins Co 2,265,262 0.2755% 2,471,777 -14,970 -0.61%34
90 111 23043 Liberty Mut Ins Co 3,754 0.0005% 3,517 -10,595 -301.25%144
91 108 22977 Lumbermens Mut Cas Co 243,294 0.0296% 208,225 1 0.00%80
92 23108 Lumbermens Underwriting Alliance 58,307 0.0071% 50,512 0 0.00%102
93 212 19356 Maryland Cas Co 12,543 0.0015% 18,385 12,660 68.86%126
94 88 22306 Massachusetts Bay Ins Co 1,011 0.0001% 218 0 0.00%153
95 15768 Merced Mut Ins Co 126,948 0.0154% 122,418 1,278 1.04%89
96 660 11908 Mercury Cas Co 139,158 0.0169% 152,863 -142,978 -93.53%88
California Department of Insurance Page 2 of 4 Rate Specialist Bureau - 07/10/2001
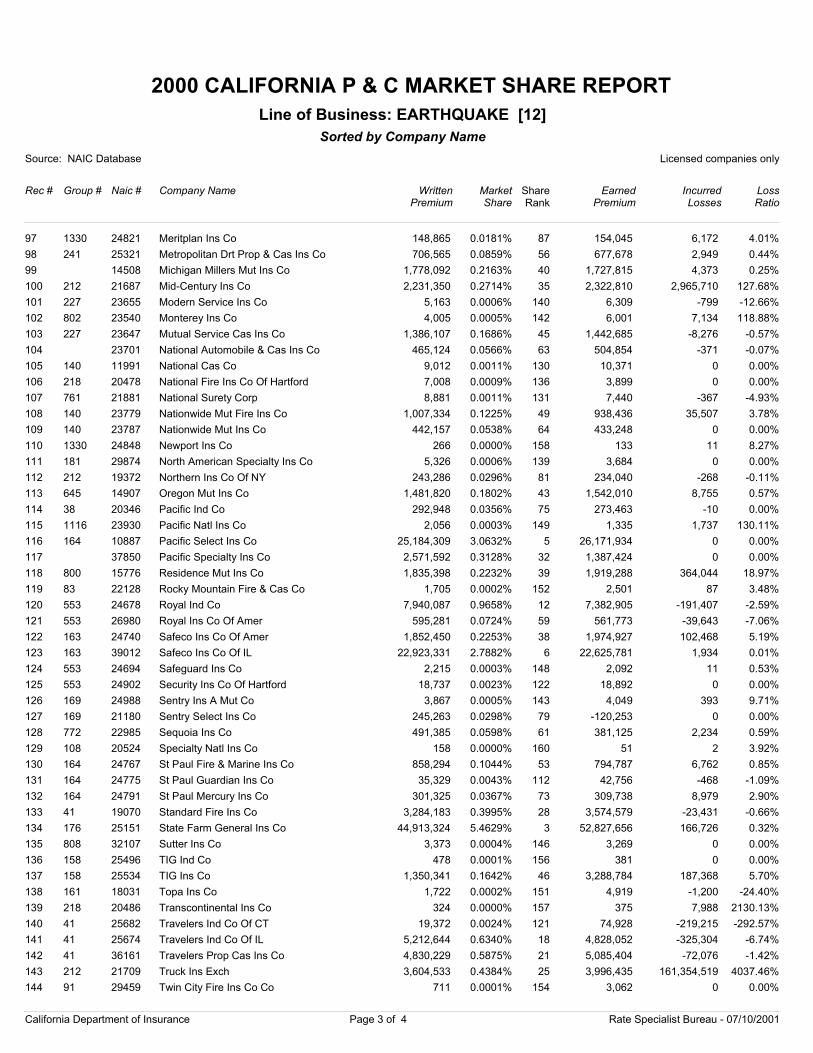
2000 CALIFORNIA P & C MARKET SHARE REPORT
Source: NAIC Database Licensed companies only
Rec # Group # Naic # Company Name
Sorted by Company Name
WrittenPremium
Market Share
EarnedPremium
IncurredLosses
LossRatio
Line of Business: EARTHQUAKE [12]
ShareRank
97 1330 24821 Meritplan Ins Co 148,865 0.0181% 154,045 6,172 4.01%87
98 241 25321 Metropolitan Drt Prop & Cas Ins Co 706,565 0.0859% 677,678 2,949 0.44%56
99 14508 Michigan Millers Mut Ins Co 1,778,092 0.2163% 1,727,815 4,373 0.25%40
100 212 21687 Mid-Century Ins Co 2,231,350 0.2714% 2,322,810 2,965,710 127.68%35
101 227 23655 Modern Service Ins Co 5,163 0.0006% 6,309 -799 -12.66%140
102 802 23540 Monterey Ins Co 4,005 0.0005% 6,001 7,134 118.88%142
103 227 23647 Mutual Service Cas Ins Co 1,386,107 0.1686% 1,442,685 -8,276 -0.57%45
104 23701 National Automobile & Cas Ins Co 465,124 0.0566% 504,854 -371 -0.07%63
105 140 11991 National Cas Co 9,012 0.0011% 10,371 0 0.00%130
106 218 20478 National Fire Ins Co Of Hartford 7,008 0.0009% 3,899 0 0.00%136
107 761 21881 National Surety Corp 8,881 0.0011% 7,440 -367 -4.93%131
108 140 23779 Nationwide Mut Fire Ins Co 1,007,334 0.1225% 938,436 35,507 3.78%49
109 140 23787 Nationwide Mut Ins Co 442,157 0.0538% 433,248 0 0.00%64
110 1330 24848 Newport Ins Co 266 0.0000% 133 11 8.27%158
111 181 29874 North American Specialty Ins Co 5,326 0.0006% 3,684 0 0.00%139
112 212 19372 Northern Ins Co Of NY 243,286 0.0296% 234,040 -268 -0.11%81
113 645 14907 Oregon Mut Ins Co 1,481,820 0.1802% 1,542,010 8,755 0.57%43
114 38 20346 Pacific Ind Co 292,948 0.0356% 273,463 -10 0.00%75
115 1116 23930 Pacific Natl Ins Co 2,056 0.0003% 1,335 1,737 130.11%149
116 164 10887 Pacific Select Ins Co 25,184,309 3.0632% 26,171,934 0 0.00%5
117 37850 Pacific Specialty Ins Co 2,571,592 0.3128% 1,387,424 0 0.00%32
118 800 15776 Residence Mut Ins Co 1,835,398 0.2232% 1,919,288 364,044 18.97%39
119 83 22128 Rocky Mountain Fire & Cas Co 1,705 0.0002% 2,501 87 3.48%152
120 553 24678 Royal Ind Co 7,940,087 0.9658% 7,382,905 -191,407 -2.59%12
121 553 26980 Royal Ins Co Of Amer 595,281 0.0724% 561,773 -39,643 -7.06%59
122 163 24740 Safeco Ins Co Of Amer 1,852,450 0.2253% 1,974,927 102,468 5.19%38
123 163 39012 Safeco Ins Co Of IL 22,923,331 2.7882% 22,625,781 1,934 0.01%6
124 553 24694 Safeguard Ins Co 2,215 0.0003% 2,092 11 0.53%148
125 553 24902 Security Ins Co Of Hartford 18,737 0.0023% 18,892 0 0.00%122
126 169 24988 Sentry Ins A Mut Co 3,867 0.0005% 4,049 393 9.71%143
127 169 21180 Sentry Select Ins Co 245,263 0.0298% -120,253 0 0.00%79
128 772 22985 Sequoia Ins Co 491,385 0.0598% 381,125 2,234 0.59%61
129 108 20524 Specialty Natl Ins Co 158 0.0000% 51 2 3.92%160
130 164 24767 St Paul Fire & Marine Ins Co 858,294 0.1044% 794,787 6,762 0.85%53
131 164 24775 St Paul Guardian Ins Co 35,329 0.0043% 42,756 -468 -1.09%112
132 164 24791 St Paul Mercury Ins Co 301,325 0.0367% 309,738 8,979 2.90%73
133 41 19070 Standard Fire Ins Co 3,284,183 0.3995% 3,574,579 -23,431 -0.66%28
134 176 25151 State Farm General Ins Co 44,913,324 5.4629% 52,827,656 166,726 0.32%3
135 808 32107 Sutter Ins Co 3,373 0.0004% 3,269 0 0.00%146
136 158 25496 TIG Ind Co 478 0.0001% 381 0 0.00%156
137 158 25534 TIG Ins Co 1,350,341 0.1642% 3,288,784 187,368 5.70%46
138 161 18031 Topa Ins Co 1,722 0.0002% 4,919 -1,200 -24.40%151
139 218 20486 Transcontinental Ins Co 324 0.0000% 375 7,988 2130.13%157
140 41 25682 Travelers Ind Co Of CT 19,372 0.0024% 74,928 -219,215 -292.57%121
141 41 25674 Travelers Ind Co Of IL 5,212,644 0.6340% 4,828,052 -325,304 -6.74%18
142 41 36161 Travelers Prop Cas Ins Co 4,830,229 0.5875% 5,085,404 -72,076 -1.42%21
143 212 21709 Truck Ins Exch 3,604,533 0.4384% 3,996,435 161,354,519 4037.46%25
144 91 29459 Twin City Fire Ins Co Co 711 0.0001% 3,062 0 0.00%154
California Department of Insurance Page 3 of 4 Rate Specialist Bureau - 07/10/2001
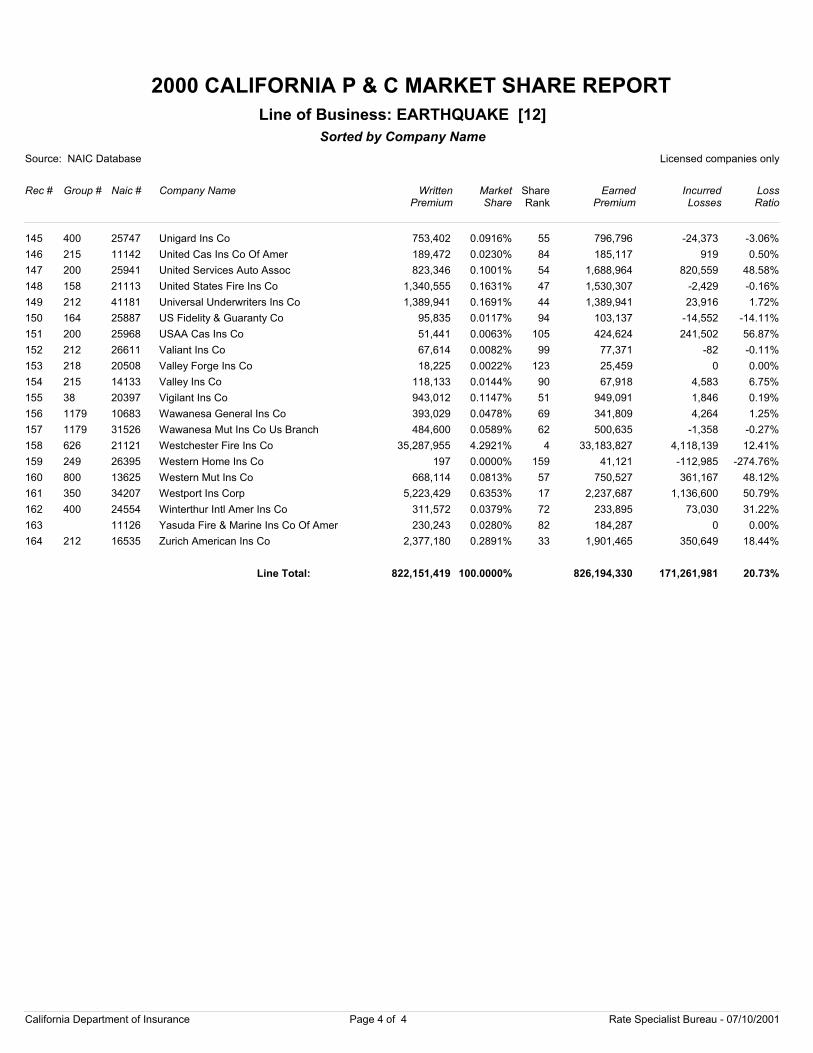
2000 CALIFORNIA P & C MARKET SHARE REPORT
Source: NAIC Database Licensed companies only
Rec # Group # Naic # Company Name
Sorted by Company Name
WrittenPremium
Market Share
EarnedPremium
IncurredLosses
LossRatio
Line of Business: EARTHQUAKE [12]
ShareRank
145 400 25747 Unigard Ins Co 753,402 0.0916% 796,796 -24,373 -3.06%55
146 215 11142 United Cas Ins Co Of Amer 189,472 0.0230% 185,117 919 0.50%84
147 200 25941 United Services Auto Assoc 823,346 0.1001% 1,688,964 820,559 48.58%54
148 158 21113 United States Fire Ins Co 1,340,555 0.1631% 1,530,307 -2,429 -0.16%47
149 212 41181 Universal Underwriters Ins Co 1,389,941 0.1691% 1,389,941 23,916 1.72%44
150 164 25887 US Fidelity & Guaranty Co 95,835 0.0117% 103,137 -14,552 -14.11%94
151 200 25968 USAA Cas Ins Co 51,441 0.0063% 424,624 241,502 56.87%105
152 212 26611 Valiant Ins Co 67,614 0.0082% 77,371 -82 -0.11%99
153 218 20508 Valley Forge Ins Co 18,225 0.0022% 25,459 0 0.00%123
154 215 14133 Valley Ins Co 118,133 0.0144% 67,918 4,583 6.75%90
155 38 20397 Vigilant Ins Co 943,012 0.1147% 949,091 1,846 0.19%51
156 1179 10683 Wawanesa General Ins Co 393,029 0.0478% 341,809 4,264 1.25%69
157 1179 31526 Wawanesa Mut Ins Co Us Branch 484,600 0.0589% 500,635 -1,358 -0.27%62
158 626 21121 Westchester Fire Ins Co 35,287,955 4.2921% 33,183,827 4,118,139 12.41%4
159 249 26395 Western Home Ins Co 197 0.0000% 41,121 -112,985 -274.76%159
160 800 13625 Western Mut Ins Co 668,114 0.0813% 750,527 361,167 48.12%57
161 350 34207 Westport Ins Corp 5,223,429 0.6353% 2,237,687 1,136,600 50.79%17
162 400 24554 Winterthur Intl Amer Ins Co 311,572 0.0379% 233,895 73,030 31.22%72
163 11126 Yasuda Fire & Marine Ins Co Of Amer 230,243 0.0280% 184,287 0 0.00%82
164 212 16535 Zurich American Ins Co 2,377,180 0.2891% 1,901,465 350,649 18.44%33
822,151,419 100.0000% 826,194,330 171,261,981 20.73%Line Total:
California Department of Insurance Page 4 of 4 Rate Specialist Bureau - 07/10/2001
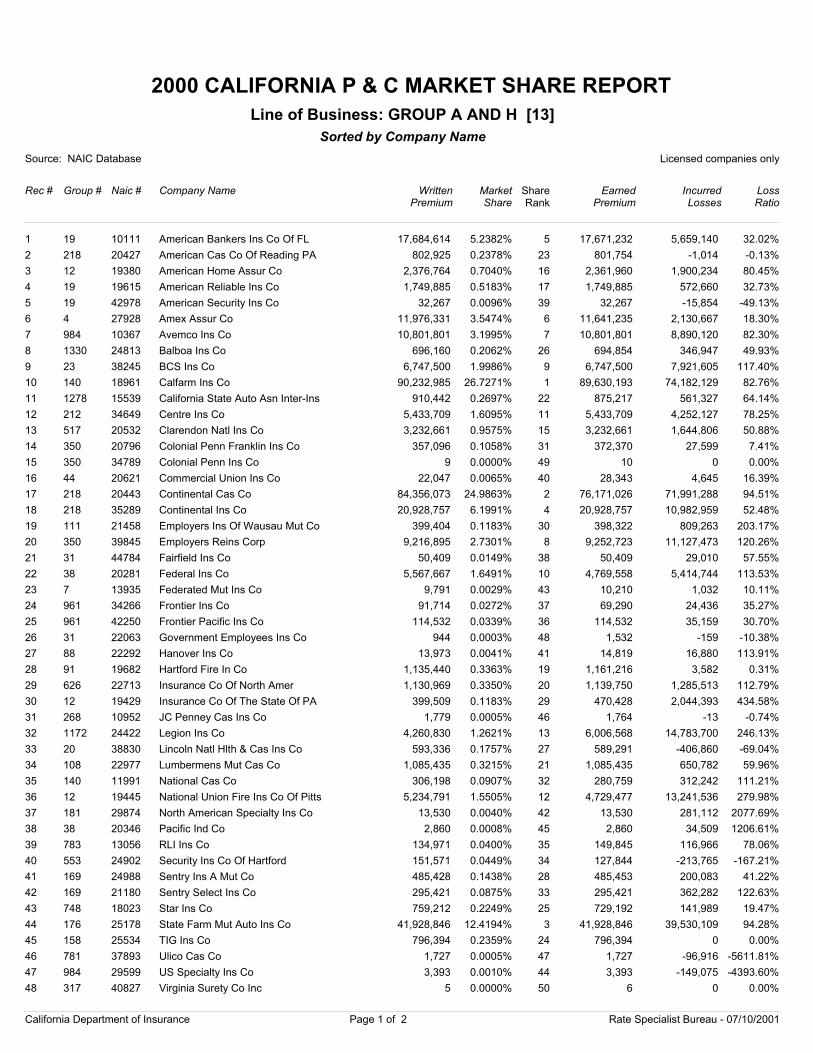
2000 CALIFORNIA P & C MARKET SHARE REPORT
Source: NAIC Database Licensed companies only
Rec # Group # Naic # Company Name
Sorted by Company Name
WrittenPremium
Market Share
EarnedPremium
IncurredLosses
LossRatio
Line of Business: GROUP A AND H [13]
ShareRank
1 19 10111 American Bankers Ins Co Of FL 17,684,614 5.2382% 17,671,232 5,659,140 32.02%5
2 218 20427 American Cas Co Of Reading PA 802,925 0.2378% 801,754 -1,014 -0.13%23
3 12 19380 American Home Assur Co 2,376,764 0.7040% 2,361,960 1,900,234 80.45%16
4 19 19615 American Reliable Ins Co 1,749,885 0.5183% 1,749,885 572,660 32.73%17
5 19 42978 American Security Ins Co 32,267 0.0096% 32,267 -15,854 -49.13%39
6 4 27928 Amex Assur Co 11,976,331 3.5474% 11,641,235 2,130,667 18.30%6
7 984 10367 Avemco Ins Co 10,801,801 3.1995% 10,801,801 8,890,120 82.30%7
8 1330 24813 Balboa Ins Co 696,160 0.2062% 694,854 346,947 49.93%26
9 23 38245 BCS Ins Co 6,747,500 1.9986% 6,747,500 7,921,605 117.40%9
10 140 18961 Calfarm Ins Co 90,232,985 26.7271% 89,630,193 74,182,129 82.76%1
11 1278 15539 California State Auto Asn Inter-Ins 910,442 0.2697% 875,217 561,327 64.14%22
12 212 34649 Centre Ins Co 5,433,709 1.6095% 5,433,709 4,252,127 78.25%11
13 517 20532 Clarendon Natl Ins Co 3,232,661 0.9575% 3,232,661 1,644,806 50.88%15
14 350 20796 Colonial Penn Franklin Ins Co 357,096 0.1058% 372,370 27,599 7.41%31
15 350 34789 Colonial Penn Ins Co 9 0.0000% 10 0 0.00%49
16 44 20621 Commercial Union Ins Co 22,047 0.0065% 28,343 4,645 16.39%40
17 218 20443 Continental Cas Co 84,356,073 24.9863% 76,171,026 71,991,288 94.51%2
18 218 35289 Continental Ins Co 20,928,757 6.1991% 20,928,757 10,982,959 52.48%4
19 111 21458 Employers Ins Of Wausau Mut Co 399,404 0.1183% 398,322 809,263 203.17%30
20 350 39845 Employers Reins Corp 9,216,895 2.7301% 9,252,723 11,127,473 120.26%8
21 31 44784 Fairfield Ins Co 50,409 0.0149% 50,409 29,010 57.55%38
22 38 20281 Federal Ins Co 5,567,667 1.6491% 4,769,558 5,414,744 113.53%10
23 7 13935 Federated Mut Ins Co 9,791 0.0029% 10,210 1,032 10.11%43
24 961 34266 Frontier Ins Co 91,714 0.0272% 69,290 24,436 35.27%37
25 961 42250 Frontier Pacific Ins Co 114,532 0.0339% 114,532 35,159 30.70%36
26 31 22063 Government Employees Ins Co 944 0.0003% 1,532 -159 -10.38%48
27 88 22292 Hanover Ins Co 13,973 0.0041% 14,819 16,880 113.91%41
28 91 19682 Hartford Fire In Co 1,135,440 0.3363% 1,161,216 3,582 0.31%19
29 626 22713 Insurance Co Of North Amer 1,130,969 0.3350% 1,139,750 1,285,513 112.79%20
30 12 19429 Insurance Co Of The State Of PA 399,509 0.1183% 470,428 2,044,393 434.58%29
31 268 10952 JC Penney Cas Ins Co 1,779 0.0005% 1,764 -13 -0.74%46
32 1172 24422 Legion Ins Co 4,260,830 1.2621% 6,006,568 14,783,700 246.13%13
33 20 38830 Lincoln Natl Hlth & Cas Ins Co 593,336 0.1757% 589,291 -406,860 -69.04%27
34 108 22977 Lumbermens Mut Cas Co 1,085,435 0.3215% 1,085,435 650,782 59.96%21
35 140 11991 National Cas Co 306,198 0.0907% 280,759 312,242 111.21%32
36 12 19445 National Union Fire Ins Co Of Pitts 5,234,791 1.5505% 4,729,477 13,241,536 279.98%12
37 181 29874 North American Specialty Ins Co 13,530 0.0040% 13,530 281,112 2077.69%42
38 38 20346 Pacific Ind Co 2,860 0.0008% 2,860 34,509 1206.61%45
39 783 13056 RLI Ins Co 134,971 0.0400% 149,845 116,966 78.06%35
40 553 24902 Security Ins Co Of Hartford 151,571 0.0449% 127,844 -213,765 -167.21%34
41 169 24988 Sentry Ins A Mut Co 485,428 0.1438% 485,453 200,083 41.22%28
42 169 21180 Sentry Select Ins Co 295,421 0.0875% 295,421 362,282 122.63%33
43 748 18023 Star Ins Co 759,212 0.2249% 729,192 141,989 19.47%25
44 176 25178 State Farm Mut Auto Ins Co 41,928,846 12.4194% 41,928,846 39,530,109 94.28%3
45 158 25534 TIG Ins Co 796,394 0.2359% 796,394 0 0.00%24
46 781 37893 Ulico Cas Co 1,727 0.0005% 1,727 -96,916 -5611.81%47
47 984 29599 US Specialty Ins Co 3,393 0.0010% 3,393 -149,075 -4393.60%44
48 317 40827 Virginia Surety Co Inc 5 0.0000% 6 0 0.00%50
California Department of Insurance Page 1 of 2 Rate Specialist Bureau - 07/10/2001
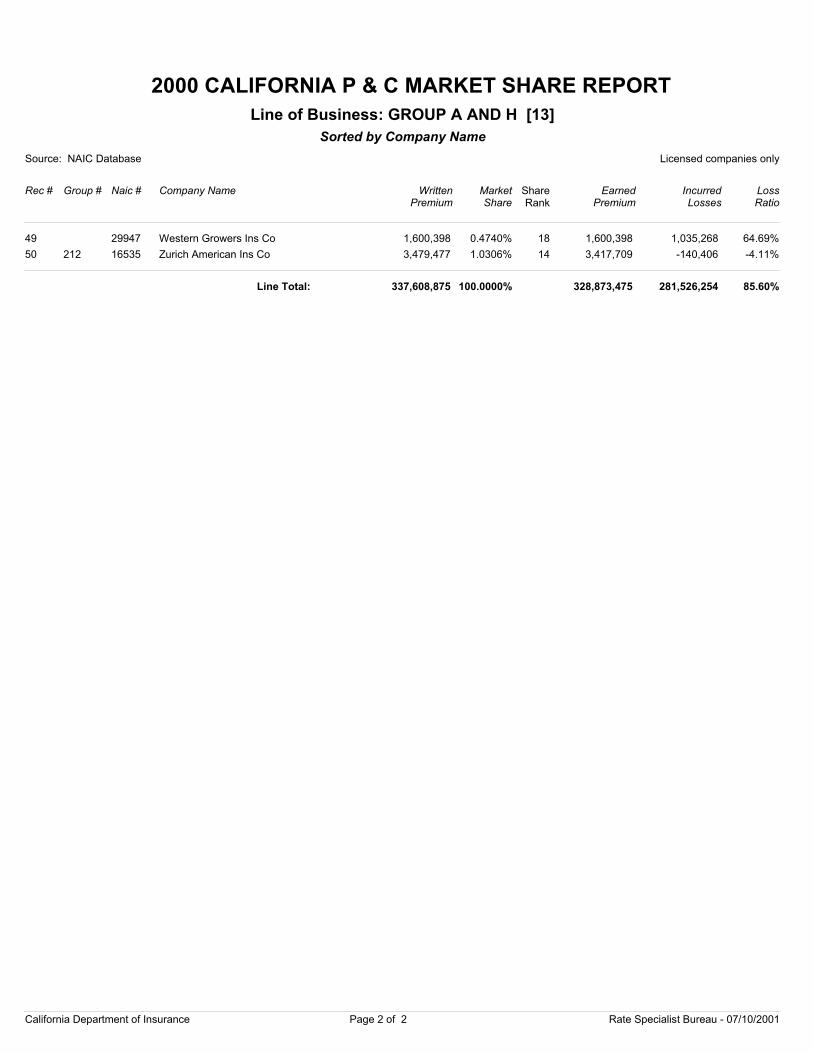
2000 CALIFORNIA P & C MARKET SHARE REPORT
Source: NAIC Database Licensed companies only
Rec # Group # Naic # Company Name
Sorted by Company Name
WrittenPremium
Market Share
EarnedPremium
IncurredLosses
LossRatio
Line of Business: GROUP A AND H [13]
ShareRank
49 29947 Western Growers Ins Co 1,600,398 0.4740% 1,600,398 1,035,268 64.69%18
50 212 16535 Zurich American Ins Co 3,479,477 1.0306% 3,417,709 -140,406 -4.11%14
337,608,875 100.0000% 328,873,475 281,526,254 85.60%Line Total:
California Department of Insurance Page 2 of 2 Rate Specialist Bureau - 07/10/2001

2000 CALIFORNIA P & C MARKET SHARE REPORT
Source: NAIC Database Licensed companies only
Rec # Group # Naic # Company Name
Sorted by Company Name
WrittenPremium
Market Share
EarnedPremium
IncurredLosses
LossRatio
Line of Business: CREDIT A&H(GRP&IND) [14]
ShareRank
1 8 19232 Allstate Ins Co 1,922,728 1.7775% 1,861,619 1,283,756 68.96%5
2 19 10111 American Bankers Ins Co Of FL 40,068,819 37.0414% 40,397,230 1,865,793 4.62%2
3 19 42978 American Security Ins Co 52,351,443 48.3960% 52,351,443 1,919,698 3.67%1
4 31 34274 Central States Ind Co Of Omaha 11,178,229 10.3337% 11,178,229 3,563,579 31.88%3
5 268 10952 JC Penney Cas Ins Co 70 0.0001% 70 0 0.00%8
6 350 32077 Montgomery Ward Ins Co 193 0.0002% 0 36,952 0.00%7
7 19 42986 Standard Guaranty Ins Co 2,449,975 2.2649% 1,980,048 -247,005 -12.47%4
8 176 25178 State Farm Mut Auto Ins Co 201,535 0.1863% 829,538 542,655 65.42%6
108,172,992 100.0000% 108,598,177 8,965,428 8.26%Line Total:
California Department of Insurance Page 1 of 1 Rate Specialist Bureau - 07/10/2001
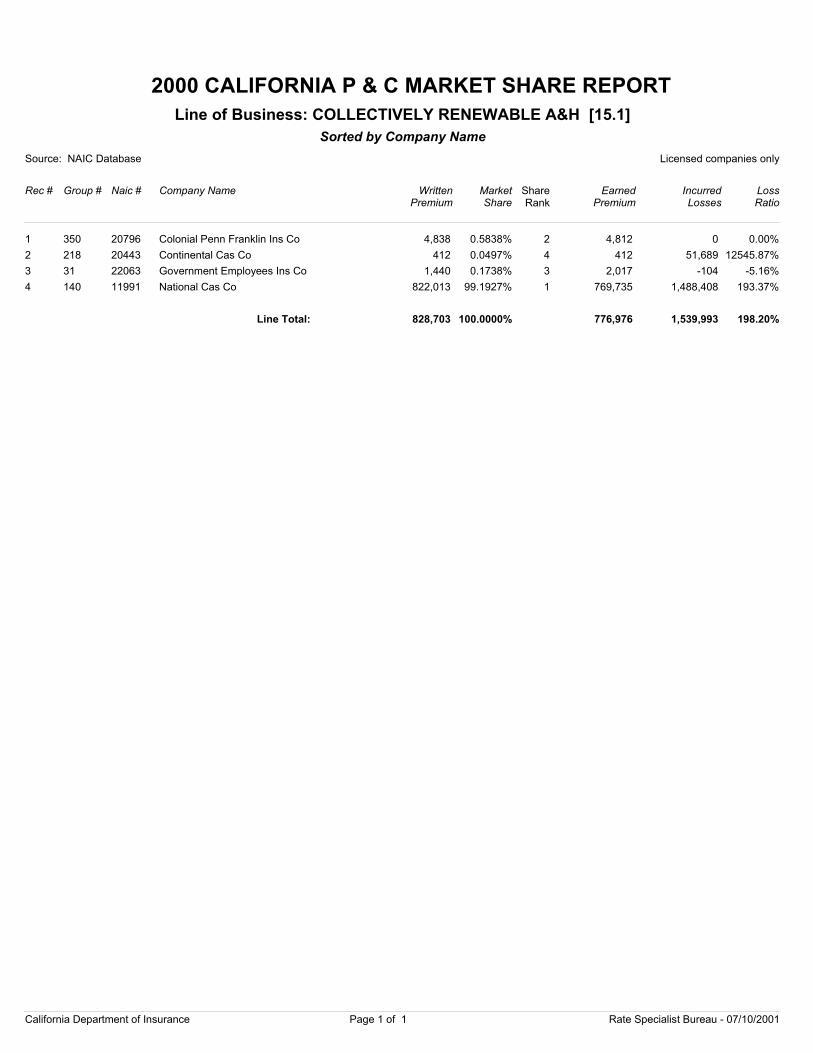
2000 CALIFORNIA P & C MARKET SHARE REPORT
Source: NAIC Database Licensed companies only
Rec # Group # Naic # Company Name
Sorted by Company Name
WrittenPremium
Market Share
EarnedPremium
IncurredLosses
LossRatio
Line of Business: COLLECTIVELY RENEWABLE A&H [15.1]
ShareRank
1 350 20796 Colonial Penn Franklin Ins Co 4,838 0.5838% 4,812 0 0.00%2
2 218 20443 Continental Cas Co 412 0.0497% 412 51,689 12545.87%4
3 31 22063 Government Employees Ins Co 1,440 0.1738% 2,017 -104 -5.16%3
4 140 11991 National Cas Co 822,013 99.1927% 769,735 1,488,408 193.37%1
828,703 100.0000% 776,976 1,539,993 198.20%Line Total:
California Department of Insurance Page 1 of 1 Rate Specialist Bureau - 07/10/2001
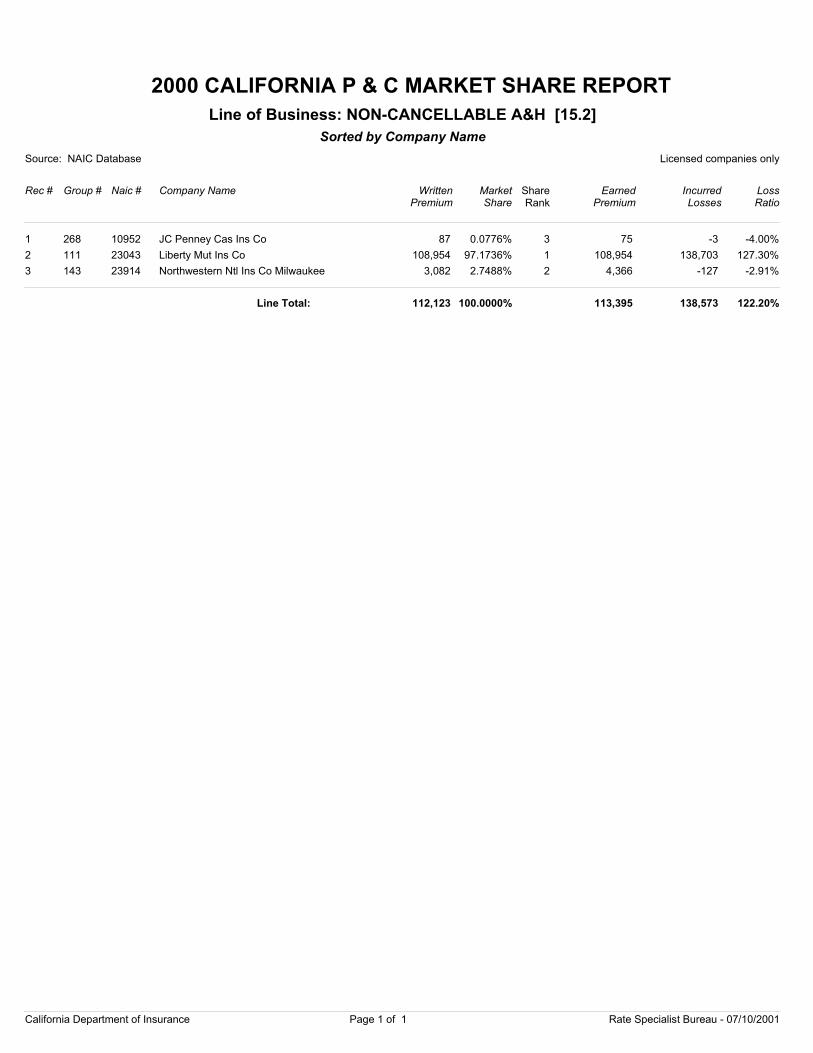
2000 CALIFORNIA P & C MARKET SHARE REPORT
Source: NAIC Database Licensed companies only
Rec # Group # Naic # Company Name
Sorted by Company Name
WrittenPremium
Market Share
EarnedPremium
IncurredLosses
LossRatio
Line of Business: NON-CANCELLABLE A&H [15.2]
ShareRank
1 268 10952 JC Penney Cas Ins Co 87 0.0776% 75 -3 -4.00%3
2 111 23043 Liberty Mut Ins Co 108,954 97.1736% 108,954 138,703 127.30%1
3 143 23914 Northwestern Ntl Ins Co Milwaukee 3,082 2.7488% 4,366 -127 -2.91%2
112,123 100.0000% 113,395 138,573 122.20%Line Total:
California Department of Insurance Page 1 of 1 Rate Specialist Bureau - 07/10/2001
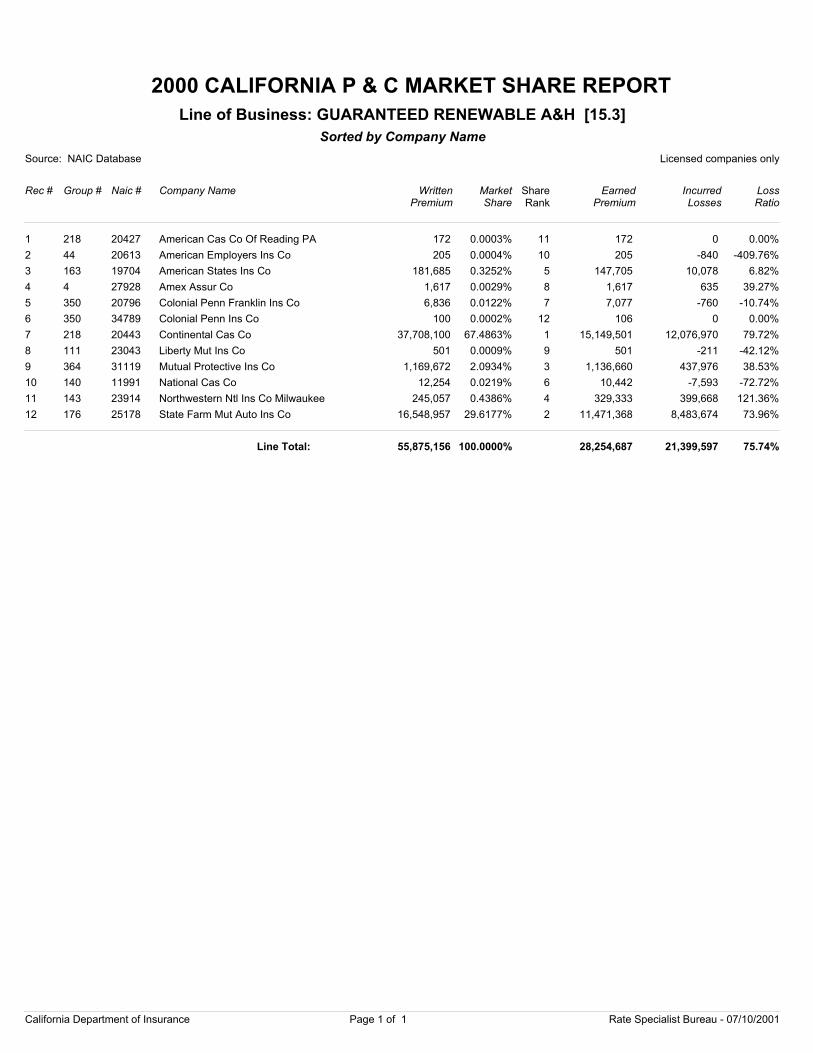
2000 CALIFORNIA P & C MARKET SHARE REPORT
Source: NAIC Database Licensed companies only
Rec # Group # Naic # Company Name
Sorted by Company Name
WrittenPremium
Market Share
EarnedPremium
IncurredLosses
LossRatio
Line of Business: GUARANTEED RENEWABLE A&H [15.3]
ShareRank
1 218 20427 American Cas Co Of Reading PA 172 0.0003% 172 0 0.00%11
2 44 20613 American Employers Ins Co 205 0.0004% 205 -840 -409.76%10
3 163 19704 American States Ins Co 181,685 0.3252% 147,705 10,078 6.82%5
4 4 27928 Amex Assur Co 1,617 0.0029% 1,617 635 39.27%8
5 350 20796 Colonial Penn Franklin Ins Co 6,836 0.0122% 7,077 -760 -10.74%7
6 350 34789 Colonial Penn Ins Co 100 0.0002% 106 0 0.00%12
7 218 20443 Continental Cas Co 37,708,100 67.4863% 15,149,501 12,076,970 79.72%1
8 111 23043 Liberty Mut Ins Co 501 0.0009% 501 -211 -42.12%9
9 364 31119 Mutual Protective Ins Co 1,169,672 2.0934% 1,136,660 437,976 38.53%3
10 140 11991 National Cas Co 12,254 0.0219% 10,442 -7,593 -72.72%6
11 143 23914 Northwestern Ntl Ins Co Milwaukee 245,057 0.4386% 329,333 399,668 121.36%4
12 176 25178 State Farm Mut Auto Ins Co 16,548,957 29.6177% 11,471,368 8,483,674 73.96%2
55,875,156 100.0000% 28,254,687 21,399,597 75.74%Line Total:
California Department of Insurance Page 1 of 1 Rate Specialist Bureau - 07/10/2001
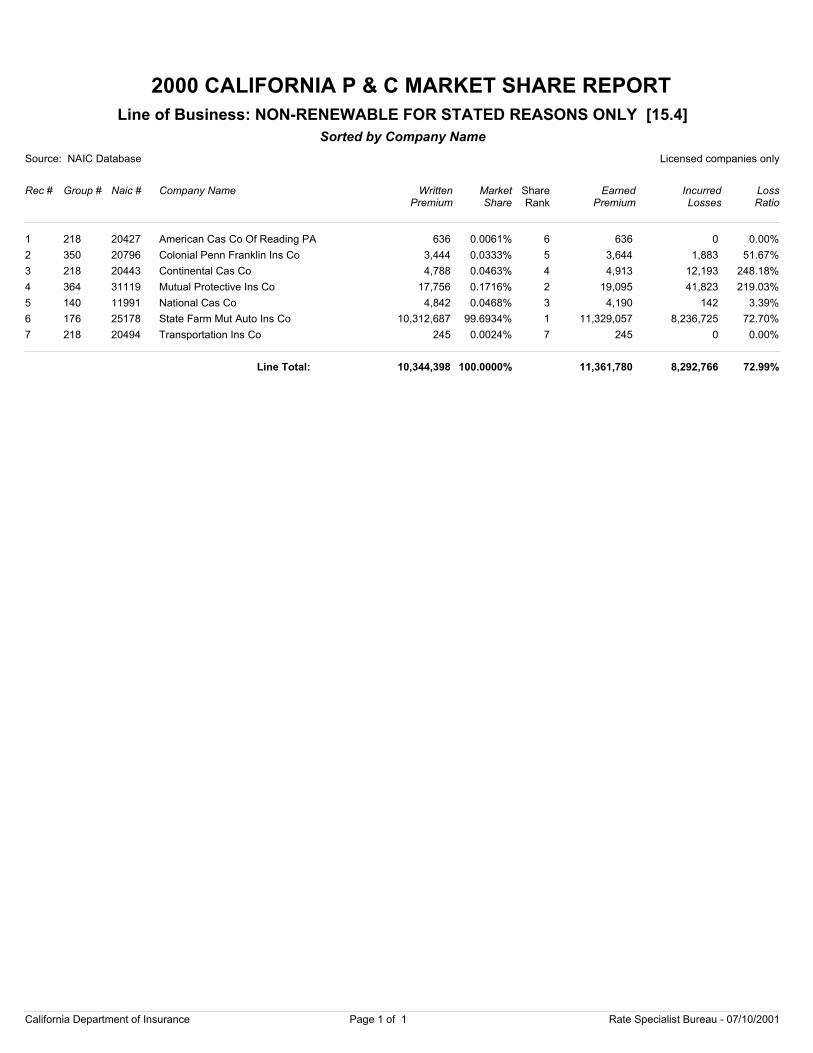
2000 CALIFORNIA P & C MARKET SHARE REPORT
Source: NAIC Database Licensed companies only
Rec # Group # Naic # Company Name
Sorted by Company Name
WrittenPremium
Market Share
EarnedPremium
IncurredLosses
LossRatio
Line of Business: NON-RENEWABLE FOR STATED REASONS ONLY [15.4]
ShareRank
1 218 20427 American Cas Co Of Reading PA 636 0.0061% 636 0 0.00%6
2 350 20796 Colonial Penn Franklin Ins Co 3,444 0.0333% 3,644 1,883 51.67%5
3 218 20443 Continental Cas Co 4,788 0.0463% 4,913 12,193 248.18%4
4 364 31119 Mutual Protective Ins Co 17,756 0.1716% 19,095 41,823 219.03%2
5 140 11991 National Cas Co 4,842 0.0468% 4,190 142 3.39%3
6 176 25178 State Farm Mut Auto Ins Co 10,312,687 99.6934% 11,329,057 8,236,725 72.70%1
7 218 20494 Transportation Ins Co 245 0.0024% 245 0 0.00%7
10,344,398 100.0000% 11,361,780 8,292,766 72.99%Line Total:
California Department of Insurance Page 1 of 1 Rate Specialist Bureau - 07/10/2001
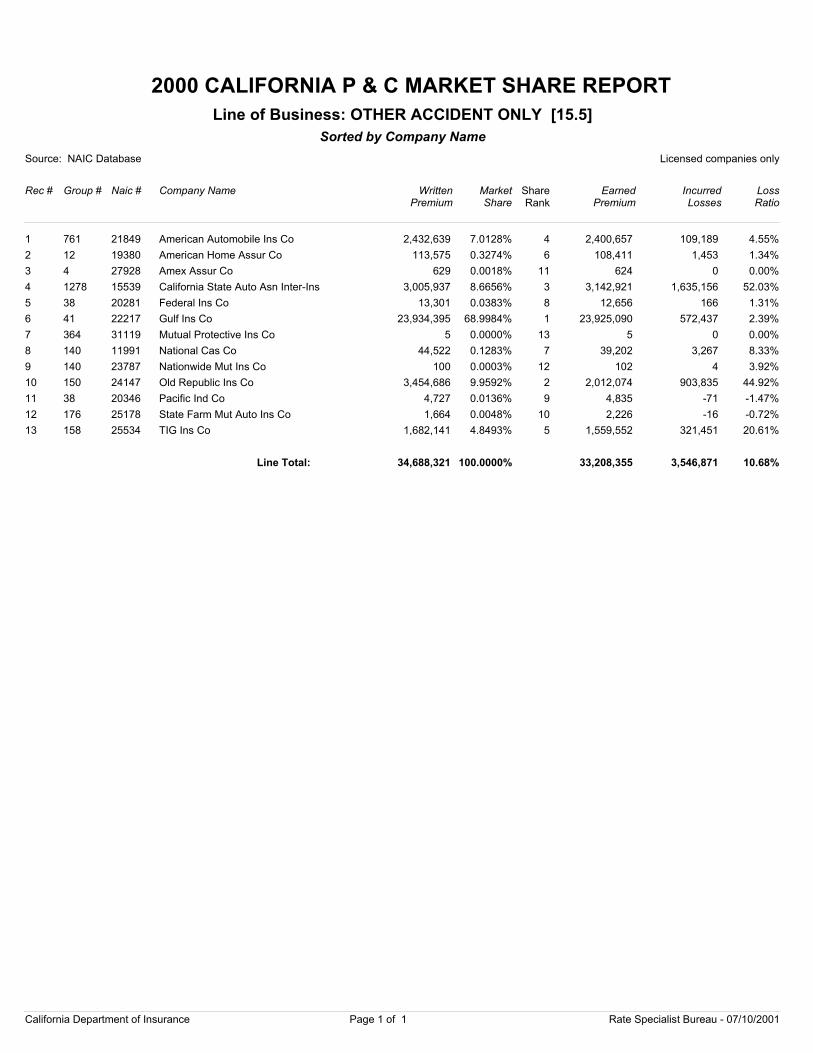
2000 CALIFORNIA P & C MARKET SHARE REPORT
Source: NAIC Database Licensed companies only
Rec # Group # Naic # Company Name
Sorted by Company Name
WrittenPremium
Market Share
EarnedPremium
IncurredLosses
LossRatio
Line of Business: OTHER ACCIDENT ONLY [15.5]
ShareRank
1 761 21849 American Automobile Ins Co 2,432,639 7.0128% 2,400,657 109,189 4.55%4
2 12 19380 American Home Assur Co 113,575 0.3274% 108,411 1,453 1.34%6
3 4 27928 Amex Assur Co 629 0.0018% 624 0 0.00%11
4 1278 15539 California State Auto Asn Inter-Ins 3,005,937 8.6656% 3,142,921 1,635,156 52.03%3
5 38 20281 Federal Ins Co 13,301 0.0383% 12,656 166 1.31%8
6 41 22217 Gulf Ins Co 23,934,395 68.9984% 23,925,090 572,437 2.39%1
7 364 31119 Mutual Protective Ins Co 5 0.0000% 5 0 0.00%13
8 140 11991 National Cas Co 44,522 0.1283% 39,202 3,267 8.33%7
9 140 23787 Nationwide Mut Ins Co 100 0.0003% 102 4 3.92%12
10 150 24147 Old Republic Ins Co 3,454,686 9.9592% 2,012,074 903,835 44.92%2
11 38 20346 Pacific Ind Co 4,727 0.0136% 4,835 -71 -1.47%9
12 176 25178 State Farm Mut Auto Ins Co 1,664 0.0048% 2,226 -16 -0.72%10
13 158 25534 TIG Ins Co 1,682,141 4.8493% 1,559,552 321,451 20.61%5
34,688,321 100.0000% 33,208,355 3,546,871 10.68%Line Total:
California Department of Insurance Page 1 of 1 Rate Specialist Bureau - 07/10/2001
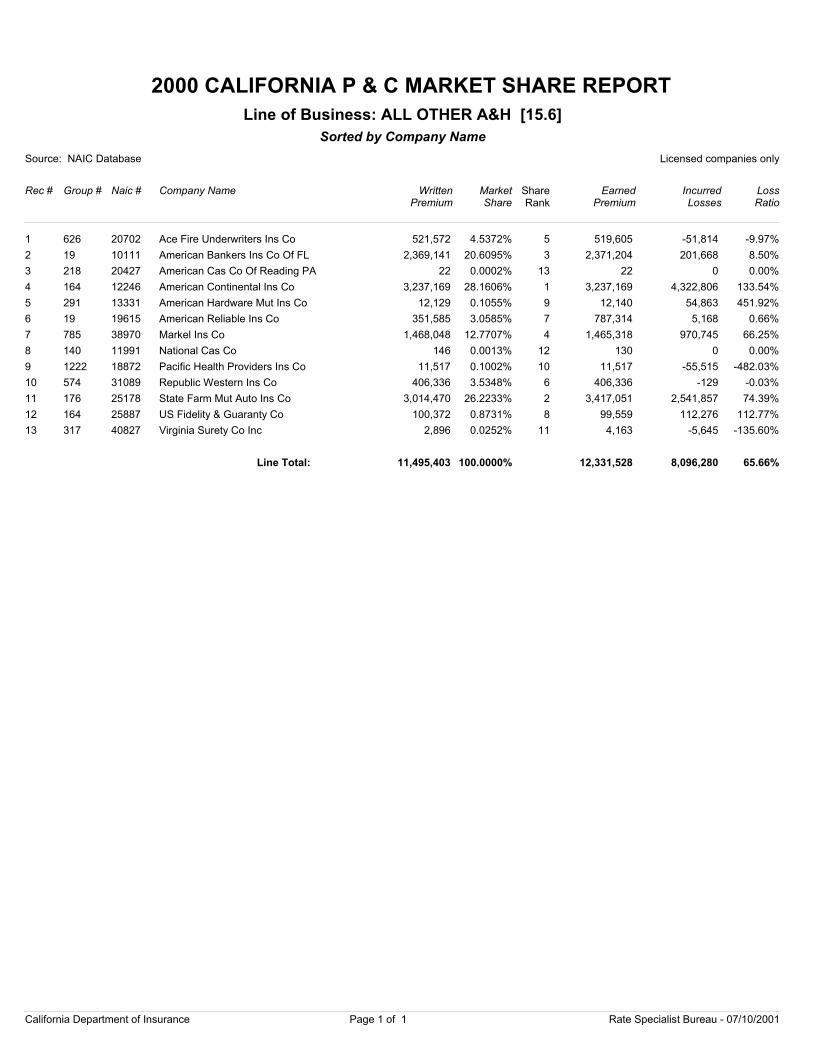
2000 CALIFORNIA P & C MARKET SHARE REPORT
Source: NAIC Database Licensed companies only
Rec # Group # Naic # Company Name
Sorted by Company Name
WrittenPremium
Market Share
EarnedPremium
IncurredLosses
LossRatio
Line of Business: ALL OTHER A&H [15.6]
ShareRank
1 626 20702 Ace Fire Underwriters Ins Co 521,572 4.5372% 519,605 -51,814 -9.97%5
2 19 10111 American Bankers Ins Co Of FL 2,369,141 20.6095% 2,371,204 201,668 8.50%3
3 218 20427 American Cas Co Of Reading PA 22 0.0002% 22 0 0.00%13
4 164 12246 American Continental Ins Co 3,237,169 28.1606% 3,237,169 4,322,806 133.54%1
5 291 13331 American Hardware Mut Ins Co 12,129 0.1055% 12,140 54,863 451.92%9
6 19 19615 American Reliable Ins Co 351,585 3.0585% 787,314 5,168 0.66%7
7 785 38970 Markel Ins Co 1,468,048 12.7707% 1,465,318 970,745 66.25%4
8 140 11991 National Cas Co 146 0.0013% 130 0 0.00%12
9 1222 18872 Pacific Health Providers Ins Co 11,517 0.1002% 11,517 -55,515 -482.03%10
10 574 31089 Republic Western Ins Co 406,336 3.5348% 406,336 -129 -0.03%6
11 176 25178 State Farm Mut Auto Ins Co 3,014,470 26.2233% 3,417,051 2,541,857 74.39%2
12 164 25887 US Fidelity & Guaranty Co 100,372 0.8731% 99,559 112,276 112.77%8
13 317 40827 Virginia Surety Co Inc 2,896 0.0252% 4,163 -5,645 -135.60%11
11,495,403 100.0000% 12,331,528 8,096,280 65.66%Line Total:
California Department of Insurance Page 1 of 1 Rate Specialist Bureau - 07/10/2001
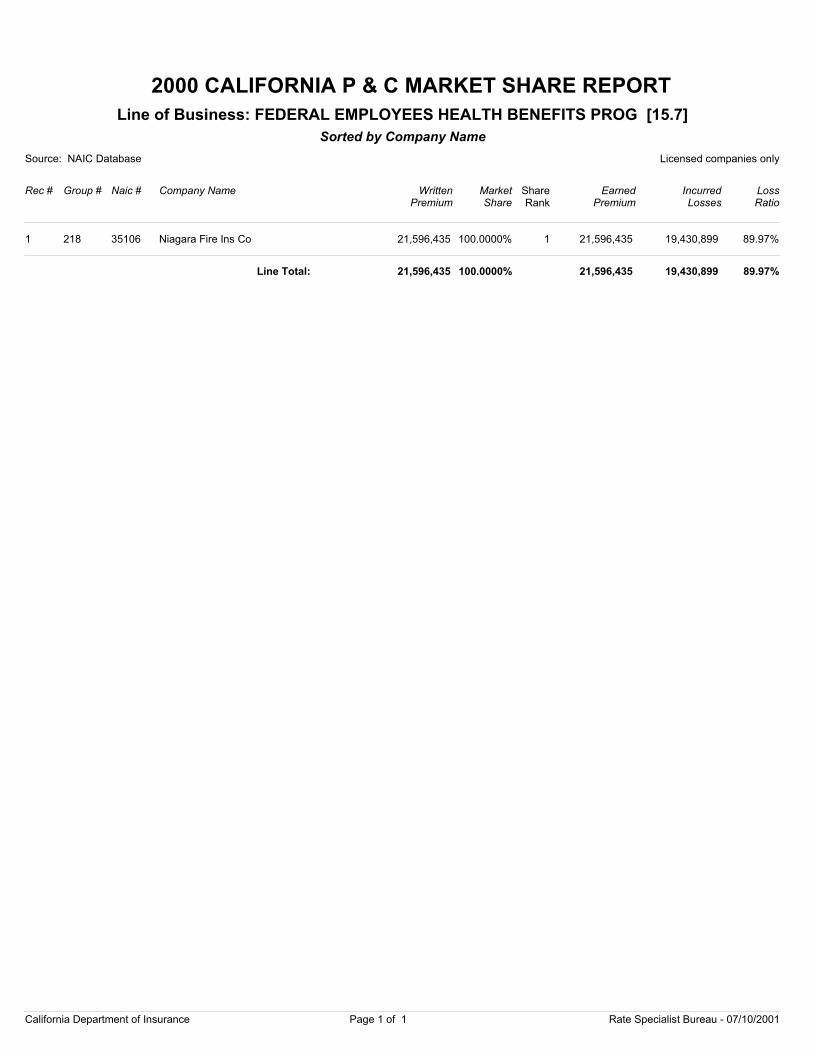
2000 CALIFORNIA P & C MARKET SHARE REPORT
Source: NAIC Database Licensed companies only
Rec # Group # Naic # Company Name
Sorted by Company Name
WrittenPremium
Market Share
EarnedPremium
IncurredLosses
LossRatio
Line of Business: FEDERAL EMPLOYEES HEALTH BENEFITS PROG [15.7]
ShareRank
1 218 35106 Niagara Fire Ins Co 21,596,435 100.0000% 21,596,435 19,430,899 89.97%1
21,596,435 100.0000% 21,596,435 19,430,899 89.97%Line Total:
California Department of Insurance Page 1 of 1 Rate Specialist Bureau - 07/10/2001
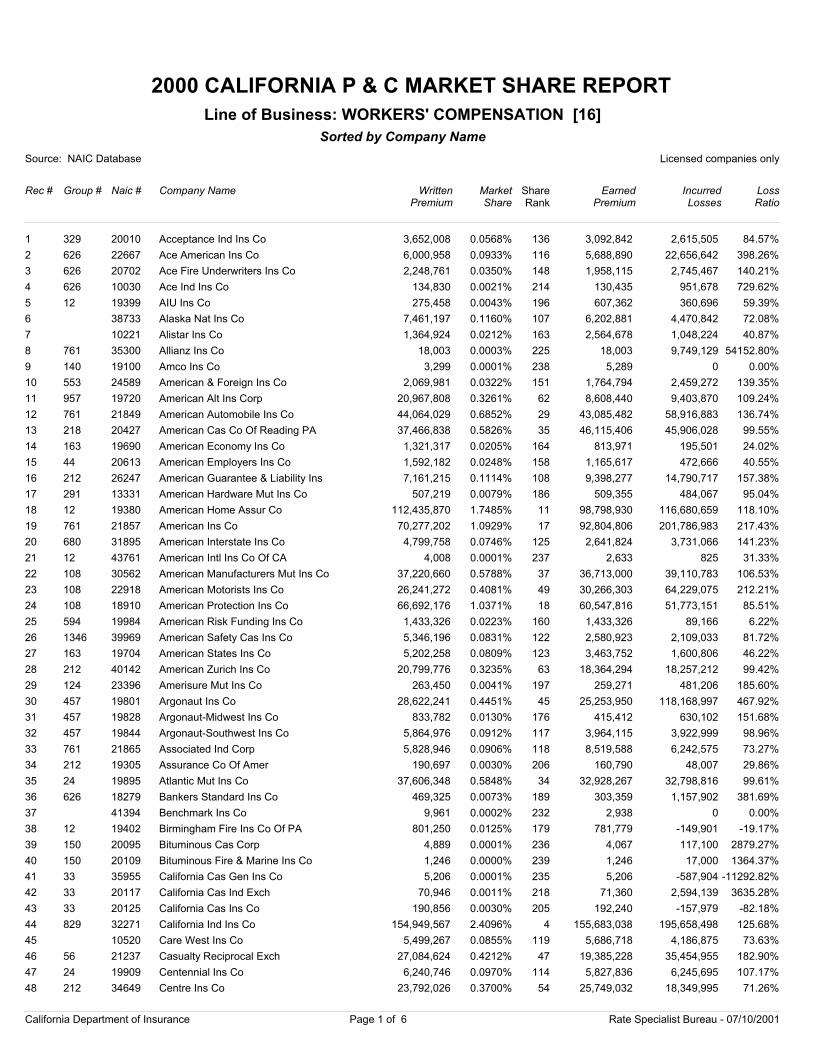
2000 CALIFORNIA P & C MARKET SHARE REPORT
Source: NAIC Database Licensed companies only
Rec # Group # Naic # Company Name
Sorted by Company Name
WrittenPremium
Market Share
EarnedPremium
IncurredLosses
LossRatio
Line of Business: WORKERS' COMPENSATION [16]
ShareRank
1 329 20010 Acceptance Ind Ins Co 3,652,008 0.0568% 3,092,842 2,615,505 84.57%136
2 626 22667 Ace American Ins Co 6,000,958 0.0933% 5,688,890 22,656,642 398.26%116
3 626 20702 Ace Fire Underwriters Ins Co 2,248,761 0.0350% 1,958,115 2,745,467 140.21%148
4 626 10030 Ace Ind Ins Co 134,830 0.0021% 130,435 951,678 729.62%214
5 12 19399 AIU Ins Co 275,458 0.0043% 607,362 360,696 59.39%196
6 38733 Alaska Nat Ins Co 7,461,197 0.1160% 6,202,881 4,470,842 72.08%107
7 10221 Alistar Ins Co 1,364,924 0.0212% 2,564,678 1,048,224 40.87%163
8 761 35300 Allianz Ins Co 18,003 0.0003% 18,003 9,749,129 54152.80%225
9 140 19100 Amco Ins Co 3,299 0.0001% 5,289 0 0.00%238
10 553 24589 American & Foreign Ins Co 2,069,981 0.0322% 1,764,794 2,459,272 139.35%151
11 957 19720 American Alt Ins Corp 20,967,808 0.3261% 8,608,440 9,403,870 109.24%62
12 761 21849 American Automobile Ins Co 44,064,029 0.6852% 43,085,482 58,916,883 136.74%29
13 218 20427 American Cas Co Of Reading PA 37,466,838 0.5826% 46,115,406 45,906,028 99.55%35
14 163 19690 American Economy Ins Co 1,321,317 0.0205% 813,971 195,501 24.02%164
15 44 20613 American Employers Ins Co 1,592,182 0.0248% 1,165,617 472,666 40.55%158
16 212 26247 American Guarantee & Liability Ins 7,161,215 0.1114% 9,398,277 14,790,717 157.38%108
17 291 13331 American Hardware Mut Ins Co 507,219 0.0079% 509,355 484,067 95.04%186
18 12 19380 American Home Assur Co 112,435,870 1.7485% 98,798,930 116,680,659 118.10%11
19 761 21857 American Ins Co 70,277,202 1.0929% 92,804,806 201,786,983 217.43%17
20 680 31895 American Interstate Ins Co 4,799,758 0.0746% 2,641,824 3,731,066 141.23%125
21 12 43761 American Intl Ins Co Of CA 4,008 0.0001% 2,633 825 31.33%237
22 108 30562 American Manufacturers Mut Ins Co 37,220,660 0.5788% 36,713,000 39,110,783 106.53%37
23 108 22918 American Motorists Ins Co 26,241,272 0.4081% 30,266,303 64,229,075 212.21%49
24 108 18910 American Protection Ins Co 66,692,176 1.0371% 60,547,816 51,773,151 85.51%18
25 594 19984 American Risk Funding Ins Co 1,433,326 0.0223% 1,433,326 89,166 6.22%160
26 1346 39969 American Safety Cas Ins Co 5,346,196 0.0831% 2,580,923 2,109,033 81.72%122
27 163 19704 American States Ins Co 5,202,258 0.0809% 3,463,752 1,600,806 46.22%123
28 212 40142 American Zurich Ins Co 20,799,776 0.3235% 18,364,294 18,257,212 99.42%63
29 124 23396 Amerisure Mut Ins Co 263,450 0.0041% 259,271 481,206 185.60%197
30 457 19801 Argonaut Ins Co 28,622,241 0.4451% 25,253,950 118,168,997 467.92%45
31 457 19828 Argonaut-Midwest Ins Co 833,782 0.0130% 415,412 630,102 151.68%176
32 457 19844 Argonaut-Southwest Ins Co 5,864,976 0.0912% 3,964,115 3,922,999 98.96%117
33 761 21865 Associated Ind Corp 5,828,946 0.0906% 8,519,588 6,242,575 73.27%118
34 212 19305 Assurance Co Of Amer 190,697 0.0030% 160,790 48,007 29.86%206
35 24 19895 Atlantic Mut Ins Co 37,606,348 0.5848% 32,928,267 32,798,816 99.61%34
36 626 18279 Bankers Standard Ins Co 469,325 0.0073% 303,359 1,157,902 381.69%189
37 41394 Benchmark Ins Co 9,961 0.0002% 2,938 0 0.00%232
38 12 19402 Birmingham Fire Ins Co Of PA 801,250 0.0125% 781,779 -149,901 -19.17%179
39 150 20095 Bituminous Cas Corp 4,889 0.0001% 4,067 117,100 2879.27%236
40 150 20109 Bituminous Fire & Marine Ins Co 1,246 0.0000% 1,246 17,000 1364.37%239
41 33 35955 California Cas Gen Ins Co 5,206 0.0001% 5,206 -587,904 -11292.82%235
42 33 20117 California Cas Ind Exch 70,946 0.0011% 71,360 2,594,139 3635.28%218
43 33 20125 California Cas Ins Co 190,856 0.0030% 192,240 -157,979 -82.18%205
44 829 32271 California Ind Ins Co 154,949,567 2.4096% 155,683,038 195,658,498 125.68%4
45 10520 Care West Ins Co 5,499,267 0.0855% 5,686,718 4,186,875 73.63%119
46 56 21237 Casualty Reciprocal Exch 27,084,624 0.4212% 19,385,228 35,454,955 182.90%47
47 24 19909 Centennial Ins Co 6,240,746 0.0970% 5,827,836 6,245,695 107.17%114
48 212 34649 Centre Ins Co 23,792,026 0.3700% 25,749,032 18,349,995 71.26%54
California Department of Insurance Page 1 of 6 Rate Specialist Bureau - 07/10/2001
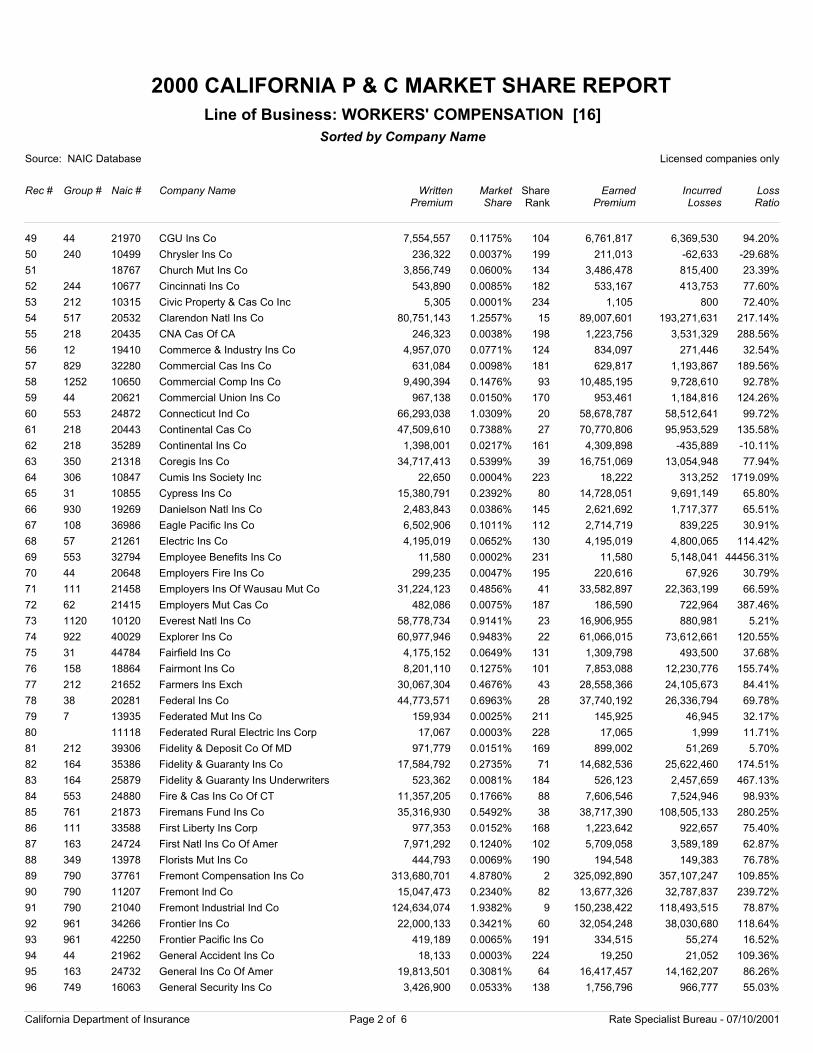
2000 CALIFORNIA P & C MARKET SHARE REPORT
Source: NAIC Database Licensed companies only
Rec # Group # Naic # Company Name
Sorted by Company Name
WrittenPremium
Market Share
EarnedPremium
IncurredLosses
LossRatio
Line of Business: WORKERS' COMPENSATION [16]
ShareRank
49 44 21970 CGU Ins Co 7,554,557 0.1175% 6,761,817 6,369,530 94.20%104
50 240 10499 Chrysler Ins Co 236,322 0.0037% 211,013 -62,633 -29.68%199
51 18767 Church Mut Ins Co 3,856,749 0.0600% 3,486,478 815,400 23.39%134
52 244 10677 Cincinnati Ins Co 543,890 0.0085% 533,167 413,753 77.60%182
53 212 10315 Civic Property & Cas Co Inc 5,305 0.0001% 1,105 800 72.40%234
54 517 20532 Clarendon Natl Ins Co 80,751,143 1.2557% 89,007,601 193,271,631 217.14%15
55 218 20435 CNA Cas Of CA 246,323 0.0038% 1,223,756 3,531,329 288.56%198
56 12 19410 Commerce & Industry Ins Co 4,957,070 0.0771% 834,097 271,446 32.54%124
57 829 32280 Commercial Cas Ins Co 631,084 0.0098% 629,817 1,193,867 189.56%181
58 1252 10650 Commercial Comp Ins Co 9,490,394 0.1476% 10,485,195 9,728,610 92.78%93
59 44 20621 Commercial Union Ins Co 967,138 0.0150% 953,461 1,184,816 124.26%170
60 553 24872 Connecticut Ind Co 66,293,038 1.0309% 58,678,787 58,512,641 99.72%20
61 218 20443 Continental Cas Co 47,509,610 0.7388% 70,770,806 95,953,529 135.58%27
62 218 35289 Continental Ins Co 1,398,001 0.0217% 4,309,898 -435,889 -10.11%161
63 350 21318 Coregis Ins Co 34,717,413 0.5399% 16,751,069 13,054,948 77.94%39
64 306 10847 Cumis Ins Society Inc 22,650 0.0004% 18,222 313,252 1719.09%223
65 31 10855 Cypress Ins Co 15,380,791 0.2392% 14,728,051 9,691,149 65.80%80
66 930 19269 Danielson Natl Ins Co 2,483,843 0.0386% 2,621,692 1,717,377 65.51%145
67 108 36986 Eagle Pacific Ins Co 6,502,906 0.1011% 2,714,719 839,225 30.91%112
68 57 21261 Electric Ins Co 4,195,019 0.0652% 4,195,019 4,800,065 114.42%130
69 553 32794 Employee Benefits Ins Co 11,580 0.0002% 11,580 5,148,041 44456.31%231
70 44 20648 Employers Fire Ins Co 299,235 0.0047% 220,616 67,926 30.79%195
71 111 21458 Employers Ins Of Wausau Mut Co 31,224,123 0.4856% 33,582,897 22,363,199 66.59%41
72 62 21415 Employers Mut Cas Co 482,086 0.0075% 186,590 722,964 387.46%187
73 1120 10120 Everest Natl Ins Co 58,778,734 0.9141% 16,906,955 880,981 5.21%23
74 922 40029 Explorer Ins Co 60,977,946 0.9483% 61,066,015 73,612,661 120.55%22
75 31 44784 Fairfield Ins Co 4,175,152 0.0649% 1,309,798 493,500 37.68%131
76 158 18864 Fairmont Ins Co 8,201,110 0.1275% 7,853,088 12,230,776 155.74%101
77 212 21652 Farmers Ins Exch 30,067,304 0.4676% 28,558,366 24,105,673 84.41%43
78 38 20281 Federal Ins Co 44,773,571 0.6963% 37,740,192 26,336,794 69.78%28
79 7 13935 Federated Mut Ins Co 159,934 0.0025% 145,925 46,945 32.17%211
80 11118 Federated Rural Electric Ins Corp 17,067 0.0003% 17,065 1,999 11.71%228
81 212 39306 Fidelity & Deposit Co Of MD 971,779 0.0151% 899,002 51,269 5.70%169
82 164 35386 Fidelity & Guaranty Ins Co 17,584,792 0.2735% 14,682,536 25,622,460 174.51%71
83 164 25879 Fidelity & Guaranty Ins Underwriters 523,362 0.0081% 526,123 2,457,659 467.13%184
84 553 24880 Fire & Cas Ins Co Of CT 11,357,205 0.1766% 7,606,546 7,524,946 98.93%88
85 761 21873 Firemans Fund Ins Co 35,316,930 0.5492% 38,717,390 108,505,133 280.25%38
86 111 33588 First Liberty Ins Corp 977,353 0.0152% 1,223,642 922,657 75.40%168
87 163 24724 First Natl Ins Co Of Amer 7,971,292 0.1240% 5,709,058 3,589,189 62.87%102
88 349 13978 Florists Mut Ins Co 444,793 0.0069% 194,548 149,383 76.78%190
89 790 37761 Fremont Compensation Ins Co 313,680,701 4.8780% 325,092,890 357,107,247 109.85%2
90 790 11207 Fremont Ind Co 15,047,473 0.2340% 13,677,326 32,787,837 239.72%82
91 790 21040 Fremont Industrial Ind Co 124,634,074 1.9382% 150,238,422 118,493,515 78.87%9
92 961 34266 Frontier Ins Co 22,000,133 0.3421% 32,054,248 38,030,680 118.64%60
93 961 42250 Frontier Pacific Ins Co 419,189 0.0065% 334,515 55,274 16.52%191
94 44 21962 General Accident Ins Co 18,133 0.0003% 19,250 21,052 109.36%224
95 163 24732 General Ins Co Of Amer 19,813,501 0.3081% 16,417,457 14,162,207 86.26%64
96 749 16063 General Security Ins Co 3,426,900 0.0533% 1,756,796 966,777 55.03%138
California Department of Insurance Page 2 of 6 Rate Specialist Bureau - 07/10/2001
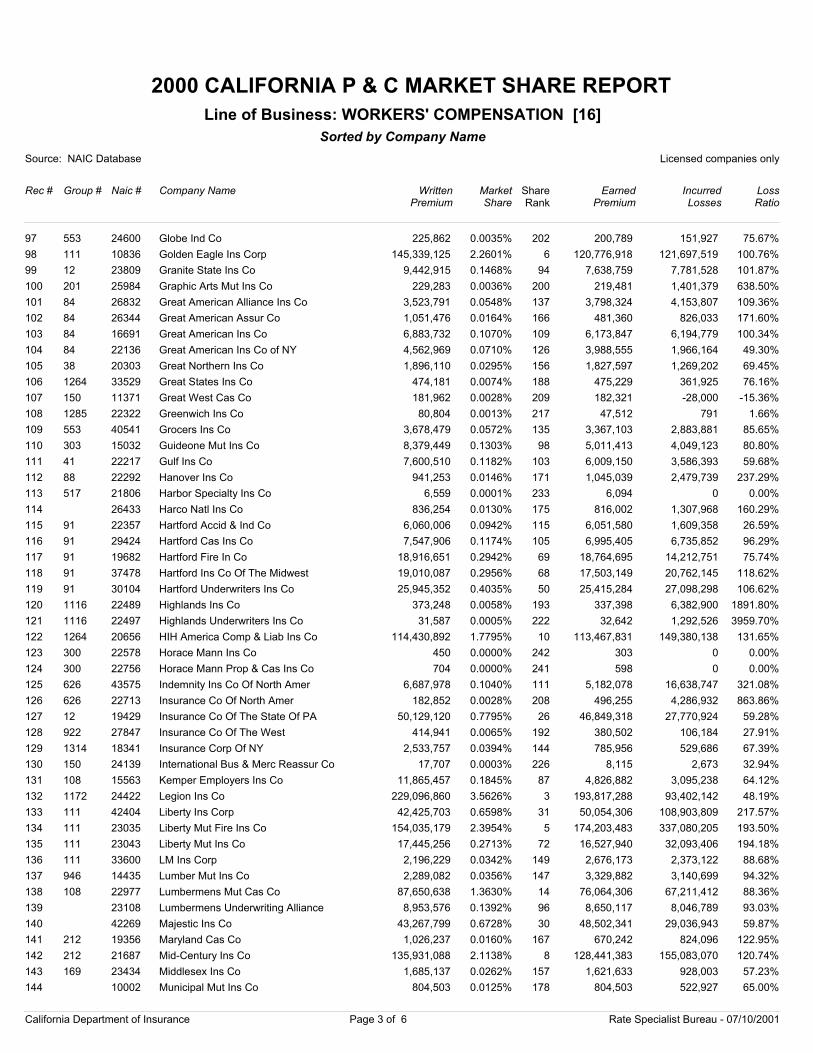
2000 CALIFORNIA P & C MARKET SHARE REPORT
Source: NAIC Database Licensed companies only
Rec # Group # Naic # Company Name
Sorted by Company Name
WrittenPremium
Market Share
EarnedPremium
IncurredLosses
LossRatio
Line of Business: WORKERS' COMPENSATION [16]
ShareRank
97 553 24600 Globe Ind Co 225,862 0.0035% 200,789 151,927 75.67%202
98 111 10836 Golden Eagle Ins Corp 145,339,125 2.2601% 120,776,918 121,697,519 100.76%6
99 12 23809 Granite State Ins Co 9,442,915 0.1468% 7,638,759 7,781,528 101.87%94
100 201 25984 Graphic Arts Mut Ins Co 229,283 0.0036% 219,481 1,401,379 638.50%200
101 84 26832 Great American Alliance Ins Co 3,523,791 0.0548% 3,798,324 4,153,807 109.36%137
102 84 26344 Great American Assur Co 1,051,476 0.0164% 481,360 826,033 171.60%166
103 84 16691 Great American Ins Co 6,883,732 0.1070% 6,173,847 6,194,779 100.34%109
104 84 22136 Great American Ins Co of NY 4,562,969 0.0710% 3,988,555 1,966,164 49.30%126
105 38 20303 Great Northern Ins Co 1,896,110 0.0295% 1,827,597 1,269,202 69.45%156
106 1264 33529 Great States Ins Co 474,181 0.0074% 475,229 361,925 76.16%188
107 150 11371 Great West Cas Co 181,962 0.0028% 182,321 -28,000 -15.36%209
108 1285 22322 Greenwich Ins Co 80,804 0.0013% 47,512 791 1.66%217
109 553 40541 Grocers Ins Co 3,678,479 0.0572% 3,367,103 2,883,881 85.65%135
110 303 15032 Guideone Mut Ins Co 8,379,449 0.1303% 5,011,413 4,049,123 80.80%98
111 41 22217 Gulf Ins Co 7,600,510 0.1182% 6,009,150 3,586,393 59.68%103
112 88 22292 Hanover Ins Co 941,253 0.0146% 1,045,039 2,479,739 237.29%171
113 517 21806 Harbor Specialty Ins Co 6,559 0.0001% 6,094 0 0.00%233
114 26433 Harco Natl Ins Co 836,254 0.0130% 816,002 1,307,968 160.29%175
115 91 22357 Hartford Accid & Ind Co 6,060,006 0.0942% 6,051,580 1,609,358 26.59%115
116 91 29424 Hartford Cas Ins Co 7,547,906 0.1174% 6,995,405 6,735,852 96.29%105
117 91 19682 Hartford Fire In Co 18,916,651 0.2942% 18,764,695 14,212,751 75.74%69
118 91 37478 Hartford Ins Co Of The Midwest 19,010,087 0.2956% 17,503,149 20,762,145 118.62%68
119 91 30104 Hartford Underwriters Ins Co 25,945,352 0.4035% 25,415,284 27,098,298 106.62%50
120 1116 22489 Highlands Ins Co 373,248 0.0058% 337,398 6,382,900 1891.80%193
121 1116 22497 Highlands Underwriters Ins Co 31,587 0.0005% 32,642 1,292,526 3959.70%222
122 1264 20656 HIH America Comp & Liab Ins Co 114,430,892 1.7795% 113,467,831 149,380,138 131.65%10
123 300 22578 Horace Mann Ins Co 450 0.0000% 303 0 0.00%242
124 300 22756 Horace Mann Prop & Cas Ins Co 704 0.0000% 598 0 0.00%241
125 626 43575 Indemnity Ins Co Of North Amer 6,687,978 0.1040% 5,182,078 16,638,747 321.08%111
126 626 22713 Insurance Co Of North Amer 182,852 0.0028% 496,255 4,286,932 863.86%208
127 12 19429 Insurance Co Of The State Of PA 50,129,120 0.7795% 46,849,318 27,770,924 59.28%26
128 922 27847 Insurance Co Of The West 414,941 0.0065% 380,502 106,184 27.91%192
129 1314 18341 Insurance Corp Of NY 2,533,757 0.0394% 785,956 529,686 67.39%144
130 150 24139 International Bus & Merc Reassur Co 17,707 0.0003% 8,115 2,673 32.94%226
131 108 15563 Kemper Employers Ins Co 11,865,457 0.1845% 4,826,882 3,095,238 64.12%87
132 1172 24422 Legion Ins Co 229,096,860 3.5626% 193,817,288 93,402,142 48.19%3
133 111 42404 Liberty Ins Corp 42,425,703 0.6598% 50,054,306 108,903,809 217.57%31
134 111 23035 Liberty Mut Fire Ins Co 154,035,179 2.3954% 174,203,483 337,080,205 193.50%5
135 111 23043 Liberty Mut Ins Co 17,445,256 0.2713% 16,527,940 32,093,406 194.18%72
136 111 33600 LM Ins Corp 2,196,229 0.0342% 2,676,173 2,373,122 88.68%149
137 946 14435 Lumber Mut Ins Co 2,289,082 0.0356% 3,329,882 3,140,699 94.32%147
138 108 22977 Lumbermens Mut Cas Co 87,650,638 1.3630% 76,064,306 67,211,412 88.36%14
139 23108 Lumbermens Underwriting Alliance 8,953,576 0.1392% 8,650,117 8,046,789 93.03%96
140 42269 Majestic Ins Co 43,267,799 0.6728% 48,502,341 29,036,943 59.87%30
141 212 19356 Maryland Cas Co 1,026,237 0.0160% 670,242 824,096 122.95%167
142 212 21687 Mid-Century Ins Co 135,931,088 2.1138% 128,441,383 155,083,070 120.74%8
143 169 23434 Middlesex Ins Co 1,685,137 0.0262% 1,621,633 928,003 57.23%157
144 10002 Municipal Mut Ins Co 804,503 0.0125% 804,503 522,927 65.00%178
California Department of Insurance Page 3 of 6 Rate Specialist Bureau - 07/10/2001
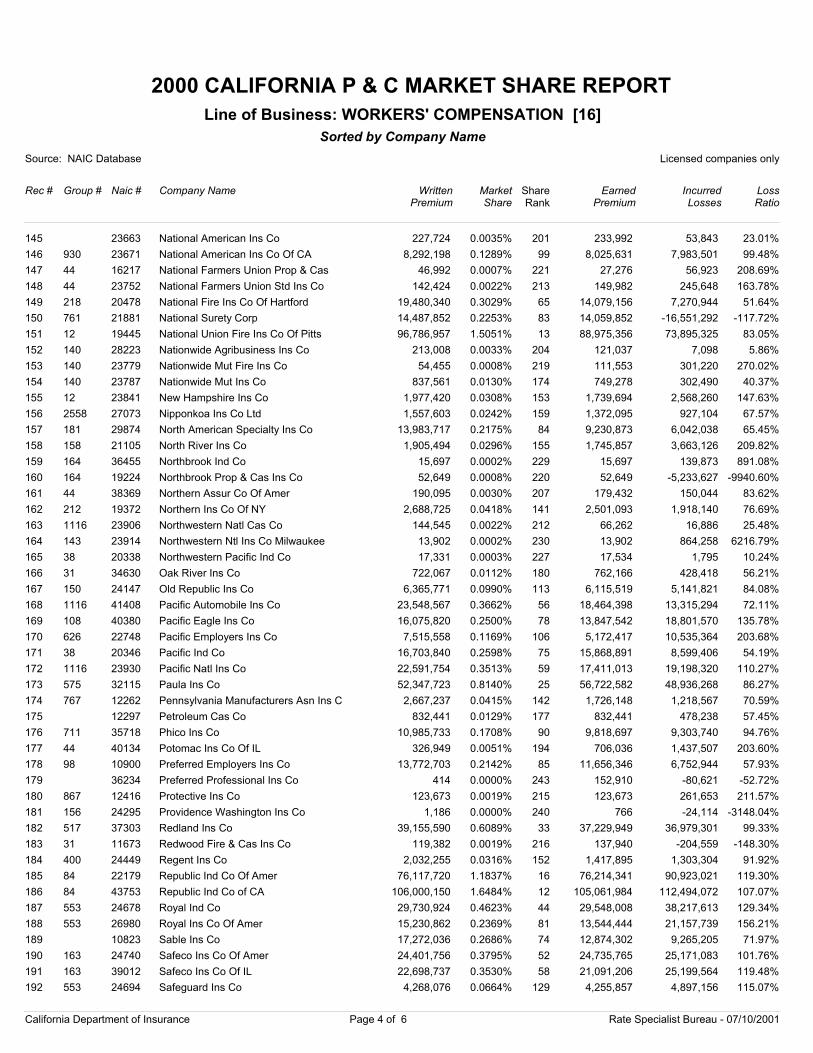
2000 CALIFORNIA P & C MARKET SHARE REPORT
Source: NAIC Database Licensed companies only
Rec # Group # Naic # Company Name
Sorted by Company Name
WrittenPremium
Market Share
EarnedPremium
IncurredLosses
LossRatio
Line of Business: WORKERS' COMPENSATION [16]
ShareRank
145 23663 National American Ins Co 227,724 0.0035% 233,992 53,843 23.01%201
146 930 23671 National American Ins Co Of CA 8,292,198 0.1289% 8,025,631 7,983,501 99.48%99
147 44 16217 National Farmers Union Prop & Cas 46,992 0.0007% 27,276 56,923 208.69%221
148 44 23752 National Farmers Union Std Ins Co 142,424 0.0022% 149,982 245,648 163.78%213
149 218 20478 National Fire Ins Co Of Hartford 19,480,340 0.3029% 14,079,156 7,270,944 51.64%65
150 761 21881 National Surety Corp 14,487,852 0.2253% 14,059,852 -16,551,292 -117.72%83
151 12 19445 National Union Fire Ins Co Of Pitts 96,786,957 1.5051% 88,975,356 73,895,325 83.05%13
152 140 28223 Nationwide Agribusiness Ins Co 213,008 0.0033% 121,037 7,098 5.86%204
153 140 23779 Nationwide Mut Fire Ins Co 54,455 0.0008% 111,553 301,220 270.02%219
154 140 23787 Nationwide Mut Ins Co 837,561 0.0130% 749,278 302,490 40.37%174
155 12 23841 New Hampshire Ins Co 1,977,420 0.0308% 1,739,694 2,568,260 147.63%153
156 2558 27073 Nipponkoa Ins Co Ltd 1,557,603 0.0242% 1,372,095 927,104 67.57%159
157 181 29874 North American Specialty Ins Co 13,983,717 0.2175% 9,230,873 6,042,038 65.45%84
158 158 21105 North River Ins Co 1,905,494 0.0296% 1,745,857 3,663,126 209.82%155
159 164 36455 Northbrook Ind Co 15,697 0.0002% 15,697 139,873 891.08%229
160 164 19224 Northbrook Prop & Cas Ins Co 52,649 0.0008% 52,649 -5,233,627 -9940.60%220
161 44 38369 Northern Assur Co Of Amer 190,095 0.0030% 179,432 150,044 83.62%207
162 212 19372 Northern Ins Co Of NY 2,688,725 0.0418% 2,501,093 1,918,140 76.69%141
163 1116 23906 Northwestern Natl Cas Co 144,545 0.0022% 66,262 16,886 25.48%212
164 143 23914 Northwestern Ntl Ins Co Milwaukee 13,902 0.0002% 13,902 864,258 6216.79%230
165 38 20338 Northwestern Pacific Ind Co 17,331 0.0003% 17,534 1,795 10.24%227
166 31 34630 Oak River Ins Co 722,067 0.0112% 762,166 428,418 56.21%180
167 150 24147 Old Republic Ins Co 6,365,771 0.0990% 6,115,519 5,141,821 84.08%113
168 1116 41408 Pacific Automobile Ins Co 23,548,567 0.3662% 18,464,398 13,315,294 72.11%56
169 108 40380 Pacific Eagle Ins Co 16,075,820 0.2500% 13,847,542 18,801,570 135.78%78
170 626 22748 Pacific Employers Ins Co 7,515,558 0.1169% 5,172,417 10,535,364 203.68%106
171 38 20346 Pacific Ind Co 16,703,840 0.2598% 15,868,891 8,599,406 54.19%75
172 1116 23930 Pacific Natl Ins Co 22,591,754 0.3513% 17,411,013 19,198,320 110.27%59
173 575 32115 Paula Ins Co 52,347,723 0.8140% 56,722,582 48,936,268 86.27%25
174 767 12262 Pennsylvania Manufacturers Asn Ins C 2,667,237 0.0415% 1,726,148 1,218,567 70.59%142
175 12297 Petroleum Cas Co 832,441 0.0129% 832,441 478,238 57.45%177
176 711 35718 Phico Ins Co 10,985,733 0.1708% 9,818,697 9,303,740 94.76%90
177 44 40134 Potomac Ins Co Of IL 326,949 0.0051% 706,036 1,437,507 203.60%194
178 98 10900 Preferred Employers Ins Co 13,772,703 0.2142% 11,656,346 6,752,944 57.93%85
179 36234 Preferred Professional Ins Co 414 0.0000% 152,910 -80,621 -52.72%243
180 867 12416 Protective Ins Co 123,673 0.0019% 123,673 261,653 211.57%215
181 156 24295 Providence Washington Ins Co 1,186 0.0000% 766 -24,114 -3148.04%240
182 517 37303 Redland Ins Co 39,155,590 0.6089% 37,229,949 36,979,301 99.33%33
183 31 11673 Redwood Fire & Cas Ins Co 119,382 0.0019% 137,940 -204,559 -148.30%216
184 400 24449 Regent Ins Co 2,032,255 0.0316% 1,417,895 1,303,304 91.92%152
185 84 22179 Republic Ind Co Of Amer 76,117,720 1.1837% 76,214,341 90,923,021 119.30%16
186 84 43753 Republic Ind Co of CA 106,000,150 1.6484% 105,061,984 112,494,072 107.07%12
187 553 24678 Royal Ind Co 29,730,924 0.4623% 29,548,008 38,217,613 129.34%44
188 553 26980 Royal Ins Co Of Amer 15,230,862 0.2369% 13,544,444 21,157,739 156.21%81
189 10823 Sable Ins Co 17,272,036 0.2686% 12,874,302 9,265,205 71.97%74
190 163 24740 Safeco Ins Co Of Amer 24,401,756 0.3795% 24,735,765 25,171,083 101.76%52
191 163 39012 Safeco Ins Co Of IL 22,698,737 0.3530% 21,091,206 25,199,564 119.48%58
192 553 24694 Safeguard Ins Co 4,268,076 0.0664% 4,255,857 4,897,156 115.07%129
California Department of Insurance Page 4 of 6 Rate Specialist Bureau - 07/10/2001
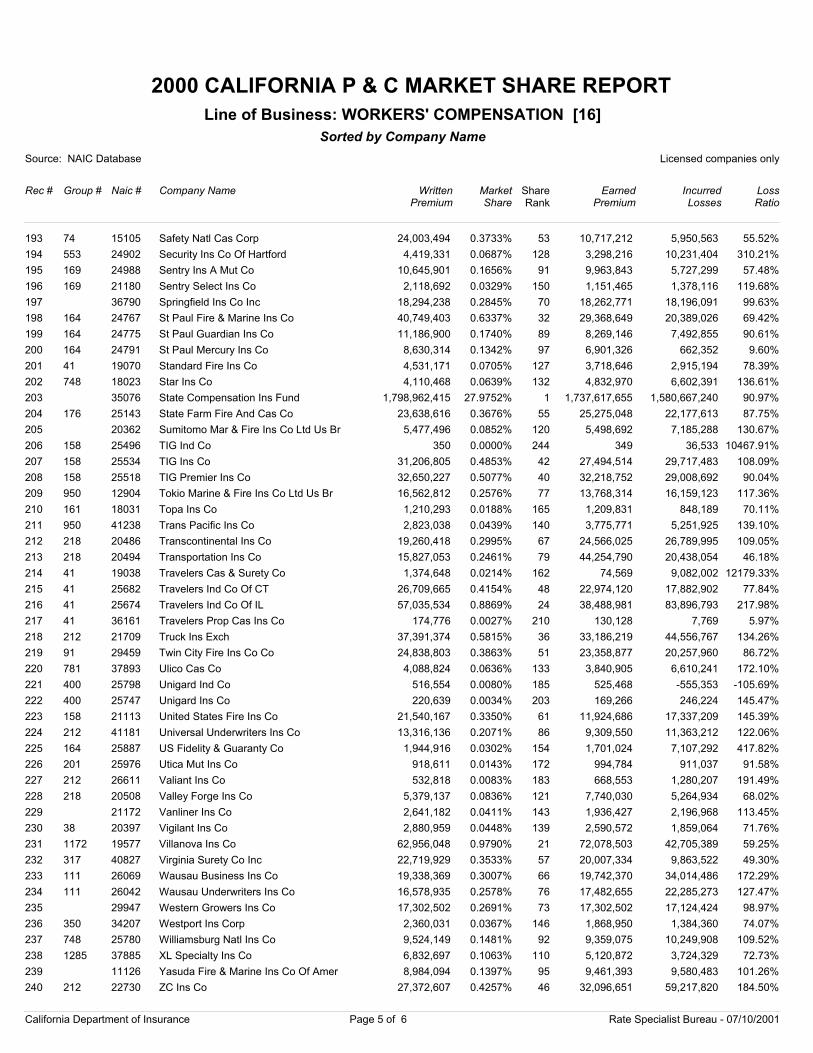
2000 CALIFORNIA P & C MARKET SHARE REPORT
Source: NAIC Database Licensed companies only
Rec # Group # Naic # Company Name
Sorted by Company Name
WrittenPremium
Market Share
EarnedPremium
IncurredLosses
LossRatio
Line of Business: WORKERS' COMPENSATION [16]
ShareRank
193 74 15105 Safety Natl Cas Corp 24,003,494 0.3733% 10,717,212 5,950,563 55.52%53
194 553 24902 Security Ins Co Of Hartford 4,419,331 0.0687% 3,298,216 10,231,404 310.21%128
195 169 24988 Sentry Ins A Mut Co 10,645,901 0.1656% 9,963,843 5,727,299 57.48%91
196 169 21180 Sentry Select Ins Co 2,118,692 0.0329% 1,151,465 1,378,116 119.68%150
197 36790 Springfield Ins Co Inc 18,294,238 0.2845% 18,262,771 18,196,091 99.63%70
198 164 24767 St Paul Fire & Marine Ins Co 40,749,403 0.6337% 29,368,649 20,389,026 69.42%32
199 164 24775 St Paul Guardian Ins Co 11,186,900 0.1740% 8,269,146 7,492,855 90.61%89
200 164 24791 St Paul Mercury Ins Co 8,630,314 0.1342% 6,901,326 662,352 9.60%97
201 41 19070 Standard Fire Ins Co 4,531,171 0.0705% 3,718,646 2,915,194 78.39%127
202 748 18023 Star Ins Co 4,110,468 0.0639% 4,832,970 6,602,391 136.61%132
203 35076 State Compensation Ins Fund 1,798,962,415 27.9752% 1,737,617,655 1,580,667,240 90.97%1
204 176 25143 State Farm Fire And Cas Co 23,638,616 0.3676% 25,275,048 22,177,613 87.75%55
205 20362 Sumitomo Mar & Fire Ins Co Ltd Us Br 5,477,496 0.0852% 5,498,692 7,185,288 130.67%120
206 158 25496 TIG Ind Co 350 0.0000% 349 36,533 10467.91%244
207 158 25534 TIG Ins Co 31,206,805 0.4853% 27,494,514 29,717,483 108.09%42
208 158 25518 TIG Premier Ins Co 32,650,227 0.5077% 32,218,752 29,008,692 90.04%40
209 950 12904 Tokio Marine & Fire Ins Co Ltd Us Br 16,562,812 0.2576% 13,768,314 16,159,123 117.36%77
210 161 18031 Topa Ins Co 1,210,293 0.0188% 1,209,831 848,189 70.11%165
211 950 41238 Trans Pacific Ins Co 2,823,038 0.0439% 3,775,771 5,251,925 139.10%140
212 218 20486 Transcontinental Ins Co 19,260,418 0.2995% 24,566,025 26,789,995 109.05%67
213 218 20494 Transportation Ins Co 15,827,053 0.2461% 44,254,790 20,438,054 46.18%79
214 41 19038 Travelers Cas & Surety Co 1,374,648 0.0214% 74,569 9,082,002 12179.33%162
215 41 25682 Travelers Ind Co Of CT 26,709,665 0.4154% 22,974,120 17,882,902 77.84%48
216 41 25674 Travelers Ind Co Of IL 57,035,534 0.8869% 38,488,981 83,896,793 217.98%24
217 41 36161 Travelers Prop Cas Ins Co 174,776 0.0027% 130,128 7,769 5.97%210
218 212 21709 Truck Ins Exch 37,391,374 0.5815% 33,186,219 44,556,767 134.26%36
219 91 29459 Twin City Fire Ins Co Co 24,838,803 0.3863% 23,358,877 20,257,960 86.72%51
220 781 37893 Ulico Cas Co 4,088,824 0.0636% 3,840,905 6,610,241 172.10%133
221 400 25798 Unigard Ind Co 516,554 0.0080% 525,468 -555,353 -105.69%185
222 400 25747 Unigard Ins Co 220,639 0.0034% 169,266 246,224 145.47%203
223 158 21113 United States Fire Ins Co 21,540,167 0.3350% 11,924,686 17,337,209 145.39%61
224 212 41181 Universal Underwriters Ins Co 13,316,136 0.2071% 9,309,550 11,363,212 122.06%86
225 164 25887 US Fidelity & Guaranty Co 1,944,916 0.0302% 1,701,024 7,107,292 417.82%154
226 201 25976 Utica Mut Ins Co 918,611 0.0143% 994,784 911,037 91.58%172
227 212 26611 Valiant Ins Co 532,818 0.0083% 668,553 1,280,207 191.49%183
228 218 20508 Valley Forge Ins Co 5,379,137 0.0836% 7,740,030 5,264,934 68.02%121
229 21172 Vanliner Ins Co 2,641,182 0.0411% 1,936,427 2,196,968 113.45%143
230 38 20397 Vigilant Ins Co 2,880,959 0.0448% 2,590,572 1,859,064 71.76%139
231 1172 19577 Villanova Ins Co 62,956,048 0.9790% 72,078,503 42,705,389 59.25%21
232 317 40827 Virginia Surety Co Inc 22,719,929 0.3533% 20,007,334 9,863,522 49.30%57
233 111 26069 Wausau Business Ins Co 19,338,369 0.3007% 19,742,370 34,014,486 172.29%66
234 111 26042 Wausau Underwriters Ins Co 16,578,935 0.2578% 17,482,655 22,285,273 127.47%76
235 29947 Western Growers Ins Co 17,302,502 0.2691% 17,302,502 17,124,424 98.97%73
236 350 34207 Westport Ins Corp 2,360,031 0.0367% 1,868,950 1,384,360 74.07%146
237 748 25780 Williamsburg Natl Ins Co 9,524,149 0.1481% 9,359,075 10,249,908 109.52%92
238 1285 37885 XL Specialty Ins Co 6,832,697 0.1063% 5,120,872 3,724,329 72.73%110
239 11126 Yasuda Fire & Marine Ins Co Of Amer 8,984,094 0.1397% 9,461,393 9,580,483 101.26%95
240 212 22730 ZC Ins Co 27,372,607 0.4257% 32,096,651 59,217,820 184.50%46
California Department of Insurance Page 5 of 6 Rate Specialist Bureau - 07/10/2001
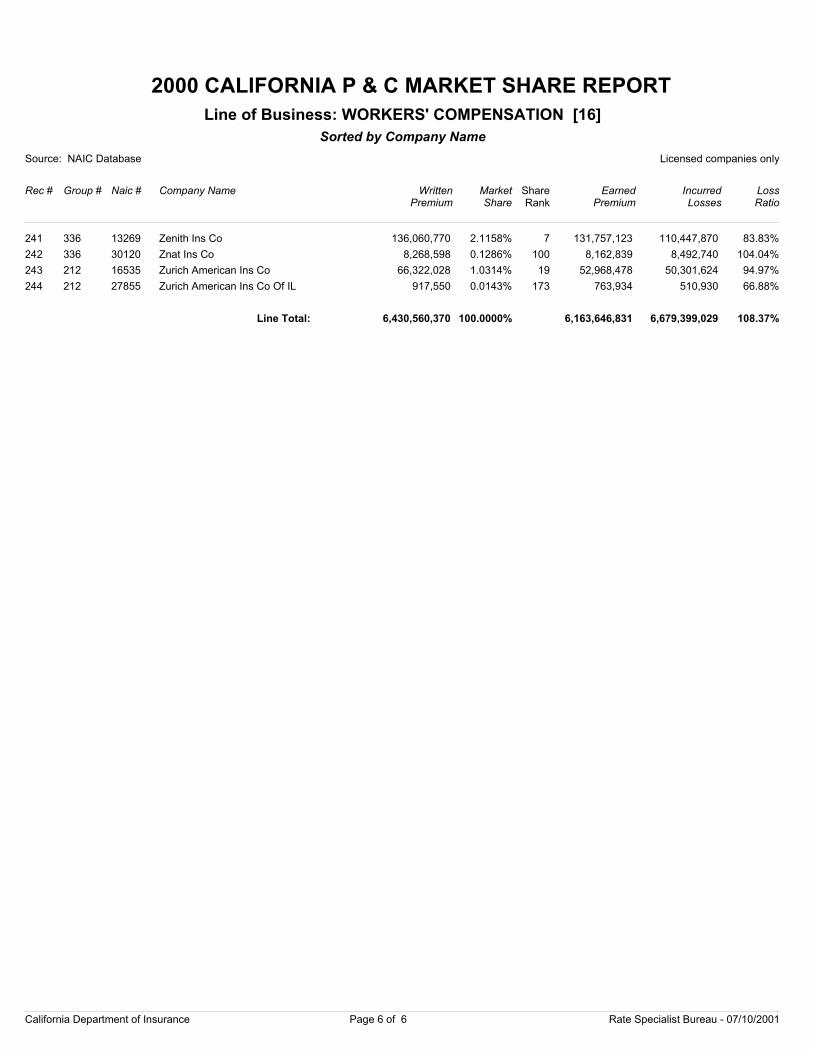
2000 CALIFORNIA P & C MARKET SHARE REPORT
Source: NAIC Database Licensed companies only
Rec # Group # Naic # Company Name
Sorted by Company Name
WrittenPremium
Market Share
EarnedPremium
IncurredLosses
LossRatio
Line of Business: WORKERS' COMPENSATION [16]
ShareRank
241 336 13269 Zenith Ins Co 136,060,770 2.1158% 131,757,123 110,447,870 83.83%7
242 336 30120 Znat Ins Co 8,268,598 0.1286% 8,162,839 8,492,740 104.04%100
243 212 16535 Zurich American Ins Co 66,322,028 1.0314% 52,968,478 50,301,624 94.97%19
244 212 27855 Zurich American Ins Co Of IL 917,550 0.0143% 763,934 510,930 66.88%173
6,430,560,370 100.0000% 6,163,646,831 6,679,399,029 108.37%Line Total:
California Department of Insurance Page 6 of 6 Rate Specialist Bureau - 07/10/2001
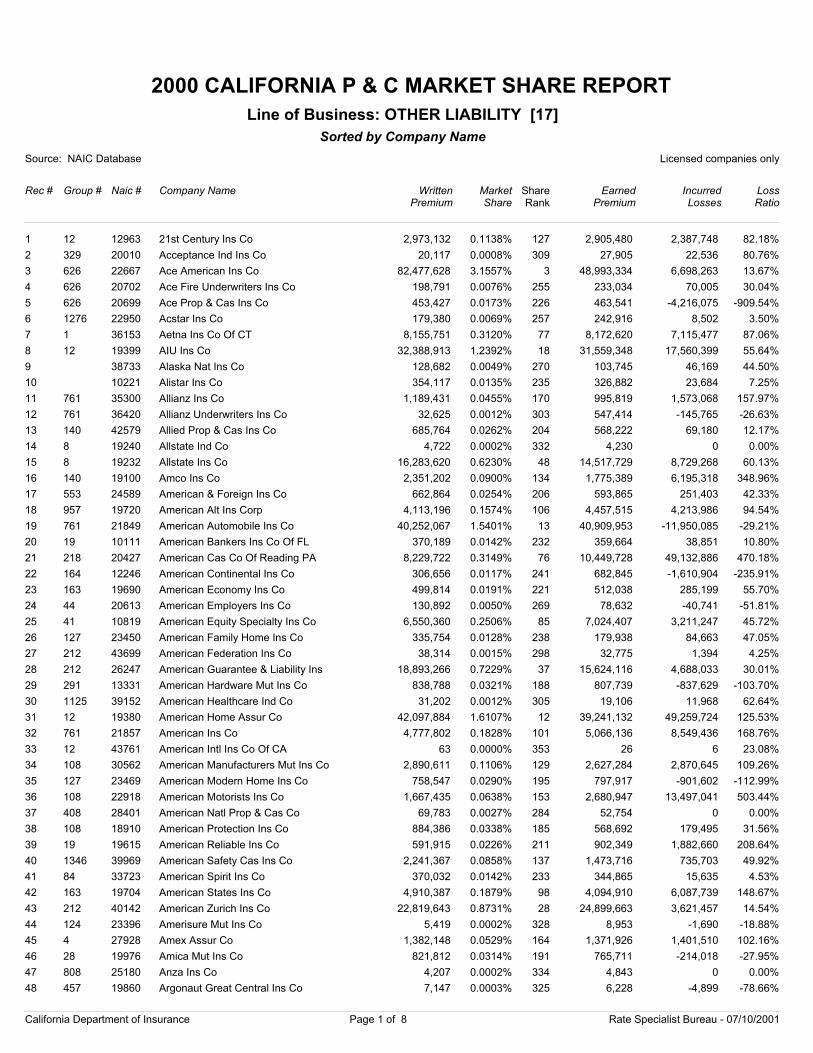
2000 CALIFORNIA P & C MARKET SHARE REPORT
Source: NAIC Database Licensed companies only
Rec # Group # Naic # Company Name
Sorted by Company Name
WrittenPremium
Market Share
EarnedPremium
IncurredLosses
LossRatio
Line of Business: OTHER LIABILITY [17]
ShareRank
1 12 12963 21st Century Ins Co 2,973,132 0.1138% 2,905,480 2,387,748 82.18%127
2 329 20010 Acceptance Ind Ins Co 20,117 0.0008% 27,905 22,536 80.76%309
3 626 22667 Ace American Ins Co 82,477,628 3.1557% 48,993,334 6,698,263 13.67%3
4 626 20702 Ace Fire Underwriters Ins Co 198,791 0.0076% 233,034 70,005 30.04%255
5 626 20699 Ace Prop & Cas Ins Co 453,427 0.0173% 463,541 -4,216,075 -909.54%226
6 1276 22950 Acstar Ins Co 179,380 0.0069% 242,916 8,502 3.50%257
7 1 36153 Aetna Ins Co Of CT 8,155,751 0.3120% 8,172,620 7,115,477 87.06%77
8 12 19399 AIU Ins Co 32,388,913 1.2392% 31,559,348 17,560,399 55.64%18
9 38733 Alaska Nat Ins Co 128,682 0.0049% 103,745 46,169 44.50%270
10 10221 Alistar Ins Co 354,117 0.0135% 326,882 23,684 7.25%235
11 761 35300 Allianz Ins Co 1,189,431 0.0455% 995,819 1,573,068 157.97%170
12 761 36420 Allianz Underwriters Ins Co 32,625 0.0012% 547,414 -145,765 -26.63%303
13 140 42579 Allied Prop & Cas Ins Co 685,764 0.0262% 568,222 69,180 12.17%204
14 8 19240 Allstate Ind Co 4,722 0.0002% 4,230 0 0.00%332
15 8 19232 Allstate Ins Co 16,283,620 0.6230% 14,517,729 8,729,268 60.13%48
16 140 19100 Amco Ins Co 2,351,202 0.0900% 1,775,389 6,195,318 348.96%134
17 553 24589 American & Foreign Ins Co 662,864 0.0254% 593,865 251,403 42.33%206
18 957 19720 American Alt Ins Corp 4,113,196 0.1574% 4,457,515 4,213,986 94.54%106
19 761 21849 American Automobile Ins Co 40,252,067 1.5401% 40,909,953 -11,950,085 -29.21%13
20 19 10111 American Bankers Ins Co Of FL 370,189 0.0142% 359,664 38,851 10.80%232
21 218 20427 American Cas Co Of Reading PA 8,229,722 0.3149% 10,449,728 49,132,886 470.18%76
22 164 12246 American Continental Ins Co 306,656 0.0117% 682,845 -1,610,904 -235.91%241
23 163 19690 American Economy Ins Co 499,814 0.0191% 512,038 285,199 55.70%221
24 44 20613 American Employers Ins Co 130,892 0.0050% 78,632 -40,741 -51.81%269
25 41 10819 American Equity Specialty Ins Co 6,550,360 0.2506% 7,024,407 3,211,247 45.72%85
26 127 23450 American Family Home Ins Co 335,754 0.0128% 179,938 84,663 47.05%238
27 212 43699 American Federation Ins Co 38,314 0.0015% 32,775 1,394 4.25%298
28 212 26247 American Guarantee & Liability Ins 18,893,266 0.7229% 15,624,116 4,688,033 30.01%37
29 291 13331 American Hardware Mut Ins Co 838,788 0.0321% 807,739 -837,629 -103.70%188
30 1125 39152 American Healthcare Ind Co 31,202 0.0012% 19,106 11,968 62.64%305
31 12 19380 American Home Assur Co 42,097,884 1.6107% 39,241,132 49,259,724 125.53%12
32 761 21857 American Ins Co 4,777,802 0.1828% 5,066,136 8,549,436 168.76%101
33 12 43761 American Intl Ins Co Of CA 63 0.0000% 26 6 23.08%353
34 108 30562 American Manufacturers Mut Ins Co 2,890,611 0.1106% 2,627,284 2,870,645 109.26%129
35 127 23469 American Modern Home Ins Co 758,547 0.0290% 797,917 -901,602 -112.99%195
36 108 22918 American Motorists Ins Co 1,667,435 0.0638% 2,680,947 13,497,041 503.44%153
37 408 28401 American Natl Prop & Cas Co 69,783 0.0027% 52,754 0 0.00%284
38 108 18910 American Protection Ins Co 884,386 0.0338% 568,692 179,495 31.56%185
39 19 19615 American Reliable Ins Co 591,915 0.0226% 902,349 1,882,660 208.64%211
40 1346 39969 American Safety Cas Ins Co 2,241,367 0.0858% 1,473,716 735,703 49.92%137
41 84 33723 American Spirit Ins Co 370,032 0.0142% 344,865 15,635 4.53%233
42 163 19704 American States Ins Co 4,910,387 0.1879% 4,094,910 6,087,739 148.67%98
43 212 40142 American Zurich Ins Co 22,819,643 0.8731% 24,899,663 3,621,457 14.54%28
44 124 23396 Amerisure Mut Ins Co 5,419 0.0002% 8,953 -1,690 -18.88%328
45 4 27928 Amex Assur Co 1,382,148 0.0529% 1,371,926 1,401,510 102.16%164
46 28 19976 Amica Mut Ins Co 821,812 0.0314% 765,711 -214,018 -27.95%191
47 808 25180 Anza Ins Co 4,207 0.0002% 4,843 0 0.00%334
48 457 19860 Argonaut Great Central Ins Co 7,147 0.0003% 6,228 -4,899 -78.66%325
California Department of Insurance Page 1 of 8 Rate Specialist Bureau - 07/10/2001
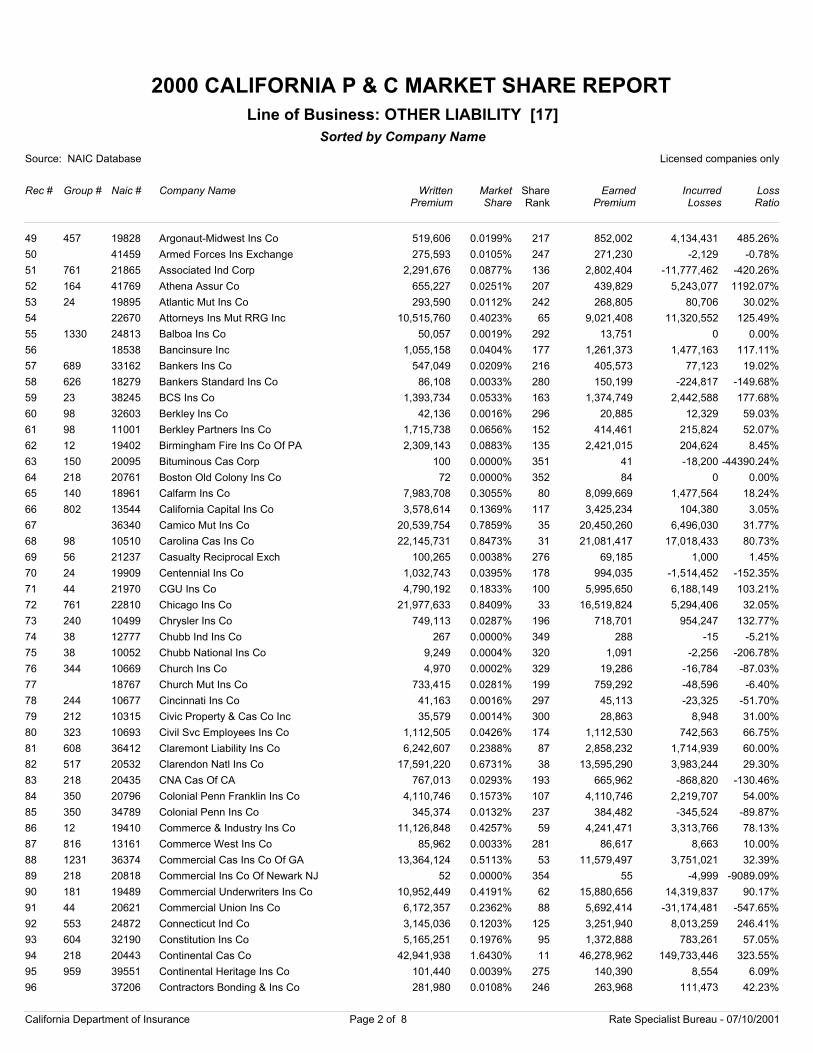
2000 CALIFORNIA P & C MARKET SHARE REPORT
Source: NAIC Database Licensed companies only
Rec # Group # Naic # Company Name
Sorted by Company Name
WrittenPremium
Market Share
EarnedPremium
IncurredLosses
LossRatio
Line of Business: OTHER LIABILITY [17]
ShareRank
49 457 19828 Argonaut-Midwest Ins Co 519,606 0.0199% 852,002 4,134,431 485.26%217
50 41459 Armed Forces Ins Exchange 275,593 0.0105% 271,230 -2,129 -0.78%247
51 761 21865 Associated Ind Corp 2,291,676 0.0877% 2,802,404 -11,777,462 -420.26%136
52 164 41769 Athena Assur Co 655,227 0.0251% 439,829 5,243,077 1192.07%207
53 24 19895 Atlantic Mut Ins Co 293,590 0.0112% 268,805 80,706 30.02%242
54 22670 Attorneys Ins Mut RRG Inc 10,515,760 0.4023% 9,021,408 11,320,552 125.49%65
55 1330 24813 Balboa Ins Co 50,057 0.0019% 13,751 0 0.00%292
56 18538 Bancinsure Inc 1,055,158 0.0404% 1,261,373 1,477,163 117.11%177
57 689 33162 Bankers Ins Co 547,049 0.0209% 405,573 77,123 19.02%216
58 626 18279 Bankers Standard Ins Co 86,108 0.0033% 150,199 -224,817 -149.68%280
59 23 38245 BCS Ins Co 1,393,734 0.0533% 1,374,749 2,442,588 177.68%163
60 98 32603 Berkley Ins Co 42,136 0.0016% 20,885 12,329 59.03%296
61 98 11001 Berkley Partners Ins Co 1,715,738 0.0656% 414,461 215,824 52.07%152
62 12 19402 Birmingham Fire Ins Co Of PA 2,309,143 0.0883% 2,421,015 204,624 8.45%135
63 150 20095 Bituminous Cas Corp 100 0.0000% 41 -18,200 -44390.24%351
64 218 20761 Boston Old Colony Ins Co 72 0.0000% 84 0 0.00%352
65 140 18961 Calfarm Ins Co 7,983,708 0.3055% 8,099,669 1,477,564 18.24%80
66 802 13544 California Capital Ins Co 3,578,614 0.1369% 3,425,234 104,380 3.05%117
67 36340 Camico Mut Ins Co 20,539,754 0.7859% 20,450,260 6,496,030 31.77%35
68 98 10510 Carolina Cas Ins Co 22,145,731 0.8473% 21,081,417 17,018,433 80.73%31
69 56 21237 Casualty Reciprocal Exch 100,265 0.0038% 69,185 1,000 1.45%276
70 24 19909 Centennial Ins Co 1,032,743 0.0395% 994,035 -1,514,452 -152.35%178
71 44 21970 CGU Ins Co 4,790,192 0.1833% 5,995,650 6,188,149 103.21%100
72 761 22810 Chicago Ins Co 21,977,633 0.8409% 16,519,824 5,294,406 32.05%33
73 240 10499 Chrysler Ins Co 749,113 0.0287% 718,701 954,247 132.77%196
74 38 12777 Chubb Ind Ins Co 267 0.0000% 288 -15 -5.21%349
75 38 10052 Chubb National Ins Co 9,249 0.0004% 1,091 -2,256 -206.78%320
76 344 10669 Church Ins Co 4,970 0.0002% 19,286 -16,784 -87.03%329
77 18767 Church Mut Ins Co 733,415 0.0281% 759,292 -48,596 -6.40%199
78 244 10677 Cincinnati Ins Co 41,163 0.0016% 45,113 -23,325 -51.70%297
79 212 10315 Civic Property & Cas Co Inc 35,579 0.0014% 28,863 8,948 31.00%300
80 323 10693 Civil Svc Employees Ins Co 1,112,505 0.0426% 1,112,530 742,563 66.75%174
81 608 36412 Claremont Liability Ins Co 6,242,607 0.2388% 2,858,232 1,714,939 60.00%87
82 517 20532 Clarendon Natl Ins Co 17,591,220 0.6731% 13,595,290 3,983,244 29.30%38
83 218 20435 CNA Cas Of CA 767,013 0.0293% 665,962 -868,820 -130.46%193
84 350 20796 Colonial Penn Franklin Ins Co 4,110,746 0.1573% 4,110,746 2,219,707 54.00%107
85 350 34789 Colonial Penn Ins Co 345,374 0.0132% 384,482 -345,524 -89.87%237
86 12 19410 Commerce & Industry Ins Co 11,126,848 0.4257% 4,241,471 3,313,766 78.13%59
87 816 13161 Commerce West Ins Co 85,962 0.0033% 86,617 8,663 10.00%281
88 1231 36374 Commercial Cas Ins Co Of GA 13,364,124 0.5113% 11,579,497 3,751,021 32.39%53
89 218 20818 Commercial Ins Co Of Newark NJ 52 0.0000% 55 -4,999 -9089.09%354
90 181 19489 Commercial Underwriters Ins Co 10,952,449 0.4191% 15,880,656 14,319,837 90.17%62
91 44 20621 Commercial Union Ins Co 6,172,357 0.2362% 5,692,414 -31,174,481 -547.65%88
92 553 24872 Connecticut Ind Co 3,145,036 0.1203% 3,251,940 8,013,259 246.41%125
93 604 32190 Constitution Ins Co 5,165,251 0.1976% 1,372,888 783,261 57.05%95
94 218 20443 Continental Cas Co 42,941,938 1.6430% 46,278,962 149,733,446 323.55%11
95 959 39551 Continental Heritage Ins Co 101,440 0.0039% 140,390 8,554 6.09%275
96 37206 Contractors Bonding & Ins Co 281,980 0.0108% 263,968 111,473 42.23%246
California Department of Insurance Page 2 of 8 Rate Specialist Bureau - 07/10/2001
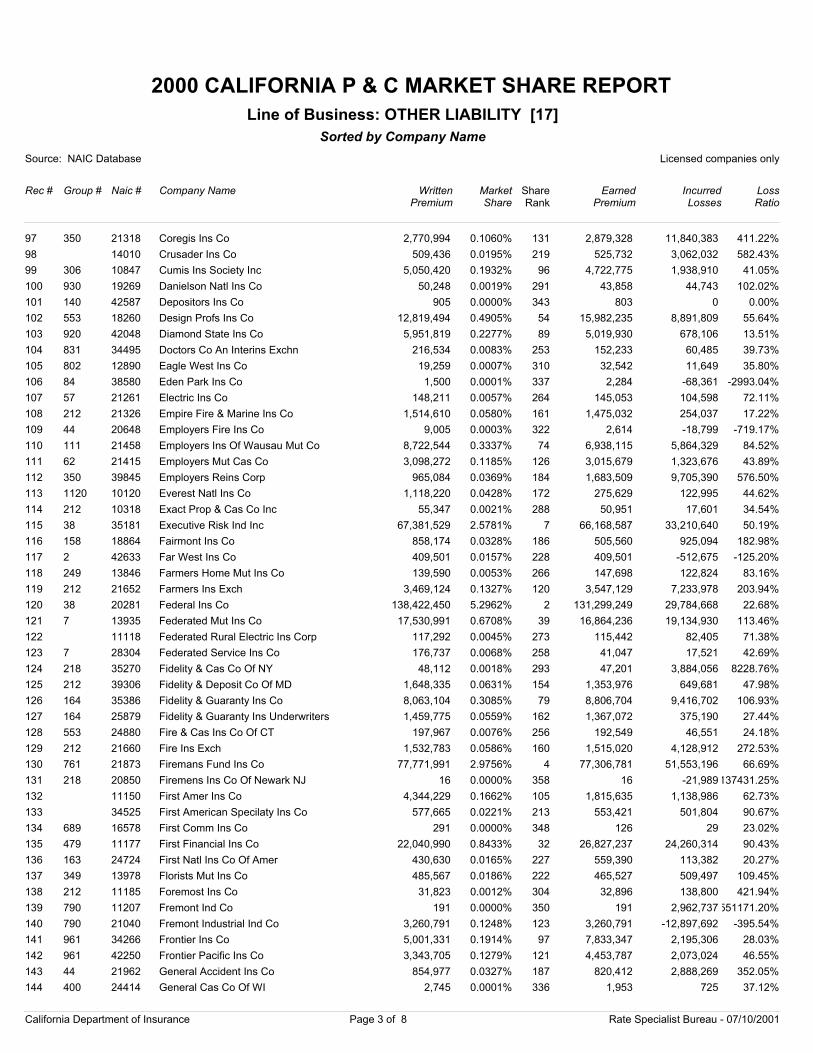
2000 CALIFORNIA P & C MARKET SHARE REPORT
Source: NAIC Database Licensed companies only
Rec # Group # Naic # Company Name
Sorted by Company Name
WrittenPremium
Market Share
EarnedPremium
IncurredLosses
LossRatio
Line of Business: OTHER LIABILITY [17]
ShareRank
97 350 21318 Coregis Ins Co 2,770,994 0.1060% 2,879,328 11,840,383 411.22%131
98 14010 Crusader Ins Co 509,436 0.0195% 525,732 3,062,032 582.43%219
99 306 10847 Cumis Ins Society Inc 5,050,420 0.1932% 4,722,775 1,938,910 41.05%96
100 930 19269 Danielson Natl Ins Co 50,248 0.0019% 43,858 44,743 102.02%291
101 140 42587 Depositors Ins Co 905 0.0000% 803 0 0.00%343
102 553 18260 Design Profs Ins Co 12,819,494 0.4905% 15,982,235 8,891,809 55.64%54
103 920 42048 Diamond State Ins Co 5,951,819 0.2277% 5,019,930 678,106 13.51%89
104 831 34495 Doctors Co An Interins Exchn 216,534 0.0083% 152,233 60,485 39.73%253
105 802 12890 Eagle West Ins Co 19,259 0.0007% 32,542 11,649 35.80%310
106 84 38580 Eden Park Ins Co 1,500 0.0001% 2,284 -68,361 -2993.04%337
107 57 21261 Electric Ins Co 148,211 0.0057% 145,053 104,598 72.11%264
108 212 21326 Empire Fire & Marine Ins Co 1,514,610 0.0580% 1,475,032 254,037 17.22%161
109 44 20648 Employers Fire Ins Co 9,005 0.0003% 2,614 -18,799 -719.17%322
110 111 21458 Employers Ins Of Wausau Mut Co 8,722,544 0.3337% 6,938,115 5,864,329 84.52%74
111 62 21415 Employers Mut Cas Co 3,098,272 0.1185% 3,015,679 1,323,676 43.89%126
112 350 39845 Employers Reins Corp 965,084 0.0369% 1,683,509 9,705,390 576.50%184
113 1120 10120 Everest Natl Ins Co 1,118,220 0.0428% 275,629 122,995 44.62%172
114 212 10318 Exact Prop & Cas Co Inc 55,347 0.0021% 50,951 17,601 34.54%288
115 38 35181 Executive Risk Ind Inc 67,381,529 2.5781% 66,168,587 33,210,640 50.19%7
116 158 18864 Fairmont Ins Co 858,174 0.0328% 505,560 925,094 182.98%186
117 2 42633 Far West Ins Co 409,501 0.0157% 409,501 -512,675 -125.20%228
118 249 13846 Farmers Home Mut Ins Co 139,590 0.0053% 147,698 122,824 83.16%266
119 212 21652 Farmers Ins Exch 3,469,124 0.1327% 3,547,129 7,233,978 203.94%120
120 38 20281 Federal Ins Co 138,422,450 5.2962% 131,299,249 29,784,668 22.68%2
121 7 13935 Federated Mut Ins Co 17,530,991 0.6708% 16,864,236 19,134,930 113.46%39
122 11118 Federated Rural Electric Ins Corp 117,292 0.0045% 115,442 82,405 71.38%273
123 7 28304 Federated Service Ins Co 176,737 0.0068% 41,047 17,521 42.69%258
124 218 35270 Fidelity & Cas Co Of NY 48,112 0.0018% 47,201 3,884,056 8228.76%293
125 212 39306 Fidelity & Deposit Co Of MD 1,648,335 0.0631% 1,353,976 649,681 47.98%154
126 164 35386 Fidelity & Guaranty Ins Co 8,063,104 0.3085% 8,806,704 9,416,702 106.93%79
127 164 25879 Fidelity & Guaranty Ins Underwriters 1,459,775 0.0559% 1,367,072 375,190 27.44%162
128 553 24880 Fire & Cas Ins Co Of CT 197,967 0.0076% 192,549 46,551 24.18%256
129 212 21660 Fire Ins Exch 1,532,783 0.0586% 1,515,020 4,128,912 272.53%160
130 761 21873 Firemans Fund Ins Co 77,771,991 2.9756% 77,306,781 51,553,196 66.69%4
131 218 20850 Firemens Ins Co Of Newark NJ 16 0.0000% 16 -21,989137431.25%358
132 11150 First Amer Ins Co 4,344,229 0.1662% 1,815,635 1,138,986 62.73%105
133 34525 First American Specilaty Ins Co 577,665 0.0221% 553,421 501,804 90.67%213
134 689 16578 First Comm Ins Co 291 0.0000% 126 29 23.02%348
135 479 11177 First Financial Ins Co 22,040,990 0.8433% 26,827,237 24,260,314 90.43%32
136 163 24724 First Natl Ins Co Of Amer 430,630 0.0165% 559,390 113,382 20.27%227
137 349 13978 Florists Mut Ins Co 485,567 0.0186% 465,527 509,497 109.45%222
138 212 11185 Foremost Ins Co 31,823 0.0012% 32,896 138,800 421.94%304
139 790 11207 Fremont Ind Co 191 0.0000% 191 2,962,737551171.20%350
140 790 21040 Fremont Industrial Ind Co 3,260,791 0.1248% 3,260,791 -12,897,692 -395.54%123
141 961 34266 Frontier Ins Co 5,001,331 0.1914% 7,833,347 2,195,306 28.03%97
142 961 42250 Frontier Pacific Ins Co 3,343,705 0.1279% 4,453,787 2,073,024 46.55%121
143 44 21962 General Accident Ins Co 854,977 0.0327% 820,412 2,888,269 352.05%187
144 400 24414 General Cas Co Of WI 2,745 0.0001% 1,953 725 37.12%336
California Department of Insurance Page 3 of 8 Rate Specialist Bureau - 07/10/2001
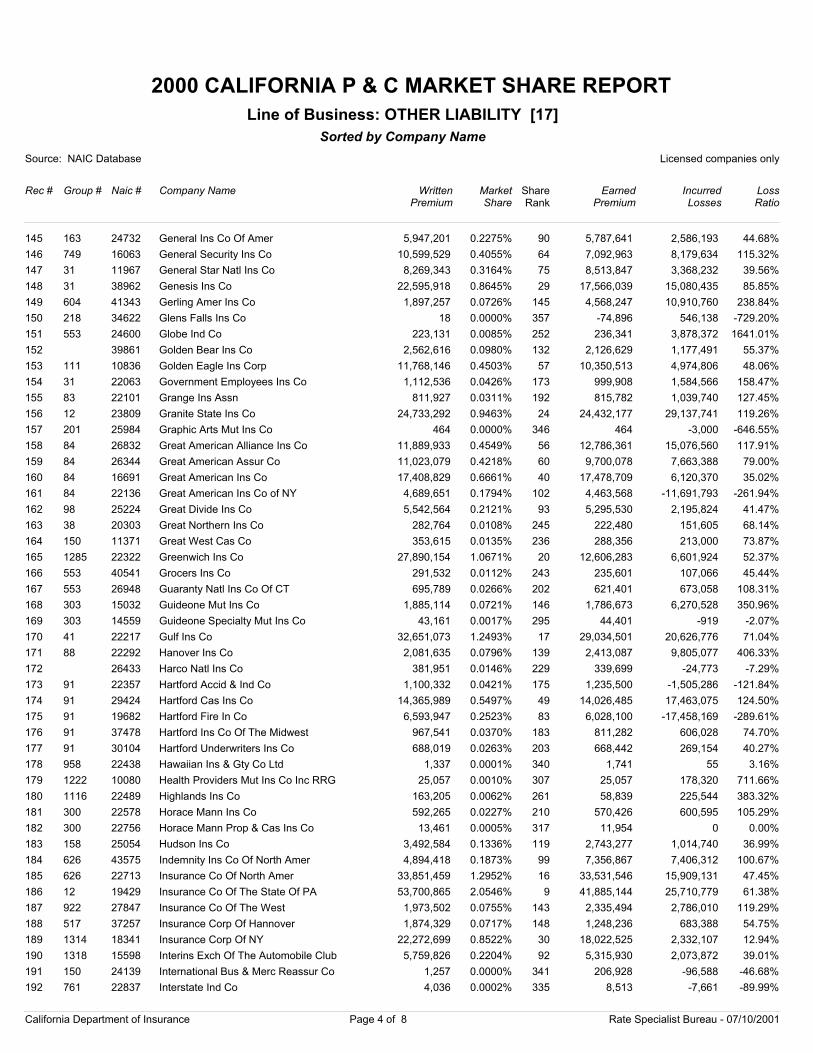
2000 CALIFORNIA P & C MARKET SHARE REPORT
Source: NAIC Database Licensed companies only
Rec # Group # Naic # Company Name
Sorted by Company Name
WrittenPremium
Market Share
EarnedPremium
IncurredLosses
LossRatio
Line of Business: OTHER LIABILITY [17]
ShareRank
145 163 24732 General Ins Co Of Amer 5,947,201 0.2275% 5,787,641 2,586,193 44.68%90
146 749 16063 General Security Ins Co 10,599,529 0.4055% 7,092,963 8,179,634 115.32%64
147 31 11967 General Star Natl Ins Co 8,269,343 0.3164% 8,513,847 3,368,232 39.56%75
148 31 38962 Genesis Ins Co 22,595,918 0.8645% 17,566,039 15,080,435 85.85%29
149 604 41343 Gerling Amer Ins Co 1,897,257 0.0726% 4,568,247 10,910,760 238.84%145
150 218 34622 Glens Falls Ins Co 18 0.0000% -74,896 546,138 -729.20%357
151 553 24600 Globe Ind Co 223,131 0.0085% 236,341 3,878,372 1641.01%252
152 39861 Golden Bear Ins Co 2,562,616 0.0980% 2,126,629 1,177,491 55.37%132
153 111 10836 Golden Eagle Ins Corp 11,768,146 0.4503% 10,350,513 4,974,806 48.06%57
154 31 22063 Government Employees Ins Co 1,112,536 0.0426% 999,908 1,584,566 158.47%173
155 83 22101 Grange Ins Assn 811,927 0.0311% 815,782 1,039,740 127.45%192
156 12 23809 Granite State Ins Co 24,733,292 0.9463% 24,432,177 29,137,741 119.26%24
157 201 25984 Graphic Arts Mut Ins Co 464 0.0000% 464 -3,000 -646.55%346
158 84 26832 Great American Alliance Ins Co 11,889,933 0.4549% 12,786,361 15,076,560 117.91%56
159 84 26344 Great American Assur Co 11,023,079 0.4218% 9,700,078 7,663,388 79.00%60
160 84 16691 Great American Ins Co 17,408,829 0.6661% 17,478,709 6,120,370 35.02%40
161 84 22136 Great American Ins Co of NY 4,689,651 0.1794% 4,463,568 -11,691,793 -261.94%102
162 98 25224 Great Divide Ins Co 5,542,564 0.2121% 5,295,530 2,195,824 41.47%93
163 38 20303 Great Northern Ins Co 282,764 0.0108% 222,480 151,605 68.14%245
164 150 11371 Great West Cas Co 353,615 0.0135% 288,356 213,000 73.87%236
165 1285 22322 Greenwich Ins Co 27,890,154 1.0671% 12,606,283 6,601,924 52.37%20
166 553 40541 Grocers Ins Co 291,532 0.0112% 235,601 107,066 45.44%243
167 553 26948 Guaranty Natl Ins Co Of CT 695,789 0.0266% 621,401 673,058 108.31%202
168 303 15032 Guideone Mut Ins Co 1,885,114 0.0721% 1,786,673 6,270,528 350.96%146
169 303 14559 Guideone Specialty Mut Ins Co 43,161 0.0017% 44,401 -919 -2.07%295
170 41 22217 Gulf Ins Co 32,651,073 1.2493% 29,034,501 20,626,776 71.04%17
171 88 22292 Hanover Ins Co 2,081,635 0.0796% 2,413,087 9,805,077 406.33%139
172 26433 Harco Natl Ins Co 381,951 0.0146% 339,699 -24,773 -7.29%229
173 91 22357 Hartford Accid & Ind Co 1,100,332 0.0421% 1,235,500 -1,505,286 -121.84%175
174 91 29424 Hartford Cas Ins Co 14,365,989 0.5497% 14,026,485 17,463,075 124.50%49
175 91 19682 Hartford Fire In Co 6,593,947 0.2523% 6,028,100 -17,458,169 -289.61%83
176 91 37478 Hartford Ins Co Of The Midwest 967,541 0.0370% 811,282 606,028 74.70%183
177 91 30104 Hartford Underwriters Ins Co 688,019 0.0263% 668,442 269,154 40.27%203
178 958 22438 Hawaiian Ins & Gty Co Ltd 1,337 0.0001% 1,741 55 3.16%340
179 1222 10080 Health Providers Mut Ins Co Inc RRG 25,057 0.0010% 25,057 178,320 711.66%307
180 1116 22489 Highlands Ins Co 163,205 0.0062% 58,839 225,544 383.32%261
181 300 22578 Horace Mann Ins Co 592,265 0.0227% 570,426 600,595 105.29%210
182 300 22756 Horace Mann Prop & Cas Ins Co 13,461 0.0005% 11,954 0 0.00%317
183 158 25054 Hudson Ins Co 3,492,584 0.1336% 2,743,277 1,014,740 36.99%119
184 626 43575 Indemnity Ins Co Of North Amer 4,894,418 0.1873% 7,356,867 7,406,312 100.67%99
185 626 22713 Insurance Co Of North Amer 33,851,459 1.2952% 33,531,546 15,909,131 47.45%16
186 12 19429 Insurance Co Of The State Of PA 53,700,865 2.0546% 41,885,144 25,710,779 61.38%9
187 922 27847 Insurance Co Of The West 1,973,502 0.0755% 2,335,494 2,786,010 119.29%143
188 517 37257 Insurance Corp Of Hannover 1,874,329 0.0717% 1,248,236 683,388 54.75%148
189 1314 18341 Insurance Corp Of NY 22,272,699 0.8522% 18,022,525 2,332,107 12.94%30
190 1318 15598 Interins Exch Of The Automobile Club 5,759,826 0.2204% 5,315,930 2,073,872 39.01%92
191 150 24139 International Bus & Merc Reassur Co 1,257 0.0000% 206,928 -96,588 -46.68%341
192 761 22837 Interstate Ind Co 4,036 0.0002% 8,513 -7,661 -89.99%335
California Department of Insurance Page 4 of 8 Rate Specialist Bureau - 07/10/2001
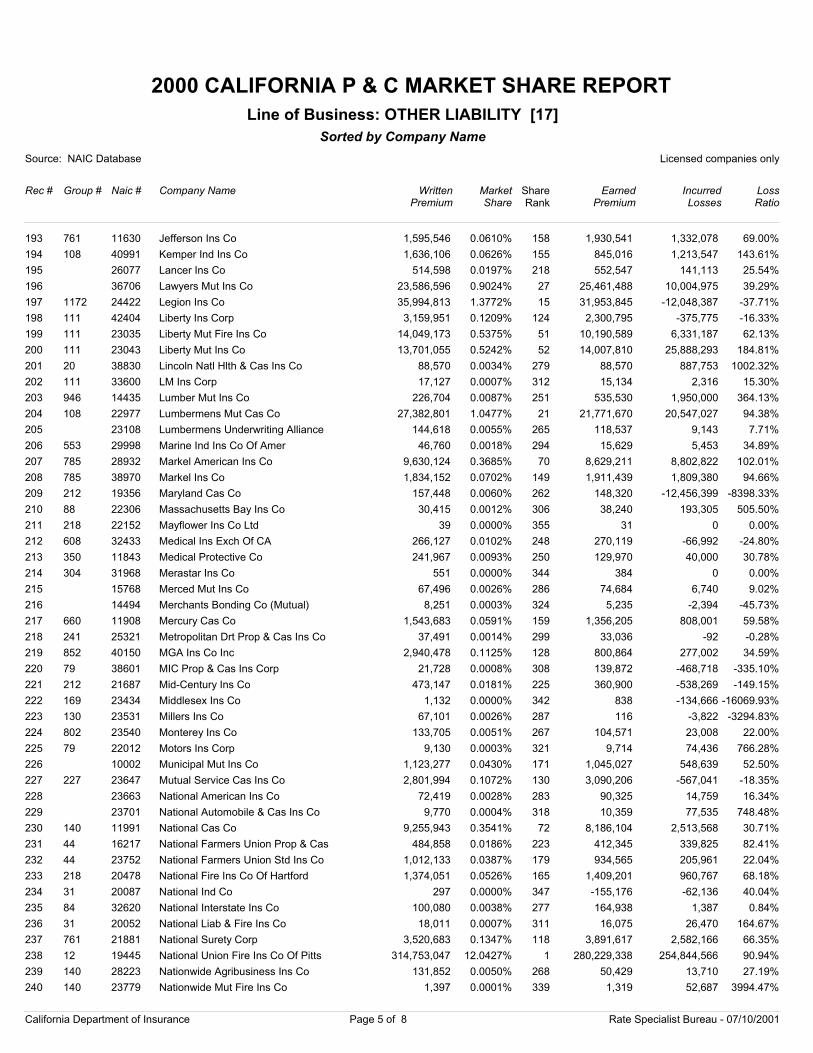
2000 CALIFORNIA P & C MARKET SHARE REPORT
Source: NAIC Database Licensed companies only
Rec # Group # Naic # Company Name
Sorted by Company Name
WrittenPremium
Market Share
EarnedPremium
IncurredLosses
LossRatio
Line of Business: OTHER LIABILITY [17]
ShareRank
193 761 11630 Jefferson Ins Co 1,595,546 0.0610% 1,930,541 1,332,078 69.00%158
194 108 40991 Kemper Ind Ins Co 1,636,106 0.0626% 845,016 1,213,547 143.61%155
195 26077 Lancer Ins Co 514,598 0.0197% 552,547 141,113 25.54%218
196 36706 Lawyers Mut Ins Co 23,586,596 0.9024% 25,461,488 10,004,975 39.29%27
197 1172 24422 Legion Ins Co 35,994,813 1.3772% 31,953,845 -12,048,387 -37.71%15
198 111 42404 Liberty Ins Corp 3,159,951 0.1209% 2,300,795 -375,775 -16.33%124
199 111 23035 Liberty Mut Fire Ins Co 14,049,173 0.5375% 10,190,589 6,331,187 62.13%51
200 111 23043 Liberty Mut Ins Co 13,701,055 0.5242% 14,007,810 25,888,293 184.81%52
201 20 38830 Lincoln Natl Hlth & Cas Ins Co 88,570 0.0034% 88,570 887,753 1002.32%279
202 111 33600 LM Ins Corp 17,127 0.0007% 15,134 2,316 15.30%312
203 946 14435 Lumber Mut Ins Co 226,704 0.0087% 535,530 1,950,000 364.13%251
204 108 22977 Lumbermens Mut Cas Co 27,382,801 1.0477% 21,771,670 20,547,027 94.38%21
205 23108 Lumbermens Underwriting Alliance 144,618 0.0055% 118,537 9,143 7.71%265
206 553 29998 Marine Ind Ins Co Of Amer 46,760 0.0018% 15,629 5,453 34.89%294
207 785 28932 Markel American Ins Co 9,630,124 0.3685% 8,629,211 8,802,822 102.01%70
208 785 38970 Markel Ins Co 1,834,152 0.0702% 1,911,439 1,809,380 94.66%149
209 212 19356 Maryland Cas Co 157,448 0.0060% 148,320 -12,456,399 -8398.33%262
210 88 22306 Massachusetts Bay Ins Co 30,415 0.0012% 38,240 193,305 505.50%306
211 218 22152 Mayflower Ins Co Ltd 39 0.0000% 31 0 0.00%355
212 608 32433 Medical Ins Exch Of CA 266,127 0.0102% 270,119 -66,992 -24.80%248
213 350 11843 Medical Protective Co 241,967 0.0093% 129,970 40,000 30.78%250
214 304 31968 Merastar Ins Co 551 0.0000% 384 0 0.00%344
215 15768 Merced Mut Ins Co 67,496 0.0026% 74,684 6,740 9.02%286
216 14494 Merchants Bonding Co (Mutual) 8,251 0.0003% 5,235 -2,394 -45.73%324
217 660 11908 Mercury Cas Co 1,543,683 0.0591% 1,356,205 808,001 59.58%159
218 241 25321 Metropolitan Drt Prop & Cas Ins Co 37,491 0.0014% 33,036 -92 -0.28%299
219 852 40150 MGA Ins Co Inc 2,940,478 0.1125% 800,864 277,002 34.59%128
220 79 38601 MIC Prop & Cas Ins Corp 21,728 0.0008% 139,872 -468,718 -335.10%308
221 212 21687 Mid-Century Ins Co 473,147 0.0181% 360,900 -538,269 -149.15%225
222 169 23434 Middlesex Ins Co 1,132 0.0000% 838 -134,666 -16069.93%342
223 130 23531 Millers Ins Co 67,101 0.0026% 116 -3,822 -3294.83%287
224 802 23540 Monterey Ins Co 133,705 0.0051% 104,571 23,008 22.00%267
225 79 22012 Motors Ins Corp 9,130 0.0003% 9,714 74,436 766.28%321
226 10002 Municipal Mut Ins Co 1,123,277 0.0430% 1,045,027 548,639 52.50%171
227 227 23647 Mutual Service Cas Ins Co 2,801,994 0.1072% 3,090,206 -567,041 -18.35%130
228 23663 National American Ins Co 72,419 0.0028% 90,325 14,759 16.34%283
229 23701 National Automobile & Cas Ins Co 9,770 0.0004% 10,359 77,535 748.48%318
230 140 11991 National Cas Co 9,255,943 0.3541% 8,186,104 2,513,568 30.71%72
231 44 16217 National Farmers Union Prop & Cas 484,858 0.0186% 412,345 339,825 82.41%223
232 44 23752 National Farmers Union Std Ins Co 1,012,133 0.0387% 934,565 205,961 22.04%179
233 218 20478 National Fire Ins Co Of Hartford 1,374,051 0.0526% 1,409,201 960,767 68.18%165
234 31 20087 National Ind Co 297 0.0000% -155,176 -62,136 40.04%347
235 84 32620 National Interstate Ins Co 100,080 0.0038% 164,938 1,387 0.84%277
236 31 20052 National Liab & Fire Ins Co 18,011 0.0007% 16,075 26,470 164.67%311
237 761 21881 National Surety Corp 3,520,683 0.1347% 3,891,617 2,582,166 66.35%118
238 12 19445 National Union Fire Ins Co Of Pitts 314,753,047 12.0427% 280,229,338 254,844,566 90.94%1
239 140 28223 Nationwide Agribusiness Ins Co 131,852 0.0050% 50,429 13,710 27.19%268
240 140 23779 Nationwide Mut Fire Ins Co 1,397 0.0001% 1,319 52,687 3994.47%339
California Department of Insurance Page 5 of 8 Rate Specialist Bureau - 07/10/2001
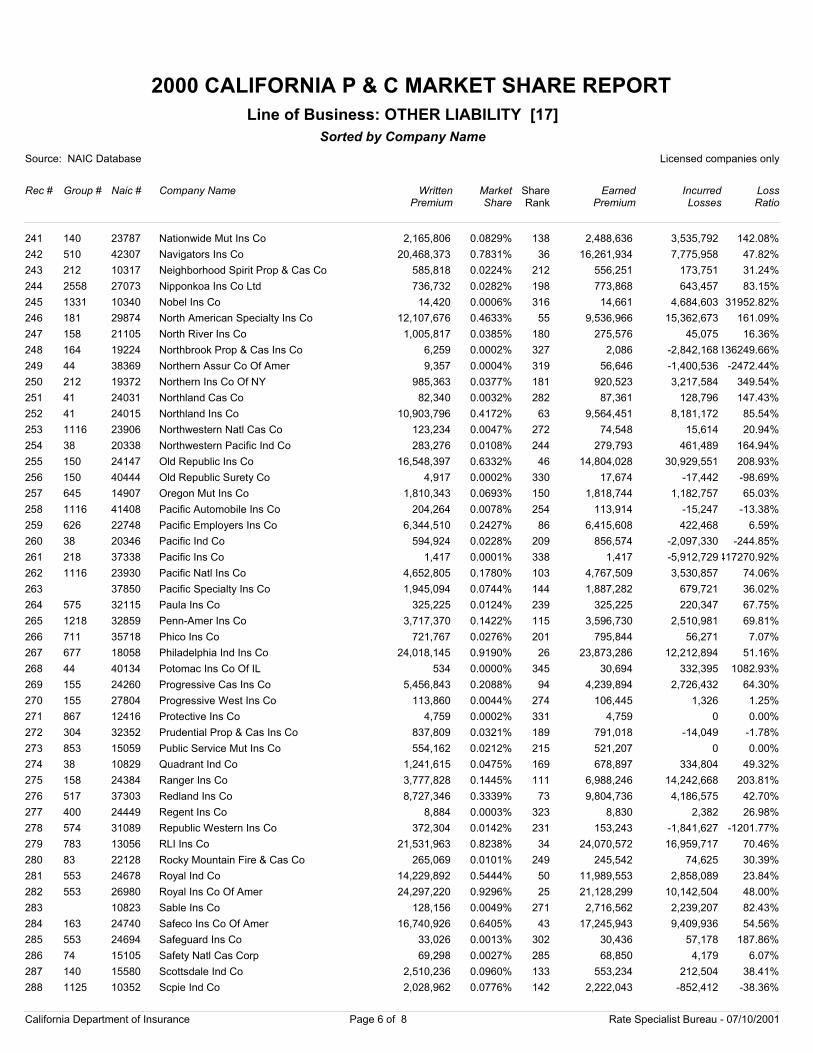
2000 CALIFORNIA P & C MARKET SHARE REPORT
Source: NAIC Database Licensed companies only
Rec # Group # Naic # Company Name
Sorted by Company Name
WrittenPremium
Market Share
EarnedPremium
IncurredLosses
LossRatio
Line of Business: OTHER LIABILITY [17]
ShareRank
241 140 23787 Nationwide Mut Ins Co 2,165,806 0.0829% 2,488,636 3,535,792 142.08%138
242 510 42307 Navigators Ins Co 20,468,373 0.7831% 16,261,934 7,775,958 47.82%36
243 212 10317 Neighborhood Spirit Prop & Cas Co 585,818 0.0224% 556,251 173,751 31.24%212
244 2558 27073 Nipponkoa Ins Co Ltd 736,732 0.0282% 773,868 643,457 83.15%198
245 1331 10340 Nobel Ins Co 14,420 0.0006% 14,661 4,684,603 31952.82%316
246 181 29874 North American Specialty Ins Co 12,107,676 0.4633% 9,536,966 15,362,673 161.09%55
247 158 21105 North River Ins Co 1,005,817 0.0385% 275,576 45,075 16.36%180
248 164 19224 Northbrook Prop & Cas Ins Co 6,259 0.0002% 2,086 -2,842,168136249.66%327
249 44 38369 Northern Assur Co Of Amer 9,357 0.0004% 56,646 -1,400,536 -2472.44%319
250 212 19372 Northern Ins Co Of NY 985,363 0.0377% 920,523 3,217,584 349.54%181
251 41 24031 Northland Cas Co 82,340 0.0032% 87,361 128,796 147.43%282
252 41 24015 Northland Ins Co 10,903,796 0.4172% 9,564,451 8,181,172 85.54%63
253 1116 23906 Northwestern Natl Cas Co 123,234 0.0047% 74,548 15,614 20.94%272
254 38 20338 Northwestern Pacific Ind Co 283,276 0.0108% 279,793 461,489 164.94%244
255 150 24147 Old Republic Ins Co 16,548,397 0.6332% 14,804,028 30,929,551 208.93%46
256 150 40444 Old Republic Surety Co 4,917 0.0002% 17,674 -17,442 -98.69%330
257 645 14907 Oregon Mut Ins Co 1,810,343 0.0693% 1,818,744 1,182,757 65.03%150
258 1116 41408 Pacific Automobile Ins Co 204,264 0.0078% 113,914 -15,247 -13.38%254
259 626 22748 Pacific Employers Ins Co 6,344,510 0.2427% 6,415,608 422,468 6.59%86
260 38 20346 Pacific Ind Co 594,924 0.0228% 856,574 -2,097,330 -244.85%209
261 218 37338 Pacific Ins Co 1,417 0.0001% 1,417 -5,912,729417270.92%338
262 1116 23930 Pacific Natl Ins Co 4,652,805 0.1780% 4,767,509 3,530,857 74.06%103
263 37850 Pacific Specialty Ins Co 1,945,094 0.0744% 1,887,282 679,721 36.02%144
264 575 32115 Paula Ins Co 325,225 0.0124% 325,225 220,347 67.75%239
265 1218 32859 Penn-Amer Ins Co 3,717,370 0.1422% 3,596,730 2,510,981 69.81%115
266 711 35718 Phico Ins Co 721,767 0.0276% 795,844 56,271 7.07%201
267 677 18058 Philadelphia Ind Ins Co 24,018,145 0.9190% 23,873,286 12,212,894 51.16%26
268 44 40134 Potomac Ins Co Of IL 534 0.0000% 30,694 332,395 1082.93%345
269 155 24260 Progressive Cas Ins Co 5,456,843 0.2088% 4,239,894 2,726,432 64.30%94
270 155 27804 Progressive West Ins Co 113,860 0.0044% 106,445 1,326 1.25%274
271 867 12416 Protective Ins Co 4,759 0.0002% 4,759 0 0.00%331
272 304 32352 Prudential Prop & Cas Ins Co 837,809 0.0321% 791,018 -14,049 -1.78%189
273 853 15059 Public Service Mut Ins Co 554,162 0.0212% 521,207 0 0.00%215
274 38 10829 Quadrant Ind Co 1,241,615 0.0475% 678,897 334,804 49.32%169
275 158 24384 Ranger Ins Co 3,777,828 0.1445% 6,988,246 14,242,668 203.81%111
276 517 37303 Redland Ins Co 8,727,346 0.3339% 9,804,736 4,186,575 42.70%73
277 400 24449 Regent Ins Co 8,884 0.0003% 8,830 2,382 26.98%323
278 574 31089 Republic Western Ins Co 372,304 0.0142% 153,243 -1,841,627 -1201.77%231
279 783 13056 RLI Ins Co 21,531,963 0.8238% 24,070,572 16,959,717 70.46%34
280 83 22128 Rocky Mountain Fire & Cas Co 265,069 0.0101% 245,542 74,625 30.39%249
281 553 24678 Royal Ind Co 14,229,892 0.5444% 11,989,553 2,858,089 23.84%50
282 553 26980 Royal Ins Co Of Amer 24,297,220 0.9296% 21,128,299 10,142,504 48.00%25
283 10823 Sable Ins Co 128,156 0.0049% 2,716,562 2,239,207 82.43%271
284 163 24740 Safeco Ins Co Of Amer 16,740,926 0.6405% 17,245,943 9,409,936 54.56%43
285 553 24694 Safeguard Ins Co 33,026 0.0013% 30,436 57,178 187.86%302
286 74 15105 Safety Natl Cas Corp 69,298 0.0027% 68,850 4,179 6.07%285
287 140 15580 Scottsdale Ind Co 2,510,236 0.0960% 553,234 212,504 38.41%133
288 1125 10352 Scpie Ind Co 2,028,962 0.0776% 2,222,043 -852,412 -38.36%142
California Department of Insurance Page 6 of 8 Rate Specialist Bureau - 07/10/2001
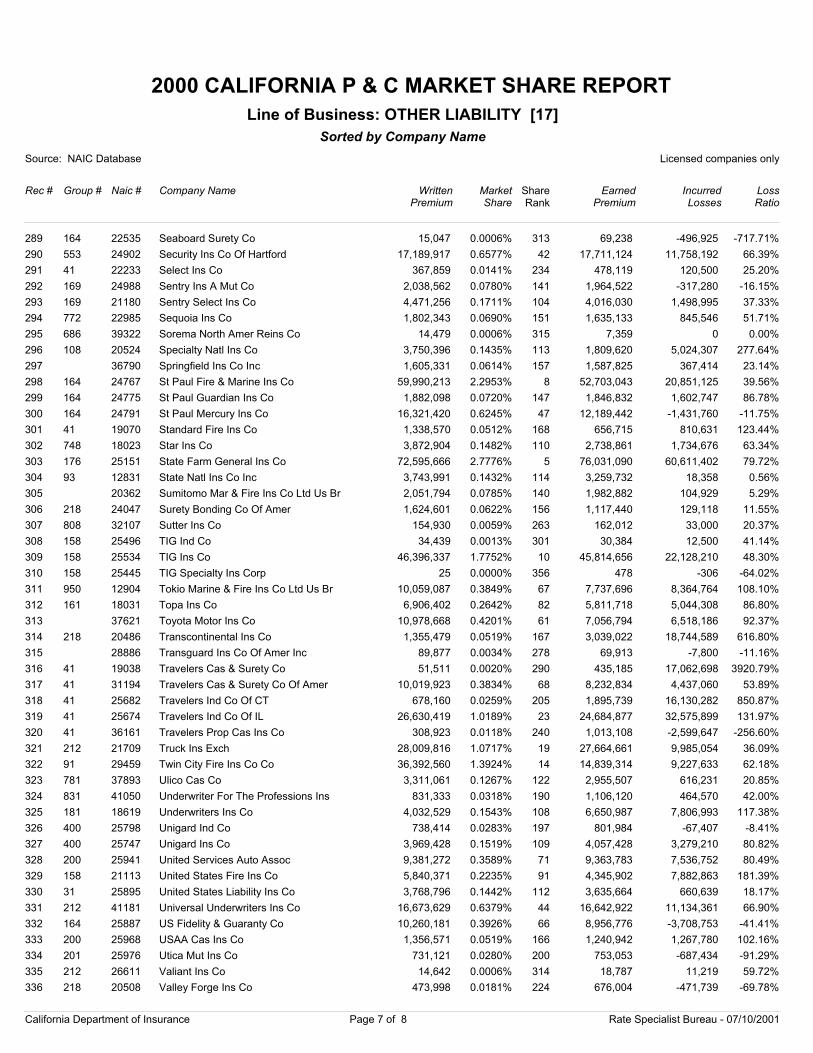
2000 CALIFORNIA P & C MARKET SHARE REPORT
Source: NAIC Database Licensed companies only
Rec # Group # Naic # Company Name
Sorted by Company Name
WrittenPremium
Market Share
EarnedPremium
IncurredLosses
LossRatio
Line of Business: OTHER LIABILITY [17]
ShareRank
289 164 22535 Seaboard Surety Co 15,047 0.0006% 69,238 -496,925 -717.71%313
290 553 24902 Security Ins Co Of Hartford 17,189,917 0.6577% 17,711,124 11,758,192 66.39%42
291 41 22233 Select Ins Co 367,859 0.0141% 478,119 120,500 25.20%234
292 169 24988 Sentry Ins A Mut Co 2,038,562 0.0780% 1,964,522 -317,280 -16.15%141
293 169 21180 Sentry Select Ins Co 4,471,256 0.1711% 4,016,030 1,498,995 37.33%104
294 772 22985 Sequoia Ins Co 1,802,343 0.0690% 1,635,133 845,546 51.71%151
295 686 39322 Sorema North Amer Reins Co 14,479 0.0006% 7,359 0 0.00%315
296 108 20524 Specialty Natl Ins Co 3,750,396 0.1435% 1,809,620 5,024,307 277.64%113
297 36790 Springfield Ins Co Inc 1,605,331 0.0614% 1,587,825 367,414 23.14%157
298 164 24767 St Paul Fire & Marine Ins Co 59,990,213 2.2953% 52,703,043 20,851,125 39.56%8
299 164 24775 St Paul Guardian Ins Co 1,882,098 0.0720% 1,846,832 1,602,747 86.78%147
300 164 24791 St Paul Mercury Ins Co 16,321,420 0.6245% 12,189,442 -1,431,760 -11.75%47
301 41 19070 Standard Fire Ins Co 1,338,570 0.0512% 656,715 810,631 123.44%168
302 748 18023 Star Ins Co 3,872,904 0.1482% 2,738,861 1,734,676 63.34%110
303 176 25151 State Farm General Ins Co 72,595,666 2.7776% 76,031,090 60,611,402 79.72%5
304 93 12831 State Natl Ins Co Inc 3,743,991 0.1432% 3,259,732 18,358 0.56%114
305 20362 Sumitomo Mar & Fire Ins Co Ltd Us Br 2,051,794 0.0785% 1,982,882 104,929 5.29%140
306 218 24047 Surety Bonding Co Of Amer 1,624,601 0.0622% 1,117,440 129,118 11.55%156
307 808 32107 Sutter Ins Co 154,930 0.0059% 162,012 33,000 20.37%263
308 158 25496 TIG Ind Co 34,439 0.0013% 30,384 12,500 41.14%301
309 158 25534 TIG Ins Co 46,396,337 1.7752% 45,814,656 22,128,210 48.30%10
310 158 25445 TIG Specialty Ins Corp 25 0.0000% 478 -306 -64.02%356
311 950 12904 Tokio Marine & Fire Ins Co Ltd Us Br 10,059,087 0.3849% 7,737,696 8,364,764 108.10%67
312 161 18031 Topa Ins Co 6,906,402 0.2642% 5,811,718 5,044,308 86.80%82
313 37621 Toyota Motor Ins Co 10,978,668 0.4201% 7,056,794 6,518,186 92.37%61
314 218 20486 Transcontinental Ins Co 1,355,479 0.0519% 3,039,022 18,744,589 616.80%167
315 28886 Transguard Ins Co Of Amer Inc 89,877 0.0034% 69,913 -7,800 -11.16%278
316 41 19038 Travelers Cas & Surety Co 51,511 0.0020% 435,185 17,062,698 3920.79%290
317 41 31194 Travelers Cas & Surety Co Of Amer 10,019,923 0.3834% 8,232,834 4,437,060 53.89%68
318 41 25682 Travelers Ind Co Of CT 678,160 0.0259% 1,895,739 16,130,282 850.87%205
319 41 25674 Travelers Ind Co Of IL 26,630,419 1.0189% 24,684,877 32,575,899 131.97%23
320 41 36161 Travelers Prop Cas Ins Co 308,923 0.0118% 1,013,108 -2,599,647 -256.60%240
321 212 21709 Truck Ins Exch 28,009,816 1.0717% 27,664,661 9,985,054 36.09%19
322 91 29459 Twin City Fire Ins Co Co 36,392,560 1.3924% 14,839,314 9,227,633 62.18%14
323 781 37893 Ulico Cas Co 3,311,061 0.1267% 2,955,507 616,231 20.85%122
324 831 41050 Underwriter For The Professions Ins 831,333 0.0318% 1,106,120 464,570 42.00%190
325 181 18619 Underwriters Ins Co 4,032,529 0.1543% 6,650,987 7,806,993 117.38%108
326 400 25798 Unigard Ind Co 738,414 0.0283% 801,984 -67,407 -8.41%197
327 400 25747 Unigard Ins Co 3,969,428 0.1519% 4,057,428 3,279,210 80.82%109
328 200 25941 United Services Auto Assoc 9,381,272 0.3589% 9,363,783 7,536,752 80.49%71
329 158 21113 United States Fire Ins Co 5,840,371 0.2235% 4,345,902 7,882,863 181.39%91
330 31 25895 United States Liability Ins Co 3,768,796 0.1442% 3,635,664 660,639 18.17%112
331 212 41181 Universal Underwriters Ins Co 16,673,629 0.6379% 16,642,922 11,134,361 66.90%44
332 164 25887 US Fidelity & Guaranty Co 10,260,181 0.3926% 8,956,776 -3,708,753 -41.41%66
333 200 25968 USAA Cas Ins Co 1,356,571 0.0519% 1,240,942 1,267,780 102.16%166
334 201 25976 Utica Mut Ins Co 731,121 0.0280% 753,053 -687,434 -91.29%200
335 212 26611 Valiant Ins Co 14,642 0.0006% 18,787 11,219 59.72%314
336 218 20508 Valley Forge Ins Co 473,998 0.0181% 676,004 -471,739 -69.78%224
California Department of Insurance Page 7 of 8 Rate Specialist Bureau - 07/10/2001
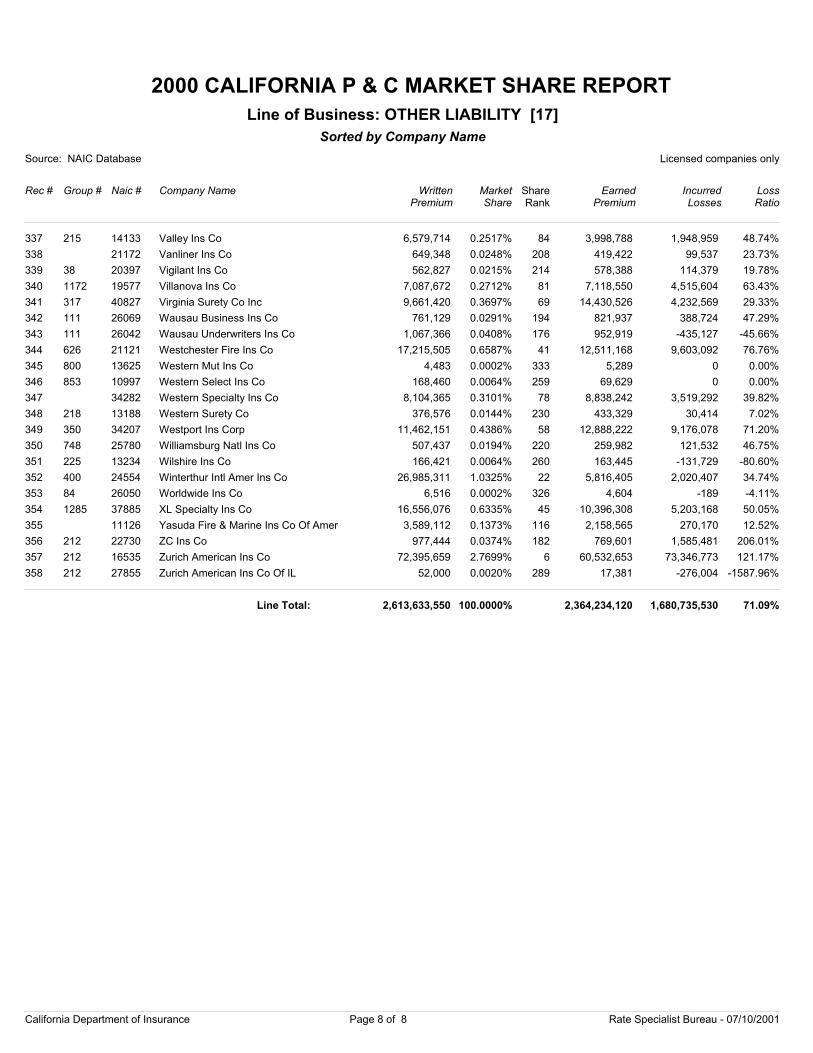
2000 CALIFORNIA P & C MARKET SHARE REPORT
Source: NAIC Database Licensed companies only
Rec # Group # Naic # Company Name
Sorted by Company Name
WrittenPremium
Market Share
EarnedPremium
IncurredLosses
LossRatio
Line of Business: OTHER LIABILITY [17]
ShareRank
337 215 14133 Valley Ins Co 6,579,714 0.2517% 3,998,788 1,948,959 48.74%84
338 21172 Vanliner Ins Co 649,348 0.0248% 419,422 99,537 23.73%208
339 38 20397 Vigilant Ins Co 562,827 0.0215% 578,388 114,379 19.78%214
340 1172 19577 Villanova Ins Co 7,087,672 0.2712% 7,118,550 4,515,604 63.43%81
341 317 40827 Virginia Surety Co Inc 9,661,420 0.3697% 14,430,526 4,232,569 29.33%69
342 111 26069 Wausau Business Ins Co 761,129 0.0291% 821,937 388,724 47.29%194
343 111 26042 Wausau Underwriters Ins Co 1,067,366 0.0408% 952,919 -435,127 -45.66%176
344 626 21121 Westchester Fire Ins Co 17,215,505 0.6587% 12,511,168 9,603,092 76.76%41
345 800 13625 Western Mut Ins Co 4,483 0.0002% 5,289 0 0.00%333
346 853 10997 Western Select Ins Co 168,460 0.0064% 69,629 0 0.00%259
347 34282 Western Specialty Ins Co 8,104,365 0.3101% 8,838,242 3,519,292 39.82%78
348 218 13188 Western Surety Co 376,576 0.0144% 433,329 30,414 7.02%230
349 350 34207 Westport Ins Corp 11,462,151 0.4386% 12,888,222 9,176,078 71.20%58
350 748 25780 Williamsburg Natl Ins Co 507,437 0.0194% 259,982 121,532 46.75%220
351 225 13234 Wilshire Ins Co 166,421 0.0064% 163,445 -131,729 -80.60%260
352 400 24554 Winterthur Intl Amer Ins Co 26,985,311 1.0325% 5,816,405 2,020,407 34.74%22
353 84 26050 Worldwide Ins Co 6,516 0.0002% 4,604 -189 -4.11%326
354 1285 37885 XL Specialty Ins Co 16,556,076 0.6335% 10,396,308 5,203,168 50.05%45
355 11126 Yasuda Fire & Marine Ins Co Of Amer 3,589,112 0.1373% 2,158,565 270,170 12.52%116
356 212 22730 ZC Ins Co 977,444 0.0374% 769,601 1,585,481 206.01%182
357 212 16535 Zurich American Ins Co 72,395,659 2.7699% 60,532,653 73,346,773 121.17%6
358 212 27855 Zurich American Ins Co Of IL 52,000 0.0020% 17,381 -276,004 -1587.96%289
2,613,633,550 100.0000% 2,364,234,120 1,680,735,530 71.09%Line Total:
California Department of Insurance Page 8 of 8 Rate Specialist Bureau - 07/10/2001
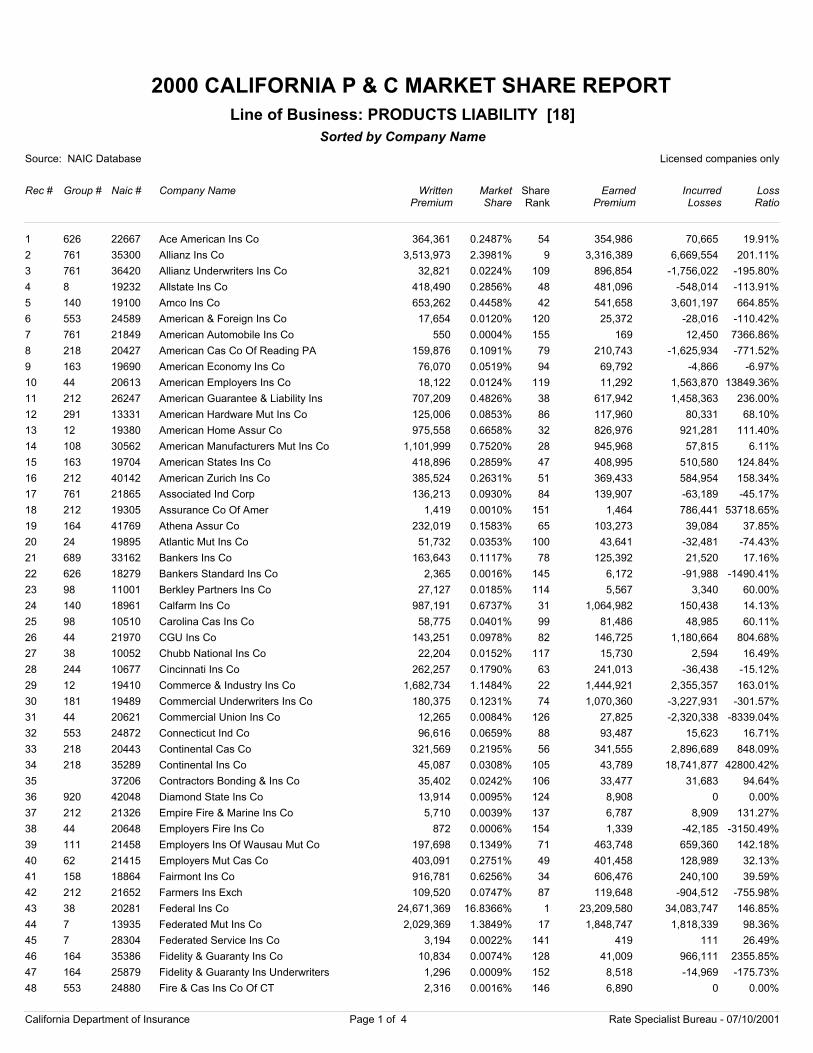
2000 CALIFORNIA P & C MARKET SHARE REPORT
Source: NAIC Database Licensed companies only
Rec # Group # Naic # Company Name
Sorted by Company Name
WrittenPremium
Market Share
EarnedPremium
IncurredLosses
LossRatio
Line of Business: PRODUCTS LIABILITY [18]
ShareRank
1 626 22667 Ace American Ins Co 364,361 0.2487% 354,986 70,665 19.91%54
2 761 35300 Allianz Ins Co 3,513,973 2.3981% 3,316,389 6,669,554 201.11%9
3 761 36420 Allianz Underwriters Ins Co 32,821 0.0224% 896,854 -1,756,022 -195.80%109
4 8 19232 Allstate Ins Co 418,490 0.2856% 481,096 -548,014 -113.91%48
5 140 19100 Amco Ins Co 653,262 0.4458% 541,658 3,601,197 664.85%42
6 553 24589 American & Foreign Ins Co 17,654 0.0120% 25,372 -28,016 -110.42%120
7 761 21849 American Automobile Ins Co 550 0.0004% 169 12,450 7366.86%155
8 218 20427 American Cas Co Of Reading PA 159,876 0.1091% 210,743 -1,625,934 -771.52%79
9 163 19690 American Economy Ins Co 76,070 0.0519% 69,792 -4,866 -6.97%94
10 44 20613 American Employers Ins Co 18,122 0.0124% 11,292 1,563,870 13849.36%119
11 212 26247 American Guarantee & Liability Ins 707,209 0.4826% 617,942 1,458,363 236.00%38
12 291 13331 American Hardware Mut Ins Co 125,006 0.0853% 117,960 80,331 68.10%86
13 12 19380 American Home Assur Co 975,558 0.6658% 826,976 921,281 111.40%32
14 108 30562 American Manufacturers Mut Ins Co 1,101,999 0.7520% 945,968 57,815 6.11%28
15 163 19704 American States Ins Co 418,896 0.2859% 408,995 510,580 124.84%47
16 212 40142 American Zurich Ins Co 385,524 0.2631% 369,433 584,954 158.34%51
17 761 21865 Associated Ind Corp 136,213 0.0930% 139,907 -63,189 -45.17%84
18 212 19305 Assurance Co Of Amer 1,419 0.0010% 1,464 786,441 53718.65%151
19 164 41769 Athena Assur Co 232,019 0.1583% 103,273 39,084 37.85%65
20 24 19895 Atlantic Mut Ins Co 51,732 0.0353% 43,641 -32,481 -74.43%100
21 689 33162 Bankers Ins Co 163,643 0.1117% 125,392 21,520 17.16%78
22 626 18279 Bankers Standard Ins Co 2,365 0.0016% 6,172 -91,988 -1490.41%145
23 98 11001 Berkley Partners Ins Co 27,127 0.0185% 5,567 3,340 60.00%114
24 140 18961 Calfarm Ins Co 987,191 0.6737% 1,064,982 150,438 14.13%31
25 98 10510 Carolina Cas Ins Co 58,775 0.0401% 81,486 48,985 60.11%99
26 44 21970 CGU Ins Co 143,251 0.0978% 146,725 1,180,664 804.68%82
27 38 10052 Chubb National Ins Co 22,204 0.0152% 15,730 2,594 16.49%117
28 244 10677 Cincinnati Ins Co 262,257 0.1790% 241,013 -36,438 -15.12%63
29 12 19410 Commerce & Industry Ins Co 1,682,734 1.1484% 1,444,921 2,355,357 163.01%22
30 181 19489 Commercial Underwriters Ins Co 180,375 0.1231% 1,070,360 -3,227,931 -301.57%74
31 44 20621 Commercial Union Ins Co 12,265 0.0084% 27,825 -2,320,338 -8339.04%126
32 553 24872 Connecticut Ind Co 96,616 0.0659% 93,487 15,623 16.71%88
33 218 20443 Continental Cas Co 321,569 0.2195% 341,555 2,896,689 848.09%56
34 218 35289 Continental Ins Co 45,087 0.0308% 43,789 18,741,877 42800.42%105
35 37206 Contractors Bonding & Ins Co 35,402 0.0242% 33,477 31,683 94.64%106
36 920 42048 Diamond State Ins Co 13,914 0.0095% 8,908 0 0.00%124
37 212 21326 Empire Fire & Marine Ins Co 5,710 0.0039% 6,787 8,909 131.27%137
38 44 20648 Employers Fire Ins Co 872 0.0006% 1,339 -42,185 -3150.49%154
39 111 21458 Employers Ins Of Wausau Mut Co 197,698 0.1349% 463,748 659,360 142.18%71
40 62 21415 Employers Mut Cas Co 403,091 0.2751% 401,458 128,989 32.13%49
41 158 18864 Fairmont Ins Co 916,781 0.6256% 606,476 240,100 39.59%34
42 212 21652 Farmers Ins Exch 109,520 0.0747% 119,648 -904,512 -755.98%87
43 38 20281 Federal Ins Co 24,671,369 16.8366% 23,209,580 34,083,747 146.85%1
44 7 13935 Federated Mut Ins Co 2,029,369 1.3849% 1,848,747 1,818,339 98.36%17
45 7 28304 Federated Service Ins Co 3,194 0.0022% 419 111 26.49%141
46 164 35386 Fidelity & Guaranty Ins Co 10,834 0.0074% 41,009 966,111 2355.85%128
47 164 25879 Fidelity & Guaranty Ins Underwriters 1,296 0.0009% 8,518 -14,969 -175.73%152
48 553 24880 Fire & Cas Ins Co Of CT 2,316 0.0016% 6,890 0 0.00%146
California Department of Insurance Page 1 of 4 Rate Specialist Bureau - 07/10/2001
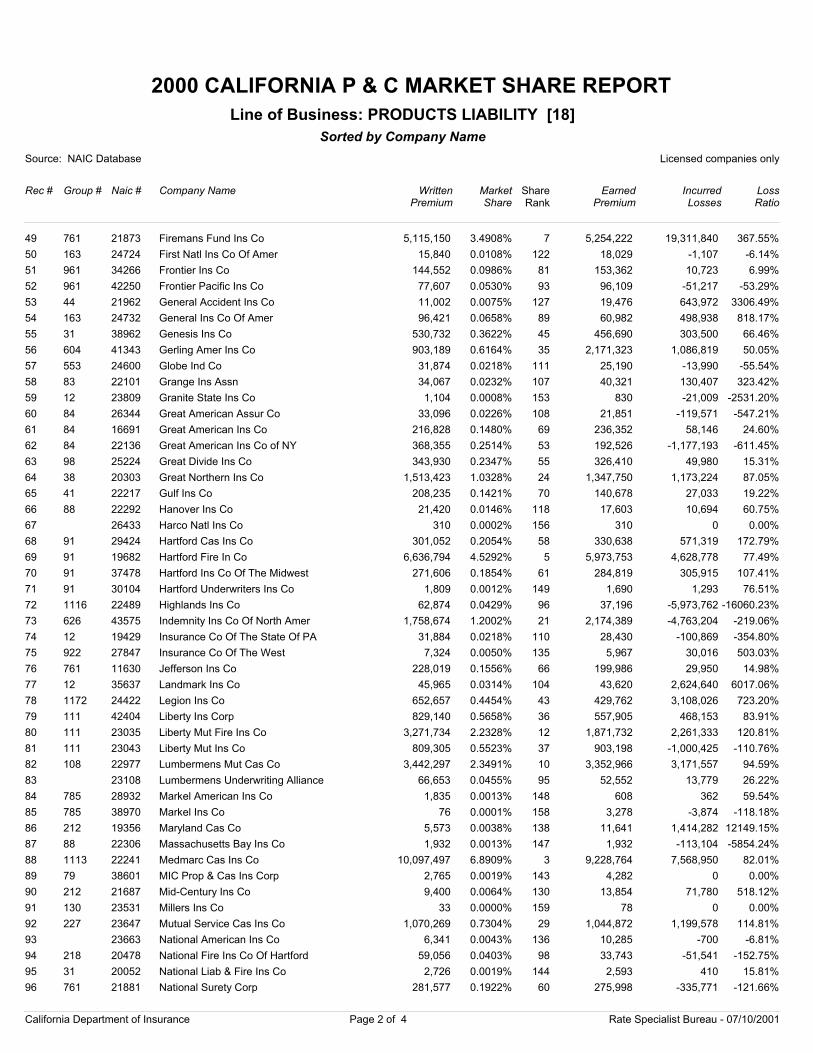
2000 CALIFORNIA P & C MARKET SHARE REPORT
Source: NAIC Database Licensed companies only
Rec # Group # Naic # Company Name
Sorted by Company Name
WrittenPremium
Market Share
EarnedPremium
IncurredLosses
LossRatio
Line of Business: PRODUCTS LIABILITY [18]
ShareRank
49 761 21873 Firemans Fund Ins Co 5,115,150 3.4908% 5,254,222 19,311,840 367.55%7
50 163 24724 First Natl Ins Co Of Amer 15,840 0.0108% 18,029 -1,107 -6.14%122
51 961 34266 Frontier Ins Co 144,552 0.0986% 153,362 10,723 6.99%81
52 961 42250 Frontier Pacific Ins Co 77,607 0.0530% 96,109 -51,217 -53.29%93
53 44 21962 General Accident Ins Co 11,002 0.0075% 19,476 643,972 3306.49%127
54 163 24732 General Ins Co Of Amer 96,421 0.0658% 60,982 498,938 818.17%89
55 31 38962 Genesis Ins Co 530,732 0.3622% 456,690 303,500 66.46%45
56 604 41343 Gerling Amer Ins Co 903,189 0.6164% 2,171,323 1,086,819 50.05%35
57 553 24600 Globe Ind Co 31,874 0.0218% 25,190 -13,990 -55.54%111
58 83 22101 Grange Ins Assn 34,067 0.0232% 40,321 130,407 323.42%107
59 12 23809 Granite State Ins Co 1,104 0.0008% 830 -21,009 -2531.20%153
60 84 26344 Great American Assur Co 33,096 0.0226% 21,851 -119,571 -547.21%108
61 84 16691 Great American Ins Co 216,828 0.1480% 236,352 58,146 24.60%69
62 84 22136 Great American Ins Co of NY 368,355 0.2514% 192,526 -1,177,193 -611.45%53
63 98 25224 Great Divide Ins Co 343,930 0.2347% 326,410 49,980 15.31%55
64 38 20303 Great Northern Ins Co 1,513,423 1.0328% 1,347,750 1,173,224 87.05%24
65 41 22217 Gulf Ins Co 208,235 0.1421% 140,678 27,033 19.22%70
66 88 22292 Hanover Ins Co 21,420 0.0146% 17,603 10,694 60.75%118
67 26433 Harco Natl Ins Co 310 0.0002% 310 0 0.00%156
68 91 29424 Hartford Cas Ins Co 301,052 0.2054% 330,638 571,319 172.79%58
69 91 19682 Hartford Fire In Co 6,636,794 4.5292% 5,973,753 4,628,778 77.49%5
70 91 37478 Hartford Ins Co Of The Midwest 271,606 0.1854% 284,819 305,915 107.41%61
71 91 30104 Hartford Underwriters Ins Co 1,809 0.0012% 1,690 1,293 76.51%149
72 1116 22489 Highlands Ins Co 62,874 0.0429% 37,196 -5,973,762 -16060.23%96
73 626 43575 Indemnity Ins Co Of North Amer 1,758,674 1.2002% 2,174,389 -4,763,204 -219.06%21
74 12 19429 Insurance Co Of The State Of PA 31,884 0.0218% 28,430 -100,869 -354.80%110
75 922 27847 Insurance Co Of The West 7,324 0.0050% 5,967 30,016 503.03%135
76 761 11630 Jefferson Ins Co 228,019 0.1556% 199,986 29,950 14.98%66
77 12 35637 Landmark Ins Co 45,965 0.0314% 43,620 2,624,640 6017.06%104
78 1172 24422 Legion Ins Co 652,657 0.4454% 429,762 3,108,026 723.20%43
79 111 42404 Liberty Ins Corp 829,140 0.5658% 557,905 468,153 83.91%36
80 111 23035 Liberty Mut Fire Ins Co 3,271,734 2.2328% 1,871,732 2,261,333 120.81%12
81 111 23043 Liberty Mut Ins Co 809,305 0.5523% 903,198 -1,000,425 -110.76%37
82 108 22977 Lumbermens Mut Cas Co 3,442,297 2.3491% 3,352,966 3,171,557 94.59%10
83 23108 Lumbermens Underwriting Alliance 66,653 0.0455% 52,552 13,779 26.22%95
84 785 28932 Markel American Ins Co 1,835 0.0013% 608 362 59.54%148
85 785 38970 Markel Ins Co 76 0.0001% 3,278 -3,874 -118.18%158
86 212 19356 Maryland Cas Co 5,573 0.0038% 11,641 1,414,282 12149.15%138
87 88 22306 Massachusetts Bay Ins Co 1,932 0.0013% 1,932 -113,104 -5854.24%147
88 1113 22241 Medmarc Cas Ins Co 10,097,497 6.8909% 9,228,764 7,568,950 82.01%3
89 79 38601 MIC Prop & Cas Ins Corp 2,765 0.0019% 4,282 0 0.00%143
90 212 21687 Mid-Century Ins Co 9,400 0.0064% 13,854 71,780 518.12%130
91 130 23531 Millers Ins Co 33 0.0000% 78 0 0.00%159
92 227 23647 Mutual Service Cas Ins Co 1,070,269 0.7304% 1,044,872 1,199,578 114.81%29
93 23663 National American Ins Co 6,341 0.0043% 10,285 -700 -6.81%136
94 218 20478 National Fire Ins Co Of Hartford 59,056 0.0403% 33,743 -51,541 -152.75%98
95 31 20052 National Liab & Fire Ins Co 2,726 0.0019% 2,593 410 15.81%144
96 761 21881 National Surety Corp 281,577 0.1922% 275,998 -335,771 -121.66%60
California Department of Insurance Page 2 of 4 Rate Specialist Bureau - 07/10/2001
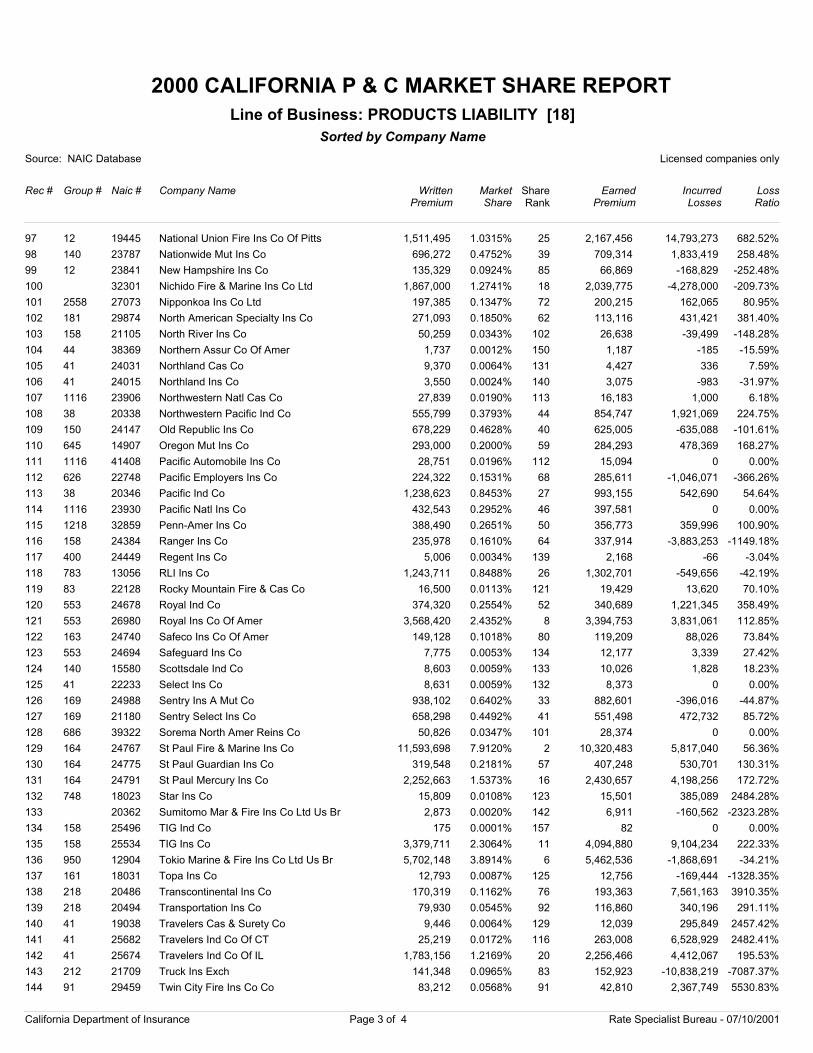
2000 CALIFORNIA P & C MARKET SHARE REPORT
Source: NAIC Database Licensed companies only
Rec # Group # Naic # Company Name
Sorted by Company Name
WrittenPremium
Market Share
EarnedPremium
IncurredLosses
LossRatio
Line of Business: PRODUCTS LIABILITY [18]
ShareRank
97 12 19445 National Union Fire Ins Co Of Pitts 1,511,495 1.0315% 2,167,456 14,793,273 682.52%25
98 140 23787 Nationwide Mut Ins Co 696,272 0.4752% 709,314 1,833,419 258.48%39
99 12 23841 New Hampshire Ins Co 135,329 0.0924% 66,869 -168,829 -252.48%85
100 32301 Nichido Fire & Marine Ins Co Ltd 1,867,000 1.2741% 2,039,775 -4,278,000 -209.73%18
101 2558 27073 Nipponkoa Ins Co Ltd 197,385 0.1347% 200,215 162,065 80.95%72
102 181 29874 North American Specialty Ins Co 271,093 0.1850% 113,116 431,421 381.40%62
103 158 21105 North River Ins Co 50,259 0.0343% 26,638 -39,499 -148.28%102
104 44 38369 Northern Assur Co Of Amer 1,737 0.0012% 1,187 -185 -15.59%150
105 41 24031 Northland Cas Co 9,370 0.0064% 4,427 336 7.59%131
106 41 24015 Northland Ins Co 3,550 0.0024% 3,075 -983 -31.97%140
107 1116 23906 Northwestern Natl Cas Co 27,839 0.0190% 16,183 1,000 6.18%113
108 38 20338 Northwestern Pacific Ind Co 555,799 0.3793% 854,747 1,921,069 224.75%44
109 150 24147 Old Republic Ins Co 678,229 0.4628% 625,005 -635,088 -101.61%40
110 645 14907 Oregon Mut Ins Co 293,000 0.2000% 284,293 478,369 168.27%59
111 1116 41408 Pacific Automobile Ins Co 28,751 0.0196% 15,094 0 0.00%112
112 626 22748 Pacific Employers Ins Co 224,322 0.1531% 285,611 -1,046,071 -366.26%68
113 38 20346 Pacific Ind Co 1,238,623 0.8453% 993,155 542,690 54.64%27
114 1116 23930 Pacific Natl Ins Co 432,543 0.2952% 397,581 0 0.00%46
115 1218 32859 Penn-Amer Ins Co 388,490 0.2651% 356,773 359,996 100.90%50
116 158 24384 Ranger Ins Co 235,978 0.1610% 337,914 -3,883,253 -1149.18%64
117 400 24449 Regent Ins Co 5,006 0.0034% 2,168 -66 -3.04%139
118 783 13056 RLI Ins Co 1,243,711 0.8488% 1,302,701 -549,656 -42.19%26
119 83 22128 Rocky Mountain Fire & Cas Co 16,500 0.0113% 19,429 13,620 70.10%121
120 553 24678 Royal Ind Co 374,320 0.2554% 340,689 1,221,345 358.49%52
121 553 26980 Royal Ins Co Of Amer 3,568,420 2.4352% 3,394,753 3,831,061 112.85%8
122 163 24740 Safeco Ins Co Of Amer 149,128 0.1018% 119,209 88,026 73.84%80
123 553 24694 Safeguard Ins Co 7,775 0.0053% 12,177 3,339 27.42%134
124 140 15580 Scottsdale Ind Co 8,603 0.0059% 10,026 1,828 18.23%133
125 41 22233 Select Ins Co 8,631 0.0059% 8,373 0 0.00%132
126 169 24988 Sentry Ins A Mut Co 938,102 0.6402% 882,601 -396,016 -44.87%33
127 169 21180 Sentry Select Ins Co 658,298 0.4492% 551,498 472,732 85.72%41
128 686 39322 Sorema North Amer Reins Co 50,826 0.0347% 28,374 0 0.00%101
129 164 24767 St Paul Fire & Marine Ins Co 11,593,698 7.9120% 10,320,483 5,817,040 56.36%2
130 164 24775 St Paul Guardian Ins Co 319,548 0.2181% 407,248 530,701 130.31%57
131 164 24791 St Paul Mercury Ins Co 2,252,663 1.5373% 2,430,657 4,198,256 172.72%16
132 748 18023 Star Ins Co 15,809 0.0108% 15,501 385,089 2484.28%123
133 20362 Sumitomo Mar & Fire Ins Co Ltd Us Br 2,873 0.0020% 6,911 -160,562 -2323.28%142
134 158 25496 TIG Ind Co 175 0.0001% 82 0 0.00%157
135 158 25534 TIG Ins Co 3,379,711 2.3064% 4,094,880 9,104,234 222.33%11
136 950 12904 Tokio Marine & Fire Ins Co Ltd Us Br 5,702,148 3.8914% 5,462,536 -1,868,691 -34.21%6
137 161 18031 Topa Ins Co 12,793 0.0087% 12,756 -169,444 -1328.35%125
138 218 20486 Transcontinental Ins Co 170,319 0.1162% 193,363 7,561,163 3910.35%76
139 218 20494 Transportation Ins Co 79,930 0.0545% 116,860 340,196 291.11%92
140 41 19038 Travelers Cas & Surety Co 9,446 0.0064% 12,039 295,849 2457.42%129
141 41 25682 Travelers Ind Co Of CT 25,219 0.0172% 263,008 6,528,929 2482.41%116
142 41 25674 Travelers Ind Co Of IL 1,783,156 1.2169% 2,256,466 4,412,067 195.53%20
143 212 21709 Truck Ins Exch 141,348 0.0965% 152,923 -10,838,219 -7087.37%83
144 91 29459 Twin City Fire Ins Co Co 83,212 0.0568% 42,810 2,367,749 5530.83%91
California Department of Insurance Page 3 of 4 Rate Specialist Bureau - 07/10/2001
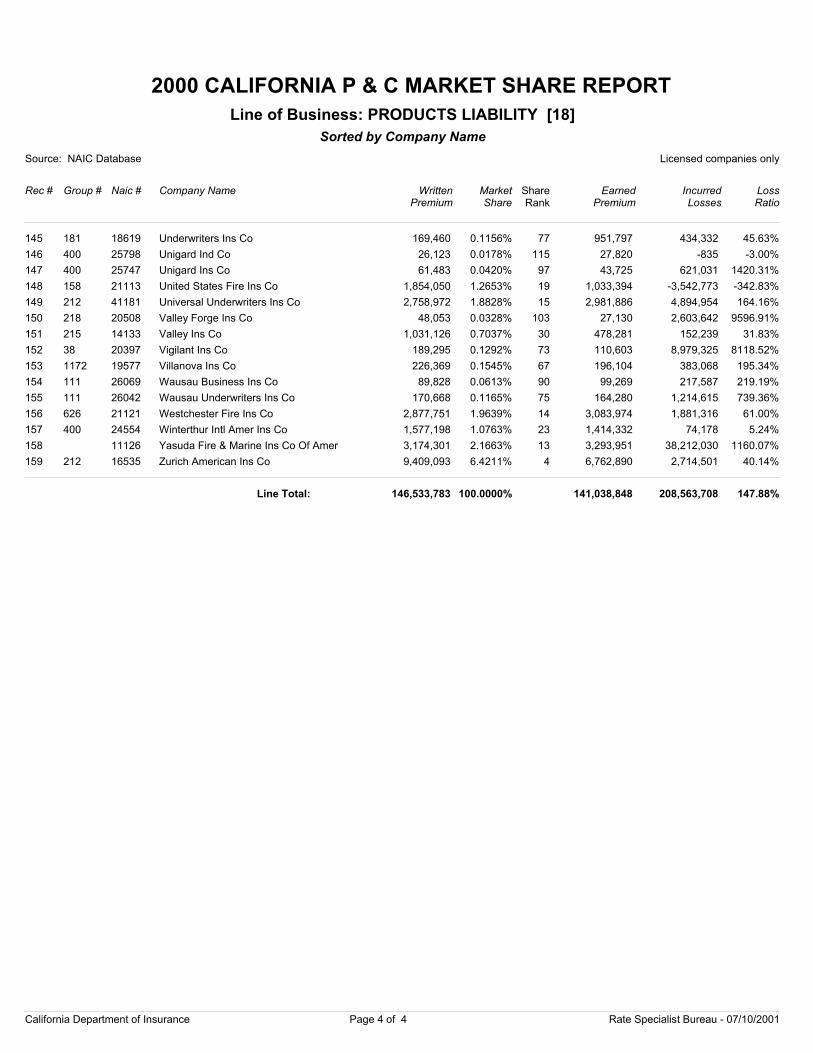
2000 CALIFORNIA P & C MARKET SHARE REPORT
Source: NAIC Database Licensed companies only
Rec # Group # Naic # Company Name
Sorted by Company Name
WrittenPremium
Market Share
EarnedPremium
IncurredLosses
LossRatio
Line of Business: PRODUCTS LIABILITY [18]
ShareRank
145 181 18619 Underwriters Ins Co 169,460 0.1156% 951,797 434,332 45.63%77
146 400 25798 Unigard Ind Co 26,123 0.0178% 27,820 -835 -3.00%115
147 400 25747 Unigard Ins Co 61,483 0.0420% 43,725 621,031 1420.31%97
148 158 21113 United States Fire Ins Co 1,854,050 1.2653% 1,033,394 -3,542,773 -342.83%19
149 212 41181 Universal Underwriters Ins Co 2,758,972 1.8828% 2,981,886 4,894,954 164.16%15
150 218 20508 Valley Forge Ins Co 48,053 0.0328% 27,130 2,603,642 9596.91%103
151 215 14133 Valley Ins Co 1,031,126 0.7037% 478,281 152,239 31.83%30
152 38 20397 Vigilant Ins Co 189,295 0.1292% 110,603 8,979,325 8118.52%73
153 1172 19577 Villanova Ins Co 226,369 0.1545% 196,104 383,068 195.34%67
154 111 26069 Wausau Business Ins Co 89,828 0.0613% 99,269 217,587 219.19%90
155 111 26042 Wausau Underwriters Ins Co 170,668 0.1165% 164,280 1,214,615 739.36%75
156 626 21121 Westchester Fire Ins Co 2,877,751 1.9639% 3,083,974 1,881,316 61.00%14
157 400 24554 Winterthur Intl Amer Ins Co 1,577,198 1.0763% 1,414,332 74,178 5.24%23
158 11126 Yasuda Fire & Marine Ins Co Of Amer 3,174,301 2.1663% 3,293,951 38,212,030 1160.07%13
159 212 16535 Zurich American Ins Co 9,409,093 6.4211% 6,762,890 2,714,501 40.14%4
146,533,783 100.0000% 141,038,848 208,563,708 147.88%Line Total:
California Department of Insurance Page 4 of 4 Rate Specialist Bureau - 07/10/2001
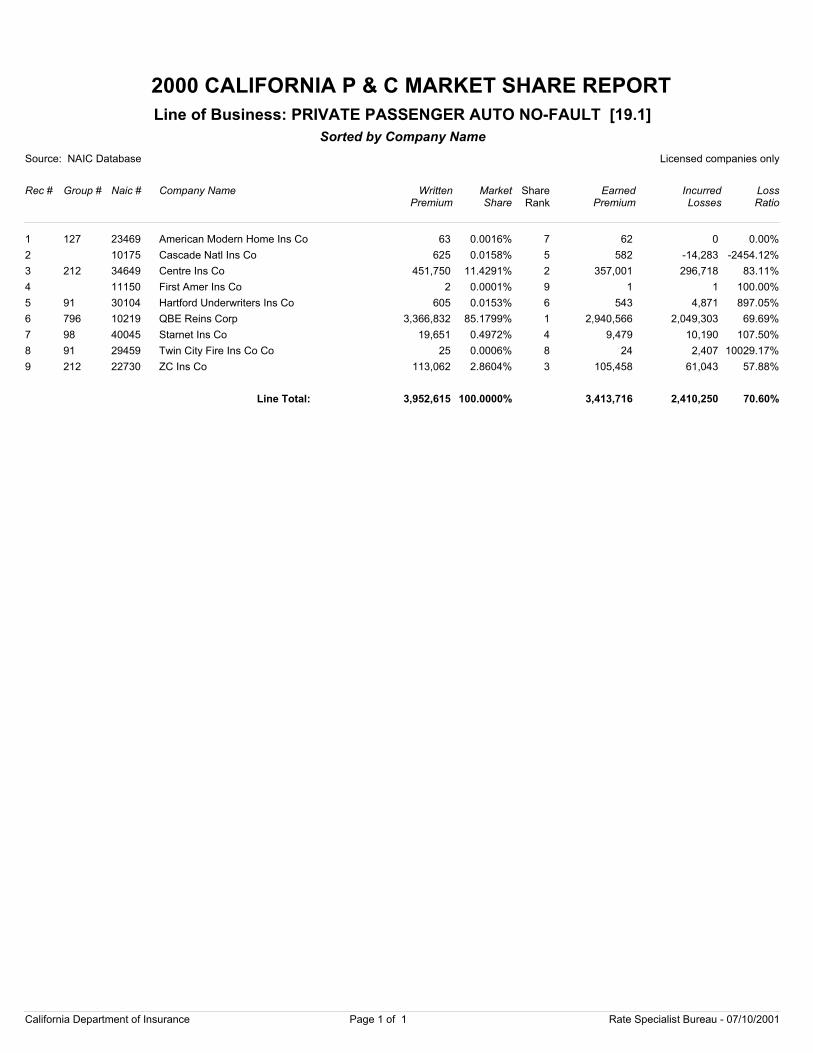
2000 CALIFORNIA P & C MARKET SHARE REPORT
Source: NAIC Database Licensed companies only
Rec # Group # Naic # Company Name
Sorted by Company Name
WrittenPremium
Market Share
EarnedPremium
IncurredLosses
LossRatio
Line of Business: PRIVATE PASSENGER AUTO NO-FAULT [19.1]
ShareRank
1 127 23469 American Modern Home Ins Co 63 0.0016% 62 0 0.00%7
2 10175 Cascade Natl Ins Co 625 0.0158% 582 -14,283 -2454.12%5
3 212 34649 Centre Ins Co 451,750 11.4291% 357,001 296,718 83.11%2
4 11150 First Amer Ins Co 2 0.0001% 1 1 100.00%9
5 91 30104 Hartford Underwriters Ins Co 605 0.0153% 543 4,871 897.05%6
6 796 10219 QBE Reins Corp 3,366,832 85.1799% 2,940,566 2,049,303 69.69%1
7 98 40045 Starnet Ins Co 19,651 0.4972% 9,479 10,190 107.50%4
8 91 29459 Twin City Fire Ins Co Co 25 0.0006% 24 2,407 10029.17%8
9 212 22730 ZC Ins Co 113,062 2.8604% 105,458 61,043 57.88%3
3,952,615 100.0000% 3,413,716 2,410,250 70.60%Line Total:
California Department of Insurance Page 1 of 1 Rate Specialist Bureau - 07/10/2001
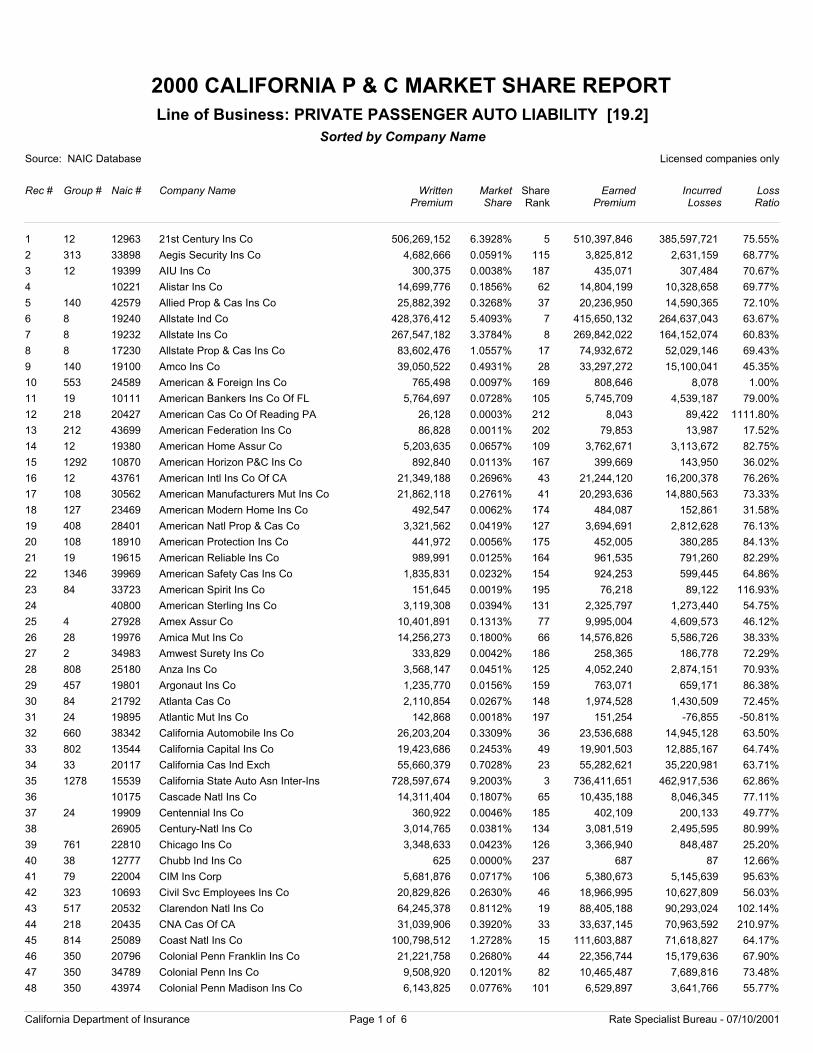
2000 CALIFORNIA P & C MARKET SHARE REPORT
Source: NAIC Database Licensed companies only
Rec # Group # Naic # Company Name
Sorted by Company Name
WrittenPremium
Market Share
EarnedPremium
IncurredLosses
LossRatio
Line of Business: PRIVATE PASSENGER AUTO LIABILITY [19.2]
ShareRank
1 12 12963 21st Century Ins Co 506,269,152 6.3928% 510,397,846 385,597,721 75.55%5
2 313 33898 Aegis Security Ins Co 4,682,666 0.0591% 3,825,812 2,631,159 68.77%115
3 12 19399 AIU Ins Co 300,375 0.0038% 435,071 307,484 70.67%187
4 10221 Alistar Ins Co 14,699,776 0.1856% 14,804,199 10,328,658 69.77%62
5 140 42579 Allied Prop & Cas Ins Co 25,882,392 0.3268% 20,236,950 14,590,365 72.10%37
6 8 19240 Allstate Ind Co 428,376,412 5.4093% 415,650,132 264,637,043 63.67%7
7 8 19232 Allstate Ins Co 267,547,182 3.3784% 269,842,022 164,152,074 60.83%8
8 8 17230 Allstate Prop & Cas Ins Co 83,602,476 1.0557% 74,932,672 52,029,146 69.43%17
9 140 19100 Amco Ins Co 39,050,522 0.4931% 33,297,272 15,100,041 45.35%28
10 553 24589 American & Foreign Ins Co 765,498 0.0097% 808,646 8,078 1.00%169
11 19 10111 American Bankers Ins Co Of FL 5,764,697 0.0728% 5,745,709 4,539,187 79.00%105
12 218 20427 American Cas Co Of Reading PA 26,128 0.0003% 8,043 89,422 1111.80%212
13 212 43699 American Federation Ins Co 86,828 0.0011% 79,853 13,987 17.52%202
14 12 19380 American Home Assur Co 5,203,635 0.0657% 3,762,671 3,113,672 82.75%109
15 1292 10870 American Horizon P&C Ins Co 892,840 0.0113% 399,669 143,950 36.02%167
16 12 43761 American Intl Ins Co Of CA 21,349,188 0.2696% 21,244,120 16,200,378 76.26%43
17 108 30562 American Manufacturers Mut Ins Co 21,862,118 0.2761% 20,293,636 14,880,563 73.33%41
18 127 23469 American Modern Home Ins Co 492,547 0.0062% 484,087 152,861 31.58%174
19 408 28401 American Natl Prop & Cas Co 3,321,562 0.0419% 3,694,691 2,812,628 76.13%127
20 108 18910 American Protection Ins Co 441,972 0.0056% 452,005 380,285 84.13%175
21 19 19615 American Reliable Ins Co 989,991 0.0125% 961,535 791,260 82.29%164
22 1346 39969 American Safety Cas Ins Co 1,835,831 0.0232% 924,253 599,445 64.86%154
23 84 33723 American Spirit Ins Co 151,645 0.0019% 76,218 89,122 116.93%195
24 40800 American Sterling Ins Co 3,119,308 0.0394% 2,325,797 1,273,440 54.75%131
25 4 27928 Amex Assur Co 10,401,891 0.1313% 9,995,004 4,609,573 46.12%77
26 28 19976 Amica Mut Ins Co 14,256,273 0.1800% 14,576,826 5,586,726 38.33%66
27 2 34983 Amwest Surety Ins Co 333,829 0.0042% 258,365 186,778 72.29%186
28 808 25180 Anza Ins Co 3,568,147 0.0451% 4,052,240 2,874,151 70.93%125
29 457 19801 Argonaut Ins Co 1,235,770 0.0156% 763,071 659,171 86.38%159
30 84 21792 Atlanta Cas Co 2,110,854 0.0267% 1,974,528 1,430,509 72.45%148
31 24 19895 Atlantic Mut Ins Co 142,868 0.0018% 151,254 -76,855 -50.81%197
32 660 38342 California Automobile Ins Co 26,203,204 0.3309% 23,536,688 14,945,128 63.50%36
33 802 13544 California Capital Ins Co 19,423,686 0.2453% 19,901,503 12,885,167 64.74%49
34 33 20117 California Cas Ind Exch 55,660,379 0.7028% 55,282,621 35,220,981 63.71%23
35 1278 15539 California State Auto Asn Inter-Ins 728,597,674 9.2003% 736,411,651 462,917,536 62.86%3
36 10175 Cascade Natl Ins Co 14,311,404 0.1807% 10,435,188 8,046,345 77.11%65
37 24 19909 Centennial Ins Co 360,922 0.0046% 402,109 200,133 49.77%185
38 26905 Century-Natl Ins Co 3,014,765 0.0381% 3,081,519 2,495,595 80.99%134
39 761 22810 Chicago Ins Co 3,348,633 0.0423% 3,366,940 848,487 25.20%126
40 38 12777 Chubb Ind Ins Co 625 0.0000% 687 87 12.66%237
41 79 22004 CIM Ins Corp 5,681,876 0.0717% 5,380,673 5,145,639 95.63%106
42 323 10693 Civil Svc Employees Ins Co 20,829,826 0.2630% 18,966,995 10,627,809 56.03%46
43 517 20532 Clarendon Natl Ins Co 64,245,378 0.8112% 88,405,188 90,293,024 102.14%19
44 218 20435 CNA Cas Of CA 31,039,906 0.3920% 33,637,145 70,963,592 210.97%33
45 814 25089 Coast Natl Ins Co 100,798,512 1.2728% 111,603,887 71,618,827 64.17%15
46 350 20796 Colonial Penn Franklin Ins Co 21,221,758 0.2680% 22,356,744 15,179,636 67.90%44
47 350 34789 Colonial Penn Ins Co 9,508,920 0.1201% 10,465,487 7,689,816 73.48%82
48 350 43974 Colonial Penn Madison Ins Co 6,143,825 0.0776% 6,529,897 3,641,766 55.77%101
California Department of Insurance Page 1 of 6 Rate Specialist Bureau - 07/10/2001
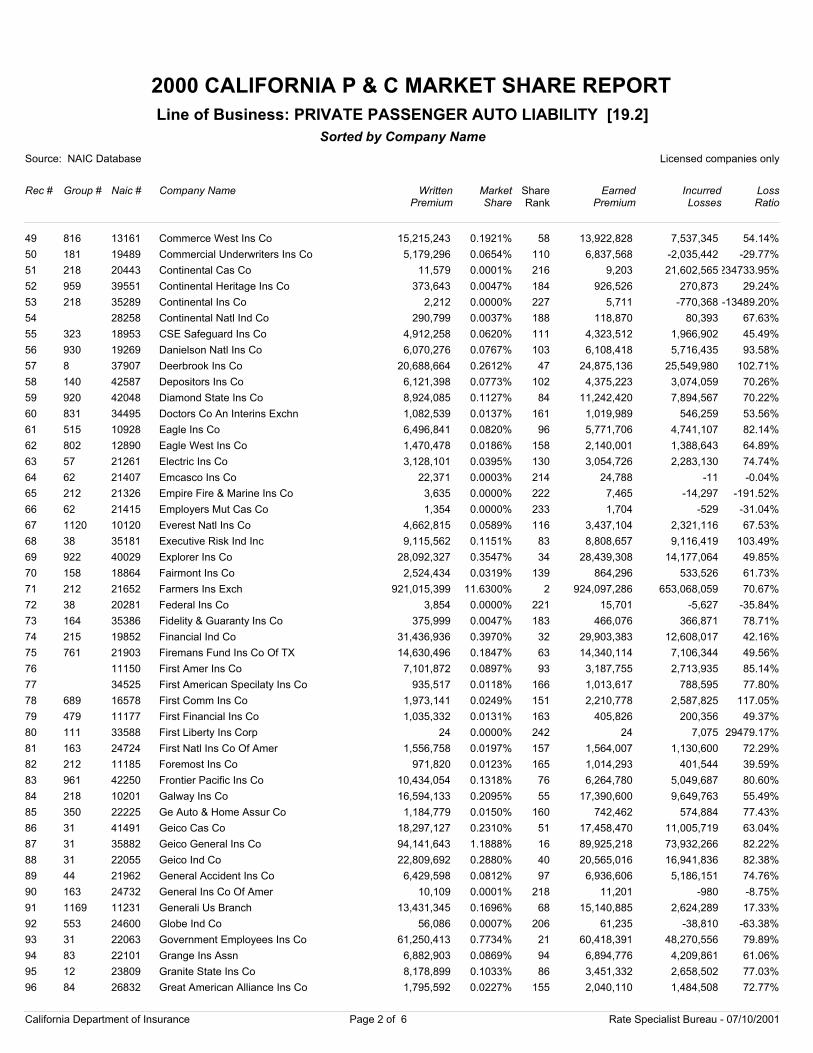
2000 CALIFORNIA P & C MARKET SHARE REPORT
Source: NAIC Database Licensed companies only
Rec # Group # Naic # Company Name
Sorted by Company Name
WrittenPremium
Market Share
EarnedPremium
IncurredLosses
LossRatio
Line of Business: PRIVATE PASSENGER AUTO LIABILITY [19.2]
ShareRank
49 816 13161 Commerce West Ins Co 15,215,243 0.1921% 13,922,828 7,537,345 54.14%58
50 181 19489 Commercial Underwriters Ins Co 5,179,296 0.0654% 6,837,568 -2,035,442 -29.77%110
51 218 20443 Continental Cas Co 11,579 0.0001% 9,203 21,602,565234733.95%216
52 959 39551 Continental Heritage Ins Co 373,643 0.0047% 926,526 270,873 29.24%184
53 218 35289 Continental Ins Co 2,212 0.0000% 5,711 -770,368 -13489.20%227
54 28258 Continental Natl Ind Co 290,799 0.0037% 118,870 80,393 67.63%188
55 323 18953 CSE Safeguard Ins Co 4,912,258 0.0620% 4,323,512 1,966,902 45.49%111
56 930 19269 Danielson Natl Ins Co 6,070,276 0.0767% 6,108,418 5,716,435 93.58%103
57 8 37907 Deerbrook Ins Co 20,688,664 0.2612% 24,875,136 25,549,980 102.71%47
58 140 42587 Depositors Ins Co 6,121,398 0.0773% 4,375,223 3,074,059 70.26%102
59 920 42048 Diamond State Ins Co 8,924,085 0.1127% 11,242,420 7,894,567 70.22%84
60 831 34495 Doctors Co An Interins Exchn 1,082,539 0.0137% 1,019,989 546,259 53.56%161
61 515 10928 Eagle Ins Co 6,496,841 0.0820% 5,771,706 4,741,107 82.14%96
62 802 12890 Eagle West Ins Co 1,470,478 0.0186% 2,140,001 1,388,643 64.89%158
63 57 21261 Electric Ins Co 3,128,101 0.0395% 3,054,726 2,283,130 74.74%130
64 62 21407 Emcasco Ins Co 22,371 0.0003% 24,788 -11 -0.04%214
65 212 21326 Empire Fire & Marine Ins Co 3,635 0.0000% 7,465 -14,297 -191.52%222
66 62 21415 Employers Mut Cas Co 1,354 0.0000% 1,704 -529 -31.04%233
67 1120 10120 Everest Natl Ins Co 4,662,815 0.0589% 3,437,104 2,321,116 67.53%116
68 38 35181 Executive Risk Ind Inc 9,115,562 0.1151% 8,808,657 9,116,419 103.49%83
69 922 40029 Explorer Ins Co 28,092,327 0.3547% 28,439,308 14,177,064 49.85%34
70 158 18864 Fairmont Ins Co 2,524,434 0.0319% 864,296 533,526 61.73%139
71 212 21652 Farmers Ins Exch 921,015,399 11.6300% 924,097,286 653,068,059 70.67%2
72 38 20281 Federal Ins Co 3,854 0.0000% 15,701 -5,627 -35.84%221
73 164 35386 Fidelity & Guaranty Ins Co 375,999 0.0047% 466,076 366,871 78.71%183
74 215 19852 Financial Ind Co 31,436,936 0.3970% 29,903,383 12,608,017 42.16%32
75 761 21903 Firemans Fund Ins Co Of TX 14,630,496 0.1847% 14,340,114 7,106,344 49.56%63
76 11150 First Amer Ins Co 7,101,872 0.0897% 3,187,755 2,713,935 85.14%93
77 34525 First American Specilaty Ins Co 935,517 0.0118% 1,013,617 788,595 77.80%166
78 689 16578 First Comm Ins Co 1,973,141 0.0249% 2,210,778 2,587,825 117.05%151
79 479 11177 First Financial Ins Co 1,035,332 0.0131% 405,826 200,356 49.37%163
80 111 33588 First Liberty Ins Corp 24 0.0000% 24 7,075 29479.17%242
81 163 24724 First Natl Ins Co Of Amer 1,556,758 0.0197% 1,564,007 1,130,600 72.29%157
82 212 11185 Foremost Ins Co 971,820 0.0123% 1,014,293 401,544 39.59%165
83 961 42250 Frontier Pacific Ins Co 10,434,054 0.1318% 6,264,780 5,049,687 80.60%76
84 218 10201 Galway Ins Co 16,594,133 0.2095% 17,390,600 9,649,763 55.49%55
85 350 22225 Ge Auto & Home Assur Co 1,184,779 0.0150% 742,462 574,884 77.43%160
86 31 41491 Geico Cas Co 18,297,127 0.2310% 17,458,470 11,005,719 63.04%51
87 31 35882 Geico General Ins Co 94,141,643 1.1888% 89,925,218 73,932,266 82.22%16
88 31 22055 Geico Ind Co 22,809,692 0.2880% 20,565,016 16,941,836 82.38%40
89 44 21962 General Accident Ins Co 6,429,598 0.0812% 6,936,606 5,186,151 74.76%97
90 163 24732 General Ins Co Of Amer 10,109 0.0001% 11,201 -980 -8.75%218
91 1169 11231 Generali Us Branch 13,431,345 0.1696% 15,140,885 2,624,289 17.33%68
92 553 24600 Globe Ind Co 56,086 0.0007% 61,235 -38,810 -63.38%206
93 31 22063 Government Employees Ins Co 61,250,413 0.7734% 60,418,391 48,270,556 79.89%21
94 83 22101 Grange Ins Assn 6,882,903 0.0869% 6,894,776 4,209,861 61.06%94
95 12 23809 Granite State Ins Co 8,178,899 0.1033% 3,451,332 2,658,502 77.03%86
96 84 26832 Great American Alliance Ins Co 1,795,592 0.0227% 2,040,110 1,484,508 72.77%155
California Department of Insurance Page 2 of 6 Rate Specialist Bureau - 07/10/2001
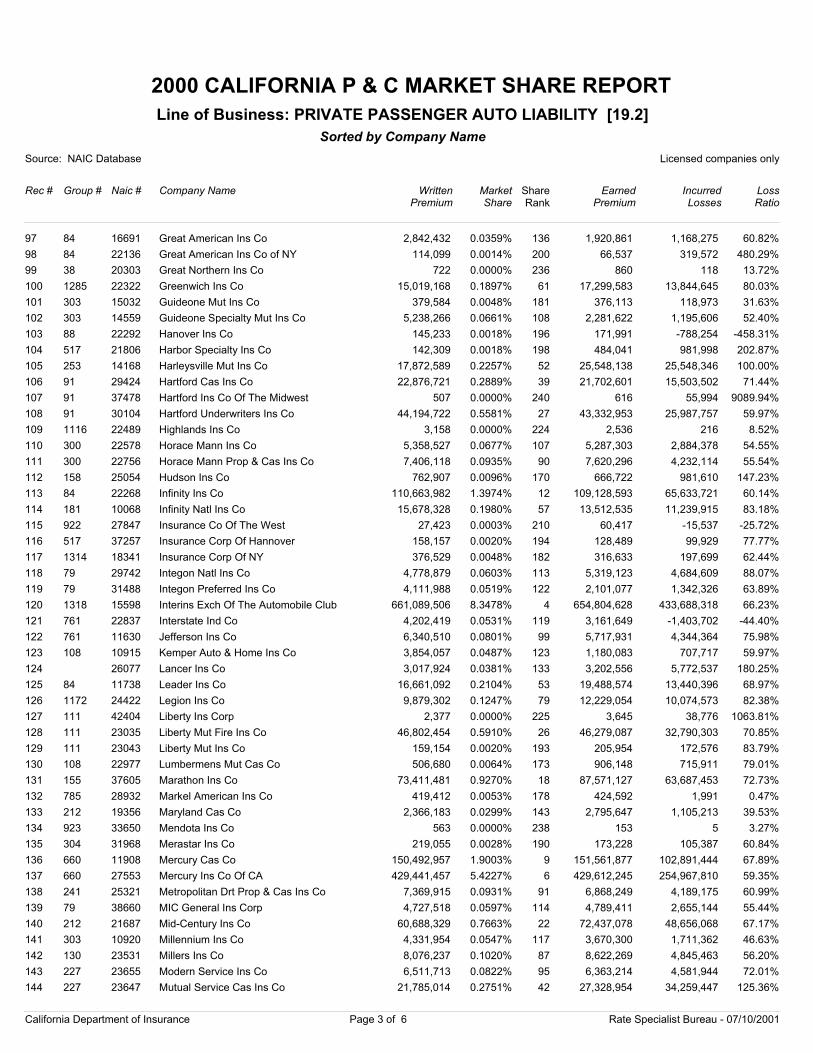
2000 CALIFORNIA P & C MARKET SHARE REPORT
Source: NAIC Database Licensed companies only
Rec # Group # Naic # Company Name
Sorted by Company Name
WrittenPremium
Market Share
EarnedPremium
IncurredLosses
LossRatio
Line of Business: PRIVATE PASSENGER AUTO LIABILITY [19.2]
ShareRank
97 84 16691 Great American Ins Co 2,842,432 0.0359% 1,920,861 1,168,275 60.82%136
98 84 22136 Great American Ins Co of NY 114,099 0.0014% 66,537 319,572 480.29%200
99 38 20303 Great Northern Ins Co 722 0.0000% 860 118 13.72%236
100 1285 22322 Greenwich Ins Co 15,019,168 0.1897% 17,299,583 13,844,645 80.03%61
101 303 15032 Guideone Mut Ins Co 379,584 0.0048% 376,113 118,973 31.63%181
102 303 14559 Guideone Specialty Mut Ins Co 5,238,266 0.0661% 2,281,622 1,195,606 52.40%108
103 88 22292 Hanover Ins Co 145,233 0.0018% 171,991 -788,254 -458.31%196
104 517 21806 Harbor Specialty Ins Co 142,309 0.0018% 484,041 981,998 202.87%198
105 253 14168 Harleysville Mut Ins Co 17,872,589 0.2257% 25,548,138 25,548,346 100.00%52
106 91 29424 Hartford Cas Ins Co 22,876,721 0.2889% 21,702,601 15,503,502 71.44%39
107 91 37478 Hartford Ins Co Of The Midwest 507 0.0000% 616 55,994 9089.94%240
108 91 30104 Hartford Underwriters Ins Co 44,194,722 0.5581% 43,332,953 25,987,757 59.97%27
109 1116 22489 Highlands Ins Co 3,158 0.0000% 2,536 216 8.52%224
110 300 22578 Horace Mann Ins Co 5,358,527 0.0677% 5,287,303 2,884,378 54.55%107
111 300 22756 Horace Mann Prop & Cas Ins Co 7,406,118 0.0935% 7,620,296 4,232,114 55.54%90
112 158 25054 Hudson Ins Co 762,907 0.0096% 666,722 981,610 147.23%170
113 84 22268 Infinity Ins Co 110,663,982 1.3974% 109,128,593 65,633,721 60.14%12
114 181 10068 Infinity Natl Ins Co 15,678,328 0.1980% 13,512,535 11,239,915 83.18%57
115 922 27847 Insurance Co Of The West 27,423 0.0003% 60,417 -15,537 -25.72%210
116 517 37257 Insurance Corp Of Hannover 158,157 0.0020% 128,489 99,929 77.77%194
117 1314 18341 Insurance Corp Of NY 376,529 0.0048% 316,633 197,699 62.44%182
118 79 29742 Integon Natl Ins Co 4,778,879 0.0603% 5,319,123 4,684,609 88.07%113
119 79 31488 Integon Preferred Ins Co 4,111,988 0.0519% 2,101,077 1,342,326 63.89%122
120 1318 15598 Interins Exch Of The Automobile Club 661,089,506 8.3478% 654,804,628 433,688,318 66.23%4
121 761 22837 Interstate Ind Co 4,202,419 0.0531% 3,161,649 -1,403,702 -44.40%119
122 761 11630 Jefferson Ins Co 6,340,510 0.0801% 5,717,931 4,344,364 75.98%99
123 108 10915 Kemper Auto & Home Ins Co 3,854,057 0.0487% 1,180,083 707,717 59.97%123
124 26077 Lancer Ins Co 3,017,924 0.0381% 3,202,556 5,772,537 180.25%133
125 84 11738 Leader Ins Co 16,661,092 0.2104% 19,488,574 13,440,396 68.97%53
126 1172 24422 Legion Ins Co 9,879,302 0.1247% 12,229,054 10,074,573 82.38%79
127 111 42404 Liberty Ins Corp 2,377 0.0000% 3,645 38,776 1063.81%225
128 111 23035 Liberty Mut Fire Ins Co 46,802,454 0.5910% 46,279,087 32,790,303 70.85%26
129 111 23043 Liberty Mut Ins Co 159,154 0.0020% 205,954 172,576 83.79%193
130 108 22977 Lumbermens Mut Cas Co 506,680 0.0064% 906,148 715,911 79.01%173
131 155 37605 Marathon Ins Co 73,411,481 0.9270% 87,571,127 63,687,453 72.73%18
132 785 28932 Markel American Ins Co 419,412 0.0053% 424,592 1,991 0.47%178
133 212 19356 Maryland Cas Co 2,366,183 0.0299% 2,795,647 1,105,213 39.53%143
134 923 33650 Mendota Ins Co 563 0.0000% 153 5 3.27%238
135 304 31968 Merastar Ins Co 219,055 0.0028% 173,228 105,387 60.84%190
136 660 11908 Mercury Cas Co 150,492,957 1.9003% 151,561,877 102,891,444 67.89%9
137 660 27553 Mercury Ins Co Of CA 429,441,457 5.4227% 429,612,245 254,967,810 59.35%6
138 241 25321 Metropolitan Drt Prop & Cas Ins Co 7,369,915 0.0931% 6,868,249 4,189,175 60.99%91
139 79 38660 MIC General Ins Corp 4,727,518 0.0597% 4,789,411 2,655,144 55.44%114
140 212 21687 Mid-Century Ins Co 60,688,329 0.7663% 72,437,078 48,656,068 67.17%22
141 303 10920 Millennium Ins Co 4,331,954 0.0547% 3,670,300 1,711,362 46.63%117
142 130 23531 Millers Ins Co 8,076,237 0.1020% 8,622,269 4,845,463 56.20%87
143 227 23655 Modern Service Ins Co 6,511,713 0.0822% 6,363,214 4,581,944 72.01%95
144 227 23647 Mutual Service Cas Ins Co 21,785,014 0.2751% 27,328,954 34,259,447 125.36%42
California Department of Insurance Page 3 of 6 Rate Specialist Bureau - 07/10/2001
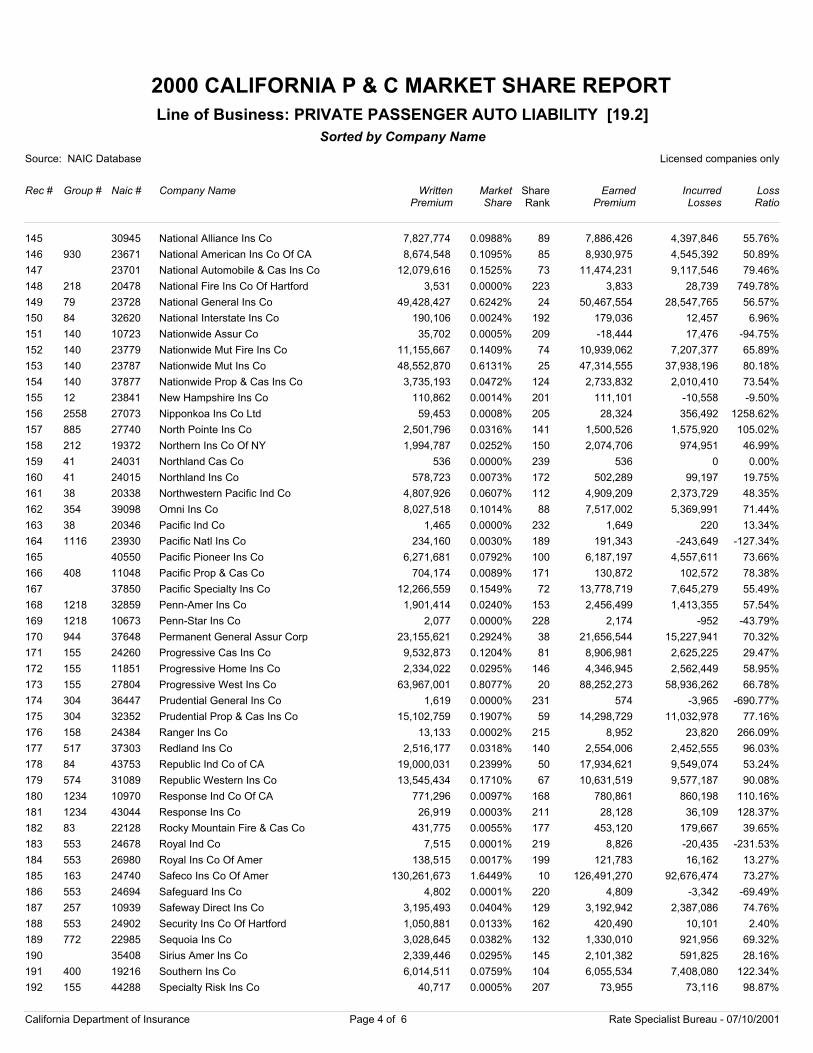
2000 CALIFORNIA P & C MARKET SHARE REPORT
Source: NAIC Database Licensed companies only
Rec # Group # Naic # Company Name
Sorted by Company Name
WrittenPremium
Market Share
EarnedPremium
IncurredLosses
LossRatio
Line of Business: PRIVATE PASSENGER AUTO LIABILITY [19.2]
ShareRank
145 30945 National Alliance Ins Co 7,827,774 0.0988% 7,886,426 4,397,846 55.76%89
146 930 23671 National American Ins Co Of CA 8,674,548 0.1095% 8,930,975 4,545,392 50.89%85
147 23701 National Automobile & Cas Ins Co 12,079,616 0.1525% 11,474,231 9,117,546 79.46%73
148 218 20478 National Fire Ins Co Of Hartford 3,531 0.0000% 3,833 28,739 749.78%223
149 79 23728 National General Ins Co 49,428,427 0.6242% 50,467,554 28,547,765 56.57%24
150 84 32620 National Interstate Ins Co 190,106 0.0024% 179,036 12,457 6.96%192
151 140 10723 Nationwide Assur Co 35,702 0.0005% -18,444 17,476 -94.75%209
152 140 23779 Nationwide Mut Fire Ins Co 11,155,667 0.1409% 10,939,062 7,207,377 65.89%74
153 140 23787 Nationwide Mut Ins Co 48,552,870 0.6131% 47,314,555 37,938,196 80.18%25
154 140 37877 Nationwide Prop & Cas Ins Co 3,735,193 0.0472% 2,733,832 2,010,410 73.54%124
155 12 23841 New Hampshire Ins Co 110,862 0.0014% 111,101 -10,558 -9.50%201
156 2558 27073 Nipponkoa Ins Co Ltd 59,453 0.0008% 28,324 356,492 1258.62%205
157 885 27740 North Pointe Ins Co 2,501,796 0.0316% 1,500,526 1,575,920 105.02%141
158 212 19372 Northern Ins Co Of NY 1,994,787 0.0252% 2,074,706 974,951 46.99%150
159 41 24031 Northland Cas Co 536 0.0000% 536 0 0.00%239
160 41 24015 Northland Ins Co 578,723 0.0073% 502,289 99,197 19.75%172
161 38 20338 Northwestern Pacific Ind Co 4,807,926 0.0607% 4,909,209 2,373,729 48.35%112
162 354 39098 Omni Ins Co 8,027,518 0.1014% 7,517,002 5,369,991 71.44%88
163 38 20346 Pacific Ind Co 1,465 0.0000% 1,649 220 13.34%232
164 1116 23930 Pacific Natl Ins Co 234,160 0.0030% 191,343 -243,649 -127.34%189
165 40550 Pacific Pioneer Ins Co 6,271,681 0.0792% 6,187,197 4,557,611 73.66%100
166 408 11048 Pacific Prop & Cas Co 704,174 0.0089% 130,872 102,572 78.38%171
167 37850 Pacific Specialty Ins Co 12,266,559 0.1549% 13,778,719 7,645,279 55.49%72
168 1218 32859 Penn-Amer Ins Co 1,901,414 0.0240% 2,456,499 1,413,355 57.54%153
169 1218 10673 Penn-Star Ins Co 2,077 0.0000% 2,174 -952 -43.79%228
170 944 37648 Permanent General Assur Corp 23,155,621 0.2924% 21,656,544 15,227,941 70.32%38
171 155 24260 Progressive Cas Ins Co 9,532,873 0.1204% 8,906,981 2,625,225 29.47%81
172 155 11851 Progressive Home Ins Co 2,334,022 0.0295% 4,346,945 2,562,449 58.95%146
173 155 27804 Progressive West Ins Co 63,967,001 0.8077% 88,252,273 58,936,262 66.78%20
174 304 36447 Prudential General Ins Co 1,619 0.0000% 574 -3,965 -690.77%231
175 304 32352 Prudential Prop & Cas Ins Co 15,102,759 0.1907% 14,298,729 11,032,978 77.16%59
176 158 24384 Ranger Ins Co 13,133 0.0002% 8,952 23,820 266.09%215
177 517 37303 Redland Ins Co 2,516,177 0.0318% 2,554,006 2,452,555 96.03%140
178 84 43753 Republic Ind Co of CA 19,000,031 0.2399% 17,934,621 9,549,074 53.24%50
179 574 31089 Republic Western Ins Co 13,545,434 0.1710% 10,631,519 9,577,187 90.08%67
180 1234 10970 Response Ind Co Of CA 771,296 0.0097% 780,861 860,198 110.16%168
181 1234 43044 Response Ins Co 26,919 0.0003% 28,128 36,109 128.37%211
182 83 22128 Rocky Mountain Fire & Cas Co 431,775 0.0055% 453,120 179,667 39.65%177
183 553 24678 Royal Ind Co 7,515 0.0001% 8,826 -20,435 -231.53%219
184 553 26980 Royal Ins Co Of Amer 138,515 0.0017% 121,783 16,162 13.27%199
185 163 24740 Safeco Ins Co Of Amer 130,261,673 1.6449% 126,491,270 92,676,474 73.27%10
186 553 24694 Safeguard Ins Co 4,802 0.0001% 4,809 -3,342 -69.49%220
187 257 10939 Safeway Direct Ins Co 3,195,493 0.0404% 3,192,942 2,387,086 74.76%129
188 553 24902 Security Ins Co Of Hartford 1,050,881 0.0133% 420,490 10,101 2.40%162
189 772 22985 Sequoia Ins Co 3,028,645 0.0382% 1,330,010 921,956 69.32%132
190 35408 Sirius Amer Ins Co 2,339,446 0.0295% 2,101,382 591,825 28.16%145
191 400 19216 Southern Ins Co 6,014,511 0.0759% 6,055,534 7,408,080 122.34%104
192 155 44288 Specialty Risk Ins Co 40,717 0.0005% 73,955 73,116 98.87%207
California Department of Insurance Page 4 of 6 Rate Specialist Bureau - 07/10/2001
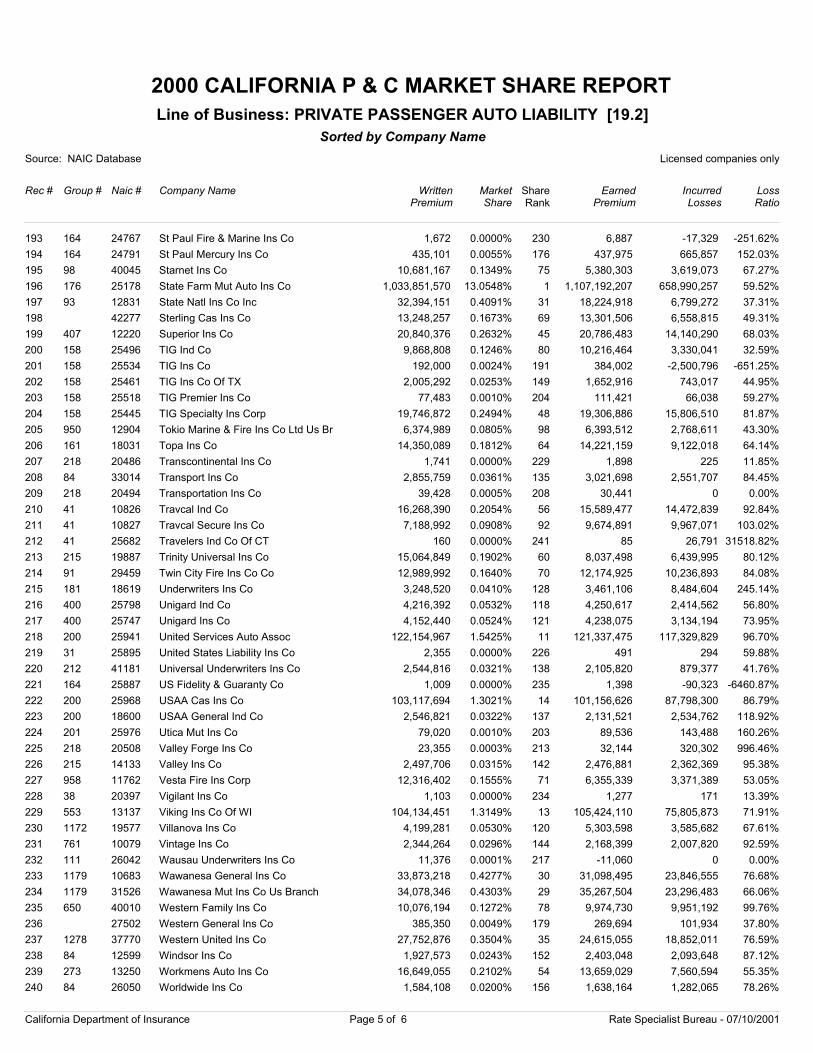
2000 CALIFORNIA P & C MARKET SHARE REPORT
Source: NAIC Database Licensed companies only
Rec # Group # Naic # Company Name
Sorted by Company Name
WrittenPremium
Market Share
EarnedPremium
IncurredLosses
LossRatio
Line of Business: PRIVATE PASSENGER AUTO LIABILITY [19.2]
ShareRank
193 164 24767 St Paul Fire & Marine Ins Co 1,672 0.0000% 6,887 -17,329 -251.62%230
194 164 24791 St Paul Mercury Ins Co 435,101 0.0055% 437,975 665,857 152.03%176
195 98 40045 Starnet Ins Co 10,681,167 0.1349% 5,380,303 3,619,073 67.27%75
196 176 25178 State Farm Mut Auto Ins Co 1,033,851,570 13.0548% 1,107,192,207 658,990,257 59.52%1
197 93 12831 State Natl Ins Co Inc 32,394,151 0.4091% 18,224,918 6,799,272 37.31%31
198 42277 Sterling Cas Ins Co 13,248,257 0.1673% 13,301,506 6,558,815 49.31%69
199 407 12220 Superior Ins Co 20,840,376 0.2632% 20,786,483 14,140,290 68.03%45
200 158 25496 TIG Ind Co 9,868,808 0.1246% 10,216,464 3,330,041 32.59%80
201 158 25534 TIG Ins Co 192,000 0.0024% 384,002 -2,500,796 -651.25%191
202 158 25461 TIG Ins Co Of TX 2,005,292 0.0253% 1,652,916 743,017 44.95%149
203 158 25518 TIG Premier Ins Co 77,483 0.0010% 111,421 66,038 59.27%204
204 158 25445 TIG Specialty Ins Corp 19,746,872 0.2494% 19,306,886 15,806,510 81.87%48
205 950 12904 Tokio Marine & Fire Ins Co Ltd Us Br 6,374,989 0.0805% 6,393,512 2,768,611 43.30%98
206 161 18031 Topa Ins Co 14,350,089 0.1812% 14,221,159 9,122,018 64.14%64
207 218 20486 Transcontinental Ins Co 1,741 0.0000% 1,898 225 11.85%229
208 84 33014 Transport Ins Co 2,855,759 0.0361% 3,021,698 2,551,707 84.45%135
209 218 20494 Transportation Ins Co 39,428 0.0005% 30,441 0 0.00%208
210 41 10826 Travcal Ind Co 16,268,390 0.2054% 15,589,477 14,472,839 92.84%56
211 41 10827 Travcal Secure Ins Co 7,188,992 0.0908% 9,674,891 9,967,071 103.02%92
212 41 25682 Travelers Ind Co Of CT 160 0.0000% 85 26,791 31518.82%241
213 215 19887 Trinity Universal Ins Co 15,064,849 0.1902% 8,037,498 6,439,995 80.12%60
214 91 29459 Twin City Fire Ins Co Co 12,989,992 0.1640% 12,174,925 10,236,893 84.08%70
215 181 18619 Underwriters Ins Co 3,248,520 0.0410% 3,461,106 8,484,604 245.14%128
216 400 25798 Unigard Ind Co 4,216,392 0.0532% 4,250,617 2,414,562 56.80%118
217 400 25747 Unigard Ins Co 4,152,440 0.0524% 4,238,075 3,134,194 73.95%121
218 200 25941 United Services Auto Assoc 122,154,967 1.5425% 121,337,475 117,329,829 96.70%11
219 31 25895 United States Liability Ins Co 2,355 0.0000% 491 294 59.88%226
220 212 41181 Universal Underwriters Ins Co 2,544,816 0.0321% 2,105,820 879,377 41.76%138
221 164 25887 US Fidelity & Guaranty Co 1,009 0.0000% 1,398 -90,323 -6460.87%235
222 200 25968 USAA Cas Ins Co 103,117,694 1.3021% 101,156,626 87,798,300 86.79%14
223 200 18600 USAA General Ind Co 2,546,821 0.0322% 2,131,521 2,534,762 118.92%137
224 201 25976 Utica Mut Ins Co 79,020 0.0010% 89,536 143,488 160.26%203
225 218 20508 Valley Forge Ins Co 23,355 0.0003% 32,144 320,302 996.46%213
226 215 14133 Valley Ins Co 2,497,706 0.0315% 2,476,881 2,362,369 95.38%142
227 958 11762 Vesta Fire Ins Corp 12,316,402 0.1555% 6,355,339 3,371,389 53.05%71
228 38 20397 Vigilant Ins Co 1,103 0.0000% 1,277 171 13.39%234
229 553 13137 Viking Ins Co Of WI 104,134,451 1.3149% 105,424,110 75,805,873 71.91%13
230 1172 19577 Villanova Ins Co 4,199,281 0.0530% 5,303,598 3,585,682 67.61%120
231 761 10079 Vintage Ins Co 2,344,264 0.0296% 2,168,399 2,007,820 92.59%144
232 111 26042 Wausau Underwriters Ins Co 11,376 0.0001% -11,060 0 0.00%217
233 1179 10683 Wawanesa General Ins Co 33,873,218 0.4277% 31,098,495 23,846,555 76.68%30
234 1179 31526 Wawanesa Mut Ins Co Us Branch 34,078,346 0.4303% 35,267,504 23,296,483 66.06%29
235 650 40010 Western Family Ins Co 10,076,194 0.1272% 9,974,730 9,951,192 99.76%78
236 27502 Western General Ins Co 385,350 0.0049% 269,694 101,934 37.80%179
237 1278 37770 Western United Ins Co 27,752,876 0.3504% 24,615,055 18,852,011 76.59%35
238 84 12599 Windsor Ins Co 1,927,573 0.0243% 2,403,048 2,093,648 87.12%152
239 273 13250 Workmens Auto Ins Co 16,649,055 0.2102% 13,659,029 7,560,594 55.35%54
240 84 26050 Worldwide Ins Co 1,584,108 0.0200% 1,638,164 1,282,065 78.26%156
California Department of Insurance Page 5 of 6 Rate Specialist Bureau - 07/10/2001
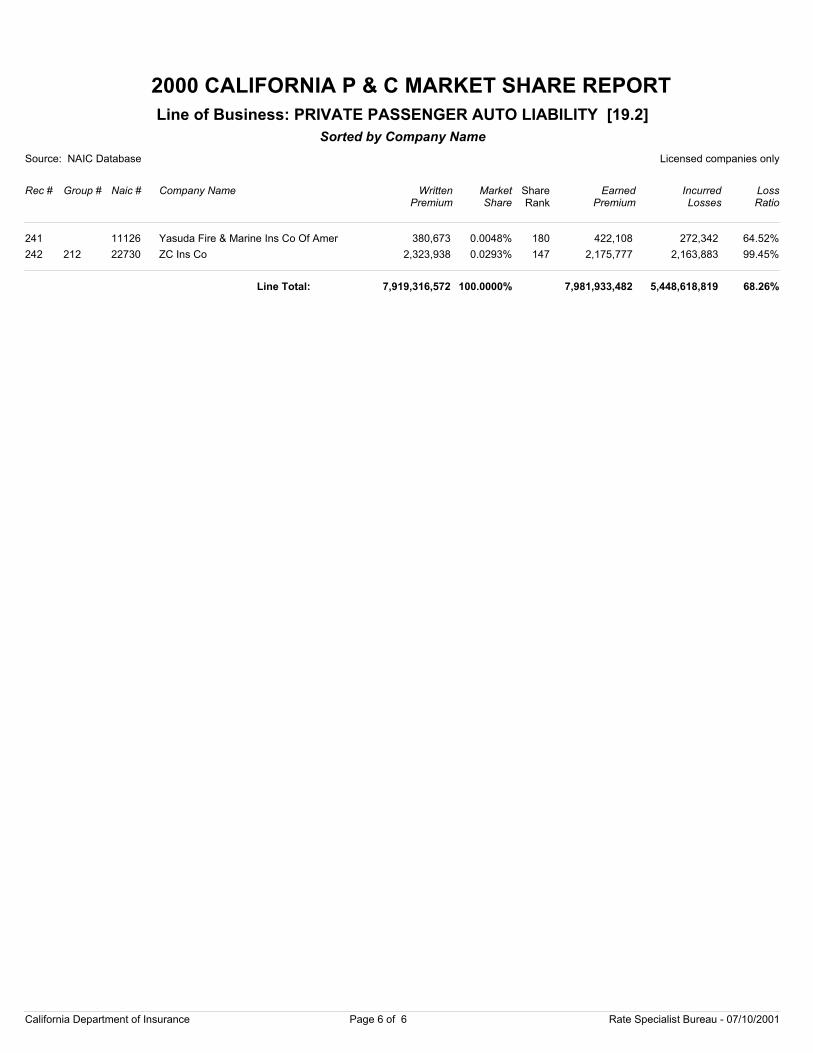
2000 CALIFORNIA P & C MARKET SHARE REPORT
Source: NAIC Database Licensed companies only
Rec # Group # Naic # Company Name
Sorted by Company Name
WrittenPremium
Market Share
EarnedPremium
IncurredLosses
LossRatio
Line of Business: PRIVATE PASSENGER AUTO LIABILITY [19.2]
ShareRank
241 11126 Yasuda Fire & Marine Ins Co Of Amer 380,673 0.0048% 422,108 272,342 64.52%180
242 212 22730 ZC Ins Co 2,323,938 0.0293% 2,175,777 2,163,883 99.45%147
7,919,316,572 100.0000% 7,981,933,482 5,448,618,819 68.26%Line Total:
California Department of Insurance Page 6 of 6 Rate Specialist Bureau - 07/10/2001
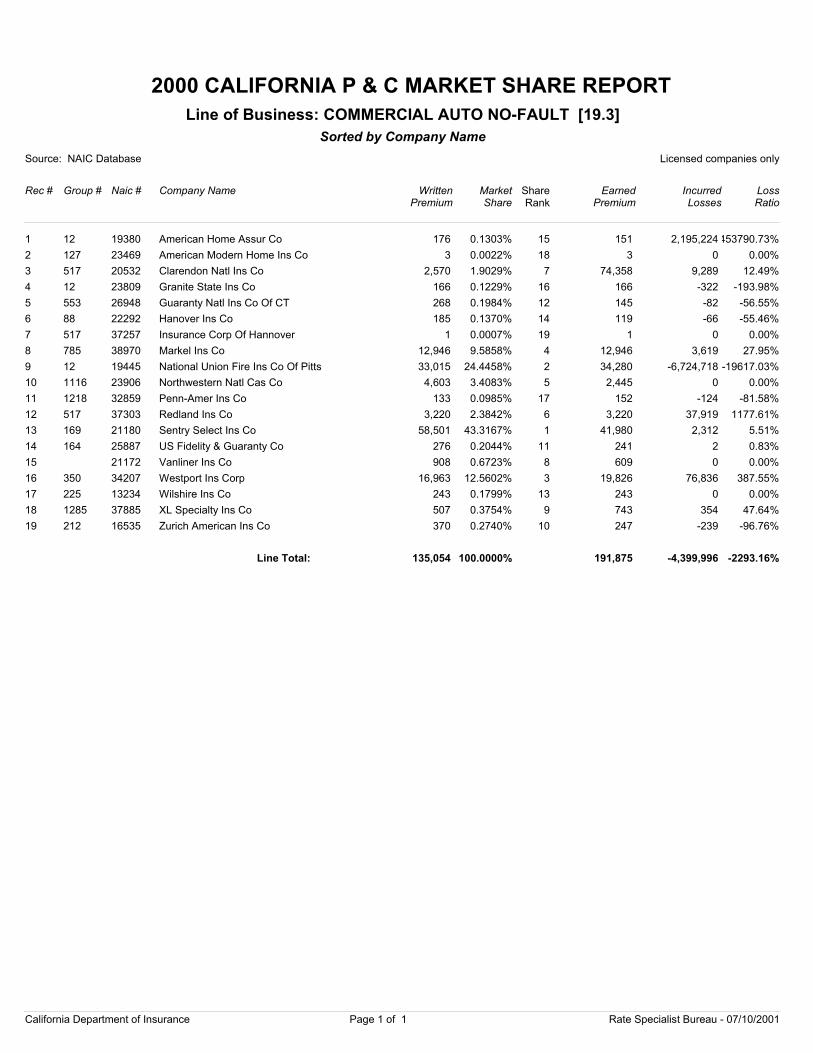
2000 CALIFORNIA P & C MARKET SHARE REPORT
Source: NAIC Database Licensed companies only
Rec # Group # Naic # Company Name
Sorted by Company Name
WrittenPremium
Market Share
EarnedPremium
IncurredLosses
LossRatio
Line of Business: COMMERCIAL AUTO NO-FAULT [19.3]
ShareRank
1 12 19380 American Home Assur Co 176 0.1303% 151 2,195,224453790.73%15
2 127 23469 American Modern Home Ins Co 3 0.0022% 3 0 0.00%18
3 517 20532 Clarendon Natl Ins Co 2,570 1.9029% 74,358 9,289 12.49%7
4 12 23809 Granite State Ins Co 166 0.1229% 166 -322 -193.98%16
5 553 26948 Guaranty Natl Ins Co Of CT 268 0.1984% 145 -82 -56.55%12
6 88 22292 Hanover Ins Co 185 0.1370% 119 -66 -55.46%14
7 517 37257 Insurance Corp Of Hannover 1 0.0007% 1 0 0.00%19
8 785 38970 Markel Ins Co 12,946 9.5858% 12,946 3,619 27.95%4
9 12 19445 National Union Fire Ins Co Of Pitts 33,015 24.4458% 34,280 -6,724,718 -19617.03%2
10 1116 23906 Northwestern Natl Cas Co 4,603 3.4083% 2,445 0 0.00%5
11 1218 32859 Penn-Amer Ins Co 133 0.0985% 152 -124 -81.58%17
12 517 37303 Redland Ins Co 3,220 2.3842% 3,220 37,919 1177.61%6
13 169 21180 Sentry Select Ins Co 58,501 43.3167% 41,980 2,312 5.51%1
14 164 25887 US Fidelity & Guaranty Co 276 0.2044% 241 2 0.83%11
15 21172 Vanliner Ins Co 908 0.6723% 609 0 0.00%8
16 350 34207 Westport Ins Corp 16,963 12.5602% 19,826 76,836 387.55%3
17 225 13234 Wilshire Ins Co 243 0.1799% 243 0 0.00%13
18 1285 37885 XL Specialty Ins Co 507 0.3754% 743 354 47.64%9
19 212 16535 Zurich American Ins Co 370 0.2740% 247 -239 -96.76%10
135,054 100.0000% 191,875 -4,399,996 -2293.16%Line Total:
California Department of Insurance Page 1 of 1 Rate Specialist Bureau - 07/10/2001
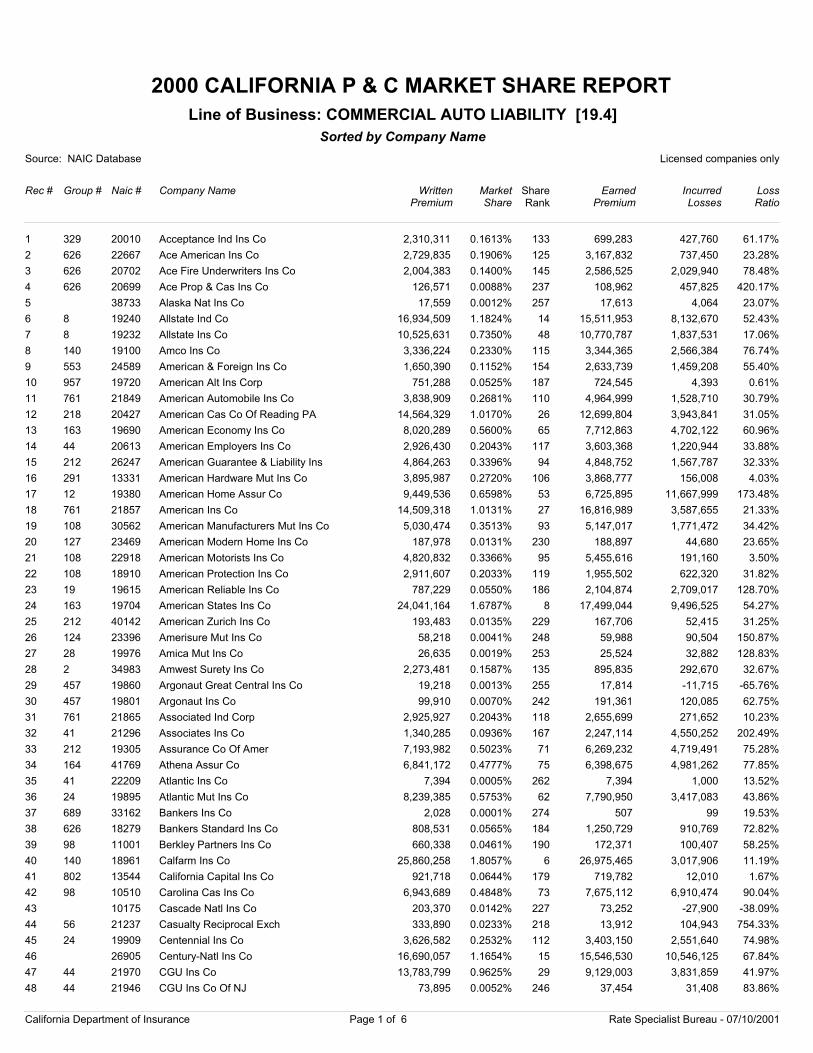
2000 CALIFORNIA P & C MARKET SHARE REPORT
Source: NAIC Database Licensed companies only
Rec # Group # Naic # Company Name
Sorted by Company Name
WrittenPremium
Market Share
EarnedPremium
IncurredLosses
LossRatio
Line of Business: COMMERCIAL AUTO LIABILITY [19.4]
ShareRank
1 329 20010 Acceptance Ind Ins Co 2,310,311 0.1613% 699,283 427,760 61.17%133
2 626 22667 Ace American Ins Co 2,729,835 0.1906% 3,167,832 737,450 23.28%125
3 626 20702 Ace Fire Underwriters Ins Co 2,004,383 0.1400% 2,586,525 2,029,940 78.48%145
4 626 20699 Ace Prop & Cas Ins Co 126,571 0.0088% 108,962 457,825 420.17%237
5 38733 Alaska Nat Ins Co 17,559 0.0012% 17,613 4,064 23.07%257
6 8 19240 Allstate Ind Co 16,934,509 1.1824% 15,511,953 8,132,670 52.43%14
7 8 19232 Allstate Ins Co 10,525,631 0.7350% 10,770,787 1,837,531 17.06%48
8 140 19100 Amco Ins Co 3,336,224 0.2330% 3,344,365 2,566,384 76.74%115
9 553 24589 American & Foreign Ins Co 1,650,390 0.1152% 2,633,739 1,459,208 55.40%154
10 957 19720 American Alt Ins Corp 751,288 0.0525% 724,545 4,393 0.61%187
11 761 21849 American Automobile Ins Co 3,838,909 0.2681% 4,964,999 1,528,710 30.79%110
12 218 20427 American Cas Co Of Reading PA 14,564,329 1.0170% 12,699,804 3,943,841 31.05%26
13 163 19690 American Economy Ins Co 8,020,289 0.5600% 7,712,863 4,702,122 60.96%65
14 44 20613 American Employers Ins Co 2,926,430 0.2043% 3,603,368 1,220,944 33.88%117
15 212 26247 American Guarantee & Liability Ins 4,864,263 0.3396% 4,848,752 1,567,787 32.33%94
16 291 13331 American Hardware Mut Ins Co 3,895,987 0.2720% 3,868,777 156,008 4.03%106
17 12 19380 American Home Assur Co 9,449,536 0.6598% 6,725,895 11,667,999 173.48%53
18 761 21857 American Ins Co 14,509,318 1.0131% 16,816,989 3,587,655 21.33%27
19 108 30562 American Manufacturers Mut Ins Co 5,030,474 0.3513% 5,147,017 1,771,472 34.42%93
20 127 23469 American Modern Home Ins Co 187,978 0.0131% 188,897 44,680 23.65%230
21 108 22918 American Motorists Ins Co 4,820,832 0.3366% 5,455,616 191,160 3.50%95
22 108 18910 American Protection Ins Co 2,911,607 0.2033% 1,955,502 622,320 31.82%119
23 19 19615 American Reliable Ins Co 787,229 0.0550% 2,104,874 2,709,017 128.70%186
24 163 19704 American States Ins Co 24,041,164 1.6787% 17,499,044 9,496,525 54.27%8
25 212 40142 American Zurich Ins Co 193,483 0.0135% 167,706 52,415 31.25%229
26 124 23396 Amerisure Mut Ins Co 58,218 0.0041% 59,988 90,504 150.87%248
27 28 19976 Amica Mut Ins Co 26,635 0.0019% 25,524 32,882 128.83%253
28 2 34983 Amwest Surety Ins Co 2,273,481 0.1587% 895,835 292,670 32.67%135
29 457 19860 Argonaut Great Central Ins Co 19,218 0.0013% 17,814 -11,715 -65.76%255
30 457 19801 Argonaut Ins Co 99,910 0.0070% 191,361 120,085 62.75%242
31 761 21865 Associated Ind Corp 2,925,927 0.2043% 2,655,699 271,652 10.23%118
32 41 21296 Associates Ins Co 1,340,285 0.0936% 2,247,114 4,550,252 202.49%167
33 212 19305 Assurance Co Of Amer 7,193,982 0.5023% 6,269,232 4,719,491 75.28%71
34 164 41769 Athena Assur Co 6,841,172 0.4777% 6,398,675 4,981,262 77.85%75
35 41 22209 Atlantic Ins Co 7,394 0.0005% 7,394 1,000 13.52%262
36 24 19895 Atlantic Mut Ins Co 8,239,385 0.5753% 7,790,950 3,417,083 43.86%62
37 689 33162 Bankers Ins Co 2,028 0.0001% 507 99 19.53%274
38 626 18279 Bankers Standard Ins Co 808,531 0.0565% 1,250,729 910,769 72.82%184
39 98 11001 Berkley Partners Ins Co 660,338 0.0461% 172,371 100,407 58.25%190
40 140 18961 Calfarm Ins Co 25,860,258 1.8057% 26,975,465 3,017,906 11.19%6
41 802 13544 California Capital Ins Co 921,718 0.0644% 719,782 12,010 1.67%179
42 98 10510 Carolina Cas Ins Co 6,943,689 0.4848% 7,675,112 6,910,474 90.04%73
43 10175 Cascade Natl Ins Co 203,370 0.0142% 73,252 -27,900 -38.09%227
44 56 21237 Casualty Reciprocal Exch 333,890 0.0233% 13,912 104,943 754.33%218
45 24 19909 Centennial Ins Co 3,626,582 0.2532% 3,403,150 2,551,640 74.98%112
46 26905 Century-Natl Ins Co 16,690,057 1.1654% 15,546,530 10,546,125 67.84%15
47 44 21970 CGU Ins Co 13,783,799 0.9625% 9,129,003 3,831,859 41.97%29
48 44 21946 CGU Ins Co Of NJ 73,895 0.0052% 37,454 31,408 83.86%246
California Department of Insurance Page 1 of 6 Rate Specialist Bureau - 07/10/2001
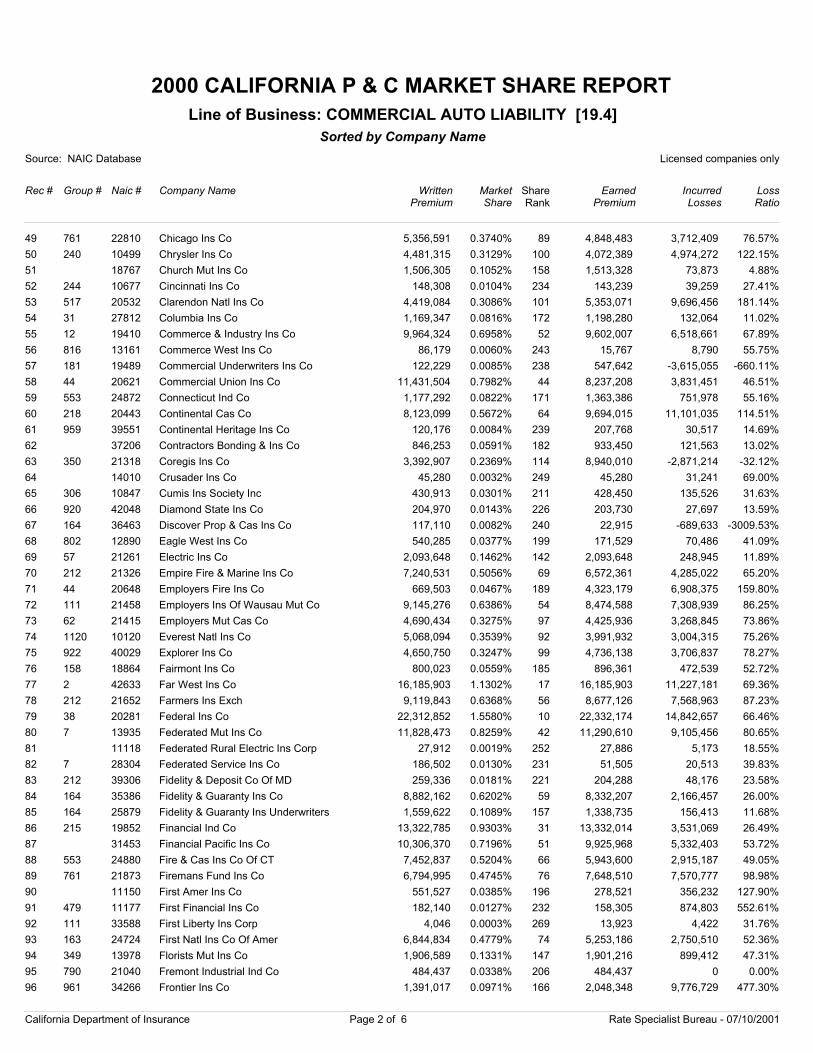
2000 CALIFORNIA P & C MARKET SHARE REPORT
Source: NAIC Database Licensed companies only
Rec # Group # Naic # Company Name
Sorted by Company Name
WrittenPremium
Market Share
EarnedPremium
IncurredLosses
LossRatio
Line of Business: COMMERCIAL AUTO LIABILITY [19.4]
ShareRank
49 761 22810 Chicago Ins Co 5,356,591 0.3740% 4,848,483 3,712,409 76.57%89
50 240 10499 Chrysler Ins Co 4,481,315 0.3129% 4,072,389 4,974,272 122.15%100
51 18767 Church Mut Ins Co 1,506,305 0.1052% 1,513,328 73,873 4.88%158
52 244 10677 Cincinnati Ins Co 148,308 0.0104% 143,239 39,259 27.41%234
53 517 20532 Clarendon Natl Ins Co 4,419,084 0.3086% 5,353,071 9,696,456 181.14%101
54 31 27812 Columbia Ins Co 1,169,347 0.0816% 1,198,280 132,064 11.02%172
55 12 19410 Commerce & Industry Ins Co 9,964,324 0.6958% 9,602,007 6,518,661 67.89%52
56 816 13161 Commerce West Ins Co 86,179 0.0060% 15,767 8,790 55.75%243
57 181 19489 Commercial Underwriters Ins Co 122,229 0.0085% 547,642 -3,615,055 -660.11%238
58 44 20621 Commercial Union Ins Co 11,431,504 0.7982% 8,237,208 3,831,451 46.51%44
59 553 24872 Connecticut Ind Co 1,177,292 0.0822% 1,363,386 751,978 55.16%171
60 218 20443 Continental Cas Co 8,123,099 0.5672% 9,694,015 11,101,035 114.51%64
61 959 39551 Continental Heritage Ins Co 120,176 0.0084% 207,768 30,517 14.69%239
62 37206 Contractors Bonding & Ins Co 846,253 0.0591% 933,450 121,563 13.02%182
63 350 21318 Coregis Ins Co 3,392,907 0.2369% 8,940,010 -2,871,214 -32.12%114
64 14010 Crusader Ins Co 45,280 0.0032% 45,280 31,241 69.00%249
65 306 10847 Cumis Ins Society Inc 430,913 0.0301% 428,450 135,526 31.63%211
66 920 42048 Diamond State Ins Co 204,970 0.0143% 203,730 27,697 13.59%226
67 164 36463 Discover Prop & Cas Ins Co 117,110 0.0082% 22,915 -689,633 -3009.53%240
68 802 12890 Eagle West Ins Co 540,285 0.0377% 171,529 70,486 41.09%199
69 57 21261 Electric Ins Co 2,093,648 0.1462% 2,093,648 248,945 11.89%142
70 212 21326 Empire Fire & Marine Ins Co 7,240,531 0.5056% 6,572,361 4,285,022 65.20%69
71 44 20648 Employers Fire Ins Co 669,503 0.0467% 4,323,179 6,908,375 159.80%189
72 111 21458 Employers Ins Of Wausau Mut Co 9,145,276 0.6386% 8,474,588 7,308,939 86.25%54
73 62 21415 Employers Mut Cas Co 4,690,434 0.3275% 4,425,936 3,268,845 73.86%97
74 1120 10120 Everest Natl Ins Co 5,068,094 0.3539% 3,991,932 3,004,315 75.26%92
75 922 40029 Explorer Ins Co 4,650,750 0.3247% 4,736,138 3,706,837 78.27%99
76 158 18864 Fairmont Ins Co 800,023 0.0559% 896,361 472,539 52.72%185
77 2 42633 Far West Ins Co 16,185,903 1.1302% 16,185,903 11,227,181 69.36%17
78 212 21652 Farmers Ins Exch 9,119,843 0.6368% 8,677,126 7,568,963 87.23%56
79 38 20281 Federal Ins Co 22,312,852 1.5580% 22,332,174 14,842,657 66.46%10
80 7 13935 Federated Mut Ins Co 11,828,473 0.8259% 11,290,610 9,105,456 80.65%42
81 11118 Federated Rural Electric Ins Corp 27,912 0.0019% 27,886 5,173 18.55%252
82 7 28304 Federated Service Ins Co 186,502 0.0130% 51,505 20,513 39.83%231
83 212 39306 Fidelity & Deposit Co Of MD 259,336 0.0181% 204,288 48,176 23.58%221
84 164 35386 Fidelity & Guaranty Ins Co 8,882,162 0.6202% 8,332,207 2,166,457 26.00%59
85 164 25879 Fidelity & Guaranty Ins Underwriters 1,559,622 0.1089% 1,338,735 156,413 11.68%157
86 215 19852 Financial Ind Co 13,322,785 0.9303% 13,332,014 3,531,069 26.49%31
87 31453 Financial Pacific Ins Co 10,306,370 0.7196% 9,925,968 5,332,403 53.72%51
88 553 24880 Fire & Cas Ins Co Of CT 7,452,837 0.5204% 5,943,600 2,915,187 49.05%66
89 761 21873 Firemans Fund Ins Co 6,794,995 0.4745% 7,648,510 7,570,777 98.98%76
90 11150 First Amer Ins Co 551,527 0.0385% 278,521 356,232 127.90%196
91 479 11177 First Financial Ins Co 182,140 0.0127% 158,305 874,803 552.61%232
92 111 33588 First Liberty Ins Corp 4,046 0.0003% 13,923 4,422 31.76%269
93 163 24724 First Natl Ins Co Of Amer 6,844,834 0.4779% 5,253,186 2,750,510 52.36%74
94 349 13978 Florists Mut Ins Co 1,906,589 0.1331% 1,901,216 899,412 47.31%147
95 790 21040 Fremont Industrial Ind Co 484,437 0.0338% 484,437 0 0.00%206
96 961 34266 Frontier Ins Co 1,391,017 0.0971% 2,048,348 9,776,729 477.30%166
California Department of Insurance Page 2 of 6 Rate Specialist Bureau - 07/10/2001
2000 CALIFORNIA P & C MARKET SHARE REPORT
Source: NAIC Database Licensed companies only
Rec # Group # Naic # Company Name
Sorted by Company Name
WrittenPremium
Market Share
EarnedPremium
IncurredLosses
LossRatio
Line of Business: COMMERCIAL AUTO LIABILITY [19.4]
ShareRank
97 961 42250 Frontier Pacific Ins Co 449,495 0.0314% 644,176 64,975 10.09%207
98 350 22225 Ge Auto & Home Assur Co 20,561 0.0014% 31,843 -37,000 -116.20%254
99 31 35882 Geico General Ins Co 948 0.0001% 884 11 1.24%276
100 44 21962 General Accident Ins Co 10,936,204 0.7636% 13,350,255 10,023,086 75.08%47
101 400 24414 General Cas Co Of WI 5,246 0.0004% 5,729 -2,085 -36.39%264
102 163 24732 General Ins Co Of Amer 7,024,541 0.4905% 6,393,581 3,584,932 56.07%72
103 749 16063 General Security Ins Co 15,021,271 1.0489% 15,275,821 13,348,792 87.39%22
104 1169 11231 Generali Us Branch 12,414,485 0.8668% 12,000,831 8,009,732 66.74%35
105 31 38962 Genesis Ins Co 2,135,906 0.1491% 1,372,707 16,471 1.20%138
106 553 24600 Globe Ind Co 312,734 0.0218% 391,321 56,756 14.50%220
107 39861 Golden Bear Ins Co 489,132 0.0342% 423,364 -250,000 -59.05%205
108 111 10836 Golden Eagle Ins Corp 46,367,730 3.2376% 39,024,001 18,179,338 46.59%1
109 31 22063 Government Employees Ins Co 1,358 0.0001% 1,297 867 66.85%275
110 83 22101 Grange Ins Assn 2,060,005 0.1438% 2,139,665 1,529,651 71.49%143
111 12 23809 Granite State Ins Co 903,385 0.0631% 695,898 2,340,455 336.32%180
112 201 25984 Graphic Arts Mut Ins Co 15,484 0.0011% 24,437 -44,533 -182.24%258
113 84 26832 Great American Alliance Ins Co 591,333 0.0413% 509,873 170,476 33.43%193
114 84 26344 Great American Assur Co 3,854,517 0.2691% 3,343,075 4,060,457 121.46%109
115 84 16691 Great American Ins Co 2,694,354 0.1881% 2,458,957 1,536,655 62.49%126
116 84 22136 Great American Ins Co of NY 2,094,260 0.1462% 2,112,026 742,928 35.18%141
117 38 20303 Great Northern Ins Co 376,854 0.0263% 74,711 564,268 755.27%214
118 150 11371 Great West Cas Co 4,236,236 0.2958% 3,966,667 1,351,788 34.08%103
119 1285 22322 Greenwich Ins Co 11,777,723 0.8224% 9,286,414 6,367,367 68.57%43
120 553 40541 Grocers Ins Co 542,660 0.0379% 432,178 104,646 24.21%198
121 553 26948 Guaranty Natl Ins Co Of CT 2,155,142 0.1505% 1,753,415 1,909,846 108.92%137
122 303 15032 Guideone Mut Ins Co 3,970,938 0.2773% 3,789,094 909,158 23.99%105
123 41 22217 Gulf Ins Co 3,675,241 0.2566% 2,845,659 1,443,411 50.72%111
124 88 22292 Hanover Ins Co 6,060,324 0.4232% 3,397,797 3,520,984 103.63%82
125 517 21806 Harbor Specialty Ins Co 2,037 0.0001% 13,868 34,296 247.30%273
126 26433 Harco Natl Ins Co 2,109,699 0.1473% 2,070,349 789,855 38.15%140
127 91 22357 Hartford Accid & Ind Co 438,097 0.0306% 499,574 35,979 7.20%210
128 91 29424 Hartford Cas Ins Co 12,037,986 0.8406% 10,896,429 4,272,978 39.21%38
129 91 19682 Hartford Fire In Co 14,744,404 1.0295% 14,044,361 10,551,173 75.13%24
130 91 37478 Hartford Ins Co Of The Midwest 18,712 0.0013% 21,898 712 3.25%256
131 91 30104 Hartford Underwriters Ins Co 490,865 0.0343% 375,317 67,274 17.92%204
132 1116 22489 Highlands Ins Co 1,718,826 0.1200% 1,112,818 78,699 7.07%151
133 212 22527 Home Ins Co 9,669 0.0007% -98,562 1,750,953 -1776.50%260
134 158 25054 Hudson Ins Co 2,906,456 0.2029% 2,724,207 6,348,775 233.05%120
135 626 43575 Indemnity Ins Co Of North Amer 5,199 0.0004% -37,395 2,102,903 -5623.49%265
136 626 22713 Insurance Co Of North Amer 10,694 0.0007% -494,826 -261,690 52.89%259
137 12 19429 Insurance Co Of The State Of PA 5,112,847 0.3570% 5,653,467 7,799,552 137.96%91
138 922 27847 Insurance Co Of The West 8,543,638 0.5966% 9,090,549 9,530,315 104.84%61
139 517 37257 Insurance Corp Of Hannover 2,687,423 0.1876% 1,692,548 1,158,962 68.47%127
140 1314 18341 Insurance Corp Of NY 14,126,268 0.9864% 13,714,202 14,042,188 102.39%28
141 79 31488 Integon Preferred Ins Co 533,803 0.0373% 385,137 124,930 32.44%200
142 761 22837 Interstate Ind Co 1,603,441 0.1120% 1,123,131 483,273 43.03%155
143 26077 Lancer Ins Co 10,426,516 0.7280% 10,821,074 11,085,712 102.45%49
144 84 11738 Leader Ins Co 372,151 0.0260% 421,086 189,334 44.96%215
California Department of Insurance Page 3 of 6 Rate Specialist Bureau - 07/10/2001
2000 CALIFORNIA P & C MARKET SHARE REPORT
Source: NAIC Database Licensed companies only
Rec # Group # Naic # Company Name
Sorted by Company Name
WrittenPremium
Market Share
EarnedPremium
IncurredLosses
LossRatio
Line of Business: COMMERCIAL AUTO LIABILITY [19.4]
ShareRank
145 1172 24422 Legion Ins Co 11,121,968 0.7766% 10,562,894 5,248,137 49.68%45
146 111 42404 Liberty Ins Corp 2,997,080 0.2093% 3,615,248 3,943,110 109.07%116
147 111 23035 Liberty Mut Fire Ins Co 22,085,689 1.5421% 20,536,675 29,842,083 145.31%11
148 111 23043 Liberty Mut Ins Co 7,199,698 0.5027% 3,533,143 7,207,823 204.01%70
149 111 33600 LM Ins Corp 3,939 0.0003% 5,422 211 3.89%270
150 946 14435 Lumber Mut Ins Co 971,489 0.0678% 1,920,035 894,337 46.58%178
151 108 22977 Lumbermens Mut Cas Co 8,945,682 0.6246% 8,871,549 6,734,432 75.91%58
152 23108 Lumbermens Underwriting Alliance 138,146 0.0096% 116,795 154,853 132.59%236
153 23876 Mapfre Reins Corp 78,262 0.0055% 149,179 86,937 58.28%245
154 785 28932 Markel American Ins Co 1,128,660 0.0788% 1,128,660 748,206 66.29%174
155 785 38970 Markel Ins Co 1,439,721 0.1005% 1,446,795 813,140 56.20%161
156 212 19356 Maryland Cas Co 1,429,109 0.0998% 1,113,954 314,569 28.24%163
157 88 22306 Massachusetts Bay Ins Co 1,815,062 0.1267% 2,544,272 3,992,146 156.91%149
158 660 11908 Mercury Cas Co 28,276,049 1.9744% 27,764,138 10,174,883 36.65%5
159 852 40150 MGA Ins Co Inc 1,455,793 0.1017% 1,242,950 488,527 39.30%160
160 212 21687 Mid-Century Ins Co 17,034,475 1.1894% 16,024,584 16,284,413 101.62%13
161 169 23434 Middlesex Ins Co 555 0.0000% 562 -3,652 -649.82%277
162 130 23531 Millers Ins Co 350,546 0.0245% 282,629 -165,696 -58.63%217
163 802 23540 Monterey Ins Co 1,713,304 0.1196% 1,135,814 765,147 67.37%152
164 227 23647 Mutual Service Cas Ins Co 5,521,901 0.3856% 5,861,341 3,203,614 54.66%88
165 23663 National American Ins Co 208,622 0.0146% 232,624 62,788 26.99%225
166 930 23671 National American Ins Co Of CA 13,294,318 0.9283% 10,305,418 9,194,294 89.22%32
167 140 11991 National Cas Co 2,474,738 0.1728% 2,255,213 704,624 31.24%131
168 155 10243 National Continental Ins Co 5,897,923 0.4118% 5,832,322 7,094,659 121.64%84
169 44 16217 National Farmers Union Prop & Cas 445,868 0.0311% 372,286 708,286 190.25%209
170 44 23752 National Farmers Union Std Ins Co 105,266 0.0074% 95,144 37,791 39.72%241
171 218 20478 National Fire Ins Co Of Hartford 2,125,973 0.1484% 1,612,756 401,805 24.91%139
172 31 20087 National Ind Co 5,004 0.0003% 5,004 -10,652 -212.87%267
173 84 32620 National Interstate Ins Co 3,562,824 0.2488% 2,385,294 1,327,075 55.64%113
174 31 20052 National Liab & Fire Ins Co 2,303,200 0.1608% 2,112,416 317,273 15.02%134
175 761 21881 National Surety Corp 6,710,260 0.4685% 8,287,533 10,293,903 124.21%77
176 12 19445 National Union Fire Ins Co Of Pitts 15,670,012 1.0942% 15,761,013 24,884,621 157.89%19
177 140 26093 Nationwide Affinity Ins Co of Amer 74 0.0000% 74 -243 -328.38%279
178 140 28223 Nationwide Agribusiness Ins Co 322,207 0.0225% 129,415 64,143 49.56%219
179 140 23787 Nationwide Mut Ins Co 11,989,811 0.8372% 10,932,718 10,470,647 95.77%40
180 140 37877 Nationwide Prop & Cas Ins Co 5,079 0.0004% 5,078 4,874 95.98%266
181 12 23841 New Hampshire Ins Co 2,496,416 0.1743% 2,701,716 1,763,323 65.27%129
182 2558 27073 Nipponkoa Ins Co Ltd 587,652 0.0410% 641,918 323,869 50.45%194
183 181 29874 North American Specialty Ins Co 1,865,202 0.1302% 2,081,385 1,102,062 52.95%148
184 158 21105 North River Ins Co 235,904 0.0165% 521,191 170,827 32.78%223
185 164 19224 Northbrook Prop & Cas Ins Co 3,804 0.0003% 4,223 -2,112,909 -50033.36%271
186 44 38369 Northern Assur Co Of Amer 1,311,052 0.0915% 978,008 538,590 55.07%168
187 212 19372 Northern Ins Co Of NY 13,021,354 0.9092% 11,011,747 7,038,502 63.92%34
188 41 24015 Northland Ins Co 5,558,103 0.3881% 4,745,529 3,358,950 70.78%87
189 1116 23906 Northwestern Natl Cas Co 254,592 0.0178% 137,180 43,906 32.01%222
190 38 20338 Northwestern Pacific Ind Co 391,946 0.0274% 623,760 343,865 55.13%213
191 150 24147 Old Republic Ins Co 512,417 0.0358% 558,723 -4,522,451 -809.43%202
192 645 14907 Oregon Mut Ins Co 8,388 0.0006% 8,364 -210 -2.51%261
California Department of Insurance Page 4 of 6 Rate Specialist Bureau - 07/10/2001
2000 CALIFORNIA P & C MARKET SHARE REPORT
Source: NAIC Database Licensed companies only
Rec # Group # Naic # Company Name
Sorted by Company Name
WrittenPremium
Market Share
EarnedPremium
IncurredLosses
LossRatio
Line of Business: COMMERCIAL AUTO LIABILITY [19.4]
ShareRank
193 1116 41408 Pacific Automobile Ins Co 367,427 0.0257% 211,446 -10,488 -4.96%216
194 626 22748 Pacific Employers Ins Co 6,231,710 0.4351% 6,248,067 2,218,462 35.51%81
195 38 20346 Pacific Ind Co 2,796,166 0.1952% 3,391,042 3,618,478 106.71%124
196 1116 23930 Pacific Natl Ins Co 1,733,520 0.1210% 1,803,225 -941,231 -52.20%150
197 40550 Pacific Pioneer Ins Co 44,992 0.0031% 7,084 20,681 291.94%250
198 37850 Pacific Specialty Ins Co 6,203 0.0004% 7,207 -2,334 -32.39%263
199 1218 32859 Penn-Amer Ins Co 1,666,308 0.1163% 1,369,233 3,303,324 241.25%153
200 767 12262 Pennsylvania Manufacturers Asn Ins C 60,173 0.0042% 41,247 34,813 84.40%247
201 677 18058 Philadelphia Ind Ins Co 683,218 0.0477% 537,646 12,583 2.34%188
202 44 40134 Potomac Ins Co Of IL 32,589 0.0023% 72,284 6,742 9.33%251
203 155 24260 Progressive Cas Ins Co 44,860,920 3.1324% 39,025,443 20,240,724 51.87%2
204 867 12416 Protective Ins Co 493,669 0.0345% 493,669 -386,918 -78.38%203
205 156 24295 Providence Washington Ins Co 433 0.0000% 1,702 -3,760 -220.92%278
206 796 39217 QBE Ins Corp 8,213,017 0.5735% 1,522,344 677,587 44.51%63
207 158 24384 Ranger Ins Co 15,129,967 1.0564% 14,594,830 12,777,753 87.55%21
208 517 37303 Redland Ins Co 10,319,522 0.7206% 8,773,958 4,960,572 56.54%50
209 400 24449 Regent Ins Co 141,565 0.0099% 139,986 2,590 1.85%235
210 574 31089 Republic Western Ins Co 1,427,311 0.0997% 1,043,949 314,588 30.13%164
211 783 13056 RLI Ins Co 7,338,507 0.5124% 5,810,905 5,923,235 101.93%68
212 83 22128 Rocky Mountain Fire & Cas Co 446,025 0.0311% 366,697 185,183 50.50%208
213 553 24678 Royal Ind Co 5,744,942 0.4011% 5,224,957 456,876 8.74%85
214 553 26980 Royal Ins Co Of Amer 12,276,706 0.8572% 13,413,761 8,060,098 60.09%37
215 10823 Sable Ins Co 1,987,054 0.1387% 2,144,336 3,497,872 163.12%146
216 163 24740 Safeco Ins Co Of Amer 15,992,616 1.1167% 19,691,732 11,636,755 59.09%18
217 553 24694 Safeguard Ins Co 629,354 0.0439% 549,241 227,638 41.45%191
218 74 15105 Safety Natl Cas Corp 10,958,122 0.7651% 10,810,115 20,053,977 185.51%46
219 867 40460 Sagamore Ins Co 530,778 0.0371% 463,656 1,697,402 366.09%201
220 140 15580 Scottsdale Ind Co 20,048,239 1.3999% 19,946,038 16,036,908 80.40%12
221 553 24902 Security Ins Co Of Hartford 3,861,450 0.2696% 3,204,625 1,482,684 46.27%108
222 41 22233 Select Ins Co 2,881,437 0.2012% 2,409,148 1,076,212 44.67%121
223 169 24988 Sentry Ins A Mut Co 2,832,042 0.1977% 2,727,551 581,587 21.32%122
224 169 21180 Sentry Select Ins Co 8,780,691 0.6131% 8,403,237 4,810,628 57.25%60
225 772 22985 Sequoia Ins Co 3,872,048 0.2704% 3,783,789 3,836,221 101.39%107
226 84 24899 Seven Hills Ins Co 599,842 0.0419% 865,760 -78,674 -9.09%192
227 686 39322 Sorema North Amer Reins Co 81,610 0.0057% 44,088 4,448 10.09%244
228 108 20524 Specialty Natl Ins Co 4,759,955 0.3324% 2,053,675 425,263 20.71%96
229 36790 Springfield Ins Co Inc 1,594,470 0.1113% 1,588,308 716,730 45.13%156
230 164 24767 St Paul Fire & Marine Ins Co 23,726,348 1.6567% 22,996,765 12,164,103 52.89%9
231 164 24775 St Paul Guardian Ins Co 1,090,581 0.0761% 1,496,278 754,113 50.40%175
232 164 24791 St Paul Mercury Ins Co 4,311,076 0.3010% 4,452,723 2,736,075 61.45%102
233 748 18023 Star Ins Co 4,679,291 0.3267% 4,018,053 3,138,727 78.12%98
234 176 25143 State Farm Fire And Cas Co 1,468,508 0.1025% 1,764,002 1,374,698 77.93%159
235 176 25178 State Farm Mut Auto Ins Co 41,947,124 2.9290% 45,003,514 21,676,081 48.17%4
236 93 12831 State Natl Ins Co Inc 2,048,644 0.1430% 542,373 171,589 31.64%144
237 20362 Sumitomo Mar & Fire Ins Co Ltd Us Br 1,432,701 0.1000% 1,511,293 774,903 51.27%162
238 808 32107 Sutter Ins Co 973,078 0.0679% 668,108 224,712 33.63%177
239 158 25496 TIG Ind Co 5,961,455 0.4163% 6,289,682 3,926,542 62.43%83
240 158 25534 TIG Ins Co 12,343,095 0.8619% 11,760,961 6,729,527 57.22%36
California Department of Insurance Page 5 of 6 Rate Specialist Bureau - 07/10/2001
2000 CALIFORNIA P & C MARKET SHARE REPORT
Source: NAIC Database Licensed companies only
Rec # Group # Naic # Company Name
Sorted by Company Name
WrittenPremium
Market Share
EarnedPremium
IncurredLosses
LossRatio
Line of Business: COMMERCIAL AUTO LIABILITY [19.4]
ShareRank
241 950 12904 Tokio Marine & Fire Ins Co Ltd Us Br 9,067,878 0.6332% 8,399,670 1,754,616 20.89%57
242 161 18031 Topa Ins Co 7,444,348 0.5198% 6,055,123 1,852,441 30.59%67
243 218 20486 Transcontinental Ins Co 5,309,537 0.3707% 4,849,986 3,642,802 75.11%90
244 28886 Transguard Ins Co Of Amer Inc 852,190 0.0595% 647,435 1,225,690 189.31%181
245 84 33014 Transport Ins Co 2,578 0.0002% 2,215 39,517 1784.06%272
246 218 20494 Transportation Ins Co 13,113,376 0.9156% 17,773,210 14,577,373 82.02%33
247 41 19038 Travelers Cas & Surety Co 161,538 0.0113% 127,543 -1,792,537 -1405.44%233
248 41 25682 Travelers Ind Co Of CT 6,662,851 0.4652% 12,013,621 3,143,662 26.17%78
249 41 25674 Travelers Ind Co Of IL 42,858,884 2.9926% 38,558,587 30,023,157 77.86%3
250 212 21709 Truck Ins Exch 24,873,196 1.7368% 24,057,311 25,360,983 105.42%7
251 91 29459 Twin City Fire Ins Co Co 1,169,203 0.0816% 1,042,423 613,729 58.88%173
252 781 37893 Ulico Cas Co 843,138 0.0589% 754,344 370,661 49.14%183
253 181 18619 Underwriters Ins Co 1,089,449 0.0761% 1,042,938 857,891 82.26%176
254 400 25798 Unigard Ind Co 2,421,343 0.1691% 2,385,802 708,737 29.71%132
255 400 25747 Unigard Ins Co 14,684,236 1.0253% 13,107,366 9,043,558 69.00%25
256 155 11770 United Fncl Cas Co 4,188,028 0.2924% 4,188,028 2,928,893 69.93%104
257 158 21113 United States Fire Ins Co 2,483,064 0.1734% 2,593,726 -311,286 -12.00%130
258 212 41181 Universal Underwriters Ins Co 14,843,881 1.0365% 15,486,070 9,216,924 59.52%23
259 164 25887 US Fidelity & Guaranty Co 13,557,432 0.9466% 11,530,423 -952,666 -8.26%30
260 201 25976 Utica Mut Ins Co 219,477 0.0153% 205,355 636,834 310.11%224
261 212 26611 Valiant Ins Co 2,826,858 0.1974% 3,120,734 3,355,879 107.53%123
262 218 20508 Valley Forge Ins Co 9,123,678 0.6371% 13,927,319 15,561,232 111.73%55
263 215 14133 Valley Ins Co 6,443,339 0.4499% 3,295,867 2,477,276 75.16%79
264 21172 Vanliner Ins Co 2,667,902 0.1863% 1,895,415 1,506,159 79.46%128
265 38 20397 Vigilant Ins Co 201,058 0.0140% 242,980 1,288,228 530.18%228
266 1172 19577 Villanova Ins Co 11,993,175 0.8374% 6,620,056 5,803,849 87.67%39
267 317 40827 Virginia Surety Co Inc 4,911 0.0003% 6,459 14,425 223.33%268
268 111 26069 Wausau Business Ins Co 1,229,506 0.0859% 1,397,283 1,757,983 125.81%170
269 111 26042 Wausau Underwriters Ins Co 1,392,277 0.0972% 1,550,607 886,303 57.16%165
270 626 21121 Westchester Fire Ins Co 551,281 0.0385% 866,743 717,356 82.76%197
271 650 40010 Western Family Ins Co 584,310 0.0408% 804,000 574,647 71.47%195
272 27502 Western General Ins Co 2,271,358 0.1586% 2,238,774 1,335,289 59.64%136
273 350 34207 Westport Ins Corp 1,287,706 0.0899% 1,346,488 5,116,460 379.99%169
274 225 13234 Wilshire Ins Co 11,943,844 0.8340% 11,878,278 7,036,116 59.24%41
275 400 24554 Winterthur Intl Amer Ins Co 417,744 0.0292% 313,592 162,631 51.86%212
276 1285 37885 XL Specialty Ins Co 6,343,736 0.4430% 5,092,511 5,553,141 109.05%80
277 11126 Yasuda Fire & Marine Ins Co Of Amer 5,585,007 0.3900% 6,493,013 11,418,080 175.85%86
278 212 22730 ZC Ins Co 15,501,740 1.0824% 10,632,729 3,028,183 28.48%20
279 212 16535 Zurich American Ins Co 16,363,826 1.1426% 11,222,583 5,162,184 46.00%16
1,432,155,520 100.0000% 1,356,393,051 920,676,228 67.88%Line Total:
California Department of Insurance Page 6 of 6 Rate Specialist Bureau - 07/10/2001
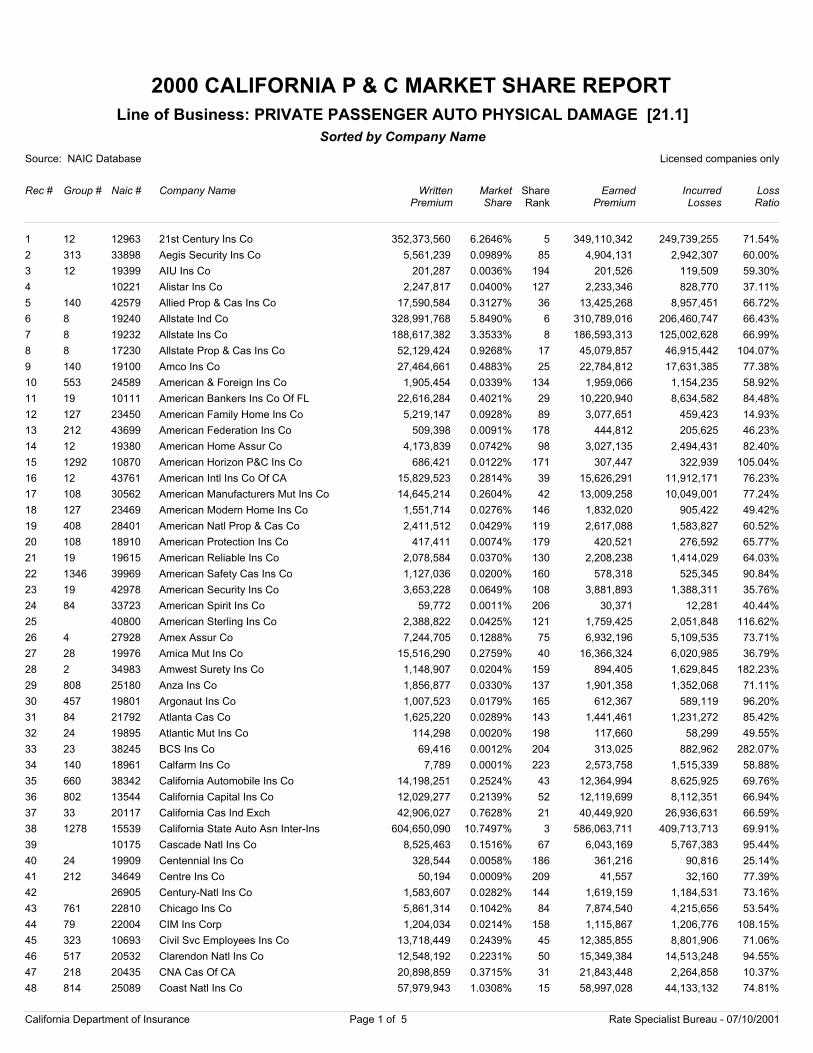
2000 CALIFORNIA P & C MARKET SHARE REPORT
Source: NAIC Database Licensed companies only
Rec # Group # Naic # Company Name
Sorted by Company Name
WrittenPremium
Market Share
EarnedPremium
IncurredLosses
LossRatio
Line of Business: PRIVATE PASSENGER AUTO PHYSICAL DAMAGE [21.1]
ShareRank
1 12 12963 21st Century Ins Co 352,373,560 6.2646% 349,110,342 249,739,255 71.54%5
2 313 33898 Aegis Security Ins Co 5,561,239 0.0989% 4,904,131 2,942,307 60.00%85
3 12 19399 AIU Ins Co 201,287 0.0036% 201,526 119,509 59.30%194
4 10221 Alistar Ins Co 2,247,817 0.0400% 2,233,346 828,770 37.11%127
5 140 42579 Allied Prop & Cas Ins Co 17,590,584 0.3127% 13,425,268 8,957,451 66.72%36
6 8 19240 Allstate Ind Co 328,991,768 5.8490% 310,789,016 206,460,747 66.43%6
7 8 19232 Allstate Ins Co 188,617,382 3.3533% 186,593,313 125,002,628 66.99%8
8 8 17230 Allstate Prop & Cas Ins Co 52,129,424 0.9268% 45,079,857 46,915,442 104.07%17
9 140 19100 Amco Ins Co 27,464,661 0.4883% 22,784,812 17,631,385 77.38%25
10 553 24589 American & Foreign Ins Co 1,905,454 0.0339% 1,959,066 1,154,235 58.92%134
11 19 10111 American Bankers Ins Co Of FL 22,616,284 0.4021% 10,220,940 8,634,582 84.48%29
12 127 23450 American Family Home Ins Co 5,219,147 0.0928% 3,077,651 459,423 14.93%89
13 212 43699 American Federation Ins Co 509,398 0.0091% 444,812 205,625 46.23%178
14 12 19380 American Home Assur Co 4,173,839 0.0742% 3,027,135 2,494,431 82.40%98
15 1292 10870 American Horizon P&C Ins Co 686,421 0.0122% 307,447 322,939 105.04%171
16 12 43761 American Intl Ins Co Of CA 15,829,523 0.2814% 15,626,291 11,912,171 76.23%39
17 108 30562 American Manufacturers Mut Ins Co 14,645,214 0.2604% 13,009,258 10,049,001 77.24%42
18 127 23469 American Modern Home Ins Co 1,551,714 0.0276% 1,832,020 905,422 49.42%146
19 408 28401 American Natl Prop & Cas Co 2,411,512 0.0429% 2,617,088 1,583,827 60.52%119
20 108 18910 American Protection Ins Co 417,411 0.0074% 420,521 276,592 65.77%179
21 19 19615 American Reliable Ins Co 2,078,584 0.0370% 2,208,238 1,414,029 64.03%130
22 1346 39969 American Safety Cas Ins Co 1,127,036 0.0200% 578,318 525,345 90.84%160
23 19 42978 American Security Ins Co 3,653,228 0.0649% 3,881,893 1,388,311 35.76%108
24 84 33723 American Spirit Ins Co 59,772 0.0011% 30,371 12,281 40.44%206
25 40800 American Sterling Ins Co 2,388,822 0.0425% 1,759,425 2,051,848 116.62%121
26 4 27928 Amex Assur Co 7,244,705 0.1288% 6,932,196 5,109,535 73.71%75
27 28 19976 Amica Mut Ins Co 15,516,290 0.2759% 16,366,324 6,020,985 36.79%40
28 2 34983 Amwest Surety Ins Co 1,148,907 0.0204% 894,405 1,629,845 182.23%159
29 808 25180 Anza Ins Co 1,856,877 0.0330% 1,901,358 1,352,068 71.11%137
30 457 19801 Argonaut Ins Co 1,007,523 0.0179% 612,367 589,119 96.20%165
31 84 21792 Atlanta Cas Co 1,625,220 0.0289% 1,441,461 1,231,272 85.42%143
32 24 19895 Atlantic Mut Ins Co 114,298 0.0020% 117,660 58,299 49.55%198
33 23 38245 BCS Ins Co 69,416 0.0012% 313,025 882,962 282.07%204
34 140 18961 Calfarm Ins Co 7,789 0.0001% 2,573,758 1,515,339 58.88%223
35 660 38342 California Automobile Ins Co 14,198,251 0.2524% 12,364,994 8,625,925 69.76%43
36 802 13544 California Capital Ins Co 12,029,277 0.2139% 12,119,699 8,112,351 66.94%52
37 33 20117 California Cas Ind Exch 42,906,027 0.7628% 40,449,920 26,936,631 66.59%21
38 1278 15539 California State Auto Asn Inter-Ins 604,650,090 10.7497% 586,063,711 409,713,713 69.91%3
39 10175 Cascade Natl Ins Co 8,525,463 0.1516% 6,043,169 5,767,383 95.44%67
40 24 19909 Centennial Ins Co 328,544 0.0058% 361,216 90,816 25.14%186
41 212 34649 Centre Ins Co 50,194 0.0009% 41,557 32,160 77.39%209
42 26905 Century-Natl Ins Co 1,583,607 0.0282% 1,619,159 1,184,531 73.16%144
43 761 22810 Chicago Ins Co 5,861,314 0.1042% 7,874,540 4,215,656 53.54%84
44 79 22004 CIM Ins Corp 1,204,034 0.0214% 1,115,867 1,206,776 108.15%158
45 323 10693 Civil Svc Employees Ins Co 13,718,449 0.2439% 12,385,855 8,801,906 71.06%45
46 517 20532 Clarendon Natl Ins Co 12,548,192 0.2231% 15,349,384 14,513,248 94.55%50
47 218 20435 CNA Cas Of CA 20,898,859 0.3715% 21,843,448 2,264,858 10.37%31
48 814 25089 Coast Natl Ins Co 57,979,943 1.0308% 58,997,028 44,133,132 74.81%15
California Department of Insurance Page 1 of 5 Rate Specialist Bureau - 07/10/2001

2000 CALIFORNIA P & C MARKET SHARE REPORT
Source: NAIC Database Licensed companies only
Rec # Group # Naic # Company Name
Sorted by Company Name
WrittenPremium
Market Share
EarnedPremium
IncurredLosses
LossRatio
Line of Business: PRIVATE PASSENGER AUTO PHYSICAL DAMAGE [21.1]
ShareRank
49 350 20796 Colonial Penn Franklin Ins Co 13,718,812 0.2439% 13,986,329 10,656,421 76.19%44
50 350 34789 Colonial Penn Ins Co 5,911,452 0.1051% 6,515,856 4,463,221 68.50%82
51 350 43974 Colonial Penn Madison Ins Co 3,986,754 0.0709% 4,222,013 2,501,805 59.26%102
52 816 13161 Commerce West Ins Co 9,974,681 0.1773% 8,798,986 4,604,695 52.33%58
53 181 19489 Commercial Underwriters Ins Co 1,441,232 0.0256% 2,107,674 3,704,306 175.75%152
54 218 35289 Continental Ins Co 4,674 0.0001% 5,752 66,351 1153.53%226
55 28258 Continental Natl Ind Co 3,067 0.0001% 2,145 15,315 713.99%228
56 323 18953 CSE Safeguard Ins Co 3,839,408 0.0683% 2,731,705 1,289,439 47.20%105
57 930 19269 Danielson Natl Ins Co 4,587,992 0.0816% 4,506,735 4,163,275 92.38%95
58 8 37907 Deerbrook Ins Co 16,673,244 0.2964% 19,602,610 23,859,428 121.72%37
59 140 42587 Depositors Ins Co 4,034,439 0.0717% 2,813,820 2,820,631 100.24%101
60 920 42048 Diamond State Ins Co 8,368,095 0.1488% 8,778,343 8,197,594 93.38%69
61 831 34495 Doctors Co An Interins Exchn 749,702 0.0133% 699,850 376,831 53.84%170
62 515 10928 Eagle Ins Co 1,958,117 0.0348% 1,436,800 811,745 56.50%132
63 802 12890 Eagle West Ins Co 934,364 0.0166% 1,357,898 806,183 59.37%166
64 57 21261 Electric Ins Co 2,255,475 0.0401% 2,108,312 1,569,569 74.45%126
65 62 21407 Emcasco Ins Co 18,706 0.0003% 20,535 755 3.68%216
66 212 21326 Empire Fire & Marine Ins Co 196,484 0.0035% 199,430 55,648 27.90%195
67 62 21415 Employers Mut Cas Co 308 0.0000% 694 -44 -6.34%236
68 1120 10120 Everest Natl Ins Co 3,653,553 0.0650% 2,279,407 3,356,666 147.26%107
69 38 35181 Executive Risk Ind Inc 366,309 0.0065% 369,446 568,902 153.99%181
70 922 40029 Explorer Ins Co 18,951,935 0.3369% 17,763,974 10,746,745 60.50%33
71 158 18864 Fairmont Ins Co 2,286,432 0.0406% 797,691 685,389 85.92%125
72 212 21652 Farmers Ins Exch 662,819,891 11.7839% 663,130,969 455,831,481 68.74%2
73 38 20281 Federal Ins Co 25,969 0.0005% -7,077 131,892 -1863.67%215
74 164 35386 Fidelity & Guaranty Ins Co 294,088 0.0052% 365,226 84,296 23.08%188
75 215 19852 Financial Ind Co 20,207,623 0.3593% 17,225,149 11,202,917 65.04%32
76 761 21903 Firemans Fund Ins Co Of TX 9,644,107 0.1715% 9,378,138 5,191,916 55.36%59
77 11150 First Amer Ins Co 4,305,764 0.0765% 2,119,407 1,212,474 57.21%96
78 34525 First American Specilaty Ins Co 280,381 0.0050% 331,341 76,300 23.03%190
79 689 16578 First Comm Ins Co 1,910,465 0.0340% 2,198,912 1,556,821 70.80%133
80 479 11177 First Financial Ins Co 650,877 0.0116% 255,128 205,945 80.72%172
81 163 24724 First Natl Ins Co Of Amer 1,281,040 0.0228% 1,272,665 762,062 59.88%155
82 212 11185 Foremost Ins Co 2,358,175 0.0419% 2,358,855 1,006,805 42.68%123
83 961 42250 Frontier Pacific Ins Co 2,839,858 0.0505% 1,941,614 739,464 38.09%114
84 218 10201 Galway Ins Co 6,320,967 0.1124% 6,664,093 2,730,432 40.97%79
85 350 22225 Ge Auto & Home Assur Co 6,877 0.0001% 6,877 2,473 35.96%224
86 31 41491 Geico Cas Co 9,134,540 0.1624% 8,448,404 5,818,840 68.88%64
87 31 35882 Geico General Ins Co 77,892,416 1.3848% 72,694,394 52,175,281 71.77%13
88 31 22055 Geico Ind Co 15,363,633 0.2731% 13,455,166 13,126,315 97.56%41
89 44 21962 General Accident Ins Co 3,869,246 0.0688% 4,010,133 3,953,448 98.59%104
90 163 24732 General Ins Co Of Amer 9,512 0.0002% 10,452 1,334 12.76%220
91 1169 11231 Generali Us Branch 4,958,742 0.0882% 5,052,829 926,518 18.34%91
92 553 24600 Globe Ind Co 31,279 0.0006% 33,809 21,420 63.36%214
93 31 22063 Government Employees Ins Co 50,954,363 0.9059% 49,338,755 34,048,808 69.01%18
94 83 22101 Grange Ins Assn 4,293,416 0.0763% 4,142,759 2,866,114 69.18%97
95 12 23809 Granite State Ins Co 4,776,132 0.0849% 1,973,552 1,705,215 86.40%94
96 84 26832 Great American Alliance Ins Co 1,666,155 0.0296% 1,851,047 726,699 39.26%141
California Department of Insurance Page 2 of 5 Rate Specialist Bureau - 07/10/2001
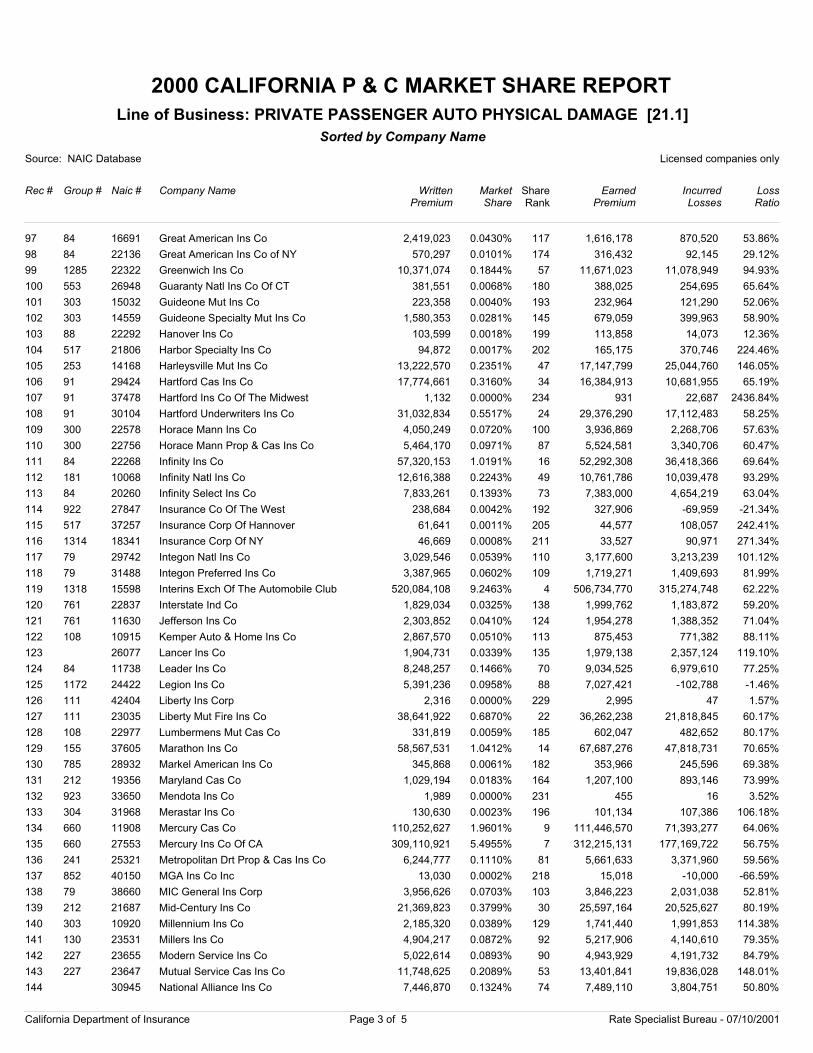
2000 CALIFORNIA P & C MARKET SHARE REPORT
Source: NAIC Database Licensed companies only
Rec # Group # Naic # Company Name
Sorted by Company Name
WrittenPremium
Market Share
EarnedPremium
IncurredLosses
LossRatio
Line of Business: PRIVATE PASSENGER AUTO PHYSICAL DAMAGE [21.1]
ShareRank
97 84 16691 Great American Ins Co 2,419,023 0.0430% 1,616,178 870,520 53.86%117
98 84 22136 Great American Ins Co of NY 570,297 0.0101% 316,432 92,145 29.12%174
99 1285 22322 Greenwich Ins Co 10,371,074 0.1844% 11,671,023 11,078,949 94.93%57
100 553 26948 Guaranty Natl Ins Co Of CT 381,551 0.0068% 388,025 254,695 65.64%180
101 303 15032 Guideone Mut Ins Co 223,358 0.0040% 232,964 121,290 52.06%193
102 303 14559 Guideone Specialty Mut Ins Co 1,580,353 0.0281% 679,059 399,963 58.90%145
103 88 22292 Hanover Ins Co 103,599 0.0018% 113,858 14,073 12.36%199
104 517 21806 Harbor Specialty Ins Co 94,872 0.0017% 165,175 370,746 224.46%202
105 253 14168 Harleysville Mut Ins Co 13,222,570 0.2351% 17,147,799 25,044,760 146.05%47
106 91 29424 Hartford Cas Ins Co 17,774,661 0.3160% 16,384,913 10,681,955 65.19%34
107 91 37478 Hartford Ins Co Of The Midwest 1,132 0.0000% 931 22,687 2436.84%234
108 91 30104 Hartford Underwriters Ins Co 31,032,834 0.5517% 29,376,290 17,112,483 58.25%24
109 300 22578 Horace Mann Ins Co 4,050,249 0.0720% 3,936,869 2,268,706 57.63%100
110 300 22756 Horace Mann Prop & Cas Ins Co 5,464,170 0.0971% 5,524,581 3,340,706 60.47%87
111 84 22268 Infinity Ins Co 57,320,153 1.0191% 52,292,308 36,418,366 69.64%16
112 181 10068 Infinity Natl Ins Co 12,616,388 0.2243% 10,761,786 10,039,478 93.29%49
113 84 20260 Infinity Select Ins Co 7,833,261 0.1393% 7,383,000 4,654,219 63.04%73
114 922 27847 Insurance Co Of The West 238,684 0.0042% 327,906 -69,959 -21.34%192
115 517 37257 Insurance Corp Of Hannover 61,641 0.0011% 44,577 108,057 242.41%205
116 1314 18341 Insurance Corp Of NY 46,669 0.0008% 33,527 90,971 271.34%211
117 79 29742 Integon Natl Ins Co 3,029,546 0.0539% 3,177,600 3,213,239 101.12%110
118 79 31488 Integon Preferred Ins Co 3,387,965 0.0602% 1,719,271 1,409,693 81.99%109
119 1318 15598 Interins Exch Of The Automobile Club 520,084,108 9.2463% 506,734,770 315,274,748 62.22%4
120 761 22837 Interstate Ind Co 1,829,034 0.0325% 1,999,762 1,183,872 59.20%138
121 761 11630 Jefferson Ins Co 2,303,852 0.0410% 1,954,278 1,388,352 71.04%124
122 108 10915 Kemper Auto & Home Ins Co 2,867,570 0.0510% 875,453 771,382 88.11%113
123 26077 Lancer Ins Co 1,904,731 0.0339% 1,979,138 2,357,124 119.10%135
124 84 11738 Leader Ins Co 8,248,257 0.1466% 9,034,525 6,979,610 77.25%70
125 1172 24422 Legion Ins Co 5,391,236 0.0958% 7,027,421 -102,788 -1.46%88
126 111 42404 Liberty Ins Corp 2,316 0.0000% 2,995 47 1.57%229
127 111 23035 Liberty Mut Fire Ins Co 38,641,922 0.6870% 36,262,238 21,818,845 60.17%22
128 108 22977 Lumbermens Mut Cas Co 331,819 0.0059% 602,047 482,652 80.17%185
129 155 37605 Marathon Ins Co 58,567,531 1.0412% 67,687,276 47,818,731 70.65%14
130 785 28932 Markel American Ins Co 345,868 0.0061% 353,966 245,596 69.38%182
131 212 19356 Maryland Cas Co 1,029,194 0.0183% 1,207,100 893,146 73.99%164
132 923 33650 Mendota Ins Co 1,989 0.0000% 455 16 3.52%231
133 304 31968 Merastar Ins Co 130,630 0.0023% 101,134 107,386 106.18%196
134 660 11908 Mercury Cas Co 110,252,627 1.9601% 111,446,570 71,393,277 64.06%9
135 660 27553 Mercury Ins Co Of CA 309,110,921 5.4955% 312,215,131 177,169,722 56.75%7
136 241 25321 Metropolitan Drt Prop & Cas Ins Co 6,244,777 0.1110% 5,661,633 3,371,960 59.56%81
137 852 40150 MGA Ins Co Inc 13,030 0.0002% 15,018 -10,000 -66.59%218
138 79 38660 MIC General Ins Corp 3,956,626 0.0703% 3,846,223 2,031,038 52.81%103
139 212 21687 Mid-Century Ins Co 21,369,823 0.3799% 25,597,164 20,525,627 80.19%30
140 303 10920 Millennium Ins Co 2,185,320 0.0389% 1,741,440 1,991,853 114.38%129
141 130 23531 Millers Ins Co 4,904,217 0.0872% 5,217,906 4,140,610 79.35%92
142 227 23655 Modern Service Ins Co 5,022,614 0.0893% 4,943,929 4,191,732 84.79%90
143 227 23647 Mutual Service Cas Ins Co 11,748,625 0.2089% 13,401,841 19,836,028 148.01%53
144 30945 National Alliance Ins Co 7,446,870 0.1324% 7,489,110 3,804,751 50.80%74
California Department of Insurance Page 3 of 5 Rate Specialist Bureau - 07/10/2001
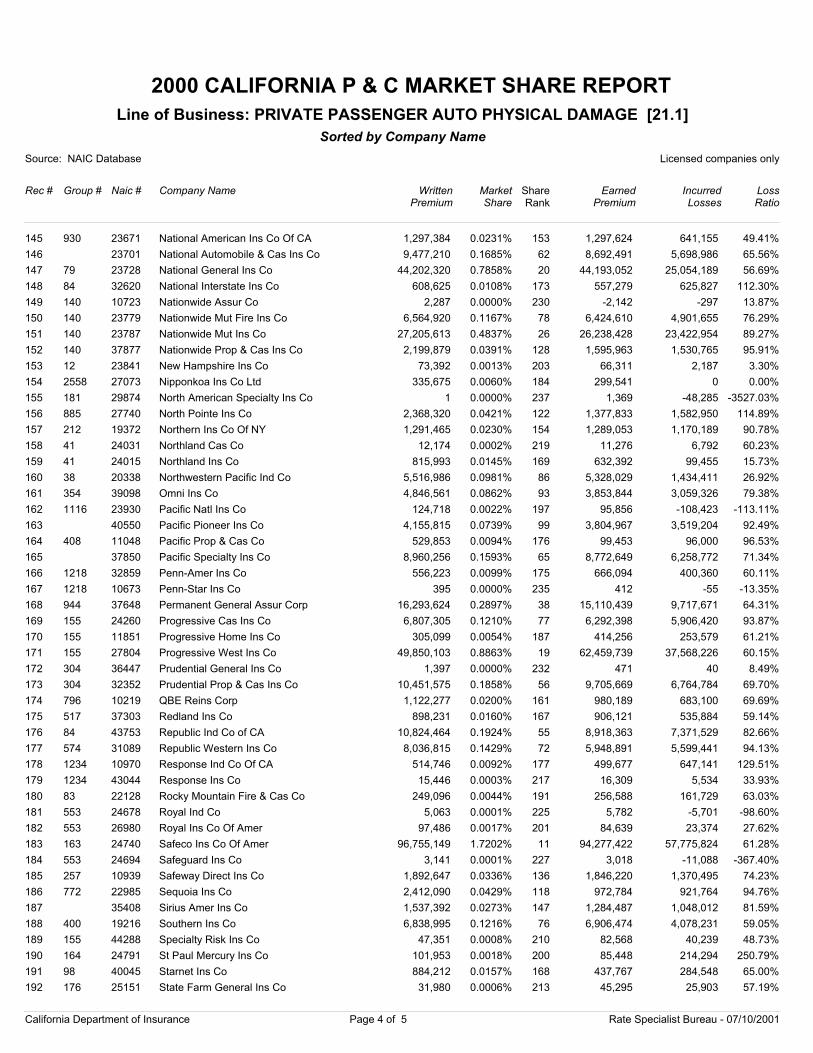
2000 CALIFORNIA P & C MARKET SHARE REPORT
Source: NAIC Database Licensed companies only
Rec # Group # Naic # Company Name
Sorted by Company Name
WrittenPremium
Market Share
EarnedPremium
IncurredLosses
LossRatio
Line of Business: PRIVATE PASSENGER AUTO PHYSICAL DAMAGE [21.1]
ShareRank
145 930 23671 National American Ins Co Of CA 1,297,384 0.0231% 1,297,624 641,155 49.41%153
146 23701 National Automobile & Cas Ins Co 9,477,210 0.1685% 8,692,491 5,698,986 65.56%62
147 79 23728 National General Ins Co 44,202,320 0.7858% 44,193,052 25,054,189 56.69%20
148 84 32620 National Interstate Ins Co 608,625 0.0108% 557,279 625,827 112.30%173
149 140 10723 Nationwide Assur Co 2,287 0.0000% -2,142 -297 13.87%230
150 140 23779 Nationwide Mut Fire Ins Co 6,564,920 0.1167% 6,424,610 4,901,655 76.29%78
151 140 23787 Nationwide Mut Ins Co 27,205,613 0.4837% 26,238,428 23,422,954 89.27%26
152 140 37877 Nationwide Prop & Cas Ins Co 2,199,879 0.0391% 1,595,963 1,530,765 95.91%128
153 12 23841 New Hampshire Ins Co 73,392 0.0013% 66,311 2,187 3.30%203
154 2558 27073 Nipponkoa Ins Co Ltd 335,675 0.0060% 299,541 0 0.00%184
155 181 29874 North American Specialty Ins Co 1 0.0000% 1,369 -48,285 -3527.03%237
156 885 27740 North Pointe Ins Co 2,368,320 0.0421% 1,377,833 1,582,950 114.89%122
157 212 19372 Northern Ins Co Of NY 1,291,465 0.0230% 1,289,053 1,170,189 90.78%154
158 41 24031 Northland Cas Co 12,174 0.0002% 11,276 6,792 60.23%219
159 41 24015 Northland Ins Co 815,993 0.0145% 632,392 99,455 15.73%169
160 38 20338 Northwestern Pacific Ind Co 5,516,986 0.0981% 5,328,029 1,434,411 26.92%86
161 354 39098 Omni Ins Co 4,846,561 0.0862% 3,853,844 3,059,326 79.38%93
162 1116 23930 Pacific Natl Ins Co 124,718 0.0022% 95,856 -108,423 -113.11%197
163 40550 Pacific Pioneer Ins Co 4,155,815 0.0739% 3,804,967 3,519,204 92.49%99
164 408 11048 Pacific Prop & Cas Co 529,853 0.0094% 99,453 96,000 96.53%176
165 37850 Pacific Specialty Ins Co 8,960,256 0.1593% 8,772,649 6,258,772 71.34%65
166 1218 32859 Penn-Amer Ins Co 556,223 0.0099% 666,094 400,360 60.11%175
167 1218 10673 Penn-Star Ins Co 395 0.0000% 412 -55 -13.35%235
168 944 37648 Permanent General Assur Corp 16,293,624 0.2897% 15,110,439 9,717,671 64.31%38
169 155 24260 Progressive Cas Ins Co 6,807,305 0.1210% 6,292,398 5,906,420 93.87%77
170 155 11851 Progressive Home Ins Co 305,099 0.0054% 414,256 253,579 61.21%187
171 155 27804 Progressive West Ins Co 49,850,103 0.8863% 62,459,739 37,568,226 60.15%19
172 304 36447 Prudential General Ins Co 1,397 0.0000% 471 40 8.49%232
173 304 32352 Prudential Prop & Cas Ins Co 10,451,575 0.1858% 9,705,669 6,764,784 69.70%56
174 796 10219 QBE Reins Corp 1,122,277 0.0200% 980,189 683,100 69.69%161
175 517 37303 Redland Ins Co 898,231 0.0160% 906,121 535,884 59.14%167
176 84 43753 Republic Ind Co of CA 10,824,464 0.1924% 8,918,363 7,371,529 82.66%55
177 574 31089 Republic Western Ins Co 8,036,815 0.1429% 5,948,891 5,599,441 94.13%72
178 1234 10970 Response Ind Co Of CA 514,746 0.0092% 499,677 647,141 129.51%177
179 1234 43044 Response Ins Co 15,446 0.0003% 16,309 5,534 33.93%217
180 83 22128 Rocky Mountain Fire & Cas Co 249,096 0.0044% 256,588 161,729 63.03%191
181 553 24678 Royal Ind Co 5,063 0.0001% 5,782 -5,701 -98.60%225
182 553 26980 Royal Ins Co Of Amer 97,486 0.0017% 84,639 23,374 27.62%201
183 163 24740 Safeco Ins Co Of Amer 96,755,149 1.7202% 94,277,422 57,775,824 61.28%11
184 553 24694 Safeguard Ins Co 3,141 0.0001% 3,018 -11,088 -367.40%227
185 257 10939 Safeway Direct Ins Co 1,892,647 0.0336% 1,846,220 1,370,495 74.23%136
186 772 22985 Sequoia Ins Co 2,412,090 0.0429% 972,784 921,764 94.76%118
187 35408 Sirius Amer Ins Co 1,537,392 0.0273% 1,284,487 1,048,012 81.59%147
188 400 19216 Southern Ins Co 6,838,995 0.1216% 6,906,474 4,078,231 59.05%76
189 155 44288 Specialty Risk Ins Co 47,351 0.0008% 82,568 40,239 48.73%210
190 164 24791 St Paul Mercury Ins Co 101,953 0.0018% 85,448 214,294 250.79%200
191 98 40045 Starnet Ins Co 884,212 0.0157% 437,767 284,548 65.00%168
192 176 25151 State Farm General Ins Co 31,980 0.0006% 45,295 25,903 57.19%213
California Department of Insurance Page 4 of 5 Rate Specialist Bureau - 07/10/2001
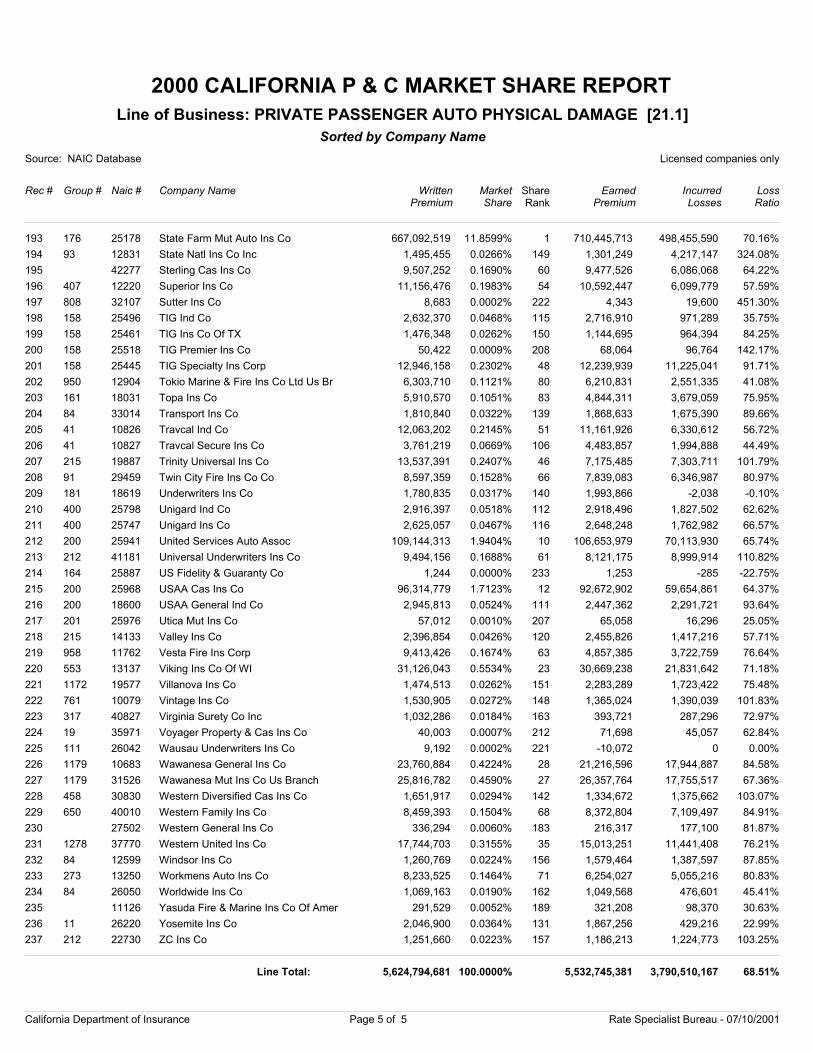
2000 CALIFORNIA P & C MARKET SHARE REPORT
Source: NAIC Database Licensed companies only
Rec # Group # Naic # Company Name
Sorted by Company Name
WrittenPremium
Market Share
EarnedPremium
IncurredLosses
LossRatio
Line of Business: PRIVATE PASSENGER AUTO PHYSICAL DAMAGE [21.1]
ShareRank
193 176 25178 State Farm Mut Auto Ins Co 667,092,519 11.8599% 710,445,713 498,455,590 70.16%1
194 93 12831 State Natl Ins Co Inc 1,495,455 0.0266% 1,301,249 4,217,147 324.08%149
195 42277 Sterling Cas Ins Co 9,507,252 0.1690% 9,477,526 6,086,068 64.22%60
196 407 12220 Superior Ins Co 11,156,476 0.1983% 10,592,447 6,099,779 57.59%54
197 808 32107 Sutter Ins Co 8,683 0.0002% 4,343 19,600 451.30%222
198 158 25496 TIG Ind Co 2,632,370 0.0468% 2,716,910 971,289 35.75%115
199 158 25461 TIG Ins Co Of TX 1,476,348 0.0262% 1,144,695 964,394 84.25%150
200 158 25518 TIG Premier Ins Co 50,422 0.0009% 68,064 96,764 142.17%208
201 158 25445 TIG Specialty Ins Corp 12,946,158 0.2302% 12,239,939 11,225,041 91.71%48
202 950 12904 Tokio Marine & Fire Ins Co Ltd Us Br 6,303,710 0.1121% 6,210,831 2,551,335 41.08%80
203 161 18031 Topa Ins Co 5,910,570 0.1051% 4,844,311 3,679,059 75.95%83
204 84 33014 Transport Ins Co 1,810,840 0.0322% 1,868,633 1,675,390 89.66%139
205 41 10826 Travcal Ind Co 12,063,202 0.2145% 11,161,926 6,330,612 56.72%51
206 41 10827 Travcal Secure Ins Co 3,761,219 0.0669% 4,483,857 1,994,888 44.49%106
207 215 19887 Trinity Universal Ins Co 13,537,391 0.2407% 7,175,485 7,303,711 101.79%46
208 91 29459 Twin City Fire Ins Co Co 8,597,359 0.1528% 7,839,083 6,346,987 80.97%66
209 181 18619 Underwriters Ins Co 1,780,835 0.0317% 1,993,866 -2,038 -0.10%140
210 400 25798 Unigard Ind Co 2,916,397 0.0518% 2,918,496 1,827,502 62.62%112
211 400 25747 Unigard Ins Co 2,625,057 0.0467% 2,648,248 1,762,982 66.57%116
212 200 25941 United Services Auto Assoc 109,144,313 1.9404% 106,653,979 70,113,930 65.74%10
213 212 41181 Universal Underwriters Ins Co 9,494,156 0.1688% 8,121,175 8,999,914 110.82%61
214 164 25887 US Fidelity & Guaranty Co 1,244 0.0000% 1,253 -285 -22.75%233
215 200 25968 USAA Cas Ins Co 96,314,779 1.7123% 92,672,902 59,654,861 64.37%12
216 200 18600 USAA General Ind Co 2,945,813 0.0524% 2,447,362 2,291,721 93.64%111
217 201 25976 Utica Mut Ins Co 57,012 0.0010% 65,058 16,296 25.05%207
218 215 14133 Valley Ins Co 2,396,854 0.0426% 2,455,826 1,417,216 57.71%120
219 958 11762 Vesta Fire Ins Corp 9,413,426 0.1674% 4,857,385 3,722,759 76.64%63
220 553 13137 Viking Ins Co Of WI 31,126,043 0.5534% 30,669,238 21,831,642 71.18%23
221 1172 19577 Villanova Ins Co 1,474,513 0.0262% 2,283,289 1,723,422 75.48%151
222 761 10079 Vintage Ins Co 1,530,905 0.0272% 1,365,024 1,390,039 101.83%148
223 317 40827 Virginia Surety Co Inc 1,032,286 0.0184% 393,721 287,296 72.97%163
224 19 35971 Voyager Property & Cas Ins Co 40,003 0.0007% 71,698 45,057 62.84%212
225 111 26042 Wausau Underwriters Ins Co 9,192 0.0002% -10,072 0 0.00%221
226 1179 10683 Wawanesa General Ins Co 23,760,884 0.4224% 21,216,596 17,944,887 84.58%28
227 1179 31526 Wawanesa Mut Ins Co Us Branch 25,816,782 0.4590% 26,357,764 17,755,517 67.36%27
228 458 30830 Western Diversified Cas Ins Co 1,651,917 0.0294% 1,334,672 1,375,662 103.07%142
229 650 40010 Western Family Ins Co 8,459,393 0.1504% 8,372,804 7,109,497 84.91%68
230 27502 Western General Ins Co 336,294 0.0060% 216,317 177,100 81.87%183
231 1278 37770 Western United Ins Co 17,744,703 0.3155% 15,013,251 11,441,408 76.21%35
232 84 12599 Windsor Ins Co 1,260,769 0.0224% 1,579,464 1,387,597 87.85%156
233 273 13250 Workmens Auto Ins Co 8,233,525 0.1464% 6,254,027 5,055,216 80.83%71
234 84 26050 Worldwide Ins Co 1,069,163 0.0190% 1,049,568 476,601 45.41%162
235 11126 Yasuda Fire & Marine Ins Co Of Amer 291,529 0.0052% 321,208 98,370 30.63%189
236 11 26220 Yosemite Ins Co 2,046,900 0.0364% 1,867,256 429,216 22.99%131
237 212 22730 ZC Ins Co 1,251,660 0.0223% 1,186,213 1,224,773 103.25%157
5,624,794,681 100.0000% 5,532,745,381 3,790,510,167 68.51%Line Total:
California Department of Insurance Page 5 of 5 Rate Specialist Bureau - 07/10/2001
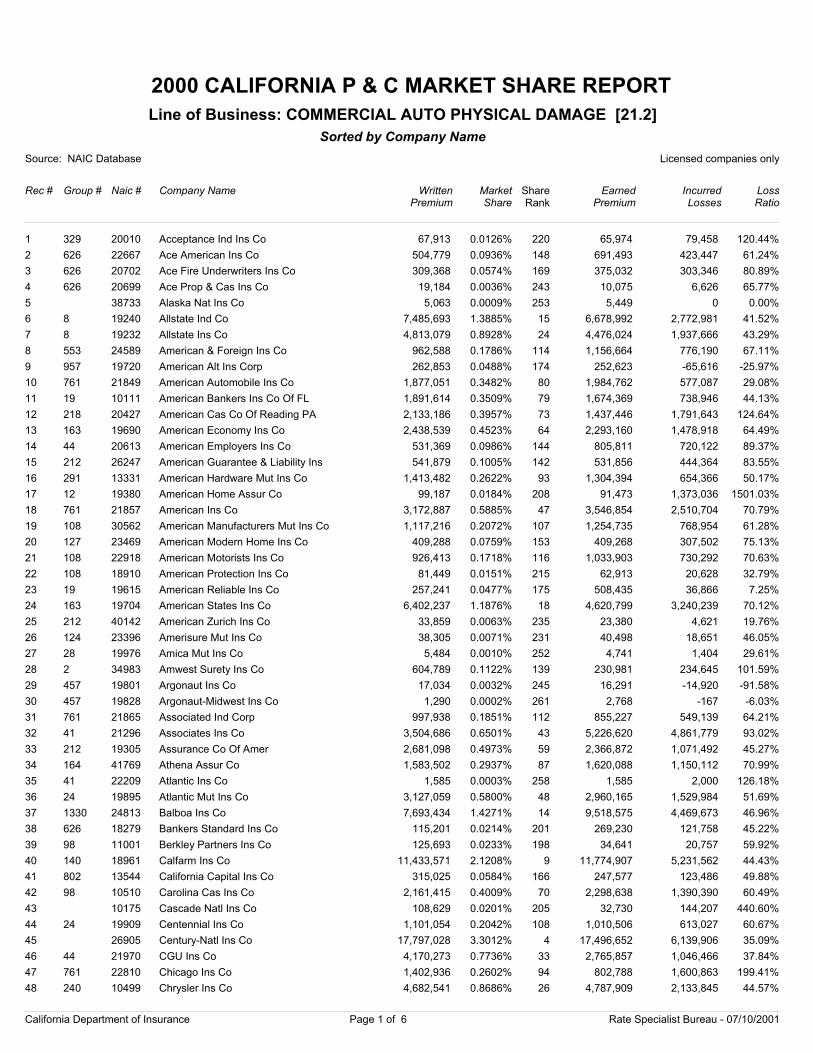
2000 CALIFORNIA P & C MARKET SHARE REPORT
Source: NAIC Database Licensed companies only
Rec # Group # Naic # Company Name
Sorted by Company Name
WrittenPremium
Market Share
EarnedPremium
IncurredLosses
LossRatio
Line of Business: COMMERCIAL AUTO PHYSICAL DAMAGE [21.2]
ShareRank
1 329 20010 Acceptance Ind Ins Co 67,913 0.0126% 65,974 79,458 120.44%220
2 626 22667 Ace American Ins Co 504,779 0.0936% 691,493 423,447 61.24%148
3 626 20702 Ace Fire Underwriters Ins Co 309,368 0.0574% 375,032 303,346 80.89%169
4 626 20699 Ace Prop & Cas Ins Co 19,184 0.0036% 10,075 6,626 65.77%243
5 38733 Alaska Nat Ins Co 5,063 0.0009% 5,449 0 0.00%253
6 8 19240 Allstate Ind Co 7,485,693 1.3885% 6,678,992 2,772,981 41.52%15
7 8 19232 Allstate Ins Co 4,813,079 0.8928% 4,476,024 1,937,666 43.29%24
8 553 24589 American & Foreign Ins Co 962,588 0.1786% 1,156,664 776,190 67.11%114
9 957 19720 American Alt Ins Corp 262,853 0.0488% 252,623 -65,616 -25.97%174
10 761 21849 American Automobile Ins Co 1,877,051 0.3482% 1,984,762 577,087 29.08%80
11 19 10111 American Bankers Ins Co Of FL 1,891,614 0.3509% 1,674,369 738,946 44.13%79
12 218 20427 American Cas Co Of Reading PA 2,133,186 0.3957% 1,437,446 1,791,643 124.64%73
13 163 19690 American Economy Ins Co 2,438,539 0.4523% 2,293,160 1,478,918 64.49%64
14 44 20613 American Employers Ins Co 531,369 0.0986% 805,811 720,122 89.37%144
15 212 26247 American Guarantee & Liability Ins 541,879 0.1005% 531,856 444,364 83.55%142
16 291 13331 American Hardware Mut Ins Co 1,413,482 0.2622% 1,304,394 654,366 50.17%93
17 12 19380 American Home Assur Co 99,187 0.0184% 91,473 1,373,036 1501.03%208
18 761 21857 American Ins Co 3,172,887 0.5885% 3,546,854 2,510,704 70.79%47
19 108 30562 American Manufacturers Mut Ins Co 1,117,216 0.2072% 1,254,735 768,954 61.28%107
20 127 23469 American Modern Home Ins Co 409,288 0.0759% 409,268 307,502 75.13%153
21 108 22918 American Motorists Ins Co 926,413 0.1718% 1,033,903 730,292 70.63%116
22 108 18910 American Protection Ins Co 81,449 0.0151% 62,913 20,628 32.79%215
23 19 19615 American Reliable Ins Co 257,241 0.0477% 508,435 36,866 7.25%175
24 163 19704 American States Ins Co 6,402,237 1.1876% 4,620,799 3,240,239 70.12%18
25 212 40142 American Zurich Ins Co 33,859 0.0063% 23,380 4,621 19.76%235
26 124 23396 Amerisure Mut Ins Co 38,305 0.0071% 40,498 18,651 46.05%231
27 28 19976 Amica Mut Ins Co 5,484 0.0010% 4,741 1,404 29.61%252
28 2 34983 Amwest Surety Ins Co 604,789 0.1122% 230,981 234,645 101.59%139
29 457 19801 Argonaut Ins Co 17,034 0.0032% 16,291 -14,920 -91.58%245
30 457 19828 Argonaut-Midwest Ins Co 1,290 0.0002% 2,768 -167 -6.03%261
31 761 21865 Associated Ind Corp 997,938 0.1851% 855,227 549,139 64.21%112
32 41 21296 Associates Ins Co 3,504,686 0.6501% 5,226,620 4,861,779 93.02%43
33 212 19305 Assurance Co Of Amer 2,681,098 0.4973% 2,366,872 1,071,492 45.27%59
34 164 41769 Athena Assur Co 1,583,502 0.2937% 1,620,088 1,150,112 70.99%87
35 41 22209 Atlantic Ins Co 1,585 0.0003% 1,585 2,000 126.18%258
36 24 19895 Atlantic Mut Ins Co 3,127,059 0.5800% 2,960,165 1,529,984 51.69%48
37 1330 24813 Balboa Ins Co 7,693,434 1.4271% 9,518,575 4,469,673 46.96%14
38 626 18279 Bankers Standard Ins Co 115,201 0.0214% 269,230 121,758 45.22%201
39 98 11001 Berkley Partners Ins Co 125,693 0.0233% 34,641 20,757 59.92%198
40 140 18961 Calfarm Ins Co 11,433,571 2.1208% 11,774,907 5,231,562 44.43%9
41 802 13544 California Capital Ins Co 315,025 0.0584% 247,577 123,486 49.88%166
42 98 10510 Carolina Cas Ins Co 2,161,415 0.4009% 2,298,638 1,390,390 60.49%70
43 10175 Cascade Natl Ins Co 108,629 0.0201% 32,730 144,207 440.60%205
44 24 19909 Centennial Ins Co 1,101,054 0.2042% 1,010,506 613,027 60.67%108
45 26905 Century-Natl Ins Co 17,797,028 3.3012% 17,496,652 6,139,906 35.09%4
46 44 21970 CGU Ins Co 4,170,273 0.7736% 2,765,857 1,046,466 37.84%33
47 761 22810 Chicago Ins Co 1,402,936 0.2602% 802,788 1,600,863 199.41%94
48 240 10499 Chrysler Ins Co 4,682,541 0.8686% 4,787,909 2,133,845 44.57%26
California Department of Insurance Page 1 of 6 Rate Specialist Bureau - 07/10/2001
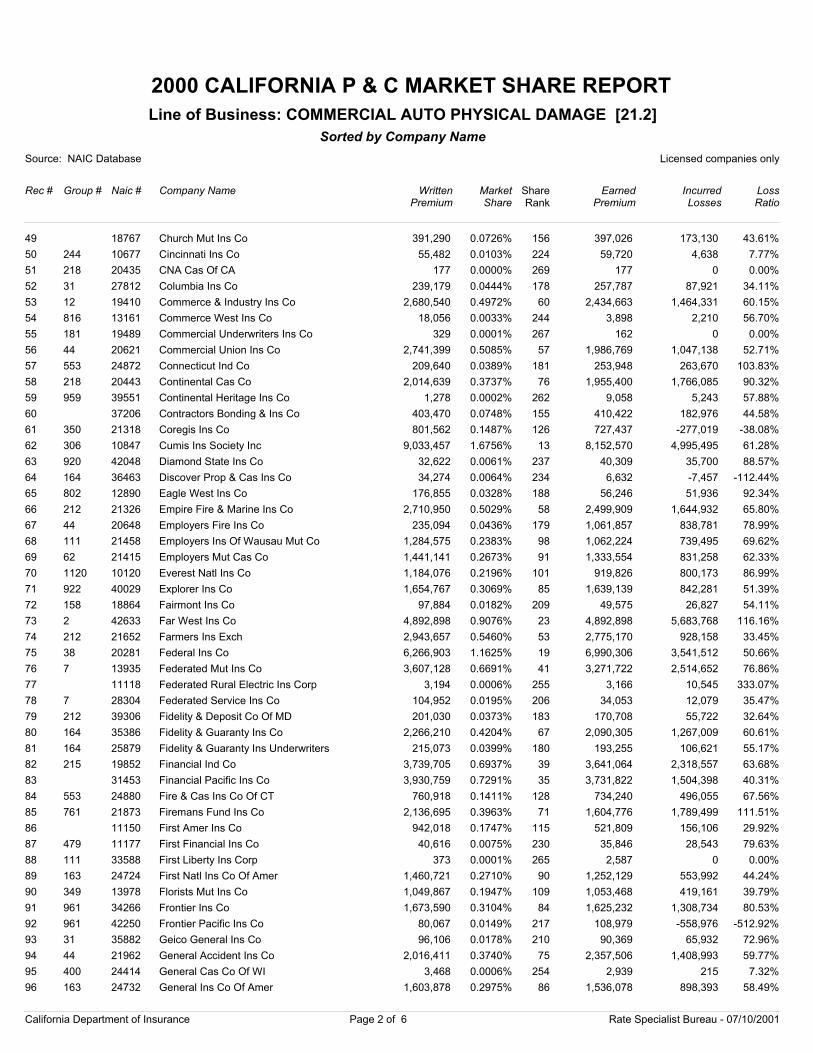
2000 CALIFORNIA P & C MARKET SHARE REPORT
Source: NAIC Database Licensed companies only
Rec # Group # Naic # Company Name
Sorted by Company Name
WrittenPremium
Market Share
EarnedPremium
IncurredLosses
LossRatio
Line of Business: COMMERCIAL AUTO PHYSICAL DAMAGE [21.2]
ShareRank
49 18767 Church Mut Ins Co 391,290 0.0726% 397,026 173,130 43.61%156
50 244 10677 Cincinnati Ins Co 55,482 0.0103% 59,720 4,638 7.77%224
51 218 20435 CNA Cas Of CA 177 0.0000% 177 0 0.00%269
52 31 27812 Columbia Ins Co 239,179 0.0444% 257,787 87,921 34.11%178
53 12 19410 Commerce & Industry Ins Co 2,680,540 0.4972% 2,434,663 1,464,331 60.15%60
54 816 13161 Commerce West Ins Co 18,056 0.0033% 3,898 2,210 56.70%244
55 181 19489 Commercial Underwriters Ins Co 329 0.0001% 162 0 0.00%267
56 44 20621 Commercial Union Ins Co 2,741,399 0.5085% 1,986,769 1,047,138 52.71%57
57 553 24872 Connecticut Ind Co 209,640 0.0389% 253,948 263,670 103.83%181
58 218 20443 Continental Cas Co 2,014,639 0.3737% 1,955,400 1,766,085 90.32%76
59 959 39551 Continental Heritage Ins Co 1,278 0.0002% 9,058 5,243 57.88%262
60 37206 Contractors Bonding & Ins Co 403,470 0.0748% 410,422 182,976 44.58%155
61 350 21318 Coregis Ins Co 801,562 0.1487% 727,437 -277,019 -38.08%126
62 306 10847 Cumis Ins Society Inc 9,033,457 1.6756% 8,152,570 4,995,495 61.28%13
63 920 42048 Diamond State Ins Co 32,622 0.0061% 40,309 35,700 88.57%237
64 164 36463 Discover Prop & Cas Ins Co 34,274 0.0064% 6,632 -7,457 -112.44%234
65 802 12890 Eagle West Ins Co 176,855 0.0328% 56,246 51,936 92.34%188
66 212 21326 Empire Fire & Marine Ins Co 2,710,950 0.5029% 2,499,909 1,644,932 65.80%58
67 44 20648 Employers Fire Ins Co 235,094 0.0436% 1,061,857 838,781 78.99%179
68 111 21458 Employers Ins Of Wausau Mut Co 1,284,575 0.2383% 1,062,224 739,495 69.62%98
69 62 21415 Employers Mut Cas Co 1,441,141 0.2673% 1,333,554 831,258 62.33%91
70 1120 10120 Everest Natl Ins Co 1,184,076 0.2196% 919,826 800,173 86.99%101
71 922 40029 Explorer Ins Co 1,654,767 0.3069% 1,639,139 842,281 51.39%85
72 158 18864 Fairmont Ins Co 97,884 0.0182% 49,575 26,827 54.11%209
73 2 42633 Far West Ins Co 4,892,898 0.9076% 4,892,898 5,683,768 116.16%23
74 212 21652 Farmers Ins Exch 2,943,657 0.5460% 2,775,170 928,158 33.45%53
75 38 20281 Federal Ins Co 6,266,903 1.1625% 6,990,306 3,541,512 50.66%19
76 7 13935 Federated Mut Ins Co 3,607,128 0.6691% 3,271,722 2,514,652 76.86%41
77 11118 Federated Rural Electric Ins Corp 3,194 0.0006% 3,166 10,545 333.07%255
78 7 28304 Federated Service Ins Co 104,952 0.0195% 34,053 12,079 35.47%206
79 212 39306 Fidelity & Deposit Co Of MD 201,030 0.0373% 170,708 55,722 32.64%183
80 164 35386 Fidelity & Guaranty Ins Co 2,266,210 0.4204% 2,090,305 1,267,009 60.61%67
81 164 25879 Fidelity & Guaranty Ins Underwriters 215,073 0.0399% 193,255 106,621 55.17%180
82 215 19852 Financial Ind Co 3,739,705 0.6937% 3,641,064 2,318,557 63.68%39
83 31453 Financial Pacific Ins Co 3,930,759 0.7291% 3,731,822 1,504,398 40.31%35
84 553 24880 Fire & Cas Ins Co Of CT 760,918 0.1411% 734,240 496,055 67.56%128
85 761 21873 Firemans Fund Ins Co 2,136,695 0.3963% 1,604,776 1,789,499 111.51%71
86 11150 First Amer Ins Co 942,018 0.1747% 521,809 156,106 29.92%115
87 479 11177 First Financial Ins Co 40,616 0.0075% 35,846 28,543 79.63%230
88 111 33588 First Liberty Ins Corp 373 0.0001% 2,587 0 0.00%265
89 163 24724 First Natl Ins Co Of Amer 1,460,721 0.2710% 1,252,129 553,992 44.24%90
90 349 13978 Florists Mut Ins Co 1,049,867 0.1947% 1,053,468 419,161 39.79%109
91 961 34266 Frontier Ins Co 1,673,590 0.3104% 1,625,232 1,308,734 80.53%84
92 961 42250 Frontier Pacific Ins Co 80,067 0.0149% 108,979 -558,976 -512.92%217
93 31 35882 Geico General Ins Co 96,106 0.0178% 90,369 65,932 72.96%210
94 44 21962 General Accident Ins Co 2,016,411 0.3740% 2,357,506 1,408,993 59.77%75
95 400 24414 General Cas Co Of WI 3,468 0.0006% 2,939 215 7.32%254
96 163 24732 General Ins Co Of Amer 1,603,878 0.2975% 1,536,078 898,393 58.49%86
California Department of Insurance Page 2 of 6 Rate Specialist Bureau - 07/10/2001
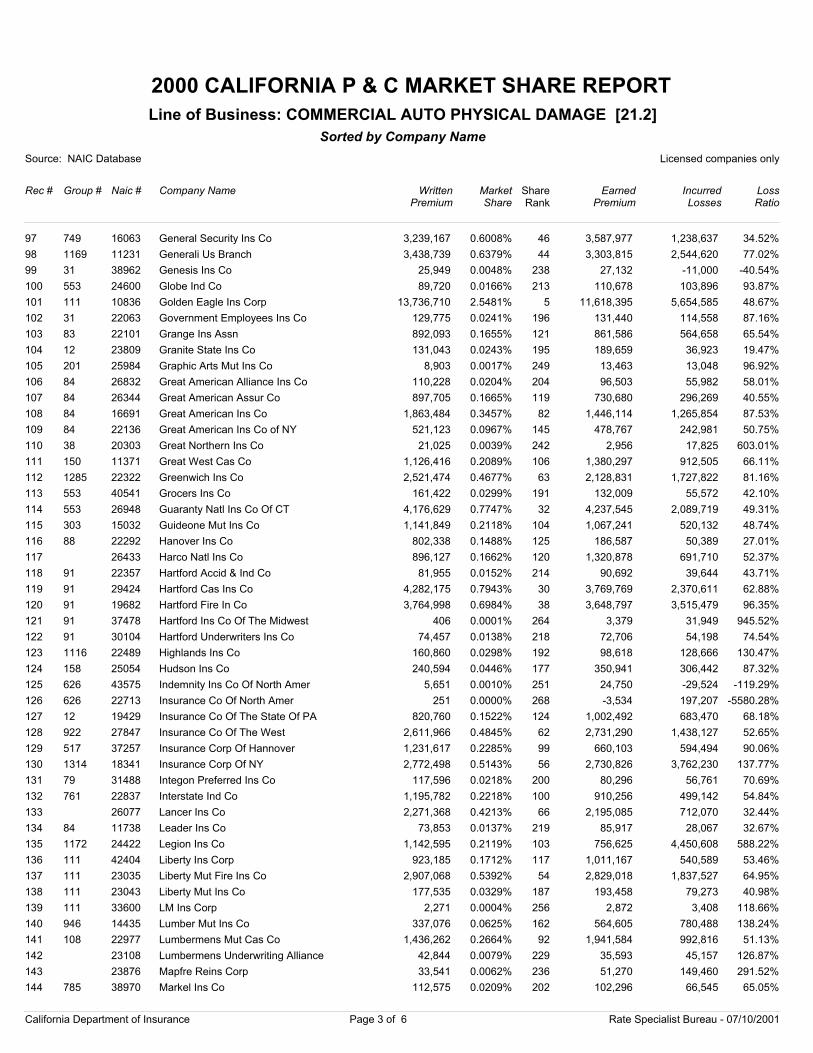
2000 CALIFORNIA P & C MARKET SHARE REPORT
Source: NAIC Database Licensed companies only
Rec # Group # Naic # Company Name
Sorted by Company Name
WrittenPremium
Market Share
EarnedPremium
IncurredLosses
LossRatio
Line of Business: COMMERCIAL AUTO PHYSICAL DAMAGE [21.2]
ShareRank
97 749 16063 General Security Ins Co 3,239,167 0.6008% 3,587,977 1,238,637 34.52%46
98 1169 11231 Generali Us Branch 3,438,739 0.6379% 3,303,815 2,544,620 77.02%44
99 31 38962 Genesis Ins Co 25,949 0.0048% 27,132 -11,000 -40.54%238
100 553 24600 Globe Ind Co 89,720 0.0166% 110,678 103,896 93.87%213
101 111 10836 Golden Eagle Ins Corp 13,736,710 2.5481% 11,618,395 5,654,585 48.67%5
102 31 22063 Government Employees Ins Co 129,775 0.0241% 131,440 114,558 87.16%196
103 83 22101 Grange Ins Assn 892,093 0.1655% 861,586 564,658 65.54%121
104 12 23809 Granite State Ins Co 131,043 0.0243% 189,659 36,923 19.47%195
105 201 25984 Graphic Arts Mut Ins Co 8,903 0.0017% 13,463 13,048 96.92%249
106 84 26832 Great American Alliance Ins Co 110,228 0.0204% 96,503 55,982 58.01%204
107 84 26344 Great American Assur Co 897,705 0.1665% 730,680 296,269 40.55%119
108 84 16691 Great American Ins Co 1,863,484 0.3457% 1,446,114 1,265,854 87.53%82
109 84 22136 Great American Ins Co of NY 521,123 0.0967% 478,767 242,981 50.75%145
110 38 20303 Great Northern Ins Co 21,025 0.0039% 2,956 17,825 603.01%242
111 150 11371 Great West Cas Co 1,126,416 0.2089% 1,380,297 912,505 66.11%106
112 1285 22322 Greenwich Ins Co 2,521,474 0.4677% 2,128,831 1,727,822 81.16%63
113 553 40541 Grocers Ins Co 161,422 0.0299% 132,009 55,572 42.10%191
114 553 26948 Guaranty Natl Ins Co Of CT 4,176,629 0.7747% 4,237,545 2,089,719 49.31%32
115 303 15032 Guideone Mut Ins Co 1,141,849 0.2118% 1,067,241 520,132 48.74%104
116 88 22292 Hanover Ins Co 802,338 0.1488% 186,587 50,389 27.01%125
117 26433 Harco Natl Ins Co 896,127 0.1662% 1,320,878 691,710 52.37%120
118 91 22357 Hartford Accid & Ind Co 81,955 0.0152% 90,692 39,644 43.71%214
119 91 29424 Hartford Cas Ins Co 4,282,175 0.7943% 3,769,769 2,370,611 62.88%30
120 91 19682 Hartford Fire In Co 3,764,998 0.6984% 3,648,797 3,515,479 96.35%38
121 91 37478 Hartford Ins Co Of The Midwest 406 0.0001% 3,379 31,949 945.52%264
122 91 30104 Hartford Underwriters Ins Co 74,457 0.0138% 72,706 54,198 74.54%218
123 1116 22489 Highlands Ins Co 160,860 0.0298% 98,618 128,666 130.47%192
124 158 25054 Hudson Ins Co 240,594 0.0446% 350,941 306,442 87.32%177
125 626 43575 Indemnity Ins Co Of North Amer 5,651 0.0010% 24,750 -29,524 -119.29%251
126 626 22713 Insurance Co Of North Amer 251 0.0000% -3,534 197,207 -5580.28%268
127 12 19429 Insurance Co Of The State Of PA 820,760 0.1522% 1,002,492 683,470 68.18%124
128 922 27847 Insurance Co Of The West 2,611,966 0.4845% 2,731,290 1,438,127 52.65%62
129 517 37257 Insurance Corp Of Hannover 1,231,617 0.2285% 660,103 594,494 90.06%99
130 1314 18341 Insurance Corp Of NY 2,772,498 0.5143% 2,730,826 3,762,230 137.77%56
131 79 31488 Integon Preferred Ins Co 117,596 0.0218% 80,296 56,761 70.69%200
132 761 22837 Interstate Ind Co 1,195,782 0.2218% 910,256 499,142 54.84%100
133 26077 Lancer Ins Co 2,271,368 0.4213% 2,195,085 712,070 32.44%66
134 84 11738 Leader Ins Co 73,853 0.0137% 85,917 28,067 32.67%219
135 1172 24422 Legion Ins Co 1,142,595 0.2119% 756,625 4,450,608 588.22%103
136 111 42404 Liberty Ins Corp 923,185 0.1712% 1,011,167 540,589 53.46%117
137 111 23035 Liberty Mut Fire Ins Co 2,907,068 0.5392% 2,829,018 1,837,527 64.95%54
138 111 23043 Liberty Mut Ins Co 177,535 0.0329% 193,458 79,273 40.98%187
139 111 33600 LM Ins Corp 2,271 0.0004% 2,872 3,408 118.66%256
140 946 14435 Lumber Mut Ins Co 337,076 0.0625% 564,605 780,488 138.24%162
141 108 22977 Lumbermens Mut Cas Co 1,436,262 0.2664% 1,941,584 992,816 51.13%92
142 23108 Lumbermens Underwriting Alliance 42,844 0.0079% 35,593 45,157 126.87%229
143 23876 Mapfre Reins Corp 33,541 0.0062% 51,270 149,460 291.52%236
144 785 38970 Markel Ins Co 112,575 0.0209% 102,296 66,545 65.05%202
California Department of Insurance Page 3 of 6 Rate Specialist Bureau - 07/10/2001
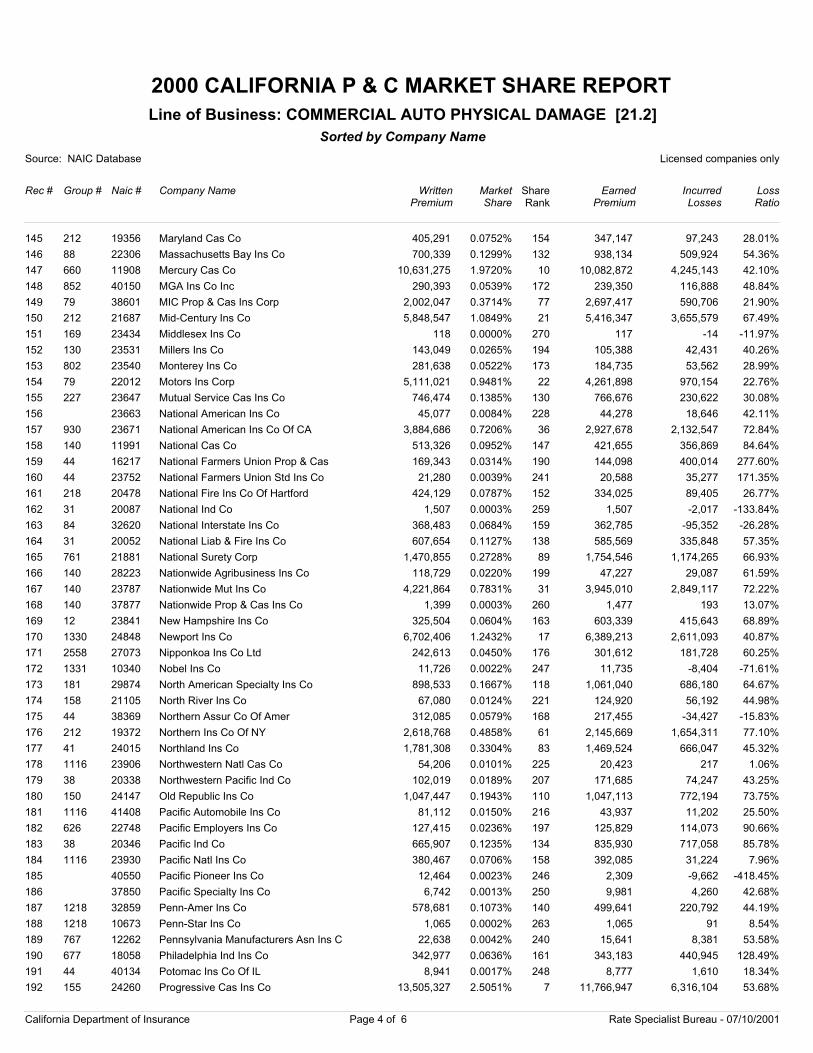
2000 CALIFORNIA P & C MARKET SHARE REPORT
Source: NAIC Database Licensed companies only
Rec # Group # Naic # Company Name
Sorted by Company Name
WrittenPremium
Market Share
EarnedPremium
IncurredLosses
LossRatio
Line of Business: COMMERCIAL AUTO PHYSICAL DAMAGE [21.2]
ShareRank
145 212 19356 Maryland Cas Co 405,291 0.0752% 347,147 97,243 28.01%154
146 88 22306 Massachusetts Bay Ins Co 700,339 0.1299% 938,134 509,924 54.36%132
147 660 11908 Mercury Cas Co 10,631,275 1.9720% 10,082,872 4,245,143 42.10%10
148 852 40150 MGA Ins Co Inc 290,393 0.0539% 239,350 116,888 48.84%172
149 79 38601 MIC Prop & Cas Ins Corp 2,002,047 0.3714% 2,697,417 590,706 21.90%77
150 212 21687 Mid-Century Ins Co 5,848,547 1.0849% 5,416,347 3,655,579 67.49%21
151 169 23434 Middlesex Ins Co 118 0.0000% 117 -14 -11.97%270
152 130 23531 Millers Ins Co 143,049 0.0265% 105,388 42,431 40.26%194
153 802 23540 Monterey Ins Co 281,638 0.0522% 184,735 53,562 28.99%173
154 79 22012 Motors Ins Corp 5,111,021 0.9481% 4,261,898 970,154 22.76%22
155 227 23647 Mutual Service Cas Ins Co 746,474 0.1385% 766,676 230,622 30.08%130
156 23663 National American Ins Co 45,077 0.0084% 44,278 18,646 42.11%228
157 930 23671 National American Ins Co Of CA 3,884,686 0.7206% 2,927,678 2,132,547 72.84%36
158 140 11991 National Cas Co 513,326 0.0952% 421,655 356,869 84.64%147
159 44 16217 National Farmers Union Prop & Cas 169,343 0.0314% 144,098 400,014 277.60%190
160 44 23752 National Farmers Union Std Ins Co 21,280 0.0039% 20,588 35,277 171.35%241
161 218 20478 National Fire Ins Co Of Hartford 424,129 0.0787% 334,025 89,405 26.77%152
162 31 20087 National Ind Co 1,507 0.0003% 1,507 -2,017 -133.84%259
163 84 32620 National Interstate Ins Co 368,483 0.0684% 362,785 -95,352 -26.28%159
164 31 20052 National Liab & Fire Ins Co 607,654 0.1127% 585,569 335,848 57.35%138
165 761 21881 National Surety Corp 1,470,855 0.2728% 1,754,546 1,174,265 66.93%89
166 140 28223 Nationwide Agribusiness Ins Co 118,729 0.0220% 47,227 29,087 61.59%199
167 140 23787 Nationwide Mut Ins Co 4,221,864 0.7831% 3,945,010 2,849,117 72.22%31
168 140 37877 Nationwide Prop & Cas Ins Co 1,399 0.0003% 1,477 193 13.07%260
169 12 23841 New Hampshire Ins Co 325,504 0.0604% 603,339 415,643 68.89%163
170 1330 24848 Newport Ins Co 6,702,406 1.2432% 6,389,213 2,611,093 40.87%17
171 2558 27073 Nipponkoa Ins Co Ltd 242,613 0.0450% 301,612 181,728 60.25%176
172 1331 10340 Nobel Ins Co 11,726 0.0022% 11,735 -8,404 -71.61%247
173 181 29874 North American Specialty Ins Co 898,533 0.1667% 1,061,040 686,180 64.67%118
174 158 21105 North River Ins Co 67,080 0.0124% 124,920 56,192 44.98%221
175 44 38369 Northern Assur Co Of Amer 312,085 0.0579% 217,455 -34,427 -15.83%168
176 212 19372 Northern Ins Co Of NY 2,618,768 0.4858% 2,145,669 1,654,311 77.10%61
177 41 24015 Northland Ins Co 1,781,308 0.3304% 1,469,524 666,047 45.32%83
178 1116 23906 Northwestern Natl Cas Co 54,206 0.0101% 20,423 217 1.06%225
179 38 20338 Northwestern Pacific Ind Co 102,019 0.0189% 171,685 74,247 43.25%207
180 150 24147 Old Republic Ins Co 1,047,447 0.1943% 1,047,113 772,194 73.75%110
181 1116 41408 Pacific Automobile Ins Co 81,112 0.0150% 43,937 11,202 25.50%216
182 626 22748 Pacific Employers Ins Co 127,415 0.0236% 125,829 114,073 90.66%197
183 38 20346 Pacific Ind Co 665,907 0.1235% 835,930 717,058 85.78%134
184 1116 23930 Pacific Natl Ins Co 380,467 0.0706% 392,085 31,224 7.96%158
185 40550 Pacific Pioneer Ins Co 12,464 0.0023% 2,309 -9,662 -418.45%246
186 37850 Pacific Specialty Ins Co 6,742 0.0013% 9,981 4,260 42.68%250
187 1218 32859 Penn-Amer Ins Co 578,681 0.1073% 499,641 220,792 44.19%140
188 1218 10673 Penn-Star Ins Co 1,065 0.0002% 1,065 91 8.54%263
189 767 12262 Pennsylvania Manufacturers Asn Ins C 22,638 0.0042% 15,641 8,381 53.58%240
190 677 18058 Philadelphia Ind Ins Co 342,977 0.0636% 343,183 440,945 128.49%161
191 44 40134 Potomac Ins Co Of IL 8,941 0.0017% 8,777 1,610 18.34%248
192 155 24260 Progressive Cas Ins Co 13,505,327 2.5051% 11,766,947 6,316,104 53.68%7
California Department of Insurance Page 4 of 6 Rate Specialist Bureau - 07/10/2001
2000 CALIFORNIA P & C MARKET SHARE REPORT
Source: NAIC Database Licensed companies only
Rec # Group # Naic # Company Name
Sorted by Company Name
WrittenPremium
Market Share
EarnedPremium
IncurredLosses
LossRatio
Line of Business: COMMERCIAL AUTO PHYSICAL DAMAGE [21.2]
ShareRank
193 155 42919 Progressive Northwestern Ins Co 47,729 0.0089% 47,729 66,339 138.99%227
194 867 12416 Protective Ins Co 63,980 0.0119% 63,980 26,685 41.71%222
195 156 24295 Providence Washington Ins Co 334 0.0001% 730 -2,198 -301.10%266
196 304 32352 Prudential Prop & Cas Ins Co 170,381 0.0316% 170,381 -70,794 -41.55%189
197 796 39217 QBE Ins Corp 2,176,380 0.4037% 450,508 334,710 74.30%69
198 158 24384 Ranger Ins Co 2,135,109 0.3960% 1,950,350 1,023,583 52.48%72
199 517 37303 Redland Ins Co 535,054 0.0992% 824,032 722,522 87.68%143
200 400 24449 Regent Ins Co 36,723 0.0068% 36,026 17,455 48.45%233
201 574 31089 Republic Western Ins Co 850,120 0.1577% 724,213 603,510 83.33%123
202 783 13056 RLI Ins Co 1,303,667 0.2418% 1,121,101 1,034,073 92.24%96
203 83 22128 Rocky Mountain Fire & Cas Co 198,965 0.0369% 155,478 142,108 91.40%184
204 553 24678 Royal Ind Co 514,853 0.0955% 517,503 231,226 44.68%146
205 553 26980 Royal Ins Co Of Amer 3,043,972 0.5646% 3,008,168 2,083,418 69.26%49
206 10823 Sable Ins Co 367,677 0.0682% 329,043 191,962 58.34%160
207 163 24740 Safeco Ins Co Of Amer 3,808,852 0.7065% 4,812,275 3,063,368 63.66%37
208 553 24694 Safeguard Ins Co 143,395 0.0266% 149,254 126,844 84.99%193
209 74 15105 Safety Natl Cas Corp 428,126 0.0794% 424,436 783,981 184.71%151
210 867 40460 Sagamore Ins Co 193,297 0.0359% 152,029 107,893 70.97%186
211 140 15580 Scottsdale Ind Co 3,964,954 0.7355% 3,768,693 2,167,615 57.52%34
212 553 24902 Security Ins Co Of Hartford 966,707 0.1793% 815,913 1,481,420 181.57%113
213 41 22233 Select Ins Co 706,787 0.1311% 577,758 675,858 116.98%131
214 169 24988 Sentry Ins A Mut Co 760,632 0.1411% 730,162 365,160 50.01%129
215 169 21180 Sentry Select Ins Co 4,404,214 0.8169% 4,382,500 4,194,311 95.71%28
216 772 22985 Sequoia Ins Co 2,990,047 0.5546% 2,797,658 1,046,672 37.41%50
217 84 24899 Seven Hills Ins Co 198,858 0.0369% 240,707 148,977 61.89%185
218 686 39322 Sorema North Amer Reins Co 24,574 0.0046% 13,422 0 0.00%239
219 400 19216 Southern Ins Co 38,120 0.0071% 39,965 74,961 187.57%232
220 108 20524 Specialty Natl Ins Co 665,969 0.1235% 370,587 40,195 10.85%133
221 164 24767 St Paul Fire & Marine Ins Co 6,001,170 1.1132% 5,789,273 3,213,332 55.50%20
222 164 24775 St Paul Guardian Ins Co 435,121 0.0807% 499,162 628,324 125.88%150
223 164 24791 St Paul Mercury Ins Co 1,143,081 0.2120% 1,092,331 441,005 40.37%102
224 748 18023 Star Ins Co 1,046,223 0.1941% 788,296 884,906 112.26%111
225 176 25143 State Farm Fire And Cas Co 461,923 0.0857% 530,959 333,127 62.74%149
226 176 25178 State Farm Mut Auto Ins Co 29,239,252 5.4237% 30,773,989 21,482,842 69.81%2
227 93 12831 State Natl Ins Co Inc 13,605,826 2.5238% 12,442,604 3,411,920 27.42%6
228 20362 Sumitomo Mar & Fire Ins Co Ltd Us Br 551,742 0.1023% 575,488 544,820 94.67%141
229 808 32107 Sutter Ins Co 786,006 0.1458% 524,981 277,668 52.89%127
230 158 25496 TIG Ind Co 1,289,509 0.2392% 1,358,863 975,747 71.81%97
231 158 25534 TIG Ins Co 3,332,839 0.6182% 3,111,516 1,242,756 39.94%45
232 950 12904 Tokio Marine & Fire Ins Co Ltd Us Br 2,435,020 0.4517% 2,406,182 1,094,813 45.50%65
233 161 18031 Topa Ins Co 1,493,297 0.2770% 1,163,342 704,140 60.53%88
234 218 20486 Transcontinental Ins Co 1,128,715 0.2094% 1,134,060 793,646 69.98%105
235 28886 Transguard Ins Co Of Amer Inc 91,271 0.0169% 66,440 71,595 107.76%212
236 218 20494 Transportation Ins Co 2,986,309 0.5539% 3,573,946 2,219,978 62.12%51
237 41 25682 Travelers Ind Co Of CT 2,061,994 0.3825% 1,818,564 874,320 48.08%74
238 41 25674 Travelers Ind Co Of IL 9,909,998 1.8382% 8,790,432 5,610,616 63.83%12
239 212 21709 Truck Ins Exch 7,472,510 1.3861% 7,099,169 3,769,331 53.10%16
240 91 29459 Twin City Fire Ins Co Co 312,792 0.0580% 304,904 117,303 38.47%167
California Department of Insurance Page 5 of 6 Rate Specialist Bureau - 07/10/2001
2000 CALIFORNIA P & C MARKET SHARE REPORT
Source: NAIC Database Licensed companies only
Rec # Group # Naic # Company Name
Sorted by Company Name
WrittenPremium
Market Share
EarnedPremium
IncurredLosses
LossRatio
Line of Business: COMMERCIAL AUTO PHYSICAL DAMAGE [21.2]
ShareRank
241 781 37893 Ulico Cas Co 390,273 0.0724% 340,349 81,378 23.91%157
242 181 18619 Underwriters Ins Co 4,545,232 0.8431% 4,591,460 3,181,193 69.28%27
243 400 25798 Unigard Ind Co 649,271 0.1204% 700,130 328,756 46.96%135
244 400 25747 Unigard Ins Co 4,737,380 0.8787% 4,215,465 2,238,017 53.09%25
245 155 11770 United Fncl Cas Co 33,357,703 6.1876% 32,412,075 17,523,543 54.06%1
246 158 21113 United States Fire Ins Co 625,106 0.1160% 531,584 440,755 82.91%136
247 212 41181 Universal Underwriters Ins Co 13,389,200 2.4836% 13,940,006 6,102,584 43.78%8
248 164 25887 US Fidelity & Guaranty Co 3,526,419 0.6541% 3,032,027 607,571 20.04%42
249 201 25976 Utica Mut Ins Co 48,922 0.0091% 63,683 48,809 76.64%226
250 212 26611 Valiant Ins Co 881,945 0.1636% 936,459 459,194 49.04%122
251 218 20508 Valley Forge Ins Co 2,186,482 0.4056% 3,120,414 1,816,955 58.23%68
252 215 14133 Valley Ins Co 1,909,189 0.3541% 959,160 556,233 57.99%78
253 21172 Vanliner Ins Co 624,437 0.1158% 501,353 261,551 52.17%137
254 38 20397 Vigilant Ins Co 60,194 0.0112% 85,025 81,860 96.28%223
255 1172 19577 Villanova Ins Co 4,349,419 0.8068% 1,901,108 1,118,696 58.84%29
256 317 40827 Virginia Surety Co Inc 2,181 0.0004% 3,557 244 6.86%257
257 111 26069 Wausau Business Ins Co 325,260 0.0603% 339,770 560,189 164.87%164
258 111 26042 Wausau Underwriters Ins Co 319,016 0.0592% 420,467 376,874 89.63%165
259 626 21121 Westchester Fire Ins Co 110,308 0.0205% 160,909 -1,572 -0.98%203
260 650 40010 Western Family Ins Co 202,894 0.0376% 262,241 218,674 83.39%182
261 27502 Western General Ins Co 27,317,543 5.0672% 33,092,619 23,218,830 70.16%3
262 350 34207 Westport Ins Corp 292,078 0.0542% 311,693 515,423 165.36%171
263 237 24635 Westward Ins Co 301,669 0.0560% 301,669 98,437 32.63%170
264 748 25780 Williamsburg Natl Ins Co 1,401,528 0.2600% 1,703,114 1,076,009 63.18%95
265 225 13234 Wilshire Ins Co 3,644,130 0.6760% 3,621,221 1,936,393 53.47%40
266 400 24554 Winterthur Intl Amer Ins Co 95,287 0.0177% 72,336 57,727 79.80%211
267 1285 37885 XL Specialty Ins Co 2,951,155 0.5474% 2,144,470 1,815,745 84.67%52
268 11126 Yasuda Fire & Marine Ins Co Of Amer 1,867,737 0.3465% 2,046,185 1,096,505 53.59%81
269 212 22730 ZC Ins Co 10,083,467 1.8704% 5,828,297 3,895,675 66.84%11
270 212 16535 Zurich American Ins Co 2,820,941 0.5233% 1,917,503 1,274,978 66.49%55
539,106,013 100.0000% 518,008,917 308,751,951 59.60%Line Total:
California Department of Insurance Page 6 of 6 Rate Specialist Bureau - 07/10/2001
2000 CALIFORNIA P & C MARKET SHARE REPORT
Source: NAIC Database Licensed companies only
Rec # Group # Naic # Company Name
Sorted by Company Name
WrittenPremium
Market Share
EarnedPremium
IncurredLosses
LossRatio
Line of Business: AIRCRAFT [22]
ShareRank
1 626 22667 Ace American Ins Co 3,600 0.0029% 1,856 -88,265 -4755.66%35
2 12 19380 American Home Assur Co 8,256,277 6.7325% 10,744,971 4,097,053 38.13%5
3 108 22918 American Motorists Ins Co 119 0.0001% 119 -24,691 -20748.74%41
4 984 10367 Avemco Ins Co 6,143,620 5.0098% 6,647,775 3,546,779 53.35%8
5 24 19909 Centennial Ins Co 812,700 0.6627% 783,672 288,359 36.80%23
6 244 10677 Cincinnati Ins Co 3,256,289 2.6553% 3,041,878 1,511,067 49.68%15
7 517 20532 Clarendon Natl Ins Co 189,179 0.1543% 87,011 62,213 71.50%28
8 218 20443 Continental Cas Co 4,619,321 3.7668% 4,161,595 95,238 2.29%13
9 218 35289 Continental Ins Co 638 0.0005% 638 -168,456 -26403.76%37
10 38 20281 Federal Ins Co 4,856,103 3.9599% 4,651,523 1,033,894 22.23%12
11 761 21873 Firemans Fund Ins Co 1,315,153 1.0724% 2,505,904 427,102 17.04%21
12 218 20850 Firemens Ins Co Of Newark NJ 128 0.0001% 128 290,672227087.50%40
13 163 24732 General Ins Co Of Amer 62 0.0001% 62 -380,530613758.06%43
14 1169 11231 Generali Us Branch 123,623 0.1008% 193,044 665,792 344.89%30
15 218 34622 Glens Falls Ins Co 213 0.0002% 213 -61,398 -28825.35%38
16 84 16691 Great American Ins Co 2,915,727 2.3776% 3,998,510 3,741,483 93.57%17
17 1285 22322 Greenwich Ins Co 1,173,452 0.9569% -128,147 239,634 -187.00%22
18 91 19682 Hartford Fire In Co 6,419,674 5.2349% 5,997,710 2,858,727 47.66%7
19 626 43575 Indemnity Ins Co Of North Amer 9,571,795 7.8052% 8,567,376 10,265,552 119.82%3
20 626 22713 Insurance Co Of North Amer 71,279 0.0581% 79,451 -928,984 -1169.25%32
21 12 19429 Insurance Co Of The State Of PA 703,496 0.5737% 148,332 717,972 484.03%24
22 761 11630 Jefferson Ins Co 93,208 0.0760% 68,032 63,354 93.12%31
23 1172 24422 Legion Ins Co 40,185 0.0328% 34,995 1,704 4.87%33
24 111 23043 Liberty Mut Ins Co 5,206,154 4.2453% 5,206,154 4,343,488 83.43%10
25 108 22977 Lumbermens Mut Cas Co 1,611,185 1.3138% 1,556,929 621,385 39.91%18
26 12 19445 National Union Fire Ins Co Of Pitts 12,858,688 10.4855% 11,145,823 3,805,436 34.14%2
27 510 42307 Navigators Ins Co 128 0.0001% 128 46,829 36585.16%39
28 12 23841 New Hampshire Ins Co 222,941 0.1818% 253,517 222,644 87.82%27
29 256 16608 New York Marine & Gnrl Ins Co 317,045 0.2585% 339,137 592,854 174.81%26
30 1331 10340 Nobel Ins Co 848 0.0007% 848 255 30.07%36
31 150 24147 Old Republic Ins Co 5,409,029 4.4107% 5,484,062 2,180,628 39.76%9
32 158 24384 Ranger Ins Co 173,078 0.1411% 1,913,195 3,472,707 181.51%29
33 553 24678 Royal Ind Co 3,847,516 3.1374% 3,584,022 1,518,160 42.36%14
34 169 21180 Sentry Select Ins Co 1,586,034 1.2933% 1,775,858 1,884,422 106.11%19
35 164 24767 St Paul Fire & Marine Ins Co 3,104,100 2.5312% 2,962,743 1,416,577 47.81%16
36 41 19038 Travelers Cas & Surety Co 66 0.0001% 66 -219,115331992.42%42
37 41 25682 Travelers Ind Co Of CT 22,175 0.0181% 84,821 6,471 7.63%34
38 181 18619 Underwriters Ins Co 1,411,285 1.1508% 1,029,275 462,834 44.97%20
39 984 29599 US Specialty Ins Co 14,402,463 11.7443% 12,429,789 6,866,423 55.24%1
40 626 21121 Westchester Fire Ins Co 6,922,701 5.6450% 2,472,044 1,337,638 54.11%6
41 350 34207 Westport Ins Corp 652,194 0.5318% 652,194 455,287 69.81%25
42 1285 37885 XL Specialty Ins Co 9,186,349 7.4909% 5,844,632 612,124 10.47%4
43 212 16535 Zurich American Ins Co 5,133,321 4.1859% 4,749,105 2,021,805 42.57%11
122,633,141 100.0000% 113,070,990 59,903,123 52.98%Line Total:
California Department of Insurance Page 1 of 1 Rate Specialist Bureau - 07/10/2001
2000 CALIFORNIA P & C MARKET SHARE REPORT
Source: NAIC Database Licensed companies only
Rec # Group # Naic # Company Name
Sorted by Company Name
WrittenPremium
Market Share
EarnedPremium
IncurredLosses
LossRatio
Line of Business: FIDELITY [23]
ShareRank
1 65 10014 Affiliated Fm Ins Co 504,338 0.6198% 326,132 614,046 188.28%22
2 8 19232 Allstate Ins Co 64,571 0.0794% 64,564 11,995 18.58%51
3 553 24589 American & Foreign Ins Co 4,367 0.0054% 777 335 43.11%93
4 957 19720 American Alt Ins Corp 398 0.0005% 190 92 48.42%119
5 761 21849 American Automobile Ins Co 50 0.0001% 50 -233 -466.00%128
6 218 20427 American Cas Co Of Reading PA 3,266 0.0040% 3,638 -27,012 -742.50%98
7 163 19690 American Economy Ins Co 16,722 0.0205% 13,511 1,148 8.50%72
8 212 26247 American Guarantee & Liability Ins 100 0.0001% 2,630 33,092 1258.25%127
9 291 13331 American Hardware Mut Ins Co 71,507 0.0879% 54,603 694 1.27%49
10 761 21857 American Ins Co 6,100 0.0075% 11,521 -1,746 -15.15%83
11 108 30562 American Manufacturers Mut Ins Co 636 0.0008% 373 28 7.51%115
12 108 22918 American Motorists Ins Co 33,935 0.0417% 39,751 12,777 32.14%59
13 108 18910 American Protection Ins Co 5,637 0.0069% 3,894 532 13.66%87
14 163 19704 American States Ins Co 30,952 0.0380% 28,317 2,354 8.31%62
15 212 19305 Assurance Co Of Amer 86,391 0.1062% 72,478 41,672 57.50%44
16 24 19895 Atlantic Mut Ins Co 12,992 0.0160% 11,855 6,319 53.30%78
17 18538 Bancinsure Inc 322,682 0.3965% 631,871 438,511 69.40%26
18 44 21970 CGU Ins Co 4,550 0.0056% 4,132 -776 -18.78%92
19 240 10499 Chrysler Ins Co 116,498 0.1432% 102,796 220,355 214.36%38
20 12 19410 Commerce & Industry Ins Co 250 0.0003% 218 87 39.91%123
21 44 20621 Commercial Union Ins Co 430 0.0005% 1,041 8,289 796.25%118
22 36960 Connecticut Surety Co 70,305 0.0864% 73,144 6,980 9.54%50
23 218 20443 Continental Cas Co 1,699,761 2.0889% 1,292,457 -2,515,163 -194.60%9
24 218 35289 Continental Ins Co 581,377 0.7145% 611,044 442,216 72.37%21
25 306 10847 Cumis Ins Society Inc 12,635,384 15.5279% 12,230,264 17,206,458 140.69%3
26 920 42048 Diamond State Ins Co 116 0.0001% 116 0 0.00%125
27 111 21458 Employers Ins Of Wausau Mut Co 71,962 0.0884% 62,368 -23,405 -37.53%48
28 62 21415 Employers Mut Cas Co 14,286 0.0176% 13,717 -463 -3.38%76
29 38 35181 Executive Risk Ind Inc 1,350,495 1.6596% 1,450,997 172,864 11.91%11
30 65 21482 Factory Mut Ins Co 864,586 1.0625% 932,708 -1,119,628 -120.04%18
31 212 21652 Farmers Ins Exch 3,143 0.0039% 1,596 256 16.04%99
32 38 20281 Federal Ins Co 15,491,072 19.0373% 14,476,160 6,268,585 43.30%1
33 7 13935 Federated Mut Ins Co 173,337 0.2130% 262,766 -39,792 -15.14%32
34 11118 Federated Rural Electric Ins Corp 1,217 0.0015% 1,185 -127 -10.72%111
35 7 28304 Federated Service Ins Co 8,229 0.0101% 1,742 450 25.83%81
36 218 35270 Fidelity & Cas Co Of NY 285 0.0004% 662 16,315 2464.50%121
37 212 39306 Fidelity & Deposit Co Of MD 4,210,449 5.1743% 3,642,594 3,772,156 103.56%6
38 164 35386 Fidelity & Guaranty Ins Co 124,612 0.1531% 105,906 51,455 48.59%37
39 164 25879 Fidelity & Guaranty Ins Underwriters 17,514 0.0215% 30,367 39,989 131.69%71
40 761 21873 Firemans Fund Ins Co 3,006 0.0037% 3,061 -2,061 -67.33%100
41 218 20850 Firemens Ins Co Of Newark NJ 624 0.0008% 463 0 0.00%116
42 163 24724 First Natl Ins Co Of Amer 3,794 0.0047% 4,691 208 4.43%95
43 961 34266 Frontier Ins Co 700 0.0009% 783 -12 -1.53%114
44 961 42250 Frontier Pacific Ins Co 126,135 0.1550% 127,113 9,880 7.77%36
45 400 24414 General Cas Co Of WI 15,000 0.0184% 13,893 3,333 23.99%74
46 163 24732 General Ins Co Of Amer 21,082 0.0259% 23,932 14,511 60.63%69
47 553 24600 Globe Ind Co 1,583 0.0019% 1,584 547 34.53%107
48 111 10836 Golden Eagle Ins Corp 696,530 0.8560% 582,715 324,934 55.76%20
California Department of Insurance Page 1 of 3 Rate Specialist Bureau - 07/10/2001
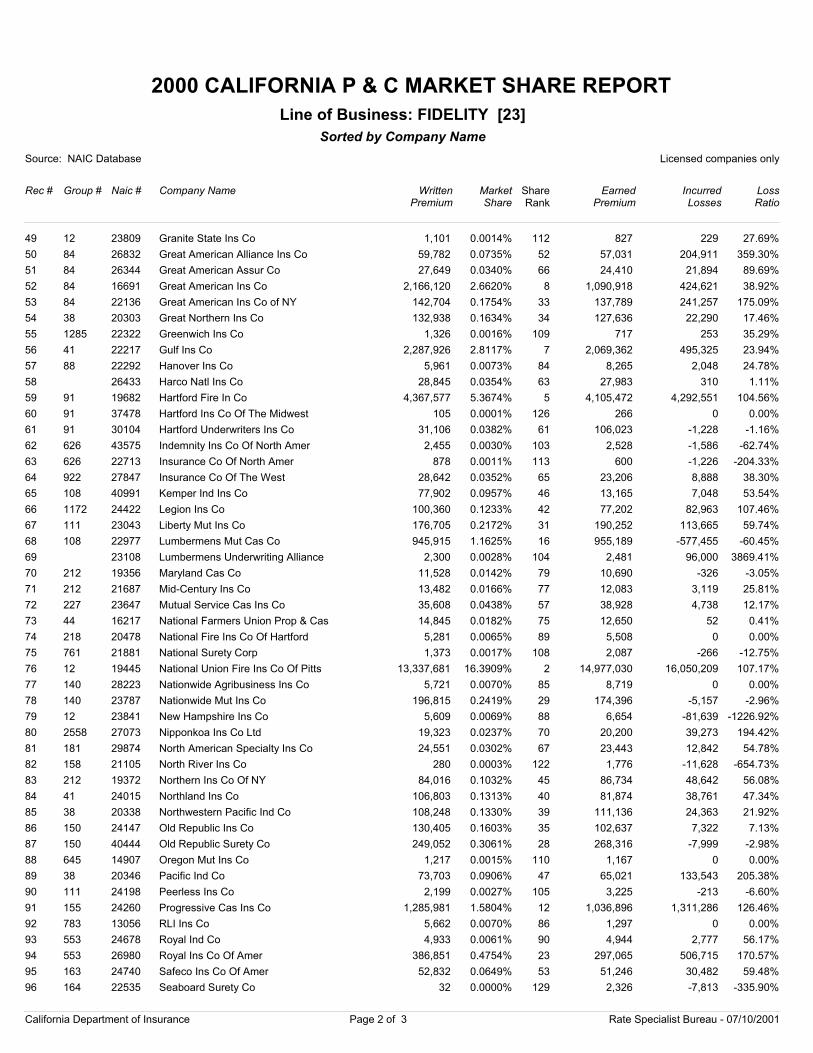
2000 CALIFORNIA P & C MARKET SHARE REPORT
Source: NAIC Database Licensed companies only
Rec # Group # Naic # Company Name
Sorted by Company Name
WrittenPremium
Market Share
EarnedPremium
IncurredLosses
LossRatio
Line of Business: FIDELITY [23]
ShareRank
49 12 23809 Granite State Ins Co 1,101 0.0014% 827 229 27.69%112
50 84 26832 Great American Alliance Ins Co 59,782 0.0735% 57,031 204,911 359.30%52
51 84 26344 Great American Assur Co 27,649 0.0340% 24,410 21,894 89.69%66
52 84 16691 Great American Ins Co 2,166,120 2.6620% 1,090,918 424,621 38.92%8
53 84 22136 Great American Ins Co of NY 142,704 0.1754% 137,789 241,257 175.09%33
54 38 20303 Great Northern Ins Co 132,938 0.1634% 127,636 22,290 17.46%34
55 1285 22322 Greenwich Ins Co 1,326 0.0016% 717 253 35.29%109
56 41 22217 Gulf Ins Co 2,287,926 2.8117% 2,069,362 495,325 23.94%7
57 88 22292 Hanover Ins Co 5,961 0.0073% 8,265 2,048 24.78%84
58 26433 Harco Natl Ins Co 28,845 0.0354% 27,983 310 1.11%63
59 91 19682 Hartford Fire In Co 4,367,577 5.3674% 4,105,472 4,292,551 104.56%5
60 91 37478 Hartford Ins Co Of The Midwest 105 0.0001% 266 0 0.00%126
61 91 30104 Hartford Underwriters Ins Co 31,106 0.0382% 106,023 -1,228 -1.16%61
62 626 43575 Indemnity Ins Co Of North Amer 2,455 0.0030% 2,528 -1,586 -62.74%103
63 626 22713 Insurance Co Of North Amer 878 0.0011% 600 -1,226 -204.33%113
64 922 27847 Insurance Co Of The West 28,642 0.0352% 23,206 8,888 38.30%65
65 108 40991 Kemper Ind Ins Co 77,902 0.0957% 13,165 7,048 53.54%46
66 1172 24422 Legion Ins Co 100,360 0.1233% 77,202 82,963 107.46%42
67 111 23043 Liberty Mut Ins Co 176,705 0.2172% 190,252 113,665 59.74%31
68 108 22977 Lumbermens Mut Cas Co 945,915 1.1625% 955,189 -577,455 -60.45%16
69 23108 Lumbermens Underwriting Alliance 2,300 0.0028% 2,481 96,000 3869.41%104
70 212 19356 Maryland Cas Co 11,528 0.0142% 10,690 -326 -3.05%79
71 212 21687 Mid-Century Ins Co 13,482 0.0166% 12,083 3,119 25.81%77
72 227 23647 Mutual Service Cas Ins Co 35,608 0.0438% 38,928 4,738 12.17%57
73 44 16217 National Farmers Union Prop & Cas 14,845 0.0182% 12,650 52 0.41%75
74 218 20478 National Fire Ins Co Of Hartford 5,281 0.0065% 5,508 0 0.00%89
75 761 21881 National Surety Corp 1,373 0.0017% 2,087 -266 -12.75%108
76 12 19445 National Union Fire Ins Co Of Pitts 13,337,681 16.3909% 14,977,030 16,050,209 107.17%2
77 140 28223 Nationwide Agribusiness Ins Co 5,721 0.0070% 8,719 0 0.00%85
78 140 23787 Nationwide Mut Ins Co 196,815 0.2419% 174,396 -5,157 -2.96%29
79 12 23841 New Hampshire Ins Co 5,609 0.0069% 6,654 -81,639 -1226.92%88
80 2558 27073 Nipponkoa Ins Co Ltd 19,323 0.0237% 20,200 39,273 194.42%70
81 181 29874 North American Specialty Ins Co 24,551 0.0302% 23,443 12,842 54.78%67
82 158 21105 North River Ins Co 280 0.0003% 1,776 -11,628 -654.73%122
83 212 19372 Northern Ins Co Of NY 84,016 0.1032% 86,734 48,642 56.08%45
84 41 24015 Northland Ins Co 106,803 0.1313% 81,874 38,761 47.34%40
85 38 20338 Northwestern Pacific Ind Co 108,248 0.1330% 111,136 24,363 21.92%39
86 150 24147 Old Republic Ins Co 130,405 0.1603% 102,637 7,322 7.13%35
87 150 40444 Old Republic Surety Co 249,052 0.3061% 268,316 -7,999 -2.98%28
88 645 14907 Oregon Mut Ins Co 1,217 0.0015% 1,167 0 0.00%110
89 38 20346 Pacific Ind Co 73,703 0.0906% 65,021 133,543 205.38%47
90 111 24198 Peerless Ins Co 2,199 0.0027% 3,225 -213 -6.60%105
91 155 24260 Progressive Cas Ins Co 1,285,981 1.5804% 1,036,896 1,311,286 126.46%12
92 783 13056 RLI Ins Co 5,662 0.0070% 1,297 0 0.00%86
93 553 24678 Royal Ind Co 4,933 0.0061% 4,944 2,777 56.17%90
94 553 26980 Royal Ins Co Of Amer 386,851 0.4754% 297,065 506,715 170.57%23
95 163 24740 Safeco Ins Co Of Amer 52,832 0.0649% 51,246 30,482 59.48%53
96 164 22535 Seaboard Surety Co 32 0.0000% 2,326 -7,813 -335.90%129
California Department of Insurance Page 2 of 3 Rate Specialist Bureau - 07/10/2001
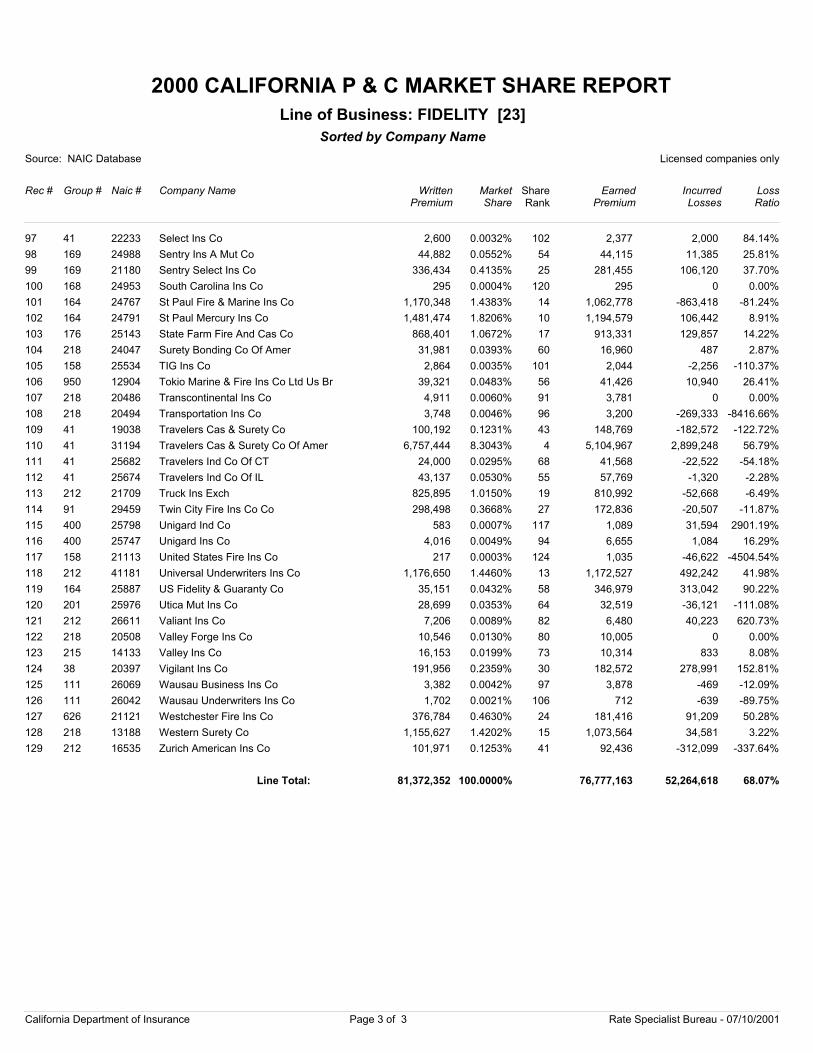
2000 CALIFORNIA P & C MARKET SHARE REPORT
Source: NAIC Database Licensed companies only
Rec # Group # Naic # Company Name
Sorted by Company Name
WrittenPremium
Market Share
EarnedPremium
IncurredLosses
LossRatio
Line of Business: FIDELITY [23]
ShareRank
97 41 22233 Select Ins Co 2,600 0.0032% 2,377 2,000 84.14%102
98 169 24988 Sentry Ins A Mut Co 44,882 0.0552% 44,115 11,385 25.81%54
99 169 21180 Sentry Select Ins Co 336,434 0.4135% 281,455 106,120 37.70%25
100 168 24953 South Carolina Ins Co 295 0.0004% 295 0 0.00%120
101 164 24767 St Paul Fire & Marine Ins Co 1,170,348 1.4383% 1,062,778 -863,418 -81.24%14
102 164 24791 St Paul Mercury Ins Co 1,481,474 1.8206% 1,194,579 106,442 8.91%10
103 176 25143 State Farm Fire And Cas Co 868,401 1.0672% 913,331 129,857 14.22%17
104 218 24047 Surety Bonding Co Of Amer 31,981 0.0393% 16,960 487 2.87%60
105 158 25534 TIG Ins Co 2,864 0.0035% 2,044 -2,256 -110.37%101
106 950 12904 Tokio Marine & Fire Ins Co Ltd Us Br 39,321 0.0483% 41,426 10,940 26.41%56
107 218 20486 Transcontinental Ins Co 4,911 0.0060% 3,781 0 0.00%91
108 218 20494 Transportation Ins Co 3,748 0.0046% 3,200 -269,333 -8416.66%96
109 41 19038 Travelers Cas & Surety Co 100,192 0.1231% 148,769 -182,572 -122.72%43
110 41 31194 Travelers Cas & Surety Co Of Amer 6,757,444 8.3043% 5,104,967 2,899,248 56.79%4
111 41 25682 Travelers Ind Co Of CT 24,000 0.0295% 41,568 -22,522 -54.18%68
112 41 25674 Travelers Ind Co Of IL 43,137 0.0530% 57,769 -1,320 -2.28%55
113 212 21709 Truck Ins Exch 825,895 1.0150% 810,992 -52,668 -6.49%19
114 91 29459 Twin City Fire Ins Co Co 298,498 0.3668% 172,836 -20,507 -11.87%27
115 400 25798 Unigard Ind Co 583 0.0007% 1,089 31,594 2901.19%117
116 400 25747 Unigard Ins Co 4,016 0.0049% 6,655 1,084 16.29%94
117 158 21113 United States Fire Ins Co 217 0.0003% 1,035 -46,622 -4504.54%124
118 212 41181 Universal Underwriters Ins Co 1,176,650 1.4460% 1,172,527 492,242 41.98%13
119 164 25887 US Fidelity & Guaranty Co 35,151 0.0432% 346,979 313,042 90.22%58
120 201 25976 Utica Mut Ins Co 28,699 0.0353% 32,519 -36,121 -111.08%64
121 212 26611 Valiant Ins Co 7,206 0.0089% 6,480 40,223 620.73%82
122 218 20508 Valley Forge Ins Co 10,546 0.0130% 10,005 0 0.00%80
123 215 14133 Valley Ins Co 16,153 0.0199% 10,314 833 8.08%73
124 38 20397 Vigilant Ins Co 191,956 0.2359% 182,572 278,991 152.81%30
125 111 26069 Wausau Business Ins Co 3,382 0.0042% 3,878 -469 -12.09%97
126 111 26042 Wausau Underwriters Ins Co 1,702 0.0021% 712 -639 -89.75%106
127 626 21121 Westchester Fire Ins Co 376,784 0.4630% 181,416 91,209 50.28%24
128 218 13188 Western Surety Co 1,155,627 1.4202% 1,073,564 34,581 3.22%15
129 212 16535 Zurich American Ins Co 101,971 0.1253% 92,436 -312,099 -337.64%41
81,372,352 100.0000% 76,777,163 52,264,618 68.07%Line Total:
California Department of Insurance Page 3 of 3 Rate Specialist Bureau - 07/10/2001
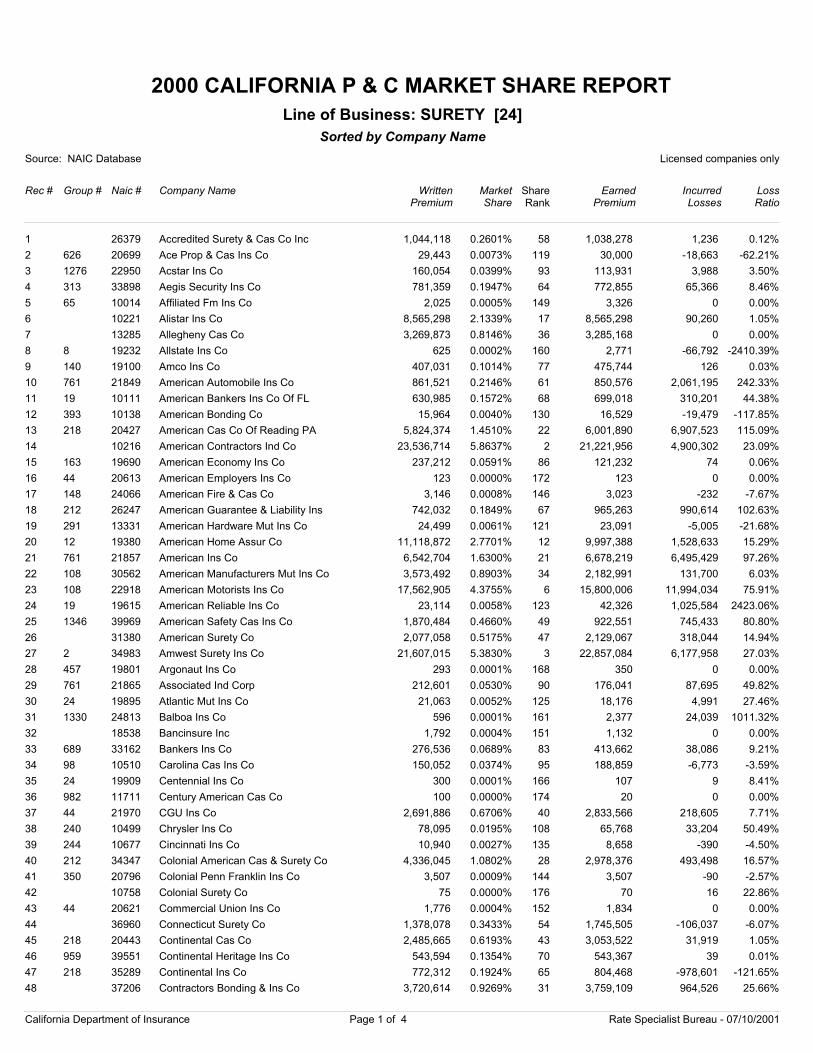
2000 CALIFORNIA P & C MARKET SHARE REPORT
Source: NAIC Database Licensed companies only
Rec # Group # Naic # Company Name
Sorted by Company Name
WrittenPremium
Market Share
EarnedPremium
IncurredLosses
LossRatio
Line of Business: SURETY [24]
ShareRank
1 26379 Accredited Surety & Cas Co Inc 1,044,118 0.2601% 1,038,278 1,236 0.12%58
2 626 20699 Ace Prop & Cas Ins Co 29,443 0.0073% 30,000 -18,663 -62.21%119
3 1276 22950 Acstar Ins Co 160,054 0.0399% 113,931 3,988 3.50%93
4 313 33898 Aegis Security Ins Co 781,359 0.1947% 772,855 65,366 8.46%64
5 65 10014 Affiliated Fm Ins Co 2,025 0.0005% 3,326 0 0.00%149
6 10221 Alistar Ins Co 8,565,298 2.1339% 8,565,298 90,260 1.05%17
7 13285 Allegheny Cas Co 3,269,873 0.8146% 3,285,168 0 0.00%36
8 8 19232 Allstate Ins Co 625 0.0002% 2,771 -66,792 -2410.39%160
9 140 19100 Amco Ins Co 407,031 0.1014% 475,744 126 0.03%77
10 761 21849 American Automobile Ins Co 861,521 0.2146% 850,576 2,061,195 242.33%61
11 19 10111 American Bankers Ins Co Of FL 630,985 0.1572% 699,018 310,201 44.38%68
12 393 10138 American Bonding Co 15,964 0.0040% 16,529 -19,479 -117.85%130
13 218 20427 American Cas Co Of Reading PA 5,824,374 1.4510% 6,001,890 6,907,523 115.09%22
14 10216 American Contractors Ind Co 23,536,714 5.8637% 21,221,956 4,900,302 23.09%2
15 163 19690 American Economy Ins Co 237,212 0.0591% 121,232 74 0.06%86
16 44 20613 American Employers Ins Co 123 0.0000% 123 0 0.00%172
17 148 24066 American Fire & Cas Co 3,146 0.0008% 3,023 -232 -7.67%146
18 212 26247 American Guarantee & Liability Ins 742,032 0.1849% 965,263 990,614 102.63%67
19 291 13331 American Hardware Mut Ins Co 24,499 0.0061% 23,091 -5,005 -21.68%121
20 12 19380 American Home Assur Co 11,118,872 2.7701% 9,997,388 1,528,633 15.29%12
21 761 21857 American Ins Co 6,542,704 1.6300% 6,678,219 6,495,429 97.26%21
22 108 30562 American Manufacturers Mut Ins Co 3,573,492 0.8903% 2,182,991 131,700 6.03%34
23 108 22918 American Motorists Ins Co 17,562,905 4.3755% 15,800,006 11,994,034 75.91%6
24 19 19615 American Reliable Ins Co 23,114 0.0058% 42,326 1,025,584 2423.06%123
25 1346 39969 American Safety Cas Ins Co 1,870,484 0.4660% 922,551 745,433 80.80%49
26 31380 American Surety Co 2,077,058 0.5175% 2,129,067 318,044 14.94%47
27 2 34983 Amwest Surety Ins Co 21,607,015 5.3830% 22,857,084 6,177,958 27.03%3
28 457 19801 Argonaut Ins Co 293 0.0001% 350 0 0.00%168
29 761 21865 Associated Ind Corp 212,601 0.0530% 176,041 87,695 49.82%90
30 24 19895 Atlantic Mut Ins Co 21,063 0.0052% 18,176 4,991 27.46%125
31 1330 24813 Balboa Ins Co 596 0.0001% 2,377 24,039 1011.32%161
32 18538 Bancinsure Inc 1,792 0.0004% 1,132 0 0.00%151
33 689 33162 Bankers Ins Co 276,536 0.0689% 413,662 38,086 9.21%83
34 98 10510 Carolina Cas Ins Co 150,052 0.0374% 188,859 -6,773 -3.59%95
35 24 19909 Centennial Ins Co 300 0.0001% 107 9 8.41%166
36 982 11711 Century American Cas Co 100 0.0000% 20 0 0.00%174
37 44 21970 CGU Ins Co 2,691,886 0.6706% 2,833,566 218,605 7.71%40
38 240 10499 Chrysler Ins Co 78,095 0.0195% 65,768 33,204 50.49%108
39 244 10677 Cincinnati Ins Co 10,940 0.0027% 8,658 -390 -4.50%135
40 212 34347 Colonial American Cas & Surety Co 4,336,045 1.0802% 2,978,376 493,498 16.57%28
41 350 20796 Colonial Penn Franklin Ins Co 3,507 0.0009% 3,507 -90 -2.57%144
42 10758 Colonial Surety Co 75 0.0000% 70 16 22.86%176
43 44 20621 Commercial Union Ins Co 1,776 0.0004% 1,834 0 0.00%152
44 36960 Connecticut Surety Co 1,378,078 0.3433% 1,745,505 -106,037 -6.07%54
45 218 20443 Continental Cas Co 2,485,665 0.6193% 3,053,522 31,919 1.05%43
46 959 39551 Continental Heritage Ins Co 543,594 0.1354% 543,367 39 0.01%70
47 218 35289 Continental Ins Co 772,312 0.1924% 804,468 -978,601 -121.65%65
48 37206 Contractors Bonding & Ins Co 3,720,614 0.9269% 3,759,109 964,526 25.66%31
California Department of Insurance Page 1 of 4 Rate Specialist Bureau - 07/10/2001
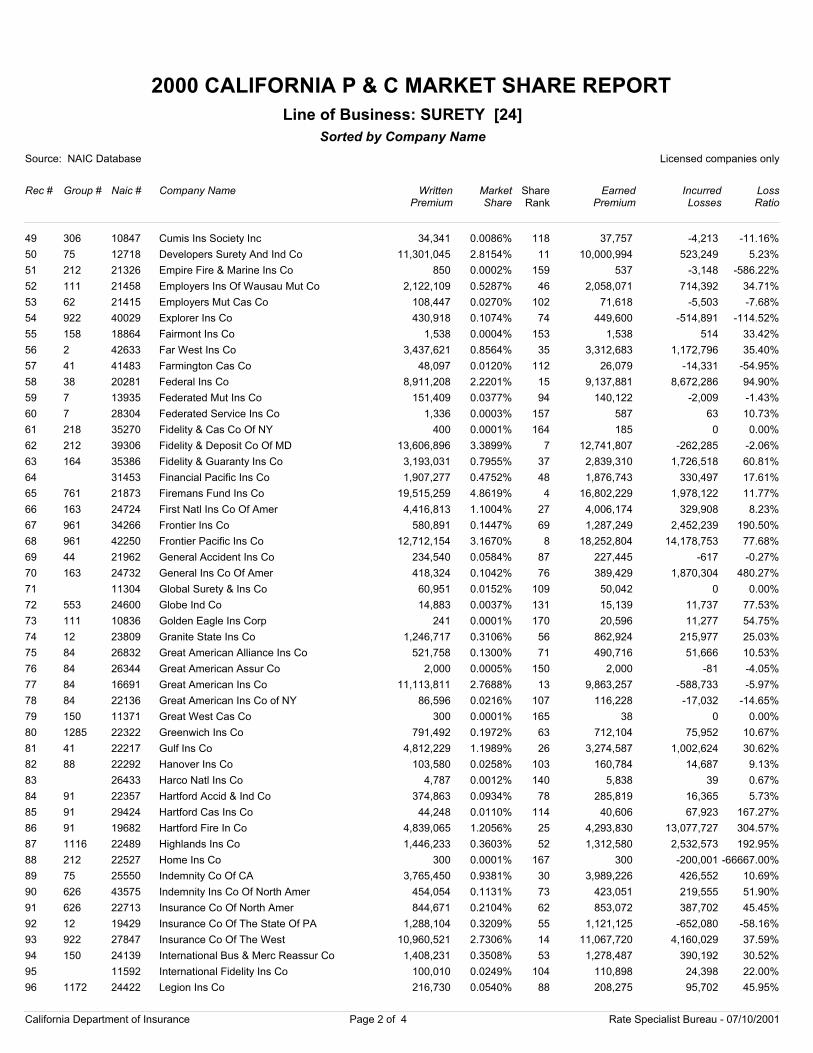
2000 CALIFORNIA P & C MARKET SHARE REPORT
Source: NAIC Database Licensed companies only
Rec # Group # Naic # Company Name
Sorted by Company Name
WrittenPremium
Market Share
EarnedPremium
IncurredLosses
LossRatio
Line of Business: SURETY [24]
ShareRank
49 306 10847 Cumis Ins Society Inc 34,341 0.0086% 37,757 -4,213 -11.16%118
50 75 12718 Developers Surety And Ind Co 11,301,045 2.8154% 10,000,994 523,249 5.23%11
51 212 21326 Empire Fire & Marine Ins Co 850 0.0002% 537 -3,148 -586.22%159
52 111 21458 Employers Ins Of Wausau Mut Co 2,122,109 0.5287% 2,058,071 714,392 34.71%46
53 62 21415 Employers Mut Cas Co 108,447 0.0270% 71,618 -5,503 -7.68%102
54 922 40029 Explorer Ins Co 430,918 0.1074% 449,600 -514,891 -114.52%74
55 158 18864 Fairmont Ins Co 1,538 0.0004% 1,538 514 33.42%153
56 2 42633 Far West Ins Co 3,437,621 0.8564% 3,312,683 1,172,796 35.40%35
57 41 41483 Farmington Cas Co 48,097 0.0120% 26,079 -14,331 -54.95%112
58 38 20281 Federal Ins Co 8,911,208 2.2201% 9,137,881 8,672,286 94.90%15
59 7 13935 Federated Mut Ins Co 151,409 0.0377% 140,122 -2,009 -1.43%94
60 7 28304 Federated Service Ins Co 1,336 0.0003% 587 63 10.73%157
61 218 35270 Fidelity & Cas Co Of NY 400 0.0001% 185 0 0.00%164
62 212 39306 Fidelity & Deposit Co Of MD 13,606,896 3.3899% 12,741,807 -262,285 -2.06%7
63 164 35386 Fidelity & Guaranty Ins Co 3,193,031 0.7955% 2,839,310 1,726,518 60.81%37
64 31453 Financial Pacific Ins Co 1,907,277 0.4752% 1,876,743 330,497 17.61%48
65 761 21873 Firemans Fund Ins Co 19,515,259 4.8619% 16,802,229 1,978,122 11.77%4
66 163 24724 First Natl Ins Co Of Amer 4,416,813 1.1004% 4,006,174 329,908 8.23%27
67 961 34266 Frontier Ins Co 580,891 0.1447% 1,287,249 2,452,239 190.50%69
68 961 42250 Frontier Pacific Ins Co 12,712,154 3.1670% 18,252,804 14,178,753 77.68%8
69 44 21962 General Accident Ins Co 234,540 0.0584% 227,445 -617 -0.27%87
70 163 24732 General Ins Co Of Amer 418,324 0.1042% 389,429 1,870,304 480.27%76
71 11304 Global Surety & Ins Co 60,951 0.0152% 50,042 0 0.00%109
72 553 24600 Globe Ind Co 14,883 0.0037% 15,139 11,737 77.53%131
73 111 10836 Golden Eagle Ins Corp 241 0.0001% 20,596 11,277 54.75%170
74 12 23809 Granite State Ins Co 1,246,717 0.3106% 862,924 215,977 25.03%56
75 84 26832 Great American Alliance Ins Co 521,758 0.1300% 490,716 51,666 10.53%71
76 84 26344 Great American Assur Co 2,000 0.0005% 2,000 -81 -4.05%150
77 84 16691 Great American Ins Co 11,113,811 2.7688% 9,863,257 -588,733 -5.97%13
78 84 22136 Great American Ins Co of NY 86,596 0.0216% 116,228 -17,032 -14.65%107
79 150 11371 Great West Cas Co 300 0.0001% 38 0 0.00%165
80 1285 22322 Greenwich Ins Co 791,492 0.1972% 712,104 75,952 10.67%63
81 41 22217 Gulf Ins Co 4,812,229 1.1989% 3,274,587 1,002,624 30.62%26
82 88 22292 Hanover Ins Co 103,580 0.0258% 160,784 14,687 9.13%103
83 26433 Harco Natl Ins Co 4,787 0.0012% 5,838 39 0.67%140
84 91 22357 Hartford Accid & Ind Co 374,863 0.0934% 285,819 16,365 5.73%78
85 91 29424 Hartford Cas Ins Co 44,248 0.0110% 40,606 67,923 167.27%114
86 91 19682 Hartford Fire In Co 4,839,065 1.2056% 4,293,830 13,077,727 304.57%25
87 1116 22489 Highlands Ins Co 1,446,233 0.3603% 1,312,580 2,532,573 192.95%52
88 212 22527 Home Ins Co 300 0.0001% 300 -200,001 -66667.00%167
89 75 25550 Indemnity Co Of CA 3,765,450 0.9381% 3,989,226 426,552 10.69%30
90 626 43575 Indemnity Ins Co Of North Amer 454,054 0.1131% 423,051 219,555 51.90%73
91 626 22713 Insurance Co Of North Amer 844,671 0.2104% 853,072 387,702 45.45%62
92 12 19429 Insurance Co Of The State Of PA 1,288,104 0.3209% 1,121,125 -652,080 -58.16%55
93 922 27847 Insurance Co Of The West 10,960,521 2.7306% 11,067,720 4,160,029 37.59%14
94 150 24139 International Bus & Merc Reassur Co 1,408,231 0.3508% 1,278,487 390,192 30.52%53
95 11592 International Fidelity Ins Co 100,010 0.0249% 110,898 24,398 22.00%104
96 1172 24422 Legion Ins Co 216,730 0.0540% 208,275 95,702 45.95%88
California Department of Insurance Page 2 of 4 Rate Specialist Bureau - 07/10/2001
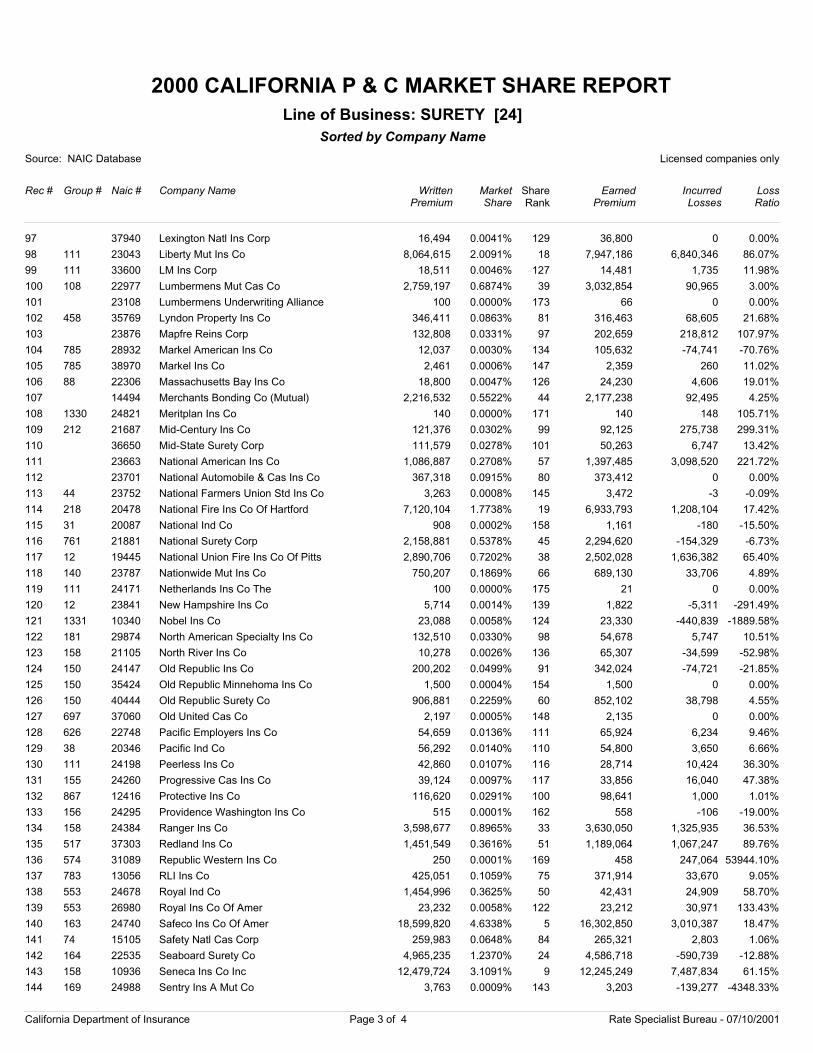
2000 CALIFORNIA P & C MARKET SHARE REPORT
Source: NAIC Database Licensed companies only
Rec # Group # Naic # Company Name
Sorted by Company Name
WrittenPremium
Market Share
EarnedPremium
IncurredLosses
LossRatio
Line of Business: SURETY [24]
ShareRank
97 37940 Lexington Natl Ins Corp 16,494 0.0041% 36,800 0 0.00%129
98 111 23043 Liberty Mut Ins Co 8,064,615 2.0091% 7,947,186 6,840,346 86.07%18
99 111 33600 LM Ins Corp 18,511 0.0046% 14,481 1,735 11.98%127
100 108 22977 Lumbermens Mut Cas Co 2,759,197 0.6874% 3,032,854 90,965 3.00%39
101 23108 Lumbermens Underwriting Alliance 100 0.0000% 66 0 0.00%173
102 458 35769 Lyndon Property Ins Co 346,411 0.0863% 316,463 68,605 21.68%81
103 23876 Mapfre Reins Corp 132,808 0.0331% 202,659 218,812 107.97%97
104 785 28932 Markel American Ins Co 12,037 0.0030% 105,632 -74,741 -70.76%134
105 785 38970 Markel Ins Co 2,461 0.0006% 2,359 260 11.02%147
106 88 22306 Massachusetts Bay Ins Co 18,800 0.0047% 24,230 4,606 19.01%126
107 14494 Merchants Bonding Co (Mutual) 2,216,532 0.5522% 2,177,238 92,495 4.25%44
108 1330 24821 Meritplan Ins Co 140 0.0000% 140 148 105.71%171
109 212 21687 Mid-Century Ins Co 121,376 0.0302% 92,125 275,738 299.31%99
110 36650 Mid-State Surety Corp 111,579 0.0278% 50,263 6,747 13.42%101
111 23663 National American Ins Co 1,086,887 0.2708% 1,397,485 3,098,520 221.72%57
112 23701 National Automobile & Cas Ins Co 367,318 0.0915% 373,412 0 0.00%80
113 44 23752 National Farmers Union Std Ins Co 3,263 0.0008% 3,472 -3 -0.09%145
114 218 20478 National Fire Ins Co Of Hartford 7,120,104 1.7738% 6,933,793 1,208,104 17.42%19
115 31 20087 National Ind Co 908 0.0002% 1,161 -180 -15.50%158
116 761 21881 National Surety Corp 2,158,881 0.5378% 2,294,620 -154,329 -6.73%45
117 12 19445 National Union Fire Ins Co Of Pitts 2,890,706 0.7202% 2,502,028 1,636,382 65.40%38
118 140 23787 Nationwide Mut Ins Co 750,207 0.1869% 689,130 33,706 4.89%66
119 111 24171 Netherlands Ins Co The 100 0.0000% 21 0 0.00%175
120 12 23841 New Hampshire Ins Co 5,714 0.0014% 1,822 -5,311 -291.49%139
121 1331 10340 Nobel Ins Co 23,088 0.0058% 23,330 -440,839 -1889.58%124
122 181 29874 North American Specialty Ins Co 132,510 0.0330% 54,678 5,747 10.51%98
123 158 21105 North River Ins Co 10,278 0.0026% 65,307 -34,599 -52.98%136
124 150 24147 Old Republic Ins Co 200,202 0.0499% 342,024 -74,721 -21.85%91
125 150 35424 Old Republic Minnehoma Ins Co 1,500 0.0004% 1,500 0 0.00%154
126 150 40444 Old Republic Surety Co 906,881 0.2259% 852,102 38,798 4.55%60
127 697 37060 Old United Cas Co 2,197 0.0005% 2,135 0 0.00%148
128 626 22748 Pacific Employers Ins Co 54,659 0.0136% 65,924 6,234 9.46%111
129 38 20346 Pacific Ind Co 56,292 0.0140% 54,800 3,650 6.66%110
130 111 24198 Peerless Ins Co 42,860 0.0107% 28,714 10,424 36.30%116
131 155 24260 Progressive Cas Ins Co 39,124 0.0097% 33,856 16,040 47.38%117
132 867 12416 Protective Ins Co 116,620 0.0291% 98,641 1,000 1.01%100
133 156 24295 Providence Washington Ins Co 515 0.0001% 558 -106 -19.00%162
134 158 24384 Ranger Ins Co 3,598,677 0.8965% 3,630,050 1,325,935 36.53%33
135 517 37303 Redland Ins Co 1,451,549 0.3616% 1,189,064 1,067,247 89.76%51
136 574 31089 Republic Western Ins Co 250 0.0001% 458 247,064 53944.10%169
137 783 13056 RLI Ins Co 425,051 0.1059% 371,914 33,670 9.05%75
138 553 24678 Royal Ind Co 1,454,996 0.3625% 42,431 24,909 58.70%50
139 553 26980 Royal Ins Co Of Amer 23,232 0.0058% 23,212 30,971 133.43%122
140 163 24740 Safeco Ins Co Of Amer 18,599,820 4.6338% 16,302,850 3,010,387 18.47%5
141 74 15105 Safety Natl Cas Corp 259,983 0.0648% 265,321 2,803 1.06%84
142 164 22535 Seaboard Surety Co 4,965,235 1.2370% 4,586,718 -590,739 -12.88%24
143 158 10936 Seneca Ins Co Inc 12,479,724 3.1091% 12,245,249 7,487,834 61.15%9
144 169 24988 Sentry Ins A Mut Co 3,763 0.0009% 3,203 -139,277 -4348.33%143
California Department of Insurance Page 3 of 4 Rate Specialist Bureau - 07/10/2001
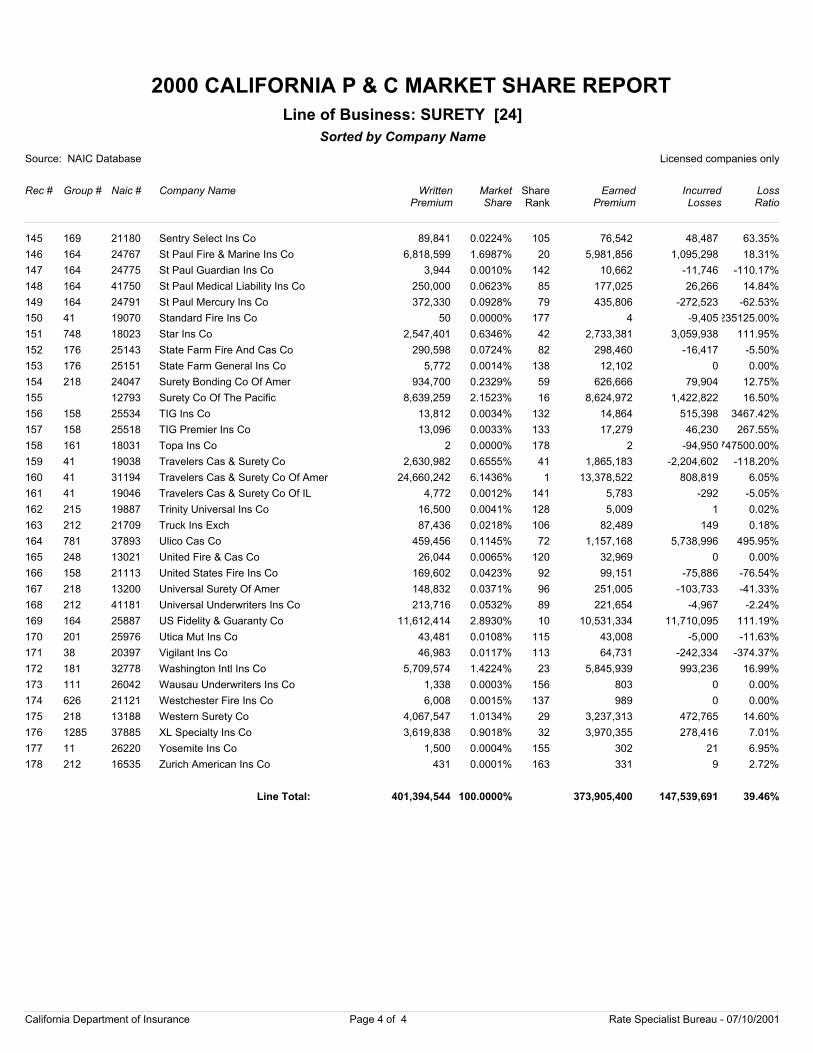
2000 CALIFORNIA P & C MARKET SHARE REPORT
Source: NAIC Database Licensed companies only
Rec # Group # Naic # Company Name
Sorted by Company Name
WrittenPremium
Market Share
EarnedPremium
IncurredLosses
LossRatio
Line of Business: SURETY [24]
ShareRank
145 169 21180 Sentry Select Ins Co 89,841 0.0224% 76,542 48,487 63.35%105
146 164 24767 St Paul Fire & Marine Ins Co 6,818,599 1.6987% 5,981,856 1,095,298 18.31%20
147 164 24775 St Paul Guardian Ins Co 3,944 0.0010% 10,662 -11,746 -110.17%142
148 164 41750 St Paul Medical Liability Ins Co 250,000 0.0623% 177,025 26,266 14.84%85
149 164 24791 St Paul Mercury Ins Co 372,330 0.0928% 435,806 -272,523 -62.53%79
150 41 19070 Standard Fire Ins Co 50 0.0000% 4 -9,405235125.00%177
151 748 18023 Star Ins Co 2,547,401 0.6346% 2,733,381 3,059,938 111.95%42
152 176 25143 State Farm Fire And Cas Co 290,598 0.0724% 298,460 -16,417 -5.50%82
153 176 25151 State Farm General Ins Co 5,772 0.0014% 12,102 0 0.00%138
154 218 24047 Surety Bonding Co Of Amer 934,700 0.2329% 626,666 79,904 12.75%59
155 12793 Surety Co Of The Pacific 8,639,259 2.1523% 8,624,972 1,422,822 16.50%16
156 158 25534 TIG Ins Co 13,812 0.0034% 14,864 515,398 3467.42%132
157 158 25518 TIG Premier Ins Co 13,096 0.0033% 17,279 46,230 267.55%133
158 161 18031 Topa Ins Co 2 0.0000% 2 -94,950747500.00%178
159 41 19038 Travelers Cas & Surety Co 2,630,982 0.6555% 1,865,183 -2,204,602 -118.20%41
160 41 31194 Travelers Cas & Surety Co Of Amer 24,660,242 6.1436% 13,378,522 808,819 6.05%1
161 41 19046 Travelers Cas & Surety Co Of IL 4,772 0.0012% 5,783 -292 -5.05%141
162 215 19887 Trinity Universal Ins Co 16,500 0.0041% 5,009 1 0.02%128
163 212 21709 Truck Ins Exch 87,436 0.0218% 82,489 149 0.18%106
164 781 37893 Ulico Cas Co 459,456 0.1145% 1,157,168 5,738,996 495.95%72
165 248 13021 United Fire & Cas Co 26,044 0.0065% 32,969 0 0.00%120
166 158 21113 United States Fire Ins Co 169,602 0.0423% 99,151 -75,886 -76.54%92
167 218 13200 Universal Surety Of Amer 148,832 0.0371% 251,005 -103,733 -41.33%96
168 212 41181 Universal Underwriters Ins Co 213,716 0.0532% 221,654 -4,967 -2.24%89
169 164 25887 US Fidelity & Guaranty Co 11,612,414 2.8930% 10,531,334 11,710,095 111.19%10
170 201 25976 Utica Mut Ins Co 43,481 0.0108% 43,008 -5,000 -11.63%115
171 38 20397 Vigilant Ins Co 46,983 0.0117% 64,731 -242,334 -374.37%113
172 181 32778 Washington Intl Ins Co 5,709,574 1.4224% 5,845,939 993,236 16.99%23
173 111 26042 Wausau Underwriters Ins Co 1,338 0.0003% 803 0 0.00%156
174 626 21121 Westchester Fire Ins Co 6,008 0.0015% 989 0 0.00%137
175 218 13188 Western Surety Co 4,067,547 1.0134% 3,237,313 472,765 14.60%29
176 1285 37885 XL Specialty Ins Co 3,619,838 0.9018% 3,970,355 278,416 7.01%32
177 11 26220 Yosemite Ins Co 1,500 0.0004% 302 21 6.95%155
178 212 16535 Zurich American Ins Co 431 0.0001% 331 9 2.72%163
401,394,544 100.0000% 373,905,400 147,539,691 39.46%Line Total:
California Department of Insurance Page 4 of 4 Rate Specialist Bureau - 07/10/2001
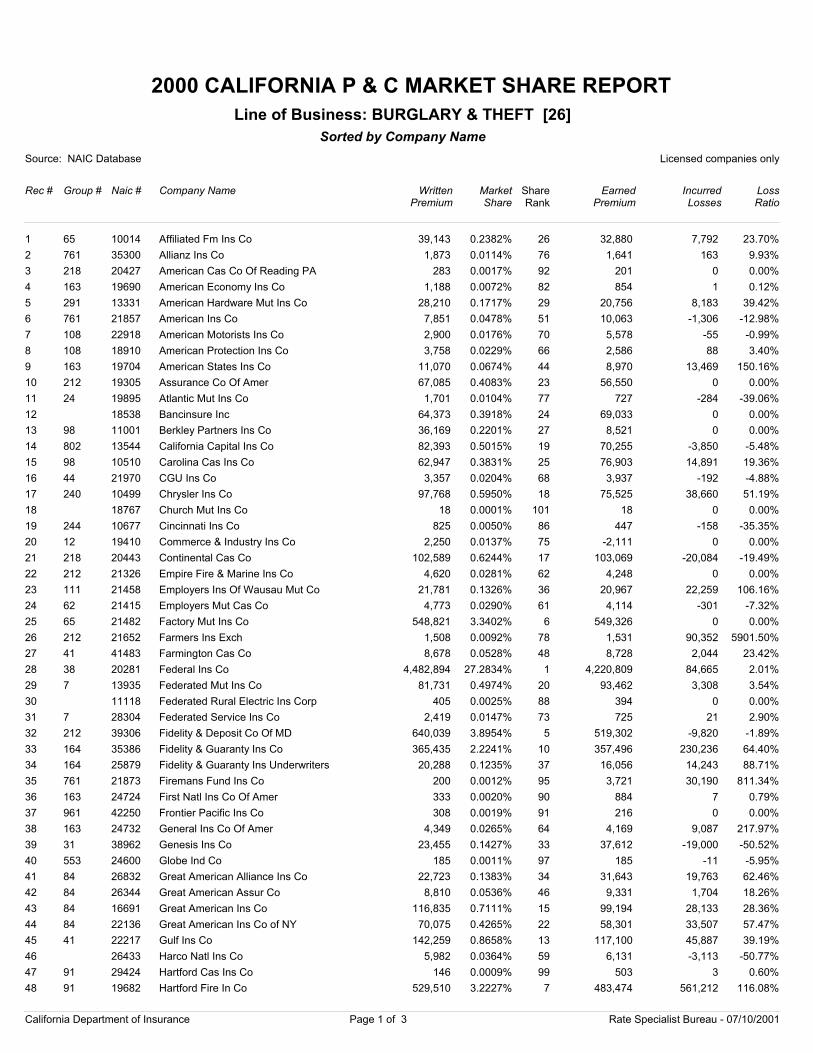
2000 CALIFORNIA P & C MARKET SHARE REPORT
Source: NAIC Database Licensed companies only
Rec # Group # Naic # Company Name
Sorted by Company Name
WrittenPremium
Market Share
EarnedPremium
IncurredLosses
LossRatio
Line of Business: BURGLARY & THEFT [26]
ShareRank
1 65 10014 Affiliated Fm Ins Co 39,143 0.2382% 32,880 7,792 23.70%26
2 761 35300 Allianz Ins Co 1,873 0.0114% 1,641 163 9.93%76
3 218 20427 American Cas Co Of Reading PA 283 0.0017% 201 0 0.00%92
4 163 19690 American Economy Ins Co 1,188 0.0072% 854 1 0.12%82
5 291 13331 American Hardware Mut Ins Co 28,210 0.1717% 20,756 8,183 39.42%29
6 761 21857 American Ins Co 7,851 0.0478% 10,063 -1,306 -12.98%51
7 108 22918 American Motorists Ins Co 2,900 0.0176% 5,578 -55 -0.99%70
8 108 18910 American Protection Ins Co 3,758 0.0229% 2,586 88 3.40%66
9 163 19704 American States Ins Co 11,070 0.0674% 8,970 13,469 150.16%44
10 212 19305 Assurance Co Of Amer 67,085 0.4083% 56,550 0 0.00%23
11 24 19895 Atlantic Mut Ins Co 1,701 0.0104% 727 -284 -39.06%77
12 18538 Bancinsure Inc 64,373 0.3918% 69,033 0 0.00%24
13 98 11001 Berkley Partners Ins Co 36,169 0.2201% 8,521 0 0.00%27
14 802 13544 California Capital Ins Co 82,393 0.5015% 70,255 -3,850 -5.48%19
15 98 10510 Carolina Cas Ins Co 62,947 0.3831% 76,903 14,891 19.36%25
16 44 21970 CGU Ins Co 3,357 0.0204% 3,937 -192 -4.88%68
17 240 10499 Chrysler Ins Co 97,768 0.5950% 75,525 38,660 51.19%18
18 18767 Church Mut Ins Co 18 0.0001% 18 0 0.00%101
19 244 10677 Cincinnati Ins Co 825 0.0050% 447 -158 -35.35%86
20 12 19410 Commerce & Industry Ins Co 2,250 0.0137% -2,111 0 0.00%75
21 218 20443 Continental Cas Co 102,589 0.6244% 103,069 -20,084 -19.49%17
22 212 21326 Empire Fire & Marine Ins Co 4,620 0.0281% 4,248 0 0.00%62
23 111 21458 Employers Ins Of Wausau Mut Co 21,781 0.1326% 20,967 22,259 106.16%36
24 62 21415 Employers Mut Cas Co 4,773 0.0290% 4,114 -301 -7.32%61
25 65 21482 Factory Mut Ins Co 548,821 3.3402% 549,326 0 0.00%6
26 212 21652 Farmers Ins Exch 1,508 0.0092% 1,531 90,352 5901.50%78
27 41 41483 Farmington Cas Co 8,678 0.0528% 8,728 2,044 23.42%48
28 38 20281 Federal Ins Co 4,482,894 27.2834% 4,220,809 84,665 2.01%1
29 7 13935 Federated Mut Ins Co 81,731 0.4974% 93,462 3,308 3.54%20
30 11118 Federated Rural Electric Ins Corp 405 0.0025% 394 0 0.00%88
31 7 28304 Federated Service Ins Co 2,419 0.0147% 725 21 2.90%73
32 212 39306 Fidelity & Deposit Co Of MD 640,039 3.8954% 519,302 -9,820 -1.89%5
33 164 35386 Fidelity & Guaranty Ins Co 365,435 2.2241% 357,496 230,236 64.40%10
34 164 25879 Fidelity & Guaranty Ins Underwriters 20,288 0.1235% 16,056 14,243 88.71%37
35 761 21873 Firemans Fund Ins Co 200 0.0012% 3,721 30,190 811.34%95
36 163 24724 First Natl Ins Co Of Amer 333 0.0020% 884 7 0.79%90
37 961 42250 Frontier Pacific Ins Co 308 0.0019% 216 0 0.00%91
38 163 24732 General Ins Co Of Amer 4,349 0.0265% 4,169 9,087 217.97%64
39 31 38962 Genesis Ins Co 23,455 0.1427% 37,612 -19,000 -50.52%33
40 553 24600 Globe Ind Co 185 0.0011% 185 -11 -5.95%97
41 84 26832 Great American Alliance Ins Co 22,723 0.1383% 31,643 19,763 62.46%34
42 84 26344 Great American Assur Co 8,810 0.0536% 9,331 1,704 18.26%46
43 84 16691 Great American Ins Co 116,835 0.7111% 99,194 28,133 28.36%15
44 84 22136 Great American Ins Co of NY 70,075 0.4265% 58,301 33,507 57.47%22
45 41 22217 Gulf Ins Co 142,259 0.8658% 117,100 45,887 39.19%13
46 26433 Harco Natl Ins Co 5,982 0.0364% 6,131 -3,113 -50.77%59
47 91 29424 Hartford Cas Ins Co 146 0.0009% 503 3 0.60%99
48 91 19682 Hartford Fire In Co 529,510 3.2227% 483,474 561,212 116.08%7
California Department of Insurance Page 1 of 3 Rate Specialist Bureau - 07/10/2001
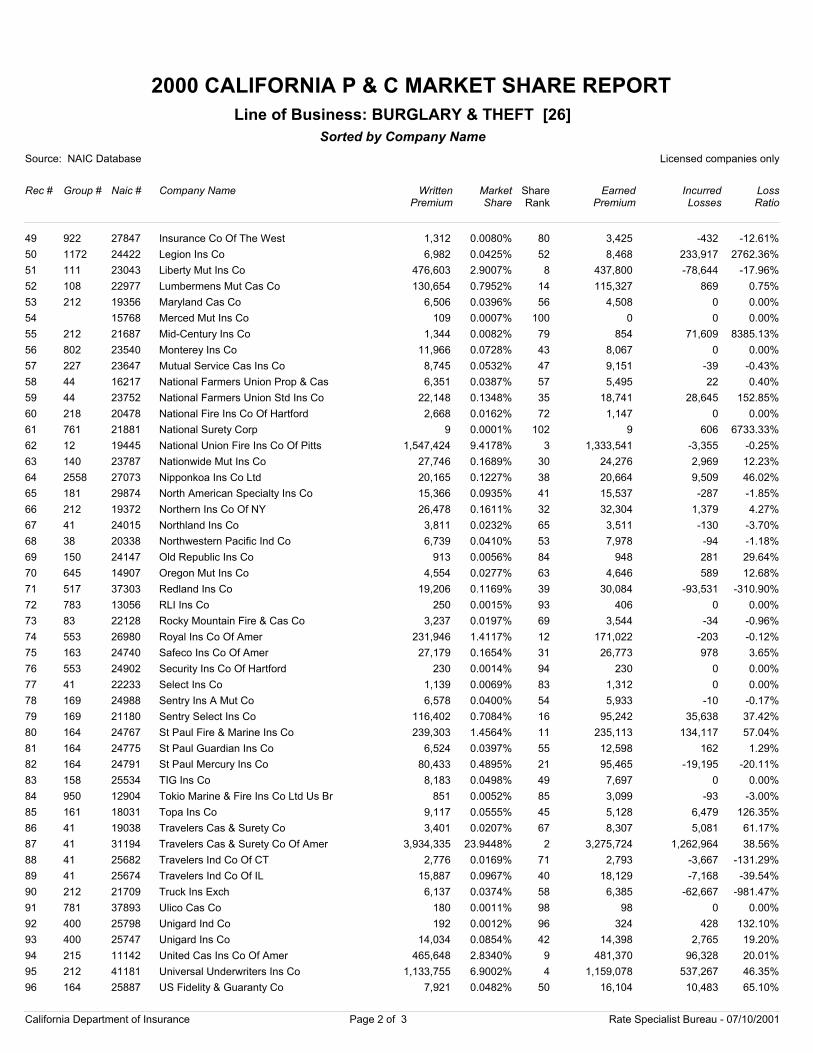
2000 CALIFORNIA P & C MARKET SHARE REPORT
Source: NAIC Database Licensed companies only
Rec # Group # Naic # Company Name
Sorted by Company Name
WrittenPremium
Market Share
EarnedPremium
IncurredLosses
LossRatio
Line of Business: BURGLARY & THEFT [26]
ShareRank
49 922 27847 Insurance Co Of The West 1,312 0.0080% 3,425 -432 -12.61%80
50 1172 24422 Legion Ins Co 6,982 0.0425% 8,468 233,917 2762.36%52
51 111 23043 Liberty Mut Ins Co 476,603 2.9007% 437,800 -78,644 -17.96%8
52 108 22977 Lumbermens Mut Cas Co 130,654 0.7952% 115,327 869 0.75%14
53 212 19356 Maryland Cas Co 6,506 0.0396% 4,508 0 0.00%56
54 15768 Merced Mut Ins Co 109 0.0007% 0 0 0.00%100
55 212 21687 Mid-Century Ins Co 1,344 0.0082% 854 71,609 8385.13%79
56 802 23540 Monterey Ins Co 11,966 0.0728% 8,067 0 0.00%43
57 227 23647 Mutual Service Cas Ins Co 8,745 0.0532% 9,151 -39 -0.43%47
58 44 16217 National Farmers Union Prop & Cas 6,351 0.0387% 5,495 22 0.40%57
59 44 23752 National Farmers Union Std Ins Co 22,148 0.1348% 18,741 28,645 152.85%35
60 218 20478 National Fire Ins Co Of Hartford 2,668 0.0162% 1,147 0 0.00%72
61 761 21881 National Surety Corp 9 0.0001% 9 606 6733.33%102
62 12 19445 National Union Fire Ins Co Of Pitts 1,547,424 9.4178% 1,333,541 -3,355 -0.25%3
63 140 23787 Nationwide Mut Ins Co 27,746 0.1689% 24,276 2,969 12.23%30
64 2558 27073 Nipponkoa Ins Co Ltd 20,165 0.1227% 20,664 9,509 46.02%38
65 181 29874 North American Specialty Ins Co 15,366 0.0935% 15,537 -287 -1.85%41
66 212 19372 Northern Ins Co Of NY 26,478 0.1611% 32,304 1,379 4.27%32
67 41 24015 Northland Ins Co 3,811 0.0232% 3,511 -130 -3.70%65
68 38 20338 Northwestern Pacific Ind Co 6,739 0.0410% 7,978 -94 -1.18%53
69 150 24147 Old Republic Ins Co 913 0.0056% 948 281 29.64%84
70 645 14907 Oregon Mut Ins Co 4,554 0.0277% 4,646 589 12.68%63
71 517 37303 Redland Ins Co 19,206 0.1169% 30,084 -93,531 -310.90%39
72 783 13056 RLI Ins Co 250 0.0015% 406 0 0.00%93
73 83 22128 Rocky Mountain Fire & Cas Co 3,237 0.0197% 3,544 -34 -0.96%69
74 553 26980 Royal Ins Co Of Amer 231,946 1.4117% 171,022 -203 -0.12%12
75 163 24740 Safeco Ins Co Of Amer 27,179 0.1654% 26,773 978 3.65%31
76 553 24902 Security Ins Co Of Hartford 230 0.0014% 230 0 0.00%94
77 41 22233 Select Ins Co 1,139 0.0069% 1,312 0 0.00%83
78 169 24988 Sentry Ins A Mut Co 6,578 0.0400% 5,933 -10 -0.17%54
79 169 21180 Sentry Select Ins Co 116,402 0.7084% 95,242 35,638 37.42%16
80 164 24767 St Paul Fire & Marine Ins Co 239,303 1.4564% 235,113 134,117 57.04%11
81 164 24775 St Paul Guardian Ins Co 6,524 0.0397% 12,598 162 1.29%55
82 164 24791 St Paul Mercury Ins Co 80,433 0.4895% 95,465 -19,195 -20.11%21
83 158 25534 TIG Ins Co 8,183 0.0498% 7,697 0 0.00%49
84 950 12904 Tokio Marine & Fire Ins Co Ltd Us Br 851 0.0052% 3,099 -93 -3.00%85
85 161 18031 Topa Ins Co 9,117 0.0555% 5,128 6,479 126.35%45
86 41 19038 Travelers Cas & Surety Co 3,401 0.0207% 8,307 5,081 61.17%67
87 41 31194 Travelers Cas & Surety Co Of Amer 3,934,335 23.9448% 3,275,724 1,262,964 38.56%2
88 41 25682 Travelers Ind Co Of CT 2,776 0.0169% 2,793 -3,667 -131.29%71
89 41 25674 Travelers Ind Co Of IL 15,887 0.0967% 18,129 -7,168 -39.54%40
90 212 21709 Truck Ins Exch 6,137 0.0374% 6,385 -62,667 -981.47%58
91 781 37893 Ulico Cas Co 180 0.0011% 98 0 0.00%98
92 400 25798 Unigard Ind Co 192 0.0012% 324 428 132.10%96
93 400 25747 Unigard Ins Co 14,034 0.0854% 14,398 2,765 19.20%42
94 215 11142 United Cas Ins Co Of Amer 465,648 2.8340% 481,370 96,328 20.01%9
95 212 41181 Universal Underwriters Ins Co 1,133,755 6.9002% 1,159,078 537,267 46.35%4
96 164 25887 US Fidelity & Guaranty Co 7,921 0.0482% 16,104 10,483 65.10%50
California Department of Insurance Page 2 of 3 Rate Specialist Bureau - 07/10/2001
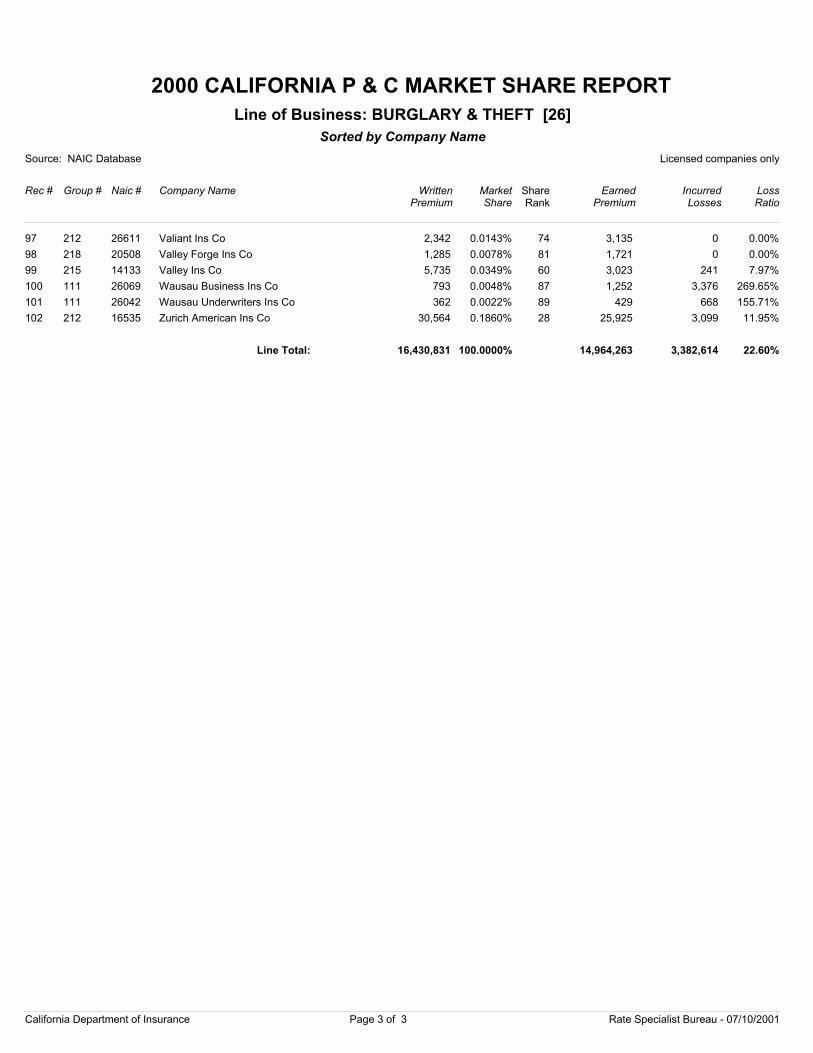
2000 CALIFORNIA P & C MARKET SHARE REPORT
Source: NAIC Database Licensed companies only
Rec # Group # Naic # Company Name
Sorted by Company Name
WrittenPremium
Market Share
EarnedPremium
IncurredLosses
LossRatio
Line of Business: BURGLARY & THEFT [26]
ShareRank
97 212 26611 Valiant Ins Co 2,342 0.0143% 3,135 0 0.00%74
98 218 20508 Valley Forge Ins Co 1,285 0.0078% 1,721 0 0.00%81
99 215 14133 Valley Ins Co 5,735 0.0349% 3,023 241 7.97%60
100 111 26069 Wausau Business Ins Co 793 0.0048% 1,252 3,376 269.65%87
101 111 26042 Wausau Underwriters Ins Co 362 0.0022% 429 668 155.71%89
102 212 16535 Zurich American Ins Co 30,564 0.1860% 25,925 3,099 11.95%28
16,430,831 100.0000% 14,964,263 3,382,614 22.60%Line Total:
California Department of Insurance Page 3 of 3 Rate Specialist Bureau - 07/10/2001
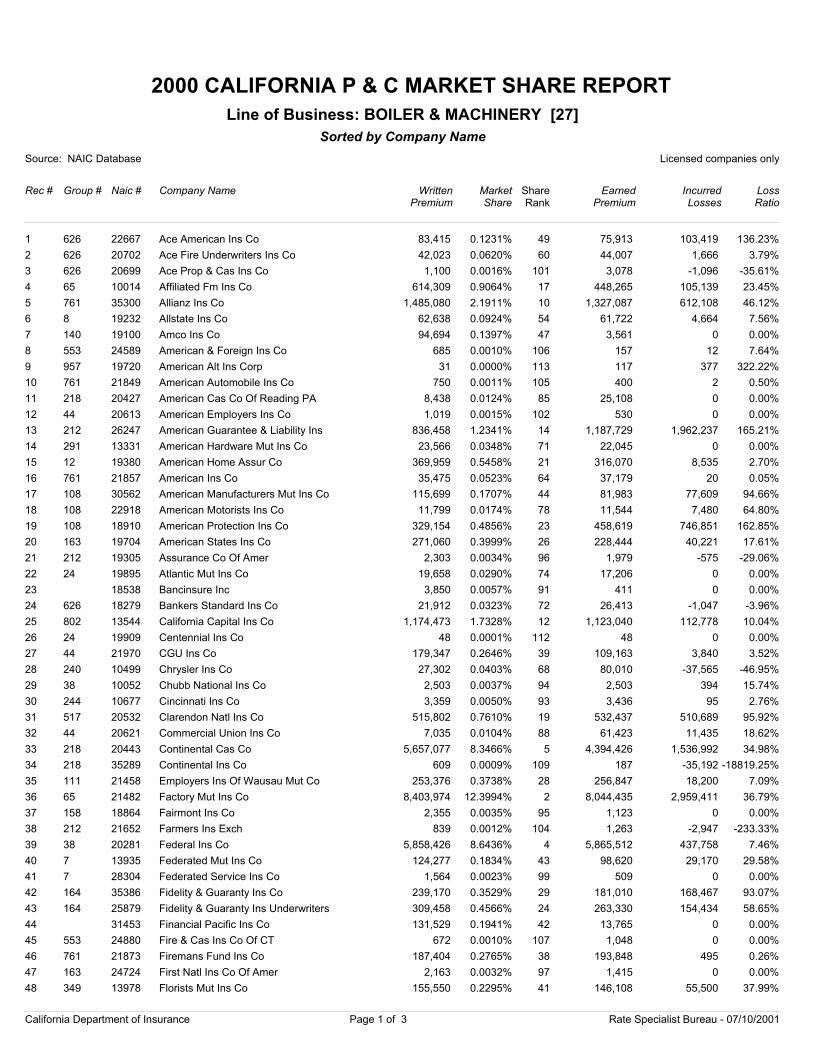
2000 CALIFORNIA P & C MARKET SHARE REPORT
Source: NAIC Database Licensed companies only
Rec # Group # Naic # Company Name
Sorted by Company Name
WrittenPremium
Market Share
EarnedPremium
IncurredLosses
LossRatio
Line of Business: BOILER & MACHINERY [27]
ShareRank
1 626 22667 Ace American Ins Co 83,415 0.1231% 75,913 103,419 136.23%49
2 626 20702 Ace Fire Underwriters Ins Co 42,023 0.0620% 44,007 1,666 3.79%60
3 626 20699 Ace Prop & Cas Ins Co 1,100 0.0016% 3,078 -1,096 -35.61%101
4 65 10014 Affiliated Fm Ins Co 614,309 0.9064% 448,265 105,139 23.45%17
5 761 35300 Allianz Ins Co 1,485,080 2.1911% 1,327,087 612,108 46.12%10
6 8 19232 Allstate Ins Co 62,638 0.0924% 61,722 4,664 7.56%54
7 140 19100 Amco Ins Co 94,694 0.1397% 3,561 0 0.00%47
8 553 24589 American & Foreign Ins Co 685 0.0010% 157 12 7.64%106
9 957 19720 American Alt Ins Corp 31 0.0000% 117 377 322.22%113
10 761 21849 American Automobile Ins Co 750 0.0011% 400 2 0.50%105
11 218 20427 American Cas Co Of Reading PA 8,438 0.0124% 25,108 0 0.00%85
12 44 20613 American Employers Ins Co 1,019 0.0015% 530 0 0.00%102
13 212 26247 American Guarantee & Liability Ins 836,458 1.2341% 1,187,729 1,962,237 165.21%14
14 291 13331 American Hardware Mut Ins Co 23,566 0.0348% 22,045 0 0.00%71
15 12 19380 American Home Assur Co 369,959 0.5458% 316,070 8,535 2.70%21
16 761 21857 American Ins Co 35,475 0.0523% 37,179 20 0.05%64
17 108 30562 American Manufacturers Mut Ins Co 115,699 0.1707% 81,983 77,609 94.66%44
18 108 22918 American Motorists Ins Co 11,799 0.0174% 11,544 7,480 64.80%78
19 108 18910 American Protection Ins Co 329,154 0.4856% 458,619 746,851 162.85%23
20 163 19704 American States Ins Co 271,060 0.3999% 228,444 40,221 17.61%26
21 212 19305 Assurance Co Of Amer 2,303 0.0034% 1,979 -575 -29.06%96
22 24 19895 Atlantic Mut Ins Co 19,658 0.0290% 17,206 0 0.00%74
23 18538 Bancinsure Inc 3,850 0.0057% 411 0 0.00%91
24 626 18279 Bankers Standard Ins Co 21,912 0.0323% 26,413 -1,047 -3.96%72
25 802 13544 California Capital Ins Co 1,174,473 1.7328% 1,123,040 112,778 10.04%12
26 24 19909 Centennial Ins Co 48 0.0001% 48 0 0.00%112
27 44 21970 CGU Ins Co 179,347 0.2646% 109,163 3,840 3.52%39
28 240 10499 Chrysler Ins Co 27,302 0.0403% 80,010 -37,565 -46.95%68
29 38 10052 Chubb National Ins Co 2,503 0.0037% 2,503 394 15.74%94
30 244 10677 Cincinnati Ins Co 3,359 0.0050% 3,436 95 2.76%93
31 517 20532 Clarendon Natl Ins Co 515,802 0.7610% 532,437 510,689 95.92%19
32 44 20621 Commercial Union Ins Co 7,035 0.0104% 61,423 11,435 18.62%88
33 218 20443 Continental Cas Co 5,657,077 8.3466% 4,394,426 1,536,992 34.98%5
34 218 35289 Continental Ins Co 609 0.0009% 187 -35,192 -18819.25%109
35 111 21458 Employers Ins Of Wausau Mut Co 253,376 0.3738% 256,847 18,200 7.09%28
36 65 21482 Factory Mut Ins Co 8,403,974 12.3994% 8,044,435 2,959,411 36.79%2
37 158 18864 Fairmont Ins Co 2,355 0.0035% 1,123 0 0.00%95
38 212 21652 Farmers Ins Exch 839 0.0012% 1,263 -2,947 -233.33%104
39 38 20281 Federal Ins Co 5,858,426 8.6436% 5,865,512 437,758 7.46%4
40 7 13935 Federated Mut Ins Co 124,277 0.1834% 98,620 29,170 29.58%43
41 7 28304 Federated Service Ins Co 1,564 0.0023% 509 0 0.00%99
42 164 35386 Fidelity & Guaranty Ins Co 239,170 0.3529% 181,010 168,467 93.07%29
43 164 25879 Fidelity & Guaranty Ins Underwriters 309,458 0.4566% 263,330 154,434 58.65%24
44 31453 Financial Pacific Ins Co 131,529 0.1941% 13,765 0 0.00%42
45 553 24880 Fire & Cas Ins Co Of CT 672 0.0010% 1,048 0 0.00%107
46 761 21873 Firemans Fund Ins Co 187,404 0.2765% 193,848 495 0.26%38
47 163 24724 First Natl Ins Co Of Amer 2,163 0.0032% 1,415 0 0.00%97
48 349 13978 Florists Mut Ins Co 155,550 0.2295% 146,108 55,500 37.99%41
California Department of Insurance Page 1 of 3 Rate Specialist Bureau - 07/10/2001
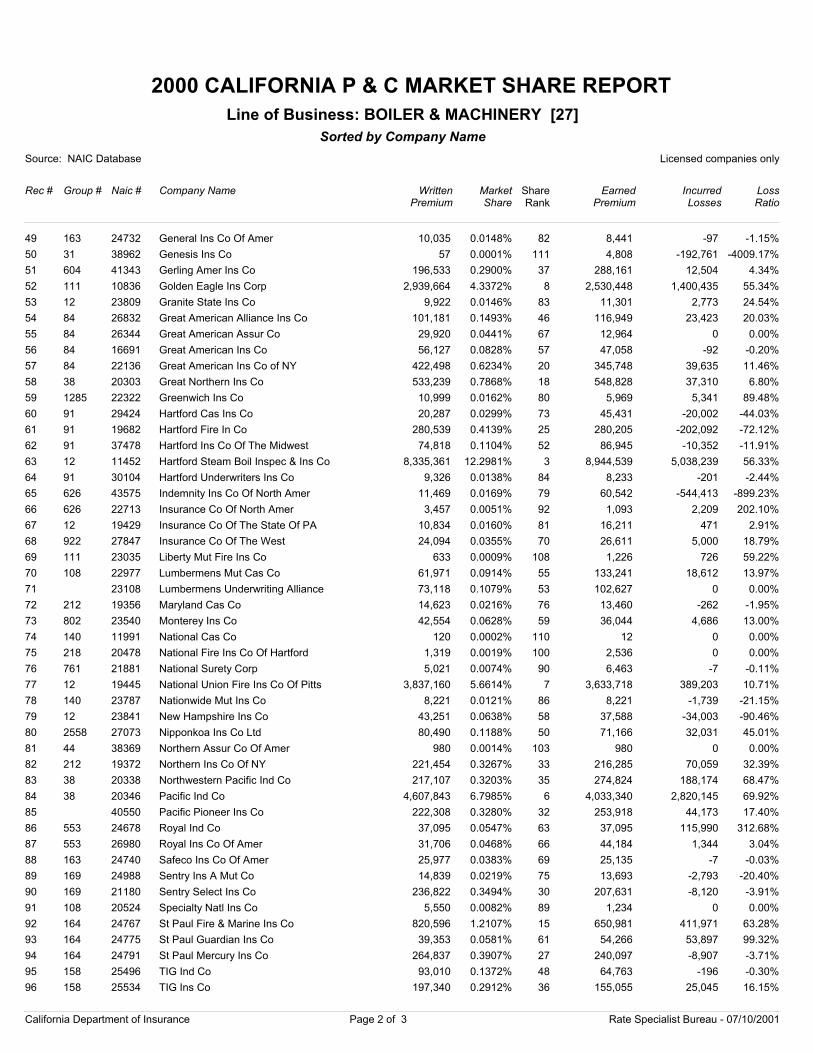
2000 CALIFORNIA P & C MARKET SHARE REPORT
Source: NAIC Database Licensed companies only
Rec # Group # Naic # Company Name
Sorted by Company Name
WrittenPremium
Market Share
EarnedPremium
IncurredLosses
LossRatio
Line of Business: BOILER & MACHINERY [27]
ShareRank
49 163 24732 General Ins Co Of Amer 10,035 0.0148% 8,441 -97 -1.15%82
50 31 38962 Genesis Ins Co 57 0.0001% 4,808 -192,761 -4009.17%111
51 604 41343 Gerling Amer Ins Co 196,533 0.2900% 288,161 12,504 4.34%37
52 111 10836 Golden Eagle Ins Corp 2,939,664 4.3372% 2,530,448 1,400,435 55.34%8
53 12 23809 Granite State Ins Co 9,922 0.0146% 11,301 2,773 24.54%83
54 84 26832 Great American Alliance Ins Co 101,181 0.1493% 116,949 23,423 20.03%46
55 84 26344 Great American Assur Co 29,920 0.0441% 12,964 0 0.00%67
56 84 16691 Great American Ins Co 56,127 0.0828% 47,058 -92 -0.20%57
57 84 22136 Great American Ins Co of NY 422,498 0.6234% 345,748 39,635 11.46%20
58 38 20303 Great Northern Ins Co 533,239 0.7868% 548,828 37,310 6.80%18
59 1285 22322 Greenwich Ins Co 10,999 0.0162% 5,969 5,341 89.48%80
60 91 29424 Hartford Cas Ins Co 20,287 0.0299% 45,431 -20,002 -44.03%73
61 91 19682 Hartford Fire In Co 280,539 0.4139% 280,205 -202,092 -72.12%25
62 91 37478 Hartford Ins Co Of The Midwest 74,818 0.1104% 86,945 -10,352 -11.91%52
63 12 11452 Hartford Steam Boil Inspec & Ins Co 8,335,361 12.2981% 8,944,539 5,038,239 56.33%3
64 91 30104 Hartford Underwriters Ins Co 9,326 0.0138% 8,233 -201 -2.44%84
65 626 43575 Indemnity Ins Co Of North Amer 11,469 0.0169% 60,542 -544,413 -899.23%79
66 626 22713 Insurance Co Of North Amer 3,457 0.0051% 1,093 2,209 202.10%92
67 12 19429 Insurance Co Of The State Of PA 10,834 0.0160% 16,211 471 2.91%81
68 922 27847 Insurance Co Of The West 24,094 0.0355% 26,611 5,000 18.79%70
69 111 23035 Liberty Mut Fire Ins Co 633 0.0009% 1,226 726 59.22%108
70 108 22977 Lumbermens Mut Cas Co 61,971 0.0914% 133,241 18,612 13.97%55
71 23108 Lumbermens Underwriting Alliance 73,118 0.1079% 102,627 0 0.00%53
72 212 19356 Maryland Cas Co 14,623 0.0216% 13,460 -262 -1.95%76
73 802 23540 Monterey Ins Co 42,554 0.0628% 36,044 4,686 13.00%59
74 140 11991 National Cas Co 120 0.0002% 12 0 0.00%110
75 218 20478 National Fire Ins Co Of Hartford 1,319 0.0019% 2,536 0 0.00%100
76 761 21881 National Surety Corp 5,021 0.0074% 6,463 -7 -0.11%90
77 12 19445 National Union Fire Ins Co Of Pitts 3,837,160 5.6614% 3,633,718 389,203 10.71%7
78 140 23787 Nationwide Mut Ins Co 8,221 0.0121% 8,221 -1,739 -21.15%86
79 12 23841 New Hampshire Ins Co 43,251 0.0638% 37,588 -34,003 -90.46%58
80 2558 27073 Nipponkoa Ins Co Ltd 80,490 0.1188% 71,166 32,031 45.01%50
81 44 38369 Northern Assur Co Of Amer 980 0.0014% 980 0 0.00%103
82 212 19372 Northern Ins Co Of NY 221,454 0.3267% 216,285 70,059 32.39%33
83 38 20338 Northwestern Pacific Ind Co 217,107 0.3203% 274,824 188,174 68.47%35
84 38 20346 Pacific Ind Co 4,607,843 6.7985% 4,033,340 2,820,145 69.92%6
85 40550 Pacific Pioneer Ins Co 222,308 0.3280% 253,918 44,173 17.40%32
86 553 24678 Royal Ind Co 37,095 0.0547% 37,095 115,990 312.68%63
87 553 26980 Royal Ins Co Of Amer 31,706 0.0468% 44,184 1,344 3.04%66
88 163 24740 Safeco Ins Co Of Amer 25,977 0.0383% 25,135 -7 -0.03%69
89 169 24988 Sentry Ins A Mut Co 14,839 0.0219% 13,693 -2,793 -20.40%75
90 169 21180 Sentry Select Ins Co 236,822 0.3494% 207,631 -8,120 -3.91%30
91 108 20524 Specialty Natl Ins Co 5,550 0.0082% 1,234 0 0.00%89
92 164 24767 St Paul Fire & Marine Ins Co 820,596 1.2107% 650,981 411,971 63.28%15
93 164 24775 St Paul Guardian Ins Co 39,353 0.0581% 54,266 53,897 99.32%61
94 164 24791 St Paul Mercury Ins Co 264,837 0.3907% 240,097 -8,907 -3.71%27
95 158 25496 TIG Ind Co 93,010 0.1372% 64,763 -196 -0.30%48
96 158 25534 TIG Ins Co 197,340 0.2912% 155,055 25,045 16.15%36
California Department of Insurance Page 2 of 3 Rate Specialist Bureau - 07/10/2001
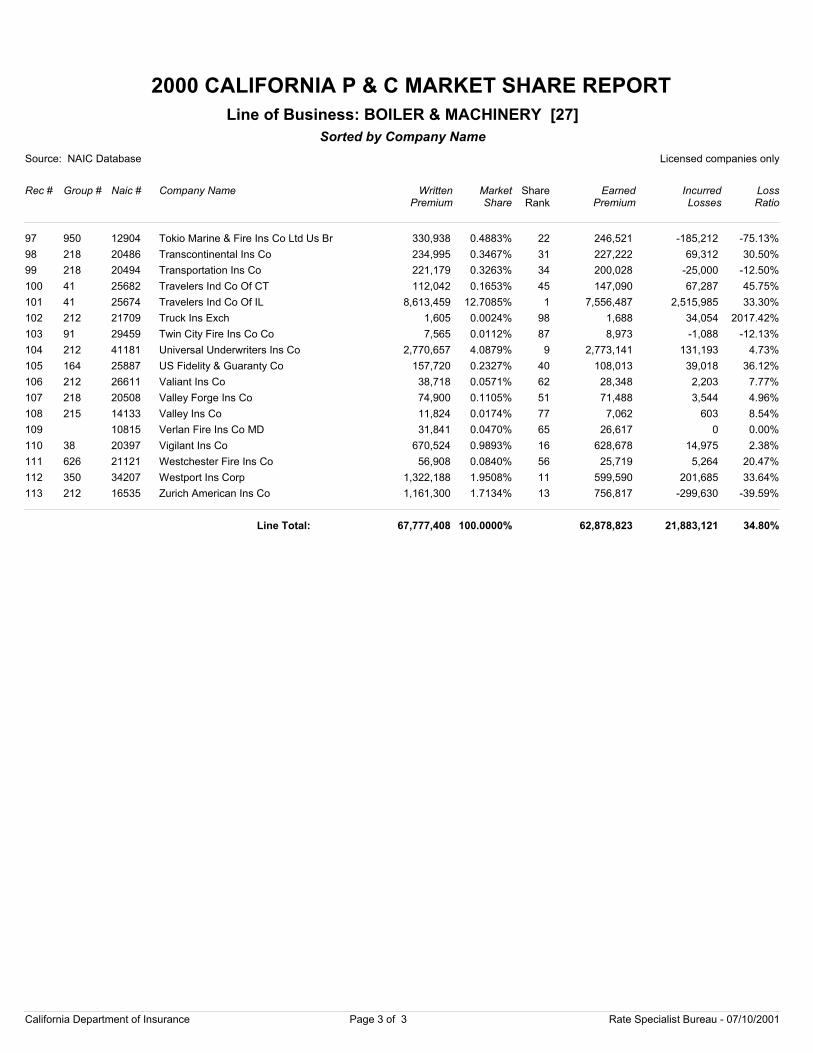
2000 CALIFORNIA P & C MARKET SHARE REPORT
Source: NAIC Database Licensed companies only
Rec # Group # Naic # Company Name
Sorted by Company Name
WrittenPremium
Market Share
EarnedPremium
IncurredLosses
LossRatio
Line of Business: BOILER & MACHINERY [27]
ShareRank
97 950 12904 Tokio Marine & Fire Ins Co Ltd Us Br 330,938 0.4883% 246,521 -185,212 -75.13%22
98 218 20486 Transcontinental Ins Co 234,995 0.3467% 227,222 69,312 30.50%31
99 218 20494 Transportation Ins Co 221,179 0.3263% 200,028 -25,000 -12.50%34
100 41 25682 Travelers Ind Co Of CT 112,042 0.1653% 147,090 67,287 45.75%45
101 41 25674 Travelers Ind Co Of IL 8,613,459 12.7085% 7,556,487 2,515,985 33.30%1
102 212 21709 Truck Ins Exch 1,605 0.0024% 1,688 34,054 2017.42%98
103 91 29459 Twin City Fire Ins Co Co 7,565 0.0112% 8,973 -1,088 -12.13%87
104 212 41181 Universal Underwriters Ins Co 2,770,657 4.0879% 2,773,141 131,193 4.73%9
105 164 25887 US Fidelity & Guaranty Co 157,720 0.2327% 108,013 39,018 36.12%40
106 212 26611 Valiant Ins Co 38,718 0.0571% 28,348 2,203 7.77%62
107 218 20508 Valley Forge Ins Co 74,900 0.1105% 71,488 3,544 4.96%51
108 215 14133 Valley Ins Co 11,824 0.0174% 7,062 603 8.54%77
109 10815 Verlan Fire Ins Co MD 31,841 0.0470% 26,617 0 0.00%65
110 38 20397 Vigilant Ins Co 670,524 0.9893% 628,678 14,975 2.38%16
111 626 21121 Westchester Fire Ins Co 56,908 0.0840% 25,719 5,264 20.47%56
112 350 34207 Westport Ins Corp 1,322,188 1.9508% 599,590 201,685 33.64%11
113 212 16535 Zurich American Ins Co 1,161,300 1.7134% 756,817 -299,630 -39.59%13
67,777,408 100.0000% 62,878,823 21,883,121 34.80%Line Total:
California Department of Insurance Page 3 of 3 Rate Specialist Bureau - 07/10/2001
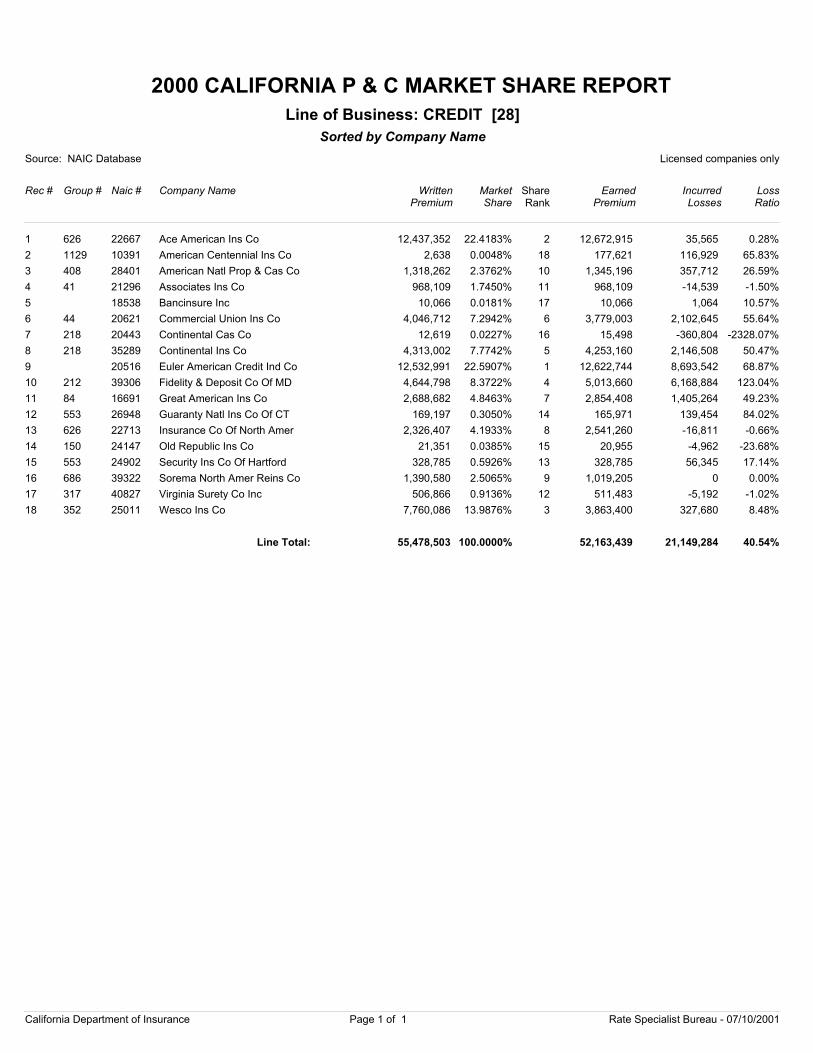
2000 CALIFORNIA P & C MARKET SHARE REPORT
Source: NAIC Database Licensed companies only
Rec # Group # Naic # Company Name
Sorted by Company Name
WrittenPremium
Market Share
EarnedPremium
IncurredLosses
LossRatio
Line of Business: CREDIT [28]
ShareRank
1 626 22667 Ace American Ins Co 12,437,352 22.4183% 12,672,915 35,565 0.28%2
2 1129 10391 American Centennial Ins Co 2,638 0.0048% 177,621 116,929 65.83%18
3 408 28401 American Natl Prop & Cas Co 1,318,262 2.3762% 1,345,196 357,712 26.59%10
4 41 21296 Associates Ins Co 968,109 1.7450% 968,109 -14,539 -1.50%11
5 18538 Bancinsure Inc 10,066 0.0181% 10,066 1,064 10.57%17
6 44 20621 Commercial Union Ins Co 4,046,712 7.2942% 3,779,003 2,102,645 55.64%6
7 218 20443 Continental Cas Co 12,619 0.0227% 15,498 -360,804 -2328.07%16
8 218 35289 Continental Ins Co 4,313,002 7.7742% 4,253,160 2,146,508 50.47%5
9 20516 Euler American Credit Ind Co 12,532,991 22.5907% 12,622,744 8,693,542 68.87%1
10 212 39306 Fidelity & Deposit Co Of MD 4,644,798 8.3722% 5,013,660 6,168,884 123.04%4
11 84 16691 Great American Ins Co 2,688,682 4.8463% 2,854,408 1,405,264 49.23%7
12 553 26948 Guaranty Natl Ins Co Of CT 169,197 0.3050% 165,971 139,454 84.02%14
13 626 22713 Insurance Co Of North Amer 2,326,407 4.1933% 2,541,260 -16,811 -0.66%8
14 150 24147 Old Republic Ins Co 21,351 0.0385% 20,955 -4,962 -23.68%15
15 553 24902 Security Ins Co Of Hartford 328,785 0.5926% 328,785 56,345 17.14%13
16 686 39322 Sorema North Amer Reins Co 1,390,580 2.5065% 1,019,205 0 0.00%9
17 317 40827 Virginia Surety Co Inc 506,866 0.9136% 511,483 -5,192 -1.02%12
18 352 25011 Wesco Ins Co 7,760,086 13.9876% 3,863,400 327,680 8.48%3
55,478,503 100.0000% 52,163,439 21,149,284 40.54%Line Total:
California Department of Insurance Page 1 of 1 Rate Specialist Bureau - 07/10/2001
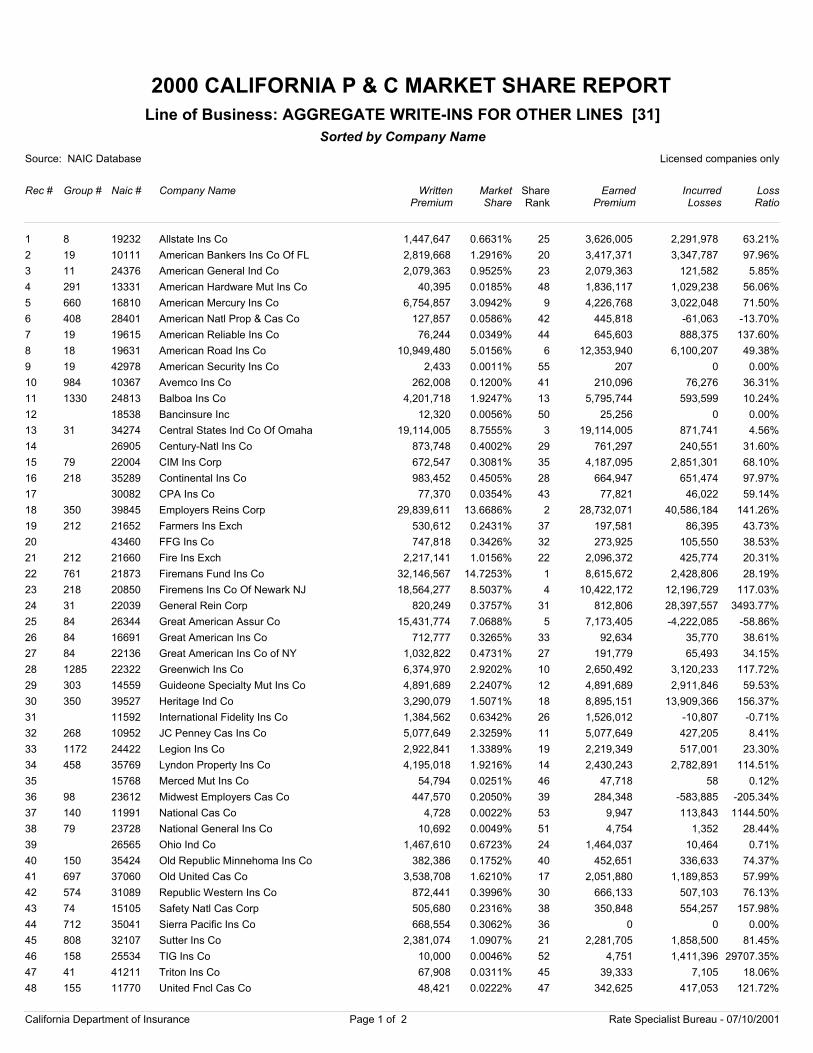
2000 CALIFORNIA P & C MARKET SHARE REPORT
Source: NAIC Database Licensed companies only
Rec # Group # Naic # Company Name
Sorted by Company Name
WrittenPremium
Market Share
EarnedPremium
IncurredLosses
LossRatio
Line of Business: AGGREGATE WRITE-INS FOR OTHER LINES [31]
ShareRank
1 8 19232 Allstate Ins Co 1,447,647 0.6631% 3,626,005 2,291,978 63.21%25
2 19 10111 American Bankers Ins Co Of FL 2,819,668 1.2916% 3,417,371 3,347,787 97.96%20
3 11 24376 American General Ind Co 2,079,363 0.9525% 2,079,363 121,582 5.85%23
4 291 13331 American Hardware Mut Ins Co 40,395 0.0185% 1,836,117 1,029,238 56.06%48
5 660 16810 American Mercury Ins Co 6,754,857 3.0942% 4,226,768 3,022,048 71.50%9
6 408 28401 American Natl Prop & Cas Co 127,857 0.0586% 445,818 -61,063 -13.70%42
7 19 19615 American Reliable Ins Co 76,244 0.0349% 645,603 888,375 137.60%44
8 18 19631 American Road Ins Co 10,949,480 5.0156% 12,353,940 6,100,207 49.38%6
9 19 42978 American Security Ins Co 2,433 0.0011% 207 0 0.00%55
10 984 10367 Avemco Ins Co 262,008 0.1200% 210,096 76,276 36.31%41
11 1330 24813 Balboa Ins Co 4,201,718 1.9247% 5,795,744 593,599 10.24%13
12 18538 Bancinsure Inc 12,320 0.0056% 25,256 0 0.00%50
13 31 34274 Central States Ind Co Of Omaha 19,114,005 8.7555% 19,114,005 871,741 4.56%3
14 26905 Century-Natl Ins Co 873,748 0.4002% 761,297 240,551 31.60%29
15 79 22004 CIM Ins Corp 672,547 0.3081% 4,187,095 2,851,301 68.10%35
16 218 35289 Continental Ins Co 983,452 0.4505% 664,947 651,474 97.97%28
17 30082 CPA Ins Co 77,370 0.0354% 77,821 46,022 59.14%43
18 350 39845 Employers Reins Corp 29,839,611 13.6686% 28,732,071 40,586,184 141.26%2
19 212 21652 Farmers Ins Exch 530,612 0.2431% 197,581 86,395 43.73%37
20 43460 FFG Ins Co 747,818 0.3426% 273,925 105,550 38.53%32
21 212 21660 Fire Ins Exch 2,217,141 1.0156% 2,096,372 425,774 20.31%22
22 761 21873 Firemans Fund Ins Co 32,146,567 14.7253% 8,615,672 2,428,806 28.19%1
23 218 20850 Firemens Ins Co Of Newark NJ 18,564,277 8.5037% 10,422,172 12,196,729 117.03%4
24 31 22039 General Rein Corp 820,249 0.3757% 812,806 28,397,557 3493.77%31
25 84 26344 Great American Assur Co 15,431,774 7.0688% 7,173,405 -4,222,085 -58.86%5
26 84 16691 Great American Ins Co 712,777 0.3265% 92,634 35,770 38.61%33
27 84 22136 Great American Ins Co of NY 1,032,822 0.4731% 191,779 65,493 34.15%27
28 1285 22322 Greenwich Ins Co 6,374,970 2.9202% 2,650,492 3,120,233 117.72%10
29 303 14559 Guideone Specialty Mut Ins Co 4,891,689 2.2407% 4,891,689 2,911,846 59.53%12
30 350 39527 Heritage Ind Co 3,290,079 1.5071% 8,895,151 13,909,366 156.37%18
31 11592 International Fidelity Ins Co 1,384,562 0.6342% 1,526,012 -10,807 -0.71%26
32 268 10952 JC Penney Cas Ins Co 5,077,649 2.3259% 5,077,649 427,205 8.41%11
33 1172 24422 Legion Ins Co 2,922,841 1.3389% 2,219,349 517,001 23.30%19
34 458 35769 Lyndon Property Ins Co 4,195,018 1.9216% 2,430,243 2,782,891 114.51%14
35 15768 Merced Mut Ins Co 54,794 0.0251% 47,718 58 0.12%46
36 98 23612 Midwest Employers Cas Co 447,570 0.2050% 284,348 -583,885 -205.34%39
37 140 11991 National Cas Co 4,728 0.0022% 9,947 113,843 1144.50%53
38 79 23728 National General Ins Co 10,692 0.0049% 4,754 1,352 28.44%51
39 26565 Ohio Ind Co 1,467,610 0.6723% 1,464,037 10,464 0.71%24
40 150 35424 Old Republic Minnehoma Ins Co 382,386 0.1752% 452,651 336,633 74.37%40
41 697 37060 Old United Cas Co 3,538,708 1.6210% 2,051,880 1,189,853 57.99%17
42 574 31089 Republic Western Ins Co 872,441 0.3996% 666,133 507,103 76.13%30
43 74 15105 Safety Natl Cas Corp 505,680 0.2316% 350,848 554,257 157.98%38
44 712 35041 Sierra Pacific Ins Co 668,554 0.3062% 0 0 0.00%36
45 808 32107 Sutter Ins Co 2,381,074 1.0907% 2,281,705 1,858,500 81.45%21
46 158 25534 TIG Ins Co 10,000 0.0046% 4,751 1,411,396 29707.35%52
47 41 41211 Triton Ins Co 67,908 0.0311% 39,333 7,105 18.06%45
48 155 11770 United Fncl Cas Co 48,421 0.0222% 342,625 417,053 121.72%47
California Department of Insurance Page 1 of 2 Rate Specialist Bureau - 07/10/2001
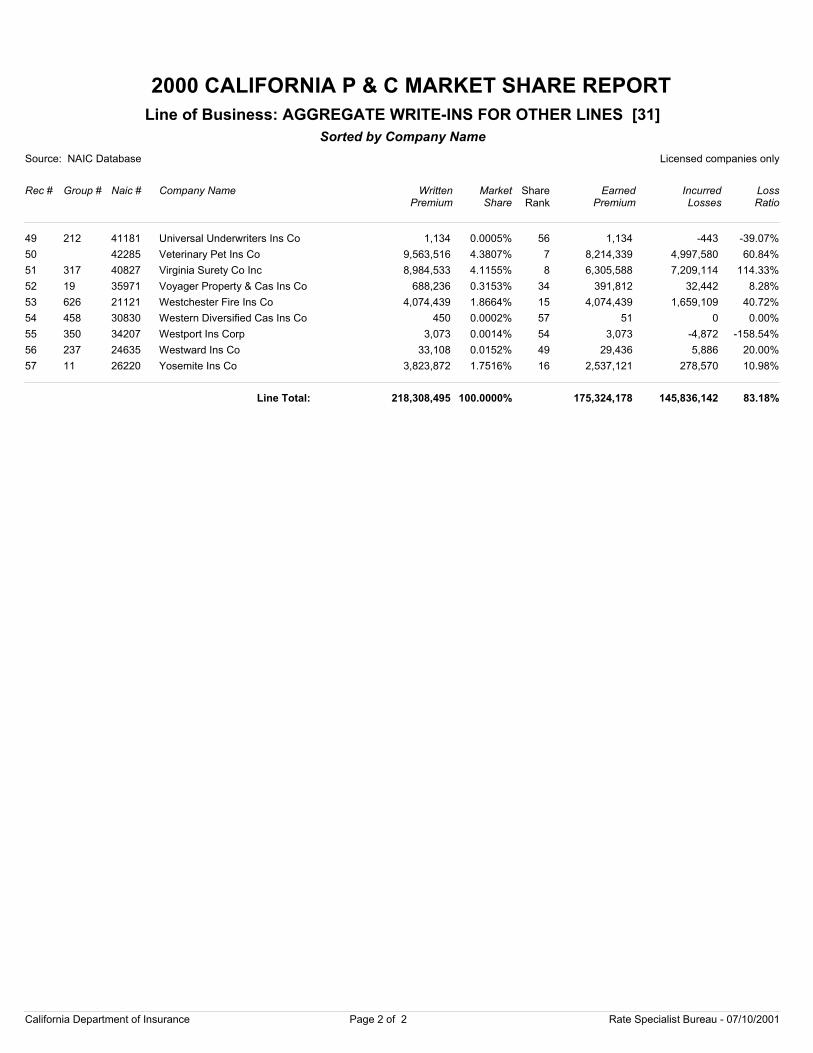
2000 CALIFORNIA P & C MARKET SHARE REPORT
Source: NAIC Database Licensed companies only
Rec # Group # Naic # Company Name
Sorted by Company Name
WrittenPremium
Market Share
EarnedPremium
IncurredLosses
LossRatio
Line of Business: AGGREGATE WRITE-INS FOR OTHER LINES [31]
ShareRank
49 212 41181 Universal Underwriters Ins Co 1,134 0.0005% 1,134 -443 -39.07%56
50 42285 Veterinary Pet Ins Co 9,563,516 4.3807% 8,214,339 4,997,580 60.84%7
51 317 40827 Virginia Surety Co Inc 8,984,533 4.1155% 6,305,588 7,209,114 114.33%8
52 19 35971 Voyager Property & Cas Ins Co 688,236 0.3153% 391,812 32,442 8.28%34
53 626 21121 Westchester Fire Ins Co 4,074,439 1.8664% 4,074,439 1,659,109 40.72%15
54 458 30830 Western Diversified Cas Ins Co 450 0.0002% 51 0 0.00%57
55 350 34207 Westport Ins Corp 3,073 0.0014% 3,073 -4,872 -158.54%54
56 237 24635 Westward Ins Co 33,108 0.0152% 29,436 5,886 20.00%49
57 11 26220 Yosemite Ins Co 3,823,872 1.7516% 2,537,121 278,570 10.98%16
218,308,495 100.0000% 175,324,178 145,836,142 83.18%Line Total:
California Department of Insurance Page 2 of 2 Rate Specialist Bureau - 07/10/2001
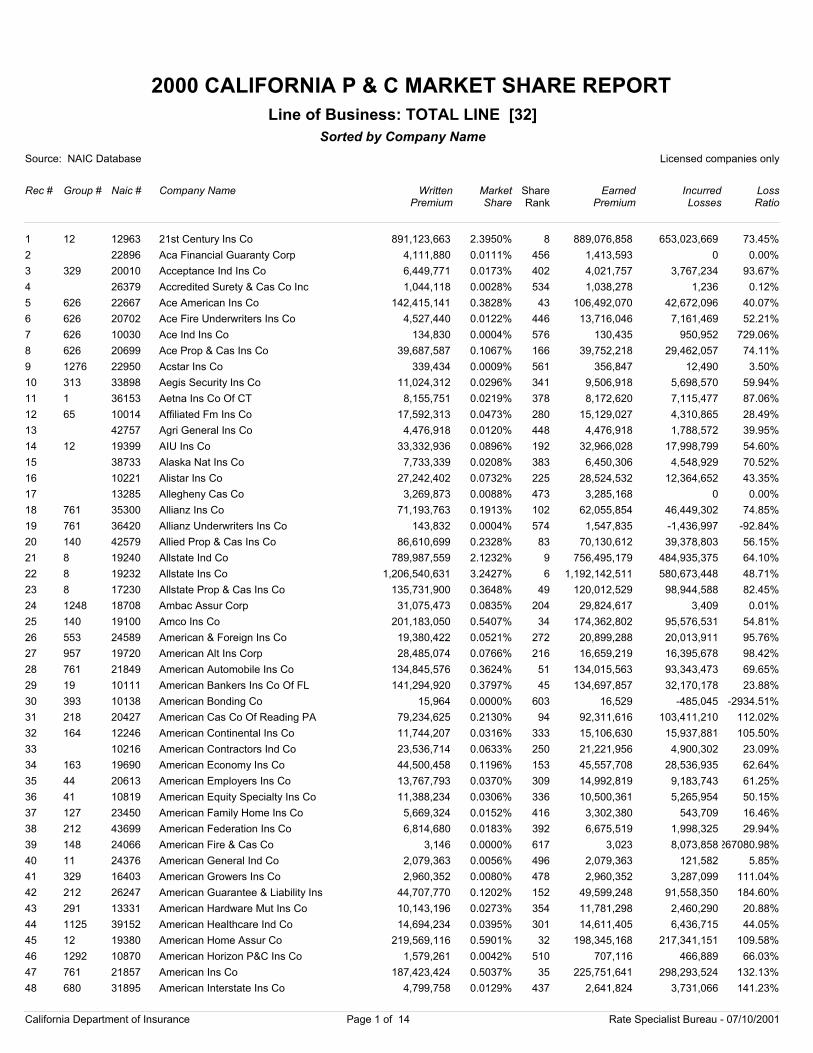
2000 CALIFORNIA P & C MARKET SHARE REPORT
Source: NAIC Database Licensed companies only
Rec # Group # Naic # Company Name
Sorted by Company Name
WrittenPremium
Market Share
EarnedPremium
IncurredLosses
LossRatio
Line of Business: TOTAL LINE [32]
ShareRank
1 12 12963 21st Century Ins Co 891,123,663 2.3950% 889,076,858 653,023,669 73.45%8
2 22896 Aca Financial Guaranty Corp 4,111,880 0.0111% 1,413,593 0 0.00%456
3 329 20010 Acceptance Ind Ins Co 6,449,771 0.0173% 4,021,757 3,767,234 93.67%402
4 26379 Accredited Surety & Cas Co Inc 1,044,118 0.0028% 1,038,278 1,236 0.12%534
5 626 22667 Ace American Ins Co 142,415,141 0.3828% 106,492,070 42,672,096 40.07%43
6 626 20702 Ace Fire Underwriters Ins Co 4,527,440 0.0122% 13,716,046 7,161,469 52.21%446
7 626 10030 Ace Ind Ins Co 134,830 0.0004% 130,435 950,952 729.06%576
8 626 20699 Ace Prop & Cas Ins Co 39,687,587 0.1067% 39,752,218 29,462,057 74.11%166
9 1276 22950 Acstar Ins Co 339,434 0.0009% 356,847 12,490 3.50%561
10 313 33898 Aegis Security Ins Co 11,024,312 0.0296% 9,506,918 5,698,570 59.94%341
11 1 36153 Aetna Ins Co Of CT 8,155,751 0.0219% 8,172,620 7,115,477 87.06%378
12 65 10014 Affiliated Fm Ins Co 17,592,313 0.0473% 15,129,027 4,310,865 28.49%280
13 42757 Agri General Ins Co 4,476,918 0.0120% 4,476,918 1,788,572 39.95%448
14 12 19399 AIU Ins Co 33,332,936 0.0896% 32,966,028 17,998,799 54.60%192
15 38733 Alaska Nat Ins Co 7,733,339 0.0208% 6,450,306 4,548,929 70.52%383
16 10221 Alistar Ins Co 27,242,402 0.0732% 28,524,532 12,364,652 43.35%225
17 13285 Allegheny Cas Co 3,269,873 0.0088% 3,285,168 0 0.00%473
18 761 35300 Allianz Ins Co 71,193,763 0.1913% 62,055,854 46,449,302 74.85%102
19 761 36420 Allianz Underwriters Ins Co 143,832 0.0004% 1,547,835 -1,436,997 -92.84%574
20 140 42579 Allied Prop & Cas Ins Co 86,610,699 0.2328% 70,130,612 39,378,803 56.15%83
21 8 19240 Allstate Ind Co 789,987,559 2.1232% 756,495,179 484,935,375 64.10%9
22 8 19232 Allstate Ins Co 1,206,540,631 3.2427% 1,192,142,511 580,673,448 48.71%6
23 8 17230 Allstate Prop & Cas Ins Co 135,731,900 0.3648% 120,012,529 98,944,588 82.45%49
24 1248 18708 Ambac Assur Corp 31,075,473 0.0835% 29,824,617 3,409 0.01%204
25 140 19100 Amco Ins Co 201,183,050 0.5407% 174,362,802 95,576,531 54.81%34
26 553 24589 American & Foreign Ins Co 19,380,422 0.0521% 20,899,288 20,013,911 95.76%272
27 957 19720 American Alt Ins Corp 28,485,074 0.0766% 16,659,219 16,395,678 98.42%216
28 761 21849 American Automobile Ins Co 134,845,576 0.3624% 134,015,563 93,343,473 69.65%51
29 19 10111 American Bankers Ins Co Of FL 141,294,920 0.3797% 134,697,857 32,170,178 23.88%45
30 393 10138 American Bonding Co 15,964 0.0000% 16,529 -485,045 -2934.51%603
31 218 20427 American Cas Co Of Reading PA 79,234,625 0.2130% 92,311,616 103,411,210 112.02%94
32 164 12246 American Continental Ins Co 11,744,207 0.0316% 15,106,630 15,937,881 105.50%333
33 10216 American Contractors Ind Co 23,536,714 0.0633% 21,221,956 4,900,302 23.09%250
34 163 19690 American Economy Ins Co 44,500,458 0.1196% 45,557,708 28,536,935 62.64%153
35 44 20613 American Employers Ins Co 13,767,793 0.0370% 14,992,819 9,183,743 61.25%309
36 41 10819 American Equity Specialty Ins Co 11,388,234 0.0306% 10,500,361 5,265,954 50.15%336
37 127 23450 American Family Home Ins Co 5,669,324 0.0152% 3,302,380 543,709 16.46%416
38 212 43699 American Federation Ins Co 6,814,680 0.0183% 6,675,519 1,998,325 29.94%392
39 148 24066 American Fire & Cas Co 3,146 0.0000% 3,023 8,073,858267080.98%617
40 11 24376 American General Ind Co 2,079,363 0.0056% 2,079,363 121,582 5.85%496
41 329 16403 American Growers Ins Co 2,960,352 0.0080% 2,960,352 3,287,099 111.04%478
42 212 26247 American Guarantee & Liability Ins 44,707,770 0.1202% 49,599,248 91,558,350 184.60%152
43 291 13331 American Hardware Mut Ins Co 10,143,196 0.0273% 11,781,298 2,460,290 20.88%354
44 1125 39152 American Healthcare Ind Co 14,694,234 0.0395% 14,611,405 6,436,715 44.05%301
45 12 19380 American Home Assur Co 219,569,116 0.5901% 198,345,168 217,341,151 109.58%32
46 1292 10870 American Horizon P&C Ins Co 1,579,261 0.0042% 707,116 466,889 66.03%510
47 761 21857 American Ins Co 187,423,424 0.5037% 225,751,641 298,293,524 132.13%35
48 680 31895 American Interstate Ins Co 4,799,758 0.0129% 2,641,824 3,731,066 141.23%437
California Department of Insurance Page 1 of 14 Rate Specialist Bureau - 07/10/2001
2000 CALIFORNIA P & C MARKET SHARE REPORT
Source: NAIC Database Licensed companies only
Rec # Group # Naic # Company Name
Sorted by Company Name
WrittenPremium
Market Share
EarnedPremium
IncurredLosses
LossRatio
Line of Business: TOTAL LINE [32]
ShareRank
49 12 43761 American Intl Ins Co Of CA 37,470,975 0.1007% 37,061,684 28,150,499 75.96%171
50 1269 10200 American Live Stock Ins Co 282,410 0.0008% 376,545 48,165 12.79%565
51 108 30562 American Manufacturers Mut Ins Co 142,467,204 0.3829% 134,282,983 94,231,588 70.17%42
52 660 16810 American Mercury Ins Co 6,754,857 0.0182% 4,226,768 3,022,048 71.50%393
53 127 23469 American Modern Home Ins Co 11,778,381 0.0317% 12,929,995 5,773,682 44.65%332
54 108 22918 American Motorists Ins Co 76,084,474 0.2045% 84,756,017 117,581,548 138.73%98
55 408 28401 American Natl Prop & Cas Co 9,788,298 0.0263% 10,882,983 5,394,631 49.57%361
56 108 18910 American Protection Ins Co 80,823,190 0.2172% 73,225,220 59,065,767 80.66%91
57 19 19615 American Reliable Ins Co 14,400,316 0.0387% 19,450,600 12,649,797 65.04%304
58 594 19984 American Risk Funding Ins Co 1,433,326 0.0039% 1,433,326 89,166 6.22%516
59 18 19631 American Road Ins Co 10,949,480 0.0294% 12,353,940 6,100,207 49.38%344
60 1346 39969 American Safety Cas Ins Co 12,420,914 0.0334% 6,479,761 4,714,959 72.76%324
61 19 42978 American Security Ins Co 91,266,431 0.2453% 92,148,905 11,441,496 12.42%78
62 84 33723 American Spirit Ins Co 3,899,549 0.0105% 3,935,333 -1,160,722 -29.49%459
63 163 19704 American States Ins Co 61,519,803 0.1653% 46,995,453 36,851,711 78.42%117
64 40800 American Sterling Ins Co 10,357,399 0.0278% 8,648,373 3,666,848 42.40%350
65 31380 American Surety Co 2,077,058 0.0056% 2,129,067 318,044 14.94%497
66 212 40142 American Zurich Ins Co 44,230,862 0.1189% 43,823,054 22,561,721 51.48%155
67 766 30872 Amerin Guaranty Corp 23,540,787 0.0633% 24,505,631 1,373,376 5.60%249
68 124 23396 Amerisure Mut Ins Co 499,537 0.0013% 490,648 388,001 79.08%553
69 4 27928 Amex Assur Co 35,890,590 0.0965% 34,764,003 15,533,824 44.68%178
70 28 19976 Amica Mut Ins Co 48,084,483 0.1292% 48,979,988 15,176,061 30.98%144
71 2 34983 Amwest Surety Ins Co 26,300,111 0.0707% 25,244,923 8,553,371 33.88%229
72 808 25180 Anza Ins Co 6,127,478 0.0165% 6,738,450 4,479,880 66.48%405
73 457 19860 Argonaut Great Central Ins Co 462,562 0.0012% 397,742 297,756 74.86%556
74 457 19801 Argonaut Ins Co 30,973,253 0.0832% 26,864,996 121,618,324 452.70%205
75 457 19828 Argonaut-Midwest Ins Co 1,349,977 0.0036% 1,283,453 4,760,929 370.95%518
76 457 19844 Argonaut-Southwest Ins Co 5,864,976 0.0158% 3,964,115 3,927,094 99.07%411
77 41459 Armed Forces Ins Exchange 5,597,014 0.0150% 5,589,801 1,840,968 32.93%419
78 761 21865 Associated Ind Corp 73,218,564 0.1968% 76,101,879 18,182,924 23.89%100
79 785 27189 Associated Intl Ins Co 16,971,860 0.0456% 31,752,197 679,254 2.14%288
80 41 21296 Associates Ins Co 6,653,068 0.0179% 9,363,264 9,568,891 102.20%397
81 212 19305 Assurance Co Of Amer 54,722,823 0.1471% 45,084,311 25,417,386 56.38%130
82 164 41769 Athena Assur Co 9,670,448 0.0260% 8,795,973 11,478,208 130.49%362
83 84 21792 Atlanta Cas Co 3,736,074 0.0100% 3,415,989 2,661,781 77.92%465
84 41 22209 Atlantic Ins Co 9,115 0.0000% 9,045 0 0.00%611
85 24 19895 Atlantic Mut Ins Co 99,133,382 0.2664% 89,139,029 58,763,337 65.92%71
86 111 18333 Atlas Assur Co Of Amer 13,342 0.0000% 13,342 436,703 3273.14%605
87 22670 Attorneys Ins Mut RRG Inc 10,515,760 0.0283% 9,021,408 11,320,552 125.49%347
88 984 10367 Avemco Ins Co 17,207,429 0.0462% 17,659,672 12,513,174 70.86%285
89 29530 AXA Art Ins Corp 6,264,457 0.0168% 5,888,914 2,516,087 42.73%404
90 1330 24813 Balboa Ins Co 27,408,766 0.0737% 29,941,232 9,395,634 31.38%224
91 18538 Bancinsure Inc 1,517,700 0.0041% 2,004,213 1,916,738 95.64%511
92 689 33162 Bankers Ins Co 21,797,371 0.0586% 23,222,706 383,502 1.65%259
93 626 18279 Bankers Standard Ins Co 2,579,802 0.0069% 4,183,365 3,596,981 85.98%488
94 23 38245 BCS Ins Co 9,068,960 0.0244% 9,293,584 11,765,826 126.60%371
95 98 32603 Berkley Ins Co 5,730,217 0.0154% 3,901,793 2,680,551 68.70%414
96 98 11001 Berkley Partners Ins Co 3,619,685 0.0097% 901,291 576,164 63.93%467
California Department of Insurance Page 2 of 14 Rate Specialist Bureau - 07/10/2001
2000 CALIFORNIA P & C MARKET SHARE REPORT
Source: NAIC Database Licensed companies only
Rec # Group # Naic # Company Name
Sorted by Company Name
WrittenPremium
Market Share
EarnedPremium
IncurredLosses
LossRatio
Line of Business: TOTAL LINE [32]
ShareRank
97 12 19402 Birmingham Fire Ins Co Of PA 3,308,111 0.0089% 3,482,069 346,038 9.94%471
98 150 20095 Bituminous Cas Corp 6,342 0.0000% 5,381 99,200 1843.52%613
99 150 20109 Bituminous Fire & Marine Ins Co 1,757 0.0000% 3,036 -600 -19.76%620
100 218 20761 Boston Old Colony Ins Co 1,686 0.0000% 6,464 209,518 3241.31%621
101 10830 Business Alliance Ins Co 2,888,004 0.0078% 1,403,173 2,666,198 190.01%480
102 140 18961 Calfarm Ins Co 228,029,832 0.6129% 248,394,875 150,803,741 60.71%30
103 660 38342 California Automobile Ins Co 40,401,455 0.1086% 35,901,682 23,571,053 65.65%163
104 802 13544 California Capital Ins Co 114,702,449 0.3083% 113,408,671 58,092,014 51.22%60
105 33 35955 California Cas Gen Ins Co 4,560 0.0000% 4,560 -759,076 -16646.40%615
106 33 20117 California Cas Ind Exch 104,697,965 0.2814% 101,934,609 67,592,661 66.31%67
107 33 20125 California Cas Ins Co 25,215,103 0.0678% 25,328,944 7,511,356 29.66%239
108 10779 California Earthquake Authority 432,770,846 1.1631% 435,801,207 -272,816 -0.06%16
109 829 32271 California Ind Ins Co 154,949,567 0.4164% 155,683,038 195,658,498 125.68%41
110 350 38865 California Ins Co 6 0.0000% 6 8,229,604160066.67%633
111 1278 15539 California State Auto Asn Inter-Ins 1,538,076,551 4.1338% 1,515,728,026 971,766,480 64.11%4
112 36340 Camico Mut Ins Co 20,539,754 0.0552% 20,450,260 6,496,030 31.77%265
113 528 20877 Capital Markets Assr Corp 55,799 0.0001% 101,651 0 0.00%587
114 10520 Care West Ins Co 5,499,267 0.0148% 5,686,718 4,186,875 73.63%421
115 98 10510 Carolina Cas Ins Co 33,831,007 0.0909% 34,129,578 26,271,216 76.97%190
116 10175 Cascade Natl Ins Co 23,149,491 0.0622% 16,584,921 13,915,512 83.90%252
117 56 21237 Casualty Reciprocal Exch 27,518,779 0.0740% 19,468,325 35,560,898 182.66%221
118 24 19909 Centennial Ins Co 30,066,870 0.0808% 28,300,783 16,749,879 59.19%209
119 31 34274 Central States Ind Co Of Omaha 30,292,234 0.0814% 30,292,234 4,435,320 14.64%207
120 212 34649 Centre Ins Co 32,853,090 0.0883% 32,129,816 23,183,184 72.15%193
121 982 11711 Century American Cas Co 10,838 0.0000% 44,998 -959,035 -2131.28%608
122 626 20710 Century Ind Co 376 0.0000% 376 -71,376,310983061.17%625
123 26905 Century-Natl Ins Co 140,324,000 0.3771% 142,941,714 67,641,457 47.32%46
124 44 21970 CGU Ins Co 64,050,769 0.1721% 56,259,509 33,225,612 59.06%112
125 44 21946 CGU Ins Co Of NJ 107,569 0.0003% 72,795 58,200 79.95%580
126 761 22810 Chicago Ins Co 46,103,318 0.1239% 41,650,407 17,551,156 42.14%147
127 240 10499 Chrysler Ins Co 11,934,877 0.0321% 11,525,427 11,002,082 95.46%328
128 38 12777 Chubb Ind Ins Co 3,865 0.0000% 4,298 -609 -14.17%616
129 38 10052 Chubb National Ins Co 135,687 0.0004% 112,853 8,966 7.94%575
130 344 10669 Church Ins Co 3,201,495 0.0086% 3,221,684 92,975 2.89%474
131 18767 Church Mut Ins Co 19,063,567 0.0512% 19,016,895 5,087,466 26.75%275
132 79 22004 CIM Ins Corp 7,558,329 0.0203% 10,684,989 9,200,863 86.11%388
133 244 10677 Cincinnati Ins Co 4,552,212 0.0122% 4,313,636 1,914,652 44.39%444
134 212 10315 Civic Property & Cas Co Inc 2,337,614 0.0063% 2,195,676 1,278,700 58.24%492
135 323 10693 Civil Svc Employees Ins Co 79,886,092 0.2147% 77,299,365 40,468,028 52.35%93
136 608 36412 Claremont Liability Ins Co 7,641,774 0.0205% 4,262,303 2,477,339 58.12%384
137 517 20532 Clarendon Natl Ins Co 273,559,468 0.7352% 308,433,543 355,528,862 115.27%27
138 306 40266 CMG Mortgage Ins Co 4,944,335 0.0133% 4,971,137 -66,677 -1.34%433
139 218 20435 CNA Cas Of CA 88,181,371 0.2370% 92,226,014 86,288,423 93.56%81
140 814 25089 Coast Natl Ins Co 158,778,455 0.4267% 170,600,915 115,751,959 67.85%39
141 212 34347 Colonial American Cas & Surety Co 4,337,415 0.0117% 2,979,097 514,079 17.26%451
142 350 20796 Colonial Penn Franklin Ins Co 40,196,104 0.1080% 41,619,030 28,111,893 67.55%164
143 350 34789 Colonial Penn Ins Co 19,113,868 0.0514% 20,918,030 14,172,469 67.75%274
144 350 43974 Colonial Penn Madison Ins Co 10,130,579 0.0272% 10,751,910 6,143,571 57.14%355
California Department of Insurance Page 3 of 14 Rate Specialist Bureau - 07/10/2001
2000 CALIFORNIA P & C MARKET SHARE REPORT
Source: NAIC Database Licensed companies only
Rec # Group # Naic # Company Name
Sorted by Company Name
WrittenPremium
Market Share
EarnedPremium
IncurredLosses
LossRatio
Line of Business: TOTAL LINE [32]
ShareRank
145 10758 Colonial Surety Co 75 0.0000% 70 16 22.86%629
146 31 27812 Columbia Ins Co 1,480,947 0.0040% 1,532,138 -220,846 -14.41%513
147 12 19410 Commerce & Industry Ins Co 31,878,158 0.0857% 20,111,422 -14,666,762 -72.93%200
148 816 13161 Commerce West Ins Co 25,380,121 0.0682% 22,828,096 12,161,703 53.28%236
149 829 32280 Commercial Cas Ins Co 631,084 0.0017% 629,817 1,193,867 189.56%550
150 1231 36374 Commercial Cas Ins Co Of GA 13,364,124 0.0359% 11,579,497 3,751,021 32.39%311
151 1252 10650 Commercial Comp Ins Co 9,490,394 0.0255% 10,485,195 9,728,610 92.78%365
152 218 20818 Commercial Ins Co Of Newark NJ 52 0.0000% 55 77,295140536.36%631
153 181 19489 Commercial Underwriters Ins Co 19,875,339 0.0534% 28,440,793 9,689,587 34.07%270
154 44 20621 Commercial Union Ins Co 101,317,393 0.2723% 98,600,568 40,637,136 41.21%70
155 158 10220 Commonwealth Ins Co Of Amer 1,126,721 0.0030% 1,031,349 -132,892 -12.89%531
156 34711 Computer Ins Co 1,987,960 0.0053% 1,987,960 -28,425 -1.43%499
157 553 24872 Connecticut Ind Co 71,940,583 0.1933% 64,944,245 67,164,918 103.42%101
158 36960 Connecticut Surety Co 1,448,383 0.0039% 1,818,649 -99,057 -5.45%515
159 604 32190 Constitution Ins Co 12,507,129 0.0336% 3,258,528 1,888,464 57.95%321
160 218 20443 Continental Cas Co 278,739,472 0.7491% 287,350,888 427,375,319 148.73%25
161 959 39551 Continental Heritage Ins Co 1,140,131 0.0031% 1,827,109 315,226 17.25%530
162 218 35289 Continental Ins Co 36,363,995 0.0977% 39,083,082 54,754,928 140.10%176
163 28258 Continental Natl Ind Co 293,866 0.0008% 121,015 95,708 79.09%564
164 37206 Contractors Bonding & Ins Co 12,732,735 0.0342% 11,625,081 6,699,116 57.63%318
165 350 21318 Coregis Ins Co 58,134,199 0.1562% 43,479,860 28,862,436 66.38%125
166 30082 CPA Ins Co 77,370 0.0002% 77,821 46,022 59.14%583
167 14010 Crusader Ins Co 28,513,822 0.0766% 28,269,301 18,427,145 65.18%215
168 323 18953 CSE Safeguard Ins Co 9,434,274 0.0254% 7,342,438 3,417,794 46.55%367
169 306 10847 Cumis Ins Society Inc 31,446,738 0.0845% 29,797,340 25,106,860 84.26%202
170 31 10855 Cypress Ins Co 15,380,791 0.0413% 14,728,051 9,691,149 65.80%297
171 930 19269 Danielson Natl Ins Co 15,595,922 0.0419% 15,599,878 14,124,699 90.54%296
172 8 37907 Deerbrook Ins Co 37,361,908 0.1004% 44,477,746 49,409,408 111.09%172
173 40975 Dentists Ins Co 23,928,548 0.0643% 23,366,634 9,062,964 38.79%247
174 140 42587 Depositors Ins Co 10,849,452 0.0292% 7,851,476 6,438,709 82.01%346
175 553 18260 Design Profs Ins Co 12,819,494 0.0345% 15,982,235 8,891,809 55.64%316
176 75 12718 Developers Surety And Ind Co 11,301,045 0.0304% 10,000,994 523,249 5.23%338
177 920 42048 Diamond State Ins Co 32,685,841 0.0878% 34,121,361 24,629,140 72.18%196
178 164 36463 Discover Prop & Cas Ins Co 122,660 0.0003% 623 2,378 381.70%577
179 831 34495 Doctors Co An Interins Exchn 88,038,456 0.2366% 87,587,197 27,154,360 31.00%82
180 33499 Dorinco Rein Co 659,951 0.0018% 608,167 0 0.00%549
181 515 10928 Eagle Ins Co 8,454,958 0.0227% 7,208,506 6,707,453 93.05%376
182 108 36986 Eagle Pacific Ins Co 6,502,906 0.0175% 2,714,719 839,225 30.91%400
183 802 12890 Eagle West Ins Co 4,423,078 0.0119% 6,068,284 3,454,434 56.93%450
184 84 38580 Eden Park Ins Co 786 0.0000% 1,809 -95,980 -5305.69%622
185 57 21261 Electric Ins Co 12,668,899 0.0340% 12,386,690 9,442,241 76.23%319
186 62 21407 Emcasco Ins Co 68,260 0.0002% 75,649 -7,817 -10.33%584
187 212 21326 Empire Fire & Marine Ins Co 19,172,574 0.0515% 18,950,707 7,682,740 40.54%273
188 553 32794 Employee Benefits Ins Co 11,580 0.0000% 11,580 5,113,003 44153.74%606
189 44 20648 Employers Fire Ins Co 17,833,066 0.0479% 23,611,541 20,576,459 87.15%279
190 111 21458 Employers Ins Of Wausau Mut Co 66,283,998 0.1781% 65,481,312 41,332,603 63.12%106
191 62 21415 Employers Mut Cas Co 12,900,649 0.0347% 12,031,720 7,470,894 62.09%313
192 350 39845 Employers Reins Corp 40,021,590 0.1076% 39,668,303 61,419,047 154.83%165
California Department of Insurance Page 4 of 14 Rate Specialist Bureau - 07/10/2001
2000 CALIFORNIA P & C MARKET SHARE REPORT
Source: NAIC Database Licensed companies only
Rec # Group # Naic # Company Name
Sorted by Company Name
WrittenPremium
Market Share
EarnedPremium
IncurredLosses
LossRatio
Line of Business: TOTAL LINE [32]
ShareRank
193 20516 Euler American Credit Ind Co 12,532,991 0.0337% 12,622,744 8,693,542 68.87%320
194 1120 10120 Everest Natl Ins Co 82,363,472 0.2214% 33,642,715 13,380,980 39.77%90
195 212 10318 Exact Prop & Cas Co Inc 2,730,005 0.0073% 2,637,837 949,046 35.98%484
196 38 35181 Executive Risk Ind Inc 86,297,446 0.2319% 85,940,628 47,012,149 54.70%85
197 922 40029 Explorer Ins Co 125,162,504 0.3364% 125,085,247 106,657,240 85.27%56
198 65 21482 Factory Mut Ins Co 123,364,425 0.3316% 114,700,425 18,090,304 15.77%58
199 31 44784 Fairfield Ins Co 4,226,800 0.0114% 1,360,848 522,510 38.40%454
200 158 18864 Fairmont Ins Co 15,924,665 0.0428% 11,886,170 15,293,677 128.67%294
201 2 42633 Far West Ins Co 26,195,342 0.0704% 25,525,604 18,867,692 73.92%230
202 249 13846 Farmers Home Mut Ins Co 4,746,857 0.0128% 5,081,540 1,230,564 24.22%438
203 212 21652 Farmers Ins Exch 1,780,903,422 4.7864% 1,780,399,309 1,225,851,425 68.85%3
204 41 41483 Farmington Cas Co 53,379 0.0001% 31,411 -389,069 -1238.64%588
205 38 20281 Federal Ins Co 468,938,543 1.2603% 448,345,689 202,275,173 45.12%15
206 7 13935 Federated Mut Ins Co 44,010,925 0.1183% 41,928,130 37,707,336 89.93%156
207 11118 Federated Rural Electric Ins Corp 209,935 0.0006% 207,672 119,854 57.71%570
208 7 28304 Federated Service Ins Co 560,148 0.0015% 156,822 556,074 354.59%551
209 43460 FFG Ins Co 747,818 0.0020% 273,925 105,550 38.53%544
210 218 35270 Fidelity & Cas Co Of NY 31,108 0.0001% 1,121,649 4,510,385 402.12%598
211 212 39306 Fidelity & Deposit Co Of MD 80,525,774 0.2164% 68,004,683 16,665,716 24.51%92
212 164 35386 Fidelity & Guaranty Ins Co 48,686,997 0.1309% 45,798,641 46,967,334 102.55%143
213 164 25879 Fidelity & Guaranty Ins Underwriters 14,034,066 0.0377% 13,977,735 11,243,495 80.44%306
214 350 12815 Financial Guaranty Ins Co 9,399,255 0.0253% 4,031,948 0 0.00%369
215 215 19852 Financial Ind Co 68,744,671 0.1848% 64,130,714 29,669,462 46.26%104
216 31453 Financial Pacific Ins Co 53,023,718 0.1425% 52,678,132 23,437,558 44.49%134
217 194 18287 Financial Security Assur Inc 35,625,441 0.0957% 27,746,314 1,060 0.00%180
218 553 24880 Fire & Cas Ins Co Of CT 20,798,758 0.0559% 15,348,476 10,761,331 70.11%264
219 212 21660 Fire Ins Exch 765,849,731 2.0583% 747,255,484 492,715,281 65.94%10
220 761 21873 Firemans Fund Ins Co 484,301,948 1.3016% 456,121,650 289,888,951 63.56%13
221 761 21903 Firemans Fund Ins Co Of TX 24,274,603 0.0652% 23,718,255 12,362,028 52.12%244
222 218 20850 Firemens Ins Co Of Newark NJ 24,066,921 0.0647% 14,251,313 16,025,266 112.45%246
223 11150 First Amer Ins Co 17,303,711 0.0465% 7,987,837 5,569,212 69.72%284
224 37710 First American Prop & Cas Ins Co 7,074,728 0.0190% 7,754,821 1,886,811 24.33%390
225 34525 First American Specilaty Ins Co 14,997,050 0.0403% 14,576,740 6,726,900 46.15%300
226 689 16578 First Comm Ins Co 4,735,896 0.0127% 5,150,326 4,359,113 84.64%440
227 479 11177 First Financial Ins Co 30,251,885 0.0813% 33,291,380 28,378,195 85.24%208
228 111 33588 First Liberty Ins Corp 981,520 0.0026% 1,239,925 934,206 75.34%535
229 163 24724 First Natl Ins Co Of Amer 35,744,075 0.0961% 25,735,538 11,505,063 44.70%179
230 349 13978 Florists Mut Ins Co 6,754,818 0.0182% 6,355,040 3,065,645 48.24%394
231 1129 38776 Folksamerica Rein Co 5,802,526 0.0156% 3,974,924 1,395,074 35.10%412
232 212 11185 Foremost Ins Co 28,110,205 0.0755% 26,621,421 8,959,596 33.66%220
233 212 11800 Foremost Property & Cas Ins Co 6,070,757 0.0163% 5,962,957 2,899,533 48.63%406
234 790 37761 Fremont Compensation Ins Co 313,680,701 0.8431% 325,092,890 356,972,296 109.81%23
235 790 11207 Fremont Ind Co 15,089,361 0.0406% 13,762,698 31,482,022 228.75%299
236 790 21040 Fremont Industrial Ind Co 128,379,302 0.3450% 153,983,650 98,440,068 63.93%53
237 961 34266 Frontier Ins Co 34,718,177 0.0933% 49,033,873 57,617,099 117.50%186
238 961 42250 Frontier Pacific Ins Co 34,988,214 0.0940% 37,699,723 23,767,810 63.05%184
239 218 10201 Galway Ins Co 22,915,100 0.0616% 24,054,693 12,380,195 51.47%253
240 350 22225 Ge Auto & Home Assur Co 1,212,217 0.0033% 781,182 540,357 69.17%527
California Department of Insurance Page 5 of 14 Rate Specialist Bureau - 07/10/2001
2000 CALIFORNIA P & C MARKET SHARE REPORT
Source: NAIC Database Licensed companies only
Rec # Group # Naic # Company Name
Sorted by Company Name
WrittenPremium
Market Share
EarnedPremium
IncurredLosses
LossRatio
Line of Business: TOTAL LINE [32]
ShareRank
241 350 29823 Ge Residential Mortgage Ins Corp NC 97,390 0.0003% 138,351 -155,917 -112.70%581
242 31 41491 Geico Cas Co 27,431,667 0.0737% 25,906,874 16,832,954 64.97%223
243 31 35882 Geico General Ins Co 172,131,113 0.4626% 162,725,103 130,008,759 79.89%37
244 31 22055 Geico Ind Co 38,173,325 0.1026% 34,020,183 30,168,108 88.68%169
245 350 16675 Gen Elec Mortgage Ins Corp Of NC 2,866 0.0000% 3,652 -5,998 -164.24%618
246 44 21962 General Accident Ins Co 67,412,037 0.1812% 73,520,411 57,982,835 78.87%105
247 400 24414 General Cas Co Of WI 35,053 0.0001% 33,615 -878 -2.61%596
248 350 38458 General Electric Mortgage Ins Corp 74,021,593 0.1989% 75,797,378 -2,296,736 -3.03%99
249 163 24732 General Ins Co Of Amer 64,790,471 0.1741% 59,745,439 33,611,624 56.26%110
250 31 22039 General Rein Corp 820,249 0.0022% 812,806 28,397,557 3493.77%541
251 749 16063 General Security Ins Co 35,424,455 0.0952% 30,679,666 24,004,558 78.24%182
252 31 11967 General Star Natl Ins Co 11,208,332 0.0301% 10,436,495 4,239,584 40.62%340
253 1169 11231 Generali Us Branch 35,894,632 0.0965% 42,199,507 22,413,205 53.11%177
254 31 38962 Genesis Ins Co 28,701,456 0.0771% 22,367,738 17,223,229 77.00%212
255 164 10799 Geovera Ins Co 51,059,844 0.1372% 47,215,347 0 0.00%139
256 604 41343 Gerling Amer Ins Co 10,277,365 0.0276% 14,932,734 15,453,661 103.49%352
257 218 34622 Glens Falls Ins Co 231 0.0000% -8,104,280 396,151 -4.89%626
258 11304 Global Surety & Ins Co 60,951 0.0002% 50,042 0 0.00%586
259 553 24600 Globe Ind Co 9,454,878 0.0254% 9,081,103 23,567,064 259.52%366
260 39861 Golden Bear Ins Co 9,664,537 0.0260% 8,867,375 1,199,828 13.53%363
261 111 10836 Golden Eagle Ins Corp 382,165,760 1.0271% 335,643,737 236,406,229 70.43%17
262 31 22063 Government Employees Ins Co 113,450,580 0.3049% 110,893,091 83,936,359 75.69%63
263 83 22101 Grange Ins Assn 24,208,713 0.0651% 23,687,398 14,368,908 60.66%245
264 12 23809 Granite State Ins Co 50,146,922 0.1348% 39,975,385 44,913,938 112.35%141
265 201 25984 Graphic Arts Mut Ins Co 402,802 0.0011% 392,386 1,394,147 355.30%559
266 84 26832 Great American Alliance Ins Co 37,038,165 0.0995% 37,924,436 25,514,842 67.28%174
267 84 26344 Great American Assur Co 64,942,438 0.1745% 52,842,330 7,401,719 14.01%109
268 84 16691 Great American Ins Co 66,070,004 0.1776% 61,331,567 25,546,938 41.65%107
269 84 22136 Great American Ins Co of NY 66,006,626 0.1774% 63,022,564 17,428,621 27.65%108
270 98 25224 Great Divide Ins Co 8,868,896 0.0238% 8,566,769 4,724,580 55.15%372
271 38 20303 Great Northern Ins Co 21,182,824 0.0569% 20,038,281 11,956,159 59.67%263
272 1264 33529 Great States Ins Co 474,181 0.0013% 475,229 361,925 76.16%554
273 150 11371 Great West Cas Co 6,479,835 0.0174% 6,321,478 2,635,721 41.69%401
274 1285 22322 Greenwich Ins Co 118,606,354 0.3188% 93,510,931 53,274,759 56.97%59
275 553 40541 Grocers Ins Co 10,513,247 0.0283% 9,333,788 4,708,738 50.45%348
276 553 26948 Guaranty Natl Ins Co Of CT 7,570,688 0.0203% 7,204,811 5,067,105 70.33%387
277 303 15032 Guideone Mut Ins Co 32,773,947 0.0881% 29,043,787 17,372,257 59.81%194
278 303 14559 Guideone Specialty Mut Ins Co 25,273,568 0.0679% 20,774,640 15,151,842 72.93%238
279 41 22217 Gulf Ins Co 105,934,876 0.2847% 94,855,744 33,806,318 35.64%65
280 88 22292 Hanover Ins Co 11,790,599 0.0317% 9,895,796 25,868,741 261.41%331
281 517 21806 Harbor Specialty Ins Co 239,768 0.0006% 692,309 1,410,067 203.68%569
282 26433 Harco Natl Ins Co 4,546,147 0.0122% 4,864,037 2,855,741 58.71%445
283 253 14168 Harleysville Mut Ins Co 31,096,599 0.0836% 42,697,115 50,593,106 118.49%203
284 91 22357 Hartford Accid & Ind Co 9,370,774 0.0252% 9,279,529 -1,317,913 -14.20%370
285 91 29424 Hartford Cas Ins Co 236,757,325 0.6363% 218,328,500 115,945,597 53.11%29
286 91 19682 Hartford Fire In Co 175,084,976 0.4706% 174,006,312 80,813,621 46.44%36
287 91 37478 Hartford Ins Co Of The Midwest 61,230,933 0.1646% 58,543,116 33,802,252 57.74%118
288 12 11452 Hartford Steam Boil Inspec & Ins Co 12,428,576 0.0334% 24,211,742 8,086,863 33.40%323
California Department of Insurance Page 6 of 14 Rate Specialist Bureau - 07/10/2001
2000 CALIFORNIA P & C MARKET SHARE REPORT
Source: NAIC Database Licensed companies only
Rec # Group # Naic # Company Name
Sorted by Company Name
WrittenPremium
Market Share
EarnedPremium
IncurredLosses
LossRatio
Line of Business: TOTAL LINE [32]
ShareRank
289 91 30104 Hartford Underwriters Ins Co 142,300,886 0.3825% 138,086,178 85,373,407 61.83%44
290 958 22438 Hawaiian Ins & Gty Co Ltd 2,746,288 0.0074% 3,677,610 1,396,560 37.97%483
291 1222 10080 Health Providers Mut Ins Co Inc RRG 20,137 0.0001% 20,137 522,588 2595.16%599
292 350 39527 Heritage Ind Co 3,290,079 0.0088% 8,895,151 13,909,366 156.37%472
293 1116 22489 Highlands Ins Co 4,306,429 0.0116% 3,186,378 4,046,026 126.98%452
294 1116 22497 Highlands Underwriters Ins Co 31,587 0.0001% 32,647 1,334,360 4087.24%597
295 1264 20656 HIH America Comp & Liab Ins Co 114,430,892 0.3075% 113,467,831 149,380,138 131.65%61
296 1293 11005 Homesite Ins Co Of CA 155,465 0.0004% 22,574 14,000 62.02%572
297 300 22578 Horace Mann Ins Co 13,472,768 0.0362% 13,020,506 8,472,361 65.07%310
298 300 22756 Horace Mann Prop & Cas Ins Co 20,536,441 0.0552% 20,820,975 11,985,028 57.56%266
299 158 25054 Hudson Ins Co 16,095,388 0.0433% 13,288,716 11,605,885 87.34%292
300 10048 Hyundai Marine & Fire Ins Co Ltd 1,102,072 0.0030% 946,317 206,293 21.80%532
301 75 25550 Indemnity Co Of CA 3,765,450 0.0101% 3,989,226 426,552 10.69%464
302 626 43575 Indemnity Ins Co Of North Amer 38,349,680 0.1031% 43,542,069 46,367,694 106.49%168
303 246 14265 Indiana Lumbermens Mut Ins Co 5,657 0.0000% 34,340 -3,556 -10.36%614
304 84 22268 Infinity Ins Co 167,984,135 0.4515% 161,420,901 102,052,087 63.22%38
305 181 10068 Infinity Natl Ins Co 28,294,716 0.0760% 24,274,321 21,279,393 87.66%219
306 84 20260 Infinity Select Ins Co 7,833,261 0.0211% 7,383,000 4,654,219 63.04%380
307 626 22713 Insurance Co Of North Amer 45,049,311 0.1211% 42,550,093 27,933,055 65.65%150
308 12 19429 Insurance Co Of The State Of PA 112,234,231 0.3016% 96,802,260 63,854,938 65.96%64
309 922 27847 Insurance Co Of The West 51,745,766 0.1391% 51,686,791 18,008,737 34.84%136
310 517 37257 Insurance Corp Of Hannover 11,879,584 0.0319% 7,465,780 5,020,688 67.25%329
311 1314 18341 Insurance Corp Of NY 53,093,484 0.1427% 45,786,937 25,164,774 54.96%133
312 79 29742 Integon Natl Ins Co 7,808,425 0.0210% 8,496,723 7,897,848 92.95%381
313 79 31488 Integon Preferred Ins Co 8,151,352 0.0219% 4,285,781 2,933,710 68.45%379
314 1318 15598 Interins Exch Of The Automobile Club 1,312,564,560 3.5277% 1,286,261,609 829,706,974 64.51%5
315 150 24139 International Bus & Merc Reassur Co 1,427,195 0.0038% 1,493,530 296,277 19.84%517
316 11592 International Fidelity Ins Co 1,484,572 0.0040% 1,636,910 13,591 0.83%512
317 761 22837 Interstate Ind Co 9,913,421 0.0266% 8,089,511 1,249,881 15.45%360
318 268 10952 JC Penney Cas Ins Co 5,079,585 0.0137% 5,079,558 427,189 8.41%429
319 761 11630 Jefferson Ins Co 10,990,838 0.0295% 10,266,088 7,295,673 71.07%342
320 14354 Jewelers Mut Ins Co 4,894,094 0.0132% 4,970,237 1,909,600 38.42%434
321 218 20885 Kansas City Fire & Marine Ins Co 10,184 0.0000% 57,851 2,011,001 3476.17%609
322 108 10915 Kemper Auto & Home Ins Co 6,721,627 0.0181% 2,055,536 1,479,099 71.96%395
323 108 27138 Kemper Cas Ins Co 3,814,583 0.0103% 3,814,583 217,643 5.71%462
324 108 15563 Kemper Employers Ins Co 11,865,457 0.0319% 4,826,882 3,095,238 64.12%330
325 108 40991 Kemper Ind Ins Co 1,906,508 0.0051% 955,222 1,258,938 131.80%502
326 26077 Lancer Ins Co 18,135,137 0.0487% 18,750,400 20,068,556 107.03%278
327 12 35637 Landmark Ins Co 9,361 0.0000% 321,881 9,049,982 2811.59%610
328 36706 Lawyers Mut Ins Co 23,586,596 0.0634% 25,461,488 10,004,975 39.29%248
329 84 11738 Leader Ins Co 25,355,353 0.0681% 29,030,102 20,637,406 71.09%237
330 1172 24422 Legion Ins Co 315,015,306 0.8466% 278,213,886 134,879,564 48.48%22
331 37940 Lexington Natl Ins Corp 16,494 0.0000% 36,800 0 0.00%602
332 37800 Lg Ins Co Ltd Us Branch 1,285,995 0.0035% 1,414,855 1,151,874 81.41%524
333 111 42404 Liberty Ins Corp 51,542,600 0.1385% 59,132,882 112,552,326 190.34%137
334 111 19917 Liberty Ins Underwriters Inc 1,936,659 0.0052% 1,998,093 1,254,452 62.78%500
335 111 23035 Liberty Mut Fire Ins Co 329,630,880 0.8859% 338,875,669 458,541,579 135.31%20
336 111 23043 Liberty Mut Ins Co 57,170,977 0.1537% 52,812,977 79,575,587 150.67%128
California Department of Insurance Page 7 of 14 Rate Specialist Bureau - 07/10/2001
2000 CALIFORNIA P & C MARKET SHARE REPORT
Source: NAIC Database Licensed companies only
Rec # Group # Naic # Company Name
Sorted by Company Name
WrittenPremium
Market Share
EarnedPremium
IncurredLosses
LossRatio
Line of Business: TOTAL LINE [32]
ShareRank
337 20 38830 Lincoln Natl Hlth & Cas Ins Co 681,906 0.0018% 677,861 480,893 70.94%547
338 111 33600 LM Ins Corp 2,238,652 0.0060% 2,714,650 2,379,914 87.67%494
339 946 14435 Lumber Mut Ins Co 5,954,206 0.0160% 9,814,033 8,380,347 85.39%407
340 108 22977 Lumbermens Mut Cas Co 155,130,368 0.4169% 139,032,434 111,795,121 80.41%40
341 23108 Lumbermens Underwriting Alliance 13,063,538 0.0351% 12,487,725 9,414,769 75.39%312
342 458 35769 Lyndon Property Ins Co 7,586,229 0.0204% 4,361,696 3,282,715 75.26%386
343 42269 Majestic Ins Co 43,267,799 0.1163% 48,502,341 29,036,943 59.87%159
344 23876 Mapfre Reins Corp 8,554,509 0.0230% 8,713,006 2,686,949 30.84%375
345 155 37605 Marathon Ins Co 131,979,012 0.3547% 155,258,403 111,506,184 71.82%52
346 553 29998 Marine Ind Ins Co Of Amer 46,760 0.0001% 15,629 1,538 9.84%591
347 785 28932 Markel American Ins Co 15,842,613 0.0426% 14,348,038 11,581,859 80.72%295
348 785 38970 Markel Ins Co 12,190,619 0.0328% 9,585,474 5,390,698 56.24%325
349 212 19356 Maryland Cas Co 22,858,331 0.0614% 22,593,922 -1,903,446 -8.42%254
350 88 22306 Massachusetts Bay Ins Co 6,619,215 0.0178% 8,382,508 18,840,624 224.76%398
351 218 22152 Mayflower Ins Co Ltd 39 0.0000% 31 479,994548367.74%632
352 528 12041 MBIA Ins Corp 44,871,825 0.1206% 27,742,987 0 0.00%151
353 608 32433 Medical Ins Exch Of CA 25,748,480 0.0692% 28,847,867 10,367,387 35.94%233
354 350 11843 Medical Protective Co 5,094,031 0.0137% 3,128,169 1,318,408 42.15%427
355 1113 22241 Medmarc Cas Ins Co 10,097,497 0.0271% 9,228,764 7,568,950 82.01%356
356 923 33650 Mendota Ins Co 2,552 0.0000% 608 21 3.45%619
357 304 31968 Merastar Ins Co 371,994 0.0010% 287,200 214,163 74.57%560
358 15768 Merced Mut Ins Co 5,256,297 0.0141% 5,102,346 2,728,442 53.47%423
359 14494 Merchants Bonding Co (Mutual) 2,224,783 0.0060% 2,182,473 90,101 4.13%495
360 660 11908 Mercury Cas Co 353,068,772 0.9489% 342,953,349 208,036,923 60.66%19
361 660 27553 Mercury Ins Co Of CA 738,552,378 1.9850% 741,827,376 432,137,532 58.25%11
362 1330 24821 Meritplan Ins Co 4,958,046 0.0133% 4,330,376 1,435,921 33.16%432
363 241 25321 Metropolitan Drt Prop & Cas Ins Co 17,012,750 0.0457% 15,608,462 8,372,973 53.64%287
364 852 40150 MGA Ins Co Inc 4,699,694 0.0126% 2,298,182 872,417 37.96%441
365 105 10682 MGIC Credit Assur Corp 3,625,230 0.0097% 3,625,230 3,446,429 95.07%466
366 79 38660 MIC General Ins Corp 10,326,269 0.0278% 10,255,541 4,779,814 46.61%351
367 79 38601 MIC Prop & Cas Ins Corp 2,491,987 0.0067% 4,712,317 3,564,884 75.65%489
368 14508 Michigan Millers Mut Ins Co 6,715,426 0.0180% 6,678,095 2,160,957 32.36%396
369 212 21687 Mid-Century Ins Co 316,424,707 0.8504% 319,916,142 290,878,424 90.92%21
370 36650 Mid-State Surety Corp 111,579 0.0003% 50,263 6,747 13.42%579
371 169 23434 Middlesex Ins Co 1,690,367 0.0045% 1,625,753 796,047 48.96%506
372 98 23612 Midwest Employers Cas Co 447,570 0.0012% 284,348 -553,363 -194.61%557
373 303 10920 Millennium Ins Co 6,517,274 0.0175% 5,411,740 3,703,215 68.43%399
374 130 23531 Millers Ins Co 17,545,393 0.0472% 17,836,424 11,137,049 62.44%281
375 22551 Mitsui Marine & Fire Ins Co 1,289,821 0.0035% 1,247,889 27,261 2.18%522
376 227 23655 Modern Service Ins Co 11,614,341 0.0312% 11,395,330 8,774,770 77.00%334
377 802 23540 Monterey Ins Co 3,929,894 0.0106% 2,899,465 1,800,780 62.11%458
378 350 32077 Montgomery Ward Ins Co 193 0.0000% 193 49,195 25489.64%627
379 468 31232 Monumental General Cas Co 4,737,712 0.0127% 4,151,630 3,776,577 90.97%439
380 105 29858 Mortgage Guaranty Ins Corp 101,771,817 0.2735% 101,413,381 45,847,202 45.21%69
381 79 22012 Motors Ins Corp 5,121,060 0.0138% 4,268,705 1,030,303 24.14%425
382 10002 Municipal Mut Ins Co 1,927,780 0.0052% 1,849,530 1,071,566 57.94%501
383 364 31119 Mutual Protective Ins Co 1,187,426 0.0032% 1,155,760 479,795 41.51%528
384 227 23647 Mutual Service Cas Ins Co 54,292,356 0.1459% 62,528,445 88,453,938 141.46%131
California Department of Insurance Page 8 of 14 Rate Specialist Bureau - 07/10/2001
2000 CALIFORNIA P & C MARKET SHARE REPORT
Source: NAIC Database Licensed companies only
Rec # Group # Naic # Company Name
Sorted by Company Name
WrittenPremium
Market Share
EarnedPremium
IncurredLosses
LossRatio
Line of Business: TOTAL LINE [32]
ShareRank
385 30945 National Alliance Ins Co 15,274,644 0.0411% 15,375,536 8,208,645 53.39%298
386 23663 National American Ins Co 1,652,986 0.0044% 2,024,009 3,495,818 172.72%508
387 930 23671 National American Ins Co Of CA 35,451,133 0.0953% 31,491,487 31,070,004 98.66%181
388 23701 National Automobile & Cas Ins Co 24,782,268 0.0666% 23,629,423 16,473,318 69.72%243
389 140 11991 National Cas Co 16,753,961 0.0450% 15,989,853 7,474,371 46.74%291
390 155 10243 National Continental Ins Co 5,897,923 0.0159% 5,832,322 6,677,140 114.49%409
391 44 16217 National Farmers Union Prop & Cas 1,298,132 0.0035% 1,067,866 1,504,472 140.89%521
392 44 23752 National Farmers Union Std Ins Co 1,680,053 0.0045% 1,534,002 642,362 41.87%507
393 218 20478 National Fire Ins Co Of Hartford 60,427,545 0.1624% 51,268,816 28,531,808 55.65%121
394 79 23728 National General Ins Co 98,244,316 0.2640% 99,573,838 55,652,402 55.89%72
395 31 20087 National Ind Co 8,316 0.0000% -147,379 -191,532 129.96%612
396 84 32620 National Interstate Ins Co 4,830,101 0.0130% 3,649,329 1,871,394 51.28%436
397 31 20052 National Liab & Fire Ins Co 2,939,576 0.0079% 2,727,638 687,228 25.19%479
398 761 21881 National Surety Corp 93,312,528 0.2508% 104,817,164 59,788,426 57.04%76
399 12 19445 National Union Fire Ins Co Of Pitts 527,960,935 1.4190% 486,478,234 410,581,964 84.40%12
400 140 28223 Nationwide Agribusiness Ins Co 1,322,522 0.0036% 668,580 184,395 27.58%520
401 140 10723 Nationwide Assur Co 37,989 0.0001% -20,586 17,179 -83.45%595
402 140 23779 Nationwide Mut Fire Ins Co 26,731,123 0.0718% 25,406,147 13,998,983 55.10%228
403 140 23787 Nationwide Mut Ins Co 123,595,639 0.3322% 118,859,586 93,356,157 78.54%57
404 140 37877 Nationwide Prop & Cas Ins Co 5,941,508 0.0160% 4,336,459 3,748,239 86.44%408
405 510 42307 Navigators Ins Co 29,145,725 0.0783% 24,853,628 12,665,834 50.96%211
406 15865 NCMIC Ins Co 5,665,002 0.0152% 5,737,017 1,868,952 32.58%417
407 212 10317 Neighborhood Spirit Prop & Cas Co 12,745,120 0.0343% 12,439,665 5,634,599 45.30%317
408 111 24171 Netherlands Ins Co The 100 0.0000% 21 25,000119047.62%628
409 12 23841 New Hampshire Ins Co 17,076,851 0.0459% 13,245,557 30,069,428 227.02%286
410 256 16608 New York Marine & Gnrl Ins Co 3,477,180 0.0093% 3,408,868 -678,833 -19.91%470
411 1330 24848 Newport Ins Co 32,424,042 0.0871% 21,903,411 8,459,183 38.62%198
412 218 35106 Niagara Fire Ins Co 21,596,435 0.0580% 21,596,435 19,122,934 88.55%262
413 32301 Nichido Fire & Marine Ins Co Ltd 1,867,000 0.0050% 2,039,775 -4,567,000 -223.90%503
414 2558 27073 Nipponkoa Ins Co Ltd 5,703,200 0.0153% 5,673,151 3,799,606 66.98%415
415 38997 Nissan Fire & Marine Ins Co Us Br 3,537,896 0.0095% 3,537,896 1,257,942 35.56%468
416 1331 10340 Nobel Ins Co 41,990 0.0001% 43,350 4,155,848 9586.73%594
417 1282 33200 Norcal Mut Ins Co 127,005,679 0.3413% 128,625,943 58,765,151 45.69%54
418 181 29874 North American Specialty Ins Co 33,390,922 0.0897% 26,162,797 24,378,463 93.18%191
419 885 27740 North Pointe Ins Co 4,870,116 0.0131% 2,878,359 3,158,870 109.75%435
420 158 21105 North River Ins Co 5,381,153 0.0145% 5,632,947 5,940,439 105.46%422
421 164 36455 Northbrook Ind Co 15,697 0.0000% 15,697 -321,163 -2046.02%604
422 164 19224 Northbrook Prop & Cas Ins Co 66,572 0.0002% 67,053 -11,854,221 -17678.88%585
423 44 38369 Northern Assur Co Of Amer 6,356,466 0.0171% 4,870,671 374,746 7.69%403
424 212 19372 Northern Ins Co Of NY 61,130,121 0.1643% 53,564,984 46,671,354 87.13%119
425 41 24031 Northland Cas Co 1,325,801 0.0036% 1,365,242 393,999 28.86%519
426 41 24015 Northland Ins Co 26,174,653 0.0703% 23,350,641 14,361,560 61.50%231
427 43583 Northwest Physicians Mut Ins Co 4,156,078 0.0112% 3,477,071 1,800,326 51.78%455
428 1116 23906 Northwestern Natl Cas Co 912,823 0.0025% 414,703 86,494 20.86%537
429 143 23914 Northwestern Ntl Ins Co Milwaukee 262,041 0.0007% 347,601 1,113,310 320.28%566
430 38 20338 Northwestern Pacific Ind Co 17,511,159 0.0471% 19,670,019 19,351,148 98.38%282
431 31 34630 Oak River Ins Co 722,067 0.0019% 762,166 428,418 56.21%545
432 26565 Ohio Ind Co 1,467,610 0.0039% 1,464,037 7,076 0.48%514
California Department of Insurance Page 9 of 14 Rate Specialist Bureau - 07/10/2001
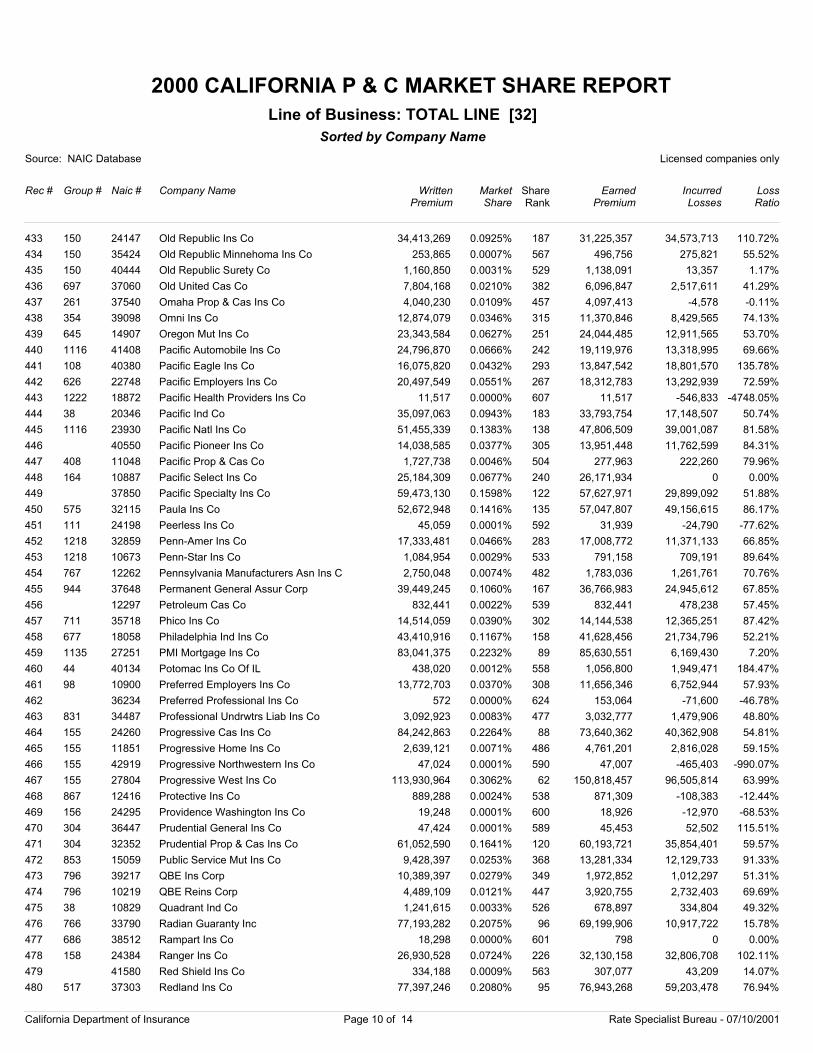
2000 CALIFORNIA P & C MARKET SHARE REPORT
Source: NAIC Database Licensed companies only
Rec # Group # Naic # Company Name
Sorted by Company Name
WrittenPremium
Market Share
EarnedPremium
IncurredLosses
LossRatio
Line of Business: TOTAL LINE [32]
ShareRank
433 150 24147 Old Republic Ins Co 34,413,269 0.0925% 31,225,357 34,573,713 110.72%187
434 150 35424 Old Republic Minnehoma Ins Co 253,865 0.0007% 496,756 275,821 55.52%567
435 150 40444 Old Republic Surety Co 1,160,850 0.0031% 1,138,091 13,357 1.17%529
436 697 37060 Old United Cas Co 7,804,168 0.0210% 6,096,847 2,517,611 41.29%382
437 261 37540 Omaha Prop & Cas Ins Co 4,040,230 0.0109% 4,097,413 -4,578 -0.11%457
438 354 39098 Omni Ins Co 12,874,079 0.0346% 11,370,846 8,429,565 74.13%315
439 645 14907 Oregon Mut Ins Co 23,343,584 0.0627% 24,044,485 12,911,565 53.70%251
440 1116 41408 Pacific Automobile Ins Co 24,796,870 0.0666% 19,119,976 13,318,995 69.66%242
441 108 40380 Pacific Eagle Ins Co 16,075,820 0.0432% 13,847,542 18,801,570 135.78%293
442 626 22748 Pacific Employers Ins Co 20,497,549 0.0551% 18,312,783 13,292,939 72.59%267
443 1222 18872 Pacific Health Providers Ins Co 11,517 0.0000% 11,517 -546,833 -4748.05%607
444 38 20346 Pacific Ind Co 35,097,063 0.0943% 33,793,754 17,148,507 50.74%183
445 1116 23930 Pacific Natl Ins Co 51,455,339 0.1383% 47,806,509 39,001,087 81.58%138
446 40550 Pacific Pioneer Ins Co 14,038,585 0.0377% 13,951,448 11,762,599 84.31%305
447 408 11048 Pacific Prop & Cas Co 1,727,738 0.0046% 277,963 222,260 79.96%504
448 164 10887 Pacific Select Ins Co 25,184,309 0.0677% 26,171,934 0 0.00%240
449 37850 Pacific Specialty Ins Co 59,473,130 0.1598% 57,627,971 29,899,092 51.88%122
450 575 32115 Paula Ins Co 52,672,948 0.1416% 57,047,807 49,156,615 86.17%135
451 111 24198 Peerless Ins Co 45,059 0.0001% 31,939 -24,790 -77.62%592
452 1218 32859 Penn-Amer Ins Co 17,333,481 0.0466% 17,008,772 11,371,133 66.85%283
453 1218 10673 Penn-Star Ins Co 1,084,954 0.0029% 791,158 709,191 89.64%533
454 767 12262 Pennsylvania Manufacturers Asn Ins C 2,750,048 0.0074% 1,783,036 1,261,761 70.76%482
455 944 37648 Permanent General Assur Corp 39,449,245 0.1060% 36,766,983 24,945,612 67.85%167
456 12297 Petroleum Cas Co 832,441 0.0022% 832,441 478,238 57.45%539
457 711 35718 Phico Ins Co 14,514,059 0.0390% 14,144,538 12,365,251 87.42%302
458 677 18058 Philadelphia Ind Ins Co 43,410,916 0.1167% 41,628,456 21,734,796 52.21%158
459 1135 27251 PMI Mortgage Ins Co 83,041,375 0.2232% 85,630,551 6,169,430 7.20%89
460 44 40134 Potomac Ins Co Of IL 438,020 0.0012% 1,056,800 1,949,471 184.47%558
461 98 10900 Preferred Employers Ins Co 13,772,703 0.0370% 11,656,346 6,752,944 57.93%308
462 36234 Preferred Professional Ins Co 572 0.0000% 153,064 -71,600 -46.78%624
463 831 34487 Professional Undrwtrs Liab Ins Co 3,092,923 0.0083% 3,032,777 1,479,906 48.80%477
464 155 24260 Progressive Cas Ins Co 84,242,863 0.2264% 73,640,362 40,362,908 54.81%88
465 155 11851 Progressive Home Ins Co 2,639,121 0.0071% 4,761,201 2,816,028 59.15%486
466 155 42919 Progressive Northwestern Ins Co 47,024 0.0001% 47,007 -465,403 -990.07%590
467 155 27804 Progressive West Ins Co 113,930,964 0.3062% 150,818,457 96,505,814 63.99%62
468 867 12416 Protective Ins Co 889,288 0.0024% 871,309 -108,383 -12.44%538
469 156 24295 Providence Washington Ins Co 19,248 0.0001% 18,926 -12,970 -68.53%600
470 304 36447 Prudential General Ins Co 47,424 0.0001% 45,453 52,502 115.51%589
471 304 32352 Prudential Prop & Cas Ins Co 61,052,590 0.1641% 60,193,721 35,854,401 59.57%120
472 853 15059 Public Service Mut Ins Co 9,428,397 0.0253% 13,281,334 12,129,733 91.33%368
473 796 39217 QBE Ins Corp 10,389,397 0.0279% 1,972,852 1,012,297 51.31%349
474 796 10219 QBE Reins Corp 4,489,109 0.0121% 3,920,755 2,732,403 69.69%447
475 38 10829 Quadrant Ind Co 1,241,615 0.0033% 678,897 334,804 49.32%526
476 766 33790 Radian Guaranty Inc 77,193,282 0.2075% 69,199,906 10,917,722 15.78%96
477 686 38512 Rampart Ins Co 18,298 0.0000% 798 0 0.00%601
478 158 24384 Ranger Ins Co 26,930,528 0.0724% 32,130,158 32,806,708 102.11%226
479 41580 Red Shield Ins Co 334,188 0.0009% 307,077 43,209 14.07%563
480 517 37303 Redland Ins Co 77,397,246 0.2080% 76,943,268 59,203,478 76.94%95
California Department of Insurance Page 10 of 14 Rate Specialist Bureau - 07/10/2001
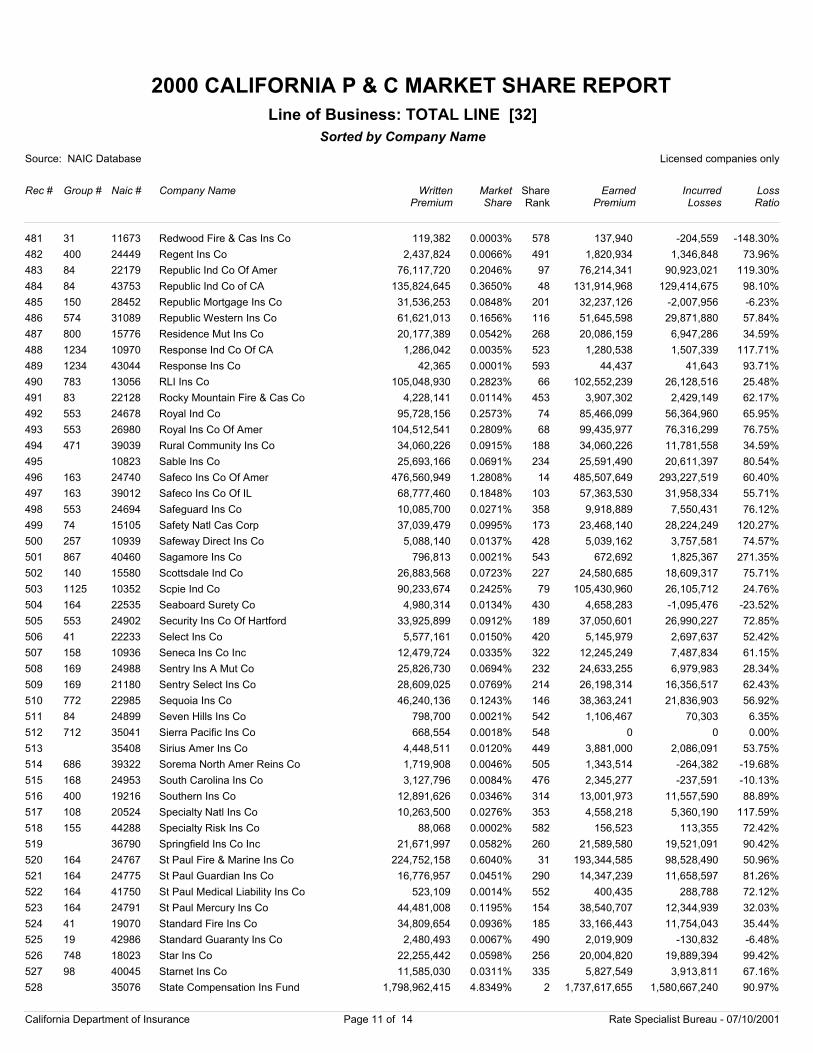
2000 CALIFORNIA P & C MARKET SHARE REPORT
Source: NAIC Database Licensed companies only
Rec # Group # Naic # Company Name
Sorted by Company Name
WrittenPremium
Market Share
EarnedPremium
IncurredLosses
LossRatio
Line of Business: TOTAL LINE [32]
ShareRank
481 31 11673 Redwood Fire & Cas Ins Co 119,382 0.0003% 137,940 -204,559 -148.30%578
482 400 24449 Regent Ins Co 2,437,824 0.0066% 1,820,934 1,346,848 73.96%491
483 84 22179 Republic Ind Co Of Amer 76,117,720 0.2046% 76,214,341 90,923,021 119.30%97
484 84 43753 Republic Ind Co of CA 135,824,645 0.3650% 131,914,968 129,414,675 98.10%48
485 150 28452 Republic Mortgage Ins Co 31,536,253 0.0848% 32,237,126 -2,007,956 -6.23%201
486 574 31089 Republic Western Ins Co 61,621,013 0.1656% 51,645,598 29,871,880 57.84%116
487 800 15776 Residence Mut Ins Co 20,177,389 0.0542% 20,086,159 6,947,286 34.59%268
488 1234 10970 Response Ind Co Of CA 1,286,042 0.0035% 1,280,538 1,507,339 117.71%523
489 1234 43044 Response Ins Co 42,365 0.0001% 44,437 41,643 93.71%593
490 783 13056 RLI Ins Co 105,048,930 0.2823% 102,552,239 26,128,516 25.48%66
491 83 22128 Rocky Mountain Fire & Cas Co 4,228,141 0.0114% 3,907,302 2,429,149 62.17%453
492 553 24678 Royal Ind Co 95,728,156 0.2573% 85,466,099 56,364,960 65.95%74
493 553 26980 Royal Ins Co Of Amer 104,512,541 0.2809% 99,435,977 76,316,299 76.75%68
494 471 39039 Rural Community Ins Co 34,060,226 0.0915% 34,060,226 11,781,558 34.59%188
495 10823 Sable Ins Co 25,693,166 0.0691% 25,591,490 20,611,397 80.54%234
496 163 24740 Safeco Ins Co Of Amer 476,560,949 1.2808% 485,507,649 293,227,519 60.40%14
497 163 39012 Safeco Ins Co Of IL 68,777,460 0.1848% 57,363,530 31,958,334 55.71%103
498 553 24694 Safeguard Ins Co 10,085,700 0.0271% 9,918,889 7,550,431 76.12%358
499 74 15105 Safety Natl Cas Corp 37,039,479 0.0995% 23,468,140 28,224,249 120.27%173
500 257 10939 Safeway Direct Ins Co 5,088,140 0.0137% 5,039,162 3,757,581 74.57%428
501 867 40460 Sagamore Ins Co 796,813 0.0021% 672,692 1,825,367 271.35%543
502 140 15580 Scottsdale Ind Co 26,883,568 0.0723% 24,580,685 18,609,317 75.71%227
503 1125 10352 Scpie Ind Co 90,233,674 0.2425% 105,430,960 26,105,712 24.76%79
504 164 22535 Seaboard Surety Co 4,980,314 0.0134% 4,658,283 -1,095,476 -23.52%430
505 553 24902 Security Ins Co Of Hartford 33,925,899 0.0912% 37,050,601 26,990,227 72.85%189
506 41 22233 Select Ins Co 5,577,161 0.0150% 5,145,979 2,697,637 52.42%420
507 158 10936 Seneca Ins Co Inc 12,479,724 0.0335% 12,245,249 7,487,834 61.15%322
508 169 24988 Sentry Ins A Mut Co 25,826,730 0.0694% 24,633,255 6,979,983 28.34%232
509 169 21180 Sentry Select Ins Co 28,609,025 0.0769% 26,198,314 16,356,517 62.43%214
510 772 22985 Sequoia Ins Co 46,240,136 0.1243% 38,363,241 21,836,903 56.92%146
511 84 24899 Seven Hills Ins Co 798,700 0.0021% 1,106,467 70,303 6.35%542
512 712 35041 Sierra Pacific Ins Co 668,554 0.0018% 0 0 0.00%548
513 35408 Sirius Amer Ins Co 4,448,511 0.0120% 3,881,000 2,086,091 53.75%449
514 686 39322 Sorema North Amer Reins Co 1,719,908 0.0046% 1,343,514 -264,382 -19.68%505
515 168 24953 South Carolina Ins Co 3,127,796 0.0084% 2,345,277 -237,591 -10.13%476
516 400 19216 Southern Ins Co 12,891,626 0.0346% 13,001,973 11,557,590 88.89%314
517 108 20524 Specialty Natl Ins Co 10,263,500 0.0276% 4,558,218 5,360,190 117.59%353
518 155 44288 Specialty Risk Ins Co 88,068 0.0002% 156,523 113,355 72.42%582
519 36790 Springfield Ins Co Inc 21,671,997 0.0582% 21,589,580 19,521,091 90.42%260
520 164 24767 St Paul Fire & Marine Ins Co 224,752,158 0.6040% 193,344,585 98,528,490 50.96%31
521 164 24775 St Paul Guardian Ins Co 16,776,957 0.0451% 14,347,239 11,658,597 81.26%290
522 164 41750 St Paul Medical Liability Ins Co 523,109 0.0014% 400,435 288,788 72.12%552
523 164 24791 St Paul Mercury Ins Co 44,481,008 0.1195% 38,540,707 12,344,939 32.03%154
524 41 19070 Standard Fire Ins Co 34,809,654 0.0936% 33,166,443 11,754,043 35.44%185
525 19 42986 Standard Guaranty Ins Co 2,480,493 0.0067% 2,019,909 -130,832 -6.48%490
526 748 18023 Star Ins Co 22,255,442 0.0598% 20,004,820 19,889,394 99.42%256
527 98 40045 Starnet Ins Co 11,585,030 0.0311% 5,827,549 3,913,811 67.16%335
528 35076 State Compensation Ins Fund 1,798,962,415 4.8349% 1,737,617,655 1,580,667,240 90.97%2
California Department of Insurance Page 11 of 14 Rate Specialist Bureau - 07/10/2001
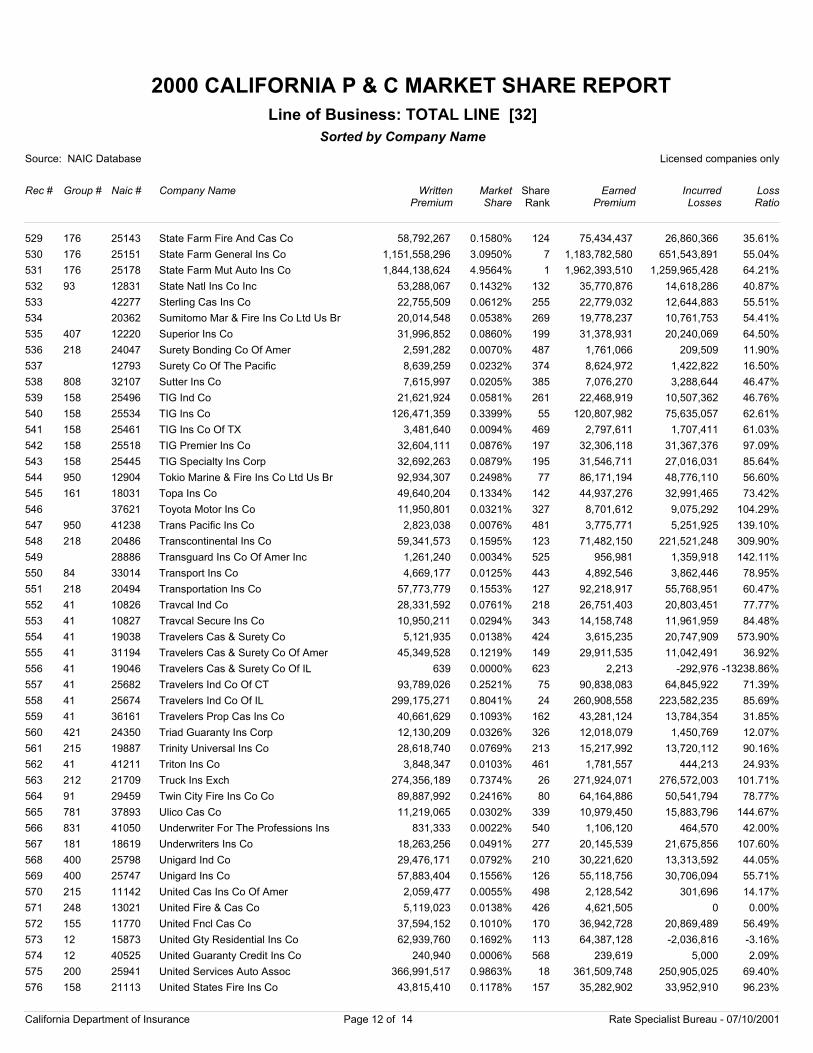
2000 CALIFORNIA P & C MARKET SHARE REPORT
Source: NAIC Database Licensed companies only
Rec # Group # Naic # Company Name
Sorted by Company Name
WrittenPremium
Market Share
EarnedPremium
IncurredLosses
LossRatio
Line of Business: TOTAL LINE [32]
ShareRank
529 176 25143 State Farm Fire And Cas Co 58,792,267 0.1580% 75,434,437 26,860,366 35.61%124
530 176 25151 State Farm General Ins Co 1,151,558,296 3.0950% 1,183,782,580 651,543,891 55.04%7
531 176 25178 State Farm Mut Auto Ins Co 1,844,138,624 4.9564% 1,962,393,510 1,259,965,428 64.21%1
532 93 12831 State Natl Ins Co Inc 53,288,067 0.1432% 35,770,876 14,618,286 40.87%132
533 42277 Sterling Cas Ins Co 22,755,509 0.0612% 22,779,032 12,644,883 55.51%255
534 20362 Sumitomo Mar & Fire Ins Co Ltd Us Br 20,014,548 0.0538% 19,778,237 10,761,753 54.41%269
535 407 12220 Superior Ins Co 31,996,852 0.0860% 31,378,931 20,240,069 64.50%199
536 218 24047 Surety Bonding Co Of Amer 2,591,282 0.0070% 1,761,066 209,509 11.90%487
537 12793 Surety Co Of The Pacific 8,639,259 0.0232% 8,624,972 1,422,822 16.50%374
538 808 32107 Sutter Ins Co 7,615,997 0.0205% 7,076,270 3,288,644 46.47%385
539 158 25496 TIG Ind Co 21,621,924 0.0581% 22,468,919 10,507,362 46.76%261
540 158 25534 TIG Ins Co 126,471,359 0.3399% 120,807,982 75,635,057 62.61%55
541 158 25461 TIG Ins Co Of TX 3,481,640 0.0094% 2,797,611 1,707,411 61.03%469
542 158 25518 TIG Premier Ins Co 32,604,111 0.0876% 32,306,118 31,367,376 97.09%197
543 158 25445 TIG Specialty Ins Corp 32,692,263 0.0879% 31,546,711 27,016,031 85.64%195
544 950 12904 Tokio Marine & Fire Ins Co Ltd Us Br 92,934,307 0.2498% 86,171,194 48,776,110 56.60%77
545 161 18031 Topa Ins Co 49,640,204 0.1334% 44,937,276 32,991,465 73.42%142
546 37621 Toyota Motor Ins Co 11,950,801 0.0321% 8,701,612 9,075,292 104.29%327
547 950 41238 Trans Pacific Ins Co 2,823,038 0.0076% 3,775,771 5,251,925 139.10%481
548 218 20486 Transcontinental Ins Co 59,341,573 0.1595% 71,482,150 221,521,248 309.90%123
549 28886 Transguard Ins Co Of Amer Inc 1,261,240 0.0034% 956,981 1,359,918 142.11%525
550 84 33014 Transport Ins Co 4,669,177 0.0125% 4,892,546 3,862,446 78.95%443
551 218 20494 Transportation Ins Co 57,773,779 0.1553% 92,218,917 55,768,951 60.47%127
552 41 10826 Travcal Ind Co 28,331,592 0.0761% 26,751,403 20,803,451 77.77%218
553 41 10827 Travcal Secure Ins Co 10,950,211 0.0294% 14,158,748 11,961,959 84.48%343
554 41 19038 Travelers Cas & Surety Co 5,121,935 0.0138% 3,615,235 20,747,909 573.90%424
555 41 31194 Travelers Cas & Surety Co Of Amer 45,349,528 0.1219% 29,911,535 11,042,491 36.92%149
556 41 19046 Travelers Cas & Surety Co Of IL 639 0.0000% 2,213 -292,976 -13238.86%623
557 41 25682 Travelers Ind Co Of CT 93,789,026 0.2521% 90,838,083 64,845,922 71.39%75
558 41 25674 Travelers Ind Co Of IL 299,175,271 0.8041% 260,908,558 223,582,235 85.69%24
559 41 36161 Travelers Prop Cas Ins Co 40,661,629 0.1093% 43,281,124 13,784,354 31.85%162
560 421 24350 Triad Guaranty Ins Corp 12,130,209 0.0326% 12,018,079 1,450,769 12.07%326
561 215 19887 Trinity Universal Ins Co 28,618,740 0.0769% 15,217,992 13,720,112 90.16%213
562 41 41211 Triton Ins Co 3,848,347 0.0103% 1,781,557 444,213 24.93%461
563 212 21709 Truck Ins Exch 274,356,189 0.7374% 271,924,071 276,572,003 101.71%26
564 91 29459 Twin City Fire Ins Co Co 89,887,992 0.2416% 64,164,886 50,541,794 78.77%80
565 781 37893 Ulico Cas Co 11,219,065 0.0302% 10,979,450 15,883,796 144.67%339
566 831 41050 Underwriter For The Professions Ins 831,333 0.0022% 1,106,120 464,570 42.00%540
567 181 18619 Underwriters Ins Co 18,263,256 0.0491% 20,145,539 21,675,856 107.60%277
568 400 25798 Unigard Ind Co 29,476,171 0.0792% 30,221,620 13,313,592 44.05%210
569 400 25747 Unigard Ins Co 57,883,404 0.1556% 55,118,756 30,706,094 55.71%126
570 215 11142 United Cas Ins Co Of Amer 2,059,477 0.0055% 2,128,542 301,696 14.17%498
571 248 13021 United Fire & Cas Co 5,119,023 0.0138% 4,621,505 0 0.00%426
572 155 11770 United Fncl Cas Co 37,594,152 0.1010% 36,942,728 20,869,489 56.49%170
573 12 15873 United Gty Residential Ins Co 62,939,760 0.1692% 64,387,128 -2,036,816 -3.16%113
574 12 40525 United Guaranty Credit Ins Co 240,940 0.0006% 239,619 5,000 2.09%568
575 200 25941 United Services Auto Assoc 366,991,517 0.9863% 361,509,748 250,905,025 69.40%18
576 158 21113 United States Fire Ins Co 43,815,410 0.1178% 35,282,902 33,952,910 96.23%157
California Department of Insurance Page 12 of 14 Rate Specialist Bureau - 07/10/2001
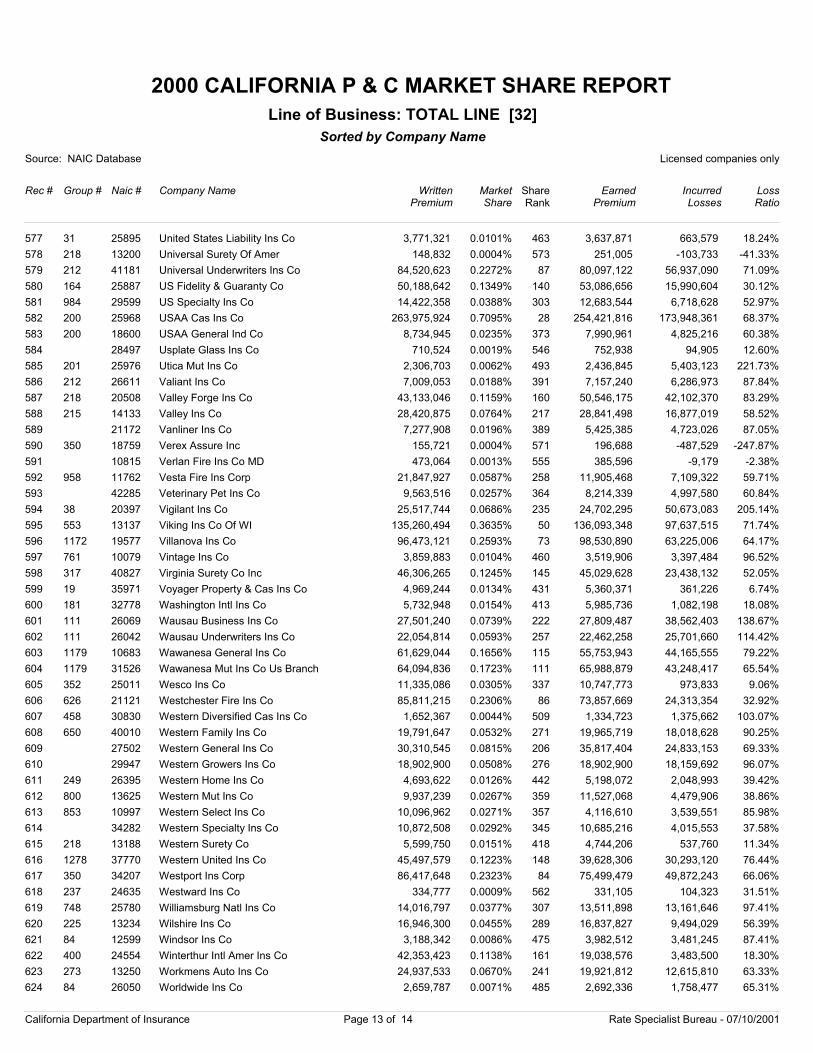
2000 CALIFORNIA P & C MARKET SHARE REPORT
Source: NAIC Database Licensed companies only
Rec # Group # Naic # Company Name
Sorted by Company Name
WrittenPremium
Market Share
EarnedPremium
IncurredLosses
LossRatio
Line of Business: TOTAL LINE [32]
ShareRank
577 31 25895 United States Liability Ins Co 3,771,321 0.0101% 3,637,871 663,579 18.24%463
578 218 13200 Universal Surety Of Amer 148,832 0.0004% 251,005 -103,733 -41.33%573
579 212 41181 Universal Underwriters Ins Co 84,520,623 0.2272% 80,097,122 56,937,090 71.09%87
580 164 25887 US Fidelity & Guaranty Co 50,188,642 0.1349% 53,086,656 15,990,604 30.12%140
581 984 29599 US Specialty Ins Co 14,422,358 0.0388% 12,683,544 6,718,628 52.97%303
582 200 25968 USAA Cas Ins Co 263,975,924 0.7095% 254,421,816 173,948,361 68.37%28
583 200 18600 USAA General Ind Co 8,734,945 0.0235% 7,990,961 4,825,216 60.38%373
584 28497 Usplate Glass Ins Co 710,524 0.0019% 752,938 94,905 12.60%546
585 201 25976 Utica Mut Ins Co 2,306,703 0.0062% 2,436,845 5,403,123 221.73%493
586 212 26611 Valiant Ins Co 7,009,053 0.0188% 7,157,240 6,286,973 87.84%391
587 218 20508 Valley Forge Ins Co 43,133,046 0.1159% 50,546,175 42,102,370 83.29%160
588 215 14133 Valley Ins Co 28,420,875 0.0764% 28,841,498 16,877,019 58.52%217
589 21172 Vanliner Ins Co 7,277,908 0.0196% 5,425,385 4,723,026 87.05%389
590 350 18759 Verex Assure Inc 155,721 0.0004% 196,688 -487,529 -247.87%571
591 10815 Verlan Fire Ins Co MD 473,064 0.0013% 385,596 -9,179 -2.38%555
592 958 11762 Vesta Fire Ins Corp 21,847,927 0.0587% 11,905,468 7,109,322 59.71%258
593 42285 Veterinary Pet Ins Co 9,563,516 0.0257% 8,214,339 4,997,580 60.84%364
594 38 20397 Vigilant Ins Co 25,517,744 0.0686% 24,702,295 50,673,083 205.14%235
595 553 13137 Viking Ins Co Of WI 135,260,494 0.3635% 136,093,348 97,637,515 71.74%50
596 1172 19577 Villanova Ins Co 96,473,121 0.2593% 98,530,890 63,225,006 64.17%73
597 761 10079 Vintage Ins Co 3,859,883 0.0104% 3,519,906 3,397,484 96.52%460
598 317 40827 Virginia Surety Co Inc 46,306,265 0.1245% 45,029,628 23,438,132 52.05%145
599 19 35971 Voyager Property & Cas Ins Co 4,969,244 0.0134% 5,360,371 361,226 6.74%431
600 181 32778 Washington Intl Ins Co 5,732,948 0.0154% 5,985,736 1,082,198 18.08%413
601 111 26069 Wausau Business Ins Co 27,501,240 0.0739% 27,809,487 38,562,403 138.67%222
602 111 26042 Wausau Underwriters Ins Co 22,054,814 0.0593% 22,462,258 25,701,660 114.42%257
603 1179 10683 Wawanesa General Ins Co 61,629,044 0.1656% 55,753,943 44,165,555 79.22%115
604 1179 31526 Wawanesa Mut Ins Co Us Branch 64,094,836 0.1723% 65,988,879 43,248,417 65.54%111
605 352 25011 Wesco Ins Co 11,335,086 0.0305% 10,747,773 973,833 9.06%337
606 626 21121 Westchester Fire Ins Co 85,811,215 0.2306% 73,857,669 24,313,354 32.92%86
607 458 30830 Western Diversified Cas Ins Co 1,652,367 0.0044% 1,334,723 1,375,662 103.07%509
608 650 40010 Western Family Ins Co 19,791,647 0.0532% 19,965,719 18,018,628 90.25%271
609 27502 Western General Ins Co 30,310,545 0.0815% 35,817,404 24,833,153 69.33%206
610 29947 Western Growers Ins Co 18,902,900 0.0508% 18,902,900 18,159,692 96.07%276
611 249 26395 Western Home Ins Co 4,693,622 0.0126% 5,198,072 2,048,993 39.42%442
612 800 13625 Western Mut Ins Co 9,937,239 0.0267% 11,527,068 4,479,906 38.86%359
613 853 10997 Western Select Ins Co 10,096,962 0.0271% 4,116,610 3,539,551 85.98%357
614 34282 Western Specialty Ins Co 10,872,508 0.0292% 10,685,216 4,015,553 37.58%345
615 218 13188 Western Surety Co 5,599,750 0.0151% 4,744,206 537,760 11.34%418
616 1278 37770 Western United Ins Co 45,497,579 0.1223% 39,628,306 30,293,120 76.44%148
617 350 34207 Westport Ins Corp 86,417,648 0.2323% 75,499,479 49,872,243 66.06%84
618 237 24635 Westward Ins Co 334,777 0.0009% 331,105 104,323 31.51%562
619 748 25780 Williamsburg Natl Ins Co 14,016,797 0.0377% 13,511,898 13,161,646 97.41%307
620 225 13234 Wilshire Ins Co 16,946,300 0.0455% 16,837,827 9,494,029 56.39%289
621 84 12599 Windsor Ins Co 3,188,342 0.0086% 3,982,512 3,481,245 87.41%475
622 400 24554 Winterthur Intl Amer Ins Co 42,353,423 0.1138% 19,038,576 3,483,500 18.30%161
623 273 13250 Workmens Auto Ins Co 24,937,533 0.0670% 19,921,812 12,615,810 63.33%241
624 84 26050 Worldwide Ins Co 2,659,787 0.0071% 2,692,336 1,758,477 65.31%485
California Department of Insurance Page 13 of 14 Rate Specialist Bureau - 07/10/2001
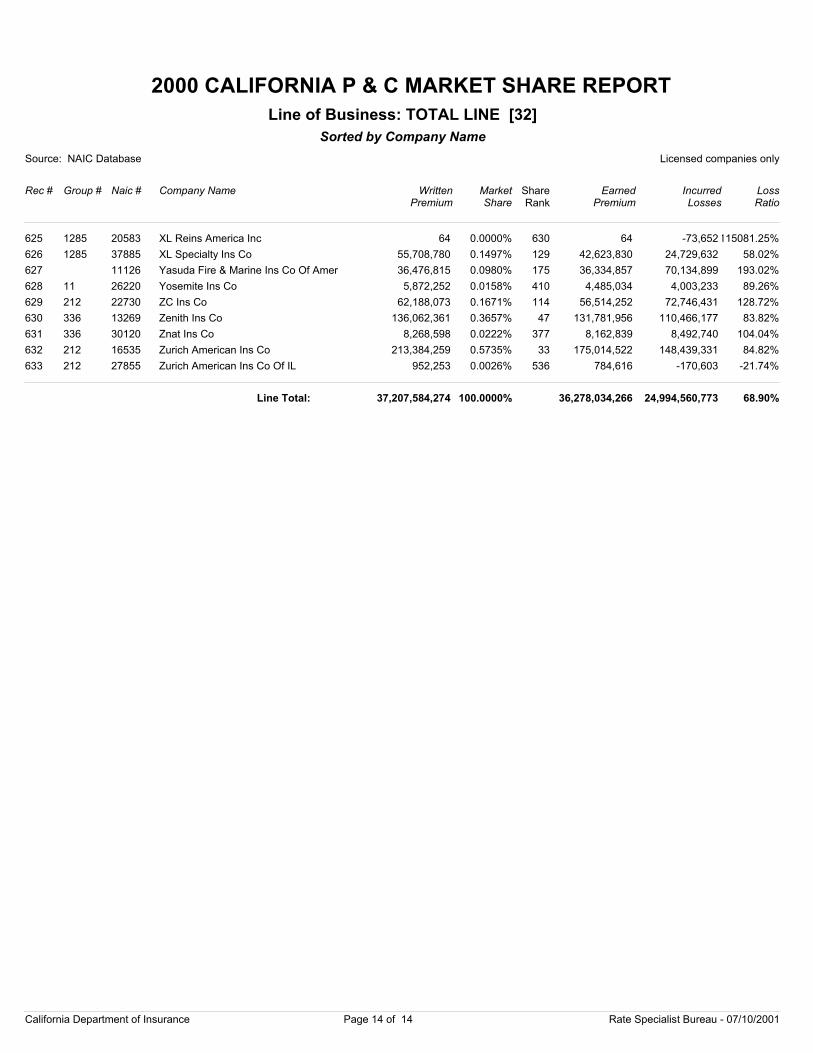
2000 CALIFORNIA P & C MARKET SHARE REPORT
Source: NAIC Database Licensed companies only
Rec # Group # Naic # Company Name
Sorted by Company Name
WrittenPremium
Market Share
EarnedPremium
IncurredLosses
LossRatio
Line of Business: TOTAL LINE [32]
ShareRank
625 1285 20583 XL Reins America Inc 64 0.0000% 64 -73,652115081.25%630
626 1285 37885 XL Specialty Ins Co 55,708,780 0.1497% 42,623,830 24,729,632 58.02%129
627 11126 Yasuda Fire & Marine Ins Co Of Amer 36,476,815 0.0980% 36,334,857 70,134,899 193.02%175
628 11 26220 Yosemite Ins Co 5,872,252 0.0158% 4,485,034 4,003,233 89.26%410
629 212 22730 ZC Ins Co 62,188,073 0.1671% 56,514,252 72,746,431 128.72%114
630 336 13269 Zenith Ins Co 136,062,361 0.3657% 131,781,956 110,466,177 83.82%47
631 336 30120 Znat Ins Co 8,268,598 0.0222% 8,162,839 8,492,740 104.04%377
632 212 16535 Zurich American Ins Co 213,384,259 0.5735% 175,014,522 148,439,331 84.82%33
633 212 27855 Zurich American Ins Co Of IL 952,253 0.0026% 784,616 -170,603 -21.74%536
37,207,584,274 100.0000% 36,278,034,266 24,994,560,773 68.90%Line Total:
California Department of Insurance Page 14 of 14 Rate Specialist Bureau - 07/10/2001
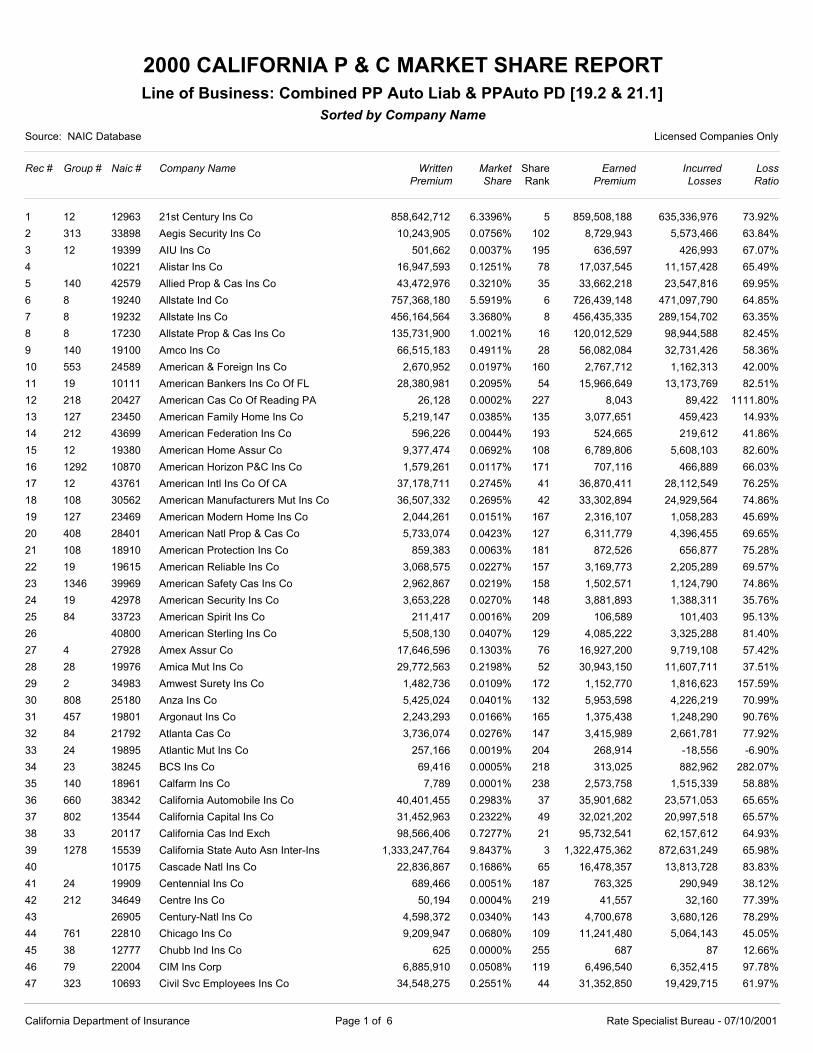
2000 CALIFORNIA P & C MARKET SHARE REPORT
Source: NAIC Database Licensed Companies Only
Rec # Group # Naic # Company Name
Line of Business: Combined PP Auto Liab & PPAuto PD [19.2 & 21.1]Sorted by Company Name
WrittenPremium
Market Share
EarnedPremium
IncurredLosses
LossRatio
ShareRank
1 12 12963 21st Century Ins Co 858,642,712 6.3396% 859,508,188 635,336,976 73.92%5
2 313 33898 Aegis Security Ins Co 10,243,905 0.0756% 8,729,943 5,573,466 63.84%102
3 12 19399 AIU Ins Co 501,662 0.0037% 636,597 426,993 67.07%195
4 10221 Alistar Ins Co 16,947,593 0.1251% 17,037,545 11,157,428 65.49%78
5 140 42579 Allied Prop & Cas Ins Co 43,472,976 0.3210% 33,662,218 23,547,816 69.95%35
6 8 19240 Allstate Ind Co 757,368,180 5.5919% 726,439,148 471,097,790 64.85%6
7 8 19232 Allstate Ins Co 456,164,564 3.3680% 456,435,335 289,154,702 63.35%8
8 8 17230 Allstate Prop & Cas Ins Co 135,731,900 1.0021% 120,012,529 98,944,588 82.45%16
9 140 19100 Amco Ins Co 66,515,183 0.4911% 56,082,084 32,731,426 58.36%28
10 553 24589 American & Foreign Ins Co 2,670,952 0.0197% 2,767,712 1,162,313 42.00%160
11 19 10111 American Bankers Ins Co Of FL 28,380,981 0.2095% 15,966,649 13,173,769 82.51%54
12 218 20427 American Cas Co Of Reading PA 26,128 0.0002% 8,043 89,422 1111.80%227
13 127 23450 American Family Home Ins Co 5,219,147 0.0385% 3,077,651 459,423 14.93%135
14 212 43699 American Federation Ins Co 596,226 0.0044% 524,665 219,612 41.86%193
15 12 19380 American Home Assur Co 9,377,474 0.0692% 6,789,806 5,608,103 82.60%108
16 1292 10870 American Horizon P&C Ins Co 1,579,261 0.0117% 707,116 466,889 66.03%171
17 12 43761 American Intl Ins Co Of CA 37,178,711 0.2745% 36,870,411 28,112,549 76.25%41
18 108 30562 American Manufacturers Mut Ins Co 36,507,332 0.2695% 33,302,894 24,929,564 74.86%42
19 127 23469 American Modern Home Ins Co 2,044,261 0.0151% 2,316,107 1,058,283 45.69%167
20 408 28401 American Natl Prop & Cas Co 5,733,074 0.0423% 6,311,779 4,396,455 69.65%127
21 108 18910 American Protection Ins Co 859,383 0.0063% 872,526 656,877 75.28%181
22 19 19615 American Reliable Ins Co 3,068,575 0.0227% 3,169,773 2,205,289 69.57%157
23 1346 39969 American Safety Cas Ins Co 2,962,867 0.0219% 1,502,571 1,124,790 74.86%158
24 19 42978 American Security Ins Co 3,653,228 0.0270% 3,881,893 1,388,311 35.76%148
25 84 33723 American Spirit Ins Co 211,417 0.0016% 106,589 101,403 95.13%209
26 40800 American Sterling Ins Co 5,508,130 0.0407% 4,085,222 3,325,288 81.40%129
27 4 27928 Amex Assur Co 17,646,596 0.1303% 16,927,200 9,719,108 57.42%76
28 28 19976 Amica Mut Ins Co 29,772,563 0.2198% 30,943,150 11,607,711 37.51%52
29 2 34983 Amwest Surety Ins Co 1,482,736 0.0109% 1,152,770 1,816,623 157.59%172
30 808 25180 Anza Ins Co 5,425,024 0.0401% 5,953,598 4,226,219 70.99%132
31 457 19801 Argonaut Ins Co 2,243,293 0.0166% 1,375,438 1,248,290 90.76%165
32 84 21792 Atlanta Cas Co 3,736,074 0.0276% 3,415,989 2,661,781 77.92%147
33 24 19895 Atlantic Mut Ins Co 257,166 0.0019% 268,914 -18,556 -6.90%204
34 23 38245 BCS Ins Co 69,416 0.0005% 313,025 882,962 282.07%218
35 140 18961 Calfarm Ins Co 7,789 0.0001% 2,573,758 1,515,339 58.88%238
36 660 38342 California Automobile Ins Co 40,401,455 0.2983% 35,901,682 23,571,053 65.65%37
37 802 13544 California Capital Ins Co 31,452,963 0.2322% 32,021,202 20,997,518 65.57%49
38 33 20117 California Cas Ind Exch 98,566,406 0.7277% 95,732,541 62,157,612 64.93%21
39 1278 15539 California State Auto Asn Inter-Ins 1,333,247,764 9.8437% 1,322,475,362 872,631,249 65.98%3
40 10175 Cascade Natl Ins Co 22,836,867 0.1686% 16,478,357 13,813,728 83.83%65
41 24 19909 Centennial Ins Co 689,466 0.0051% 763,325 290,949 38.12%187
42 212 34649 Centre Ins Co 50,194 0.0004% 41,557 32,160 77.39%219
43 26905 Century-Natl Ins Co 4,598,372 0.0340% 4,700,678 3,680,126 78.29%143
44 761 22810 Chicago Ins Co 9,209,947 0.0680% 11,241,480 5,064,143 45.05%109
45 38 12777 Chubb Ind Ins Co 625 0.0000% 687 87 12.66%255
46 79 22004 CIM Ins Corp 6,885,910 0.0508% 6,496,540 6,352,415 97.78%119
47 323 10693 Civil Svc Employees Ins Co 34,548,275 0.2551% 31,352,850 19,429,715 61.97%44
California Department of Insurance Page 1 of 6 Rate Specialist Bureau - 07/10/2001
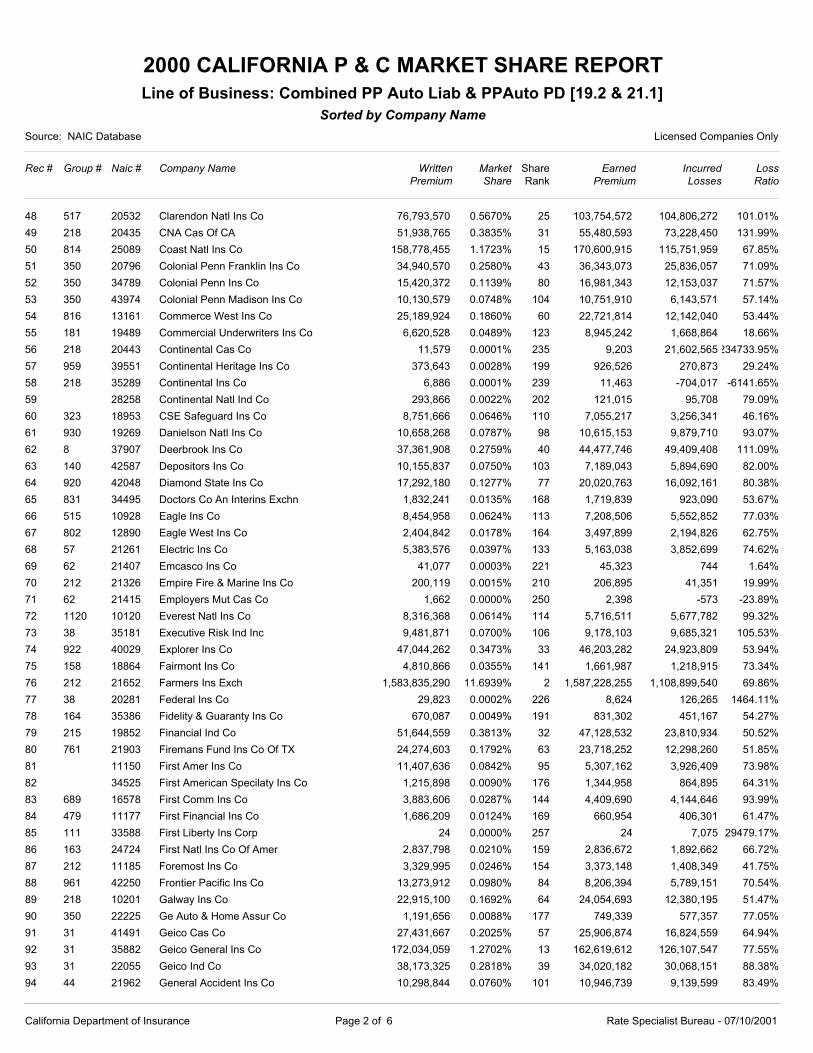
2000 CALIFORNIA P & C MARKET SHARE REPORT
Source: NAIC Database Licensed Companies Only
Rec # Group # Naic # Company Name
Line of Business: Combined PP Auto Liab & PPAuto PD [19.2 & 21.1]Sorted by Company Name
WrittenPremium
Market Share
EarnedPremium
IncurredLosses
LossRatio
ShareRank
48 517 20532 Clarendon Natl Ins Co 76,793,570 0.5670% 103,754,572 104,806,272 101.01%25
49 218 20435 CNA Cas Of CA 51,938,765 0.3835% 55,480,593 73,228,450 131.99%31
50 814 25089 Coast Natl Ins Co 158,778,455 1.1723% 170,600,915 115,751,959 67.85%15
51 350 20796 Colonial Penn Franklin Ins Co 34,940,570 0.2580% 36,343,073 25,836,057 71.09%43
52 350 34789 Colonial Penn Ins Co 15,420,372 0.1139% 16,981,343 12,153,037 71.57%80
53 350 43974 Colonial Penn Madison Ins Co 10,130,579 0.0748% 10,751,910 6,143,571 57.14%104
54 816 13161 Commerce West Ins Co 25,189,924 0.1860% 22,721,814 12,142,040 53.44%60
55 181 19489 Commercial Underwriters Ins Co 6,620,528 0.0489% 8,945,242 1,668,864 18.66%123
56 218 20443 Continental Cas Co 11,579 0.0001% 9,203 21,602,565234733.95%235
57 959 39551 Continental Heritage Ins Co 373,643 0.0028% 926,526 270,873 29.24%199
58 218 35289 Continental Ins Co 6,886 0.0001% 11,463 -704,017 -6141.65%239
59 28258 Continental Natl Ind Co 293,866 0.0022% 121,015 95,708 79.09%202
60 323 18953 CSE Safeguard Ins Co 8,751,666 0.0646% 7,055,217 3,256,341 46.16%110
61 930 19269 Danielson Natl Ins Co 10,658,268 0.0787% 10,615,153 9,879,710 93.07%98
62 8 37907 Deerbrook Ins Co 37,361,908 0.2759% 44,477,746 49,409,408 111.09%40
63 140 42587 Depositors Ins Co 10,155,837 0.0750% 7,189,043 5,894,690 82.00%103
64 920 42048 Diamond State Ins Co 17,292,180 0.1277% 20,020,763 16,092,161 80.38%77
65 831 34495 Doctors Co An Interins Exchn 1,832,241 0.0135% 1,719,839 923,090 53.67%168
66 515 10928 Eagle Ins Co 8,454,958 0.0624% 7,208,506 5,552,852 77.03%113
67 802 12890 Eagle West Ins Co 2,404,842 0.0178% 3,497,899 2,194,826 62.75%164
68 57 21261 Electric Ins Co 5,383,576 0.0397% 5,163,038 3,852,699 74.62%133
69 62 21407 Emcasco Ins Co 41,077 0.0003% 45,323 744 1.64%221
70 212 21326 Empire Fire & Marine Ins Co 200,119 0.0015% 206,895 41,351 19.99%210
71 62 21415 Employers Mut Cas Co 1,662 0.0000% 2,398 -573 -23.89%250
72 1120 10120 Everest Natl Ins Co 8,316,368 0.0614% 5,716,511 5,677,782 99.32%114
73 38 35181 Executive Risk Ind Inc 9,481,871 0.0700% 9,178,103 9,685,321 105.53%106
74 922 40029 Explorer Ins Co 47,044,262 0.3473% 46,203,282 24,923,809 53.94%33
75 158 18864 Fairmont Ins Co 4,810,866 0.0355% 1,661,987 1,218,915 73.34%141
76 212 21652 Farmers Ins Exch 1,583,835,290 11.6939% 1,587,228,255 1,108,899,540 69.86%2
77 38 20281 Federal Ins Co 29,823 0.0002% 8,624 126,265 1464.11%226
78 164 35386 Fidelity & Guaranty Ins Co 670,087 0.0049% 831,302 451,167 54.27%191
79 215 19852 Financial Ind Co 51,644,559 0.3813% 47,128,532 23,810,934 50.52%32
80 761 21903 Firemans Fund Ins Co Of TX 24,274,603 0.1792% 23,718,252 12,298,260 51.85%63
81 11150 First Amer Ins Co 11,407,636 0.0842% 5,307,162 3,926,409 73.98%95
82 34525 First American Specilaty Ins Co 1,215,898 0.0090% 1,344,958 864,895 64.31%176
83 689 16578 First Comm Ins Co 3,883,606 0.0287% 4,409,690 4,144,646 93.99%144
84 479 11177 First Financial Ins Co 1,686,209 0.0124% 660,954 406,301 61.47%169
85 111 33588 First Liberty Ins Corp 24 0.0000% 24 7,075 29479.17%257
86 163 24724 First Natl Ins Co Of Amer 2,837,798 0.0210% 2,836,672 1,892,662 66.72%159
87 212 11185 Foremost Ins Co 3,329,995 0.0246% 3,373,148 1,408,349 41.75%154
88 961 42250 Frontier Pacific Ins Co 13,273,912 0.0980% 8,206,394 5,789,151 70.54%84
89 218 10201 Galway Ins Co 22,915,100 0.1692% 24,054,693 12,380,195 51.47%64
90 350 22225 Ge Auto & Home Assur Co 1,191,656 0.0088% 749,339 577,357 77.05%177
91 31 41491 Geico Cas Co 27,431,667 0.2025% 25,906,874 16,824,559 64.94%57
92 31 35882 Geico General Ins Co 172,034,059 1.2702% 162,619,612 126,107,547 77.55%13
93 31 22055 Geico Ind Co 38,173,325 0.2818% 34,020,182 30,068,151 88.38%39
94 44 21962 General Accident Ins Co 10,298,844 0.0760% 10,946,739 9,139,599 83.49%101
California Department of Insurance Page 2 of 6 Rate Specialist Bureau - 07/10/2001
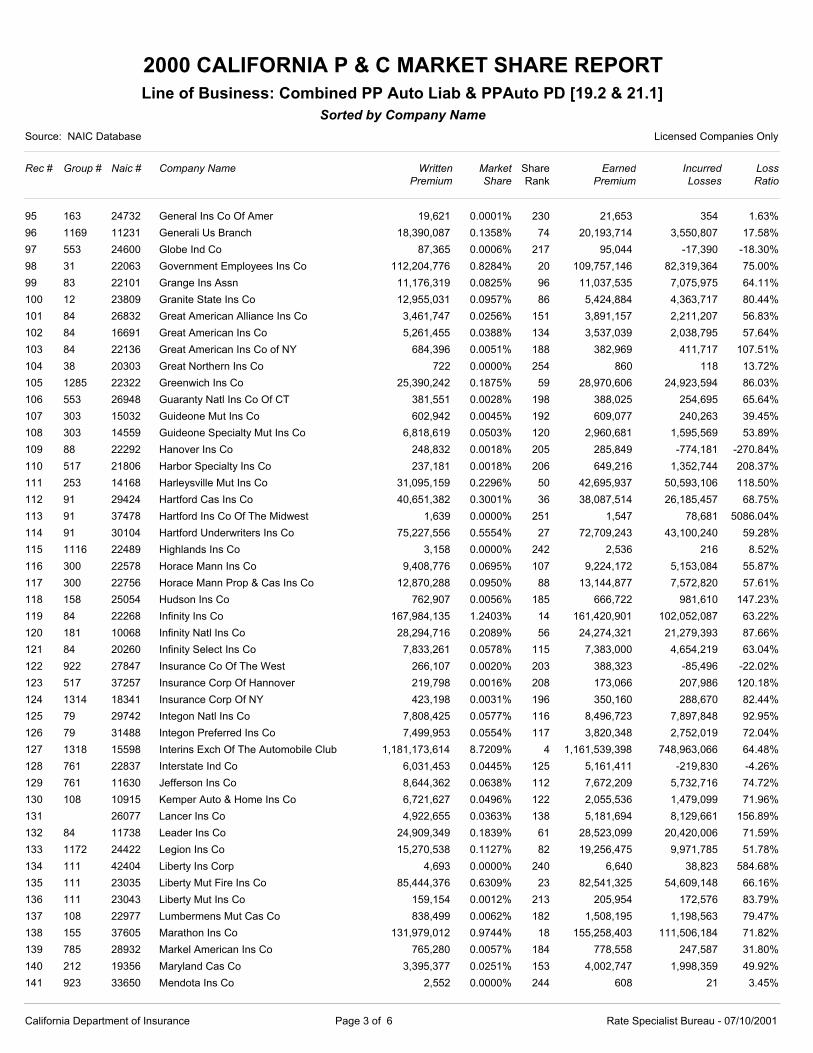
2000 CALIFORNIA P & C MARKET SHARE REPORT
Source: NAIC Database Licensed Companies Only
Rec # Group # Naic # Company Name
Line of Business: Combined PP Auto Liab & PPAuto PD [19.2 & 21.1]Sorted by Company Name
WrittenPremium
Market Share
EarnedPremium
IncurredLosses
LossRatio
ShareRank
95 163 24732 General Ins Co Of Amer 19,621 0.0001% 21,653 354 1.63%230
96 1169 11231 Generali Us Branch 18,390,087 0.1358% 20,193,714 3,550,807 17.58%74
97 553 24600 Globe Ind Co 87,365 0.0006% 95,044 -17,390 -18.30%217
98 31 22063 Government Employees Ins Co 112,204,776 0.8284% 109,757,146 82,319,364 75.00%20
99 83 22101 Grange Ins Assn 11,176,319 0.0825% 11,037,535 7,075,975 64.11%96
100 12 23809 Granite State Ins Co 12,955,031 0.0957% 5,424,884 4,363,717 80.44%86
101 84 26832 Great American Alliance Ins Co 3,461,747 0.0256% 3,891,157 2,211,207 56.83%151
102 84 16691 Great American Ins Co 5,261,455 0.0388% 3,537,039 2,038,795 57.64%134
103 84 22136 Great American Ins Co of NY 684,396 0.0051% 382,969 411,717 107.51%188
104 38 20303 Great Northern Ins Co 722 0.0000% 860 118 13.72%254
105 1285 22322 Greenwich Ins Co 25,390,242 0.1875% 28,970,606 24,923,594 86.03%59
106 553 26948 Guaranty Natl Ins Co Of CT 381,551 0.0028% 388,025 254,695 65.64%198
107 303 15032 Guideone Mut Ins Co 602,942 0.0045% 609,077 240,263 39.45%192
108 303 14559 Guideone Specialty Mut Ins Co 6,818,619 0.0503% 2,960,681 1,595,569 53.89%120
109 88 22292 Hanover Ins Co 248,832 0.0018% 285,849 -774,181 -270.84%205
110 517 21806 Harbor Specialty Ins Co 237,181 0.0018% 649,216 1,352,744 208.37%206
111 253 14168 Harleysville Mut Ins Co 31,095,159 0.2296% 42,695,937 50,593,106 118.50%50
112 91 29424 Hartford Cas Ins Co 40,651,382 0.3001% 38,087,514 26,185,457 68.75%36
113 91 37478 Hartford Ins Co Of The Midwest 1,639 0.0000% 1,547 78,681 5086.04%251
114 91 30104 Hartford Underwriters Ins Co 75,227,556 0.5554% 72,709,243 43,100,240 59.28%27
115 1116 22489 Highlands Ins Co 3,158 0.0000% 2,536 216 8.52%242
116 300 22578 Horace Mann Ins Co 9,408,776 0.0695% 9,224,172 5,153,084 55.87%107
117 300 22756 Horace Mann Prop & Cas Ins Co 12,870,288 0.0950% 13,144,877 7,572,820 57.61%88
118 158 25054 Hudson Ins Co 762,907 0.0056% 666,722 981,610 147.23%185
119 84 22268 Infinity Ins Co 167,984,135 1.2403% 161,420,901 102,052,087 63.22%14
120 181 10068 Infinity Natl Ins Co 28,294,716 0.2089% 24,274,321 21,279,393 87.66%56
121 84 20260 Infinity Select Ins Co 7,833,261 0.0578% 7,383,000 4,654,219 63.04%115
122 922 27847 Insurance Co Of The West 266,107 0.0020% 388,323 -85,496 -22.02%203
123 517 37257 Insurance Corp Of Hannover 219,798 0.0016% 173,066 207,986 120.18%208
124 1314 18341 Insurance Corp Of NY 423,198 0.0031% 350,160 288,670 82.44%196
125 79 29742 Integon Natl Ins Co 7,808,425 0.0577% 8,496,723 7,897,848 92.95%116
126 79 31488 Integon Preferred Ins Co 7,499,953 0.0554% 3,820,348 2,752,019 72.04%117
127 1318 15598 Interins Exch Of The Automobile Club 1,181,173,614 8.7209% 1,161,539,398 748,963,066 64.48%4
128 761 22837 Interstate Ind Co 6,031,453 0.0445% 5,161,411 -219,830 -4.26%125
129 761 11630 Jefferson Ins Co 8,644,362 0.0638% 7,672,209 5,732,716 74.72%112
130 108 10915 Kemper Auto & Home Ins Co 6,721,627 0.0496% 2,055,536 1,479,099 71.96%122
131 26077 Lancer Ins Co 4,922,655 0.0363% 5,181,694 8,129,661 156.89%138
132 84 11738 Leader Ins Co 24,909,349 0.1839% 28,523,099 20,420,006 71.59%61
133 1172 24422 Legion Ins Co 15,270,538 0.1127% 19,256,475 9,971,785 51.78%82
134 111 42404 Liberty Ins Corp 4,693 0.0000% 6,640 38,823 584.68%240
135 111 23035 Liberty Mut Fire Ins Co 85,444,376 0.6309% 82,541,325 54,609,148 66.16%23
136 111 23043 Liberty Mut Ins Co 159,154 0.0012% 205,954 172,576 83.79%213
137 108 22977 Lumbermens Mut Cas Co 838,499 0.0062% 1,508,195 1,198,563 79.47%182
138 155 37605 Marathon Ins Co 131,979,012 0.9744% 155,258,403 111,506,184 71.82%18
139 785 28932 Markel American Ins Co 765,280 0.0057% 778,558 247,587 31.80%184
140 212 19356 Maryland Cas Co 3,395,377 0.0251% 4,002,747 1,998,359 49.92%153
141 923 33650 Mendota Ins Co 2,552 0.0000% 608 21 3.45%244
California Department of Insurance Page 3 of 6 Rate Specialist Bureau - 07/10/2001
2000 CALIFORNIA P & C MARKET SHARE REPORT
Source: NAIC Database Licensed Companies Only
Rec # Group # Naic # Company Name
Line of Business: Combined PP Auto Liab & PPAuto PD [19.2 & 21.1]Sorted by Company Name
WrittenPremium
Market Share
EarnedPremium
IncurredLosses
LossRatio
ShareRank
142 304 31968 Merastar Ins Co 349,685 0.0026% 274,362 212,773 77.55%201
143 660 11908 Mercury Cas Co 260,745,584 1.9252% 263,008,447 174,284,721 66.27%9
144 660 27553 Mercury Ins Co Of CA 738,552,378 5.4529% 741,827,376 432,137,532 58.25%7
145 241 25321 Metropolitan Drt Prop & Cas Ins Co 13,614,692 0.1005% 12,529,882 7,561,135 60.34%83
146 852 40150 MGA Ins Co Inc 13,030 0.0001% 15,018 -10,000 -66.59%232
147 79 38660 MIC General Ins Corp 8,684,144 0.0641% 8,635,634 4,686,182 54.27%111
148 212 21687 Mid-Century Ins Co 82,058,152 0.6059% 98,034,242 69,181,695 70.57%24
149 303 10920 Millennium Ins Co 6,517,274 0.0481% 5,411,740 3,703,215 68.43%124
150 130 23531 Millers Ins Co 12,980,454 0.0958% 13,840,175 8,986,073 64.93%85
151 227 23655 Modern Service Ins Co 11,534,327 0.0852% 11,307,143 8,773,676 77.59%94
152 227 23647 Mutual Service Cas Ins Co 33,533,639 0.2476% 40,730,795 54,095,475 132.81%46
153 30945 National Alliance Ins Co 15,274,644 0.1128% 15,375,536 8,202,597 53.35%81
154 930 23671 National American Ins Co Of CA 9,971,932 0.0736% 10,228,599 5,186,547 50.71%105
155 23701 National Automobile & Cas Ins Co 21,556,826 0.1592% 20,166,722 14,816,532 73.47%70
156 218 20478 National Fire Ins Co Of Hartford 3,531 0.0000% 3,833 28,739 749.78%241
157 79 23728 National General Ins Co 93,630,747 0.6913% 94,660,606 53,601,954 56.63%22
158 84 32620 National Interstate Ins Co 798,731 0.0059% 736,315 638,284 86.69%183
159 140 10723 Nationwide Assur Co 37,989 0.0003% -20,586 17,179 -83.45%224
160 140 23779 Nationwide Mut Fire Ins Co 17,720,587 0.1308% 17,363,672 12,109,032 69.74%75
161 140 23787 Nationwide Mut Ins Co 75,758,483 0.5593% 73,552,983 61,361,150 83.42%26
162 140 37877 Nationwide Prop & Cas Ins Co 5,935,072 0.0438% 4,329,795 3,541,175 81.79%126
163 12 23841 New Hampshire Ins Co 184,254 0.0014% 177,412 -8,371 -4.72%212
164 2558 27073 Nipponkoa Ins Co Ltd 395,128 0.0029% 327,865 356,492 108.73%197
165 181 29874 North American Specialty Ins Co 1 0.0000% 1,369 -48,285 -3527.03%258
166 885 27740 North Pointe Ins Co 4,870,116 0.0360% 2,878,359 3,158,870 109.75%140
167 212 19372 Northern Ins Co Of NY 3,286,252 0.0243% 3,363,759 2,145,140 63.77%155
168 41 24031 Northland Cas Co 12,710 0.0001% 11,812 6,792 57.50%233
169 41 24015 Northland Ins Co 1,394,716 0.0103% 1,134,681 198,652 17.51%173
170 38 20338 Northwestern Pacific Ind Co 10,324,912 0.0762% 10,237,238 3,808,140 37.20%100
171 354 39098 Omni Ins Co 12,874,079 0.0951% 11,370,846 8,429,317 74.13%87
172 38 20346 Pacific Ind Co 1,465 0.0000% 1,649 220 13.34%252
173 1116 23930 Pacific Natl Ins Co 358,878 0.0026% 287,199 -352,072 -122.59%200
174 40550 Pacific Pioneer Ins Co 10,427,496 0.0770% 9,992,164 8,076,815 80.83%99
175 408 11048 Pacific Prop & Cas Co 1,234,027 0.0091% 230,325 198,572 86.21%175
176 37850 Pacific Specialty Ins Co 21,226,815 0.1567% 22,551,368 13,904,051 61.66%71
177 1218 32859 Penn-Amer Ins Co 2,457,637 0.0181% 3,122,593 1,813,715 58.08%163
178 1218 10673 Penn-Star Ins Co 2,472 0.0000% 2,586 -1,007 -38.94%245
179 944 37648 Permanent General Assur Corp 39,449,245 0.2913% 36,766,983 24,945,612 67.85%38
180 155 24260 Progressive Cas Ins Co 16,340,178 0.1206% 15,199,379 8,531,645 56.13%79
181 155 11851 Progressive Home Ins Co 2,639,121 0.0195% 4,761,201 2,816,028 59.15%162
182 155 27804 Progressive West Ins Co 113,817,104 0.8403% 150,712,012 96,504,488 64.03%19
183 304 36447 Prudential General Ins Co 3,016 0.0000% 1,045 -3,925 -375.60%243
184 304 32352 Prudential Prop & Cas Ins Co 25,554,334 0.1887% 24,004,398 17,797,762 74.14%58
185 796 10219 QBE Reins Corp 1,122,277 0.0083% 980,189 683,100 69.69%178
186 158 24384 Ranger Ins Co 13,133 0.0001% 8,952 23,820 266.09%231
187 517 37303 Redland Ins Co 3,414,408 0.0252% 3,460,127 2,988,439 86.37%152
188 84 43753 Republic Ind Co of CA 29,824,495 0.2202% 26,852,984 16,920,603 63.01%51
California Department of Insurance Page 4 of 6 Rate Specialist Bureau - 07/10/2001
2000 CALIFORNIA P & C MARKET SHARE REPORT
Source: NAIC Database Licensed Companies Only
Rec # Group # Naic # Company Name
Line of Business: Combined PP Auto Liab & PPAuto PD [19.2 & 21.1]Sorted by Company Name
WrittenPremium
Market Share
EarnedPremium
IncurredLosses
LossRatio
ShareRank
189 574 31089 Republic Western Ins Co 21,582,249 0.1593% 16,580,410 15,176,628 91.53%69
190 1234 10970 Response Ind Co Of CA 1,286,042 0.0095% 1,280,538 1,507,339 117.71%174
191 1234 43044 Response Ins Co 42,365 0.0003% 44,437 41,643 93.71%220
192 83 22128 Rocky Mountain Fire & Cas Co 680,871 0.0050% 709,708 341,396 48.10%189
193 553 24678 Royal Ind Co 12,578 0.0001% 14,608 -26,136 -178.92%234
194 553 26980 Royal Ins Co Of Amer 236,001 0.0017% 206,422 39,536 19.15%207
195 163 24740 Safeco Ins Co Of Amer 227,016,822 1.6761% 220,768,692 150,452,298 68.15%11
196 553 24694 Safeguard Ins Co 7,943 0.0001% 7,827 -14,430 -184.36%237
197 257 10939 Safeway Direct Ins Co 5,088,140 0.0376% 5,039,162 3,757,581 74.57%136
198 553 24902 Security Ins Co Of Hartford 1,050,881 0.0078% 420,490 10,101 2.40%179
199 772 22985 Sequoia Ins Co 5,440,735 0.0402% 2,302,794 1,843,720 80.06%131
200 35408 Sirius Amer Ins Co 3,876,838 0.0286% 3,385,869 1,639,837 48.43%145
201 400 19216 Southern Ins Co 12,853,506 0.0949% 12,962,008 11,486,311 88.62%89
202 155 44288 Specialty Risk Ins Co 88,068 0.0007% 156,523 113,355 72.42%216
203 164 24767 St Paul Fire & Marine Ins Co 1,672 0.0000% 6,887 -17,329 -251.62%249
204 164 24791 St Paul Mercury Ins Co 537,054 0.0040% 523,423 880,151 168.15%194
205 98 40045 Starnet Ins Co 11,565,379 0.0854% 5,818,070 3,903,621 67.09%93
206 176 25151 State Farm General Ins Co 31,980 0.0002% 45,295 25,903 57.19%225
207 176 25178 State Farm Mut Auto Ins Co 1,700,944,089 12.5586% 1,817,637,920 1,157,445,847 63.68%1
208 93 12831 State Natl Ins Co Inc 33,889,606 0.2502% 19,526,167 11,016,419 56.42%45
209 42277 Sterling Cas Ins Co 22,755,509 0.1680% 22,779,032 12,644,883 55.51%66
210 407 12220 Superior Ins Co 31,996,852 0.2362% 31,378,930 20,240,069 64.50%48
211 808 32107 Sutter Ins Co 8,683 0.0001% 4,343 19,600 451.30%236
212 158 25496 TIG Ind Co 12,501,178 0.0923% 12,933,374 4,301,330 33.26%91
213 158 25534 TIG Ins Co 192,000 0.0014% 384,002 -2,500,796 -651.25%211
214 158 25461 TIG Ins Co Of TX 3,481,640 0.0257% 2,797,611 1,707,411 61.03%150
215 158 25518 TIG Premier Ins Co 127,905 0.0009% 179,485 162,802 90.71%215
216 158 25445 TIG Specialty Ins Corp 32,693,030 0.2414% 31,546,825 27,031,551 85.69%47
217 950 12904 Tokio Marine & Fire Ins Co Ltd Us Br 12,678,699 0.0936% 12,604,343 5,319,946 42.21%90
218 161 18031 Topa Ins Co 20,260,659 0.1496% 19,065,470 12,801,077 67.14%72
219 218 20486 Transcontinental Ins Co 1,741 0.0000% 1,898 225 11.85%248
220 84 33014 Transport Ins Co 4,666,599 0.0345% 4,890,331 4,227,097 86.44%142
221 218 20494 Transportation Ins Co 39,428 0.0003% 30,441 0 0.00%223
222 41 10826 Travcal Ind Co 28,331,592 0.2092% 26,751,403 20,803,451 77.77%55
223 41 10827 Travcal Secure Ins Co 10,950,211 0.0808% 14,158,748 11,961,959 84.48%97
224 41 25682 Travelers Ind Co Of CT 160 0.0000% 85 26,791 31518.82%256
225 215 19887 Trinity Universal Ins Co 28,602,240 0.2112% 15,212,983 13,743,706 90.34%53
226 91 29459 Twin City Fire Ins Co Co 21,587,351 0.1594% 20,014,008 16,583,880 82.86%68
227 181 18619 Underwriters Ins Co 5,029,355 0.0371% 5,454,972 8,482,566 155.50%137
228 400 25798 Unigard Ind Co 7,132,789 0.0527% 7,169,113 4,242,064 59.17%118
229 400 25747 Unigard Ins Co 6,777,497 0.0500% 6,886,323 4,897,176 71.11%121
230 200 25941 United Services Auto Assoc 231,299,280 1.7077% 227,991,454 187,443,759 82.22%10
231 31 25895 United States Liability Ins Co 2,355 0.0000% 491 294 59.88%246
232 212 41181 Universal Underwriters Ins Co 12,038,972 0.0889% 10,226,995 9,879,291 96.60%92
233 164 25887 US Fidelity & Guaranty Co 2,253 0.0000% 2,651 -90,608 -3417.88%247
234 200 25968 USAA Cas Ins Co 199,432,473 1.4725% 193,829,528 147,453,161 76.07%12
235 200 18600 USAA General Ind Co 5,492,634 0.0406% 4,578,883 4,826,483 105.41%130
California Department of Insurance Page 5 of 6 Rate Specialist Bureau - 07/10/2001
2000 CALIFORNIA P & C MARKET SHARE REPORT
Source: NAIC Database Licensed Companies Only
Rec # Group # Naic # Company Name
Line of Business: Combined PP Auto Liab & PPAuto PD [19.2 & 21.1]Sorted by Company Name
WrittenPremium
Market Share
EarnedPremium
IncurredLosses
LossRatio
ShareRank
236 201 25976 Utica Mut Ins Co 136,032 0.0010% 154,594 159,784 103.36%214
237 218 20508 Valley Forge Ins Co 23,355 0.0002% 32,144 320,302 996.46%228
238 215 14133 Valley Ins Co 4,894,560 0.0361% 4,932,707 3,779,585 76.62%139
239 958 11762 Vesta Fire Ins Corp 21,729,828 0.1604% 11,212,724 7,094,148 63.27%67
240 38 20397 Vigilant Ins Co 1,103 0.0000% 1,277 171 13.39%253
241 553 13137 Viking Ins Co Of WI 135,260,494 0.9987% 136,093,348 97,637,515 71.74%17
242 1172 19577 Villanova Ins Co 5,673,794 0.0419% 7,586,887 5,309,104 69.98%128
243 761 10079 Vintage Ins Co 3,875,169 0.0286% 3,533,423 3,397,859 96.16%146
244 317 40827 Virginia Surety Co Inc 1,032,286 0.0076% 393,721 287,296 72.97%180
245 19 35971 Voyager Property & Cas Ins Co 40,003 0.0003% 71,698 45,057 62.84%222
246 111 26042 Wausau Underwriters Ins Co 20,568 0.0002% -21,132 0 0.00%229
247 1179 10683 Wawanesa General Ins Co 57,634,102 0.4255% 52,315,091 41,791,442 79.88%30
248 1179 31526 Wawanesa Mut Ins Co Us Branch 59,895,128 0.4422% 61,625,268 41,052,000 66.62%29
249 458 30830 Western Diversified Cas Ins Co 1,651,917 0.0122% 1,334,672 1,375,662 103.07%170
250 650 40010 Western Family Ins Co 18,535,587 0.1369% 18,347,534 17,060,689 92.99%73
251 27502 Western General Ins Co 721,644 0.0053% 486,011 279,034 57.41%186
252 1278 37770 Western United Ins Co 45,497,579 0.3359% 39,628,306 30,293,419 76.44%34
253 84 12599 Windsor Ins Co 3,188,342 0.0235% 3,982,512 3,481,245 87.41%156
254 273 13250 Workmens Auto Ins Co 24,882,580 0.1837% 19,913,056 12,615,810 63.35%62
255 84 26050 Worldwide Ins Co 2,653,271 0.0196% 2,687,732 1,758,666 65.43%161
256 11126 Yasuda Fire & Marine Ins Co Of Amer 672,202 0.0050% 743,316 370,712 49.87%190
257 11 26220 Yosemite Ins Co 2,046,900 0.0151% 1,867,256 429,216 22.99%166
258 212 22730 ZC Ins Co 3,575,598 0.0264% 3,361,990 3,388,656 100.79%149
13,544,111,253 100.0000% 13,514,678,863 9,239,128,986 68.36%Line Total:
California Department of Insurance Page 6 of 6 Rate Specialist Bureau - 07/10/2001
2000 CALIFORNIA P & C MARKET SHARE REPORT
Source: NAIC Database Licensed Companies Only
Rec # Group # Naic # Company Name
Line of Business: Combined Cmcl Auto Liab & Cmcl Auto PD [19.4 & 21.2]Sorted by Company Name
WrittenPremium
Market Share
EarnedPremium
IncurredLosses
LossRatio
ShareRank
1 329 20010 Acceptance Ind Ins Co 2,378,224 0.1206% 765,257 507,218 66.28%154
2 626 22667 Ace American Ins Co 3,234,614 0.1641% 3,859,325 1,160,897 30.08%135
3 626 20702 Ace Fire Underwriters Ins Co 2,313,751 0.1174% 2,961,557 2,333,286 78.79%156
4 626 20699 Ace Prop & Cas Ins Co 145,755 0.0074% 119,037 464,451 390.17%246
5 38733 Alaska Nat Ins Co 22,622 0.0011% 23,062 4,064 17.62%267
6 8 19240 Allstate Ind Co 24,420,202 1.2388% 22,190,945 10,905,651 49.14%17
7 8 19232 Allstate Ins Co 15,338,710 0.7781% 15,246,811 3,775,197 24.76%45
8 140 19100 Amco Ins Co 3,336,224 0.1692% 3,344,365 2,566,384 76.74%133
9 553 24589 American & Foreign Ins Co 2,612,978 0.1326% 3,790,403 2,235,398 58.98%151
10 957 19720 American Alt Ins Corp 1,014,141 0.0514% 977,168 -61,223 -6.27%194
11 761 21849 American Automobile Ins Co 5,715,960 0.2900% 6,949,761 2,105,797 30.30%107
12 19 10111 American Bankers Ins Co Of FL 1,891,614 0.0960% 1,674,369 738,946 44.13%167
13 218 20427 American Cas Co Of Reading PA 16,697,515 0.8470% 14,137,250 5,735,484 40.57%33
14 163 19690 American Economy Ins Co 10,458,828 0.5306% 10,006,023 6,181,040 61.77%63
15 44 20613 American Employers Ins Co 3,457,799 0.1754% 4,409,179 1,941,066 44.02%132
16 212 26247 American Guarantee & Liability Ins 5,406,142 0.2742% 5,380,608 2,012,151 37.40%111
17 291 13331 American Hardware Mut Ins Co 5,309,469 0.2693% 5,173,171 810,374 15.66%113
18 12 19380 American Home Assur Co 9,548,723 0.4844% 6,817,368 13,041,035 191.29%70
19 761 21857 American Ins Co 17,682,205 0.8970% 20,363,843 6,098,359 29.95%27
20 108 30562 American Manufacturers Mut Ins Co 6,147,690 0.3119% 6,401,752 2,540,426 39.68%101
21 127 23469 American Modern Home Ins Co 597,266 0.0303% 598,165 352,182 58.88%212
22 108 22918 American Motorists Ins Co 5,747,245 0.2916% 6,489,519 921,452 14.20%105
23 108 18910 American Protection Ins Co 2,993,056 0.1518% 2,018,415 642,948 31.85%141
24 19 19615 American Reliable Ins Co 1,044,470 0.0530% 2,613,309 2,745,883 105.07%191
25 163 19704 American States Ins Co 30,443,401 1.5444% 22,119,843 12,736,764 57.58%10
26 212 40142 American Zurich Ins Co 227,342 0.0115% 191,086 57,036 29.85%238
27 124 23396 Amerisure Mut Ins Co 96,523 0.0049% 100,486 109,155 108.63%256
28 28 19976 Amica Mut Ins Co 32,119 0.0016% 30,265 34,286 113.29%264
29 2 34983 Amwest Surety Ins Co 2,878,270 0.1460% 1,126,816 527,315 46.80%146
30 457 19860 Argonaut Great Central Ins Co 19,218 0.0010% 17,814 -11,715 -65.76%269
31 457 19801 Argonaut Ins Co 116,944 0.0059% 207,652 105,165 50.64%251
32 457 19828 Argonaut-Midwest Ins Co 1,290 0.0001% 2,768 -167 -6.03%288
33 761 21865 Associated Ind Corp 3,923,865 0.1991% 3,510,926 820,791 23.38%124
34 41 21296 Associates Ins Co 4,844,971 0.2458% 7,473,734 9,412,031 125.93%116
35 212 19305 Assurance Co Of Amer 9,875,080 0.5010% 8,636,104 5,790,983 67.06%69
36 164 41769 Athena Assur Co 8,424,674 0.4274% 8,018,763 6,131,374 76.46%80
37 41 22209 Atlantic Ins Co 8,979 0.0005% 8,979 3,000 33.41%276
38 24 19895 Atlantic Mut Ins Co 11,366,444 0.5766% 10,751,115 4,947,067 46.01%58
39 1330 24813 Balboa Ins Co 7,693,434 0.3903% 9,518,575 4,469,673 46.96%85
40 689 33162 Bankers Ins Co 2,028 0.0001% 507 99 19.53%287
41 626 18279 Bankers Standard Ins Co 923,732 0.0469% 1,519,959 1,032,527 67.93%196
42 98 11001 Berkley Partners Ins Co 786,031 0.0399% 207,012 121,164 58.53%202
43 140 18961 Calfarm Ins Co 37,293,829 1.8919% 38,750,372 8,249,468 21.29%7
44 802 13544 California Capital Ins Co 1,236,743 0.0627% 967,359 135,496 14.01%188
45 98 10510 Carolina Cas Ins Co 9,105,104 0.4619% 9,973,750 8,300,864 83.23%74
46 10175 Cascade Natl Ins Co 311,999 0.0158% 105,982 116,307 109.74%229
47 56 21237 Casualty Reciprocal Exch 333,890 0.0169% 13,912 104,943 754.33%228
48 24 19909 Centennial Ins Co 4,727,636 0.2398% 4,413,656 3,164,667 71.70%119
California Department of Insurance Page 1 of 7 Rate Specialist Bureau - 07/10/2001
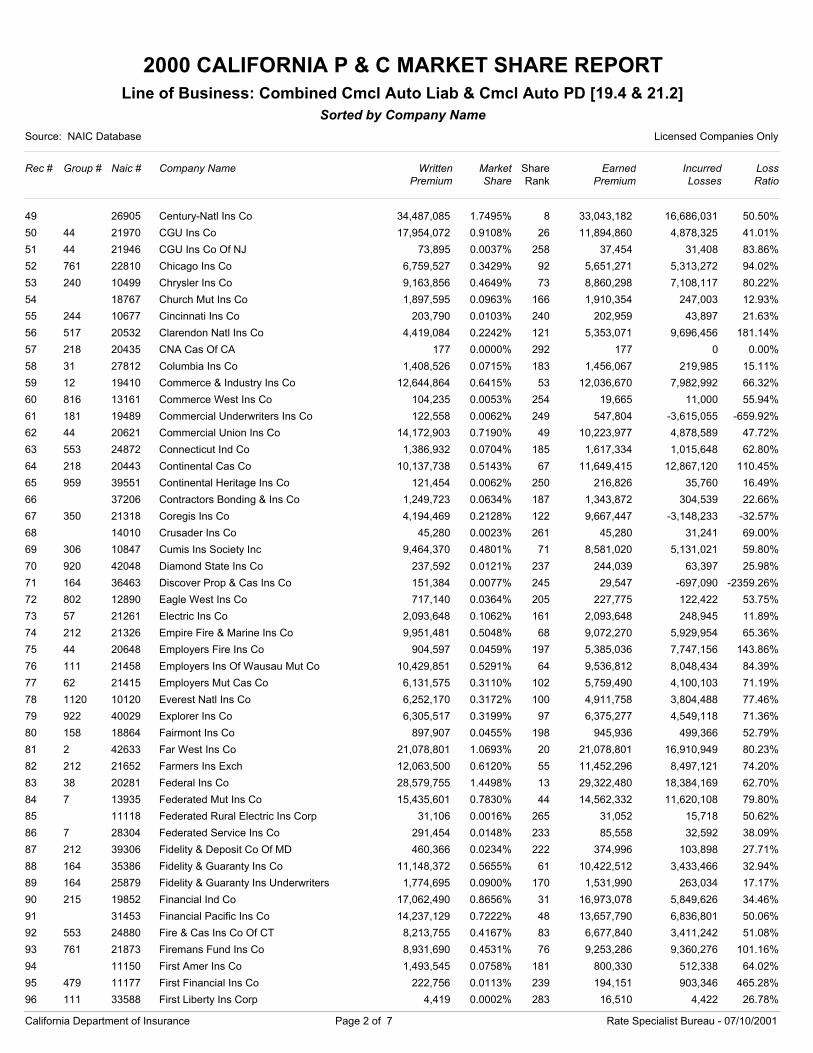
2000 CALIFORNIA P & C MARKET SHARE REPORT
Source: NAIC Database Licensed Companies Only
Rec # Group # Naic # Company Name
Line of Business: Combined Cmcl Auto Liab & Cmcl Auto PD [19.4 & 21.2]Sorted by Company Name
WrittenPremium
Market Share
EarnedPremium
IncurredLosses
LossRatio
ShareRank
49 26905 Century-Natl Ins Co 34,487,085 1.7495% 33,043,182 16,686,031 50.50%8
50 44 21970 CGU Ins Co 17,954,072 0.9108% 11,894,860 4,878,325 41.01%26
51 44 21946 CGU Ins Co Of NJ 73,895 0.0037% 37,454 31,408 83.86%258
52 761 22810 Chicago Ins Co 6,759,527 0.3429% 5,651,271 5,313,272 94.02%92
53 240 10499 Chrysler Ins Co 9,163,856 0.4649% 8,860,298 7,108,117 80.22%73
54 18767 Church Mut Ins Co 1,897,595 0.0963% 1,910,354 247,003 12.93%166
55 244 10677 Cincinnati Ins Co 203,790 0.0103% 202,959 43,897 21.63%240
56 517 20532 Clarendon Natl Ins Co 4,419,084 0.2242% 5,353,071 9,696,456 181.14%121
57 218 20435 CNA Cas Of CA 177 0.0000% 177 0 0.00%292
58 31 27812 Columbia Ins Co 1,408,526 0.0715% 1,456,067 219,985 15.11%183
59 12 19410 Commerce & Industry Ins Co 12,644,864 0.6415% 12,036,670 7,982,992 66.32%53
60 816 13161 Commerce West Ins Co 104,235 0.0053% 19,665 11,000 55.94%254
61 181 19489 Commercial Underwriters Ins Co 122,558 0.0062% 547,804 -3,615,055 -659.92%249
62 44 20621 Commercial Union Ins Co 14,172,903 0.7190% 10,223,977 4,878,589 47.72%49
63 553 24872 Connecticut Ind Co 1,386,932 0.0704% 1,617,334 1,015,648 62.80%185
64 218 20443 Continental Cas Co 10,137,738 0.5143% 11,649,415 12,867,120 110.45%67
65 959 39551 Continental Heritage Ins Co 121,454 0.0062% 216,826 35,760 16.49%250
66 37206 Contractors Bonding & Ins Co 1,249,723 0.0634% 1,343,872 304,539 22.66%187
67 350 21318 Coregis Ins Co 4,194,469 0.2128% 9,667,447 -3,148,233 -32.57%122
68 14010 Crusader Ins Co 45,280 0.0023% 45,280 31,241 69.00%261
69 306 10847 Cumis Ins Society Inc 9,464,370 0.4801% 8,581,020 5,131,021 59.80%71
70 920 42048 Diamond State Ins Co 237,592 0.0121% 244,039 63,397 25.98%237
71 164 36463 Discover Prop & Cas Ins Co 151,384 0.0077% 29,547 -697,090 -2359.26%245
72 802 12890 Eagle West Ins Co 717,140 0.0364% 227,775 122,422 53.75%205
73 57 21261 Electric Ins Co 2,093,648 0.1062% 2,093,648 248,945 11.89%161
74 212 21326 Empire Fire & Marine Ins Co 9,951,481 0.5048% 9,072,270 5,929,954 65.36%68
75 44 20648 Employers Fire Ins Co 904,597 0.0459% 5,385,036 7,747,156 143.86%197
76 111 21458 Employers Ins Of Wausau Mut Co 10,429,851 0.5291% 9,536,812 8,048,434 84.39%64
77 62 21415 Employers Mut Cas Co 6,131,575 0.3110% 5,759,490 4,100,103 71.19%102
78 1120 10120 Everest Natl Ins Co 6,252,170 0.3172% 4,911,758 3,804,488 77.46%100
79 922 40029 Explorer Ins Co 6,305,517 0.3199% 6,375,277 4,549,118 71.36%97
80 158 18864 Fairmont Ins Co 897,907 0.0455% 945,936 499,366 52.79%198
81 2 42633 Far West Ins Co 21,078,801 1.0693% 21,078,801 16,910,949 80.23%20
82 212 21652 Farmers Ins Exch 12,063,500 0.6120% 11,452,296 8,497,121 74.20%55
83 38 20281 Federal Ins Co 28,579,755 1.4498% 29,322,480 18,384,169 62.70%13
84 7 13935 Federated Mut Ins Co 15,435,601 0.7830% 14,562,332 11,620,108 79.80%44
85 11118 Federated Rural Electric Ins Corp 31,106 0.0016% 31,052 15,718 50.62%265
86 7 28304 Federated Service Ins Co 291,454 0.0148% 85,558 32,592 38.09%233
87 212 39306 Fidelity & Deposit Co Of MD 460,366 0.0234% 374,996 103,898 27.71%222
88 164 35386 Fidelity & Guaranty Ins Co 11,148,372 0.5655% 10,422,512 3,433,466 32.94%61
89 164 25879 Fidelity & Guaranty Ins Underwriters 1,774,695 0.0900% 1,531,990 263,034 17.17%170
90 215 19852 Financial Ind Co 17,062,490 0.8656% 16,973,078 5,849,626 34.46%31
91 31453 Financial Pacific Ins Co 14,237,129 0.7222% 13,657,790 6,836,801 50.06%48
92 553 24880 Fire & Cas Ins Co Of CT 8,213,755 0.4167% 6,677,840 3,411,242 51.08%83
93 761 21873 Firemans Fund Ins Co 8,931,690 0.4531% 9,253,286 9,360,276 101.16%76
94 11150 First Amer Ins Co 1,493,545 0.0758% 800,330 512,338 64.02%181
95 479 11177 First Financial Ins Co 222,756 0.0113% 194,151 903,346 465.28%239
96 111 33588 First Liberty Ins Corp 4,419 0.0002% 16,510 4,422 26.78%283
California Department of Insurance Page 2 of 7 Rate Specialist Bureau - 07/10/2001

2000 CALIFORNIA P & C MARKET SHARE REPORT
Source: NAIC Database Licensed Companies Only
Rec # Group # Naic # Company Name
Line of Business: Combined Cmcl Auto Liab & Cmcl Auto PD [19.4 & 21.2]Sorted by Company Name
WrittenPremium
Market Share
EarnedPremium
IncurredLosses
LossRatio
ShareRank
97 163 24724 First Natl Ins Co Of Amer 8,305,555 0.4213% 6,505,315 3,304,502 50.80%82
98 349 13978 Florists Mut Ins Co 2,956,456 0.1500% 2,954,684 1,318,573 44.63%143
99 790 21040 Fremont Industrial Ind Co 484,437 0.0246% 484,437 0 0.00%221
100 961 34266 Frontier Ins Co 3,064,607 0.1555% 3,673,580 11,085,463 301.76%139
101 961 42250 Frontier Pacific Ins Co 529,562 0.0269% 753,155 -494,001 -65.59%215
102 350 22225 Ge Auto & Home Assur Co 20,561 0.0010% 31,843 -37,000 -116.20%268
103 31 35882 Geico General Ins Co 97,054 0.0049% 91,253 65,943 72.26%255
104 44 21962 General Accident Ins Co 12,952,615 0.6571% 15,707,761 11,432,079 72.78%51
105 400 24414 General Cas Co Of WI 8,714 0.0004% 8,668 -1,870 -21.57%277
106 163 24732 General Ins Co Of Amer 8,628,419 0.4377% 7,929,659 4,483,325 56.54%79
107 749 16063 General Security Ins Co 18,260,438 0.9263% 18,863,798 14,587,429 77.33%25
108 1169 11231 Generali Us Branch 15,853,224 0.8042% 15,304,646 10,554,352 68.96%38
109 31 38962 Genesis Ins Co 2,161,855 0.1097% 1,399,839 5,471 0.39%159
110 553 24600 Globe Ind Co 402,454 0.0204% 501,999 160,652 32.00%226
111 39861 Golden Bear Ins Co 489,132 0.0248% 423,364 -250,000 -59.05%220
112 111 10836 Golden Eagle Ins Corp 60,104,440 3.0490% 50,642,396 23,833,923 47.06%2
113 31 22063 Government Employees Ins Co 131,133 0.0067% 132,737 115,425 86.96%247
114 83 22101 Grange Ins Assn 2,952,098 0.1498% 3,001,251 2,094,309 69.78%144
115 12 23809 Granite State Ins Co 1,034,428 0.0525% 885,557 2,377,378 268.46%192
116 201 25984 Graphic Arts Mut Ins Co 24,387 0.0012% 37,900 -31,485 -83.07%266
117 84 26832 Great American Alliance Ins Co 701,561 0.0356% 606,376 226,458 37.35%207
118 84 26344 Great American Assur Co 4,752,222 0.2411% 4,073,755 4,356,726 106.95%118
119 84 16691 Great American Ins Co 4,557,838 0.2312% 3,905,071 2,802,509 71.77%120
120 84 22136 Great American Ins Co of NY 2,615,383 0.1327% 2,590,793 985,909 38.05%150
121 38 20303 Great Northern Ins Co 397,879 0.0202% 77,667 582,093 749.47%227
122 150 11371 Great West Cas Co 5,362,652 0.2720% 5,346,964 2,264,293 42.35%112
123 1285 22322 Greenwich Ins Co 14,299,197 0.7254% 11,415,245 8,095,189 70.92%47
124 553 40541 Grocers Ins Co 704,082 0.0357% 564,187 160,218 28.40%206
125 553 26948 Guaranty Natl Ins Co Of CT 6,331,771 0.3212% 5,990,960 3,999,565 66.76%96
126 303 15032 Guideone Mut Ins Co 5,112,787 0.2594% 4,856,335 1,429,290 29.43%114
127 41 22217 Gulf Ins Co 3,675,241 0.1864% 2,845,659 1,443,411 50.72%128
128 88 22292 Hanover Ins Co 6,862,662 0.3481% 3,584,384 3,571,373 99.64%90
129 517 21806 Harbor Specialty Ins Co 2,037 0.0001% 13,868 34,296 247.30%286
130 26433 Harco Natl Ins Co 3,005,826 0.1525% 3,391,227 1,481,565 43.69%140
131 91 22357 Hartford Accid & Ind Co 520,052 0.0264% 590,266 75,623 12.81%216
132 91 29424 Hartford Cas Ins Co 16,320,161 0.8279% 14,666,198 6,643,589 45.30%35
133 91 19682 Hartford Fire In Co 18,509,402 0.9390% 17,693,158 14,066,652 79.50%24
134 91 37478 Hartford Ins Co Of The Midwest 19,118 0.0010% 25,277 32,661 129.21%270
135 91 30104 Hartford Underwriters Ins Co 565,322 0.0287% 448,023 121,472 27.11%213
136 1116 22489 Highlands Ins Co 1,879,686 0.0954% 1,211,436 207,365 17.12%168
137 212 22527 Home Ins Co 9,669 0.0005% -98,562 1,750,953 -1776.50%275
138 158 25054 Hudson Ins Co 3,147,050 0.1596% 3,075,148 6,655,217 216.42%136
139 626 43575 Indemnity Ins Co Of North Amer 10,850 0.0006% -12,645 2,073,379 -16396.83%274
140 626 22713 Insurance Co Of North Amer 10,945 0.0006% -498,360 -64,483 12.94%273
141 12 19429 Insurance Co Of The State Of PA 5,933,607 0.3010% 6,655,959 8,483,022 127.45%103
142 922 27847 Insurance Co Of The West 11,155,604 0.5659% 11,821,839 10,968,442 92.78%60
143 517 37257 Insurance Corp Of Hannover 3,919,040 0.1988% 2,352,651 1,753,456 74.53%126
144 1314 18341 Insurance Corp Of NY 16,898,766 0.8573% 16,445,028 17,804,418 108.27%32
California Department of Insurance Page 3 of 7 Rate Specialist Bureau - 07/10/2001
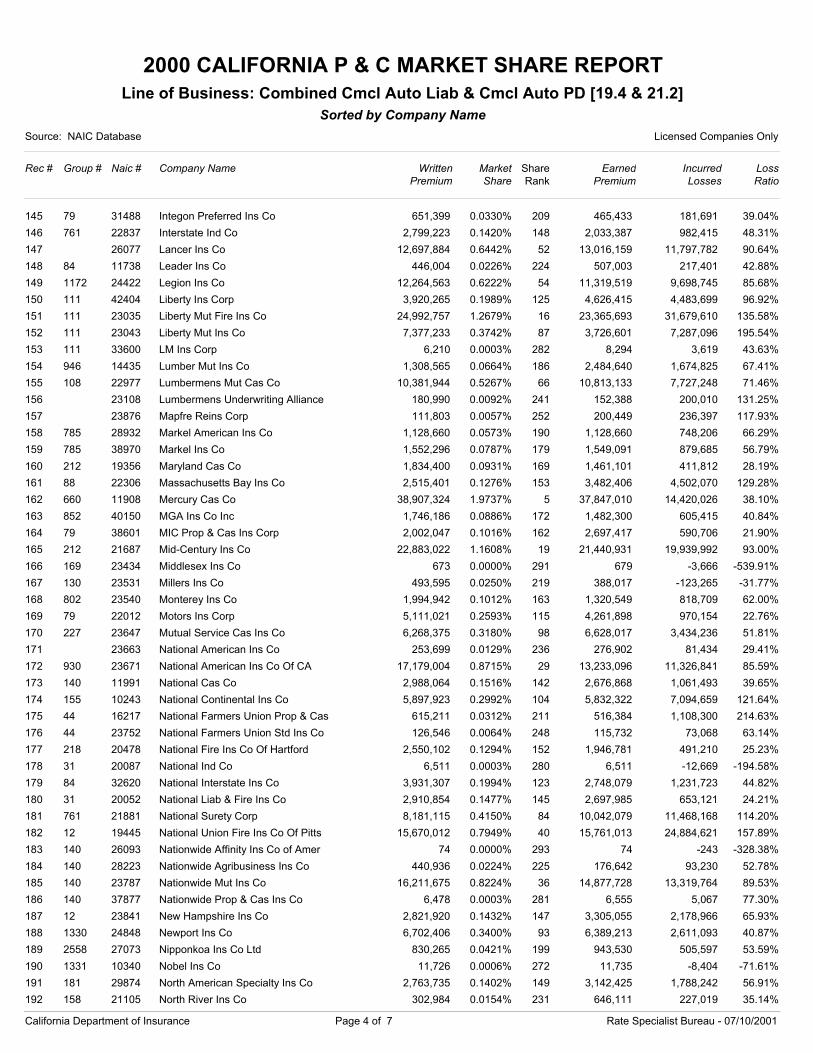
2000 CALIFORNIA P & C MARKET SHARE REPORT
Source: NAIC Database Licensed Companies Only
Rec # Group # Naic # Company Name
Line of Business: Combined Cmcl Auto Liab & Cmcl Auto PD [19.4 & 21.2]Sorted by Company Name
WrittenPremium
Market Share
EarnedPremium
IncurredLosses
LossRatio
ShareRank
145 79 31488 Integon Preferred Ins Co 651,399 0.0330% 465,433 181,691 39.04%209
146 761 22837 Interstate Ind Co 2,799,223 0.1420% 2,033,387 982,415 48.31%148
147 26077 Lancer Ins Co 12,697,884 0.6442% 13,016,159 11,797,782 90.64%52
148 84 11738 Leader Ins Co 446,004 0.0226% 507,003 217,401 42.88%224
149 1172 24422 Legion Ins Co 12,264,563 0.6222% 11,319,519 9,698,745 85.68%54
150 111 42404 Liberty Ins Corp 3,920,265 0.1989% 4,626,415 4,483,699 96.92%125
151 111 23035 Liberty Mut Fire Ins Co 24,992,757 1.2679% 23,365,693 31,679,610 135.58%16
152 111 23043 Liberty Mut Ins Co 7,377,233 0.3742% 3,726,601 7,287,096 195.54%87
153 111 33600 LM Ins Corp 6,210 0.0003% 8,294 3,619 43.63%282
154 946 14435 Lumber Mut Ins Co 1,308,565 0.0664% 2,484,640 1,674,825 67.41%186
155 108 22977 Lumbermens Mut Cas Co 10,381,944 0.5267% 10,813,133 7,727,248 71.46%66
156 23108 Lumbermens Underwriting Alliance 180,990 0.0092% 152,388 200,010 131.25%241
157 23876 Mapfre Reins Corp 111,803 0.0057% 200,449 236,397 117.93%252
158 785 28932 Markel American Ins Co 1,128,660 0.0573% 1,128,660 748,206 66.29%190
159 785 38970 Markel Ins Co 1,552,296 0.0787% 1,549,091 879,685 56.79%179
160 212 19356 Maryland Cas Co 1,834,400 0.0931% 1,461,101 411,812 28.19%169
161 88 22306 Massachusetts Bay Ins Co 2,515,401 0.1276% 3,482,406 4,502,070 129.28%153
162 660 11908 Mercury Cas Co 38,907,324 1.9737% 37,847,010 14,420,026 38.10%5
163 852 40150 MGA Ins Co Inc 1,746,186 0.0886% 1,482,300 605,415 40.84%172
164 79 38601 MIC Prop & Cas Ins Corp 2,002,047 0.1016% 2,697,417 590,706 21.90%162
165 212 21687 Mid-Century Ins Co 22,883,022 1.1608% 21,440,931 19,939,992 93.00%19
166 169 23434 Middlesex Ins Co 673 0.0000% 679 -3,666 -539.91%291
167 130 23531 Millers Ins Co 493,595 0.0250% 388,017 -123,265 -31.77%219
168 802 23540 Monterey Ins Co 1,994,942 0.1012% 1,320,549 818,709 62.00%163
169 79 22012 Motors Ins Corp 5,111,021 0.2593% 4,261,898 970,154 22.76%115
170 227 23647 Mutual Service Cas Ins Co 6,268,375 0.3180% 6,628,017 3,434,236 51.81%98
171 23663 National American Ins Co 253,699 0.0129% 276,902 81,434 29.41%236
172 930 23671 National American Ins Co Of CA 17,179,004 0.8715% 13,233,096 11,326,841 85.59%29
173 140 11991 National Cas Co 2,988,064 0.1516% 2,676,868 1,061,493 39.65%142
174 155 10243 National Continental Ins Co 5,897,923 0.2992% 5,832,322 7,094,659 121.64%104
175 44 16217 National Farmers Union Prop & Cas 615,211 0.0312% 516,384 1,108,300 214.63%211
176 44 23752 National Farmers Union Std Ins Co 126,546 0.0064% 115,732 73,068 63.14%248
177 218 20478 National Fire Ins Co Of Hartford 2,550,102 0.1294% 1,946,781 491,210 25.23%152
178 31 20087 National Ind Co 6,511 0.0003% 6,511 -12,669 -194.58%280
179 84 32620 National Interstate Ins Co 3,931,307 0.1994% 2,748,079 1,231,723 44.82%123
180 31 20052 National Liab & Fire Ins Co 2,910,854 0.1477% 2,697,985 653,121 24.21%145
181 761 21881 National Surety Corp 8,181,115 0.4150% 10,042,079 11,468,168 114.20%84
182 12 19445 National Union Fire Ins Co Of Pitts 15,670,012 0.7949% 15,761,013 24,884,621 157.89%40
183 140 26093 Nationwide Affinity Ins Co of Amer 74 0.0000% 74 -243 -328.38%293
184 140 28223 Nationwide Agribusiness Ins Co 440,936 0.0224% 176,642 93,230 52.78%225
185 140 23787 Nationwide Mut Ins Co 16,211,675 0.8224% 14,877,728 13,319,764 89.53%36
186 140 37877 Nationwide Prop & Cas Ins Co 6,478 0.0003% 6,555 5,067 77.30%281
187 12 23841 New Hampshire Ins Co 2,821,920 0.1432% 3,305,055 2,178,966 65.93%147
188 1330 24848 Newport Ins Co 6,702,406 0.3400% 6,389,213 2,611,093 40.87%93
189 2558 27073 Nipponkoa Ins Co Ltd 830,265 0.0421% 943,530 505,597 53.59%199
190 1331 10340 Nobel Ins Co 11,726 0.0006% 11,735 -8,404 -71.61%272
191 181 29874 North American Specialty Ins Co 2,763,735 0.1402% 3,142,425 1,788,242 56.91%149
192 158 21105 North River Ins Co 302,984 0.0154% 646,111 227,019 35.14%231
California Department of Insurance Page 4 of 7 Rate Specialist Bureau - 07/10/2001
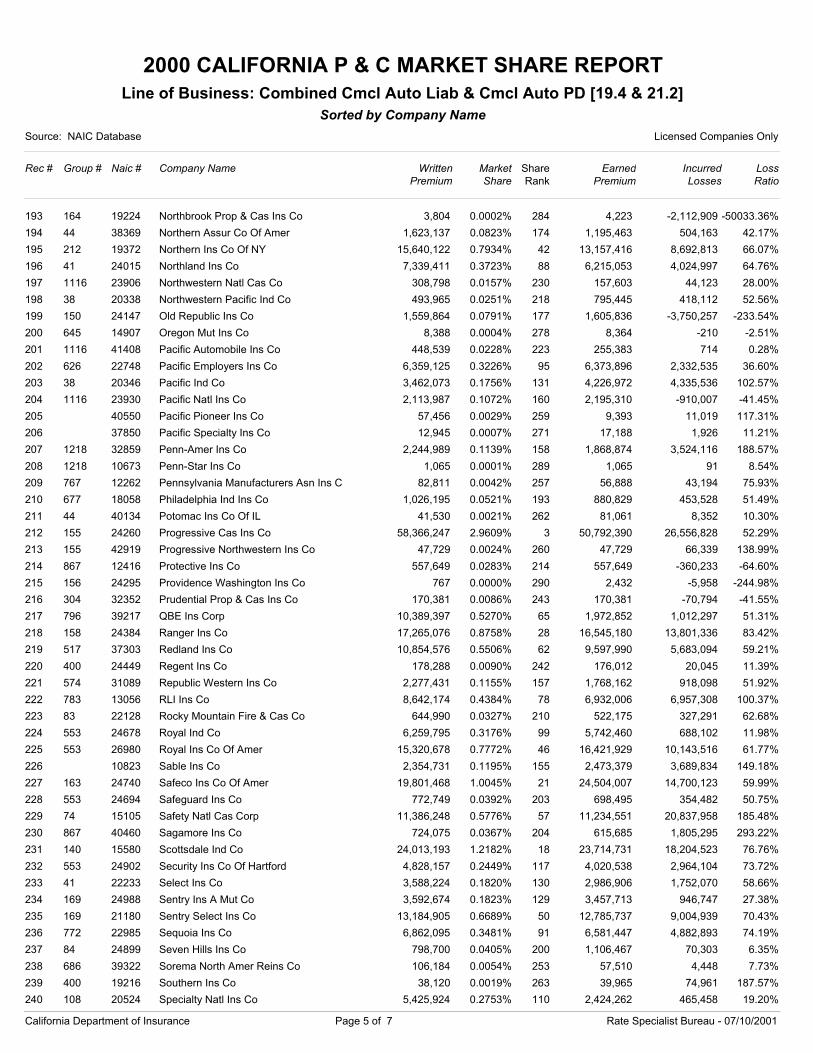
2000 CALIFORNIA P & C MARKET SHARE REPORT
Source: NAIC Database Licensed Companies Only
Rec # Group # Naic # Company Name
Line of Business: Combined Cmcl Auto Liab & Cmcl Auto PD [19.4 & 21.2]Sorted by Company Name
WrittenPremium
Market Share
EarnedPremium
IncurredLosses
LossRatio
ShareRank
193 164 19224 Northbrook Prop & Cas Ins Co 3,804 0.0002% 4,223 -2,112,909 -50033.36%284
194 44 38369 Northern Assur Co Of Amer 1,623,137 0.0823% 1,195,463 504,163 42.17%174
195 212 19372 Northern Ins Co Of NY 15,640,122 0.7934% 13,157,416 8,692,813 66.07%42
196 41 24015 Northland Ins Co 7,339,411 0.3723% 6,215,053 4,024,997 64.76%88
197 1116 23906 Northwestern Natl Cas Co 308,798 0.0157% 157,603 44,123 28.00%230
198 38 20338 Northwestern Pacific Ind Co 493,965 0.0251% 795,445 418,112 52.56%218
199 150 24147 Old Republic Ins Co 1,559,864 0.0791% 1,605,836 -3,750,257 -233.54%177
200 645 14907 Oregon Mut Ins Co 8,388 0.0004% 8,364 -210 -2.51%278
201 1116 41408 Pacific Automobile Ins Co 448,539 0.0228% 255,383 714 0.28%223
202 626 22748 Pacific Employers Ins Co 6,359,125 0.3226% 6,373,896 2,332,535 36.60%95
203 38 20346 Pacific Ind Co 3,462,073 0.1756% 4,226,972 4,335,536 102.57%131
204 1116 23930 Pacific Natl Ins Co 2,113,987 0.1072% 2,195,310 -910,007 -41.45%160
205 40550 Pacific Pioneer Ins Co 57,456 0.0029% 9,393 11,019 117.31%259
206 37850 Pacific Specialty Ins Co 12,945 0.0007% 17,188 1,926 11.21%271
207 1218 32859 Penn-Amer Ins Co 2,244,989 0.1139% 1,868,874 3,524,116 188.57%158
208 1218 10673 Penn-Star Ins Co 1,065 0.0001% 1,065 91 8.54%289
209 767 12262 Pennsylvania Manufacturers Asn Ins C 82,811 0.0042% 56,888 43,194 75.93%257
210 677 18058 Philadelphia Ind Ins Co 1,026,195 0.0521% 880,829 453,528 51.49%193
211 44 40134 Potomac Ins Co Of IL 41,530 0.0021% 81,061 8,352 10.30%262
212 155 24260 Progressive Cas Ins Co 58,366,247 2.9609% 50,792,390 26,556,828 52.29%3
213 155 42919 Progressive Northwestern Ins Co 47,729 0.0024% 47,729 66,339 138.99%260
214 867 12416 Protective Ins Co 557,649 0.0283% 557,649 -360,233 -64.60%214
215 156 24295 Providence Washington Ins Co 767 0.0000% 2,432 -5,958 -244.98%290
216 304 32352 Prudential Prop & Cas Ins Co 170,381 0.0086% 170,381 -70,794 -41.55%243
217 796 39217 QBE Ins Corp 10,389,397 0.5270% 1,972,852 1,012,297 51.31%65
218 158 24384 Ranger Ins Co 17,265,076 0.8758% 16,545,180 13,801,336 83.42%28
219 517 37303 Redland Ins Co 10,854,576 0.5506% 9,597,990 5,683,094 59.21%62
220 400 24449 Regent Ins Co 178,288 0.0090% 176,012 20,045 11.39%242
221 574 31089 Republic Western Ins Co 2,277,431 0.1155% 1,768,162 918,098 51.92%157
222 783 13056 RLI Ins Co 8,642,174 0.4384% 6,932,006 6,957,308 100.37%78
223 83 22128 Rocky Mountain Fire & Cas Co 644,990 0.0327% 522,175 327,291 62.68%210
224 553 24678 Royal Ind Co 6,259,795 0.3176% 5,742,460 688,102 11.98%99
225 553 26980 Royal Ins Co Of Amer 15,320,678 0.7772% 16,421,929 10,143,516 61.77%46
226 10823 Sable Ins Co 2,354,731 0.1195% 2,473,379 3,689,834 149.18%155
227 163 24740 Safeco Ins Co Of Amer 19,801,468 1.0045% 24,504,007 14,700,123 59.99%21
228 553 24694 Safeguard Ins Co 772,749 0.0392% 698,495 354,482 50.75%203
229 74 15105 Safety Natl Cas Corp 11,386,248 0.5776% 11,234,551 20,837,958 185.48%57
230 867 40460 Sagamore Ins Co 724,075 0.0367% 615,685 1,805,295 293.22%204
231 140 15580 Scottsdale Ind Co 24,013,193 1.2182% 23,714,731 18,204,523 76.76%18
232 553 24902 Security Ins Co Of Hartford 4,828,157 0.2449% 4,020,538 2,964,104 73.72%117
233 41 22233 Select Ins Co 3,588,224 0.1820% 2,986,906 1,752,070 58.66%130
234 169 24988 Sentry Ins A Mut Co 3,592,674 0.1823% 3,457,713 946,747 27.38%129
235 169 21180 Sentry Select Ins Co 13,184,905 0.6689% 12,785,737 9,004,939 70.43%50
236 772 22985 Sequoia Ins Co 6,862,095 0.3481% 6,581,447 4,882,893 74.19%91
237 84 24899 Seven Hills Ins Co 798,700 0.0405% 1,106,467 70,303 6.35%200
238 686 39322 Sorema North Amer Reins Co 106,184 0.0054% 57,510 4,448 7.73%253
239 400 19216 Southern Ins Co 38,120 0.0019% 39,965 74,961 187.57%263
240 108 20524 Specialty Natl Ins Co 5,425,924 0.2753% 2,424,262 465,458 19.20%110
California Department of Insurance Page 5 of 7 Rate Specialist Bureau - 07/10/2001
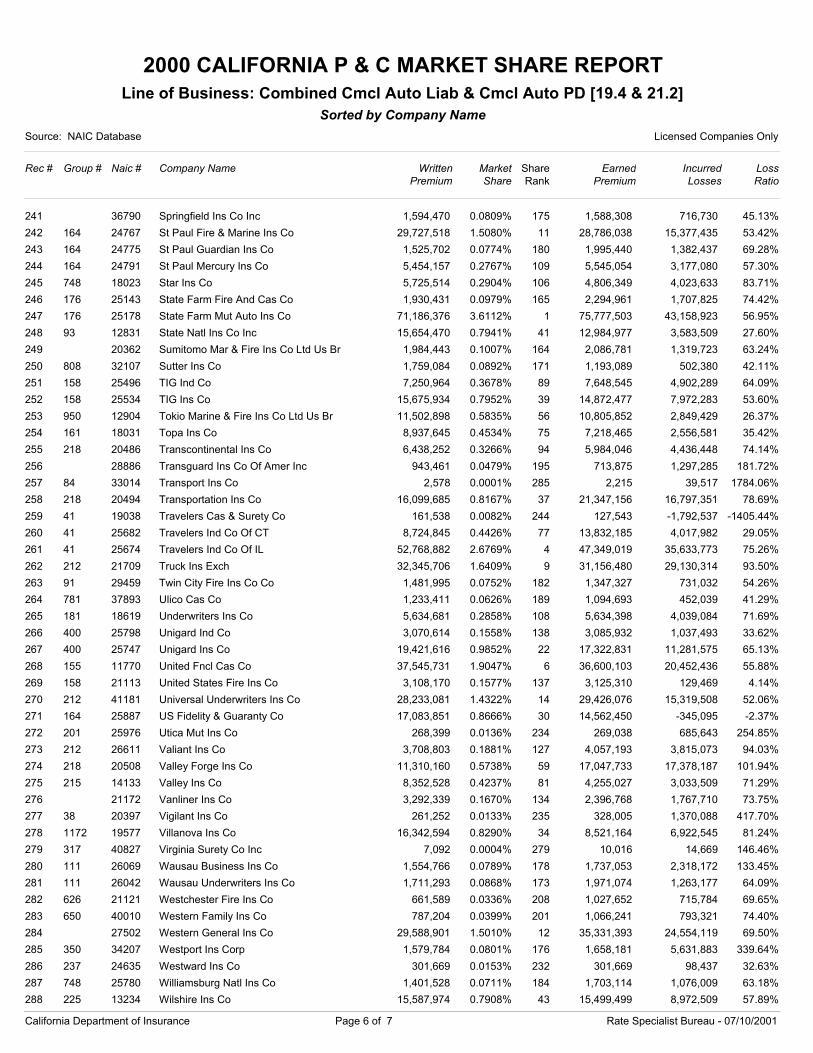
2000 CALIFORNIA P & C MARKET SHARE REPORT
Source: NAIC Database Licensed Companies Only
Rec # Group # Naic # Company Name
Line of Business: Combined Cmcl Auto Liab & Cmcl Auto PD [19.4 & 21.2]Sorted by Company Name
WrittenPremium
Market Share
EarnedPremium
IncurredLosses
LossRatio
ShareRank
241 36790 Springfield Ins Co Inc 1,594,470 0.0809% 1,588,308 716,730 45.13%175
242 164 24767 St Paul Fire & Marine Ins Co 29,727,518 1.5080% 28,786,038 15,377,435 53.42%11
243 164 24775 St Paul Guardian Ins Co 1,525,702 0.0774% 1,995,440 1,382,437 69.28%180
244 164 24791 St Paul Mercury Ins Co 5,454,157 0.2767% 5,545,054 3,177,080 57.30%109
245 748 18023 Star Ins Co 5,725,514 0.2904% 4,806,349 4,023,633 83.71%106
246 176 25143 State Farm Fire And Cas Co 1,930,431 0.0979% 2,294,961 1,707,825 74.42%165
247 176 25178 State Farm Mut Auto Ins Co 71,186,376 3.6112% 75,777,503 43,158,923 56.95%1
248 93 12831 State Natl Ins Co Inc 15,654,470 0.7941% 12,984,977 3,583,509 27.60%41
249 20362 Sumitomo Mar & Fire Ins Co Ltd Us Br 1,984,443 0.1007% 2,086,781 1,319,723 63.24%164
250 808 32107 Sutter Ins Co 1,759,084 0.0892% 1,193,089 502,380 42.11%171
251 158 25496 TIG Ind Co 7,250,964 0.3678% 7,648,545 4,902,289 64.09%89
252 158 25534 TIG Ins Co 15,675,934 0.7952% 14,872,477 7,972,283 53.60%39
253 950 12904 Tokio Marine & Fire Ins Co Ltd Us Br 11,502,898 0.5835% 10,805,852 2,849,429 26.37%56
254 161 18031 Topa Ins Co 8,937,645 0.4534% 7,218,465 2,556,581 35.42%75
255 218 20486 Transcontinental Ins Co 6,438,252 0.3266% 5,984,046 4,436,448 74.14%94
256 28886 Transguard Ins Co Of Amer Inc 943,461 0.0479% 713,875 1,297,285 181.72%195
257 84 33014 Transport Ins Co 2,578 0.0001% 2,215 39,517 1784.06%285
258 218 20494 Transportation Ins Co 16,099,685 0.8167% 21,347,156 16,797,351 78.69%37
259 41 19038 Travelers Cas & Surety Co 161,538 0.0082% 127,543 -1,792,537 -1405.44%244
260 41 25682 Travelers Ind Co Of CT 8,724,845 0.4426% 13,832,185 4,017,982 29.05%77
261 41 25674 Travelers Ind Co Of IL 52,768,882 2.6769% 47,349,019 35,633,773 75.26%4
262 212 21709 Truck Ins Exch 32,345,706 1.6409% 31,156,480 29,130,314 93.50%9
263 91 29459 Twin City Fire Ins Co Co 1,481,995 0.0752% 1,347,327 731,032 54.26%182
264 781 37893 Ulico Cas Co 1,233,411 0.0626% 1,094,693 452,039 41.29%189
265 181 18619 Underwriters Ins Co 5,634,681 0.2858% 5,634,398 4,039,084 71.69%108
266 400 25798 Unigard Ind Co 3,070,614 0.1558% 3,085,932 1,037,493 33.62%138
267 400 25747 Unigard Ins Co 19,421,616 0.9852% 17,322,831 11,281,575 65.13%22
268 155 11770 United Fncl Cas Co 37,545,731 1.9047% 36,600,103 20,452,436 55.88%6
269 158 21113 United States Fire Ins Co 3,108,170 0.1577% 3,125,310 129,469 4.14%137
270 212 41181 Universal Underwriters Ins Co 28,233,081 1.4322% 29,426,076 15,319,508 52.06%14
271 164 25887 US Fidelity & Guaranty Co 17,083,851 0.8666% 14,562,450 -345,095 -2.37%30
272 201 25976 Utica Mut Ins Co 268,399 0.0136% 269,038 685,643 254.85%234
273 212 26611 Valiant Ins Co 3,708,803 0.1881% 4,057,193 3,815,073 94.03%127
274 218 20508 Valley Forge Ins Co 11,310,160 0.5738% 17,047,733 17,378,187 101.94%59
275 215 14133 Valley Ins Co 8,352,528 0.4237% 4,255,027 3,033,509 71.29%81
276 21172 Vanliner Ins Co 3,292,339 0.1670% 2,396,768 1,767,710 73.75%134
277 38 20397 Vigilant Ins Co 261,252 0.0133% 328,005 1,370,088 417.70%235
278 1172 19577 Villanova Ins Co 16,342,594 0.8290% 8,521,164 6,922,545 81.24%34
279 317 40827 Virginia Surety Co Inc 7,092 0.0004% 10,016 14,669 146.46%279
280 111 26069 Wausau Business Ins Co 1,554,766 0.0789% 1,737,053 2,318,172 133.45%178
281 111 26042 Wausau Underwriters Ins Co 1,711,293 0.0868% 1,971,074 1,263,177 64.09%173
282 626 21121 Westchester Fire Ins Co 661,589 0.0336% 1,027,652 715,784 69.65%208
283 650 40010 Western Family Ins Co 787,204 0.0399% 1,066,241 793,321 74.40%201
284 27502 Western General Ins Co 29,588,901 1.5010% 35,331,393 24,554,119 69.50%12
285 350 34207 Westport Ins Corp 1,579,784 0.0801% 1,658,181 5,631,883 339.64%176
286 237 24635 Westward Ins Co 301,669 0.0153% 301,669 98,437 32.63%232
287 748 25780 Williamsburg Natl Ins Co 1,401,528 0.0711% 1,703,114 1,076,009 63.18%184
288 225 13234 Wilshire Ins Co 15,587,974 0.7908% 15,499,499 8,972,509 57.89%43
California Department of Insurance Page 6 of 7 Rate Specialist Bureau - 07/10/2001
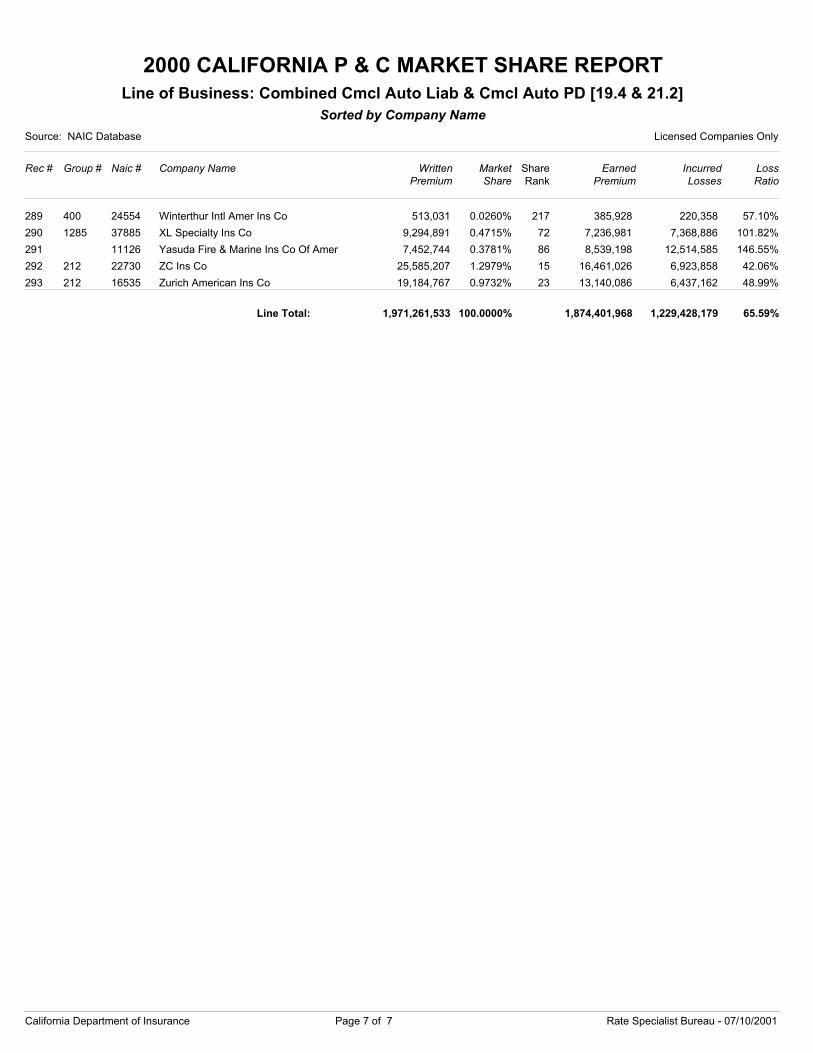
2000 CALIFORNIA P & C MARKET SHARE REPORT
Source: NAIC Database Licensed Companies Only
Rec # Group # Naic # Company Name
Line of Business: Combined Cmcl Auto Liab & Cmcl Auto PD [19.4 & 21.2]Sorted by Company Name
WrittenPremium
Market Share
EarnedPremium
IncurredLosses
LossRatio
ShareRank
289 400 24554 Winterthur Intl Amer Ins Co 513,031 0.0260% 385,928 220,358 57.10%217
290 1285 37885 XL Specialty Ins Co 9,294,891 0.4715% 7,236,981 7,368,886 101.82%72
291 11126 Yasuda Fire & Marine Ins Co Of Amer 7,452,744 0.3781% 8,539,198 12,514,585 146.55%86
292 212 22730 ZC Ins Co 25,585,207 1.2979% 16,461,026 6,923,858 42.06%15
293 212 16535 Zurich American Ins Co 19,184,767 0.9732% 13,140,086 6,437,162 48.99%23
1,971,261,533 100.0000% 1,874,401,968 1,229,428,179 65.59%Line Total:
California Department of Insurance Page 7 of 7 Rate Specialist Bureau - 07/10/2001

![2017 California Property and Casualty Market Share …...2017 California Property and Casualty Market Share Report Line of Business: Total Line [35] Sorted by: Group Market Share Source:](https://img.pdfslide.net/doc/110x75/5f61f50d6d23b743a531d094/2017-california-property-and-casualty-market-share-2017-california-property.jpg)