Embed Size (px)
Citation preview
2006 Annual Results
Paris, 15 February 2007

2
2006 Annual Results
In 2006, Capgemini has recorded very solid progress
Priorities executedPriorities executed
Doubling operating margin and net resultDoubling operating margin and net result
Optimized cost structure and deliveryOptimized cost structure and delivery
Double digit growth for our 4 disciplinesDouble digit growth for our 4 disciplines
FY 06 / FY 05
Consulting Services + 10,3 %
Technology Services + 12,8 %
SOGETI + 10,4 %
Outsourcing Services* + 12,6%
TOTAL GROUP + 12,1 %
Cost of services rendered - 0,4 pt
Selling Expenses - 1 pt
General and Administrative Expenses - 1,2 pt
Operating Margin + 2,6 pt
CONFIRM NORTH AMERICAN TURNAROUND
IMPLEMENT MAP INITIATIVE
FOCUS ON ADDING VALUE TO CLIENTS
11
22
33
x2
InM€
2005 2006
Operating Margin Net Result
225
(3,2%)
447
(5,8%)
141
293
Dividend : + 40 %* Revenue CS/TS related to Mega deals (HMRC, Schneider & TXU) reclassified in CS/TS
3
2006 Annual Results
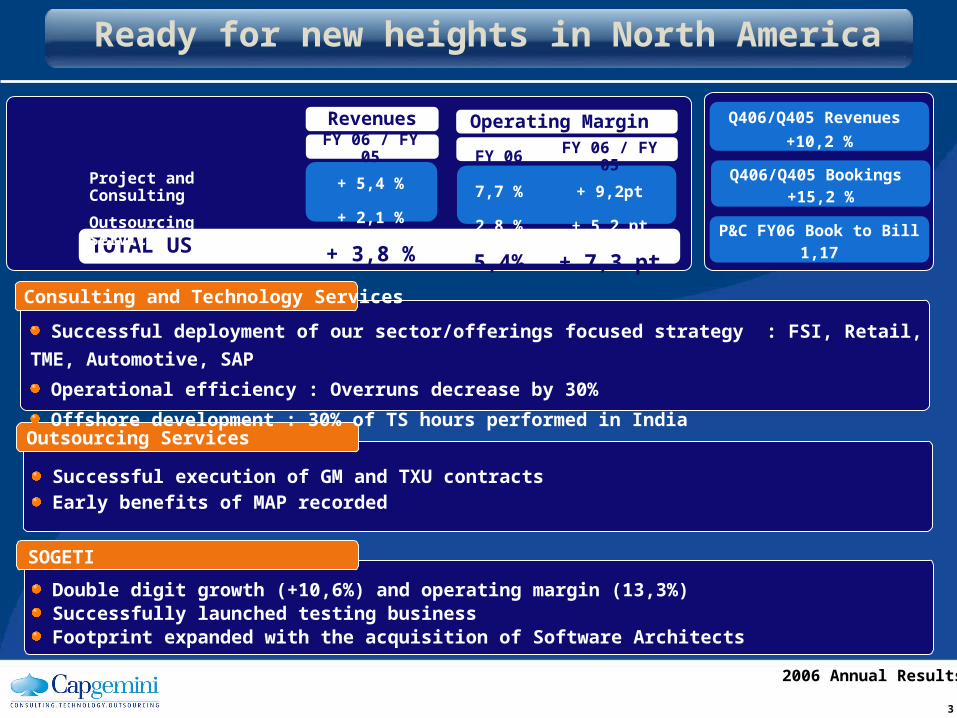
Ready for new heights in North America
SOGETI
Double digit growth (+10,6%) and operating margin (13,3%) Successfully launched testing business Footprint expanded with the acquisition of Software Architects
Outsourcing Services
Successful execution of GM and TXU contracts Early benefits of MAP recorded
Consulting and Technology Services
Successful deployment of our sector/offerings focused strategy : FSI, Retail, TME, Automotive, SAP
Operational efficiency : Overruns decrease by 30%
Offshore development : 30% of TS hours performed in India
Revenues
TOTAL US
FY 06 / FY 05
+ 5,4 %
+ 2,1 %
+ 3,8 %
Operating Margin
FY 06 FY 06 / FY 05
7,7 % + 9,2pt
2,8 % + 5,2 pt
5,4% + 7,3 pt
Project and Consulting
Outsourcing Services
Q406/Q405 Revenues
+10,2 %
Q406/Q405 Bookings +15,2 %
P&C FY06 Book to Bill1,17
4
2006 Annual Results
Mid term margin impact
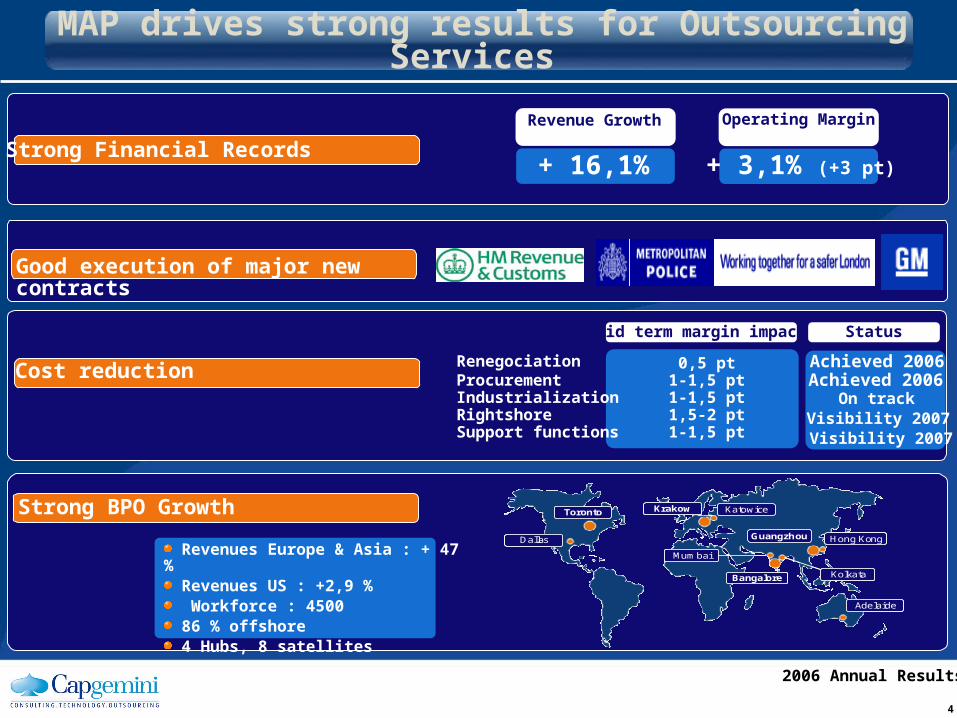
MAP drives strong results for Outsourcing Services
Renegociation 0,5 ptProcurement 1-1,5 ptIndustrialization 1-1,5 ptRightshore 1,5-2 ptSupport functions 1-1,5 pt
Operating Margin
+ 3,1% (+3 pt)
Revenue Growth
+ 16,1%Strong Financial Records
Good execution of major new contracts
Strong BPO Growth
Cost reduction
Status
Achieved 2006Achieved 2006
On trackVisibility 2007Visibility 2007
Revenues Europe & Asia : + 47 % Revenues US : +2,9 % Workforce : 4500 86 % offshore 4 Hubs, 8 satellites
Toronto
Dallas
KatowiceKrakow
Bangalore
Guangzhou Hong Kong
Adelaide
Kolkata
Mumbai
Toronto
Dallas
KatowiceKrakow
Bangalore
Guangzhou Hong Kong
Adelaide
Kolkata
Mumbai
5
2006 Annual Results
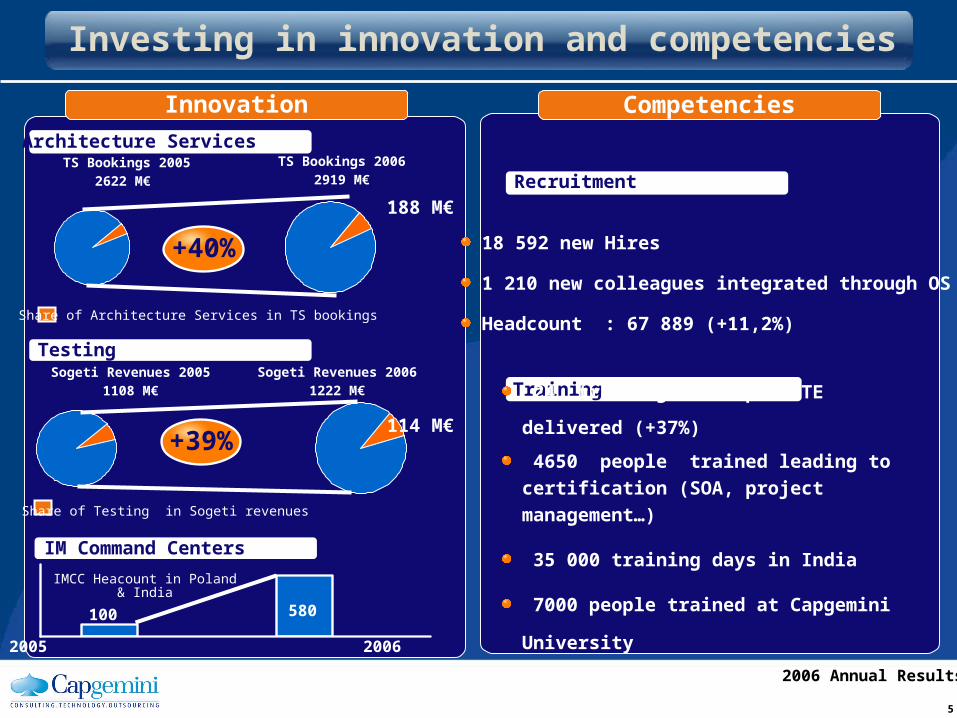
Architecture ServicesTS Bookings 2005
2622 M€
TS Bookings 20062919 M€
TestingSogeti Revenues 2005
1108 M€
Sogeti Revenues 20061222 M€
Recruitment
18 592 new Hires
1 210 new colleagues integrated through OS
Headcount : 67 889 (+11,2%)
Training
24 training hours per FTE delivered (+37%)
4650 people trained leading to certification
(SOA, project management…)
35 000 training days in India
7000 people trained at Capgemini University
Investing in innovation and competencies
Innovation Competencies
+40%
188 M€
+39%114 M€
Share of Architecture Services in TS bookings
Share of Testing in Sogeti revenues
IM Command Centers
580100
2005 2006
IMCC Heacount in Poland & India
6
2006 Annual Results
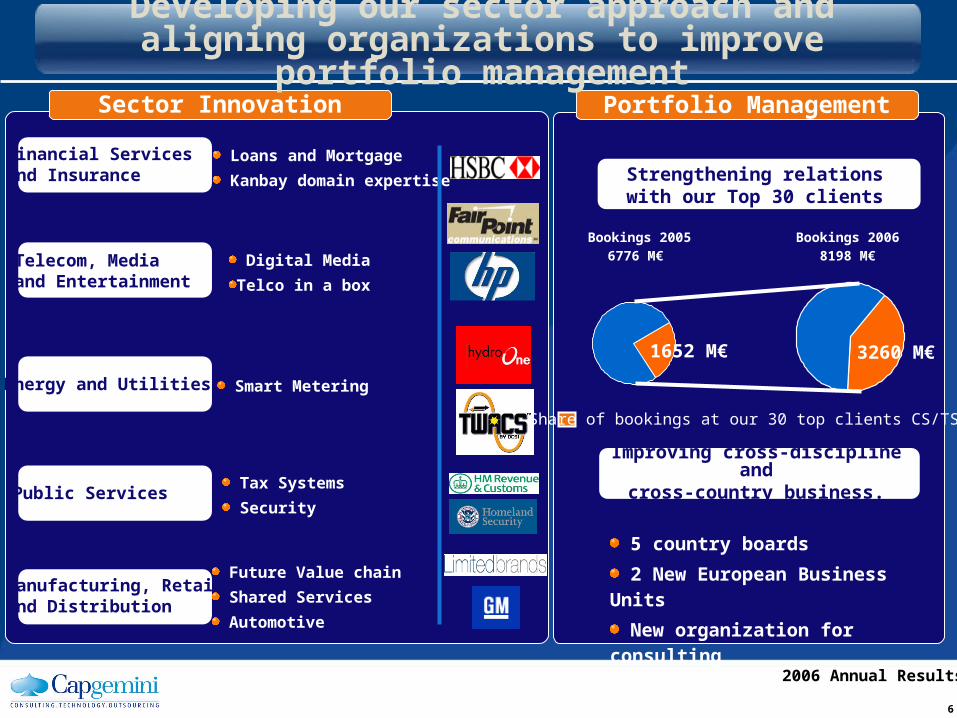
Sector Innovation Portfolio Management
Financial Services and Insurance
Telecom, Media and Entertainment
Energy and Utilities
Public Services
Manufacturing, Retailand Distribution
Loans and Mortgage
Kanbay domain expertise
Digital Media
Telco in a box
Smart Metering
Tax Systems
Security
Future Value chain
Shared Services
Automotive
Improving cross-discipline andcross-country business.
Bookings 20056776 M€
Bookings 20068198 M€
Strengthening relations with our Top 30 clients
5 country boards
2 New European Business Units
New organization for consulting
Developing our sector approach and aligning organizations to improve portfolio management
HMRC
Homeland
Share of bookings at our 30 top clients CS/TS/OS
1652 M€ 3260 M€
7
2006 Annual Results
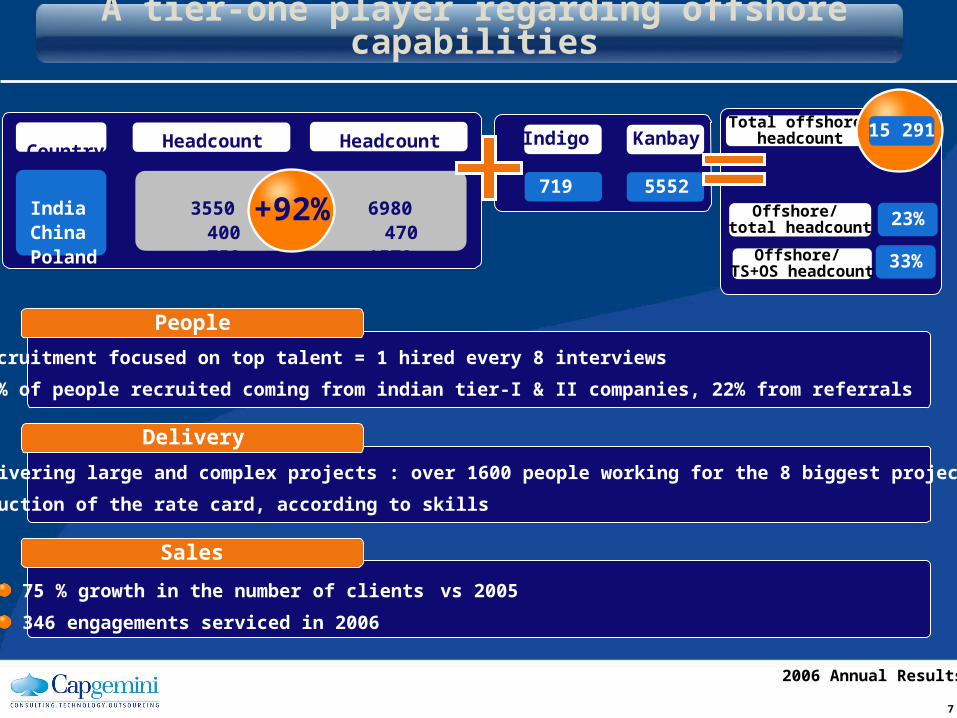
A tier-one player regarding offshore capabilities
People
Sales
Recruitment focused on top talent = 1 hired every 8 interviews
53% of people recruited coming from indian tier-I & II companies, 22% from referrals
Delivering large and complex projects : over 1600 people working for the 8 biggest projects
Reduction of the rate card, according to skills
75 % growth in the number of clients vs 2005
346 engagements serviced in 2006
Delivery
Country Headcount 2005 Headcount 2006
India 3550 6980
China 400 470
Poland 750 1570
Indigo Kanbay
719 5552+92% 23%
33%
Offshore/ total headcount
Offshore/ TS+OS headcount
Total offshore headcount 15 291

8
2006 Annual Results
Our 2007 priorities : Going one step beyond
Fight For Leadership Keep Transforming
NORTH AMERICA : Join top 3 in
selected domain areas
BPO : Extend footprint beyond F&A
FINANCIAL SERVICES :
Consolidate tier-one status leveraging
Kanbay
KANBAY : Drive successful integration
I3 : Accelerate the Group positive
momentum
CONSULTING SERVICES : Roll out
a renewed ambition
9
2006 Annual Results
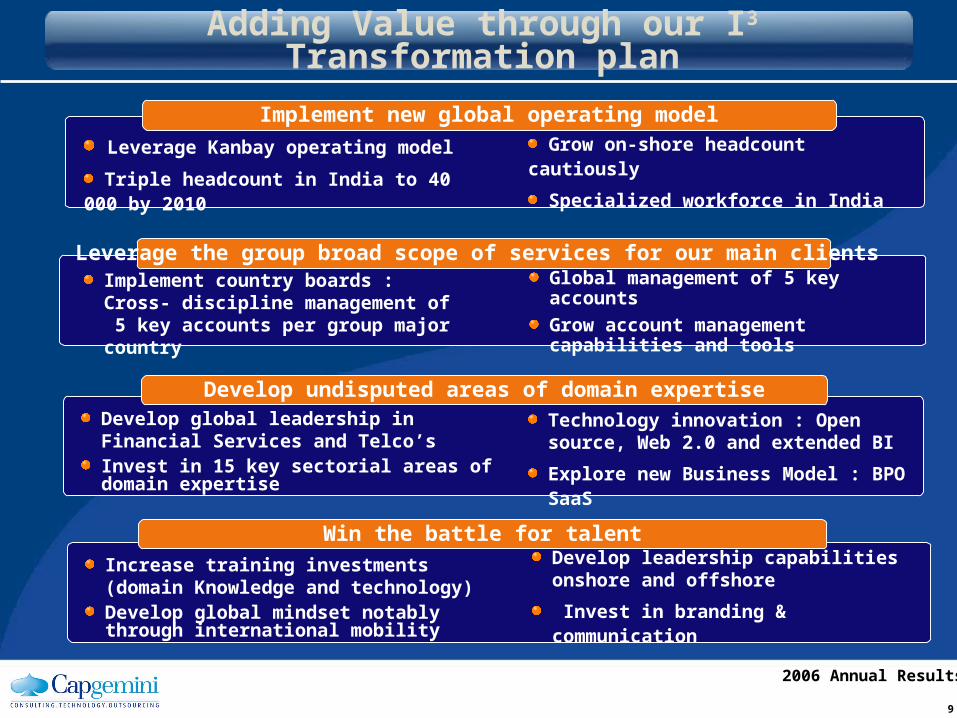
Adding Value through our I3 Transformation plan
Leverage Kanbay operating model
Triple headcount in India to 40 000 by 2010
Implement new global operating model
Win the battle for talent
Develop undisputed areas of domain expertise
Grow on-shore headcount cautiously
Specialized workforce in India
Implement country boards : Cross- discipline management of 5 key accounts per group major country
Leverage the group broad scope of services for our main clients Global management of 5 key accounts
Grow account management capabilities and tools
Develop global leadership in Financial Services and Telco’sInvest in 15 key sectorial areas of domain expertise
Technology innovation : Open source, Web 2.0 and extended BI
Explore new Business Model : BPO SaaS
Increase training investments (domain Knowledge and technology)Develop global mindset notably through international mobility
Develop leadership capabilities onshore and offshore
Invest in branding & communication
10
2006 Annual Results
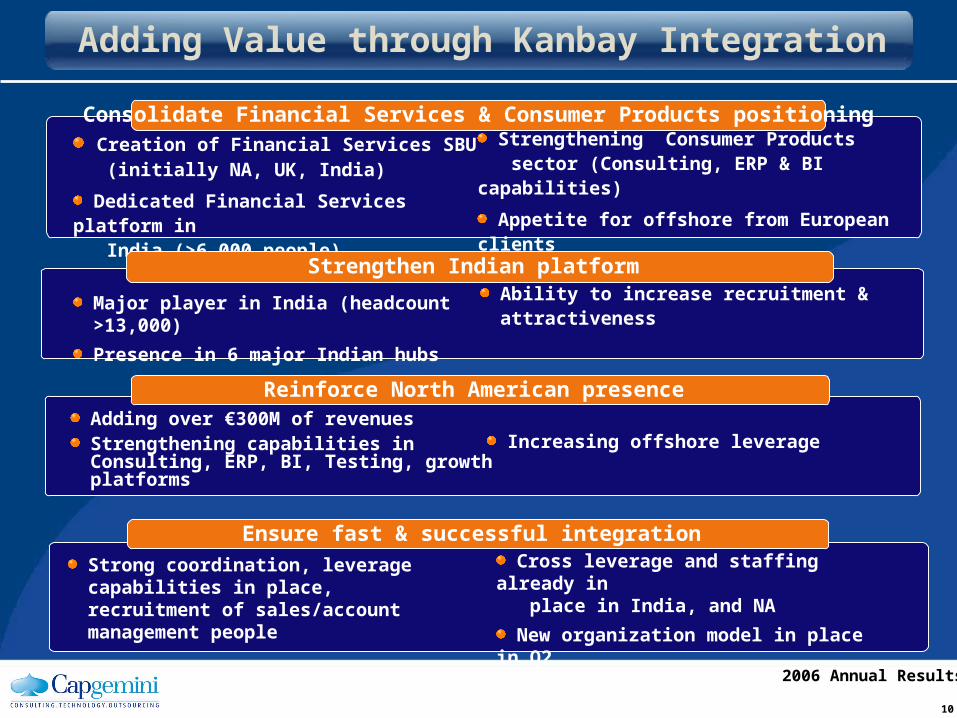
Adding Value through Kanbay Integration
Creation of Financial Services SBU (initially NA, UK, India)
Dedicated Financial Services platform in India (>6,000 people)
Consolidate Financial Services & Consumer Products positioning
Ensure fast & successful integration
Reinforce North American presence
Strengthening Consumer Products
sector (Consulting, ERP & BI capabilities)
Appetite for offshore from European clients
Major player in India (headcount >13,000)
Presence in 6 major Indian hubs
Strengthen Indian platform
Ability to increase recruitment & attractiveness
Adding over €300M of revenuesStrengthening capabilities in Consulting, ERP, BI, Testing, growth platforms
Increasing offshore leverage
Strong coordination, leverage capabilities in place, recruitment of sales/account management people
Cross leverage and staffing already in place in India, and NA
New organization model in place in Q2

Financials
12
2006 Annual Results
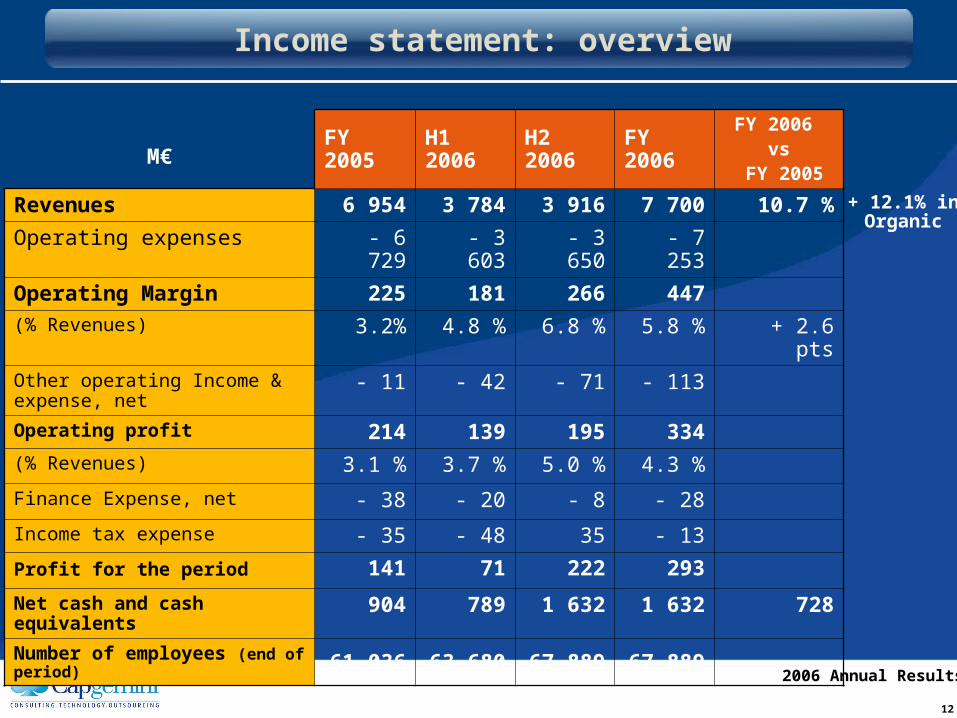
M€ FY 2005 H1 2006 H2 2006 FY 2006FY 2006
vs FY 2005
Revenues 6 954 3 784 3 916 7 700 10.7 %
Operating expenses - 6 729 - 3 603 - 3 650 - 7 253
Operating Margin 225 181 266 447
(% Revenues) 3.2% 4.8 % 6.8 % 5.8 % + 2.6 pts
Other operating Income & expense, net
- 11 - 42 - 71 - 113
Operating profit 214 139 195 334
(% Revenues) 3.1 % 3.7 % 5.0 % 4.3 %
Finance Expense, net - 38 - 20 - 8 - 28
Income tax expense - 35 - 48 35 - 13
Profit for the period 141 71 222 293
Net cash and cash equivalents 904 789 1 632 1 632 728
Number of employees (end of period) 61 036 63 680 67 889 67 889
Income statement: overview
+ 12.1% inOrganic
13
2006 Annual Results
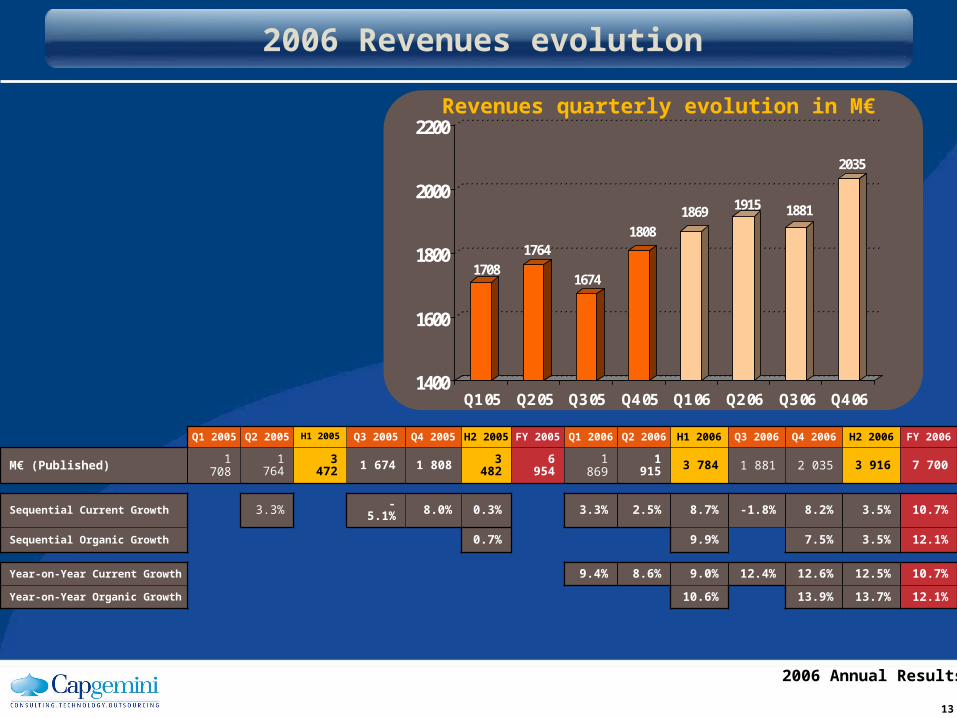
Q1 2005 Q2 2005 H1 2005 Q3 2005 Q4 2005 H2 2005 FY 2005 Q1 2006 Q2 2006 H1 2006 Q3 2006 Q4 2006 H2 2006 FY 2006
M€ (Published) 1 708 1 764 3 472 1 674 1 808 3 482 6 954 1 869 1 915 3 784 1 881 2 035 3 916 7 700
Sequential Current Growth 3.3% - 5.1% 8.0% 0.3% 3.3% 2.5% 8.7% -1.8% 8.2% 3.5% 10.7%
Sequential Organic Growth 0.7% 9.9% 7.5% 3.5% 12.1%
Year-on-Year Current Growth 9.4% 8.6% 9.0% 12.4% 12.6% 12.5% 10.7%
Year-on-Year Organic Growth 10.6% 13.9% 13.7% 12.1%
1708
1764
1674
1808
1869 1915 1881
2035
1400
1600
1800
2000
2200
Q1 05 Q2 05 Q3 05 Q4 05 Q1 06 Q2 06 Q3 06 Q4 06
2006 Revenues evolution
Revenues quarterly evolution in M€
14
2006 Annual Results
Current Organic
Current Sequential Year on year Sequential Year on
year
Q4 2005 Q3 2006 Q4 2006Q4 06 / Q3 06
Q4 06 / Q4 05
Q4 06 / Q3 06
Q4 06 / Q4 05
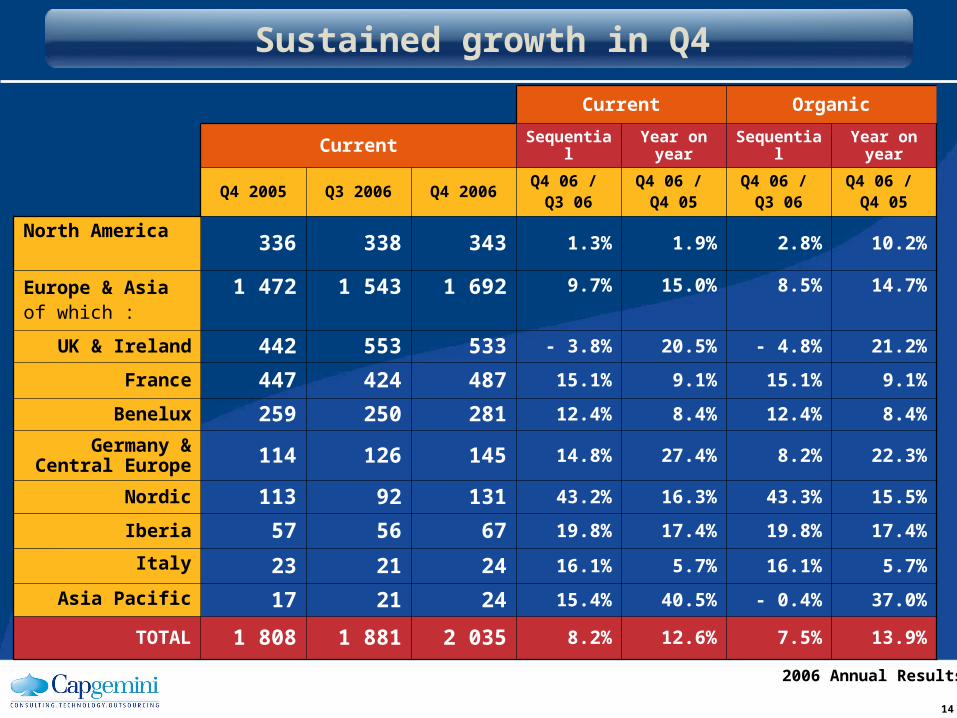
North America336 338 343 1.3% 1.9% 2.8% 10.2%
Europe & Asiaof which :
1 472 1 543 1 692 9.7% 15.0% 8.5% 14.7%
UK & Ireland 442 553 533 - 3.8% 20.5% - 4.8% 21.2%
France 447 424 487 15.1% 9.1% 15.1% 9.1%
Benelux 259 250 281 12.4% 8.4% 12.4% 8.4%
Germany & Central Europe 114 126 145 14.8% 27.4% 8.2% 22.3%
Nordic 113 92 131 43.2% 16.3% 43.3% 15.5%
Iberia 57 56 67 19.8% 17.4% 19.8% 17.4%
Italy 23 21 24 16.1% 5.7% 16.1% 5.7%
Asia Pacific 17 21 24 15.4% 40.5% - 0.4% 37.0%
TOTAL 1 808 1 881 2 035 8.2% 12.6% 7.5% 13.9%
Sustained growth in Q4
15
2006 Annual Results
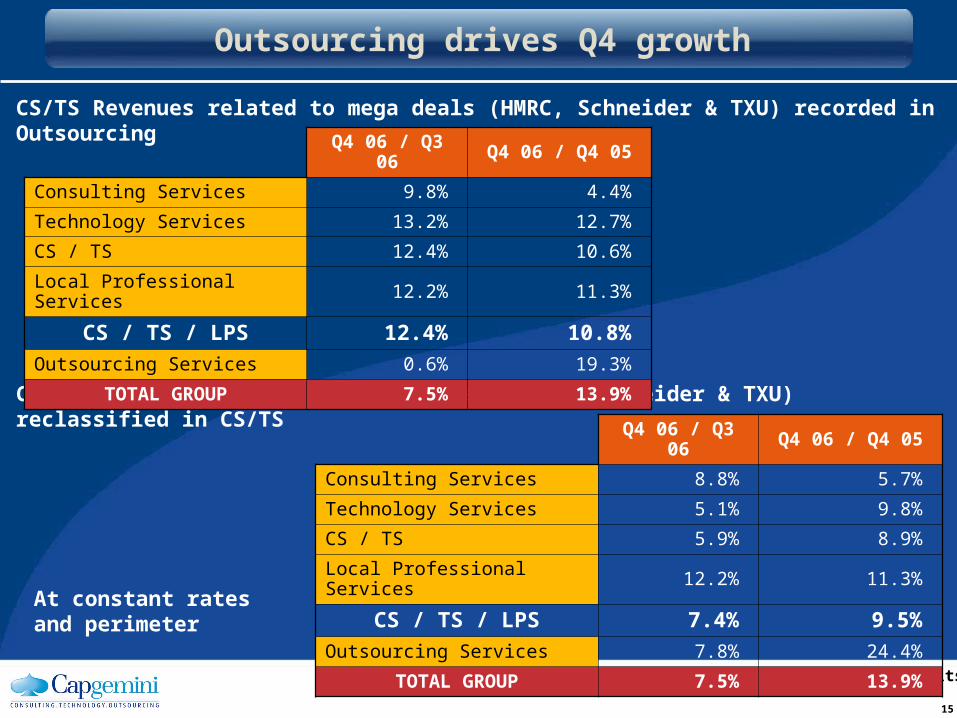
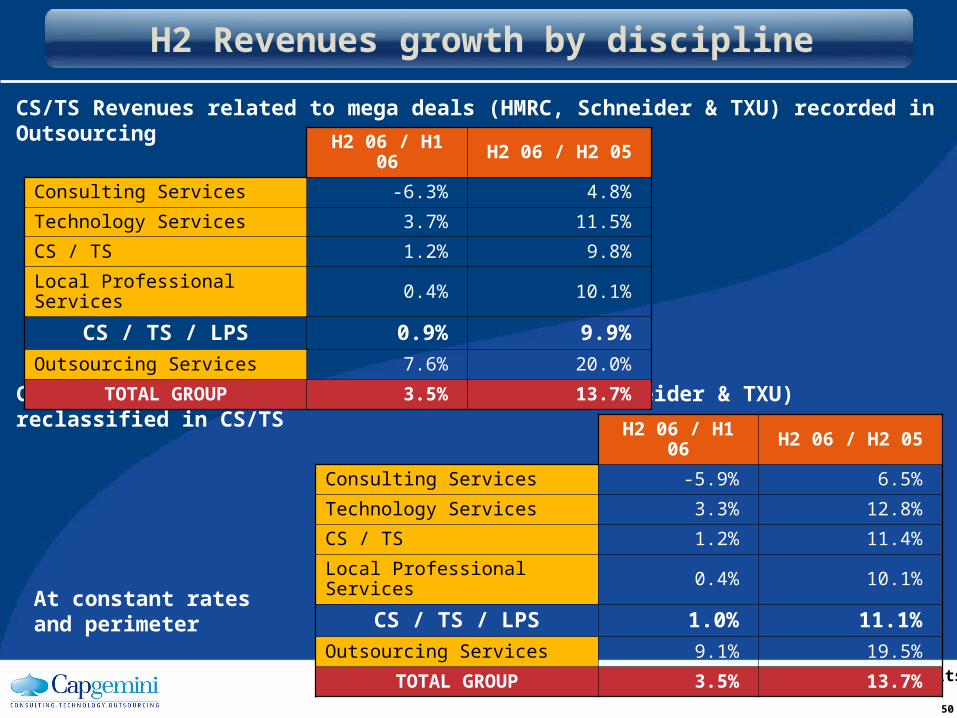
CS/TS Revenues related to mega deals (HMRC, Schneider & TXU) recorded in Outsourcing
CS/TS Revenues related to mega deals (HMRC, Schneider & TXU) reclassified in CS/TS
Outsourcing drives Q4 growth
Q4 06 / Q3 06 Q4 06 / Q4 05
Consulting Services 9.8% 4.4%
Technology Services 13.2% 12.7%
CS / TS 12.4% 10.6%
Local Professional Services 12.2% 11.3%
CS / TS / LPS 12.4% 10.8%
Outsourcing Services 0.6% 19.3%
TOTAL GROUP 7.5% 13.9%
Q4 06 / Q3 06 Q4 06 / Q4 05
Consulting Services 8.8% 5.7%
Technology Services 5.1% 9.8%
CS / TS 5.9% 8.9%
Local Professional Services 12.2% 11.3%
CS / TS / LPS 7.4% 9.5%
Outsourcing Services 7.8% 24.4%
TOTAL GROUP 7.5% 13.9%
At constant ratesand perimeter
16
2006 Annual Results
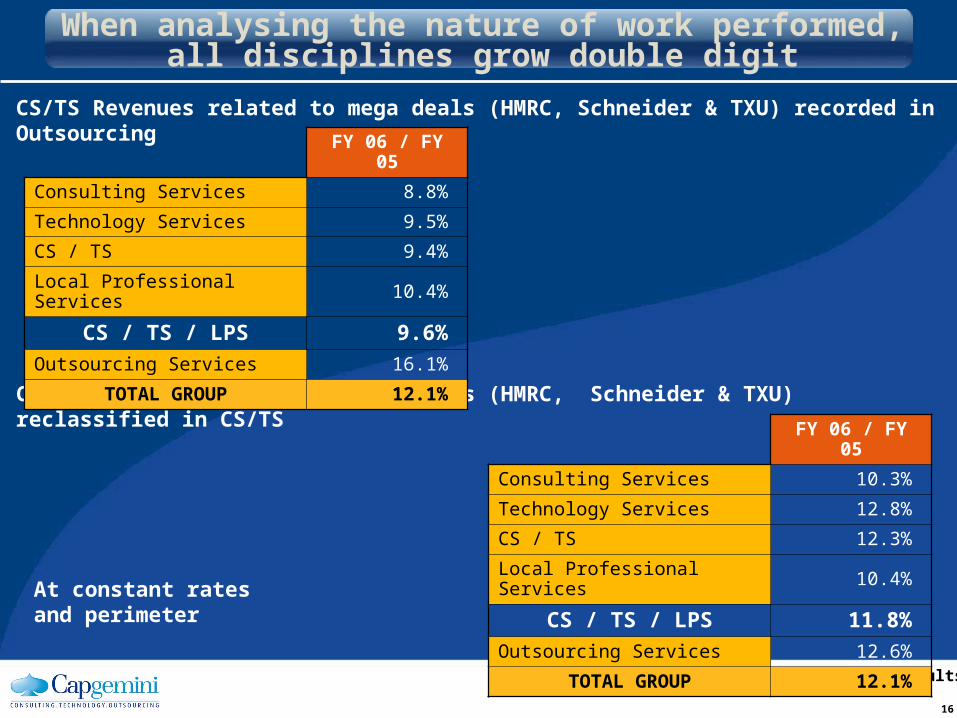
CS/TS Revenues related to mega deals (HMRC, Schneider & TXU) recorded in Outsourcing
CS/TS Revenues related to mega deals (HMRC, Schneider & TXU) reclassified in CS/TS
When analysing the nature of work performed, all disciplines grow double digit
FY 06 / FY 05
Consulting Services 8.8%
Technology Services 9.5%
CS / TS 9.4%
Local Professional Services 10.4%
CS / TS / LPS 9.6%
Outsourcing Services 16.1%
TOTAL GROUP 12.1%
FY 06 / FY 05
Consulting Services 10.3%
Technology Services 12.8%
CS / TS 12.3%
Local Professional Services 10.4%
CS / TS / LPS 11.8%
Outsourcing Services 12.6%
TOTAL GROUP 12.1%
At constant ratesand perimeter
17
2006 Annual Results
Current Organic
M€
Current Year on year
Year on year
FY 05 FY 06 FY 06 / FY 05 FY 06 / FY 05
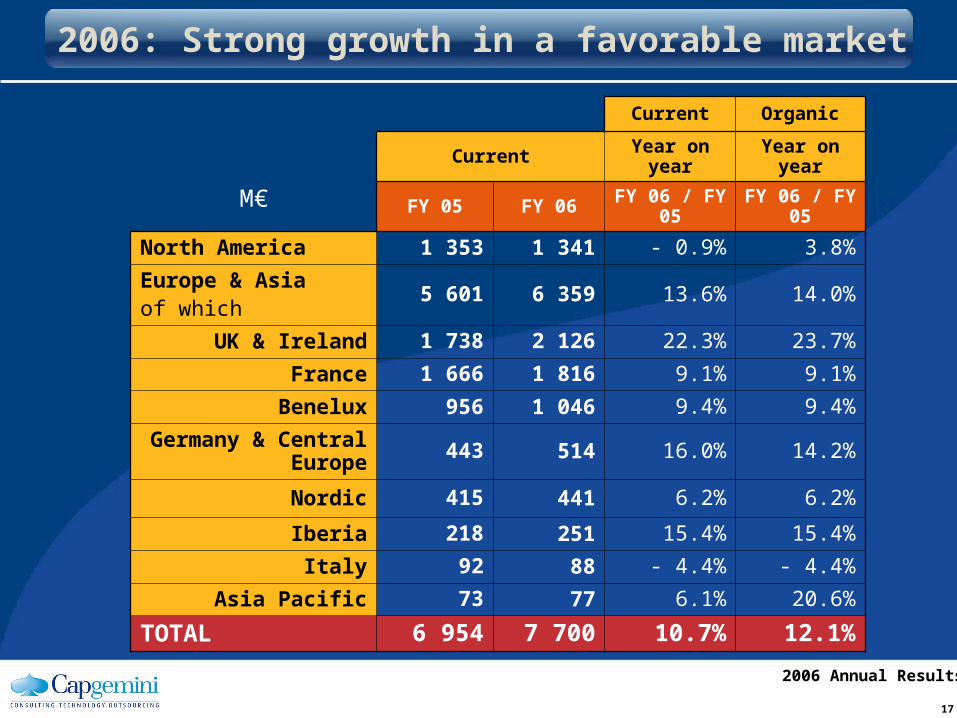
North America 1 353 1 341 - 0.9% 3.8%
Europe & Asiaof which
5 601 6 359 13.6% 14.0%
UK & Ireland 1 738 2 126 22.3% 23.7%
France 1 666 1 816 9.1% 9.1%
Benelux 956 1 046 9.4% 9.4%
Germany & Central Europe 443 514 16.0% 14.2%
Nordic 415 441 6.2% 6.2%
Iberia 218 251 15.4% 15.4%
Italy 92 88 - 4.4% - 4.4%
Asia Pacific 73 77 6.1% 20.6%
TOTAL 6 954 7 700 10.7% 12.1%
2006: Strong growth in a favorable market
18
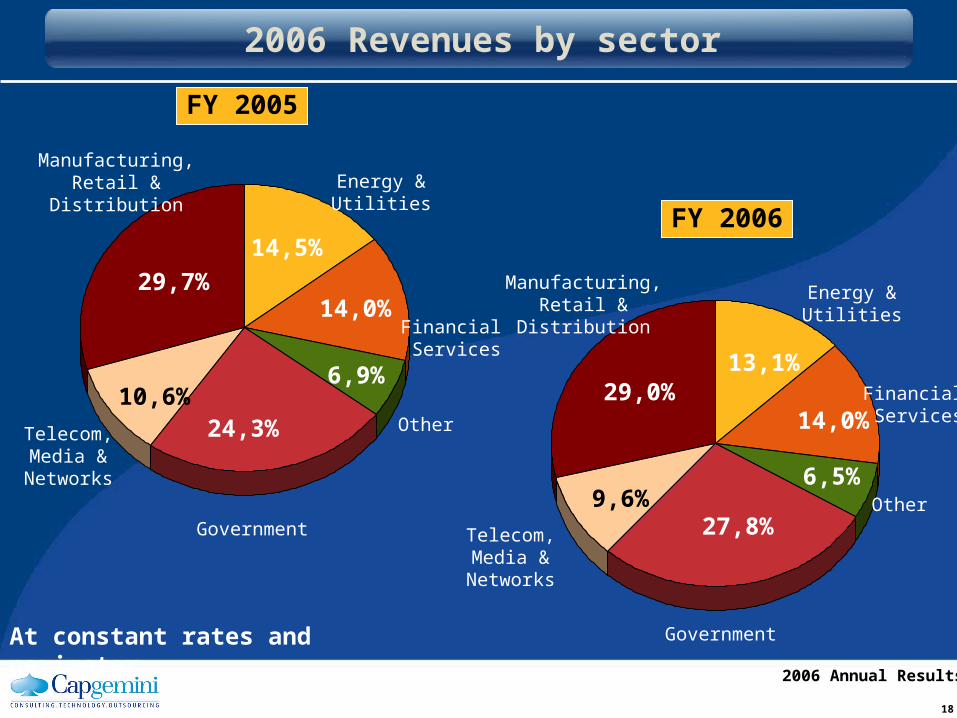
2006 Annual Results
13,1%
6,5%
27,8%9,6%
29,0%14,0%
14,5%
14,0%
6,9%
24,3%10,6%
29,7%
FY 2005
FY 2006
At constant rates and perimeter
Energy & Utilities
Financial Services
Other
Government
Telecom, Media & Networks
Manufacturing, Retail & Distribution
Energy & Utilities
Financial Services
Other
Government
Telecom, Media & Networks
Manufacturing, Retail & Distribution
2006 Revenues by sector
19
2006 Annual Results
Bookings evolution by discipline
At constant rates and perimeter
1 119
277
1 226
490
953
320
1 274
1 117
1 230
1 760
1 376
329
1 117
406
1 311
669
0
500
1 000
1 500
2 000
2 500
3 000
3 500
Q1 05 Q2 05 Q3 05 Q4 05 Q1 06 Q2 06 Q3 06 Q4 06
Outsourcing
Project & Consulting
M€
1 396
1 716
1 273
2 391
2 990
1 7051 523
1 980
6 776 8 198

20
2006 Annual Results
Consulting, Technology and Local Professional Services Bookings
800
900
1000
1100
1200
1300
1400
Q1 Q2 Q3 Q4
200420052006

21
2006 Annual Results
CS / TS / LPS
Bookings Revenues BBR
North America 822 704 1.17
Rest of the world 4 212 3 984 1.06
TOTAL 5 034 4 688 1.07
At budget rates
Book to Bill CS / TS / LPS – FY 2006
M€

22
2006 Annual Results
Charge-out rate – Consulting Services – Quarter evolution
980
1080
1180
1280
1380
1480
2005 2006
1272
12181210
12251200
1222
1189
1246
At constant rates and perimeter
23
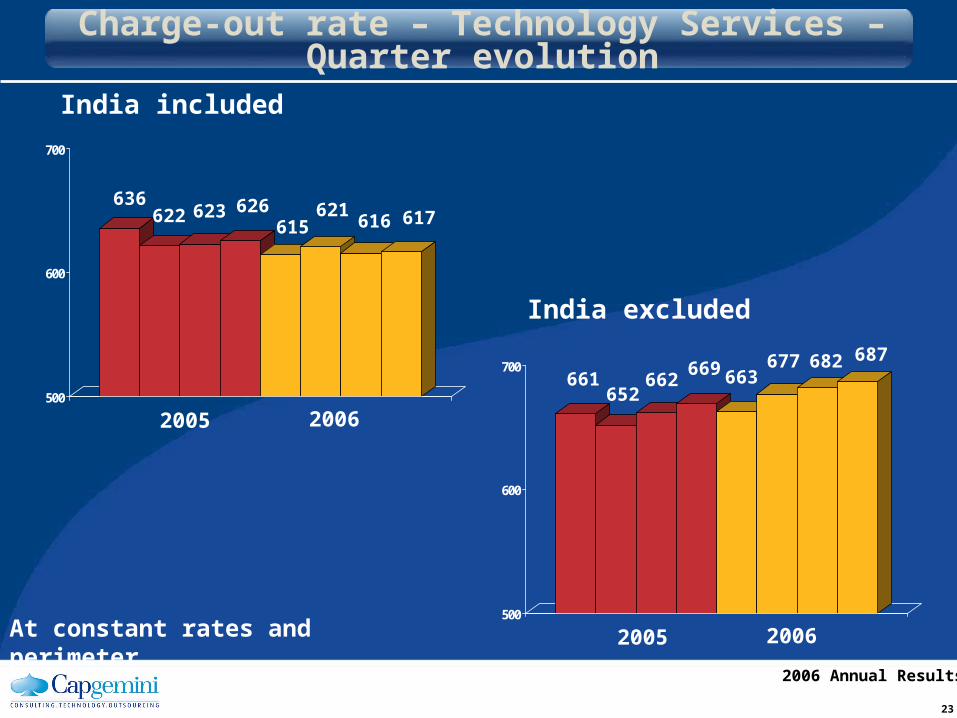
2006 Annual Results
Charge-out rate – Technology Services – Quarter evolution
500
600
700
500
600
700
2005 2006
2005 2006
636622 623 626
615621
616 617
661652
662669 663
677 682 687
India included
India excluded
At constant rates and perimeter
24
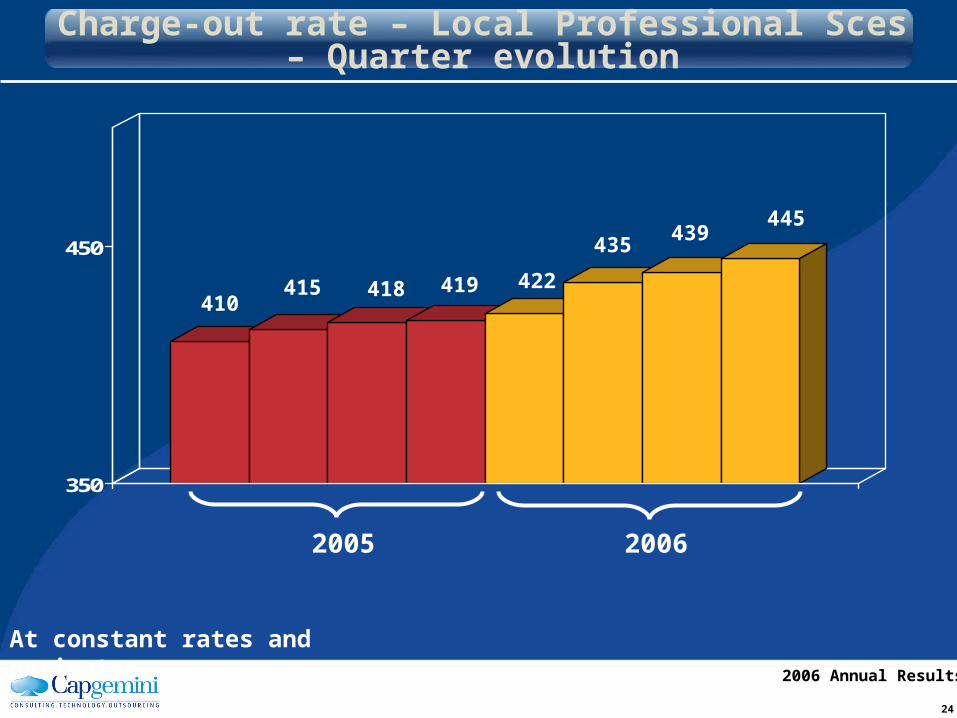
2006 Annual Results
Charge-out rate – Local Professional Sces – Quarter evolution
350
450
2005 2006
410415 418 419 422
435439
445
At constant rates and perimeter
25
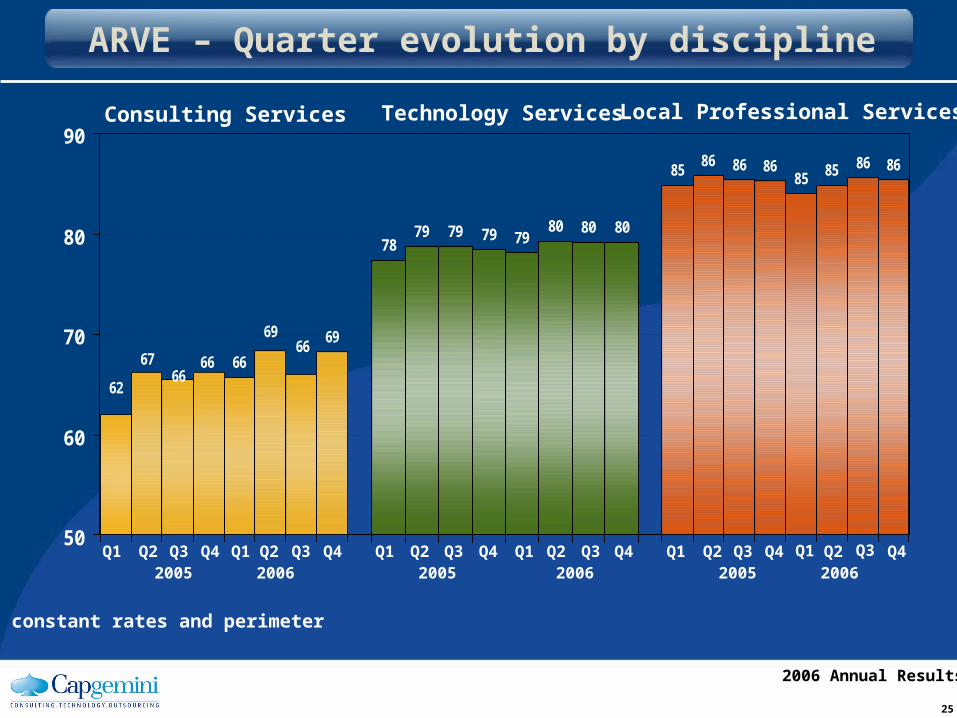
2006 Annual Results
50
60
70
80
90
6966
69
666666
67
62
7879 79 79 79
80 80 80
8586 86 86
85 85 86 86
Consulting Services Technology Services Local Professional Services
At constant rates and perimeter
Q1 Q2 Q2 Q4Q42005 2006
Q3Q3 Q1 Q1 Q2 Q2 Q4Q42005 2006
Q3Q3 Q1Q1 Q2 Q2 Q4Q42005 2006
Q3Q3 Q1
ARVE – Quarter evolution by discipline

26
2006 Annual Results
Consulting Services & Local Professional Services at double digit operating margin in H2
H1 2005 H2 2005 FY 2005 H1 2006 H2 2006 FY 2006
Consulting ServicesTechnology ServicesLocal Professional ServicesCS / TS / LPS
1.8%3.7%8.0%4.3%
7.4%6.5%
10.2%7.6%
4.5%5.1%9.1%6.0%
8.9%6.4%8.4%7.4%
11.5%8.5%
11.2%9.7%
10.1%7.5%9.8%8.6%
Outsourcing Services -1.2% 1.5% 0.1% 2.0% 4.1% 3.1%
Total Operations (1) 2.3% 5.3% 3.8% 5.4% 7.5% 6.4%
TOTAL 1.8% 4.7% 3.2% 4.8% 6.8% 5.8%(1) before headquarters’ expenses
At current rates and perimeter
27
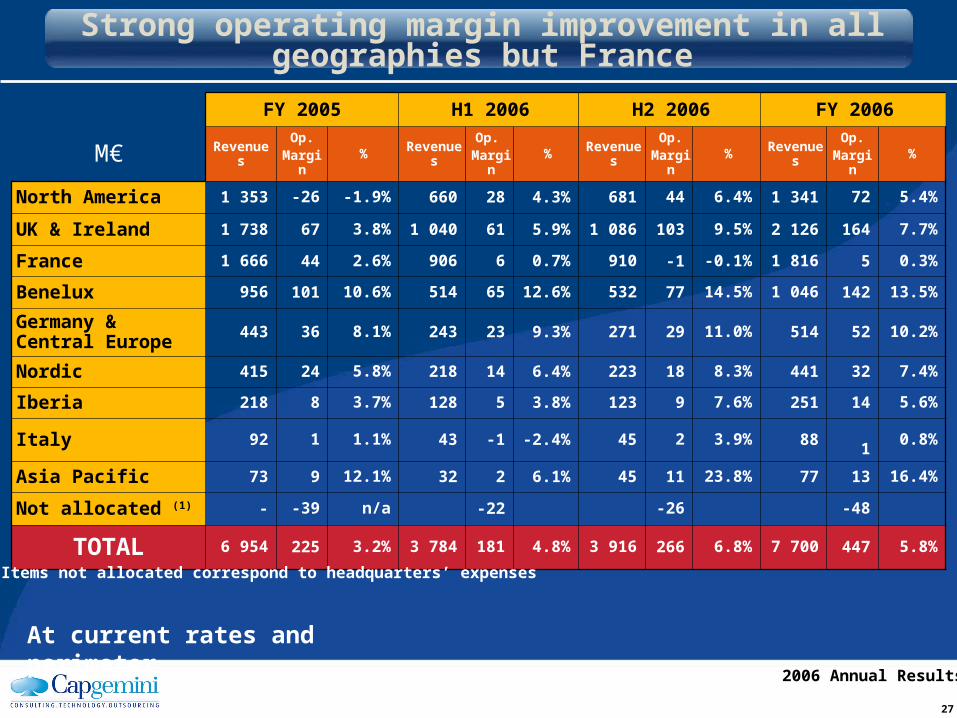
2006 Annual Results
FY 2005 H1 2006 H2 2006 FY 2006
M€ RevenuesOp.
Margin% Revenues
Op. Margin
% RevenuesOp.
Margin% Revenues
Op.Margin
%
North America 1 353 -26 -1.9% 660 28 4.3% 681 44 6.4% 1 341 72 5.4%
UK & Ireland 1 738 67 3.8% 1 040 61 5.9% 1 086 103 9.5% 2 126 164 7.7%
France 1 666 44 2.6% 906 6 0.7% 910 -1 -0.1% 1 816 5 0.3%
Benelux 956 101 10.6% 514 65 12.6% 532 77 14.5% 1 046 142 13.5%
Germany & Central Europe
443 36 8.1% 243 23 9.3% 271 29 11.0% 514 52 10.2%
Nordic 415 24 5.8% 218 14 6.4% 223 18 8.3% 441 32 7.4%
Iberia 218 8 3.7% 128 5 3.8% 123 9 7.6% 251 14 5.6%
Italy 92 1 1.1% 43 -1 -2.4% 45 2 3.9% 881
0.8%
Asia Pacific 73 9 12.1% 32 2 6.1% 45 11 23.8% 77 13 16.4%
Not allocated (1) - -39 n/a -22 -26 -48
TOTAL 6 954 225 3.2% 3 784 181 4.8% 3 916 266 6.8% 7 700 447 5.8%
Strong operating margin improvement in all geographies but France
(1) Items not allocated correspond to headquarters’ expenses
At current rates and perimeter
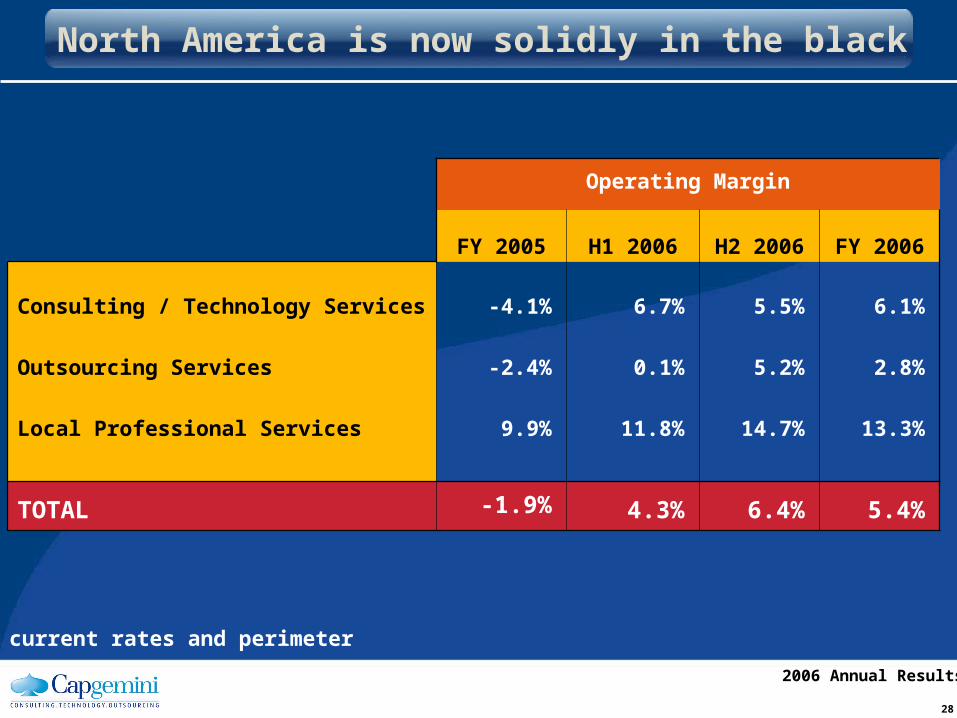
28
2006 Annual Results
Operating Margin
FY 2005 H1 2006 H2 2006 FY 2006
Consulting / Technology Services
Outsourcing Services
Local Professional Services
-4.1%
-2.4%
9.9%
6.7%
0.1%
11.8%
5.5%
5.2%
14.7%
6.1%
2.8%
13.3%
TOTAL -1.9% 4.3% 6.4% 5.4%
North America is now solidly in the black
At current rates and perimeter
29
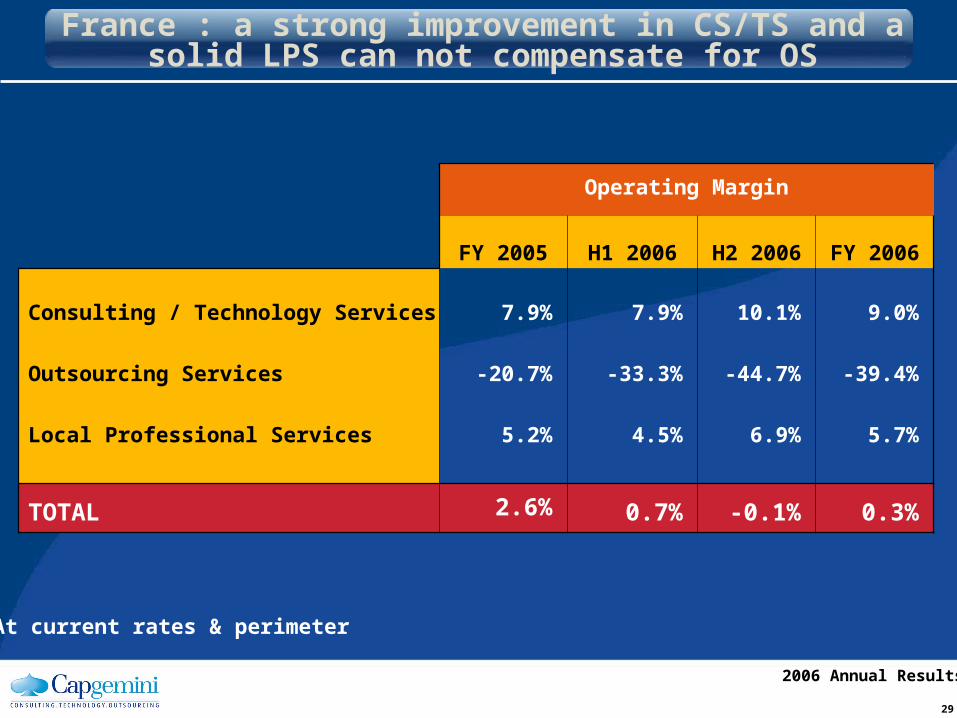
2006 Annual Results
At current rates & perimeter
France : a strong improvement in CS/TS and a solid LPS can not compensate for OS
Operating Margin
FY 2005 H1 2006 H2 2006 FY 2006
Consulting / Technology Services
Outsourcing Services
Local Professional Services
7.9%
-20.7%
5.2%
7.9%
-33.3%
4.5%
10.1%
-44.7%
6.9%
9.0%
-39.4%
5.7%
TOTAL 2.6% 0.7% -0.1% 0.3%

30
2006 Annual Results
M€ FY 2005 H1 2006 H2 2006 FY 2006
Revenues 6 954 3 784 3 916 7 700
Cost of services rendered -5 377 -2 915 -3 005 -5 920% of Revenues 77.3% 77.0% 76.7% 76.9%
Gross Margin 1 577 869 911 1 780% of Revenues 22.7% 23.0% 23.3% 23.1%
Selling expenses -524 -265 -243 -508% of Revenues 7.6% 7.0% 6.2% 6.6%
General & Admin. Expenses -828 -423 -402 -825% of Revenues 11.9% 11.2% 10.3% 10.7%
Operating Margin 225 181 266 447% of Revenues 3.2% 4.8% 6.8% 5.8%
SG&A are down in absolute terms despite a double digit growth in revenues
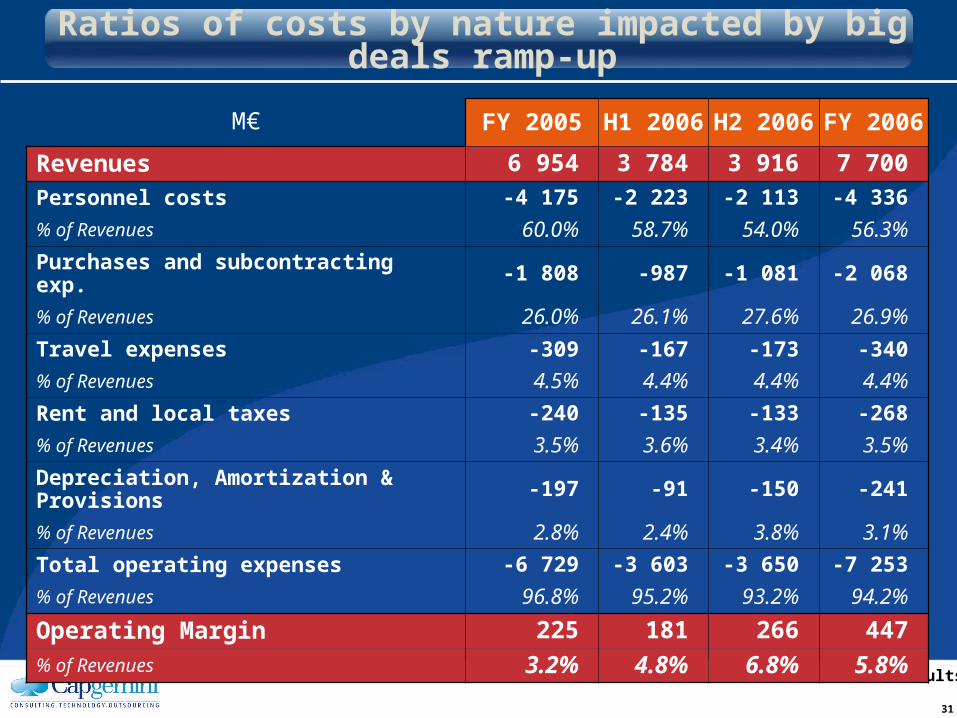
31
2006 Annual Results
M€ FY 2005 H1 2006 H2 2006 FY 2006
Revenues 6 954 3 784 3 916 7 700
Personnel costs -4 175 -2 223 -2 113 -4 336
% of Revenues 60.0% 58.7% 54.0% 56.3%
Purchases and subcontracting exp. -1 808 -987 -1 081 -2 068
% of Revenues 26.0% 26.1% 27.6% 26.9%
Travel expenses -309 -167 -173 -340
% of Revenues 4.5% 4.4% 4.4% 4.4%
Rent and local taxes -240 -135 -133 -268
% of Revenues 3.5% 3.6% 3.4% 3.5%
Depreciation, Amortization & Provisions -197 -91 -150 -241
% of Revenues 2.8% 2.4% 3.8% 3.1%
Total operating expenses -6 729 -3 603 -3 650 -7 253
% of Revenues 96.8% 95.2% 93.2% 94.2%
Operating Margin 225 181 266 447
% of Revenues 3.2% 4.8% 6.8% 5.8%
Ratios of costs by nature impacted by big deals ramp-up
32
2006 Annual Results
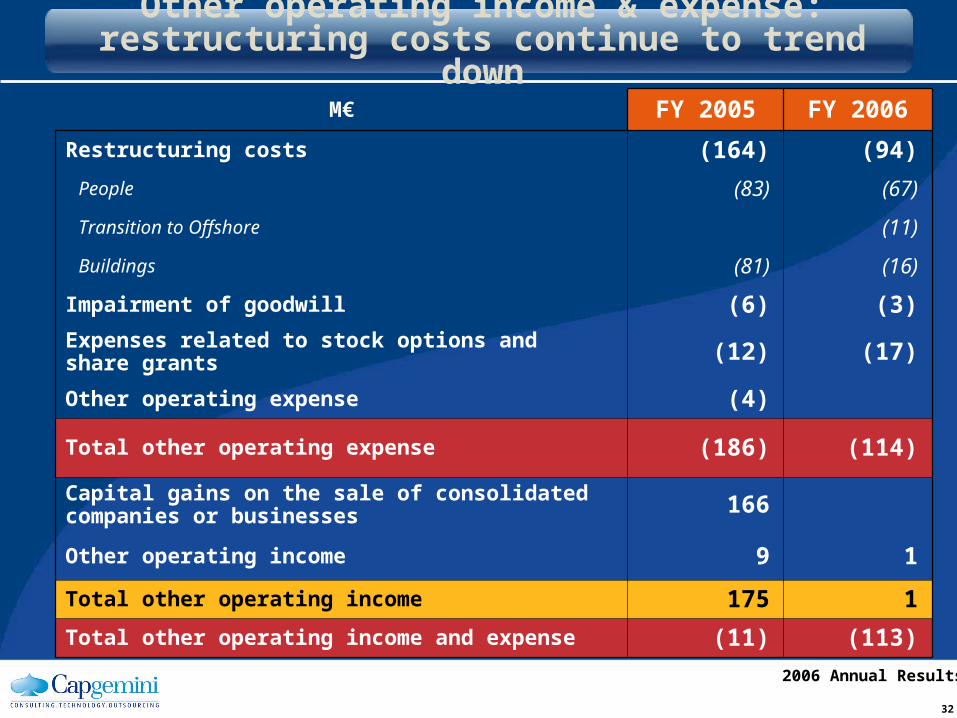
M€ FY 2005 FY 2006
Restructuring costs (164) (94)
People (83) (67)
Transition to Offshore (11)
Buildings (81) (16)
Impairment of goodwill (6) (3)
Expenses related to stock options and share grants (12) (17)
Other operating expense (4)
Total other operating expense (186) (114)
Capital gains on the sale of consolidated companies or businesses 166
Other operating income 9 1
Total other operating income 175 1
Total other operating income and expense (11) (113)
Other operating income & expense:restructuring costs continue to trend down
33
2006 Annual Results
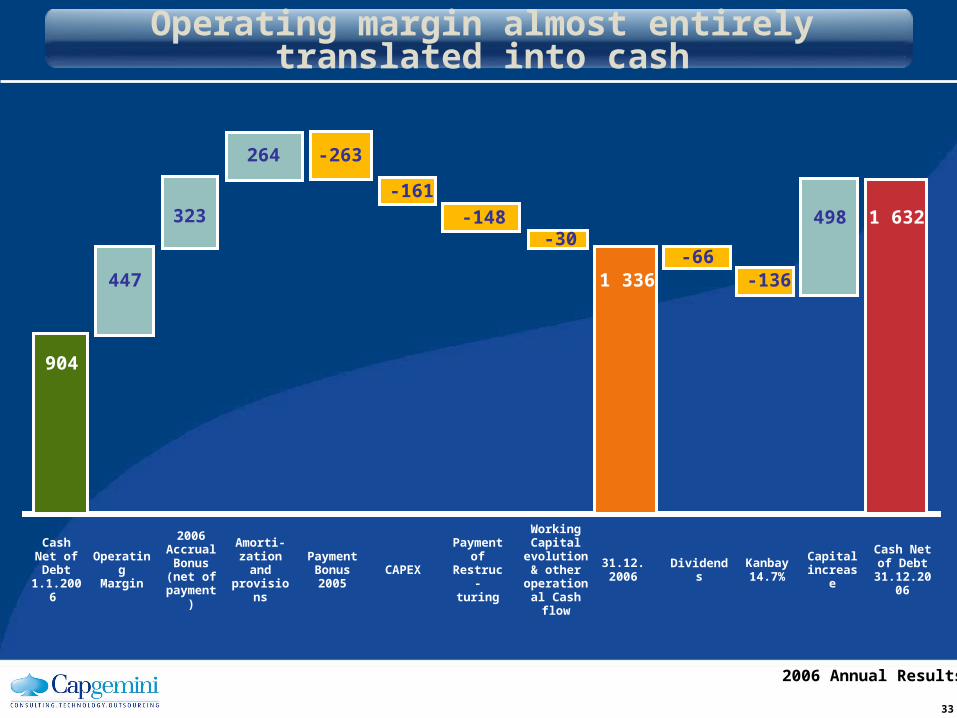
Operating margin almost entirely translated into cash
Cash Net of Debt
1.1.2006
OperatingMargin
2006AccrualBonus (net of
payment)
Amorti-zation andprovisions
PaymentBonus2005
CAPEX
Paymentof
Restruc-turing
Working Capital
evolution & other
operational Cash flow
31.12.2006
DividendsKanbay14.7%
Capital increase
Cash Net of Debt
31.12.2006
264 -263
-161323 -148 498 1 632
-30-66
447 1 336 -136
904
34
2006 Annual Results
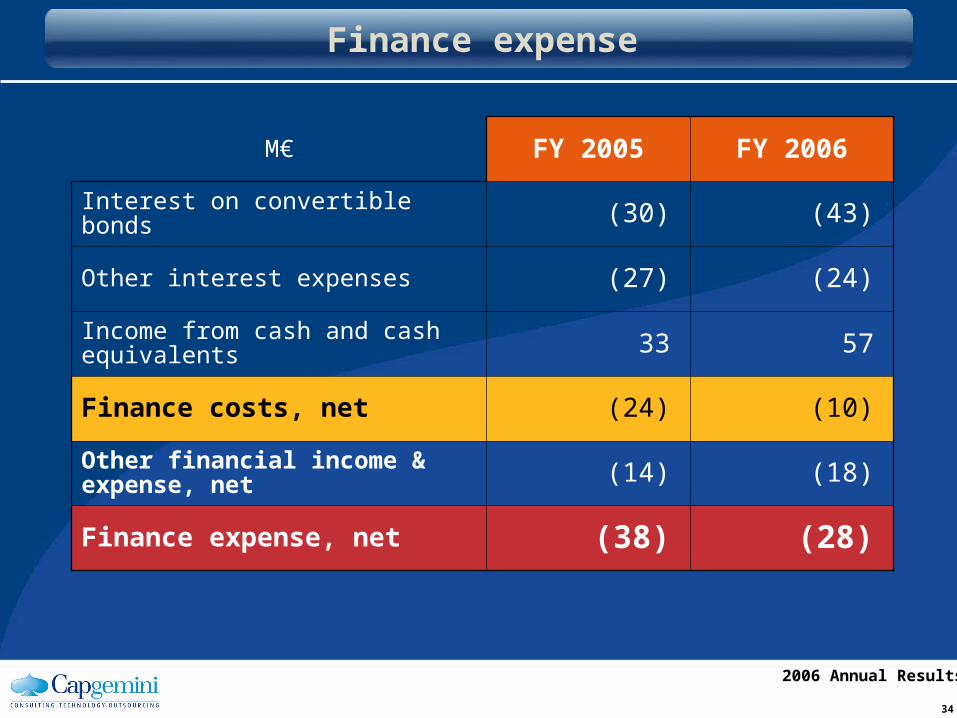
M€ FY 2005 FY 2006
Interest on convertible bonds (30) (43)
Other interest expenses (27) (24)
Income from cash and cash equivalents 33 57
Finance costs, net (24) (10)
Other financial income & expense, net (14) (18)
Finance expense, net (38) (28)
Finance expense
35
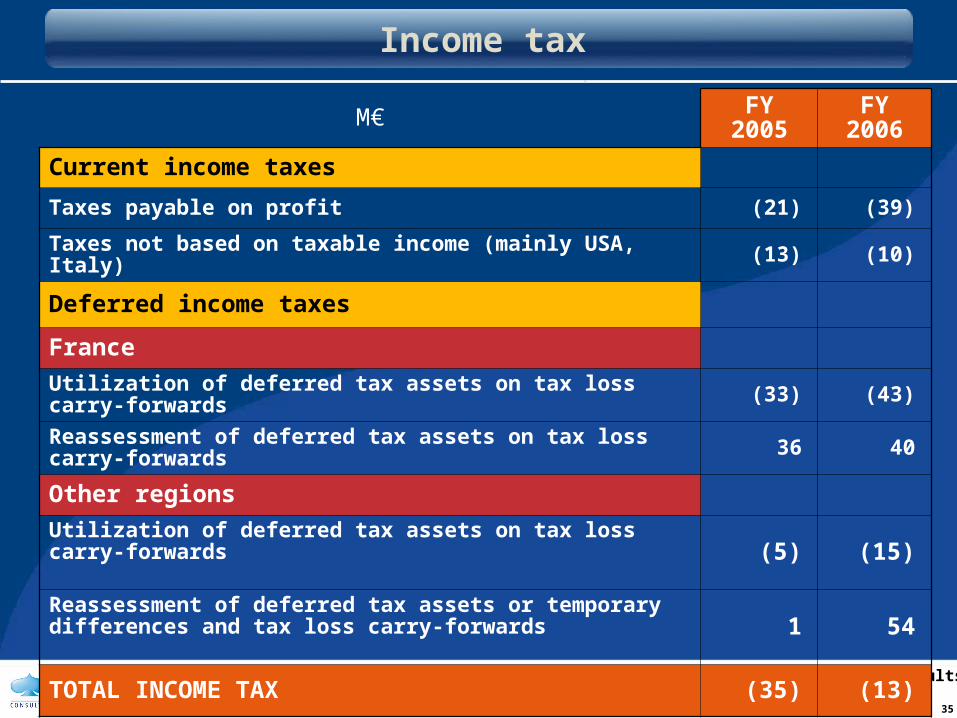
2006 Annual Results
M€ FY 2005 FY 2006
Current income taxes
Taxes payable on profit (21) (39)
Taxes not based on taxable income (mainly USA, Italy) (13) (10)
Deferred income taxes
France
Utilization of deferred tax assets on tax loss carry-forwards (33) (43)
Reassessment of deferred tax assets on tax loss carry-forwards 36 40
Other regions
Utilization of deferred tax assets on tax loss carry-forwards (5) (15)
Reassessment of deferred tax assets or temporary differences and tax loss carry-forwards 1 54
TOTAL INCOME TAX (35) (13)
Income tax
36
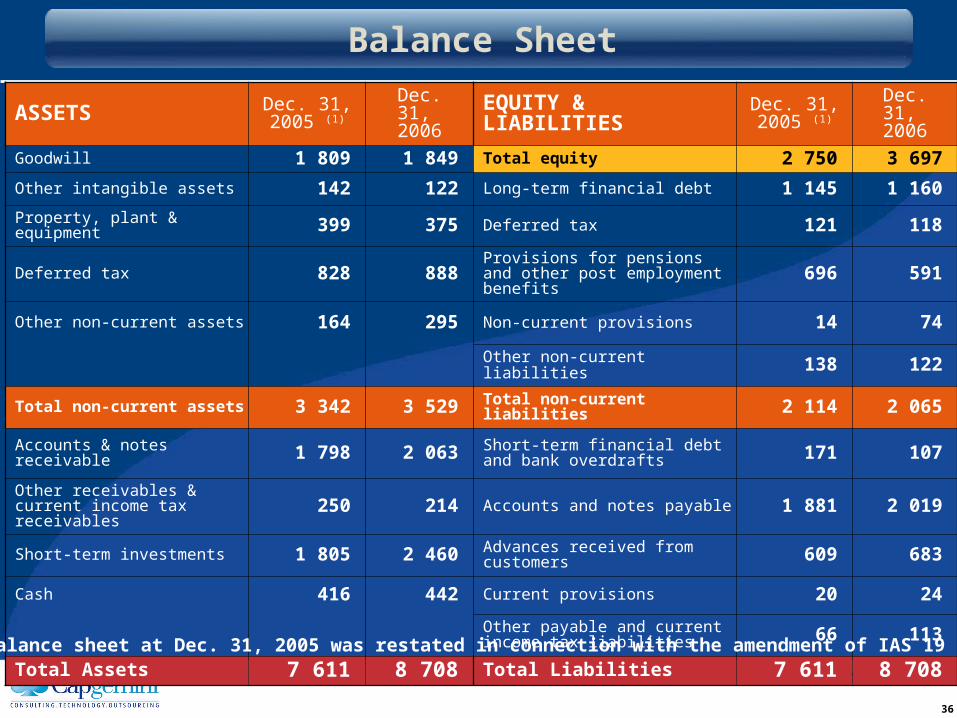
2006 Annual Results
ASSETS Dec. 31,2005 (1)
Dec. 31, 2006 EQUITY & LIABILITIES Dec. 31,
2005 (1)Dec. 31,
2006
Goodwill 1 809 1 849 Total equity 2 750 3 697
Other intangible assets 142 122 Long-term financial debt 1 145 1 160
Property, plant & equipment 399 375 Deferred tax 121 118
Deferred tax 828 888 Provisions for pensions and other post employment benefits 696 591
Other non-current assets 164 295 Non-current provisions 14 74
Other non-current liabilities 138 122
Total non-current assets 3 342 3 529 Total non-current liabilities 2 114 2 065
Accounts & notes receivable 1 798 2 063 Short-term financial debt and bank overdrafts 171 107
Other receivables & current income tax receivables 250 214 Accounts and notes payable 1 881 2 019
Short-term investments 1 805 2 460 Advances received from customers 609 683
Cash 416 442 Current provisions 20 24
Other payable and current income tax liabilities 66 113
Total Assets 7 611 8 708 Total Liabilities 7 611 8 708
Balance Sheet
(1) the balance sheet at Dec. 31, 2005 was restated in connection with the amendment of IAS 19
37
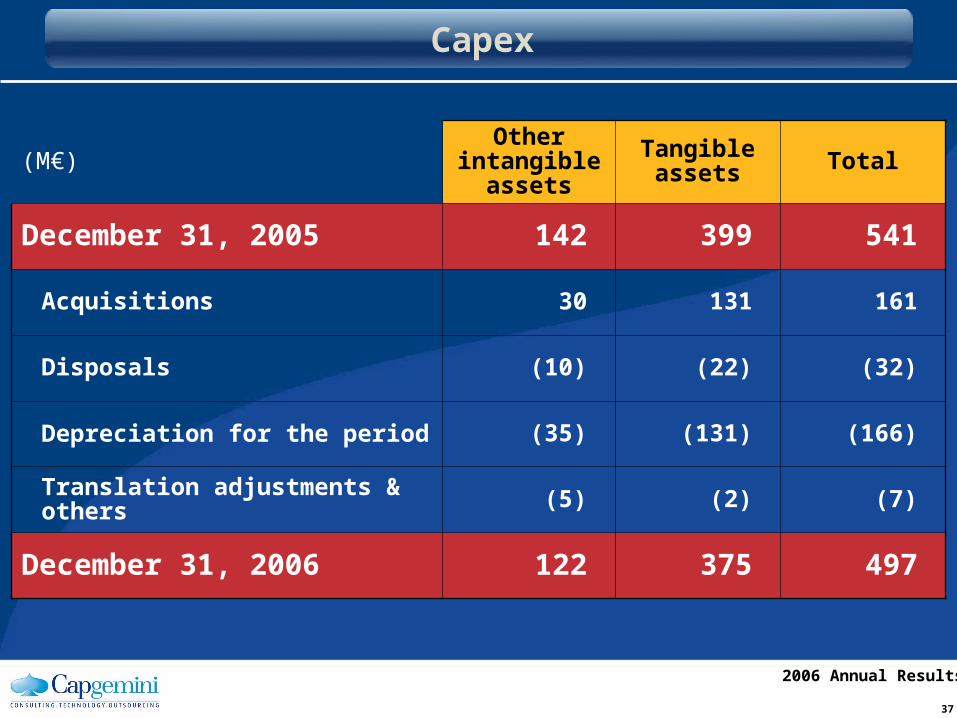
2006 Annual Results
(M€)Other
intangible assets
Tangible assets Total
December 31, 2005 142 399 541
Acquisitions 30 131 161
Disposals (10) (22) (32)
Depreciation for the period (35) (131) (166)
Translation adjustments & others (5) (2) (7)
December 31, 2006 122 375 497
Capex
38
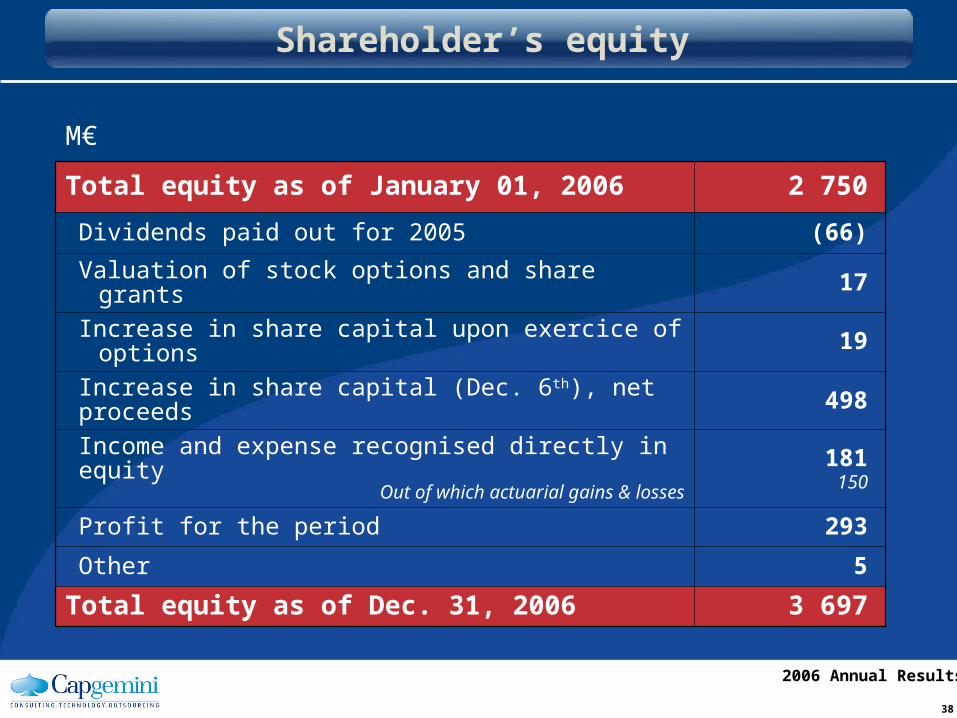
2006 Annual Results
M€
Total equity as of January 01, 2006 2 750
Dividends paid out for 2005 (66)
Valuation of stock options and share grants 17
Increase in share capital upon exercice of options 19
Increase in share capital (Dec. 6th), net proceeds 498
Income and expense recognised directly in equityOut of which actuarial gains & losses
181150
Profit for the period 293
Other 5
Total equity as of Dec. 31, 2006 3 697
Shareholder’s equity
39
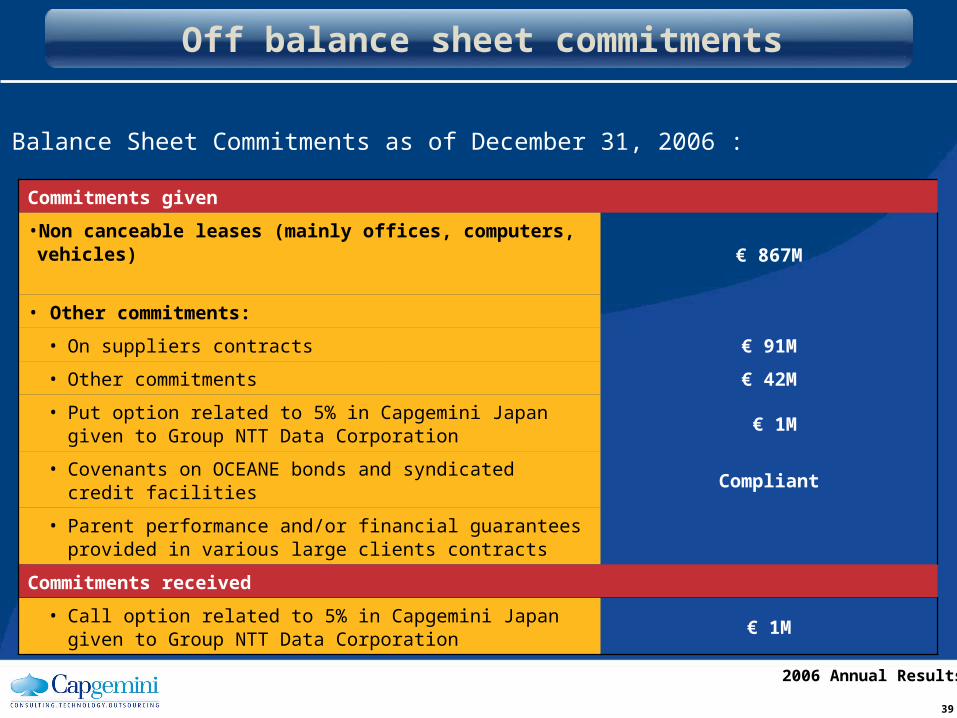
2006 Annual Results
Commitments given
•Non canceable leases (mainly offices, computers, vehicles)€ 867M
• Other commitments:
• On suppliers contracts € 91M
• Other commitments € 42M
• Put option related to 5% in Capgemini Japan given to Group NTT Data Corporation
€ 1M
• Covenants on OCEANE bonds and syndicated credit facilities Compliant
• Parent performance and/or financial guarantees provided in various large clients contracts
Commitments received
• Call option related to 5% in Capgemini Japan given to Group NTT Data Corporation
€ 1M
Off balance sheet commitments
Off Balance Sheet Commitments as of December 31, 2006 :
40
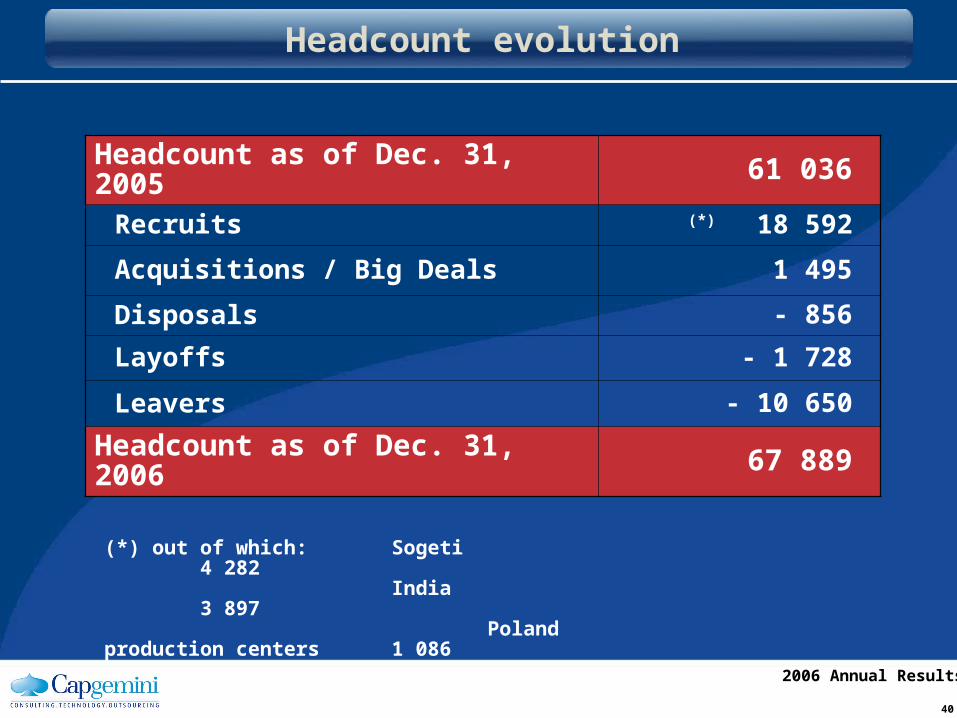
2006 Annual Results
Headcount as of Dec. 31, 2005 61 036
Recruits (*) 18 592
Acquisitions / Big Deals 1 495
Disposals - 856
Layoffs - 1 728
Leavers - 10 650
Headcount as of Dec. 31, 2006 67 889
(*) out of which: Sogeti 4 282 India 3 897
Poland production centers 1 086
Headcount evolution
41
2006 Annual Results
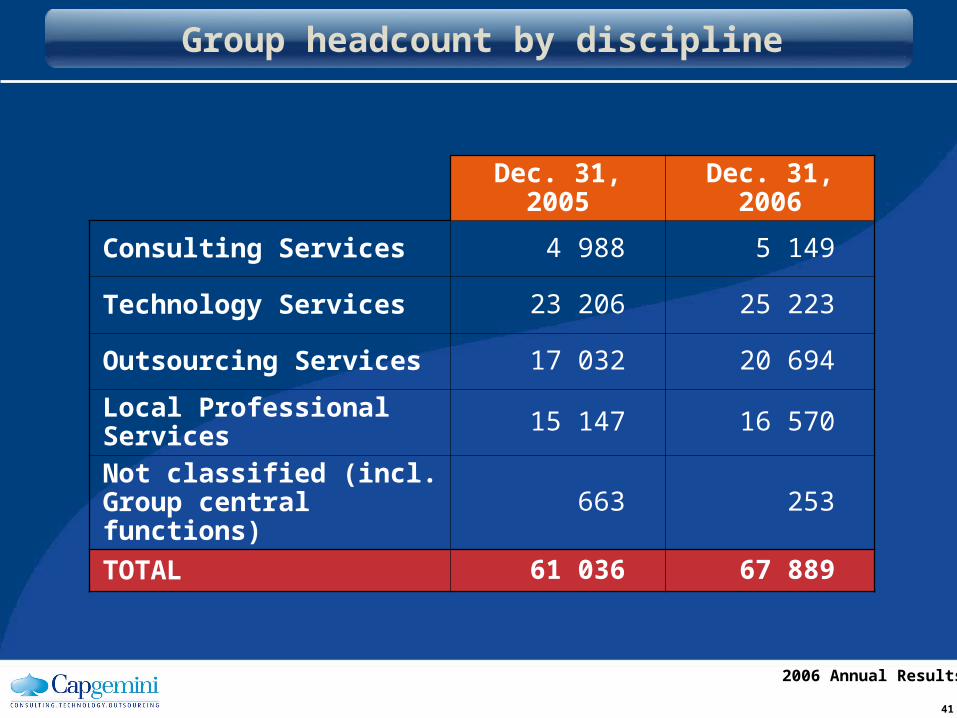
Dec. 31, 2005 Dec. 31, 2006
Consulting Services 4 988 5 149
Technology Services 23 206 25 223
Outsourcing Services 17 032 20 694
Local Professional Services 15 147 16 570
Not classified (incl. Group central functions) 663 253
TOTAL 61 036 67 889
Group headcount by discipline
42
2006 Annual Results
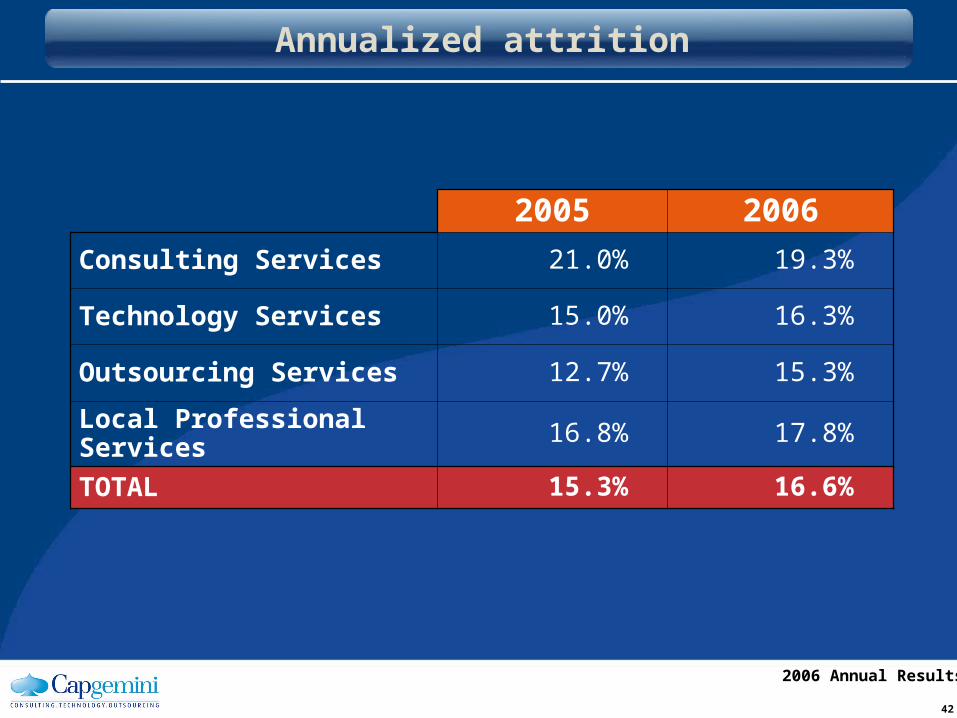
2005 2006
Consulting Services 21.0% 19.3%
Technology Services 15.0% 16.3%
Outsourcing Services 12.7% 15.3%
Local Professional Services 16.8% 17.8%
TOTAL 15.3% 16.6%
Annualized attrition
43
2006 Annual Results
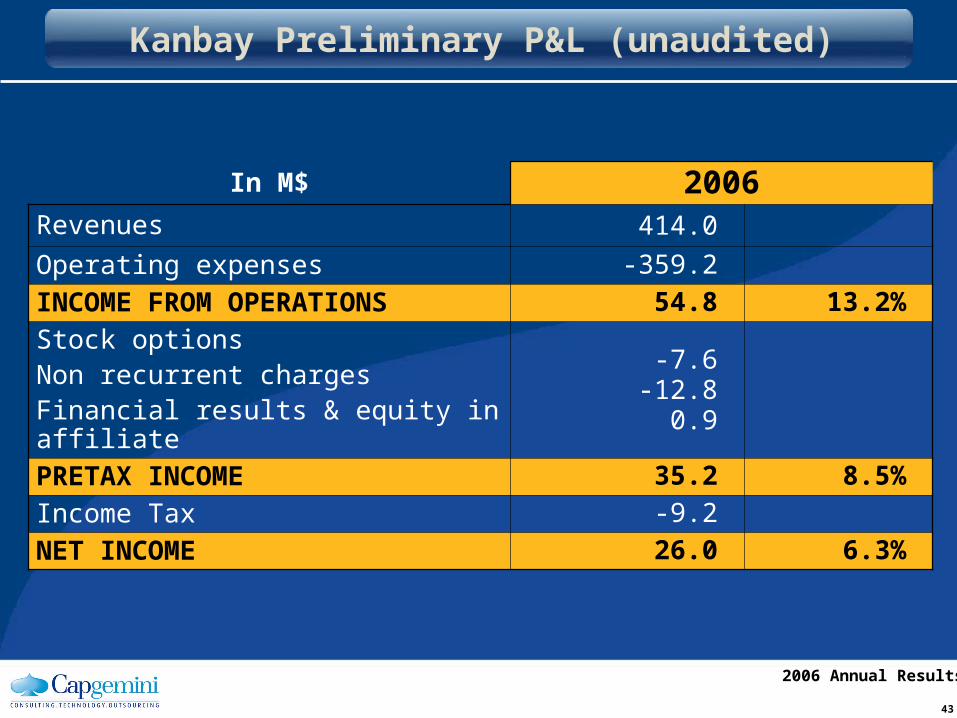
Kanbay Preliminary P&L (unaudited)
In M$ 2006Revenues 414.0
Operating expenses -359.2
INCOME FROM OPERATIONS 54.8 13.2%
Stock optionsNon recurrent chargesFinancial results & equity in affiliate
-7.6-12.8
0.9
PRETAX INCOME 35.2 8.5%
Income Tax -9.2
NET INCOME 26.0 6.3%

44
2006 Annual Results
ASSETS (M$) LIABILITIES & STOCKHOLDERS’ EQUITY (M$)
Cash & Cash EquivalentsShort term investmentsAccounts receivables – Related partyAccounts receivables – Third partyAllowance for doubtful accountsPrepaid expenses and other current assetsDeferred tax assets currentOther receivables
Total Current Assets
Land and buildingComputer equipmentComputer softwareFurniture and fixturesLeasehold improvementsAccumulated depreciationIntangible assetsAccumulated amortizationGoodwill netOther assetsInvestment in affiliate
48462861-1632
193
43341121
8-3512-2
1594
27
Trade accounts payableDeferred revenueCustomer depositsAmounts due to subcontractorsAccrued bonus and commissionsAccrued vacationAccrued salaries, w/holdings & PR taxesAccrued income taxOther accrued liabilitiesCurrent portion LTD
Total current liabilities
Long-term debt, less current portionDeferred income taxes – non current
Total non-current liabilities
Total liabilities
Common stockAPICAPIC – Deferred compensationCumulative translation adjustmentRetained earnings
Stockholders’ equity
75-2
18672
2310
80
861
87
167
-229
-36
76
308
Total Assets 475 Total Liabilities & stockholders’ equity 475
Balance Sheet – Kanbay (unaudited)(in millions of US$)

2006 Annual Results
Paris, 15 February 2007
Back upFY 2006

47
2006 Annual Results
Q4 2005
Q4 2006
10,6%16,1%
34,7%38,6%
At constant rates and perimeter
11,5%16,5%
35,1%36,9%
Consulting Services
Technology Services
Outsourcing Services
Local Professional
Services
Consulting Services
Technology Services
Outsourcing Services
Local Professional
Services
Q4 Revenues by discipline
48
2006 Annual Results
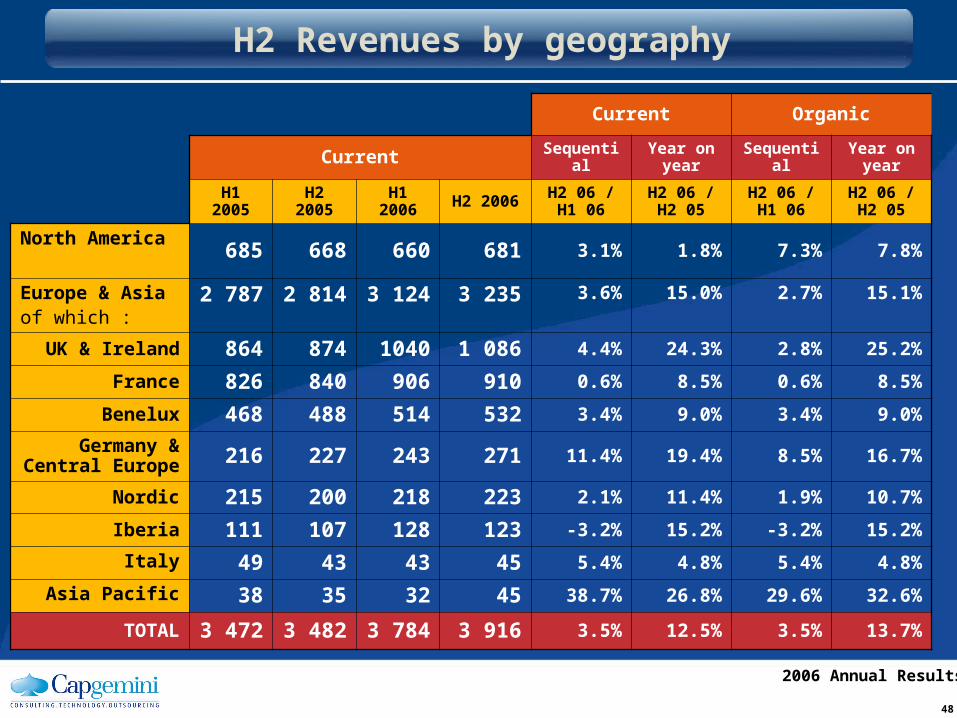
H2 Revenues by geography
Current Organic
Current Sequential Year on year Sequential Year on
year
H1 2005 H2 2005 H1 2006 H2 2006 H2 06 / H1 06
H2 06 / H2 05
H2 06 / H1 06
H2 06 / H2 05
North America685 668 660 681 3.1% 1.8% 7.3% 7.8%
Europe & Asiaof which :
2 787 2 814 3 124 3 235 3.6% 15.0% 2.7% 15.1%
UK & Ireland 864 874 1040 1 086 4.4% 24.3% 2.8% 25.2%
France 826 840 906 910 0.6% 8.5% 0.6% 8.5%
Benelux 468 488 514 532 3.4% 9.0% 3.4% 9.0%
Germany & Central Europe 216 227 243 271 11.4% 19.4% 8.5% 16.7%
Nordic 215 200 218 223 2.1% 11.4% 1.9% 10.7%
Iberia 111 107 128 123 -3.2% 15.2% -3.2% 15.2%
Italy 49 43 43 45 5.4% 4.8% 5.4% 4.8%
Asia Pacific 38 35 32 45 38.7% 26.8% 29.6% 32.6%
TOTAL 3 472 3 482 3 784 3 916 3.5% 12.5% 3.5% 13.7%
49
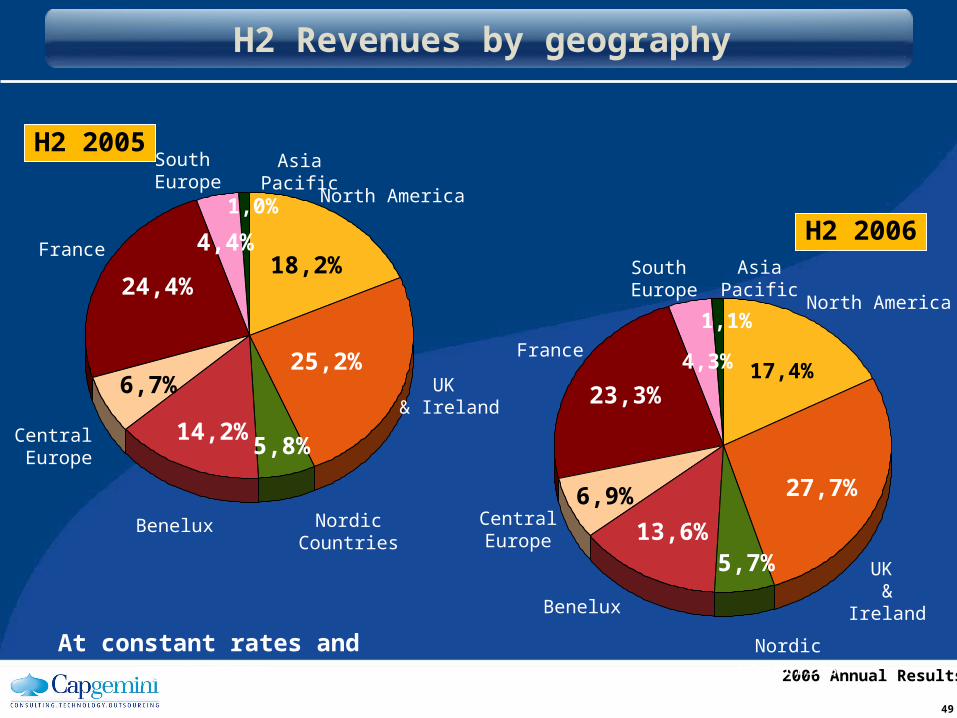
2006 Annual Results
H2 Revenues by geography
17,4%
27,7%
5,7%13,6%
6,9%
23,3%
4,3%
1,1%
H2 2006
At constant rates and perimeter
Benelux
North America
UK & Ireland
Nordic Countries
18,2%
25,2%
5,8%14,2%
6,7%
24,4%
4,4%
1,0%
H2 2005
North America
UK & Ireland
Nordic Countries
Central Europe
France
South Europe
Asia Pacific
Benelux Central Europe
France
South Europe
Asia Pacific
50
2006 Annual Results
H2 Revenues growth by discipline
CS/TS Revenues related to mega deals (HMRC, Schneider & TXU) recorded in Outsourcing
CS/TS Revenues related to mega deals (HMRC, Schneider & TXU) reclassified in CS/TS
H2 06 / H1 06 H2 06 / H2 05
Consulting Services -6.3% 4.8%
Technology Services 3.7% 11.5%
CS / TS 1.2% 9.8%
Local Professional Services 0.4% 10.1%
CS / TS / LPS 0.9% 9.9%
Outsourcing Services 7.6% 20.0%
TOTAL GROUP 3.5% 13.7%
H2 06 / H1 06 H2 06 / H2 05
Consulting Services -5.9% 6.5%
Technology Services 3.3% 12.8%
CS / TS 1.2% 11.4%
Local Professional Services 0.4% 10.1%
CS / TS / LPS 1.0% 11.1%
Outsourcing Services 9.1% 19.5%
TOTAL GROUP 3.5% 13.7%
At constant ratesand perimeter
51
2006 Annual Results
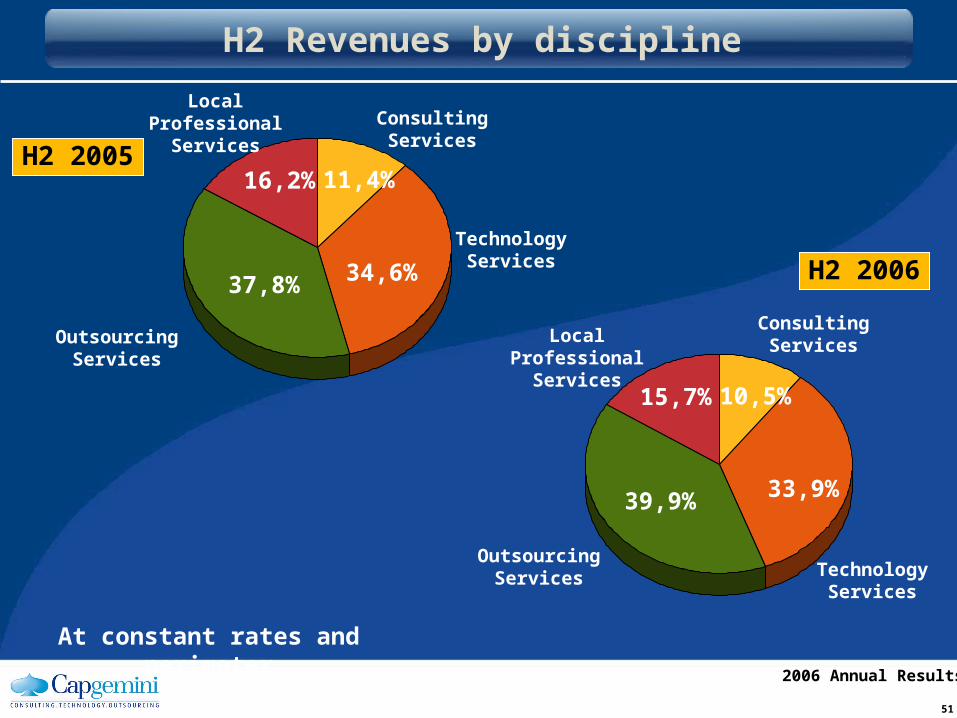
H2 Revenues by discipline
H2 2005
H2 2006
10,5%15,7%
33,9%39,9%
At constant rates and perimeter
11,4%16,2%
34,6%37,8%
Consulting Services
Technology Services
Outsourcing Services
Local Professional
Services
Consulting Services
Technology Services
Outsourcing Services
Local Professional
Services
52
2006 Annual Results
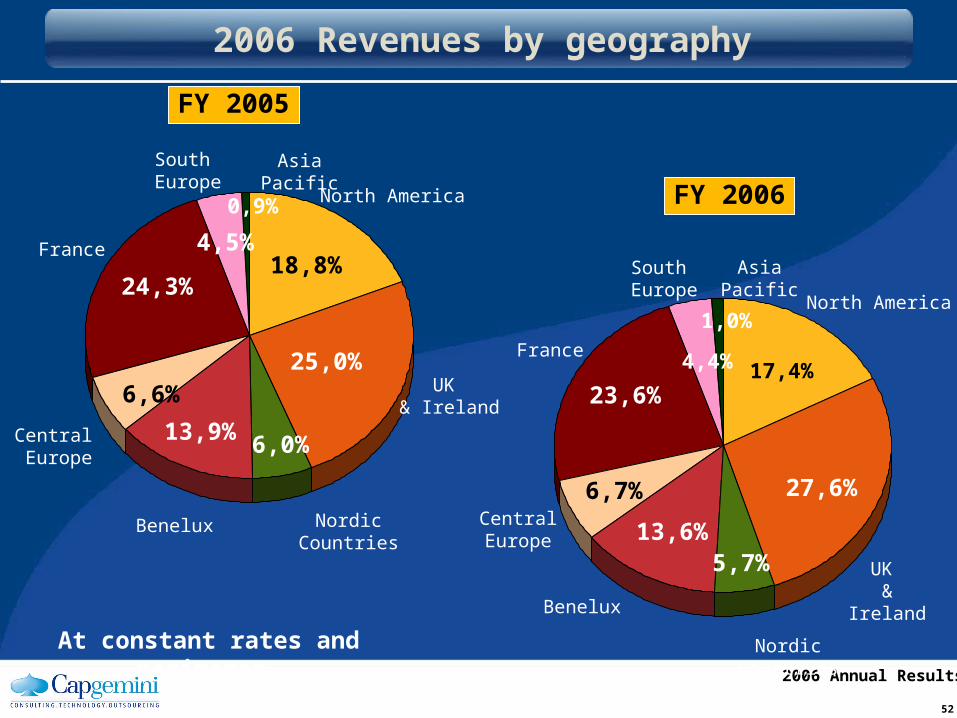
17,4%
27,6%
5,7%13,6%
6,7%
23,6%
4,4%
1,0%
FY 2006
At constant rates and perimeter
Benelux
North America
UK & Ireland
Nordic Countries
18,8%
25,0%
6,0%13,9%
6,6%
24,3%
4,5%
0,9%
FY 2005
North America
UK & Ireland
Nordic Countries
Central Europe
France
South Europe
Asia Pacific
Benelux Central Europe
France
South Europe
Asia Pacific
2006 Revenues by geography
53
2006 Annual Results
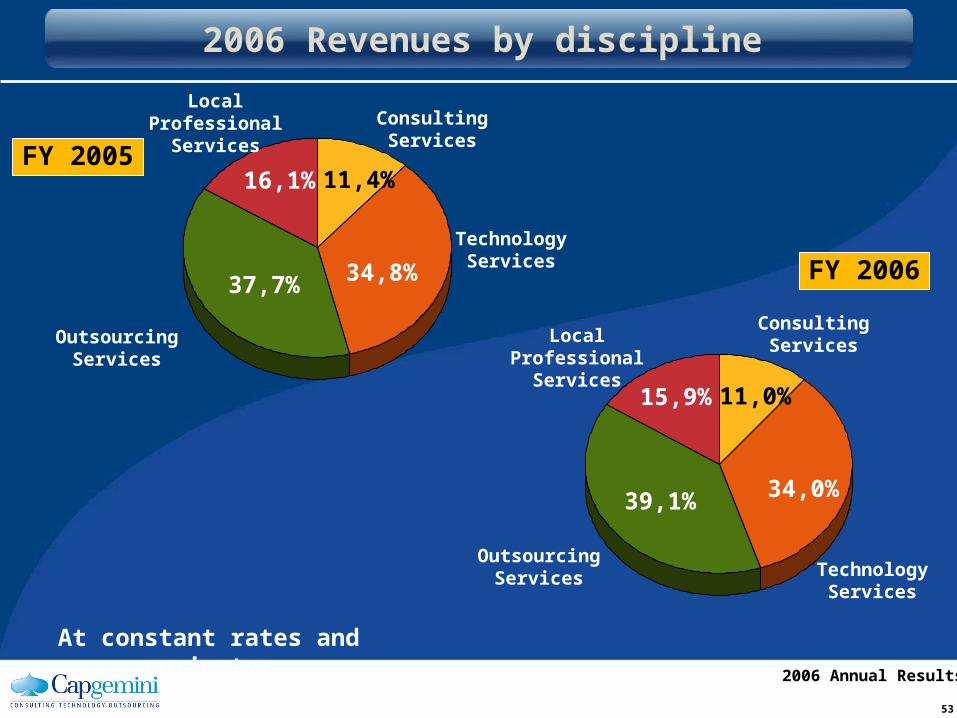
FY 2005
FY 2006
11,0%15,9%
34,0%39,1%
At constant rates and perimeter
11,4%16,1%
34,8%37,7%
Consulting Services
Technology Services
Outsourcing Services
Local Professional
Services
Consulting Services
Technology Services
Outsourcing Services
Local Professional
Services
2006 Revenues by discipline
2006 Annual Results
Paris, 15 February 2007


![Annual Report 2006 Annual Report 2006 [2.7 MB]](https://img.pdfslide.net/doc/110x75/586b796d1a28ab063d8c0594/annual-report-2006-annual-report-2006-27-mb.jpg)