Embed Size (px)
Citation preview

Electrolytic Manganese Dioxide FromAustralia and China
Investigation Nos. 731-TA-1124 and 1125 (Preliminary)
Publication 3955 October 2007
Washington, DC 20436
U.S. International Trade Commission
COMMISSIONERS
Daniel R. Pearson, ChairmanShara L. Aranoff, Vice Chairman
Deanna Tanner OkunCharlotte R. Lane
Irving A. WilliamsonDean A. Pinkert
Robert A. RogowskyDirector of Operations
Staff assigned
Cynthia Trainor, InvestigatorEric Land, Industry AnalystGerald Benedick, EconomistDavid Boyland, Accountant
Gracemary Roth-Roffy, AttorneySteven Hudgens, Senior Statistician
George Deyman, Supervisor Investigator
Address all communications toSecretary to the Commission
United States International Trade CommissionWashington, DC 20436
U.S. International Trade CommissionWashington, DC 20436
www.usitc.gov
Electrolytic Manganese Dioxide FromAustralia and China
Investigation Nos. 731-TA-1124 and 1125 (Preliminary)
Publication 3955 October 2007

i
C O N T E N T S
Page
Determinations . . . . . . . . . . . . . . . . . . . . . . . . . . . . . . . . . . . . . . . . . . . . . . . . . . . . . . . . . . . . . . . . . . 1Views of the Commission . . . . . . . . . . . . . . . . . . . . . . . . . . . . . . . . . . . . . . . . . . . . . . . . . . . . . . . . . 3Part I: Introduction . . . . . . . . . . . . . . . . . . . . . . . . . . . . . . . . . . . . . . . . . . . . . . . . . . . . . . . . . . . . I-1
Background . . . . . . . . . . . . . . . . . . . . . . . . . . . . . . . . . . . . . . . . . . . . . . . . . . . . . . . . . . . . . . . . . . I-1Statutory criteria and organization of the report . . . . . . . . . . . . . . . . . . . . . . . . . . . . . . . . . . . . . . I-1U.S. EMD market summary . . . . . . . . . . . . . . . . . . . . . . . . . . . . . . . . . . . . . . . . . . . . . . . . . . . . . I-3Summary data . . . . . . . . . . . . . . . . . . . . . . . . . . . . . . . . . . . . . . . . . . . . . . . . . . . . . . . . . . . . . . . . I-3Previous and related investigations . . . . . . . . . . . . . . . . . . . . . . . . . . . . . . . . . . . . . . . . . . . . . . . . I-3Nature and extent of alleged sales at LTFV . . . . . . . . . . . . . . . . . . . . . . . . . . . . . . . . . . . . . . . . . I-4The subject product . . . . . . . . . . . . . . . . . . . . . . . . . . . . . . . . . . . . . . . . . . . . . . . . . . . . . . . . . . . . I-5
Commerce’s scope . . . . . . . . . . . . . . . . . . . . . . . . . . . . . . . . . . . . . . . . . . . . . . . . . . . . . . . . . . I-5Tariff treatment . . . . . . . . . . . . . . . . . . . . . . . . . . . . . . . . . . . . . . . . . . . . . . . . . . . . . . . . . . . . I-5
The domestic like product . . . . . . . . . . . . . . . . . . . . . . . . . . . . . . . . . . . . . . . . . . . . . . . . . . . . . . . I-6Physical characteristics and uses . . . . . . . . . . . . . . . . . . . . . . . . . . . . . . . . . . . . . . . . . . . . . . . I-6Production process . . . . . . . . . . . . . . . . . . . . . . . . . . . . . . . . . . . . . . . . . . . . . . . . . . . . . . . . . . I-8Channels of distribution . . . . . . . . . . . . . . . . . . . . . . . . . . . . . . . . . . . . . . . . . . . . . . . . . . . . . . I-9
Domestic like product issues . . . . . . . . . . . . . . . . . . . . . . . . . . . . . . . . . . . . . . . . . . . . . . . . . . . . I-9Part II: Conditions of competition in the U.S. market . . . . . . . . . . . . . . . . . . . . . . . . . . . . . . . . II-1
Channels of distribution and market characteristics . . . . . . . . . . . . . . . . . . . . . . . . . . . . . . . . . . . II-1Supply and demand considerations . . . . . . . . . . . . . . . . . . . . . . . . . . . . . . . . . . . . . . . . . . . . . . . . II-2
U.S. supply . . . . . . . . . . . . . . . . . . . . . . . . . . . . . . . . . . . . . . . . . . . . . . . . . . . . . . . . . . . . . . . II-2U.S. demand . . . . . . . . . . . . . . . . . . . . . . . . . . . . . . . . . . . . . . . . . . . . . . . . . . . . . . . . . . . . . . II-6Demand outside the United States . . . . . . . . . . . . . . . . . . . . . . . . . . . . . . . . . . . . . . . . . . . . . . II-9
Substitutability issues . . . . . . . . . . . . . . . . . . . . . . . . . . . . . . . . . . . . . . . . . . . . . . . . . . . . . . . . . . II-10EMD qualification . . . . . . . . . . . . . . . . . . . . . . . . . . . . . . . . . . . . . . . . . . . . . . . . . . . . . . . . . . II-10EMD blending . . . . . . . . . . . . . . . . . . . . . . . . . . . . . . . . . . . . . . . . . . . . . . . . . . . . . . . . . . . . . II-11Changes in product range and marketing of EMD . . . . . . . . . . . . . . . . . . . . . . . . . . . . . . . . . II-11Factors affecting sales and purchases . . . . . . . . . . . . . . . . . . . . . . . . . . . . . . . . . . . . . . . . . . . II-11
Part III: U.S. producers’ production, shipments, and employment . . . . . . . . . . . . . . . . . . . . . . III-1U.S. producers . . . . . . . . . . . . . . . . . . . . . . . . . . . . . . . . . . . . . . . . . . . . . . . . . . . . . . . . . . . . . . . III-1U.S. capacity, production, and capacity utilization . . . . . . . . . . . . . . . . . . . . . . . . . . . . . . . . . . . III-1U.S. producers’ U.S. shipments and export shipments . . . . . . . . . . . . . . . . . . . . . . . . . . . . . . . . . III-3Captive consumption . . . . . . . . . . . . . . . . . . . . . . . . . . . . . . . . . . . . . . . . . . . . . . . . . . . . . . . . . . III-4U.S. producers’ imports and purchases of imports . . . . . . . . . . . . . . . . . . . . . . . . . . . . . . . . . . . . III-5U.S. producers’ inventories . . . . . . . . . . . . . . . . . . . . . . . . . . . . . . . . . . . . . . . . . . . . . . . . . . . . . III-6U.S. employment, wages, and productivity . . . . . . . . . . . . . . . . . . . . . . . . . . . . . . . . . . . . . . . . . III-6
Part IV: U.S. imports, apparent consumption, and market shares . . . . . . . . . . . . . . . . . . . . . . IV-1U.S. importers . . . . . . . . . . . . . . . . . . . . . . . . . . . . . . . . . . . . . . . . . . . . . . . . . . . . . . . . . . . . . . . . IV-1U.S. imports . . . . . . . . . . . . . . . . . . . . . . . . . . . . . . . . . . . . . . . . . . . . . . . . . . . . . . . . . . . . . . . . . IV-1Negligibility . . . . . . . . . . . . . . . . . . . . . . . . . . . . . . . . . . . . . . . . . . . . . . . . . . . . . . . . . . . . . . . . . IV-3Cumulation considerations . . . . . . . . . . . . . . . . . . . . . . . . . . . . . . . . . . . . . . . . . . . . . . . . . . . . . . IV-4
Fungibility . . . . . . . . . . . . . . . . . . . . . . . . . . . . . . . . . . . . . . . . . . . . . . . . . . . . . . . . . . . . . . . . IV-4Geographical market segmentation . . . . . . . . . . . . . . . . . . . . . . . . . . . . . . . . . . . . . . . . . . . . . IV-5Common or similar channels of distribution . . . . . . . . . . . . . . . . . . . . . . . . . . . . . . . . . . . . . . IV-6Simultaneous presence in the market . . . . . . . . . . . . . . . . . . . . . . . . . . . . . . . . . . . . . . . . . . . IV-6
ii
C O N T E N T S
Page
Part IV: U.S. imports, apparent consumption, and market shares–ContinuedApparent U.S. consumption . . . . . . . . . . . . . . . . . . . . . . . . . . . . . . . . . . . . . . . . . . . . . . . . . . . . . IV-7U.S. market shares . . . . . . . . . . . . . . . . . . . . . . . . . . . . . . . . . . . . . . . . . . . . . . . . . . . . . . . . . . . . IV-8Ratio of imports to U.S. production . . . . . . . . . . . . . . . . . . . . . . . . . . . . . . . . . . . . . . . . . . . . . . . IV-9
Part V: Pricing and related information . . . . . . . . . . . . . . . . . . . . . . . . . . . . . . . . . . . . . . . . . . . . V-1Factors affecting pricing . . . . . . . . . . . . . . . . . . . . . . . . . . . . . . . . . . . . . . . . . . . . . . . . . . . . . . . . V-1
Raw material costs . . . . . . . . . . . . . . . . . . . . . . . . . . . . . . . . . . . . . . . . . . . . . . . . . . . . . . . . . . V-1Tariff rates and transportation costs to the U.S. market . . . . . . . . . . . . . . . . . . . . . . . . . . . . . V-2U.S. inland transportation costs . . . . . . . . . . . . . . . . . . . . . . . . . . . . . . . . . . . . . . . . . . . . . . . . V-3Exchange rates . . . . . . . . . . . . . . . . . . . . . . . . . . . . . . . . . . . . . . . . . . . . . . . . . . . . . . . . . . . . . V-4
Pricing practices . . . . . . . . . . . . . . . . . . . . . . . . . . . . . . . . . . . . . . . . . . . . . . . . . . . . . . . . . . . . . . V-6Short-term contracts/agreements . . . . . . . . . . . . . . . . . . . . . . . . . . . . . . . . . . . . . . . . . . . . . . . V-6Other pricing practices . . . . . . . . . . . . . . . . . . . . . . . . . . . . . . . . . . . . . . . . . . . . . . . . . . . . . . . V-7
Price data . . . . . . . . . . . . . . . . . . . . . . . . . . . . . . . . . . . . . . . . . . . . . . . . . . . . . . . . . . . . . . . . . . . V-8Questionnaire bid-price data . . . . . . . . . . . . . . . . . . . . . . . . . . . . . . . . . . . . . . . . . . . . . . . . . . V-8Questionnaire quarterly selling price data . . . . . . . . . . . . . . . . . . . . . . . . . . . . . . . . . . . . . . . . V-10
Lost revenues and lost sales . . . . . . . . . . . . . . . . . . . . . . . . . . . . . . . . . . . . . . . . . . . . . . . . . . . . . V-13Part VI: Financial experience of the U.S. producers . . . . . . . . . . . . . . . . . . . . . . . . . . . . . . . . . . VI-1
Background . . . . . . . . . . . . . . . . . . . . . . . . . . . . . . . . . . . . . . . . . . . . . . . . . . . . . . . . . . . . . . . . . . VI-1Merchant-market operations on EMD . . . . . . . . . . . . . . . . . . . . . . . . . . . . . . . . . . . . . . . . . . . . . VI-1Overall operations on EMD . . . . . . . . . . . . . . . . . . . . . . . . . . . . . . . . . . . . . . . . . . . . . . . . . . . . . VI-3Capital expenditures, research and development expenses,
assets, and return on investment . . . . . . . . . . . . . . . . . . . . . . . . . . . . . . . . . . . . . . . . . . . . . . . VI-6Capital and investment . . . . . . . . . . . . . . . . . . . . . . . . . . . . . . . . . . . . . . . . . . . . . . . . . . . . . . . . . VI-6
Actual negative effects (Australia) . . . . . . . . . . . . . . . . . . . . . . . . . . . . . . . . . . . . . . . . . . . . . VI-7Anticipated negative effects (Australia) . . . . . . . . . . . . . . . . . . . . . . . . . . . . . . . . . . . . . . . . . VI-7Actual negative effects (China) . . . . . . . . . . . . . . . . . . . . . . . . . . . . . . . . . . . . . . . . . . . . . . . . VI-7Anticipated negative effects (China) . . . . . . . . . . . . . . . . . . . . . . . . . . . . . . . . . . . . . . . . . . . . VI-7
Part VII: Threat considerations and Bratsk information . . . . . . . . . . . . . . . . . . . . . . . . . . . . . . VII-1The industry in Australia . . . . . . . . . . . . . . . . . . . . . . . . . . . . . . . . . . . . . . . . . . . . . . . . . . . . . . . VII-1The industry in China . . . . . . . . . . . . . . . . . . . . . . . . . . . . . . . . . . . . . . . . . . . . . . . . . . . . . . . . . . VII-1The industries in Australia and China combined . . . . . . . . . . . . . . . . . . . . . . . . . . . . . . . . . . . . . VII-2
U.S. importers’ inventories . . . . . . . . . . . . . . . . . . . . . . . . . . . . . . . . . . . . . . . . . . . . . . . . . . . . . . VII-4U.S. importers’ imports subsequent to June 30, 2007 . . . . . . . . . . . . . . . . . . . . . . . . . . . . . . . . . VII-5Antidumping investigations in third-country markets . . . . . . . . . . . . . . . . . . . . . . . . . . . . . . . . . VII-5Information on nonsubject sources . . . . . . . . . . . . . . . . . . . . . . . . . . . . . . . . . . . . . . . . . . . . . . . . VII-5
“Bratsk” considerations . . . . . . . . . . . . . . . . . . . . . . . . . . . . . . . . . . . . . . . . . . . . . . . . . . . . . . VII-5Nonsubject source information . . . . . . . . . . . . . . . . . . . . . . . . . . . . . . . . . . . . . . . . . . . . . . . . VII-6Overview . . . . . . . . . . . . . . . . . . . . . . . . . . . . . . . . . . . . . . . . . . . . . . . . . . . . . . . . . . . . . . . . . VII-6Brazil . . . . . . . . . . . . . . . . . . . . . . . . . . . . . . . . . . . . . . . . . . . . . . . . . . . . . . . . . . . . . . . . . . . . VII-9Colombia . . . . . . . . . . . . . . . . . . . . . . . . . . . . . . . . . . . . . . . . . . . . . . . . . . . . . . . . . . . . . . . . . VII-9India . . . . . . . . . . . . . . . . . . . . . . . . . . . . . . . . . . . . . . . . . . . . . . . . . . . . . . . . . . . . . . . . . . . . VII-10Japan . . . . . . . . . . . . . . . . . . . . . . . . . . . . . . . . . . . . . . . . . . . . . . . . . . . . . . . . . . . . . . . . . . . . VII-10South Africa . . . . . . . . . . . . . . . . . . . . . . . . . . . . . . . . . . . . . . . . . . . . . . . . . . . . . . . . . . . . . . . VII-11Spain . . . . . . . . . . . . . . . . . . . . . . . . . . . . . . . . . . . . . . . . . . . . . . . . . . . . . . . . . . . . . . . . . . . . VII-11
iii
C O N T E N T S
PageAppendixes
A. Federal Register notices . . . . . . . . . . . . . . . . . . . . . . . . . . . . . . . . . . . . . . . . . . . . . . . . . . . . . . . A-1B. Calendar of public conference . . . . . . . . . . . . . . . . . . . . . . . . . . . . . . . . . . . . . . . . . . . . . . . . . . B-1C. Summary data . . . . . . . . . . . . . . . . . . . . . . . . . . . . . . . . . . . . . . . . . . . . . . . . . . . . . . . . . . . . . . . C-1D. Questionnaire selling price data for the specified EMD product category 1 imported
from nonsubject countries and produced in the United States . . . . . . . . . . . . . . . . . . . . . . . D-1
Note.–Information that would reveal confidential operations of individual concerns may not bepublished and therefore has been deleted from this report. Such deletions are indicated by asterisks.


1 The record is defined in sec. 207.2(f) of the Commission’s Rules of Practice and Procedure (19 CFR § 207.2(f)). 2 Commissioner Dean A. Pinkert recused himself to avoid any conflict of interest or appearance of a conflict.
UNITED STATES INTERNATIONAL TRADE COMMISSION
Investigation Nos. 731-TA-1124 and 1125 (Preliminary)
ELECTROLYTIC MANGANESE DIOXIDE FROM AUSTRALIA AND CHINA
DETERMINATIONS
On the basis of the record1 developed in the subject investigations, the United States InternationalTrade Commission (Commission) determines, pursuant to section 733(a) of the Tariff Act of 1930 (19U.S.C. § 1673b(a)) (the Act), that there is a reasonable indication that an industry in the United States ismaterially injured by reason of imports from Australia and China of electrolytic manganese dioxide,provided for in subheading 2820.10.00 of the Harmonized Tariff Schedule of the United States, that arealleged to be sold in the United States at less than fair value (LTFV).2
COMMENCEMENT OF FINAL PHASE INVESTIGATIONS
Pursuant to section 207.18 of the Commission’s rules, the Commission also gives notice of thecommencement of the final phase of its investigations. The Commission will issue a final phase notice ofscheduling, which will be published in the Federal Register as provided in section 207.21 of theCommission’s rules, upon notice from the Department of Commerce (Commerce) of an affirmativepreliminary determination in the investigations under section 733(b) of the Act, or, if the preliminarydetermination is negative, upon notice of an affirmative final determination in the investigations undersection 735(a) of the Act. Parties that filed entries of appearance in the preliminary phase of theinvestigations need not enter a separate appearance for the final phase of the investigations. Industrialusers, and, if the merchandise under investigation is sold at the retail level, representative consumerorganizations have the right to appear as parties in Commission antidumping and countervailing duty investigations. The Secretary will prepare a public service list containing the names and addresses of allpersons, or their representatives, who are parties to the investigations.
BACKGROUND
On August 22, 2007, a petition was filed with the Commission and Commerce by Tronox LLC,Oklahoma City, OK, alleging that an industry in the United States is materially injured and threatenedwith further material injury by reason of LTFV imports of electrolytic manganese dioxide from Australiaand China. Accordingly, effective August 22, 2007, the Commission instituted antidumping dutyinvestigation Nos. 731-TA-1124 and 1125 (Preliminary).
Notice of the institution of the Commission’s investigations and of a public conference to be heldin connection therewith was given by posting copies of the notice in the Office of the Secretary, U.S.International Trade Commission, Washington, DC, and by publishing the notice in the Federal Registerof August 28, 2007 (72 FR 49309). The conference was held in Washington, DC, on September 12,2007, and all persons who requested the opportunity were permitted to appear in person or by counsel.

1 Commissioner Dean A. Pinkert has recused himself from these investigations. 2 19 U.S.C. § 1673b(a); see, e.g., Co-Steel Raritan, Inc. v. United States, 357 F.3d 1294 (Fed. Cir. 2004);American Lamb Co. v. United States, 785 F.2d 994, 1001-04 (Fed. Cir. 1986); Aristech Chemical Corp. v. UnitedStates, 20 CIT 353, 354 (1996). No party argued that the establishment of an industry is materially retarded byreason of the allegedly unfairly traded imports. 3 American Lamb, 785 F.2d at 1001; see also Texas Crushed Stone Co. v. United States, 35 F.3d 1535, 1543(Fed. Cir. 1994). 4 Tronox accounts for approximately *** percent of reported U.S. production of EMD. Confidential Staff Report(“CR”) and Public Staff Report (“PR”) at Table III-1. 5 CR at VII-3, PR at VII-1.
3
VIEWS OF THE COMMISSION
Based on the record in the preliminary phase of these investigations, we find that there is areasonable indication that an industry in the United States is materially injured by reason of imports ofelectrolytic manganese dioxide (“EMD”) from Australia and China that are allegedly sold in the UnitedStates at less than fair value (“LTFV”).1
I. THE LEGAL STANDARD FOR PRELIMINARY DETERMINATIONS
The legal standard for preliminary antidumping and countervailing duty determinations requiresthe Commission to determine, based upon the information available at the time of the preliminarydetermination, whether there is a reasonable indication that a domestic industry is materially injured,threatened with material injury, or whether the establishment of an industry is materially retarded, byreason of the allegedly unfairly traded imports.2 In applying this standard, the Commission weighs theevidence before it and determines whether “(1) the record as a whole contains clear and convincingevidence that there is no material injury or threat of such injury; and (2) no likelihood exists that contraryevidence will arise in a final investigation.”3
II. BACKGROUND
A. In General
The petition in these investigations was filed on August 22, 2007 by Tronox LLC (“Tronox” or“Petitioner”).4 Representatives from Tronox appeared at the conference, and Tronox filed apostconference brief.
The sole Australian producer of the subject merchandise, Delta EMD Australia (Pty) Limited(“Delta” or “Australian Respondent”), also appeared at the conference and submitted a questionnaireresponse and a postconference brief. Spectrum Brands, Inc. (“Spectrum”) and Panasonic PrimaryBattery Corporation of America (“Panasonic”), U.S. purchasers that oppose the petition, appeared at theconference, and Spectrum submitted a postconference brief. No producer or exporter of the subjectmerchandise from China appeared at the conference or submitted a postconference brief, and only two of36 possible producers of EMD in China submitted questionnaire responses.5

6 Each antidumping or countervailing duty investigation is sui generis, presenting unique interactions of theeconomic variables the Commission considers, and therefore is not binding on the Commission in subsequentinvestigations, even when the same subject country and merchandise are at issue. E.g., Nucor Corp. v. UnitedStates, 414 F.3d 1331, 1340 (Fed. Cir. 2005); Ugine-Savoie Imphy v. United States, 248 F. Supp. 2d 1208, 1220 (Ct.Int’l Trade 2002). 7 See Electrolytic Manganese Dioxide from Greece and Japan, Inv. Nos. 731-TA-406 and 408 (Final), USITCPub. 2177 (April 1989); Eveready Battery Co., Inc. v. United States, 77 F. Supp. 2d 1327 (Ct. Int’l Tr. 1999);Electrolytic Manganese Dioxide from Greece and Japan, Inv. Nos. 731-TA-406 and 408 (Review), USITC Pub.3296 (May 2000) (“USITC Pub. 3296”) at 3 (a summary of these investigations/reviews appears at CR at I-4-I-6). 8 68 Fed. Reg. 51551 (Aug. 27, 2003). 9 19 U.S.C. § 1677(4)(A). 10 19 U.S.C. § 1677(4)(A). 11 19 U.S.C. § 1677(10). 12 See, e.g., NEC Corp. v. Department of Commerce, 36 F. Supp. 2d 380, 383 (Ct. Int’l Trade 1998); NipponSteel Corp. v. United States, 19 CIT 450, 455 (1995); Torrington Co. v. United States, 747 F. Supp. 744, 749 n.3(Ct. Int’l Trade 1990), aff’d, 938 F.2d 1278 (Fed. Cir. 1991) (“every like product determination ‘must be made onthe particular record at issue’ and the ‘unique facts of each case’”). The Commission generally considers a numberof factors including: (1) physical characteristics and uses; (2) interchangeability; (3) channels of distribution;(4) customer and producer perceptions of the products; (5) common manufacturing facilities, production processes,and production employees; and, where appropriate, (6) price. See Nippon, 19 CIT at 455 n.4; Timken Co. v. UnitedStates, 913 F. Supp. 580, 584 (Ct. Int’l Trade 1996).
4
B. Previous and Related Investigations6
EMD has been the subject of several antidumping duty investigations and reviews since the late1980s.7 The most recent antidumping duty investigations involving EMD were initiated on August 27,2003 with respect to imports from Australia, China, Greece, Ireland, Japan and South Africa in responseto a petition filed by Kerr-McGee, Inc., predecessor to Tronox.8 The Commission reached affirmativedeterminations in the preliminary phase of the investigations with respect to imports from Australia,Greece, Ireland, Japan, and South Africa. The Commission also found that imports from China werenegligible and terminated the investigation with respect to imports from China. However, before anyfinal determinations were reached, the petition was withdrawn.
III. DOMESTIC LIKE PRODUCT
A. In General
In determining whether there is a reasonable indication that an industry in the United States ismaterially injured or threatened with material injury by reason of imports of the subject merchandise, theCommission first defines the “domestic like product” and the “industry.”9 Section 771(4)(A) of the TariffAct of 1930, as amended (“the Act”), defines the relevant domestic industry as the “producers as a[w]hole of a domestic like product, or those producers whose collective output of a domestic like productconstitutes a major proportion of the total domestic production of the product.”10 In turn, the Act defines“domestic like product” as “a product which is like, or in the absence of like, most similar incharacteristics and uses with, the article subject to an investigation . . . .”11
The decision regarding the appropriate domestic like product(s) in an investigation is a factualdetermination, and the Commission has applied the statutory standard of “like” or “most similar incharacteristics and uses” on a case-by-case basis.12 No single factor is dispositive, and the Commission
13 See, e.g., S. Rep. No. 96-249 at 90-91 (1979). 14 Nippon Steel, 19 CIT at 455; Torrington, 747 F. Supp. at 748-49. See also S. Rep. No. 96-249 at 90-91 (1979)(Congress has indicated that the like product standard should not be interpreted in “such a narrow fashion as topermit minor differences in physical characteristics or uses to lead to the conclusion that the product and article arenot ‘like’ each other, nor should the definition of ‘like product’ be interpreted in such a fashion as to preventconsideration of an industry adversely affected by the imports under consideration.”). 15 See, e.g., USEC, Inc. v. United States, Slip Op. 01-1421 (Fed. Cir. April 25, 2002) at 9 (“The ITC may notmodify the class or kind of imported merchandise examined by Commerce.”); Algoma Steel Corp. v. United States,688 F. Supp. 639, 644 (Ct. Int'l Trade 1988), aff'd, 865 F.3d 240 (Fed. Cir.), cert. denied, 492 U.S. 919 (1989). 16 Hosiden Corp. v. Advanced Display Mfrs., 85 F.3d 1561, 1568 (Fed. Cir. 1996) (Commission may find a singlelike product corresponding to several different classes or kinds defined by Commerce); Torrington, 747 F. Supp. at748-52 (affirming Commission determination of six like products in investigations where Commerce found fiveclasses or kinds). 17 Acciai Speciali Terni S.p.A. v. United States, 118 F. Supp. 2d 1298, 1304-05 (Ct. Int’l Trade 2000); NipponSteel Corp. v. United States, 19 CIT at 455; Asociacion Colombiana de Exportadores de Flores v. United States, 693F. Supp. 1165, 1169 n.5 (Ct. Int’l Trade 1988) (particularly addressing like product determination); CitrosucoPaulista, S.A. v. United States, 704 F. Supp. 1075, 1087-88 (Ct. Int’l Trade 1988). 18 72 Fed. Reg. 52850 (Sept. 17, 2007). 19 Petitioner’s Postconference Brief at 6. 20 CR at I-7, PR at I-6. 21 CR at I-7, I-12, PR at I-6, I-8.
5
may consider other factors it deems relevant based on the facts of a particular investigation.13 TheCommission looks for clear dividing lines among possible like products and disregards minor variations.14 Although the Commission must accept the determination of Commerce as to the scope of the importedmerchandise allegedly sold at LTFV,15 the Commission determines what domestic product is like theimported articles Commerce has identified.16 The Commission must base its domestic like productdetermination on the record in these investigations. The Commission is not bound by priordeterminations, even those pertaining to the same imported products, but may draw upon previousdeterminations in addressing pertinent like product issues.17
B. Product Description
Commerce’s notice of initiation defines the imported merchandise within the scope of theseinvestigations as follows –
[a]ll manganese dioxide (MnO2) that has been manufactured in an electrolytic process,whether in powder, chip or plate form. Excluded from the scope are natural manganesedioxide (NMD) and chemical manganese dioxide (CMD).18
Petitioner argues that the Commission should find one domestic like product consisting of EMDcoextensive with Commerce’s scope of the investigations.19 Respondents have not opposed the Petitioner’s proposed definition of the domestic like product for purposes of the preliminary phase ofthese investigations.
EMD is a black powder (or plate or chip that will be ground into powder) that has a gammacrystalline structure and is used almost exclusively in dry-cell batteries.20 There are three grades of EMD– alkaline, lithium and zinc-chloride – that are designed to be used in alkaline, lithium, and chloridebatteries, respectively. All types and grades of EMD are produced by the same general process.21 Thethree grades differ primarily in particle size and pH or acidity/alkalinity (characteristics which are
22 CR at I-7-I-8, PR at I-6. 23 CR at I-7, PR at I-6. 24 ***. See USITC Pub. 3296 at I-7. 25 ***. 26 CR at I-7-I-8, PR at I-6. 27 CR at I-8, PR at I-6. 28 CR at I-10-11, PR at I-7. 29 CR at I-9 n.17, II-27-II-28, Conference Transcript (Stevens) at 83, PR at I-6 n.18. 30 CR/PR at II-1. 31 19 U.S.C. § 1677(4)(A). 32 United States Steel Group v. United States, 873 F. Supp. 673, 681-84 (Ct. Int’l Trade 1994), aff’d, 96 F.3d1352 (Fed. Cir. 1996).
6
imparted during the finishing process for EMD), but are essentially identical in all other physicalcharacteristics.22
Virtually all EMD produced and consumed in the United States is of the alkaline grade.23 Thezinc chloride grade has not been produced in the United States for a number of years.24 Additionally,during the period of investigation, lithium grade EMD was manufactured by *** and in ***.25 All threegrades may be used in the production of dry-cell batteries.26 Within each of the grades of EMD, thequality of EMD may vary.27 Typically, higher quality EMD is used in AA/AAA type batteries, whilelower quality grade may be used in C/D batteries. All new supplies of EMD must be qualified by thebattery manufacturer before they can be used in a specific battery.28 There is evidence in the record thathigher-quality EMD may be blended with lower quality EMD for use in C/D cell batteries.29 Almost allEMD is sold directly or indirectly through an importer or producers’ sales representatives to end users(battery manufacturers).30
In conclusion, we find no significant differences among the several grades of EMD with respectto physical characteristics, uses, production processes, or channels of distribution. Absent a cleardividing line between different grades of EMD, we define a single domestic like product as EMD,coextensive with the scope of these investigations.
IV. DOMESTIC INDUSTRY
The domestic industry is defined as the “producers as a [w]hole of a domestic like product, orthose producers whose collective output of a domestic like product constitutes a major proportion of thetotal domestic production of the product.”31 In defining the domestic industry, the Commission’s generalpractice has been to include in the industry all domestic production of the domestic like product, whethertoll-produced, captively consumed, or sold in the domestic merchant market.32 Based on our finding thatthe domestic like product is EMD, we find that the domestic industry consists of the three domesticproducers of that product: Tronox, Erachem, and Energizer.
We must determine whether any producer of the domestic like product should be excluded fromthe domestic industry pursuant to 19 U.S.C. § 1677(4)(B), which allows the Commission, if appropriatecircumstances exist, to exclude from the domestic industry producers that are related to an exporter orimporter of subject merchandise or which are themselves importers. Exclusion of such a producer iswithin the Commission’s discretion based upon the facts presented in each investigation. In theseinvestigations, *** imported subject merchandise during the period of investigation and ***. Thus, thesedomestic EMD producers qualify as “related parties” under 19 U.S.C. § 1677(4)(B).

33 CR/PR at Table III-2. 34 CR at III-5, PR at III-3. 35 CR/PR at Table III-4. 36 CR/PR at Table III-4. During the period of investigation, *** imported *** short tons of subject imports from***, and the ratio of its subject imports to its production in that year was ***. 37 CR/PR at Table III-4. 38 CR/PR at Table III-4. 39 CR/PR at III-8-III-9, PR at III-5. 40 In line with 19 U.S.C. § 1677(24), we determine that negligibility is not an issue in these investigations. Subject imports from each of the subject countries were above three percent of total imports for the most recent 12-month period preceding the filing of the petition (August 2006 through July 2007). Specifically, subject importsfrom Australia accounted for 50.1 percent, and subject imports from China accounted for 33.7 percent, of totalimports of the merchandise in that period. CR/PR at Table IV-4. 41 19 U.S.C. § 1677(7)(G)(i). 42 See Certain Cast-Iron Pipe Fittings from Brazil, the Republic of Korea, and Taiwan, Inv. Nos. 731-TA-278-280(Final), USITC Pub. 1845 (May 1986), aff'd, Fundicao Tupy, S.A. v. United States, 678 F. Supp. 898 (Ct. Int'l
(continued...)
7
***.33 ***.34 According to ***, it ***.35 ***.36 In addition to ***, ***.37 ***.38 Based on theseratios, and given there are no other factors that indicate that appropriate circumstances exist to exclude*** and no party has argued for its exclusion, we find that appropriate circumstances do not exist toexclude *** from the domestic industry.
*** operations also present a related party issue. ***.39 There is, however, no evidence in therecord to indicate that *** was shielded from injury by its *** during the period of investigation. Wenote that no party has argued for *** exclusion from the domestic industry. We do not find thatappropriate circumstances to exclude *** from the domestic industry.
Therefore, consistent with our definition of domestic like product, we define the domesticindustry as consisting of all domestic producers of EMD.40
V. CUMULATION
A. In General
For purposes of evaluating the volume and price effects for a determination of material injury byreason of the subject imports, section 771(7)(G)(i) of the Act requires the Commission to cumulatesubject imports from all countries as to which petitions were filed and/or investigations self-initiated byCommerce on the same day, if such imports compete with each other and the domestic like product in theU.S. market.41 In assessing whether subject imports compete with each other and with the domestic likeproduct, the Commission has generally considered four factors, including:
(1) the degree of fungibility between the subject imports from different countries andbetween imports and the domestic like product, including consideration of specificcustomer requirements and other quality related questions;
(2) the presence of sales or offers to sell in the same geographic markets of subjectimports from different countries and the domestic like product;
(3) the existence of common or similar channels of distribution for subject importsfrom different countries and the domestic like product; and
(4) whether the subject imports are simultaneously present in the market.42

(...continued)Trade), aff'd, 859 F.2d 915 (Fed. Cir. 1988). 43 See, e.g., Wieland Werke, AG v. United States, 718 F. Supp. 50 (Ct. Int'l Trade 1989). 44 The SAA states that “the new section will not affect current Commission practice under which the statutoryrequirement is satisfied if there is a reasonable overlap of competition.” SAA at 848 (citing Fundicao Tupy, S.A. v.United States, 678 F. Supp. 898, 902 (Ct. Int'l Trade 1988)), aff'd 859 F.2d 915 (Fed. Cir. 1988). See Goss GraphicSys., Inc. v. United States, 33 F. Supp. 2d 1082,1087 (Ct. Int’l Trade 1998) (“cumulation does not require twoproducts to be highly fungible”); Wieland Werke, AG, 718 F. Supp. at 52 (“Completely overlapping markets are notrequired.”). 45 See 19 U.S.C. § 1677(7)(G)(ii). 46 CR/PR at Table II-3. 47 CR/PR at Table II-3. 48 CR/PR at Table II-4. 49 CR/PR at Table II-4. 50 CR/PR at Table II-4. 51 CR at II-34, PR at II-13. 52 CR at II-33, PR at II-13.
8
While no single factor is necessarily determinative, and the list of factors is not exclusive, thesefactors are intended to provide the Commission with a framework for determining whether the subjectimports compete with each other and with the domestic like product.43 Only a “reasonable overlap” ofcompetition is required.44
B. Analysis
The threshold requirement for cumulation is satisfied because Petitioner filed a petition withrespect to each of the subject countries on the same day. None of the statutory exceptions to cumulationis applicable.45 We next examine the four factors that the Commission customarily considers indetermining whether there is a reasonable overlap of competition.
While the evidence is somewhat mixed, subject imports from each country appear to be at leastmoderately interchangeable with each other and the domestic like product. Generally, domesticproducers familiar with both the domestic product and EMD from Australia and China indicate that theyare “always” or “frequently” interchangeable.46 The importer/purchasers’ responses were mixed, withfour of nine responses indicating that domestic product and EMD from Australia were “always” or“frequently” interchangeable and three of eight indicating the same for domestic product and EMD fromChina; the remainder indicated that the products were “sometimes” or “never” interchangeable. Three ofseven responses indicated that EMD from Australia and China were “always” or “frequently”interchangeable; the remainder indicated they were “sometimes’ or “never” interchangeable.47 Domesticproducers responded that non-price factors are “never” or “sometimes” significant.48 Importer/purchaserresponses were mixed, with three of eight responses indicating that non-price factors were “never” or“sometimes” significant when comparing domestic product and EMD from Australia, two of sevenindicating the same comparing domestic product and EMD from China, and three of six indicating thesame comparing EMD from Australia and China. The remaining importer/purchaser responses indicatedthat non-price differences were “frequently” or “always” important.49
Of the four battery manufacturers that purchase EMD, ***.50 ***.51 Finally, ***.52

53 CR at II-26, PR at II-10. 54 CR at I-9 n.17, PR at I-6 n.18. 55 CR/PR at II-26-II-27. 56 CR/PR at Table II-2. 57 CR at V-4-V-5, PR at V-3. 58 U.S. producers’ and importers’ questionnaire responses, sections IV-C, III-C-1 and III-C-2, CR/PR at Table I-2. 59 CR/PR at Table IV-11.
9
All EMD must go through a rigorous, costly, and lengthy qualification process which limits, tosome extent, shifting among suppliers in the short run.53 With the exception ***, domestic and subjectEMD from Australia and China are generally produced to a particular customer’s specifications.54 Although all EMD must be qualified, the record shows that the domestic product and subject importsfrom both countries have been qualified by *** U.S. battery producers at various times during the periodof investigation.55
Both Delta and Spectrum argue that competition between the domestic like product and subjectimports is at best attenuated, because domestic producers have focused their production on EMD for theAA/AAA battery market segment while subject imports are concentrated in the C/D battery marketsegment. The record, however, indicates that in 2006, domestic EMD and imported EMD were used forboth C/D and AA/AAA battery production.56
On balance, for purposes of the preliminary phase of these investigations, we find that thedomestic product and subject imports from both countries are sufficiently fungible to indicate areasonable overlap of competition. The other criteria appear to be met as well. The record indicates thatdomestically produced, Australian, and Chinese EMD are all sold to battery manufacturers that arelocated in the Midwest and Southeastern sections of the United States.57 U.S. EMD producers selldirectly to end users (battery manufacturers) and U.S. importers sell subject EMD directly or throughtheir sales representatives to battery manufacturers.58 Finally, imports from each of the subject countriesand domestic shipments have been present in the U.S. market throughout the period of investigation. Specifically, subject imports from Australia and China were recorded in virtually every month of theperiod.59
For the reasons discussed above, we find that there is a reasonable overlap of competitionbetween subject imports from Australia and China, and among these subject imports and the domestic likeproduct. Although short-run interchangeability between domestic and subject EMD is limited because allEMD must undergo a qualification process, the record indicates that there is a sufficient degree offungibility among and between subject imports and the domestic like product to warrant a finding of areasonable overlap of competition. The domestic like product and subject imports from both countriescompete in the same geographic markets, are sold directly to end users (battery manufacturers), and havebeen simultaneously present in the U.S. market throughout the period of investigation. Thus, we cumulate subject imports from both countries for purposes of our material injuryanalysis in the preliminary phase of these investigations.
60 19 U.S.C. §1673b(a). 61 19 U.S.C. § 1677(7)(B)( i). The Commission “may consider such other economic factors as are relevant to thedetermination” but shall “identify each [such] factor . . . [a]nd explain in full its relevance to the determination.” 19 U.S.C. § 1677(7)(B); see also, e.g., Angus Chem. Co. v. United States, 140 F.3d 1478 (Fed. Cir. 1998). 62 19 U.S.C. § 1677(7)(A). 63 19 U.S.C. § 1677(7)(C)(iii). 64 19 U.S.C. § 1677(7)(C)(iii).
10
VI. REASONABLE INDICATION OF MATERIAL INJURY BY REASON OF SUBJECTIMPORTS
In the preliminary phase of antidumping or countervailing duty investigations, the Commissiondetermines whether there is a reasonable indication that an industry in the United States is materiallyinjured by reason of the imports under investigation.60 In making this determination, the Commissionmust consider the volume of subject imports, their effect on prices for the domestic like product, and theirimpact on domestic producers of the domestic like product, but only in the context of U.S. productionoperations.61 The statute defines “material injury” as “harm which is not inconsequential, immaterial, orunimportant.”62 In assessing whether there is a reasonable indication that the domestic industry ismaterially injured by reason of subject imports, we consider all relevant economic factors that bear on thestate of the industry in the United States.63 No single factor is dispositive, and all relevant factors areconsidered “within the context of the business cycle and conditions of competition that are distinctive tothe affected industry.”64
For the reasons stated below, we determine that there is a reasonable indication that the domesticindustry producing EMD is materially injured by reason of subject imports from Australia and China.
A. Conditions of Competition and the Business Cycle
The following conditions of competition inform our analysis of whether there is a reasonableindication of material injury by reason of the subject imports.

65 As amended by the URAA, the statute contains a provision on captive production at section 19 U.S.C. §1677(7)(C)(iv), which provides:
(iv) CAPTIVE PRODUCTION -- If domestic producers internally transfer significant productionof the domestic like product for the production of a downstream article and sell significantproduction of the domestic like product in the merchant market, and the Commission finds that –
(I) the domestic like product produced that is internally transferred for processing intothat downstream article does not enter the merchant market for the domestic like product,
(II) the domestic like product is the predominant material input in the production of thatdownstream article, and
(III) the production of the domestic like product sold in the merchant market is notgenerally used in the production of that downstream article,
then the Commission, in determining market share and the factors affecting financial performanceset forth in clause (iii), shall focus primarily on the merchant market for the domestic like product.
19 U.S.C. § 1677(7)(C)(iv). The SAA indicates that where a domestic like product is transferred internally for theproduction of another article coming within the definition of the domestic like product, such transfers do notconstitute internal transfers for the production of a “downstream article” for purposes of the captive productionprovision. SAA at 853. 66 CR at III-6-III-7, PR at III-5. 67 In any final phase of these investigations, we intend to evaluate possible benefits associated with captiveproduction, including with respect to quality, blending, and surety of supply. 68 CR/PR at I-3. 69 CR at I-10-I-11, PR at I-7.
11
1. Captive Production65
The domestic industry consumes a significant portion of its EMD production in the manufactureof downstream products, namely batteries. We have considered whether the captive production provisionrequires us to focus our analysis primarily on the merchant market when assessing market share andfactors affecting the financial performance of the domestic industry. We find that a significant amount ofdomestic production of EMD is both captively consumed and sold on the merchant market,66 and thus thethreshold requirement is met. However, the record indicates that EMD sold in the merchant market isused in the production of the same downstream products, batteries, for which EMD is captivelyconsumed. Accordingly, we find that the third criterion of the captive production provision is notsatisfied, and therefore the captive production provision does not apply in these investigations. We,however, take the captive production into account as a significant condition of competition.67
2. Product Interchangeability
EMD is used almost exclusively in the production of dry-cell batteries.68 As discussed earlier incumulation, the interchangeability of domestic and imported EMD is limited somewhat by the fact that allpurchases of EMD from new suppliers are required to undergo rigorous qualification procedures. Thequalification process is both battery-specific and plant-specific, and can range from about *** to *** induration.69 While all EMD must be qualified, the domestic product and subject imports from both
70 CR at II-26-II-27, PR at II-10-II-11. In 2006, in C/D batteries, U.S. battery producers’ usage of domesticallyproduced EMD totaled *** short tons, usage of EMD from Australia totaled *** short tons and usage of EMD fromChina totaled *** short tons. In AA batteries, U.S. battery producers’ usage of domestically produced EMD totaled*** short tons, usage of EMD from Australia totaled *** short tons, and usage of EMD from China totaled *** shorttons. In AAA batteries, U.S. battery producers’ usage of domestically produced EMD totaled *** short tons andusage of EMD from Australia totaled *** short tons. In AAA batteries, there was *** reported usage by U.S.battery producers of EMD from China. CR/PR at Table II-2. 71 CR at II-30, PR at II-12. 72 CR at II-30, PR at II-12. 73 CR/PR at Table II-4. 74 CR at II-33-34, PR at II-13, CR/PR at Table II-4. In any final phase of these investigations, we intend toexamine more fully the issue of attenuated competition in the U.S. market. In particular, we will be seekinginformation concerning (1) the number of formulations of EMD offered by each domestic producer and the types ofbatteries in which each formulation of EMD is used; (2) whether battery manufacturers offer different grades ofproducts within a particular size, targeted at particular segments of the battery market; and (3) whether the EMDused in these products differs. 75 In any final investigations, we will explore the extent to which any patents and patent licensing agreementsaffect competition in the U.S. market. 76 CR at II-15, PR at II-7. 77 CR at II-15, PR at II-6. 78 CR/PR at Table IV-6.
12
countries have been qualified by *** U.S. battery producers for at least some of their battery types atvarious times during the period of investigation.70
As discussed earlier for our cumulation analysis, domestic EMD producers familiar with both thedomestic product and EMD from Australia and China indicated that they are “always” or “frequently”interchangeable.71 Importer/purchasers’ responses were mixed, opining more frequently than U.S.producers that domestic EMD and EMD from Australia and China were “sometimes” or “never”interchangeable, with a substantial minority indicating they were “always” or “frequently”interchangeable.72 As for non-price factors, domestic producers responded that these differences are“never” or “sometimes” important.73 While importers/purchasers generally responded that suchdifferences were “always” or “frequently” important, referring specifically to performance, impurities,consistency, and the presence of EMD particulates, but a substantial minority indicated that non-pricedifferences were “never” or “sometimes” important.74 75
3. Demand Conditions
Demand for EMD is derived from the demand for dry-cell batteries, in particular alkalinebatteries, which in turn is derived from demand for the electronic devices that utilize such batteries. Dueto an increase in the consumer use of high-technology, portable consumer electronic devices, there hasbeen an increase in demand for smaller size batteries (AA/AAA). Demand for EMD is not seasonal, butcan be affected by increases in battery consumption during the holiday season and in response to naturaldisasters such as hurricanes.76
Apparent U.S. consumption of EMD fluctuated over the period of investigation but decreased by3.1 percent from 2004 to 2006.77 Apparent U.S. consumption rose from 99,277 short tons in 2004 to106,874 short tons in 2005, and then declined to 96,175 short tons in 2006. Apparent U.S. consumptionwas 3.6 percent lower in interim 2007 (44,208 short tons) than in interim 2006 (45,862 short tons).78 Parties suggested that the fluctuations in apparent U.S. consumption over the period of investigation may
79 CR at II-15 n.20; II-18, PR at II-7 n.20, II-7. 80 ***; Petitioner’s Postconference Brief Ex. 1. 81 CR at V-13 n.35, PR at V-8 n.35. 82 CR/PR at Table II-1 and I-9 n.17, PR at I-6 n.18. 83 CR/PR at Table IV-7. 84 CR/PR at Table IV-7. 85 CR/PR at Table C-1. 86 CR/PR at Table C-1. 87 CR/PR at Table IV-7. 88 CR/PR at Table IV-7. 89 CR/PR at Table IV-7. 90 CR/PR at Table IV-7.
13
be attributable to the varying hurricane activity over the same period.79 In particular, some marketparticipants attribute stronger demand in 2005 to Hurricane Katrina.80
The alkaline EMD market in the United States is comprised of a small number of purchasers. There are only four major U.S. battery producers, Duracell, Energizer, Spectrum and Panasonic, all ofwhich manufacture worldwide. Because of the lengthy and detailed qualification processes as well as therelatively limited number of suppliers, both Panasonic and Spectrum reported that they attempt tomaintain long-term relationships with their EMD suppliers.81
4. Supply Conditions
There are only a limited number of EMD suppliers that were qualified by one or more of the fourU.S. battery manufacturers during the period of investigation. These include ***.82 *** of its EMDproduction and ***.
The domestic industry was the largest supplier of EMD in the U.S. market throughout the periodof investigation. The domestic industry’s market share on a quantity basis decreased from 69.0 percent in2004 to 64.3 percent in 2006.83 In interim 2007, the domestic industry’s market share was 62.0 percent,compared to 66.6 percent in interim 2006.84 During the period of investigation, U.S. EMD productioncapacity ranged from 69,400 short tons to 70,100 short tons,85 which was equivalent to a little more thantwo-thirds of total apparent U.S. consumption for the same period. While domestic production was lessthan apparent U.S. consumption throughout the period, the domestic industry had the ability to supplymore of the U.S. market given sizeable inventories, which *** during the period of investigation.86
The next largest source of supply to the U.S. market was subject imports.87 Cumulated subjectimports’ share of the U.S. market by quantity increased from *** percent in 2004 to *** percent in 2006. In interim 2006 and interim 2007, cumulated subject imports’ market share was *** percent and ***percent, respectively.88 Nonsubject imports supplied the remainder of the U.S. market. Their marketshare fluctuated during the period of investigation, decreasing from *** percent in 2004 to *** percent in2005, and then increasing to *** percent in 2006.89 Nonsubject imports’ market share was *** percent ininterim 2006 and *** percent in interim 2007.90

91 CR at V-8, PR at V-6. 92 CR at V-10-V11, PR at V-7. 93 CR at V-9-V-10, PR at V-7. 94 CR at II-7-II-8, VI-7 n.9, PR at II-2-II-3, VI-2 n.9. 95 19 U.S.C. § 1677(7)(C)(i). 96 CR/PR at Table IV-2. 97 CR/PR at Table IV-2. 98 CR/PR at Table IV-7. 99 CR/PR at Table IV-8. 100 CR/PR at Table IV-7. 101 CR/PR at Table IV-2.
14
5. Other Considerations
Both domestically produced and imported EMD are usually sold under annualcontracts/agreements, with negotiations occurring in the fourth quarter of the previous year for shipmentsin the following year.91 Generally, the negotiation process involves competitive bids or quotes from abattery manufacturer’s various qualified suppliers before the contract is awarded and may involvecounteroffers and other terms of negotiation.92 There were mixed responses as to whether annualcontracts are for fixed volumes and prices, the extent to which they are subject to renegotiation, andwhether they typically include meet-or-release provisions.93
EMD production involves substantial fixed and variable costs. EMD production is also capital-intensive and, as a result, EMD producers generally must keep their plants operating at or near fullcapacity to remain profitable.94
B. Volume of Subject Imports
Section 771(7)(C)(i) of the Act provides that the “Commission shall consider whether the volumeof imports of the merchandise, or any increase in that volume, either in absolute terms or relative toproduction or consumption in the United States, is significant.”95
The volume of cumulated subject imports was significant during the period of investigation, andit increased from 2004 to 2006, both in absolute terms and relative to consumption and production in theUnited States. The volume of subject imports was *** short tons in 2004, *** short tons in 2005, and*** short tons in 2006.96 In interim 2007, the volume of cumulated subject imports was *** short tons,compared to *** short tons in interim 2006.97 Subject imports’ share of apparent U.S. consumption rosefrom *** percent in 2004 to *** percent in 2006. In interim 2007, subject imports’ share of apparentU.S. consumption was *** percent (their highest level during the period), compared with *** percent ininterim 2006.98 The ratio of cumulated subject imports to U.S. production rose *** from *** percent in2004 to *** percent in 2005, and then fell to *** percent in 2006. The ratio of cumulated subject importsto U.S. production in interim 2007 was *** percent, compared to *** percent in interim 2006.99
Subject imports’ increase in market share came almost entirely at the expense of the domesticindustry. The domestic industry’s market share was 69.0 percent in 2004, 66.1 percent in 2005, and 64.3percent in 2006; it was 62.0 percent in interim 2007 as compared to 66.6 percent in interim 2006.100 Nonsubject imports, both in absolute terms and relative to U.S. consumption, remained at low levelsthroughout the period, typically amounting to approximately *** of total imports annually during theperiod of investigation.101 Nonsubject imports’ market share was *** percent in 2004, *** percent in
102 CR/PR at Table IV-7. Nonsubject imports were *** short tons in 2004, *** short tons in 2005, and *** shorttons in 2006; they were *** short tons in interim period 2006 and *** short tons in interim period 2007. CR/PR atTables IV-2 and IV-7. 103 In any final phase investigations, we will seek information on the role of nonsubject imports of EMD in theU.S. market. We invite parties to comment in any final phase investigations on whether Bratsk Aluminum Smelterv. United States, 444 F.3d 1369 (Fed. Cir. 2006) is applicable to the facts of these investigations. In particular,parties are encouraged to focus on whether the first triggering factor under Bratsk (whether EMD is a commodityproduct) is met. The Commission also invites parties to comment on what additional information the Commissionshould collect to address the issues raised by the Court and how that information should be collected, and to identifywhich of the various nonsubject sources should be the focus of additional information gathering by the Commissionin any final phase investigations. 104 Chairman Pearson and Commissioner Okun do not join the preceding footnote. The U.S. Court of Appeals forthe Federal Circuit did not address the application of its mandate in Bratsk Aluminum Smelter v. United States, 444F.3d 1369 (Fed. Cir. 2006), to preliminary investigations. In that case the Court indicated that, in cases involvingcommodity products in which imports from non-subject countries are price-competitive and are a significant factorin the U.S. market, in order to establish a causal link between subject imports and material injury the Commissionmust evaluate whether the non-subject imports would replace subject imports and thereby eliminate the benefit to thedomestic industry of an antidumping or countervailing duty order.
The legal standard for preliminary antidumping and countervailing duty determinations requires theCommission to determine, based upon the information available at the time of the preliminary determination,whether there is a reasonable indication that a domestic industry is materially injured or threatened with materialinjury by reason of the allegedly unfairly traded imports. 19 U.S.C. §§ 1671b(a), 1673b(a) (2000). Thus, ChairmanPearson and Commissioner Okun conclude that they must conduct a Bratsk analysis as they would in any other typeof causation analysis in a preliminary investigation. Consequently, in these investigations, having found that there isa reasonable indication that the domestic EMD industry is materially injured by reason of allegedly unfairly tradedimports from Australia and China, as a threshold inquiry they proceed to assess whether the facts of theseinvestigations trigger a Bratsk analysis.
Chairman Pearson and Commissioner Okun note that the Bratsk Court stated that “[t]he obligation underGerald Metals is triggered whenever the antidumping investigation is centered on a commodity product, and pricecompetitive nonsubject imports are a significant factor in the market. Bratsk, 444 F.3d at 1375. Thus, the Bratsktest purportedly is not required in every case, but only in cases involving a “commodity product” and where “pricecompetitive nonsubject imports are a significant factor in the market.” With regard to the first prong of this analysis,the Bratsk Court referred to a “commodity product” as “meaning that it is generally interchangeable regardless of itssource.” The record of these investigations does not lead Chairman Pearson and Commissioner Okun to concludethat EMD fits this definition of a commodity product. First, although some questionnaire respondents reported thatEMD from various sources was interchangeable, all parties noted the existence of extensive and time-consumingprocedures that are required before new suppliers can be qualified. CR/PR at Table II-3; CR at II-33-II-35, PR at II-13. Hence, interchangeability in the short run appears to be limited inasmuch as it may be difficult if not impossiblefor an EMD user to switch suppliers if the alternate supplier has not already been qualified by that particular user. Second, the record indicates that non-price factors, such as quality, availability, transportation network, productrange, and technical support, may affect competition significantly. CR, PR at table II-4; CR at II-33-II-35, PR at II-13. Because such factors apparently exert significant influence over buying decisions, it is unlikely that EMD fromvarious sources would be readily interchangeable.
Consequently, Chairman Pearson and Commissioner Okun conclude that the first prong of this thresholdinquiry is not met, and are not required to reach the issues of whether nonsubject imports are price-competitive orwhether such imports would replace subject imports in the event antidumping orders were imposed. For a completestatement of Chairman Pearson’s and Commissioner Okun’s interpretation of Bratsk in a preliminary investigation,see Separate and Additional Views of Chairman Daniel R. Pearson and Commissioner Deanna Tanner OkunConcerning Bratsk Aluminum v. United States in Sodium Hexametaphosphate from China, Inv. No. 731-TA-1110(Preliminary), USITC Pub. 3912 (Apr. 2007) at 19-25. In any final phase investigation, any party holding a contrary
(continued...)
15
2005, and *** percent in 2006; it was *** percent in interim 2007, compared to *** percent in interim2006.102 103 104

104 (...continued)view should so indicate, and provide a basis for its view, at the time written comments on the draft questionnairesare submitted. 105 19 U.S.C. § 1677(7)(C)(ii). 106 Conference Transcript at 67 (Reilly), 121(McGrath). 107 CR/PR at Table II-4 (supplier qualification) and at V-41, PR at V-8-V-9, (petitioner reporting that U.S.purchasers frequently use competing offers as leverage in price negotiations) but see CR at V-41, PR at V-13. (EMD purchasers Panasonic and Spectrum, ***). 108 CR at II-34 ***, PR at II-13. 109 CR at V-13-V-29; PR at V-8-V-9, Conference Transcript at 121. In the preliminary phase of theseinvestigations, data were collected detailing U.S. producers’ and importers’ participation in bid events. We viewcomparisons of the prevailing bid prices with extreme caution, however, because they were made in varying terms,including f.o.b., landed duty-paid, and delivered. CR at V-13, PR at V-8. On average, subject imports underbid thedomestic product in a number of instances. CR/PR at Table V-3. We plan to examine the bidding process and thecircumstances surrounding the bidding process more fully in any final phase of these investigations. 110 CR/PR at Tables V-4 and V-5. 111 CR/PR at Table V-4.
16
For the foregoing reasons, we find for the purposes of the preliminary phase of theseinvestigations that both the volume and increase in volume of cumulated subject imports are significant,both in absolute terms and relative to consumption and production in the United States.
C. Price Effects of the Subject Imports
Section 771(C)(ii) of the Act provides that, in evaluating the price effects of subject imports, the Commission shall consider whether – (I) there has been significant price undersellingby the imported merchandise as compared with the price of domestic like products of theUnited States, and (II) the effect of imports of such merchandise otherwise depressesprices to a significant degree or prevents price increases, which otherwise would haveoccurred, to a significant degree.105
As noted above, the domestic like product and subject imports appear to be at least moderatelyinterchangeable. While respondents emphasize that quality is the most important factor in purchasingdecisions, the record also reflects that price is an important factor in purchasing decisions.106 Asdiscussed earlier, U.S. producers and a substantial minority of importers/purchasers report that non-pricefactors were “never” or “sometimes” important in purchasing decisions. Each purchaser, however, hasqualified ***, elevating the importance of price in competition for sales among eligible suppliers.107 ***indicated that all EMD for standard grades of EMD was interchangeable and that price was a factor inpurchasing decisions.108
As noted previously, almost all sales of EMD are made on an annual contract/agreement basis,and negotiations typically occur in the fourth quarter of the year preceding that in which shipments are tooccur.
According to quarterly selling price data collected in these investigations, there was significantprice underselling by subject imports during the period of investigation.109 Subject imports undersold thedomestic like product in all but one of 23 possible price comparisons. Margins of underselling rangedfrom 1.5 percent to 13.0 percent.110
Domestic prices for the specified product increased irregularly from January-March 2004through January-March 2006, and remained at the same level throughout 2006.111 Domestic prices,
112 CR/PR at Table V-4. 113 CR/PR at Table V-4. 114 The ratio of COGS to net sales decreased from 92.9 percent in 2004 to 87.5 percent in 2005, and then rose to94.1 percent in 2006; it was 103.0 percent in interim 2007 as compared to 95.0 percent in interim 2006. The ratio ofraw material costs to net sales increased from 22.5 percent in 2004 to 24.7 percent in 2005 and 29.2 percent in 2006;it was 31.9 percent in interim 2007, as compared to 27.8 percent in 2006. CR/PR at Table VI-5. 115 CR/PR at Table C-1. The ratio was 87.5 percent in 2005. CR/PR at Tables VI-5 and C-1. 116 CR/PR at Table VI-5. 117 In its notice of initiation of the antidumping duty investigations, Commerce estimated the dumping margin forsubject imports from Australia to be 52.94 percent and the dumping margin for subject imports from China to be133.76 percent. 72 Fed. Reg. 52850, 52854 (Sept. 17, 2007), CR at I-6, PR at I-5. 118 19 U.S.C. § 1677(7)(C)(iii); see also SAA at 851 and 885 (“In material injury determinations, the Commissionconsiders, in addition to imports, other factors that may be contributing to overall injury. While these factors, insome cases, may account for the injury to the domestic industry, they also may demonstrate that an industry is facing
(continued...)
17
however, declined in interim 2007.112 Prices for Australian subject imports fluctuated during January-March 2004 through October-December 2005, but increased in 2006, and remained at the same levelthroughout 2006. Prices for Australian subject imports declined in interim 2007. Prices for Chinesesubject imports declined overall from January-March 2005 (the first period reported) through October-December 2005, then fluctuated in 2006. In interim 2007, prices for Chinese subject imports declined,and in April-June 2007, reached their lowest level of the period.113 Over the period of investigation, thedomestic industry’s ratio of costs of goods sold (“COGS”) to net sales rose overall from 2004 to 2006, asdid the ratio of raw material costs to net sales. The ratios of COGS to net sales and raw material costs tonet sales were higher in interim 2007 than in interim 2006.114
The available data do not indicate that subject imports had a significant depressing effect ondomestic prices as domestic prices generally rose throughout the period. There also does not appear to bestrong evidence that subject imports had a significant price-suppressing effect from 2004 to 2006. Although the domestic industry’s ratio of COGS to net sales rose from 92.9 percent in 2004 to 94.1percent in 2006, the increase was irregular and relatively small.115 In interim 2007, however, prices werelower and costs higher than in interim 2006. Consequently, the ratio of COGS to net sales was higher ininterim 2007, at 103.0 percent, than in interim 2006, when it was 95.0 percent.116 Thus, while theevidence of price suppression effects is not conclusive when the period 2004-2006 is considered alone, anincipient trend appears confirmed based on interim year data. Ordinarily, we are reluctant to place greatweight on comparisons of partial-year periods. Here, however, those comparisons merit greater relevancebecause the record information that most sales contracts are annual and negotiated in the fourth quarter ofeach year. We conclude that the domestic industry is starting to experience a cost/price squeeze, and wewill re-examine this issue in any final phase investigations.
Nevertheless, the record in this preliminary phase suggests that, in the face of widespreadunderselling by the subject imports, the domestic industry is sacrificing market share in order to maintainand/or increase its prices. Thus, the pervasive underselling not only has contributed to the domesticindustry’s declining market share but also to the declines in other volume-based indicators discussedbelow.
D. Impact of the Subject Imports117
Section 771(7)(C)(iii) provides that the Commission, in examining the impact of the subjectimports on the domestic industry, “shall evaluate all relevant economic factors which have a bearing onthe state of the industry.”118 These factors include: output, sales, inventories, capacity utilization, market
118 (...continued)difficulties from a variety of sources and is vulnerable to dumped or subsidized imports.”) SAA at 885. 119 19 U.S.C. § 1677(7)(C)(iii); see also SAA at 851, 885; Live Cattle from Canada and Mexico, Inv. Nos. 701-TA-386, 731-TA-812-813 (Preliminary), USITC Pub. 3155 at 25 n.148 (Feb. 1999). 120 Domestic production capacity was 69,400 short tons in 2004, 66,999 short tons in 2005, and 70,100 short tonsin 2006. Production capacity was lower in interim 2007 (34,996 short tons) than in interim 2006 (35,193 short tons). CR/PR at Table C-1. 121 Production increased from 64,678 short tons in 2004 to 69,877 short tons in 2005 and 67,877 short tons in2006. Production was lower in interim 2007 (30,917 short tons) than in interim 2006 (34,135 short tons). CR/PR atTable C-1, CR/PR at Table III-2. The domestic industry’s U.S. shipments increased from 68,472 short tons in 2004to 70,685 short tons in 2005, and then decreased to 61,820 short tons in 2006. U.S. shipments were lower in interim2007 (27,430 short tons) than in interim 2006 (30,564 short tons). CR/PR at Table C-1. 122 We note that respondents assert that domestic producers do not have the capacity to supply the entire U.S.EMD market. Although domestic producers’ existing production is less than U.S. apparent consumption, U.S. EMDproducers appear capable of supplying a large share of the U.S. EMD market and experienced *** increase ininventories over the period of investigation. Moreover, as the Commission previously has noted, “there is no shortsupply provision in the statute” and “the fact that the domestic industry may not be able to supply all of demanddoes not mean the industry may not be materially injured or threatened with material injury by reason of subjectimports.” Softwood Lumber from Canada, Inv. Nos. 701-TA-414 and 731-TA-928 (Article 1904 NAFTA Remand)at 108, n. 310 (December 2003). See also, Certain Activated Carbon from China, Inv. No. 731-TA-1103(Preliminary), USITC Pub. 3852 (May 2006) at 19, n. 134; Certain Orange Juice from Brazil, Inv. No. 731-TA-1089 (Final), USITC Pub. 3838 (March 2006) at 20 n. 143; Certain Lined Paper School Supplies, Inv. Nos. 701-TA-442-443 (Preliminary) and 731-TA-1095-1097 (Preliminary), USITC Pub. 3811 (October 2005) at 23, n. 155; MetalCalendar Slides from Japan, Inv. No. 731-TA-1094 (Preliminary), USITC Pub. 3792 (August 2005) at 9, n. 45 (“Tothe extent that Respondents claim that the Commission is legally unable to make an affirmative finding of materialinjury by reason of subject imports because the domestic industry is incapable of supplying domestic demand, theyare incorrect.”). 123 Capacity utilization increased from 93.2 percent in 2004 to 99.8 percent in 2005, and then declined to 96.8percent in 2005. Capacity utilization was lower in interim 2007 (87.8 percent) than in interim 2006 (97.5 percent). CR/PR at Table C-1.
18
share, employment, wages, productivity, profits, cash flow, return on investment, ability to raise capital,research and development, and factors affecting domestic prices. No single factor is dispositive and allrelevant factors are considered “within the context of the business cycle and conditions of competitionthat are distinctive to the affected industry.”119
By most measures, the domestic industry’s performance indicators were positive in the first twoyears of the period of investigation. The indicators, however, showed a marked decline in 2006 andcontinued to worsen when the interim periods are compared as subject imports continued to capturemarket share from the domestic industry. Although overall industry capacity remained relatively stablethroughout the period,120 domestic producers’ total production and shipments of EMD increased from2004 to 2005, but decreased in 2006, and were lower in interim 2007 compared with interim 2006.121 122 Domestic producers’ capacity utilization increased irregularly from 2004 to 2006, and waslower in interim 2007 when compared to interim 2006.123 Domestic producers’ end-of-period inventories
124 End-of-period inventories declined from *** short tons in 2004 to *** short tons in 2005, then rose to ***short tons in 2005. End-of-period inventories were higher in interim 2007 (*** short tons) than in interim 2006 (***short tons). CR/PR at Table C-1.
We note that the parties offered differing views as to the role of inventories in the U.S. market. In any finalphase of these investigations, we intend to examine more fully the role of inventories. 125 While we examine the domestic industry as a whole, see 19 U.S.C. §1677(4)(A), we take into account, as acondition of competition, Energizer’s captive consumption. We note that the merchant market producers’ indicatorsfollowed similar trends as those for the industry as a whole.
Specifically, U.S. merchant producers’ U.S. commercial shipments increased from *** short tons in 2004 to*** short tons in 2005, and then decreased to *** short tons in 2006. U.S. commercial shipments were lower ininterim 2007 *** than in interim 2006 ***. U.S. merchant producers’ production increased from *** short tons in2004 to *** short tons in 2005 and then decreased to *** short tons in 2006. Production was lower in interim 2007(*** short tons) than in interim 2006 (*** short tons).
U.S. merchant producers’ production capacity was *** short tons in 2004 and *** short tons in 2005 and2006. Their production capacity in interim 2006 and in interim 2007 was *** short tons. Their capacity utilizationincreased from *** percent in 2004 to *** percent in 2005, and then declined to *** percent in 2006; capacityutilization was lower in interim 2007 *** than in interim 2006 ***. Merchant producers’ end-of-period inventoriesdeclined from *** short tons in 2004 to *** short tons in 2005, then rose to *** short tons in 2006. End-of-periodinventories were lower in interim 2007 (*** short tons) than in interim 2006 (*** short tons). CR/PR at Table C-2 126 The domestic industry’s average number of production workers decreased from 219 in 2004 to 216 in 2005,and then rose to 218 in 2006. The average number of workers was higher in interim 2007 (217) than in interim 2006(215). Hours worked decreased from 472,000 in 2004 to 467,000 in 2005, then increased to 470,000 in 2006. Hoursworked were lower in interim 2007 (234,000) than in interim 2006 (235,000). CR/PR at Table C-1.
U.S. merchant producers’ average number of production workers decreased from *** in 2004 to *** in2005, then rose to *** in 2006. The average number of workers was lower in interim 2006 *** than in interim 2007***. Hours worked decreased from *** in 2004 to *** in 2005, then increased to *** in 2006. Hours worked werehigher in interim 2007 *** than in interim 2006 ***. 127 The domestic industry paid wages of $11.9 million in 2004, $12.3 million in 2005, and $13.0 million in 2006. Wages paid during the interim periods were higher in interim 2007 ($6.5 million) in interim 2006 than in interim2006 ($6.4 million). CR/PR at Table C-1.
U.S. merchant producers paid wages of $*** in 2004, $*** in 2005, and $*** in 2006. Wages paid werehigher in interim 2007 ($***) than in interim 2006 ($***). CR/PR at Table C-2. 128 The domestic industry’s productivity increased from 137.0 tons/1,000 hours in 2004 to 149.6 tons/1,000 hoursin 2005, and to 144.4 tons/1,000 hours in 2006. Productivity was lower in interim 2007 at 132.1 tons/1,000 hoursworked, than in interim 2006, when it was 145.3 tons/1,000 hours worked. CR/PR at Table C-1.
U.S. merchant producers’ productivity increased from *** in 2004 to *** in 2005, then declined to *** in2004. Productivity was lower in interim 2007 *** than in interim 2006 ***. CR/PR at Table C-2. 129 The domestic industry’s net sales values were $90.4 million in 2004, $94.8 million in 2005, and $87.1 millionin 2006. They were lower in interim 2007 ($37.9 million) than in interim 2006 ($42.8 million). CR/PR at Table C-1.
U.S. merchant producers’ net sales values were $*** in 2004, $*** in 2005, and $*** in 2006. They werelower in interim 2007 *** than in interim 2006 ***. CR/PR at Table C-2.
19
decreased from 2004 to 2005 but then *** in 2006. Such inventories were also *** higher in interim2007 when compared to interim 2006.124 125
The average number of production-related workers and hours worked remained fairly steadyfrom 2004 to 2006, and when the interim periods are compared.126 Wages paid increased from 2004 to2006, and were higher in interim 2007 when compared to interim 2006.127 While productivity increasedirregularly from 2004 to 2006, it was lower in interim 2007 when compared with interim 2006.128
The domestic industry’s financial indicators were mixed in 2004 and 2005, and worsened in 2006and when the interim periods are compared. The net sales value decreased by 3.7 percent from 2004 to2006, and was 11.5 percent lower in interim 2007 than in interim 2006.129 The domestic industry’s
1 The domestic industry’s operating income was negative $1.5 million in 2004, positive $3.6 million in 2005, andnegative $3.4 million in 2006. The domestic industry’s operating losses were higher in interim 2007 ($5.7 million)than in interim 2006 ($2.2 million). CR/PR at Table C-1.
U.S. merchant producers’ financial indicators followed similar trends as those for the industry as a whole. U.S. merchant producers’ *** from $*** in 2004 to $*** in 2005, then *** to $*** in 2006. Their *** was *** ininterim 2007, compared to *** in interim 2006. CR/PR at Table C-2. 2 The domestic industry’s operating margin increased from negative 1.6 percent in 2004 to positive 3.8 percent in2005, and then decreased to negative 3.9 percent in 2006. The operating margin was substantially lower in interim2007 (negative 15.2 percent) than in interim 2006 (negative 5.1 percent). CR/PR at C-1.
U.S. merchant producers’ operating margin increased from *** percent in 2004 to *** percent in 2005, andthen decreased to *** percent in 2006. The operating margin was *** in interim 2007 *** than in interim 2006 ***. CR/PR at Table C-2. 3 The domestic industry’s capital expenditures were $*** in 2004, $*** in 2005, and $*** in 2006. Capitalexpenditures were higher in interim 2007 (***) than in interim 2006 (***). Research and development expenditureswere $*** in 2004, $*** in 2005, and $*** in 2006. These expenditures were lower in interim 2007 ($***) then ininterim 2006 ($***). CR/PR at Table VI-9.
U.S. merchant producers’ capital expenditures were $*** in 2004, and were $*** in 2005 and in 2006. They were higher in interim 2007 ($***) than in interim 2006 ($***). CR/PR at C-2. Research and developmentexpenditures were $*** in 2004, $*** in 2005 and $*** in 2006. These expenditures were lower than in interim2007 ($***) than in interim 2006 ($***). CR/PR at Table VI-9. 4 CR/PR at Table C-1.
20
industry’s operating income fluctuated between 2004 and 2006, declining overall by 128.1 percent. Thedomestic industry’s operating loss was higher in interim 2007, by 161.8 percent, compared to interim2006.1 The domestic industry’s ratio of operating income to sales followed a similar pattern.2
Capital expenditures decreased from 2004 to 2005, then increased in 2006, and were higher ininterim 2007 than in interim 2006. Research and development expenditures increased from 2004 to 2006,but were lower in interim 2007 than in interim 2006.3
For purposes of the preliminary phase of these investigations, we find a reasonable indication thatcumulated subject imports had a significant negative impact on the condition of the domestic industryduring the period of investigation. As discussed above, the absolute and relative volumes of subjectimports are significant and their underselling was significant, leading subject imports to gain market shareat the expense of the domestic industry. From 2004 to 2006, the domestic industry lost market share andits U.S. shipments fell in quantity, yet it continued production at high levels of capacity utilization. As aresult, the domestic industry experienced a *** inventory buildup, finally causing the industry to cutproduction in interim 2007, resulting in higher unit COGS,4 even as inventories continued to build. Thus,subject imports had an adverse impact on the condition of the domestic industry, as exemplified by suchindicators as declining capacity utilization rates, increasing inventories, and accompanying operatinglosses. We therefore find that subject imports had a significant negative impact on the performance of thedomestic industry during the period examined.
CONCLUSION
For the reasons stated above, we determine that there is a reasonable indication that an industry inthe United States is materially injured by reason of subject imports of EMD from Australia and Chinathat are allegedly sold in the United States at less than fair value.

1 A complete description of the imported product subject to these investigations is presented in The SubjectProduct section located in Part I of this report. The merchandise subject to these investigations is classified in theHarmonized Tariff Schedule of the United States (“HTS”) under subheading 2820.10.00. The normal trade relationstariff rate on EMD, applicable to imports from China, is 4.7 percent ad valorem. Imports of EMD from Australia areduty-free. 2 Federal Register notices cited in the tabulation are presented in app. A.
I-1
PART I: INTRODUCTION
BACKGROUND
These investigations result from a petition filed on August 22, 2007, by Tronox LLC (“Tronox”),Oklahoma City, OK, alleging that an industry in the United States is materially injured and threatenedwith further material injury by reason of less-than-fair-value (“LTFV”) imports of electrolytic manganesedioxide (“EMD”)1 from Australia and China. Information relating to the background of theseinvestigations is provided below.2
Effective date Action
August 22, 2007 Petition filed with Commerce and the Commission; Commission institutesinvestigations (72 FR 49309, August 28, 2007)
September 12, 2007 Commission’s conference (a list of witnesses that appeared at the conference ispresented in appendix B)
September 17, 2007 Commerce’s notice of initiation (72 FR 52850, September 17, 2007)
October 5, 2007 Date of the Commission’s vote
October 9, 2007 Commission’s determinations transmitted to Commerce
October 16, 2007 Commission’s views transmitted to Commerce
STATUTORY CRITERIA AND ORGANIZATION OF THE REPORT
Section 771(7)(B) of the Tariff Act of 1930 (the “Act”) (19 U.S.C. § 1677(7)(B)) provides that inmaking its determinations of injury to an industry in the United States, the Commission--
shall consider (I) the volume of imports of the subjectmerchandise, (II) the effect of imports of thatmerchandise on prices in the United States for domesticlike products, and (III) the impact of imports of suchmerchandise on domestic producers of domestic like products, but only in the context of production operations within theUnited States; and . . . may consider such other economic factors as arerelevant to the determination regarding whether there is material injuryby reason of imports.
I-2
Section 771(7)(C) of the Act (19 U.S.C. § 1677(7)(C)) further provides that--
In evaluating the volume of imports of merchandise, theCommission shall consider whether the volume ofimports of the merchandise, or any increase in thatvolume, either in absolute terms or relative toproduction or consumption in the United States issignificant.. . .In evaluating the effect of imports of such merchandiseon prices, the Commission shall consider whether . . . (I)there has been significant price underselling by theimported merchandise as compared with the price ofdomestic like products of the United States, and (II) theeffect of imports of such merchandise otherwisedepresses prices to a significant degree or prevents priceincreases, which otherwise would have occurred, to asignificant degree.. . .In examining the impact required to be considered undersubparagraph (B)(i)(III), the Commission shall evaluate(within the context of the business cycle and conditionsof competition that are distinctive to the affectedindustry) all relevant economic factors which have abearing on the state of the industry in the United States,including, but not limited to. . . (I) actual and potential declines in output, sales, market share,profits, productivity, return on investments, and utilization of capacity,(II) factors affecting domestic prices, (III) actual and potential negativeeffects on cash flow, inventories, employment, wages, growth, ability toraise capital, and investment, (IV) actual and potential negative effectson the existing development and production efforts of the domesticindustry, including efforts to develop a derivative or more advancedversion of the domestic like product, and (V) in {an antidumpinginvestigation}, the magnitude of the margin of dumping.
Information on the subject merchandise, alleged margins of dumping, and domestic like productis presented in Part I. Information on conditions of competition and other relevant economic factors ispresented in Part II. Part III presents information on the condition of the U.S. industry, including data oncapacity, production, shipments, inventories, and employment. The volume and pricing of imports of thesubject merchandise are presented in Parts IV and V, respectively. Part VI presents information on thefinancial experience of U.S. producers. Part VII presents the statutory requirements and informationobtained for use in the Commission’s consideration of the question of threat of material injury and thejudicial requirements and information obtained for use in the Commission’s consideration pursuant toBratsk rulings.
3 Tronox and Erachem sell EMD in the merchant market. Energizer internally consumes *** the EMD itproduces in its battery manufacturing facilities. 4 Notice of Institution of Antidumping Duty Investigations: Electrolytic Manganese Dioxide from Greece,Ireland, and Japan, 53 FR 21530, June 8, 1988.
I-3
U.S. EMD MARKET SUMMARY
U.S. apparent consumption for EMD totaled approximately $131.1 million (96,175 short tons) in 2006. Three firms – Energizer Battery Manufacturing Inc. (“Energizer”), Erachem Comilog, Inc. (“Erachem”), and Tronox LLC (“Tronox”) – accounted for all known U.S. production in 2006. At leastfive firms have imported EMD from Australia and/or China since 2004. The three largest importers – ***– accounted for *** percent of reported U.S. imports from Australia and *** percent of reported U.S.imports from China in 2006. One firm, *** produces EMD in Australia and at least 14 firms produceEMD in China. The two largest producers in China – *** – accounted for approximately *** percent ofreported Chinese production in 2006, approximately *** percent of reported Chinese exports to theUnited States in 2006, and *** percent of reported U.S. imports of EMD from China in 2006.
EMD is primarily used in the manufacture of alkaline batteries, but may also be used in somebattery applications such as in military and other special purpose areas. Four purchasers of EMD -- Duracell, a division of The Procter & Gamble Co. (“Duracell”), Energizer Battery Manufacturing Inc. (“Energizer”), Panasonic Primary Battery Corp. of America (“Panasonic”), and Spectrum Brands, Inc. (formerly Rayovac Corp.) (“Spectrum”) -- accounted for virtually 100 percent of EMD consumption in2006.
U.S. producers’ U.S. shipments of EMD totaled 61,820 short tons in 2006, and accounted for64.3 percent of apparent U.S. consumption by quantity. U.S. imports from Australia totaled *** shorttons in 2006, and accounted for *** percent of apparent consumption by quantity; U.S. imports fromChina totaled *** short tons in 2006, and accounted for *** percent of apparent U.S. consumption byquantity; and U.S. imports from all other sources combined totaled *** short tons in 2006, and accountedfor *** percent of apparent U.S. consumption by quantity.
SUMMARY DATA
A summary of data collected in these investigations for the U.S. EMD market is presented inappendix C, tables C-1 (data on the total U.S. market) and C-2 (data on the U.S. merchant market). TableC-1 includes data submitted by all three U.S. producers. Table C-2 includes data for the two U.S.producers that sell EMD in the merchant market.3
Producer data are based on questionnaire responses of three firms that accounted for all U.S.production of EMD during the period examined. U.S. import data are based on questionnaire responsesof ten importers that accounted for virtually all imports of EMD during the period examined. Data onU.S. consumption of imports were compiled using shipment data reported in the questionnaire responsesof the ten firms that imported the subject product during the period examined.
PREVIOUS AND RELATED INVESTIGATIONS
On May 31, 1988, the Commission instituted antidumping investigations on EMD (defined as inthe present investigations) from Greece, Ireland, and Japan.4 On April 10, 1989, the Commission issued
5 Electrolytic Manganese Dioxide from Greece and Japan, Invs. Nos. 731-TA-406 and 408 (Final), USITCPublication 2177 (April 1989), p. 1. Commerce determined that there were no LTFV imports of EMD from Ireland,and the investigation concerning Ireland was terminated. 6 54 FR 15244, April 17, 1989. 7 In its request, Eveready alleged the following changed circumstances: (1) the addition of a third recognizedtype of EMD–“high drain” EMD, (2) structural changes in battery consumption (a shift from C and D size batteriesto smaller AA and AAA size batteries), and (3) the impending unavailability of supply of regular and “high drain”EMD from U.S. producers and producers in countries not subject to antidumping duty orders. 8 63 FR 43192, August 12, 1998. 9 Eveready Battery Co., Inc. v. United States, Slip. Op. 99-126 (CIT, November 23, 1999). 10 Notice of Institution of Five-year Reviews: Electrolytic Manganese Dioxide from Greece and Japan, 64 FR23675, May 3, 1999. The Commission determined to conduct full five-year reviews on these orders. 64 FR 46407,August 25, 1999. 11 Electrolytic Manganese Dioxide from Greece and Japan, Invs. Nos. 731-TA-406 and 408 (Review), USITCPublication 3296 (May 2000), p. 1. 12 Notice of Institution of Antidumping Duty Investigations: Electrolytic Manganese Dioxide from Australia,China, Greece, Ireland, Japan, and South Africa, 68 FR 47607, August 11, 2003. 13 68 FR 55062, September 22, 2003.
I-4
final affirmative determinations with regard to imports of EMD from Greece and Japan,5 and on April 17,1989 Commerce issued antidumping duty orders on EMD from Greece and Japan.6
On May 26, 1998, Eveready (referred to as Energizer in this report) filed with the Commission arequest for a changed circumstances review with regard to imports from Greece pursuant to section751(b) of the Act.7 The Commission determined that the request did not show changed circumstancessufficient to warrant a review.8 Eveready appealed the Commission’s determination to the Court ofInternational Trade. The Commission moved to dismiss the appeal, which was granted on the basis thatan upcoming five-year review of the orders would provide the equivalent relief Eveready sought.9
On May 3, 1999, the Commission instituted five-year reviews to determine whether revocation ofthe antidumping duty orders on imports of EMD from Greece and Japan would likely lead to thecontinuation or recurrence of material injury to the domestic EMD industry.10 On April 20, 2000, theCommission determined that revocation would not likely lead to continuation or recurrence of materialinjury to the U.S. industry, and the orders were subsequently revoked.11
On July 31, 2003, the Commission instituted antidumping investigations on EMD from Australia,China, Greece, Ireland, Japan, and South Africa.12 On September 15, 2003, the Commission madeaffirmative preliminary determinations on EMD from Australia, Greece, Ireland, Japan, and South Africa,and determined that imports from China were negligible, thus ending the investigation concerningChina.13 On March 2, 2004, the Commission received notice from the Department of Commerce(“Commerce”) stating that it had received a letter from petitioner Kerr-McGee Chemical LLC (nowTronox) withdrawing its petitions. As a result, Commerce and the Commission terminated theirrespective investigations.
NATURE AND EXTENT OF ALLEGED SALES AT LTFV
On September 17, 2007, Commerce published a notice in the Federal Register of the initiation ofthe antidumping investigations on EMD from Australia and China. The estimated weighted-average
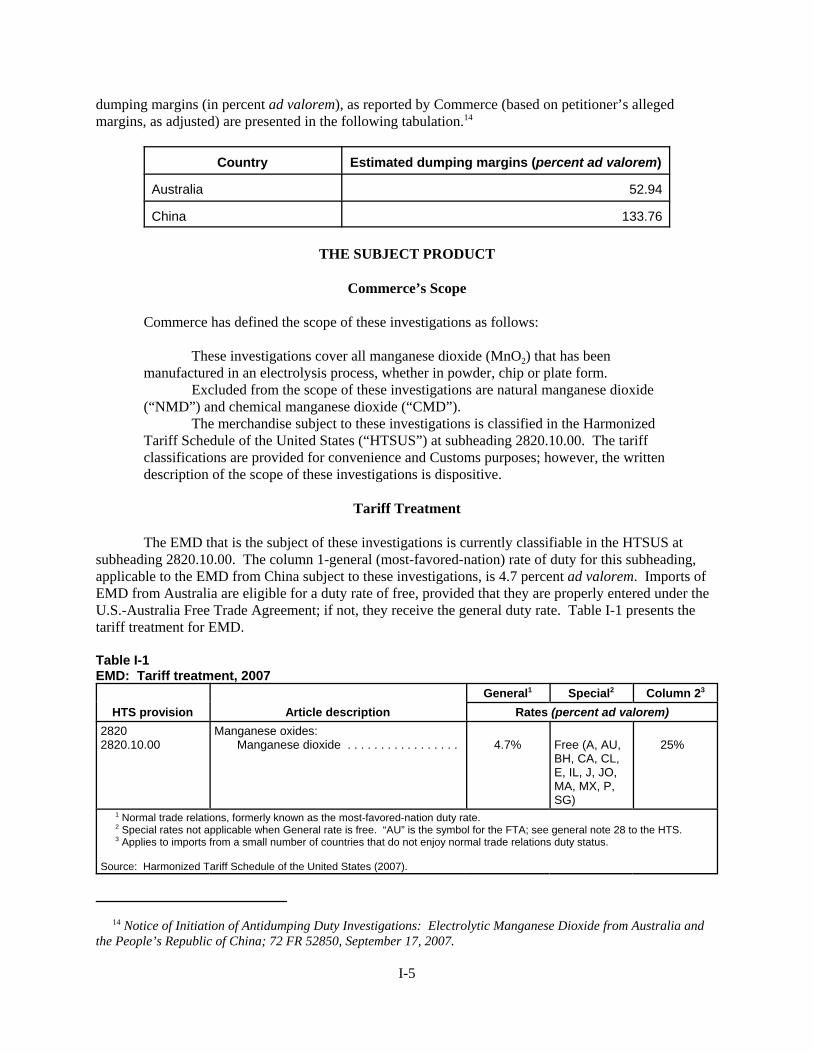
14 Notice of Initiation of Antidumping Duty Investigations: Electrolytic Manganese Dioxide from Australia andthe People’s Republic of China; 72 FR 52850, September 17, 2007.
I-5
dumping margins (in percent ad valorem), as reported by Commerce (based on petitioner’s allegedmargins, as adjusted) are presented in the following tabulation.14
Country Estimated dumping margins (percent ad valorem)
Australia 52.94
China 133.76
THE SUBJECT PRODUCT
Commerce’s Scope
Commerce has defined the scope of these investigations as follows:
These investigations cover all manganese dioxide (MnO2) that has beenmanufactured in an electrolysis process, whether in powder, chip or plate form.
Excluded from the scope of these investigations are natural manganese dioxide(“NMD”) and chemical manganese dioxide (“CMD”).
The merchandise subject to these investigations is classified in the HarmonizedTariff Schedule of the United States (“HTSUS”) at subheading 2820.10.00. The tariffclassifications are provided for convenience and Customs purposes; however, the writtendescription of the scope of these investigations is dispositive.
Tariff Treatment
The EMD that is the subject of these investigations is currently classifiable in the HTSUS atsubheading 2820.10.00. The column 1-general (most-favored-nation) rate of duty for this subheading,applicable to the EMD from China subject to these investigations, is 4.7 percent ad valorem. Imports ofEMD from Australia are eligible for a duty rate of free, provided that they are properly entered under theU.S.-Australia Free Trade Agreement; if not, they receive the general duty rate. Table I-1 presents thetariff treatment for EMD.
Table I-1EMD: Tariff treatment, 2007
HTS provision Article descriptionGeneral1 Special2 Column 23
Rates (percent ad valorem)28202820.10.00
Manganese oxides:Manganese dioxide . . . . . . . . . . . . . . . . . 4.7% Free (A, AU,
BH, CA, CL,E, IL, J, JO,MA, MX, P,SG)
25%
1 Normal trade relations, formerly known as the most-favored-nation duty rate. 2 Special rates not applicable when General rate is free. “AU” is the symbol for the FTA; see general note 28 to the HTS. 3 Applies to imports from a small number of countries that do not enjoy normal trade relations duty status.
Source: Harmonized Tariff Schedule of the United States (2007).

15 Petition, pp. 7-9. 16 Petition, p. 8. 17 Conference transcript, p. 53 (Gutwald). 18 ***. 19 Tronox developed a patented “high drain” EMD in the late 1990s. This technology is designed to produce anEMD for batteries that can handle the next generation of electronic devices that have a higher drain capacity orhigher power utilization requirement. However, “high drain” EMD has not been commercially successful duringthe period covered by these investigations. (Conference transcript, p. 43 (Gutwald) and p. 52 (Stater)).
I-6
THE DOMESTIC LIKE PRODUCT
Physical Characteristics and Uses
EMD is a black powder (or plate or chip that will be ground into powder) that has a gammacrystalline structure. The powder form is required for use in dry-cell batteries. Its gamma crystallinestructure, as opposed to most other crystalline structures that manganese dioxide powder can assume,allows for the free transfer of hydrogen ions within the manganese dioxide crystal, thus resulting in thefullest possible utilization of the manganese dioxide in the production of electrical current within a dry-cell battery.15
There are three grades of EMD--alkaline, zinc chloride, and lithium grade; however, virtually allEMD produced in the United States is the alkaline grade.16 Alkaline grade EMD, because of particle sizeand pH (acidity level), qualifies for use in the manufacture of alkaline batteries; zinc chloride-gradequalifies for use in zinc chloride batteries; and lithium grade qualifies for use in rechargeable batteries andalso can be used in some primary battery applications such as in military and other special purposeareas.17 The particle size (grind) and pH are achieved in the finishing process of the EMD. All otherproperties of the three grades of EMD are essentially identical, including the moisture content, sulfatecontent, other metallic element content, purity, and crystalline structure.
Within each of the grades of EMD, there is relatively higher and lower quality EMD. Higherquality EMD tends to have a higher discharge rate and longer shelf life than lower quality EMD in thesame grade. Higher quality EMD is distinguished from lower quality EMD by its lower levels ofimpurities, superior flow characteristics of the materials in the battery, and higher energy capacity per unitweight. Features such as grain size, uniformity, abrasiveness, pH, and moisture levels are alsoimportant.18 Of course, the quality of EMD is only one factor out of many that contribute to the quality ofa finished battery.19
In addition to EMD, there are two other types of manganese dioxide, both of which can be usedin dry-cell batteries: natural manganese dioxide (“NMD”) and chemical manganese dioxide (“CMD”). NMD consists of certain naturally occurring manganese ore, selected because of its high MnO2 content,favorable electrochemical properties, and low level of impurities. The ore is often processed to removeimpurities and improve its battery activity. NMD has a lower performance rate than EMD or CMD butmay be blended with synthetic manganese dioxide for increased performance. Subsequent to theinvention of the wet zinc/manganese dioxide primary cell (the precursor of the present-day dry-cellbattery) in the 1860s, NMD was the only type of manganese dioxide used in dry-cell batteries. NMD isnot produced in the United States today, only small amounts (if any) are imported, and NMD is not withinthe scope of these investigations.
CMD is chemically precipitated, battery-active manganese dioxide. CMD differs from EMD inthree major respects: surface area, electrolyte absorption, and density. As a result, CMD generallyexhibits lower discharge rates than does EMD. CMD is used outside the United States in lower-

20 A Tronox official testified that he has no knowledge of any NMD or CMD production in the United States. Conference transcript, p. 52 (Stater). 21 The shelf life of a battery is a measure of how long a battery may be stored and still provide useful service. Alkaline batteries typically have a shelf life of several years. 22 Electrolytic Manganese Dioxide from Australia, China, Greece, Ireland, Japan, and South Africa,Investigations Nos. 731-TA-1048-1053 (Preliminary), Publication 3633, September 2003, pp. I-8-I-9. 23 Conference transcript, p. 68 (Reilly). 24 According to Spectrum, purchases of EMD under a single contract may be used in any number of differentplants. “When Spectrum negotiates a contract for the supply of EMD, the EMD that is purchased under that contractmay be used in battery production in either the United States or one of the Company’s foreign plants, or both.” Spectrum’s postconference brief, p. 2. However, *** indicated that qualification is not transferable among facilitiesin different geographic locations. ***. 25 Ibid., p. 11. 26 Ibid., app. 4. 27 According to Tronox, “We also understand that EMD from Australia and China is routinely supplied into thoselarge cells that account for a large part of the market. In addition, we have heard from customers and competitorsthat both Australian and Chinese EMD are suitable for use in the small cells. Now, we believe that we produce afirst rate, high quality product. The reality is the subject imports are also of a high quality. As a result, EMD has
(continued...)
I-7
performance batteries but is not known to be used domestically in batteries. CMD is not within the scopeof these investigations.20
As noted, of the three grades of EMD, alkaline-grade EMD is required for alkaline batteries. Inan alkaline battery, the cathode consists of a high-density blend of EMD and graphite. The electrolyte isconcentrated potassium hydroxide; potassium hydroxide is very alkaline or “basic” (the opposite ofacidic). The anode is composed of powdered amalgamated zinc.
Before EMD can be used in a battery, a sample is tested extensively (“qualification”). The mostimportant tests that an EMD producer or consumer uses to determine EMD quality are (1) dischargeperformance tests, (2) gassing tests, and (3) tests to measure the compressed density of the EMD. Thedischarge performance test measures how long a battery will maintain useful voltage for a given load andrate of discharge. This test essentially provides information on the number of hours of service a batterywill provide. The gassing test measures how much gas is generated as a result of impurities in the EMD. The less gas that is generated, the purer the EMD and the longer the shelf life of the battery.21 Tests tomeasure the compressed density of a given sample of EMD determine how much EMD can be used in abattery within the space limitations of the battery. The more EMD that can be contained in a battery, thehigher the electrical capacity of the battery.
Although a given sample of EMD may perform satisfactorily when subjected to standard testssuch as the discharge performance test, it must be qualified before it can be used in a specific battery. The qualification process is both battery-specific and plant-specific, and can range from about *** to ***in duration.22 Qualification standards for EMD used in AA and AAA batteries are also reported to bemore stringent than standards for EMD used in C and D batteries.23 24 In general, this is because smaller-battery performance is more dependent on EMD discharge quality than that of the larger batteries. Thequalification process ensures that the processing equipment used to manufacture a given battery iscompatible with the type of EMD to be used, so as to optimize battery performance. The qualificationprocess entails chemical analysis of the EMD, followed by a series of test trials up to and including alimited plant run of about one week of production.25 The time involved in the qualification process isdescribed by Spectrum as lasting between ***.26
Tronox contends that EMD has become a commodity-like product as producers from a number ofcountries have improved their production processes so as to better control EMD quality.27 Respondents
27 (...continued)increasingly become commoditized.” Conference transcript, p. 23 (Gutwald). 28 Respondents testified “Unlike a commodity, EMD is not sold principally on the basis of price. Now, becauseof that in economist’s terms EMD from different manufacturers are imperfect substitutes. Now, the importantnonprice characteristics include product quality, and quality features include grain size, uniformity, freedom fromimpurities, abrasiveness, compliance with customer specifications including pH moisture levels and so forth.”Conference transcript, p. 67 (Reilly) and Delta Australia’s postconference brief, p. 8. 29 Spectrum’s postconference brief, p. 8. 30 Ibid. 31 Petition, p. 9. 32 For ore containing manganese carbonate the reduction step is omitted. 33 Electrolytic Manganese Dioxide from Australia, China, Greece, Ireland, Japan, and South Africa,Investigations Nos. 731-TA-1048-1053 (Preliminary), USITC Publication 3633, September 2003, p. I-7-I-8. 34 Later removal of the iron is important because it would otherwise contaminate the product and affect efficiencyin the electrolysis process, and because impurities such as arsenic and lead are co-precipitated when the iron isprecipitated.
I-8
disagree that “commoditization” has occurred.28 In any event, quality remains a source of concern incertain instances, not only for foreign suppliers but also for domestic suppliers. For example, Spectrumdescribes the Chinese EMD as having particulates added to it to “enhance deposit yields,” whichproduces “more manganese dioxide for a given applied current,” but results in reduced performance.29 Spectrum reports ***.30
Production Process
All types and grades of EMD, whether imported or domestically produced, are subject to thesame general manufacturing process. There are three stages of EMD production: ore handling,electrolysis, and finishing.31 Ore handling involves the preparation of manganese dioxide for electrolysis. Currently, the only suitable ores contain either manganese dioxide or manganese carbonate. Manganeseore containing manganese dioxide is crushed and ground and then fed into reduction furnaces that convertmanganese dioxide to the sulfuric acid-soluble manganese oxide (MnO) known as the reduced ore.32 Themanganese is then “leached” by having the reduced ore digested continuously in spent electrolyte andsulfuric acid. Next, the resulting manganese sulfate solution is purified to remove, to the extent possible,such impurities as copper, nickel, cobalt, molybdenum, antimony, and arsenic (manganese dioxide forbatteries should be essentially free of impurities that would deposit on a zinc anode).33 Iron may be addedto aid in the removal of impurities.34
In electrolysis, the manganese sulfate solution is processed through a number of thickeners andfilters and is fed to the electrolytic cell room. The purified manganese sulfate is then metered to theelectrolytic cells, where hydrogen is liberated at carbon or lead cathodes and manganese dioxide isdeposited on titanium anodes. The period of electrolysis lasts from two to four weeks.
In the finishing process, the anodes are removed from the cells and are immersed in hot water toremove the electrolyte solution. The EMD deposit is removed from the anodes, washed, and neutralizedto remove traces of the electrolyte. Neutralization determines the final pH of the EMD. EMD is in plateor chip form when removed from the anodes and neutralized, but must be ground into a powder for use inbatteries. It is usually ground and sold as a powder by the EMD producers. Prior to shipment, the EMDis dried and packed according to customer specification. Before EMD is shipped to a customer, relativelyminor adjustments are made to meet the particular needs of the customer. Adjustments include modifyingthe particle-size distribution, compressed density, and abrasiveness of the EMD.

35 The Commission’s decision regarding the appropriate domestic products that are “like” the subject importedproducts is based on a number of factors including (1) physical characteristics and uses; (2) common manufacturingfacilities and production employees; (3) interchangeability; (4) customer and producer perceptions; (5) channels ofdistribution; and (6) price. 36 Petitioner’s postconference brief, p. 6; see also Delta Australia’s September 19, 2007 Responses toSupplemental Questions, p. 9, and Spectrum’s postconference brief, pp. 6-7.
I-9
In response to questions on whether firms produced other products on the same equipment andmachinery used in the production of EMD, and using the same production and related workers, ***.
Channels of Distribution
The Commission’s questionnaire asked firms to report the quantity of U.S. shipments sold todistributors and end users. Data compiled in response to Commission questionnaires concerning thesechannels of distribution, by country, are presented in table I-2.
Table I-2EMD: U.S. producers’ and importers’ shares of reported U.S. shipments, by sources and channelsof distribution, 2004-06, January-June 2006, and January-June 2007
* * * * * * *
DOMESTIC LIKE PRODUCT ISSUES
Presented below is information related to the Commission’s “domestic like product” finding.35 No responding party has objected to the petitioner’s definition of the domestic like product, “all EMDproduced in the United States.”36 Information on interchangeability, customer and producer perceptions,and channels of distribution is presented in Part II of this report, and information on the pricing of EMDis presented in Part V.


1 Letter/supplemental questionnaire response from ***, September 19, 2007; e-mail from ***, September 18,2007; letter from ***, September 14, 2007; and Spectrum’s postconference brief, attachments 2-4. 2 Petition, p. 8. The EMD is used by U.S. battery producers to produce the cathode part of the battery, whichincludes EMD, graphite, and an electrolyte. This cathode formulation may be different from one battery cell size toanother and from one battery producer to another (letter from ***, September 19, 2007). 3 Petition, p. 31.
II-1
PART II: CONDITIONS OF COMPETITION IN THE U.S. MARKET
CHANNELS OF DISTRIBUTION AND MARKET CHARACTERISTICS
The reporting U.S. producers of EMD and U.S. importers of EMD from Australia, China, andnonsubject countries shipped their EMD nearly exclusively to U.S. battery producers during January2004-June 2007. Table II-1 shows U.S. battery producers’ reported purchases of EMD bysupplier/country-of-origin and by year during January 2004-June 2007 and table II-2 shows U.S. batteryproducers’ use of EMD by supplier/country-of-origin and by size/type of battery during 2006.1
Table II-1EMD: U.S. battery producers’ purchase quantities of EMD, by country of origin and supplier, 2004-06 and January-June 2007
* * * * * * *
Table II-2EMD: U.S. battery producers’ usage of EMD, by country of origin, supplier, and size/type ofbattery, 2006
* * * * * * *
The properties of EMD make it particularly useful in the production of dry-cell batteries,particularly alkaline batteries, by far its principal use.2 Depending on the size and characteristics ofdifferent dry-cell batteries, differing types of EMD may be used. Demand for EMD is derived almostexclusively from demand for alkaline batteries, which, in turn, is derived from the demand for thewireless/portable electronic devices that use these batteries.
EMD is purchased almost exclusively by four U.S. battery producers for the production of dry-cell batteries, whereas there are at least nine merchant market suppliers (including two U.S. EMDproducers) of U.S.-produced and imported EMD to the U.S. market. According to the petitioner,purchasers reportedly have enough market power to pressure their suppliers to meet undisclosed lowerprices from competing suppliers.3
4 Short-run effects discussed in the supply and demand sections refer to changes that could occur within 12months, unless otherwise indicated. 5 Data on U.S. EMD production, production capacity, capacity utilization, inventories, and exports are shown indetail in Part III. 6 Conference transcript, p. 17 (Stater). 7 According to the petitioner, supply relationships at different U.S. accounts are well-established (petition, p. 31). 8 U.S. producer questionnaire response, section IV-B-15a; the reported figures for variable and fixed costs wereweighted by each responding firm’s reported total EMD production costs to derive a weighted-average figure for theindustry. The U.S. EMD producers were also requested to identify which costs they considered variable and whichthey considered fixed (Ibid.). The two responding U.S. EMD producers identified a number of variable cost items,such as ***; and a number of fixed cost items, such as ***. The primary raw material for all U.S. EMD producerswas manganese dioxide, which, for the two responding U.S. producers, averaged *** percent of their costs toproduce EMD in 2006; this weighted-average figure was developed by weighting each firm’s response for themanganese dioxide cost share in 2006 by its reported total EMD production costs during this period.
II-2
SUPPLY AND DEMAND CONSIDERATIONS4
U.S. Supply5
U.S. Production
Based on available information, U.S. producers had an ability to respond to changes in U.S.demand with moderate changes in the quantity of shipments of U.S.-produced EMD to the U.S. marketduring January 2004-June 2007. Factors contributing to this degree of responsiveness of supply arediscussed below.
Industry capacity
Based on the three U.S. producers’ reported capacity and production, the domestic industry’sannual capacity utilization for EMD fluctuated but remained high during 2004-06, averaging 96.9 percentduring this period; capacity utilization was 87.8 percent during January-June 2007 compared to 97.5percent during January-June 2006. These levels of capacity utilization indicate that U.S. producers ofEMD generally had a limited amount of available capacity with which they could increase production ofEMD in the short run in the event of a price change, particularly during 2004-06, but available capacityincreased during January-June 2007. Tronox reported that the capital-intensive nature of the EMDproduction process requires the firm to operate the plant as fully as possible to minimize unit costs.6 U.S.producers’ flexibility may be constrained by limited capability of specific U.S. plants to produce or to bequalified by end users to supply all the required types/grades of EMD.7
The two responding U.S. producers of EMD, ***, reported in their questionnaire responses theirvariable costs, which averaged, for both responding producers combined, *** percent of their costs toproduce EMD during 2006, while fixed costs were *** percent.8 Although low output levels reportedlylead to increased unit costs, significant variable costs likely moderate, at least somewhat, such an increasein unit costs. In the short run, firms with high variable costs to total costs tend to reduce production andmaintain prices when faced with a downturn in demand, whereas firms with high fixed costs tend toreduce selling prices and maintain production.
9 Petition, p. 31. 10 Tronox’ postconference brief, exh. 1, p. 4. 11 Ibid. 12 *** (U.S. producer questionnaire response, section II-3). 13 U.S. producer questionnaire responses, section II-3.
II-3
According to petitioners, the economics of EMD production depend on high rates of capacityutilization. For this reason, all major producers must maintain enough volume at key accounts to keeptheir plants operating at or near full capacity, even at the expense of lower prices.9
Inventory levels
The three U.S. producers of EMD reported combined end-of-period inventory quantities thatfluctuated but *** during 2004-06, from *** percent of U.S. producers’ total shipments of the U.S.-produced EMD during 2004 to *** percent during 2006; these inventories were *** percent of annualizedshipments during January-June 2007 and *** percent during January-June 2006. These levels ofinventories suggest that U.S. producers had some ability to use inventories to respond to price changes inthe short run. This flexibility may be restrained in the short run to the extent that U.S. producers’inventories consist of products that are not required by the increased demand, or consist of productsalready committed to customers in the U.S. and/or export markets. Tronox reported that its EMDinventories are generally available for sale, but it maintains consigned inventories for ***.10 Tronoxstated further that the growth in its EMD inventories reflects reduction in demand for its EMD, and notany changes to its inventory-holding policies with its customers.11 In addition, end-of-period inventoriesof EMD held by Energizer during January 2004-March 2007 averaged *** short tons annually during thisperiod, or almost *** percent of all three U.S. EMD producers’ combined average annual inventories ofEMD during this period. Energizer’s inventories of its U.S.-produced EMD is ***.
Alternate markets
The three U.S. producers’ total reported exports of their U.S.-produced EMD averaged less than*** percent of the quantity of their total shipments of U.S.-produced EMD January 2004-June 2007. The*** level of exports during the period indicates that domestic producers of EMD are constrained in theirability to shift shipments between the United States and other markets in the short run in response to pricechanges. This flexibility may be further restrained in the short run to the extent that U.S. producers’ salesof EMD exported to third-country markets were not used/acceptable in the U.S. market or vice versa, orto the extent that U.S. producers have binding supply agreements longer than 12 months with customersin the U.S. and/or export markets.
Production alternatives
***,12 and ***.13 The ability of U.S. producers to shift production between EMD and otherproducts would enhance their supply responsiveness in the short run in response to relative price changesbetween EMD and alternative production products.
14 In comparison, Delta’s EMD inventories were *** percent of its total shipments during January-June 2006. 15 Delta’s foreign producer questionnaire response, section II-1.
II-4
Imports from Australia
Based on available information, staff believes that the lone Australian producer of EMD, Delta, islikely to respond to changes in demand with relatively *** changes in shipments of Australian-producedEMD to the U.S. market. Factors contributing to this degree of responsiveness of supply are discussedbelow.
Industry capacity
Delta reported total capacity utilization for EMD in Australia that fluctuated but remained ***during 2004-06, averaging *** percent during this period; capacity utilization was *** percent duringJanuary-June 2007 compared to *** percent during January-June 2006. Delta’s capacity utilization isexpected to average *** percent during all of 2007 and *** percent during 2008, while its capacity levelsare expected to ***. The *** capacity utilization level during January-June 2007 occurred as Delta ***its inventory level. The levels of capacity utilization indicate that Delta had *** ability to increaseproduction of EMD in the short run during 2004-06, in the event of a price change, *** to do so duringJanuary-June 2007, and this ability is expected to continue throughout 2007, but may become *** less in2008 based on the expected *** capacity utilization rates during 2008.
Inventory levels
Delta reported end-of-period inventory quantities of EMD in Australia that were *** during2004-06, averaging *** percent of total shipments during this period; Delta’s EMD inventories were ***percent of its total annualized shipments during January-June 2007,14 as it *** during the period.15 Thesedata indicate that Delta had *** ability to use inventories as a means to increase shipments to the U.S.market in the short run. This flexibility may be restrained in the short run to the extent that Delta’sAustralian inventories consist of products not useable/acceptable in the U.S. market, or consist ofproducts already committed to customers in third-country markets.
In addition, Delta also reported end-of-period inventory quantities of its Australian-producedEMD in the United States. These U.S. inventories of the imported EMD from Australia *** during 2004-06, or by a total of *** percent. Delta’s U.S. inventory quantities of its imported EMD from Australiaincreased from *** percent of its U.S. shipment quantities of such imports in 2004 to *** percent in2006; such inventory shares of annualized U.S. shipments were *** percent during January-June 2007,compared to *** percent during January-June 2006.
Alternate markets
Delta reported that its EMD produced in Australia was shipped *** to the United States and ***to third-country markets during January 2004-June 2007; there was no home-market demand for EMD. This shipment pattern *** in 2007 and 2008. During January 2004-June 2007, Delta’s shipments ofEMD to the U.S. market averaged *** percent of its total shipment quantities of EMD, and exports tothird-country markets averaged the remaining *** percent of the total. These data for alternate marketsindicate that Delta had *** third-country markets for its EMD from which it could shift shipments ofEMD to the United States in the short run in the event of a price change in the U.S. market. Thisflexibility may be restrained in the short run to the extent that Delta’s sales of EMD in third-country
16 Delta’s foreign producer questionnaire responses, section II-3.
II-5
markets were not used/acceptable in the U.S. market, or to the extent that Delta has binding supplyagreements longer than 12 months with customers in third-country markets.
Production alternatives
Delta reported producing *** EMD at its Australian facility, with ***.16 The ability of Delta toshift production between EMD and other products would enhance its supply responsiveness in the shortrun in response to relative price changes between EMD and alternative production products.
Imports from China
Based on available information, staff believes that Chinese producers of EMD are likely torespond to changes in demand with relatively *** changes in shipments of EMD to the U.S. market. Factors contributing to this degree of responsiveness of supply are discussed below.
Industry capacity
The two responding Chinese producers of EMD, ***, are believed to be the only two Chineseproducers currently exporting EMD to the United States. Based on these Chinese producers’ reportedcapacity and production, the Chinese industry’s annual capacity utilization for EMD fluctuated butremained *** during 2004-06, averaging *** percent during this period; capacity utilization was ***percent during January-June 2007 compared to *** percent during January-June 2006. The two Chineseproducers’ expected capacity utilization levels are expected to increase to *** percent for all of 2007 andto *** percent during 2008, while capacity levels are expected to increase during both periods. Theselevels of capacity utilization indicate that Chinese producers of EMD had *** available capacity withwhich they could increase production of EMD in the short run in the event of a price change during 2004-06, *** ability to increase production of EMD during January-June 2007, when ***. This increasedability to increase production of EMD is expected to continue for the remainder of 2007 and for 2008,based on expected capacity utilization rates and higher projected capacity each year.
Inventory levels
The two responding Chinese producers of EMD reported that combined end-of-period inventories increased steadily during 2004-06, but as a share of total shipments such inventories fluctuated butincreased from *** percent of total shipments during 2004 to *** percent during 2006; the Chineseproducers’ EMD inventories were *** percent of their annualized total shipments during January-June2007, compared to *** percent during January-June 2006. These data indicate that the Chinese producershad an ability to use inventories as a means to increase *** shipments to the U.S. market in the short run. This flexibility may be restrained in the short run to the extent that the Chinese producers’ inventoriesconsist of products not useable/acceptable in the U.S. market, or consist of products already committed tocustomers in third-country markets.
In addition, U.S. importers of Chinese EMD also reported end-of-period inventory quantities oftheir Chinese-produced EMD in the United States. These U.S. inventories of the imported EMD fromChina increased steadily during 2004-06, by a total of *** percent. The U.S. inventory quantities of theimported EMD from China increased from *** percent of U.S. shipment quantities of such imports in2004 to *** percent in 2006; such inventory shares of annualized U.S. shipments were *** percent duringJanuary-June 2007, compared to *** percent during January-June 2006.
17 Petition, p. 8; and Tronox’s postconference brief, exhibit 1, p. 3. In addition, lithium-grade EMD is used in thecommon 3-volt “coin” type batteries, but the volume of EMD used for this application reportedly is so small as torender it immaterial (Tronox’s postconference brief, exh. 1, p. 6). According to Delta, ***. Delta also indicated that*** (Letter from ***, September 19, 2007). 18 North American alkaline battery demand reportedly is expected to increase *** percent over the next five years(letter from ***), September 19, 2007.
II-6
Alternate markets
The two responding Chinese producers of EMD reported that their products were shipped *** totheir home market, *** to third-country markets, *** to the U.S. market, and the remainder was used forinternal consumption/transfers during January 2004-June 2007; this shipment pattern was *** in 2007and 2008. During January 2004-June 2007, Chinese producers’ shipments of EMD to the home marketaveraged *** percent of their total shipment quantities of EMD; exports to third-country marketsaveraged *** percent of the total; exports to the U.S. market averaged *** percent of the total; andinternal consumption/transfers accounted for the remaining *** percent. These data for alternate marketsindicate that Chinese EMD producers had a strong home market and other non-U.S. export markets fromwhich they could shift shipments of EMD to the United States in the short run in the event of a pricechange in the U.S. market. This flexibility may be restrained in the short run to the extent that Chineseproducers’ sales of EMD in their home market and/or exports to third-country markets were notused/acceptable in the U.S. market, or to the extent that Chinese producers have binding supplyagreements longer than 12 months with customers in the home and/or third-country markets.
Production alternatives
The two responding Chinese producers of EMD reported that they produced ***. The ability ofChinese producers to shift production between EMD and other products would enhance their supplyresponsiveness in the short run in response to relative price changes between EMD and alternativeproduction products.
Supply of Nonsubject Imports of EMD to the U.S. Market
Based on import statistics presented in Part IV, a total of five nonsubject countries exported EMDto the United States during January 2004-June 2007. Imports of EMD from nonsubject countriesaccounted for *** percent of the quantity of total U.S. imports of EMD during this period. The share oftotal U.S. imports of EMD from nonsubject countries decreased from *** percent in 2004 to *** percentin 2006, while the quantity of total U.S. imports of EMD increased by 71.5 percent. Japan was theprincipal nonsubject country supplier ***.
U.S. Demand
Demand for EMD, as measured by annual U.S. apparent consumption, fluctuated during 2004-06,decreasing by a total of 3.1 percent on a quantity basis during this period; U.S. apparent consumption was3.6 percent lower in January-June 2007 than in January-March 2006.
EMD is used almost exclusively in the production of dry-cell batteries, with most of thesebatteries involving the production of alkaline batteries.17 As a result, U.S. demand for EMD is derivedalmost wholly from the downstream demand for U.S.-produced alkaline batteries,18 which, in turn, is
19 Conference transcript, p. 115 (Reilly) and p. 116 (McGrath). 20 Tronox’ postconference brief, exhibit 1, p. 5. In addition, Duracell reported that *** (importer questionnaireresponse, section III-B-15). 21 Delta asserted that there was a low cross-price elasticity of demand between AA/AAA cell sizes and C/D cellsizes because of different demand drivers for these two categories of battery sizes (conference transcript, p. 117 (Reilly)). 22 Tronox’ postconference brief, exh. 1, p. 2; letter from ***, September 19, 2007; letter/supplementaryquestionnaire response from ***, September 19, 2007; and Spectrum’s postconference brief, exh. 1, p. 3. 23 U.S. producer and importer questionnaire responses, sections IV-B-16 and III-B-15, respectively.
II-7
derived from demand for the wireless/portable electronic devices using these batteries,19 such as variousremote controls, some cameras and MP3 players, wall clocks, smoke alarms, flashlights, radios, etc. Although EMD production is not seasonal, shipment volumes of batteries can be affected by increases inbattery consumption at Christmas and in response to natural disasters, such as hurricanes.20
Because U.S. demand for EMD is a derived from demand for alkaline batteries,21 fourfirms–Tronox, Delta, Duracell, and Spectrum–provided detailed responses concerning drivers for U.S.EMD/alkaline battery demand, which are shown in the following tabulation.22
* * * * * * *
U.S. producers and importers provided a mix of responses when reporting how U.S. demand forEMD has changed since January 1, 2004.23 One of the two responding U.S. producers of EMD, ***,reported an increase in demand, while the other U.S. producer, ***, reported a decrease in demand. Twoof the nine responding U.S. importers/purchasers of EMD reported an increase in U.S. demand, two U.S.importers/purchasers reported a decrease, five U.S. importers/purchasers reported unchanged demand,one U.S. importer/purchaser reported fluctuating demand, and the remaining U.S. importer/purchaser didnot know how U.S. demand changed. The two responding U.S. producers of EMD and six of theresponding U.S. importers/purchasers provided additional comments, which are shown in the followingtabulation by the type of change in U.S. demand for EMD.
* * * * * * *
Based on available information, U.S. end users of EMD, almost exclusively U.S. batteryproducers, are likely to respond to changes in the price of EMD with moderately small changes in theirpurchases of EMD, such that U.S. demand may be price inelastic. The main contributing factor to thislevel of responsiveness of demand is the apparent lack of any close substitutes for EMD and the relativelylow-to-moderate cost share, whereas the existence of some substitutes in the downstream market forbatteries, such as other types of batteries and imported alkaline batteries, and some ability of U.S. batteryproducers to shift U.S. production to their offshore facilities, tend to enhance the responsiveness of U.S.demand for EMD.

24 U.S. producer and importer questionnaire responses, sections IV-B-17 and III-B-16, respectively. Theproducers and importers were requested to provide examples of the top two economic substitutes for EMD and thisrequest was preceded by the following explanation: “Substitution in demand refers to products that can, based onmarket price considerations and consumer/industrial user preferences/technical requirements, reasonably be expectedto substitute for each other when the price of one product changes vis-a-vis the price of the other product–someconsumers/ industrial users may require greater price changes than others before they switch among the alternativeproducts.” 25 ***. 26 According to Tronox, digital cameras are a relatively new part of the market, such that EMD demand growthfrom this segment has been fairly small, as the batteries are small cells and there is substantial competition fromrechargeable batteries (Tronox’ postconference brief, exh. 1, p. 3). On the other hand, Panasonic asserted thatmarket demand for rechargeable batteries is on the decrease versus alkaline batteries. For some reason, according toPanasonic, the U.S. market would rather use a disposable battery than a rechargeable battery, so the rechargeablebattery demand has declined (conference transcript, p. 131 (Stevens)). 27 Tronox’ postconference brief, exh. 1, p. 3. 28 Conference transcript, p. 113 (Stevens) and (McGrath).
II-8
Substitute Products
All three responding U.S. producers of EMD and 8 (includes the four U.S. battery producers) of10 responding U.S. importers/purchasers reported that no substitutes exist for EMD, whereas theremaining 2 U.S. importers did not know if substitutes existed.24 One of the responding U.S.importers/purchasers, ***, provided additional responses. Although *** believes that there are nosubstitutes for EMD (whether a manganese dioxide or not) that are suitable for use in consumer alkalinebatteries, chemical manganese dioxide (CMD) and natural manganese dioxide (NMD) can be used butface the following difficulties. CMD has significantly lower performance than EMD in alkaline batteries,such that an alkaline battery made with CMD, rather than EMD, would never meet the marketexpectations for battery performance. NMD, while suitable for use in the acid electrolyte of zinc carbonbatteries, is entirely too impure to even be considered for use with alkaline batteries, because alkalinebatteries using NMD instead of EMD would exhibit an unacceptable and unworkable level ofgassing/leakage.
Because demand for EMD is derived almost exclusively from the demand for alkaline batteries, itmay be useful to consider the extent to which other types of batteries and/or imported alkaline batteriescould substitute for U.S.-produced alkaline batteries, which could affect the demand for alkaline batteries,and, in turn, the demand for EMD. *** asserted that U.S. EMD demand has decreased, at least partially,because of the shift from alkaline batteries to rechargeable batteries.25 Tronox reported that in low-drainapplications there is no competition from other chemistries. According to Tronox, in high-drainapplications, such as digital cameras,26 rechargeable batteries with non-EMD chemistries are used ascompeting alternatives to disposable EMD-containing alkaline batteries. Tronox also reported that in thelithium segment of the battery market, various types that do not use EMD also compete with EMD-containing batteries.27 Panasonic and Spectrum asserted that in the U.S. market no other types of batteriescompete with the batteries that use EMD, primarily alkaline batteries.28 A U.S. importer of EMD, ***,asserted that a non-alkaline battery, nickel oxy-hydroxide (NOH), is used in very high performancebatteries, primarily for digital cameras. According to ***, NOH batteries are very expensive and really aseparate niche market from standard or even premium alkaline batteries, hence at this stage there is littleimpact on the price or demand for EMD. Potentially, over the next three years, NOH batteries may
29 U.S. importer questionnaire response, section III-B-16. 30 ***. 31 Tronox’ postconference brief, exh. 1, p. 3. 32 Spectrum’s postconference brief, exh. 1, p. 3. 33 U.S. importer questionnaire responses, section III-B-14. 34 U.S. producer and importer questionnaire responses, sections IV-B-16 and III-B-15, respectively. 35 One of these two importers/purchasers, ***, identified the European Union, Japan, and the rest of the worldwhere EMD demand has fluctuated, but provided no further comments. 36 The two responding U.S. importers/purchasers asserting that EMD demand outside the United States wasunchanged, ***, identified Europe, China, Japan, Singapore, and Switzerland as the countries/areas to which theywere referring, but provided no other comments.
II-9
increase market share in the premium battery market, but it will depend upon the price of the NOHbatteries, which is driven significantly by the price of nickel.29
*** reported that U.S. demand for EMD has decreased, at least partially, because of increasedU.S. imports of primary alkaline batteries.30 Tronox asserted that it has not observed a major increase inU.S. demand for EMD used in small cell batteries, perhaps due to increasing volumes of imported smallcell batteries, particularly from China.31 Spectrum reported that in 2006 ***. Spectrum believes thatsome of this production has resulted ***.32
Cost Share
As noted earlier, EMD is used in the production of batteries, most notably alkaline batteries. Thefour U.S. battery producers reported in their importer/purchaser questionnaire responses the share ofEMD costs to the total cost to produce batteries.33 *** reported for all batteries combined, whereas, ***reported for specific battery sizes. The cost shares of EMD ranged from a low of *** percent for ***battery to *** percent for *** battery. The cost shares of EMD reported by the four U.S. batteryproducers are shown in the following tabulation.
* * * * * * *
Demand Outside the United States
U.S. producers and importers/purchasers of EMD were requested in their questionnaire responsesto comment on demand for EMD outside of the United States since January 1, 2004.34 The tworesponding U.S. producers of EMD and 4 of the 10 responding U.S. importers/purchasers reported thatsome foreign demand has increased (one of these U.S. producers also cited decreased foreign demand,two of these U.S. importers/purchasers also cited unchanged foreign demand, and another of these U.S.importers/purchasers also cited decreased and unchanged foreign demand), whereas two U.S.importers/purchasers reported that such demand fluctuated,35 two U.S. importers/purchasers reported thatsuch demand was unchanged,36 and the two remaining importers/purchasers reported that they wereunfamiliar with foreign EMD demand. Seven of the responding firms that reported on EMD demandoutside of the United States provided additional comments, which are shown, by the various categories ofdemand change, in the following tabulation.
* * * * * * *
37 U.S. producer and importer questionnaire responses, sections IV-A.2-3 and III-A.2-3/III-A.4-2/3/4,respectively; conference transcript, pp. 102-103 (Stevens) and (McGrath); and Tronox’s postconference brief,exhibit 1, p. 11. 38 ***. 39 Conference transcript, pp. 102-103 (Stevens) and (McGrath); and Tronox’s postconference brief, exhibit 1, p.11. 40 Letter from ***, September 19, 2007. 41 As an example, *** (U.S. importer questionnaire response, section III-A.4-2). 42 Panasonic asserted that the production process that is used by one U.S. battery producer versus another isdifferent, and in some cases contaminants that are in the EMD may still allow a particular U.S. battery producer touse that particular EMD. In Panasonic’s case, those specific contaminants in its process are not allowed, otherwise itcauses another problem, which is an impact on the actual quality of its battery. (Conference transcript, pp. 105-106(Stevens)). In addition, Spectrum asserted that, in testing the Tronox product, Spectrum incurred significantly moretool wear than with other producers of EMD. Similarly, abrasion is the result of specific crystallinity in a givenEMD, which causes accelerated wearing of cathode dyes and ultimately leads to out of specification cathode pellets.This requires frequent tooling changes and substantially increases the cost to the battery manufacturer. (Conferencetranscript, p. 92 (McGrath)). 43 Importer questionnaire responses, sections III-A.-2/3; letter from ***, September 14, 2007; and Spectrum’spostconference brief, attachment 3. In addition, Spectrum asserted that Duracell holds certain U.S. patents withrespect to specific claims for batteries and battery electrodes with high power EMD that’s based on example datafrom Tronox EMD material. Because of these intellectual property rights, Spectrum would have to bear additionalcosts of analysis and potential intellectual property claims were it to switch to using Tronox EMD (conferencetranscript, p. 95 (McGrath)). *** reported that *** (letter/supplemental questionnaire response from ***),September 19, 2007.
II-10
SUBSTITUTABILITY ISSUES
The degree of substitution in demand between EMD produced in the United States and thatimported from Australia and from China depends upon such factors as relative prices, conditions of sales(order lead times, payment terms etc.), purchaser supply requirements, qualified status of supplier, andproduct differentiation. Product differentiation depends on factors such as the range of products, quality(grade standards, defect rates, product consistency, etc.), availability, reliability of supply, productservices, and the market perception of these factors. Based on the reported information in theseinvestigations, there appears to be at least moderate substitution in demand between EMD produceddomestically and that imported from Australia and possibly less substitution between U.S.-producedEMD and that imported from China.
EMD Qualification
U.S. producers and importers/purchasers of EMD reported that EMD suppliers must be qualifiedfor each type/size of battery and for each of their producing locations.37 *** reported that its standardalkaline grade EMD reportedly is qualified for use in all cell sizes with its current customers,38 whereas,for ***, different types/grades of EMD are required for each size of battery.39 In addition, Delta reportedselling ***.40 Qualification requirements may result in reduced substitutability among suppliers as EMDfrom a particular source may be the only EMD qualified for a certain size/type of battery.41 The extent towhich U.S. battery producers are able to qualify EMD from different sources may depend on theproduction process of the battery producers.42 The *** qualify EMD from Tronox during January 2004-June 2007 and ***.43 ***. On the other hand, the ***, qualified EMD from *** throughout January

44 ***; conference transcript, pp. 94-95 (McGrath). 45 E-mail from ***; and letter from ***. 46 ***. ***. Ibid. 47 ***. (Spectrum’s importer questionnaire response, section III-B-17.) 48 Conference transcript, pp. 94-95 (McGrath). 49 U.S. producer and importer questionnaire responses, sections IV-B-13 and III-B-13, respectively. 50 U.S. producer and importer questionnaire responses, sections IV-B-18 and III-B-17, respectively. The importerquestionnaire was sent to both importers and purchasers of EMD; both types of firms were requested to report therequested information for interchangeability. 51 U.S. producer and importer questionnaire responses, sections IV-B-19 and III-B-18, respectively. The importerquestionnaire was sent to both importers and purchasers of EMD; both types of firms were requested to report therequested information for nonprice factors. Nonprice factors referred to in the questionnaire request includedquality, availability, transportation network, product range, and technical support, but nonprice factors were notnecessarily restricted to only these factors.
II-11
2004-June 2007. *** have qualified EMD from China during at least some portion of the period, January2004-June 2007, and *** have qualified EMD from Australia during this period.
EMD Blending
*** blend their EMD from various sources,44 while *** not blend EMD from various sources.45 Such blending may suggest that EMD from several sources either exhibits no differences in physicaland/or performance characteristics or is differentiated by these factors; if the former, the products may besubstitutable and if the latter the products may also be complements. Duracell asserted that in itsexperience ***.46 ***,47 ***. As a result, the imported EMD from China that Spectrum purchases canqualify for uses in batteries, but only qualify in a limited fashion.48
Changes in Product Range and Marketing of EMD
U.S. producers and importers/purchasers of the subject EMD were requested in theirquestionnaire responses to describe any significant changes in the product range or marketing of EMD inthe United States since January 2004.49 The two responding U.S. producers and six of the nineresponding U.S. importers/purchasers reported some changes, while the three remaining U.S.importers/purchasers reported no such changes. The comments of the firms reporting changes in themarketing or product range of EMD in the U.S. market are shown in the following tabulation:
* * * * * * *
Factors Affecting Sales and Purchases
U.S. producers and importers/purchasers of EMD were requested in their questionnaires to reporton the extent of interchangeability (products from different countries physically capable of being used inthe same applications) of EMD produced domestically, imported from Australia, China, and from thirdcountries.50 They were also asked to report the extent of any non-price differences that would affectsales/purchases in the U.S. market among these various sources of EMD.51 Responses of the U.S.producers and importers/purchasers regarding the degree of interchangeability between domestic andimported EMD are summarized in table II-3, and their responses regarding differences other than priceaffecting competition are summarized in table II-4.
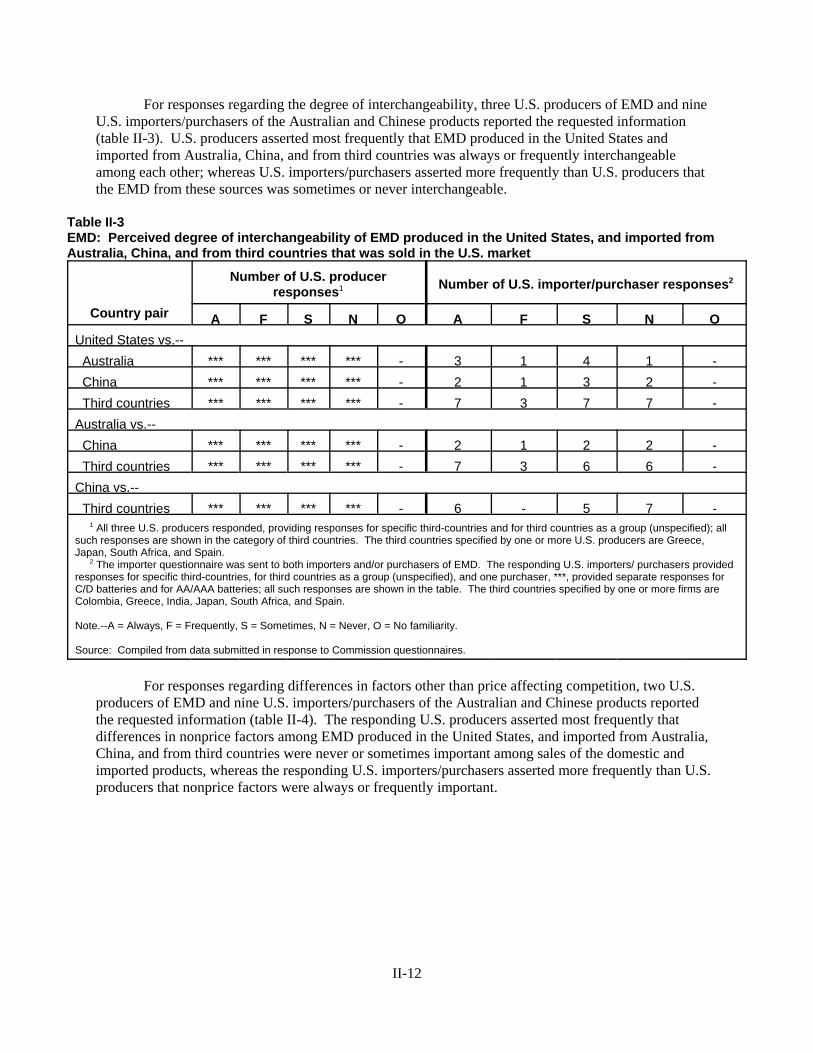
II-12
For responses regarding the degree of interchangeability, three U.S. producers of EMD and nineU.S. importers/purchasers of the Australian and Chinese products reported the requested information(table II-3). U.S. producers asserted most frequently that EMD produced in the United States andimported from Australia, China, and from third countries was always or frequently interchangeableamong each other; whereas U.S. importers/purchasers asserted more frequently than U.S. producers thatthe EMD from these sources was sometimes or never interchangeable.
Table II-3EMD: Perceived degree of interchangeability of EMD produced in the United States, and imported fromAustralia, China, and from third countries that was sold in the U.S. market
Country pair
Number of U.S. producerresponses1 Number of U.S. importer/purchaser responses2
A F S N O A F S N OUnited States vs.-- Australia *** *** *** *** - 3 1 4 1 - China *** *** *** *** - 2 1 3 2 - Third countries *** *** *** *** - 7 3 7 7 -Australia vs.-- China *** *** *** *** - 2 1 2 2 - Third countries *** *** *** *** - 7 3 6 6 -China vs.-- Third countries *** *** *** *** - 6 - 5 7 - 1 All three U.S. producers responded, providing responses for specific third-countries and for third countries as a group (unspecified); allsuch responses are shown in the category of third countries. The third countries specified by one or more U.S. producers are Greece,Japan, South Africa, and Spain. 2 The importer questionnaire was sent to both importers and/or purchasers of EMD. The responding U.S. importers/ purchasers providedresponses for specific third-countries, for third countries as a group (unspecified), and one purchaser, ***, provided separate responses forC/D batteries and for AA/AAA batteries; all such responses are shown in the table. The third countries specified by one or more firms areColombia, Greece, India, Japan, South Africa, and Spain.
Note.--A = Always, F = Frequently, S = Sometimes, N = Never, O = No familiarity.
Source: Compiled from data submitted in response to Commission questionnaires.
For responses regarding differences in factors other than price affecting competition, two U.S.producers of EMD and nine U.S. importers/purchasers of the Australian and Chinese products reportedthe requested information (table II-4). The responding U.S. producers asserted most frequently thatdifferences in nonprice factors among EMD produced in the United States, and imported from Australia, China, and from third countries were never or sometimes important among sales of the domestic andimported products, whereas the responding U.S. importers/purchasers asserted more frequently than U.S.producers that nonprice factors were always or frequently important.

52 U.S. producer and importer questionnaire responses, sections IV-B-18/19 and III-B-17/18, respectively. 53 U.S. producers of EMD did not provide any additional responses regarding nonprice factors.
II-13
Table II-4EMD: Perceived importance of differences in factors other than price between EMD produced inthe United States, and imported from Australia, China, and from third countries that was sold inthe U.S. market
Country pair
Number of U.S. producer responses1Number of U.S. importer/purchaser
responses2
A F S N O A F S N O
United States vs.--
Australia *** *** *** *** - 3 2 1 2 -
China *** *** *** *** - 4 1 - 2 -
Third countries *** *** *** *** - 10 2 3 6 -
Australia vs.–
China *** *** *** *** - 3 - 1 2 -
Third countries *** *** *** *** - 9 - 4 6 -
China vs.--
Third countries *** *** *** *** - 6 1 3 6 - 1 Two of the three U.S. producers responded and provided responses for specific third-countries and for third countries as agroup (unspecified); all such responses are shown in the category of third countries. The third countries specified by one ormore U.S. producers are Greece, Japan, South Africa, and Spain. 2 The importer questionnaire was sent to both importers and/or purchasers of EMD. The responding U.S. importers/purchasers provided responses for specific third-countries and for third countries as a group (unspecified); all such responsesare shown in the category of third countries. The third countries specified by one or more U.S. importers/purchasers areColombia, Greece, India, Japan, South Africa, and Spain.
Note.--A = Always, F = Frequently, S = Sometimes, N = Never, O = No familiarity.
Source: Compiled from data submitted in response to Commission questionnaires.
U.S. producers and importers/purchasers were also requested in their questionnaires to provideany comments where products are sometimes or never interchangeable and where nonprice factors werealways or frequently significant in competition between the domestic and imported EMD.52 Thecomments of the responding U.S. producers and U.S. importers/purchasers reporting oninterchangeability and comments of the responding U.S. importers/purchasers commenting on nonpricefactors are shown in the following two tabulations.53
* * * * * * *
* * * * * * *

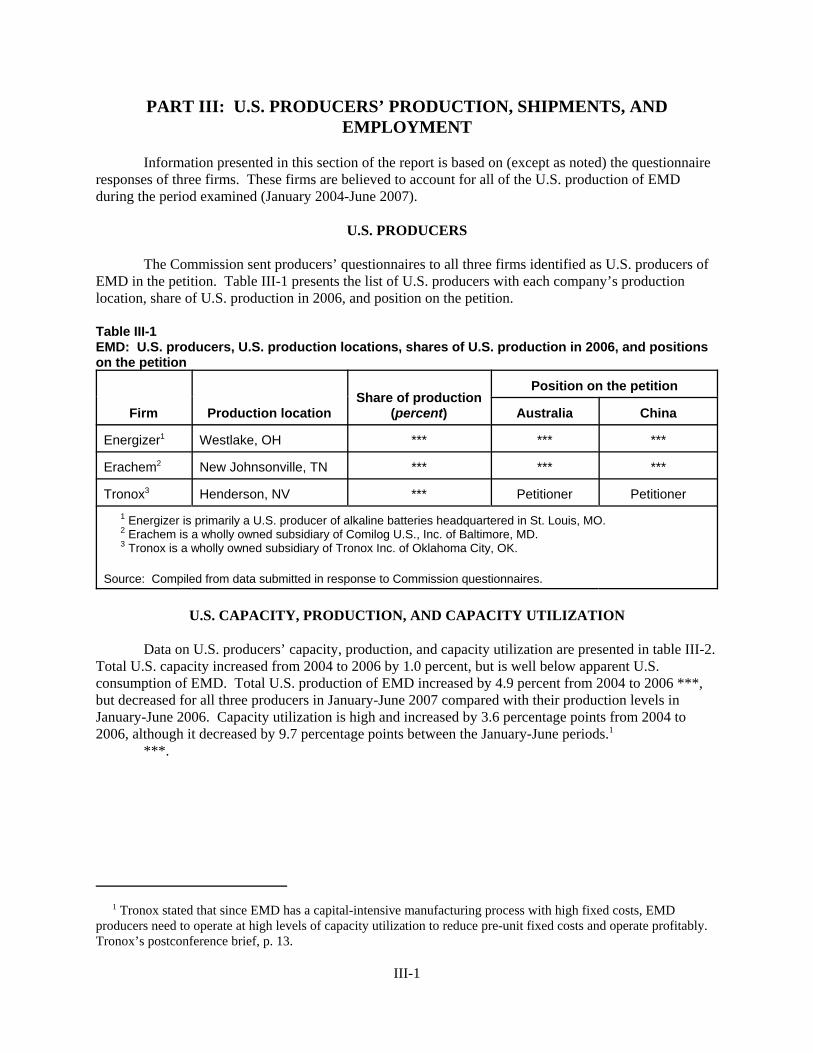
1 Tronox stated that since EMD has a capital-intensive manufacturing process with high fixed costs, EMDproducers need to operate at high levels of capacity utilization to reduce pre-unit fixed costs and operate profitably. Tronox’s postconference brief, p. 13.
III-1
PART III: U.S. PRODUCERS’ PRODUCTION, SHIPMENTS, ANDEMPLOYMENT
Information presented in this section of the report is based on (except as noted) the questionnaireresponses of three firms. These firms are believed to account for all of the U.S. production of EMDduring the period examined (January 2004-June 2007).
U.S. PRODUCERS
The Commission sent producers’ questionnaires to all three firms identified as U.S. producers ofEMD in the petition. Table III-1 presents the list of U.S. producers with each company’s productionlocation, share of U.S. production in 2006, and position on the petition.
Table III-1EMD: U.S. producers, U.S. production locations, shares of U.S. production in 2006, and positionson the petition
Firm Production locationShare of production
(percent)
Position on the petition
Australia China
Energizer1 Westlake, OH *** *** ***
Erachem2 New Johnsonville, TN *** *** ***
Tronox3 Henderson, NV *** Petitioner Petitioner
1 Energizer is primarily a U.S. producer of alkaline batteries headquartered in St. Louis, MO. 2 Erachem is a wholly owned subsidiary of Comilog U.S., Inc. of Baltimore, MD. 3 Tronox is a wholly owned subsidiary of Tronox Inc. of Oklahoma City, OK.
Source: Compiled from data submitted in response to Commission questionnaires.
U.S. CAPACITY, PRODUCTION, AND CAPACITY UTILIZATION
Data on U.S. producers’ capacity, production, and capacity utilization are presented in table III-2. Total U.S. capacity increased from 2004 to 2006 by 1.0 percent, but is well below apparent U.S.consumption of EMD. Total U.S. production of EMD increased by 4.9 percent from 2004 to 2006 ***,but decreased for all three producers in January-June 2007 compared with their production levels inJanuary-June 2006. Capacity utilization is high and increased by 3.6 percentage points from 2004 to2006, although it decreased by 9.7 percentage points between the January-June periods.1
***.
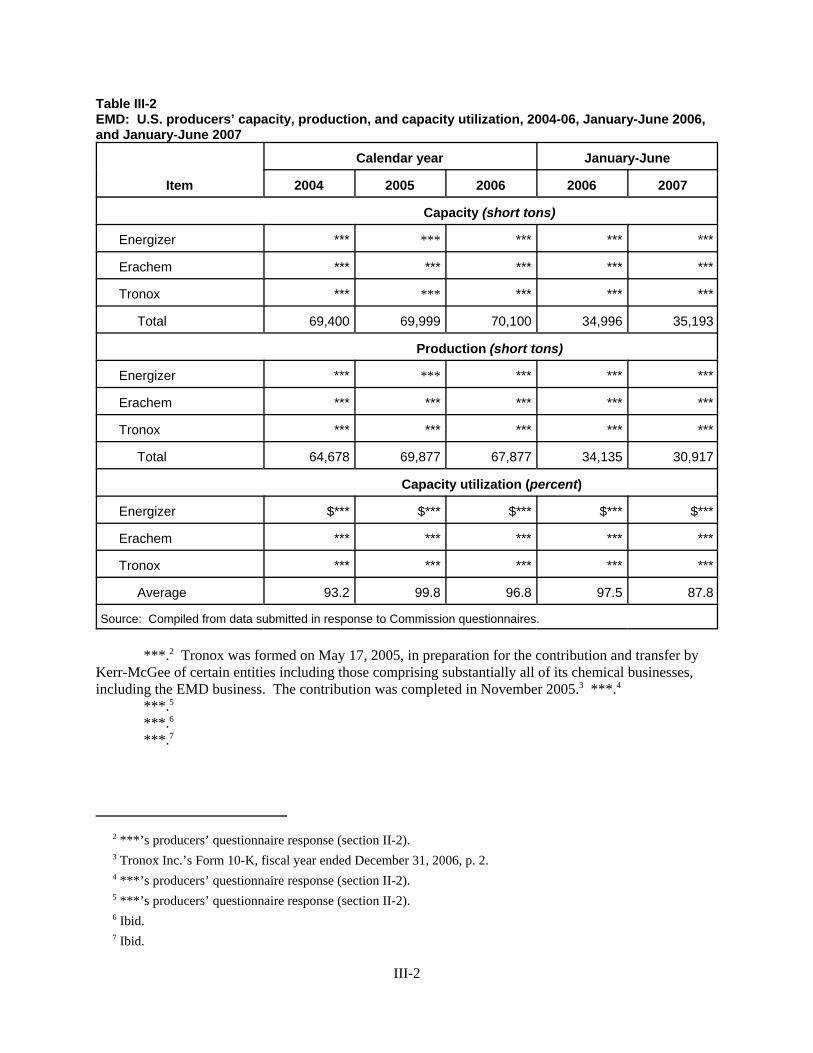
2 ***’s producers’ questionnaire response (section II-2). 3 Tronox Inc.’s Form 10-K, fiscal year ended December 31, 2006, p. 2. 4 ***’s producers’ questionnaire response (section II-2). 5 ***’s producers’ questionnaire response (section II-2). 6 Ibid. 7 Ibid.
III-2
Table III-2EMD: U.S. producers’ capacity, production, and capacity utilization, 2004-06, January-June 2006,and January-June 2007
Item
Calendar year January-June
2004 2005 2006 2006 2007
Capacity (short tons)
Energizer *** *** *** *** ***
Erachem *** *** *** *** ***
Tronox *** *** *** *** ***
Total 69,400 69,999 70,100 34,996 35,193
Production (short tons)
Energizer *** *** *** *** ***
Erachem *** *** *** *** ***
Tronox *** *** *** *** ***
Total 64,678 69,877 67,877 34,135 30,917
Capacity utilization (percent)
Energizer $*** $*** $*** $*** $***
Erachem *** *** *** *** ***
Tronox *** *** *** *** ***
Average 93.2 99.8 96.8 97.5 87.8
Source: Compiled from data submitted in response to Commission questionnaires.
***.2 Tronox was formed on May 17, 2005, in preparation for the contribution and transfer byKerr-McGee of certain entities including those comprising substantially all of its chemical businesses,including the EMD business. The contribution was completed in November 2005.3 ***.4
***.5
***.6
***.7
8 ***’s producers’ questionnaire response (section II-2). 9 U.S. producers’ questionnaire responses (section II-4). 10 U.S. producers’ questionnaire responses (section II-3 and section II-5). 11 U.S. producers’ questionnaire responses (section II-11 and section II-12). 12 U.S. producers’ questionnaire responses (section II-6 and section II-7). 13 ***.
III-3
***.8 Constraints that set the limits on production capabilities were reported as follows: ***.9 ***.10 *** produce EMD using titanium anodes.11 The domestic producers reported *** toll agreements *** U.S. production of EMD in U.S.
foreign trade zones.12
U.S. PRODUCERS’ U.S. SHIPMENTS AND EXPORT SHIPMENTS
As detailed in table III-3, the volume of U.S. producers’ U.S. shipments of EMD (*** of whichwere of alkaline-grade EMD) decreased irregularly by 9.7 percent from 2004 to 2006. The value of theirU.S. shipments also decreased irregularly by 1.8 percent during the same time period. The volume andvalue of U.S. shipments also decreased between the January-June periods. *** of the internalconsumption shipments are those of ***, which consumes *** of the EMD it produces in the productionof its dry cell batteries.13 The *** volume of export shipments made by U.S. producers increased by ***percent between 2004 and 2006, while the value of those export shipments decreased *** percent duringthe same period. *** reported export shipments, which were made to ***. Energizer, which internallyconsumes *** the EMD it produces, ***. *** reported transfers at market prices. ***.
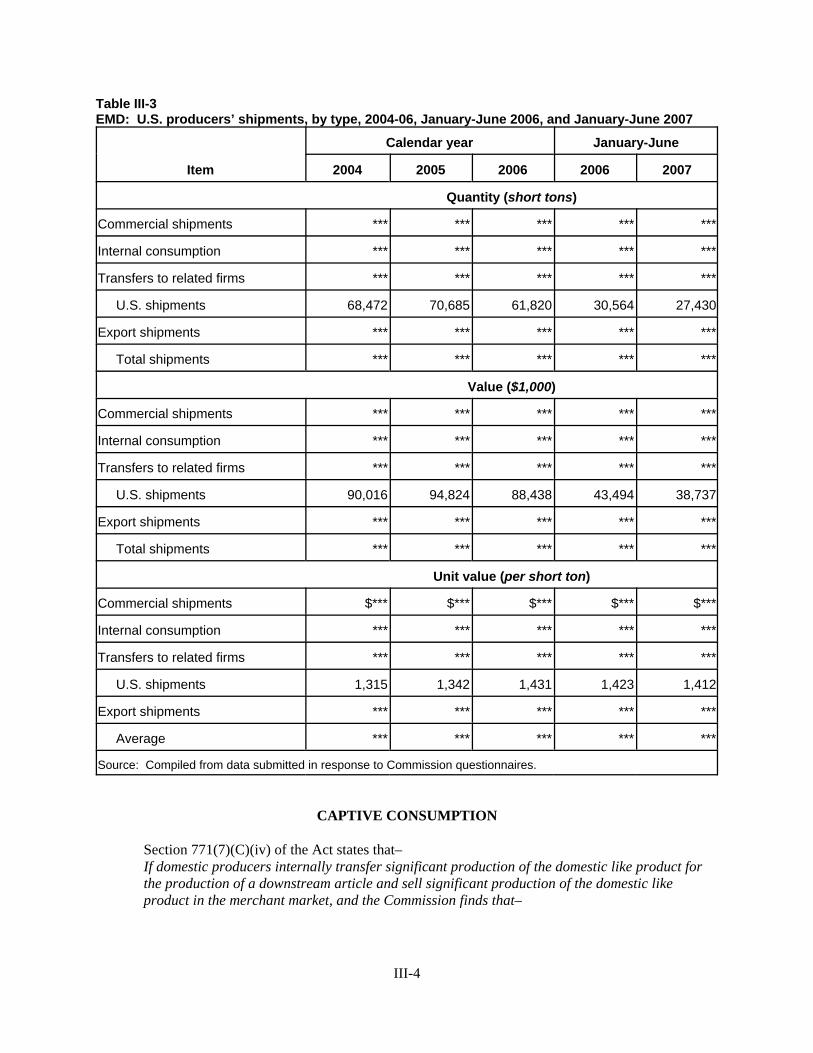
III-4
Table III-3EMD: U.S. producers’ shipments, by type, 2004-06, January-June 2006, and January-June 2007
Item
Calendar year January-June
2004 2005 2006 2006 2007
Quantity (short tons)
Commercial shipments *** *** *** *** ***
Internal consumption *** *** *** *** ***
Transfers to related firms *** *** *** *** ***
U.S. shipments 68,472 70,685 61,820 30,564 27,430
Export shipments *** *** *** *** ***
Total shipments *** *** *** *** ***
Value ($1,000)
Commercial shipments *** *** *** *** ***
Internal consumption *** *** *** *** ***
Transfers to related firms *** *** *** *** ***
U.S. shipments 90,016 94,824 88,438 43,494 38,737
Export shipments *** *** *** *** ***
Total shipments *** *** *** *** ***
Unit value (per short ton)
Commercial shipments $*** $*** $*** $*** $***
Internal consumption *** *** *** *** ***
Transfers to related firms *** *** *** *** ***
U.S. shipments 1,315 1,342 1,431 1,423 1,412
Export shipments *** *** *** *** ***
Average *** *** *** *** ***
Source: Compiled from data submitted in response to Commission questionnaires.
CAPTIVE CONSUMPTION
Section 771(7)(C)(iv) of the Act states that–If domestic producers internally transfer significant production of the domestic like product forthe production of a downstream article and sell significant production of the domestic likeproduct in the merchant market, and the Commission finds that–
14 19 U.S.C. § 1677(7)(C)(iv). 15 Firms were asked to provide the share of EMD in the total cost of producing batteries. Of the batteryproducers, Duracell responded that EMD accounted for ***, Energizer responded ***, Rayovac responded ***, andPanasonic responded ***. Firms other than battery producers responded *** (Erachem); *** (Tronox); and ***(Delta), based on ***. 16 ***’s producers’ questionnaire response (section II-13). 17 ***’s producers’ questionnaire response (section I-5 and section I-6).
III-5
(I) the domestic like product produced that is internally transferred forprocessing into that downstream article does not enter the merchantmarket for the domestic like product,
(II) the domestic like product is the predominant material input in theproduction of that downstream article, and
(III) the production of the domestic like product sold in the merchant market isnot generally used in the production of that downstream article,
then the Commission, in determining market share and the factors affecting financialperformance . . ., shall focus primarily on the merchant market for the domestic like product.14
Captive consumption (internal shipments) accounted for *** percent of the volume of U.S.producers’ U.S. shipments of EMD in each of the years 2004 and 2005, *** percent in 2006, *** percentin January-June 2006, and *** percent in January-June 2007; *** captive consumption was accounted forby Energizer. Commercial (merchant) shipments accounted for *** percent of U.S. producers’ U.S.shipments in 2004, *** percent in 2005, *** percent in 2006, *** percent in January-June 2006, and ***percent in January-June 2007. Transfers to related firms accounted for *** percent of U.S. producers’U.S. shipments in each of the years 2004, 2005, and 2006 and in January-June 2006, and *** percent inJanuary-June 2007.
The first requirement for application of the captive consumption provision is that the domesticlike product that is internally transferred for processing into a downstream article not enter the merchantmarket for the domestic like product. *** captively consumed EMD was used in production of alkalinedry-cell batteries during the period for which data were collected in these investigations.
The second criterion of the captive consumption provision concerns whether the domestic likeproduct is the predominant material input in the production of the downstream article that is captivelyproduced. EMD amounts to between *** and *** percent of the total cost of manufacturing a battery,depending on the type of battery.15
The third criterion of the captive consumption provision is that the production of the domesticlike product sold in the merchant market is generally not used in the production of the downstream articleproduced from the domestic like product that is internally transferred for processing (captively produced). Virtually all, if not all, U.S.-produced EMD, whether sold in the U.S. merchant market or captivelyconsumed, is used in the production of dry-cell batteries.
U.S. PRODUCERS’ IMPORTS AND PURCHASES OF IMPORTS
One of the three U.S. producers, ***, reported that it directly imported or purchased subjectimports from third-party importers during the period examined ***. Table III-4 presents direct importsand purchases of imports and domestic product by ***, along with its U.S. production.
***.16 ***.17
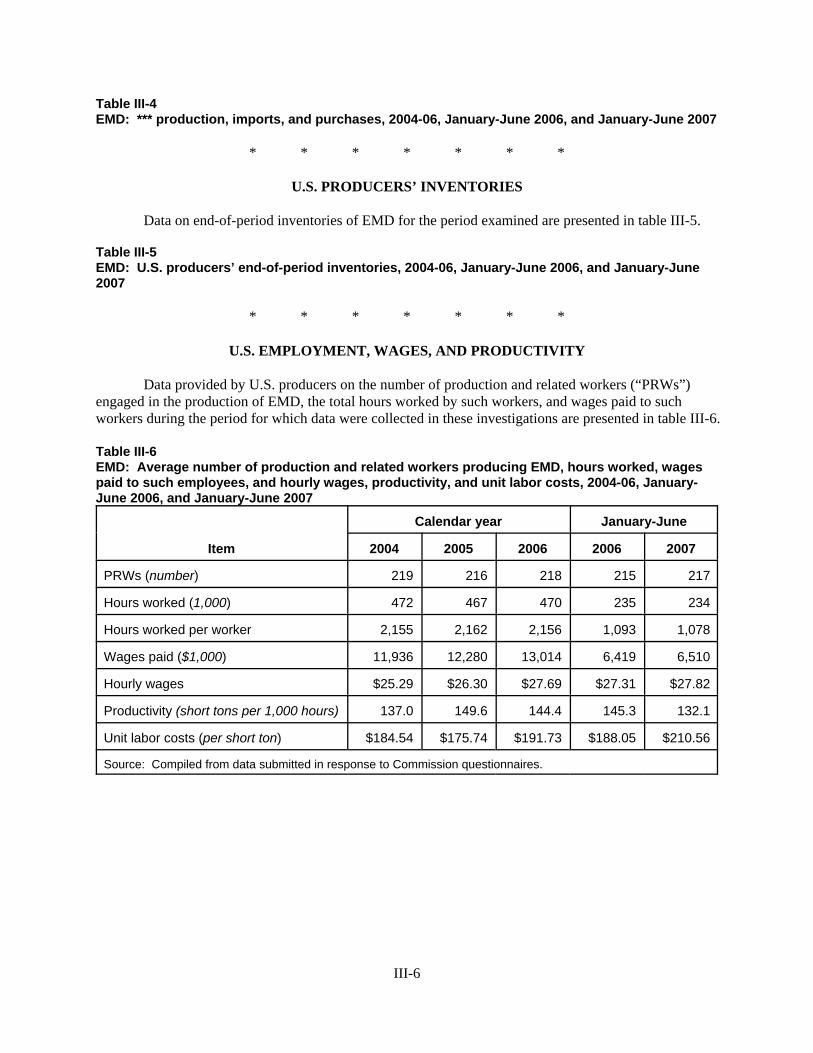
III-6
Table III-4EMD: *** production, imports, and purchases, 2004-06, January-June 2006, and January-June 2007
* * * * * * *
U.S. PRODUCERS’ INVENTORIES
Data on end-of-period inventories of EMD for the period examined are presented in table III-5.
Table III-5EMD: U.S. producers’ end-of-period inventories, 2004-06, January-June 2006, and January-June2007
* * * * * * *
U.S. EMPLOYMENT, WAGES, AND PRODUCTIVITY
Data provided by U.S. producers on the number of production and related workers (“PRWs”)engaged in the production of EMD, the total hours worked by such workers, and wages paid to suchworkers during the period for which data were collected in these investigations are presented in table III-6.
Table III-6EMD: Average number of production and related workers producing EMD, hours worked, wagespaid to such employees, and hourly wages, productivity, and unit labor costs, 2004-06, January-June 2006, and January-June 2007
Item
Calendar year January-June
2004 2005 2006 2006 2007
PRWs (number) 219 216 218 215 217
Hours worked (1,000) 472 467 470 235 234
Hours worked per worker 2,155 2,162 2,156 1,093 1,078
Wages paid ($1,000) 11,936 12,280 13,014 6,419 6,510
Hourly wages $25.29 $26.30 $27.69 $27.31 $27.82
Productivity (short tons per 1,000 hours) 137.0 149.6 144.4 145.3 132.1
Unit labor costs (per short ton) $184.54 $175.74 $191.73 $188.05 $210.56
Source: Compiled from data submitted in response to Commission questionnaires.
1 The Commission sent questionnaires to those firms identified in the petition, along with firms that, based on areview of data provided by U.S. Customs and Border Protection (“Customs”) (formerly the U.S. Customs Service),may have imported EMD since 2004. 2 In addition to the nine responses, the Commission received responses from ***. Further, the Commissionreceived responses from *** indicating that it did not import EMD during the period examined. *** was sent animporters’ questionnaire by the Commission but did not respond; however, ***. 3 ***. 4 ***.
IV-1
PART IV: U.S. IMPORTS, APPARENT CONSUMPTION, ANDMARKET SHARES
U.S. IMPORTERS
The Commission sent importer questionnaires to 17 firms believed to be importers of EMD fromthe subject countries, as well as to all three U.S. producers.1 Questionnaire responses were received fromten companies that are believed to account for virtually all U.S. imports of EMD.2 Questionnairerespondents were located in Australia, California, Japan, New Jersey, New York (3), Ohio, Pennsylvaniaand Wisconsin.3 *** firms reported imports from nonsubject countries.
The Commission received importer questionnaires from virtually all importers of EMD. *** wasdiscovered in Commerce statistics for the period for which data were gathered, and as a result,Commission staff elected to compile U.S. import data in this report from questionnaire responses.4
Table IV-1 lists all responding U.S. importers of EMD and their quantity of imports, by source, in2006. *** U.S. importers entered the subject product into or withdrew it from foreign trade zones orbonded warehouses.
Table IV-1EMD: Reported U.S. imports, by importer and by source of imports, 2006
* * * * * * *
U.S. IMPORTS
Table IV-2 shows that the volume of U.S. imports of EMD from subject countries combinedfluctuated upward by *** percent from 2004 to 2006, and further increased by *** percent betweenJanuary-June 2006 and January-June 2007. Taken separately, the volume of imports from Australiaincreased by *** percent and from China increased by *** percent from 2004 to 2006. The volume ofU.S. imports from Australia *** short tons in 2004 to *** short tons in 2005 then declined by *** shorttons in 2006. Interim period comparisons show that imports of EMD from Australia *** short tons ininterim 2007 as compared to *** short tons in interim 2006. The volume of EMD imports from Chinadecreased by *** short tons or *** percent between 2004 and 2005 before an increase of *** short tonsor *** percent in 2006. A comparison of EMD imports from China for the interim periods *** to interimperiod EMD imports from Australia. Interim EMD imports from China decreased by *** short tons, from*** short tons in interim 2006 to *** short tons, or by *** percent, in interim 2007.
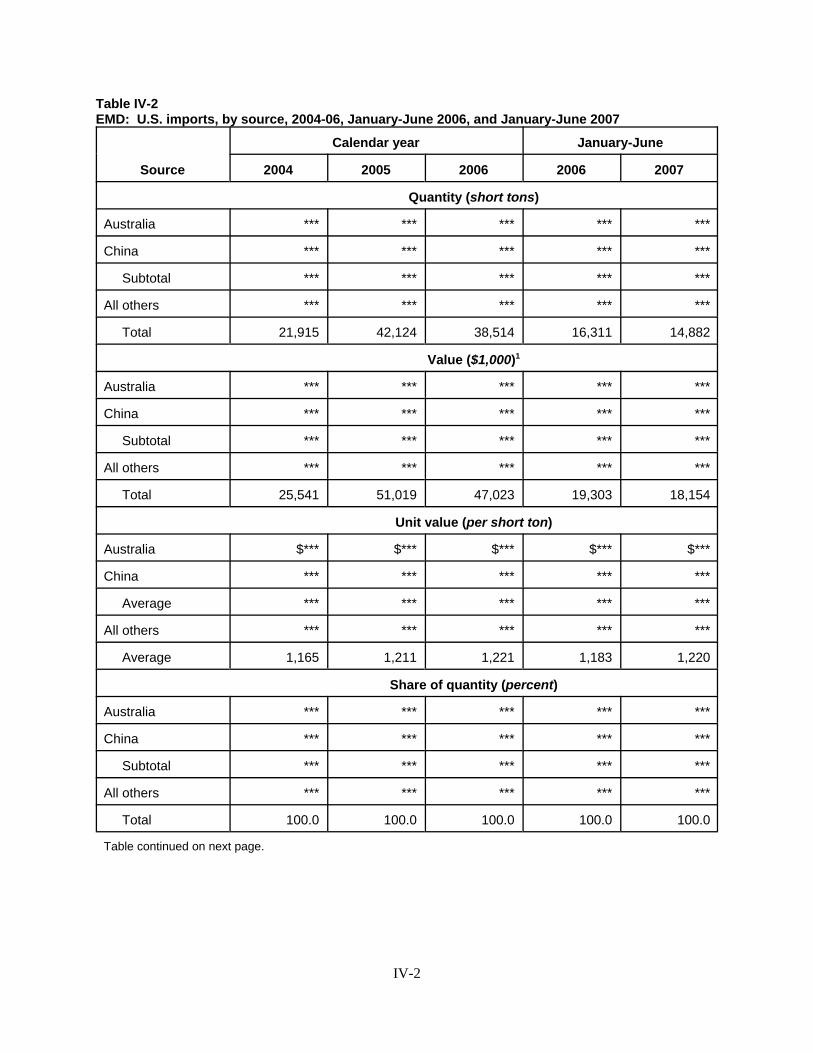
IV-2
Table IV-2EMD: U.S. imports, by source, 2004-06, January-June 2006, and January-June 2007
Source
Calendar year January-June
2004 2005 2006 2006 2007
Quantity (short tons)
Australia *** *** *** *** ***
China *** *** *** *** ***
Subtotal *** *** *** *** ***
All others *** *** *** *** ***
Total 21,915 42,124 38,514 16,311 14,882
Value ($1,000)1
Australia *** *** *** *** ***
China *** *** *** *** ***
Subtotal *** *** *** *** ***
All others *** *** *** *** ***
Total 25,541 51,019 47,023 19,303 18,154
Unit value (per short ton)
Australia $*** $*** $*** $*** $***
China *** *** *** *** ***
Average *** *** *** *** ***
All others *** *** *** *** ***
Average 1,165 1,211 1,221 1,183 1,220
Share of quantity (percent)
Australia *** *** *** *** ***
China *** *** *** *** ***
Subtotal *** *** *** *** ***
All others *** *** *** *** ***
Total 100.0 100.0 100.0 100.0 100.0
Table continued on next page.
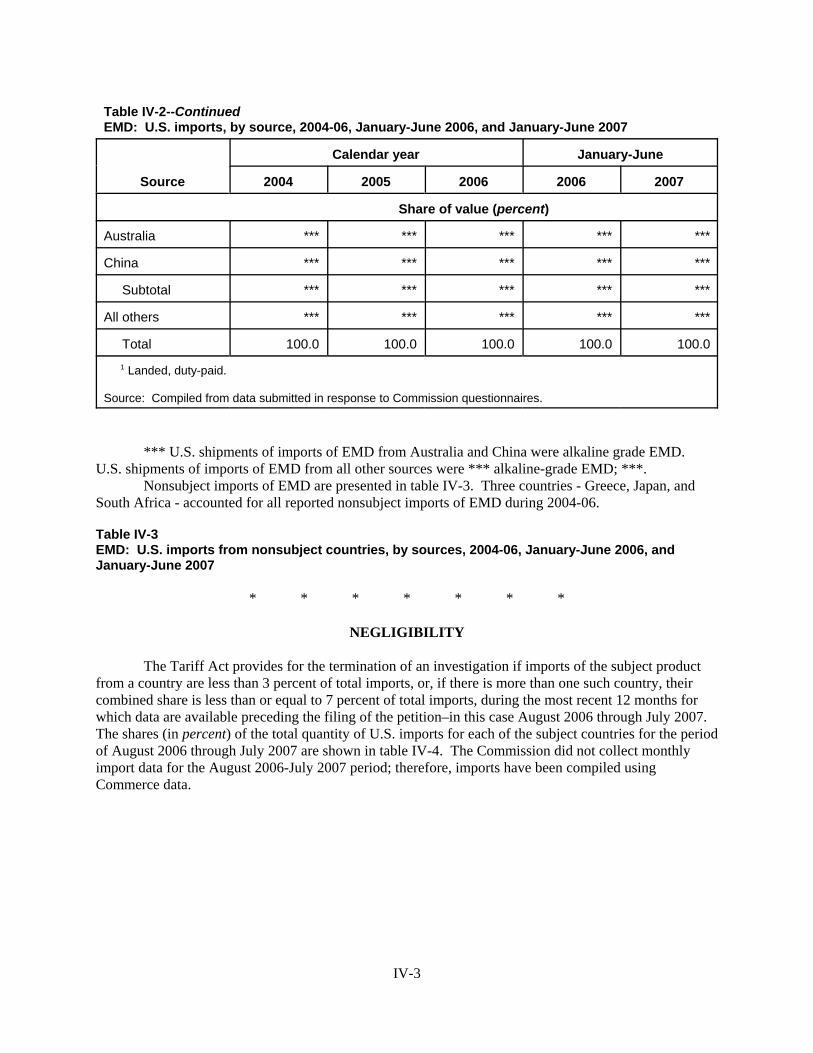
IV-3
Table IV-2--ContinuedEMD: U.S. imports, by source, 2004-06, January-June 2006, and January-June 2007
Source
Calendar year January-June
2004 2005 2006 2006 2007
Share of value (percent)
Australia *** *** *** *** ***
China *** *** *** *** ***
Subtotal *** *** *** *** ***
All others *** *** *** *** ***
Total 100.0 100.0 100.0 100.0 100.0
1 Landed, duty-paid.
Source: Compiled from data submitted in response to Commission questionnaires.
*** U.S. shipments of imports of EMD from Australia and China were alkaline grade EMD. U.S. shipments of imports of EMD from all other sources were *** alkaline-grade EMD; ***.
Nonsubject imports of EMD are presented in table IV-3. Three countries - Greece, Japan, andSouth Africa - accounted for all reported nonsubject imports of EMD during 2004-06.
Table IV-3EMD: U.S. imports from nonsubject countries, by sources, 2004-06, January-June 2006, andJanuary-June 2007
* * * * * * *
NEGLIGIBILITY
The Tariff Act provides for the termination of an investigation if imports of the subject productfrom a country are less than 3 percent of total imports, or, if there is more than one such country, theircombined share is less than or equal to 7 percent of total imports, during the most recent 12 months forwhich data are available preceding the filing of the petition–in this case August 2006 through July 2007. The shares (in percent) of the total quantity of U.S. imports for each of the subject countries for the periodof August 2006 through July 2007 are shown in table IV-4. The Commission did not collect monthlyimport data for the August 2006-July 2007 period; therefore, imports have been compiled using Commerce data.

5 Petitioner’s postconference brief, p. 8. 6 Ibid., pp. 8-9. 7 Ibid., p. 9. 8 Ibid. 9 ***. 10 ***. 11 Spectrum’s postconference brief, pp. 7 and 14. 12 Ibid.
IV-4
Table IV-4EMD: U.S. imports and shares of total imports, by source, August 2006-July 2007
Country Imports (short tons)
Share of total imports(percent)
Australia 18,919 50.1
China 12,723 33.7
Subtotal 31,642 83.7
All other countries 6,157 16.3
Total 37,799 100.0
Source: Compiled from official Commerce statistics.
CUMULATION CONSIDERATIONS
In assessing whether imports compete with each other and with the domestic like product, theCommission has generally considered four factors: (1) fungibility, (2) presence of sales or offers to sellin the same geographical market, (3) common or similar channels of distribution, and (4) simultaneouspresence in the market.
Fungibility
Tronox contends that all EMD from the two subject countries and domestically produced EMD is“generally fungible.”5 It states that Chinese EMD is unquestionably fungible with Australian EMD, suchthat Australian EMD has been replaced by Chinese EMD and vice-versa, in direct competition for sales toU.S. customers in 2006 and 2007.6 Australian EMD sold in the United States allegedly is used in allmajor cell sizes - AA, AAA, and C and D batteries, as is the EMD made by U.S. producer Tronox.7 Moreover, if EMD from a particular supplier does not meet the requirements of a specific batterymanufacturer, the EMD can be blended with EMD from other sources in order to satisfy the batterymanufacturer’s specifications.8 “Blending” is a process by which battery manufacturers may mix or blendEMD from various sources and various grades together to achieve a desired EMD grade.
Duracell said that ***.9Energizer stated that “***.”10
Spectrum argued that EMD is not fungible.11 It stated that EMD is produced for specific batterymanufacturers and that it is not interchangeable between end users. Spectrum cannot use domestic EMDinterchangeably with EMD imported from Australia and China.12 Further, it contends that Chinese EMDis not directly substitutable for EMD originating in any other country for physical reasons, as Chinese
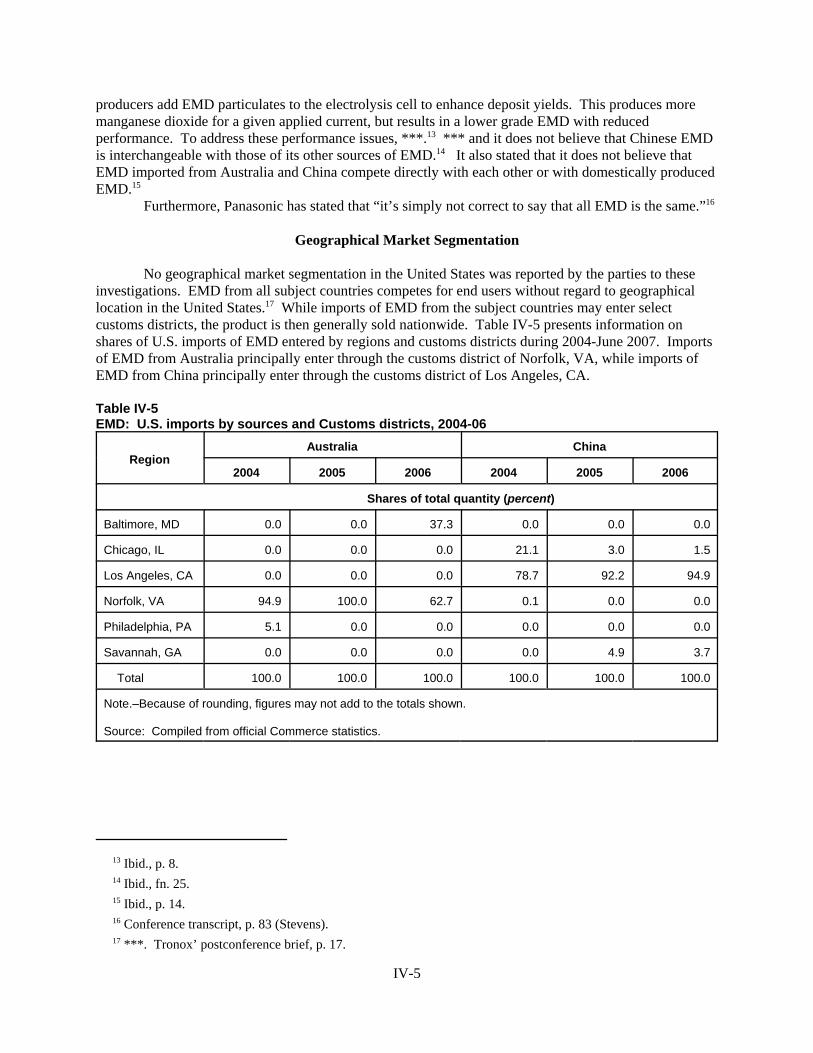
13 Ibid., p. 8. 14 Ibid., fn. 25. 15 Ibid., p. 14. 16 Conference transcript, p. 83 (Stevens). 17 ***. Tronox’ postconference brief, p. 17.
IV-5
producers add EMD particulates to the electrolysis cell to enhance deposit yields. This produces moremanganese dioxide for a given applied current, but results in a lower grade EMD with reducedperformance. To address these performance issues, ***.13 *** and it does not believe that Chinese EMDis interchangeable with those of its other sources of EMD.14 It also stated that it does not believe thatEMD imported from Australia and China compete directly with each other or with domestically producedEMD.15
Furthermore, Panasonic has stated that “it’s simply not correct to say that all EMD is the same.”16
Geographical Market Segmentation
No geographical market segmentation in the United States was reported by the parties to theseinvestigations. EMD from all subject countries competes for end users without regard to geographicallocation in the United States.17 While imports of EMD from the subject countries may enter selectcustoms districts, the product is then generally sold nationwide. Table IV-5 presents information onshares of U.S. imports of EMD entered by regions and customs districts during 2004-June 2007. Importsof EMD from Australia principally enter through the customs district of Norfolk, VA, while imports ofEMD from China principally enter through the customs district of Los Angeles, CA.
Table IV-5EMD: U.S. imports by sources and Customs districts, 2004-06
RegionAustralia China
2004 2005 2006 2004 2005 2006
Shares of total quantity (percent)
Baltimore, MD 0.0 0.0 37.3 0.0 0.0 0.0
Chicago, IL 0.0 0.0 0.0 21.1 3.0 1.5
Los Angeles, CA 0.0 0.0 0.0 78.7 92.2 94.9
Norfolk, VA 94.9 100.0 62.7 0.1 0.0 0.0
Philadelphia, PA 5.1 0.0 0.0 0.0 0.0 0.0
Savannah, GA 0.0 0.0 0.0 0.0 4.9 3.7
Total 100.0 100.0 100.0 100.0 100.0 100.0
Note.–Because of rounding, figures may not add to the totals shown.
Source: Compiled from official Commerce statistics.
18 Id.
IV-6
Common or Similar Channels of Distribution
All imports from all subject countries and domestic production of EMD are sold directly to endusers, the battery manufacturers, by sales representatives of the producers or the importers.18
Simultaneous Presence in the Market
Imports generally have been simultaneously present in the U.S. market throughout the periodexamined. Imports of EMD from Australia and China entered the United States in virtually all monthsfrom January 2006 through July 2007, with the exceptions of March 2006 and January 2007 for EMDimports from Australia.
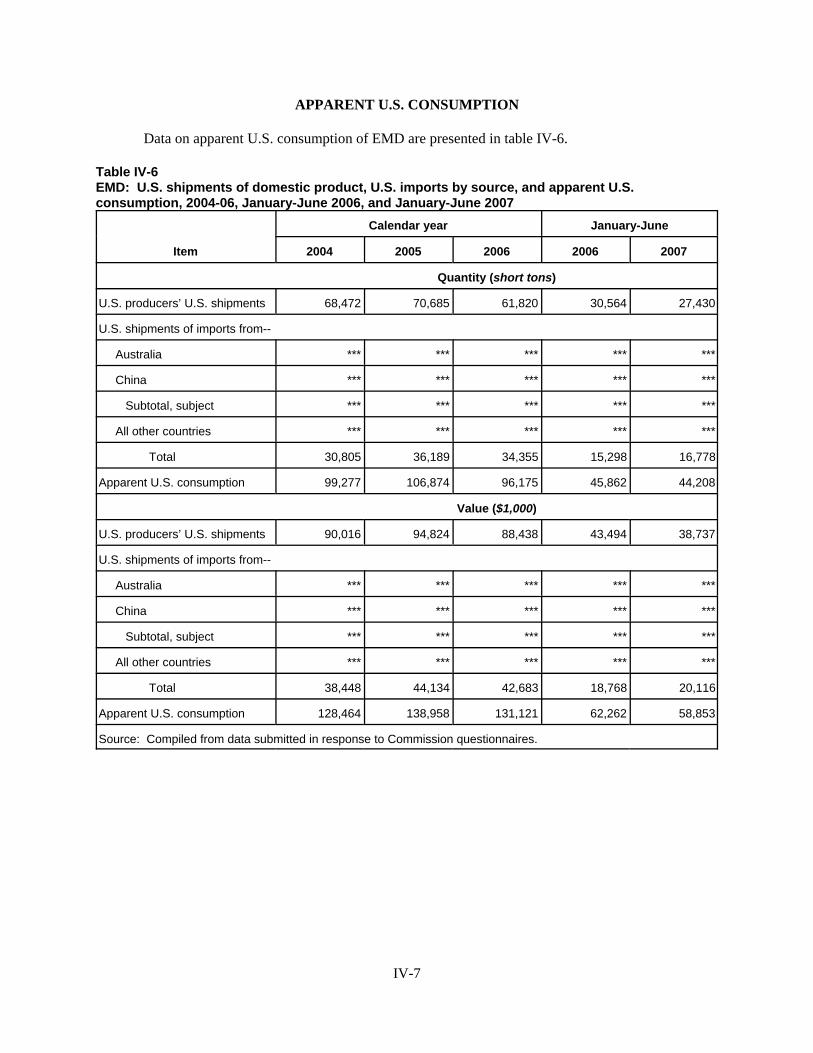
IV-7
APPARENT U.S. CONSUMPTION
Data on apparent U.S. consumption of EMD are presented in table IV-6.
Table IV-6EMD: U.S. shipments of domestic product, U.S. imports by source, and apparent U.S.consumption, 2004-06, January-June 2006, and January-June 2007
Item
Calendar year January-June
2004 2005 2006 2006 2007
Quantity (short tons)
U.S. producers’ U.S. shipments 68,472 70,685 61,820 30,564 27,430
U.S. shipments of imports from--
Australia *** *** *** *** ***
China *** *** *** *** ***
Subtotal, subject *** *** *** *** ***
All other countries *** *** *** *** ***
Total 30,805 36,189 34,355 15,298 16,778
Apparent U.S. consumption 99,277 106,874 96,175 45,862 44,208
Value ($1,000)
U.S. producers’ U.S. shipments 90,016 94,824 88,438 43,494 38,737
U.S. shipments of imports from--
Australia *** *** *** *** ***
China *** *** *** *** ***
Subtotal, subject *** *** *** *** ***
All other countries *** *** *** *** ***
Total 38,448 44,134 42,683 18,768 20,116
Apparent U.S. consumption 128,464 138,958 131,121 62,262 58,853
Source: Compiled from data submitted in response to Commission questionnaires.
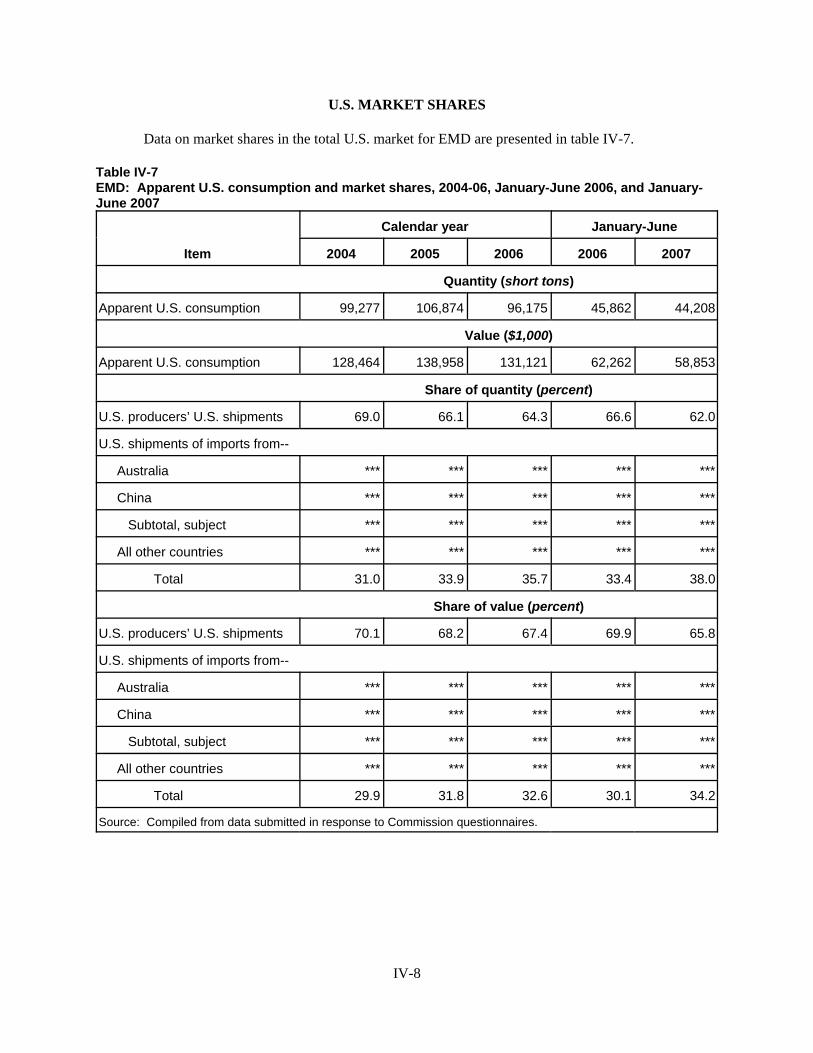
IV-8
U.S. MARKET SHARES
Data on market shares in the total U.S. market for EMD are presented in table IV-7.
Table IV-7EMD: Apparent U.S. consumption and market shares, 2004-06, January-June 2006, and January-June 2007
Item
Calendar year January-June
2004 2005 2006 2006 2007
Quantity (short tons)
Apparent U.S. consumption 99,277 106,874 96,175 45,862 44,208
Value ($1,000)
Apparent U.S. consumption 128,464 138,958 131,121 62,262 58,853
Share of quantity (percent)
U.S. producers’ U.S. shipments 69.0 66.1 64.3 66.6 62.0
U.S. shipments of imports from--
Australia *** *** *** *** ***
China *** *** *** *** ***
Subtotal, subject *** *** *** *** ***
All other countries *** *** *** *** ***
Total 31.0 33.9 35.7 33.4 38.0
Share of value (percent)
U.S. producers’ U.S. shipments 70.1 68.2 67.4 69.9 65.8
U.S. shipments of imports from--
Australia *** *** *** *** ***
China *** *** *** *** ***
Subtotal, subject *** *** *** *** ***
All other countries *** *** *** *** ***
Total 29.9 31.8 32.6 30.1 34.2
Source: Compiled from data submitted in response to Commission questionnaires.
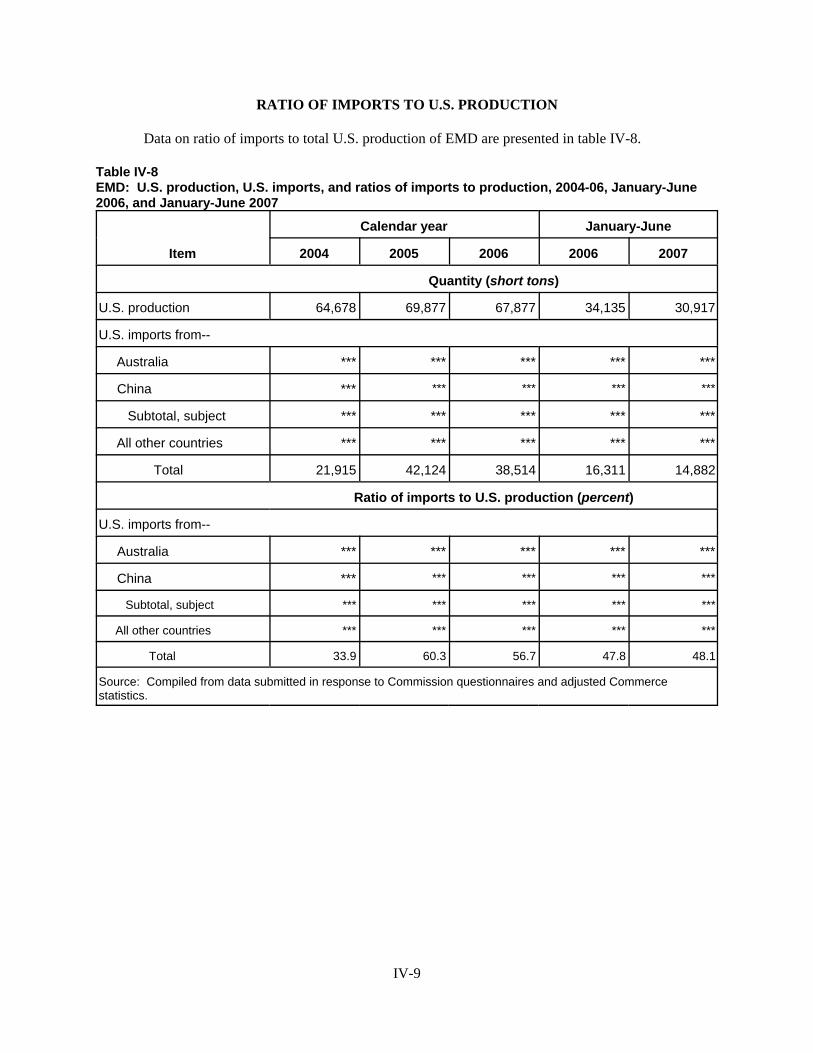
IV-9
RATIO OF IMPORTS TO U.S. PRODUCTION
Data on ratio of imports to total U.S. production of EMD are presented in table IV-8.
Table IV-8EMD: U.S. production, U.S. imports, and ratios of imports to production, 2004-06, January-June2006, and January-June 2007
Item
Calendar year January-June
2004 2005 2006 2006 2007
Quantity (short tons)
U.S. production 64,678 69,877 67,877 34,135 30,917
U.S. imports from--
Australia *** *** *** *** ***
China *** *** *** *** ***
Subtotal, subject *** *** *** *** ***
All other countries *** *** *** *** ***
Total 21,915 42,124 38,514 16,311 14,882
Ratio of imports to U.S. production (percent)
U.S. imports from--
Australia *** *** *** *** ***
China *** *** *** *** ***
Subtotal, subject *** *** *** *** ***
All other countries *** *** *** *** ***
Total 33.9 60.3 56.7 47.8 48.1
Source: Compiled from data submitted in response to Commission questionnaires and adjusted Commercestatistics.

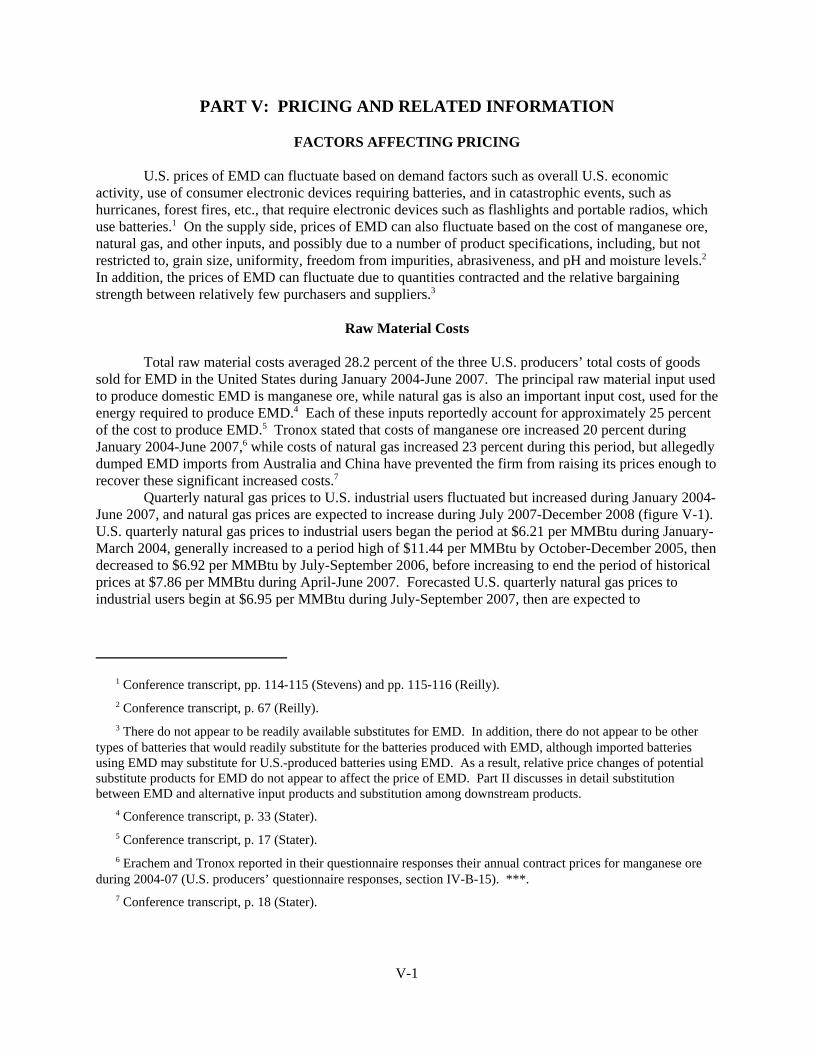
1 Conference transcript, pp. 114-115 (Stevens) and pp. 115-116 (Reilly).
2 Conference transcript, p. 67 (Reilly).
3 There do not appear to be readily available substitutes for EMD. In addition, there do not appear to be othertypes of batteries that would readily substitute for the batteries produced with EMD, although imported batteriesusing EMD may substitute for U.S.-produced batteries using EMD. As a result, relative price changes of potentialsubstitute products for EMD do not appear to affect the price of EMD. Part II discusses in detail substitutionbetween EMD and alternative input products and substitution among downstream products.
4 Conference transcript, p. 33 (Stater).
5 Conference transcript, p. 17 (Stater).
6 Erachem and Tronox reported in their questionnaire responses their annual contract prices for manganese oreduring 2004-07 (U.S. producers’ questionnaire responses, section IV-B-15). ***.
7 Conference transcript, p. 18 (Stater).
V-1
PART V: PRICING AND RELATED INFORMATION
FACTORS AFFECTING PRICING
U.S. prices of EMD can fluctuate based on demand factors such as overall U.S. economicactivity, use of consumer electronic devices requiring batteries, and in catastrophic events, such ashurricanes, forest fires, etc., that require electronic devices such as flashlights and portable radios, whichuse batteries.1 On the supply side, prices of EMD can also fluctuate based on the cost of manganese ore,natural gas, and other inputs, and possibly due to a number of product specifications, including, but notrestricted to, grain size, uniformity, freedom from impurities, abrasiveness, and pH and moisture levels.2 In addition, the prices of EMD can fluctuate due to quantities contracted and the relative bargainingstrength between relatively few purchasers and suppliers.3
Raw Material Costs
Total raw material costs averaged 28.2 percent of the three U.S. producers’ total costs of goodssold for EMD in the United States during January 2004-June 2007. The principal raw material input usedto produce domestic EMD is manganese ore, while natural gas is also an important input cost, used for theenergy required to produce EMD.4 Each of these inputs reportedly account for approximately 25 percentof the cost to produce EMD.5 Tronox stated that costs of manganese ore increased 20 percent duringJanuary 2004-June 2007,6 while costs of natural gas increased 23 percent during this period, but allegedlydumped EMD imports from Australia and China have prevented the firm from raising its prices enough torecover these significant increased costs.7
Quarterly natural gas prices to U.S. industrial users fluctuated but increased during January 2004-June 2007, and natural gas prices are expected to increase during July 2007-December 2008 (figure V-1). U.S. quarterly natural gas prices to industrial users began the period at $6.21 per MMBtu during January-March 2004, generally increased to a period high of $11.44 per MMBtu by October-December 2005, thendecreased to $6.92 per MMBtu by July-September 2006, before increasing to end the period of historicalprices at $7.86 per MMBtu during April-June 2007. Forecasted U.S. quarterly natural gas prices toindustrial users begin at $6.95 per MMBtu during July-September 2007, then are expected to
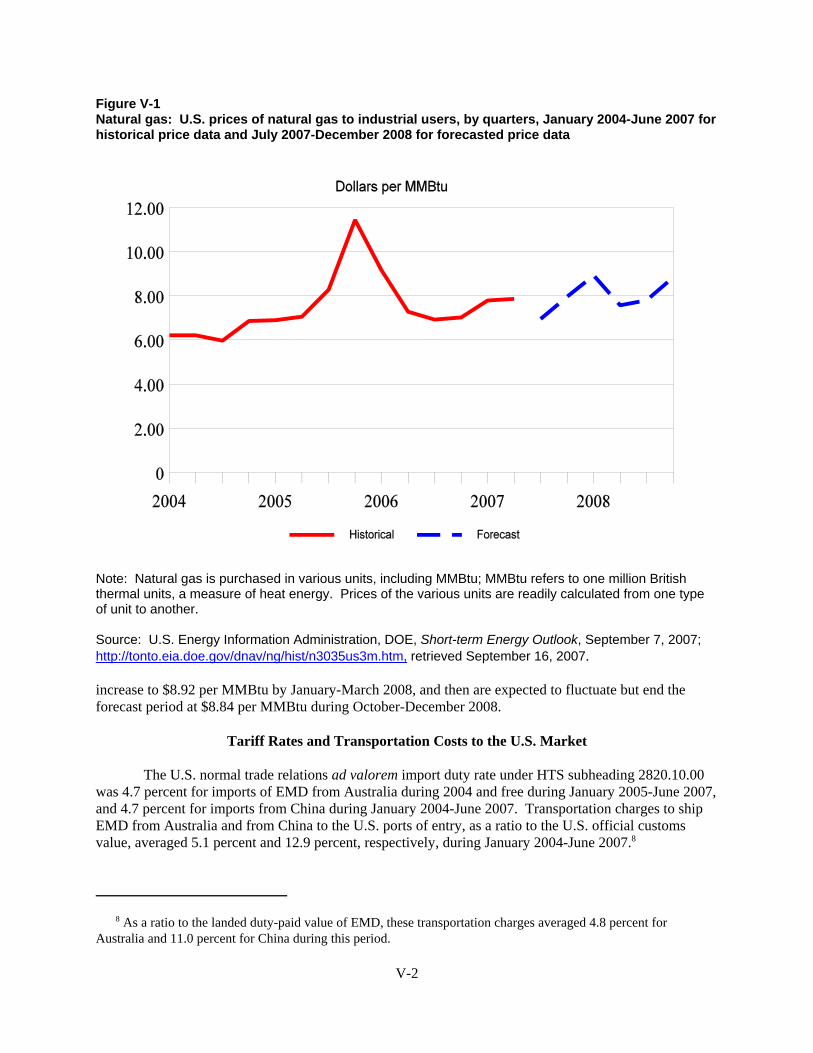
8 As a ratio to the landed duty-paid value of EMD, these transportation charges averaged 4.8 percent forAustralia and 11.0 percent for China during this period.
V-2
Figure V-1Natural gas: U.S. prices of natural gas to industrial users, by quarters, January 2004-June 2007 forhistorical price data and July 2007-December 2008 for forecasted price data
Note: Natural gas is purchased in various units, including MMBtu; MMBtu refers to one million Britishthermal units, a measure of heat energy. Prices of the various units are readily calculated from one typeof unit to another.
Source: U.S. Energy Information Administration, DOE, Short-term Energy Outlook, September 7, 2007;http://tonto.eia.doe.gov/dnav/ng/hist/n3035us3m.htm, retrieved September 16, 2007.
increase to $8.92 per MMBtu by January-March 2008, and then are expected to fluctuate but end theforecast period at $8.84 per MMBtu during October-December 2008.
Tariff Rates and Transportation Costs to the U.S. Market
The U.S. normal trade relations ad valorem import duty rate under HTS subheading 2820.10.00was 4.7 percent for imports of EMD from Australia during 2004 and free during January 2005-June 2007,and 4.7 percent for imports from China during January 2004-June 2007. Transportation charges to shipEMD from Australia and from China to the U.S. ports of entry, as a ratio to the U.S. official customsvalue, averaged 5.1 percent and 12.9 percent, respectively, during January 2004-June 2007.8
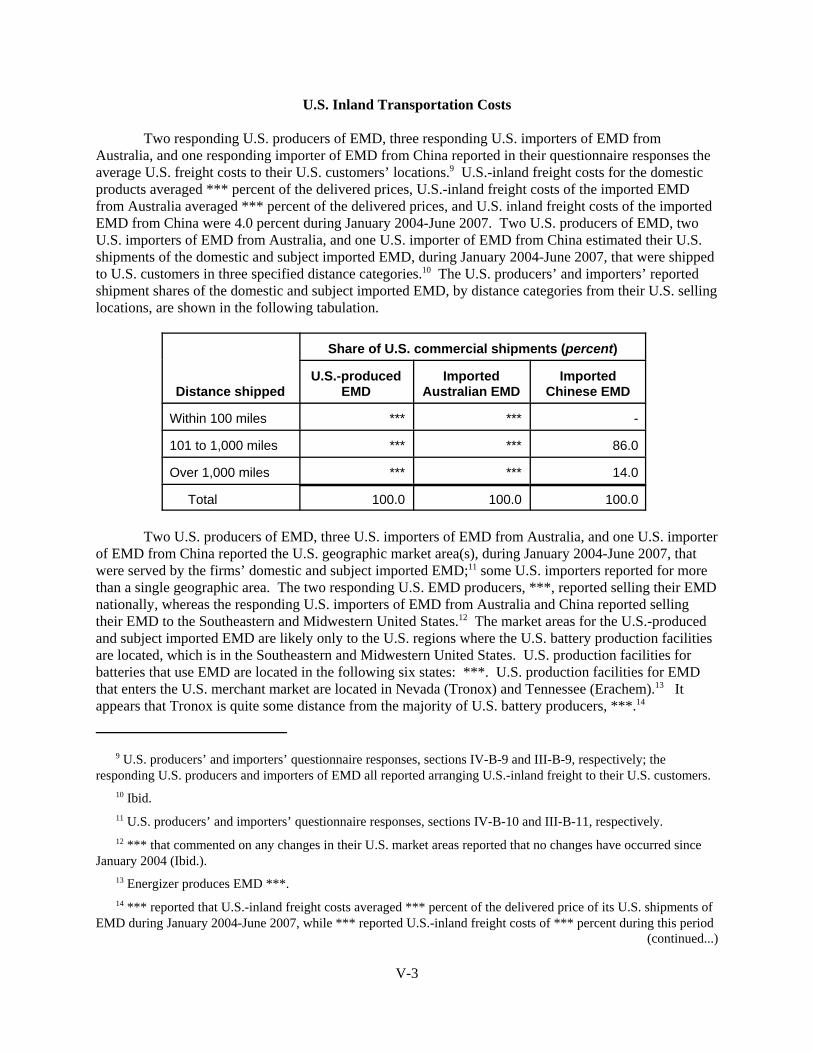
9 U.S. producers’ and importers’ questionnaire responses, sections IV-B-9 and III-B-9, respectively; theresponding U.S. producers and importers of EMD all reported arranging U.S.-inland freight to their U.S. customers.
10 Ibid.
11 U.S. producers’ and importers’ questionnaire responses, sections IV-B-10 and III-B-11, respectively.
12 *** that commented on any changes in their U.S. market areas reported that no changes have occurred sinceJanuary 2004 (Ibid.).
13 Energizer produces EMD ***.
14 *** reported that U.S.-inland freight costs averaged *** percent of the delivered price of its U.S. shipments ofEMD during January 2004-June 2007, while *** reported U.S.-inland freight costs of *** percent during this period
(continued...)
V-3
U.S. Inland Transportation Costs
Two responding U.S. producers of EMD, three responding U.S. importers of EMD fromAustralia, and one responding importer of EMD from China reported in their questionnaire responses theaverage U.S. freight costs to their U.S. customers’ locations.9 U.S.-inland freight costs for the domesticproducts averaged *** percent of the delivered prices, U.S.-inland freight costs of the imported EMDfrom Australia averaged *** percent of the delivered prices, and U.S. inland freight costs of the importedEMD from China were 4.0 percent during January 2004-June 2007. Two U.S. producers of EMD, twoU.S. importers of EMD from Australia, and one U.S. importer of EMD from China estimated their U.S.shipments of the domestic and subject imported EMD, during January 2004-June 2007, that were shippedto U.S. customers in three specified distance categories.10 The U.S. producers’ and importers’ reportedshipment shares of the domestic and subject imported EMD, by distance categories from their U.S. sellinglocations, are shown in the following tabulation.
Distance shipped
Share of U.S. commercial shipments (percent)
U.S.-producedEMD
ImportedAustralian EMD
ImportedChinese EMD
Within 100 miles *** *** -
101 to 1,000 miles *** *** 86.0
Over 1,000 miles *** *** 14.0
Total 100.0 100.0 100.0
Two U.S. producers of EMD, three U.S. importers of EMD from Australia, and one U.S. importerof EMD from China reported the U.S. geographic market area(s), during January 2004-June 2007, thatwere served by the firms’ domestic and subject imported EMD;11 some U.S. importers reported for morethan a single geographic area. The two responding U.S. EMD producers, ***, reported selling their EMDnationally, whereas the responding U.S. importers of EMD from Australia and China reported sellingtheir EMD to the Southeastern and Midwestern United States.12 The market areas for the U.S.-producedand subject imported EMD are likely only to the U.S. regions where the U.S. battery production facilitiesare located, which is in the Southeastern and Midwestern United States. U.S. production facilities forbatteries that use EMD are located in the following six states: ***. U.S. production facilities for EMDthat enters the U.S. merchant market are located in Nevada (Tronox) and Tennessee (Erachem).13 Itappears that Tronox is quite some distance from the majority of U.S. battery producers, ***.14
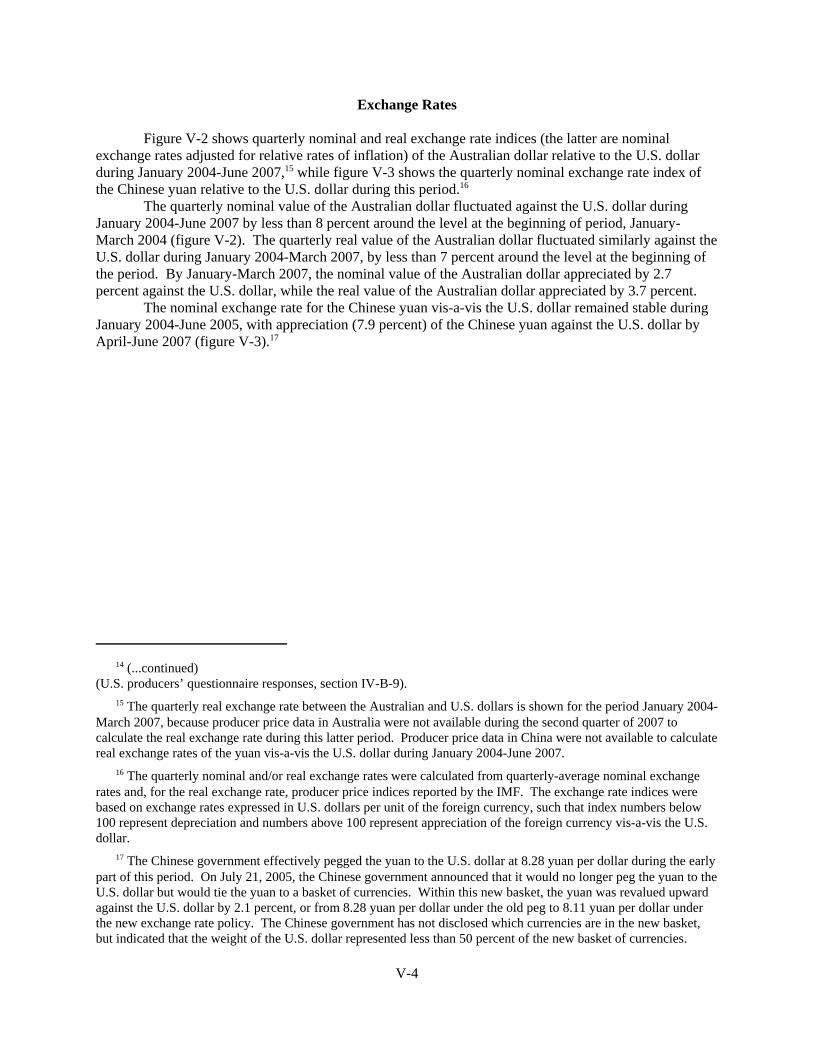
14 (...continued)(U.S. producers’ questionnaire responses, section IV-B-9).
15 The quarterly real exchange rate between the Australian and U.S. dollars is shown for the period January 2004-March 2007, because producer price data in Australia were not available during the second quarter of 2007 tocalculate the real exchange rate during this latter period. Producer price data in China were not available to calculatereal exchange rates of the yuan vis-a-vis the U.S. dollar during January 2004-June 2007.
16 The quarterly nominal and/or real exchange rates were calculated from quarterly-average nominal exchangerates and, for the real exchange rate, producer price indices reported by the IMF. The exchange rate indices werebased on exchange rates expressed in U.S. dollars per unit of the foreign currency, such that index numbers below100 represent depreciation and numbers above 100 represent appreciation of the foreign currency vis-a-vis the U.S.dollar.
17 The Chinese government effectively pegged the yuan to the U.S. dollar at 8.28 yuan per dollar during the earlypart of this period. On July 21, 2005, the Chinese government announced that it would no longer peg the yuan to theU.S. dollar but would tie the yuan to a basket of currencies. Within this new basket, the yuan was revalued upwardagainst the U.S. dollar by 2.1 percent, or from 8.28 yuan per dollar under the old peg to 8.11 yuan per dollar underthe new exchange rate policy. The Chinese government has not disclosed which currencies are in the new basket,but indicated that the weight of the U.S. dollar represented less than 50 percent of the new basket of currencies.
V-4
Exchange Rates
Figure V-2 shows quarterly nominal and real exchange rate indices (the latter are nominalexchange rates adjusted for relative rates of inflation) of the Australian dollar relative to the U.S. dollarduring January 2004-June 2007,15 while figure V-3 shows the quarterly nominal exchange rate index ofthe Chinese yuan relative to the U.S. dollar during this period.16
The quarterly nominal value of the Australian dollar fluctuated against the U.S. dollar duringJanuary 2004-June 2007 by less than 8 percent around the level at the beginning of period, January-March 2004 (figure V-2). The quarterly real value of the Australian dollar fluctuated similarly against theU.S. dollar during January 2004-March 2007, by less than 7 percent around the level at the beginning ofthe period. By January-March 2007, the nominal value of the Australian dollar appreciated by 2.7percent against the U.S. dollar, while the real value of the Australian dollar appreciated by 3.7 percent.
The nominal exchange rate for the Chinese yuan vis-a-vis the U.S. dollar remained stable duringJanuary 2004-June 2005, with appreciation (7.9 percent) of the Chinese yuan against the U.S. dollar byApril-June 2007 (figure V-3).17
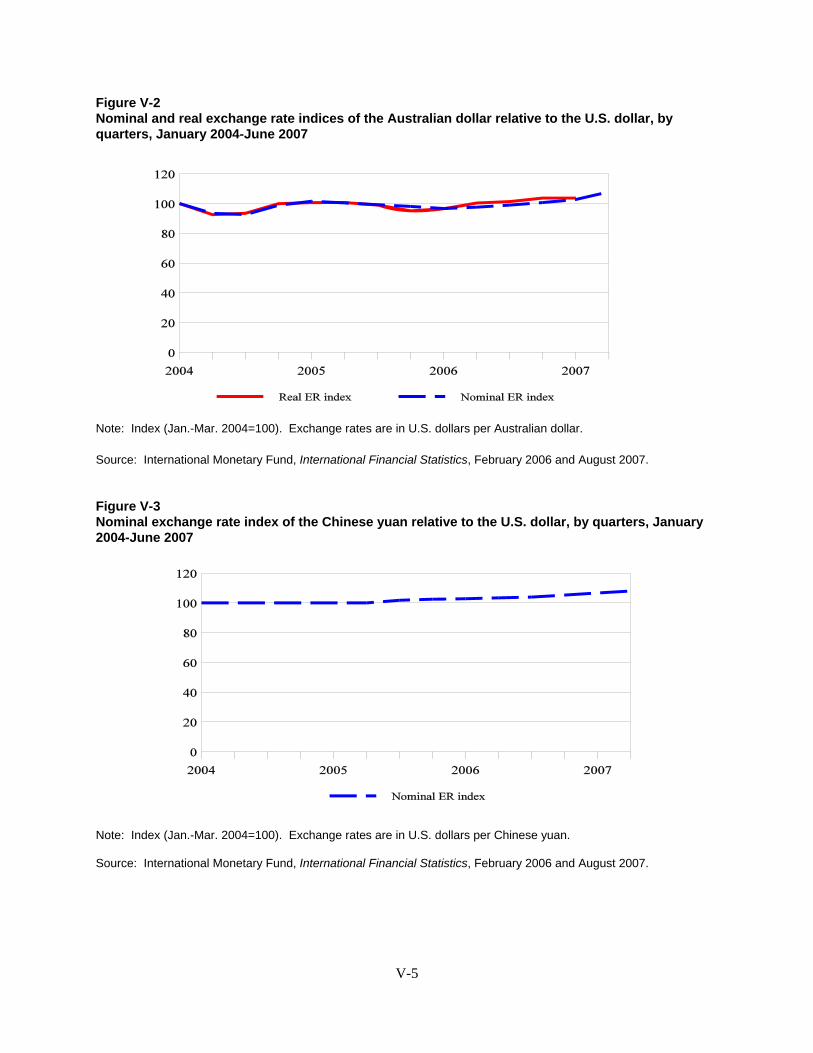
V-5
Figure V-2Nominal and real exchange rate indices of the Australian dollar relative to the U.S. dollar, byquarters, January 2004-June 2007
Note: Index (Jan.-Mar. 2004=100). Exchange rates are in U.S. dollars per Australian dollar.
Source: International Monetary Fund, International Financial Statistics, February 2006 and August 2007.
Figure V-3Nominal exchange rate index of the Chinese yuan relative to the U.S. dollar, by quarters, January2004-June 2007
Note: Index (Jan.-Mar. 2004=100). Exchange rates are in U.S. dollars per Chinese yuan.
Source: International Monetary Fund, International Financial Statistics, February 2006 and August 2007.

18 Information on pricing practices discussed in this section was based on questionnaire responses of the U.S.producers of EMD and importers of EMD from Australia and China, unless otherwise noted.
19 *** (U.S. producers’ questionnaire response, section IV-B-2).
20 U.S. producers’ and importers’ questionnaire responses, sections IV-B-1 and III-B-1, respectively.
21 Spot sales are usually one-time delivery, within 30 days of the purchase agreement; short-term sales are formultiple deliveries for up to 12 months after the purchase agreement; and long-term sales are for multiple deliveriesfor more than 12 months after the purchase agreement. Short-term and long-term sales can be arranged by contractsor verbal agreements.
22 U.S. battery producers provided detailed information on contract negotiations that are discussed later in Part Vin the section entitled Questionnaire Bid-Price Data.
23 U.S. producers’ and importers’ questionnaire responses, sections IV-B-3, 4, 5 and III-B-3, 4, 5, respectively; responding firms were two U.S. producers of EMD, three U.S. importers of EMD from Australia, and two U.S.importers of EMD from China.
V-6
PRICING PRACTICES18
U.S. producers and importers of EMD sell almost exclusively in the U.S. market directly to U.S.battery producers, which account for almost all U.S. consumption of EMD. The majority of U.S. sales ofEMD is typically negotiated between the EMD suppliers and U.S. battery producers as annualcontracts/agreements, with negotiations occurring in the fourth quarter of the previous year for shipmentsthroughout the following year.19 Spot sales may also occur during the contract year when the purchaserrequires an additional quantity beyond the contracted quantity. Two U.S. producers of EMD, one U.S.importer of EMD from Australia, and two U.S. importers of EMD from China reported their 2006 U.S.shipments by type of sale.20 Shares of the 2006 U.S. commercial shipment quantities of the domesticallyproduced and subject imported EMD, by type of sale, are shown in the following tabulation.21
Type of sale
Share of 2006 U.S. commercial shipments (percent)
U.S.-producedEMD
ImportedAustralian EMD
ImportedChinese EMD
Spot sales *** *** -
Short-term sales *** *** 100.0
Long-term sales *** *** -
Total 100.0 100.0 100.0
Source: Compiled from data submitted in response to Commission questionnaires.
Short-Term Contracts/Agreements22
U.S. producers and importers of EMD reported the terms of short-term contract/agreement salesand spot sales and described how prices were negotiated.23 U.S. EMD producers and importers of thesubject EMD reported that their short-term contracts typically were for 12 months, although an importerof EMD from Australia, ***, also reported that short-term contracts of *** sometimes occurred.
24 ***.
25 This importer, *** reported that, although 12-month contracts sometimes have meet-or-release provisions, ***do not have such provisions.
26 U.S. producer and importer questionnaire responses, sections IV-B-4 and III-B-4, respectively. *** and ***also discussed how they determine prices in spot sales (U.S. producer questionnaire responses, section IV-B-5). ***.
27 ***.
28 U.S. producers’ and importers’ questionnaire responses, sections II-9 and II-5, respectively.
29 U.S. producers’ and importers’ questionnaire responses, sections IV-B-12 and III-B-10, respectively.
30 U.S. producers’ and importers’ questionnaire responses, sections IV-B-7 and III-B-7, respectively. Allresponding U.S. producers and importers reported arranging U.S.-inland freight to their U.S. customers (Ibid.).
31 U.S. producers’ and importers’ questionnaire responses, sections IV-B-6 and III-B-6, respectively.
V-7
There were mixed responses about whether prices could be renegotiated during the contractperiod. The two responding U.S. EMD producers reported that ***;24 the three responding U.S. importersof EMD from Australia reported that prices ***; and one of the two responding U.S. importers of EMDfrom China reported that prices could not be renegotiated, while the remaining U.S. importer reported thatprices could be renegotiated.
The responding U.S. producers and importers of EMD reported that short-termcontracts/agreements typically fix quantity and price. However, one of the responding U.S. EMDproducers, ***, also indicated that ***. In addition, one of the responding U.S. importers of EMD fromAustralia, ***, reported that ***. Also, one of the two responding U.S. importers of EMD from China,***, indicated that quantity and price are not fixed.
***, one of the three responding U.S. importers of EMD from Australia,25 and both of theresponding U.S. importers of EMD from China reported that short-term contracts/agreements of 12months either have meet-or-release provisions, or, at least sometimes, prices are flexible and can berenegotiated. The two remaining U.S. importers of EMD from Australia reported that short-termcontracts/agreements do not have meet-or-release provisions.
The two responding U.S. producers of EMD, the two responding U.S. importers of EMD fromAustralia, and the one responding U.S. importer of EMD from China explained how they negotiate pricesfor short-term contracts/agreements for EMD.26 ***,27 ***.
The two responding U.S. importers of EMD from Australia, ***, and the single respondingimporter of EMD from China, ***, also described the process of negotiating prices for EMD in short-termcontracts/agreements. ***.
Other Pricing Practices
U.S. producers of EMD and U.S. importers of EMD from Australia, China, and from nonsubjectcountries reported shipping *** their EMD to end users.28 In addition, *** responding U.S. producersand importers of EMD reported that they did not sell their EMD over the internet.29
The two responding U.S. producers of EMD reported quoting prices on a U.S. f.o.b. plant basis,whereas the three responding U.S. importers of EMD from Australia and the two responding U.S.importers of EMD from China reported quoting prices on a delivered basis.30 The two responding U.S.producers of EMD reported offering payment terms of net 30 days and net 45 days, while the threeresponding importers of EMD from Australia and the two responding importers of EMD from Chinareported offering payment terms ranging from net 30 days to net 60 days.31
32 U.S. producers’ and importers’ questionnaire responses, sections IV-B-4 and 8 and III-B-4 and 8, respectively.
33 ***.
34 U.S. producers’ and importers’ questionnaire responses, sections IV-B-11 and III-B-12, respectively.
35 Three of the four U.S. battery producers, ***, reported that their requests for price and quantity offers fromtheir qualified suppliers does not exactly fit the normal bid process (*** importer questionnaire responses, sectionsIII-A.4-1 and III-A.4, respectively; and conference transcript, p. 120 (Stevens)). Because of the lengthy and detailedqualification procedure and the relatively limited number of qualified suppliers, Panasonic and Spectrum reportedthat the firms do not conduct a re-bid across all suppliers of EMD, but strive to maintain a long-term relationshipwith their EMD suppliers. Conference transcript, pp. 120-121 (Stevens) and (McGrath).
36 U.S. importer questionnaire response, section III-A.4.
37 Duracell, Energizer, and Spectrum (Rayovac) reported bid price data, while Panasonic reported that ***. ***reportedly account for *** percent of U.S. production of alkaline batteries and reportedly *** (staff telephoneinterview with ***).
V-8
The majority of responding U.S. producers and importers of the domestic and subject importedEMD reported that they have no set quantity discount policies, but most reported that in pricenegotiations discounts are made to larger-volume customers.32 *** provided some additionalexplanation.33 ***.
*** and the one responding U.S. importer of EMD from Australia, ***, reported selling theirEMD from U.S. inventory, but the two responding U.S. importers of EMD from China reported sellingtheir products from Chinese production or inventory.34 The two responding U.S. producers reported orderlead times of *** days for *** and *** days for ***, whereas *** reported an order lead time of *** daysfor the imported Australian EMD. The two responding importers of EMD from China reported order leadtimes of *** and *** days for the EMD shipped from China. All of the responding firms reported thatlead times have not changed since January 2004.
PRICE DATA
Questionnaire Bid-Price Data35
U.S. battery producers that used EMD to produce alkaline batteries were requested in theirimporter/purchaser questionnaire responses to report details of bid prices of individual participatingsuppliers for each bid request for EMD shipments received by the U.S. battery producers during January2004-June 2007.36 The three U.S. battery producers responding with bid price data reported informationon a total of 62 EMD bid offers, 53 of which were accepted bids.37 The total number of bids accepted, thetotal quantity awarded, and the average price, by country of origin, are shown in the tabulation below forall contract years combined (2004-07). The average prices for the purchased EMD were based onawarded values that were reported on several bases, including f.o.b., landed duty-paid, and delivered.
* * * * * * *
The reported detailed bid-price information are shown by each of the three reporting U.S. batteryproducers in tables V-1 through V-3, respectively.

38 U.S. importers’ questionnaire responses, section III-A.4-1.
39 E-mail from ***, September 6, 2007.
40 U.S. importers’ questionnaire responses, section III-A.4-2.
41 U.S. importers’ questionnaire responses, section III-A.4-3.
42 U.S. importer questionnaire responses, section III-A.4-4.
V-9
Table V-1EMD: Bid price information reported by Duracell for its annual alkaline-grade EMD contractsawarded for use in its U.S. battery production during 2004-07
* * * * * * *
Table V-2EMD: Bid price information reported by Energizer for its annual alkaline-grade EMD contractsawarded for use in its U.S. battery production during 2004-07
* * * * * * *
Table V-3EMD: Bid price information reported by Spectrum for its annual alkaline-grade EMD contractsawarded for use in its U.S. battery production during 2004-07
* * * * * * *
The responding U.S. battery producers were requested to discuss in their importer/purchaserquestionnaire responses the reason(s) why they awarded contracts to the winning bidders, and why anybidders that were not the lowest priced were awarded contracts.38 The comments of the three U.S. batteryproducers providing bid-price data, and Panasonic’s explanation of its process of selecting EMD suppliersis shown in the tabulation below.39
* * * * * * *
U.S. battery producers were also requested in their importer/purchaser questionnaire responses toidentify the suppliers that were qualified to supply EMD to the battery producers during 2004-07 and thecountry of origin of the EMD.40 The responses of each of the four responding U.S. battery producers are shown in the following tabulation.
* * * * * * *
In addition, U.S. battery producers were requested in their importer/purchaser questionnaireresponses to identify which EMD suppliers, if any they were currently trying to qualify.41 ***.
U.S. battery producers reported in their importer/purchaser questionnaire response the extent towhich qualification among their EMD suppliers is transferable among their different geographicallocations using EMD.42 The responses of the four responding U.S. battery producers are shown in thetabulation below.
* * * * * * *
43 U.S. producer and importer questionnaire responses, sections IV-A.2-4 and III-A.2-4, respectively.
44 Energizer reported that ***.
45 Most of the selling price information discussed in this section of the report represents quarterly shipmentsreported by U.S. producers and importers of EMD and was based on their annual bid awards that were reported bythe U.S. battery producers and that were just discussed in the previous section of this report.
46 The petitioners suggested this product category and three additional product categories for collecting pricedata, but indicated that the standard alkaline EMD product category represents nearly the entire U.S. market forEMD (petition, p. 27).
47 If the reporting firms sold their EMD on a delivered price basis, they were requested to estimate, to the extentpossible, the net f.o.b. U.S. selling value (for instance, deduct from the U.S. delivered value the U.S.-inland freightcost (or an estimate of this cost) it charged, or otherwise arranged, to deliver the EMD to customers at their U.S.receiving location(s)). The firms were requested not to report sales transactions where they were unable to reportvalues, either actual or adjusted, on a f.o.b. U.S. point of shipment basis.
48 If the reporting U.S. battery producers imported their EMD on a delivered price basis, they were requested toestimate, to the extent possible, the U.S. c.i.f., landed, duty-paid values (for instance, deduct from the delivered priceany U.S.-inland freight and shipping charges to the firm’s U.S. location(s)/plant(s) and report the resulting effectiveU.S. c.i.f., landed, duty-paid value). The firms were requested not to report transactions where they were unable toreport values, either actual or adjusted, on a U.S. c.i.f., landed, duty-paid value basis.
V-10
U.S. producers of EMD and U.S. importers of the Australian and Chinese EMD that sell theirproducts to U.S. battery producers were requested to explain the bid process in the producer and importerquestionnaire responses.43 The responses of the two responding U.S. producers, Erachem and Tronox,44
and the three responding U.S. importers, Chemalloy, Delta, and Mitsui (all importers of Australian and/or South African EMD--Mitsui also imported EMD from Japan) are shown in the following tabulation.
* * * * * * *
Questionnaire Quarterly Selling Price Data45
U.S. selling value and quantity data were requested for sales to U.S. battery producers for thefollowing EMD product category produced in the United States and imported from Australia and China:46
Product category 1.--Standard alkaline grade electrolytic manganese dioxide in powderform.
The price data were based on quarterly net U.S. f.o.b. selling price data of U.S. producers andimporters for their shipments of the specified domestic and imported Australian and Chinese EMDproduct category 1 during January 2004-June 2007 to U.S. battery producer customers unrelated to theselling firms.47 In addition, each U.S. importer was requested to provide the selling price data for thespecified EMD product category that it imported from its largest nonsubject country source.
U.S. battery producers that imported their EMD directly were also requested to provide theirquarterly purchase price data for these direct imports, but to supply the purchase values on a U.S. c.i.f.,landed, duty-paid basis.48
Two U.S. producers of EMD (Erachem and Tronox), one U.S. importer of EMD from Australia(Delta), and two U.S. importers of EMD from China (Chori and Shenzhen) reported useable selling priceinformation, but not necessarily for all periods. In addition, a single U.S. importer of EMD also reported
49 This U.S. importer reported total sales quantities for pricing purposes during January 2004-June 2007 thatamounted to *** short tons of EMD from South Africa.
50 *** reported total import quantities for purchase pricing purposes during January 2004-June 2007 thatamounted to almost *** short tons of EMD from China. The reported quantity accounted for *** percent of totalU.S. imports of EMD from China during this period. *** reported a landed, duty-paid, U.S. port of entry purchaseprice of $*** per pound for this EMD during July-September 2004.
51 Selling prices of the U.S.-produced EMD showed less quarter-to-quarter fluctuation than selling prices of theEMD imported from Australia.
V-11
the requested quarterly selling price data for one nonsubject country, South Africa,49 and *** reportedquarterly purchase price data for its imported EMD from China.50 The responding U.S. producersreported total sales quantities of the U.S.-produced EMD for pricing purposes during January 2004-June2007 that amounted to *** short tons, or *** percent of their total reported U.S. commercial shipments ofthe U.S.-produced EMD during this period. The responding U.S. importers reported total sales quantitiesfor pricing purposes during January 2004-June 2007 that amounted to *** short tons of EMD fromAustralia, which accounted for *** percent of total reported U.S. shipments of the imported EMD fromAustralia during this period; and *** short tons of EMD from China, which accounted for *** percent oftotal reported U.S. shipments of the imported EMD from China during this period.
Price Trends
Trends in weighted-average selling prices of the domestic, imported Australian, and importedChinese EMD and comparisons of the weighted-average prices between the domestic and subjectimported EMD are based on the individual firms’ reported quarterly net f.o.b. U.S. selling price data toU.S. battery producer customers. Quarterly trends in weighted-average selling prices and quantities of thedomestic and subject imported product category 1 are shown in table V-4; price comparisons between thedomestic and the subject imported product category 1 are also shown in this table. The quarterlyweighted-average selling prices and quantities of the domestic and subject imported EMD productcategory 1 are also shown in figure V-4. In addition, selling prices of the domestic EMD productcategory 1 and that imported from South Africa are shown in appendix D.
Table V-4EMD: Net weighted-average U.S. f.o.b. selling prices and quantities of domestic and subjectimported EMD product category 1 and margins of underselling/ (overselling), by quarters, January2004-June 2007
* * * * * * *
Figure V-4EMD: Net weighted-average U.S. f.o.b. selling prices and quantities of U.S.-produced and subjectimported product category 1, by quarters, January 2004-June 2007
* * * * * * *
The weighted-average quarterly selling prices of the U.S.-produced and imported AustralianEMD product category 1 tended to trend upward during January 2004-December 2006, before decliningsomewhat during January-June 2007 (table V-4 and figure V-4).51 The quarterly selling prices of theimported Chinese EMD product category 1 first declined from the initial-period price level, January-March 2005, then fluctuated without much trend during the remaining period for which price data were
52 Letter from ***, September 19, 2007.
53 This was a period of violent hurricanes on the Gulf Coast; natural disasters reportedly result in an increase indemand for alkaline batteries and hence EMD (conference transcript, p. 48 (Gutwald), p. 40 (Boyce), and p. 114(Stevens)).
V-12
reported, July 2005-June 2007 (table V-4 and figure V-4). For the U.S.-produced and importedAustralian EMD, selling prices reached their highest levels of the period during 2006, while selling pricesof the imported Chinese EMD showed only a modest uptick during 2006. Price trends of the domesticEMD during January 2004-June 2007 may have been influenced, at least partially, by price fluctuationsof manganese ore and natural gas.
Quarterly selling prices of the U.S.-produced EMD increased from $*** per pound duringJanuary-March 2004 to a period high of $*** per pound by ***, or by *** percent, and remained at thislatter level throughout 2006, before decreasing somewhat to $*** per pound during January-March 2007and remaining at this level to end the period in April-June 2007, about *** percent higher than the initial-period value. Quarterly selling prices of the EMD imported from Australia fluctuated but increased from$*** per pound during January-March 2004 to a period high of $*** per pound by ***, or by ***percent, and remained at this latter level throughout ***, before decreasing somewhat to $*** per poundby January-March 2007 and ending at $*** per pound by April-June 2007, or *** the initial-period value. Quarterly selling prices of the EMD imported from China fluctuated but decreased from $*** per poundduring January-March 2005, the first period for which price data were reported, to match a period low of$*** per pound ***, or by *** percent, then increased to $*** per pound by July-September 2006, beforedecreasing to $*** per pound in the following quarter, and ending at a period low of $*** per pound byApril-June 2007, or *** percent lower than the initial period value.
The generally higher U.S. quarterly selling prices of the imported EMD from Australia comparedto prices of the EMD from China is also reflected in the higher U.S. average unit values for the importedEMD from Australia compared to that from China. Delta asserted that the higher average unit values forthe imported EMD from Australia reflect ***.52 Delta explained that ***. Total quarterly sales quantities reported by the U.S. producers and importers of the subjectimported EMD product category 1 fluctuated during January 2004-June 2007, with the quantities of thedomestic and imported Australian products trending downward during this period while quantities of theproducts imported from China trended upward (table V-4 and figure V-4). U.S. producers’ quarterlyshipment quantities of EMD increased from the initial-period level of almost *** million pounds duringJanuary-March 2004, to a period high of *** million pounds during ***,53 or by *** percent, thendecreased to a period low of almost *** million pounds by *** (*** percent lower than the period-highlevel), and ended at almost *** million pounds in April-June 2007.
U.S. importers’ quarterly shipment quantities of EMD from Australia increased from the initial-period level of almost *** million pounds during January-March 2004, to a period high of *** millionpounds during ***, or by *** percent, then fluctuated but decreased to end near a period low of ***million pounds by *** (*** percent lower than the period-high level).
U.S. importers’ quarterly shipment quantities of EMD from China increased from the initial-period level of *** pounds during January-March 2005, the first period for which data were reported, to aperiod high of *** million pounds during ***, or by *** percent, then decreased to almost *** millionpounds by January-March 2007 (*** percent lower than the period-high level), and ended the period at*** million pounds during April-June 2007 for the second-highest quarterly quantity reported for EMDimported from China.
54 Petition, p. 17.
55 Petition p. 31. *** were unable to report competing prices of EMD in their lost revenue and lost salesallegations, suggesting that purchasers do not disclose specific competing prices.
56 Conference transcript, p. 121 (Stevens) and (McGrath); and Spectrum’s postconference brief, exhibit 1, p. 4.
57 U.S. producer questionnaire responses, sections IV-D (lost revenues) and IV-E (lost sales).
58 In addition, another U.S. EMD producer, ***, responding in its questionnaire response for informationregarding lost revenues and lost sales, reported that ***.
59 In addition, *** also reported lost revenue and lost sales allegations involving ***. The lost sales and lostrevenue allegations involved *** U.S. battery producers.
V-13
Price Comparisons
A total of 23 quarterly net weighted-average U.S. f.o.b. selling price comparisons were possiblebetween the domestic EMD product category 1 and that imported from Australia and China shipped toU.S. battery-producer customers during January 2004-June 2007. All 14 selling price comparisonsinvolving the domestic and imported Australian specified EMD product category showed that theimported product was priced less than the domestic product. In eight of nine price comparisons involvingthe domestic and imported Chinese specified EMD product category, the imported product was pricedless than the domestic product; the single remaining price comparison showed that the domestic andimported Chinese product were priced the same. The selling price comparisons involving the importedAustralian and Chinese specified EMD product are shown by period in table V-5.
Table V-5EMD: Number of quarterly net weighted-average U.S. f.o.b. selling price comparisons betweenU.S.-produced and imported Australian and Chinese EMD during January 2004-June 2007
* * * * * * *
LOST REVENUES AND LOST SALES
In the petition, Tronox reported seven lost revenue allegations and four lost sales allegations dueto competition from imports of EMD from Australia and/or China during January 2004-June 2007. Theseven lost revenue allegations involved a total value of *** for *** of EMD, while the four lost salesallegations involved a total value of *** for *** short tons of EMD. Tronox was unable to providecompeting transaction-specific prices of the subject imported EMD, and noted in the petition that the fourU.S. purchasers of EMD do not release information on prices they pay for their purchases of importedEMD,54 although the purchasers will frequently ***. According to the petitioner, U.S. purchasersroutinely use competitive offers from other suppliers as leverage in price negotiations with their principalsuppliers.55 On the other hand, Panasonic and Spectrum reported that the firms do not use prices ofvarious qualified suppliers as leverage to obtain lower prices.56
In producer questionnaire responses,57 ***.58 ***.The responding U.S. producers, which supply EMD to ***, identified *** in their allegations;59
as a result, some double-counting of lost revenue and lost sales may have occurred in the allegationsinvolving these purchasers. The total of *** reported lost revenue allegations involved an aggregatevalue of *** for *** of EMD, while the total of *** lost sales allegations involved an aggregate value of*** for *** short tons of EMD.
60 E-mail from ***, September 14, 2007.
61 *** not only provided specific comments on the lost revenue and lost sales allegations where it disagreed, butit also referenced its importer questionnaire responses to sections III-A.4-2 and III-B-15 as additional comments. Inits importer questionnaire responses, *** indicated that ***. In addition, *** discussed ***. *** indicated in thesequestionnaire responses that, if it is unsuccessful in maintaining a cost-effective manufacturing solution in the UnitedStates, then inevitably a strategic reassessment of *** manufacturing strategy will be necessary.
62 Fax from ***, September 4 and 7, 2007.
63 ***. Ibid.
64 Fax from ***, September 7, 2007.
V-14
The U.S. purchasers cited in the lost revenue and lost sales allegations in the petition and inquestionnaire responses, the transaction information supplied by the U.S. producers, and whether theresponding purchasers agreed or disagreed with the allegations are shown in table V-6 for lost revenueallegations and table V-7 for lost sales allegations. Any additional comments of the respondingpurchasers are discussed below.
Table V-6EMD: U.S. producers’ lost revenue allegations
* * * * * * *
Table V-7EMD: U.S. producers’ lost sales allegations
* * * * * * *
*** disagreed with *** of the *** lost revenue allegations and *** of the *** lost salesallegations involving the firm and was not able to agree or disagree with the remaining *** lost revenueallegations and *** lost sales allegations (tables V-6 and V-7).60 61 In the *** lost revenue allegationswith which *** disagreed (involving ***), *** provided the following explanation.
“***.”In the *** lost sales allegations on which *** disagreed (involving ***), *** asserted that the reportedvolume was lost *** with equal or better pricing. In the remaining *** lost revenue allegations(involving ***) and *** lost sales allegations (involving ***), *** did not agree or disagree but providedthe following explanation.
“***.”*** disagreed with all *** lost revenue allegations and *** lost sales allegations involving the
firm (tables V-6 and V-7).62 For the lost revenue and lost sales allegations, *** asserted that comparativepricing of other suppliers is not the determining factor for *** in accepting or rejecting offered prices. According to ***, each discussion with an EMD supplier is unique to that supplier’s cost drivers and ***requirements.63 In addition to these comments, *** also referred to its sourcing strategy, ***, which isdiscussed earlier in Part V in the discussion of bid prices.
*** disagreed with the *** lost revenue allegations and *** lost sales allegations involving thefirm (tables V-6 and V-7).64 For the lost revenue allegations, *** asserted that the reported pricecomparisons are not good estimates of the actual prices of EMD from Australia or China that *** paid.*** reported that it did not use the Chinese material (***) in ***. *** asserted that the loss alleged forthe domestic *** during *** was due to poor performance of the domestic product vis-a-vis the productfrom Australia. *** asserted that the ***, cited for ***, has lower ***. For *** lost sales allegations
65 Letter from ***, ***.
V-15
involving ***, the U.S. battery producer asserted that the lost sales were due to poor quality andperformance compared to ***. *** also asserted that prices of the domestic and imported *** were ***.
*** disagreed with the *** lost revenue allegations and *** lost sales allegations involving thefirm (tables V-6 and V-7).65 The *** lost revenue allegations involved ***. The *** lost salesallegations involved ***.
*** provided the following explanations for each lost revenue allegation. For the first lostrevenue allegation (***), *** reported that--
“***.”For the *** lost revenue allegation (***), *** reported that --
“***.”*** provided the following explanations for each lost sales allegation. For the *** lost sales
allegations involving ***, *** reported that--“***.”
For the lost sales allegation involving ***, *** reported that--“***.”
For the lost sales allegation involving ***, *** reported that--“***.”
For the lost sales allegation involving ***, *** reported that--“***.”

1 ***. Tronox was formed in May 2005 and primarily represents Kerr-McGee’s former chemical business segment. The initial public offering of Tronox’ common stock was completed in late November 2005. Tronox 2006 10-K, p.30. According to a company official at the staff conference, Tronox’ EMD manufacturing and marketing operationswere not affected by the divestiture from Kerr-McGee. Conference transcript, pp. 47-48 (Stater). 2 Merchant-market operations represent the financial results of Erachem and Tronox.
VI-1
PART VI: FINANCIAL EXPERIENCE OF THE U.S. PRODUCERS
BACKGROUND
Three U.S. producers reported their EMD financial results on the basis of U.S. generally acceptedaccounting principles (“GAAP”).1 Energizer reported on a fiscal year basis ending September 30, whileErachem and Tronox reported their financial results for calendar-year periods.
The majority of overall EMD revenue reflects commercial sales which were reported by Erachemand Tronox. The balance was accounted for by Energizer’s EMD internal consumption with ***.
MERCHANT-MARKET OPERATIONS ON EMD
Income-and-loss data for merchant-market operations on EMD are presented in table VI-1 and onan average unit basis in table VI-2.2 Table VI-3 presents selected company-specific financial informationfor merchant-market operations on EMD. A variance analysis of the financial results for merchant-market operations on EMD is presented in table VI-4.
Table VI-1EMD: Results of merchant-market operations, 2004-06, January-June 2006, and January-June 2007
* * * * * * *
Table VI-2EMD: Results of merchant-market operations (per short ton), 2004-06, January-June 2006, andJanuary-June 2007
* * * * * * *
Table VI-3EMD: Results of merchant-market operations by firm, 2004-06, January-June 2006, and January-June 2007
* * * * * * *
Table VI-4EMD: Variance analysis of merchant-market financial results of operations, 2004-06, January-June2006, and January-June 2007
* * * * * * *
While average EMD sales value increased *** during the full-year periods as shown in table VI-2, changes in total EMD revenue were primarily the result of period-to-period changes in sales volume;

3 Letter from ***, September 16, 2007. 4 Tronox 2006 10-K, p. 33. 5 Conference transcript, p. 48 (Gutwald). 6 Ibid., p. 55 (Gutwald). 7 Tronox’s postconference brief, exh. 1, p. 8. 8 E-mail with attachments from DLA Piper on behalf of Tronox, September 17, 2007. 9 At the staff conference, the Tronox plant manager stated that in addition to substantial variable costs “. . . EMDproduction is also a highly capital intensive manufacturing process with high fixed overhead costs. The company’sprofitability depends on using production assets as fully as possible in order to minimize per unit cost. Just to giveyou an example, in 2003 when we lost our market position and our capacity utilization dropped the impact was sosevere that we were forced to idle the plant and furlough the workforce.” Conference transcript, pp. 17-18 (Stater). 10 With respect to a typical EMD manufacturing operation, an industry witness at the staff conference stated thatmanganese ore and energy costs would each represent around a quarter of total EMD production costs. Conferencetranscript, p. 17 (Stater). ***. Exh. 27 of petition. ***. E-mail from DLA Piper on behalf of Tronox, September13, 2007. E-mail from ***, September 13, 2007. 11 With regard to the larger level of average other factory costs in interim 2006 compared to full-year 2006, asshown in table VI-2, Erachem and Tronox attributed this pattern ***. E-mail with attachments from DLA Piper onbehalf of Tronox, September 17, 2007. ***. E-mail from ***, September 13, 2007.
VI-2
e.g., the net sales variance section of table VI-4 shows that the 2004-06 full-year negative sales volumevariance was *** and more than offset the corresponding 2004-06 full-year positive price variance. Although total EMD sales volume peaked in 2005, the increase in overall 2005 sales volume compared to2004 was ***. As noted in Part III of this report, ***.
*** reported declines in EMD sales volume in 2006. In Erachem’s questionnaire response andsubsequent response to a staff question, the company indicated that ***.3 ***, Tronox stated in its 200610-K that “. . . sales {of manganese dioxide in 2006} declined primarily due to a decrease in volume of17.4 percent which is the result of record volumes in 2005 brought about by hurricane Katrina.”4 While aTronox company official generally confirmed the accuracy of this statement at the staff conference,5 thecompany official also noted that information on the record shows that the above-referenced 2006 declinein EMD sales volume also coincided with increased subject imports.6 In its postconference brief, thecompany, in contrast with the above-referenced statement in its 2006 10-K, stated that “. . . subjectimports were the primary cause {of lower EMD sales volume in 2006}.”7
As noted above, average EMD sales values increased *** during the full-year periods and at arate *** lower compared to the increase in average raw material costs. Under these circumstances it isnotable that in interim 2007 and despite the absence of declining raw material and/or energy costs, ***. In response to a staff question regarding this trend, Tronox stated that ***.8
As shown in table VI-2, the *** increases in average revenue during the full-year periods werematched against larger positive and negative changes in average cost of goods sold (“COGS”), with therelative share of raw material and other factory costs shifting somewhat during the period. In 2004,average other factory costs, which represents a mix of variable, fixed and semi-fixed costs, was the largestcomponent of average EMD COGS. While other items likely affected the level of average other factorycosts in 2004, lower capacity utilization appears to be a primary factor.9 In 2005, when the industry’sfull-year capacity utilization reached its highest level, both average other factory costs and overallaverage COGS declined to their lowest levels. In 2006 and interim 2007, declines in capacity utilizationand corresponding reduced fixed-cost absorption were exacerbated by continued increases in average rawmaterial costs, as shown in table VI-2, and higher energy costs.10 11
12 ***. 13 ***. Tronox and Erachem responses to question III-10 (U.S. producer questionnaire) and conferencetranscript, pp. 55-56 (Gutwald). 14 ***. E-mail with attachments from DLA Piper on behalf of Tronox, September 17, 2007. ***. 15 It should be noted that average COGS (particularly the other factory costs component) is affected by productionvolume and corresponding fixed cost absorption. In table VI-4, the positive or negative effect on average productioncosts due to changes in production volume is implicit in the cost variance, not the volume variance. 16 Depreciation expense, which is used in table VI-1 and table VI-5 to determine estimated cash flow fromoperations, declined during the period ***. ***. E-mail with attachments from DLA Piper on behalf of Tronox,September 17, 2007. 17 Overall operations on EMD represent the financial results of Energizer, Erachem, and Tronox.
VI-3
As shown in table VI-3, ***. To the extent that company-specific differences in average revenuewere generally *** appear to be due mostly to lower ***.12 13
While absolute SG&A expenses increased somewhat during the period, SG&A expenses ingeneral did not play a major role in terms of explaining period-to-period changes in operating income;e.g., as shown in table VI-4, the industry’s *** at the end of the period was due primarily to the decline ofgross profit to *** in interim 2007.14 The decline to *** in interim 2007 was in turn primarily due to anegative cost variance and to a lesser extent to the negative price variance noted previously.15
As shown in table VI-1, total estimated cash flow from operations, while positive throughout thefull-year period, followed a pattern similar to operating income: peaking in 2005 and then declining ***in both 2006 and interim 2007.16
OVERALL OPERATIONS ON EMD
Income-and-loss data for overall operations on EMD are presented in table VI-5 and on anaverage unit basis in table VI-6.17 Table VI-7 presents selected company-specific financial information for overall operations on EMD. A variance analysis of the financial results for overall operations onEMD is presented in table VI-8.
The primary difference between the overall EMD operations and the previous merchant-marketsection is the inclusion of Energizer. As noted previously, Energizer consumes *** of its EMD in theproduction of batteries. Unlike Tronox or Erachem, whose sales volume *** during the period,Energizer’s sales volume was ***.
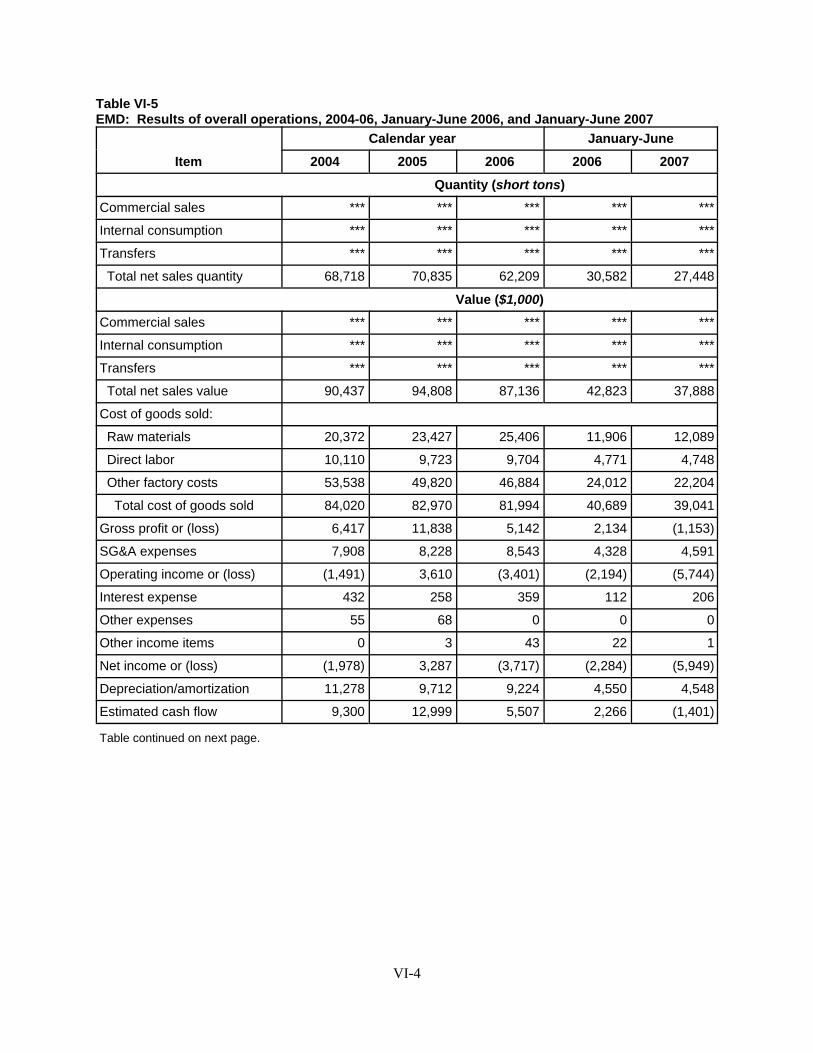
VI-4
Table VI-5EMD: Results of overall operations, 2004-06, January-June 2006, and January-June 2007
Item
Calendar year January-June
2004 2005 2006 2006 2007
Quantity (short tons)Commercial sales *** *** *** *** ***
Internal consumption *** *** *** *** ***
Transfers *** *** *** *** ***
Total net sales quantity 68,718 70,835 62,209 30,582 27,448
Value ($1,000)Commercial sales *** *** *** *** ***
Internal consumption *** *** *** *** ***
Transfers *** *** *** *** ***
Total net sales value 90,437 94,808 87,136 42,823 37,888
Cost of goods sold:
Raw materials 20,372 23,427 25,406 11,906 12,089
Direct labor 10,110 9,723 9,704 4,771 4,748
Other factory costs 53,538 49,820 46,884 24,012 22,204
Total cost of goods sold 84,020 82,970 81,994 40,689 39,041
Gross profit or (loss) 6,417 11,838 5,142 2,134 (1,153)
SG&A expenses 7,908 8,228 8,543 4,328 4,591
Operating income or (loss) (1,491) 3,610 (3,401) (2,194) (5,744)
Interest expense 432 258 359 112 206
Other expenses 55 68 0 0 0
Other income items 0 3 43 22 1
Net income or (loss) (1,978) 3,287 (3,717) (2,284) (5,949)
Depreciation/amortization 11,278 9,712 9,224 4,550 4,548
Estimated cash flow 9,300 12,999 5,507 2,266 (1,401)
Table continued on next page.

VI-5
Table VI-5--ContinuedEMD: Results of overall operations, 2004-06, January-June 2006, and January-June 2007
Item
Calendar year January-June
2004 2005 2006 2006 2007
Ratio to net sales (percent)Raw material 22.5 24.7 29.2 27.8 31.9
Direct labor 11.2 10.3 11.1 11.1 12.5
Other factory costs 59.2 52.5 53.8 56.1 58.6
Cost of goods sold 92.9 87.5 94.1 95.0 103.0
Gross profit or (loss) 7.1 12.5 5.9 5.0 (3.0)
SG&A expenses 8.7 8.7 9.8 10.1 12.1
Operating income or (loss) (1.6) 3.8 (3.9) (5.1) (15.2)
Net income or (loss) (2.2) 3.5 (4.3) (5.3) (15.7)
Number of producers reporting
Operating losses *** *** *** *** ***
Data 3 3 3 3 3
Source: Compiled from data submitted in response to Commission questionnaires.
Table VI-6EMD: Results of overall operations (per short ton), 2004-06, January-June 2006, and January-June2007
Item
Calendar year January-June
2004 2005 2006 2006 2007
Unit value (dollars per short ton)
Commercial sales *** *** *** *** ***
Internal consumption *** *** *** *** ***
Transfers *** *** *** *** ***
Total net sales 1,316 1,338 1,401 1,400 1,380
Cost of goods sold:
Raw material 296 331 408 389 440
Direct labor 147 137 156 156 173
Other factory costs 779 703 754 785 809
Total cost of goods sold 1,223 1,171 1,318 1,330 1,422
Gross profit or (loss) 93 167 83 70 (42)
SG&A expenses 115 116 137 142 167
Operating income or (loss) (22) 51 (55) (72) (209)Source: Compiled from data submitted in response to Commission questionnaires.
18 ***. See Electrolytic Manganese Dioxide from Australia, China, Greece, Ireland, Japan, and South Africa,Investigations Nos. 731-TA-1048-1053 (proprietary version of preliminary phase staff report), table VI-2, p. VI-4. 19 E-mail from ***, September 20, 2007. 20 ***. 21 ***. E-mail with attachments from DLA Piper on behalf of Tronox, September 17, 2007. 22 Erachem’s revised September 12, 2007 questionnaire response. 23 E-mail with attachments from DLA Piper on behalf of Tronox, September 17, 2007.
VI-6
As shown in table VI-7, Energizer’s average sales values (e.g., fair market values assigned by thecompany) were ***. As such and recognizing possible EMD grade differences between the threecompanies, the ***.18 ***.19
As shown in table VI-5, while the trend of financial results for overall EMD operations isgenerally the same as EMD merchant-market financial results (table VI-1), the ***.
Table VI-7EMD: Results of overall operations by firm, 2004-06, January-June 2006, and January-June 2007
* * * * * * *Table VI-8EMD: Variance analysis of overall financial results of operations, 2004-06, January-June 2006, andJanuary-June 2007
* * * * * * *
CAPITAL EXPENDITURES, RESEARCH AND DEVELOPMENT EXPENSES, ASSETS, AND RETURN ON INVESTMENT
Data on capital expenditures, research and development (“R&D”) expenses, assets, and return oninvestment are presented in table VI-9.
Both Erachem and Energizer reported ***.20 ***.21
***.22 ***.23 As shown in table VI-9, Erachem’s R&D expenses were *** throughout the period. *** report R&D expenses.
Table VI-9Overall EMD operations: Capital expenditures, R&D expenses, assets, and return on investmentof, by firms, 2004-06, January-June 2006, and January-June 2007
* * * * * * *
CAPITAL AND INVESTMENT
The Commission requested U.S. producers to describe any actual or anticipated negative effectsof imports of EMD from Australia and China, respectively, on their firms’ growth, investment, ability toraise capital, existing development and production efforts (including efforts to develop a derivative ormore advanced version of the product), or the scale of capital investments.
VI-7
Actual Negative Effects (Australia)
Energizer ***.
Erachem ***.
Tronox ***.
Anticipated Negative Effects (Australia)
Energizer ***.
Erachem ***.
Tronox ***.
Actual Negative Effects (China)
Energizer ***.
Erachem ***.
Tronox: ***.
Anticipated Negative Effects (China)
Energizer ***.
Erachem ***.
Tronox ***.

1 Another Australian firm, Hitec Energy Limited, has failed to successfully commercialize its EMD operations todate (petition, p. 10). It reportedly does not have an operational facility and is not an active producer of EMD(conference transcript, p. 129 (Moore)). 2 Delta Australia’s foreign producers’ questionnaire (section II-9). 3 Delta Australia’s postconference brief, p. 14. 4 ***. 5 These firms are: (1) Guizhou Redstar Developing Import & Export (“Redstar”); and (2) XiangtanElectrochemical Scientific, Ltd. (“Xiangtan”). ***.
VII-1
PART VII: THREAT CONSIDERATIONS AND BRATSK INFORMATION
The Commission analyzes a number of factors in making threat determinations (see 19 U.S.C. §1677(7)(F)(i)). Information on the volume and pricing of imports of the subject merchandise is presentedin Parts IV and V, and information on the effects of imports of the subject merchandise on U.S.producers’ existing development and production efforts is presented in Part VI. Information oninventories of the subject merchandise; foreign producers’ operations, including the potential for“product-shifting;” any other threat indicators, if applicable; and any dumping in third-country markets,follows. Also presented in this section of the report are the statutory requirements and informationobtained for use in the Commission’s consideration pursuant to Bratsk rulings.
THE INDUSTRY IN AUSTRALIA
Table VII-1 presents data for reported production and shipments of EMD in Australia. The datawere provided by the sole producer of EMD in Australia, Delta EMD Australia Pty, Ltd. (“DeltaAustralia”).1 The firm reported that *** percent of its total sales in the most recent fiscal year were salesof EMD. In 2006, *** percent of Delta Australia’s total shipments were exported to the United States. Approximately *** percent of its shipments of EMD were to other export markets such as ***. From2004 to 2006, Delta Australia’s volume of shipments exported to the United States fluctuated upward by*** percent, and its volume of shipments exported to other world markets also fluctuated upward by ***percent. Delta Australia’s capacity remained the same from 2004 to 2006. It reported that ***. It furtherreported that ***.2 Its production decreased from 2004 to 2006 by *** percent and is projected to ***.*** imported EMD into the United States from Delta Australia ***.
Delta Australia projects its exports to the United States to ***. It stated that ***.3 ***.4
Table VII-1EMD: Australia’a reported production capacity, production, shipments, and inventories, 2004-06,January-June 2006, January-June 2007, and projections for 2007 and 2008
* * * * * * *
THE INDUSTRY IN CHINA
Table VII-2 presents data for reported production and shipments of EMD in China. TheCommission sent questionnaires to 36 possible producers of EMD in China and received completedresponses from two firms,5 which together estimated that in 2006 they accounted for approximately ***
6 Foreign producers’ questionnaire responses (section II-9). Xiangtian’s web site states that Xiangtian produces40,000 tons of EMD per year and that its EMD plant’s production is the largest in the world. www.chinaemd.com,retrieved September 22, 2007. 7 Foreign producers’ questionnaire responses (section I-3); Importers’ questionnaire responses (section II-5). 8 Foreign producers’ questionnaire responses (section II-9). 9 ***. Foreign producers’ questionnaire responses (section II-9). 10 Spectrum’s postconference brief, p. 32 and exh. 11.
VII-2
percent of all EMD production in China. *** Chinese producers that responded, Redstar and Xiangtan,exported EMD to the United States during the period examined.6
Table VII-2EMD: China’s reported production capacity, production, shipments, and inventories, 2004-06,January-June 2006, January-June 2007, and projections for 2007 and 2008
* * * * * * *
***.7
In 2006, *** percent of reported shipments of Chinese EMD were exported to the United Stateswhile *** percent of reported shipments were made in the Chinese home market. Producers of EMD inChina reported that in 2006 *** percent of their shipments of EMD were to other export markets (***).8 From 2004 to 2006, Chinese EMD producers’ volume of shipments exported to the United Statesincreased by *** percent while their volume of shipments exported to other world markets increasedirregularly by *** percent. Producers’ capacity in China *** from 2004 to 2006 and is projected to ***.9 Production increased from 2004 to 2006 by *** percent and is projected to ***.
In June 2007, the Chinese Ministry of Finance and the State Administration of Taxationannounced the elimination of the export rebate on multiple products, including EMD, effective in July2007.10
THE INDUSTRIES IN AUSTRALIA AND CHINA COMBINED
Table VII-3 presents reported data on the EMD industries in Australia and China combined.
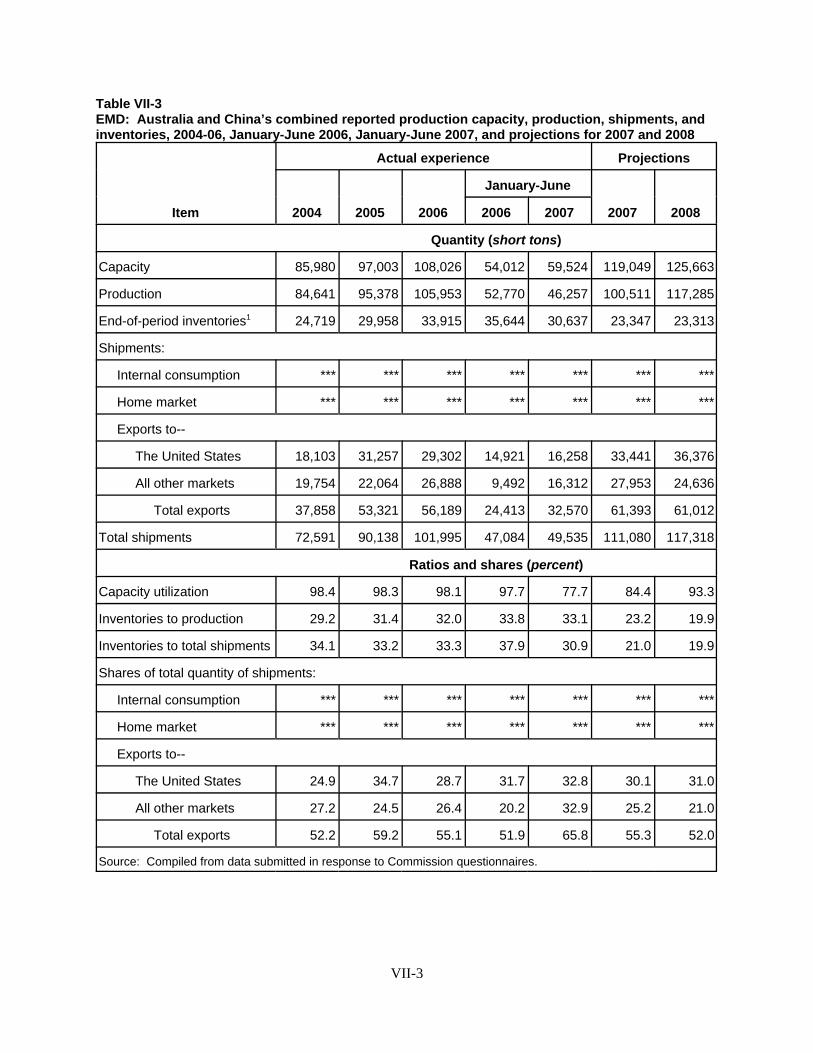
VII-3
Table VII-3EMD: Australia and China’s combined reported production capacity, production, shipments, andinventories, 2004-06, January-June 2006, January-June 2007, and projections for 2007 and 2008
Item
Actual experience Projections
2004 2005 2006
January-June
2007 20082006 2007
Quantity (short tons)
Capacity 85,980 97,003 108,026 54,012 59,524 119,049 125,663
Production 84,641 95,378 105,953 52,770 46,257 100,511 117,285
End-of-period inventories1 24,719 29,958 33,915 35,644 30,637 23,347 23,313
Shipments:
Internal consumption *** *** *** *** *** *** ***
Home market *** *** *** *** *** *** ***
Exports to--
The United States 18,103 31,257 29,302 14,921 16,258 33,441 36,376
All other markets 19,754 22,064 26,888 9,492 16,312 27,953 24,636
Total exports 37,858 53,321 56,189 24,413 32,570 61,393 61,012
Total shipments 72,591 90,138 101,995 47,084 49,535 111,080 117,318
Ratios and shares (percent)
Capacity utilization 98.4 98.3 98.1 97.7 77.7 84.4 93.3
Inventories to production 29.2 31.4 32.0 33.8 33.1 23.2 19.9
Inventories to total shipments 34.1 33.2 33.3 37.9 30.9 21.0 19.9
Shares of total quantity of shipments:
Internal consumption *** *** *** *** *** *** ***
Home market *** *** *** *** *** *** ***
Exports to--
The United States 24.9 34.7 28.7 31.7 32.8 30.1 31.0
All other markets 27.2 24.5 26.4 20.2 32.9 25.2 21.0
Total exports 52.2 59.2 55.1 51.9 65.8 55.3 52.0
Source: Compiled from data submitted in response to Commission questionnaires.

VII-4
U.S. IMPORTERS’ INVENTORIES
Reported inventories held by U.S. importers of subject merchandise from Australia and China areshown in table VII-4.
Table VII-4EMD: U.S. importers’ end-of-period inventories of subject imports, by source, 2004-06, January-June 2006, and January-June 2007
Source
Calendar year January-June
2004 2005 2006 2006 2007
Imports from Australia:
Inventories (short tons) *** *** *** *** ***
Ratio to imports (percent) *** *** *** *** ***
Ratio to U.S. shipments of imports (percent) *** *** *** *** ***
Imports from China:
Inventories (short tons) *** *** *** *** ***
Ratio to imports (percent) *** *** *** *** ***
Ratio to U.S. shipments of imports (percent) *** *** *** *** ***
Imports from all subject countries:
Inventories (short tons) *** *** *** *** ***
Ratio to imports (percent) *** *** *** *** ***
Ratio to U.S. shipments of imports (percent) *** *** *** *** ***
Imports from nonsubject countries:
Inventories (short tons) *** *** *** *** ***
Ratio to imports (percent) *** *** *** *** ***
Ratio to U.S. shipments of imports (percent) *** *** *** *** ***
Imports from all sources:
Inventories (short tons) 5,709 11,638 14,963 11,826 12,989
Ratio to imports (percent) 26.1 27.6 38.9 36.3 43.6
Ratio to U.S. shipments of imports (percent) 18.5 32.2 43.6 38.7 38.7
Note–January-June ratios are calculated using annualized import data. Also, all ratios were calculated only for firmsthat provided both import and inventory data.
Source: Compiled from data submitted in response to Commission questionnaires.
11 Delta Australia’s September 19, 2007 Responses to Supplemental Questions, p. 9. 12 Ibid. 13 Silicon Metal from Russia, Inv. No. 731-TA-991 (Second Remand), USITC Publication 3910, March 2007, p. 2; citing Bratsk Aluminum Smelter v. United States, 444 F.3d at 1375.
VII-5
U.S. IMPORTERS’ IMPORTS SUBSEQUENT TO JUNE 30, 2007
The Commission requested importers to indicate whether they imported or arranged for theimportation of EMD from Australia or China after June 30, 2007. *** responding importers reported thatthey had arranged for the importation of EMD from a subject country subsequent to June 30, 2007. Thetabulation below shows the importer, the quantity of EMD imported or arranged for importationsubsequent to June 30, 2007, and the country of origin of the imports. Table VII-5 presents importssubsequent to June 30, 2007 by month of import.
* * * * * * *
Table VII-5EMD: Subject U.S. imports scheduled for delivery after June 30, 2007
* * * * * * *
ANTIDUMPING INVESTIGATIONS IN THIRD-COUNTRY MARKETS
On April 27, 2007, Japan initiated antidumping investigations on EMD from Australia, China,South Africa, and Spain. According to Delta Australia, the investigations are ongoing and finaldeterminations are expected by April 27, 2008.11
On December 21, 2006, the European Commission (“EC”) initiated an antidumping investigationon EMD from South Africa. On September 18, 2007, the EC imposed a 14.9-percent provisionalantidumping duty on imports of “certain manganese dioxides” from South Africa. A final determinationis expected to occur no later than March 21, 2008.12
INFORMATION ON NONSUBJECT SOURCES
“Bratsk” Considerations
As a result of the Court of Appeals for the Federal Circuit (“CAFC”) decision in BratskAluminum Smelter v. United States (“Bratsk”), the Commission is directed to:
undertake an “additional causation inquiry” whenever certaintriggering factors are met: “whenever the antidumping investigation iscentered on a commodity product, and price competitive non-subjectimports are a significant factor in the market.” The additional inquiryrequired by the Court, which we refer to as the Bratsk replacement /benefit test, is “whether non-subject imports would have replaced thesubject imports without any beneficial effect on domestic producers.13

14 There are no trade data presented for Greece. The Global Trade Atlas reports Greece has declared trade ofmanganese dioxide as confidential. 15 Ireland was a major producer of EMD until its one plant was closed in 2003. According to Delta Industries, “InJuly 2003, a Japanese competitor, Mitsui Mining & Smelting Ltd., announced that they would close their plant inIreland in September 2003 which has since taken place.” Delta Elecrical Industries Limited - Audited Group Resultsfor the Year Ended December 2003, retrieved on Sept. 19, 2007 fromhttp://www.netassets.co.za/equities/naSens/nasensArticle.asp?sensID=19347. 16 ***. 17 Citic Dameng Mining Industries Limited, 2006 EMD Market Review and Forecast, March 30, 2007, retrievedon September 19, 2007 from http://www.manganese.org/documents/2.IMnIEPD0307Tongqing.pdf, (partiallysupplied in exh. 29 of the petition); The Changing Patterns of the Global EMD Business (exh. 32 of the petition);and The Economics of Manganese, 2003 (exh. 4 of the petition). According to Tronox Inc.’s Form 10-K for its fiscalyear ended December 31, 2006 (p. 10), Tronox has approximately 8 percent of global EMD production capacity andErachem has 7 percent. Other significant producers and their estimated global capacity shares include Delta (17percent), Tosoh (15 percent), Xiangtan (11 percent), and Mitsui (7 percent), with the remainder essentially consistingof additional producers in China (Ibid.). 18 Tronox’ postconference brief, pp. 10-11.
VII-6
Nonsubject Source Information
During the preliminary phase of these investigations, the Commission sought pricing data fromU.S. importers of electrolytic manganese dioxide from Australia, China, and from all other countries. Those data are presented in Part V (China and Australia) and appendix D (all other countries) of thisreport. With respect to foreign nonsubject industry data, the Commission sought publicly availableinformation regarding international producers of EMD during 2002-06: Brazil, Colombia, India,Greece,14 Japan, Spain, and South Africa.15 The information obtained is presented in the followingsections.
Overview
Although EMD is believed to be produced in substantial quantities in nonsubject countries Brazil,Greece, Japan, and South Africa, quantitative production data for global EMD production are notgenerally available.16 World production capacity for 2003 and 2006 is shown table VII-6.17
According to the petition, global EMD production capacity was estimated to be 367,800 metrictons (405,463 short tons) as of the end of 2006, with global demand for EMD in 2006 estimated at310,000 metric tons (341,744 short tons). Tronox also cited a statement in Delta’s July 2007 interimreport to the effect that global production capacity for EMD more than satisfies existing demand.18
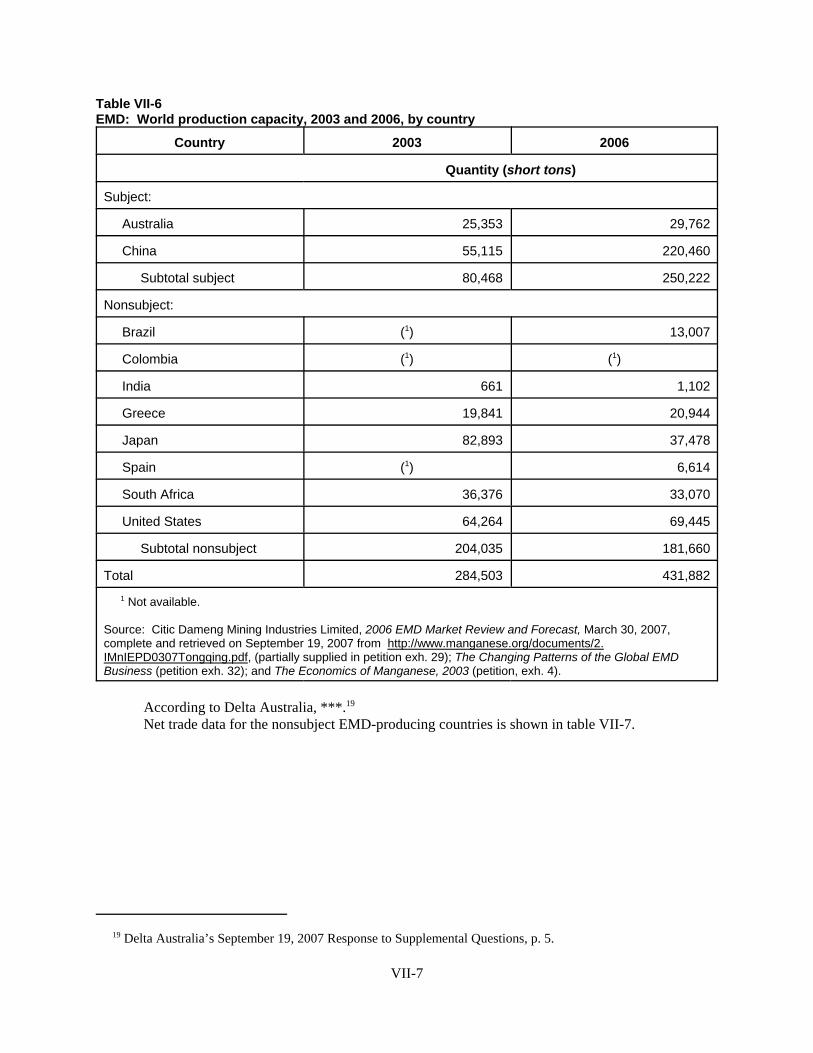
19 Delta Australia’s September 19, 2007 Response to Supplemental Questions, p. 5.
VII-7
Table VII-6EMD: World production capacity, 2003 and 2006, by country
Country 2003 2006
Quantity (short tons)
Subject:
Australia 25,353 29,762
China 55,115 220,460
Subtotal subject 80,468 250,222
Nonsubject:
Brazil (1) 13,007
Colombia (1) (1)
India 661 1,102
Greece 19,841 20,944
Japan 82,893 37,478
Spain (1) 6,614
South Africa 36,376 33,070
United States 64,264 69,445
Subtotal nonsubject 204,035 181,660
Total 284,503 431,882
1 Not available.
Source: Citic Dameng Mining Industries Limited, 2006 EMD Market Review and Forecast, March 30, 2007,complete and retrieved on September 19, 2007 from http://www.manganese.org/documents/2.IMnIEPD0307Tongqing.pdf, (partially supplied in petition exh. 29); The Changing Patterns of the Global EMDBusiness (petition exh. 32); and The Economics of Manganese, 2003 (petition, exh. 4).
According to Delta Australia, ***.19
Net trade data for the nonsubject EMD-producing countries is shown in table VII-7.

VII-8
Table VII-7EMD: Net trade from major nonsubject producing countries, 2004-06
CountryCalendar year
2004 2005 2006
Quantity (short tons)
Imports:
Brazil 626 1,001 2,399
Colombia 1,495 1,488 2,037
India 4,553 5,401 8,198
Japan 7,695 14,770 15,487
South Africa 621 343 33
Spain 237 238 243
Exports:
Brazil 10,038 9,022 2,867
Colombia 20 0 7
India 717 767 860
Japan 31,019 32,062 32,343
South Africa 28,456 35,613 28,331
Spain 2,543 2,674 4,176
Trade balance:
Brazil 9,412 8,021 468
Colombia (1,475) (1,488) (2,030)
India (3,836) (4,634) (7,338)
Japan 23,324 17,292 16,856
South Africa 27,835 35,270 28,298
Spain 2,306 2,436 3,933
Source: World Trade Atlas, importer and exporter records (HTS subheading 2820.10).

20 Citic Dameng Mining Industries Limited, 2006 EMD Market Review and Forecast, March 30, 2007. 21 Ibid. 22 World Trade Atlas. 23 ***. 24 World Trade Atlas.
VII-9
Brazil
Brazil is estimated to have accounted for about 3 percent of world production capacity of EMD atthe end of 2006.20 Two companies were producing in Brazil, SBEL and EML.21 The following tabulationshows Brazil’s exports of EMD to its major markets:22
Market2004 2005 2006
Quantity (short tons)
United States 1,010 1,398 934
Italy 782 419 400
Colombia 917 685 283
Mexico 0 43 220
Pakistan 110 119 208
All other 7,220 6,359 820
Total 10,038 9,022 2,867
Colombia
One producer of EMD is located in Colombia, Quintal, S.A. ***.23 The following tabulationshows Colombia’s exports of EMD to its major markets:24
Market2004 2005 2006
Quantity (short tons)
Guatemala 0 0 7
Ecuador 0 0 (1)
Peru 20 0 0
United States 0 0 0
All other 0 0 0
Total 20 0 7
1 Less than 0.5 short ton.
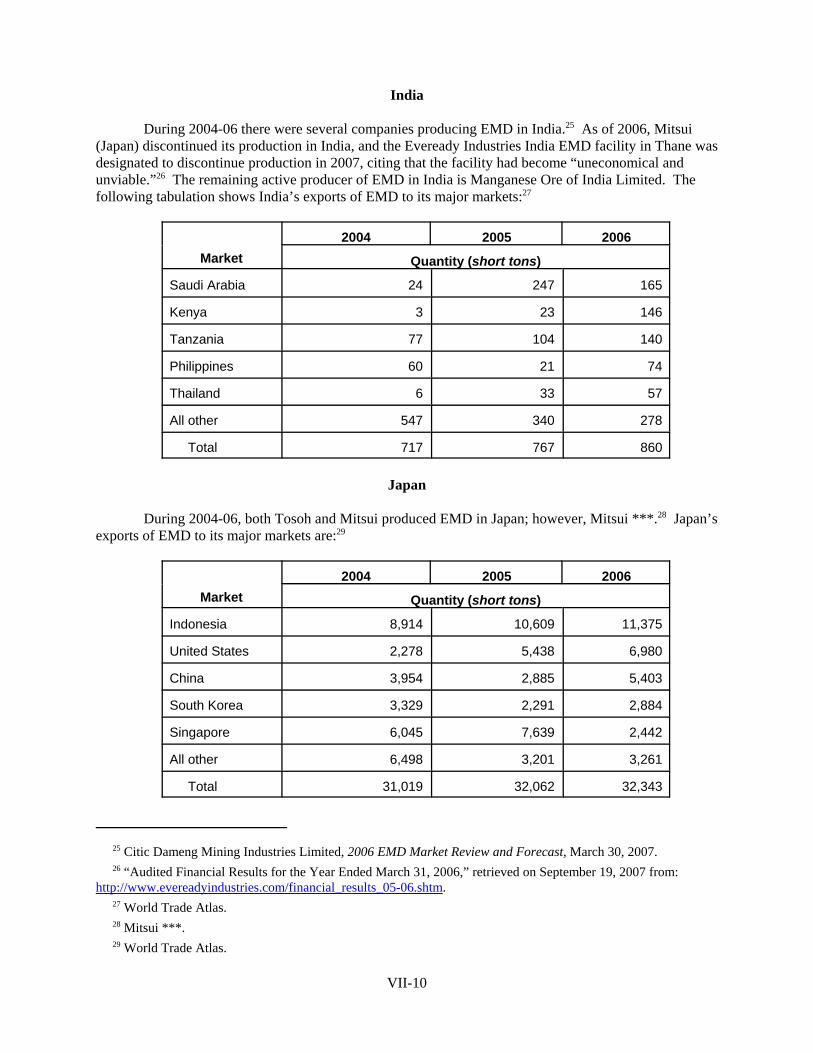
25 Citic Dameng Mining Industries Limited, 2006 EMD Market Review and Forecast, March 30, 2007. 26 “Audited Financial Results for the Year Ended March 31, 2006,” retrieved on September 19, 2007 from: http://www.evereadyindustries.com/financial_results_05-06.shtm. 27 World Trade Atlas. 28 Mitsui ***. 29 World Trade Atlas.
VII-10
India
During 2004-06 there were several companies producing EMD in India.25 As of 2006, Mitsui(Japan) discontinued its production in India, and the Eveready Industries India EMD facility in Thane wasdesignated to discontinue production in 2007, citing that the facility had become “uneconomical andunviable.”26 The remaining active producer of EMD in India is Manganese Ore of India Limited. Thefollowing tabulation shows India’s exports of EMD to its major markets:27
Market2004 2005 2006
Quantity (short tons)
Saudi Arabia 24 247 165
Kenya 3 23 146
Tanzania 77 104 140
Philippines 60 21 74
Thailand 6 33 57
All other 547 340 278
Total 717 767 860
Japan
During 2004-06, both Tosoh and Mitsui produced EMD in Japan; however, Mitsui ***.28 Japan’sexports of EMD to its major markets are:29
Market2004 2005 2006
Quantity (short tons)
Indonesia 8,914 10,609 11,375
United States 2,278 5,438 6,980
China 3,954 2,885 5,403
South Korea 3,329 2,291 2,884
Singapore 6,045 7,639 2,442
All other 6,498 3,201 3,261
Total 31,019 32,062 32,343
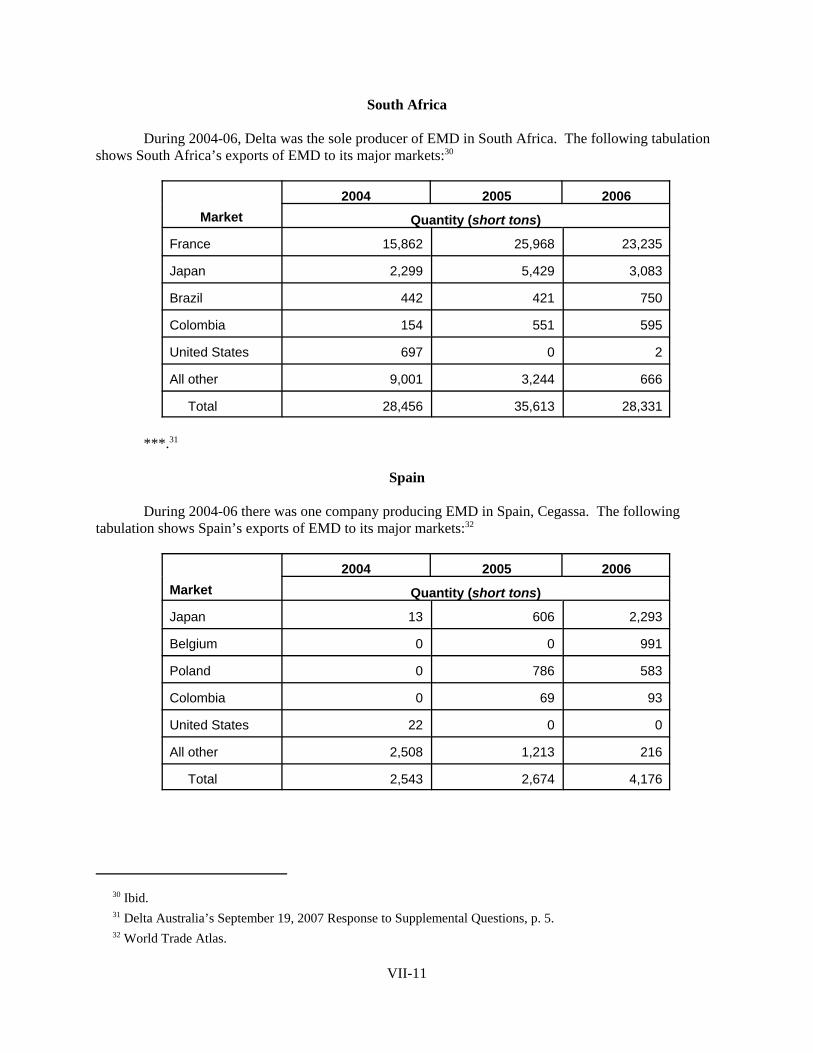
30 Ibid. 31 Delta Australia’s September 19, 2007 Response to Supplemental Questions, p. 5. 32 World Trade Atlas.
VII-11
South Africa
During 2004-06, Delta was the sole producer of EMD in South Africa. The following tabulationshows South Africa’s exports of EMD to its major markets:30
Market2004 2005 2006
Quantity (short tons)
France 15,862 25,968 23,235
Japan 2,299 5,429 3,083
Brazil 442 421 750
Colombia 154 551 595
United States 697 0 2
All other 9,001 3,244 666
Total 28,456 35,613 28,331
***.31
Spain
During 2004-06 there was one company producing EMD in Spain, Cegassa. The followingtabulation shows Spain’s exports of EMD to its major markets:32
Market2004 2005 2006
Quantity (short tons)
Japan 13 606 2,293
Belgium 0 0 991
Poland 0 786 583
Colombia 0 69 93
United States 22 0 0
All other 2,508 1,213 216
Total 2,543 2,674 4,176

A-1
APPENDIX A
FEDERAL REGISTER NOTICES

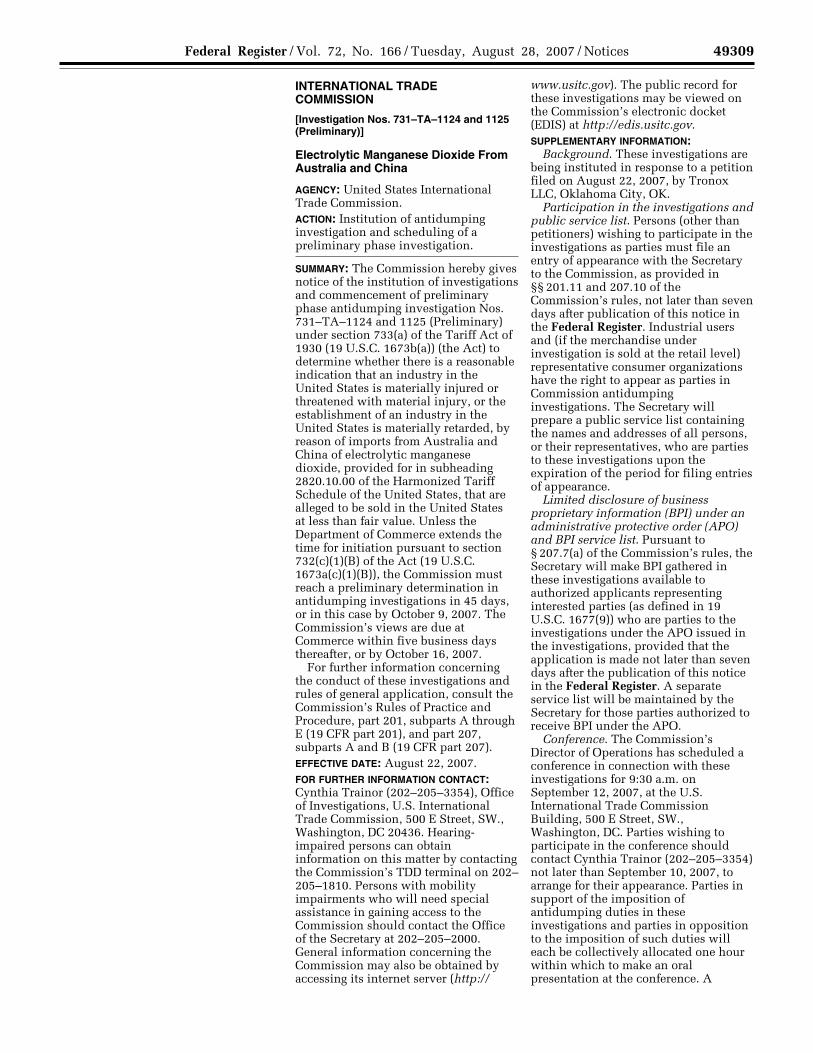
49309 Federal Register / Vol. 72, No. 166 / Tuesday, August 28, 2007 / Notices
comment on information collection and recordkeeping activities [see 5 CFR 1320.8(d)]. This notice identifies information collections that OSM will be submitting to OMB for approval. An agency may not conduct or sponsor, and a person is not required to respond to, a collection of information unless it displays a currently valid OMB control number. The OMB control number for this collection of information is 1029– 0114 and is on the forms along with the expiration date. OSM will request a 3- year term of approval for this information collection activity.
Comments are invited on: (1) The need for the collection of information for the performance of the functions of the agency; (2) the accuracy of the agency’s burden estimates; (3) ways to enhance the quality, utility and clarity of the information collection; and (4) ways to minimize the information collection burden on respondents, such as use of automated means of collection of the information. A summary of the public comments will accompany OSM’s submission of the information collection request to OMB.
This notice provides the public with 60 days in which to comment on the following information collection activity:
Title: Technical Evaluations Series. OMB Control Number: 1029–0114. Summary: The series of surveys are
needed to ensure that technical assistance activities, technology transfer activities and technical forums are useful for those who participate or receive the assistance. Specifically, representatives from State and Tribal regulatory and reclamation authorities, representatives of industry, environmental or citizens groups, or the public, are the recipients of the assistance or participants in these forums. These surveys will be the primary means through which OSM evaluates its performance in meeting the performance goals outlined in its annual plans developed pursuant to the Government Performance and Results Act.
Bureau Form Number: None. Frequency of Collection: Once. Description of Respondents: 26 State
and Tribal governments, industry organizations and individuals who request information or assistance.
Total Annual Responses: 750. Total Annual Burden Hours: 63. Dated: August 22, 2007.
John R. Craynon, Chief, Division of Regulatory Support. [FR Doc. 07–4202 Filed 8–27–07; 8:45 am] BILLING CODE 4310–05–M
INTERNATIONAL TRADE COMMISSION
[Investigation Nos. 731–TA–1124 and 1125 (Preliminary)]
Electrolytic Manganese Dioxide From Australia and China
AGENCY: United States International Trade Commission. ACTION: Institution of antidumping investigation and scheduling of a preliminary phase investigation.
SUMMARY: The Commission hereby gives notice of the institution of investigations and commencement of preliminary phase antidumping investigation Nos. 731–TA–1124 and 1125 (Preliminary) under section 733(a) of the Tariff Act of 1930 (19 U.S.C. 1673b(a)) (the Act) to determine whether there is a reasonable indication that an industry in the United States is materially injured or threatened with material injury, or the establishment of an industry in the United States is materially retarded, by reason of imports from Australia and China of electrolytic manganese dioxide, provided for in subheading 2820.10.00 of the Harmonized Tariff Schedule of the United States, that are alleged to be sold in the United States at less than fair value. Unless the Department of Commerce extends the time for initiation pursuant to section 732(c)(1)(B) of the Act (19 U.S.C. 1673a(c)(1)(B)), the Commission must reach a preliminary determination in antidumping investigations in 45 days, or in this case by October 9, 2007. The Commission’s views are due at Commerce within five business days thereafter, or by October 16, 2007.
For further information concerning the conduct of these investigations and rules of general application, consult the Commission’s Rules of Practice and Procedure, part 201, subparts A through E (19 CFR part 201), and part 207, subparts A and B (19 CFR part 207). EFFECTIVE DATE: August 22, 2007. FOR FURTHER INFORMATION CONTACT: Cynthia Trainor (202–205–3354), Office of Investigations, U.S. International Trade Commission, 500 E Street, SW., Washington, DC 20436. Hearing- impaired persons can obtain information on this matter by contacting the Commission’s TDD terminal on 202– 205–1810. Persons with mobility impairments who will need special assistance in gaining access to the Commission should contact the Office of the Secretary at 202–205–2000. General information concerning the Commission may also be obtained by accessing its internet server (http://
www.usitc.gov). The public record for these investigations may be viewed on the Commission’s electronic docket (EDIS) at http://edis.usitc.gov. SUPPLEMENTARY INFORMATION:
Background. These investigations are being instituted in response to a petition filed on August 22, 2007, by Tronox LLC, Oklahoma City, OK.
Participation in the investigations and public service list. Persons (other than petitioners) wishing to participate in the investigations as parties must file an entry of appearance with the Secretary to the Commission, as provided in §§ 201.11 and 207.10 of the Commission’s rules, not later than seven days after publication of this notice in the Federal Register. Industrial users and (if the merchandise under investigation is sold at the retail level) representative consumer organizations have the right to appear as parties in Commission antidumping investigations. The Secretary will prepare a public service list containing the names and addresses of all persons, or their representatives, who are parties to these investigations upon the expiration of the period for filing entries of appearance.
Limited disclosure of business proprietary information (BPI) under an administrative protective order (APO) and BPI service list. Pursuant to § 207.7(a) of the Commission’s rules, the Secretary will make BPI gathered in these investigations available to authorized applicants representing interested parties (as defined in 19 U.S.C. 1677(9)) who are parties to the investigations under the APO issued in the investigations, provided that the application is made not later than seven days after the publication of this notice in the Federal Register. A separate service list will be maintained by the Secretary for those parties authorized to receive BPI under the APO.
Conference. The Commission’s Director of Operations has scheduled a conference in connection with these investigations for 9:30 a.m. on September 12, 2007, at the U.S. International Trade Commission Building, 500 E Street, SW., Washington, DC. Parties wishing to participate in the conference should contact Cynthia Trainor (202–205–3354) not later than September 10, 2007, to arrange for their appearance. Parties in support of the imposition of antidumping duties in these investigations and parties in opposition to the imposition of such duties will each be collectively allocated one hour within which to make an oral presentation at the conference. A
VerDate Aug<31>2005 19:52 Aug 27, 2007 Jkt 211001 PO 00000 Frm 00063 Fmt 4703 Sfmt 4703 E:\FR\FM\28AUN1.SGM 28AUN1pwal
ker
on P
RO
D1P
C71
with
NO
TIC
ES

49310 Federal Register / Vol. 72, No. 166 / Tuesday, August 28, 2007 / Notices
1 The record is defined in sec. 207.2(f) of the Commission’s Rules of Practice and Procedure (19 CFR § 207.2(f)).
2 Commissioner Charlotte R. Lane determines that there is a reasonable indication that an industry in the United States is materially injured by reason of imports of light-walled rectangular pipe and tube from China, Korea, Mexico, and Turkey.
3 Vice Chairman Shara L. Aranoff, Commissioner Deanna Tanner Okun, and Commissioner Irving A. Williamson determine that there is a reasonable indication that an industry in the United States is threatened with material injury by reason of imports of light-walled rectangular pipe and tube from China, Korea, Mexico, and Turkey.
4 Chairman Daniel R. Peason determines that there is a reasonable indication that an industry in the United States is threatened with material injury by reason of imports of light-walled rectangular pipe and tube from China, Korea, and Turkey, but that there is not a reasonable indication that an industry in the United States is materially injured or threatened with material injury by reason of imports of light-walled rectangular pipe and tube from Mexico.
5 Prior to February 3, 2007, the merchandise subject to these investigations was properly classified under subheading 7306.60.50 of the Harmonized Tariff Schedule of the United States.
6 Commissioner Dean A. Pinkert recused himself to avoid any conflict of interest or appearance of a conflict.
7 Allied Tube and Conduit, Harvey, IL; Atlas Tube, Plymouth, MI; California Steel and Tube, City of Industry, CA; EXLTUBE, Kansas City, MO; Hannibal Industries, Los Angeles, CA; Leavitt Tube Company LLC, Chicago, IL; Maruichi American Corporation, Sante Fe Springs, CA; Searing Industries, Rancho Cucamonga, CA; Southland Tube, Birmingham, AL; Vest Inc., Los Angeles, CA; Welded Tube, Concord, Ontario (Canada); and Western Tube and Conduit, Long Beach, CA.
nonparty who has testimony that may aid the Commission’s deliberations may request permission to present a short statement at the conference.
Written submissions. As provided in §§ 201.8 and 207.15 of the Commission’s rules, any person may submit to the Commission on or before September 17, 2007, a written brief containing information and arguments pertinent to the subject matter of the investigations. Parties may file written testimony in connection with their presentation at the conference no later than three days before the conference. If briefs or written testimony contain BPI, they must conform with the requirements of §§ 201.6, 207.3, and 207.7 of the Commission’s rules. The Commission’s rules do not authorize filing of submissions with the Secretary by facsimile or electronic means, except to the extent permitted by § 201.8 of the Commission’s rules, as amended, 67 FR 68036 (November 8, 2002). Even where electronic filing of a document is permitted, certain documents must also be filed in paper form, as specified in II(C) of the Commission’s Handbook on Electronic Filing Procedures, 67 FR 68168, 68173 (November 8, 2002).
In accordance with §§ 201.16(c) and 207.3 of the rules, each document filed by a party to the investigations must be served on all other parties to the investigations (as identified by either the public or BPI service list), and a certificate of service must be timely filed. The Secretary will not accept a document for filing without a certificate of service.
Authority: These investigations are being conducted under authority of title VII of the Tariff Act of 1930; this notice is published pursuant to § 207.12 of the Commission’s rules.
By order of the Commission. Issued: August 22, 2007.
Marilyn R. Abbott, Secretary to the Commission. [FR Doc. E7–16962 Filed 8–27–07; 8:45 am]
BILLING CODE 7020–02–P
INTERNATIONAL TRADE COMMISSION
[Investigation Nos. 701–TA–449 and 731– TA–1118–1121 (Preliminary)]
Light-Walled Rectangular Pipe and Tube From China, Korea, Mexico, and Turkey
Determination On the basis of the record 1 developed
in the subject investigations, the United States International Trade Commission (Commission) determines, pursuant to sections 703(a) and 733(a) of the Tariff Act of 1930 (19 U.S.C. 1671b(a) and 1673b(a)) (the Act), that there is a reasonable indication that an industry in the United States is materially injured 2 or threatened with material injury 3,4 by reason of imports from China, Korea, Mexico, and Turkey of light-walled rectangular pipe and tube, provided for in subheading 7306.61.50 of the Harmonized Tariff Schedule of the United States,5 that are alleged to be subsidized by the Government of China and that are alleged to be to be sold in the United States at less than fair value (LTFV) from China, Korea, Mexico, and Turkey.6
Commencement of Final Phase Investigations
Pursuant to § 207.18 of the Commission’s rules, the Commission also gives notice of the commencement of the final phase of its investigations. The Commission will issue a final phase notice of scheduling, which will be published in the Federal Register as
provided in § 207.21 of the Commission’s rules, upon notice from the Department of Commerce (Commerce) of affirmative preliminary determinations in the investigations under sections 703(b) and 733(b) of the Act, or, if the preliminary determinations are negative, upon notice of affirmative final determinations in those investigations under section 705(a) and 735(a) of the Act. Parties that filed entries of appearance in the preliminary phase of the investigations need not enter a separate appearance for the final phase of the investigations. Industrial users, and, if the merchandise under investigation is sold at the retail level, representative consumer organizations have the right to appear as parties in Commission antidumping and countervailing duty investigations. The Secretary will prepare a public service list containing the names and addresses of all persons, or their representatives, who are parties to the investigations.
Background On June 27, 2007, a petition was filed
with the Commission and Commerce by twelve U.S. producers,7 alleging that an industry in the United States is materially injured by reason of subsidized imports of light-walled rectangular pipe and tube from China and LTFV imports from China, Korea, Mexico, and Turkey. Accordingly, effective June 27, 2007, the Commission instituted countervailing duty investigation No. 701–TA–449 (Preliminary) and antidumping investigation Nos. 731–TA–1118–1121 (Preliminary).
Notice of the institution of the Commission’s investigations and of a public conference to be held in connection therewith was given by posting copies of the notice in the Office of the Secretary, U.S. International Trade Commission, Washington, DC, and by publishing the notice in the Federal Register of July 3, 2007 (72 FR 36479). The conference was held in Washington, DC, on July 18, 2007, and all persons who requested the opportunity were permitted to appear in person or by counsel.
The Commission transmitted its determinations in these investigations to the Secretary of Commerce on August
VerDate Aug<31>2005 19:52 Aug 27, 2007 Jkt 211001 PO 00000 Frm 00064 Fmt 4703 Sfmt 4703 E:\FR\FM\28AUN1.SGM 28AUN1pwal
ker
on P
RO
D1P
C71
with
NO
TIC
ES
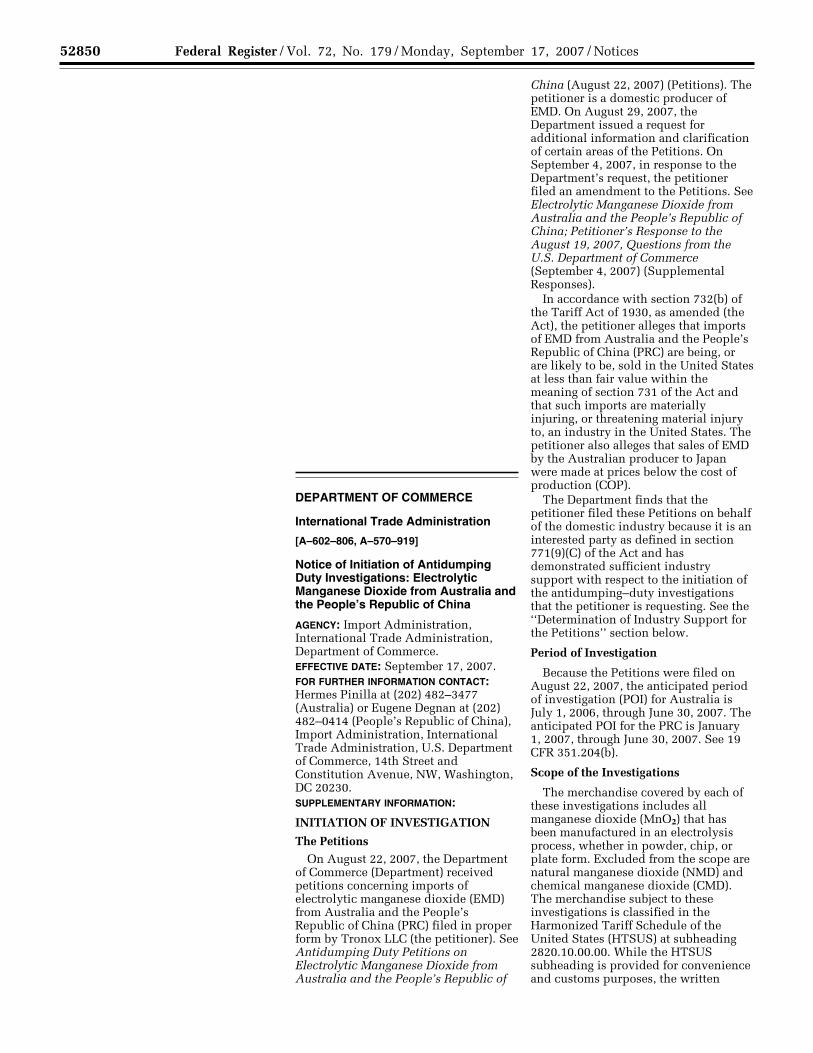
52850 Federal Register / Vol. 72, No. 179 / Monday, September 17, 2007 / Notices
ADDRESSES: The meeting will be held at Sierra Nevada College, 999 Tahoe Boulevard, Incline Village, NV 89451. FOR FURTHER INFORMATION CONTACT: Arla Hains, Lake Tahoe Basin Management Unit, Forest Service, 35 College Drive, South Lake Tahoe, CA 96150, (530) 543–2773. SUPPLEMENTARY INFORMATION: Items to be covered on the agenda include: (1) Discussion of possible changes to the Implementation Agreement, Southern Nevada Public Land Management Act of 1998 Public Law 105–263 (as amended); (2) an update on the Environmental Improvement Program; and (3) Public Comment. All Lake Tahoe Basin Federal Advisory Committee meetings are open to the public. Interested citizens are encouraged to attend at the above address. Issues may be brought to the attention of the Committee during the open public comment period at the meeting or by filing written statements with the secretary for the Committee before or after the meeting. Please refer any written comments to the Lake Tahoe Basin Management Unit at the contact address stated above.
Dated: September 11, 2007. Terri Marceron, Forest Supervisor. [FR Doc. 07–4581 Filed 9–14–07; 8:45 am] BILLING CODE 3410–11–M
DEPARTMENT OF AGRICULTURE
Forest Service
Notice of New Fee Site; Federal Lands Recreation Enhancement Act, (Title VIII, Pub. L. 108–447)
AGENCY: Monongahela National Forest, USDA Forest Service. ACTION: Notice of new fee site.
DEPARTMENT OF COMMERCE
International Trade Administration
[A–602–806, A–570–919]
Notice of Initiation of Antidumping Duty Investigations: Electrolytic Manganese Dioxide from Australia and the People’s Republic of China
AGENCY: Import Administration, International Trade Administration, Department of Commerce. EFFECTIVE DATE: September 17, 2007. FOR FURTHER INFORMATION CONTACT: Hermes Pinilla at (202) 482–3477 (Australia) or Eugene Degnan at (202) 482–0414 (People’s Republic of China), Import Administration, International Trade Administration, U.S. Department of Commerce, 14th Street and Constitution Avenue, NW, Washington, DC 20230. SUPPLEMENTARY INFORMATION:
INITIATION OF INVESTIGATION
The Petitions On August 22, 2007, the Department
of Commerce (Department) received petitions concerning imports of electrolytic manganese dioxide (EMD) from Australia and the People’s Republic of China (PRC) filed in proper form by Tronox LLC (the petitioner). See Antidumping Duty Petitions on Electrolytic Manganese Dioxide from Australia and the People’s Republic of
China (August 22, 2007) (Petitions). The petitioner is a domestic producer of EMD. On August 29, 2007, the Department issued a request for additional information and clarification of certain areas of the Petitions. On September 4, 2007, in response to the Department’s request, the petitioner filed an amendment to the Petitions. See Electrolytic Manganese Dioxide from Australia and the People’s Republic of China; Petitioner’s Response to the August 19, 2007, Questions from the U.S. Department of Commerce (September 4, 2007) (Supplemental Responses).
In accordance with section 732(b) of the Tariff Act of 1930, as amended (the Act), the petitioner alleges that imports of EMD from Australia and the People’s Republic of China (PRC) are being, or are likely to be, sold in the United States at less than fair value within the meaning of section 731 of the Act and that such imports are materially injuring, or threatening material injury to, an industry in the United States. The petitioner also alleges that sales of EMD by the Australian producer to Japan were made at prices below the cost of production (COP).
The Department finds that the petitioner filed these Petitions on behalf of the domestic industry because it is an interested party as defined in section 771(9)(C) of the Act and has demonstrated sufficient industry support with respect to the initiation of the antidumping–duty investigations that the petitioner is requesting. See the ‘‘Determination of Industry Support for the Petitions’’ section below.
Period of Investigation
Because the Petitions were filed on August 22, 2007, the anticipated period of investigation (POI) for Australia is July 1, 2006, through June 30, 2007. The anticipated POI for the PRC is January 1, 2007, through June 30, 2007. See 19 CFR 351.204(b).
Scope of the Investigations
The merchandise covered by each of these investigations includes all manganese dioxide (MnO2) that has been manufactured in an electrolysis process, whether in powder, chip, or plate form. Excluded from the scope are natural manganese dioxide (NMD) and chemical manganese dioxide (CMD). The merchandise subject to these investigations is classified in the Harmonized Tariff Schedule of the United States (HTSUS) at subheading 2820.10.00.00. While the HTSUS subheading is provided for convenience and customs purposes, the written
VerDate Aug<31>2005 17:00 Sep 14, 2007 Jkt 211001 PO 00000 Frm 00004 Fmt 4703 Sfmt 4703 E:\FR\FM\17SEN1.SGM 17SEN1jlent
ini o
n P
RO
D1P
C65
with
NO
TIC
ES
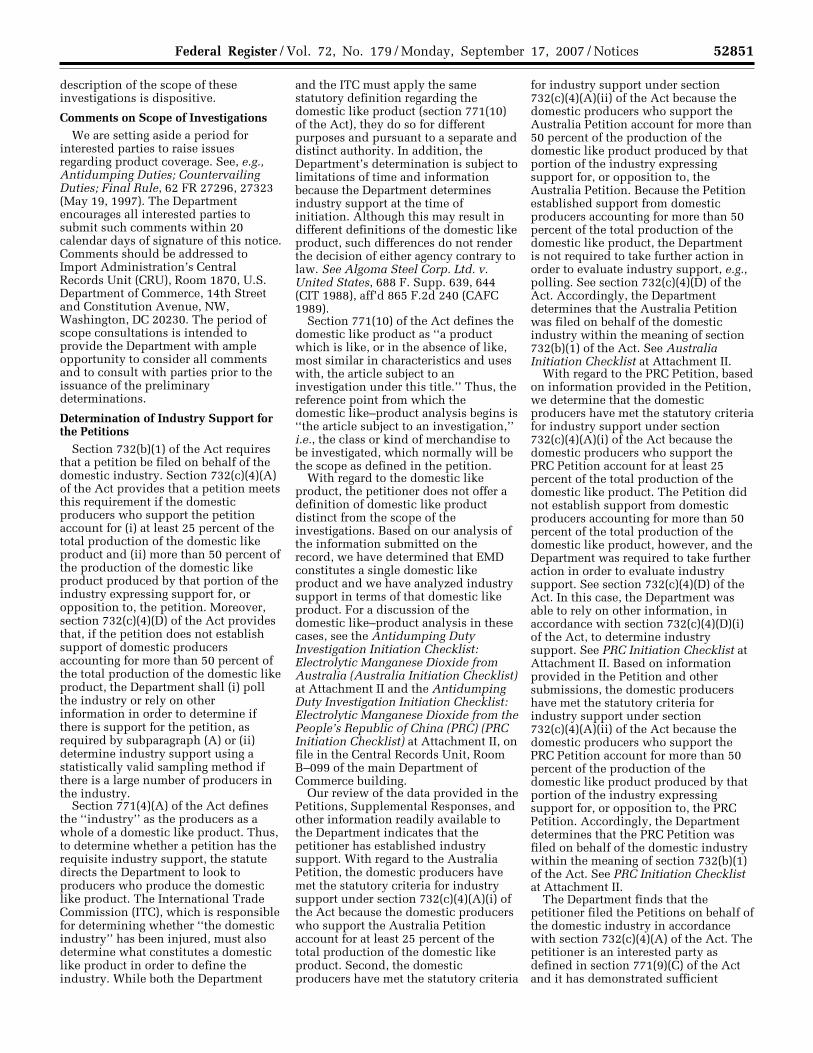
52851 Federal Register / Vol. 72, No. 179 / Monday, September 17, 2007 / Notices
description of the scope of these investigations is dispositive.
Comments on Scope of Investigations We are setting aside a period for
interested parties to raise issues regarding product coverage. See, e.g., Antidumping Duties; Countervailing Duties; Final Rule, 62 FR 27296, 27323 (May 19, 1997). The Department encourages all interested parties to submit such comments within 20 calendar days of signature of this notice. Comments should be addressed to Import Administration’s Central Records Unit (CRU), Room 1870, U.S. Department of Commerce, 14th Street and Constitution Avenue, NW, Washington, DC 20230. The period of scope consultations is intended to provide the Department with ample opportunity to consider all comments and to consult with parties prior to the issuance of the preliminary determinations.
Determination of Industry Support for the Petitions
Section 732(b)(1) of the Act requires that a petition be filed on behalf of the domestic industry. Section 732(c)(4)(A) of the Act provides that a petition meets this requirement if the domestic producers who support the petition account for (i) at least 25 percent of the total production of the domestic like product and (ii) more than 50 percent of the production of the domestic like product produced by that portion of the industry expressing support for, or opposition to, the petition. Moreover, section 732(c)(4)(D) of the Act provides that, if the petition does not establish support of domestic producers accounting for more than 50 percent of the total production of the domestic like product, the Department shall (i) poll the industry or rely on other information in order to determine if there is support for the petition, as required by subparagraph (A) or (ii) determine industry support using a statistically valid sampling method if there is a large number of producers in the industry.
Section 771(4)(A) of the Act defines the ‘‘industry’’ as the producers as a whole of a domestic like product. Thus, to determine whether a petition has the requisite industry support, the statute directs the Department to look to producers who produce the domestic like product. The International Trade Commission (ITC), which is responsible for determining whether ‘‘the domestic industry’’ has been injured, must also determine what constitutes a domestic like product in order to define the industry. While both the Department
and the ITC must apply the same statutory definition regarding the domestic like product (section 771(10) of the Act), they do so for different purposes and pursuant to a separate and distinct authority. In addition, the Department’s determination is subject to limitations of time and information because the Department determines industry support at the time of initiation. Although this may result in different definitions of the domestic like product, such differences do not render the decision of either agency contrary to law. See Algoma Steel Corp. Ltd. v. United States, 688 F. Supp. 639, 644 (CIT 1988), aff’d 865 F.2d 240 (CAFC 1989).
Section 771(10) of the Act defines the domestic like product as ‘‘a product which is like, or in the absence of like, most similar in characteristics and uses with, the article subject to an investigation under this title.’’ Thus, the reference point from which the domestic like–product analysis begins is ‘‘the article subject to an investigation,’’ i.e., the class or kind of merchandise to be investigated, which normally will be the scope as defined in the petition.
With regard to the domestic like product, the petitioner does not offer a definition of domestic like product distinct from the scope of the investigations. Based on our analysis of the information submitted on the record, we have determined that EMD constitutes a single domestic like product and we have analyzed industry support in terms of that domestic like product. For a discussion of the domestic like–product analysis in these cases, see the Antidumping Duty Investigation Initiation Checklist: Electrolytic Manganese Dioxide from Australia (Australia Initiation Checklist) at Attachment II and the Antidumping Duty Investigation Initiation Checklist: Electrolytic Manganese Dioxide from the People’s Republic of China (PRC) (PRC Initiation Checklist) at Attachment II, on file in the Central Records Unit, Room B–099 of the main Department of Commerce building.
Our review of the data provided in the Petitions, Supplemental Responses, and other information readily available to the Department indicates that the petitioner has established industry support. With regard to the Australia Petition, the domestic producers have met the statutory criteria for industry support under section 732(c)(4)(A)(i) of the Act because the domestic producers who support the Australia Petition account for at least 25 percent of the total production of the domestic like product. Second, the domestic producers have met the statutory criteria
for industry support under section 732(c)(4)(A)(ii) of the Act because the domestic producers who support the Australia Petition account for more than 50 percent of the production of the domestic like product produced by that portion of the industry expressing support for, or opposition to, the Australia Petition. Because the Petition established support from domestic producers accounting for more than 50 percent of the total production of the domestic like product, the Department is not required to take further action in order to evaluate industry support, e.g., polling. See section 732(c)(4)(D) of the Act. Accordingly, the Department determines that the Australia Petition was filed on behalf of the domestic industry within the meaning of section 732(b)(1) of the Act. See Australia Initiation Checklist at Attachment II.
With regard to the PRC Petition, based on information provided in the Petition, we determine that the domestic producers have met the statutory criteria for industry support under section 732(c)(4)(A)(i) of the Act because the domestic producers who support the PRC Petition account for at least 25 percent of the total production of the domestic like product. The Petition did not establish support from domestic producers accounting for more than 50 percent of the total production of the domestic like product, however, and the Department was required to take further action in order to evaluate industry support. See section 732(c)(4)(D) of the Act. In this case, the Department was able to rely on other information, in accordance with section 732(c)(4)(D)(i) of the Act, to determine industry support. See PRC Initiation Checklist at Attachment II. Based on information provided in the Petition and other submissions, the domestic producers have met the statutory criteria for industry support under section 732(c)(4)(A)(ii) of the Act because the domestic producers who support the PRC Petition account for more than 50 percent of the production of the domestic like product produced by that portion of the industry expressing support for, or opposition to, the PRC Petition. Accordingly, the Department determines that the PRC Petition was filed on behalf of the domestic industry within the meaning of section 732(b)(1) of the Act. See PRC Initiation Checklist at Attachment II.
The Department finds that the petitioner filed the Petitions on behalf of the domestic industry in accordance with section 732(c)(4)(A) of the Act. The petitioner is an interested party as defined in section 771(9)(C) of the Act and it has demonstrated sufficient
VerDate Aug<31>2005 17:00 Sep 14, 2007 Jkt 211001 PO 00000 Frm 00005 Fmt 4703 Sfmt 4703 E:\FR\FM\17SEN1.SGM 17SEN1jlent
ini o
n P
RO
D1P
C65
with
NO
TIC
ES
52852 Federal Register / Vol. 72, No. 179 / Monday, September 17, 2007 / Notices
industry support in favor of the initiation of the antidumping duty investigations. See Australia Initiation Checklist at Attachment II and PRC Initiation Checklist at Attachment II.
Allegations and Evidence of Material Injury and Causation
The petitioner alleges that the U.S. industry producing the domestic like product is being materially injured, or is threatened with material injury, by reason of the imports of the subject merchandise sold at less than normal value. The petitioner contends that the industry’s injured condition is illustrated by reduced market share, lost sales, smaller production, reduced capacity, a lower capacity–utilization rate, fewer shipments, underselling, price depression or suppression, lost revenue, decline in financial performance, and increase in import penetration. We have assessed the allegations and supporting evidence regarding material injury and causation, and we have determined that these allegations are properly supported by adequate evidence and meet the statutory requirements for initiation. See Australia Initiation Checklist at Attachment III and PRC Initiation Checklist at Attachment III.
Allegations of Sales at Less Than Fair Value
The following is a description of the allegations of sales at less than fair value upon which the Department based its decision to initiate investigations of imports of EMD from Australia and the PRC. The sources of data for the deductions and adjustments relating to U.S. price and normal value are discussed in greater detail in the Australia Initiation Checklist and PRC Initiation Checklist. We corrected certain information in the petitioner’s margin calculations and these corrections are set forth in detail in the Initiation Checklists. Should the need arise to use any of this information as facts available under section 776 of the Act, we will re–examine this information and may revise the margin calculations if appropriate.
Alleged U.S. Price and Normal Value: Australia
The petitioner calculated a single export price using the POI–average unit customs values (AUVs) for U.S. import data, as reported on the ITC’s Dataweb for the POI. The petitioner deducted an amount for foreign inland–freight costs. See Petition at Exhibit 11, Supplemental Responses at Exhibit R, and Australia Initiation Checklist.
In calculating the export price, the petitioner relied exclusively on AUV data with respect to U.S. imports from Australia under the HTSUS number 2820.10.00.00. This HTSUS number is a ‘‘basket category’’ as it includes both subject EMD and non–subject chemical manganese dioxide (CMD) and natural manganese dioxide (NMD). The petitioner used PIERS data to demonstrate that the imports under HTSUS number 2820.10.00.00 are in fact overwhelmingly subject merchandise because PIERS provides more specific product–identification information than official U.S. Census data as reported on the ITC’s Dataweb import statistics (Dataweb). See Petitions at Exhibit 10. In addition, the petitioner provided information that indicates that there are no producers of CMD or NMD in Australia and that the majority of imports under this HTSUS number are from a company that only produces EMD. See Petitions at Exhibit 3. Therefore, in this case, we find that the petitioner has provided information on the record that supports its position that the overwhelming percentage of the imports from Australia are, in fact, within the scope of the investigation. As such, we are able to conclude that most, if not all, of the imports from Australia under this HTSUS number are EMD and are, therefore, adequate figures upon which to base export prices for Australia.
With respect to normal value, the petitioner provided information that there were no sales in commercial quantities of EMD in the home market during the POI and that home–market prices were not reasonably available. Id. The petitioner proposed Japan as the largest third–country comparison market and demonstrated that Japan is a viable third–country market. See Petitions at Exhibit 15. The petitioner provided Global Trade Atlas EMD import data for exports from Australia into Japan and compared them with U.S. EMD import data for imports from Australia. According to these figures, the sales volume to Japan was greater than five percent of the sales volume to the United States. The petitioner compared third–country prices with an estimate of the cost of producing EMD in powder form by Delta EMD Australia Pty Ltd. (Delta). Because these data indicate that sales of EMD were made at prices below the product’s COP, the petitioner requests that the Department initiate a cost investigation of Delta.
The petitioner has provided information demonstrating reasonable grounds to believe or suspect that sales of EMD from Australia to Japan were made at prices below the fully absorbed
COP within the meaning of section 773(b) of the Act and has requested that the Department conduct a country–wide sales–below-cost investigation. See our analysis of the allegation below. An allegation of sales below cost in a petition does not need to be specific to individual exporters or producers. See, e.g., Statement of Administrative Action accompanying the Uruguay Round Agreements Act, H.R. Doc. No. 103 316, Vol. 1, at 833 (1994). Thus, the Department will consider allegations of below–cost sales in the aggregate for a foreign country. Id. Further, section 773(b)(2)(A) of the Act requires that the Department have ‘‘reasonable grounds to believe or suspect’’ that below–cost sales have occurred before initiating such an investigation. Reasonable grounds exist when an interested party provides specific factual information on costs and prices, observed or constructed, indicating that sales in the foreign market in question are at below– cost prices. See section 773(b)(2)(A)(i) of the Act.
The Department has calculated a country–specific COP for EMD in Australia. Based upon a comparison of sales prices of EMD in Japan and the country–specific cost of producing the product, we find reasonable grounds to believe or suspect that sales of EMD produced in Australia and sold in Japan were made at prices below the COP within the meaning of section 773(b)(2)(A)(i) of the Act. Accordingly, the Department is initiating a country– wide cost investigation with regard to sales of EMD from Australia to Japan. If we determine during the course of this investigation that the home market, i.e., Australia, is viable or that Japan is not the appropriate third–country market upon which to base normal value, our initiation of a country–wide cost investigation with respect to sales to Japan will be rendered moot. Because the petitioner alleged sales below cost pursuant to sections 773(a)(4), 773(b), and 773(e) of the Act, the petitioner also based normal value for sales of EMD on constructed value.
Pursuant to section 773(b)(3) of the Act, COP consists of the cost of manufacturing (COM), selling, general, and administrative expenses (SG&A), financial expenses, and packing expenses. To calculate the COM, the petitioner relied on its own costs during the 2006 fiscal year, adjusted for known differences between the costs in the United States and the costs in Australia. The petitioner obtained all of the cost differences between the United States and Australia that were used to calculate the COM from public sources. The petitioner used its own factory–
VerDate Aug<31>2005 17:00 Sep 14, 2007 Jkt 211001 PO 00000 Frm 00006 Fmt 4703 Sfmt 4703 E:\FR\FM\17SEN1.SGM 17SEN1jlent
ini o
n P
RO
D1P
C65
with
NO
TIC
ES
52853 Federal Register / Vol. 72, No. 179 / Monday, September 17, 2007 / Notices
overhead costs (FOH) as a conservative estimate of the Australian FOH. This is because the petitioner’s facilities are older than Delta’s and would thus likely have lower depreciation. Also, the petitioner states that, according to Delta’s annual report, it has limited production in Australia, which would increase Delta’s actual per–unit cost of FOH.
Because Delta’s unconsolidated financial statements were not reasonably available, the petitioner used the financial statements of an Australian zinc producer because, it asserts, zinc undergoes a production process similar to EMD. The petitioner calculated SG&A and profit ratios using the 2006 consolidated financial statements of Zinifex Ltd. (Zinifex), an Australian conglomerate that has mining, smelting, and alloy segments that produce zinc. The petitioner calculated a financial– expense ratio based on the 2006 consolidated financial statements of Delta’s parent company, Delta PLC. Where the petitioner used constructed value to determine normal value, it added an amount for profit from Zinifex’s financial statements.
We adjusted the petitioner’s calculation of SG&A and profit ratios by using information from Delta PLC’s consolidated financial statement pertinent to the Australian EMD segment of its business. We used Delta PLC’s financial records because these records included Delta’s actual costs of producing the merchandise under consideration. See Australia Initiation Checklist for a full description of the petitioner’s methodology and the adjustments we made to those calculations.
Alleged U.S. Price and Normal Value: The People’s Republic of China
The petitioner based its U.S. price calculation on the POI–AUVs of U.S. imports from the PRC under HTSUS number 2820.10.00.00, as reported on the ITC’s Dataweb for the POI. As noted above in the ‘‘Alleged U.S. Price and Normal Value: Australia’’ subsection, the petitioner demonstrated, using PIERS data, that the overwhelming percentage of the imports into the United States from the PRC were of subject EMD. The petitioner calculated an average Net U.S. Price for PRC alkaline–grade EMD by subtracting an estimate of foreign inland–freight costs from the AUV of imports for the POI. See PRC Initiation Checklist at 5.
Because the Department considers the PRC to be a non–market-economy country (NME), the petitioner constructed normal value based on the factors–of-production methodology
pursuant to section 773(c) of the Act. Recently, the Department examined the PRC’s market status and determined that NME status should continue for the PRC. See Memorandum from the Office of Policy to David M. Spooner, Assistant Secretary for Import Administration, Regarding the People’s Republic of China Status as a Non–Market Economy, dated August 30, 2006. (This document is available online at http:// ia.ita.doc.gov/download/prc–nme- status/prc–lined-paper–memo– 08302006.pdf.) In addition, in two recent investigations, the Department also determined that the PRC is an NME country. See Final Determination of Sales at Less Than Fair Value: Certain Activated Carbon from the People’s Republic of China, 72 FR 9508 (March 2, 2007), and Final Determination of Sales at Less Than Fair Value and Partial Affirmative Determination of Critical Circumstances: Certain Polyester Staple Fiber from the People’s Republic of China, 72 FR 19690 (April 19, 2007). In accordance with section 771(18)(C)(i) of the Act, the NME status remains in effect until revoked by the Department. The presumption of the NME status of the PRC has not been revoked by the Department and, therefore, remains in effect for purposes of the initiation of this investigation. Accordingly, the normal value of the product is based appropriately on factors of production valued in a surrogate market–economy country in accordance with section 773(c) of the Act. During the course of this investigation, all parties will have the opportunity to provide relevant information related to the issues of the PRC’s NME status and the granting of separate rates to individual exporters.
The petitioner asserts that India is the most appropriate surrogate country for the PRC because India is a significant producer of comparable merchandise and at a level of economic development comparable to the PRC. See Petition at 23. Based on the information provided by the petitioner, we believe that the petitioner’s use of India as a surrogate country is appropriate for purposes of initiating this investigation. After the initiation of the investigation, we will solicit comments regarding surrogate– country selection. Also, pursuant to 19 CFR 351.301(c)(3)(i), interested parties will be provided an opportunity to submit publicly available information to value the factors of production within 40 calendar days after the date of publication of the preliminary determination.
The petitioner provided dumping– margin calculations using the Department’s NME methodology as
required by 19 CFR 351.202(b)(7)(i)(C) and 19 CFR 351.408. The petitioner calculated normal value for the U.S. price discussed above based on its own consumption rates for producing alkaline–grade EMD which it stated should be similar to the consumption of PRC producers. The petitioner used its own consumption figures for the period covering July 1, 2006, through December 31, 2006. See Petitions at 23–24 and Exhibits 22 and 27, Attachment B. The petitioner states that, while the producer in the United States uses only manganese dioxide ore to produce EMD, producers in the PRC use both manganese dioxide ore and manganese carbonate ore to produce EMD. See Petitions at 23–24 and Exhibit 3. The petitioner explains, however, that, because it does not have reliable usage– rate data for PRC carbonate ore and because the petitioner reasonably believes that several producers/ exporters in the PRC use manganese dioxide ore to manufacture EMD, the petitioner’s allegations are based on its own usage rate for manganese dioxide ore. Id. The petitioner stated that it made no adjustments to the normal– value calculations because no known material differences exist between its production process in the United States and the manufacturing experience in the PRC. See Supplemental Responses at 8 and Exhibit A. Thus, the petitioner has assumed, for purposes of the Petitions, that producers in the PRC use the same inputs in the same quantities as those it uses.
For the normal–value calculations, pursuant to section 773(c)(4) of the Act, the petitioner used surrogate values from a variety of sources, including Monthly Statistics of Foreign Trade of India, Volumes I and II, Directorate General of Commercial Intelligence & Statistics (Monthly) (MSFTI), the Department’s NME Wage Rate for the PRC, the Department’s factor–valuation memoranda from other NME proceedings, and publicly available financial statements, to value the factor of production (FOP). See Petitions at 24 and Supplemental Responses at Exhibit G. The petitioner converted the inputs valued in Indian rupees to U.S. dollars based on the average rupee/U.S. dollar exchange rate for the POI, as reported on the Department’s website at http:// ia.ita.doc.gov/exchange/index.html. See Supplemental Responses at 4 and Exhibits F and G.
For manganese dioxide ore, the main raw material in the production of EMD, the petitioner provided a surrogate value based on the input price paid by Eveready Industries India, Ltd. (Eveready India), an Indian
VerDate Aug<31>2005 17:00 Sep 14, 2007 Jkt 211001 PO 00000 Frm 00007 Fmt 4703 Sfmt 4703 E:\FR\FM\17SEN1.SGM 17SEN1jlent
ini o
n P
RO
D1P
C65
with
NO
TIC
ES
52854 Federal Register / Vol. 72, No. 179 / Monday, September 17, 2007 / Notices
manufacturer of the subject merchandise, as reflected in Eveready India’s 2006 financial statements. See Petitions at 24, footnote 47. For other inputs, e.g., sulfuric acid, caustic soda, hydrogen sulfide, etc., the petitioner provided surrogate values based on pricing information from the World Trade Atlas. See Petitions at 24 and Supplemental Responses at Exhibits G and M. With regard to energy (electricity), the petitioner provided a surrogate value using the Department’s Factors of Production Valuation Memorandum for the Preliminary Results of Partial Rescission of the Fourth Antidumping Duty Administrative Review and Eighth New Shipper Review of Honey from the People’s Republic of China (December 21, 2006). See Petitions at Exhibit 21 and Supplemental Responses at Exhibit G. In addition, the petitioner provided a surrogate value for natural gas, a second energy source, using pricing information from the Gas Authority of India website. See Supplemental Responses at 5. Labor was valued using the expected wage rate for the PRC provided by the Department. See Petitions at 24 and Supplemental Responses at Exhibit G. Additionally, the petitioner explained that, where Indian surrogate values were not readily available and the costs of such factors were insignificant, it applied a ‘‘zero’’ value. See Petitions at 24 and Supplemental Responses at 5 and Exhibit G.
For the normal–value calculations, the petitioner derived the figures for FOH, SG&A, and profit from the financial ratios of Eveready India and Manganese Ore (India) Limited (MOIL), two Indian producers of merchandise that is either identical or similar to the domestic like product. The financial statements that the petitioner provided covered the period of April 2005 to March 2006. Additionally, the petitioner calculated a simple average of the two companies’ financial ratios for purposes of the Petition. Further, because Eveready India did not earn a profit while MOIL earned a profit, the petitioner calculated normal value using the profit ratio of MOIL, not Eveready India. See Supplemental Responses at 7 and Exhibit G.
Since Eveready India’s financial statement did not report a profit, we have determined not to use Eveready India in our calculation of surrogate financial ratios for purposes of this initiation. It is the Department’s practice to disregard financial statements with zero profit when there are financial statements of other surrogate companies that have earned profit on the record.
See Certain Frozen Warmwater Shrimp from the Socialist Republic of Vietnam: Final Results of the First Antidumping Administrative Review and First New Shipper Review (signed on September 5, 2007; expected publication on September 12, 2007, in the Federal Register) and the Accompanying Issues and Decision Memorandum at Comment 2, section B. Based on our review of the information contained in the Petitions, we recalculated the surrogate financial ratios for the PRC using MOIL’s financial information for material, labor, and energy (ML&E), FOH, SG&A, and profit. Although the petitioner calculated MOIL’s financial ratios based on MOIL’s consolidated financial statement, we calculated the ML&E, FOH, and profit ratios using the financial statement of MOIL’s EMD division. Because MOIL did not have specific information regarding SG&A, we continued to use the consolidated financial statement to calculate the surrogate SG&A expense. We then calculated the profit ratio using the EMD division values for ML&E and FOH (i.e., COM) plus the SG&A amount (calculated as the SG&A ratio times the COM), and the EMD division profit value. We did not make any other adjustment to the normal value as calculated by the petitioner.
Fair–Value Comparisons Based on the data provided by the
petitioner, there is reason to believe that imports of EMD from Australia and the PRC are being, or are likely to be, sold in the United States at less than fair value. Based on comparisons of export price to constructed value that we revised as discussed above and calculated in accordance with section 773(a)(4) of the Act, the estimated dumping margin for EMD from Australia is 52.94 percent. Based on comparisons of export price to normal value that we revised as discussed above and calculated in accordance with section 773(c) of the Act, the estimated dumping margin for EMD from the PRC is 133.76 percent.
Initiation of Antidumping Investigations
Based upon the examination of the Petitions on EMD from Australia and the PRC, we find that the Petitions meet the requirements of section 732 of the Act. Therefore, we are initiating antidumping duty investigations to determine whether imports of EMD from Australia and the PRC are being, or are likely to be, sold in the United States at less than fair value. In accordance with section 733(b)(1)(A) of the Act and 19 CFR 351.205((b)(1), unless
postponed, we will make our preliminary determinations no later than 140 days after the date of this initiation.
Separate Rates The Department modified the process
by which exporters and producers may obtain separate–rate status in NME investigations. See Policy Bulletin 05.1: Separate–Rates Practice and Application of Combination Rates in Antidumping Investigations involving Non–Market Economy Countries (April 5, 2005) (Separate Rates and Combination Rates Bulletin), available on the Department’s website at http://ia.ita.doc.gov/policy/ bull05–1.pdf. The process requires the submission of a separate–rate status application. Based on our experience in processing the separate–rate applications in the following antidumping duty investigations, we have modified the application for this investigation to make it more administrable and easier for applicants to complete. See, e.g., Initiation of Antidumping Duty Investigation: Certain New Pneumatic Off–the-Road Tires from the People’s Republic of China, 72 FR 43591, 43594–95 (August 6, 2007) (Tires from the PRC). The specific requirements for submitting the separate–rate application in this investigation are outlined in detail in the application itself, which will be available on the Department’s website at http://ia.ita.doc.gov/ia–highlights-and– news.html on the date of publication of this initiation notice in the Federal Register. The separate–rate application is due no later than November 9, 2007.
Respondent Selection and Quantity and Value Questionnaire
In prior NME investigations, it has been the Department’s practice to request quantity and value information from all known exporters identified in the PRC Petition. See, e.g., Tires from the PRC, 72 FR at 43595. For this investigation, because the HTSUS number 2820.10.00.00, as discussed above in the ‘‘Scope of the Investigation,’’ provides comprehensive coverage of imports of EMD, the Department expects to select respondents in this investigation based on U.S. Customs and Border Protection (CBP) data of U.S. imports under HTSUS number 2820.10.00.00 during the POI.
Use of Combination Rates in an NME Investigation
The Department will calculate combination rates for certain respondents that are eligible for a separate rate in this investigation. The
VerDate Aug<31>2005 17:00 Sep 14, 2007 Jkt 211001 PO 00000 Frm 00008 Fmt 4703 Sfmt 4703 E:\FR\FM\17SEN1.SGM 17SEN1jlent
ini o
n P
RO
D1P
C65
with
NO
TIC
ES
52855 Federal Register / Vol. 72, No. 179 / Monday, September 17, 2007 / Notices
1 Twenty days from the original deadline is September 9, 2007. However, Department practice dictates that where a deadline falls on a weekend, the appropriate deadline is the next business day. See Notice of Clarification: Application of ‘‘Next
Business Day’’ Rule for Administrative Determination Deadlines Pursuant to the Act, 70 FR 24533 (May 10, 2005).
Separate Rates and Combination Rates Bulletin, at 6, explains that, while continuing the practice of assigning separate rates only to exporters, all separate rates that the Department will now assign in its NME investigations will be specific to those producers that supplied the exporter during the POI. Note, however, that one rate is calculated for the exporter and all of the producers which supplied subject merchandise to it during the POI. This practice applies both to mandatory respondents receiving an individually calculated separate rate as well as the pool of non–investigated firms receiving the weighted–average of the individually calculated rates. This practice is referred to as the application of ‘‘combination rates’’ because such rates apply to specific combinations of exporters and one or more producers. The cash–deposit rate assigned to an exporter will apply only to merchandise both exported by the firm in question and produced by a firm that supplied the exporter during the POI.
Distribution of Copies of the Petitions
In accordance with section 732(b)(3)(A) of the Act, a copy of the public version of the Petitions has been provided to representatives of the governments of Australia and the PRC. We will attempt to provide a copy of the public version of the Petitions to all exporters named in the Petitions, as provided for in 19 CFR 351.203(c)(2).
ITC Notification
We have notified the ITC of our initiation, as required by section 732(d) of the Act.
Preliminary Determinations by the ITC
The ITC will preliminarily determine no later than October 9, 2007, whether there is a reasonable indication that imports of EMD from Australia and the PRC are materially injuring or threatening material injury to a U.S. industry. A negative ITC determination for any country will result in the investigation being terminated with respect to that country; otherwise, these investigations will proceed according to statutory and regulatory time limits.
This notice is issued and published pursuant to section 777(i) of the Act.
Dated: September 11, 2007.
Joseph A. Spetrini, Deputy Assistant Secretary for Import Administration. [FR Doc. E7–18257 Filed 9–14–07; 8:45 am]
BILLING CODE 3510–DS–S
DEPARTMENT OF COMMERCE
International Trade Administration
[A–570–918]
Steel Wire Garment Hangers from the People’s Republic of China: Initiation of Antidumping Duty Investigation
AGENCY: Import Administration, International Trade Administration, Department of Commerce. EFFECTIVE DATE: September 17, 2007. FOR FURTHER INFORMATION CONTACT: Julia Hancock or Irene Gorelik, AD/CVD Operations, Office 9, Import Administration, International Trade Administration, U.S. Department of Commerce, 14th Street and Constitution Avenue, NW, Washington, DC 20230; telephone: (202) 482–1394 or (202) 482– 6905, respectively. SUPPLEMENTARY INFORMATION:
The Petition
On July 31, 2007, the Department of Commerce (‘‘Department’’) received a petition concerning imports of steel wire garment hangers from the People’s Republic of China (‘‘PRC’’) (‘‘Petition’’) filed in proper form by M&B Metal Products Company, Inc. (‘‘Petitioner’’). In accordance with section 732(b) of the Tariff Act of 1930, as amended (‘‘Act’’), Petitioner alleges that imports of steel wire garment hangers from the PRC are being, or are likely to be, sold in the United States at less than fair value, within the meaning of section 731 of the Act, and that such imports are materially injuring, or threatening material injury to, an industry in the United States.
On August 3, 2007, the Department issued a request for additional information and clarification of certain areas of the Petition. Based on the Department’s request, Petitioner filed its response on August 8, 2007. On August 16, 2007, the Department issued polling questionnaires to the domestic industry. In addition, the Department extended the initiation deadline because, pursuant to section 732(c)(1)(B) of the Act, the Department determined that it needed to poll the domestic industry to determine support for the Petition. See Steel Wire Garment Hangers from the People’s Republic of China: Extension of the Deadline for Determining the Adequacy of the Antidumping Duty Petition, 72 FR 46606 (August 21, 2007) (‘‘Extension of Initiation Deadline’’).1
On August 17, 2007, the Department issued a second request for additional information and clarification of certain areas of the Petition, to which Petitioner responded on August 27, 2007.
The Department finds that Petitioner filed this Petition on behalf of the domestic industry because Petitioner is an interested party as defined in section 771(9)(C) and (D) of the Act, and has demonstrated sufficient industry support with respect to the antidumping duty investigation that Petitioner is requesting that the Department initiate (see ‘‘Determination of Industry Support for the Petition’’ section below). The period of investigation (‘‘POI’’) is January 1, 2007, through June 30, 2007. See 19 CFR 351.204(b).
Scope of Investigation
The merchandise that is subject to this investigation is steel wire garment hangers, fabricated from carbon steel wire, whether or not galvanized or painted, whether or not coated with latex or epoxy or similar gripping materials, and/or whether or not fashioned with paper covers or capes (with or without printing) and/or nonslip features such as saddles or tubes. These products may also be referred to by a commercial designation, such as shirt, suit, strut, caped, or latex (industrial) hangers. Specifically excluded from the scope of this investigation are wooden, plastic, and other garment hangers that are classified under separate subheadings of the Harmonized Tariff Schedule of the United States (‘‘HTSUS’’). The products subject to this investigation are currently classified under HTSUS subheading 7326.20.0020. Although the HTSUS subheading is provided for convenience and customs purposes, the written description of the merchandise is dispositive.
Comments on the Scope of Investigation
During our review of the Petition, we discussed the scope with Petitioner to ensure that it is an accurate reflection of the products for which the domestic industry is seeking relief. Moreover, as discussed in the preamble to the regulations, we are setting aside a period for interested parties to raise issues regarding product coverage. See Antidumping Duties; Countervailing Duties; Final Rule, 62 FR 27296, 27323 (May 19, 1997). The Department encourages all interested parties to submit such comments within 20 calendar days of signature of this notice.
VerDate Aug<31>2005 17:00 Sep 14, 2007 Jkt 211001 PO 00000 Frm 00009 Fmt 4703 Sfmt 4703 E:\FR\FM\17SEN1.SGM 17SEN1jlent
ini o
n P
RO
D1P
C65
with
NO
TIC
ES

B-1
APPENDIX B
CALENDAR OF PUBLIC CONFERENCE

CALENDAR OF PUBLIC CONFERENCE
Those listed below appeared as witnesses at the United States International Trade Commission’sconference:
Subject: Electrolytic Manganese Dioxide from Australia and ChinaInv. Nos.: 731-TA-1124 and 1125 (Preliminary)Date and Time: September 12, 2007 - 9:30 a.m.
The conference in connection with these investigations was held in the Main Hearing Room (room101), 500 E Street, SW, Washington, DC.
OPENING REMARKS:
Petitioners (Jack A. Levy, DLA Piper US LLP)Respondents (David Malamed, Gide Loyrette Nouel LLP)
In Support of the Imposition of Antidumping Duties:
DLA Piper US LLPWashington, DCon behalf of
Tronox LLC
Fredrick R. Stater, Plant Manager, EMD Operation, Tronox LLCPaul Gutwald, General Manager, Electrolytic Division, Tronox LLCDr. Richard L. Boyce, Econometrica International Inc.
Jack A. Levy, Esq. )Martin Schaefermeier, Esq. ) – OF COUNSELJames A. Earl, Esq. )
B-3
In Opposition to the Imposition of Antidumping Duties:
Gide Loyrette Nouel LLPNew York, NYon behalf of
Delta EMD Australia (Pty) Limited
Ashley Moore, General Manager, Sales and Supply Chain, Delta EMD Australia (Pty) LimitedDr. John Reilly, Nathan Associates, Inc.
David Malamed, Esq. )Erwan Berthelot, Esq. ) – OF COUNSELAlison L. Moore, Esq. )
Barnes, Richardson & ColburnWashington, DCon behalf of
Spectrum Brands, Inc.
Matthew McGrath, Esq. – OF COUNSEL
Vinson & Elkins LLPWashington, DCon behalf of
Panasonic Primary Battery Corp. of America
William Stevens, Director - Materials Panasonic Primary Battery Corp. of America
James P. Durling, Esq. – OF COUNSEL
REBUTTAL/CLOSING REMARKS:
Petitioners (Jack A. Levy, DLA Piper US LLP)Respondents (David Malamed, Gide Loyrette Nouel LLP) Respondents (Dr. John Reilly, Nathan Associates, Inc.)
B-4

C-1
APPENDIX C
SUMMARY DATA


Table C-1EMD: Summary data concerning the U.S. market, 2004-06, January-June 2006, and January-June 2007
(Quantity=short tons, value=1,000 dollars, unit values, unit labor costs, and unit expenses are per short ton; period changes=percent, except where noted)Reported data Period changes
January-June Jan.-JuneItem 2004 2005 2006 2006 2007 2004-06 2004-05 2005-06 2006-07
U.S. consumption quantity: Amount . . . . . . . . . . . . . . . . . . . . 99,277 106,874 96,175 45,862 44,208 -3.1 7.7 -10.0 -3.6 Producers' share (1) . . . . . . . . . 69.0 66.1 64.3 66.6 62.0 -4.7 -2.8 -1.9 -4.6 Importers' share (1): Australia . . . . . . . . . . . . . . . . . . *** *** *** *** *** *** *** *** *** China . . . . . . . . . . . . . . . . . . . . *** *** *** *** *** *** *** *** *** Subtotal . . . . . . . . . . . . . . . . . *** *** *** *** *** *** *** *** *** All other sources . . . . . . . . . . . *** *** *** *** *** *** *** *** *** Total imports . . . . . . . . . . . . . 31.0 33.9 35.7 33.4 38.0 4.7 2.8 1.9 4.6
U.S. consumption value: Amount . . . . . . . . . . . . . . . . . . . . 128,464 138,958 131,121 62,262 58,853 2.1 8.2 -5.6 -5.5 Producers' share (1) . . . . . . . . . 70.1 68.2 67.4 69.9 65.8 -2.6 -1.8 -0.8 -4.0 Importers' share (1): Australia . . . . . . . . . . . . . . . . . . *** *** *** *** *** *** *** *** *** China . . . . . . . . . . . . . . . . . . . . *** *** *** *** *** *** *** *** *** Subtotal . . . . . . . . . . . . . . . . . *** *** *** *** *** *** *** *** *** All other sources . . . . . . . . . . . *** *** *** *** *** *** *** *** *** Total imports . . . . . . . . . . . . . 29.9 31.8 32.6 30.1 34.2 2.6 1.8 0.8 4.0
U.S. shipments of imports from: Australia: Quantity . . . . . . . . . . . . . . . . . . *** *** *** *** *** *** *** *** *** Value . . . . . . . . . . . . . . . . . . . . *** *** *** *** *** *** *** *** *** Unit value . . . . . . . . . . . . . . . . . *** *** *** *** *** *** *** *** *** Ending inventory quantity . . . . . *** *** *** *** *** *** *** *** *** China: Quantity . . . . . . . . . . . . . . . . . . *** *** *** *** *** *** *** *** *** Value . . . . . . . . . . . . . . . . . . . . *** *** *** *** *** *** *** *** *** Unit value . . . . . . . . . . . . . . . . . *** *** *** *** *** *** *** *** *** Ending inventory quantity . . . . . *** *** *** *** *** *** *** *** *** Subtotal: Quantity . . . . . . . . . . . . . . . . . . *** *** *** *** *** *** *** *** *** Value . . . . . . . . . . . . . . . . . . . . *** *** *** *** *** *** *** *** *** Unit value . . . . . . . . . . . . . . . . . *** *** *** *** *** *** *** *** *** Ending inventory quantity . . . . . *** *** *** *** *** *** *** *** *** All other sources: Quantity . . . . . . . . . . . . . . . . . . *** *** *** *** *** *** *** *** *** Value . . . . . . . . . . . . . . . . . . . . *** *** *** *** *** *** *** *** *** Unit value . . . . . . . . . . . . . . . . . *** *** *** *** *** *** *** *** *** Ending inventory quantity . . . . . *** *** *** *** *** *** *** *** *** All sources: Quantity . . . . . . . . . . . . . . . . . . 30,805 36,189 34,355 15,298 16,778 11.5 17.5 -5.1 9.7 Value . . . . . . . . . . . . . . . . . . . . 38,448 44,134 42,683 18,768 20,116 11.0 14.8 -3.3 7.2 Unit value . . . . . . . . . . . . . . . . . $1,248 $1,220 $1,242 $1,227 $1,199 -0.5 -2.3 1.9 -2.3 Ending inventory quantity . . . . . 5,709 11,638 14,963 11,826 12,989 162.1 103.9 28.6 9.8
Table continued on next page.
C-3
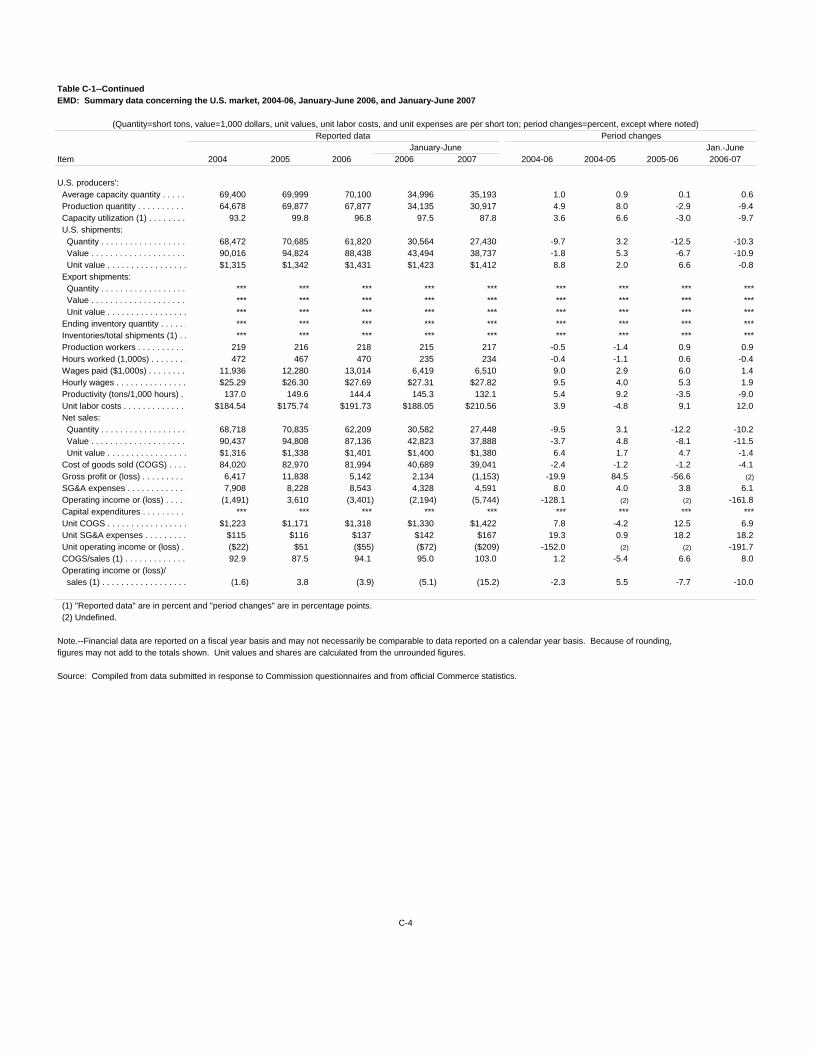
Table C-1--ContinuedEMD: Summary data concerning the U.S. market, 2004-06, January-June 2006, and January-June 2007
(Quantity=short tons, value=1,000 dollars, unit values, unit labor costs, and unit expenses are per short ton; period changes=percent, except where noted)Reported data Period changes
January-June Jan.-JuneItem 2004 2005 2006 2006 2007 2004-06 2004-05 2005-06 2006-07
U.S. producers': Average capacity quantity . . . . . 69,400 69,999 70,100 34,996 35,193 1.0 0.9 0.1 0.6 Production quantity . . . . . . . . . . 64,678 69,877 67,877 34,135 30,917 4.9 8.0 -2.9 -9.4 Capacity utilization (1) . . . . . . . . 93.2 99.8 96.8 97.5 87.8 3.6 6.6 -3.0 -9.7 U.S. shipments: Quantity . . . . . . . . . . . . . . . . . . 68,472 70,685 61,820 30,564 27,430 -9.7 3.2 -12.5 -10.3 Value . . . . . . . . . . . . . . . . . . . . 90,016 94,824 88,438 43,494 38,737 -1.8 5.3 -6.7 -10.9 Unit value . . . . . . . . . . . . . . . . . $1,315 $1,342 $1,431 $1,423 $1,412 8.8 2.0 6.6 -0.8 Export shipments: Quantity . . . . . . . . . . . . . . . . . . *** *** *** *** *** *** *** *** *** Value . . . . . . . . . . . . . . . . . . . . *** *** *** *** *** *** *** *** *** Unit value . . . . . . . . . . . . . . . . . *** *** *** *** *** *** *** *** *** Ending inventory quantity . . . . . . *** *** *** *** *** *** *** *** *** Inventories/total shipments (1) . . *** *** *** *** *** *** *** *** *** Production workers . . . . . . . . . . 219 216 218 215 217 -0.5 -1.4 0.9 0.9 Hours worked (1,000s) . . . . . . . . 472 467 470 235 234 -0.4 -1.1 0.6 -0.4 Wages paid ($1,000s) . . . . . . . . 11,936 12,280 13,014 6,419 6,510 9.0 2.9 6.0 1.4 Hourly wages . . . . . . . . . . . . . . . $25.29 $26.30 $27.69 $27.31 $27.82 9.5 4.0 5.3 1.9 Productivity (tons/1,000 hours) . 137.0 149.6 144.4 145.3 132.1 5.4 9.2 -3.5 -9.0 Unit labor costs . . . . . . . . . . . . . $184.54 $175.74 $191.73 $188.05 $210.56 3.9 -4.8 9.1 12.0 Net sales: Quantity . . . . . . . . . . . . . . . . . . 68,718 70,835 62,209 30,582 27,448 -9.5 3.1 -12.2 -10.2 Value . . . . . . . . . . . . . . . . . . . . 90,437 94,808 87,136 42,823 37,888 -3.7 4.8 -8.1 -11.5 Unit value . . . . . . . . . . . . . . . . . $1,316 $1,338 $1,401 $1,400 $1,380 6.4 1.7 4.7 -1.4 Cost of goods sold (COGS) . . . . 84,020 82,970 81,994 40,689 39,041 -2.4 -1.2 -1.2 -4.1 Gross profit or (loss) . . . . . . . . . 6,417 11,838 5,142 2,134 (1,153) -19.9 84.5 -56.6 (2)
SG&A expenses . . . . . . . . . . . . . 7,908 8,228 8,543 4,328 4,591 8.0 4.0 3.8 6.1 Operating income or (loss) . . . . . (1,491) 3,610 (3,401) (2,194) (5,744) -128.1 (2) (2) -161.8 Capital expenditures . . . . . . . . . *** *** *** *** *** *** *** *** *** Unit COGS . . . . . . . . . . . . . . . . . $1,223 $1,171 $1,318 $1,330 $1,422 7.8 -4.2 12.5 6.9 Unit SG&A expenses . . . . . . . . . $115 $116 $137 $142 $167 19.3 0.9 18.2 18.2 Unit operating income or (loss) . ($22) $51 ($55) ($72) ($209) -152.0 (2) (2) -191.7 COGS/sales (1) . . . . . . . . . . . . . 92.9 87.5 94.1 95.0 103.0 1.2 -5.4 6.6 8.0 Operating income or (loss)/ sales (1) . . . . . . . . . . . . . . . . . . (1.6) 3.8 (3.9) (5.1) (15.2) -2.3 5.5 -7.7 -10.0
(1) "Reported data" are in percent and "period changes" are in percentage points. (2) Undefined.
Note.--Financial data are reported on a fiscal year basis and may not necessarily be comparable to data reported on a calendar year basis. Because of rounding,figures may not add to the totals shown. Unit values and shares are calculated from the unrounded figures.
Source: Compiled from data submitted in response to Commission questionnaires and from official Commerce statistics.
C-4
C-5
Table C-2EMD: Summary data concerning the U.S. commercial market, 2004-06, January-June 2006, andJanuary-June 2007
* * * * * * *

D-1
APPENDIX D
QUESTIONNAIRE SELLING PRICE DATAFOR THE SPECIFIED EMD PRODUCT CATEGORY 1IMPORTED FROM NONSUBJECT COUNTRIES AND
PRODUCED IN THE UNITED STATES

D-3
Table D-1EMD: Net weighted-average U.S. f.o.b. selling prices and quantities of EMD product category 1 produced domestically and imported from South Africa, by quarters, January 2004-June 2007
* * * * * * *