Embed Size (px)
Citation preview
U.S. International Trade Commission
Publication 4506 December 2014
Washington, DC 20436
Electrolytic Manganese Dioxide from Australia and China
Investigation Nos. 731-TA-1124 and 1125 (Review)
U.S. International Trade Commission
COMMISSIONERS
Meredith M. Broadbent, Chairman Dean A. Pinkert, Vice Chairman
Irving A. Williamson David S. Johanson
F. Scott Kieff Rhonda K. Schmidtlein
Karen Laney
Staff assigned
Address all communications to Secretary to the Commission
United States International Trade Commission Washington, DC 20436
Acting Director of Operations
Cynthia Trainor, Investigator Christopher Robinson, Industry Analyst
Michele Breaux, Economist James Fetzer, Economist
Andrew Knipe, Economist Amelia Preece, Economist
David Boyland, Accountant Waleed Navarro, Statistician Russell Duncan, Statistician
Darlene Smith, Statistical Assistant Courtney McNamara, Attorney
Marc Bernstein, Attorney Karl von Schriltz, Attorney
James McClure, Supervisory Investigator
U.S. International Trade Commission
Washington, DC 20436 www.usitc.gov
Publication 4506 December 2014
Electrolytic Manganese Dioxide from Australia and China
Investigation Nos. 731-TA-1124 and 1125 (Review)

CONTENTS Page
i
Determinations ............................................................................................................................... 1
Views of the Commission ............................................................................................................... 3
Part I: Introduction ................................................................................................................ I‐1
Background ................................................................................................................................ I‐1
The original investigations ..................................................................................................... I‐2
Related investigations ............................................................................................................... I‐2
Summary data ........................................................................................................................... I‐4
Statutory criteria ................................................................................................................... I‐4
Organization of report ........................................................................................................... I‐6
Commerce’s reviews ................................................................................................................. I‐6
Administrative reviews .......................................................................................................... I‐6
Five‐year reviews ................................................................................................................... I‐6
The subject merchandise .......................................................................................................... I‐7
Commerce’s scope ................................................................................................................ I‐7
Tariff treatment ..................................................................................................................... I‐7
The product ............................................................................................................................... I‐8
Description and applications ................................................................................................. I‐8
Manufacturing processes .................................................................................................... I‐10
Domestic like product issues ................................................................................................... I‐11
U.S. market participants .......................................................................................................... I‐11
U.S. producers ..................................................................................................................... I‐11
U.S. importers ...................................................................................................................... I‐12
U.S. purchasers .................................................................................................................... I‐13
Apparent U.S. consumption .................................................................................................... I‐13
U.S. market shares .................................................................................................................. I‐14
CONTENTS Page
ii
Part II: Conditions of competition in the u.s. market ............................................................ II‐1
U.S. market characteristics ....................................................................................................... II‐1
Channels of distribution ........................................................................................................... II‐1
Geographic distribution ........................................................................................................... II‐1
Supply and demand considerations ......................................................................................... II‐2
U.S. supply ............................................................................................................................ II‐2
U.S. demand ......................................................................................................................... II‐5
Substitutability issues ............................................................................................................... II‐7
Lead times ............................................................................................................................ II‐7
Knowledge of country sources ............................................................................................. II‐8
Factors affecting purchasing decisions................................................................................. II‐8
Comparisons of domestic products, subject imports, and nonsubject imports ................ II‐11
Comparison of U.S.‐produced and imported EMD ............................................................ II‐12
Elasticity estimates ................................................................................................................. II‐14
U.S. supply elasticity ........................................................................................................... II‐15
U.S. demand elasticity ........................................................................................................ II‐15
Substitution elasticity ......................................................................................................... II‐15
CONTENTS Page
iii
Part III: Condition of the U.S. industry ................................................................................. III‐1
Overview ................................................................................................................................. III‐1
Changes experienced by the industry ................................................................................. III‐1
Anticipated changes in operations ...................................................................................... III‐1
U.S. production, capacity, and capacity utilization ................................................................. III‐1
Constraints on capacity ....................................................................................................... III‐2
U.S. producers’ U.S. shipments and exports ........................................................................... III‐2
U.S. producers’ inventories ..................................................................................................... III‐3
U.S. producers’ imports and purchases .................................................................................. III‐3
U.S. employment, wages, and productivity ............................................................................ III‐4
Financial experience of U.S. producers ................................................................................... III‐5
Background .......................................................................................................................... III‐5
Operations on EMD ............................................................................................................. III‐6
Capital expenditures and research and development expenses ...................................... III‐10
CONTENTS Page
iv
Part IV: U.S. imports and the foreign industries ................................................................... IV‐1
U.S. imports ............................................................................................................................. IV‐1
Overview .............................................................................................................................. IV‐1
Imports from subject and nonsubject countries ................................................................. IV‐1
U.S. importers’ imports subsequent to December 31, 2013 .................................................. IV‐3
Cumulation considerations ..................................................................................................... IV‐4
Subject country producers ...................................................................................................... IV‐5
The industry in Australia ......................................................................................................... IV‐5
Overview .............................................................................................................................. IV‐5
Operations on EMD ............................................................................................................. IV‐5
The industry in cHINA .............................................................................................................. IV‐7
Overview .............................................................................................................................. IV‐7
Operations on EMD ............................................................................................................. IV‐7
Production capacity ............................................................................................................. IV‐9
Consumption ..................................................................................................................... IV‐10
Foreign Demand ................................................................................................................ IV‐14
Foreign Prices .................................................................................................................... IV‐15
Part V: Pricing data ............................................................................................................... V‐1
Factors affecting prices ............................................................................................................ V‐1
Raw material costs ............................................................................................................... V‐1
U.S. inland transportation costs ........................................................................................... V‐2
Pricing practices ....................................................................................................................... V‐3
Pricing methods .................................................................................................................... V‐3
Sales terms and discounts .................................................................................................... V‐3
Price leadership .................................................................................................................... V‐3
Price data .................................................................................................................................. V‐4
Price trends ........................................................................................................................... V‐4
CONTENTS Page
v
Appendixes
A. Federal Register notices ................................................................................................. A‐1
B. List of hearing witnesses ............................................................................................... B‐1
C. Summary data ................................................................................................................ C‐1
D. Comments on the significance of the existing antidumping duty orders and the likely
effects of revocation ....................................................................................................... D‐1
E. The U.S. industry’s financial results without input adjustment for related party profit
or loss .............................................................................................................................. E‐1
Note.—Information that would reveal confidential operations of individual concerns may not
be published and therefore has been deleted. Such deletions are indicated by asterisks.

UNITED STATES INTERNATIONAL TRADE COMMISSION
Investigation Nos. 731‐TA‐1124 and 1125 (Review)
ELECTROLYTIC MANGANESE DIOXIDE FROM AUSTRALIA AND CHINA
DETERMINATIONS
On the basis of the record1 developed in the subject five‐year review, the United States International Trade Commission (Commission) determines, pursuant to section 751(c) of the Tariff Act of 1930 (19 U.S.C. ' 1675(c)), that revocation of the antidumping duty order on electrolytic manganese dioxide (“EMD”) from Australia would not be likely to lead to continuation or recurrence of material injury to an industry in the United States within a reasonably foreseeable time and that revocation of the antidumping duty order on EMD from China would be likely to lead to continuation or recurrence of material injury within a reasonably foreseeable time.
BACKGROUND
The Commission instituted these reviews on September 3, 2013 (78 F.R. 54269) and
determined on December 20, 2013 that it would conduct full reviews (79 F.R. 30163, May 27, 2014).2 Notice of the scheduling of the Commission=s reviews and of a public hearing to be held in connection therewith was given by posting copies of the notice in the Office of the Secretary, U.S. International Trade Commission, Washington, DC, and by publishing the notice in the Federal Register on May 27, 2014 (79 F.R. 30163). The hearing was held in Washington, DC, on October 21, 2014, and all persons who requested the opportunity were permitted to appear in person or by counsel.
1 The record is defined in sec. 207.2(f) of the Commission=s Rules of Practice and Procedure (19 CFR ' 207.2(f)).
2 Commissioners David S. Johanson, Meredith M. Broadbent, and F. Scott Kieff concluded that the domestic group responses for these reviews were adequate and that the respondent group responses were inadequate, but that circumstances warranted full reviews. Then‐Chairman Irving A. Williamson, then‐Commissioner Shara L. Aranoff, and Commissioner Dean A. Pinkert concluded that the domestic group responses for these reviews were adequate and that the respondent group responses were inadequate and voted for expedited reviews.

3
Views of the Commission
Based on the record in these five‐year reviews, we determine under section 751(c) of the Tariff Act of 1930, as amended (“the Tariff Act”), that revocation of the antidumping duty order on electrolytic manganese dioxide (“EMD”) from China would be likely to lead to continuation or recurrence of material injury to an industry in the United States within a reasonably foreseeable time. We also determine that revocation of the antidumping duty order on EMD from Australia would not be likely to lead to continuation or recurrence of material injury to an industry in the United States within a reasonably foreseeable time.
Background I.
On September 12, 2008, the Commission determined that a domestic industry was materially injured by reason of less than fair value (“LTFV”) imports of EMD from Australia and China.1 Commerce published the antidumping duty orders on subject imports of EMD from Australia and China on October 7, 2008.2
The Commission instituted these reviews on September 3, 2013.3 The Commission found the domestic interested party group response to the notice of institution to be adequate and the respondent interested party group response to be inadequate.4 The Commission nevertheless determined that other circumstances warranted the conduct of full reviews.5
Domestic interested parties participating in the reviews were domestic producers Tronox LLC (“Tronox”) and Erachem Comilog, Inc. (“Erachem”), which jointly responded to the notice of institution, filed briefs, and participated in the hearing. No respondent interested party responded to the notice of institution, filed briefs, or participated in the hearing.
Domestic Like Product and Industry II.
A. Domestic Like Product
In making its determination under section 751(c) of the Tariff Act, the Commission defines the “domestic like product” and the “industry.”6 The Tariff Act defines “domestic like
1 Electrolytic Manganese Dioxide from Australia and China, Inv. Nos. 731‐TA‐1124 and 1125 (Final), USITC Pub. 4036 (Sept. 2008) (“Original Determinations”).
2 Antidumping Duty Order: Electrolytic Manganese Dioxide from Australia, 73 Fed. Reg. 58538 (Oct. 7, 2008); Antidumping Duty Order: Electrolytic Manganese Dioxide from China, 73 Fed. Reg. 58537 (Oct. 7, 2008).
3 78 Fed. Reg. 54269 (Sept. 3, 2013). 4 79 Fed. Reg. 30163 (May 27, 2014). 5 79 Fed. Reg. 30163 (May 27, 2014); see also Explanation for Commission Determinations on
Adequacy in Electrolytic Manganese Dioxide from Australia and China, Inv. Nos. 731‐TA‐1124‐1125 (Review) (EDIS# 525369).
6 19 U.S.C. § 1677(4)(A).
4
product” as “a product which is like, or in the absence of like, most similar in characteristics and uses with, the article subject to an investigation under this subtitle.”7 The Commission’s practice in five‐year reviews is to examine the domestic like product definition from the original investigation and consider whether the record indicates any reason to revisit the prior findings.8
Commerce has defined the imported merchandise within the scope of the orders under review as follows:
The merchandise covered by these orders includes all manganese dioxide (MnO2) that has been manufactured in an electrolysis process, whether in powder, chip, or plate form. Excluded from the scope are natural manganese dioxide (NMD) and chemical manganese dioxide (CMD). The merchandise subject to these orders is classified in the Harmonized Tariff Schedule of the United States (“HTSUS”) at subheading 2820.10.00.00. While the HTSUS subheading is provided for convenience and customs purposes, the written description of the scope of these orders is dispositive.9
The scope of these reviews is identical to the scope of the original investigations. EMD is a black powder (or plate or chip that will be ground into powder) that has a gamma crystalline structure and is used almost exclusively in the cathode of dry‐cell batteries.10 There are three grades of EMD – alkaline, lithium, and zinc‐chloride. All types and grades of EMD are produced by the same general process.11 Almost all EMD produced and consumed in the United States is of the alkaline grade.12 Within each grade of EMD, the quality of EMD may vary, with the higher quality EMD used in AA/AAA type batteries, and the lower quality grade used in C/D batteries.13 All new suppliers of EMD must be qualified by the battery manufacturer before their EMD can be used in a specific battery.14 Almost all EMD is sold
7 19 U.S.C. § 1677(10); see, e.g., Cleo Inc. v. United States, 501 F.3d 1291, 1299 (Fed. Cir. 2007); NEC Corp. v. Department of Commerce, 36 F. Supp. 2d 380, 383 (Ct. Int’l Trade 1998); Nippon Steel Corp. v. United States, 19 CIT 450, 455 (1995); Timken Co. v. United States, 913 F. Supp. 580, 584 (Ct. Int’l Trade 1996); Torrington Co. v. United States, 747 F. Supp. 744, 748‐49 (Ct. Int’l Trade 1990), aff’d, 938 F.2d 1278 (Fed. Cir. 1991); see also S. Rep. No. 249, 96th Cong., 1st Sess. 90‐91 (1979).
8 See, e.g., Internal Combustion Industrial Forklift Trucks from Japan, Inv. No. 731‐TA‐377 (Second Review), USITC Pub. 3831 at 8‐9 (Dec. 2005); Crawfish Tail Meat from China, Inv. No. 731‐TA‐752 (Review), USITC Pub. 3614 at 4 (July 2003); Steel Concrete Reinforcing Bar from Turkey, Inv. No. 731‐TA‐745 (Review), USITC Pub. 3577 at 4 (Feb. 2003).
9 Electrolytic Manganese Dioxide From Australia and the People's Republic of China: Final Results of the Expedited First Sunset Reviews of the Antidumping Duty Orders, 79 Fed. Reg. 6162 (Feb. 3, 2014).
10 Confidential Report (“CR”) at I‐15‐16; Public Report (“PR”) at I‐8. 11 CR at I‐16; PR at I‐9. 12 CR at I‐16; PR at I‐9. 13 CR at I‐16, 18; PR at I‐9‐10. 14 CR at I‐18, II‐15; PR at II‐10.
5
directly or indirectly through an importer or producers’ sales representatives to end users (battery manufacturers).15
1. The Original Investigations
In the original investigations, the Commission defined the domestic like product to be coextensive with Commerce’s scope. The Commission found that no significant differences existed among the several grades of EMD with respect to physical characteristics, uses, production processes, or channels of distribution.16
2. These Reviews
In these reviews, the domestic interested parties agree with the domestic like product definition from the original investigations,17 and there is no new information on the record of these reviews that would warrant the Commission’s reconsideration of that definition.18 Accordingly, we define the domestic like product as all EMD within the scope.
B. Domestic Industry and Related Parties
Section 771(4)(A) of the Tariff Act defines the relevant industry as the domestic “producers as a whole of a domestic like product, or those producers whose collective output of a domestic like product constitutes a major proportion of the total domestic production of the product.”19 In defining the domestic industry, the Commission’s general practice has been to include in the industry producers of all domestic production of the like product, whether toll‐produced, captively consumed, or sold in the domestic merchant market.
We must determine whether any producer of the domestic like product should be excluded from the domestic industry pursuant to section 771(4)(B) of the Tariff Act. This provision allows the Commission, if appropriate circumstances exist, to exclude from the domestic industry producers that are related to an exporter or importer of subject merchandise or which are themselves importers.20 Exclusion of such a producer is within the Commission’s discretion based upon the facts presented in each investigation.21
15 CR/PR at II‐1, Table II‐1. 16 Original Determinations, USITC Pub. 4036 at 5. The parties did not dispute the definition of
the domestic like product in either the preliminary phase or final phase investigations. 17 Domestic Interested Parties’ Prehearing Brief at 9‐10. 18 See generally, CR at I‐15‐21; PR at I‐7‐11. 19 19 U.S.C. § 1677(4)(A). The definitions in 19 U.S.C. § 1677 are applicable to the entire subtitle
containing the antidumping and countervailing duty laws, including 19 U.S.C. §§ 1675 and 1675a. See 19 U.S.C. § 1677.
20 See Torrington Co. v. United States, 790 F. Supp. 1161, 1168 (Ct. Int’l Trade 1992), aff’d without opinion, 991 F.2d 809 (Fed. Cir. 1993); Sandvik AB v. United States, 721 F. Supp. 1322, 1331‐32 (Continued…)
6
1. The Original Investigations
In the original investigations the Commission found that one of the three domestic producers of EMD was a related party, but appropriate circumstances did not exist to exclude that producer from the domestic industry because its principal interest was in domestic production rather than importation.22 The Commission therefore defined the domestic industry as consisting of all domestic producers of the domestic like product.23
2. These Reviews
In these reviews, *** qualifies as a related party because ***.24 We find that appropriate circumstances do not exist to exclude *** as a related party, however, because ***.25 Nor is there any evidence or allegation that *** benefitted from its relationship with ***. Accordingly, we define the domestic industry as all domestic producers of EMD, including Energizer, Erachem, and Tronox.26
Cumulation III.
A. Legal Standard
With respect to five‐year reviews, section 752(a) of the Tariff Act provides as follows: the Commission may cumulatively assess the volume and effect of imports of the subject merchandise from all countries with respect to which reviews under section 1675(b) or (c) of this title were initiated on the same day, if such imports would be likely to compete with each other and with domestic like products in the United States market. The Commission shall not cumulatively assess the volume and effects of imports of the subject merchandise in a case in which it
(…Continued) (Ct. Int’l Trade 1989), aff’d mem., 904 F.2d 46 (Fed. Cir. 1990); Empire Plow Co. v. United States, 675 F. Supp. 1348, 1352 (Ct. Int’l Trade 1987).
21 The primary factors the Commission has examined in deciding whether appropriate circumstances exist to exclude a related party include the following:
(1) the percentage of domestic production attributable to the importing producer; (2) the reason the U.S. producer has decided to import the product subject to investigation, i.e.,
whether the firm benefits from the LTFV sales or subsidies or whether the firm must import in order to enable it to continue production and compete in the U.S. market; and
(3) the position of the related producer vis‐à‐vis the rest of the industry, i.e., whether inclusion or exclusion of the related party will skew the data for the rest of the industry. See, e.g.,Torrington Co. v. United States, 790 F. Supp. at 1168.
22 Original Determinations, USITC Pub. 4036 at 6‐7. 23 Original Determinations, USITC Pub. 4036 at 7. 24 CR/PR at Table I‐5 n.2. 25 CR at III‐12 & n.9; PR at III‐3 & n.9 (***). 26 CR/PR at Table I‐5.
7
determines that such imports are likely to have no discernible adverse impact on the domestic industry.27
Cumulation therefore is discretionary in five‐year reviews, unlike original investigations, which are governed by section 771(7)(G)(i) of the Tariff Act.28 The Commission may exercise its discretion to cumulate, however, only if the reviews are initiated on the same day, the Commission determines that the subject imports are likely to compete with each other and the domestic like product in the U.S. market, and imports from each such subject country are not likely to have no discernible adverse impact on the domestic industry in the event of revocation. Our focus in five‐year reviews is not only on present conditions of competition, but also on likely conditions of competition in the reasonably foreseeable future. In the original investigations, the Commission found that there was a reasonable overlap of competition between the domestic like product and subject imports from Australia and China, and between subject imports from Australia and China. The Commission therefore determined to cumulate subject imports from Australia and China for its analysis of material injury by reason of subject imports.29
In these reviews, the statutory threshold for cumulation is satisfied because both reviews were initiated on September 3, 2013.30 Based on the record of the reviews, however, we find that subject imports from Australia would be likely to have no discernible adverse impact on the domestic industry were the antidumping duty order on EMD from Australia revoked. Consequently, we are precluded from cumulating subject imports from Australia and China.
B. Likelihood of No Discernible Adverse Impact
The statute precludes cumulation if the Commission finds that subject imports from a country are likely to have no discernible adverse impact on the domestic industry.31 Neither the statute nor the Uruguay Round Agreements Act (“URAA”) Statement of Administrative Action (“SAA”) provides specific guidance on what factors the Commission is to consider in determining that imports “are likely to have no discernible adverse impact” on the domestic
27 19 U.S.C. § 1675a(a)(7). 28 19 U.S.C. § 1677(7)(G)(i); see also, e.g., Nucor Corp. v. United States, 601 F.3d 1291, 1293 (Fed.
Cir. 2010) (Commission may reasonably consider likely differing conditions of competition in deciding whether to cumulate subject imports in five‐year reviews); Allegheny Ludlum Corp. v. United States, 475 F. Supp. 2d 1370, 1378 (Ct. Int’l Trade 2006) (recognizing the wide latitude the Commission has in selecting the types of factors it considers relevant in deciding whether to exercise discretion to cumulate subject imports in five‐year reviews); Nucor Corp. v. United States, 569 F. Supp. 2d 1328, 1337‐38 (Ct. Int’l Trade 2008).
29Original Determinations, USITC Pub. 4036 at 8. 30 CR at I‐1; PR at I‐1. 31 19 U.S.C. § 1675a(a)(7).
8
industry.32 With respect to this provision, the Commission generally considers the likely volume of subject imports and the likely impact of those imports on the domestic industry within a reasonably foreseeable time if the orders are revoked. Our analysis for each of the subject countries takes into account, among other things, the nature of the product and the behavior of subject imports in the original investigations.
We find that subject imports from Australia would be likely to have no discernible adverse impact on the domestic industry if the antidumping duty order on EMD from Australia were revoked. There is currently no EMD production in Australia. The lone producer of EMD in Australia, Delta Australia, ceased production in early 2008 and decommissioned its plant that same year.33 The plant was reportedly closed due to a combination of declining demand in Delta Australia’s principal markets, EMD oversupply, increasing input costs, exchange rate fluctuations, and the imposition of the order subject to these reviews.34 All plant assets were sold, and the former plant site remains on the market, having been cleared of all structures.35 Accordingly, there have been no subject imports from Australia since 2008.36
We find that EMD production is unlikely to resume in Australia within a reasonably foreseeable time. Delta EMD Ltd., Delta Australia’s parent company,37 has no employees in Australia and no plans to reestablish an EMD production facility in Australia in the event of revocation.38 Moreover, on May 9, 2014, Delta EMD Ltd. received shareholder approval for its plan to close its last remaining EMD production facility in South Africa in 2014, realize value for the company’s assets in 2014 and 2015, and discontinue its business.39 ***.40 For these reasons, Delta EMD Ltd. is unlikely to reestablish EMD production in Australia.
32 SAA, H.R. Rep. No. 103-316, vol. I at 887 (1994). 33 CR at IV-9-10; PR at IV-5. 34 CR at IV-9; PR at IV-5. 35 CR at IV-12-13; PR at IV-6; Investigator Telephone Notes, October 23, 2014 (EDIS #546088). 36 CR/PR at Table IV-1. 37 CR at IV-28 n.23; PR at IV-14 n.23. 38 CR at IV-13, D-14; PR at IV-6, D-3; Foreign Producers’ Questionnaire of Delta EMD Australia Pty
Ltd. at Question II-4; Investigator Telephone Notes, October 23, 2014 (EDIS #546088). We reject the domestic interested parties’ argument that the Commission should take adverse inferences against Delta Australia for failing to complete a foreign producers’ questionnaire response. See Domestic Interested Parties’ Prehearing Brief at 6; Domestic Interested Parties’ Posthearing Brief at 6; Domestic Interested Parties’ Responses to Commissioner Questions at 7-8; see also Domestic Interested Parties’ Final Comments at 6. Delta EMD Ltd. (South Africa) completed a foreign producers’ questionnaire response for Delta Australia, with which it was affiliated through parent Delta EMD Ltd. See CR at IV-28 n.23; PR at IV-14 n.23. We find this questionnaire response to be adequate because a Delta EMD Ltd. (South Africa) official certified to its accuracy and because Delta Australia itself is incapable of completing a questionnaire response, having closed in 2008. See Foreign Producers’ Questionnaire of Delta EMD Australia Pty Ltd. at cover page, Question I-6.
39 CR at IV-13, IV-27-28; PR at IV-6, IV-13-14; Delta EMD, Ltd., Report on Proceedings at Annual General Meeting and withdrawal of cautionary announcement (EDIS # 546358).
40 CR at IV-28; PR at IV-14; Investigator Telephone Notes, October 23, 2014 (EDIS #546088).
9
We are unpersuaded by the domestic interested parties’ argument that Delta EMD Ltd. is likely to reestablish EMD production in Australia quickly in the event of revocation by transferring equipment from its closed South African operations to the brownfield site it continues to own in Australia.41 As an initial matter, Delta EMD Ltd.’s decision to close its Australian operations in 2008 was not based solely on the imposition of the order subject to these reviews, as the domestic interested parties suggest, but also on declining demand in Delta Australia’s principal markets, EMD oversupply, increasing input costs, and exchange rate fluctuations.42 The record indicates that Delta EMD Ltd. would likely be discouraged from reestablishing EMD production in Australia after revocation by similar factors, including declining EMD demand in the U.S. market, EMD oversupply from China, increased raw material costs, and various factors that have hobbled the competitiveness of Australian manufacturers, including a strong Australian dollar.43 In addition, the *** percent decline in apparent U.S. consumption between 2005 and 2013 indicates that conditions of competition are not the same as they were when Delta EMD Ltd. first established EMD production in Australia.44
Moreover, Delta EMD Ltd. will likely not be in a position to reestablish EMD production in Australia after revocation, and it reports that it would not do so.45 Specifically, Delta EMD Ltd. has already disposed of ***.46 Furthermore, Delta EMD Ltd. is in the process of *** pursuant to its decision to discontinue its business.47
We also find it unlikely that Delta EMD Ltd. could reestablish EMD production in Australia in time to participate in 2016 contract negotiations with U.S. purchasers for delivery in 2017, contrary to the domestic interested parties’ argument.48 Doing so would require Delta EMD Ltd. to reverse its decision to discontinue its business, which would presumably require shareholder approval, and to secure between $7 million and $100 million for the construction of the new plant, depending upon the availability of equipment from its closed South African
41 See Domestic Interested Parties’ Prehearing Brief at 26‐28; Domestic Interested Parties’ Responses to Commissioner Questions at 1, 4; Hearing Tr. at 33‐34 (Levy).
42 CR at IV‐9; PR at IV‐5. 43 See CR at IV‐17‐18, V‐1‐2; PR at IV‐7‐8, V‐1‐2; CR/PR at Tables I‐1, II‐3; Hearing Tr. at 53, 79
(Levy); “Labour, Energy Costs, not dollar, blamed for manufacturing collapse,” The Sydney Morning Herald (Oct. 13, 2014) (EDIS #544873); “Australia’s Manufacturing Cost Competitiveness: Losing Ground,” The Boston Consulting Group (Aug. 19, 2014) (EDIS #544869); Excerpts from Reserve Bank of Australia documents (EDIS #544871); Excerpts from Prime Minister’s Manufacturing Taskforce, Report of the Non‐Government Members, August 2012 (EDIS #544874).
44 See CR/PR at Table I‐1. 45 Foreign Producers’ Questionnaire of Delta EMD Australia Pty Ltd. at Question II‐4. 46 CR at IV‐28; PR at IV‐14; Investigator Telephone Notes, October 23, 2014 (EDIS #546088). 47 CR at IV‐28; PR at IV‐14; Investigator Telephone Notes, October 23, 2014 (EDIS #546088);
Delta EMD, Ltd., Report on Proceedings at Annual General Meeting and withdrawal of cautionary announcement (EDIS # 546358).
48 See Domestic Interested Parties’ Prehearing Brief at 28.
10
plant or other sources.49 Construction of the plant would then take up to 20 months,50 and purchaser qualification of EMD produced at the new plant would require another three to nine months.51 In light of these obstacles, even if Delta EMD Ltd. were determined to reestablish EMD production in Australia after revocation, which is most likely not the case, we find it unlikely that Delta EMD Ltd. could do so within a reasonably foreseeable time.
Nor is there evidence that any other company is likely to commence EMD production in Australia within a reasonably foreseeable time. In particular, there is little evidence that either Mesa Minerals, an Australian company with a proprietary process for producing EMD, or Tosoh, a Japanese producer of EMD, is likely to do so, notwithstanding the domestic interested parties’ arguments to the contrary.52 Although Mesa is attempting to commercialize its proprietary process for producing EMD,53 efforts to commercialize the process have been made since 2005 without success.54 There is no evidence, other than the domestic interested parties’ speculation, that revocation of the order would significantly accelerate Mesa’s efforts to commercialize its process, or that any such commercialization could take place within a reasonably foreseeable time.55 We find it unlikely that Mesa could secure the substantial investment capital necessary to commercialize its proprietary process,56 complete a new plant utilizing the process, and qualify its EMD with U.S. purchasers57 within a reasonably foreseeable time.
Similarly speculative is the domestic interested parties’ claim that Tosoh would have an incentive to invest in Australian EMD production after revocation because its access to the
49 See Domestic Interested Parties’ Responses to Commissioner Questions at 1; Hearing Tr. at 33 (Helou).
50 Domestic Interested Parties’ Prehearing Brief at 27‐28. 51 See CR at II‐15; PR at II‐10. 52 See Domestic Producers’ Prehearing Brief at 35; Domestic Interested Parties’ Responses to
Commissioner Questions at 5; Domestic Interested Parties’ Final Comments at 5; Hearing Tr. at 62 (Manley), 68‐69 (Helou).
53 See CR at IV‐13‐14; PR at IV‐6; Mesa June 2014 Annual Report at 3 (EDIS #544875); Mesa Home Page (EDIS #544876); *** (EDIS # 955044); Hearing Tr. at 62 (Manley) (“Mesa Minerals, they have a proprietary process for making EMD. The point of the fact is that they have not turned this into a commercial operation, but they are located in Australia.”).
54 Original Determinations, USITC Pub. 4036 at VII‐3 (HiTec Energy Limited sought to commercialize its patented process for producing EMD from low grade manganese ore in 2005, 2006, and 2007, without success); Mesa June 2014 Annual Report at 37 (EDIS #544875) (Hitec Energy Pty Ltd is wholly owned by Mesa).
55 See, e.g., CR at D‐8; PR at D‐3; Tronox’s Response to the Notice of Institution at 8, Ex. J; Hearing Tr. at 62 (Manley).
56 The domestic interested parties estimate that construction of a greenfield EMD plant utilizing existing technology would cost $100 million. Domestic Interested Parties’ Responses to Commissioner Questions at 1.
57 Three responding purchasers reported that the qualification of a new supplier takes at least nine months, while one reported that its qualification process takes three to four months. CR at II‐15; PR at II‐10.
11
steady supply of electricity necessary for EMD production has been jeopardized by the Japanese government’s decision to shut down most Japanese nuclear plants.58 The decision referenced by the domestic interested parties was taken in 2011, in the wake of the Tohoku earthquake and tsunami, and did not result in Tosoh’s investment in EMD production in Australia. There is no evidence that revocation of the order on EMD from Australia would alter Tosoh’s investment plans, particularly given that Tosoh primarily serves markets other than the United States.59
Having found that revocation of the order on EMD from Australia would likely have no discernible adverse impact on the domestic industry, we are precluded from cumulating subject imports from Australia and China for purposes of our sunset analysis, and hence conclude our cumulation analysis.
Whether Revocation of the Antidumping Orders Would Likely Lead to Continuation or IV.
Recurrence of Material Injury Within a Reasonably Foreseeable Time
A. Legal Standards
In a five‐year review conducted under section 751(c) of the Tariff Act, Commerce will revoke an antidumping or countervailing duty order unless: (1) it makes a determination that dumping or subsidization is likely to continue or recur and (2) the Commission makes a determination that revocation of the antidumping or countervailing duty order “would be likely to lead to continuation or recurrence of material injury within a reasonably foreseeable time.”60 The SAA states that “under the likelihood standard, the Commission will engage in a counterfactual analysis; it must decide the likely impact in the reasonably foreseeable future of an important change in the status quo – the revocation or termination of a proceeding and the elimination of its restraining effects on volumes and prices of imports.”61 Thus, the likelihood standard is prospective in nature.62 The U.S. Court of International Trade has found that
58 Domestic Interested Parties’ Responses to Commissioner Questions at 5; Domestic Interested Parties’ Final Comments at 5; Hearing Tr. at 18 (Manley), 68‐69 (Helou).
59 In 2013, Tosoh exported 6,647 short tons of EMD from Japan to the United States and 9,202 short tons to third country markets. CR/PR at Table IV‐15. The balance of Tosoh’s Japanese EMD capacity that year, 36,376 short tons, was presumably devoted to its home market. Id. at Table IV‐12a. Tosoh’s EMD production facility in Greece, CR at IV‐25; PR at IV‐12, exported no EMD to the United States in 2013. CR/PR at Table IV‐14.
60 19 U.S.C. § 1675a(a). 61 SAA at 883‐84. The SAA states that “{t}he likelihood of injury standard applies regardless of
the nature of the Commission’s original determination (material injury, threat of material injury, or material retardation of an industry). Likewise, the standard applies to suspended investigations that were never completed.” Id. at 883.
62 While the SAA states that “a separate determination regarding current material injury is not necessary,” it indicates that “the Commission may consider relevant factors such as current and likely continued depressed shipment levels and current and likely continued {sic} prices for the domestic like (Continued…)
12
“likely,” as used in the five‐year review provisions of the Act, means “probable,” and the Commission applies that standard in five‐year reviews.63
The statute states that “the Commission shall consider that the effects of revocation or termination may not be imminent, but may manifest themselves only over a longer period of time.”64 According to the SAA, a “‘reasonably foreseeable time’ will vary from case‐to‐case, but normally will exceed the ‘imminent’ timeframe applicable in a threat of injury analysis in original investigations.”65
Although the standard in a five‐year review is not the same as the standard applied in an original investigation, it contains some of the same fundamental elements. The statute provides that the Commission is to “consider the likely volume, price effect, and impact of imports of the subject merchandise on the industry if the orders are revoked or the suspended investigation is terminated.”66 It directs the Commission to take into account its prior injury determination, whether any improvement in the state of the industry is related to the order or the suspension agreement under review, whether the industry is vulnerable to material injury if an order is revoked or a suspension agreement is terminated, and any findings by Commerce regarding duty absorption pursuant to 19 U.S.C. § 1675(a)(4).67 The statute further provides that the presence or absence of any factor that the Commission is required to consider shall not necessarily give decisive guidance with respect to the Commission’s determination.68
In evaluating the likely volume of imports of subject merchandise if an order under review is revoked and/or a suspended investigation is terminated, the Commission is directed
(…Continued) product in the U.S. market in making its determination of the likelihood of continuation or recurrence of material injury if the order is revoked.” SAA at 884.
63 See NMB Singapore Ltd. v. United States, 288 F. Supp. 2d 1306, 1352 (Ct. Int’l Trade 2003) (“‘likely’ means probable within the context of 19 U.S.C. § 1675(c) and 19 U.S.C. § 1675a(a)”), aff’d mem., 140 Fed. Appx. 268 (Fed. Cir. 2005); Nippon Steel Corp. v. United States, 26 CIT 1416, 1419 (2002) (same); Usinor Industeel, S.A. v. United States, 26 CIT 1402, 1404 nn.3, 6 (2002) (“more likely than not” standard is “consistent with the court’s opinion;” “the court has not interpreted ‘likely’ to imply any particular degree of ‘certainty’”); Indorama Chemicals (Thailand) Ltd. v. United States, 26 CIT 1059, 1070 (2002) (“standard is based on a likelihood of continuation or recurrence of injury, not a certainty”); Usinor v. United States, 26 CIT 767, 794 (2002) (“‘likely’ is tantamount to ‘probable,’ not merely ‘possible’”).
64 19 U.S.C. § 1675a(a)(5). 65 SAA at 887. Among the factors that the Commission should consider in this regard are “the
fungibility or differentiation within the product in question, the level of substitutability between the imported and domestic products, the channels of distribution used, the methods of contracting (such as spot sales or long‐term contracts), and lead times for delivery of goods, as well as other factors that may only manifest themselves in the longer term, such as planned investment and the shifting of production facilities.” Id.
66 19 U.S.C. § 1675a(a)(1). 67 19 U.S.C. § 1675a(a)(1). Commerce has made no duty absorption findings with respect to the
orders under review. CR at I‐12 n.18; PR at I‐6 n.18. 68 19 U.S.C. § 1675a(a)(5). Although the Commission must consider all factors, no one factor is
necessarily dispositive. SAA at 886.

13
to consider whether the likely volume of imports would be significant either in absolute terms or relative to production or consumption in the United States.69 In doing so, the Commission must consider “all relevant economic factors,” including four enumerated factors: (1) any likely increase in production capacity or existing unused production capacity in the exporting country; (2) existing inventories of the subject merchandise, or likely increases in inventories; (3) the existence of barriers to the importation of the subject merchandise into countries other than the United States; and (4) the potential for product shifting if production facilities in the foreign country, which can be used to produce the subject merchandise, are currently being used to produce other products.70
In evaluating the likely price effects of subject imports if an order under review is revoked and/or a suspended investigation is terminated, the Commission is directed to consider whether there is likely to be significant underselling by the subject imports as compared to the domestic like product and whether the subject imports are likely to enter the United States at prices that otherwise would have a significant depressing or suppressing effect on the price of the domestic like product.71
In evaluating the likely impact of imports of subject merchandise if an order under review is revoked and/or a suspended investigation is terminated, the Commission is directed to consider all relevant economic factors that are likely to have a bearing on the state of the industry in the United States, including but not limited to the following: (1) likely declines in output, sales, market share, profits, productivity, return on investments, and utilization of capacity; (2) likely negative effects on cash flow, inventories, employment, wages, growth, ability to raise capital, and investment; and (3) likely negative effects on the existing development and production efforts of the industry, including efforts to develop a derivative or more advanced version of the domestic like product.72 All relevant economic factors are to be considered within the context of the business cycle and the conditions of competition that are distinctive to the industry. As instructed by the statute, we have considered the extent to
69 19 U.S.C. § 1675a(a)(2). 70 19 U.S.C. § 1675a(a)(2)(A‐D). 71 See 19 U.S.C. § 1675a(a)(3). The SAA states that “{c}onsistent with its practice in
investigations, in considering the likely price effects of imports in the event of revocation and termination, the Commission may rely on circumstantial, as well as direct, evidence of the adverse effects of unfairly traded imports on domestic prices.” SAA at 886.
72 19 U.S.C. § 1675a(a)(4). Section 752(a)(6) of the Act states that “the Commission may consider the magnitude of the margin of dumping” in making its determination in a five‐year review. 19 U.S.C. § 1675a(a)(6). The statute defines the “magnitude of the margin of dumping” to be used by the Commission in five‐year reviews as “the dumping margin or margins determined by the administering authority under section 1675a(c)(3) of this title.” 19 U.S.C. § 1677(35)(C)(iv). See also SAA at 887. In the final results of its expedited sunset reviews, Commerce calculated weighted‐average dumping margins of 83.66 percent for EMD from Australia and 149.92 percent for EMD from China. 79 Fed. Reg. 6162 (Feb. 3, 2014).
14
which any improvement in the state of the domestic industry is related to the orders under review and whether the industry is vulnerable to material injury upon revocation.73
B. Findings in the Original Investigations
1. Conditions of Competition
Demand Conditions. The Commission found that demand for EMD declined over the period of investigation, which encompassed January 2005 through March 2008. The Commission found that apparent U.S. consumption as measured by U.S. shipments declined by 14.3 percent from 2005 through 2007.74 In interim 2008 (January‐March 2008) U.S. consumption was 9.9 percent higher than in interim 2007 (January‐ March 2007). 75 The Commission also found that usage of EMD by U.S. battery producers during the period of investigation decreased by 4.2 percent. 76
The Commission observed that the U.S. EMD market consisted of very few suppliers and purchasers and that virtually all the domestic and imported product was used for a single purpose, the production of alkaline batteries. 77 The Commission also pointed out limitations in the data it collected pertaining to apparent consumption. Chinese import volume and market share appeared to be substantially understated. U.S. battery producer usage data included use of EMD by battery purchasers from existing inventories. 78
Supply Conditions. The Commission found that a limited number of suppliers were
qualified by one or more of the four U.S. battery manufacturers. 79 The domestic industry was the largest supplier of EMD in the U.S. market throughout the period of investigation, followed by subject imports. 80 Nonsubject imports from Japan and South Africa supplied the remainder of the U.S. market. 81
Product Interchangeability. The Commission observed that the interchangeability of
domestic and imported EMD was somewhat limited because all purchases of EMD from new
73 The SAA states that in assessing whether the domestic industry is vulnerable to injury if the order is revoked, the Commission “considers, in addition to imports, other factors that may be contributing to overall injury. While these factors, in some cases, may account for the injury to the domestic industry, they may also demonstrate that an industry is facing difficulties from a variety of sources and is vulnerable to dumped or subsidized imports.” SAA at 885.
74 Original Determinations, USITC Pub. 4036 at 13. 75 Original Determinations, USITC Pub. 4036 at 13. 76 Original Determinations, USITC Pub. 4036 at 13‐14. 77 Original Determinations, USITC Pub. 4036 at 13‐14. 78 Original Determinations, USITC Pub. 4036 at 13‐14. 79 Original Determinations, USITC Pub. 4036 at 14. 80 Original Determinations, USITC Pub. 4036 at 14. 81 Original Determinations, USITC Pub. 4036 at 14‐15.
15
suppliers needed to undergo rigorous qualification procedures, which could take 6 to 16 months. 82 Nevertheless, at various times during the period of the investigation, the domestic product and subject imports from both countries were qualified by one or more of the four major battery producers for at least some battery types. 83 All domestic producers and half of responding importers reported that the domestic like product and subject imported EMD were “always” or “frequently” interchangeable. 84 Most responding purchasers, however, reported that domestic and subject EMD were “sometimes” or “never” interchangeable. 85
Other Conditions. The Commission found that domestically produced EMD and imported
EMD were usually sold pursuant to annual short term contracts/agreements negotiated in the fourth quarter of the preceding year. 86 The negotiation process generally involved competitive bids or quotes from a battery manufacturer’s qualified suppliers before the contract was awarded. 87
The Commission also stated that domestic producers must operate their plants at or near full capacity utilization to remain profitable, due to the capital intensive nature of EMD production. 88
2. Volume
The Commission found that the volume of cumulated subject imports was significant during the period of investigation, both in absolute terms and relative to consumption and production in the United States.89 Subject import volume declined steadily from *** short tons in 2005 to *** short tons in 2006 and *** short tons in 2007, but was higher in interim 2008, at *** short tons, than in interim 2007, at *** short tons.90 Cumulated subject import market share increased from *** percent in 2005 to *** percent in 2006 before declining to *** percent in 2007.91 Cumulated subject import market share was *** percent in interim 2008, down from *** percent in interim 2007.92 The ratio of cumulated subject imports to U.S. production ranged from *** percent in 2005 and *** percent in 2007, and was *** percent in interim 2008. 93
82 Original Determinations, USITC Pub. 4036 at 15. 83 Original Determinations, USITC Pub. 4036 at 15. 84 Original Determinations, USITC Pub. 4036 at 15. 85 Original Determinations, USITC Pub. 4036 at 15. 86 Original Determinations, USITC Pub. 4036 at 15. 87 Original Determinations, USITC Pub. 4036 at 15. 88 Original Determinations, USITC Pub. 4036 at 16. 89 Original Determinations, USITC Pub. 4036 at 16. 90 Confidential Views, Electrolytic Manganese Dioxide from Australia and China, Inv. Nos. 731‐
TA‐1124 and 1125 (Final) (“Confidential Views”) at 23‐24 (EDIS# 522950). 91 Confidential Views at 24. 92 Confidential Views at 24. 93 Confidential Views at 24.
16
3. Price
The Commission found that the domestic like product and subject imports appeared to be at least moderately interchangeable, and although respondents emphasized that quality was an important factor in purchasing decisions, the record reflected that price was also an important factor.94 The Commission found significant underselling by subject imports during the period of investigation, based on underselling in 24 of 25 quarterly comparisons at margins ranging from *** to *** percent.95 While recognizing that prices for the domestic like product increased between the first and last quarters for which data were collected, the Commission found that subject imports suppressed prices for the domestic like product to a significant degree, as the industry’s ratio of cost of goods sold to net sales increased from 87.5 percent in 2005 to 100.9 percent in 2007.96 The Commission attributed the industry’s cost‐price squeeze to subject import competition based on evidence that ***.97
4. Impact
The Commission found that the domestic industry’s performance declined throughout the period of investigation with respect to both its total operations and its merchant market operations.98 In particular, the Commission found that the industry’s financial indicators declined as the industry experienced a cost‐price squeeze and a declining rate of capacity utilization.99 The Commission concluded that cumulated subject imports had a significant adverse impact on the condition of the domestic industry during the period of investigation.100 As the Commission explained, domestic producers needed to raise prices or gain market share during the period to compensate for increasing raw material costs and declining demand, which resulted in higher unit fixed costs.101 Due to the significant volume of subject imports that consistently undersold the domestic like product, however, the domestic industry experienced
94 Original Determinations, USITC Pub. 4036 at 17‐18. 95 Confidential Views at 25‐26. 96 Original Determinations, USITC Pub. 4036 at 18. 97 Confidential Views at 27. 98 Original Determinations , USITC Pub. 4036 at 19. Although it found that the criteria for
application of the statutory captive production provision were not satisfied, the Commission considered as a condition of competition the substantial share of domestic production captively consumed by domestic producer Energizer and noted that its performance was similar to that of the industry as a whole. Id. at 12‐13, 19 n.145.
99 Original Determinations, USITC Pub. 4036 at 19, 21. 100 Original Determinations, USITC Pub. 4036 at 22. The Commission found that application of
the replacement/benefit analysis articulated in Bratsk Aluminum Smelter v. United States, 444 F.3d 1369, 1375 (Fed. Cir. 2006), was not required because all parties agreed that EMD was not a commodity. Original Determinations, USITC Pub. 4036 at 25.
101 Original Determinations, USITC Pub. 4036 at 22.
17
a cost‐price squeeze, a reduction in U.S. shipments and capacity utilization, an inventory build‐up, and declining financial performance, including operating losses in 2007 and interim 2008.102 The Commission rejected the respondents’ argument that no remedial purpose would be served by imposing an antidumping duty order on EMD from Australia given that Australian EMD production had ceased.103 The Commission explained that it was not required to consider the effectiveness of the order. It further explained that the order would not be punitive, as respondents argued, because the sole Australian producer had closed and parties were not foreclosed from seeking a changed circumstances review with respect to any order on EMD from Australia.104
C. Conditions of Competition and the Business Cycle
In evaluating the likely impact of the subject imports on the domestic industry if an order is revoked, the statute directs the Commission to consider all relevant economic factors “within the context of the business cycle and conditions of competition that are distinctive to the affected industry.”105 The following conditions of competition inform our determinations.
1. Demand Conditions
EMD is used almost exclusively in the production of dry‐cell batteries, primarily alkaline batteries.106 Thus, demand for EMD in the U.S. market is largely a function of domestic battery production. Apparent U.S. consumption of EMD, which was *** short tons in 2005, declined from *** short tons in 2008 to *** short tons in 2009, increased to *** short tons in 2010 and *** short tons in 2011, and then declined to *** short tons in 2012 and *** short tons in 2013, a level *** percent lower than in 2008.107 Apparent U.S. consumption was *** short tons in January‐June 2014, down from *** short tons in January‐June 2013. 108
Questionnaire respondents attributed the decline in U.S. EMD demand to the movement of battery production outside the United States and the increased importation of tools, toys, and electrical equipment imported from China with batteries installed.109 The domestic interested parties attribute the decline in U.S. EMD demand primarily to technological changes in portable lighting and a shift to smaller battery cell sizes, which require less EMD.110 A slight majority of responding domestic producers, importers, purchasers, and foreign
102 Original Determinations, USITC Pub. 4036 at 22. 103 Original Determinations, USITC Pub. 4036 at 22‐23. 104 Original Determinations, USITC Pub. 4036 at 23. 105 19 U.S.C. § 1675a(a)(4). 106 CR at II‐7; PR at II‐5. 107 CR/PR at Table I‐1. 108 CR/PR at Table I‐1. 109 CR at II‐10; PR at II‐6. 110 Domestic Interested Parties’ Responses to Commissioner Questions at 26.
18
producers reported that they expect U.S. EMD demand to decline in the near future, while all other respondents reported that they expect demand to fluctuate.111
A small number of purchasers accounted for most U.S. EMD consumption during the period of review. The three largest responding purchasers, ***, accounted for *** percent of apparent U.S. consumption in 2013.112
2. Supply Conditions
During the period of review, the domestic industry satisfied the bulk of domestic demand for EMD. On an annual basis, the domestic industry supplied between *** and *** percent of apparent U.S. consumption during the period.113 Domestic industry capacity increased irregularly from *** short tons in 2008 to *** short tons in 2013, a level *** percent higher than in 2008, due to ***.114 Nonsubject imports supplied most of the balance of apparent U.S. consumption during the period of review, as subject imports ceased after 2008.115 On an annual basis, nonsubject imports supplied between *** and *** percent of apparent U.S. consumption during the period.116 The two largest sources of nonsubject imports during the period of review were South Africa and Japan, which accounted for between 90 and 97 percent of all imports during the 2009‐2013 period.117 The lone South African producer, Delta South Africa, ceased production earlier this year pursuant to the decision of its parent company, Delta EMD Ltd., to sell off its assets and discontinue its business.118
3. Substitutability
The record shows a moderate degree of substitutability between domestically produced EMD and EMD imported from each subject country, as in the original investigations.119 When asked how frequently subject imports from Australia and China are interchangeable with domestically produced EMD, most responding domestic producers reported “always,” while most responding importers and purchasers reported “sometimes.”120 Of the two responding purchasers that compared subject imports from both Australia and China, one reported that subject imports from both sources are sometimes interchangeable and the other reported that
111 CR at II‐10; PR at II‐6; CR/PR at Table II‐3. 112 CR at I‐24; PR at I‐13; CR/PR at Table I‐7. 113 CR/PR at Table I‐8. 114 CR at III‐3; PR at III‐1; CR/PR at Table III‐3. 115 CR/PR at Tables I‐7, 8. Subject import volume was *** short tons in 2008, equivalent to ***
percent of apparent U.S. consumption that year. Id. 116 CR/PR at Table I‐8. 117 CR at II‐6‐7; PR at II‐4. 118 CR at IV‐26‐28; PR at IV‐13‐14. 119 CR at II‐11; PR at II‐7. 120 CR/PR at Table II‐9.
19
they are never interchangeable.121 Most responding purchasers reported that both domestically produced EMD and EMD imported from China usually meet minimum quality specifications, while the only responding purchaser that addressed EMD imported from Australia reported that such EMD rarely or never meets minimum quality specifications.122 Half or more of responding purchasers reported that domestically produced EMD and EMD imported from China were comparable in terms of 13 of 15 listed product characteristics, but most reported that domestically produced EMD was superior in terms of delivery terms and delivery time.123 No responding purchasers compared EMD imported from Australia to domestic or Chinese‐made EMD with respect to the 15 product characteristics.124
Although the evidence is mixed, the record, on balance, indicates that if subject imports from China were to reenter the U.S. market after revocation, these products would have characteristics similar to those of the EMD imported from these subject countries during the original investigations. This indicates that any future subject imports from China would likely be moderately substitutable with the domestic like product.
4. Other Conditions
The record indicates that, as in the original investigations, price is an important factor in purchasing decisions, along with quality, product consistency, and reliability of supply.125 Most responding purchasers ranked price as the second most important factor used in purchasing decisions, behind only quality.126 Six of seven responding purchasers reported that price was “very important” to their purchasing decisions, with one reporting that price was “somewhat important.”127 All but one of the responding purchasers reported that they “sometimes” or “usually” purchase the lowest priced EMD.128
Several factors are essential for the economical production of EMD. The production of high quality EMD requires access to high magnesium content ore and a constant supply of electricity, because an inconsistent electrical supply interferes with the crystalline structure of the EMD produced.129 In addition, domestic producers must operate their plants at or near full capacity utilization to remain profitable, due to the capital intensive nature of EMD production.130
121 CR/PR at Table II‐9. 122 CR/PR at Table II‐10 123 CR/PR at Table II‐8. 124 CR at II‐17; PR at II‐11. 125 See CR/PR at Tables II‐5‐6. 126 CR/PR at Table II‐5. 127 CR/PR at Table II‐6. 128 CR at II‐14; PR at II‐9. 129 Domestic Interested Parties’ Prehearing Brief at 19. 130 See Domestic Interested Parties’ Prehearing Brief at 20, 41.
20
D. Revocation of the Antidumping Order on Subject Imports from China Is Likely to Lead to the Continuation or Recurrence of Material Injury to the Domestic Industry within a Reasonably Foreseeable Time
1. Likely Volume of Subject Imports
We find that subject imports from China are likely to be significant if the order on EMD from China were revoked. As discussed below, Chinese producers have both the ability and the incentive to reenter the U.S. market aggressively and increase their penetration of the market to significant levels in the event of revocation.
In the original investigations, shipments of subject imports from China increased from *** short tons in 2005 to *** short tons in 2006 before declining to *** short tons in 2007.131 Subject imports from China accounted for *** percent of apparent U.S. consumption in 2005, *** percent in 2006, and *** percent in 2007.132 During the period of review, subject imports from China declined from *** short tons in 2008, equivalent to *** percent of apparent U.S. consumption that year, to ***.133
Chinese producers have the ability to reenter the U.S. market readily because they possess substantial excess capacity. Only one Chinese producer, which accounted for *** of Chinese production and exports of EMD, responded to the Commission’s questionnaire.134 Other information on the record, however, indicates that twelve Chinese EMD producers possessed capacity of 326,725 short tons in 2013.135 Chinese production of EMD that year was an estimated 255,252 short tons, including 143,369 short tons of alkaline grade EMD.136 Assuming that the proportion of the Chinese industry’s capacity devoted to alkaline grade EMD in 2013 was similar to the 56 percent of the industry’s EMD production consisting of alkaline grade EMD that year,137 Chinese producers would have possessed 39,597 short tons of excess alkaline grade EMD capacity in 2013, equivalent to *** percent of apparent U.S. consumption that year.138
Chinese producers also have ample incentives to increase their exports to the U.S. market to a significant level after revocation. The capital intensity of EMD production would give Chinese producers an economic incentive to increase exports to the U.S. market as a means of filling their substantial excess capacity, and thus reducing their unit fixed costs. An additional economic incentive would be provided by the conditions of oversupply that currently
131 CR/PR at Table I‐1. 132 CR/PR at Table I‐1. 133 CR/PR at Table I‐1. 134 CR at IV‐15; PR at IV‐7; CR/PR at Table IV‐8. 135 CR at IV‐17; PR at IV‐7. 136 CR at IV‐17; PR at IV‐7. 137 See Hearing Tr. at 85 (Manley) (stating that “roughly half” of Chinese EMD capacity “is
alkaline.”). 138 CR/PR at Table I‐7; see also Hearing Tr. at 85 (Manley) (stating that “over half of the excess
exists in the alkaline‐grade EMD, the excess capacity” in China).
21
prevail in the Chinese EMD market, which have reportedly resulted in weak financial performance among Chinese EMD producers in 2013, including an $8.2 million loss reported by the largest EMD factory in China.139 The Chinese producers’ need for additional shipments and revenues, together with conditions prevailing in the U.S. market, would give them ample reason to employ their unused capacity or to shift sales from their home market in order to make significant sales to the U.S. market. The record indicates that relatively high prices prevail in the U.S. market.140 Additionally, U.S. demand, while declining, remains substantial.141 The Chinese industry displayed a moderate degree of export orientation during the period of review, having exported between 44,626 and 57,384 short tons of EMD annually during the period.142 This suggests that Chinese producers are adept at serving foreign markets and could readily acquire customers in the U.S. market. In addition, Chinese EMD exports to Japan are impeded by antidumping duty measures there.143
We find further support for our finding that subject import volume from China would likely increase to a significant level after revocation in the questionnaire responses of importers and purchasers. Two responding importers reported that they would consider importing EMD from China, and four responding purchasers reported that they would consider sourcing EMD from China, in the event of revocation.144
For all of these reasons, we conclude that revocation of the order on subject imports from China would likely result in a significant volume of subject imports from China within a reasonably foreseeable time.145
2. Likely Price Effects
We find that subject imports from China would likely undersell the domestic like product to a significant degree after revocation, thereby likely depressing and suppressing domestic like product prices to a significant degree. We conduct our analysis of likely price
139 CR at IV‐17‐18; PR at IV‐7. 140 See CR at IV‐29; PR at IV‐15; Domestic Interested Parties’ Prehearing Brief at 37. The
domestic interested parties claim that the U.S. market has the highest EMD prices in the world. Domestic Interested Parties’ Responses to Commissioner Questions at 9.
141 Compare CR/PR at Table I‐7 with id. at Table IV‐13. 142 CR at IV‐18; PR at IV‐8; CR/PR at Table IV‐9. 143 CR at IV‐5; PR at IV‐3. 144 CR at D‐10; PR at D‐3 (responses of ***), D‐12 (responses of ***). We also note that the lone
responding Chinese producer, which is ***, reported that it “***” after revocation. CR at D‐14; PR at D‐3.
145 Responding U.S. importers held no inventories of subject imports from China during the period of review and have not arranged for the delivery of any subject imports from China after December 31, 2013. CR/PR at Tables IV‐3, 4. The responding Chinese producer, which accounted for *** of Chinese EMD production, reported end‐of‐period inventories of *** short tons in 2013, equivalent to *** percent of apparent U.S. consumption that year. Id. at Tables I‐7, IV‐8. The producer also reported that ***. CR at IV‐15; PR at IV‐7.
22
effects in light of our findings that there is a moderate degree of interchangeability between subject imports and the domestic like product and that price is an important factor in the U.S. EMD market, as discussed in sections IV.C.3 and 4 above. Given this, and the prevalence of underselling by subject imports from China during the original investigations,146 we find that significant underselling by subject imports from China is likely after revocation. Chinese producers would likely revert to their underselling strategy from the original investigations as a means of rapidly increasing their penetration of the U.S. market.
We also find that the significant underselling by subject imports from China after revocation would likely result in the depression or suppression of domestic like product prices to a significant degree. As in the original investigations, domestic producers would likely have to reduce their prices to maintain their market share and an acceptable rate of capacity utilization in the face of significantly increased quantities of low‐priced subject imports from China. Thus, we conclude that, if the order were revoked, significant volumes of subject imports from China would likely undersell the domestic like product significantly to gain market share, thereby likely depressing or suppressing domestic like product prices to a significant degree.
3. Likely Impact
As an initial matter, we find that the domestic industry is not in a vulnerable condition because it performed well during the period of review according to most measures. The domestic industry’s capacity increased irregularly during the period of review from *** short tons in 2008 to *** short tons in 2013, and was *** short tons during interim 2013 and interim 2014.147 Production fluctuated during the period, declining from 66,994 short tons in 2008 to 59,438 short tons in 2009, increasing to 62,546 short tons in 2010 and 65,060 short tons in 2011, declining to 64,820 short tons in 2012, and then increasing to 65,092 short tons in 2013, a level only 2.8 percent lower than in 2008.148 Domestic industry production was *** short tons in interim 2014, up *** from *** short tons in interim 2013. 149 The industry’s capacity utilization fluctuated with production during the 2008‐2012 period, ranging between *** and *** percent, but declined to *** percent in 2013, due primarily to the increase in the industry’s capacity that year.150 The industry’s rate of capacity utilization was *** percent in interim 2014, up slightly from *** percent in interim 2013.151
Both the domestic industry’s net sales quantity and its U.S. shipments fluctuated during the period of review, ending the period lower, but the industry remained the predominant
146 In the original investigations, subject imports from China undersold the domestic like product in *** quarterly comparisons, at margins ranging from *** to *** percent. CR at V‐6 n.2; PR at V‐4 n.2.
147 CR/PR at Table III‐3. 148 CR/PR at Table III‐3. 149 CR/PR at Table III‐3. 150 CR/PR at Table III‐3. 151 CR/PR at Table III‐3.
23
supplier to the U.S. market and its market share in 2013 was close to that in 2008. The domestic industry’s net sales quantity, ***,152 fluctuated during the period of review, declining from *** short tons in 2008 to *** short tons in 2009, increasing to *** short tons in 2010, declining to *** short tons in 2011, increasing to *** short tons in 2012, and declining to *** short tons in 2013, a level *** percent lower than in 2008.153 The industry’s net sales quantity was 20,857 short tons in interim 2014, down from 25,431 short tons in interim 2013.154 The industry’s U.S. shipments, including all producers, showed a similar trend during the period of review, declining from *** short tons in 2008 to *** short tons in 2009, increasing to *** short tons in 2010, declining to *** short tons in 2011, increasing to *** in 2012, and declining to *** short tons in 2013, a level *** percent lower than in 2008.155 The industry’s share of apparent U.S. consumption declined from *** percent in 2008 to *** percent in 2009, *** percent in 2010, and *** percent in 2011, before rebounding to *** percent in 2012 and *** percent in 2013, a level *** percentage points lower than in 2008.156 The industry’s market share was *** percent in interim 2014, up from *** percent in interim 2013. 157
The domestic industry’s employment and hours worked declined ***, but wages paid and productivity increased. Employment declined from *** production and related workers (“PRWs”) in 2008 to *** PRWs in 2009, *** PRWs in 2010 and 2011, *** PRWs in 2012, and *** PRWs in 2013.158 Employment was *** PRWs in interim 2014, up from *** in interim 2013. 159
152 ***. CR at III‐15 n.12; PR at III‐5 n.12. Accordingly, information on the domestic industry’s financial experience, including its net sales quantity and value, is limited to Erachem and Tronox. CR at III‐15; PR at III‐5.
153 CR/PR at Table E‐1. 154 CR/PR at Table E‐1. 155 CR/PR at Table I‐7. The domestic industry’s end‐of‐period inventories declined during the
period of review from *** short tons in 2008 to *** short tons in 2013. CR/PR at Table III‐5. Inventories were *** short tons in interim 2014, up from *** short tons in interim 2013. Id. The industry’s inventories declined as a share of U.S. production from *** percent in 2008 to *** percent in 2013, declined as a share of U.S. shipments from *** percent in 2008 to *** percent in 2013, and declined as a share of total shipments from *** percent in 2008 to *** percent in 2013. Id. In interim 2014, the industry’s inventories were equivalent to *** percent of U.S. production, *** percent of U.S. shipments, and *** percent of total shipments, up from *** percent of U.S. production, *** percent of U.S. shipments, and *** percent of total shipments in interim 2013. Id.
156 CR/PR at Table I‐8. 157 CR/PR at Table I‐8. 158 CR/PR at Table III‐8. 159 CR/PR at Table III‐8. The industry’s total hours worked showed a similar trend, declining
irregularly from *** hours in 2008 to *** hours in 2013. Id. The industry’s total hours worked were *** hours in interim 2014, up from *** hours in interim 2013. Id. The industry’s wages paid declined from $*** in 2008 to $*** in 2009 before increasing steadily to $*** in 2013. Id. The industry’s wages paid were $*** in interim 2014, up from $*** in interim 2013. Id. The industry’s productivity in short tons per 1,000 hours exhibited a similar trend, declining from *** in 2008 to *** in 2009 before increasing steadily to *** in 2013. Id. The industry’s productivity in short tons per 1,000 hours was *** in interim 2014, down from *** in interim 2014. Id.
24
The domestic industry’s financial performance was robust during the 2009‐2013 period, although it weakened between the interim periods.160 The industry’s net sales value increased from $*** in 2008 to $*** in 2009, $*** in 2010, and $*** in 2011, before declining to $*** in 2012 and $*** in 2013, a level still *** percent higher than in 2008.161 The industry’s net sales value was $*** in interim 2014, down from $*** in interim 2013.162 The industry’s operating income increased from $*** in 2008 to $*** in 2009, declined to $*** in 2010, increased to $*** in 2011, and then declined to $*** in 2012 and $*** in 2013, a level still *** percent higher than in 2008.163 The industry’s operating income was $*** in interim 2014, down from $*** in interim 2013.164 The industry’s operating income as a share of net sales increased from *** percent in 2008 to *** percent in 2009, declined to *** percent in 2010, increased to *** percent in 2011, and declined to *** percent in 2012 and *** percent in 2013, a level still *** percentage points higher than in 2008.165 The industry’s operating income as a share of net
160 Erachem, a U.S. producer of EMD, purchases manganese ore from a related party (Compagnie Miniere De L’Ogooue (Comilog)). CR at III‐16; PR at III‐5. The domestic interested parties contend that the purchase values Erachem reports in its financial records are the ones that should be used in the Commission’s financial analysis. Domestic Interested Parties’ Prehearing Brief at 7‐9. In cases where inputs are purchased from a related party (domestic or foreign), the Commission has followed the practice of requiring the elimination of related party profit or loss such that only the related supplier’s cost is reflected in the financial results reported to the Commission. Consistent with this approach, Part III of the Commission Report presented the U.S. industry’s financial results with the above‐referenced input adjustment. In order to consider this issue more fully, Appendix E also presented the U.S. industry’s financial results without the input adjustment. We considered both sets of financial results and arrived at the same general conclusion regarding the financial results and condition of the U.S. industry.
Having considered this issue recently in 1,1,1,2 ‐‐ Tetrafluoroethane from China, Inv. Nos. 701‐TA‐509 and 731‐TA‐1244 (Final), USITC Pub. 4503 (Dec. 2014), as well as in this case and in general, we believe that the financial results information reported in Appendix E (i.e., without the input adjustment for related party profit or loss) is more useful for purposes of our analysis because it more closely reflects the actual cost of goods sold which directly impacted the U.S. producer’s decisions related to revenue, i.e., pricing. Based on this conclusion, in future questionnaires the Commission no longer intends, as a standard practice, to require a separate adjustment to eliminate relevant profit or loss on inputs purchased from related parties. Instead, the Commission will require that relevant costs included in reported financial results be consistent with and based on the accounting books and records of the firm responding to the U.S. producer questionnaire.
While this reflects a change in practice with respect to how financial results are to be reported, the Commission will continue to gather relevant information regarding input purchases from related suppliers for its analysis and will examine any anomalous patterns, to the extent present, related to such input purchases.
161 CR/PR at Table E‐1. 162 CR/PR at Table E‐1. 163 CR/PR at Table E‐1. 164 CR/PR at Table E‐1. 165 CR/PR at Table E‐1.
25
sales was *** percent in interim 2014, down from *** percent in interim 2013.166 The domestic industry’s capital expenditures increased irregularly during the period of review, while its research and development expenses fluctuated within a narrow band.167
As addressed above, we have found that revocation of the order on subject imports from China would likely result in a significant volume of subject imports that would likely undersell the domestic like product, thereby likely depressing or suppressing domestic like product prices to a significant degree. We find that the likely volume and price effects of the subject imports would likely have a significant adverse impact on the production, shipments, sales, market share, and revenues of the domestic industry, notwithstanding its current condition. These reductions would have a direct adverse impact on the industry’s profitability and employment as well as its ability to raise capital and make and maintain necessary capital investments. We therefore conclude that, if the order were revoked, subject imports from China would be likely to have a significant adverse impact on the domestic industry within a reasonably foreseeable time. In our analysis of the likely impact of subject imports from China on the domestic industry, we have taken into account whether there are other factors that likely would affect the domestic industry. As discussed above, nonsubject imports maintained an appreciable share of apparent U.S. consumption during the period of review, ranging from *** to *** percent.168 Notwithstanding the presence of nonsubject imports in the market, the domestic industry achieved strong performance during the period of review. No party has argued that the U.S. market penetration of nonsubject imports is likely to increase significantly in the reasonably foreseeable future. Indeed, the cessation of EMD production in South Africa, the largest source of nonsubject imports during the period of review, suggests that nonsubject import volume may decline.169 We have found that imports of EMD from Australia are unlikely to reenter the U.S. market within a reasonably foreseeable time. Moreover, the average unit value of nonsubject imports shipments in the U.S. market was consistently higher than the average unit value of the domestic industry’s U.S. shipments during the period of review.170 Imports from other sources are therefore unlikely to prevent subject imports from China from significantly increasing their penetration of the U.S. market after revocation. Accordingly, any likely effects of imports from other sources are distinguishable from the likely adverse effects from subject imports from China described above.
166 CR/PR at Table E‐1. 167 The industry’s capital expenditures increased steadily from $*** in 2008 to $*** in 2012
before declining to $*** in 2013, a level still *** percent higher than in 2008. CR/PR at Table III‐13. The industry’s capital expenditures were $*** in interim 2014, down from $*** in interim 2013. Id. ***. CR at III‐33‐34; PR at III‐10. The industry’s annual research and development expenses fluctuated between $*** and $*** during the 2008‐2013 period, and were $*** in interim 2014, down from $*** in interim 2013. CR/PR at Table III‐13. ***. CR at III‐34‐35; PR at III‐10.
168 CR/PR at Table I‐8. 169 CR at IV‐26‐28; PR at IV‐13‐14. 170 CR/PR at Table C‐1.
26
E. Revocation of the Antidumping Order on Subject Imports from Australia Is Not
Likely to Lead to the Continuation or Recurrence of Material Injury to the Domestic Industry within a Reasonably Foreseeable Time
1. Likely Volume of Subject Imports
As discussed in section III.B above, there is currently no EMD production in Australia, and we find it unlikely that EMD production will resume in Australia within a reasonably foreseeable time. Delta EMD Ltd. closed its Australian EMD production operations in 2008, and no longer possesses any equipment, structures, or employees there. In May 2014, Delta EMD Ltd. received shareholder approval for its decision to realize value for its assets and discontinue its business, and subsequently closed and began to sell off its remaining EMD production operations in South Africa. Accordingly, Delta EMD Ltd. is not likely to resume production of EMD in Australia after revocation, and has no plans to do so. Nor is there evidence that any other company, including Mesa Minerals and Tosoh, is likely to resume production of EMD in Australia within a reasonably foreseeable time. Therefore, we find that revocation of the order on EMD from Australia is not likely to result in a significant volume of subject imports from Australia within a reasonably foreseeable time.171
2. Likely Price Effects
Based on our conclusion that revocation of the order would not likely result in a significant volume of subject imports from Australia, we find that subject imports from Australia are unlikely to undersell the domestic like product significantly, or to depress or suppress domestic like product prices to a significant degree, within a reasonably foreseeable time after revocation.
3. Likely Impact
We have found that revocation of the order on EMD from Australia is unlikely to result in a significant volume of subject imports from Australia or significant adverse price effects on the domestic industry after revocation. In the absence of a significant volume of imports or adverse price effects, subject imports from Australia would not likely have a significant adverse impact on the domestic industry after revocation. Consequently, we conclude that that if the
171 Because there is no current or likely production of the subject merchandise in Australia, there is no excess capacity to produce such merchandise and no capability to engage in product shifting, and barriers to entry in other markets are irrelevant. Responding U.S. importers reported no inventories of subject imports from Australia during the period or review, and have no plans to import EMD from Australia after December 31, 2013. CR/PR at Tables IV‐3‐4. The record does not indicate that there are inventories of subject merchandise in Australia.
27
order were revoked, subject imports from Australia would not likely lead to the continuation or recurrence of material injury to the domestic industry within a reasonably foreseeable time.
Conclusion V.
For the foregoing reasons, we determine that revocation of the antidumping duty order on EMD from China would be likely to lead to continuation or recurrence of material injury to an industry in the United States within a reasonably foreseeable time. We also determine that revocation of the antidumping duty order on EMD from Australia would not be likely to lead to continuation or recurrence of material injury to an industry in the United States within a reasonably foreseeable time.

I‐1
PART I: INTRODUCTION
BACKGROUND
On September 3, 2013, the U.S. International Trade Commission (“Commission” or “USITC”) gave notice, pursuant to section 751(c) of the Tariff Act of 1930, as amended (“the Act”),1 that it had instituted review(s) to determine whether revocation of the antidumping duty orders on electrolytic manganese dioxide (“EMD”) from Australia and/or China would likely lead to the continuation or recurrence of material injury to a domestic industry.2 3 On December 20, 2013, the Commission determined that it would conduct full reviews pursuant to section 751(c)(5) of the Act. 4 The following tabulation presents information relating to the background and schedule of this proceeding:5
1 19 U.S.C. 1675(c). 2 Electrolytic Manganese Dioxide from Australia and China; Institution of Five‐Year Reviews, 78 FR
54269, September 3, 2013. All interested parties were requested to respond to this notice by submitting the information requested by the Commission.
3 In accordance with section 751(c) of the Act, the U.S. Department of Commerce (“Commerce”) published a notice of initiation of five‐year reviews of the subject antidumping and countervailing duty orders concurrently with the Commission’s notice of institution. Institution of Five‐Year Reviews, 78 FR 54237, September 3, 2013.
4 Electrolytic Manganese Dioxide from Australia and China; Notice of Commission Determination to Conduct Full Five‐Year Reviews and Scheduling of Full Five‐Year Reviews Concerning the Antidumping Duty Orders on Electrolytic Manganese Dioxide From Australia and China, 79 FR 30163, May 27, 2014. On December 20, 2013, the Commission determined that the domestic interested party group response was adequate and that the respondent interested party group response was inadequate with respect to both orders under review. The Commission found that circumstances warranted conducting full reviews notwithstanding the inadequate respondent interested party response.
5 The Commission’s notice of institution, notice to conduct full reviews, scheduling notice, and statement on adequacy are referenced in appendix A and may also be found at the Commission’s web site (internet address www.usitc.gov). Commissioners’ votes on whether to conduct expedited or full reviews may also be found at the web site. Appendix B is reserved for the witnesses appearing at the Commission’s hearing.
I‐2
Effective date Action
October 7, 2008 Commerce’s antidumping duty order on EMD from Australia (73 FR 58538)
October 7, 2008 Commerce’s antidumping duty order on EMD from China (73 FR 58537)
September 3, 2013 Commission’s institution of five‐year reviews (78 FR 54269)
September 1, 2013 Commerce’s initiation of five‐year reviews (78 FR 54237, September 3, 2013)
May 19, 2014 Commission’s determinations to conduct full five‐year reviews and scheduling of full five‐year reviews (79 FR 30163, May 27, 2014)
February 3, 2014 Commerce’s final results of expedited five‐year reviews of the antidumping duty orders (79 FR 6162)
October 21, 2014 Commission’s hearing
December 2, 2014 Commission’s vote
December 15, 2014 Commission’s determinations and views to Commerce
The original investigations
The original investigations resulted from petitions filed by Tronox LLC (“Tronox”), Oklahoma City, OK, on August 22, 2007, alleging that an industry in the United States is materially injured and threatened with material injury by reason of less‐than‐fair‐value (“LTFV”) imports of EMD from Australia and China. Following notifications of final determinations by Commerce that imports of EMD from Australia and China were being sold at LTFV, the Commission determined on September 12, 2008 that a domestic industry was materially injured by reason of LTFV imports of EMD from Australia and China.6 Commerce published the antidumping duty orders on subject imports of EMD from Australia and China on October 7, 2008.7
RELATED INVESTIGATIONS
On May 31, 1988, the Commission instituted antidumping investigations on EMD (defined as in the present reviews) from Greece, Ireland, and Japan.8 On April 10, 1989, the Commission issued its final affirmative determinations with regard to imports of EMD from
6 Electrolytic Manganese Dioxide from Australia and China, Inv. Nos. 731‐TA‐1124 and 1125 (Final), USITC Publication 4036 (September 2008).
7 Antidumping Duty Order: Electrolytic Manganese Dioxide from Australia, 73 FR 58538, October 7, 2008; Antidumping Duty Order: Electrolytic Manganese Dioxide from China, 73 FR 58537, October 7, 2008.
8 Notice of Institution on Antidumping Duty Investigations: Electrolytic Manganese Dioxide from Greece, Ireland, and Japan, 53 FR 21530, June 8, 1988.
I‐3
Greece and Japan,9 and on April 17, 1989, Commerce issued antidumping duty orders on EMD from Greece and Japan.10 On May 26, 1998, Eveready (referred to as Energizer in this report) filed with the Commission a request for a changed circumstances review with regard to imports from Greece pursuant to section 751 (b) of the Act.11 The Commission determined that the request did not show changed circumstances sufficient to warrant a review.12 Eveready appealed the Commission’s determination to the Court of International Trade. The Commission moved to dismiss the appeal, which was granted on the basis that an upcoming five‐year review of the orders would provide the equivalent relief Eveready sought.13 On May 3, 1999, the Commission instituted five‐year reviews to determine whether revocation of the antidumping duty orders on imports of EMD from Greece and Japan would likely lead to the continuation or recurrence of material injury to the domestic EMD industry.14 On April 20, 2000, the Commission determined that revocation would not likely lead to continuation or recurrence of material injury to the U.S. industry, and the orders were subsequently revoked.15
On July 31, 2003, the Commission instituted antidumping investigations on EMD from Australia, China, Greece, Ireland, Japan, and South Africa.16 On September 15, 2003, the Commission made affirmative preliminary determinations on EMD from Australia, Greece, Ireland, Japan, and South Africa, and determined that imports from China were negligible, thus ending the investigation concerning EMD from China.17 On March 2, 2004, The Commission received notice from Commerce stating that it had received a letter from Petitioner Kerr‐McGee Chemical LLC (now Tronox) withdrawing its petitions. As a result, Commerce and the Commission terminated their respective investigations.
9 Electrolytic Manganese Dioxide from Greece and Japan, Investigation Nos. 731‐TA‐406 and 408 (Final), USITC Publication 2177 (April 1989), p. 1. Commerce determined that there were no LTFV imports of EMD from Ireland, and the investigation concerning Ireland was terminated.
10 54 FR 15244, April 17, 1989. 11 In its request, Eveready, alleged the following changed circumstances: (1) the addition of a third
recognized type of EMD – “high drain” EMD; (2) structural changes in battery consumption (a shift from C and D size batteries to smaller AA and AAA size batteries); and (3) the impending unavailability of supply of regular and “high drain” EMD from U.S. producers and producers in countries not subject to antidumping duty orders.
12 63, FR 43192, August 12, 1998. 13 Eveready Battery Co., Inc. v. United States, Slip. Op. 99‐126 (CIT, November 23, 1999). 14 Notice of Institution of Five‐Year Reviews: Electrolytic Manganese Dioxide from Greece and Japan,
64 FR 23675, May 3, 1999. The Commission determined to conduct full five‐year reviews on these orders. 64 FR 46407, August 25, 1999.
15 Electrolytic Manganese Dioxide from Greece and Japan, Investigation Nos. 731‐TA‐406 and 408 (Review), USITC Publication 3296 (May 2000), p. 1.
16 Notice of Institution of Antidumping Duty Investigations: Electrolytic Manganese Dioxide from Australia, China, Greece, Ireland, Japan, and South Africa, 68 FR 47607, August 11, 2003.
17 68 FR 55062, September 22, 2003.
I‐4
SUMMARY DATA
Table I‐1 presents a summary of data from the original investigations and the current full five‐year reviews. Table I-1 EMD: Comparative data from the original investigations and current review, 2005-2007, 2008-2013, January-June 2013, and January-June 2014
* * * * * * *
Statutory criteria and organization of the report
Statutory criteria
Section 751(c) of the Act requires Commerce and the Commission to conduct a review no later than five years after the issuance of an antidumping or countervailing duty order or the suspension of an investigation to determine whether revocation of the order or termination of the suspended investigation “would be likely to lead to continuation or recurrence of dumping or a countervailable subsidy (as the case may be) and of material injury.”
Section 752(a) of the Act provides that in making its determination of likelihood of continuation or recurrence of material injury‐‐
(1) IN GENERAL.‐‐ . . . the Commission shall determine whether revocation of an order, or termination of a suspended investigation, would be likely to lead to continuation or recurrence of material injury within a reasonably foreseeable time. The Commission shall consider the likely volume, price effect, and impact of imports of the subject merchandise on the industry if the order is revoked or the suspended investigation is terminated. The Commission shall take into account‐‐
(A) its prior injury determinations, including the volume, price effect, and impact of imports of the subject merchandise on the industry before the order was issued or the suspension agreement was accepted, (B) whether any improvement in the state of the industry is related to the order or the suspension agreement, (C) whether the industry is vulnerable to material injury if the order is revoked or the suspension agreement is terminated, and (D) in an antidumping proceeding . . ., (Commerce’s findings) regarding duty absorption . . . .
(2) VOLUME.‐‐In evaluating the likely volume of imports of the subject merchandise if the order is revoked or the suspended investigation is terminated, the Commission shall consider whether the likely volume of imports of the subject merchandise would be significant if the order is revoked or the suspended investigation is terminated, either in absolute terms or relative to
I‐5
production or consumption in the United States. In so doing, the Commission shall consider all relevant economic factors, including‐‐
(A) any likely increase in production capacity or existing unused production capacity in the exporting country, (B) existing inventories of the subject merchandise, or likely increases in inventories, (C) the existence of barriers to the importation of such merchandise into countries other than the United States, and (D) the potential for product‐shifting if production facilities in the foreign country, which can be used to produce the subject merchandise, are currently being used to produce other products.
(3) PRICE.‐‐In evaluating the likely price effects of imports of the subject merchandise if the order is revoked or the suspended investigation is terminated, the Commission shall consider whether‐‐
(A) there is likely to be significant price underselling by imports of the subject merchandise as compared to domestic like products, and (B) imports of the subject merchandise are likely to enter the United States at prices that otherwise would have a significant depressing or suppressing effect on the price of domestic like products.
(4) IMPACT ON THE INDUSTRY.‐‐In evaluating the likely impact of imports of the subject merchandise on the industry if the order is revoked or the suspended investigation is terminated, the Commission shall consider all relevant economic factors which are likely to have a bearing on the state of the industry in the United States, including, but not limited to‐‐
(A) likely declines in output, sales, market share, profits, productivity, return on investments, and utilization of capacity, (B) likely negative effects on cash flow, inventories, employment, wages, growth, ability to raise capital, and investment, and (C) likely negative effects on the existing development and production efforts of the industry, including efforts to develop a derivative or more advanced version of the domestic like product.
The Commission shall evaluate all such relevant economic factors . . . within the context of the business cycle and the conditions of competition that are distinctive to the affected industry.
Section 752(a)(6) of the Act states further that in making its determination, “the Commission may consider the magnitude of the margin of dumping or the magnitude of the net countervailable subsidy. If a countervailable subsidy is involved, the Commission shall consider information regarding the nature of the countervailable subsidy and whether the subsidy is a subsidy described in Article 3 or 6.1 of the Subsidies Agreement.”
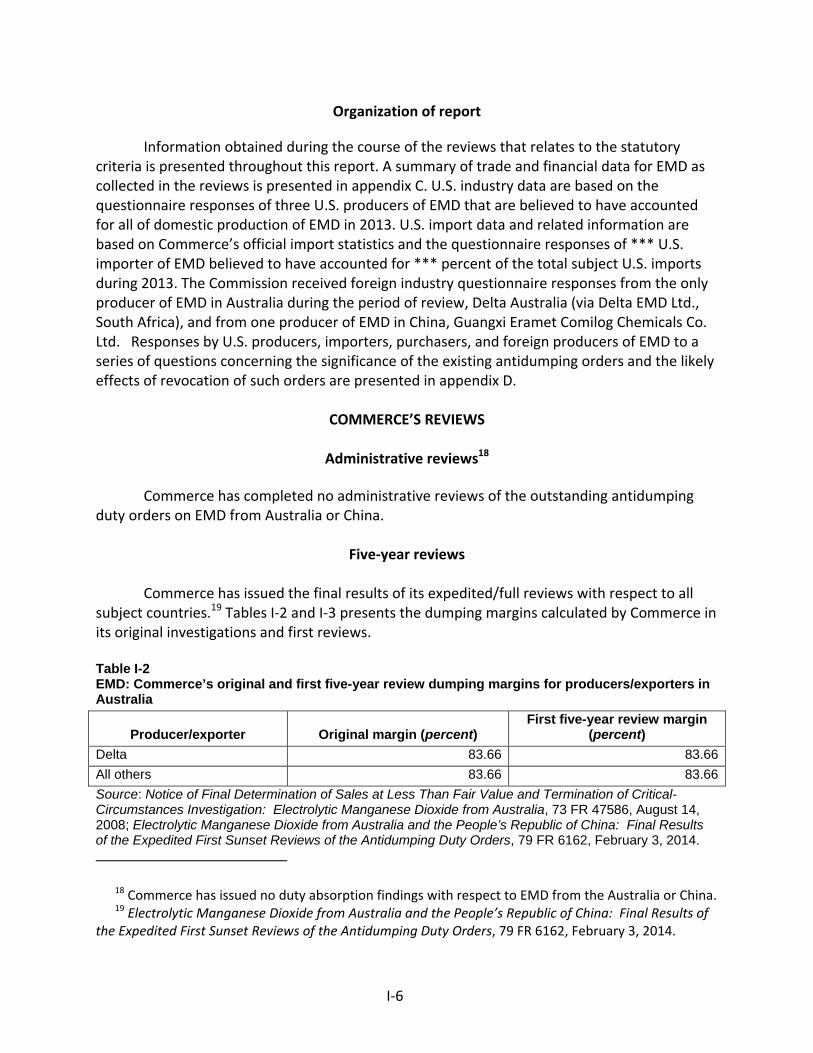
I‐6
Organization of report
Information obtained during the course of the reviews that relates to the statutory criteria is presented throughout this report. A summary of trade and financial data for EMD as collected in the reviews is presented in appendix C. U.S. industry data are based on the questionnaire responses of three U.S. producers of EMD that are believed to have accounted for all of domestic production of EMD in 2013. U.S. import data and related information are based on Commerce’s official import statistics and the questionnaire responses of *** U.S. importer of EMD believed to have accounted for *** percent of the total subject U.S. imports during 2013. The Commission received foreign industry questionnaire responses from the only producer of EMD in Australia during the period of review, Delta Australia (via Delta EMD Ltd., South Africa), and from one producer of EMD in China, Guangxi Eramet Comilog Chemicals Co. Ltd. Responses by U.S. producers, importers, purchasers, and foreign producers of EMD to a series of questions concerning the significance of the existing antidumping orders and the likely effects of revocation of such orders are presented in appendix D.
COMMERCE’S REVIEWS
Administrative reviews18
Commerce has completed no administrative reviews of the outstanding antidumping duty orders on EMD from Australia or China.
Five‐year reviews Commerce has issued the final results of its expedited/full reviews with respect to all
subject countries.19 Tables I‐2 and I‐3 presents the dumping margins calculated by Commerce in its original investigations and first reviews.
Table I-2 EMD: Commerce’s original and first five-year review dumping margins for producers/exporters in Australia
Producer/exporter Original margin (percent) First five-year review margin
(percent)
Delta 83.66 83.66
All others 83.66 83.66
Source: Notice of Final Determination of Sales at Less Than Fair Value and Termination of Critical-Circumstances Investigation: Electrolytic Manganese Dioxide from Australia, 73 FR 47586, August 14, 2008; Electrolytic Manganese Dioxide from Australia and the People’s Republic of China: Final Results of the Expedited First Sunset Reviews of the Antidumping Duty Orders, 79 FR 6162, February 3, 2014.
18 Commerce has issued no duty absorption findings with respect to EMD from the Australia or China. 19 Electrolytic Manganese Dioxide from Australia and the People’s Republic of China: Final Results of
the Expedited First Sunset Reviews of the Antidumping Duty Orders, 79 FR 6162, February 3, 2014.
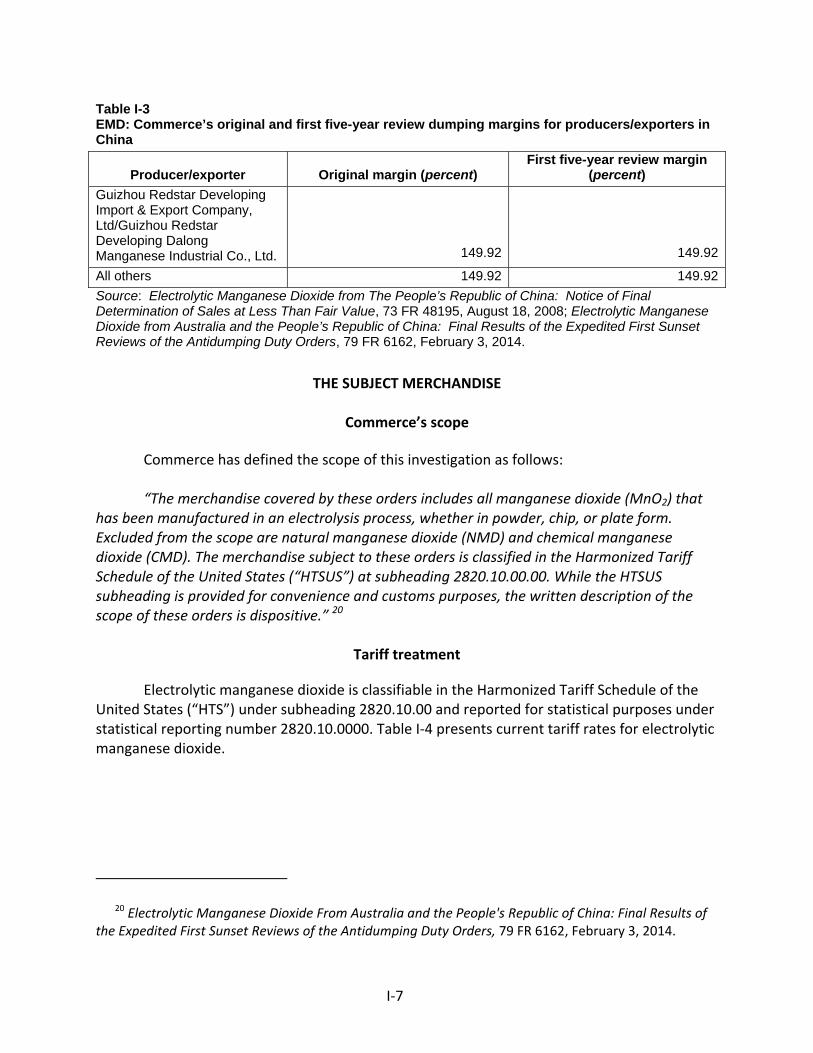
I‐7
Table I-3 EMD: Commerce’s original and first five-year review dumping margins for producers/exporters in China
Producer/exporter Original margin (percent) First five-year review margin
(percent)
Guizhou Redstar Developing Import & Export Company, Ltd/Guizhou Redstar Developing Dalong Manganese Industrial Co., Ltd. 149.92 149.92
All others 149.92 149.92
Source: Electrolytic Manganese Dioxide from The People’s Republic of China: Notice of Final Determination of Sales at Less Than Fair Value, 73 FR 48195, August 18, 2008; Electrolytic Manganese Dioxide from Australia and the People’s Republic of China: Final Results of the Expedited First Sunset Reviews of the Antidumping Duty Orders, 79 FR 6162, February 3, 2014.
THE SUBJECT MERCHANDISE
Commerce’s scope
Commerce has defined the scope of this investigation as follows:
“The merchandise covered by these orders includes all manganese dioxide (MnO2) that has been manufactured in an electrolysis process, whether in powder, chip, or plate form. Excluded from the scope are natural manganese dioxide (NMD) and chemical manganese dioxide (CMD). The merchandise subject to these orders is classified in the Harmonized Tariff Schedule of the United States (“HTSUS”) at subheading 2820.10.00.00. While the HTSUS subheading is provided for convenience and customs purposes, the written description of the scope of these orders is dispositive.” 20
Tariff treatment
Electrolytic manganese dioxide is classifiable in the Harmonized Tariff Schedule of the United States (“HTS”) under subheading 2820.10.00 and reported for statistical purposes under statistical reporting number 2820.10.0000. Table I‐4 presents current tariff rates for electrolytic manganese dioxide.
20 Electrolytic Manganese Dioxide From Australia and the People's Republic of China: Final Results of the Expedited First Sunset Reviews of the Antidumping Duty Orders, 79 FR 6162, February 3, 2014.
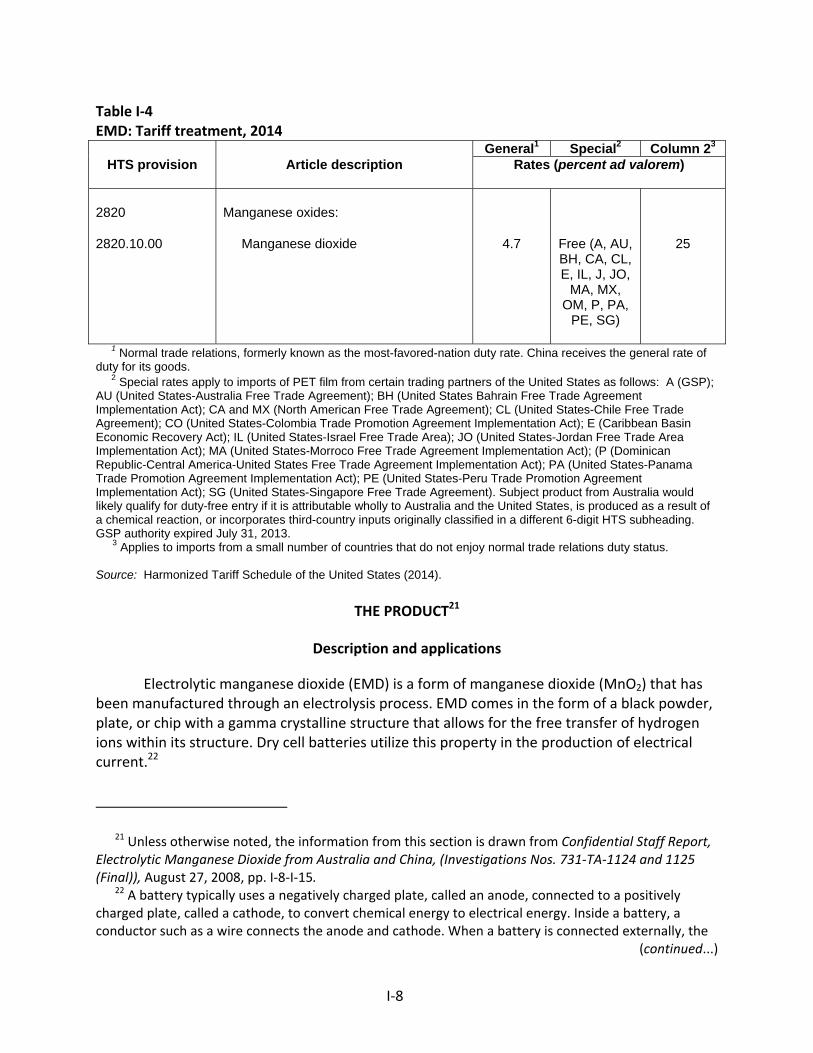
I‐8
Table I‐4 EMD: Tariff treatment, 2014
HTS provision Article description General1 Special2 Column 23
Rates (percent ad valorem)
2820
2820.10.00
Manganese oxides:
Manganese dioxide
4.7
Free (A, AU, BH, CA, CL, E, IL, J, JO,
MA, MX, OM, P, PA,
PE, SG)
25
1 Normal trade relations, formerly known as the most-favored-nation duty rate. China receives the general rate of duty for its goods. 2 Special rates apply to imports of PET film from certain trading partners of the United States as follows: A (GSP); AU (United States-Australia Free Trade Agreement); BH (United States Bahrain Free Trade Agreement Implementation Act); CA and MX (North American Free Trade Agreement); CL (United States-Chile Free Trade Agreement); CO (United States-Colombia Trade Promotion Agreement Implementation Act); E (Caribbean Basin Economic Recovery Act); IL (United States-Israel Free Trade Area); JO (United States-Jordan Free Trade Area Implementation Act); MA (United States-Morroco Free Trade Agreement Implementation Act); (P (Dominican Republic-Central America-United States Free Trade Agreement Implementation Act); PA (United States-Panama Trade Promotion Agreement Implementation Act); PE (United States-Peru Trade Promotion Agreement Implementation Act); SG (United States-Singapore Free Trade Agreement). Subject product from Australia would likely qualify for duty-free entry if it is attributable wholly to Australia and the United States, is produced as a result of a chemical reaction, or incorporates third-country inputs originally classified in a different 6-digit HTS subheading. GSP authority expired July 31, 2013. 3 Applies to imports from a small number of countries that do not enjoy normal trade relations duty status. Source: Harmonized Tariff Schedule of the United States (2014).
THE PRODUCT21
Description and applications
Electrolytic manganese dioxide (EMD) is a form of manganese dioxide (MnO2) that has been manufactured through an electrolysis process. EMD comes in the form of a black powder, plate, or chip with a gamma crystalline structure that allows for the free transfer of hydrogen ions within its structure. Dry cell batteries utilize this property in the production of electrical current.22
21 Unless otherwise noted, the information from this section is drawn from Confidential Staff Report, Electrolytic Manganese Dioxide from Australia and China, (Investigations Nos. 731‐TA‐1124 and 1125 (Final)), August 27, 2008, pp. I‐8‐I‐15.
22 A battery typically uses a negatively charged plate, called an anode, connected to a positively charged plate, called a cathode, to convert chemical energy to electrical energy. Inside a battery, a conductor such as a wire connects the anode and cathode. When a battery is connected externally, the
(continued...)
I‐9
There are three grades of EMD, depending on intended battery end use: alkaline, zinc chloride, or lithium. These grades differ from each other in characteristics achieved in the finishing process, including particle size (grind) and pH. Other properties, including purity; crystalline structure; and content of moisture, sulfate and other metallic elements are similar for the three grades. Virtually all EMD produced in the United States is alkaline grade.
Within each EMD grade, there are quality differences. Higher quality EMD has lower level of impurities, superior flow characteristics of materials within the battery, and higher energy capacity per unit weight. EMD quality is only one factor out of many contributing to the quality of a finished battery.
Battery manufacturers require consistency of EMD parameters such as moisture content, pH, and particle size both within a lot and between lots to ensure uniform performance of the final product. It is important that impurities (or “gassing agents,” such as iron, molybdenum, lead, and antimony) are within specifications to prevent battery leakage, as it is generally these electrochemical properties and the purity of EMD that determine battery discharge performance.
In addition to EMD, there are two other types of manganese dioxide, both of which can be used in dry‐cell batteries: natural manganese dioxide (NMD) and chemical manganese dioxide (CMD). NMD consists of certain naturally occurring manganese ore, selected because of its high MnO2 content, favorable electrochemical properties, and low level of impurities. The ore is often processed to remove impurities and improve battery activity. NMD has a lower performance rate than EMD or CMD but this drawback may be partially overcome because NMD may be blended with synthetic manganese dioxide for increased performance. NMD is not produced in the United States today, only small amounts (if any) are imported, and NMD is not within the scope of the orders under review.
CMD is chemically precipitated, battery‐active manganese dioxide. CMD differs from EMD in three major respects: surface area, electrolyte absorption, and density. CMD is inferior in quality to EMD and is used outside the United States in lower‐performance batteries. CMD is not known to be used domestically in batteries and is not within the scope of the orders under review.
Before EMD can be used in a battery, a sample is tested extensively (“qualification”). The most important tests that an EMD producer or consumer uses to determine EMD quality are (1) discharge performance tests, (2) gassing tests, and (3) tests to measure the compressed density of the EMD. The discharge performance test measures how long a battery will maintain useful voltage for a given load and rate of discharge. This test essentially provides information on the number of hours of service a battery will provide. The gassing test estimates the level of
(…continued) resulting circuit causes electrons to flow from the anode to the cathode (while, simultaneously, an electrolyte in the battery preserves electroneutrality).
In an alkaline battery (so named due to the usage of potassium hydroxide, a strong alkali, as the electrolyte), the anode is made of powdered amalgamated zinc while the cathode consists of a blend of EMD and graphite. Alkaline batteries can deliver more current and have longer shelf lives than zinc‐carbon and zinc‐chloride batteries.
I‐10
impurities that could reduce the shelf life of the battery. Compressed density tests indicate electrical capacity by determining how much EMD can be used within the limited volume of the battery.
Although a given sample of EMD may perform satisfactorily when subjected to standard tests such as the discharge performance test, it cannot be used commercially in a specific battery unless it also is qualified for use in that battery. The qualification process is both battery‐specific, and depending on the battery producer can take 6 to 16 months. Qualification standards for EMD used in AA and AAA batteries are also reported to be more stringent than standards for EMD used in C and D batteries.23 In general, the former standards are higher because smaller‐battery performance is more dependent on EMD discharge quality than that of larger batteries. The qualification process ensures that the processing equipment used to manufacture a given battery is compatible with the type of EMD to be used to optimize battery performance. The qualification process entails physical and chemical analysis of the EMD, followed by model shop tests and plant scale trials.
In the original investigations, Tronox contended that EMD is a commodity‐like product, with all products interchangeable after passing a qualification process. Respondents asserted that EMD is not a commodity and Spectrum noted the importance of non‐price characteristics including grain size, uniformity, purity, abrasiveness, pH, and moisture.
Manufacturing processes
All types of EMD are subject to the same three stages of production: ore handling, electrolysis, and finishing. In the first stage, either manganese dioxide or manganese carbonate ore is prepared for electrolysis. In a process known as roasting, manganese dioxide ore is crushed and fed into reduction furnaces that convert manganese dioxide into manganese oxide (MnO), called reduced ore. Manganese carbonate ore does not require this reduction process. The ore is then digested continuously in spent electrolyte and sulfuric acid to leach out manganese. The resulting manganese sulfate solution is purified to remove impurities (such as copper, nickel, cobalt, molybdenum, antimony, and arsenic), that, in a battery, negatively affect performance by depositing on a zinc anode.
In the second stage, electrolysis, manganese dioxide is separated from the rest of the manganese sulfate solution produced in the ore handling phase. The manganese sulfate solution is processed through filters and thickeners, then fed into an electrolytic cell where manganese dioxide deposits on titanium anodes while hydrogen is liberated at the cathode (made of lead or carbon). Electrolysis lasts from two to four weeks.
In the finishing process, the anodes are removed from the electrolytic cells and immersed in hot water to remove the electrolyte solution. EMD is then removed from the anodes, washed and neutralized. Neutralization determines the final pH of the EMD. EMD is in plate or chip form when removed from the anodes and neutralized. Before usage in batteries, EMD must be ground to a powder, a process usually performed by EMD producers. Prior to
23 ***.
I‐11
shipment, EMD is dried and packed according to customer specification, including adjustments such as modifying particle size distribution, compressed density, and abrasiveness.
In the original investigations ***. Australian company Mesa notes on its website that it has a patented process for ore processing that uses 50 percent less energy and produces fewer pollutants.24 Chinese producer Guanxi has filed a U.S. patent application for a process to use lower‐grade manganese ores common in China for EMD production.25
In response to U.S. producer’s questionnaire section II‐6 for these five‐year reviews, on whether firms are able to switch production capacity between EMD and other products using the same equipment and/or labor, ***.
DOMESTIC LIKE PRODUCT ISSUES
In its original determination, the Commission defined the domestic like product as all EMD meeting the description specified in the scope of the investigation.26 In its notice of institution in these current five‐year reviews, the Commission solicited comments from interested parties regarding the appropriate domestic like product and domestic industry.27 Two domestic interested parties commented on the Commission’s definition of the domestic like product and indicated that they agreed with the Commission’s definition of the domestic like product.28 No party requested that the Commission collect data concerning other possible domestic like products in their comments on the Commission’s draft questionnaires.29 No party addressed appropriate domestic like product and domestic industry in their prehearing or posthearing briefs.
U.S. MARKET PARTICIPANTS
U.S. producers
During the original investigations, three firms supplied the Commission with information on their U.S. operations with respect to EMD. These firms accounted for all of U.S. production of EMD in 2007.30 In these current proceedings, the Commission issued U.S. producers’ questionnaires to three firms, all of which provided the Commission with information on their
24Mesa Minerals Limited website, http://mesaminerals.com.au/, accessed September 15, 2014. 25 U.S. Patent Application Publication No. US 2013/0037416, Feb 14, 2013. 26 Electrolytic Manganese Dioxide from Australia and China, Inv. Nos. 731‐TA‐1124 and 1125 (Final),
USITC Publication 4036 (September 2008), p. 5. 27 Electrolytic Manganese Dioxide from Australia and China; Institution of Five‐Year Reviews, 78 FR
54269, September 3, 2014. 28 Substantive Response of Erachem Comilog, Inc., October 18, 2013, p. 13; Substantive Response of
Tronox LLC, October 17, 2013, p. 13 29 Tronox’s and Erachem’s Comments Concerning Draft Questionnaires, June 30, 2014. 30 The three U.S. producers that supplied the Commission with usable questionnaire information
during the original investigations were Energizer, Erachem, and Tronox.
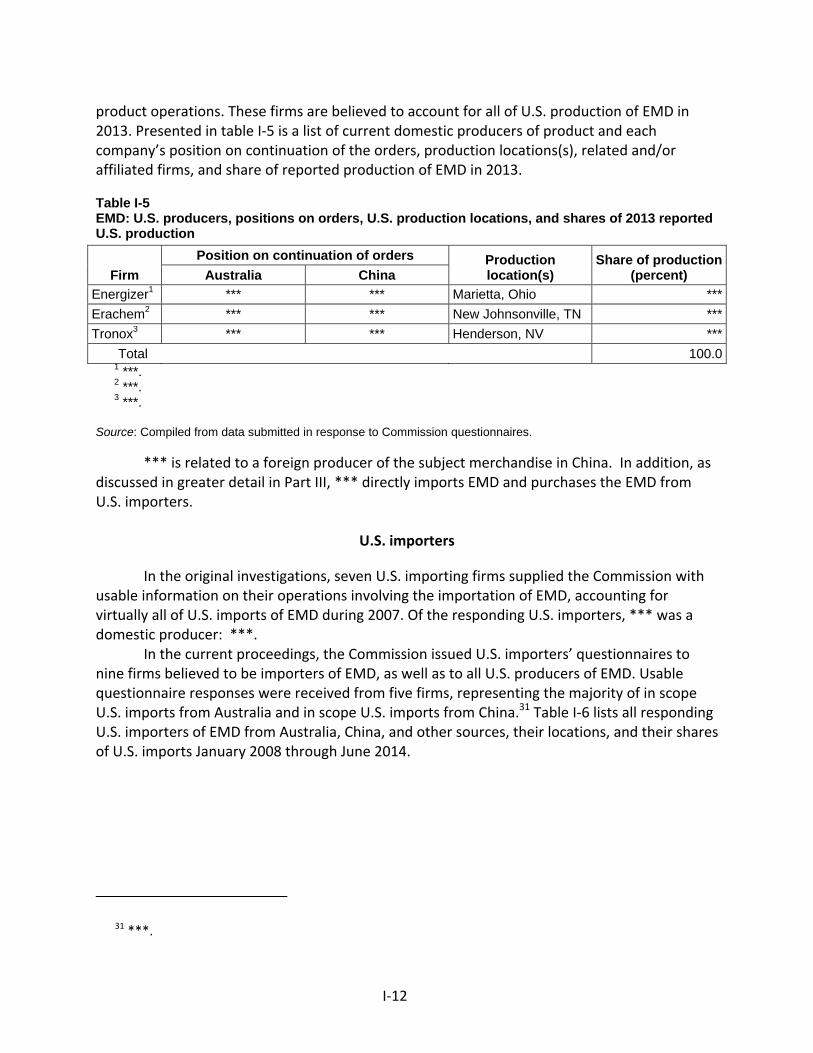
I‐12
product operations. These firms are believed to account for all of U.S. production of EMD in 2013. Presented in table I‐5 is a list of current domestic producers of product and each company’s position on continuation of the orders, production locations(s), related and/or affiliated firms, and share of reported production of EMD in 2013.
Table I-5 EMD: U.S. producers, positions on orders, U.S. production locations, and shares of 2013 reported U.S. production
Firm
Position on continuation of orders Production location(s)
Share of production (percent) Australia China
Energizer1 *** *** Marietta, Ohio ***
Erachem2 *** *** New Johnsonville, TN ***
Tronox3 *** *** Henderson, NV ***
Total 100.0 1 ***. 2 ***. 3 ***. Source: Compiled from data submitted in response to Commission questionnaires.
*** is related to a foreign producer of the subject merchandise in China. In addition, as discussed in greater detail in Part III, *** directly imports EMD and purchases the EMD from U.S. importers.
U.S. importers
In the original investigations, seven U.S. importing firms supplied the Commission with usable information on their operations involving the importation of EMD, accounting for virtually all of U.S. imports of EMD during 2007. Of the responding U.S. importers, *** was a domestic producer: ***.
In the current proceedings, the Commission issued U.S. importers’ questionnaires to nine firms believed to be importers of EMD, as well as to all U.S. producers of EMD. Usable questionnaire responses were received from five firms, representing the majority of in scope U.S. imports from Australia and in scope U.S. imports from China.31 Table I‐6 lists all responding U.S. importers of EMD from Australia, China, and other sources, their locations, and their shares of U.S. imports January 2008 through June 2014.
31 ***.
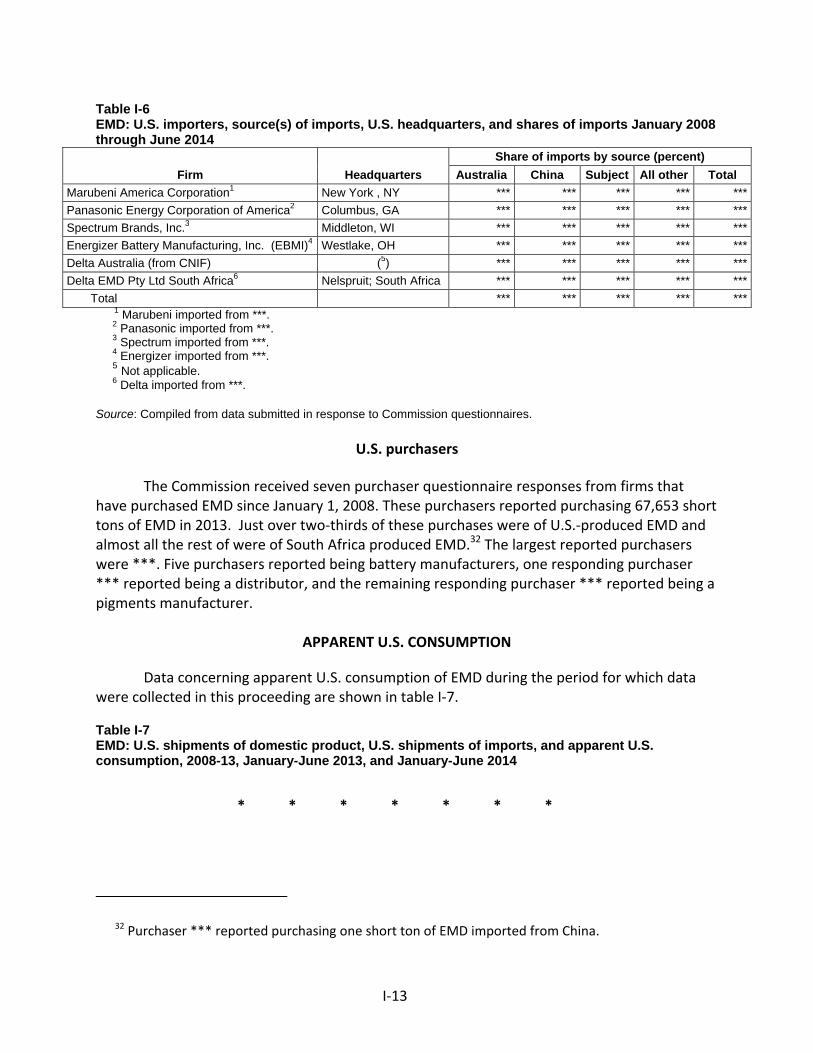
I‐13
Table I-6 EMD: U.S. importers, source(s) of imports, U.S. headquarters, and shares of imports January 2008 through June 2014
Firm Headquarters
Share of imports by source (percent)
Australia China Subject All other Total
Marubeni America Corporation1 New York , NY *** *** *** *** ***
Panasonic Energy Corporation of America2 Columbus, GA *** *** *** *** ***
Spectrum Brands, Inc.3 Middleton, WI *** *** *** *** ***
Energizer Battery Manufacturing, Inc. (EBMI)4 Westlake, OH *** *** *** *** ***
Delta Australia (from CNIF) (5) *** *** *** *** ***
Delta EMD Pty Ltd South Africa6 Nelspruit; South Africa *** *** *** *** ***
Total *** *** *** *** *** 1 Marubeni imported from ***. 2 Panasonic imported from ***. 3 Spectrum imported from ***. 4 Energizer imported from ***. 5 Not applicable. 6 Delta imported from ***. Source: Compiled from data submitted in response to Commission questionnaires.
U.S. purchasers
The Commission received seven purchaser questionnaire responses from firms that have purchased EMD since January 1, 2008. These purchasers reported purchasing 67,653 short tons of EMD in 2013. Just over two‐thirds of these purchases were of U.S.‐produced EMD and almost all the rest of were of South Africa produced EMD.32 The largest reported purchasers were ***. Five purchasers reported being battery manufacturers, one responding purchaser *** reported being a distributor, and the remaining responding purchaser *** reported being a pigments manufacturer.
APPARENT U.S. CONSUMPTION
Data concerning apparent U.S. consumption of EMD during the period for which data were collected in this proceeding are shown in table I‐7.
Table I-7 EMD: U.S. shipments of domestic product, U.S. shipments of imports, and apparent U.S. consumption, 2008-13, January-June 2013, and January-June 2014
* * * * * * *
32 Purchaser *** reported purchasing one short ton of EMD imported from China.
I‐14
U.S. MARKET SHARES
U.S. market share data are presented in table I‐8.
Table I-8 EMD: U.S. consumption and market shares, 2008-13, January-June 2013, and January-June 2014
* * * * * * *
II‐1
PART II: CONDITIONS OF COMPETITION IN THE U.S. MARKET
U.S. MARKET CHARACTERISTICS
EMD is used almost exclusively in the production of dry‐cell batteries, primarily alkaline batteries. There reportedly is a market developing for lithiated manganese oxide that utilizes EMD in electric vehicles and hybrid electric vehicles. However, many firms indicate that demand for EMD has decreased due to the moving of battery production outside the United States such as the closing of Energizer’s battery plant in the United States.1
CHANNELS OF DISTRIBUTION
There were no within scope imports of EMD from Australia or China after 2008. U.S. producers and U.S. importers sold EMD exclusively to end users, as shown in table II‐1.
GEOGRAPHIC DISTRIBUTION
U.S. producers reported selling EMD *** (table II‐2).2 Roughly 58 percent of these sales were between 101 and 1,000 miles from the U.S. producers’ production facilities, and just over 42 percent were over 1,000 miles.
Table II-1 EMD: U.S. producers’ and importers’ share of reported U.S. shipments (percent), by sources and channels of distribution, 2008-2013, January-June 2013, and January–June 2014
* * * * * * *
1 Domestic interested parties dispute that the decline in EMD demand is due to the offshoring of battery production and claim that the decline has primarily resulted from ***. (Domestic Interested Parties Posthearing Brief, Responses to Additional Posthearing Questions at 26.) Domestic interested parties believe that ***. (See Table III‐1.)
2 However, purchaser *** reported that its only establishment was in the northeast.
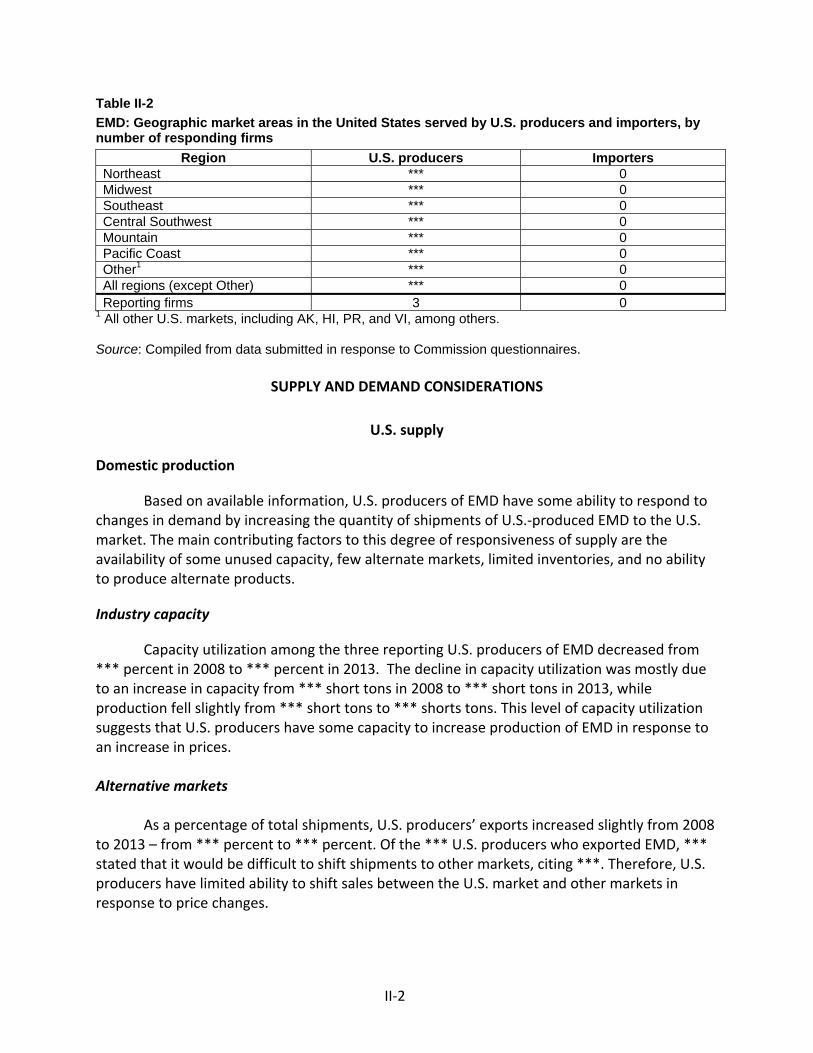
II‐2
Table II-2
EMD: Geographic market areas in the United States served by U.S. producers and importers, by number of responding firms
Region U.S. producers Importers Northeast *** 0 Midwest *** 0 Southeast *** 0 Central Southwest *** 0 Mountain *** 0 Pacific Coast *** 0 Other1 *** 0 All regions (except Other) *** 0 Reporting firms 3 0
1 All other U.S. markets, including AK, HI, PR, and VI, among others. Source: Compiled from data submitted in response to Commission questionnaires.
SUPPLY AND DEMAND CONSIDERATIONS
U.S. supply
Domestic production
Based on available information, U.S. producers of EMD have some ability to respond to changes in demand by increasing the quantity of shipments of U.S.‐produced EMD to the U.S. market. The main contributing factors to this degree of responsiveness of supply are the availability of some unused capacity, few alternate markets, limited inventories, and no ability to produce alternate products.
Industry capacity
Capacity utilization among the three reporting U.S. producers of EMD decreased from *** percent in 2008 to *** percent in 2013. The decline in capacity utilization was mostly due to an increase in capacity from *** short tons in 2008 to *** short tons in 2013, while production fell slightly from *** short tons to *** shorts tons. This level of capacity utilization suggests that U.S. producers have some capacity to increase production of EMD in response to an increase in prices.
Alternative markets
As a percentage of total shipments, U.S. producers’ exports increased slightly from 2008
to 2013 – from *** percent to *** percent. Of the *** U.S. producers who exported EMD, *** stated that it would be difficult to shift shipments to other markets, citing ***. Therefore, U.S. producers have limited ability to shift sales between the U.S. market and other markets in response to price changes.
II‐3
Inventory levels
U.S. producers’ ratio of inventories to total shipments decreased from *** percent to *** percent during 2008‐2013. These inventory levels suggest that U.S. producers have limited ability to respond to changes in demand with changes in the quantity shipped from inventories.
Production alternatives
All three of the responding U.S. producers reported that they exclusively produce EMD at their facilities, and that they would not be able to switch production (capacity) between EMD and other products.
Supply constraints
None of the three responding U.S. producers indicated that they failed in attempts to fully or partially supply EMD to their customers. While none of the U.S. purchasers indicated that a supplier had failed to supply them fully, three of seven responded that a supplier had failed to supply them partially. *** identified *** as having experienced operational inefficiencies during production that caused a supply shortfall in 2013. ***. A third firm, ***, reported that a South African producer had stopped supplying them during a qualification project in 2009.
Subject imports from Australia
There is limited information available about Australian imports. Although Delta Australia responded to the Commission questionnaire, the plant shut down in 2008 and imports of EMD from Australia effectively ceased. Global Trade Atlas data suggests that Australian global exports of EMD since 2009 are very small (see Part IV). Among the U.S. producers, all three responded that Australian supplies had diminished, and two of the three reported that some production in Australia had been shuttered as a result of the antidumping duty order. *** reported that it “***.”
Subject imports from China
The Commission received one questionnaire response from the Chinese producer ***. The *** questionnaire response and publically available information on the EMD industry in China, suggest that producers of EMD from China have the ability to respond to changes in demand with large changes in the quantity of exports of EMD to the U.S. market. The main contributing factor to the degree of responsiveness of supply is that Chinese producers utilized only 255,252 short tons of their 326,725 short tons capacity in 2013.
Industry capacity
*** capacity utilization remained *** over the period of review and did not drop below *** percent. *** capacity grew from *** short tons in 2008 to *** short tons in 2013. The relatively high level of capacity utilization combined with the doubling of capacity suggests that
II‐4
*** may have limited‐to‐moderate ability to increase production of product in response to an increase in prices.
Alternative markets
Despite an over *** percent increase in the volume of exports, *** exports, as a percentage of total shipments, increased over the period of review to *** percent in 2013. U.S. imports from China since 2008 have been minimal, decreasing from 597 shorts tons in 2008 to 0 short tons in 2013, with a total of only 0 short tons imported in the intervening years. *** primarily sells to its home market of China and other Asian countries.3 *** may have some ability to shift shipments between the U.S. market and other markets in response to price changes.
Inventory levels
*** inventories declined over the period of investigation to *** percent in 2013. These inventory levels suggest that *** may have some ability to respond to changes in demand with changes in the quantity shipped from inventories.
Production alternatives
*** stated that it could not switch production from EMD to other products.
Production constraints
*** reported that the number of cells and rate of plating EMD drives the production rate for EMD.
Nonsubject imports
The two largest nonsubject import sources of nonsubject imports from 2008‐2013 were, respectively, South Africa4 and Japan. In 2008 these two countries combined to account for 78.9 percent of nonsubject imports and 62.1 percent of all (including subject country) imports. Between 2009 and 2013, they accounted for between 90‐97 percent of all imports. South Africa alone accounted for 60‐70 percent of all imports between 2009 and 2013. Several firms indicated that Delta South Africa is planning on closing its facility in 2015.
3 At the hearing,*** indicated that ***. Hearing transcript, p. 96 (Manley). 4 South African EMD is not eligible for AGOA benefits. Erachem and Tronox’s posthearing brief, p. 16.
II‐5
New suppliers
Four out of six responding U.S. purchasers indicated that no new suppliers have entered the U.S. market since 2008, and none reported expecting additional entrants. Two firms that identified additional entrants both referenced a Colombian firm named Quintal.
U.S. demand
Based on available information, U.S. end users of EMD are likely to respond to changes in the price of EMD with small‐to‐moderate changes in their purchases of EMD. A major contributing factor to this level of responsiveness of demand is the apparent lack of any close substitutes for EMD and EMD’s relatively low‐to‐moderate cost share of EMD in the products which it is used.
End uses
EMD is used almost exclusively in the production of dry‐cell batteries, primarily alkaline batteries. As a result, U.S. demand for EMD is derived almost wholly from the downstream demand for U.S.‐produced alkaline batteries, which, in turn, is derived from demand for the electronic devices using these batteries, such as remote controls, electric vehicles, digital cameras, MP3 players, wall clocks, smoke alarms, flashlights, radios, etc. Although EMD production is not seasonal, shipment volumes of batteries can be affected by increases in battery consumption at Christmas and in response to natural disasters, such as hurricanes.
Two of three U.S. producers reported that EMD is also used in water treatment. *** indicated that there is a secondary EMD market for hazardous elements removal in fracking operations and in natural gas pipeline operations.5
One purchaser also indicated that there is a quickly developing market for lithiated manganese oxide that utilizes EMD in electric vehicles and hybrid electric vehicles. *** indicated that increasing growth in use of electric vehicles and hybrid electric vehicles may attract more and more of existing EMD capacity to EMD product extensions suitable for this industry. However, *** and other purchasers indicated that global electric vehicle demand has performed below expectations.
Business cycles
All three responding U.S. producers, two of five responding importers, and two of six responding purchasers indicated that the EMD market was subject to seasonal business cycles or distinctive conditions of competition. Many of these firms cited higher demand for battery‐powered flashlights during the hurricane season and battery‐powered toys in the months leading up to and during the holiday season. U.S. purchaser *** indicated that there are independent business cycles for the U.S. military and U.S. industrial markets. They indicate that
5 Hearing transcript, pp. 21‐25 and 43‐46 (Helou).
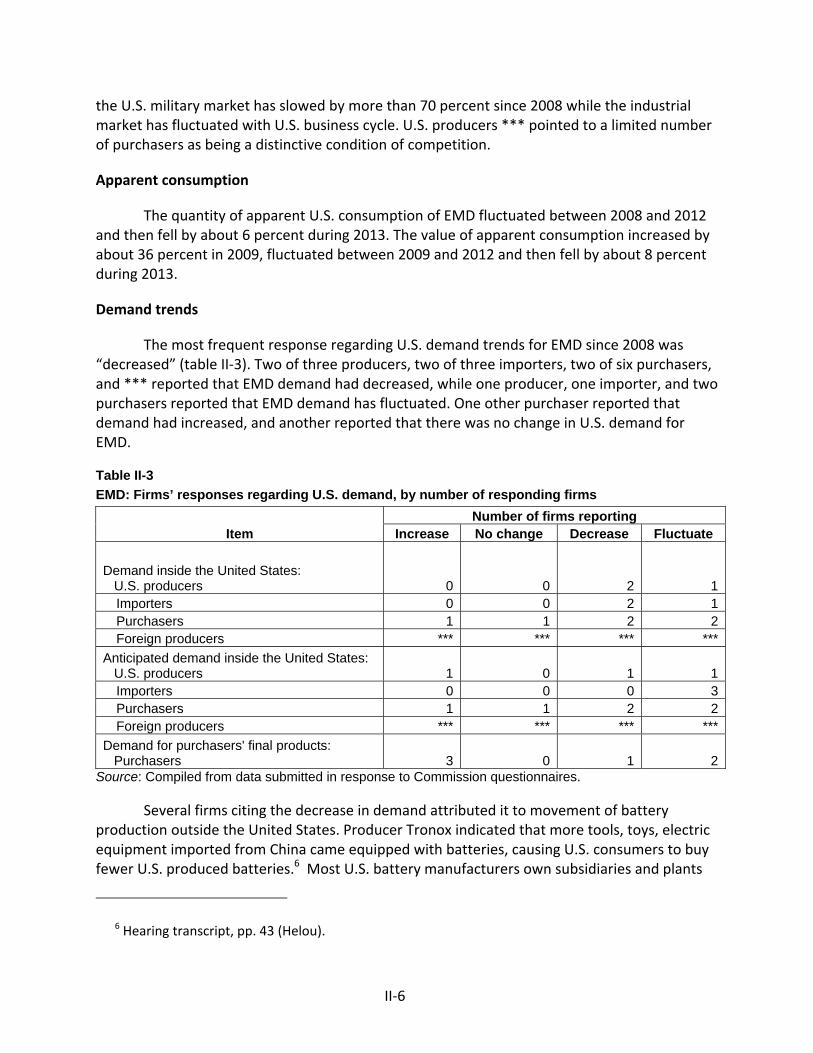
II‐6
the U.S. military market has slowed by more than 70 percent since 2008 while the industrial market has fluctuated with U.S. business cycle. U.S. producers *** pointed to a limited number of purchasers as being a distinctive condition of competition.
Apparent consumption
The quantity of apparent U.S. consumption of EMD fluctuated between 2008 and 2012 and then fell by about 6 percent during 2013. The value of apparent consumption increased by about 36 percent in 2009, fluctuated between 2009 and 2012 and then fell by about 8 percent during 2013.
Demand trends
The most frequent response regarding U.S. demand trends for EMD since 2008 was “decreased” (table II‐3). Two of three producers, two of three importers, two of six purchasers, and *** reported that EMD demand had decreased, while one producer, one importer, and two purchasers reported that EMD demand has fluctuated. One other purchaser reported that demand had increased, and another reported that there was no change in U.S. demand for EMD.
Table II-3
EMD: Firms’ responses regarding U.S. demand, by number of responding firms
Item Number of firms reporting
Increase No change Decrease Fluctuate
Demand inside the United States: U.S. producers 0 0 2 1
Importers 0 0 2 1Purchasers 1 1 2 2Foreign producers *** *** *** ***
Anticipated demand inside the United States: U.S. producers 1 0 1 1
Importers 0 0 0 3Purchasers 1 1 2 2Foreign producers *** *** *** ***
Demand for purchasers' final products: Purchasers 3 0 1 2
Source: Compiled from data submitted in response to Commission questionnaires.
Several firms citing the decrease in demand attributed it to movement of battery production outside the United States. Producer Tronox indicated that more tools, toys, electric equipment imported from China came equipped with batteries, causing U.S. consumers to buy fewer U.S. produced batteries.6 Most U.S. battery manufacturers own subsidiaries and plants
6 Hearing transcript, pp. 43 (Helou).
II‐7
overseas. Battery manufacturer EnerSys Inc., accounting for less than 10 percent of the U.S. battery manufacturing market share, acquired battery manufacturing capabilities in both Europe and China.7 The closing of Energizer’s battery plant was cited by several firms as an example. Producer *** also suggested a movement to smaller cells that require less EMD reduced the overall demand for EMD.8 Firms generally expect demand to continue to decrease or fluctuate in the near future for similar reasons.
Producer Tronox indicated that EMD demand by U.S. battery producers would continue to decrease over time. In the future, Tronox expects new applications of EMD, such as storage for wind and solar electricity generation, water purification, and electric vehicle battery production, to increase demand for EMD. Within the next five years, Tronox projects these new applications to increase demand for EMD by *** short tons, which accounts for approximately *** percent of Tronox’s 2013 production.9
Substitute products
No firms identified substitutes for EMD and none anticipated any future changes in substitutes.
Cost share
EMD accounts for a moderate share of the cost of the end‐use products in which it is used. Reported cost shares for the most commonly reported end use – alkaline batteries – were between 17 and 30 percent. EMD’s cost share in primary cell production was reported to be 10‐12 percent, and the cost share in pigment production was reported to be 25 percent.
SUBSTITUTABILITY ISSUES
The degree of substitution between domestic and imported EMD depends upon such factors as relative prices, quality (e.g., grade standards, reliability of supply, etc.), and conditions of sale (e.g., price discounts/rebates, lead times between order and delivery dates, payment terms, product services, etc.). Based on available data, staff believes that there is a moderate degree of substitutability between domestically produced EMD and EMD imported from subject countries.
Lead times
EMD is primarily sold from inventory. U.S. producer *** reported selling *** percent of their product produced‐to‐order with an average lead time of 42 days. Of the commercial
7 Battery Manufacturing in the U.S., IBISWorld Industry Report 33591, July 2014, pp. 26‐32. 8 Erachem and Tronox’s posthearing brief, p. 26. 9 Hearing transcript, pp. 21‐25 and 43‐46 (Helou) and Erachem and Tronox’s posthearing brief, p. 4,
23, and 10‐11.
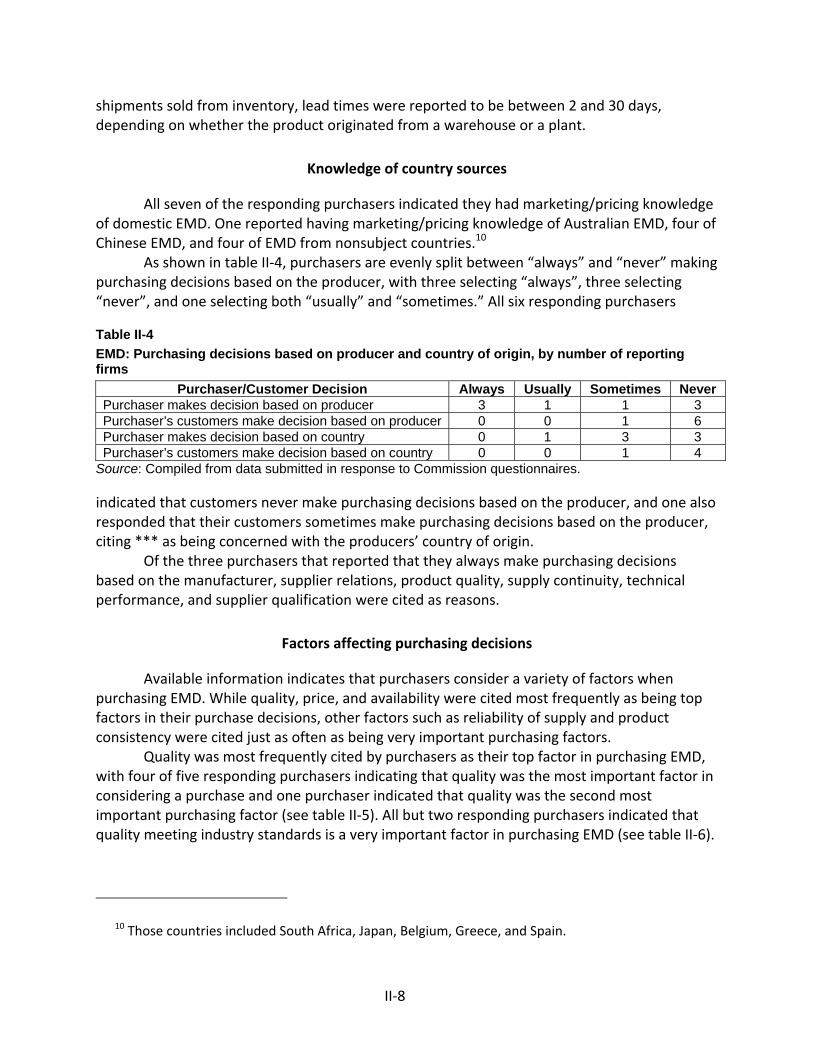
II‐8
shipments sold from inventory, lead times were reported to be between 2 and 30 days, depending on whether the product originated from a warehouse or a plant.
Knowledge of country sources
All seven of the responding purchasers indicated they had marketing/pricing knowledge of domestic EMD. One reported having marketing/pricing knowledge of Australian EMD, four of Chinese EMD, and four of EMD from nonsubject countries.10
As shown in table II‐4, purchasers are evenly split between “always” and “never” making purchasing decisions based on the producer, with three selecting “always”, three selecting “never”, and one selecting both “usually” and “sometimes.” All six responding purchasers
Table II-4
EMD: Purchasing decisions based on producer and country of origin, by number of reporting firms
Purchaser/Customer Decision Always Usually Sometimes Never Purchaser makes decision based on producer 3 1 1 3 Purchaser’s customers make decision based on producer 0 0 1 6 Purchaser makes decision based on country 0 1 3 3 Purchaser’s customers make decision based on country 0 0 1 4
Source: Compiled from data submitted in response to Commission questionnaires.
indicated that customers never make purchasing decisions based on the producer, and one also responded that their customers sometimes make purchasing decisions based on the producer, citing *** as being concerned with the producers’ country of origin.
Of the three purchasers that reported that they always make purchasing decisions based on the manufacturer, supplier relations, product quality, supply continuity, technical performance, and supplier qualification were cited as reasons.
Factors affecting purchasing decisions
Available information indicates that purchasers consider a variety of factors when purchasing EMD. While quality, price, and availability were cited most frequently as being top factors in their purchase decisions, other factors such as reliability of supply and product consistency were cited just as often as being very important purchasing factors.
Quality was most frequently cited by purchasers as their top factor in purchasing EMD, with four of five responding purchasers indicating that quality was the most important factor in considering a purchase and one purchaser indicated that quality was the second most important purchasing factor (see table II‐5). All but two responding purchasers indicated that quality meeting industry standards is a very important factor in purchasing EMD (see table II‐6).
10 Those countries included South Africa, Japan, Belgium, Greece, and Spain.
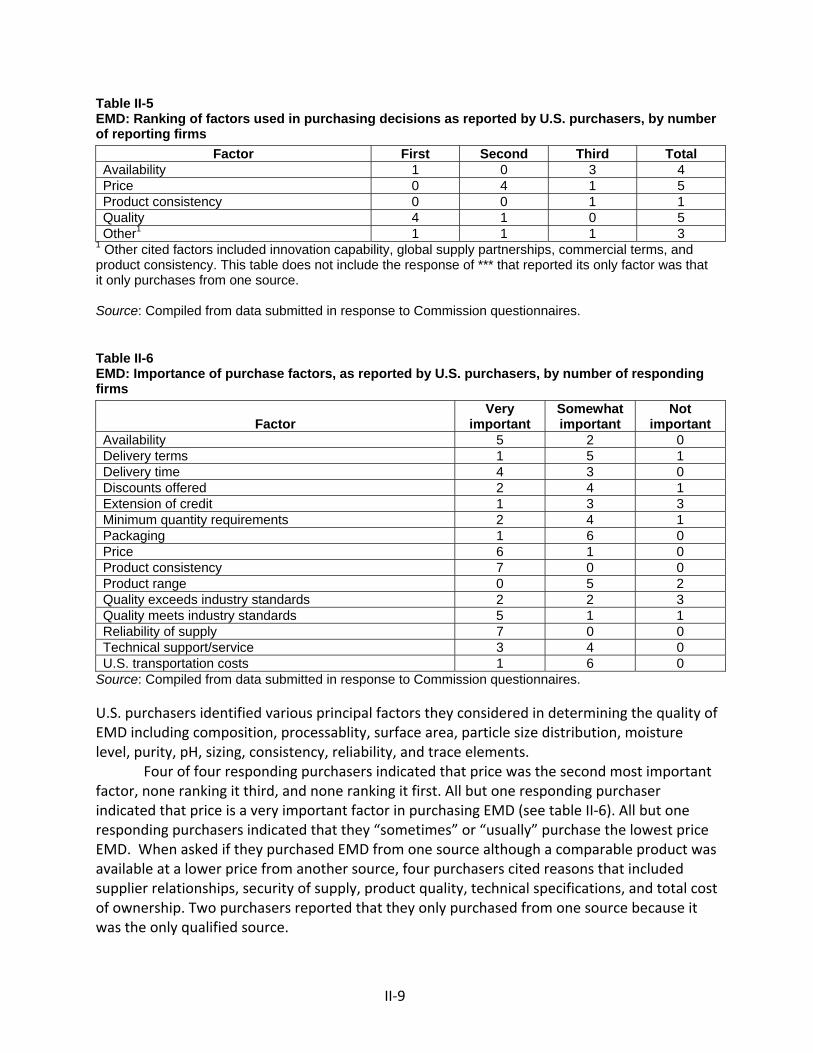
II‐9
Table II-5 EMD: Ranking of factors used in purchasing decisions as reported by U.S. purchasers, by number of reporting firms
Factor First Second Third Total Availability 1 0 3 4 Price 0 4 1 5 Product consistency 0 0 1 1 Quality 4 1 0 5 Other1 1 1 1 3
1 Other cited factors included innovation capability, global supply partnerships, commercial terms, and product consistency. This table does not include the response of *** that reported its only factor was that it only purchases from one source. Source: Compiled from data submitted in response to Commission questionnaires. Table II-6 EMD: Importance of purchase factors, as reported by U.S. purchasers, by number of responding firms
Factor Very
important Somewhat important
Not important
Availability 5 2 0 Delivery terms 1 5 1 Delivery time 4 3 0 Discounts offered 2 4 1 Extension of credit 1 3 3 Minimum quantity requirements 2 4 1 Packaging 1 6 0 Price 6 1 0 Product consistency 7 0 0 Product range 0 5 2 Quality exceeds industry standards 2 2 3 Quality meets industry standards 5 1 1 Reliability of supply 7 0 0 Technical support/service 3 4 0 U.S. transportation costs 1 6 0
Source: Compiled from data submitted in response to Commission questionnaires.
U.S. purchasers identified various principal factors they considered in determining the quality of EMD including composition, processablity, surface area, particle size distribution, moisture level, purity, pH, sizing, consistency, reliability, and trace elements.
Four of four responding purchasers indicated that price was the second most important factor, none ranking it third, and none ranking it first. All but one responding purchaser indicated that price is a very important factor in purchasing EMD (see table II‐6). All but one responding purchasers indicated that they “sometimes” or “usually” purchase the lowest price EMD. When asked if they purchased EMD from one source although a comparable product was available at a lower price from another source, four purchasers cited reasons that included supplier relationships, security of supply, product quality, technical specifications, and total cost of ownership. Two purchasers reported that they only purchased from one source because it was the only qualified source.
II‐10
Four of five responding purchasers indicated that availability was one of the top three factors it considers in purchasing EMD, and all but two purchasers indicated that availability is a very important factor in purchasing EMD. All responding purchasers indicated that product consistency and reliability of supply were very important factors in purchasing EMD.
Supplier certification
Six of seven responding U.S. purchasers require that all of the EMD they purchase be certified.11 Purchasers’ reported that new supplier qualification times varied, with three purchasers indicating it takes at least 9 months and one purchaser (***) indicating that it takes three to four months. No purchasers indicated that separate qualification requirements applied to each of the formulations/grades of its purchase or that it requires firms separately to qualify EMD of each plant location. One responding purchaser (***) indicated that separate qualification requirements apply to each of the formulation(s)/grades(s) of its purchases of EMD. This purchaser indicated that there is no difference in the qualification process between the ***.
Two purchasers reported that both domestic and foreign suppliers had failed in their attempts to qualify EMD. One purchaser (***) identified *** as not being able to achieve manufacturing process and product performance criteria, and another (***) identified *** as losing its qualification because it stopped supplying it with EMD due to market conditions.
Changes in purchasing patterns
Purchasers were also asked about changes in their purchasing patterns from different sources since 2008 (table II‐7). Reasons reported for changes in sourcing included reductions in available supply options, changing customer demand, and performance needs.
Three of seven firms reported that they had stopped purchasing EMD from subject countries since 2008. Specifically, firms reported dropping or reducing purchases from Australia because their supplier closed its operations there. One firm reported adding a Chinese supplier, ***, for specific technical characteristics.
Three purchasers reported adding or increasing purchases from nonsubject countries since 2008. One purchaser (***) reported increasing purchases of EMD from ***. Several purchasers including ***, however, reported later decreasing or discontinuing *** imports of EMD from *** because of a “***.” In all, four of seven purchasers reported new suppliers since 2008.
11 Chinese producer *** indicated that if ***. *** foreign producer questionnaire, question III‐8.
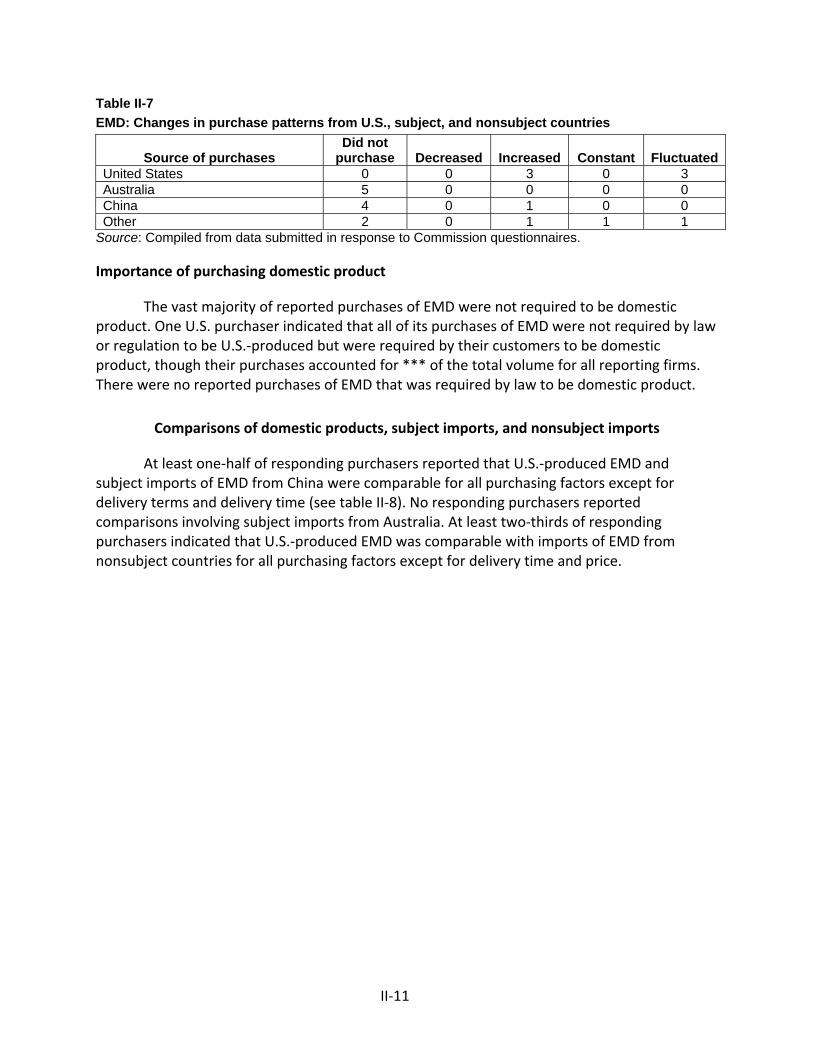
II‐11
Table II-7
EMD: Changes in purchase patterns from U.S., subject, and nonsubject countries
Source of purchases Did not
purchase Decreased Increased Constant FluctuatedUnited States 0 0 3 0 3 Australia 5 0 0 0 0 China 4 0 1 0 0 Other 2 0 1 1 1
Source: Compiled from data submitted in response to Commission questionnaires.
Importance of purchasing domestic product
The vast majority of reported purchases of EMD were not required to be domestic product. One U.S. purchaser indicated that all of its purchases of EMD were not required by law or regulation to be U.S.‐produced but were required by their customers to be domestic product, though their purchases accounted for *** of the total volume for all reporting firms. There were no reported purchases of EMD that was required by law to be domestic product.
Comparisons of domestic products, subject imports, and nonsubject imports
At least one‐half of responding purchasers reported that U.S.‐produced EMD and subject imports of EMD from China were comparable for all purchasing factors except for delivery terms and delivery time (see table II‐8). No responding purchasers reported comparisons involving subject imports from Australia. At least two‐thirds of responding purchasers indicated that U.S.‐produced EMD was comparable with imports of EMD from nonsubject countries for all purchasing factors except for delivery time and price.
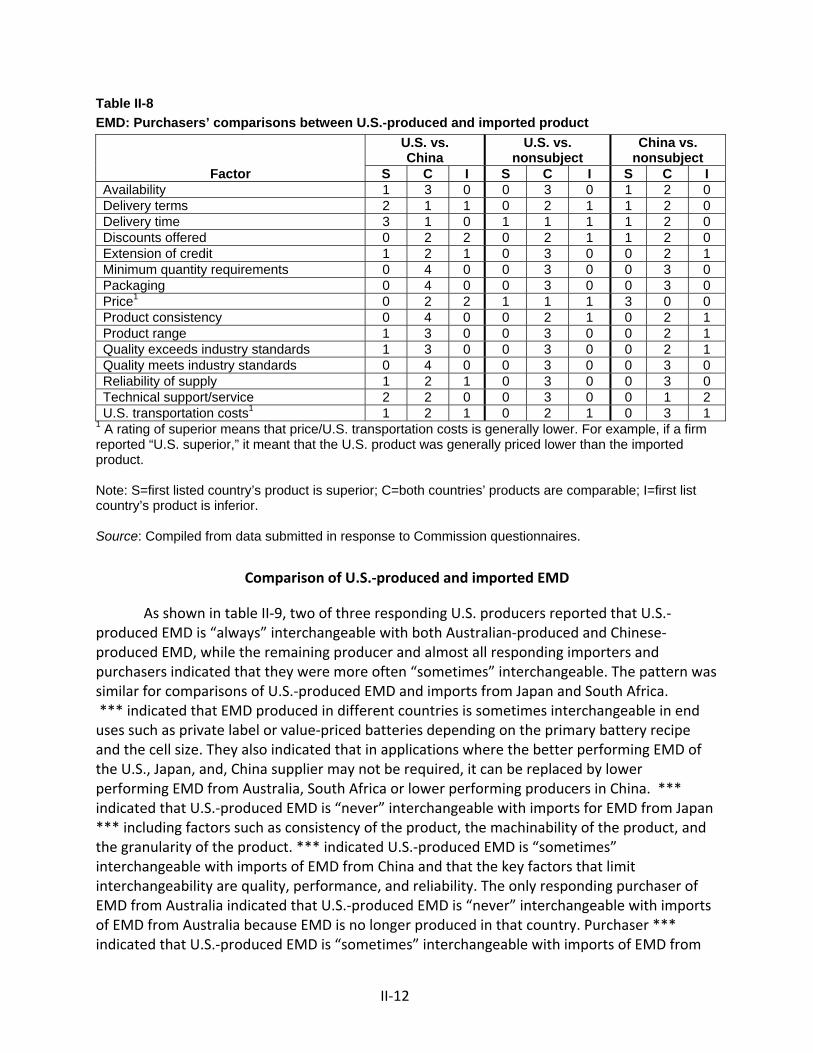
II‐12
Table II-8
EMD: Purchasers’ comparisons between U.S.-produced and imported product
Factor
U.S. vs. China
U.S. vs. nonsubject
China vs. nonsubject
S C I S C I S C I Availability 1 3 0 0 3 0 1 2 0 Delivery terms 2 1 1 0 2 1 1 2 0 Delivery time 3 1 0 1 1 1 1 2 0 Discounts offered 0 2 2 0 2 1 1 2 0 Extension of credit 1 2 1 0 3 0 0 2 1 Minimum quantity requirements 0 4 0 0 3 0 0 3 0 Packaging 0 4 0 0 3 0 0 3 0 Price1 0 2 2 1 1 1 3 0 0 Product consistency 0 4 0 0 2 1 0 2 1 Product range 1 3 0 0 3 0 0 2 1 Quality exceeds industry standards 1 3 0 0 3 0 0 2 1 Quality meets industry standards 0 4 0 0 3 0 0 3 0 Reliability of supply 1 2 1 0 3 0 0 3 0 Technical support/service 2 2 0 0 3 0 0 1 2 U.S. transportation costs1 1 2 1 0 2 1 0 3 1
1 A rating of superior means that price/U.S. transportation costs is generally lower. For example, if a firm reported “U.S. superior,” it meant that the U.S. product was generally priced lower than the imported product. Note: S=first listed country’s product is superior; C=both countries’ products are comparable; I=first list country’s product is inferior. Source: Compiled from data submitted in response to Commission questionnaires.
Comparison of U.S.‐produced and imported EMD
As shown in table II‐9, two of three responding U.S. producers reported that U.S.‐produced EMD is “always” interchangeable with both Australian‐produced and Chinese‐produced EMD, while the remaining producer and almost all responding importers and purchasers indicated that they were more often “sometimes” interchangeable. The pattern was similar for comparisons of U.S.‐produced EMD and imports from Japan and South Africa. *** indicated that EMD produced in different countries is sometimes interchangeable in end uses such as private label or value‐priced batteries depending on the primary battery recipe and the cell size. They also indicated that in applications where the better performing EMD of the U.S., Japan, and, China supplier may not be required, it can be replaced by lower performing EMD from Australia, South Africa or lower performing producers in China. *** indicated that U.S.‐produced EMD is “never” interchangeable with imports for EMD from Japan *** including factors such as consistency of the product, the machinability of the product, and the granularity of the product. *** indicated U.S.‐produced EMD is “sometimes” interchangeable with imports of EMD from China and that the key factors that limit interchangeability are quality, performance, and reliability. The only responding purchaser of EMD from Australia indicated that U.S.‐produced EMD is “never” interchangeable with imports of EMD from Australia because EMD is no longer produced in that country. Purchaser *** indicated that U.S.‐produced EMD is “sometimes” interchangeable with imports of EMD from
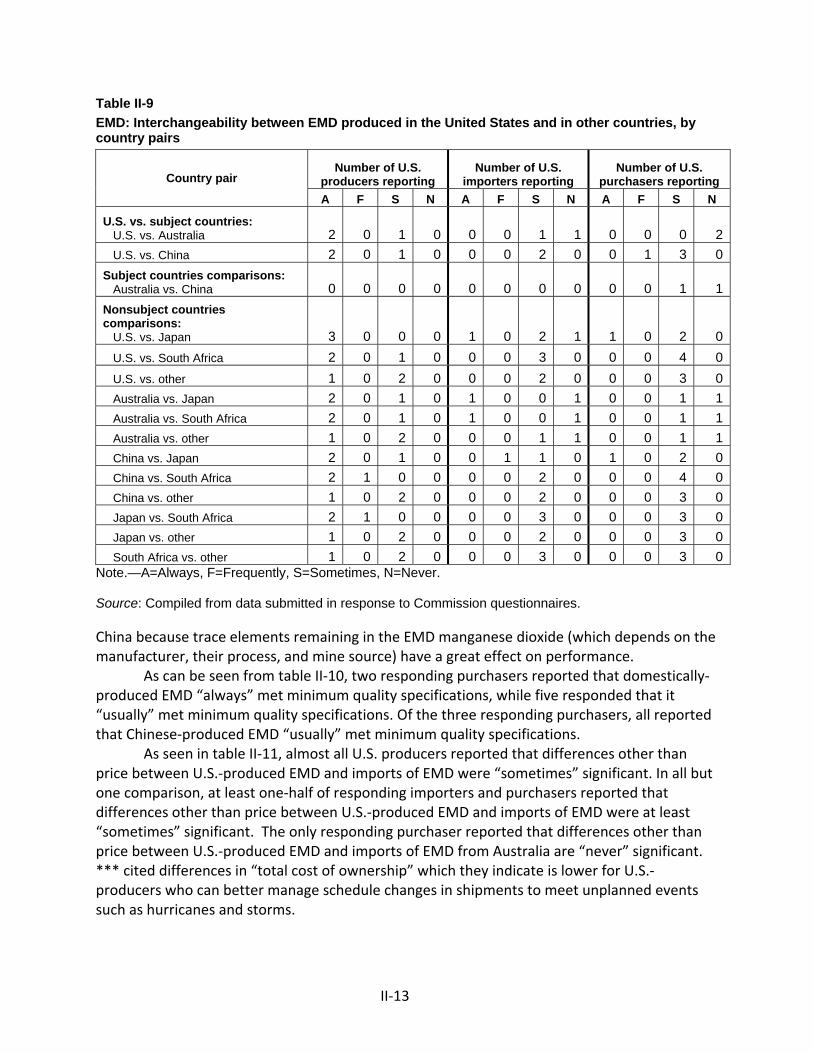
II‐13
Table II-9
EMD: Interchangeability between EMD produced in the United States and in other countries, by country pairs
Country pair Number of U.S.
producers reporting Number of U.S.
importers reporting Number of U.S.
purchasers reporting
A F S N A F S N A F S N
U.S. vs. subject countries: U.S. vs. Australia 2 0 1 0 0 0 1 1 0 0 0 2
U.S. vs. China 2 0 1 0 0 0 2 0 0 1 3 0
Subject countries comparisons: Australia vs. China 0 0 0 0 0 0 0 0 0 0 1 1
Nonsubject countries comparisons: U.S. vs. Japan 3 0 0 0 1 0 2 1 1 0 2 0
U.S. vs. South Africa 2 0 1 0 0 0 3 0 0 0 4 0
U.S. vs. other 1 0 2 0 0 0 2 0 0 0 3 0
Australia vs. Japan 2 0 1 0 1 0 0 1 0 0 1 1
Australia vs. South Africa 2 0 1 0 1 0 0 1 0 0 1 1
Australia vs. other 1 0 2 0 0 0 1 1 0 0 1 1
China vs. Japan 2 0 1 0 0 1 1 0 1 0 2 0
China vs. South Africa 2 1 0 0 0 0 2 0 0 0 4 0
China vs. other 1 0 2 0 0 0 2 0 0 0 3 0
Japan vs. South Africa 2 1 0 0 0 0 3 0 0 0 3 0
Japan vs. other 1 0 2 0 0 0 2 0 0 0 3 0
South Africa vs. other 1 0 2 0 0 0 3 0 0 0 3 0Note.—A=Always, F=Frequently, S=Sometimes, N=Never. Source: Compiled from data submitted in response to Commission questionnaires.
China because trace elements remaining in the EMD manganese dioxide (which depends on the manufacturer, their process, and mine source) have a great effect on performance.
As can be seen from table II‐10, two responding purchasers reported that domestically‐produced EMD “always” met minimum quality specifications, while five responded that it “usually” met minimum quality specifications. Of the three responding purchasers, all reported that Chinese‐produced EMD “usually” met minimum quality specifications.
As seen in table II‐11, almost all U.S. producers reported that differences other than price between U.S.‐produced EMD and imports of EMD were “sometimes” significant. In all but one comparison, at least one‐half of responding importers and purchasers reported that differences other than price between U.S.‐produced EMD and imports of EMD were at least “sometimes” significant. The only responding purchaser reported that differences other than price between U.S.‐produced EMD and imports of EMD from Australia are “never” significant. *** cited differences in “total cost of ownership” which they indicate is lower for U.S.‐producers who can better manage schedule changes in shipments to meet unplanned events such as hurricanes and storms.
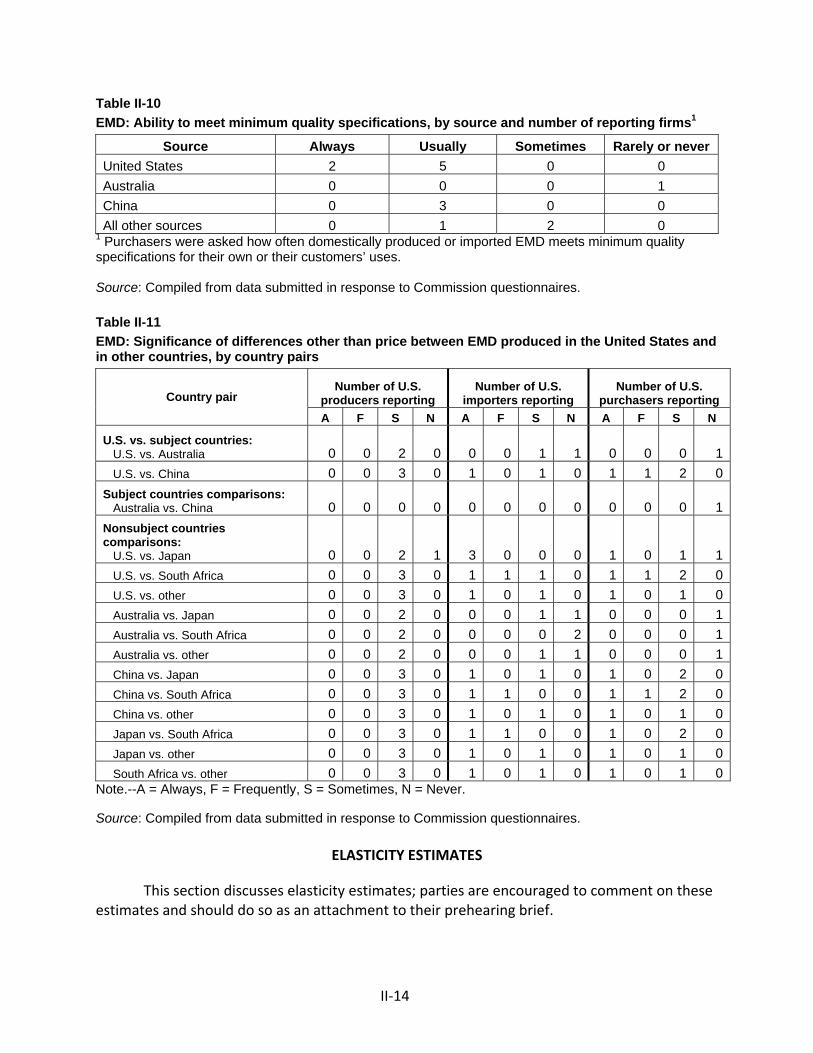
II‐14
Table II-10
EMD: Ability to meet minimum quality specifications, by source and number of reporting firms1
Source Always Usually Sometimes Rarely or never
United States 2 5 0 0
Australia 0 0 0 1
China 0 3 0 0
All other sources 0 1 2 0 1 Purchasers were asked how often domestically produced or imported EMD meets minimum quality specifications for their own or their customers’ uses. Source: Compiled from data submitted in response to Commission questionnaires.
Table II-11
EMD: Significance of differences other than price between EMD produced in the United States and in other countries, by country pairs
Country pair Number of U.S.
producers reporting Number of U.S.
importers reporting Number of U.S.
purchasers reporting
A F S N A F S N A F S N
U.S. vs. subject countries: U.S. vs. Australia 0 0 2 0 0 0 1 1 0 0 0 1
U.S. vs. China 0 0 3 0 1 0 1 0 1 1 2 0
Subject countries comparisons: Australia vs. China 0 0 0 0 0 0 0 0 0 0 0 1
Nonsubject countries comparisons: U.S. vs. Japan 0 0 2 1 3 0 0 0 1 0 1 1
U.S. vs. South Africa 0 0 3 0 1 1 1 0 1 1 2 0
U.S. vs. other 0 0 3 0 1 0 1 0 1 0 1 0
Australia vs. Japan 0 0 2 0 0 0 1 1 0 0 0 1
Australia vs. South Africa 0 0 2 0 0 0 0 2 0 0 0 1
Australia vs. other 0 0 2 0 0 0 1 1 0 0 0 1
China vs. Japan 0 0 3 0 1 0 1 0 1 0 2 0
China vs. South Africa 0 0 3 0 1 1 0 0 1 1 2 0
China vs. other 0 0 3 0 1 0 1 0 1 0 1 0
Japan vs. South Africa 0 0 3 0 1 1 0 0 1 0 2 0
Japan vs. other 0 0 3 0 1 0 1 0 1 0 1 0
South Africa vs. other 0 0 3 0 1 0 1 0 1 0 1 0Note.--A = Always, F = Frequently, S = Sometimes, N = Never. Source: Compiled from data submitted in response to Commission questionnaires.
ELASTICITY ESTIMATES
This section discusses elasticity estimates; parties are encouraged to comment on these estimates and should do so as an attachment to their prehearing brief.
II‐15
U.S. supply elasticity
The domestic supply elasticity12 for EMD measures the sensitivity of the quantity supplied by U.S. producers to changes in the U.S. market price of EMD. The elasticity of domestic supply depends on several factors, including the level of excess capacity, the ease with which producers can alter capacity, producers’ ability to shift to production of other products, the existence of inventories, and the availability of alternate markets for U.S.‐produced EMD. Analysis of these factors earlier indicates that the U.S. industry is likely to be able to somewhat increase or decrease shipments to the U.S. market; an estimate in the range of 2 to 4 is suggested.
U.S. demand elasticity
The U.S. demand elasticity for EMD measures the sensitivity of the overall quantity demanded to a change in the U.S. market price of EMD. This estimate depends on factors discussed earlier such as the existence, availability, and commercial viability of substitute products, as well as the component share of the EMD in the production of downstream products. Based on the available information, the aggregate demand for EMD is likely to be relatively inelastic with a range of ‐0.5 is ‐1.0 suggested.
Substitution elasticity
The elasticity of substitution depends upon the extent of product differentiation between the domestic and imported products.13 Product differentiation, in turn, depends upon such factors as quality (e.g., chemistry, appearance, etc.) and conditions of sale (e.g., availability, sales terms/discounts/promotions, etc.). Based on available information, the elasticity of substitution between U.S.‐produced EMD and imported EMD is likely to be in the range of 2 to 5.
12 A supply function is not defined in the case of a non‐competitive market. 13 The substitution elasticity measures the responsiveness of the relative U.S. consumption levels of
the subject imports and the domestic like products to changes in their relative prices. This reflects how easily purchasers switch from the U.S. product to the subject products (or vice versa) when prices change.

III‐1
PART III: CONDITION OF THE U.S. INDUSTRY
OVERVIEW
The information in this section of the report was compiled from responses to the Commission’s questionnaires. Three firms, Energizer, Erachem, and Tronox, which accounted for all of U.S. production of EMD during the period for which data were collected, supplied information on their operations in these reviews and other proceedings on EMD.
Changes experienced by the industry
Domestic producers were asked to indicate whether their firm had experienced any plant openings, relocations, expansions, acquisitions, consolidations, closures, or prolonged shutdowns because of strikes or equipment failure; curtailment of production because of shortages of materials or other reasons, including revision of labor agreements; or any other change in the character of their operations or organization relating to the production of EMD since 2008. *** of the domestic producers (which provided responses in these reviews) indicated that they had experienced such changes; their responses are presented in table III‐1.
Table III-1 EMD: Changes in the character of U.S. operations since January 1, 2008
* * * * * * *
Anticipated changes in operations
The Commission asked domestic producers to report anticipated changes in the character of their operations relating to the production of EMD. Their responses appear in table III‐2.
Table III-2 EMD: Anticipated changes in the character of U.S. operations
* * * * * * *
U.S. PRODUCTION, CAPACITY, AND CAPACITY UTILIZATION
Table III‐3 presents U.S. producers’ production, capacity, and capacity utilization. ***.1 *** reported that *** to switch production capacity between EMD and other products using
1 ***’s US producer questionnaire response (section II‐2).
III‐2
the same equipment and/or labor.2 ***. ***. ***.3 *** been involved in a toll agreement for production of EMD or produce EMD in a foreign trade zone.4
Table III-3 EMD: U.S. producers’ production, capacity, and capacity utilization, 2008-13, January- June 2013, and January-June 2014
* * * * * * *
Constraints on capacity
*** of the responding U.S. producers reported constraints in the manufacturing process. ***. ***.5
U.S. PRODUCERS’ U.S. SHIPMENTS AND EXPORTS
Table III‐4 presents U.S. producers’ U.S. shipments, export shipments, and total shipments of EMD for the period of this five‐year review. U.S. producers’ total shipments *** by *** short tons (*** percent) during 2008‐13 and exhibited a *** short ton *** in interim January‐June 2014 as compared to interim January‐June 2013. This trend is primarily attributable to the *** of ***’s total U.S. shipments by *** short tons (*** percent) during 2008‐13, and *** short ton *** in interim January‐June 2014 as compared to interim January‐June 2013.
U.S. producers’ U.S. shipments *** by *** short tons (*** percent) during 2008‐13 and were *** short tons *** in interim January‐June 2014 as compared to interim January‐June 2013. This trend is primarily attributable to ***’s *** of *** short tons (*** percent) during 2008‐13 followed by a *** short ton *** in interim January‐June 2014 as compared to interim January‐June 2013.
*** and accounted for *** of internal consumption of EMD during 2008‐June 2014. *** reported a *** short tons (***) of internal consumption for 2009. The reported ***.6
Export shipments *** by *** short tons (*** percent) during 2008‐13 and were *** short tons in interim January‐June 2014 as compared to *** short tons during interim January‐June 2013. The reported ***.7
2 US producer questionnaire responses (section II‐6). 3 US producer questionnaire responses (section II‐7) and correspondence between Commission staff
and ***, September 5, 2014. 4 US producer questionnaire responses (section II‐10 and section II‐11). 5 US producer questionnaire responses (section II‐5d). 6 ***’s U.S. producer questionnaire revisions (email of September 26, 2014). 7 ***’s U.S. producer questionnaire revisions (email of September 26, 2014).
III‐3
Table III-4 EMD: U.S. producers’ U.S. shipments, export shipments, and total shipments, 2008-13, January –June 2013, and January-June 2014
* * * * * * *
U.S. PRODUCERS’ INVENTORIES
Table III‐5 presents U.S. producers’ end‐of‐period inventories and the ratio of these inventories to U.S. producers’ production, U.S. shipments, and total shipments over the period examined. ***.8
Table III-5 EMD: U.S. producers’ inventories and ratios, 2008-13, January–June 2013, and January-June 2014
* * * * * * *
U.S. PRODUCERS’ IMPORTS AND PURCHASES
*** EMD during the period for which data were gathered. ***9. ***.10 Table III‐6 presents data on individual U.S. producers’ U.S. production and U.S imports of EMD from nonsubject sources over the period examined.
Table III-6 EMD: U.S. producers’ U.S. production, imports, and import ratios to U.S. production, 2008-13, January–June 2013, and January-June 2014
* * * * * * *
Table III‐7 presents data on individual U.S. producers’ reported purchases of EMD imported from nonsubject sources. ***.
Table III-7 EMD: U.S. producers’ U.S. production, purchases of imports, 2008-13, January–June 2013, and January-June 2014
* * * * * * *
8 ***. 9 ***. ***’s US importer questionnaire response. 10 ***’s US importer questionnaire response (section II‐6).
III‐4
U.S. EMPLOYMENT, WAGES, AND PRODUCTIVITY
Table III‐8 shows U.S. producers’ employment‐related data during the period examined. The number of U.S. EMD production and related workers (“PRWs”) decreased by *** PRWs, or (*** percent), during the 2008‐13 period. This period decrease was attributable to net losses and gains of PRWs as follows: ***. The number of PRWs rose by *** over the January‐June 2014 interim period in comparison with the January‐June 2013 interim period attributable to ***.
Table III-8 EMD: Average number of production and related workers, hours worked, wages paid to such employees, hourly wages, productivity, and unit labor costs, 2008-13, January–June 2013, and January-June 2014
* * * * * * *
III‐5
FINANCIAL EXPERIENCE OF U.S. PRODUCERS
Background
This section of the report presents the EMD financial results of Erachem and Tronox.11 12 Energizer, which produces EMD for internal consumption, is not included in the industry’s financial results for the reasons described in footnote 12. While Energizer’s EMD financial results are not included in the industry’s financial results, information related to its purchase of manganese ore, capital expenditures, and R&D expenses is presented and/or discussed in the relevant sections below.
With respect to the facilities where EMD is produced, Energizer reported that it ***.13 In contrast, Tronox reported that, ***. 14
Tronox filed for Chapter 11 bankruptcy in January 2009.15 As described by a public source, the company “. . . filed for Chapter 11 for its U.S. operations in January 2009, citing a need for relief from environmental liabilities. Most of the liabilities are not related to its titanium dioxide (TiO2) operations and were incurred prior to its spin‐off from Kerr‐McGee in 2006.”16 Tronox emerged from bankruptcy in February 2011. With regard to the impact of the bankruptcy on its EMD operations, Tronox noted that ***.17
Erachem was the *** U.S. producer to report that it purchases an input from a related party: manganese ore from Compagnie Miniere De L’Ogooue (Comilog), a joint venture located in Gabon. As noted in the Cost of goods sold section below, Erachem purchases manganese ore in ***. With respect to input purchases from related parties in general, the Commission’s standard practice has required the elimination of the related party’s profit or loss from the relevant COGS
11 Erachem’s U.S. EMD operations are ultimately part of the Manganese division of its French‐based parent company, Eramet. Eramet 2012 Annual Report, p. 14. Tronox, an Australian‐based multinational, classifies its U.S. EMD operations as part of “Other” for segment reporting with “Other” including Tronox’s corporate and non‐titanium related chemical operations. Tronox 2013 10‐K, p. 7. Tronox’s overall operations are primarily focused on titanium bearing mineral sands and titanium dioxide pigment.
Erachem and Tronox reported their EMD financial results to the Commission on the basis of U.S. generally accepted accounting principles (GAAP) and for calendar‐year periods.
12 Energizer’s battery operations, which include its EMD production, are part of the overall company’s Household Products segment. Energizer 2013 10‐K, p. 10. As described by a public source, Energizer’s Household Products segment and Personal Care Products segment will be spun off into separate public companies in 2015. Energizer to Divide Operations into Two Firms, MMR (Mass Market Retailers), May 26, 2014, Vol. 31 Issue 8, p. 23.
***. USITC auditor notes. ***. August 29, 2014 e‐mail with attachments (including revised table III‐19) from Energizer to USITC auditor.
13 ***. September 5, 2014 e‐mail with attachment from Cassidy Levy on behalf of Erachem to USITC auditor.
14 Energizer U.S. producer questionnaire, response to III‐7. Erachem U.S. producer questionnaire, response to III‐7. Tronox U.S. producer questionnaire, response to III‐7.
15 Tronox emerges from bankruptcy, Chemical Week, February 21, 2011, p. 12. 16 Tronox outlines plans to settle environmental claims, Chemical Week, August 30, 2010, p. 13. 17 Tronox U.S. producer questionnaire, response to III‐5.
III‐6
reported in the financial section of the U.S. producer questionnaire. The intent of this adjustment is for the related party’s actual cost to be recognized in determining the financial results reported to the Commission. ***.18 Appendix E of this report, presents the industry’s financial results without the Commission’s input adjustment for related party profit or loss.
Operations on EMD
Table III‐9 presents the EMD financial results of Erachem and Tronox (see footnote 12
regarding the exclusion of Energizer from the reported financial results). Table III‐10 presents selected company‐specific financial information. Table III‐11 presents a variance analysis of these financial results.19
Table III-9 EMD: Results of operations of U.S. producers, 2008-13, January-June 2013, and January-June 2014
* * * * * * *
Source: Compiled from data submitted in response to Commission questionnaires.
Table III-10 EMD: Results of operations of U.S. producers, by firm, 2008-13, January-June 2013, and January-June 2014
* * * * * * *
Source: Compiled from data submitted in response to Commission questionnaires.
18 Erachem U.S. producer questionnaire, response to III‐16. ***. Erachem U.S. producer questionnaire, note 2 to table III‐19. Appendix E presents the industry’s financial results without the Commission’s input adjustment for related party profit or loss.
19 The Commission’s variance analysis is calculated in three parts: sales variance, COGS variance, and sales, general and administrative (SG&A) expenses variance. Each part consists of a price variance (in the case of the sales variance) or a cost variance (in the case of the COGS and SG&A expenses variances) and a volume (quantity) variance. The sales or cost variance is calculated as the change in unit price/cost times the new volume, while the volume variance is calculated as the change in volume times the old unit price/cost. Summarized at the bottom of table III‐11, the price variance is from sales, the cost/expense variance is the sum of those items from COGS and SG&A, respectively, and the net volume variance is the sum of the price, COGS, and SG&A volume variances. The Commission’s variance analysis is generally enhanced when product mix remains constant during the period. As indicated in the Revenue section of this part of the report, product mix did change somewhat during the period but the impact on average sales value appears to be limited.
III‐7
Table III-11 EMD: Variance analysis on the operations of U.S. producers, 2008-13, January-June 2013, and January-June 2014
* * * * * * *
Source: Compiled from data submitted in response to Commission questionnaires.
Because the majority of EMD revenue reflects commercial sales, with only a minor volume of internal consumption reported by ***, the relevant tables in this section present a single line item for EMD revenue.20 Revenue
As shown in the revenue section of the variance analysis (table III‐11), total revenue increased between 2008‐11 followed by declines throughout the rest of the period. Full‐year changes in total revenue were caused by alternating volume and price variances. Only between the interim periods were price and volume variances (both negative) directionally the same.
Volume
On an ***.21
Value
While Erachem and Tronox reported the *** directional pattern of average sales value throughout most of the period, Tronox reported *** average sales values and *** period‐to‐period percentage changes. In part, some of this difference may be due to product mix; e.g., ***.22 As confirmed by each company, the same basic adjustments were recognized in order to arrive at net EMD revenue.23
As shown in table III‐9, average sales value and corresponding average manganese ore cost did not consistently share the same directional pattern (see table III‐10). With regard to the
20 ***. September 5, 2014 e‐mail with attachment from Cassidy Levy on behalf of Erachem to USITC auditor. ***. September 5, 2014 e‐mail with attachment from Cassidy Levy on behalf of Tronox to USITC auditor
21 ***. September 5, 2014 e‐mail with attachment from Cassidy Levy on behalf of Erachem to USITC auditor.
***. September 5, 2014 e‐mail with attachment from Cassidy Levy on behalf of Tronox to USITC auditor. 22 Erachem U.S. producer questionnaire, response to III‐6. Tronox U.S. producer questionnaire, response
to III‐6. 23 ***. September 5, 2014 e‐mail with attachment from Cassidy Levy on behalf of Erachem to USITC
auditor. September 5, 2014 e‐mail with attachment from Cassidy Levy on behalf of Tronox to USITC auditor.
III‐8
correlation of sales value and underlying manganese ore cost, Erachem stated that ***.24 Similarly, Tronox stated that ***.25
Cost of goods sold
As shown in table III‐10, ***.26 27
Manganese ore
As noted in a previous section of this report, the primary EMD input cost is manganese ore. Table III‐9 shows that manganese ore ranged from a low of *** percent of total COGS in 2008 to a high of *** percent in 2011. With respect to the U.S. producers whose financial results are presented in this section of the report, ***.28
Table III‐12 presents the volume and corresponding cost of manganese ore purchased by Energizer, Erachem, and Tronox.
Table III-12
EMD: Manganese ore purchases of U.S. producers, by firm, 2008-13, January-June 2013, and January-June 2014
* * * * * * *
Source: Compiled from data submitted in response to Commission questionnaires.
Erachem stated that ***.29 30 ***.31 ***.32
24 September 5, 2014 e‐mail with attachment from Cassidy Levy on behalf of Erachem to USITC auditor. 25 September 5, 2014 e‐mail with attachment from Cassidy Levy on behalf of Tronox to USITC auditor. 26 ***. USITC auditor notes. Appendix E presents company‐specific financial results without the
Commission’s input adjustment for related party profit or loss. 27 ***. Erachem U.S. producer questionnaire, response to III‐8. ***. Tronox U.S. producer
questionnaire, response to III‐8. 28 Erachem stated that ***. Erachem U.S. producer questionnaire, response to III‐11. Erachem further
stated that ***. September 5, 2014 e‐mail with attachment from Cassidy Levy on behalf of Erachem to USITC auditor.
***. Tronox U.S. producer questionnaire, response to III‐11. ***. September 5, 2014 e‐mail with attachment from Cassidy Levy on behalf of Tronox to USITC auditor.
29 September 5, 2014 e‐mail with attachment from Cassidy Levy on behalf of Erachem to USITC auditor. 30 As described by Erachem, ***. Erachem U.S. producer questionnaire, response to III‐9. 31 September 5, 2014 e‐mail with attachment from Cassidy Levy on behalf of Tronox to USITC auditor. 32 Erachem provided the following description of the delivery process: ***. Erachem U.S. producer
questionnaire response, response to III‐10. As described by Tronox, ***. Tronox U.S. producer questionnaire, response to III‐9.
III‐9
Electricity and natural gas
As shown in table III‐9, natural gas, as a share of total COGS, declined notably between 2008‐09 and then fluctuated generally lower until increasing in 2013 and again in interim 2014. For most of the period, however, electricity and natural gas were in a similar range. Of the two U.S. producers whose financial results are presented in this section, ***.33
Direct labor and other factory costs
As a share of total COGS, direct labor fluctuated but ended the period higher while other factory costs also fluctuated but generally declined. On a company‐specific basis, these costs were similar but not uniform in terms of their relative share of COGS.34
With regard to how capacity utilization impacted average labor and other factory costs, Erachem stated that ***.35 Tronox provided a similar statement regarding the impact of operating rates on unit costs.36
Gross profit or loss
As shown in table III‐10, Erachem’s gross profit ratio (total gross profit divided by total revenue) was at its ***. While also starting the period at its *** in interim 2014.
When asked to comment on the pattern of its gross profit in general, ***.37 As described by Erachem and without the input adjustment, ***.38
Tronox stated that ***.39 40
33 Erachem stated that ***. Erachem U.S. producer questionnaire, response to III‐13. ***. Tronox U.S. producer questionnaire, response to III‐13. 34 ***. September 5, 2014 e‐mail with attachment from Cassidy Levy on behalf of Erachem to USITC
auditor. ***. September 5, 2014 e‐mail with attachment from Cassidy Levy on behalf of Tronox to USITC auditor.
35 September 5, 2014 e‐mail with attachment from Cassidy Levy on behalf of Erachem to USITC auditor. 36 September 5, 2014 e‐mail with attachment from Cassidy Levy on behalf of Tronox to USITC auditor. At
the Commission’s hearing, U.S. industry witnesses reiterated that the high level of fixed costs, in conjunction with changes in throughput, plays an important role in determining average EMD COGS. Hearing transcript, p. 11 (Manley), p. 27 (Helou).
37 September 5, 2014 e‐mail with attachment from Cassidy Levy on behalf of Erachem to USITC auditor. September 5, 2014 e‐mail with attachment from Cassidy Levy on behalf of Erachem to USITC auditor.
38 Ibid. Appendix E presents company‐specific financial results without the Commission’s input adjustment for related party profit or loss.
39 September 5, 2014 e‐mail with attachment from Cassidy Levy on behalf of Tronox to USITC auditor. ***. September 17, 2014 e‐mail with attachment to Tronox from USITC auditor. In response, Tronox stated that ***. October 3, 2014 e‐mail with attachments (including revised table III‐19) from Tronox to USITC auditor.
40 ***. September 17, 2014 e‐mail with attachment to Tronox from USITC auditor. ***. October 3, 2014 e‐mail with attachments (including revised table III‐19) from Tronox to USITC auditor.
III‐10
SG&A expenses and operating income
Table III‐9 shows that total SG&A expenses declined between 2008‐10, increased somewhat in 2011, and then notably in 2012. As shown in table III‐10, Tronox reported *** SG&A expenses compared to Erachem between 2008‐11. In 2012, ***.41 ***.
On an overall basis, the industry’s SG&A expense ratio (total SG&A expenses divided by total revenue) declined modestly between 2008‐10, increased somewhat in 2011, and then increased notably in 2012, due in large part to ***. The higher SG&A expense ratio in interim 2014 compared to interim 2013 primarily reflects lower revenue.
Capital expenditures and research and development expenses
Table III‐13 presents capital expenditures and research and development (R&D) expenses by
firm.42
Table III-13 EMD: Capital expenditures and research and development expenses of U.S. producers, 2008-13, January-June 2013, January-June 2014
* * * * * * *
Source: Compiled from data submitted in response to Commission questionnaires.
Erachem, which accounted for the ***.43 ***.44 ***.45 While R&D expenses were reported by *** U.S. producers, ***,46 ***,47 and ***.48
41 Ibid. 42 As reported by the U.S. industry, including Energizer, total assets ranged from *** in 2013. (Note: The
***. With respect to a company’s overall operations, a total asset value (i.e., the bottom line value on the asset side of a company’s balance sheet) reflects an aggregation of a number of assets which are often not product specific. Additionally, the business unit responding directly to the Commission’s questionnaire may or may not directly account for all assets relevant to the operations being examined.
43 Erachem U.S. producer questionnaire, response to II‐2. The company stated that ***. September 5, 2014 e‐mail with attachment from Cassidy Levy on behalf of Erachem to USITC auditor.
44 August 29, 2014 e‐mail with attachments (including revised table III‐19) from Energizer to USITC auditor.
45 September 5, 2014 e‐mail with attachment from Cassidy Levy on behalf of Tronox to USITC auditor. As described by Tronox, ***. Ibid.
46 Erachem stated that its ***. September 5, 2014 e‐mail with attachment from Cassidy Levy on behalf of Erachem to USITC auditor.
47 As described by Tronox, ***. September 5, 2014 e‐mail with attachment from Cassidy Levy on behalf of Tronox to USITC auditor.
48 Energizer described its R&D expenses as follows: ***. August 29, 2014 e‐mail with attachments (including revised table III‐19) from Energizer to USITC auditor.
IV‐1
PART IV: U.S. IMPORTS AND THE FOREIGN INDUSTRIES
U.S. IMPORTS
Overview
The Commission issued questionnaires to 12 firms believed to have imported EMD between 2008 to June 2014. Five firms provided data and information in response to the questionnaires, while four firms indicated that they had not imported in‐scope EMD during the period for which data were collected.1 A comparison of importer questionnaire data to official Commerce statistics for imports of product is not valid, as official Commerce statistics contain significant out‐of‐scope EMD. EMD Import data in this report are based on in‐scope data reported in Commission questionnaire responses.
*** responding U.S. importers reported temporary imports under bond, through bonded warehouses, or through FTZs.
Imports from subject and nonsubject countries
Table IV‐1 presents information on U.S. imports of EMD from Australia, China, and all
other sources (primarily South Africa and Japan) over the period examined. U.S. imports of EMD from Australia and China ***. Table IV-1 EMD: U.S. imports by source, 2008-2013, January-June 2013, and January-June 2014
* * * * * * *
As previously stated in Part I of the report, responding importers reported nonsubject
imports of EMD as follows: ***. Responding importers reported nonsubject imports as aggregated “imports from all other sources;” however, the individual countries from which each imported were delineated. Therefore, ***.
Table IV‐2 presents nonsubject imports from official Commerce statistics for HTS statistical reporting number 2820.10.00. Although the statistical reporting number is eo nomine for manganese dioxide, the category may be overly broad as they contains significant imports of out‐of‐scope manganese dioxide such as chemical manganese dioxide, natural manganese dioxide, and manganese oxide.
1 ***.
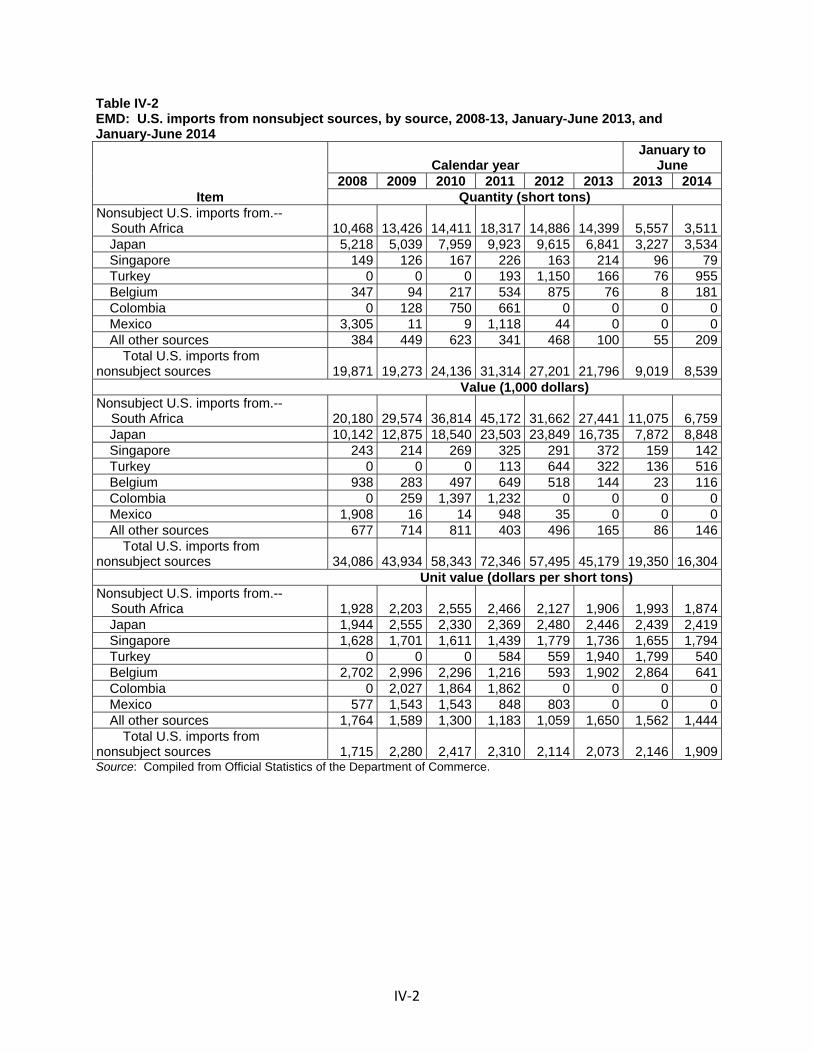
IV‐2
Table IV-2 EMD: U.S. imports from nonsubject sources, by source, 2008-13, January-June 2013, and January-June 2014
Item
Calendar year January to
June 2008 2009 2010 2011 2012 2013 2013 2014
Quantity (short tons) Nonsubject U.S. imports from.-- South Africa 10,468 13,426 14,411 18,317 14,886 14,399 5,557 3,511
Japan 5,218 5,039 7,959 9,923 9,615 6,841 3,227 3,534Singapore 149 126 167 226 163 214 96 79Turkey 0 0 0 193 1,150 166 76 955Belgium 347 94 217 534 875 76 8 181Colombia 0 128 750 661 0 0 0 0Mexico 3,305 11 9 1,118 44 0 0 0All other sources 384 449 623 341 468 100 55 209
Total U.S. imports from nonsubject sources 19,871 19,273 24,136 31,314 27,201 21,796 9,019 8,539 Value (1,000 dollars) Nonsubject U.S. imports from.-- South Africa 20,180 29,574 36,814 45,172 31,662 27,441 11,075 6,759
Japan 10,142 12,875 18,540 23,503 23,849 16,735 7,872 8,848Singapore 243 214 269 325 291 372 159 142Turkey 0 0 0 113 644 322 136 516Belgium 938 283 497 649 518 144 23 116Colombia 0 259 1,397 1,232 0 0 0 0Mexico 1,908 16 14 948 35 0 0 0All other sources 677 714 811 403 496 165 86 146
Total U.S. imports from nonsubject sources 34,086 43,934 58,343 72,346 57,495 45,179 19,350 16,304 Unit value (dollars per short tons) Nonsubject U.S. imports from.-- South Africa 1,928 2,203 2,555 2,466 2,127 1,906 1,993 1,874
Japan 1,944 2,555 2,330 2,369 2,480 2,446 2,439 2,419Singapore 1,628 1,701 1,611 1,439 1,779 1,736 1,655 1,794Turkey 0 0 0 584 559 1,940 1,799 540Belgium 2,702 2,996 2,296 1,216 593 1,902 2,864 641Colombia 0 2,027 1,864 1,862 0 0 0 0Mexico 577 1,543 1,543 848 803 0 0 0All other sources 1,764 1,589 1,300 1,183 1,059 1,650 1,562 1,444
Total U.S. imports from nonsubject sources 1,715 2,280 2,417 2,310 2,114 2,073 2,146 1,909Source: Compiled from Official Statistics of the Department of Commerce.
IV‐3
U.S. IMPORTERS’ IMPORTS SUBSEQUENT TO DECEMBER 31, 2013
The Commission requested importers to indicate whether they had imported or arranged for the importation of EMD from Australia and/or China for delivery after December 31, 2013. Table IV-3 EMD: U.S. importers orders for delivery in 2014
* * * * * * *
Non‐Tariff Barriers
The Government of Japan imposed antidumping duties on EMD from Australia, Spain, China, and South Africa from September 1, 2008 to August 31, 2013 (tariff rates: Australia, 29.3 percent; China, 34.3 percent to Guizhou Redstar Developing Co., Ltd.; South Africa, 14.5 percent; and Spain, 46.5 percent). In August 2012, Tosoh filed an application for extension of the period of the antidumping duties imposed on EMD originating in these countries, except Australia, where the business was abandoned. Post investigation, Japan found that imports of the dumped EMD in question still continue and that, accordingly, material injury to the domestic industry will continue or is likely to continue to take place again. Finally, Japan concluded that an extension of the period of the antidumping duties currently imposed on such products is appropriate. On February 21, 2014, Japan extended the duties on imports of EMD from China, South Africa, and Spain for five years from the completion of the investigation was an appropriate measure.2
The European Union renewed a 17.1 percent duty on imports of EMD from South Africa on February 24, 2014, citing that Tosoh Hellas (Greece) and Cegassa Internacional (Spain), the EU’s only producers of EMD are “still in a fragile and vulnerable situation.”3
2 “A Report was Compiled Concerning the Expiry Review of Anti‐Dumping Duty of Electrolytic Manganese Dioxide Originating in the Republic of South Africa, the People’s Republic of China, and Spain,” Office for Trade Remedy Investigations, Trade Control Dept., Trade and Economic Cooperation Bureau, February 21, 2014. http://www.meti.go.jp/english/press/2014/0221_03.html
3 “South Africa Faces Renewed CU Duty on Consumer‐Battery Material,” Jonathan Stearns, Bloomberg, February 24, 2014. http://www.bloomberg.com/news/2014‐02‐24/south‐africa‐faces‐renewed‐eu‐duty‐on‐consumer‐battery‐material.html
IV‐4
U.S. importers’ inventories
Table IV‐4 presents data for inventories of U.S. imports of EMD from Australia, China, and all other sources held in the United States.
Table IV-4
EMD: U.S. importers’ end-of-period inventories of imports, by source, 2008-2013, January-June 2013, and January-June 2014
* * * * * * *
CUMULATION CONSIDERATIONS
In assessing whether imports should be cumulated, the Commission determines whether U.S. imports from the subject countries are likely to compete with each other and with the domestic like product and has generally considered four factors: (1) fungibility, (2) presence of sales or offers to sell in the same geographical markets, (3) common or similar channels of distribution, and (4) simultaneous presence in the market. Additional information concerning fungibility, geographical markets, and simultaneous presence in the market is presented below.
Pertinent information on fungibility, channels of distribution, and geographic presence is provided in Part II of this report. Empirical data on simultaneous presence is very limited or not available because subject imports from both Australia and China were largely absent from the U.S. market during the period of review.
IV‐5
SUBJECT COUNTRY PRODUCERS
THE INDUSTRY IN AUSTRALIA
Overview
During the original investigations, Delta EMD Australia Pty. Ltd. (Delta Australia”), the sole producer of EMD in Australia, responded to the Commission questionnaire.4
On December 18, 2007, the Delta EMD Ltd. (Australia) (“Delta Australia”) board made the decision to cease production at the group’s Australia plant during March 2008. The demand for EMD in the United States, Europe, and Japan had declined with battery production migration to China and the use of larger cells reducing in favor of smaller cells that require less EMD. The EMD market was oversupplied with strong price competition while the cost of manganese ore and other inputs continued to increase substantially, resulting in poor margins. The profitability of EMD producers also continued to vary as a consequence of movement in the value of the U.S. dollar against local (Australian dollar) currency production costs. Future sales opportunity for the Australia plant was further limited due to the implementation by the U.S. Government of punitive antidumping duties against the import of EMD from Australia in 2008. These duties rendered the operation unviable and there was therefore no alternative but to shut Delta Australia down. 5
The Australia plant was shut and decommissioned during 2008 and all plant assets were sold. Remaining EMD inventory in warehouse and on water was sold during 2008.6 Staff is not aware of any other EMD producers in Australia.7
Operations on EMD
The Commission received a foreign producer questionnaire response from Delta EMD Ltd., South Africa, with regard to the EMD operations of Delta Australia during the period of review. Table IV‐5 presents data for reported Australian production and shipments of EMD.
Table IV-5 EMD: Australian production capacity, production, shipments, and inventories, 2008-13, January-June 2013, and January-June 2014
* * * * * * *
4 USITC Publication 4036 at VII‐1. 5 Delta Australia’s foreign producer questionnaire response; letter of explanation from Praveen
Baijnath, Chief Executive Officer, August 28, 2014. 6 Ibid. 7 The sole Australian producer identified in the response to the notice of institution is Delta Australia.
Substantive Response of Erachem, October 18, 2013, p. 9; Substantive Response of Tronox, October 18, 2013, p. 9.
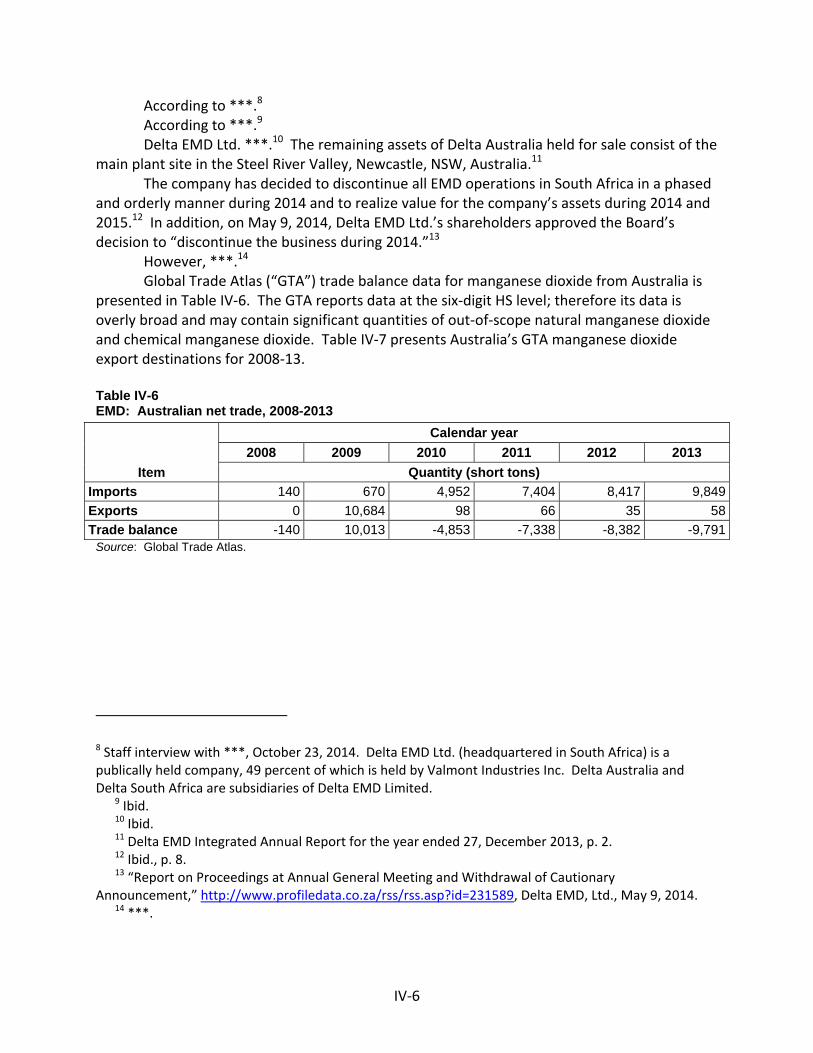
IV‐6
According to ***.8 According to ***.9 Delta EMD Ltd. ***.10 The remaining assets of Delta Australia held for sale consist of the
main plant site in the Steel River Valley, Newcastle, NSW, Australia.11 The company has decided to discontinue all EMD operations in South Africa in a phased
and orderly manner during 2014 and to realize value for the company’s assets during 2014 and 2015.12 In addition, on May 9, 2014, Delta EMD Ltd.’s shareholders approved the Board’s decision to “discontinue the business during 2014.”13
However, ***.14 Global Trade Atlas (“GTA”) trade balance data for manganese dioxide from Australia is
presented in Table IV‐6. The GTA reports data at the six‐digit HS level; therefore its data is overly broad and may contain significant quantities of out‐of‐scope natural manganese dioxide and chemical manganese dioxide. Table IV‐7 presents Australia’s GTA manganese dioxide export destinations for 2008‐13.
Table IV-6 EMD: Australian net trade, 2008-2013
Item
Calendar year
2008 2009 2010 2011 2012 2013
Quantity (short tons)
Imports 140 670 4,952 7,404 8,417 9,849
Exports 0 10,684 98 66 35 58
Trade balance -140 10,013 -4,853 -7,338 -8,382 -9,791Source: Global Trade Atlas.
8 Staff interview with ***, October 23, 2014. Delta EMD Ltd. (headquartered in South Africa) is a publically held company, 49 percent of which is held by Valmont Industries Inc. Delta Australia and Delta South Africa are subsidiaries of Delta EMD Limited.
9 Ibid. 10 Ibid. 11 Delta EMD Integrated Annual Report for the year ended 27, December 2013, p. 2. 12 Ibid., p. 8. 13 “Report on Proceedings at Annual General Meeting and Withdrawal of Cautionary
Announcement,” http://www.profiledata.co.za/rss/rss.asp?id=231589, Delta EMD, Ltd., May 9, 2014. 14 ***.
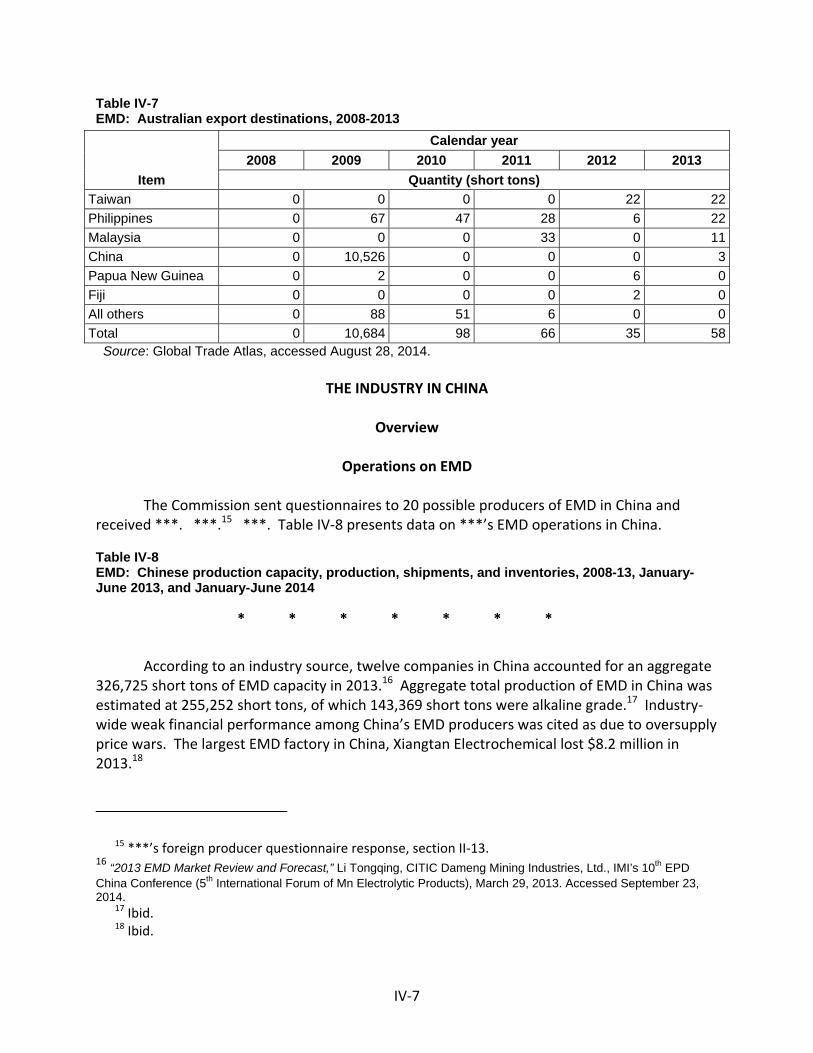
IV‐7
Table IV-7 EMD: Australian export destinations, 2008-2013
Item
Calendar year
2008 2009 2010 2011 2012 2013
Quantity (short tons)
Taiwan 0 0 0 0 22 22
Philippines 0 67 47 28 6 22
Malaysia 0 0 0 33 0 11
China 0 10,526 0 0 0 3
Papua New Guinea 0 2 0 0 6 0
Fiji 0 0 0 0 2 0
All others 0 88 51 6 0 0
Total 0 10,684 98 66 35 58 Source: Global Trade Atlas, accessed August 28, 2014.
THE INDUSTRY IN CHINA
Overview
Operations on EMD
The Commission sent questionnaires to 20 possible producers of EMD in China and received ***. ***.15 ***. Table IV‐8 presents data on ***’s EMD operations in China. Table IV-8 EMD: Chinese production capacity, production, shipments, and inventories, 2008-13, January-June 2013, and January-June 2014
* * * * * * *
According to an industry source, twelve companies in China accounted for an aggregate 326,725 short tons of EMD capacity in 2013.16 Aggregate total production of EMD in China was estimated at 255,252 short tons, of which 143,369 short tons were alkaline grade.17 Industry‐wide weak financial performance among China’s EMD producers was cited as due to oversupply price wars. The largest EMD factory in China, Xiangtan Electrochemical lost $8.2 million in 2013.18
15 ***’s foreign producer questionnaire response, section II‐13. 16 “2013 EMD Market Review and Forecast,” Li Tongqing, CITIC Dameng Mining Industries, Ltd., IMI’s 10th EPD China Conference (5th International Forum of Mn Electrolytic Products), March 29, 2013. Accessed September 23, 2014.
17 Ibid. 18 Ibid.
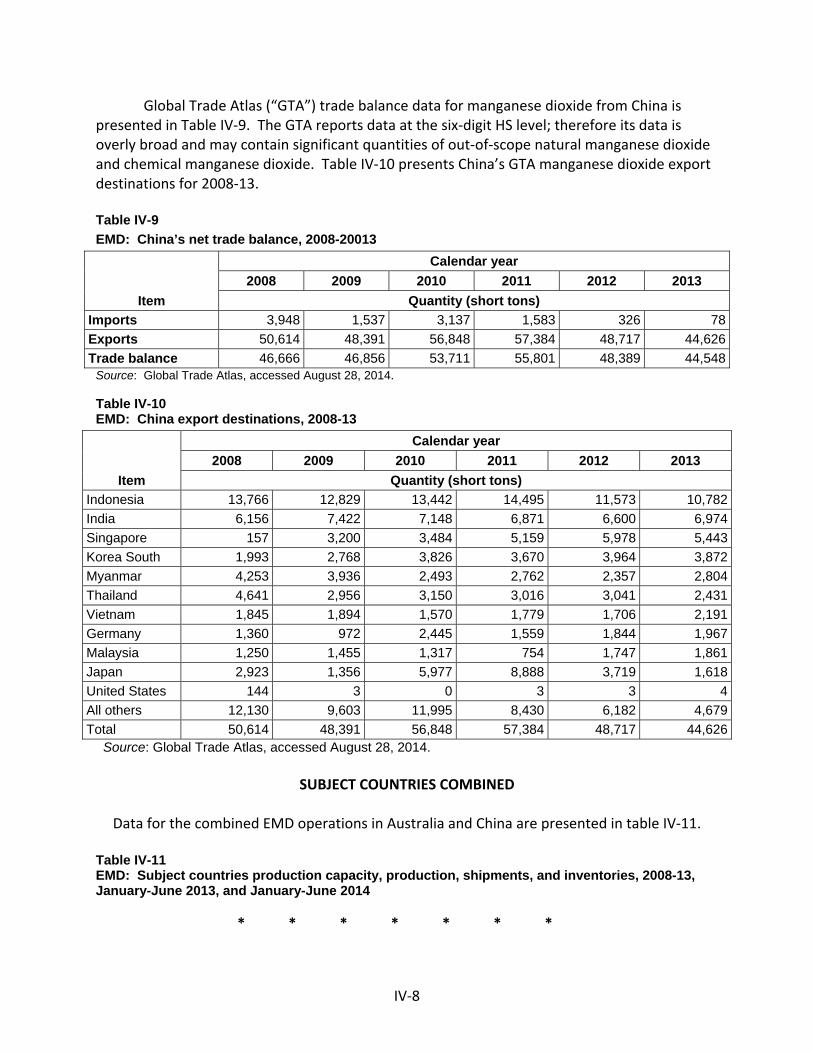
IV‐8
Global Trade Atlas (“GTA”) trade balance data for manganese dioxide from China is presented in Table IV‐9. The GTA reports data at the six‐digit HS level; therefore its data is overly broad and may contain significant quantities of out‐of‐scope natural manganese dioxide and chemical manganese dioxide. Table IV‐10 presents China’s GTA manganese dioxide export destinations for 2008‐13.
Table IV-9
EMD: China’s net trade balance, 2008-20013
Item
Calendar year
2008 2009 2010 2011 2012 2013
Quantity (short tons)
Imports 3,948 1,537 3,137 1,583 326 78
Exports 50,614 48,391 56,848 57,384 48,717 44,626
Trade balance 46,666 46,856 53,711 55,801 48,389 44,548Source: Global Trade Atlas, accessed August 28, 2014.
Table IV-10 EMD: China export destinations, 2008-13
Item
Calendar year
2008 2009 2010 2011 2012 2013
Quantity (short tons)
Indonesia 13,766 12,829 13,442 14,495 11,573 10,782
India 6,156 7,422 7,148 6,871 6,600 6,974
Singapore 157 3,200 3,484 5,159 5,978 5,443
Korea South 1,993 2,768 3,826 3,670 3,964 3,872
Myanmar 4,253 3,936 2,493 2,762 2,357 2,804
Thailand 4,641 2,956 3,150 3,016 3,041 2,431
Vietnam 1,845 1,894 1,570 1,779 1,706 2,191
Germany 1,360 972 2,445 1,559 1,844 1,967
Malaysia 1,250 1,455 1,317 754 1,747 1,861
Japan 2,923 1,356 5,977 8,888 3,719 1,618
United States 144 3 0 3 3 4
All others 12,130 9,603 11,995 8,430 6,182 4,679
Total 50,614 48,391 56,848 57,384 48,717 44,626 Source: Global Trade Atlas, accessed August 28, 2014.
SUBJECT COUNTRIES COMBINED
Data for the combined EMD operations in Australia and China are presented in table IV‐11.
Table IV-11 EMD: Subject countries production capacity, production, shipments, and inventories, 2008-13, January-June 2013, and January-June 2014
* * * * * * *
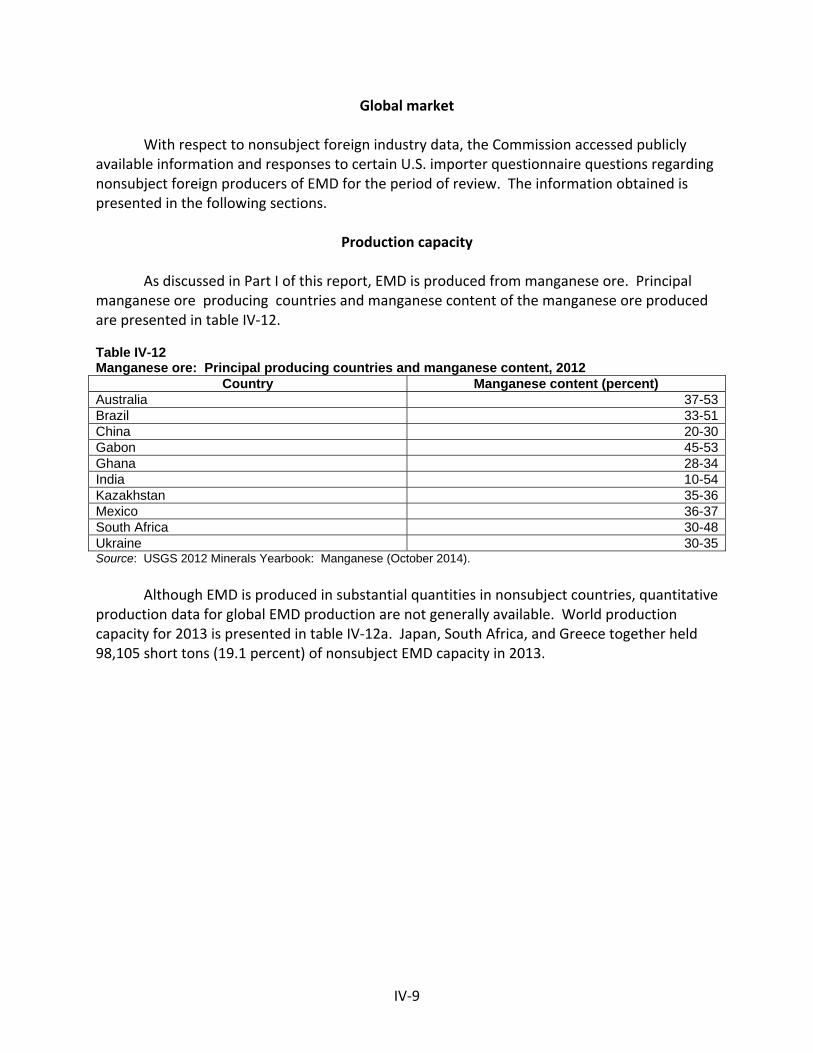
IV‐9
Global market
With respect to nonsubject foreign industry data, the Commission accessed publicly available information and responses to certain U.S. importer questionnaire questions regarding nonsubject foreign producers of EMD for the period of review. The information obtained is presented in the following sections.
Production capacity
As discussed in Part I of this report, EMD is produced from manganese ore. Principal
manganese ore producing countries and manganese content of the manganese ore produced are presented in table IV‐12. Table IV-12 Manganese ore: Principal producing countries and manganese content, 2012
Country Manganese content (percent) Australia 37-53Brazil 33-51China 20-30Gabon 45-53Ghana 28-34India 10-54Kazakhstan 35-36Mexico 36-37South Africa 30-48Ukraine 30-35Source: USGS 2012 Minerals Yearbook: Manganese (October 2014).
Although EMD is produced in substantial quantities in nonsubject countries, quantitative
production data for global EMD production are not generally available. World production capacity for 2013 is presented in table IV‐12a. Japan, South Africa, and Greece together held 98,105 short tons (19.1 percent) of nonsubject EMD capacity in 2013.
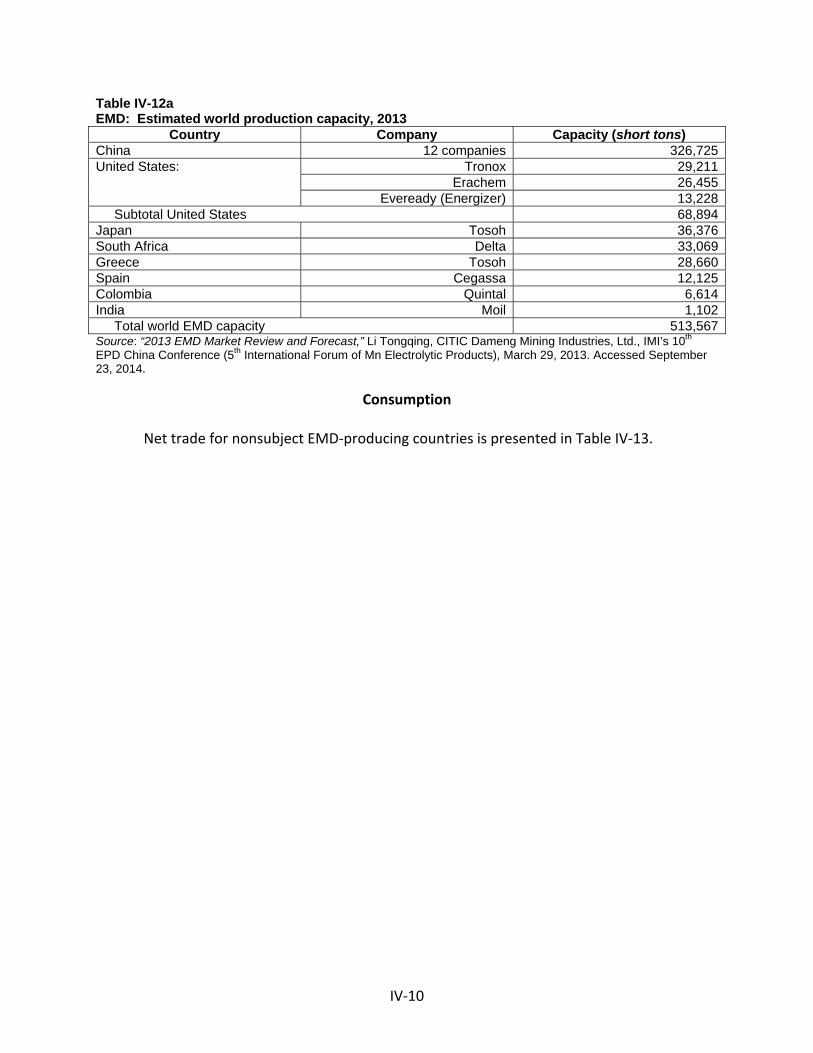
IV‐10
Table IV-12a EMD: Estimated world production capacity, 2013
Country Company Capacity (short tons) China 12 companies 326,725United States: Tronox 29,211
Erachem 26,455Eveready (Energizer) 13,228
Subtotal United States 68,894Japan Tosoh 36,376South Africa Delta 33,069Greece Tosoh 28,660Spain Cegassa 12,125Colombia Quintal 6,614India Moil 1,102 Total world EMD capacity 513,567Source: “2013 EMD Market Review and Forecast,” Li Tongqing, CITIC Dameng Mining Industries, Ltd., IMI’s 10th EPD China Conference (5th International Forum of Mn Electrolytic Products), March 29, 2013. Accessed September 23, 2014.
Consumption Net trade for nonsubject EMD‐producing countries is presented in Table IV‐13.
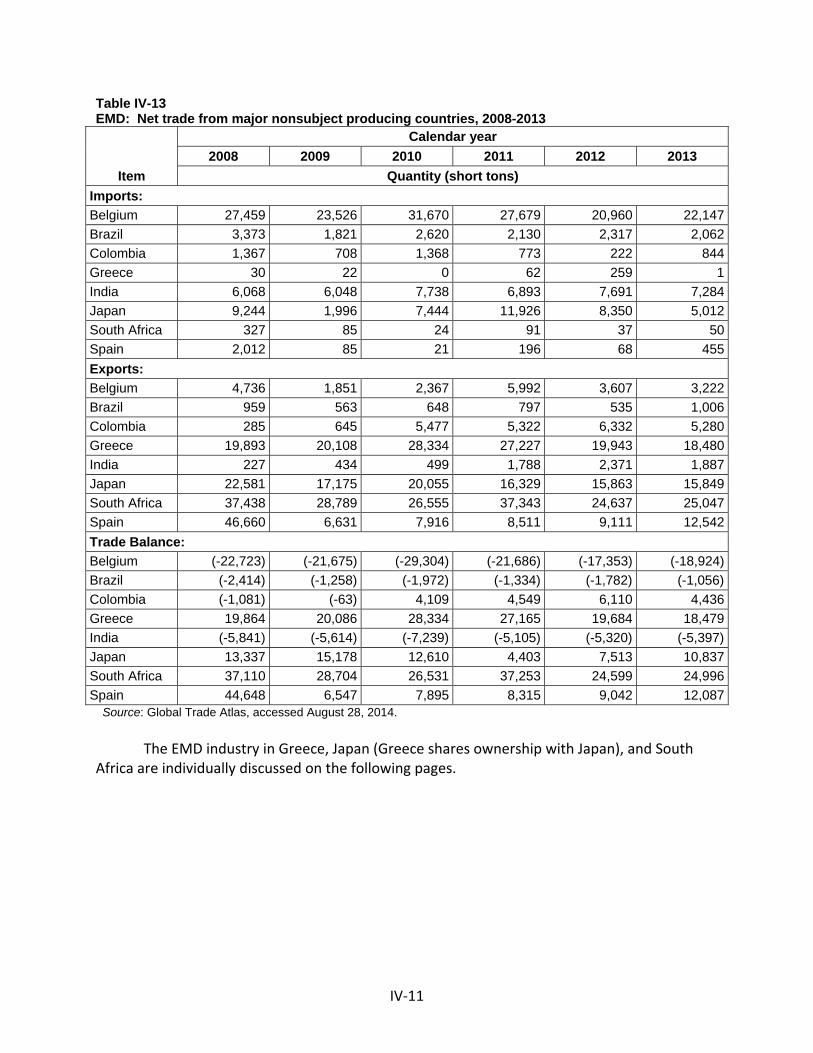
IV‐11
Table IV-13 EMD: Net trade from major nonsubject producing countries, 2008-2013
Item
Calendar year
2008 2009 2010 2011 2012 2013
Quantity (short tons)
Imports:
Belgium 27,459 23,526 31,670 27,679 20,960 22,147
Brazil 3,373 1,821 2,620 2,130 2,317 2,062
Colombia 1,367 708 1,368 773 222 844
Greece 30 22 0 62 259 1
India 6,068 6,048 7,738 6,893 7,691 7,284
Japan 9,244 1,996 7,444 11,926 8,350 5,012
South Africa 327 85 24 91 37 50
Spain 2,012 85 21 196 68 455
Exports:
Belgium 4,736 1,851 2,367 5,992 3,607 3,222
Brazil 959 563 648 797 535 1,006
Colombia 285 645 5,477 5,322 6,332 5,280
Greece 19,893 20,108 28,334 27,227 19,943 18,480
India 227 434 499 1,788 2,371 1,887
Japan 22,581 17,175 20,055 16,329 15,863 15,849
South Africa 37,438 28,789 26,555 37,343 24,637 25,047
Spain 46,660 6,631 7,916 8,511 9,111 12,542
Trade Balance:
Belgium (-22,723) (-21,675) (-29,304) (-21,686) (-17,353) (-18,924)
Brazil (-2,414) (-1,258) (-1,972) (-1,334) (-1,782) (-1,056)
Colombia (-1,081) (-63) 4,109 4,549 6,110 4,436
Greece 19,864 20,086 28,334 27,165 19,684 18,479
India (-5,841) (-5,614) (-7,239) (-5,105) (-5,320) (-5,397)
Japan 13,337 15,178 12,610 4,403 7,513 10,837
South Africa 37,110 28,704 26,531 37,253 24,599 24,996
Spain 44,648 6,547 7,895 8,315 9,042 12,087 Source: Global Trade Atlas, accessed August 28, 2014.
The EMD industry in Greece, Japan (Greece shares ownership with Japan), and South
Africa are individually discussed on the following pages.
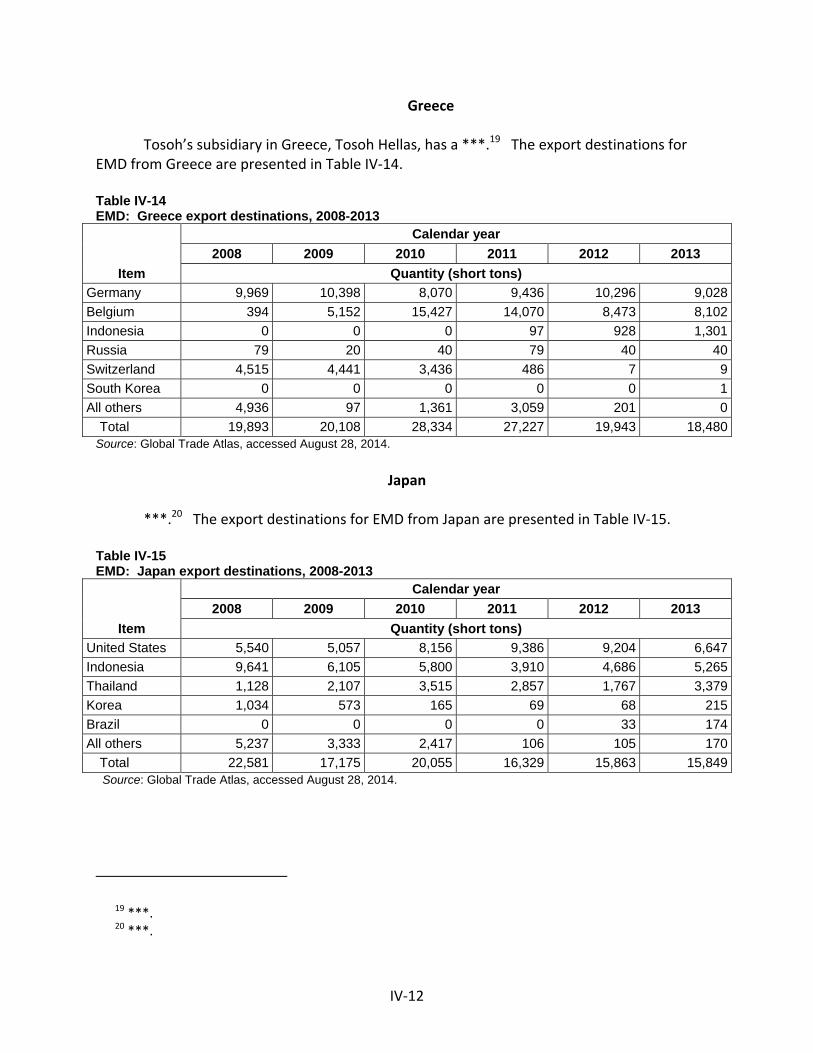
IV‐12
Greece
Tosoh’s subsidiary in Greece, Tosoh Hellas, has a ***.19 The export destinations for EMD from Greece are presented in Table IV‐14.
Table IV-14 EMD: Greece export destinations, 2008-2013
Item
Calendar year
2008 2009 2010 2011 2012 2013
Quantity (short tons)
Germany 9,969 10,398 8,070 9,436 10,296 9,028
Belgium 394 5,152 15,427 14,070 8,473 8,102
Indonesia 0 0 0 97 928 1,301
Russia 79 20 40 79 40 40
Switzerland 4,515 4,441 3,436 486 7 9
South Korea 0 0 0 0 0 1
All others 4,936 97 1,361 3,059 201 0
Total 19,893 20,108 28,334 27,227 19,943 18,480Source: Global Trade Atlas, accessed August 28, 2014.
Japan
***.20 The export destinations for EMD from Japan are presented in Table IV‐15.
Table IV-15 EMD: Japan export destinations, 2008-2013
Item
Calendar year
2008 2009 2010 2011 2012 2013
Quantity (short tons)
United States 5,540 5,057 8,156 9,386 9,204 6,647
Indonesia 9,641 6,105 5,800 3,910 4,686 5,265
Thailand 1,128 2,107 3,515 2,857 1,767 3,379
Korea 1,034 573 165 69 68 215
Brazil 0 0 0 0 33 174
All others 5,237 3,333 2,417 106 105 170
Total 22,581 17,175 20,055 16,329 15,863 15,849 Source: Global Trade Atlas, accessed August 28, 2014.
19 ***. 20 ***.
IV‐13
South Africa Delta EMD South Africa Pty Ltd. has decided, subject to shareholder approval, to discontinue operations during 2014 and to realize value for the company’s assets during 2014 and 2015. The company considered a number of strategic options including the sale of the business, a change in strategy, and discontinuation. Efforts to sell the business were not successful, however the company will still consider any further interest, and the company’s sites might be of interest to different purchasers. The investigation of alternative strategies has not identified attractive investment opportunities. Given the declining state of the global EMD market, and Delta EMD South Africa’s deteriorating financial performance, the company has concluded that the discontinuance of the business in an orderly manner is the most prudent course of action. Factors contributing to the decision include: global EMD capacity exceeding demand in a declining market, resulting in lower global EMD selling prices; the continued imposition of antidumping duties on Delta EMD’s exports to certain geographies; international battery producers preference for domestic supply; the increasing cost of doing business; Delta EMD’s limited competitive advantages; a requirement for substantial capital expenditure to sustain Delta EMD’s operations; and a substantial North American customer’s recent decision to substantially reduce supply from Delta EMD South Africa, as announced on January 24, 2014. Shut down of EMD production, if approved by Delta EMD South Africa’s shareholders, will be done in a phased manner after production of adequate inventory to supply customers their committed volumes and to allow the orderly transition of their supply arrangements. The board also took a decision to limit production and expected to have one of the company’s two EMD production lines idled by the end of March 2014.21 Further, on May 9, 2014, Delta EMD, Ltd. announced that the shareholders approved the resolution of the Board’s decision to discontinue the business.22 Table IV‐16 presents export destinations for South African EMD production.
21 “Delta EMD – Planned Discontinuation of Operations and Sale of Assets,” accessed September 15, 2014. http://www.deltaemd.co.za/index.php/discontinuation‐of‐operations and http://www.deltaemd.co.za/index.php/investor‐information/discontinuation‐of‐operations.
22 “Report on Proceedings at Annual General Meeting and Withdrawal of Cautionary Announcement,” http://www.profiledata.co.za/rss/rss.asp?id=231589, Delta EMD, Ltd., May 9, 2014.
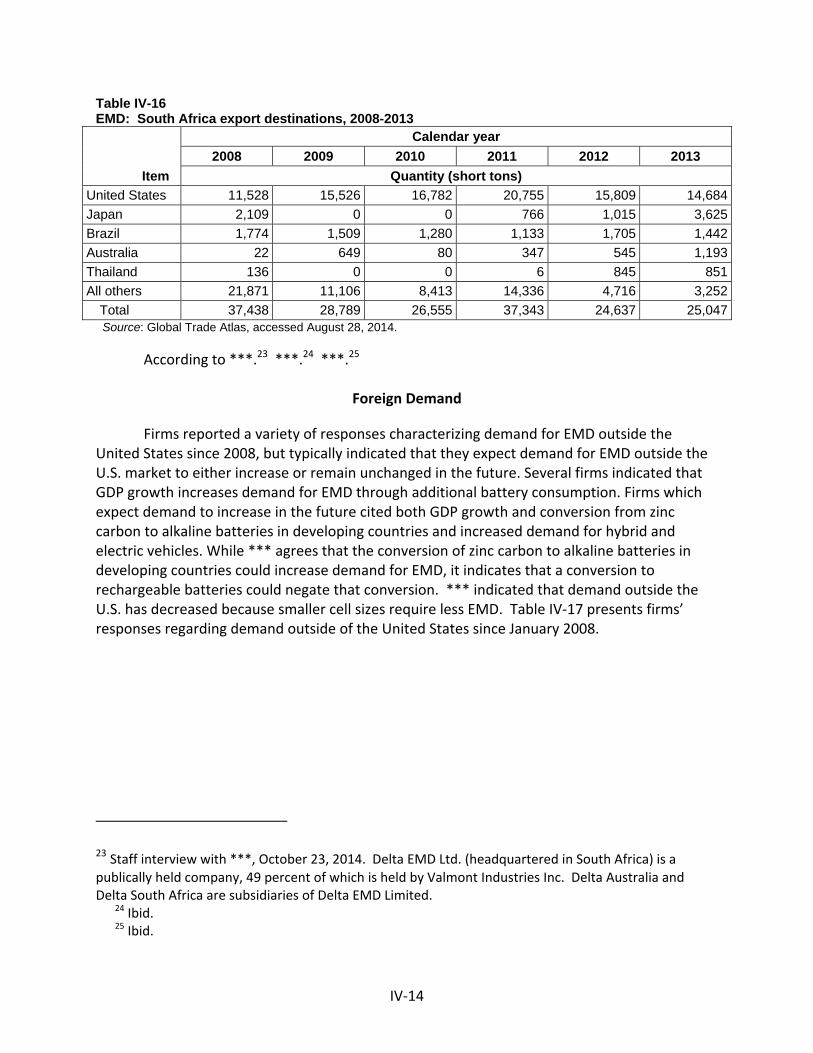
IV‐14
Table IV-16 EMD: South Africa export destinations, 2008-2013
Item
Calendar year
2008 2009 2010 2011 2012 2013
Quantity (short tons)
United States 11,528 15,526 16,782 20,755 15,809 14,684
Japan 2,109 0 0 766 1,015 3,625
Brazil 1,774 1,509 1,280 1,133 1,705 1,442
Australia 22 649 80 347 545 1,193
Thailand 136 0 0 6 845 851
All others 21,871 11,106 8,413 14,336 4,716 3,252
Total 37,438 28,789 26,555 37,343 24,637 25,047 Source: Global Trade Atlas, accessed August 28, 2014.
According to ***.23 ***.24 ***.25
Foreign Demand
Firms reported a variety of responses characterizing demand for EMD outside the United States since 2008, but typically indicated that they expect demand for EMD outside the U.S. market to either increase or remain unchanged in the future. Several firms indicated that GDP growth increases demand for EMD through additional battery consumption. Firms which expect demand to increase in the future cited both GDP growth and conversion from zinc carbon to alkaline batteries in developing countries and increased demand for hybrid and electric vehicles. While *** agrees that the conversion of zinc carbon to alkaline batteries in developing countries could increase demand for EMD, it indicates that a conversion to rechargeable batteries could negate that conversion. *** indicated that demand outside the U.S. has decreased because smaller cell sizes require less EMD. Table IV‐17 presents firms’ responses regarding demand outside of the United States since January 2008.
23 Staff interview with ***, October 23, 2014. Delta EMD Ltd. (headquartered in South Africa) is a publically held company, 49 percent of which is held by Valmont Industries Inc. Delta Australia and Delta South Africa are subsidiaries of Delta EMD Limited.
24 Ibid. 25 Ibid.
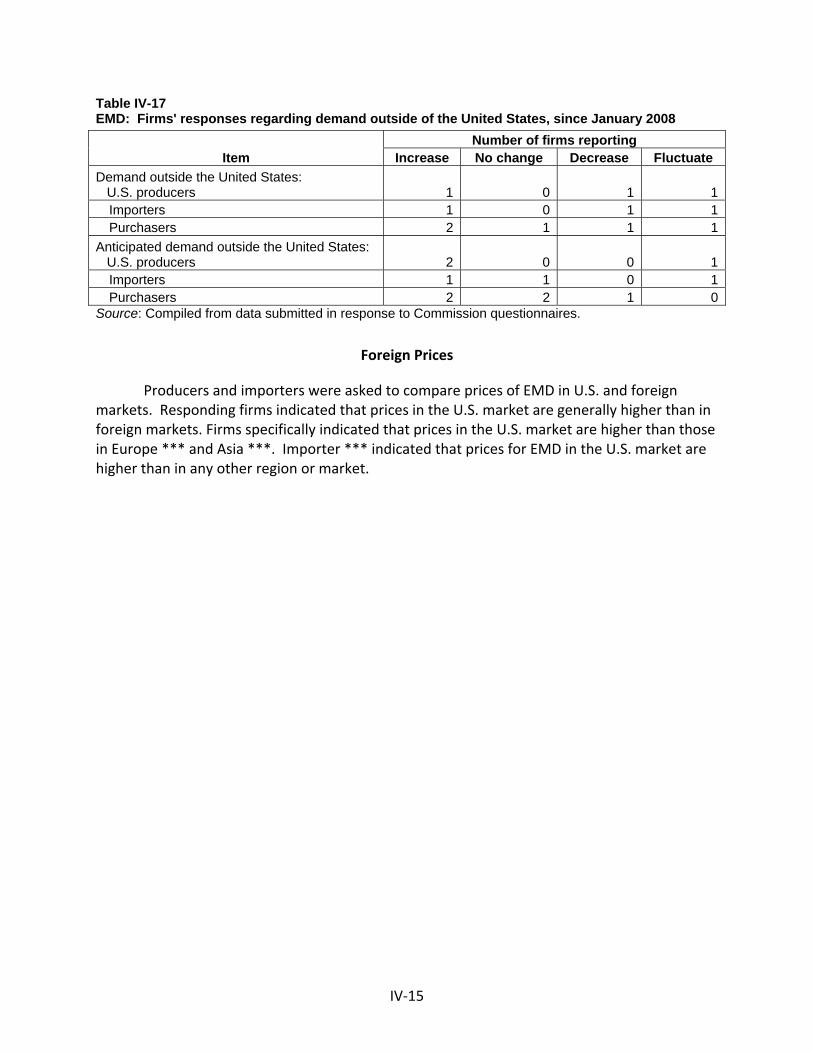
IV‐15
Table IV-17 EMD: Firms' responses regarding demand outside of the United States, since January 2008
Item Number of firms reporting
Increase No change Decrease Fluctuate
Demand outside the United States: U.S. producers 1 0 1 1
Importers 1 0 1 1Purchasers 2 1 1 1
Anticipated demand outside the United States: U.S. producers 2 0 0 1
Importers 1 1 0 1Purchasers 2 2 1 0
Source: Compiled from data submitted in response to Commission questionnaires.
Foreign Prices
Producers and importers were asked to compare prices of EMD in U.S. and foreign markets. Responding firms indicated that prices in the U.S. market are generally higher than in foreign markets. Firms specifically indicated that prices in the U.S. market are higher than those in Europe *** and Asia ***. Importer *** indicated that prices for EMD in the U.S. market are higher than in any other region or market.

V‐1
PART V: PRICING DATA
FACTORS AFFECTING PRICES
Raw material costs
Total raw material costs averaged *** percent of the U.S. producers’ total costs of goods sold for EMD in the United States during January 2008‐June 2014. The principal raw material input used to produce domestic EMD is manganese ore (raw and/or calcined manganese ore) while energy (natural gas and electricity) is also an important input cost to produce EMD. Manganese ore averaged 20 to 32 percent of the U.S. producers’ total cost of goods sold while natural gas and electricity averaged 12 to 20 percent of total cost of goods sold. Aside from seasonal fluctuations, the industrial price of electricity increased by about 7 percent during 2008, increased by about 9 percent during 2009 and fluctuated at the same level before increasing by 8 percent during 2013 (see figure V‐1). The NYMEX futures price for natural gas has fluctuated since January 2008, decreasing by as much as 75 percent between January 2008 through April 2012, but almost doubling from that level through August 2014.
Two of three U.S. producers and three of five responding U.S. importers indicated that raw material costs have increased since 2008. The remaining responding U.S. producer and three responding importers indicated that raw material costs have fluctuated (some firms provided more than one response). Most firms cited a spike in manganese ore prices in 2008, although some firms indicated that prices have fallen and then fluctuated.
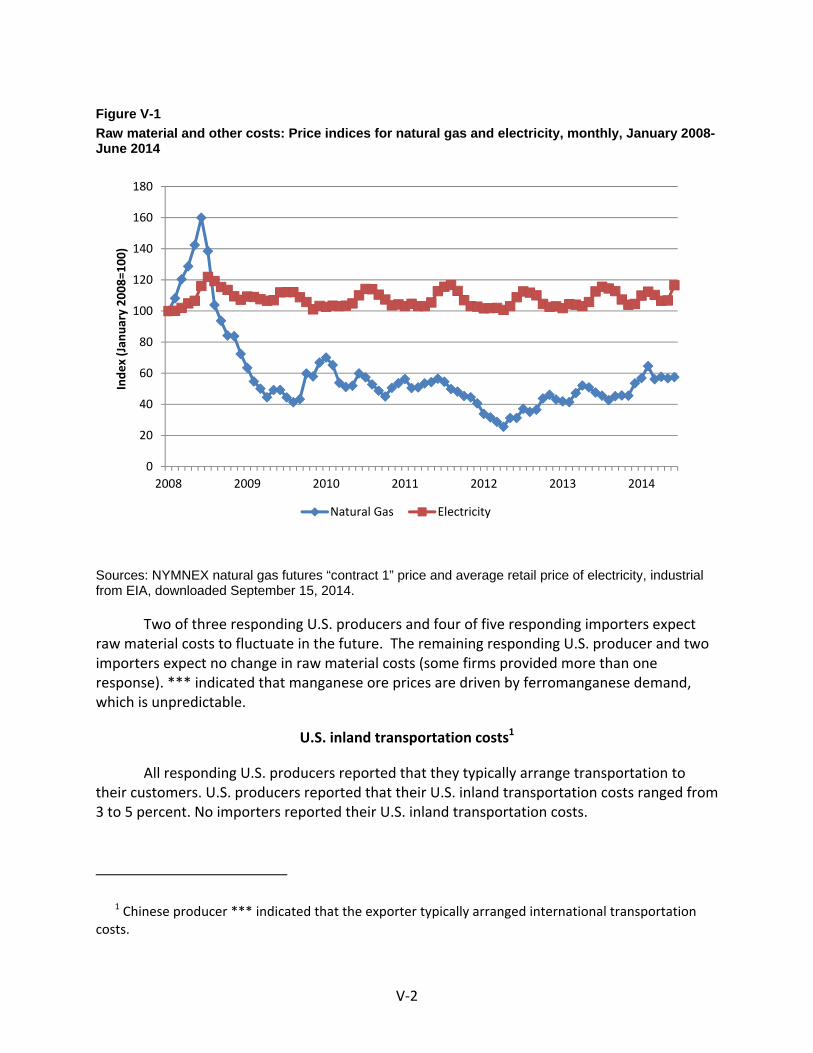
V‐2
Figure V-1
Raw material and other costs: Price indices for natural gas and electricity, monthly, January 2008-June 2014
Sources: NYMNEX natural gas futures “contract 1” price and average retail price of electricity, industrial from EIA, downloaded September 15, 2014.
Two of three responding U.S. producers and four of five responding importers expect raw material costs to fluctuate in the future. The remaining responding U.S. producer and two importers expect no change in raw material costs (some firms provided more than one response). *** indicated that manganese ore prices are driven by ferromanganese demand, which is unpredictable.
U.S. inland transportation costs1
All responding U.S. producers reported that they typically arrange transportation to their customers. U.S. producers reported that their U.S. inland transportation costs ranged from 3 to 5 percent. No importers reported their U.S. inland transportation costs.
1 Chinese producer *** indicated that the exporter typically arranged international transportation costs.
0
20
40
60
80
100
120
140
160
180
2008 2009 2010 2011 2012 2013 2014
Index (Jan
uary 2008=100)
Natural Gas Electricity
V‐3
PRICING PRACTICES
Pricing methods
The two responding U.S. producers reported using contracts while the two responding importers reported using transaction‐by‐transaction negotiations (see table V‐1). In addition to transaction‐by‐transaction negotiations, importer *** reported using an annual volume/price agreement that is not a formal contract.
Table V-1
EMD: U.S. producers and importers reported price setting methods, by number of responding firms1
* * * * * * *
U.S. producers and importers reported making almost all of their sales using short‐term contracts and a small amount was sold using spot sales (see table V‐2). No importers reported commercial shipments of imports of EMD from subject countries after 2008.
Table V-2
EMD: U.S. producers’ and importers’ shares of U.S. commercial shipments by type of sale, 2013
* * * * * * *
Four of seven responding purchasers reported that they purchase product monthly, one purchases weekly, and one purchases quarterly. Only one of seven responding purchasers reported that it expected their purchasing patterns to change in the next two years. *** expects to purchase higher volumes in the future. Purchasers reported contacting one to five suppliers before making a purchase.
Sales terms and discounts
All responding U.S. producers typically quote prices on an f.o.b. basis. All responding importers reported typically quoting prices on delivered basis. All responding U.S. producers and importers reported not offering discounts for their sales of EMD.
Price leadership
Five purchasers reported that there are price leaders in the market for EMD, one purchaser indicated that there were no price leaders, and the remaining purchaser indicated that it did not know if there were any price leaders. Tronox was named by all five of these purchasers as a price leader and Erachem was named by two of the purchasers as a price leader.
V‐4
PRICE DATA
The Commission requested U.S. producers and importers to provide quarterly data for the total quantity and f.o.b. value of the following EMD product shipped to unrelated U.S. customers during first quarter of 2008 to the second quarter of 2014.
Product 1.‐‐ Standard alkaline grade electrolytic manganese dioxide in powder form.
Two U.S. producers and no importers provided usable pricing data for sales of the requested products, although not all firms reported pricing for all products for all quarters. Pricing data reported by these firms accounted for approximately 82 percent of U.S. producers’ shipments of product during the period examined. Price data for product 1 is presented in table V‐3 and figure V‐2. The decline in volume of product 1 during the last quarter of 2013 and the last first two quarters of 2014 was mostly due to increased ***.
Price trends2
The price of the one price product sold by U.S. producers increased between the first quarter of 2008 to the second quarter of 2014 by 34 percent. The bulk of the increase in price occurred between the last quarter of 2008 and the first quarter of 2009. This was shortly after the antidumping orders on EMD were implemented. The price increased slightly during the first three quarters of 2008 and declined irregularly between the first quarter of 2009 and the second quarter of 2014. Table V-3 EMD: Weighted-average f.o.b. prices and quantities of domestic and imported product 11 and margins of underselling/(overselling), by quarters, January 2008-June 2014
* * * * * * *
Figure V-2
EMD: Weighted-average prices and quantities of domestic and imported product, by quarters, January 2008-June 2014
* * * * * * *
2 In the original investigations, subject imports from Australia were priced lower than domestic product in *** of *** comparisons, with underselling margins ranging from *** to *** percent. Subject imports from China were priced lower than domestic product in *** comparisons, with underselling margins ranging from *** to *** percent. Electrolytic Manganese Dioxide from Australia and China, Invs. Nos. 731‐TA‐1124 and 1125 (Final), USITC Publication 4036, p. V‐15.
A‐1
APPENDIX A
FEDERAL REGISTER NOTICES

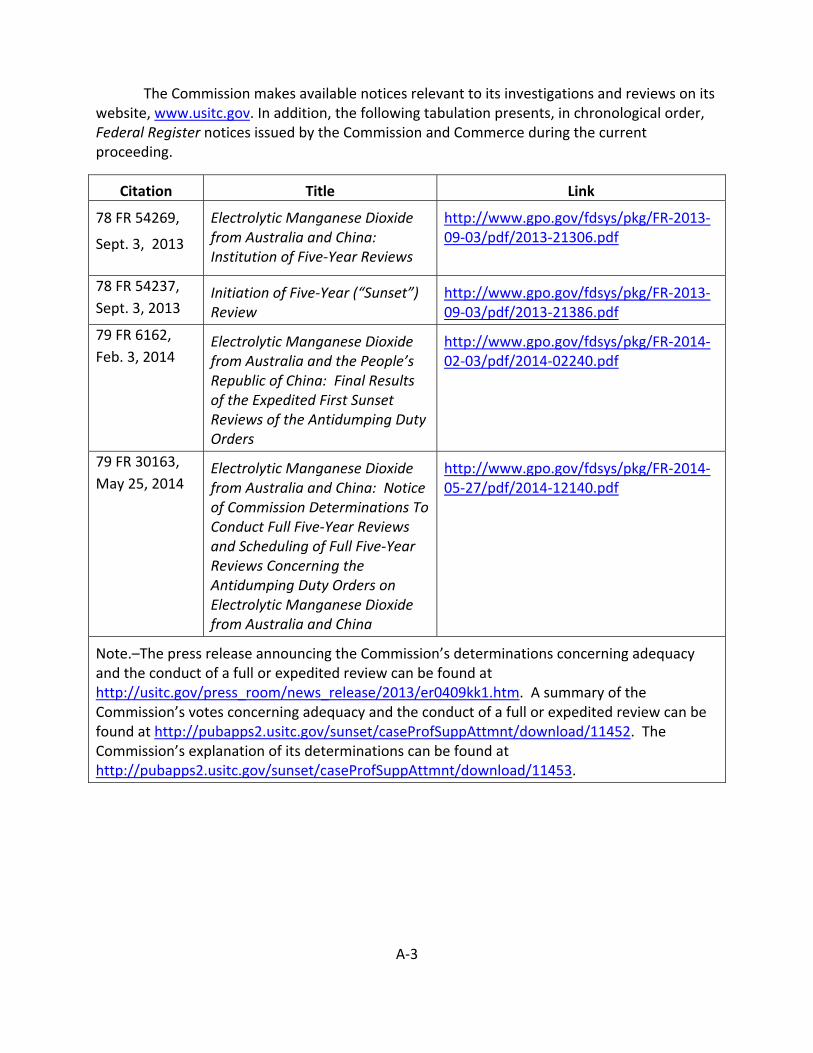
A‐3
The Commission makes available notices relevant to its investigations and reviews on its website, www.usitc.gov. In addition, the following tabulation presents, in chronological order, Federal Register notices issued by the Commission and Commerce during the current proceeding.
Citation Title Link
78 FR 54269,
Sept. 3, 2013
Electrolytic Manganese Dioxide from Australia and China: Institution of Five‐Year Reviews
http://www.gpo.gov/fdsys/pkg/FR‐2013‐09‐03/pdf/2013‐21306.pdf
78 FR 54237,
Sept. 3, 2013 Initiation of Five‐Year (“Sunset”) Review
http://www.gpo.gov/fdsys/pkg/FR‐2013‐09‐03/pdf/2013‐21386.pdf
79 FR 6162,
Feb. 3, 2014 Electrolytic Manganese Dioxide from Australia and the People’s Republic of China: Final Results of the Expedited First Sunset Reviews of the Antidumping Duty Orders
http://www.gpo.gov/fdsys/pkg/FR‐2014‐02‐03/pdf/2014‐02240.pdf
79 FR 30163,
May 25, 2014 Electrolytic Manganese Dioxide from Australia and China: Notice of Commission Determinations To Conduct Full Five‐Year Reviews and Scheduling of Full Five‐Year Reviews Concerning the Antidumping Duty Orders on Electrolytic Manganese Dioxide from Australia and China
http://www.gpo.gov/fdsys/pkg/FR‐2014‐05‐27/pdf/2014‐12140.pdf
Note.–The press release announcing the Commission’s determinations concerning adequacy and the conduct of a full or expedited review can be found at http://usitc.gov/press_room/news_release/2013/er0409kk1.htm. A summary of the Commission’s votes concerning adequacy and the conduct of a full or expedited review can be found at http://pubapps2.usitc.gov/sunset/caseProfSuppAttmnt/download/11452. The Commission’s explanation of its determinations can be found at http://pubapps2.usitc.gov/sunset/caseProfSuppAttmnt/download/11453.

B-1
APPENDIX B
LIST OF HEARING WITNESSES

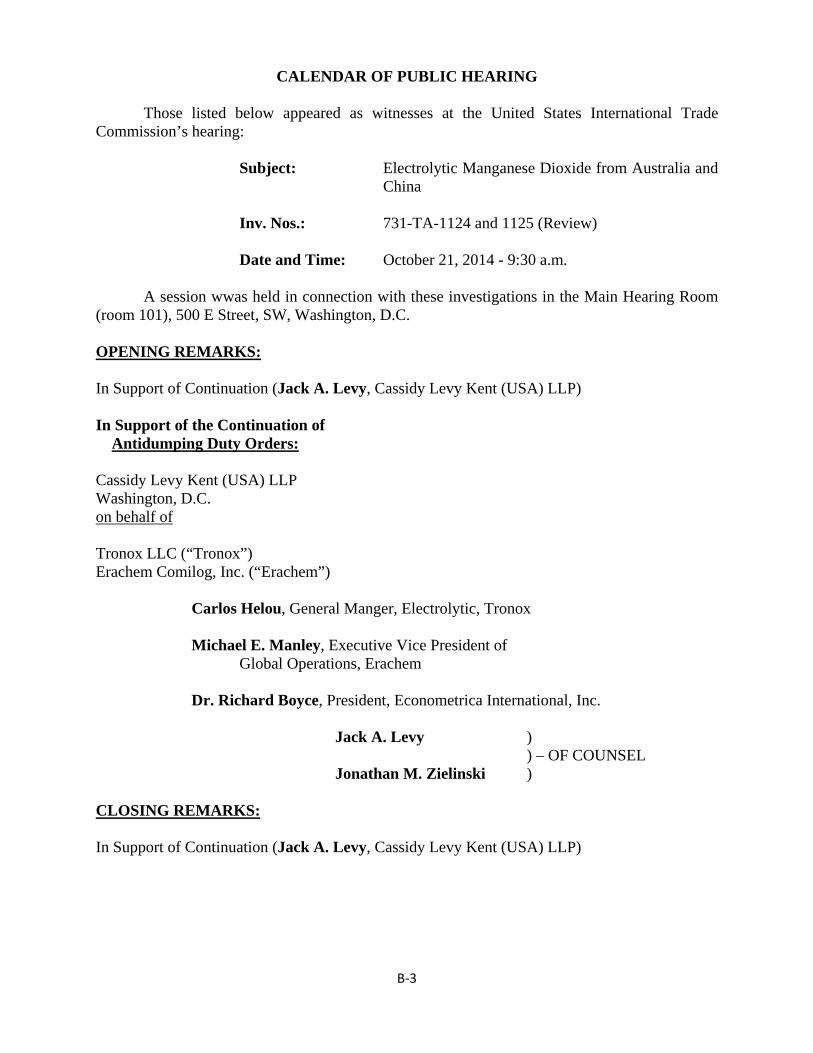
B‐3
CALENDAR OF PUBLIC HEARING Those listed below appeared as witnesses at the United States International Trade Commission’s hearing:
Subject: Electrolytic Manganese Dioxide from Australia and China
Inv. Nos.: 731-TA-1124 and 1125 (Review)
Date and Time: October 21, 2014 - 9:30 a.m.
A session wwas held in connection with these investigations in the Main Hearing Room (room 101), 500 E Street, SW, Washington, D.C. OPENING REMARKS: In Support of Continuation (Jack A. Levy, Cassidy Levy Kent (USA) LLP) In Support of the Continuation of Antidumping Duty Orders: Cassidy Levy Kent (USA) LLP Washington, D.C. on behalf of Tronox LLC (“Tronox”) Erachem Comilog, Inc. (“Erachem”) Carlos Helou, General Manger, Electrolytic, Tronox Michael E. Manley, Executive Vice President of Global Operations, Erachem Dr. Richard Boyce, President, Econometrica International, Inc.
Jack A. Levy ) ) – OF COUNSEL
Jonathan M. Zielinski ) CLOSING REMARKS: In Support of Continuation (Jack A. Levy, Cassidy Levy Kent (USA) LLP)


APPENDIX C
SUMMARY DATA

Table C-1 EMD: Summary data concerning the U.S. market, 2008-13, January to June 2013, and January to June 2014
* * * * * * *
C‐3

D‐1
APPENDIX D
COMMENTS ON THE SIGNIFICANCE OF THE EXISTING ANTIDUMPING DUTY ORDERS AND THE LIKELY EFFECTS OF REVOCATION

D-3
Appendix D is confidential in its entirety

E-1
APPENDIX E
THE U.S. INDUSTRY’S FINANCIAL RESULTS WITHOUT INPUT ADJUSTMENT FOR RELATED PARTY PROFIT OR LOSS

E-3
Table E-1 EMD: Results of operations of U.S. producers, 2008-13, January-June 2013, and January-June 2014
* * * * * * *
Source: Compiled from data submitted in response to Commission questionnaires.
Table E-2 EMD: Results of operations of U.S. producers, by firm, 2008-13, January-June 2013, and January-June 2014
* * * * * * *
Source: Compiled from data submitted in response to Commission questionnaires.
Table E-3 EMD: Variance analysis on the operations of U.S. producers, 2008-13, January-June 2013, and January-June 2014
* * * * * * *
Source: Compiled from data submitted in response to Commission questionnaires.


![A CLOSE LOOK AT ELECTROLYTIC MANGANESE DIOXIDE … · ISSN Figure 5. XtalDraw© [20] rendition of a 2:1 De Wolff regular-interstratified EMD with Prr = 0.5. and broadenings in reasonable](https://img.pdfslide.net/doc/110x75/5c441a2393f3c34c643cf8b4/a-close-look-at-electrolytic-manganese-dioxide-issn-figure-5-xtaldraw-20.jpg)