Embed Size (px)
Citation preview
Cerner Investment Community Meeting
Cerner Investment Community Meeting
February 24, 2009
Marc NaughtonSenior Vice President and Chief Financial Officer
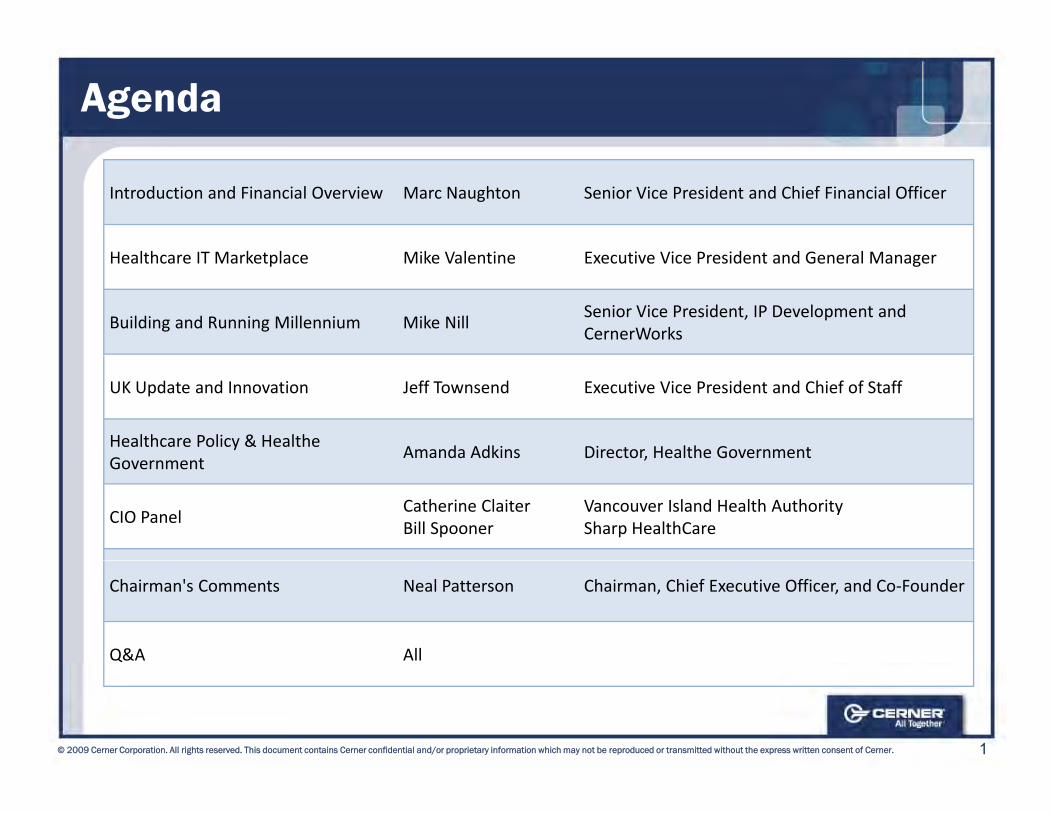
Agenda
Introduction and Financial Overview Marc Naughton Senior Vice President and Chief Financial Officer
H lth IT M k t l Mik V l ti E ti Vi P id t d G l MHealthcare IT Marketplace Mike Valentine Executive Vice President and General Manager
Building and Running Millennium Mike NillSenior Vice President, IP Development and CernerWorks
UK Update and Innovation Jeff Townsend Executive Vice President and Chief of Staff
Healthcare Policy & Healthe G
Amanda Adkins Director, Healthe GovernmentGovernment
a da d s ecto , ea t e Go e e t
CIO PanelCatherine ClaiterBill Spooner
Vancouver Island Health AuthoritySharp HealthCare
Chairman's Comments Neal Patterson Chairman, Chief Executive Officer, and Co‐Founder
Q&A All
1© 2009 Cerner Corporation. All rights reserved. This document contains Cerner confidential and/or proprietary information which may not be reproduced or transmitted without the express written consent of Cerner.
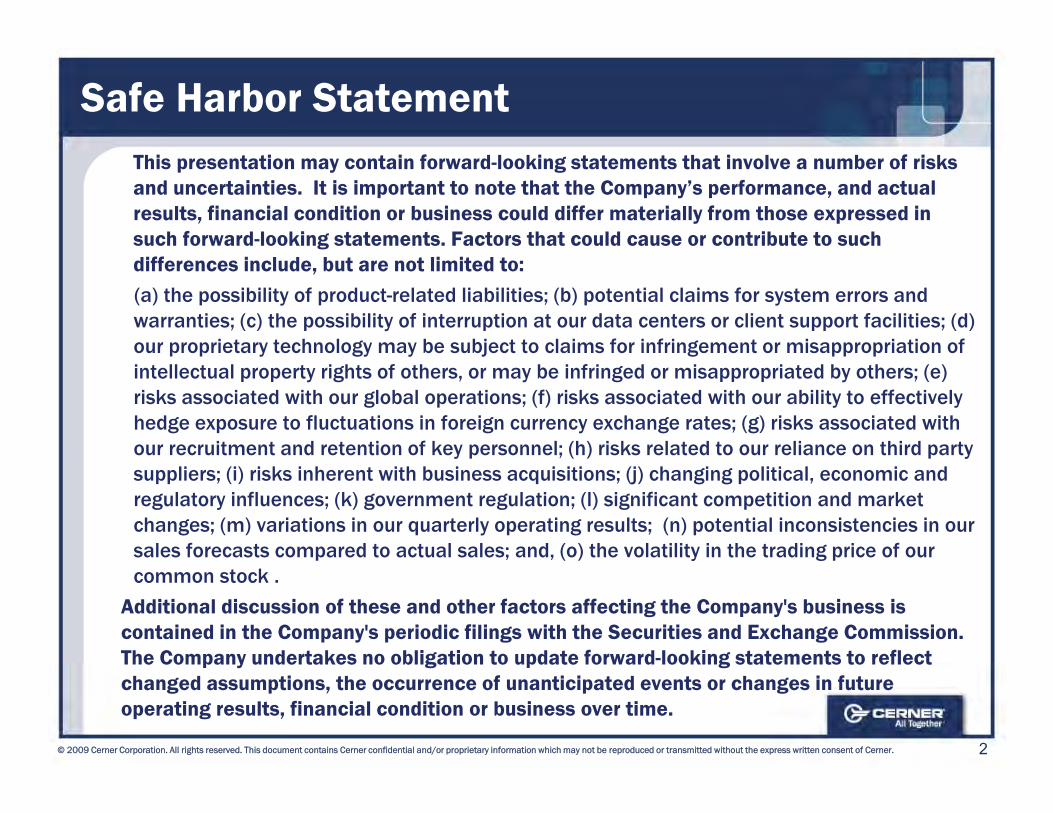
Safe Harbor StatementThis presentation may contain forward-looking statements that involve a number of risks and uncertainties. It is important to note that the Company’s performance, and actual results, financial condition or business could differ materially from those expressed in such forward-looking statements. Factors that could cause or contribute to such differences include, but are not limited to: (a) the possibility of product-related liabilities; (b) potential claims for system errors and warranties; (c) the possibility of interruption at our data centers or client support facilities; (d) our proprietary technology may be subject to claims for infringement or misappropriation of p p y gy y j g pp pintellectual property rights of others, or may be infringed or misappropriated by others; (e) risks associated with our global operations; (f) risks associated with our ability to effectively hedge exposure to fluctuations in foreign currency exchange rates; (g) risks associated with our recruitment and retention of key personnel; (h) risks related to our reliance on third party y p ; ( ) p ysuppliers; (i) risks inherent with business acquisitions; (j) changing political, economic and regulatory influences; (k) government regulation; (l) significant competition and market changes; (m) variations in our quarterly operating results; (n) potential inconsistencies in our sales forecasts compared to actual sales; and, (o) the volatility in the trading price of our p ( ) y g pcommon stock .
Additional discussion of these and other factors affecting the Company's business is contained in the Company's periodic filings with the Securities and Exchange Commission. The Company undertakes no obligation to update forward-looking statements to reflect
2© 2009 Cerner Corporation. All rights reserved. This document contains Cerner confidential and/or proprietary information which may not be reproduced or transmitted without the express written consent of Cerner.
The Company undertakes no obligation to update forward looking statements to reflect changed assumptions, the occurrence of unanticipated events or changes in future operating results, financial condition or business over time.
Cerner at a Glance
Founded in 1979, based in Kansas CityMost experienced healthcare IT managementLargest standalone healthcare IT company in world
Largest, most strategic worldwide healthcare IT client footprint
Over 6,000 hospital, health system, physician practice, clinic, laboratory, employer, government, and pharmacy client sitesclient sites
R&D Commitment and Clinical CultureOver $2B of cumulative R&DOver 900 CliniciansC l bl hiContemporary, scalable architectureMost comprehensive suite of healthcare solutions & services
2008 Revenues of $1,676M; Net Earnings of $180Mg10-year Revenue CAGR of 18% (mostly organic growth)10-year Earnings CAGR of 23%
7,600 Associates WorldwideOver 2 000 member Professional Services Organization
3© 2009 Cerner Corporation. All rights reserved. This document contains Cerner confidential and/or proprietary information which may not be reproduced or transmitted without the express written consent of Cerner.
Over 2,000 member Professional Services OrganizationOver 2,000 person Intellectual Property (IP) Organization
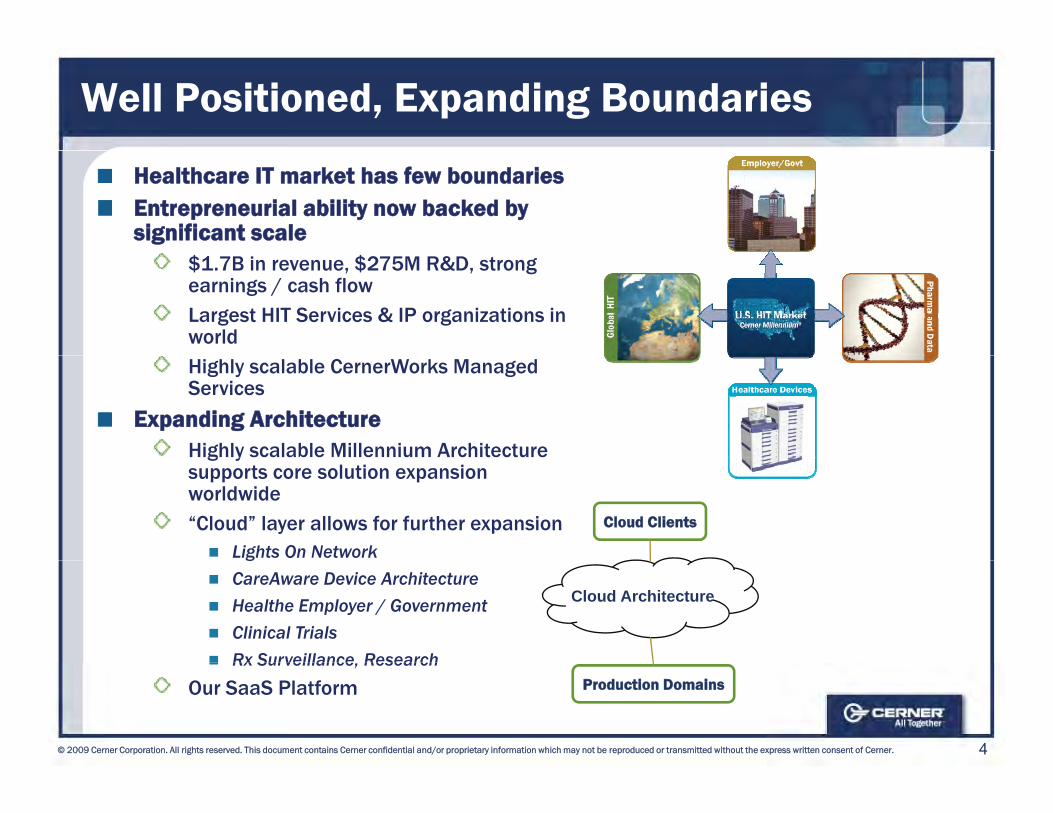
Well Positioned, Expanding Boundaries
Healthcare IT market has few boundaries Entrepreneurial ability now backed by significant scale
$1.7B in revenue, $275M R&D, strong earnings / cash flowLargest HIT Services & IP organizations in worldHighly scalable CernerWorks Managed Services
Expanding ArchitectureHighly scalable Millennium Architecture g ysupports core solution expansion worldwide“Cloud” layer allows for further expansion
Lights On Network
Cloud Clients
gCareAware Device ArchitectureHealthe Employer / GovernmentClinical TrialsRx Surveillance Research
Cloud Architecture
4© 2009 Cerner Corporation. All rights reserved. This document contains Cerner confidential and/or proprietary information which may not be reproduced or transmitted without the express written consent of Cerner.
Rx Surveillance, ResearchOur SaaS Platform Production Domains
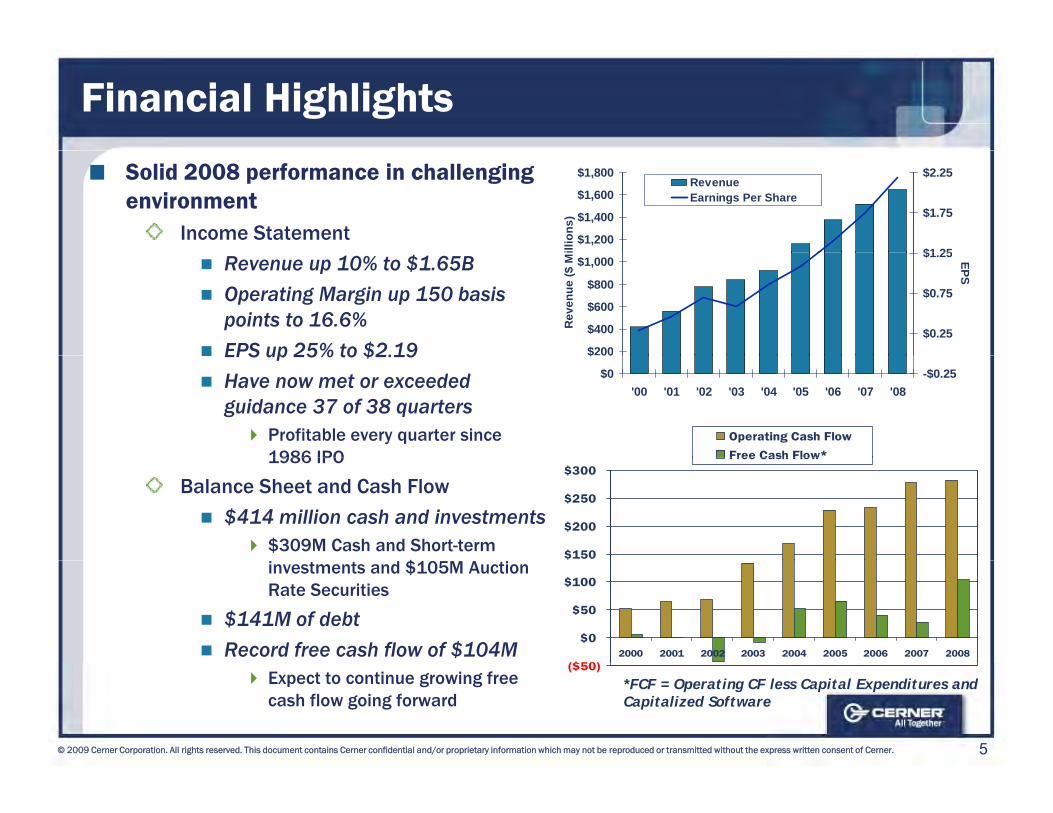
Financial Highlights
Solid 2008 performance in challenging environment
Income Statement $1,200
$1,400
$1,600
$1,800
illio
ns)
$1 25
$1.75
$2.25RevenueEarnings Per Share
Revenue up 10% to $1.65BOperating Margin up 150 basis points to 16.6%EPS up 25% to $2.19 $200
$400
$600
$800
$1,000
Rev
enue
($ M
$0.25
$0.75
$1.25 EPS
EPS up 25% to $2.19Have now met or exceeded guidance 37 of 38 quarters
Profitable every quarter since 1986 IPO
Operating Cash Flow
Free Cash Flow*
$0
$ 00
'00 '01 '02 '03 '04 '05 '06 '07 '08-$0.25
1986 IPO
Balance Sheet and Cash Flow
$414 million cash and investments$309M Cash and Short-term
$$150
$200
$250
$300Free Cash Flow
investments and $105M Auction Rate Securities
$141M of debtRecord free cash flow of $104M
($50)
$0
$50
$100
2000 2001 2002 2003 2004 2005 2006 2007 2008
5© 2009 Cerner Corporation. All rights reserved. This document contains Cerner confidential and/or proprietary information which may not be reproduced or transmitted without the express written consent of Cerner.
Expect to continue growing free cash flow going forward
($50)
*FCF = Operating CF less Capital Expenditures and Capitalized Software
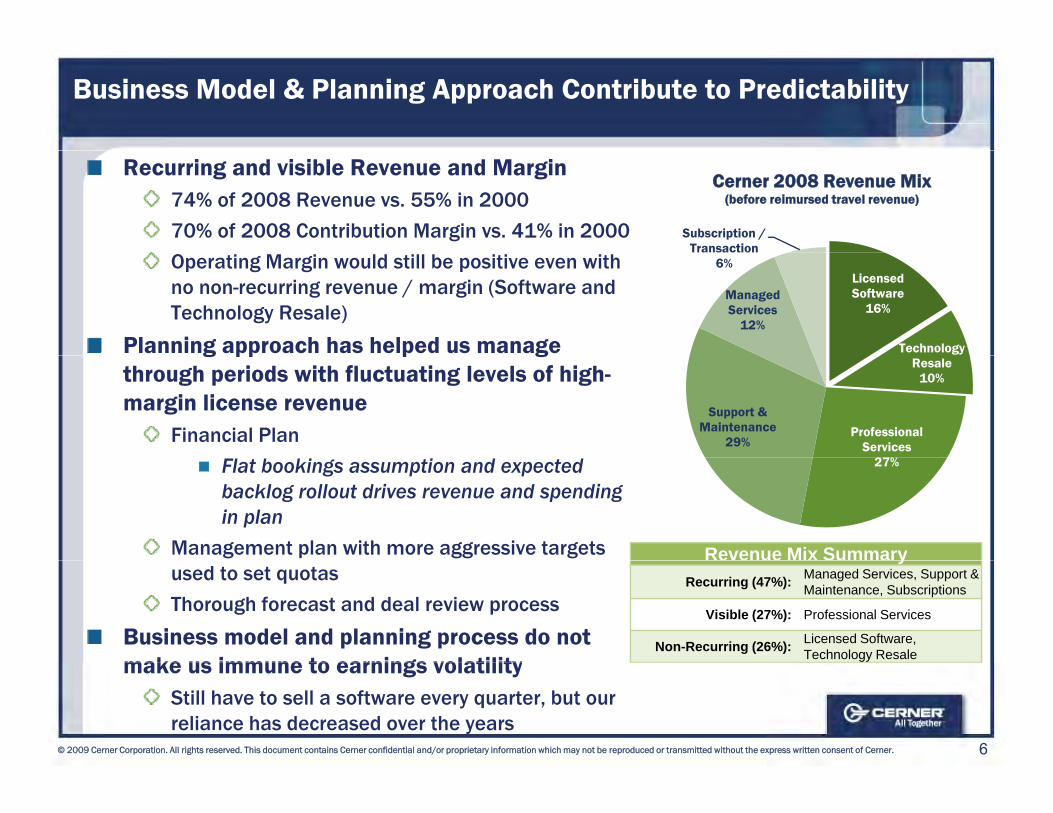
Business Model & Planning Approach Contribute to Predictability
Recurring and visible Revenue and Margin74% of 2008 Revenue vs. 55% in 2000
70% of 2008 Contribution Margin vs. 41% in 2000 Subscription / Transaction
Cerner 2008 Revenue Mix(before reimursed travel revenue)
Operating Margin would still be positive even with no non-recurring revenue / margin (Software and Technology Resale)
Planning approach has helped us manage
Licensed Software
16%
Technology
Managed Services
12%
6%
g pp p gthrough periods with fluctuating levels of high-margin license revenue
Financial Plan
Resale10%
Professional Services
27%
Support & Maintenance
29%
Flat bookings assumption and expected backlog rollout drives revenue and spending in plan
Management plan with more aggressive targets
27%
Revenue Mix Summaryused to set quotas
Thorough forecast and deal review process
Business model and planning process do not make us immune to earnings volatility
yRecurring (47%): Managed Services, Support &
Maintenance, Subscriptions
Visible (27%): Professional Services
Non-Recurring (26%): Licensed Software, Technology Resale
6© 2009 Cerner Corporation. All rights reserved. This document contains Cerner confidential and/or proprietary information which may not be reproduced or transmitted without the express written consent of Cerner.
make us immune to earnings volatilityStill have to sell a software every quarter, but our reliance has decreased over the years
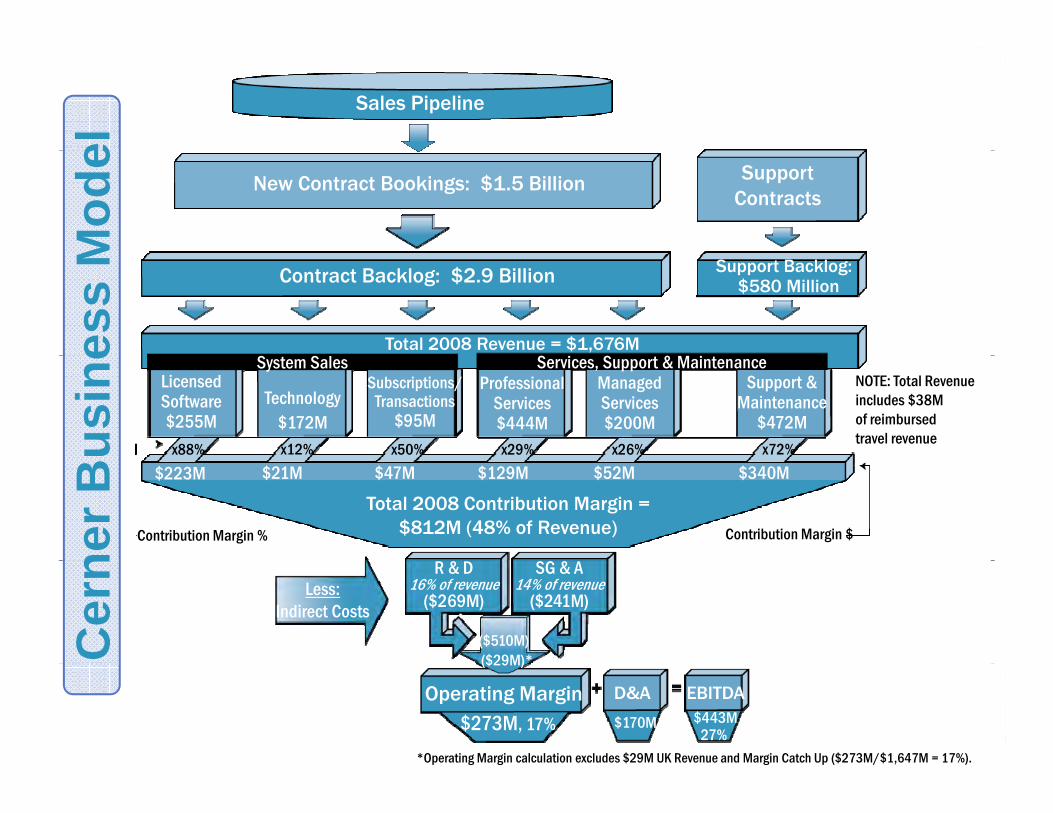
Sales Pipelineel
New Contract Bookings: $1.5 Billion SupportContracts
Mod
e
Contract Backlog: $2.9 Billion Support Backlog: $580 Million
Total 2008 Revenue = $1,676Mess
M
System Sales Services, Support & MaintenanceLicensedSoftware$255M
Subscriptions/Transactions
$95M
ProfessionalServices$444M
ManagedServices$200M
Support &Maintenance
$472Mx88% x12% x50% x29% x26% x72%
NOTE: Total Revenueincludes $38Mof reimbursedtravel revenue
Technology$172Mus
ine
Total 2008 Contribution Margin =$812M (48% of Revenue)Contribution Margin % Contribution Margin $
$223M $21M $47M $129M $52M $340M
ner B
Less:Indirect Costs
R & D16% of revenue
($269M)
SG & A14% of revenue
($241M)
($510M)($29M)*C
ern
7© 2009 Cerner Corporation. All rights reserved. This document contains Cerner confidential and/or proprietary information which may not be reproduced or transmitted without the express written consent of Cerner.
Operating Margin D&A EBITDA
$273M, 17% $170M $443M27%
*Operating Margin calculation excludes $29M UK Revenue and Margin Catch Up ($273M/$1,647M = 17%).
($29M)
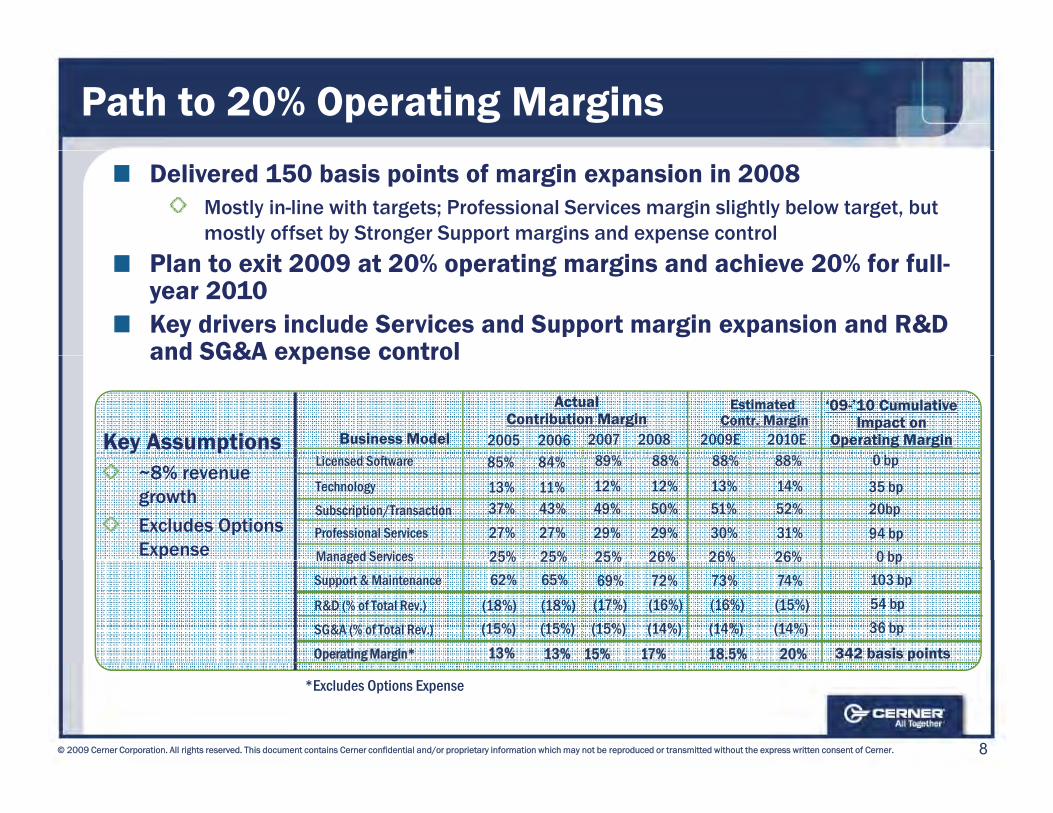
Path to 20% Operating Margins
Delivered 150 basis points of margin expansion in 2008Mostly in-line with targets; Professional Services margin slightly below target, but mostly offset by Stronger Support margins and expense control
Plan to exit 2009 at 20% operating margins and achieve 20% for full-year 2010Key drivers include Services and Support margin expansion and R&D and SG&A expense control
Key Assumptions
and SG&A expense control
Business Model
Actual Contribution Margin
Estimated Contr. Margin
‘09-’10 CumulativeImpact on
Operating Margin2005 200685% 84%
2007 2008 2009E 2010E89% 88% 88% 88%Li d S ft 0 bp
~8% revenue growth
Excludes Options Expense
85% 84%
37% 43%
89% 88% 88% 88%Licensed Software
Subscription/TransactionProfessional ServicesManaged Services
27% 27%25% 25%
49% 50% 51% 52%29% 29% 30% 31%25% 26% 26% 26%
13% 11% 12% 12% 13% 14%Technology
0 bp
35 bp20bp94 bp
0 bpManaged Services
Support & Maintenance
R&D (% of Total Rev.)
SG&A (% of Total Rev.)
25% 25%62% 65%
(18%) (18%)(15%) (15%)
25% 26% 26% 26%69% 72% 73% 74%
(17%) (16%) (16%) (15%)(15%) (14%) (14%) (14%)
0 bp103 bp54 bp36 bp
342 basis pointsOperating Margin* 13% 15% 17% 18.5% 20%13%
8© 2009 Cerner Corporation. All rights reserved. This document contains Cerner confidential and/or proprietary information which may not be reproduced or transmitted without the express written consent of Cerner.
*Excludes Options Expense
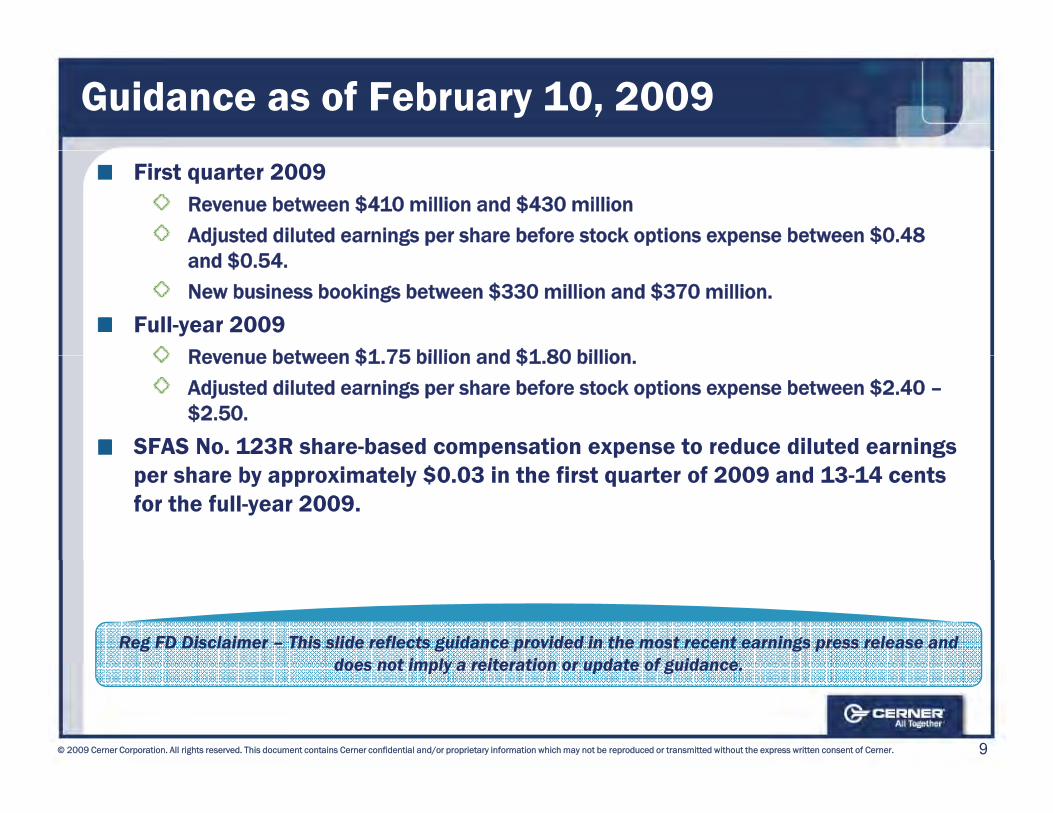
Guidance as of February 10, 2009
First quarter 2009Revenue between $410 million and $430 million
Adjusted diluted earnings per share before stock options expense between $0.48 $and $0.54.
New business bookings between $330 million and $370 million.
Full-year 2009Revenue between $1 75 billion and $1 80 billion Revenue between $1.75 billion and $1.80 billion.
Adjusted diluted earnings per share before stock options expense between $2.40 –$2.50.
SFAS No. 123R share-based compensation expense to reduce diluted earnings gper share by approximately $0.03 in the first quarter of 2009 and 13-14 cents for the full-year 2009.
Reg FD Disclaimer – This slide reflects guidance provided in the most recent earnings press release and does not imply a reiteration or update of guidance
9© 2009 Cerner Corporation. All rights reserved. This document contains Cerner confidential and/or proprietary information which may not be reproduced or transmitted without the express written consent of Cerner.
does not imply a reiteration or update of guidance.

Healthcare IT Marketplace
Mike ValentineExecutive Vice President &General Manager
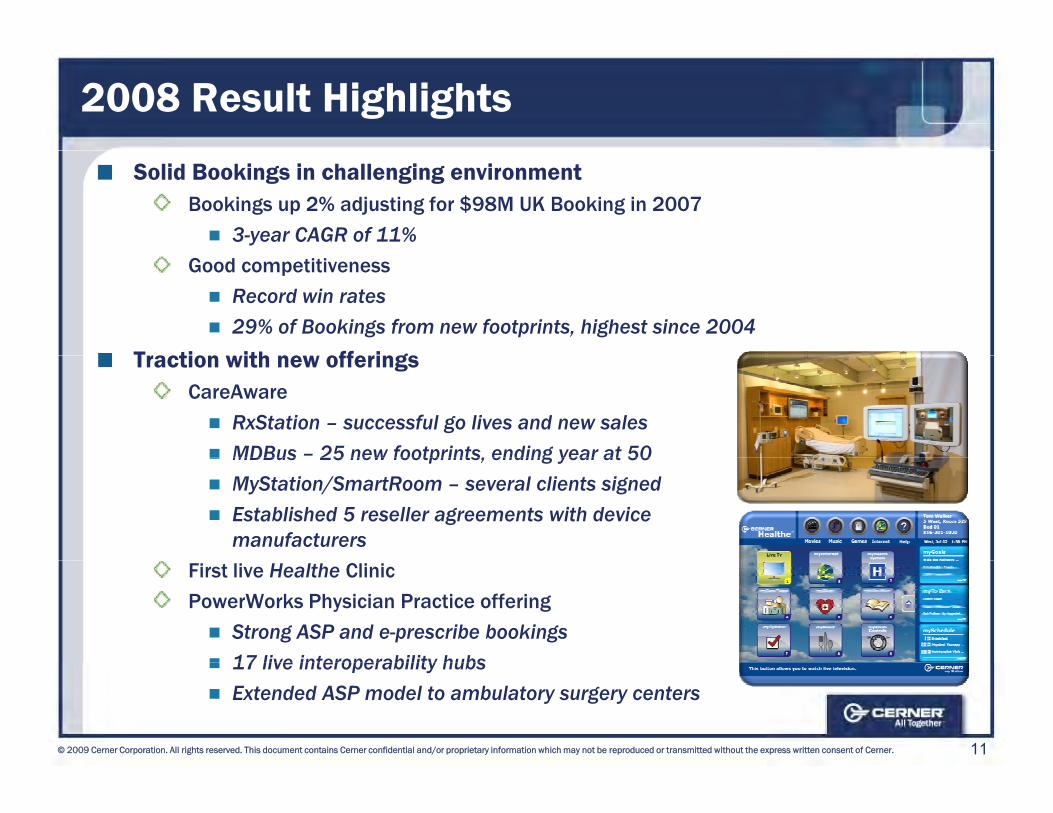
2008 Result Highlights
Solid Bookings in challenging environmentBookings up 2% adjusting for $98M UK Booking in 2007
3-year CAGR of 11%Good competitiveness
Record win rates29% of Bookings from new footprints, highest since 2004
Traction ith ne offeringsTraction with new offeringsCareAware
RxStation – successful go lives and new salesMDBus – 25 new footprints, ending year at 50MDBus 25 new footprints, ending year at 50MyStation/SmartRoom – several clients signedEstablished 5 reseller agreements with device manufacturers
First live Healthe Clinic
PowerWorks Physician Practice offering
Strong ASP and e-prescribe bookings17 live interoperability hubs
11© 2009 Cerner Corporation. All rights reserved. This document contains Cerner confidential and/or proprietary information which may not be reproduced or transmitted without the express written consent of Cerner.
17 live interoperability hubsExtended ASP model to ambulatory surgery centers
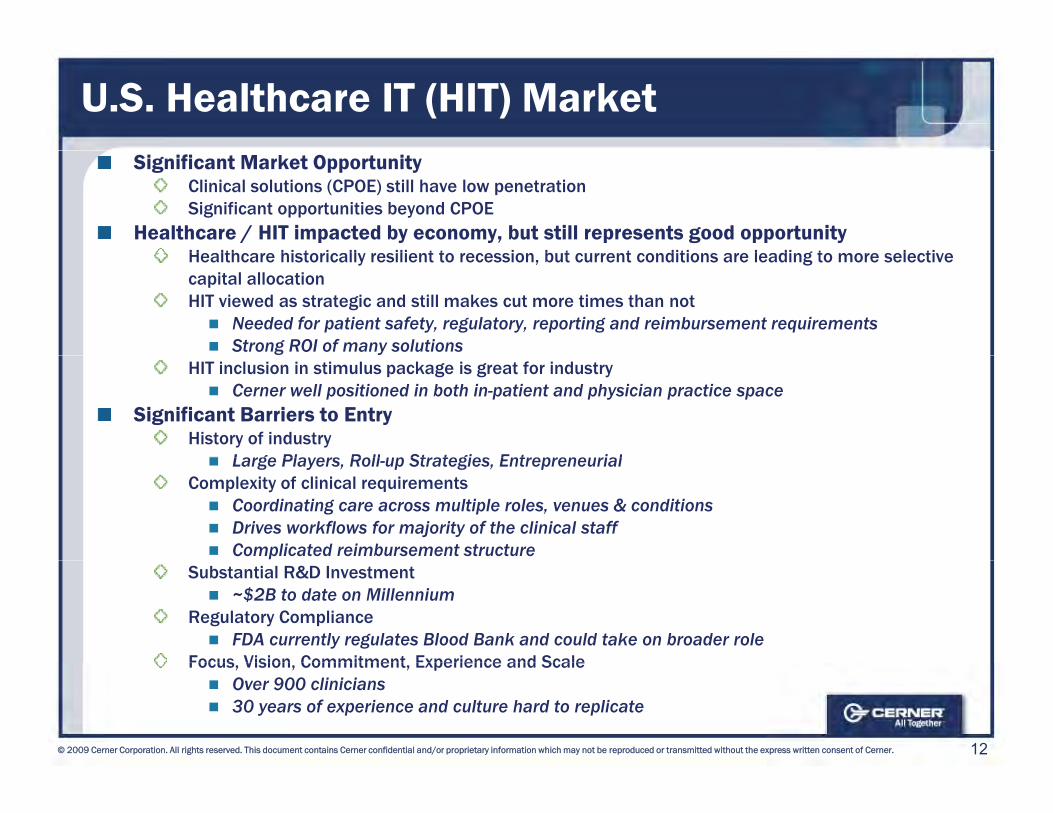
U.S. Healthcare IT (HIT) MarketSignificant Market Opportunity
Clinical solutions (CPOE) still have low penetrationSignificant opportunities beyond CPOE
Healthcare / HIT impacted by economy, but still represents good opportunityHealthcare historicall resilient to recession b t c rrent conditions are leading to more selecti e Healthcare historically resilient to recession, but current conditions are leading to more selective capital allocationHIT viewed as strategic and still makes cut more times than not
Needed for patient safety, regulatory, reporting and reimbursement requirementsStrong ROI of many solutions
HIT inclusion in stimulus package is great for industryCerner well positioned in both in-patient and physician practice space
Significant Barriers to EntryHistory of industry
Large Players Roll up Strategies EntrepreneurialLarge Players, Roll-up Strategies, EntrepreneurialComplexity of clinical requirements
Coordinating care across multiple roles, venues & conditionsDrives workflows for majority of the clinical staffComplicated reimbursement structure
Substantial R&D Investment~$2B to date on Millennium
Regulatory ComplianceFDA currently regulates Blood Bank and could take on broader role
Focus Vision Commitment Experience and Scale
12© 2009 Cerner Corporation. All rights reserved. This document contains Cerner confidential and/or proprietary information which may not be reproduced or transmitted without the express written consent of Cerner.
Focus, Vision, Commitment, Experience and ScaleOver 900 clinicians 30 years of experience and culture hard to replicate

Growth Opportunities
Playing OffenseSelling high ROI ‘whitespace’ solutions into installed baseReplace best-of-breed and unsuccessful suppliers
N M k t d S i
Whitespace & High ROIFocus Areas
AnesthesiologyClinical Process New Markets and Services
Physician Office, Retail PharmacyEmployer/Government
Personal Health Record
Clinical Process OptimizationCritical CareDevices, MDBus, Smart Room
Financial / Clinical HubsCondition ManagementBenefits / TPAFacilitated Network Model
Smart RoomEmergencyRevenue CycleSurgery
Facilitated Network ModelClinical TrialsRx Surveillance, ResearchCapture a larger portion of hospital IT spend with CernerWorks capabilities
Women’s Health
Application Management ServicesITWorks
Leveraging infrastructure to take on additional client IT workAccelerate white space, replace competitors
13© 2009 Cerner Corporation. All rights reserved. This document contains Cerner confidential and/or proprietary information which may not be reproduced or transmitted without the express written consent of Cerner.
Tightens alignment with key clients

Revenue Cycle MarketGeneral market observations
40% of healthcare organizations are planning to replace their legacy revenue cycle solutions, specifically the patient accounting application
Required to meet clinically-based pay-for-performance requirementsEmerging set of niche service suppliers and services based roll-upsO ffOutsourcing the business office
Most healthcare organizations are not staffed to manage the end-to-end processCommunity health systems are looking for cost containment; increased Community health systems are looking for cost containment; increased interest in hosted and service based models
Cerner’s opportunityRevenue cycle white space represents a $2B+ opportunityRevenue cycle white space represents a $2B opportunity50% of new business pipeline includes revenue cycle as a component70% of large installed clients have not licensed ProFit
14© 2009 Cerner Corporation. All rights reserved. This document contains Cerner confidential and/or proprietary information which may not be reproduced or transmitted without the express written consent of Cerner.
70% of large installed clients have not licensed ProFitClinical and financial integration opportunity
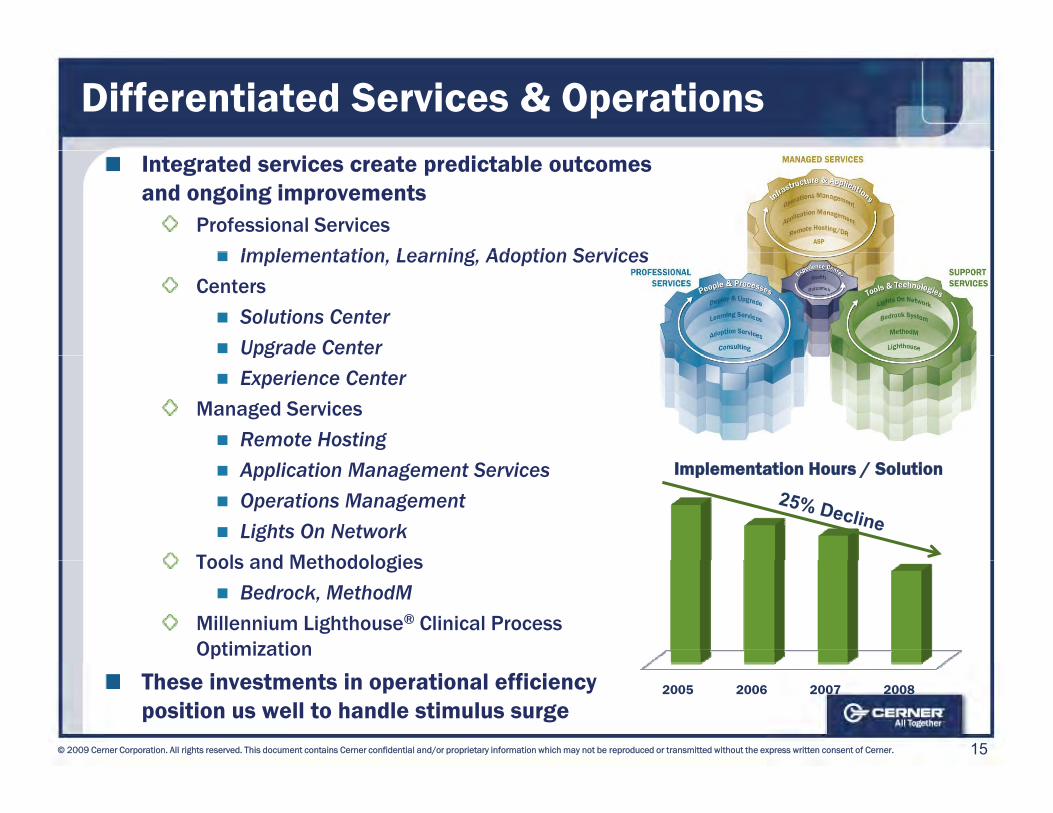
Differentiated Services & OperationsIntegrated services create predictable outcomes and ongoing improvements
Professional Services
Implementation Learning Adoption ServicesImplementation, Learning, Adoption ServicesCenters
Solutions CenterUpgrade CenterpgExperience Center
Managed Services
Remote HostingApplication Management ServicesOperations ManagementLights On Network
Tools and Methodologies
Implementation Hours / Solution
Tools and Methodologies
Bedrock, MethodMMillennium Lighthouse® Clinical Process Optimization
15© 2009 Cerner Corporation. All rights reserved. This document contains Cerner confidential and/or proprietary information which may not be reproduced or transmitted without the express written consent of Cerner.
These investments in operational efficiency position us well to handle stimulus surge
2005 2006 2007 2008
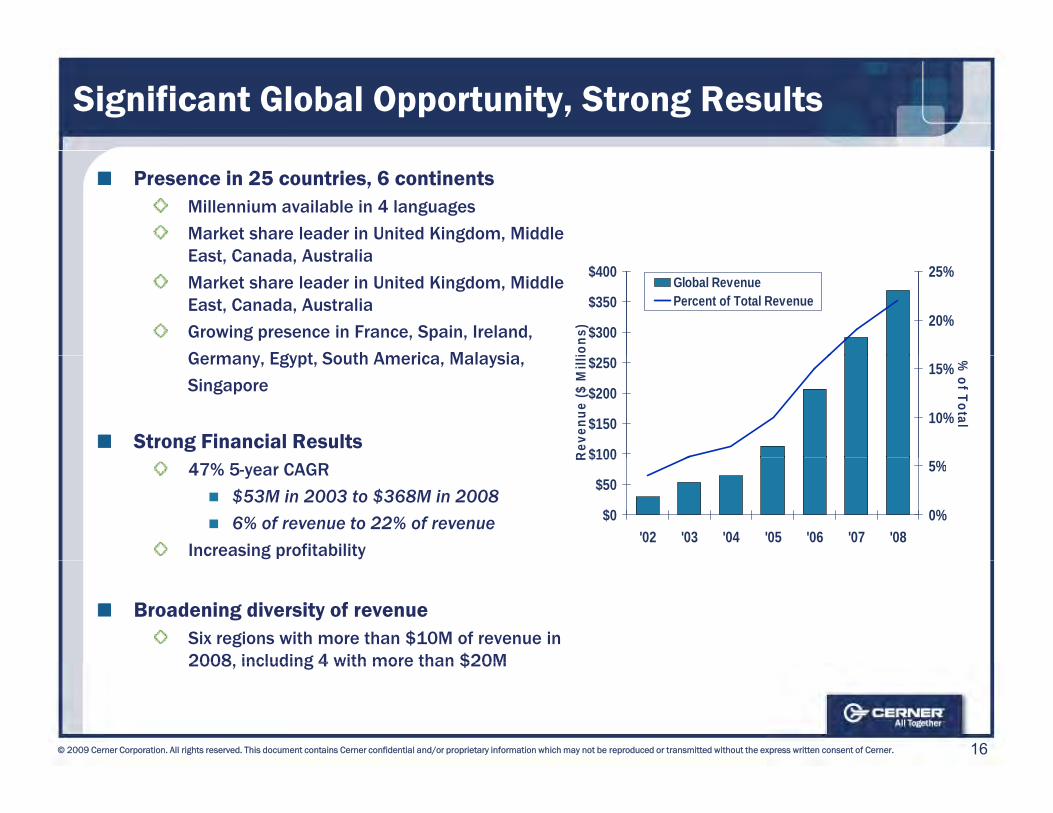
Significant Global Opportunity, Strong Results
Presence in 25 countries, 6 continentsMillennium available in 4 languages
Market share leader in United Kingdom, Middle East Canada Australia East, Canada, Australia
Market share leader in United Kingdom, Middle East, Canada, Australia
Growing presence in France, Spain, Ireland,
Germany Egypt South America Malaysia
$300
$350
$400
ions
) 20%
25%Global RevenuePercent of Total Revenue
Germany, Egypt, South America, Malaysia,
Singapore
Strong Financial Results$100
$150
$200
$250
Rev
enue
($ M
illi
10%
15%
% of Total
47% 5-year CAGR
$53M in 2003 to $368M in 20086% of revenue to 22% of revenue
Increasing profitability
$0
$50
$100
'02 '03 '04 '05 '06 '07 '08
R
0%
5%
Broadening diversity of revenueSix regions with more than $10M of revenue in 2008 including 4 with more than $20M
16© 2009 Cerner Corporation. All rights reserved. This document contains Cerner confidential and/or proprietary information which may not be reproduced or transmitted without the express written consent of Cerner.
2008, including 4 with more than $20M
Building and Running Millennium
Mike NillSenior Vice President, IP ,Development & CernerWorks
Cerner Millennium Release 2007.18
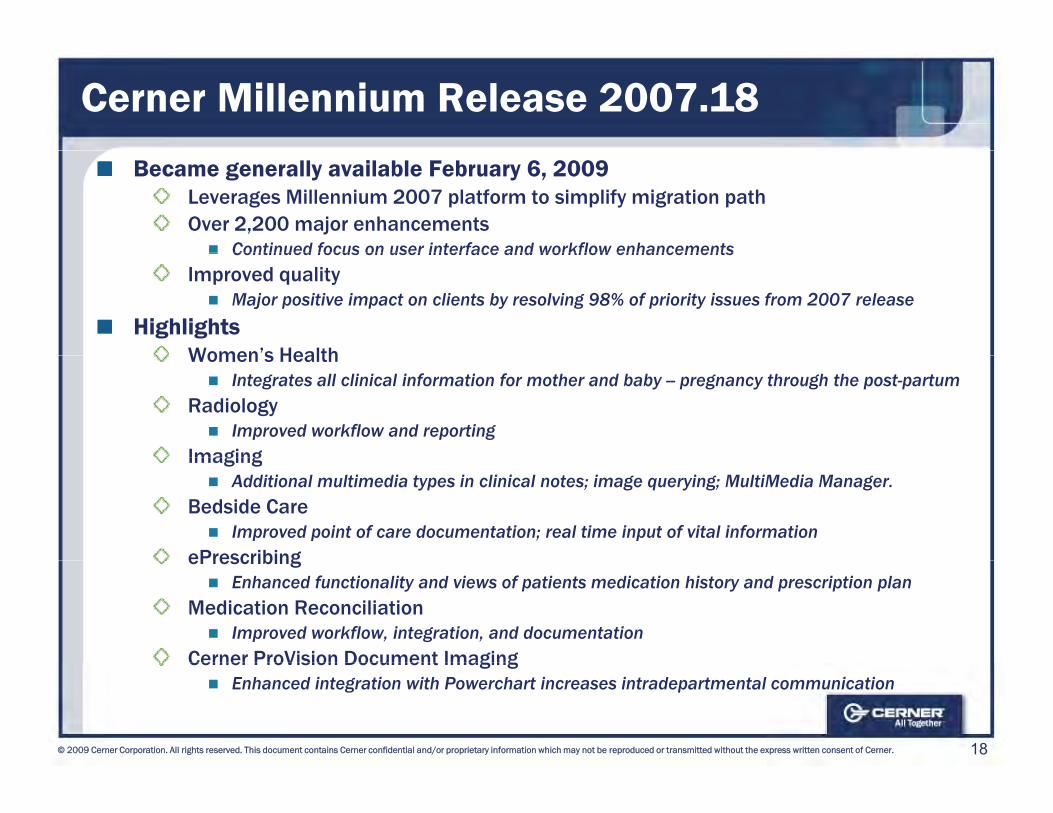
Became generally available February 6, 2009Leverages Millennium 2007 platform to simplify migration pathOver 2,200 major enhancements
Continued focus on user interface and workflow enhancementsContinued focus on user interface and workflow enhancementsImproved quality
Major positive impact on clients by resolving 98% of priority issues from 2007 releaseHighlights
Women’s HealthWomen s HealthIntegrates all clinical information for mother and baby -- pregnancy through the post-partum
RadiologyImproved workflow and reporting
ImagingImagingAdditional multimedia types in clinical notes; image querying; MultiMedia Manager.
Bedside CareImproved point of care documentation; real time input of vital information
ePrescribingePrescribingEnhanced functionality and views of patients medication history and prescription plan
Medication ReconciliationImproved workflow, integration, and documentation
Cerner ProVision Document Imaging
18© 2009 Cerner Corporation. All rights reserved. This document contains Cerner confidential and/or proprietary information which may not be reproduced or transmitted without the express written consent of Cerner.
Cerner ProVision Document ImagingEnhanced integration with Powerchart increases intradepartmental communication
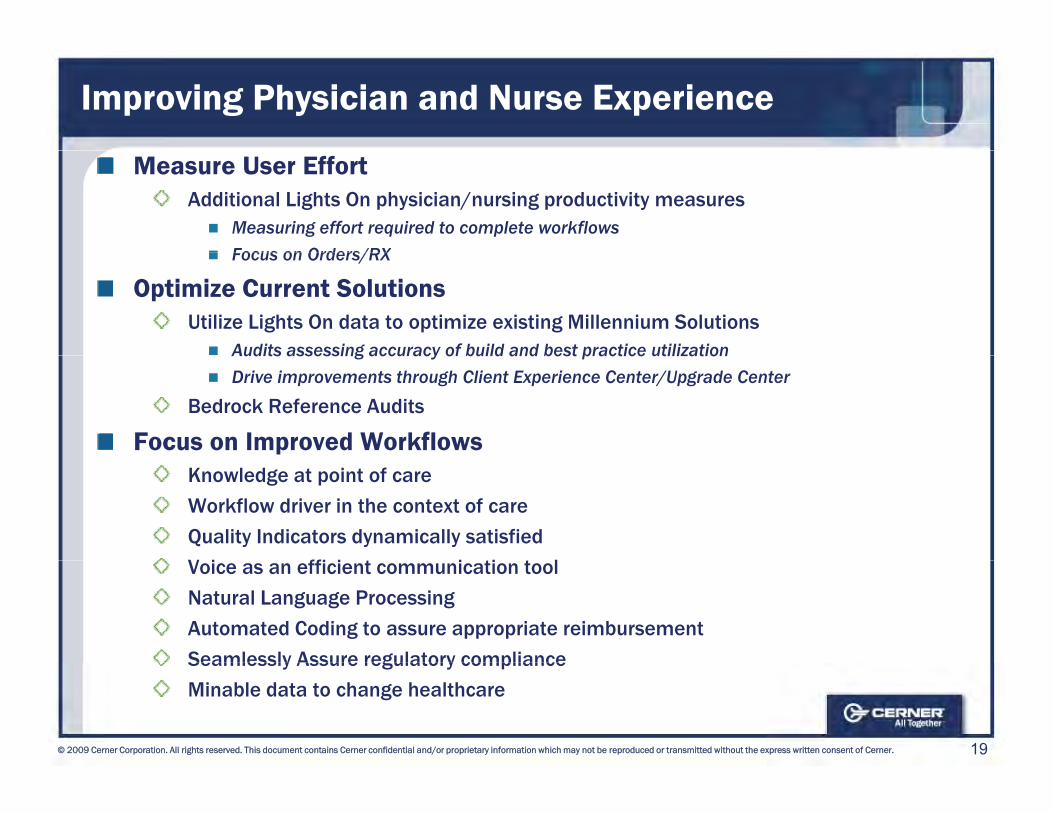
Improving Physician and Nurse Experience
Measure User EffortAdditional Lights On physician/nursing productivity measures
Measuring effort required to complete workflowsFocus on Orders/RXFocus on Orders/RX
Optimize Current SolutionsUtilize Lights On data to optimize existing Millennium Solutions
Audits assessing accuracy of build and best practice utilizationAudits assessing accuracy of build and best practice utilizationDrive improvements through Client Experience Center/Upgrade Center
Bedrock Reference Audits
Focus on Improved WorkflowsKnowledge at point of care
Workflow driver in the context of care
Quality Indicators dynamically satisfied
V i ffi i t i ti t lVoice as an efficient communication tool
Natural Language Processing
Automated Coding to assure appropriate reimbursement
Seamlessly Assure regulatory compliance
19© 2009 Cerner Corporation. All rights reserved. This document contains Cerner confidential and/or proprietary information which may not be reproduced or transmitted without the express written consent of Cerner.
Seamlessly Assure regulatory compliance
Minable data to change healthcare
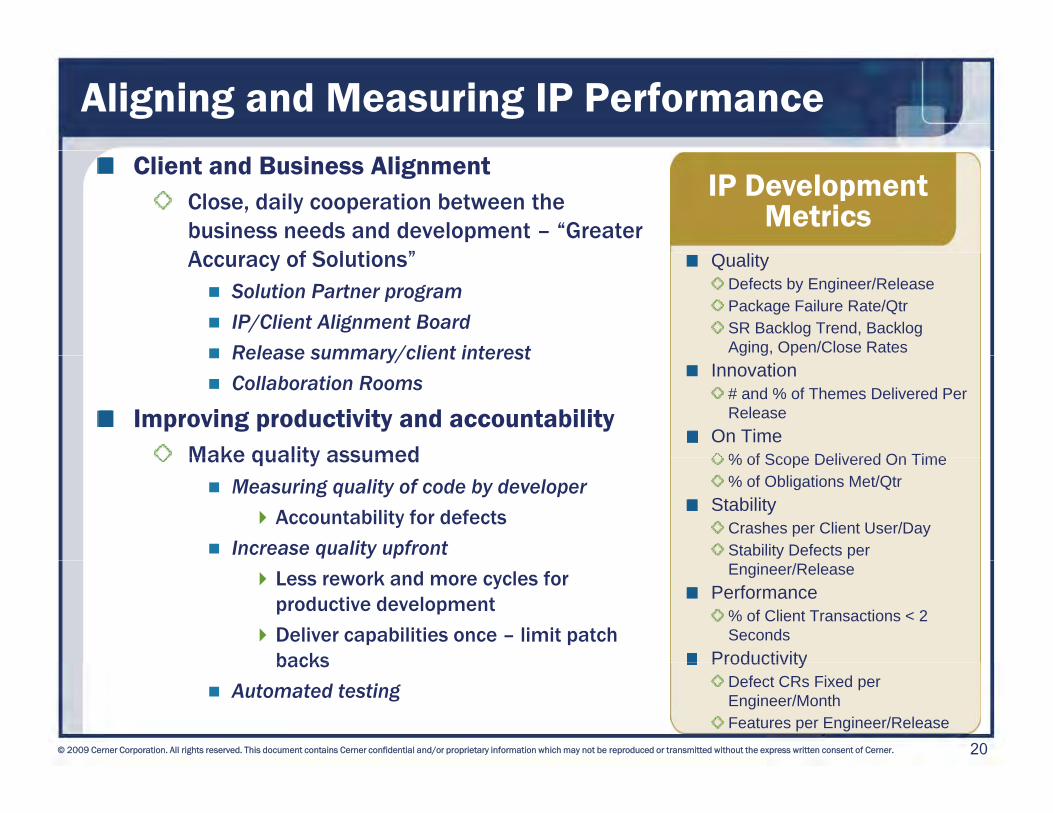
Aligning and Measuring IP PerformanceClient and Business Alignment
Close, daily cooperation between the business needs and development – “Greater A f S l ti ”
IP Development Metrics
Accuracy of Solutions”Solution Partner programIP/Client Alignment BoardRelease summary/client interest
QualityDefects by Engineer/ReleasePackage Failure Rate/QtrSR Backlog Trend, Backlog Aging, Open/Close RatesRelease summary/client interest
Collaboration Rooms
Improving productivity and accountabilityMake quality assumed
g g pInnovation
# and % of Themes Delivered Per Release
On Time% of Scope Delivered On TimeMake quality assumed
Measuring quality of code by developer Accountability for defects
Increase quality upfront
% of Scope Delivered On Time% of Obligations Met/Qtr
StabilityCrashes per Client User/DayStability Defects per
Less rework and more cycles for productive development
Deliver capabilities once – limit patch backs
Engineer/ReleasePerformance
% of Client Transactions < 2 Seconds
Productivity
20© 2009 Cerner Corporation. All rights reserved. This document contains Cerner confidential and/or proprietary information which may not be reproduced or transmitted without the express written consent of Cerner.
backs
Automated testingProductivity
Defect CRs Fixed per Engineer/MonthFeatures per Engineer/Release
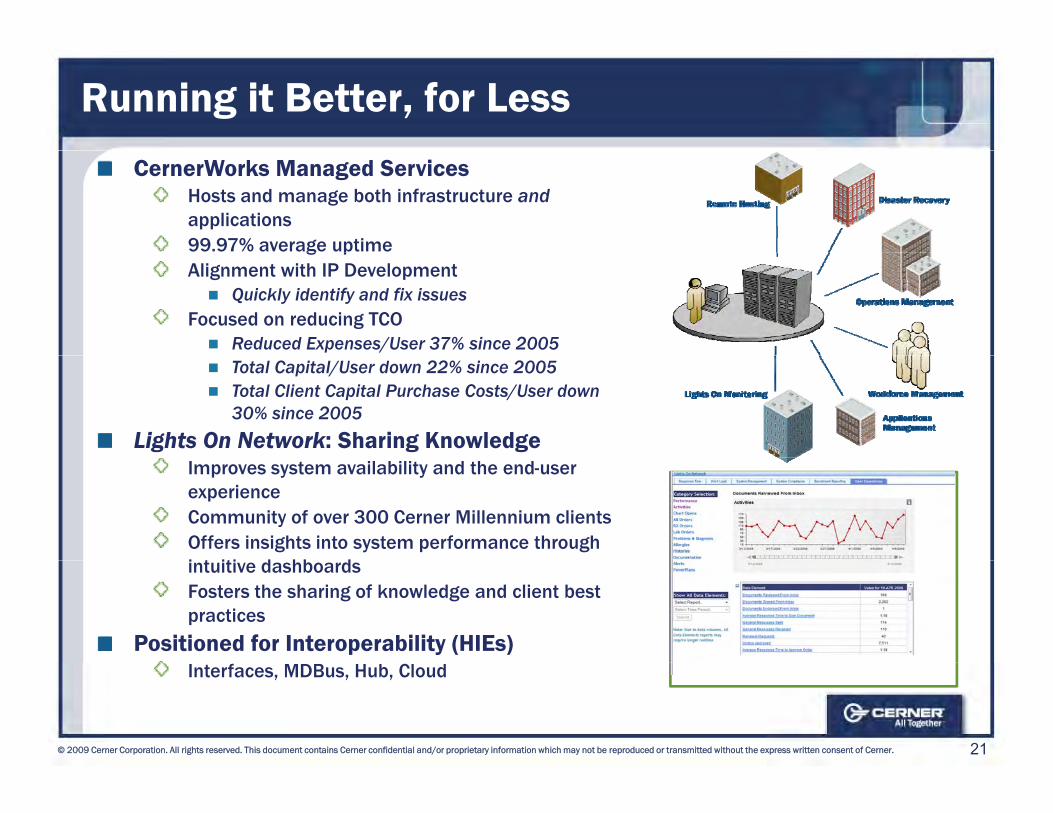
Running it Better, for Less
CernerWorks Managed ServicesHosts and manage both infrastructure andapplications99.97% average uptimeg pAlignment with IP Development
Quickly identify and fix issuesFocused on reducing TCO
Reduced Expenses/User 37% since 2005Total Capital/User down 22% since 2005 Total Client Capital Purchase Costs/User down 30% since 2005
Lights On Network: Sharing KnowledgeImproves system availability and the end-user experienceCommunity of over 300 Cerner Millennium clients Offers insights into system performance through i t iti d hb dintuitive dashboardsFosters the sharing of knowledge and client best practices
Positioned for Interoperability (HIEs)
21© 2009 Cerner Corporation. All rights reserved. This document contains Cerner confidential and/or proprietary information which may not be reproduced or transmitted without the express written consent of Cerner.
Interfaces, MDBus, Hub, Cloud

U.K. Update and Innovation
Jeff TownsendExecutive Vice President and Chief of Staff
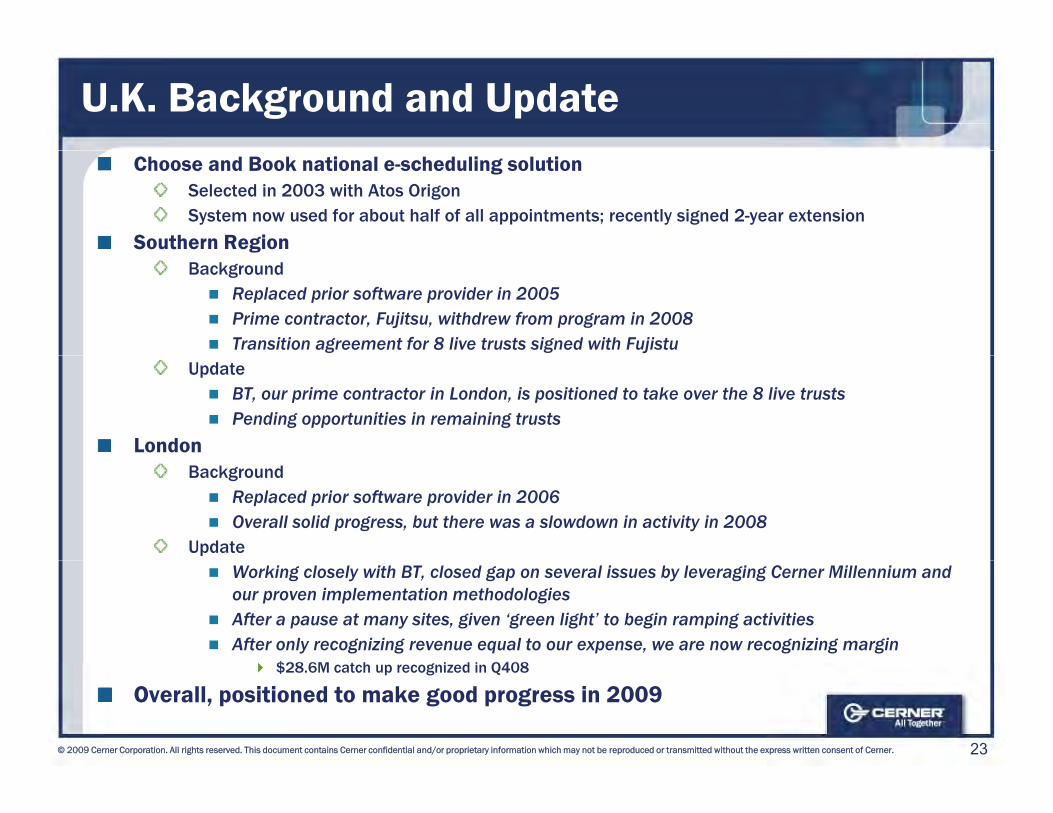
U.K. Background and UpdateChoose and Book national e-scheduling solution
Selected in 2003 with Atos OrigonSystem now used for about half of all appointments; recently signed 2-year extension
Southern RegionBackground
Replaced prior software provider in 2005Prime contractor, Fujitsu, withdrew from program in 2008Transition agreement for 8 live trusts signed with Fujistu
UpdateBT, our prime contractor in London, is positioned to take over the 8 live trustsPending opportunities in remaining trusts
LondonBackground
Replaced prior software provider in 2006Overall solid progress, but there was a slowdown in activity in 2008
UpdateWorking closely with BT, closed gap on several issues by leveraging Cerner Millennium and our proven implementation methodologiesAfter a pause at many sites, given ‘green light’ to begin ramping activitiesAfter only recognizing revenue equal to our expense, we are now recognizing margin
$28 6M t h i d i Q408
23© 2009 Cerner Corporation. All rights reserved. This document contains Cerner confidential and/or proprietary information which may not be reproduced or transmitted without the express written consent of Cerner.
$28.6M catch up recognized in Q408
Overall, positioned to make good progress in 2009

Innovation Campus - Collaboration Center
6 SuitesPhysical layout w/ help of Steelcase + Collaboration Design Rooms
Ph i iPhysicianConsumer (Home / Work /….)ICUWomen’s HealthImagingCareAware (Devices)In Process: Caregiver CenterStartup: Workforce & Enterprise Tracking
Focus is on Innovation & Real World design (“beyond the screen”)Other Collaboration Areas
Abilities Lab
HealthPresence (Cisco)
Collaboration Friday’s (Team Demonstrations)
24© 2009 Cerner Corporation. All rights reserved. This document contains Cerner confidential and/or proprietary information which may not be reproduced or transmitted without the express written consent of Cerner.
Demonstrations)
Café
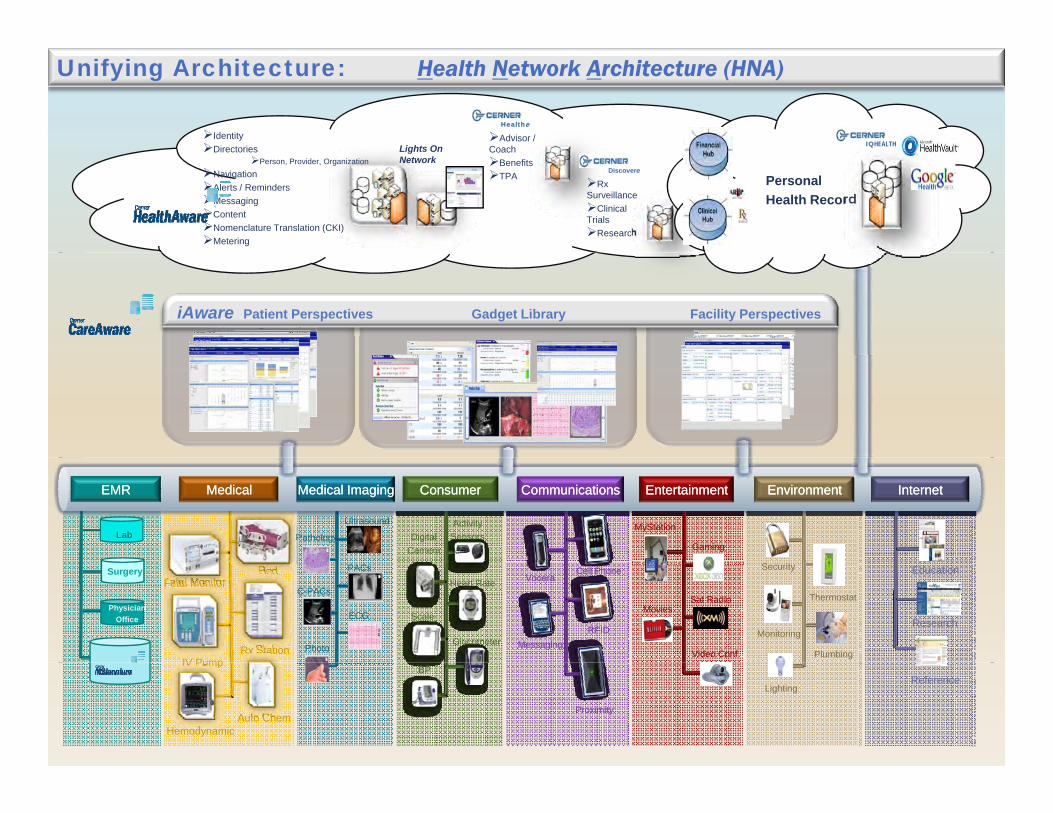
Unifying Architecture: Health Network Architecture (HNA)
IdentityDirectories Lights On
Advisor / Coach
Healthe
IQHEALTHDirectoriesPerson, Provider, Organization
NavigationAlerts / RemindersMessagingContentNomenclature Translation (CKI)Metering
Lights On Network
Rx Surveillance
Clinical Trials
Research
Discovere
CoachBenefitsTPA Personal
Health Record
iAware Patient Perspectives Gadget Library Facility Perspectives
PathologyLabActivitySensorsDigital
Camera Gaming
MyStation
EMREMR MedicalMedical Medical ImagingMedical Imaging ConsumerConsumer CommunicationsCommunications EntertainmentEntertainment EnvironmentEnvironment InternetInternet
Ultrasound
PACs
C-PACs
PhysicianOffice
Surgery Bed
Rx StationIV Pump
ECG
Photo
Vocera
Scale
Heart Rate
GlucometerRFID
Messaging
Cell Phone
Video Conf
Sat RadioMovies
Security
Thermostat
Monitoring
Plumbing
Education
Research
Fetal Monitor
25© 2009 Cerner Corporation. All rights reserved. This document contains Cerner confidential and/or proprietary information which may not be reproduced or transmitted without the express written consent of Cerner.
HemodynamicAuto Chem
IV PumpBP
Proximity
LightingReference
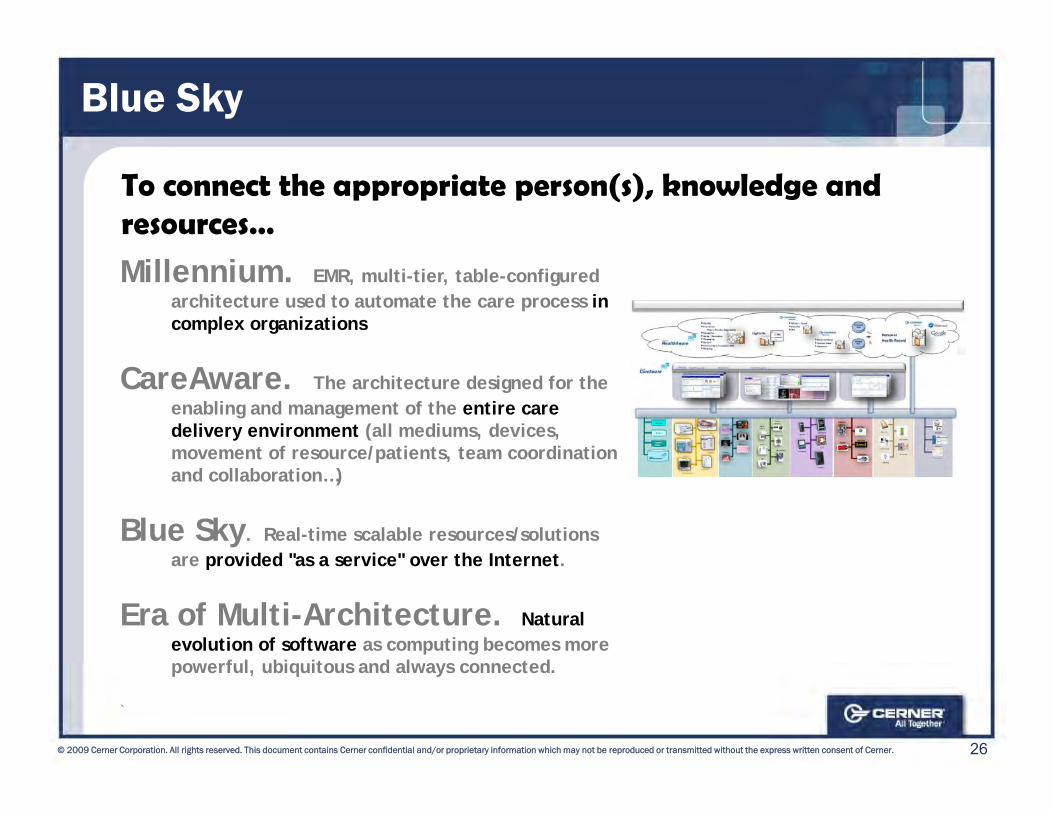
Blue Sky
To connect the appropriate person(s), knowledge and resources…
Millennium. EMR, multi-tier, table-configured architecture used to automate the care process in complex organizations
CareAware. The architecture designed for the enabling and management of the entire care delivery environment (all mediums, devices, movement of resource/patients, team coordination movement of resource/patients, team coordination and collaboration…)
Blue Sky. Real-time scalable resources/solutions are provided "as a service" over the Internetare provided as a service over the Internet.
Era of Multi-Architecture. Natural evolution of software as computing becomes more po erf l biq ito s and al a s connected
26© 2009 Cerner Corporation. All rights reserved. This document contains Cerner confidential and/or proprietary information which may not be reproduced or transmitted without the express written consent of Cerner.
powerful, ubiquitous and always connected.
`
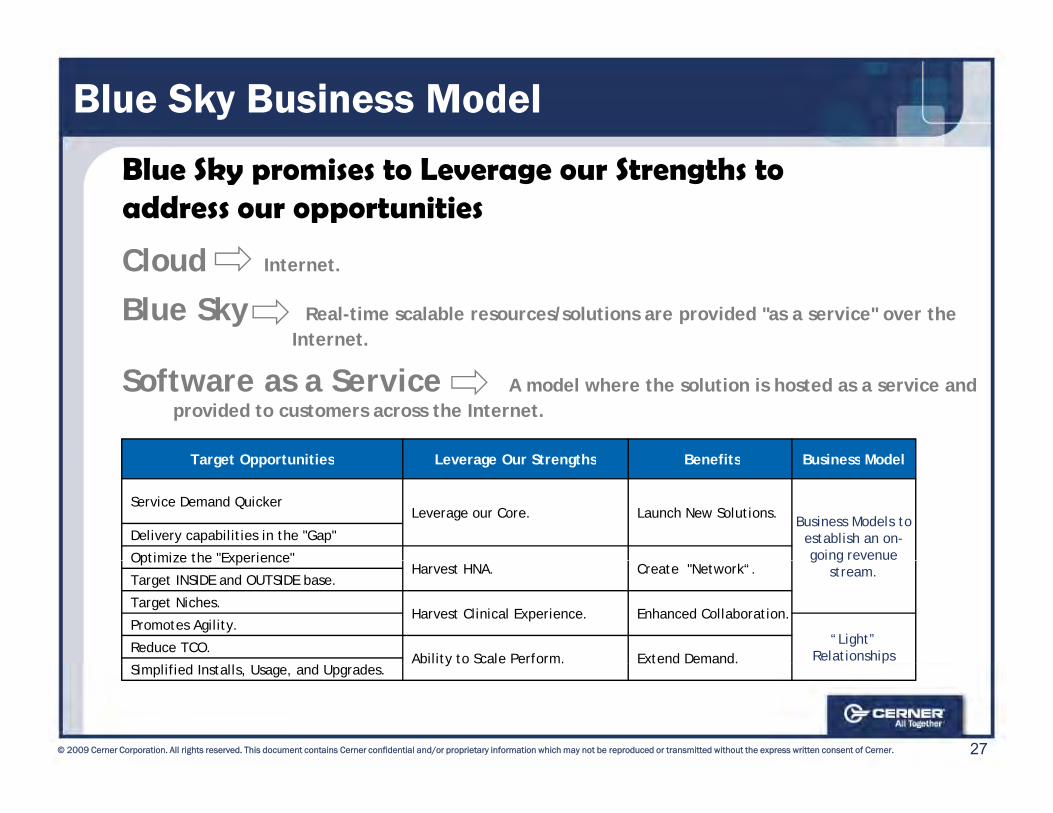
Blue Sky Business Model
Blue Sky promises to Leverage our Strengths to address our opportunities
Cl d Cloud Internet.
Blue Sky Real-time scalable resources/solutions are provided "as a service" over the Internet.
Target Opportunities Leverage Our Strengths Benefits Business Model
Software as a Service A model where the solution is hosted as a service and provided to customers across the Internet.
Target Opportunities Leverage Our Strengths Benefits Business Model
Service Demand Quicker Leverage our Core. Launch New Solutions.
Business Models to establish an on-going revenue
Delivery capabilities in the "Gap"
Optimize the "Experience" g gstream.
Optimize the ExperienceHarvest HNA. Create "Network“.
Target INSIDE and OUTSIDE base.
Target Niches.Harvest Clinical Experience. Enhanced Collaboration.
Promotes Agility.“Light”
RelationshipsReduce TCO.Ability to Scale Perform. Extend Demand.
27© 2009 Cerner Corporation. All rights reserved. This document contains Cerner confidential and/or proprietary information which may not be reproduced or transmitted without the express written consent of Cerner.
pAbility to Scale Perform. Extend Demand.Simplified Installs, Usage, and Upgrades.
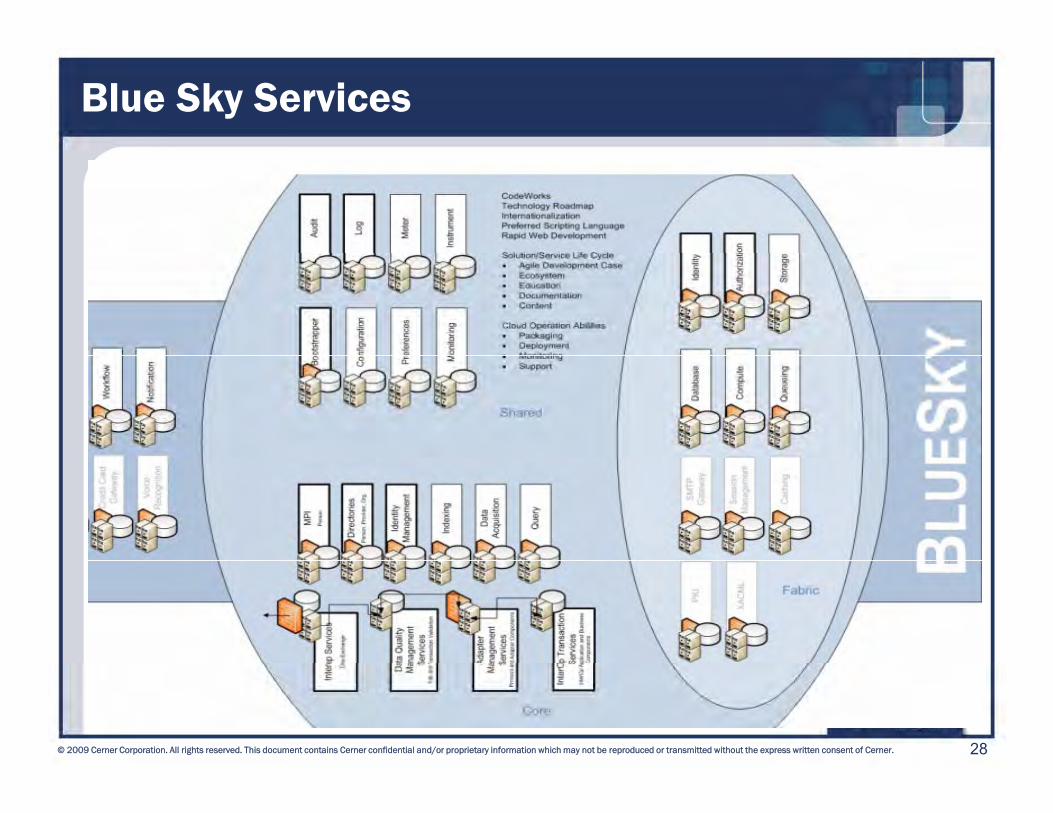
Blue Sky Services
28© 2009 Cerner Corporation. All rights reserved. This document contains Cerner confidential and/or proprietary information which may not be reproduced or transmitted without the express written consent of Cerner.
A Network of Millenniums: Document Find
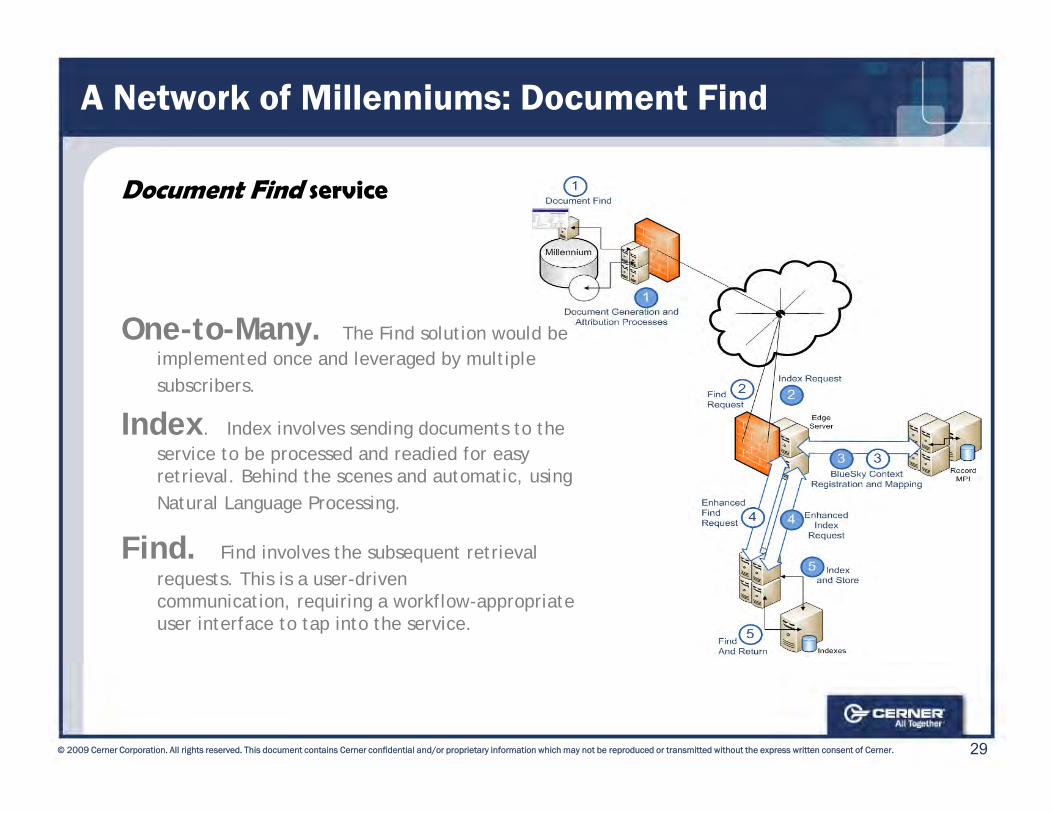
Document Find service
One-to-Many. The Find solution would be implemented once and leveraged by multipleimplemented once and leveraged by multiplesubscribers.
Index. Index involves sending documents to the service to be processed and readied for easy service to be processed and readied for easy retrieval. Behind the scenes and automatic, usingNatural Language Processing.
Find. Find involves the subsequent retrieval qrequests. This is a user-driven communication, requiring a workflow-appropriate user interface to tap into the service.
29© 2009 Cerner Corporation. All rights reserved. This document contains Cerner confidential and/or proprietary information which may not be reproduced or transmitted without the express written consent of Cerner.
A Network of Millenniums: Health Record
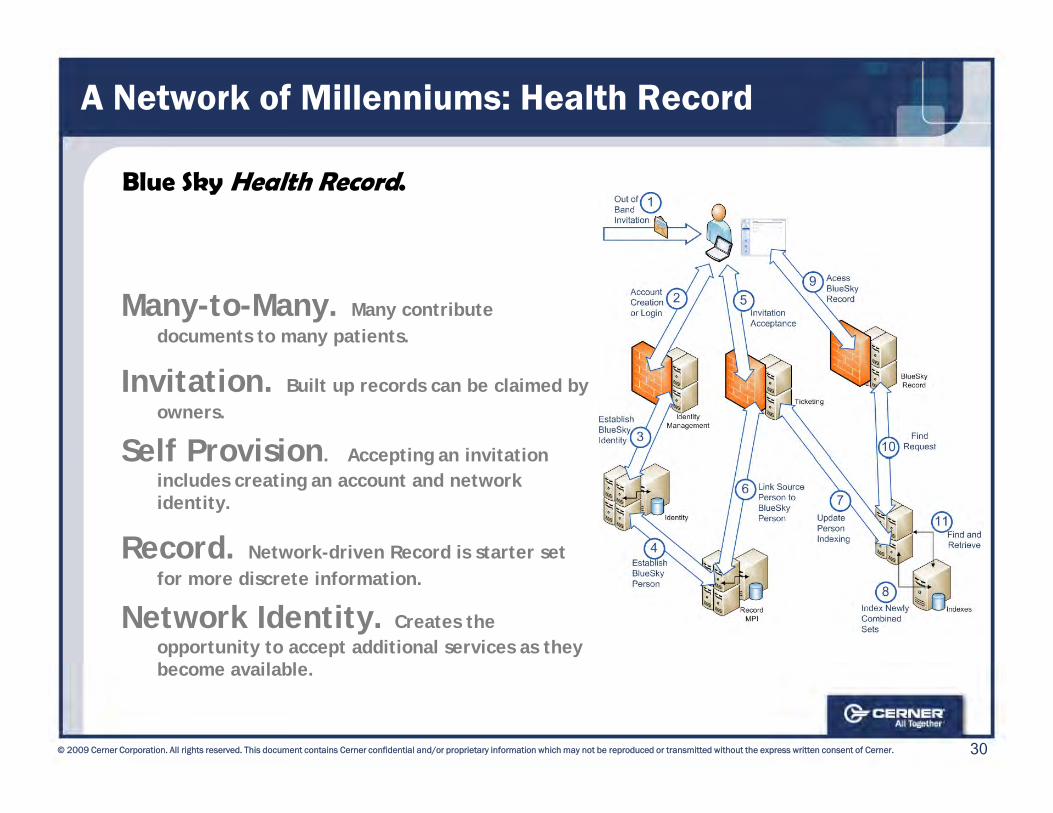
Blue Sky Health Record.
Many-to-Many. Many contribute documents to many patients.
Invitation. Built up records can be claimed by owners.
Self Provision Accepting an invitation Self Provision. Accepting an invitation includes creating an account and network identity.
Record. Network-driven Record is starter set for more discrete information.
Network Identity. Creates the opportunity to accept additional services as they b il bl
30© 2009 Cerner Corporation. All rights reserved. This document contains Cerner confidential and/or proprietary information which may not be reproduced or transmitted without the express written consent of Cerner.
become available.
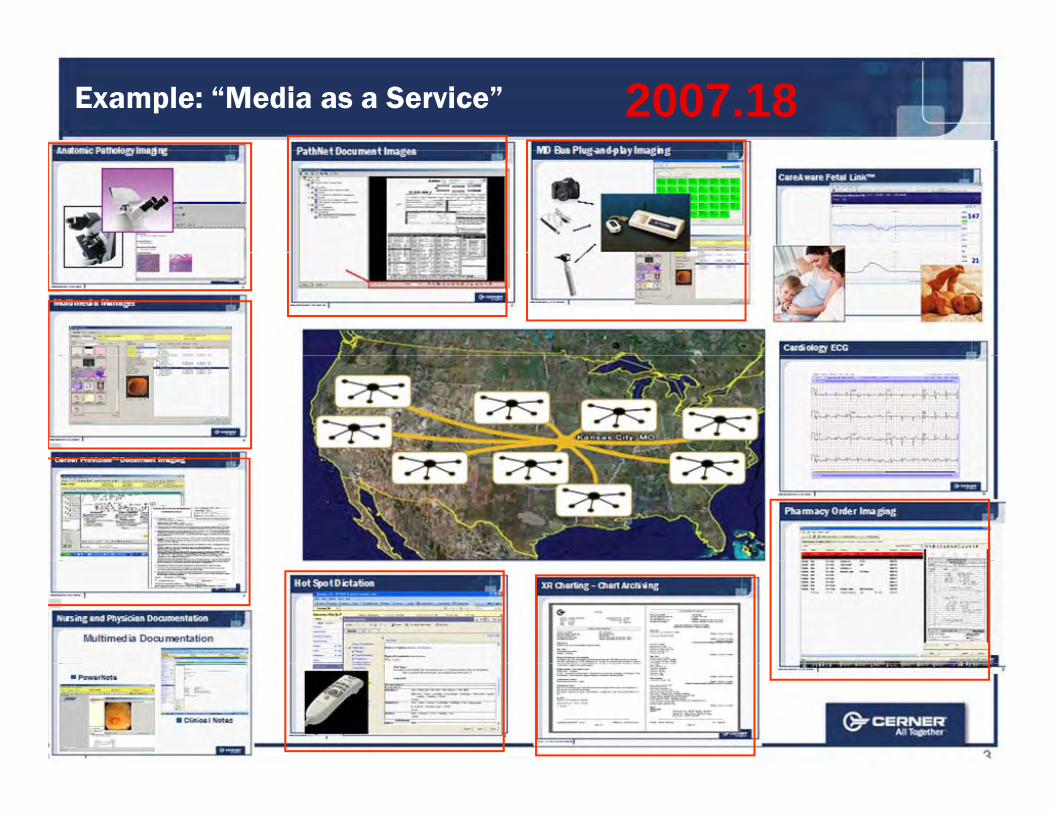
Example: “Media as a Service” 2007.18
31© 2009 Cerner Corporation. All rights reserved. This document contains Cerner confidential and/or proprietary information which may not be reproduced or transmitted without the express written consent of Cerner.

Healthcare Policy and Healthe Government
Amanda AdkinsDirector, Healthe Government,
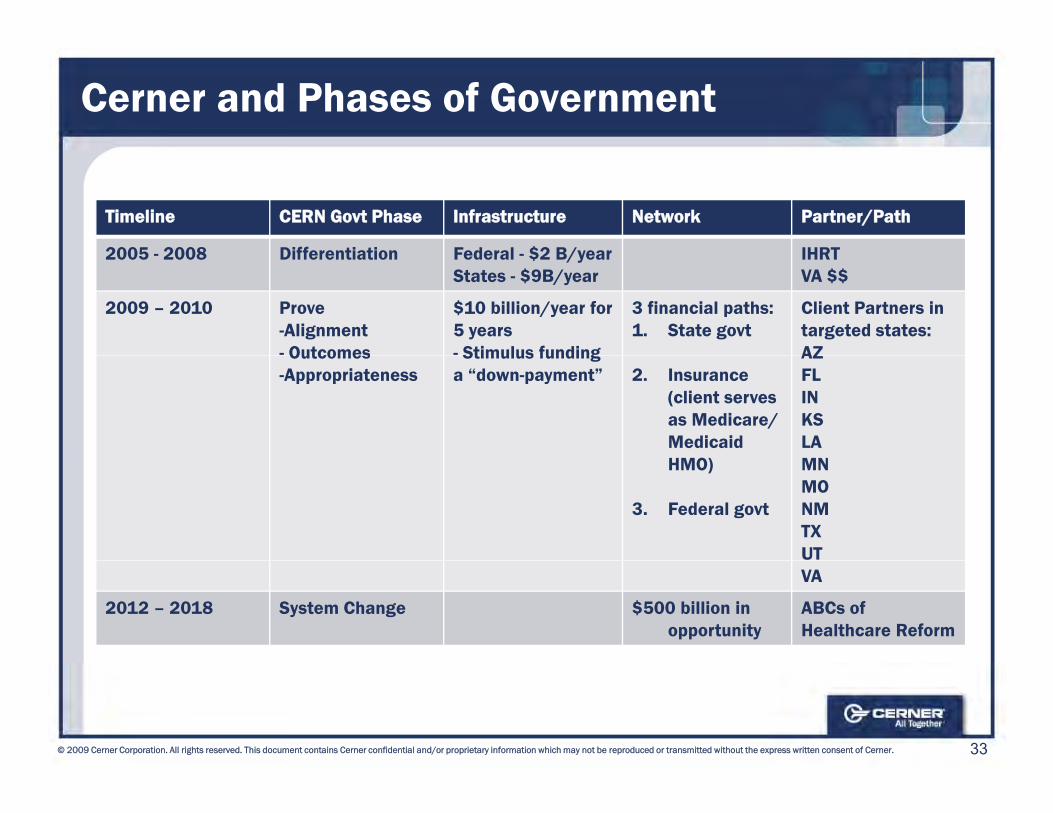
Cerner and Phases of Government
Timeline CERN Govt Phase Infrastructure Network Partner/Path
2005 2008 Differentiation Federal $2 B/year IHRT 2005 - 2008 Differentiation Federal - $2 B/yearStates - $9B/year
IHRT VA $$
2009 – 2010 Prove-Alignment- Outcomes
$10 billion/year for 5 years- Stimulus funding
3 financial paths:1. State govt
Client Partners in targeted states:AZOutcomes
-AppropriatenessStimulus funding
a “down-payment” 2. Insurance (client serves as Medicare/ Medicaid HMO)
AZFLINKSLAMNHMO)
3. Federal govt
MNMONMTXUTVA
2012 – 2018 System Change $500 billion in opportunity
ABCs of Healthcare Reform
33© 2009 Cerner Corporation. All rights reserved. This document contains Cerner confidential and/or proprietary information which may not be reproduced or transmitted without the express written consent of Cerner.
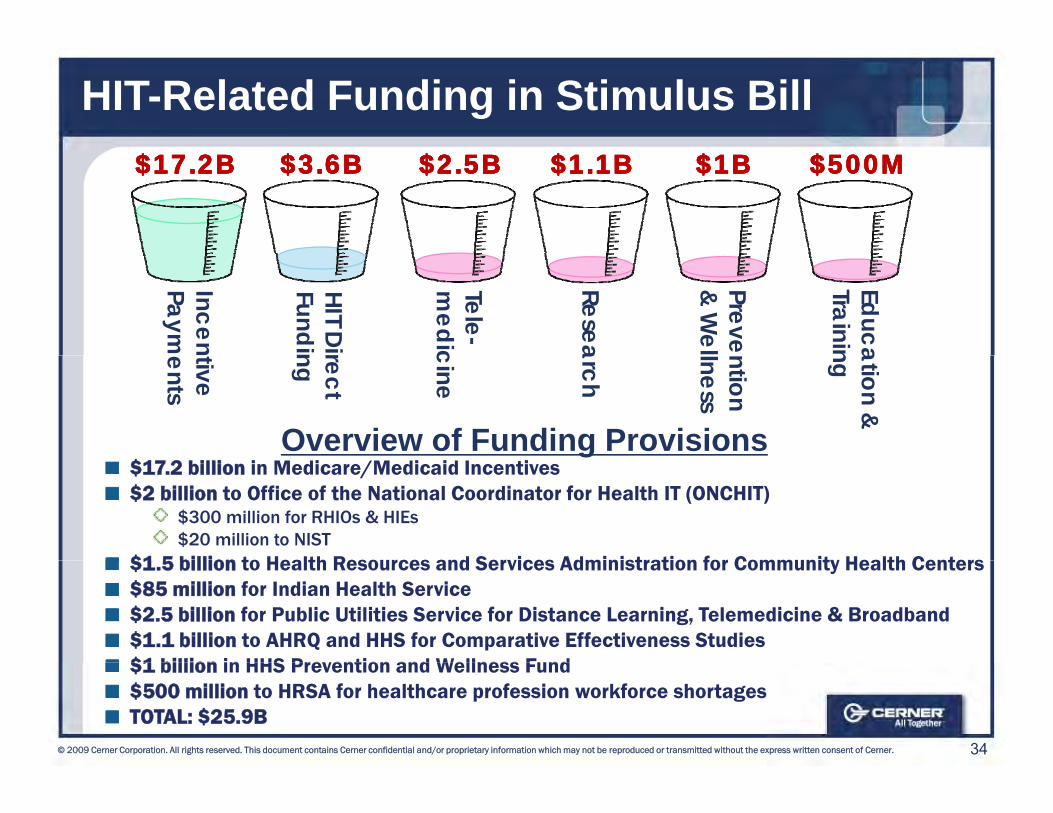
HIT-Related Funding in Stimulus Bill$17.2B$17.2B $3.6B$3.6B $2.5B$2.5B $1.1B$1.1B $500M$500M$1B$1B
IncenPaym
HIT DirFundin
Tele-m
edic
Resea
EducaTrainin
Preve& W
eltive ents
rect ng
cine
arch
ation & ngntion lness
Overview of Funding Provisions$17.2 billion in Medicare/Medicaid Incentives$2 billion to Office of the National Coordinator for Health IT (ONCHIT)
$300 million for RHIOs & HIEs$20 million to NIST
$1 5 billion to Health Resources and Services Administration for Community Health Centers$1.5 billion to Health Resources and Services Administration for Community Health Centers$85 million for Indian Health Service$2.5 billion for Public Utilities Service for Distance Learning, Telemedicine & Broadband$1.1 billion to AHRQ and HHS for Comparative Effectiveness Studies$1 billion in HHS Prevention and Wellness Fund
34© 2009 Cerner Corporation. All rights reserved. This document contains Cerner confidential and/or proprietary information which may not be reproduced or transmitted without the express written consent of Cerner.
$1 billion in HHS Prevention and Wellness Fund$500 million to HRSA for healthcare profession workforce shortagesTOTAL: $25.9B
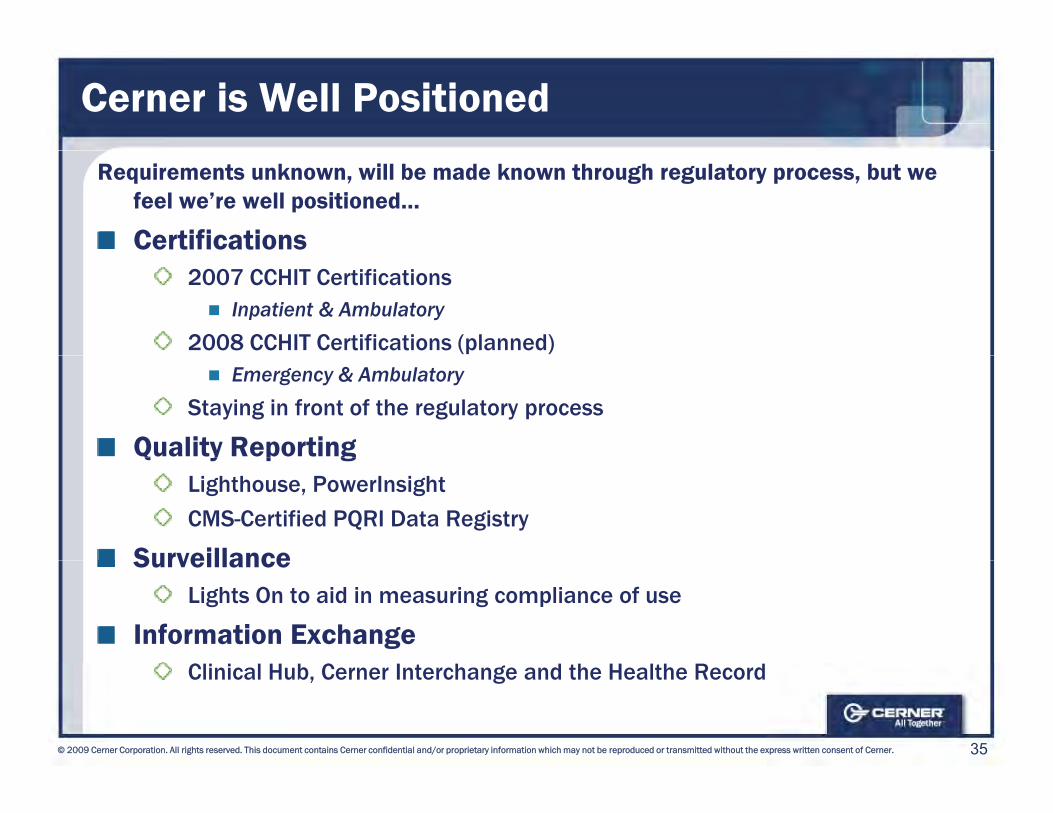
Cerner is Well Positioned
Requirements unknown, will be made known through regulatory process, but we feel we’re well positioned…
Certifications2007 CCHIT Certifications
Inpatient & Ambulatory
2008 CCHIT Certifications (planned)Emergency & Ambulatory
Staying in front of the regulatory process
Quality ReportingQ y p gLighthouse, PowerInsight
CMS-Certified PQRI Data Registry
SurveillanceSurveillanceLights On to aid in measuring compliance of use
Information Exchange
35© 2009 Cerner Corporation. All rights reserved. This document contains Cerner confidential and/or proprietary information which may not be reproduced or transmitted without the express written consent of Cerner.
Clinical Hub, Cerner Interchange and the Healthe Record
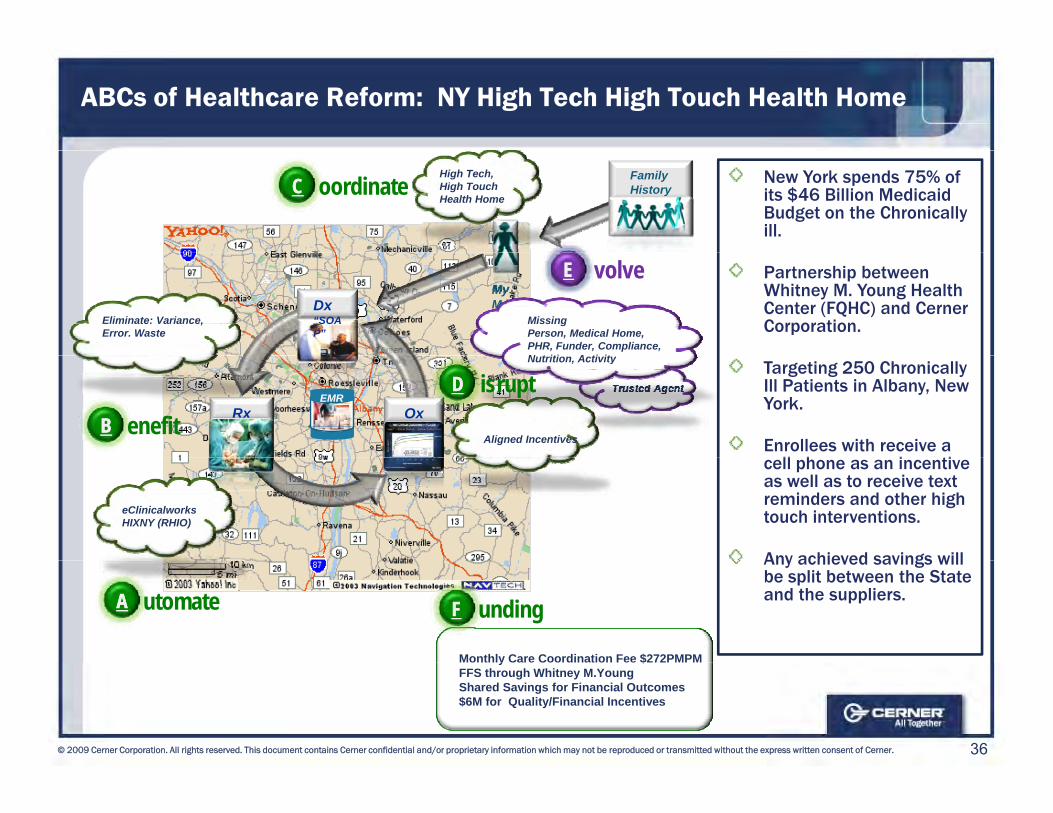
ABCs of Healthcare Reform: NY High Tech High Touch Health Home
Family History
High Tech, High TouchHealth Home
CC oordinate New York spends 75% of its $46 Billion Medicaid Budget on the Chronically ill.
Dx“SOAP”
My MedicalHistory
Eliminate: Variance,Error. Waste
MissingPerson, Medical Home,PHR, Funder, Compliance,N t iti A ti it
EE volve Partnership between Whitney M. Young Health Center (FQHC) and Cerner Corporation.
Rx OxEMR
Aligned Incentives
Trusted Agent
BB enefit
DDNutrition, Activity
Targeting 250 Chronically Ill Patients in Albany, New York.
Enrollees with receive a ll h i ti
isrupt
eClinicalworksHIXNY (RHIO)
cell phone as an incentive as well as to receive text reminders and other high touch interventions.
Any achieved savings will
Monthly Care Coordination Fee $272PMPM
AA utomate FF unding
Any achieved savings will be split between the State and the suppliers.
36© 2009 Cerner Corporation. All rights reserved. This document contains Cerner confidential and/or proprietary information which may not be reproduced or transmitted without the express written consent of Cerner.
y $FFS through Whitney M.YoungShared Savings for Financial Outcomes$6M for Quality/Financial Incentives
CIO Panel
Catherine Claiter
Bill Spooner

Chairman’s Comments
Neal PattersonChairman, Chief Executive Officer ,and Co-Founder
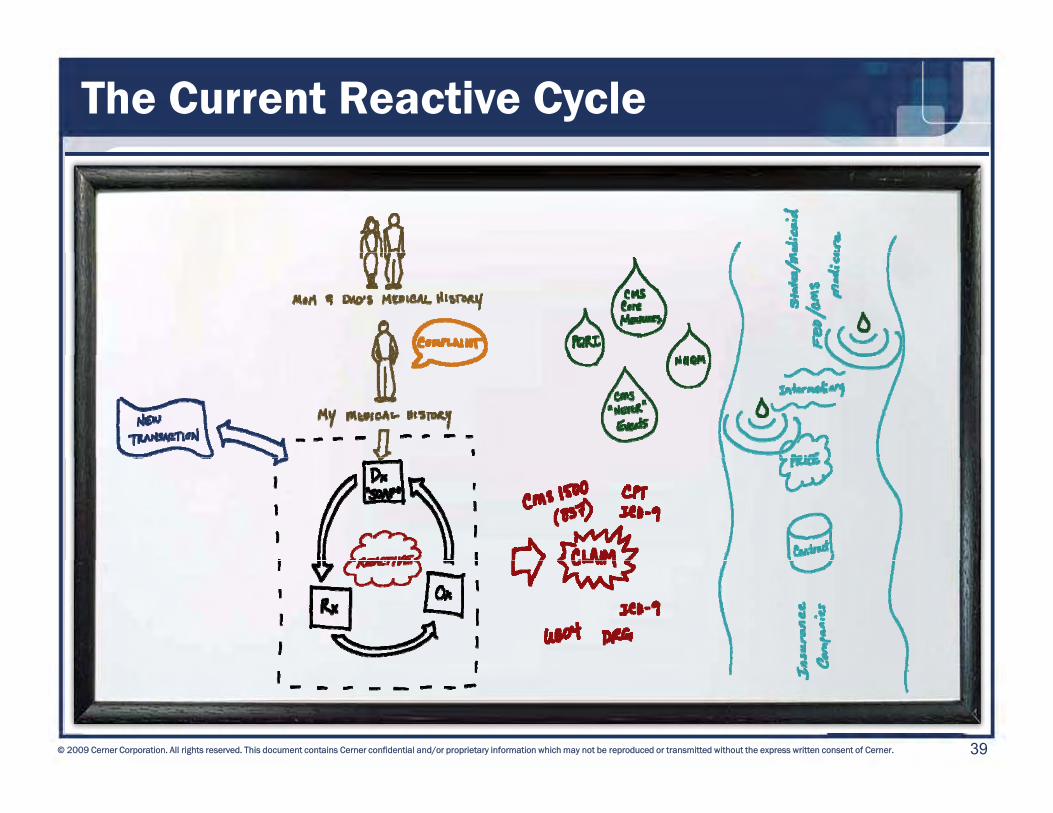
The Current Reactive Cycle
39© 2009 Cerner Corporation. All rights reserved. This document contains Cerner confidential and/or proprietary information which may not be reproduced or transmitted without the express written consent of Cerner.
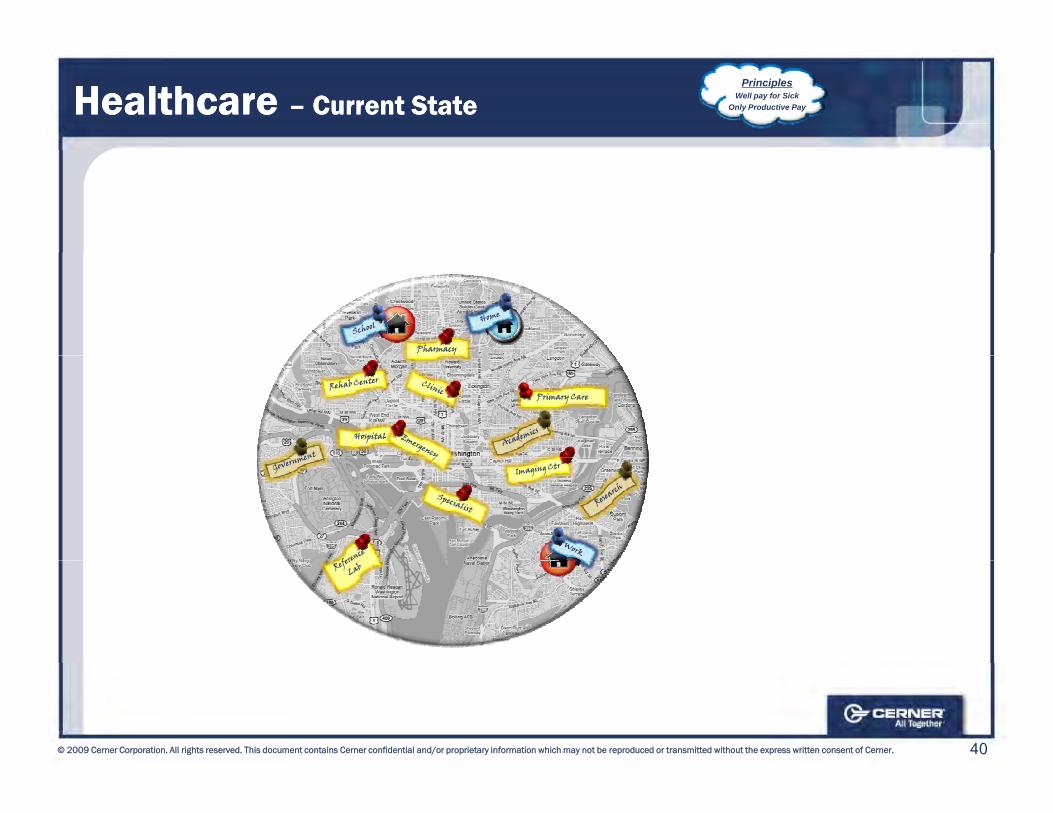
Healthcare Healthcare –– Current StateCurrent StatePrinciples
Well pay for SickOnly Productive Pay
PharmacyPharmacy
HospitalHospital
Primary CarePrimary Care
y
40© 2009 Cerner Corporation. All rights reserved. This document contains Cerner confidential and/or proprietary information which may not be reproduced or transmitted without the express written consent of Cerner.
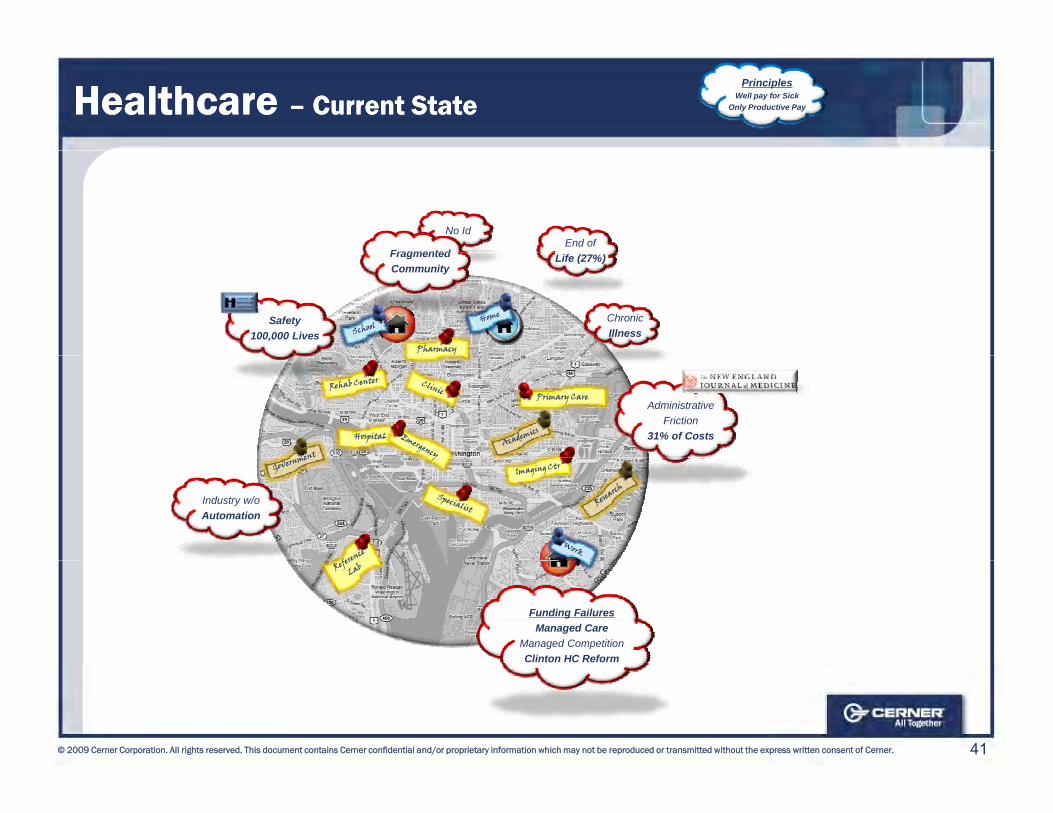
Healthcare Healthcare –– Current StateCurrent StatePrinciples
Well pay for SickOnly Productive Pay
End ofNo Id
Fragmented
PharmacyPharmacy
Life (27%)
ChronicIllness
FragmentedCommunity
Safety100,000 Lives
HospitalHospital
Primary CarePrimary Care
y
AdministrativeFriction
31% of Costs
Industry w/oAutomation
Funding FailuresManaged Care
Managed CompetitionClinton HC Reform
41© 2009 Cerner Corporation. All rights reserved. This document contains Cerner confidential and/or proprietary information which may not be reproduced or transmitted without the express written consent of Cerner.
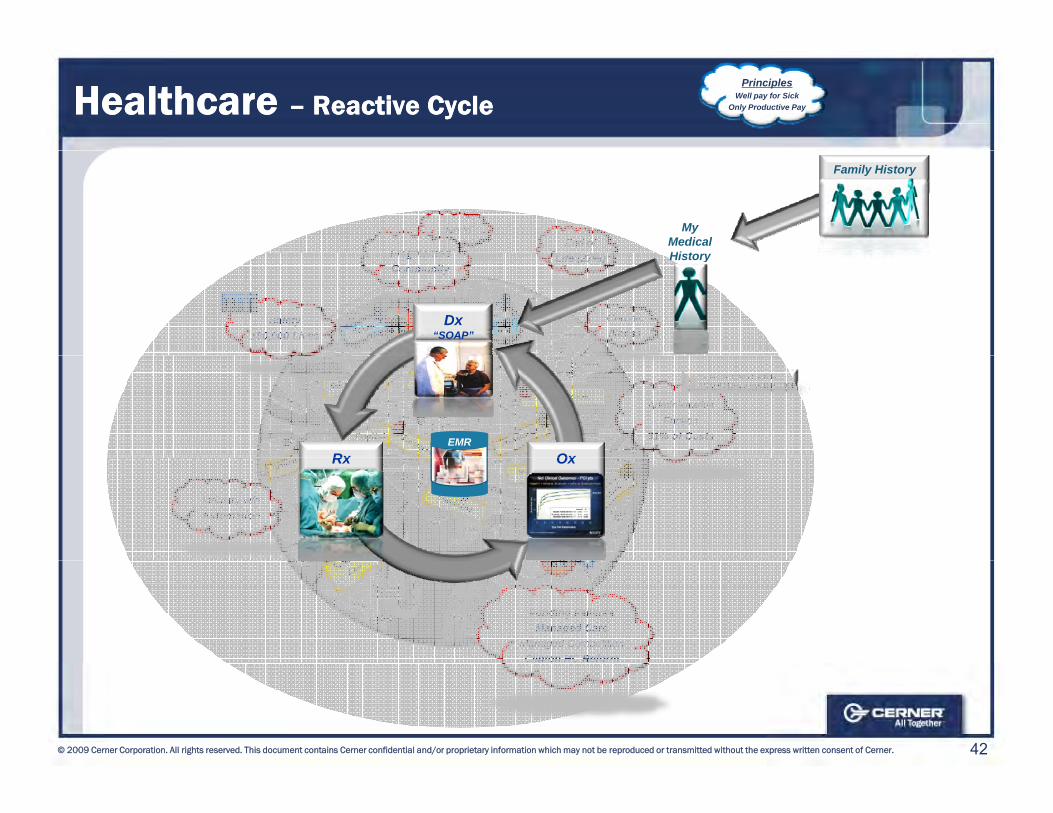
Healthcare Healthcare –– Reactive CycleReactive CyclePrinciples
Well pay for SickOnly Productive Pay
No IdEnd of
Fragmented
My MedicalHi t
Family History
PharmacyPharmacy
Safety100,000 Lives
Life (27%)
ChronicIllness
FragmentedCommunity
Dx“SOAP”
History
HospitalHospital
Primary CarePrimary Care
y
AdministrativeFriction
31% of Costs
Rx OxEMR
Industry w/oAutomation
Rx Ox
Funding FailuresManaged Care
Managed CompetitionClinton HC Reform
42© 2009 Cerner Corporation. All rights reserved. This document contains Cerner confidential and/or proprietary information which may not be reproduced or transmitted without the express written consent of Cerner.
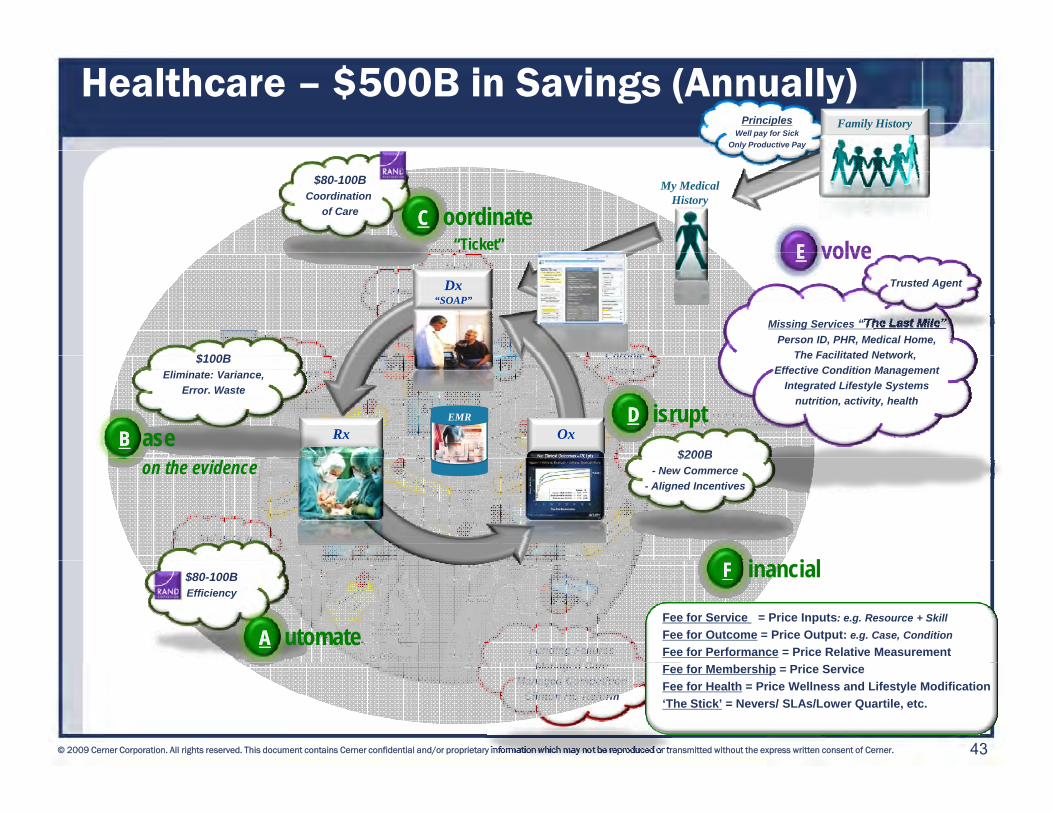
Healthcare – $500B in Savings (Annually)Principles
Well pay for SickOnly Productive Pay
Family History
My MedicalHistory
$80-100BCoordination
of Care CC oordinate“Ticket” EE volve
S f t
No IdEnd of
Life (27%)
Chronic
FragmentedCommunity
Dx“SOAP”
Missing Services “The Last Mile”Person ID, PHR, Medical Home,
The Facilitated Network$100B
Trusted Agent
EE volve
Primary CarePrimary Care
PharmacyPharmacy
Safety100,000 Lives
AdministrativeFriction
ChronicIllness
Rx OxEMR
The Facilitated Network, Effective Condition Management
Integrated Lifestyle Systemsnutrition, activity, health
$200B
$100BEliminate: Variance,
Error. Waste
BB aseDD isrupt
HospitalHospitalFriction
31% of Costs
Industry w/oAutomation
$200B- New Commerce
- Aligned Incentiveson the evidence
i i l
Funding FailuresM d C
Fee for Service = Price Inputs: e.g. Resource + SkillFee for Outcome = Price Output: e.g. Case, ConditionFee for Performance = Price Relative Measurement
$80-100BEfficiency
AA utomate
FF inancial
43© 2009 Cerner Corporation. All rights reserved. This document contains Cerner confidential and/or proprietary information which may not be reproduced or transmitted without the express written consent of Cerner.
Managed CareManaged Competition
Clinton HC Reform
Fee for Membership = Price ServiceFee for Health = Price Wellness and Lifestyle Modification ‘The Stick’ = Nevers/ SLAs/Lower Quartile, etc.

Chairman’s Comments
Neal PattersonChairman, Chief Executive Officer ,and Co-Founder

Questions
Q&A
Cerner Investment Community Meeting
February 24, 2009
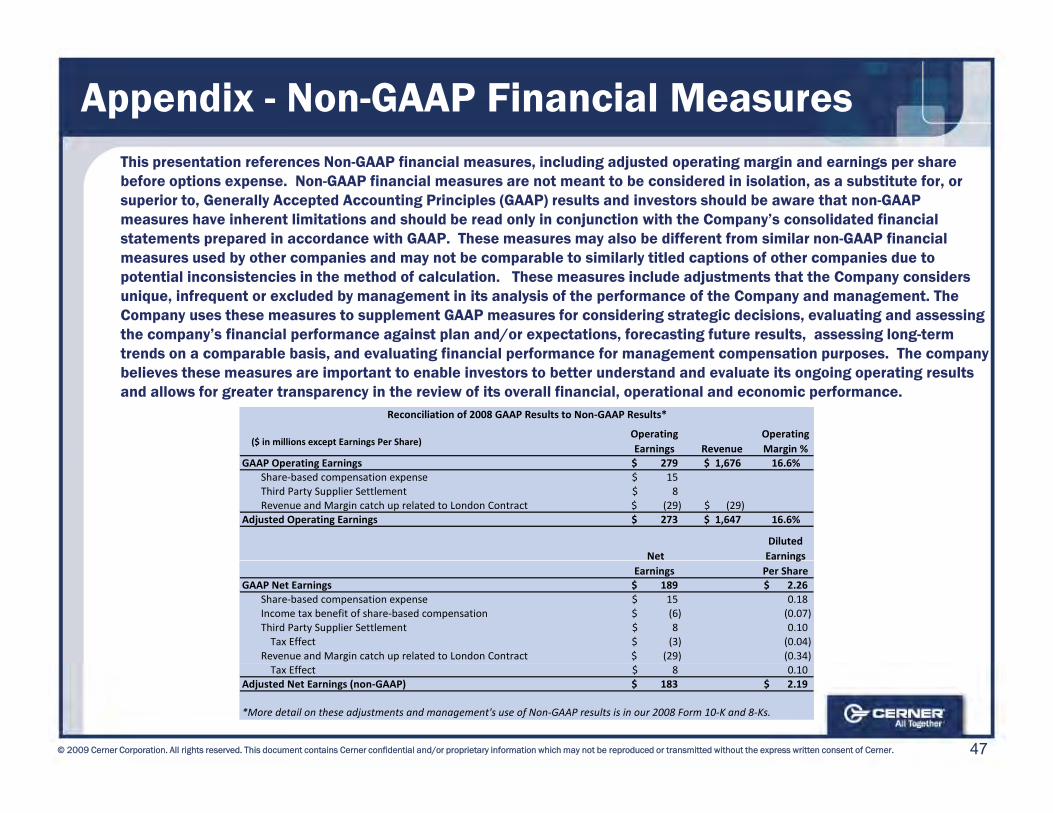
Appendix - Non-GAAP Financial MeasuresThis presentation references Non-GAAP financial measures, including adjusted operating margin and earnings per share before options expense. Non-GAAP financial measures are not meant to be considered in isolation, as a substitute for, or superior to, Generally Accepted Accounting Principles (GAAP) results and investors should be aware that non-GAAP measures have inherent limitations and should be read only in conjunction with the Company’s consolidated financial statements prepared in accordance with GAAP. These measures may also be different from similar non-GAAP financial
d b th i d t b bl t i il l titl d ti f th i d t measures used by other companies and may not be comparable to similarly titled captions of other companies due to potential inconsistencies in the method of calculation. These measures include adjustments that the Company considers unique, infrequent or excluded by management in its analysis of the performance of the Company and management. The Company uses these measures to supplement GAAP measures for considering strategic decisions, evaluating and assessing the company’s financial performance against plan and/or expectations, forecasting future results, assessing long-term trends on a comparable basis and evaluating financial performance for management compensation purposes The company trends on a comparable basis, and evaluating financial performance for management compensation purposes. The company believes these measures are important to enable investors to better understand and evaluate its ongoing operating results and allows for greater transparency in the review of its overall financial, operational and economic performance.
($ in millions except Earnings Per Share)Operating Earnings Revenue
Operating Margin %
Reconciliation of 2008 GAAP Results to Non‐GAAP Results*
GAAP Operating Earnings 279$ 1,676$ 16.6%Share‐based compensation expense 15$ Third Party Supplier Settlement 8$ Revenue and Margin catch up related to London Contract (29)$ (29)$
Adjusted Operating Earnings 273$ 1,647$ 16.6%
Net Diluted Earnings
Earnings g
Per ShareGAAP Net Earnings 189$ 2.26$
Share‐based compensation expense 15$ 0.18 Income tax benefit of share‐based compensation (6)$ (0.07) Third Party Supplier Settlement 8$ 0.10 Tax Effect (3)$ (0.04)
Revenue and Margin catch up related to London Contract (29)$ (0.34)
47© 2009 Cerner Corporation. All rights reserved. This document contains Cerner confidential and/or proprietary information which may not be reproduced or transmitted without the express written consent of Cerner.
Tax Effect 8$ 0.10 Adjusted Net Earnings (non‐GAAP) 183$ 2.19$
*More detail on these adjustments and management's use of Non‐GAAP results is in our 2008 Form 10‐K and 8‐Ks.