Embed Size (px)
Citation preview

2009 Life Jacket Wear Rate Observation Study featuring
National Wear Rate Data from 1998 to 2009
Thomas W. Mangione Heather E. Lisinski
Molly Higgins-Biddle Wendy Chow Mihaly Imre
JSI Research & Training Institute, Inc. Boston, Massachusetts
May 13, 2010
Produced under a grant from the Sport Fish Restoration and Boating Trust Fund, administered by the U.S. Coast Guard.

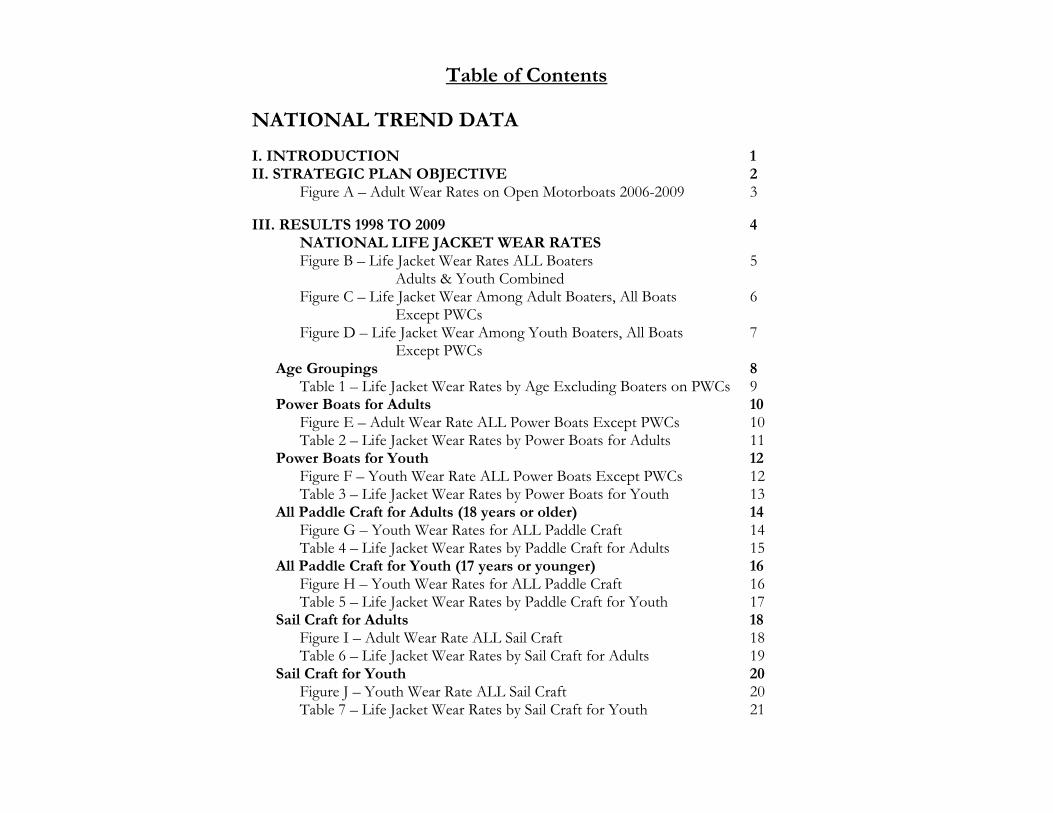
Table of Contents
NATIONAL TREND DATA I. INTRODUCTION 1 II. STRATEGIC PLAN OBJECTIVE 2 Figure A – Adult Wear Rates on Open Motorboats 2006-2009 3 III. RESULTS 1998 TO 2009 4 NATIONAL LIFE JACKET WEAR RATES Figure B – Life Jacket Wear Rates ALL Boaters 5
Adults & Youth Combined Figure C – Life Jacket Wear Among Adult Boaters, All Boats 6 Except PWCs Figure D – Life Jacket Wear Among Youth Boaters, All Boats 7 Except PWCs
Age Groupings 8 Table 1 – Life Jacket Wear Rates by Age Excluding Boaters on PWCs 9
Power Boats for Adults 10 Figure E – Adult Wear Rate ALL Power Boats Except PWCs 10 Table 2 – Life Jacket Wear Rates by Power Boats for Adults 11
Power Boats for Youth 12 Figure F – Youth Wear Rate ALL Power Boats Except PWCs 12 Table 3 – Life Jacket Wear Rates by Power Boats for Youth 13
All Paddle Craft for Adults (18 years or older) 14 Figure G – Youth Wear Rates for ALL Paddle Craft 14 Table 4 – Life Jacket Wear Rates by Paddle Craft for Adults 15
All Paddle Craft for Youth (17 years or younger) 16 Figure H – Youth Wear Rates for ALL Paddle Craft 16 Table 5 – Life Jacket Wear Rates by Paddle Craft for Youth 17
Sail Craft for Adults 18 Figure I – Adult Wear Rate ALL Sail Craft 18 Table 6 – Life Jacket Wear Rates by Sail Craft for Adults 19
Sail Craft for Youth 20 Figure J – Youth Wear Rate ALL Sail Craft 20 Table 7 – Life Jacket Wear Rates by Sail Craft for Youth 21

IV. CONCLUSIONS FOR LIFE JACKET WEAR RATES – NATIONAL 22 TREND DATA V. APPENDIX: METHODS & DESCRIPTIVE INFORMATION 23
JSI Data Collection Form: Boat Form 25 JSI Data Collection Form: Site Form 26
VI. INFORMATION ON BOATS & PEOPLE OBSERVED 27 Figure K – Number of Boats and People 28 Figure L – Types of Boats 29 Figure M – Length of Boats 30 Figure N – Length of Boats 2004-2009 Data Only 31 Figure O – Operation of Boats 32 Figure P1 – Activity of Boaters ALL YEARS 33
Figure P2 – Activity of Boaters, Detailed Breakdown of ALL OTHER Category from Figure P1 34
Figure P3 – Activity of Boaters 2007-2009 Data Only 35 Figure Q – Gender of Boaters 36 Figure R1 – Age of Boaters 37 Figure R2 – Age of Youth Boaters 38 Figure S – Water Temperature in which all Boaters Operated 39 Figure T – Water Current in which all Boaters Operated 40 Figure U – Wave Height in which all Boaters Operated 41 Figure V – Visibility in which all Boaters Operated 42 Figure W – Weather in which all Boaters Operated 43 Figure X – Air Temperature in which all Boaters Operated 44 Figure Y – Wind Speed in which all Boaters Operated 45

1
I. INTRODUCTION This report provides data and analysis on the 2009 National Life Jacket Wear Rate Observation Study with comparison information from the previous eleven year’s studies (1998-2008). Tracking changes in life jacket wear rates over time provides important statistics for those individuals and groups responsible for educating the public about boating safety, improving boating safety programs, and for legislative efforts targeting safety improvements for recreational boating. The Boating Statistics 2008 report, published by the United States Coast Guard (USCG), shows that among the 510 drowning deaths in 2008, approximately 90% (459) of the individuals were not wearing a life jacket. These statistics make it essential to not only track the national life jacket wear rate among recreational boaters, but also to understand the circumstances and patterns in which life jackets are worn.
Calendar year 2009 marked the twelfth year of life jacket wear rate data collection efforts conducted by JSI. The twelve years of data allow for a higher level of analysis (i.e., controlling for the impact of influencing factors like age, weather, and boat type) in order to unmask potential trends and indicators of increased or decreased life jacket wear among different groups of recreational boaters (e.g., adult boaters or male boaters). Most information in this report is presented separately for adults (18+ years old) and youth (0 to 17 years old). Over the 12 years of this study, the general distribution of ages, gender, boat types, boat characteristics and site characteristics have remained relatively stable. The appendix contains a detailed description of methods used and proportions of various boaters, boat and site characteristics are shown for the twelve years of data collection.
2
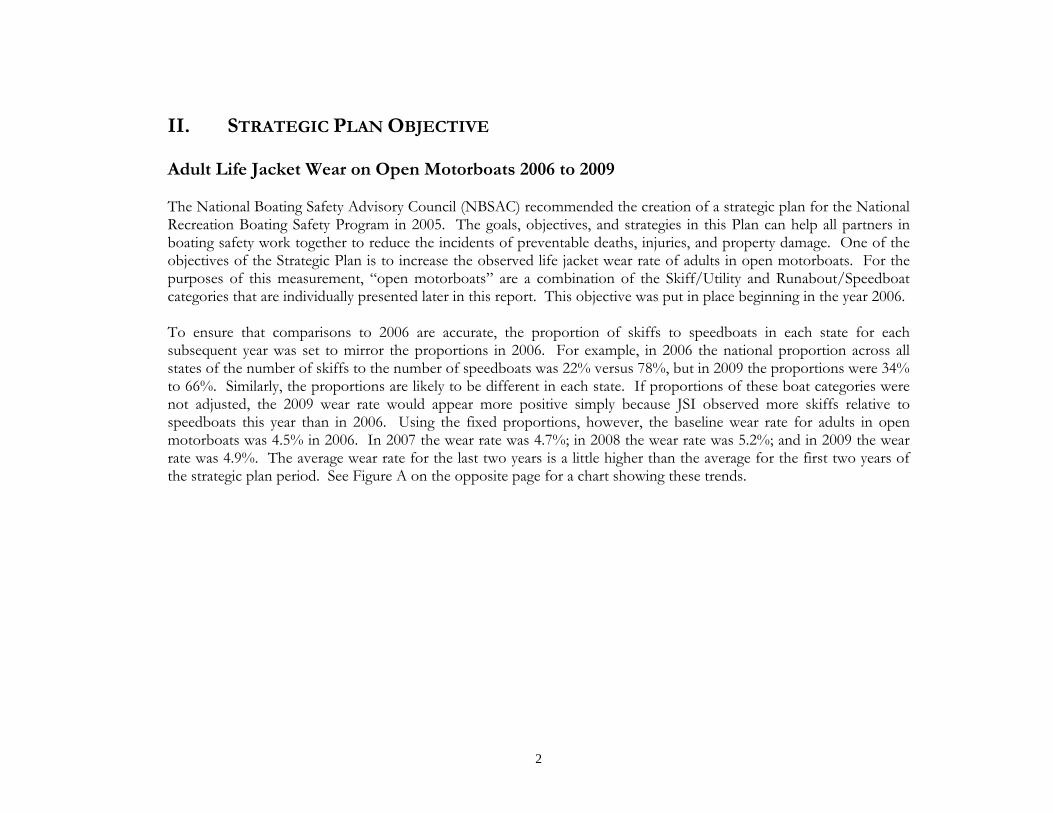
II. STRATEGIC PLAN OBJECTIVE Adult Life Jacket Wear on Open Motorboats 2006 to 2009 The National Boating Safety Advisory Council (NBSAC) recommended the creation of a strategic plan for the National Recreation Boating Safety Program in 2005. The goals, objectives, and strategies in this Plan can help all partners in boating safety work together to reduce the incidents of preventable deaths, injuries, and property damage. One of the objectives of the Strategic Plan is to increase the observed life jacket wear rate of adults in open motorboats. For the purposes of this measurement, “open motorboats” are a combination of the Skiff/Utility and Runabout/Speedboat categories that are individually presented later in this report. This objective was put in place beginning in the year 2006. To ensure that comparisons to 2006 are accurate, the proportion of skiffs to speedboats in each state for each subsequent year was set to mirror the proportions in 2006. For example, in 2006 the national proportion across all states of the number of skiffs to the number of speedboats was 22% versus 78%, but in 2009 the proportions were 34% to 66%. Similarly, the proportions are likely to be different in each state. If proportions of these boat categories were not adjusted, the 2009 wear rate would appear more positive simply because JSI observed more skiffs relative to speedboats this year than in 2006. Using the fixed proportions, however, the baseline wear rate for adults in open motorboats was 4.5% in 2006. In 2007 the wear rate was 4.7%; in 2008 the wear rate was 5.2%; and in 2009 the wear rate was 4.9%. The average wear rate for the last two years is a little higher than the average for the first two years of the strategic plan period. See Figure A on the opposite page for a chart showing these trends.

3
Figure A – Adult Wear Rates on Open Motorboats* 2006-2009
(Weighted to 2006 Skiff-Speedboat Proportions for Each State)
4.9%5.2%4.6%4.5%
0%1%2%3%4%5%6%7%8%9%
10%
2006 2007 2008 2009
JSI Research and Training Institute, Inc. 2009 National Observational Life Jacket Wear Rate Study * The Open Motorboat category is created by grouping "Skiffs" and “Speedboat/Runabouts" together. Factors controlled for in this chart are Age (proportions of 18 to 64 and 65+ adults) and the proportion of Skiffs to Speedboat/Runabouts has been set in each year within each state to reflect the proportions observed in 2006, the year in which the Strategic Plan goals were first measured. In addition, each state’s contribution to the national average is weighted to reflect the 2006 proportions.

4
III. RESULTS National Life Jacket Wear Rates ALL Boaters 1998 to 2009 Figure B shows trends for national life jacket wear rates, which includes all groups of recreational boaters together (youth and adults) for all boats. The average life jacket wear rate for 2009 was 22.3%, down somewhat from 2008 in which the rate was 23.4%. Over the twelve year period, the lowest rates were 21.3% (1999) and 21.4% (2007). The highest wear rates observed were 23.9% (1998); 23.3% (2005), 23.2% (2006) and 23.4% (2008). However, focusing on this combined life jacket wear rate obscures the influence of age and boat type on life jacket wear. Figure B also shows the impact of Personal Watercraft (PWC) wear rates on the national average wear rate for all boaters by presenting rates with PWCs removed. Life jacket wear is mandated on PWCs, therefore excluding them provides a more valid representation of voluntary wear rate trends. In 2009 wear rates for adults and youth combined on all boats except PWCs was 17.4%, down slightly from the 2008 rate of 17.9%. There has been a slight national downward trend from a high of 18.1% in 2005.

5
23.9%
21.3% 22
.9%
22.0%
21.8% 22
.8%
22.2% 23
.3%
23.2%
21.4%
23.4%
22.3%
17.4
%
17.9
%
16.9
%
17.8
%
18.1
%
17.8
%
18.1
%
17.1
%
16.7
%
17.6
%
18.1
%
15.4
%
0%
5%
10%
15%
20%
25%
30%
35%
40%
45%
50%
1998 1999 2000 2001 2002 2003 2004 2005 2006 2007 2008 2009
With PWCsWithout PWCs
Figure B – Life Jacket Wear Rates ALL Boaters (Adults and Youth Combined)
JSI Research and Training Institute, Inc. 2009 National Observational Life Jacket Wear Rate Study

6
11.0%9.0%
10.1%8.5% 9.1%
10.1% 9.7% 9.9% 9.9%8.5% 9.0%
8.1%
0%
5%
10%
15%
20%
25%
30%
1998 1999 2000 2001 2002 2003 2004 2005 2006 2007 2008 2009
11.0%9.0%
10.1%8.5% 9.1%
10.1% 9.7% 9.9% 9.9%8.5% 9.0%
8.1%
0%
5%
10%
15%
20%
25%
30%
1998 1999 2000 2001 2002 2003 2004 2005 2006 2007 2008 2009
National Life Jacket Wear Rates for ADULTS excluding PWCs 1998 to 2009
The national average wear rate for all adults on all boats excluding PWCs in 2009 is 8.1%, down slightly from 2008 and at its lowest point in the twelve years of observations (see Figure C below).
Figure C – Life Jacket Wear Among Adult Boaters (18 years or older)* (All boats except PWCs)
JSI Research and Training Institute, Inc. 2009 National Observational Life Jacket Wear Rate Study *Factors controlled for: Age & Boat Type.

7
56.4%52.1%
55.6%59.1% 60.0% 60.1% 60.6%
63.5%60.4% 62.2% 64.5% 67.2%
0%
10%
20%
30%
40%
50%
60%
70%
80%
90%
100%
1998 1999 2000 2001 2002 2003 2004 2005 2006 2007 2008 2009
National Life Jacket Wear Rates for YOUTH excluding PWCs 1998 to 2009 Figure D shows the national wear rate trend for all youth (17 years or younger) on all boats except PWCs. These rates are relatively high across the twelve years of the study with a general upward trend. The rate for 2009 is 67.2%, the highest it has been since the beginning of the study, and approximately a 20% increase across the twelve years of observations.
Figure D – Life Jacket Wear Among Youth Boaters (17 years or younger)*
(All boats except PWCs)
JSI Research and Training Institute, Inc. 2009 National Observational Life Jacket Wear Rate Study *Factors controlled for: Age & Boat Type.

8
Life Jacket Wear Rates by Age Groupings 1998 to 2009 Table 1 presents wear rates by the different age groupings used in the study. The trends in wear rates for children under 6 has remained very high - but relatively flat since 2004 - with the 2009 rate at 93.6%. For the 6 to 12 year olds there is a slight decrease from 87.3% last year to 86.5% in 2009. Teens (13 to 17 years old) show a small increasing trend since 1999 when teens were identified as a separate age category with the rate in 2009 being 38.9%, the highest that it has been since 1999. As was mentioned earlier in the discussion for Figure D, all youth grouped together show a generally increasing trend with 2009 having the highest reading across the twelve years at 67.2%. For adults ages 18 to 64 and 65+ there are no noticeable upward trends across the twelve years of data collection. In 2009 there was a decrease in national wear rates for the 18 to 64 years old group, from 9.1% in 2008 to 8.1% in 2009. For older boaters (65+) the wear rates went up from 6.1% in 2008 to a 2009 wear rate of 7.0%. As indicated in Figure C shown earlier, and in Table 1, when both adult groups are combined (18+ yrs), there was a decline from 2008 to 2009 that mirrored the 18 to 64 age group, whose rates were 9.0% in 2008 and 8.1% in 2009, because this group has more boaters than the 65+ age group.

9
Table 1 - Life Jacket Wear Rates by Age Excluding Boaters on PWCs*
Age 1998
% (N’s)
1999 %
(N’s)
2000 %
(N’s)
2001 %
(N’s)
2002 %
(N’s)
2003 %
(N’s)
2004 %
(N’s)
2005 %
(N’s)
2006 %
(N’s)
2007 %
(N’s)
2008 %
(N’s)
2009 %
(N’s)
0-5 yrs 81.4% 80.6% 89.1% 91.7% 90.1% 90.3% 94.9% 93.1% 94.4% 92.2% 93.5% 93.6% (672) (500) (716) (703) (676) (658) (743) (714) (921) (930) (938) (854) 6-12 yrs ** 69.1% 72.1% 76.6% 79.2% 79.7% 81.6% 80.6% 79.1% 84.1% 87.3% 86.5%
** (2104) (2696) (3122) (2752) (2627) (27411) (2487) (2403) (2819) (2579) (2812)
13-17 yrs ** 24.1% 30.5% 31.2% 32.4% 32.0% 29.8% 32.8% 33.5% 31.5% 33.2% 38.9% ** (2244) (2725) (2893) (2575) (2767) (2572) (2230) (2403) (2652) (2507) (2420)
0-17 yrs 56.4% 52.1% 55.6% 59.1% 60.0% 60.1% 60.6% 63.5% 60.4% 62.2% 64.5% 67.2% (all youth) (4677) (4624) (6094) (6695) (5924) (5970) (5955) (5414) (5713) (6401) (6024) (6086) 18-64 yrs 10.9% 8.8% 10.1% 8.5% 9.2% 10.1% 9.7% 9.9% 10.0% 8.4% 9.1% 8.1% (25470) (24321) (27100) (32528) (31742) (28551) (33319) (30176) (29591) (32108) (30743) (34632) 65+ yrs 13.6% 12.9% 9.9% 6.9% 6.8% 9.4% 8.3% 11.0% 8.3% 11.7% 6.1% 7.0%
(1203) (1147) (1040) (1276) (922) (1106) (1331) (823) (803) (881) (1190) (1129)
18+ yrs 11.0% 9.0% 10.1% 8.5% 9.1% 10.1% 9.7% 9.9% 9.9% 8.5% 9.0% 8.1% (all adults) (26673) (25468) (28140) (33804) (32664) (29657) (34650) (30999) (30394) (32989) (31933) (35761)
JSI Research and Training Institute, Inc. 2009 National Observational Life Jacket Wear Rate Study *Factors controlled for: Age & Boat Type. **In 1998 observations were recorded as 6-17yrs and therefore cannot be subdivided.

10
5.6%
4.4%
5.2%
4.2%3.9%
4.9%
3.9%4.4%
3.9%4.3%
4.8%
3.9%
0%
1%
2%
3%
4%
5%
6%
7%
8%
1998 1999 2000 2001 2002 2003 2004 2005 2006 2007 2008 2009
Power Boats for Adults (18 years or older). Figure E and Table 2 present information for the various types of power boats for adults. Averaging across these types of boats (not including PWCs) for 2009, we see a decrease (3.9% in 2009 from 4.8% in 2008, see Figure E below). Comparing rates for individual types of power boats provides a better understanding of these results. Skiffs decreased substantially to 6.9% from 9.2% and runabouts decreased as well (4.1% down to 3.5%). These decreases are important because they encompass the two types of craft that adults are seen in most frequently. These decreases are also reflected in the open motorboat category which saw a small decline from 2008 levels of 5.2% to 4.9% in 2009. Cabin cruisers and pontoon boats continued to show very low wear rates. PWCs continued to have almost universal wear rates. Powered inflatables had a decrease from 17.6% to 11.9%, but it is based on a relatively small number of boaters.
Figure E – Adult Wear Rates for ALL Power Boats Except PWCs*
JSI Research and Training Institute, Inc. 2009 National Observational Life Jacket Wear Rate Study *Factors controlled for: Age & Boat Type.

11
Table 2 - Life Jacket Wear Rates by Power Boats for Adults (18 years or older)*
Boat Type 1998
% (N’s)
1999 %
(N’s)
2000 %
(N’s)
2001 %
(N’s)
2002 %
(N’s)
2003 %
(N’s)
2004 %
(N’s)
2005 %
(N’s)
2006 %
(N’s)
2007 %
(N’s)
2008 %
(N’s)
2009 %
(N’s) All Power Boats 5.6% 4.4% 5.2% 4.2% 3.9% 4.9% 3.9% 4.4% 3.9% 4.3% 4.8% 3.9% (no PWCs) (20813) (19894) (22448) (27864) (26304) (24190) (28285) (25741) (25412) (27623) (27315) (29924) Skiff/Utility 13.2% 10.0% 10.3% 9.7% 5.9% 10.4% 7.9% 7.2% 7.3% 8.5% 9.2% 6.9% (2032) (1867) (1903) (2469) (3177) (4214) (4429) (5038) (4091) (5340) (6633) (7257) Runabout/Speedboat 5.5% 4.2% 5.3% 4.5% 4.3% 4.6% 3.9% 4.7% 3.7% 3.6% 4.1% 3.5% (13196) (13195) (14463) (16985) (14066) (13057) (16633) (13643) (14512) (14414) (13901) (14635) Open Motorboats** 7.2% 5.5% 6.4% 5.6% 4.7% 5.9% 4.8% 5.3% 4.5% 4.7% 5.2% 4.9% (Skiff/Utility+ Runabout/Speedboat)
(15228) (15062) (16366) (19454) (17243) (17271) (21052) (18681) (18603) (19754) (20534) (21439)
Cabin Cruiser 1.3% 1.8% 1.6% 1.2% 1.9% 1.7% 1.0% 1.1% 1.7% 2.0% 1.4% 1.6% (4012) (3396) (4391) (6222) (7111) (5119) (5242) (5054) (4280) (5353) (4430) (5342) Houseboat 0.8% 0.0% 0.0% 0.6% 0.8% 0.0% 5.6% 0.4% 0.0% 0.0% 0.0% 0.0% (252) (151) (216) (162) (124) (328) (216) (219) (112) (43) (51) (31) Pontoon 4.7% 4.0% 6.2% 1.9% 2.7% 2.9% 2.9% 4.1% 2.4% 2.7% 1.1% 2.1% (1359) (1231) (1458) (1929) (1796) (1610) (1770) (1849) (2276) (2150) (2051) (2436) PWC 96.5% 94.2% 97.4% 96.0% 95.8% 94.7% 95.5% 95.3% 97.1% 96.1% 97.6% 97.4% (1959) (1899) (1761) (2091) (1798) (1589) (1721) (1858) (1962) (1736) (2009) (2093) Powered Inflatable/Raft 25.6% 15.7% 22.3% 13.5% 27.2% 14.8% 9.0% 1.9% 11.0% 19.1% 17.6% 11.9% (214) (205) (233) (259) (154) (190) (211) (157) (253) (366) (228) (254)
JSI Research and Training Institute, Inc. 2009 National Observational Life Jacket Wear Rate Study *Factors controlled for: Age & Boat Type. ** The Open Motorboat category is created by grouping "Skiffs" and “Speedboat/Runabouts" together. Factors controlled for in this chart are Age (proportions of 18 to 64 and 65+ adults) and the proportion of Skiffs to Speedboat/Runabouts has been set in each year within each state to reflect the proportions observed in 2006, the year in which the Strategic Plan goals were first measured. In addition, each state’s contribution to the national average is weighted to reflect the 2006 proportions.

12
53.5%51.0%
54.3%58.6% 58.2% 58.7% 58.8%
62.5%58.7% 60.8%
63.9% 66.3%
0%
10%
20%
30%
40%
50%
60%
70%
80%
90%
100%
1998 1999 2000 2001 2002 2003 2004 2005 2006 2007 2008 2009
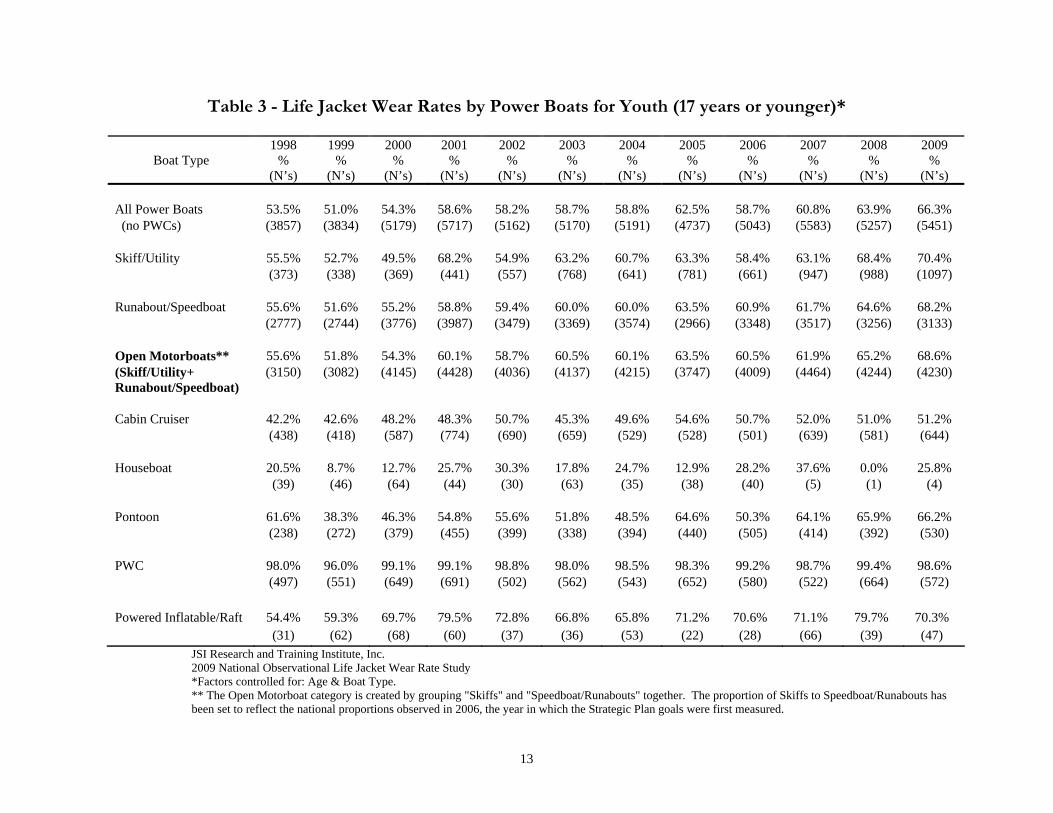
Power Boats for Youth (17 years or younger). Figure F and Table 3 present data for each type of power boat for the three age groups of youth combined (17 years or younger). For all youth on all power boats (excluding PWCs), we find an increase in 2009 (66.3%) from 2008 (63.9%, see Figure F below). Extrapolating from the age results reported in Table 1, this change is driven mostly by the increase in wear rates for the 13 to 17 year old group of boaters. The information for specific types of power boats shows gains among the most frequently used boats by this age group. For skiffs the increase is from 68.4% in 2008 to 70.4% in 2009. For speedboats/runabouts the wear rate moves from 64.6% in 2008 to 68.2% in 2009. These two boat types, which are the type of crafts youth are most frequently observed on, had their highest wear rates observed in 2009 compared to the previous years. As seen in previous years, PWC wear rates are extremely high.
Figure F – Youth Wear Rates for ALL Power Boats Except PWCs*
JSI Research and Training Institute, Inc. 2009 National Observational Life Jacket Wear Rate Study *Factors controlled for: Age & Boat Type.
13
Table 3 - Life Jacket Wear Rates by Power Boats for Youth (17 years or younger)*
Boat Type 1998
% (N’s)
1999 %
(N’s)
2000 %
(N’s)
2001 %
(N’s)
2002 %
(N’s)
2003 %
(N’s)
2004 %
(N’s)
2005 %
(N’s)
2006 %
(N’s)
2007 %
(N’s)
2008 %
(N’s)
2009 %
(N’s) All Power Boats 53.5% 51.0% 54.3% 58.6% 58.2% 58.7% 58.8% 62.5% 58.7% 60.8% 63.9% 66.3% (no PWCs) (3857) (3834) (5179) (5717) (5162) (5170) (5191) (4737) (5043) (5583) (5257) (5451) Skiff/Utility 55.5% 52.7% 49.5% 68.2% 54.9% 63.2% 60.7% 63.3% 58.4% 63.1% 68.4% 70.4% (373) (338) (369) (441) (557) (768) (641) (781) (661) (947) (988) (1097) Runabout/Speedboat 55.6% 51.6% 55.2% 58.8% 59.4% 60.0% 60.0% 63.5% 60.9% 61.7% 64.6% 68.2% (2777) (2744) (3776) (3987) (3479) (3369) (3574) (2966) (3348) (3517) (3256) (3133) Open Motorboats** 55.6% 51.8% 54.3% 60.1% 58.7% 60.5% 60.1% 63.5% 60.5% 61.9% 65.2% 68.6% (Skiff/Utility+ Runabout/Speedboat)
(3150) (3082) (4145) (4428) (4036) (4137) (4215) (3747) (4009) (4464) (4244) (4230)
Cabin Cruiser 42.2% 42.6% 48.2% 48.3% 50.7% 45.3% 49.6% 54.6% 50.7% 52.0% 51.0% 51.2% (438) (418) (587) (774) (690) (659) (529) (528) (501) (639) (581) (644) Houseboat 20.5% 8.7% 12.7% 25.7% 30.3% 17.8% 24.7% 12.9% 28.2% 37.6% 0.0% 25.8% (39) (46) (64) (44) (30) (63) (35) (38) (40) (5) (1) (4) Pontoon 61.6% 38.3% 46.3% 54.8% 55.6% 51.8% 48.5% 64.6% 50.3% 64.1% 65.9% 66.2% (238) (272) (379) (455) (399) (338) (394) (440) (505) (414) (392) (530) PWC 98.0% 96.0% 99.1% 99.1% 98.8% 98.0% 98.5% 98.3% 99.2% 98.7% 99.4% 98.6% (497) (551) (649) (691) (502) (562) (543) (652) (580) (522) (664) (572) Powered Inflatable/Raft 54.4% 59.3% 69.7% 79.5% 72.8% 66.8% 65.8% 71.2% 70.6% 71.1% 79.7% 70.3% (31) (62) (68) (60) (37) (36) (53) (22) (28) (66) (39) (47)
JSI Research and Training Institute, Inc. 2009 National Observational Life Jacket Wear Rate Study *Factors controlled for: Age & Boat Type. ** The Open Motorboat category is created by grouping "Skiffs" and "Speedboat/Runabouts" together. The proportion of Skiffs to Speedboat/Runabouts has been set to reflect the national proportions observed in 2006, the year in which the Strategic Plan goals were first measured.

14
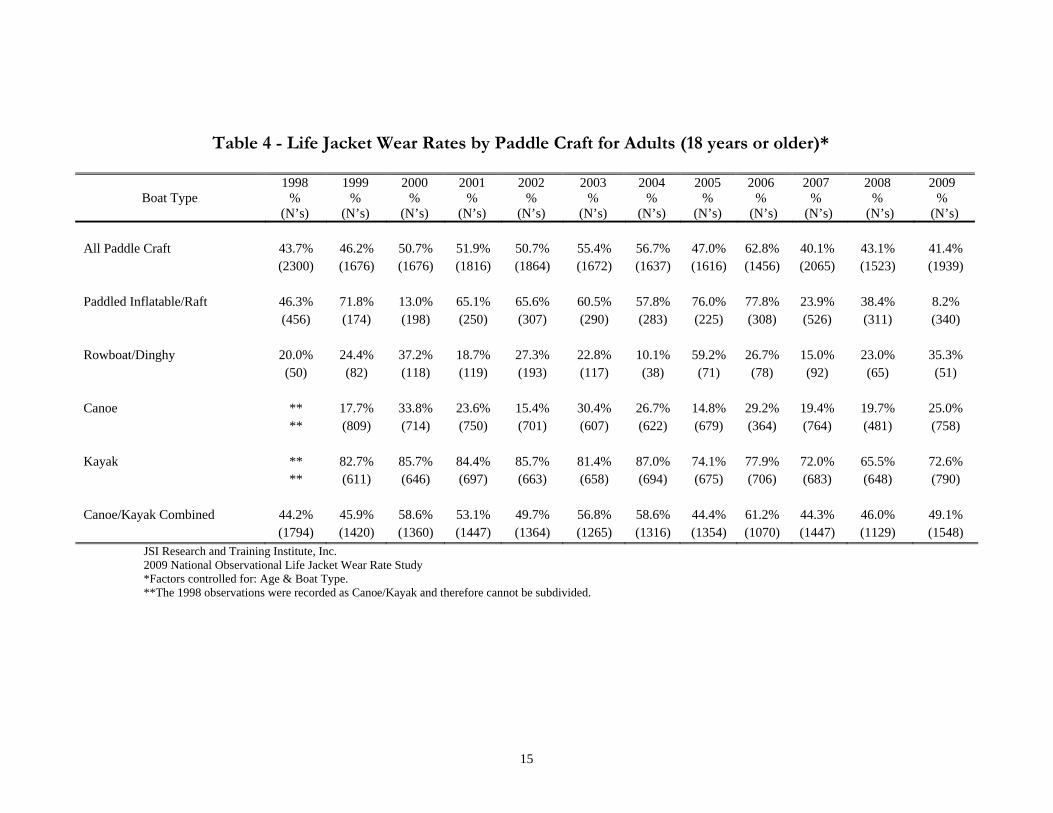
All Paddle Craft for Adults (18 years or older). Figure G and Table 4 present results for adults in paddle craft. All paddle craft rates stayed at moderate rates even though paddled inflatables showed a substantial dip. This dip was due to one site which historically sees a lot of inflatable participants and high wear rates but for 2009 observations were unable to be completed. Comparing the combined rates for the two types of craft that make up the bulk of the activity in this group (canoes and kayaks), there is an increase from 2008 in which the rate was 46.0% to 2009 when the rate went up to 49.1% (see Table 4). This is mirrored by the separate wear rate changes for canoes and kayaks, in which canoes went from 19.7% to 25.0% and kayaks increased from 65.5% to 72.6%. Rowboat/Dinghies increased from 23.0% to 35.3%, but this rate change was based on a relatively few number of these boaters observed. The data for inflatable/rafts was much lower in 2009 because observations could not be conducted at one of the main sites for observing inflatable rafts which are being paddled.
Figure G – Adult Wear Rates for ALL Paddle Craft*
43.7% 46.2%50.7% 51.9% 50.7%
55.4% 56.7%
47.0%
62.8%
40.1%43.1% 41.4%
0%
10%
20%
30%
40%
50%
60%
70%
80%
90%
100%
1998 1999 2000 2001 2002 2003 2004 2005 2006 2007 2008 2009
JSI Research and Training Institute, Inc. 2009 National Observational Life Jacket Wear Rate Study *Factors controlled for: Age & Boat Type.
15
Table 4 - Life Jacket Wear Rates by Paddle Craft for Adults (18 years or older)*
Boat Type 1998
% (N’s)
1999 %
(N’s)
2000 %
(N’s)
2001 %
(N’s)
2002 %
(N’s)
2003 %
(N’s)
2004 %
(N’s)
2005 %
(N’s)
2006 %
(N’s)
2007 %
(N’s)
2008 %
(N’s)
2009 %
(N’s)
All Paddle Craft 43.7% 46.2% 50.7% 51.9% 50.7% 55.4% 56.7% 47.0% 62.8% 40.1% 43.1% 41.4% (2300) (1676) (1676) (1816) (1864) (1672) (1637) (1616) (1456) (2065) (1523) (1939) Paddled Inflatable/Raft 46.3% 71.8% 13.0% 65.1% 65.6% 60.5% 57.8% 76.0% 77.8% 23.9% 38.4% 8.2% (456) (174) (198) (250) (307) (290) (283) (225) (308) (526) (311) (340) Rowboat/Dinghy 20.0% 24.4% 37.2% 18.7% 27.3% 22.8% 10.1% 59.2% 26.7% 15.0% 23.0% 35.3% (50) (82) (118) (119) (193) (117) (38) (71) (78) (92) (65) (51) Canoe ** 17.7% 33.8% 23.6% 15.4% 30.4% 26.7% 14.8% 29.2% 19.4% 19.7% 25.0% ** (809) (714) (750) (701) (607) (622) (679) (364) (764) (481) (758) Kayak ** 82.7% 85.7% 84.4% 85.7% 81.4% 87.0% 74.1% 77.9% 72.0% 65.5% 72.6% ** (611) (646) (697) (663) (658) (694) (675) (706) (683) (648) (790) Canoe/Kayak Combined 44.2% 45.9% 58.6% 53.1% 49.7% 56.8% 58.6% 44.4% 61.2% 44.3% 46.0% 49.1% (1794) (1420) (1360) (1447) (1364) (1265) (1316) (1354) (1070) (1447) (1129) (1548)
JSI Research and Training Institute, Inc. 2009 National Observational Life Jacket Wear Rate Study *Factors controlled for: Age & Boat Type. **The 1998 observations were recorded as Canoe/Kayak and therefore cannot be subdivided.

16
All Paddle Craft for Youth (17 years or younger). Figure H and Table 5 present results for youth in paddle craft. Data in this table should be viewed cautiously because of the relatively small number of youth who use these types of craft. For all paddle craft combined wear rates have fluctuated across the years, but the rates went up slightly for 2009 to 70.4% compared to 67.7% in 2008. For the combined canoe/kayak category there is a small decline from 80.0% in 2008 to 76.0% in 2009 (see Table 5). This is a reflection of the drop in canoe wear rates to 70.6% in 2009 from 78.0% in 2008 compared to a small increase in kayak wear rates from 83.5% in 2008 to 85.3% in 2009. Wear rates for inflatable boats which were being paddled went up slightly from 55.6% to 59.0%, but again with a relatively small number of youth boaters.
Figure H – Youth Wear Rates for ALL Paddle Craft*
76.6%
64.3%68.9% 66.3%
82.4%77.7%
70.2%
77.4%80.5%
73.5%67.7%
70.4%
0%
10%
20%
30%
40%
50%
60%
70%
80%
90%
100%
1998 1999 2000 2001 2002 2003 2004 2005 2006 2007 2008 2009
JSI Research and Training Institute, Inc. 2009 National Observational Life Jacket Wear Rate Study *Factors controlled for: Age & Boat Type.

17
Table 5 - Life Jacket Wear Rates by Paddle Craft for Youth (17 years or younger)*
Boat Type 1998
% (N’s)
1999 %
(N’s)
2000 %
(N’s)
2001 %
(N’s)
2002 %
(N’s)
2003 %
(N’s)
2004 %
(N’s)
2005 %
(N’s)
2006 %
(N’s)
2007 %
(N’s)
2008 %
(N’s)
2009 %
(N’s) All Paddle Craft 76.6% 64.3% 68.9% 66.3% 82.4% 77.7% 70.2% 77.4% 80.5% 73.5% 67.7% 70.4% (446) (317) (457) (457) (312) (372) (360) (281) (225) (520) (492) (319) Paddled Inflatable/Raft 84.4% 62.4% 45.8% 52.3% 90.3% 68.9% 68.4% 77.5% 77.9% 58.4% 55.6% 59.0% (149) (82) (124) (153) (136) (113) (118) (79) (87) (244) (218) (76) Rowboat/Dinghy 71.4% 11.1% 47.1% 60.3% 54.7% 88.6% 58.0% 77.1% 67.3% 61.0% 77.8% 91.1% (14) (9) (15) (32) (31) (21) (11) (17) (26) (21) (25) (9) Canoe ** 57.7% 74.6% 62.4% 71.1% 75.0% 60.3% 69.4% 68.9% 81.0% 78.0% 70.6% ** (142) (222) (181) (98) (130) (146) (101) (49) (123) (158) (132) Kayak ** 83.3% 89.2% 94.3% 83.7% 91.6% 91.2% 88.7% 89.0% 90.1% 83.5% 85.3% ** (84) (96) (91) (47) (108) (85) (94) (63) (132) (86) (102) Canoe/Kayak Combined 72.1% 67.3% 78.9% 73.1% 74.5% 82.9% 71.3% 79.6% 82.2% 85.7% 80.0% 76.0% (283) (226) (318) (272) (145) (238) (231) (195) (112) (255) (244) (234)
JSI Research and Training Institute, Inc. 2009 National Observational Life Jacket Wear Rate Study *Factors controlled for: Age & Boat Type. **The 1998 observations were recorded as Canoe/Kayak and therefore cannot be subdivided.

18
10.5%13.6%
17.1% 17.0%18.4%
16.7%19.5%
24.8%28.0%
24.7%
20.0%23.2%
0%
5%
10%
15%
20%
25%
30%
35%
40%
45%
50%
1998 1999 2000 2001 2002 2003 2004 2005 2006 2007 2008 2009
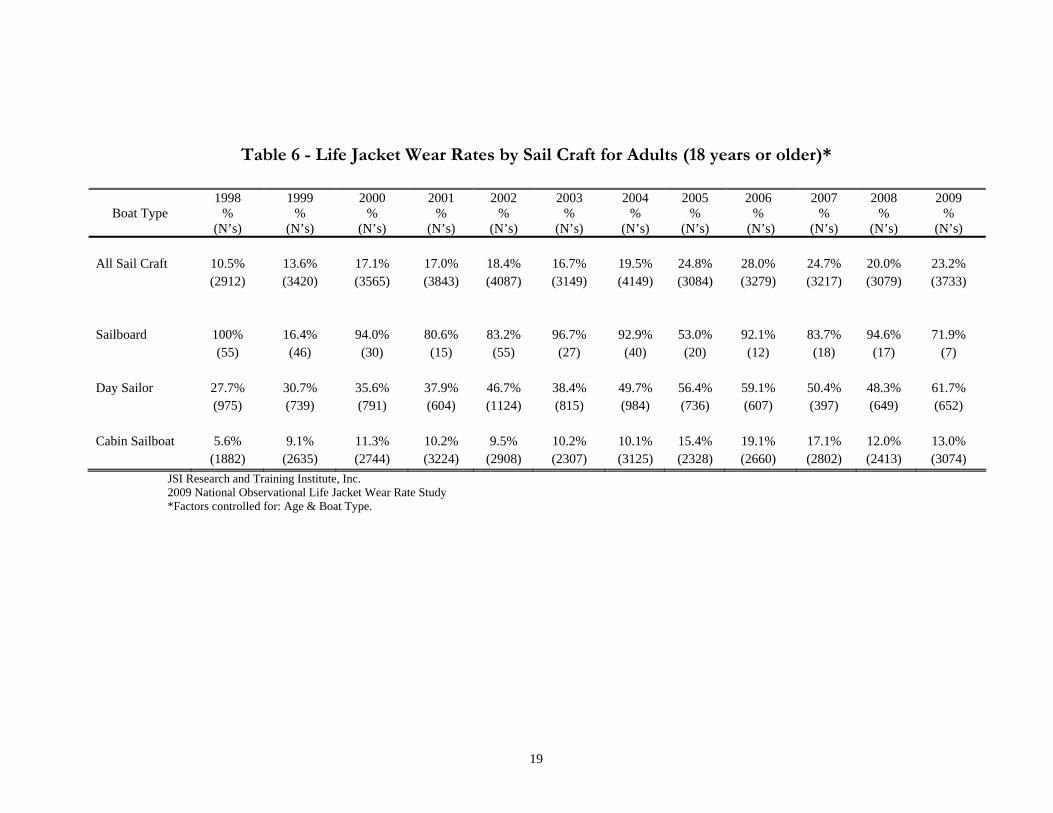
Sail Craft for Adults (18 years or older). Figure I and Table 6 document results for adults in sail craft. For all sailing craft combined there was an increase in wear rates from the previous year of 20.0% in 2008 to 23.2% in 2009 (see Figure I below). From 2008 to 2009 there was an increase for day sailors (48.3% to 61.7%). Wear rates on day sailors increased more than 100% since 1998 (a baseline rate of 27.7%). In 2009 there was also a small increase for cabin sailboats (12.0% in 2008 to 13.0% in 2009). Cabin sailboats wear rates increased approximately 150% since 1998 in which the baseline wear rate was 5.6%.
Figure I – Adult Wear Rates for ALL Sail Craft*
JSI Research and Training Institute, Inc. 2009 National Observational Life Jacket Wear Rate Study *Factors controlled for: Age & Boat Type.
19
Table 6 - Life Jacket Wear Rates by Sail Craft for Adults (18 years or older)*
JSI Research and Training Institute, Inc. 2009 National Observational Life Jacket Wear Rate Study *Factors controlled for: Age & Boat Type.
Boat Type 1998
% (N’s)
1999 %
(N’s)
2000 %
(N’s)
2001 %
(N’s)
2002 %
(N’s)
2003 %
(N’s)
2004 %
(N’s)
2005 %
(N’s)
2006 %
(N’s)
2007 %
(N’s)
2008 %
(N’s)
2009 %
(N’s) All Sail Craft 10.5% 13.6% 17.1% 17.0% 18.4% 16.7% 19.5% 24.8% 28.0% 24.7% 20.0% 23.2% (2912) (3420) (3565) (3843) (4087) (3149) (4149) (3084) (3279) (3217) (3079) (3733) Sailboard 100% 16.4% 94.0% 80.6% 83.2% 96.7% 92.9% 53.0% 92.1% 83.7% 94.6% 71.9% (55) (46) (30) (15) (55) (27) (40) (20) (12) (18) (17) (7) Day Sailor 27.7% 30.7% 35.6% 37.9% 46.7% 38.4% 49.7% 56.4% 59.1% 50.4% 48.3% 61.7% (975) (739) (791) (604) (1124) (815) (984) (736) (607) (397) (649) (652) Cabin Sailboat 5.6% 9.1% 11.3% 10.2% 9.5% 10.2% 10.1% 15.4% 19.1% 17.1% 12.0% 13.0% (1882) (2635) (2744) (3224) (2908) (2307) (3125) (2328) (2660) (2802) (2413) (3074)

20
67.6%
59.7%65.7% 66.2% 68.4% 68.9%
71.6% 71.6%75.0%
69.2%64.1%
74.7%
0%
10%
20%
30%
40%
50%
60%
70%
80%
90%
100%
1998 1999 2000 2001 2002 2003 2004 2005 2006 2007 2008 2009
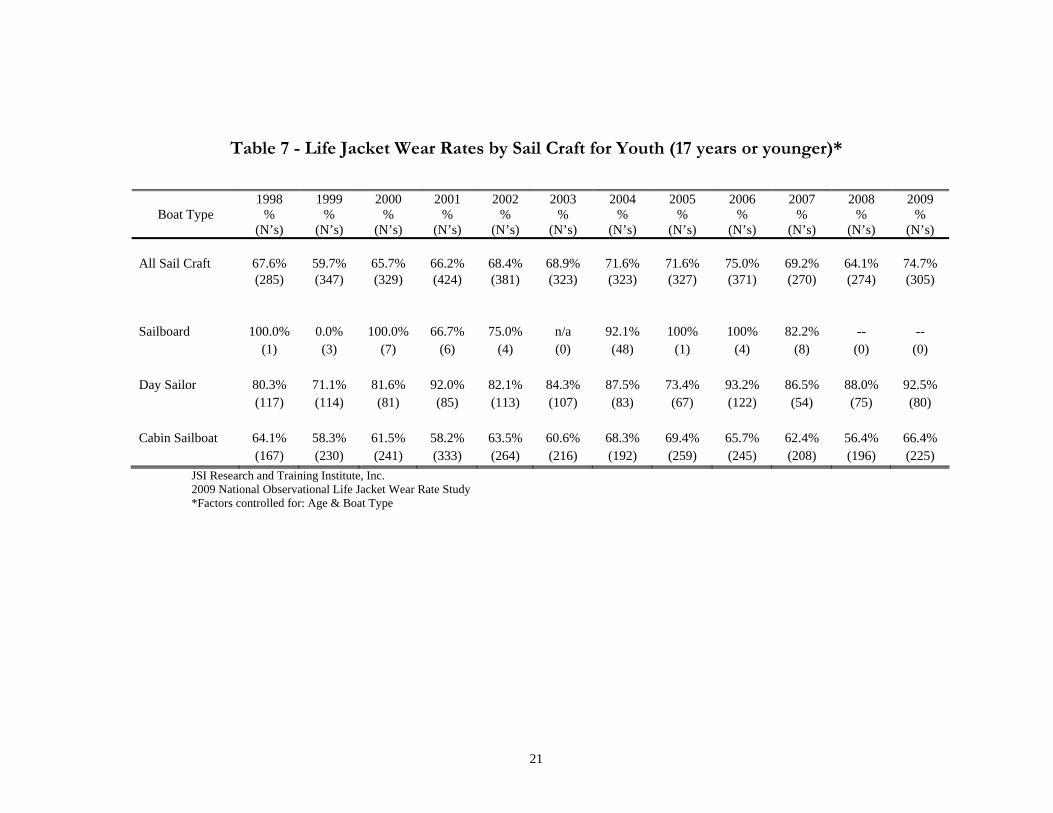
Sail Craft for Youth (17 years or younger). Figure J and Table 7 below show that the national average wear rates on all sailboats for youth increased from 64.1% in 2008 to 74.7% in 2009. However, relatively few youth are found on this type of craft and therefore fluctuations in rates should be interpreted cautiously.
Figure J – Youth Wear Rates for ALL Sail Craft*
JSI Research and Training Institute, Inc. 2009 National Observational Life Jacket Wear Rate Study *Factors controlled for: Age & Boat Type.
21
Table 7 - Life Jacket Wear Rates by Sail Craft for Youth (17 years or younger)*
Boat Type 1998
% (N’s)
1999 %
(N’s)
2000 %
(N’s)
2001 %
(N’s)
2002 %
(N’s)
2003 %
(N’s)
2004 %
(N’s)
2005 %
(N’s)
2006 %
(N’s)
2007 %
(N’s)
2008 %
(N’s)
2009 %
(N’s) All Sail Craft 67.6% 59.7% 65.7% 66.2% 68.4% 68.9% 71.6% 71.6% 75.0% 69.2% 64.1% 74.7% (285) (347) (329) (424) (381) (323) (323) (327) (371) (270) (274) (305) Sailboard 100.0% 0.0% 100.0% 66.7% 75.0% n/a 92.1% 100% 100% 82.2% -- -- (1) (3) (7) (6) (4) (0) (48) (1) (4) (8) (0) (0) Day Sailor 80.3% 71.1% 81.6% 92.0% 82.1% 84.3% 87.5% 73.4% 93.2% 86.5% 88.0% 92.5% (117) (114) (81) (85) (113) (107) (83) (67) (122) (54) (75) (80) Cabin Sailboat 64.1% 58.3% 61.5% 58.2% 63.5% 60.6% 68.3% 69.4% 65.7% 62.4% 56.4% 66.4% (167) (230) (241) (333) (264) (216) (192) (259) (245) (208) (196) (225)
JSI Research and Training Institute, Inc. 2009 National Observational Life Jacket Wear Rate Study *Factors controlled for: Age & Boat Type

22
IV. CONCLUSIONS FOR LIFE JACKET WEAR RATES - NATIONAL TREND DATA 1998 TO 2009
This report includes observational data collected from 1998 to 2009. Trends in life jacket wear for types of boats and for various age groups were displayed. A summary of key findings are: 1. In 2009 adult day sailor wear rates increase to 61.7% which is more than a 100% increase since baseline rates of
27.7% in 1998. 2. The adult life jacket wear rate for all boats (excluding PWCs) is at its lowest point (8.1%) in twelve years of
observations, continuing a general slight downward shift of wear rates since 1998. 3. National, adult wear rates continue to be high in boats that are perceived to be easier to capsize or for which
there is mandated wear – PWCs, kayaks, inflatable/rafts, and day sailors. 4. Wear rates on PWCs for both adults and children are almost universal. 5. For all youth combined (17 years or younger), wear rates increased almost 20% over the twelve years of
observations. In all likelihood this is both a reflection of changing legal mandates at the state and federal level as well as a demonstrated affect of targeted educational campaigns.
6. In 2009, increases for all youth were seen in skiffs and speedboats, the two most frequently used boats by youth.

23
V. APPENDIX: METHODS & DESCRIPTIVE
INFORMATION To provide reliable and valid indicators of changes in life jacket wear rates, it was essential for observation procedures to remain as close as possible to those used in previous years. The same states were observed for each of the twelve years of data collection efforts, over the same period of time. The vast majority of the sites in each of 30 states observed have remained the same for all twelve years. The following is a detailing of the methods used in all twelve years of data collection.
Time period - Observations were conducted during the summer months of each year, beginning the weekend of July 4th and ending on Labor Day weekend.
Site selection - A total of 30 states were chosen in which to conduct observations. The states were originally selected by a stratified random sampling procedure. Approximately three-fourths of the coastal states (20 out of 26 states) were chosen, and approximately one-half of the inland states (10 out of 24) were selected. Four sites from each state were visited, except in California, where eight sites were observed due to the size of the state. The 124 sites represented a wide range of water venues including lakes, rivers, harbors and bays, and intra-coastal waterways. The sites were selected based on consultations with local offices of the USCG, members of the local Coast Guard Auxiliary or Power Squadron, and state boating or fishing law enforcement agencies. Sites were selected to roughly represent a variety of available boating venues in the state, as well as their proximity to one another to allow for relatively short travel time between sites. In addition, sites needed to have suitable shore-based viewing locations from which observations of life jacket wear could be made using high-powered binoculars.
Observational procedures - Observations were conducted for four-hour periods either in the morning or the afternoon of a Saturday or Sunday. The goal was to observe as many boats as possible during a four-hour time frame. Viewing locations were on shore at a narrowing, bridge, or near a marina to facilitate observations. Two-person teams observed boating activity. One team member made the observations using high-powered binoculars and called out the information, which was then recorded on observation forms by the second team member. Team members alternated responsibilities frequently to ward off fatigue. In addition to recording information on boating activity and life jacket wear, observers recorded data about the site. This included information on weather and water conditions. JSI project staff trained the observers during two half-day sessions. The first half-day training consisted of reviewing the observation manual, observation forms, and required equipment. The observation manual contained procedures, definitions, and pictures of various types of boats to facilitate consistent classification by the observers. The second half-day of training allowed observation team members an opportunity to practice using the required equipment and observation forms with the assistance and guidance of a JSI project staff member.

24
Observation Forms - There were two observation forms designed. The first was the boat observation form, which was intended to record information about the boat and people on the boat. The second form was the site form, which was designed to record information about the site, weather and water conditions. The forms have remained the same from year to year, with the exception of two changes made in 1999 and one change made in 2004. These changes are discussed in detail below.
A) Boat Forms - Observers recorded the observation
time period in two hour blocks of time (7:59 or earlier, 8am – 9:59am, 10am -11:59pm, 12pm – 1:59pm, 2pm – 3:59pm, 4pm – 5:59pm, 6pm or later); the type of boat observed (skiff, speedboat/runabout, cabin cruiser, personal watercraft (PWC), pontoon boat, houseboat, sailboard, day sailor, cabin sailboat, rowboat, inflatable, canoe, kayak, and other); the type of propulsion (outboard engine, sterndrive/inboard engine, sail only, sail and auxiliary engine/motor, paddles/oars/manual, air thrust, and other); length of boat (under 16 feet, 16-20.9 feet, 21-25.9 feet, 26-45.9 and 46+ feet); type of operation (motoring, sailing, paddling, drifting, or at anchor); and activity engaged in (fishing, intent to fish, water-skiing, white-water, high speed racing, swimming, pleasure boating, and other). Observers also recorded operator/passenger status; gender (male, female, or unknown); age (under six, 6 - 12, 13 - 17, 18 - 64, 65 or older); life jacket wear (wearing or not wearing); life jacket type (traditional=old or inflatable=new). In addition, if the boat was involved in water-skiing, observers indicated which boaters were skiing at the time.
B) Site Forms - At each site, the observers recorded the beginning time and ending time of the observation period, water type (lake, river, harbor/bay, Great Lake, intra-coastal waterway) and water temperature. The following environmental factors
were measured by observers at each two hour time block during the observation period: air temperature; wind speed; wave height (less than six inches, six inches up to two feet, or over two feet); weather (sunny, partly cloudy, cloudy, raining, or stormy); and visibility (good, fair, or poor).
Over the past twelve years of observations only three categories of information have changed. In 1999, the original 6 to 17 year old age category was divided into a 6 to 12 year old group and a 13 to 17 year old group. Also in 1999, the boat category of canoes/kayaks was separated to record canoes and kayaks individually. In this report, life jacket wear rates are reported for both the combined and separated categories of age and canoes and kayaks. Finally, in 2004 the USCG requested that JSI breakout the boat size categories from three (under 16 feet, 16-25 feet and over 26 feet) to four categories (under 16 feet, 16-20 feet, 21-25 feet and over 26 feet). Observations made in 2004 - 2009 are the only years to record observations using the expanded boat size categories.

25
2009 Boat Form

26
**Actual form provides 3 blocks to record Weather Observations across the 4 hours of data collection
27
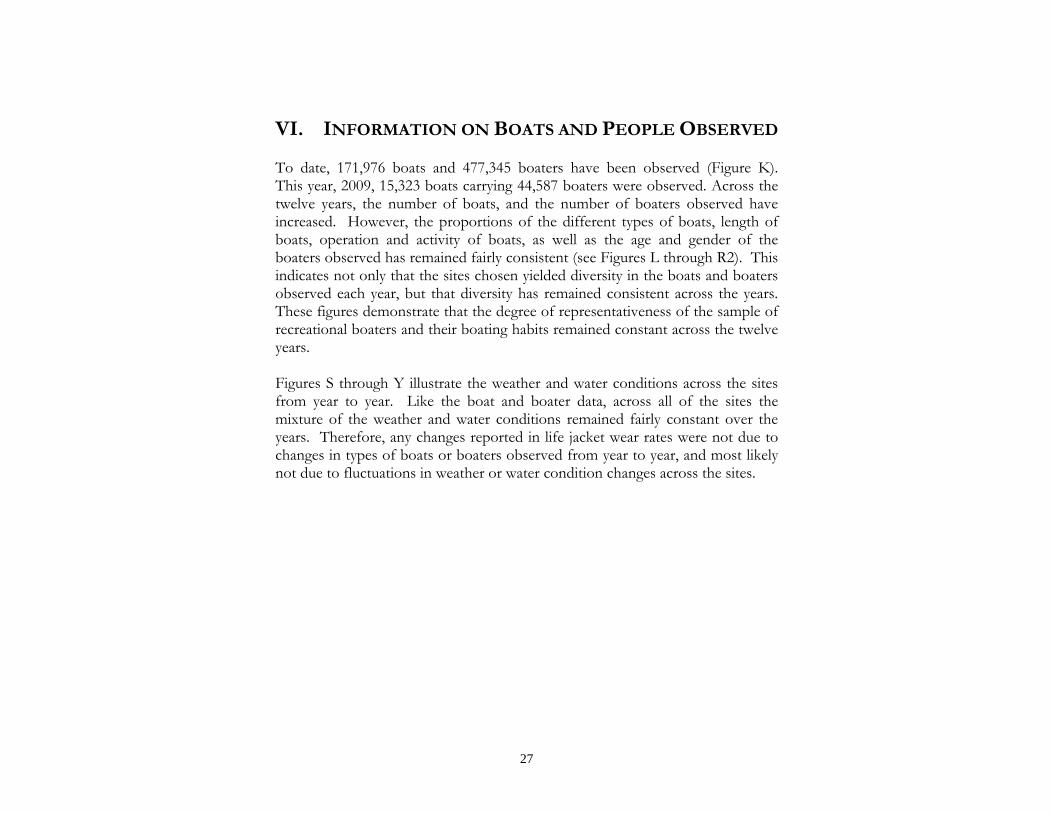
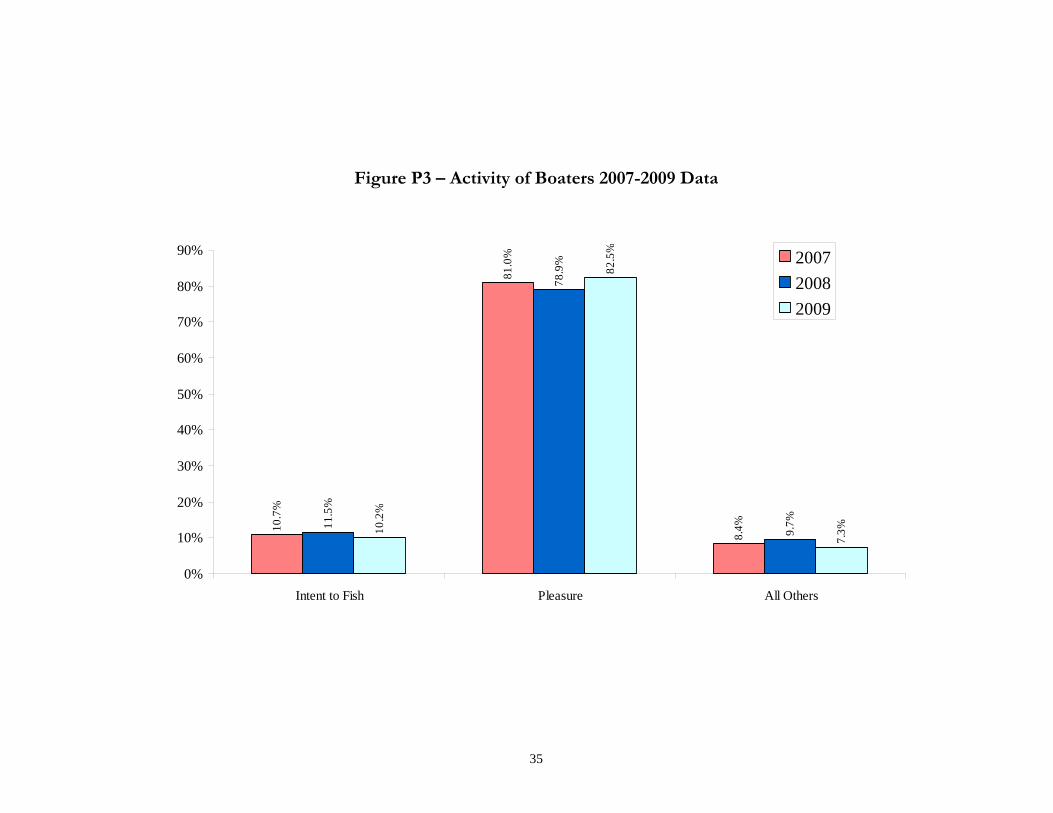
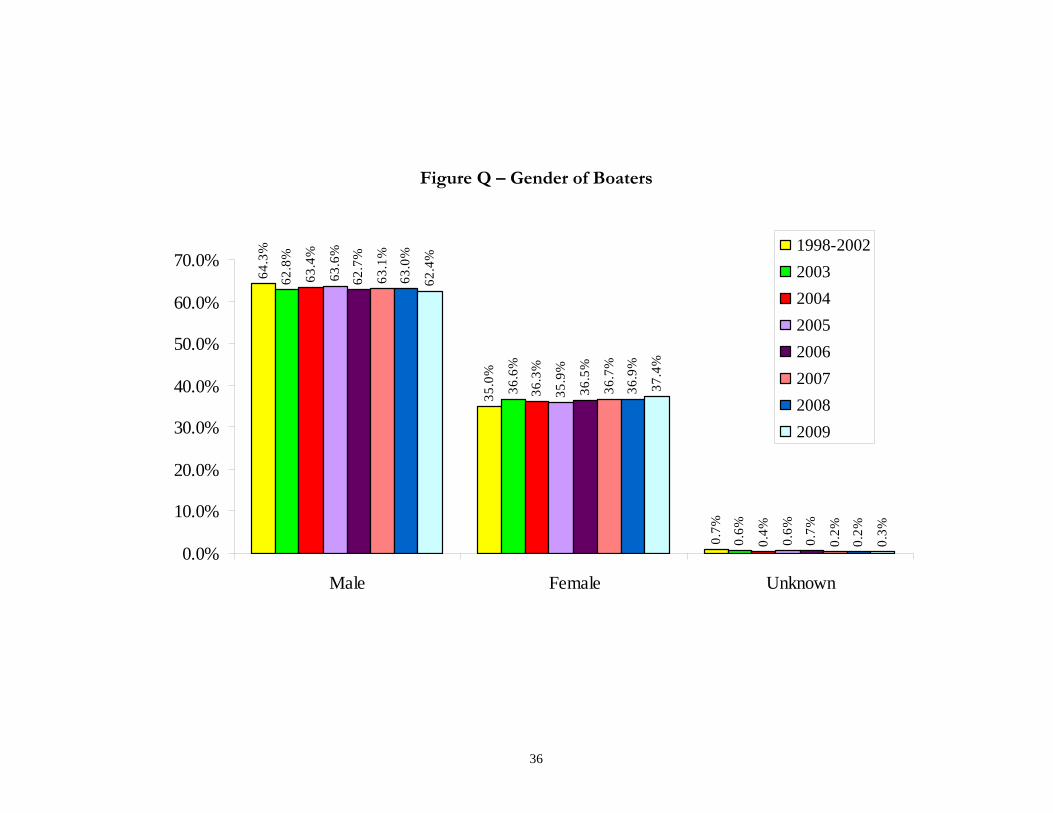
VI. INFORMATION ON BOATS AND PEOPLE OBSERVED
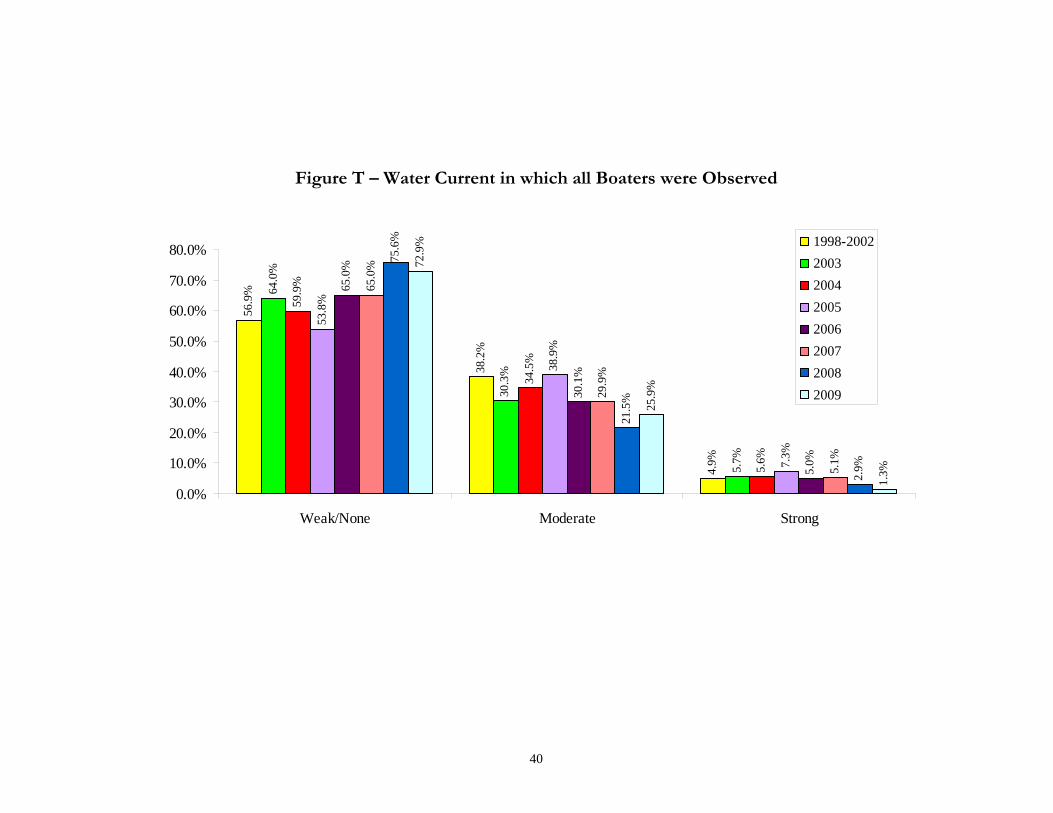
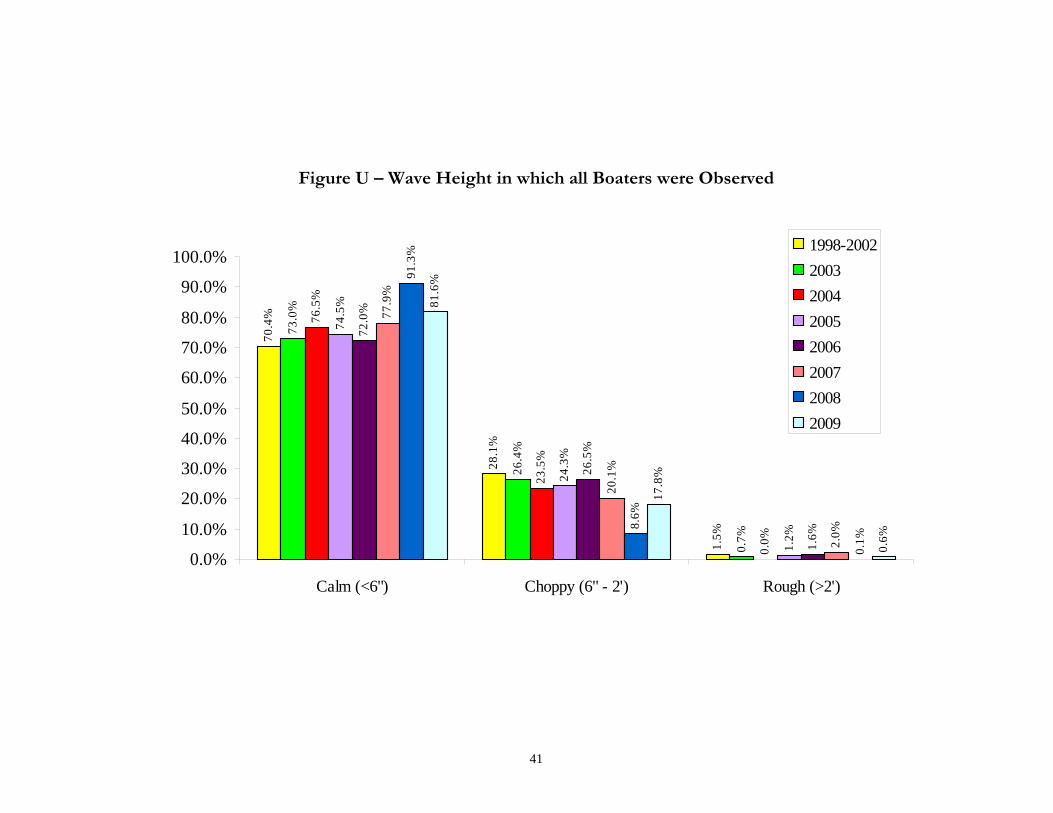
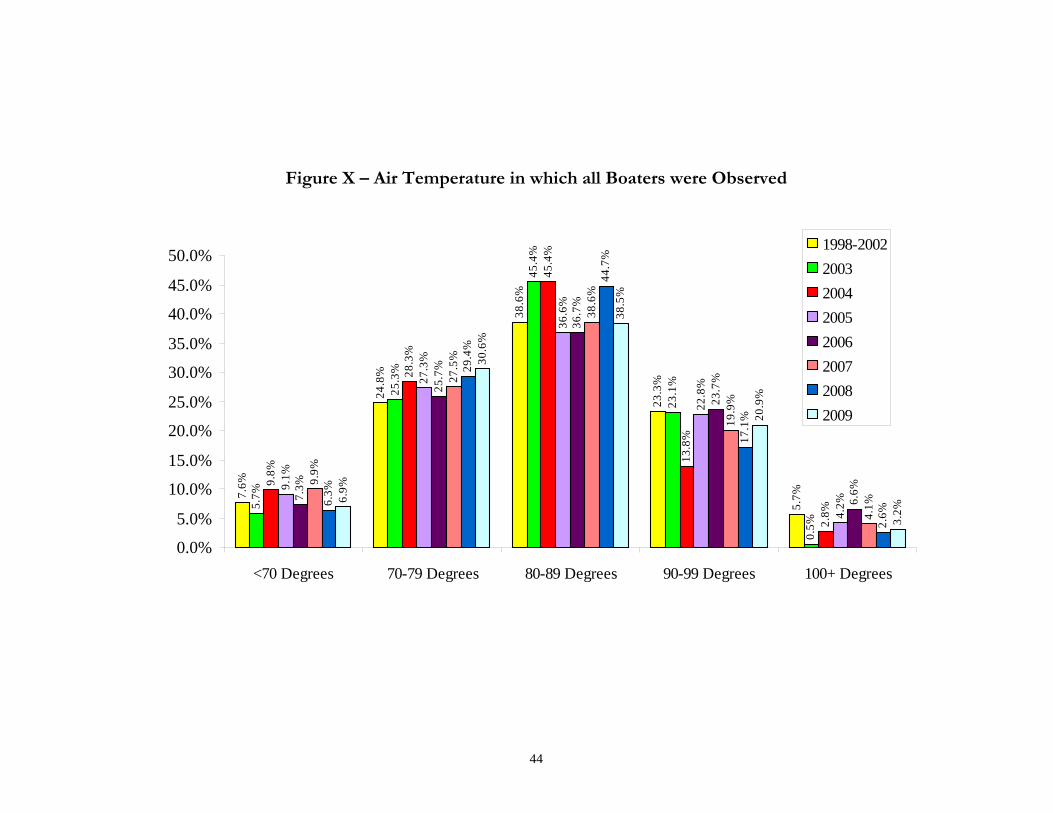
To date, 171,976 boats and 477,345 boaters have been observed (Figure K). This year, 2009, 15,323 boats carrying 44,587 boaters were observed. Across the twelve years, the number of boats, and the number of boaters observed have increased. However, the proportions of the different types of boats, length of boats, operation and activity of boats, as well as the age and gender of the boaters observed has remained fairly consistent (see Figures L through R2). This indicates not only that the sites chosen yielded diversity in the boats and boaters observed each year, but that diversity has remained consistent across the years. These figures demonstrate that the degree of representativeness of the sample of recreational boaters and their boating habits remained constant across the twelve years. Figures S through Y illustrate the weather and water conditions across the sites from year to year. Like the boat and boater data, across all of the sites the mixture of the weather and water conditions remained fairly constant over the years. Therefore, any changes reported in life jacket wear rates were not due to changes in types of boats or boaters observed from year to year, and most likely not due to fluctuations in weather or water condition changes across the sites.

28
Figure K – Number of Boats and People
14,0
70
37,9
60
13,9
24
38,4
74
15,4
42
43,3
24
14,0
87
39,3
30
13,9
79
39,1
22
14,5
67
41,9
78
14,3
06
40,7
31
15,3
23
44,5
87
0
5,000
10,000
15,000
20,000
25,000
30,000
35,000
40,000
45,000
50,000
Boats People
1998-2002: 5yr average2003200420052006200720082009

29
Figure L – Types of Boats
79.6
%
9.9% 10.4
%
73.0
%
7.8% 9.3%
81.4
%
10.2
%
8.4%
82.3
%
9.0%
8.8%
82.2
%
9.4%
8.4%
81.4
%
7.8% 10
.8%
83.7
%
8.5%
7.8%
82.7
%
8.8%
8.6%
0.0%
10.0%
20.0%
30.0%
40.0%
50.0%
60.0%
70.0%
80.0%
90.0%
Powerboats Sailboats Other
1998-20022003200420052006200720082009

30
Figure M – Length of Boats
36.6
%
49.4
%
14.0
%
36.2
%
51.2
%
12.6
%
26.1
%
62.6
%
11.3
%
29.7
%
61.0
%
9.3%
32.6
%
55.8
%
11.6
%
26.0
%
60.3
%
13.7
%
26.8
%
60.7
%
12.5
%
25.9
%
59.3
%
14.7
%
0.0%
10.0%
20.0%
30.0%
40.0%
50.0%
60.0%
70.0%
Under 16ft 16-25ft Over 26ft
1998-20022003200420052006200720082009

31
Figure N – Length of Boats 2004-2009 Data Only
26.1
%
44.7
%
18.0
%
11.3
%
29.7
%
43.5
%
17.6
%
9.3%
32.6
% 36.3
%
19.5
%
11.6
%
26.0
%
38.2
%
22.1
%
13.7
%
26.7
%
37.1
%
23.6
%
12.5
%
25.9
%
34.7
%
24.6
%
14.7
%
0.0%
5.0%
10.0%
15.0%
20.0%
25.0%
30.0%
35.0%
40.0%
45.0%
50.0%
Under 16ft 16-20 ft* 21-25 ft* Over 26ft
200420052006200720082009

32
Figure O – Operation of Boats
80.6
%
5.4% 9.
2%
3.7%
1.0%
83.4
%
5.0% 7.
3%
3.5%
0.9%
83.9
%
5.7% 6.7%
3.0%
0.7%
82.8
%
4.8% 7.
4%
3.9%
1.1%
84.3
%
5.2% 6.9%
2.8%
0.8%
84.9
%
3.8% 9.
1%
1.6%
0.6%
84.9
%
4.5% 7.
5%
2.5%
0.7%
84.2
%
4.7% 8.
4%
2.1%
0.6%
0.0%
10.0%
20.0%
30.0%
40.0%
50.0%
60.0%
70.0%
80.0%
90.0%
Motoring Sailing Rowing/Paddling Drifting Anchored
1998-20022003200420052006200720082009

33
Figure P1 – Activity of Boaters—ALL YEARS*
86.0
%
13.8
%
86.5
%
12.1
%
91.8
%
8.2%
88.6
%
11.4
%
86.3
%
12.3
%
91.7
%
8.4%
90.4
%
9.7%
92.7
%
7.3%
0%
10%
20%
30%
40%
50%
60%
70%
80%
90%
100%
Pleasure/Intent to Fish All Other
1998-20022003200420052006200720082009
*Prior to 2007, Intent to Fish & Pleasure were a combined category.

34
Figure P2 – Activity of Boaters Detailed Breakdown of ALL OTHER Category from Figure P1
4.0%
5.4%
0.7%
1.9%
0.4%
0.8%
0.6%
2.8%
5.3%
0.7%
2.0%
0.2%
0.8%
0.3%
2.4%
2.9%
0.8%
1.7%
0.2%
0.0%
0.3%
2.1%
3.9%
1.2%
3.1%
0.4% 0.5%
0.3%
2.6%
5.0%
1.1%
2.4%
0.3%
0.6%
0.2%
1.4%
3.3%
1.0%
2.3%
0.0% 0.
2%
0.1%
1.7%
2.5%
1.5%
3.0%
0.1%
0.5%
0.4%
1.7%
1.1% 1.
3%
2.8%
0.1% 0.
3%
0.0%
0%
1%
2%
3%
4%
5%
6%
Fishing Racing/HighSpeed
Water-skiing Towing Water-skiers*
White Water Swimming Other
1998-20022003200420052006200720082009
*The activity “Towing Water-skiers “ indicates that these boaters were passengers in a boat towing water-skiers or other towing activities. Likewise, “water-skiing” includes all towing sports. Label changed in April 2010.
35
Figure P3 – Activity of Boaters 2007-2009 Data
10.7
%
81.0
%
8.4%11
.5%
78.9
%
9.7%10.2
%
82.5
%
7.3%
0%
10%
20%
30%
40%
50%
60%
70%
80%
90%
Intent to Fish Pleasure All Others
200720082009
36
Figure Q – Gender of Boaters
64.3
%
35.0
%
0.7%
62.8
%
36.6
%
0.6%
63.4
%
36.3
%
0.4%
63.6
%
35.9
%
0.6%
62.7
%
36.5
%
0.7%
63.1
%
36.7
%
0.2%
63.0
%
36.9
%
0.2%
62.4
%
37.4
%
0.3%
0.0%
10.0%
20.0%
30.0%
40.0%
50.0%
60.0%
70.0%
Male Female Unknown
1998-20022003200420052006200720082009

37
Figure R1 – Age of Boaters
14.5
%
85.5
%
17.5
%
82.6
%
15.3
%
84.7
%
15.7
%
84.3
%
16.3
%
83.7
%
16.7
%
83.4
%
16.5
%
83.5
%
15.0
%
85.1
%
0.0%
10.0%
20.0%
30.0%
40.0%
50.0%
60.0%
70.0%
80.0%
90.0%
All Youth (0-17 years) All Adults (18-65+ years)
1998-2002
2003
2004
2005
2006
2007
2008
2009

38
Figure R2 – Age of Youth Boaters
12.9
%
42.5
%
44.6
%
10.5
%
42.1
%
47.5
%
11.9
%
44.3
%
43.9
%
12.3
%
43.9
%
43.9
%
15.4
%
40.6
% 43.9
%
13.8
%
42.7
%
43.5
%
14.7
%
41.2
% 44.2
%
13.4
%
44.9
%
41.8
%
0.0%
5.0%
10.0%
15.0%
20.0%
25.0%
30.0%
35.0%
40.0%
45.0%
50.0%
0-5 years 6-12 years 13-17 years
1998-2002
2003
2004
2005
2006
2007
2008
2009
39
Figure S – Water Temperature in which all Boaters were Observed
4.8%
15.7
%
39.8
%
39.8
%
2.3%
11.9
%
46.7
%
39.2
%
6.9%
14.4
%
45.1
%
33.7
%
5.9%
12.5
%
31.9
%
49.8
%
4.5%
14.3
%
41.7
%
39.5
%
3.1%
13.9
%
40.6
%
42.5
%
5.0%
14.2
%
34.7
%
46.1
%
3.7%
9.7%
48.7
%
38.0
%
0.0%
10.0%
20.0%
30.0%
40.0%
50.0%
60.0%
<60 Degrees 60-69 Degrees 70-79 Degrees 80+ Degrees
1998-20022003200420052006200720082009
40
Figure T – Water Current in which all Boaters were Observed
56.9
%
38.2
%
4.9%
64.0
%
30.3
%
5.7%
59.9
%
34.5
%
5.6%
53.8
%
38.9
%
7.3%
65.0
%
30.1
%
5.0%
65.0
%
29.9
%
5.1%
75.6
%
21.5
%
2.9%
72.9
%
25.9
%
1.3%
0.0%
10.0%
20.0%
30.0%
40.0%
50.0%
60.0%
70.0%
80.0%
Weak/None Moderate Strong
1998-20022003200420052006200720082009
41
Figure U – Wave Height in which all Boaters were Observed
70.4
%
28.1
%
1.5%
73.0
%
26.4
%
0.7%
76.5
%
23.5
%
0.0%
74.5
%
24.3
%
1.2%
72.0
%
26.5
%
1.6%
77.9
%
20.1
%
2.0%
91.3
%
8.6%
0.1%
81.6
%
17.8
%
0.6%
0.0%
10.0%
20.0%
30.0%
40.0%
50.0%
60.0%
70.0%
80.0%
90.0%
100.0%
Calm (<6") Choppy (6" - 2') Rough (>2')
1998-20022003200420052006200720082009

42
Figure V – Visibility in which all Boaters were Observed 90
.9%
9.1%
93.8
%
6.2%
87.2
%
12.8
%
94.2
%
5.8%
89.1
%
10.9
%
94.4
%
5.6%
90.8
%
9.2%
94.6
%
5.5%
0%
10%
20%
30%
40%
50%
60%
70%
80%
90%
100%
Good Fair/Poor
1998-20022003200420052006200720082009

43
Figure W – Weather in which all Boaters were Observed
54.9
%
30.2
%
12.2
%
2.6%
63.1
%
27.1
%
9.7%
0.1%
49.2
%
31.3
%
15.1
%
4.4%
58.5
%
24.8
%
13.4
%
3.3%
53.7
%
30.0
%
13.7
%
2.6%
58.8
%
30.2
%
9.0%
2.0%
54.2
%
31.5
%
12.5
%
1.9%
61.9
%
22.1
%
13.3
%
2.8%
0%
10%
20%
30%
40%
50%
60%
70%
Sunny Partly Cloudy Cloudy Raining/Stormy
1998-20022003200420052006200720082009
44
Figure X – Air Temperature in which all Boaters were Observed
7.6%
24.8
%
38.6
%
23.3
%
5.7%
5.7%
25.3
%
45.4
%
23.1
%
0.5%
9.8%
28.3
%
45.4
%
13.8
%
2.8%
9.1%
27.3
%
36.6
%
22.8
%
4.2%
7.3%
25.7
%
36.7
%
23.7
%
6.6%
9.9%
27.5
%
38.6
%
19.9
%
4.1%6.
3%
29.4
%
44.7
%
17.1
%
2.6%
6.9%
30.6
%
38.5
%
20.9
%
3.2%
0.0%
5.0%
10.0%
15.0%
20.0%
25.0%
30.0%
35.0%
40.0%
45.0%
50.0%
<70 Degrees 70-79 Degrees 80-89 Degrees 90-99 Degrees 100+ Degrees
1998-20022003200420052006200720082009

45
Figure Y – Wind Speed in which all Boaters were Observed
63.4
%
27.4
%
9.2%
76.3
%
21.2
%
2.5%
68.9
%
28.4
%
2.7%
67.3
%
29.4
%
3.3%
72.4
%
25.8
%
1.8%
66.5
%
25.8
%
7.8%
81.4
%
18.3
%
0.4%
76.5
%
22.6
%
0.9%
0.0%
10.0%
20.0%
30.0%
40.0%
50.0%
60.0%
70.0%
80.0%
90.0%
<5 Knots 5 - 9.9 Knots 10 Knots or higher
1998-20022003200420052006200720082009