Embed Size (px)
Citation preview

2010AnnuAl REpoRt


3
Table of conTenTS4
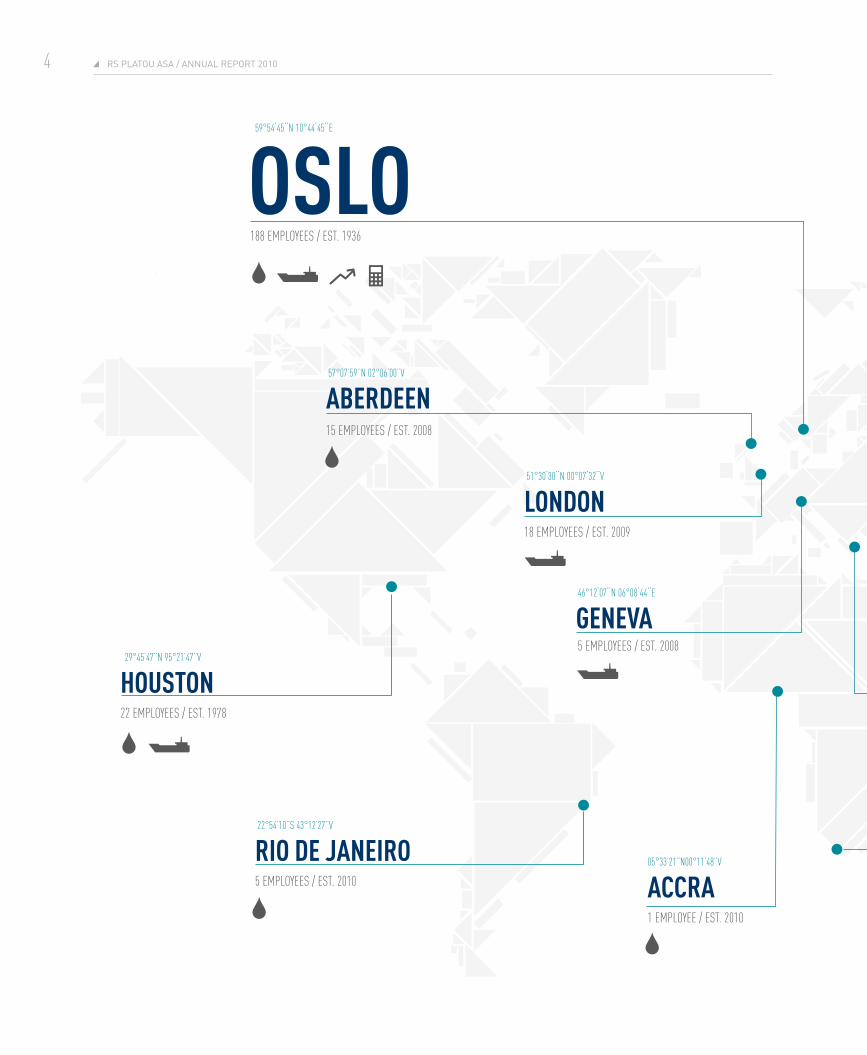
Global Presence
6Letter from the Chairman
8Key Financial Figures – RS Platou Group
10History – RS Platou Group
14Overview of our Business Areas
24Corporate Governance
32Board of Director’s Report for 2010
38Consolidated Financial Statements
p. 48 - Notes to the Consolidated Financial Statements
94Accounts for RS Platou ASA
p. 99 - Notes to the Accounts for RS Platou ASA
111Auditor’s Report for 2010
RS Platou aSa / annual RePoRt 20104
59°54’45’’n 10°44’45’’e
OslO188 employeeS / eST. 1936
51°30’30’’n 00°07’32’’V
lONDON18 employeeS / eST. 2009
57°07’59’’n 02°06’00’’V
AberDeeN15 employeeS / eST. 2008
29°45’47’’n 95°21’47’’V
HOUsTON22 employeeS / eST. 1978
22°54’10’’S 43°12’27’’V
rIO De JANeIrO5 employeeS / eST. 2010
05°33’21’’n00°11’48’’V
ACCrA1 employee / eST. 2010
46°12’07’’n 06°08’44’’e
GeNeVA5 employeeS / eST. 2008

5GloBal PReSenCe
projecT finance inVeSTmenT banKinG ShipbroKinG offShore
Global preSenceThe world accordinG To rS plaTou
31°13’19’’n 121°27’29’’e
sHANGHAI4 employeeS / eST. 2007
33°55’0’’S 18°25’0’’e
CApe TOwN3 employeeS / eST. 2011
01°17’22’’n 103°51’00’’e
sINGApOre 62 employeeS / eST. 1989
55°45’07’’n 37°36’56’’e
MOsCOw5 employeeS / eST. 2004
37°56’50’’n 23°38’13’’e
pIrAeUs10 employeeS / eST. 2009

RS Platou aSa / annual RePoRt 20106
…SinCe 2003, BuSineSS Booked haS GRown 5-fold and headCount haS Gone fRom aBout 100 to aBout 350 emPloyeeS. almoSt half of
2010 RevenueS and BuSineSS Booked Stemmed fRom oPeRationS that have Been added to the “Platou PoRtfolio” SinCe 2003.

7letteR fRom the ChaiRman
and headcount has gone from about 100 to about 350 employees. Almost half of 2010 revenues and business booked stemmed from operations that have been added to the “Platou portfolio” since 2003.
After 75 years of operations, RS Platou has a rich history and is recognized as a global industry leader, and the Board of Directors and senior management are energized and excited about the group prospects. We are in the early stages of globally reaping the full benefit of synergies from our shipping and offshore broking, finance and investment banking operations. This also goes for continued expansion of the global footprint, where enhanced utilization of our industry expertise and investment placing power should create great values for our customers.
On behalf of the company’s Board of Directors, I would like to extend my gratitude to our clients, employees and shareholders for their continued support, hard work and loyalty. We look forward to working with you and improving our services in 2011.
Yours sincerely,
Ragnar HornChairman
While we were positively surprised by the strength of the economic recovery in 2010, the year offered extraordinary events like the Deepwater Horizon oil spill in the Gulf of Mexico and the “flying ash” from Iceland putting pressure on the world financial markets. In 2011, this “trend” has continued with various natural disasters, the Fukushima nuclear accident and increasing turmoil in the Middle East. However, none of these events have been able to suppress a buoyant world economy and the general optimism of the financial markets. In this context, RS Platou has once again been able to “seize the moment” and is, in the opinion of the Board of Directors, better positioned than ever to capitalize on the prevailing market conditions.
A loss in 2009, due to write-downs and restructuring expenses in RS Platou Markets, was turned around into net income of MNOK 125 in 2010. Along with revenue growth of 19 % and commission reserves approaching record levels, we must be quite satisfied with our overall performance.
The RS Platou Group aspires to be the most reliable and attractive partner for international shipping and offshore companies seeking high value-added brokerage and investment banking services. This requires absolute commitment on our part to invest in the develop-ment and growth of our organization as well as a continuous focus on expansion of our global footprint. Even though this is an ongoing journey, we are quite thrilled about the contributions to date made by various past “counter-cyclical” investments like RS Platou London, RS Platou Markets, The Stewart Group as well as expan-sion of various regional offices.
Today, RS Platou is a very different company compared to what it was a few years ago. Since 2003, business booked has grown 5-fold
GraSpinG opporTuniTieS
leTTer from The chairman

-
RS Platou aSa / annual RePoRt 20108
Key financial fiGureSFigures in NOK 1,000
Income statement
Revenues - Shipbroking - Offshore - Markets - Finance - UnallocatedeBIt before bonus paymentsBonuseseBIt after bonus paymentsnet financial itemsProfit before taxesnet profit - net profit for equity holders of Parent - net profit for non-controlling intereststotal comPRehensIve Income
Balance sheet
non-current assetscurrent assetstotal equitylong-term liabilitiescurrent liabilitiestotal equIty and lIaBIlItIes
Key fIguRes
equity ratio (%) Book value per share (noK) dividend per share (noK)
PRofItaBIlIty
eBIt margin after bonus payments (%)Return on equity (%) ordinary & diluted earnings per share (noK) no. of shares outstanding at 31.12 (in 1,000)Weighted average no. of shares outstanding (in 1,000)
oRganIsatIon
no. of employees at 31.12
563 403 323 825 172 008
- 67 570
- 374 733192 398
182 335 83 419
265 754 213 262 187 071
26 191 175 589
41 904 398 578 231 982
18 321 190 179 440 182
52,7 %5,92,0
151
32,4 %116,7 %
5,5 34 484 33 872
749 634 439 801 208 484
- 101 349
- 526 242 262 008
264 234 31 879
296 113 224 287 191 749
32 538 222 874
58 208 441 503 255 922
21 706 222 083 499 711
51,2 %6,45,1
192
35,2 %91,1 %
5,6 34 021 34 021
919 813 403 683 433 545
6 749 81 584 (5 748)
580 717 251 377
329 340(106 120) 223 220 162 117 146 250
15 867 175 354
275 470 1 314 023
286 593 56 364
1 246 536 1 589 492
18,0 %5,83,0
298
35,8 %70,5 %
4,3 34 021 33 809
837 300 313 980 360 843 108 703
63 635 (9 860)
363 840 271 736 92 103
(138 974) (46 871) (40 907) (12 244) (28 663)
(65 194)
282 630 602 180 206 648
96 950 581 212 884 810
23,4 %4,51,0
312
11,0 %-6,4 %
(0,3) 40 688 35 389
994 117 346 151 356 998 232 998
65 889 (7 918)
500 596276 074
224 522 (43 954)
180 568 120 198 102 075
18 123 121 403
249 663 633 852 285 834 124 859 472 822 883 515
32,4 %6,21,5
346
22,6 %46,6 %
2,5 40 971 40 495
2010 2009 2008 2007 2006

-
key finanCial fiGuReS 9
reVeNUe DeVelOpMeNT
reTUrN ON eqUITy
ebIT
eps ordinary & diluTed
ShiPBRokinG offShoRe inveStment BankinG finanCe unalloCated RevenueS (nok 1,00) eBit maRGin afteR BonuS PaymentS (%)
Roe (%)ePS, oRdinaRy & diluted in nok (%)
20062006
2006 2006
400 000
300 000
200 000
100 000
40 %
30 %
20 %
10 %
8
6
4
2
1 000 000
800 000
600 000
400 000
200 000
125
100
75
50
25
20072007
2007 2007
20082008
2008 2008
20092009
2009 2009
20102010
2010 2010
bUsINess bOOkeD
2006
2 000 000
1 500 000
1 000 000
500 000
2007 2008 2009 2010
fOrwArD bOOk
2006
1 250 000
1 000 000
750 000
500 000
250 000
2007 2008 2009 2010

RS Platou aSa / annual RePoRt 201010
hiSTory–rS plaTou Group expandinG wiTh The marKeTS
11hiStoRy – RS Platou GRouP
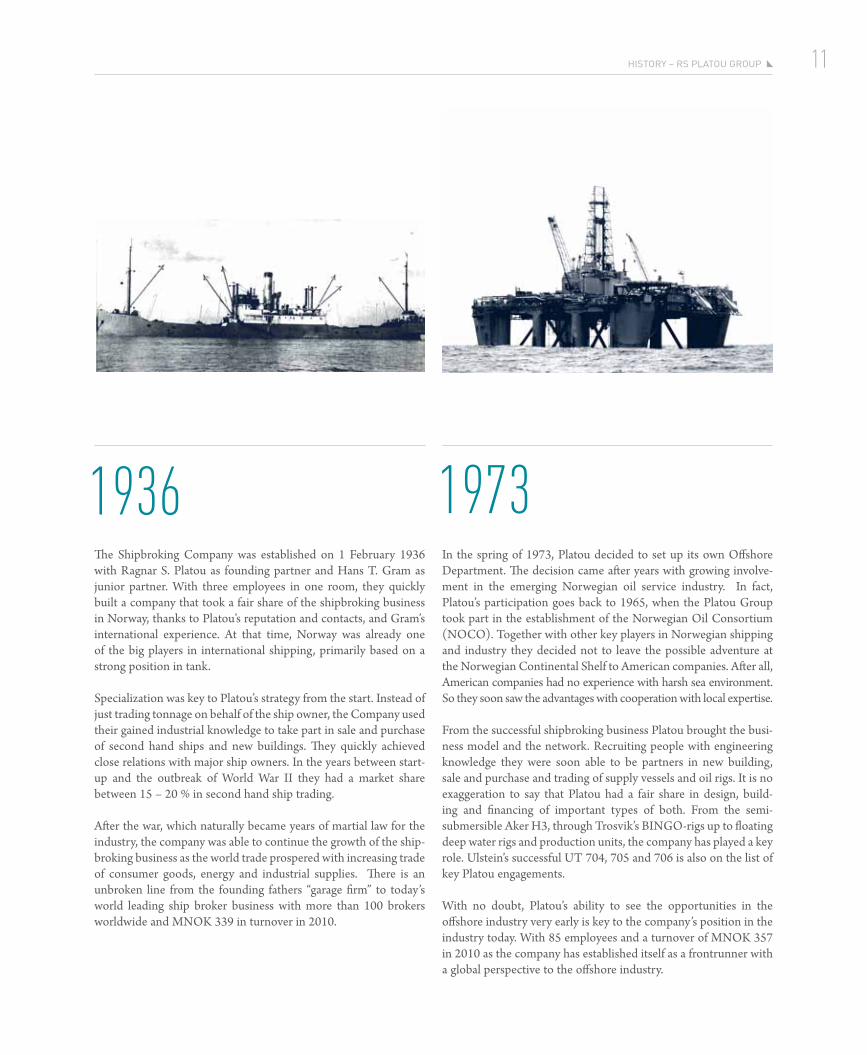
1936 1973The Shipbroking Company was established on 1 February 1936 with Ragnar S. Platou as founding partner and Hans T. Gram as junior partner. With three employees in one room, they quickly built a company that took a fair share of the shipbroking business in Norway, thanks to Platou’s reputation and contacts, and Gram’s international experience. At that time, Norway was already one of the big players in international shipping, primarily based on a strong position in tank.
Specialization was key to Platou’s strategy from the start. Instead of just trading tonnage on behalf of the ship owner, the Company used their gained industrial knowledge to take part in sale and purchase of second hand ships and new buildings. They quickly achieved close relations with major ship owners. In the years between start-up and the outbreak of World War II they had a market share between 15 – 20 % in second hand ship trading.
After the war, which naturally became years of martial law for the industry, the company was able to continue the growth of the ship-broking business as the world trade prospered with increasing trade of consumer goods, energy and industrial supplies. There is an unbroken line from the founding fathers “garage firm” to today’s world leading ship broker business with more than 100 brokers worldwide and MNOK 339 in turnover in 2010.
In the spring of 1973, Platou decided to set up its own Offshore Department. The decision came after years with growing involve-ment in the emerging Norwegian oil service industry. In fact, Platou’s participation goes back to 1965, when the Platou Group took part in the establishment of the Norwegian Oil Consortium (NOCO). Together with other key players in Norwegian shipping and industry they decided not to leave the possible adventure at the Norwegian Continental Shelf to American companies. After all, American companies had no experience with harsh sea environment. So they soon saw the advantages with cooperation with local expertise.
From the successful shipbroking business Platou brought the busi-ness model and the network. Recruiting people with engineering knowledge they were soon able to be partners in new building, sale and purchase and trading of supply vessels and oil rigs. It is no exaggeration to say that Platou had a fair share in design, build-ing and financing of important types of both. From the semi-submersible Aker H3, through Trosvik’s BINGO-rigs up to floating deep water rigs and production units, the company has played a key role. Ulstein’s successful UT 704, 705 and 706 is also on the list of key Platou engagements.
With no doubt, Platou’s ability to see the opportunities in the offshore industry very early is key to the company’s position in the industry today. With 85 employees and a turnover of MNOK 357 in 2010 as the company has established itself as a front runner with a global perspective to the offshore industry.

RS Platou aSa / annual RePoRt 201012
1987
1989This year the Singapore office was opened. With 62 employees and a fully diversified business covering all the business areas of Platou, the office is a strong symbol of the true globalization that has taken place in the company.
It was not the first international office in the company’s history. As early as in 1946 a sub-sidiary was set up in New York but was later sold to the local employees. To serve the oil industry better, Platou also established an office in Houston in 1978.
But the Singapore step was different. First, it recognized that sustainable business must
In 1987, the current CEO, Peter M. Anker, with some key partners, chaired a manage-ment buyout operation. Times had changed and the partnership structure had devel-oped as the most viable way for further suc-cess. As a result, 73 % of the shares in the company are now held by employees in the company, while the remaining shares are still with the founding families. This owner-ship model has been vital in attracting and keeping first class talents in the company, optimizing the age distribution among the partners by combining experience of sen-iority and aggressiveness of youth. In the modern competitive world, incentives that give a fair share of the values created over time are demanded by people that dedicate a substantial part of their lives to a business. Platou’s wish to invest in their people cre-ates also the necessary continuity needed for future sustainability. This ownership model is a fundamental part of the success story of Platou in modern times.
be local. Although modern communication makes the world a small place, people still prefer to do business with their neighbors. Hence, to be global you need to be local. Second, the office opening in Singapore was also a recognition of Asia as a major player in the future world.
Following Singapore, a handful of key local offices have been established. Rio de Ja-neiro, Accra, Geneva, Aberdeen, Moscow, Shanghai, Pireus and London is all up and running while Cape Town will be in busi-ness soon. This will surely not be the last piece in Platou’s global puzzle.

13
2004 2008RS Platou Finans was established in 2004. Through the company’s history, the ship & offshore broking business had been closely involved with the financial engineering needed to get the necessary funding for their customers. With the establishment of RS Platou Finans, the company took a formal step into this part of the balance sheet. The company is a specialist in develop ment of projects with limited partnership (KS/DIS). It cooperates with brokers, shipping banks and shipping owners worldwide and can offer clients a broad variety of projects.
In 2009, the division expanded with the establishment of RS Platou Real Estate focusing on structuring real estate projects and corporate finance related to the real estate sector. The two sister companies enjoys several synergies regarding project management and client preferences. Together RS Platou Finance and RS Platou Real Estate provide full scale services with-in project financing, corporate finance and corporate advisory as well as second-ary trading of shares and parts in limited liability project companies.
Following the history of service and geo-graphic expansion, RS Platou decided to acquire 50,01 % of Glitnir Securities AS in October 2008. It was a move desired for years and rendered possible by the overall global financial situation. For RS Platou, this move represented a major investment in the investment banking industry; a huge global industry with one of the greatest financial track records over the past decades. To make the acquisition a success it was important to implement a new strategy for RS Platou Markets and adjust the organization, both to gain control over costs and to lay the foundation for future value creation and profits.
RS Platou Markets changed its strategy in 2009 from being an investment bank with main focus on the retail market to become a corporate- and research driven investment bank with main focus on institutional and professional clients within the core areas of the RS Platou Group – off-shore, E&P and shipping in addition to sea-food where RS Platou Markets traditionally has had strong competence.
RS Platou Markets offers a wide range of services within equity sales and trading, fixed income, research and corporate finance to both domestic and foreign in-stitutional clients and investors. RS Platou Markets has currently approximately 95 employees worldwide and has a profes-sional environment with Norwegian and international competence and a clear strategy for further growth. RS Platou Markets also opened an office in Singapore in early 2009, in order to offer corporate financial advisory services to clients in the Asian shipping, oil service, offshore and E&P sectors. The subsidiary received their license to offer corporate finance advisory services during the year-end of 2010.
Through 75 years of steady business RS Platou has developed from a local ship broker in Norway to a global player; offering shipping and offshore customers a more or less complete range of commercial and financial services. But the goal remains the same: Create success for the customers in good and bad times.
hiStoRy – RS Platou GRouP

RS Platou aSa / annual RePoRt 201014
36%offShore
35%ShipbroKinG
23%inVeSTmenT banKinG
7%projecT finance
sHAre Of reVeNUes

kolumnetittel 15
oVerView of our buSineSS areaS

RS Platou aSa / annual RePoRt 201016
17BuSineSS aRea – ShiPBRokinG
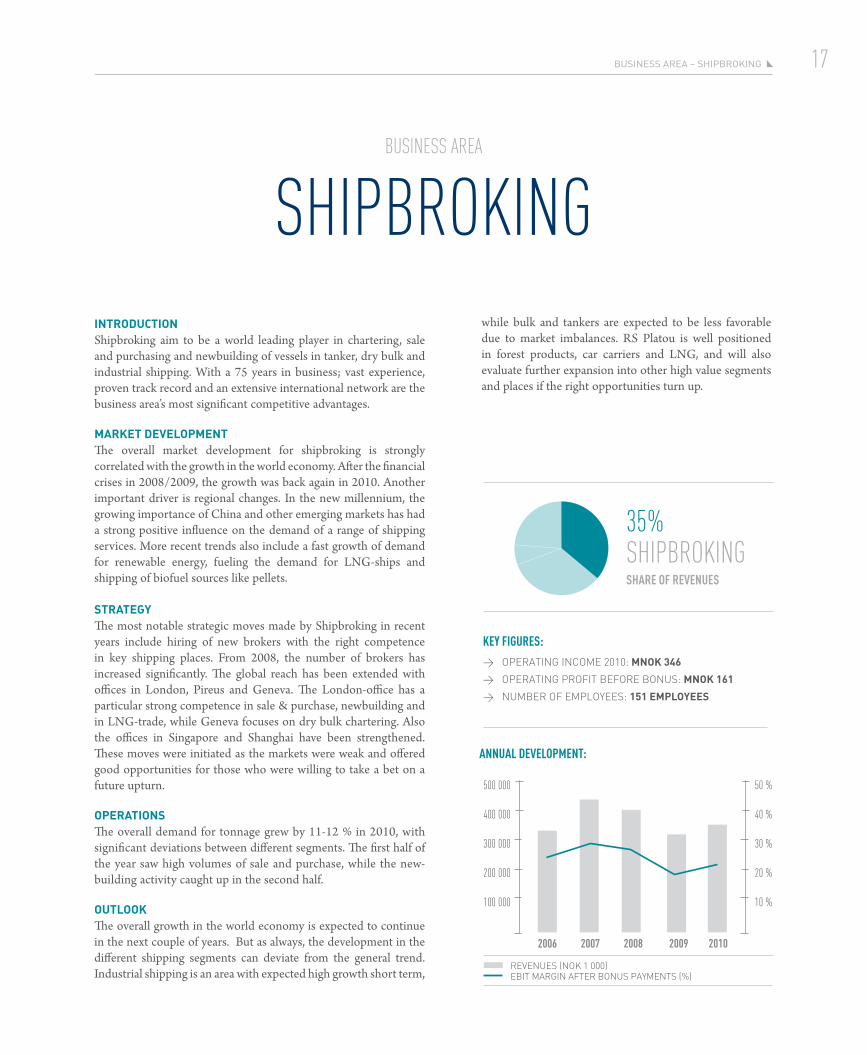
IntRoductIonShipbroking aim to be a world leading player in chartering, sale and purchasing and newbuilding of vessels in tanker, dry bulk and industrial shipping. With a 75 years in business; vast experience, proven track record and an extensive international network are the business area’s most significant competitive advantages.
maRKet develoPmentThe overall market development for shipbroking is strongly correlated with the growth in the world economy. After the financial crises in 2008/2009, the growth was back again in 2010. Another important driver is regional changes. In the new millennium, the growing importance of China and other emerging markets has had a strong positive influence on the demand of a range of shipping services. More recent trends also include a fast growth of demand for renewable energy, fueling the demand for LNG-ships and shipping of biofuel sources like pellets.
stRategyThe most notable strategic moves made by Shipbroking in recent years include hiring of new brokers with the right competence in key shipping places. From 2008, the number of brokers has increased significantly. The global reach has been extended with offices in London, Pireus and Geneva. The London-office has a particular strong competence in sale & purchase, newbuilding and in LNG-trade, while Geneva focuses on dry bulk chartering. Also the offices in Singapore and Shanghai have been strengthened. These moves were initiated as the markets were weak and offered good opportunities for those who were willing to take a bet on a future upturn.
oPeRatIonsThe overall demand for tonnage grew by 11-12 % in 2010, with significant deviations between different segments. The first half of the year saw high volumes of sale and purchase, while the new-building activity caught up in the second half.
outlooKThe overall growth in the world economy is expected to continue in the next couple of years. But as always, the development in the different shipping segments can deviate from the general trend. Industrial shipping is an area with expected high growth short term,
ShipbroKinGbuSineSS area
key fIGUres:
> Operating incOme 2010: mnoK 346
> Operating prOfit befOre bOnus: mnoK 161
> number Of emplOyees: 151 emPloyees
while bulk and tankers are expected to be less favorable due to market imbalances. RS Platou is well positioned in forest products, car carriers and LNG, and will also evaluate further expansion into other high value segments and places if the right opportunities turn up.
35%ShipbroKinG
2006
500 000
400 000
300 000
200 000
100 000
50 %
40 %
30 %
20 %
10 %
2007 2008 2009 2010
ANNUAl DeVelOpMeNT:
sHAre Of reVeNUes
reVenues (nOK 1 000) ebit margin after bOnus payments (%)

RS Platou aSa / annual RePoRt 201018

19BuSineSS aRea – offShoRe
IntRoductIonBeing on of the largest offshore broker in the world, Offshore targets to maintain and strengthen this position in the years to come. RS Platou Offshore’s business covers sale & purchase of drilling, field development and offshore support vessels and new-buildings, as well as chartering. Important competitive factors for RS Platou Offshore include global reads, local presence in the vicinity of all major offshore oil fields, reputation as a highly skilled broker since the opening of the North Sea oil adventure and a solid track record of deals.
develoPment In 2010Two major themes dominated the offshore market in 2010; recov-ery from the financial crises and a temporary setback of this processcaused by the Macondo incident in the Gulf of Mexico. The latter both increased the attention to safety procedures in the industry in general and delayed new drilling permissions in the area. But steady growth in the oil prices and announcements of higher E&P activity into 2011 signals increasing acitivity in the offshore market in 2011/2012.
stRategyExtended global presence and more integration with other Platou services are cornerstones in Offshore’s strategy. The new office in Accra is expected to fuel the West-African business better and through full operation at the Rio de Janeiro office RS PLatou Offshore will be close to an expected hot market in Brasil as Petrobras increases exploration of new fields.
ouR oPeRatIonsThe number of new rig commitments increased from 350 to 500 from 2009 to 2010, which proves a significant recovery of the over-all offshore market. This is also the key driver for offshore supply vessels, but the upturn here was halted by the supply surplus of vessels ordered before the financial crises. But financially, the bottom line for Offshore was healthy.
outlooKThe overall offshore market is expected to grow further in the nextyears, driven by high oil price and increased demand for energy. The drilling market is expected to be strong, and the offshore vesselmarket will gradually improve. Platou’s Offshore business is well positioned to take its share of the new growth, and will take full advantage of a fully operational investment bank in-house.
key fIGUres: > Operating incOme 2010: mnoK 357
> Operating prOfit befOre bOnus: mnoK 233
> number Of emplOyees: 87 emPloyees
36%offShore
2006
500 000
400 000
300 000
200 000
100 000
50 %
40 %
30 %
20 %
10 %
2007 2008 2009 2010
ANNUAl DeVelOpMeNT:
reVenues (nOK 1 000) ebit margin after bOnus payments (%)
offShorebuSineSS area
sHAre Of reVeNUes

RS Platou aSa / annual RePoRt 201020
inVeSTmenT banKinGbuSineSS area
IntRoductIonRS Platou Markets is a Norwegian-based full service investment banking firm, licensed and supervised by the Norwegian Financial Supervisory Authority. RS Platou Markets offers a wide range of services within equity sales and trading, fixed income, research and corporate finance to both domestic and foreign institutional clients and investors within the core sectors E&P, shipping, offshore and seafood. Established in late 2008, RS Platou Markets offer important complementary services to other business areas within the Platou Group.
develoPment In 2010During 2010, the stock markets globally and in Norway rebounded from the financial crisis which severely influenced 2008 and 2009. Despite the rocky start of 2010, the year marked the return of meas-ured confidence for the investment banking industry. While the US was showing good signs of recovery, Asia and the emerging markets continued to play an increasingly important role in global deal making. With companies and corporations holding record amounts of cash, attractive financing opportunities and a growing IPO pipe-line, many factors are in place for the continued momentum into 2011.
RS Platou Markets has in 2010 been retained as advisor in several high profiled equity and debt transactions in Norway, Europe, the US and Asia. In addition, RS Platou Markets has completed several valuation assignments throughout the year, in addition to two stock exchange listings. RS Platou Markets participated in 40 transactions worldwide including fixed income deals, equity offerings, block trades, valuations, acquisitions and listings with a total value of approx. NOK 21 billion.
2010 was a year of restructuring for RS Platou Markets, and the organization was strengthened, including critical support functions. In addition, the business area started up FX trading and estab-lished a presence in Asia through an office in Singapore. Despite restructuring, the business area managed to produce market- leading research, established strong institutional client relationships worldwide and built a leading bond franchise.
key fIGUres: > Operating incOme 2010: mnoK 233
> Operating prOfit befOre bOnus: mnoK 75
> number Of emplOyees: 83 emPloyees
2006
250 000
200 000
150 000
100 000
50 000
100 %
50 %
0
-50 %
-100 %
-150 %2007 2008 2009 2010
23%inVeSTmenT banKinG
ANNUAl DeVelOpMeNT
reVenues (nOK 1 000) ebit margin after bOnus payments (%)
sHAre Of reVeNUes
21BuSineSS aReaS – inveStment BankinG
oPeRatIonsRS Platou Markets offers services within equity sales and trading, fixed income, research and corporate finance. The equity sales team offer a broad range of products and services, including domestic- and international sales, sales trading, market-making and execution. While most of the trading is done on the Oslo Stock Exchange, RS Platou Markets can offer its clients trading in international stock-, derivative- and commodity markets through cooperation with in-dustry partners.
RS Platou Markets professional fixed income team is research driven and focuses on the core industries with a “niche” approach to high yield and convertible issuers in the market. RS Platou Markets are actively structuring, originating, syndicating and trading fixed income instruments and we focus on high yield bonds (secured and unsecured), convertible bonds, mezzanine instruments, pri-vately structured fixed income deals and bridge financing. RS Platou Markets act as advisers to issuers globally, and the team works with major international institutional clients in Europe, Asia and the US.
RS Platou Markets also offer financial advice in all types of ECM transactions, including initial public offerings (IPOs), secondary offer-ings and private placements. In addition, the Corporate finance team advice clients on mergers, acquisitions, divestitures, corporate
restructurings, joint ventures, exchange offers and leveraged buy-outs in order to find optimal solutions enabling them to secure long-term value creation and achieve short and long-term strategic objectives. The research department strives to provide consistent, high quality and timely research to clients and maintain an ongoing coverage of companies covering more than 90% of the market capitalization of the Oslo Stock Exchange with an emphasis of company’s within the core sectors offshore, E&P, shipping and seafood. In addition, research analysts also offer global coverage within the core sectors internationally.
outlooKThe Group shall throughout 2011 continue to utilize the synergy effects with RS Platou within core areas. The approach to the combination of ship- and rig broking and financial services (”steel and paper”) has been appreciated by customers and it is the company’s view that this continued synergy utilization will result in several transactions and other assignments. Including FX ser-vices, the company currently has a service range that covers all our customers’ needs. There are several indications that the Company will have a stronger 2011 than 2010 as a result of improved market conditions and available capital in the market in addition to internal operational improvements and additional strengthening of the organization.

RS Platou aSa / annual RePoRt 201022
IntRoductIonDirect investments in shipping and offshore has long traditions in Norway. The Platou Group decided to focus on this business area in 2004 with the establishment of RS Platou Finance. In 2009 the division expanded with the establishment of RS Platou Real Estate focusing on structuring real estate projects and corporate finance related to the real estate sector.
The two sister companies enjoys several synergies within project development, running management and client preferences. RS Platou Finance and RS Platou Real Estate have become leading players within the Norwegian market for project financing. Both companies have a built up a broad network within banks, investors, ship owners, charterers and real estate players. The division is capable of both establishing projects, syndication of equity and debt capital, restructuring debt, corporate and strategic advisory, company set-ut (both financial and legally)allocation strategies and
managing projects throughout the their life time. At every stage of the process, the ambition is to create maximum value for the clients and investors.
stRategyRS Platou Finance and RS Platou Real Estate are above all a full scale service provider, services including market and projects analysis, project structuring including establishment of KS/DIS structures and limited liability companies, equity capital market and providing all forms of project financing (bank loans, bonds, mezzanine) etc, as well as providing a market place for active secondary trading. RS Platou Finance and RS Platou Real Estate also provide a range of financial services related to asset management and corporate management, besides assisting private individuals with investor services. RS Platou Finance has significant synergies with the shipping and offshore brokerage business – through mutual utilization of client base and networks.
23BuSineSS aRea – PRojeCt finanCe
projecTfinance
buSineSS area
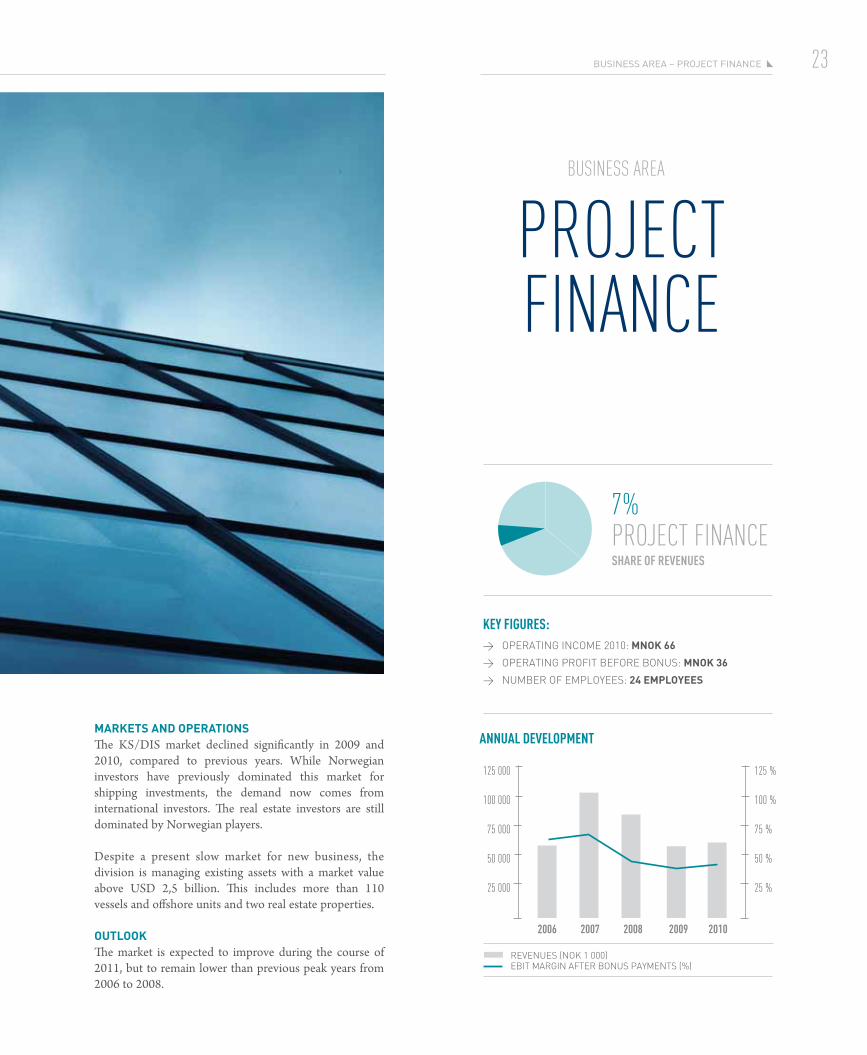
maRKets and oPeRatIonsThe KS/DIS market declined significantly in 2009 and 2010, compared to previous years. While Norwegian investors have previously dominated this market for shipping investments, the demand now comes from international investors. The real estate investors are still dominated by Norwegian players.
Despite a present slow market for new business, the division is managing existing assets with a market value above USD 2,5 billion. This includes more than 110 vessels and offshore units and two real estate properties.
outlooKThe market is expected to improve during the course of 2011, but to remain lower than previous peak years from 2006 to 2008.
key fIGUres: > Operating incOme 2010: mnoK 66
> Operating prOfit befOre bOnus: mnoK 36
> number Of emplOyees: 24 emPloyees
7%projecT finance
2006
125 000
100 000
75 000
50 000
25 000
125 %
100 %
75 %
50 %
25 %
2007 2008 2009 2010
ANNUAl DeVelOpMeNT
reVenues (nOK 1 000) ebit margin after bOnus payments (%)
sHAre Of reVeNUes

RS Platou aSa / annual RePoRt 201024

kolumnetittel 25
corporaTeGoVernance

RS Platou aSa / annual RePoRt 201026
ImPlementatIon of and RePoRtIng on coRPoRate goveRnanceRS Platou aims to follow the Norwegian Code of Practice for Corporate Governance, cf. latest version dated 21 October 2010, and the Board of Directors (the “Board”) have ensured that the Group has implemented sound corporate governance. There are no significant deviations between the Code and Corporate Governance in the Group. Deviations, if any, have been accounted for under each section.
Corporate governance deals with issues and principles associated with the distribution of roles between the governing bodies in the Company, and the responsibility and authority assigned to each body. Good corporate governance is distinguished by responsible interaction between owners, the Board and management in a long-term, productive and sustainable perspective.
Platou has adopted ethical guidelines and guidelines for corpo-rate social responsibility in accordance with the Company’s basic corporate values. In line with the Norwegian code of practice for corporate governance, a review of the major aspects of Platou’s governance structure follows below.
coRPoRate goveRnance PRIncIPlesPlatou aims to create value for its shareholders through deliver-ing first class brokerage services to its clients, mainly within the shipping and offshore industries.
Platou believes there is a link between high quality governance and the creation of shareholder value. Our governance structures and controls help to ensure that we run our business in a profitable manner for the benefit of our shareholders, employees and other stakeholders.
Our basic corporate values for how to conduct our business can be summarized as follows:
ConfidentialityAll employees has a duty to, during the term of employment and after termination, to keep confidentiality towards third parties of all matters the employee has retained knowledge of during the employment, including matters of commercial-, market-, financial and/or internal nature. This also applies to information relating to Platou’s clients and their businesses or business associates. The confidentiality does not apply to matters that has or is made public without the assistance of the employee, nor do the conditions apply to any potential injunctions made by a court or in accordance with law or regulation.
All employees are required to sign a confidentiality agreement that cover the confidentiality between the employee, Platou and towards third parties.
indePendenCeNo one should ever be able to suggest or infer that we do not hold the highest standards of ethics in our daily activities. Everyone in the firm shall act independently, and irrelevant considerations shall never influence the advice or services provided to clients.
All employees shall comply with laws and regulations in force and common practice on a continuous basis. All payments and transfers shall appear in the accounts and systems used and shall be traceable and searchable. No employee shall receive or handle capital that has no named source.
Each employee shall waive any actions that may cause conflict between own personal economical situations and those interests they are to safeguard or ensure being an employee in Platou, or that may be interpreted as such.
loyaltyThe potential for conflict is inherent in our business. To avoid that the loyalty to our clients are questioned, no one shall accept an assignment which may result in a conflict of interest. Each employee shall contribute to the safeguarding of Platou’s trust and reputation by behaving in an ethical and proper way.

CoRPoRate GoveRnanCe 27
inteGRityPlatou is committed to provide first class brokerage services. No one shall accept an amount of work which may comprise the quality of the services provided. No one shall provide services with-in an area which he or she does not master. Each employee shall act factual, correct, honest and in accordance with good business practice. Good business practice is to perform and conduct the relevant work in accordance with ethical and professional principles generally known and practiced by experienced and conscientious persons in the business.
BusIness actIvItIesThe Group’s business activities have been defined in the Articles of Association. The Group’s website also details the Group’s activities, objectives and strategies and in total these should provide both shareholders and the capital market with an understanding of the current business activities of the Group and likely future development.
equIty and dIvIdendsThe Board and the management of the Group aim at all times at keeping the Company’s equity and other financing adapted to the Company’s objective, strategy and risk profile. The Group’s business is of such a nature that modest equity is required to conduct the business, however, the Board continuously evaluates the equity position of the Company.
Platou’s objective is to yield a competitive return on invested capital to the shareholders through a combination of distribution of divi-dends and increase in share price. When evaluating the amount of dividend payable, the Board of Directors places emphasis on certainty, foreseeability and stable development, the Company’s dividend capacity, the requirements for sound and optimal equity capital as well as adequate financial resources to enable future growth and investments, applicable legal or contractual restrictions and the desire to minimize the cost of capital. The Company will pay dividends directly to the VPS Registrar, which has undertaken, in turn, to distribute the dividends to the beneficial shareholders as registered in VPS.
To ensure flexibility in the Group’s capital structure and capital management, the Board of Directors has been granted authorisa-tion to repurchase own shares by the Annual General Meeting. The General Meeting has authorised the Board of Directors to acquire own shares for a total face value of NOK 1 024 279, corresponding to 10 % of the Company’s share capital. In addition, the Board of Directors has been authorized to increase the share capital of the Company by NOK 1 024 279 by issuance of new shares. Both of the above mentioned authorizations are valid until the next annual general meeting in 2012.
equal tReatment of shaReholdeRs and tRansactIons WIth close assocIatesThere is only one class of shares, and all shares are equal in all respects.
The Board will take into account the interest of all the shareholders of the Group and treat all shareholders fairly. All transactions that are not immaterial between the Company and a shareholder, a director or senior manager of the Company (or related parties to such persons) will be subject to a valuation from an independent third party. The directors and senior management shall notify the Board if they have any material direct or indirect interest in any transaction entered into by Platou. The Group has not entered into any transactions or other agreements with shareholders, members of the Board or management outside the normal scope of business, and during 2010 no material transactions with shareholders, members of the Board or management occurred.
As a deviation from the Code, the Company’s corporate governance principles states that any transactions the Company carries out in its own shares, pursuant to the shareholder agree-ment entered into with the working partners, may be carried out at other prices than prevailing stock exchange prices. Furthermore, such transactions, pursuant to the shareholder agreement en-tered into with the working partners, can be carried out without obtaining a valuation by a third party.
In cases where a share capital increase is to be carried out which involves waiver of the pre-emption rights of existing shareholders,

RS Platou aSa / annual RePoRt 201028
and the board resolves to carry out such an increase on the basis of an authorisation granted by the general meeting, the Company should explain the justification for waiving the pre-emption rights in the public announcement to be issued in connection with the increase in share capital.
fReely negotIaBle shaResThere are no restrictions on trading of the Company’s shares in the Articles of Association.
In order to maintain stability, loyalty and long term value creation, in the interest of all shareholders, a shareholder agreement exists between the Company and working partners which include restric-tions on negotiability.
geneRal meetIngsThe shareholders exercise the supreme authority in Platou through the general meetings. The Annual General Meeting (the “AGM”) of Platou will be held each year prior to the end of June. The AGM shall approve the annual accounts and report as well as the distribu-tion of dividend, and otherwise make such resolutions as required under applicable law.
The Board of Directors may convene extraordinary general meetings whenever it deems necessary or when otherwise legally required. Platou’s auditor and any shareholder or group of shareholders representing more than 5% of the current issued and outstand-ing share capital of Platou may require that the Board of Directors convene an extraordinary general meeting.
The Board adheres to the requirements of the Norwegian code of practice for corporate governance with respect to the summons to the General Assembly. The Board summons the meeting and make the supporting information on the resolutions to be considered at the general meeting available on the company’s website no later than 21 days prior to the date of the general meeting. In addition, the Board send notices of general meetings to shareholders no later than three weeks prior to the meeting and will observe that the notice and any supporting material are sufficiently detailed and comprehensive.
Any deadline for shareholders to give notice of their intention to attend the meeting shall be set as close to the date of the meeting as possible.
The Board shall make arrangements to ensure an independent chairman for the general meeting. The Board and the person chair-ing the meeting shall arrange for the general meeting to vote sepa-rately on each candidate nominated for election to the Company’s corporate bodies, and further ensure that members of the Board and the nomination committee and the auditor are present at the general meeting.
Shareholders who are unable to attend may vote by proxy. The Company shall in this respect: ■ provide information on the procedure for representation at the
meeting through a proxy; ■ nominate a person who will be available to vote on behalf of
shareholders as their proxy; and ■ prepare a form for the appointment of a proxy, which to the
extent possible allows separate voting instructions to be given for each matter to be considered by the meeting and for each of the candidates nominated for election.
nomInatIon commItteeThe nomination committee’s duty is to nominate candidates to the AGM for the election of the Board and to propose the fees to be paid to members of the Board. The nomination committee shall justify its recommendations.
Platou has a nomination committee and the general meeting shall elect the chairperson and members of the nomination committee and shall determine the committee’s remuneration.
The nomination committee is stipulated in the Company’s Articles of Association. The general meeting shall stipulate guidelines for the duties of the nomination committee.
The nomination committee shall be composed in a way that takes into account the interests of all the Company’s shareholders in general. At least one member of the nomination committee shall

CoRPoRate GoveRnanCe 29
not be a member of the Board. No more than one member of the nomination committee shall be a member of the Board. The nomi-nation committee shall not include the Company’s CEO. Due to the composition of shareholders in the Company, the Board has resolved certain deviations from the Code with respect to how the nomination committee shall be composed, namely:
(i) A majority of the committee does not have to be independent of the Board and the executive management;(ii) Up to one member of the committee may be a member of the Board, and such member may offer himself for re-election; and(iii) The committee may include executive personnel, except the Company’s CEO.
The current nomination committee consists of Jørgen Lund (Chair-man), Ragnar Horn (member) and Wilhelm L. Holst (member). The current nomination committee has one independent member, one member who is also a member of the Board, and one member who is also part of the Company’s executive management.
Platou shall provide information on the members of the committee and any deadlines for submitting proposals to the committee.
coRPoRate assemBly and WoRK of BoaRd of dIRectoRs: comPosItIon and IndePendencePlatou does not have a corporate assembly. The composition of the Board ensures that the Board can attend to the common interests of all shareholders and meet the Company’s need for expertise, capacity and diversity. Attention is paid to ensuring that the Board can function effectively as a collegiate body. The composition of the Board ensures that it can operate independently of any special interests.
The Board consist of five directors, of which two are female direc-tors. The majority of the shareholder-elected members of the Board are independent of the Company’s executive management and material business contacts. The two members of the Board elected by shareholders are independent of the Company’s main shareholders and the Board does not include executive management.
The chairman of the Board has been elected by the general meeting. The term of office for members of the Board is not longer than two years at a time.
The annual report shall provide information to illustrate the exper-tise of the members of the Board, and information on their record of participation in board meetings. A comprehensive biography of the Board of Directors and the Executive Management is also available on Platou’s web pages.
the WoRK of the BoaRd of dIRectoRsThe Board of Directors works in accordance with the rules laid down by Norwegian law.
Annually, in connection with the first board meeting in each calendar year, the Board evaluates its performance in the previous year. The evaluation includes its own performance, the performance of the sub-committees and the performance of the individual directors. In order for the evaluation to be effective, the Board sets objectives, on both a collective and individual level, against which their perfor-mance can be measured. The results of this evaluation are not made available to the public, but only to the Nomination Committee.
In order to ensure a more independent consideration of matters of a material character in which the chairman of the Board is, or has been, personally involved, the Board’s consideration of such matters will be chaired by some other member of the Board. The division of responsibilities between the Board and the CEO has been set out in writing and agreed by the Board.
The Company has established an audit committee, the duties of which are to carry out preparatory work for the Board with respect to monitoring the financial reporting, monitor the Company’s systems for internal control and risk management, maintain regular contact with the Company’s elected auditor, and review the independence of the statutory auditor.

RS Platou aSa / annual RePoRt 201030
RIsK management and InteRnal contRolThe Board works to be continuously updated on the financial situ-ation of the Company and ensures that the Company’s operations, accounting and asset management have satisfactory control, and the directors of the Board have full and free access to officers, employees and the books and records of the Company. The Board ensures that the CEO reports monthly to the Board on the financial situation of the Company. The Board also carries out an annual review of the Company’s most important areas of exposure to risk and its internal control arrangements, which encompass the Company’s corporate values, ethical guidelines and guidelines for social responsibility.
RemuneRatIon of the BoaRd of dIRectoRsThe remuneration of the members of the Board of Directors is determined by the shareholders in a general meeting and disclosed in the annual accounts of Platou, cf. note 4. Based on the consent of the AGM, it is assumed that the remuneration of Board members reflects the respective members’ responsibility, expertise, time commitment and the complexity of the Group’s activities. This remuneration is not linked to Company’s results.
The directors of the Board (the “Directors”), or companies to which they are associated, have not accepted other appointments or engagements for the Company. The Directors have not received shares, nor have they been granted share options, as part of their remuneration as directors.
RemuneRatIon of executIve PeRsonnelThe Board has adopted guidelines for remuneration to management employees. The general meeting is informed of the guidelines annually. Salary and other remunerations to the CEO is determined by the Board. All elements of remuneration to the CEO and the total remuneration for management appear in the annual report, cf. note 4. Performance-related remuneration of the executive management in the form of share options, bonus programmes etc. is linked to value creation for shareholders. As a deviation from the Code, the Board has resolved not to include an absolute limit on performance related remuneration in the Company’s corporate governance policy.
InfoRmatIon and communIcatIonAll Group financial reporting complies with Norwegian legislation. The financial statements and annual reports are prepared to ensure accountability, transparency and fairness to all shareholders in the Group.
A financial calendar will be prepared and published on the Group website and is also distributed in accordance with the rules of the Public Companies Act and the rules applicable to companies listed on the Oslo Stock Exchange. All the information distributed to the shareholders is also published on the Group website. The Group will have regular investor meetings and public interim results presenta-tions.
The Board considers that these measures enable and ensure continuous informative interaction between the Company and the shareholders.
The Directors make themselves available for discussions with the major shareholders from time to time to develop a balanced under-standing of the issues and concerns of such shareholders, subject always to applicable law and listing rules. Information given to the Company’s shareholders shall simultaneously be made available on the Company’s web site.
taKe-oveRsThere are no limitations with respect to the purchase of shares in the Company. In the event of a take-over bid the Board of Directors will act in the best interest of the shareholders and in compliance with all rules and regulations applicable in such an event. In the case of a take-over bid the Board will refrain from taking any obstructive action unless agreed upon by the Company’s shareholders.
In a bid situation, the Board and management have an independent responsibility to help ensure that shareholders are treated equally, and that the Company’s business activities are not disrupted unnecessarily. The Board has a particular responsibility to ensure that shareholders are given sufficient information and time to form a view of the offer.
CoRPoRate GoveRnanCe 31
The Board will not seek to hinder or obstruct take-over bids for the Company’s activities or shares unless there are particular reasons for this.
In the event of a take-over bid for the Company’s shares, the Board will not exercise mandates or pass any resolutions with the intention of obstructing the take-over bid unless this is approved by the general meeting following announcement of the bid.
If an offer is made for a Company’s shares, the Board shall issue a statement making a recommendation as to whether shareholders should or should not accept the offer. The Board’s statement on the offer shall make it clear whether the views expressed are unanimous, and if this is not the case it shall explain the basis on which specific members of the Board have excluded themselves from the Board’s statement. The Board shall arrange a valuation from an independent expert. The valuation shall include an explanation, and shall be made public no later than at the time of the public disclosure of the Board’s statement.
Any transaction that is in effect a disposal of all, or a substantial part of the Company’s assets, shall be decided by a general meeting.
audItoRThe Company’s auditor shall be elected by the shareholders at the general meeting.
The auditor shall submit the main features of the plan for the audit of the Company to the Board annually.
The auditor shall participate in board meetings that deal with the annual accounts. At these meetings the auditor shall review any significant changes in the Company’s accounting principles, assess any important accounting estimates and matters of importance on which there has been disagreement between the auditor and the management.
The auditor shall at least once a year present to the Board a review of the Company’s internal control procedures, including identifying weaknesses and proposed improvements.
The Board shall hold a meeting with the auditor at least once a year at which neither the CEO nor any other representative of the management is present.
The Board shall specify guidelines for the right of the management to use the auditor for purposes other than auditing. The Board shall provide recommendations to the general meeting for the election, removal and payment of auditors.
The Board must inform the shareholders at the AGM of the remuneration paid to the auditor, including details of the fee paid for auditing work and any fees paid for other specific assignments.

RS Platou aSa / annual RePoRt 201032
kolumnetittel 33
board of direcTor´SreporT for 2010

RS Platou aSa / annual RePoRt 201034
postponements and cancellations. Only around two-thirds of the planned newbuilds scheduled for delivery were launched during 2010. This enabled utilisation rates to once more increase to more comfortable levels and charter rates to remain acceptable at least for the first half of the year. The level of newbuild orders placed during 2010 took many by surprise as the yards saw order intakes close to treble 2009 levels. It has also been a relief to see that the ro-ro and container sectors have picked up from depressed levels.
For Markets, the trading environment kept improving during the year. However concerns related to sovereign debt in Europe and the overheating of the Chinese economy caused disturbances during the year. Towards the end of 2010, monetary policies throughout Europe eased markets and helped to ensure that economic growth stayed on track. In sum for Markets, 2010 was a fair trading year, and this is reflected in the financial results for the division.
For Finance, the year 2010 was more or less as expected. The main focus was on existing projects and the need to pilot investors through difficult market conditions. Despite a few challenges, the majority of the project portfolio performed well and a few projects were added to the portfolio within dry bulk, tankers and offshore.
For all divisions, an ongoing focus on existing client relationships is essential to preserving our strong market position and continual efforts are made to increase our client base.
In 2010, business booked for the Group was MNOK 1 152,7, representing a 90 % increase from 2009. Shipbroking was the largest contributor with MNOK 512,3, followed by MNOK 345,5 in Offshore, MNOK 233,8 in Markets and MNOK 61,1 in Finance.
Income statementTotal revenues for the Group were MNOK 994,1 in 2010 an increase of 19 % from 2009 revenues of MNOK 837,3.
Shipbroking revenues improved from 2009 mainly due to the es-tablishment of the London and Piraeus offices during 2009. During the first half of 2010, sale and purchase volumes were high, while the second half of the year saw more newbuilding activity. For 2010, revenues generated by the forward book were relatively less important than in 2009.
IntRoductIonThe RS Platou Group is a leading international ship and offshore broking and investment banking group. The Group has four divisions: ■ Shipbroking ■ Offshore ■ Markets ■ Finance
Through Shipbroking and Offshore, the Group serves the shipping and offshore industry worldwide by providing services within chartering, sale and purchase and contracting of ships and offshore units. Through Finance, equity and debt capital is syndicated for shipping, offshore and real estate projects. The investment bank, Markets, offers financial advisory services within brokerage, corporate finance and bond issues for both Norwegian and international clients. RS Platou Markets AS is authorised by the Norwegian Financial Supervisory Authority (Finanstilsynet). It is licensed to offer services within equity sales and trading, fixed income, research and corporate finance to domestic and foreign clients and investors. The Group’s head office is in Oslo, with regional offices in Singapore, Houston, Aberdeen, London, Rio de Janeiro, Moscow, Geneva, Accra, Shanghai and Piraeus.
In accordance with the Accounting Act § 3-3a, we confirm that the financial statements have been prepared under the assumption of going concern. This assumption is based on profit forecasts for the year 2011 and the Group’s long-term strategic forecasts. The Group’s economic and financial position is sound.
oPeRatIons In 20102010 was predicted by many to be a difficult year for the shipping and offshore industries. However, higher than expected global economic activity resulted in a better year than initially anticipated for the Group. Offshore has been through a dramatic year of con-trasts with renewed optimism for jack-ups and semis, turbulent market conditions for offshore support vessels and the tragic Deepwater Horizon accident. Exciting areas and projects such as the offshore activities in Brazil keep driving demand for the exist-ing offshore fleet. At the same time, the industry is continuing to invest in new technology to meet the increased demands generated by both complex challenges and regulatory requirements. As for offshore, yards producing shipping tonnage also had to report order

35BoaRd of diReCtoRS
AS and RS Platou LLP and constituted MNOK 18,1, up from MNOK -28,7 in 2009. The non-controlling interests in 2009 was influenced by the loss attributable to non-controlling interest in RS Platou Markets AS.
Profit attributable to owners of the parent in 2010 was MNOK 102,1 compared with MNOK -12,2 in 2009. This represents an earnings per share of NOK 2,52 in 2010 and NOK -0,35 in 2009.
fInancIal PosItIonIn the opinion of the Board of Directors, the Group’s financial position is sound. Total assets amounted to MNOK 883,5, of which MNOK 249,7 are non-current and primarily relate to a deferred tax asset generated by historical losses in RS Platou Markets AS, PPE and goodwill generated through acquisitions. Total current assets of MNOK 633,9 exceed total current liabilities of MNOK 472,8. Total current assets primarily consist of accounts receivable and cash. The total cash position has increased from MNOK 158,0 at 31 December 2009 to MNOK 280,7 at 31 December 2010. The Group had long term liabilities of MNOK 124,9 at 31 December 2010, compared to MNOK 97,0 at 31 December 2009.
Total equity has increased by 38,3 % to MNOK 285,8 from 2009. The Group’s equity ratio was 32,3 % at 31 December 2010, up from 23,4 % at 31 December 2009.
RS Platou Markets AS had a tier 2 capital ratio of 20,26 % at 31 December 2010 compared to the requirement set by the Financial Supervisory Authority of Norway of a tier 2 capital ratio in excess of 8 %.
The Group’s cash flow from operations was MNOK 171,8 in 2010, up from MNOK -6,9 in 2009. The Group has sufficient cash to finance the existing operations of the Group. Due to fluctuating working capital requirements during the year, the Group has estab-lished overdraft facilities. These facilities were utilised from time to time during the year, but were not utilised on a net basis at year-end.
The main differences between the operating profit and net cash flow from operating activities are primarily related to net financial income, taxes paid, non-cash items recognised in profit or loss, change in working capital and certain other capitalized items not included in cash flow from investing activities.
Offshore saw a relatively modest increase in revenues. It was a difficult year, still influenced by delays and cancellations especially at yards in the Far East, but both sale and purchase and charter-ing activities generated higher revenues than expected. During the spring of 2011, the offshore office in Lagos will be closed, while a new subsidiary has been established in Accra, Ghana, to serve the West African offshore chartering market.
Markets more than doubled its revenues from 2009. Active equity and debt capital markets, combined with opportunities for initial public offerings and stock exchange listings, contributed to the growth in revenues. Several high profile transactions were completed during 2010 for international clients, underpinning Market’s ambitions to build on the Group’s global reach.
Finance saw 2010 revenues slightly higher than in 2009 which is satisfactory as 2010 was still influenced by difficult market condi-tions. A few new projects were added to the portfolio in 2010, and revenues from the real estate team contributed positively to the division.
Operating expenses for 2010 were MNOK 493,5. This included non-recurring costs of about MNOK 34 primarily related to the restructuring of Markets and the write off of capitalised sign-on fees. For 2009, the non-recurring costs were MNOK 81. Excluding non-recurring costs underlying operating expenses increased by 4 % from MNOK 441,0 in 2009 to MNOK 459,5 in 2010. The mod-est increase in costs is primarily related to increased head count during the year.
In line with the long established practice within the Group, MNOK 276,1 has been allocated for bonuses. The allocation is based on operating profit before bonus.
Net financial income improved from MNOK -139,0 in 2009 to MNOK -44,0 in 2010. Net financial income is volatile from period to period because it mainly comprises exchange rate fluctuations.
Profit before tax was MNOK 180,6 in 2010, which is a signifi-cant improvement from MNOK -46,9 in 2009. Profit after tax was MNOK 120,2 in 2010, and MNOK -40,9 in 2009. The non- controlling interests for 2010 primarily relate to RS Platou Finans

RS Platou aSa / annual RePoRt 201036
The Board of Directors has developed appropriate procedures to manage the Group’s short, medium and long-term funding and liquidity management requirements. Risk is managed by maintaining adequate borrowing facilities and by the regular monitoring of fore-cast and actual cash flows. Liquidity risk arises from the Group’s ongoing financial commitments and obligations, particularly the settlement of financial liabilities.
management, emPloyees and envIRonmental InfoRmatIonAt 31 December 2010, the Group employed 89 women and 257 men, totalling 346 employees. The Group is committed to giving men and women equal opportunities for professional and personal development, compensation and benefits, and general career develop ment. Women occupy important positions throughout the Group. The parent company’s Board of Directors consists of three men and two women, while senior management consists of six men. Throughout the Group, continual efforts are made to secure equality between genders, and under no circumstances will gender, ethnicity, religion, nationality or other criteria not relevant to a position be used when evaluating existing employees or consider-ing potential new employees. In general, the Board of Directors considers the Group’s working environment to be good. Absence due to sickness in RS Platou ASA of 1,5 % in 2010 and 1,2 % in 2009 is considered to be low. However continual efforts are still made to reduce the absence due to sickness.
The Group has a direct impact on the environment through its consumption of energy, procurement of goods, transport and waste management. However, the impact is considered to be normal and not material as operations of the Group are primarily related to office operations.
PRosPects foR the futuReIn recent years, RS Platou has spent significant resources on developing its service offering platform and the Group will continue to focus on cross border and cross service synergy realisation. The Board notes with satisfaction that the realised synergies in the Group have so far exceeded expectations. Further expansion, both in our present locations and possibly into some new locations will have strategic priority in 2011. The revenue levels in the Group are dependent upon the general development of the world economy in general, and the shipping and offshore markets
The consolidated statement of comprehensive income, and the consolidated statement of financial position dot not include oper-ating costs or capitalised costs related to research and development (R&D) as the Group has no material R&D activities.
RIsKsThe Board of Directors has overall responsibility for setting up and monitoring the Group’s risk management framework. Risk manage-ment policies are established to identify and analyse the risks faced by the Group, to implement appropriate controls over those risks and to monitor these risks and the effectiveness of the controls. Risk management policies and systems are reviewed regularly to take into account changes in market conditions and the Group’s policies. There may be deviations in the policies across the various subsidiaries within the Group.
Fluctuations in exchange rates may affect both the consolidated statement of comprehensive income and the consolidated statement of financial position. In terms of revenues, the main exposure is in USD, however, the Group also has income in NOK, EUR and GBP amongst other currencies. Most expenses are in NOK, although the Group also has significant expenses in GBP, USD and SGD. The Group may decide to use foreign currency swaps or forward exchange contracts to hedge its future exchange rate exposure.
Market risk is the risk that changes in market prices will affect the Group’s results or the value of its financial instruments, or that the development in the demand for the Group’s services changes. The objective of market risk management is to manage and control market risk exposures within acceptable limits, but also to optimise the returns available.
Credit risk is the risk of financial loss to the business if a customer or counterparty to a financial instrument fails to meet its contractual obligations. This arises principally from the Group’s receivables from its clients. Exposure to credit risk on trade receivables is monitored on a routine basis and credit evaluations are performed on clients before entering into significant transactions. Risk is managed by maintaining close contact with each client and carry-ing out regular billing and cash collection for services provided. The Group makes impairment provisions for estimated losses on of trade and other receivables on a case by case basis.

37BoaRd of diReCtoRS
in particular. The Group will strive to increase the market share across its divisions, however, price levels and absolute transaction volumes are difficult to predict. Operating cost visibility is fair, and given the expansion plans for the Group, it is likely that operating cost levels will increase.
In February 2011, The Court of Appeal gave a judgment in favour of RS Platou Markets AS in relation to a lawsuit filed by BNbank ASA, further details are included in Note 22 – Contingent liabilities. Since year-end, no other matters have arisen which have a mate-rial effect on the Group’s consolidated statement of comprehensive income, nor the consolidated statement of financial position. The same is true for the parent company.
shaReholdeRs and allocatIon of PRofItRS Platou ASA had 72 shareholders at 31 December 2010. The Board of Directors proposes that the following allocation of RS Platou ASA’s profit after tax to be adopted at the annual general meeting:
fiGuReS in nok 1.000
PRofit afteR tax 54 386
dividend -61 457
to otheR equity -7 071
The allocation is based on dividends of NOK 1,50 per share, which is in line with the policy of a maximum payout to shareholders provided that equity and working capital are adequate. RS Platou ASA will have distributable equity of MNOK 126,3 if the above allocation is adopted by the annual general meeting.
Oslo, 22 March 2011
Ragnar Horn (Chairman) Birger Nergaard
Marianne Lie Gustave Brun-Lie
Marianne Aamodt Peter M. Anker (CEO)

RS Platou aSa / annual RePoRt 201038

kolumnetittel 39
conSolidaTed financialSTaTemenTS for 2010

40 RS Platou aSa / annual RePoRt 2010
note 2010 2009
oPeRatinG RevenueS 3 992 250 836 601
otheR RevenueS 3 1 867 699
ToTal revenues 994 117 837 300
SalaRieS and PayRoll CoStS 4,18 289 751 282 917
otheR oPeRatinG exPenSeS 5 189 242 178 615
dePReCiation and imPaiRment of tanGiBle aSSetS 9 13 774 10 097
amoRtiSation and imPaiRment of intanGiBle aSSetS 10 754 1 832
operaTing expenses before bonuses 493 521 473 460
operaTing profiT before bonuses 3 500 596 363 840
BonuSeS 4 276 074 271 736
operaTing profiT 3 224 522 92 103
inteReSt inCome 6 10 983 25 029
otheR finanCial inCome 6 3 521 86 828
inteReSt exPenSeS 6 -13 031 -25 657
otheR finanCial exPenSeS 6 -44 431 -226 421
ShaRe of PRofit fRom aSSoCiated ComPanieS 6,11 -996 1 246
neT financial income/expenses -43 954 -138 974
PRofIt BefoRe tax 180 568 -46 871
inCome tax exPenSe 7 60 370 -5 964
profiT afTer Tax 120 198 -40 907
oTher comprehensive income 2010 2009
exChanGe Rate diffeRenCeS 1 205 -24 287
ToTal comprehensive income for The Year 121 403 -65 194
CONsOlIDATeD sTATeMeNT Of COMpreHeNsIVe INCOMe1 januaRy – 31 deCemBeR, fiGuReS in nok 1 000

41ConSolidated finanCial StatementS
profiT afTer Tax for The Year aTTribuTable To: 2010 2009
equity holdeRS of the PaRent 102 075 -12 244
non-ContRollinG inteReStS 18 123 -28 663
ToTal profiT afTer Tax for The Year 120 198 -40 907
ToTal comprehensive income aTTribuTable To: 2010 2009
equity holdeRS of the PaRent 102 938 -35 893
non-ContRollinG inteReStS 18 465 -29 301
ToTal comprehensive income for The Year 121 403 -65 194
earnings per share 2010 2009
oRdinaRy 8 2,52 -0,35
diluted 8 2,52 -0,35

42 RS Platou aSa / annual RePoRt 2010
note 2010 2009
asseTs
non-currenT asseTs
defeRRed tax aSSetS 7 44 047 81 599
PRoPeRty, Plant and equiPment 9 55 473 49 786
intanGiBle aSSetS 10 140 976 141 274
lonG-teRm ReCeivaBleS 6 991 6 919
finanCial inveStmentS 2 177 2 060
inveStmentS in aSSoCiateS 11 0 992
ToTal non-currenT asseTs 249 663 282 630
currenT asseTs
aCCountS ReCeivaBle 12,19 264 351 374 316
otheR ShoRt-teRm ReCeivaBleS 13,19 66 208 46 830
finanCial inveStmentS 14,19 22 577 22 989
CaSh and CaSh equivalentS 15,19 280 715 158 046
ToTal currenT asseTs 633 852 602 180
ToTal asseTs 883 515 884 810
CONsOlIDATeD sTATeMeNT Of fINANCIAl pOsITIONaSSetS aS at 31 deCemBeR, fiGuReS in nok 1 000

43ConSolidated finanCial StatementS
note 2010 2009
equiTY
ShaRe CaPital 16 10 243 10 172
ShaRe PRemium aCCount 109 750 105 572
tReaSuRy ShaReS 16 -82 -117
otheR Paid-in CaPital 16 10 534 8 821
ToTal paid-in capiTal 130 444 124 448
reTained earnings
otheR equity 124 362 59 045
ToTal reTained earnings 124 362 59 045
non-contRollIng InteRests 31 028 23 155
ToTal equiTY 285 834 206 648
long-Term liabiliTies
lonG-teRm inteReSt-BeaRinG liaBilitieS 17 78 244 54 097
PenSion liaBilitieS 18 46 616 42 853
ToTal long-Term liabiliTies 124 859 96 950
currenT liabiliTies
inteReSt-BeaRinG liaBilitieS due to CRedit inStitutionS 17 13 495 50 000
otheR inteReSt-BeaRinG liaBilitieS 17 63 746 0
aCCountS PayaBle 19 57 225 197 229
taxeS PayaBle 7 20 286 16 056
finanCial inStRumentS 19 0 5 895
otheR CuRRent liaBilitieS 19 318 069 312 031
ToTal currenT liabiliTies 472 822 581 212
total lIaBIlItIes 597 681 678 162
ToTal equiTY and liabiliTies 883 515 884 810
CONsOlIDATeD sTATeMeNT Of fINANCIAl pOsITION – CONTINUeDequity and liaBilitieS aS at 31 deCemBeR, fiGuReS in nok 1 000
Oslo, 22 March 2011
Ragnar Horn (Chairman) Birger Nergaard Marianne Lie
Gustave Brun-Lie Marianne Aamodt Peter M. Anker (CEO)

44 RS Platou aSa / annual RePoRt 2010
note 2010 2009
cash flow from operaTing acTiviTies
PRofit BefoRe tax 180 568 -46 871
adjusTmenTs
taxeS Paid -9 523 -103 547
dePReCiation and imPaiRmentS 9 13 774 10 097
amoRtiSation and imPaiRmentS 10 754 1 832
diffeRenCe Between PenSion CoSt and PenSion PaymentS 3 300 7 460
aSSoCiateS 11 992 253
PRofit(-)/loSS (+) on Sale of PRoPeRty, Plant and equiPment 9 0 0
ChanGeS in tRade ReCeivaBleS, tRade PayaBleS and CuStomeR PRePaymentS 5 361 208 649
net finanCial inCome 6 917 -13 250
otheR ChanGeS -30 359 -71 566
net CaSh flow fRom oPeRatinG aCtivitieS 171 783 -6 944
cash flow from invesTing acTiviTies
dividendS ReCeived 0 2 500
foRwaRd ContRaCtS 0 -80 387
PuRChaSe of PRoPeRty, Plant and equiPment -19 688 -29 327
PRoCeedS fRom Sale of PRoPeRty, Plant and equiPment 210 2 504
PRoCeedS fRom RePayment of otheR inveStmentS -1 327 -839
net amount Paid out on PuRChaSe of SuBSidiaRieS -1 804 0
PuRChaSe of otheR inveStmentS 0 2 148
net CaSh flow fRom inveStinG aCtivitieS -22 609 -103 401
CONsOlIDATeD sTATeMeNT Of CAsH flOw1 januaRy – 31 deCemBeR, fiGuReS in nok 1 000

45ConSolidated finanCial StatementS
cash flow from financing acTiviTies
iSSuanCe of ShaRe CaPital 4 249 99 000
tReaSuRy ShaReS 2 211 -7 895
RePayment of BoRRowinGS -133 979 -98 322
new lonG-teRm BoRRowinGS 149 966 27 838
net inteReSt inCome/inteReSt exPenSe -6 917 628
dividendS Paid 16 -40 643 -101 747
dividendS Paid to non-ContRollinG inteReStS -6 230 -19 499
net CaSh flow fRom finanCinG aCtivitieS -31 342 -99 997
net tRanSlation diffeRenCe 4 837 0
net IncRease In cash and cash equIvalents 122 669 -210 341
cash and cash equIvalents as of 1 JanuaRy 15,19 158 046 368 388
cash and cash equivalenTs as of 31 december 15,19 280 715 158 046
CONsOlIDATeD sTATeMeNT Of CAsH flOw – CONTINUeD1 januaRy – 31 deCemBeR, fiGuReS in nok 1 000

RS Platou aSa / annual RePoRt 201046
Share capital
Share premium
treasury shares
other paid-in capital
trans-lation
reserve
fair value
reserveother equity total
non-controlling
intereststotal
equity
BalanCe at 1 januaRy 2010 10 172 105 572 -117 8 821 -11 861 84 70 822 183 492 23 155 206 648
comprehensive income for The period
PRofit foR the yeaR 0 0 0 0 0 0 102 075 102 075 18 123 120 198
foReiGn CuRRenCy tRanSlation diffeRenCeS 0 0 0 0 863 0 0 863 342 1 205
total otheR inCome 0 0 0 0 863 0 0 863 342 1 205
comprehensive income for The period 0 0 0 0 863 0 102 075 102 938 18 465 121 403
TransacTions wiTh owners, recognised in equiTY
ContRiButionS fRom/diSBuRSement to owneRS
ShaRe iSSue 71 4 178 0 0 0 0 0 4 249 0 4 249
ChanGe in tReaSuRy ShaReS 0 0 35 1 713 0 0 463 2 211 0 2 211
dividendS 0 0 0 0 0 0 -40 643 -40 643 -6 230 -46 873
ToTal conTribuTions from and disbursemenT To owners 71 4 178 35 1 713 0 0 -40 180 -34 182 -6 230 -40 413
changes in ownership inTeresTs in subsidiaries wiThouT loss of conTrol
acquisiTion of non-conTrolling ownership inTeresTs 0 0 0 0 0 0 0 0 0 0
ChanGe in non-ContRollinG owneRShiP inteReStS 0 0 0 0 0 0 2 557 2 557 -4 361 -1 805
ToTal change in ownership in subsidiaries (noTe 2) 0 0 0 0 0 0 2 557 2 557 -4 361 -1 805
equiTY aT 31 december 2010 10 243 109 750 -82 10 534 -10 998 84 135 273 254 805 31 028 285 834
CONsOlIDATeD sTATeMeNT Of CHANGes IN eqUITyConSolidated Statement of ChanGeS in equity, fiGuReS in nok 1 000

47ConSolidated finanCial StatementS
Share capital
Share premium
accounttreasury
shares
other paid-in capital
trans-lation
reserve
fair value
reserveother equity total
non-controlling
intereststotal
equity
BalanCe at 1 januaRy 2009 8 505 8 239 -218 3 691 11 788 84 165 022 197 112 89 480 286 593
comprehensive income for The period
PRofit foR the yeaR 0 0 0 0 0 0 -12 244 -12 244 -28 663 -40 907
foReiGn CuRRenCy tRanSlation diffeRenCeS 0 0 0 0 -23 650 0 0 -23 650 -638 -24 288
total otheR inCome 0 0 0 0 -23 650 0 0 -23 650 -638 -24 288
comprehensive income for The period 0 0 0 0 -23 650 0 -12 244 -35 894 -29 301 -65 194
TransacTions wiTh owners, recognised in equiTY
ContRiButionS fRom/ diSBuRSement to owneRS
ShaRe iSSue 1 667 97 333 0 0 0 0 0 99 000 0 99 000
ChanGe in tReaSuRy ShaReS 0 0 -43 -984 0 0 2 741 1 713 0 1 713
ShaReS owned By SuBSidiaRieS 0 0 144 6 114 0 0 4 054 10 312 0 10 312
dividendS 0 0 0 0 0 0 -102 063 -102 063 -19 499 -121 562
ToTal conTribuTions from and disbursemenT To owners 1 667 97 333 101 5 130 0 0 -95 268 8 962 -19 499 -10 537
changes in ownership inTeresTs in subsidiaries wiThouT loss of conTrol
addiTions of non-conTrolling ownership inTeresTs 0 0 0 0 0 0 0 0 547 547
aCquiSition of non-ContRol-linG owneRShiP inteReStS 0 0 0 0 0 0 0 0 547 547
ChanGe in non-ContRollinG owneRShiP inteReStS (note 2) 0 0 0 0 0 0 13 312 13 312 -18 073 -4 761
ToTal change in ownership in subsidiaries 0 0 0 0 0 0 13 312 13 312 -18 073 -4 761
equiTY aT 31 december 2009 10 172 105 572 -117 8 821 -11 861 84 70 822 183 492 23 155 206 648

48 RS Platou aSa / annual RePoRt 2010
noTeS To The conSolidaTed financial
STaTemenTSACCOUNTING prINCIplesInfoRmatIon aBout the comPanyRS Platou ASA is a public limited company registered in Norway. The company’s head office is located at Haakon VII’s gate 10, 0119 Oslo, Norway. The company’s consolidated financial statements for the accounting year 2010 comprise the company and its subsidiaries (collectively referred to as the Group, and individually as a Group company), together with the Group’s interests in associated companies (see note 2 for a list of subsidiary companies). The company’s business activities are described in note 2.
BasIs foR the PRePaRatIon of the fInancIal statementsThe consolidated financial statements have been prepared in accordance with International Financial Reporting Standards (IFRSs) and appropriate interpretations as adopted by the EU for application as at 31 December 2010, and additional notification or disclosure requirements under the Norwegian Accounting Act, also as at 31 December 2010.
The proposed consolidated financial statements were approved by the company’s Board of Directors and CEO on the date the balance sheet was signed. The consolidated financial statements will be considered for final approval by the Annual General Meeting in May 2011.
The consolidated financial statements of RS Platou ASA are prepared on the basis of historical cost, with the exception of the following assets and liabilities, which are measured at fair value: ■ derivatives ■ financial assets recognised at fair value in the consolidated statement of comprehensive income ■ financial assets held for sale
The consolidated financial statements have been prepared applying consistent accounting principles for similar transactions and events in otherwise similar circumstances.
functIonal and PResentatIon cuRRencIesThe consolidated financial statements are presented in Norwegian kroner (NOK), which is the parent company’s functional currency. Unless otherwise stated, all figures are rounded to the nearest thousand (NOK 1 000). The balance sheet figures of subsidiaries with a different functional currency are translated at the exchange rate prevailing on the balance sheet date, and average monthly exchange rates for relevant months are applied for items in the consolidated statement of comprehensive income.
consolIdatIon PRIncIPlesThe consolidated financial statements comprise the financial statements of the Group and its subsidiaries as at 31 December 2010.

49noteS to the ConSolidated finanCial StatementS
Subsidiaries are fully consolidated from the date of acquisition, being the date on which the Group obtains control, and continue to be consolidated until the date when such control ceases. The financial statements of the subsidiaries are prepared for the same reporting period as the parent company, using consistent accounting policies. All intra-Group balances, transactions, unrealised gains and losses resulting from intra-Group transactions and dividends are eliminated.
Losses within a subsidiary are attributed to the non-controlling interests even if that results in a deficit balance. A change in the ownership interest of a subsidiary, without a loss of control, is accounted for as an equity transaction. If the Group loses control over a subsidiary, it: ■ Derecognises the assets (including goodwill) and liabilities of the subsidiary ■ Derecognises the carrying amount of any non-controlling interest ■ Derecognises the cumulative translation differences, recorded in equity ■ Recognises the fair value of the consideration received ■ Recognises the fair value of any investment retained ■ Recognises any surplus or deficit in profit or loss ■ Reclassifies the parent’s share of components previously recognised in other comprehensive income to profit or loss or retained
earnings, as appropriate.
BasIs of consolIdatIon PRIoR to 1 JanuaRy 2010Certain of the above-mentioned requirements were applied on a prospective basis. The following differences, however, are carried forward in certain instances from the previous basis of consolidation: ■ Acquisitions of non-controlling interests, prior to 1 January 2010, were accounted for using the parent entity extension method,
whereby, the difference between the consideration and the book value of the share of the net assets acquired were recognised in goodwill.
■ Losses incurred by the Group were attributed to the non-controlling interest until the balance was reduced to nil. Any further excess losses were attributed to the parent, unless the non-controlling interest had a binding obligation to cover these. Losses prior to 1 January 2010 were not reallocated between non-controlling interests and the parent shareholders.
■ Upon loss of control, the Group accounted for the investment retained at its proportionate share of net asset value at the date control was lost. The carrying values of such investments at 1 January 2010 have not been restated.
use of assumPtIons and estImates In PRePaRatIon of the fInancIal statementsManagement has made estimates and assumptions that have affected the value of assets, liabilities, revenues, costs and information regarding potential obligations. Uncertainty surrounding these assumptions and estimates may result in changes that could cause material adjustments to the book values of assets and liabilities in the future.
The financial statements may also be affected by the choice of accounting principles and the judgement exercised in applying them. This applies, for instance, to the assessment that most of the equity investments are presented as available for sale with change in value through other comprehensive income and not as fair value changes through profit and loss and to the distinctions between operating and finance leases.
estImates and assumPtIonsEstimates and their underlying assumptions are reviewed on an ongoing basis. Revisions to accounting estimates are recognised in the financial statements in the period when the revisions arise. If the revisions also affect future periods, the effect is distributed over current and future periods.
Certain key future assumptions and other important sources affecting the estimates, which are uncertain at the balance sheet date, could result in significant adjustments to the recorded amounts of assets and liabilities. Significant assets and liabilities affected by estimates are as follows:

50 RS Platou aSa / annual RePoRt 2010
defined Benefit PenSion SChemeSPension costs and pension liabilities are computed using a linear earnings profile and anticipated final salary, based on assumptions regarding the discount rate, future salary adjustments, state pensions and benefits, the future return on pension plan assets, and actuarial assumptions on mortality rates, disability and voluntary departures. Due to the long-term perspective built into a defined benefit pension scheme, there is significant uncertainty connected with the calculations. Further details are set out in note 18.
imPaiRment of non-finanCial aSSetSThe Group assesses whether there is a need to write down all non-financial assets at each reporting date. Goodwill and other assets with indefinite lives are tested both on an annual basis and when an indication of a need to make a write-down arises. Other non-financial assets are tested for impairment when indications suggest that the book value is no longer recoverable.
When value in use is employed, management must estimate the anticipated future cash flow from assets or cash-generating units and decide on an appropriate discount rate in order to calculate the present value of the cash flows.
summaRy of sIgnIfIcant accountIng PolIcIes
tRansactIons In foReIgn cuRRencIesTransactions in foreign currencies are converted using the exchange rate prevailing on the date of the transaction. Monetary items in foreign currencies are converted to Norwegian kroner using the exchange rate prevailing on the balance sheet date. Currency adjustments that arise during conversion are recognised in profit or loss. Non-monetary assets and liabilities measured in terms of historical cost in a foreign currency, are converted using the exchange rate prevailing on the transaction date. Non-monetary assets and liabilities measured at fair value, are converted to Norwegian kroner using the exchange rate prevailing on the date on which fair value was determined. Changes in exchange rates are recognised in profit or loss on an ongoing basis during the accounting period.
foReIgn oPeRatIonsAssets and liabilities in foreign operations, including goodwill and fair value adjustments that arise on consolidation, are converted to Norwegian kroner using the exchange rate prevailing on the balance sheet date. Revenues and costs of foreign operations are converted to Norwegian kroner using average exchange rates. Exchange rate differences are recognised in equity.
fInancIal InstRumentsGeneRal PRinCiPleS and definitionSRecognition and derecognitionFinancial assets and liabilities are recognised in the balance sheet when the Group becomes a party to the instruments’ contractual provisions. The ordinary purchase or sale of financial assets or liabilities is recognised on the date on which the transaction took place. When a financial asset or a financial obligation is recognised for the first time, it is measured at fair value. First-time recognition includes transaction costs that are directly attributable to the purchase or issue of the financial asset/liability, in those cases where the financial asset/liability is not measured at fair value in profit or loss.
Financial assets are derecognised when the contractual rights to cash flows from the financial asset expire, or when the Group transfers the financial asset as part of a transaction in which all or almost all risks and earnings opportunities linked to the ownership of the asset are transferred.

51noteS to the ConSolidated finanCial StatementS
Definition of amortised costFollowing first-time recognition, investments held to maturity, loans and receivables, and financial liabilities that are not recog-nised at fair value in profit or loss, are carried at amortised cost according to the effective interest method. On calculation of the effective interest rate, an estimate of cash flows is made, and contractual terms and conditions are taken into consideration. The calculation incorporates all fees and interest-related items paid or received between the parties to the contract which are an integral part of the effective interest rate, as well as transaction costs and all other additional payments or discounts.
Definition of fair valueFair value is the amount for which an asset can be traded or a liability settled as part of an arms-length transaction between knowledgeable and independent parties. For financial instruments that are listed on a stock exchange or in another regulated market, fair value is set as the bid price on the last trading day up to and including the balance sheet date, and for an asset that is to be acquired or a liability assumed, the offer price. If the market for a financial instrument is inactive, fair value is set by using valuation methods. Valuation methods include the utilisation of recently completed arms-length market transactions between knowledgeable and independent parties, if such data are available, comparison with the current fair value of another virtually identical instrument, discounted cash flow computations and option models. If the valuation method in question is in common use among participants in the market for the pricing of the instrument, and has provided reliable estimates of prices achieved in actual market transactions, then this method will be applied.
valuation hieRaRChyFinancial instruments are recognised in the balance sheet at fair value as determined by the valuation method. The various levels are defined as follows:
Level 1: Fair value is measured using quoted prices from active markets for identical financial instruments. No adjustment is made in relation to these prices.Level 2: Fair value is measured using observable input criteria other than those employed for Level 1, either directly (in the form of prices), or indirectly (extrapolated from prices).Level 3: Fair value is measured using input criteria that are not based on observable market data (non-observable input).
Financial assets not recognised at fair valueFor financial assets that are not recognised at fair value, an assessment is made on each balance sheet date as to whether there exist objective indications that a financial asset, or Group of financial assets, has incurred a fall in value.
If there are objective indications of a loss as a result of a fall in value, the loss will be measured as the difference between the asset’s carrying value and the present value of the estimated future cash flows, discounted by applying the financial asset’s original effective interest rate (i.e. the effective interest rate calculated on first-time recognition). The loss is recognised in the consolidated statement of comprehensive income.
If, at a later period, the grounds for the loss cease to exist, and this can be linked to an event that occurred after the reduction in value was recognised, the loss is reversed. The reversal cannot exceed the amount of the original amortised cost as recognised in the consolidated statement of financial position.
ClaSSifiCation and meaSuRement of finanCial aSSetS and liaBilitieSIn accordance with IAS 39 (Financial Instruments: Recognition and Measurement), financial instruments within the scope of IAS 39 are classified into the following categories: fair value with value changes in profit or loss, held-to-maturity, available for sale, loans and receivables, and other liabilities.

52 RS Platou aSa / annual RePoRt 2010
Financial assets and liabilities measured at fair value in profit or lossFinancial assets measured at fair value, with value changes in profit or loss, include financial assets held for trading purposes and derivatives. Derivatives, with the exception of a derivative that is an earmarked and effective hedging instrument, and shares that are held primarily for the purposes of selling or buying back in the short-term, are the only financial assets and liabilities classified as held for trading purposes. Gains and losses on investments held for trading purposes are recognised in the consolidated statement of comprehensive income.
Loans and receivablesLoans and receivables, which are not derivative financial assets, with fixed or stipulated payment terms and not subject to trading in an active market are, after first-time recognition, carried at amortised cost. This category mainly comprises customer receivables and other receivables.
Financial investments available for saleFinancial assets available for sale are primarily investments in shares in cases where the total ownership interest in the company is less than 20%, and are not classified as assets and liabilities measured at fair value in profit and loss. The intention of the investment constitutes the main criterion for its classification.
Financial assets classified as available for sale are written down when there is objective evidence suggesting that the asset in question has fallen in value. Objective evidence would include a significant or prolonged decline in the fair value of the investment below its cost. The accumulated loss recognised directly in comprehensive income (the difference between acquisition cost and current fair value less any write-down that has previously been recognised in profit or loss and any amortisation amount) is removed from equity and recognised in profit or loss. If the fair value of a debt instrument classified as available for sale increases during a subsequent period, and the increase can be linked objectively to an event that occurred after the write-down was recognised in profit or loss, the write-down shall be reversed in profit or loss. A write-down recognised in profit or loss for an investment in an equity instrument is not reversed in profit or loss.
fInancIal lIaBIlItIesnon-inteReSt-BeaRinG finanCial liaBilitieSNon-interest-bearing financial liabilities include financial derivatives and other non-interest-bearing liabilities. On initial recognition, a non-interest-bearing financial liability is measured at fair value. On subsequent occasions, it will be measured either at fair value or at amortised cost using the effective interest method.
inteReSt-BeaRinG liaBilitieSAll interest-bearing liabilities are valued on first-time recognition at fair value with a deduction for related transaction costs, and not at fair value in profit or loss. On subsequent occasions, an interest-bearing liability is valued at amortised cost using the effective interest method.
equItyequity and liaBilitieSFinancial instruments are classified as liabilities or equity in accordance with the underlying economical realities.
Interest, dividend, gains and losses relating to a financial instrument classified as a liability will be presented as an expense or income. Amounts distributed to holders of financial instruments that are classified as equity will be recorded directly in equity.

53noteS to the ConSolidated finanCial StatementS
tReaSuRy ShaReSWhen treasury shares are repurchased, the purchase price including directly attributable costs is recognised in equity. Treasury shares are presented as a reduction in equity. Losses or gains on transactions involving treasury shares are not recognised in the statement of comprehensive income.
CoStS of equity tRanSaCtionSTransaction costs directly related to an equity transaction are recognised directly in equity after deducting tax expenses.
Other equity(a) Fair value reservesThe reserves contain total net changes in the fair value of financial instruments classified as available for sale until the investment has been sold or it has been determined that the investment is of no value.(b) Translation differencesTranslation differences arise in connection with exchange-rate differences of consolidated foreign entities.
Exchange-rate differences in monetary amounts (liabilities or receivables) which are in reality a part of a company’s net investment in a foreign entity are also included as translation differences.
If a foreign entity is sold, the accumulated translation difference linked to the entity is reversed and recognised in the statement of comprehensive income in the same period as the gain or loss on the sale is recognised.
deRIvatIvesfoReiGn CuRRenCy deRivativeSThe Group utilises derivatives and foreign exchange futures to hedge risks linked to currency fluctuations. On first-time recogni-tion, such derivatives are valued at fair value on the date on which the contract was entered into, and are also valued at fair value on subsequent occasions. The derivatives are classified as assets when fair value is positive and as liabilities when fair value is negative. The fair value of foreign exchange futures is calculated on the basis of the prevailing exchange rate for contracts with similar profiles.
fIxed assetsFixed assets are measured at acquisition cost with a deduction for accumulated depreciation and write-downs. When assets are sold or transferred, the value in the balance sheet is derecognised and any losses or gains are recorded in profit or loss.
The acquisition cost for fixed assets is the purchase price, including charges/taxes and costs directly linked to the process of making the asset ready for use. Costs incurred after the asset has been in use, such as ongoing maintenance costs, are expensed as incurred, but other expenses anticipated to result in future economic benefits are capitalised. Depreciation is calculated using the straight line method and by applying an economic life appropriate to the asset in question. The depreciation period and method of calculation is assessed on an annual basis. A residual value is estimated at each year-end, and changes to such estimates are recorded in the financial statements as an estimate change. IntangIBle assetsIntangible assets acquired separately are measured on initial recognition at cost. The cost of intangible assets acquired in a business combination is its fair value as at the date of acquisition. Following initial recognition, intangible assets are carried at cost less any accumulated amortisation and accumulated impairment losses, if any.

54 RS Platou aSa / annual RePoRt 2010
Intangible assets are amortised over their economic life and are tested for impairment if any indications of impairment should arise. The depreciation period and calculation method are reassessed annually. Changes to the depreciation method and/or period are treated as a change in estimate.
BusIness comBInatIons and goodWIllIn the event of a business combination the purchase method is employed.
GoodwillBusiness combinations are accounted for using the acquisition method. The cost of an acquisition is measured as the aggregate of the consideration transferred, measured at fair value at the acquisition date and the amount of any non-controlling interest in the acquiree. For each business combination, the acquirer measures the non-controlling interest in the acquiree either at fair value or at the proportionate share of the acquiree’s identifiable net assets. Acquisition costs incurred are expensed and included in administrative expenses.
When the Group acquires a business, it assesses the financial assets and liabilities assumed for appropriate classification and designation in accordance with the contractual terms, economic circumstances and pertinent conditions as at the acquisition date. This includes the separation of embedded derivatives in host contracts by the acquiree.
If the business combination is achieved in stages, the acquisition date fair value of the acquirer’s previously held equity interest in the acquiree is re-measured to fair value at the acquisition date through profit or loss. Any contingent consideration to be transferred by the acquirer will be recognised at fair value at the acquisition date. Subsequent changes to the fair value of the contingent consideration which is deemed to be an asset or liability, will be recognised in accordance with IAS 39 either in profit or loss or as a change to other comprehensive income. If the contingent consideration is classified as equity, it will not be re-measured until it is finally settled within equity.
Goodwill is initially measured at cost being the excess of the aggregate of the consideration transferred and the amount recognised for non-controlling interest over the net identifiable assets acquired and liabilities assumed.
If this consideration is lower than the fair value of the net assets of the subsidiary acquired, the difference is recognised in profit or loss.
After initial recognition, goodwill is measured at cost less any accumulated impairment losses. For the purpose of impairment testing, goodwill acquired in a business combination is, from the acquisition date, allocated to each of the Group’s cash-generating units that are expected to benefit from the combination, irrespective of whether other assets or liabilities of the acquiree are assigned to those units.
Where goodwill forms part of a cash-generating unit and part of the operation within that unit is disposed of, the goodwill associated with the operation disposed of is included in the carrying amount of the operation when determining the gain or loss on disposal of the operation. Goodwill disposed of in this circumstance is measured based on the relative values of the operation disposed of and the portion of the cash-generating unit retained.
WRIte-doWn of fInancIal assetsFinancial assets valued at amortised cost are written down when, on the basis of objective evidence, it is likely that the instrument’s cash flows have been influenced negatively by one or several events that have occurred since the initial recognition of the instrument. The write-down is recorded in profit or loss. If, at a later period, the reason for the write-down ceases to apply, and this can be linked objectively to an event that occurred after the reduction in value was recognised, the earlier write-down is

55noteS to the ConSolidated finanCial StatementS
reversed. The reversal cannot exceed the amount of the original amortised cost, as recognised in the consolidated statement of financial position. The reversal of earlier write-downs is presented as revenue.
emPloyee BenefItsdefined Benefit PenSion SChemeUnder a defined benefit pension scheme, an employer is obliged to pay future pensions of a stipulated amount.
The basis for calculating pension costs is a linear distribution of pension earnings to the likely accumulated obligation at the date of retirement. Costs are calculated based on the year’s accrued pension entitlements after deducting the return on the funds set aside to cover pensions.
Pension obligations administered by a life assurance company are assessed against the pension funds in the scheme. Where the total amount of pension funds is greater than the calculated pension obligation on the balance sheet date, the net value is classified as an asset in the balance sheet if it is likely that the over-financing can be used to offset future obligations. Where the pension obligations are greater than the pension funds, the net obligation is classified as a liability in the balance sheet. Each scheme is assessed separately.
Pension obligations not administered by a life assurance company are entered as liabilities in the balance sheet.
The pension obligations are calculated as the present value of the estimated future pension benefits that, in accounting terms, are regarded as having been accrued on the balance sheet date. When calculating the pension obligation, actuarial and economic factors such as anticipated lifespan, salary growth and early retirement are taken into account. The discount rate is determined based on the 10-year government bond yield on the balance sheet date, with an increment to take into account the relevant term of the obligations, which approximately run for up to 40 years.
Differences in the estimates are accounted for over the average remaining accrual period to the extent that the difference exceeds either 10 % of the pension funds, or 10 % of the pension obligations, whichever is the greater. This assessment is made separately for each scheme.
The pension cost is based on assumptions made at the start of the period. In the accounts, costs related to the accrual of pension entitlements are classified as personnel costs. Pension costs and pension obligations include social security tax.
Gains and losses on curtailment or termination of a defined benefit pension scheme are recognised in profit or loss on when the curtailment or termination takes place.
A curtailment occurs when the Group decides on a significant reduction in personnel included in a scheme, or amends the terms and conditions of a defined benefit pension scheme so that a significant part of current employees’ future pension accruals no longer qualify for benefits, or qualify only for reduced benefits.
The introduction of a new benefit plan or an improvement to a current benefit plan will entail changes to the pension obligation. This will be expensed linearly until the effect of the change has been accrued. The introduction of new schemes or changes to existing schemes which take place with retroactive effect so that employees immediately accrue paid-up policy (or a change in a paid-up policy) are recorded immediately in profit or loss. Gains or losses linked to curtailments, or terminations of, pension plans are recognised in profit or loss when these events occur.

56 RS Platou aSa / annual RePoRt 2010
defined ContRiBution PlanA defined contribution pension plan is a scheme whereby the company pays a fixed premium to a separate entity with no obligation to pay more than the stipulated annual amount. The stipulated amount is a fixed percentage of monthly salaries. In addition to the benefit plan described above, some of the Group’s subsidiaries have made contributions to local pension plans for full-time employees. The pension premium is expensed as it is incurred.
PRovIsIonsA provision is recorded in the financial statements when the Group has an obligation (legal or constructive) as a result of a past event for which it is probable (more likely than not) that a financial settlement will result from such obligation, and that the amount in question can be reliably measured. If the effect is significant, the provision is calculated by discounting anticipated future cash flows using a discount rate before tax that reflects the market’s pricing of the time value of money and, if relevant, the risks specifically linked to the obligation. PRIncIPles foR RecognIsIng RevenuesThe Group’s revenues primarily consist of commissions from sales and purchases, contracting of newbuilds and chartering, syndication and corporate management, stock broking, and consultancy revenues related to financial advisory services.
Revenue is recognised when the Group has a contractual entitlement to commission, normally at the time of completed contractual periods between the principals in the transaction.
Sale and PuRChaSeCommission earned from sale and purchase of existing vessels is invoiced and recognised in profit or loss upon the delivery of the vessel from the seller to the buyer. The commission is normally based on a percentage of the purchase price of the vessel.
newBuildinGSThe commission is normally based on a percentage of the purchase price of the vessel and the commission is invoiced and recognised in profit or loss based on the payment milestones as stipulated in the newbuilding contract negotiated between the ship owner and the yard. The Group normally invoices the yard when the ship owner pays the yard based on the agreed milestones.
ChaRteRinGThe commission earned from chartering is normally based on a percentage of the charter rates as negotiated between the ship owner and the charterer. Invoicing and revenue recognition in profit or loss normally follows the payment from charterer to ship owner as negotiated in the chartering agreement.
SyndiCation and CoRPoRate manaGementWithin the Finance division, there are revenues related to syndication fees from new projects and corporate management fees from existing projects. Syndication fees are normally recognised in profit or loss at the date of invoicing which is usually when the project has been capitalised with necessary debt and equity capital. Corporate management fees are invoiced based on corporate management agreements usually with six months advance payment, and are recognised in profit or loss through monthly income entries through the advanced period.
StoCk BRokinGCommissions related to stock broking are recognised at the execution date for the trade.

57noteS to the ConSolidated finanCial StatementS
ConSultanCy RevenueSConsultancy revenues related to financial advisory services performed by the Markets division are recognised in profit and loss when the services delivered in order to complete an engagement as stated in the engagement letter have been delivered. Any discretionary fees will be recognised in profit or loss when such agreements are entered into following completion of a transaction.
leasIngLeasing contracts in which most of the risks and rewards linked to ownership of the asset are not transferred to the Group are classified as operating leases. Lease payments are classified as operating costs and expensed on a straight line basis. fInancIal Revenues and exPensesFinancial revenues comprise interest income, dividend income and gains on the disposal of financial assets available for sale. Changes in gains from financial derivatives are recorded in profit or loss. Interest income is recognised as it is earned, using the effective interest method.
Dividends are recognised when the shareholders’ right to receive the dividend is approved by the General Meeting.
Financial expenses consist of interest expenses on loans, write-downs of financial assets, and losses on derivatives recorded in profit or loss.
Income taxThe tax charge consists of tax payable and changes in deferred tax. Deferred tax liabilities and deferred tax assets are calculated on the basis of all the recognised differences between the accounting and tax value of assets and liabilities, with the exception of: ■ temporary differences linked to goodwill that are not tax deductible. ■ temporary differences related to investments in subsidiaries, associated companies or jointly controlled companies which the
Group controls, when the temporary differences will be reversed and this is not anticipated to take place in the foreseeable future.
Deferred tax assets are recognised when it is probable that the Group will have sufficient taxable profits in subsequent periods to be able to use the tax assets. The Group recognises deferred tax assets not previously recorded to the extent that it has become likely that the Group can use such deferred tax assets. Similarly, the Group will reduce a deferred tax asset to the extent that the Group no longer considers it likely that it can make use of such deferred tax asset.
Deferred tax is calculated based on anticipated future tax rates that apply to the Group companies in which temporary differences have arisen.
Deferred tax is recognised at nominal value and is classified as financial non-current assets(long-term liabilities) in the balance sheet.
Tax payable and deferred tax are recognised in equity to the extent that the tax items relate to equity transactions.
eaRnIngs PeR shaReThe Group presents ordinary and diluted earnings per share for the Group’s ordinary shares.

58 RS Platou aSa / annual RePoRt 2010
segment RePoRtIngAn operational segment is a part of the Group that conducts business activities which are able to generate revenues and costs, including revenues and costs from transactions made with other Group segments, and where separate financial information is available (see note 2). All operating profit and loss related to the operational segments are reviewed on a regular basis by the Group’s Managing Director in order to evaluate the segments’ results and to allocate resources to them.
There is no difference between the valuation rules used in connection with segment reporting and the valuation rules used in preparing the consolidated financial statements.
A segment represents a part of the Group that carries a different risk and return than the other segments within the Group.
accountIng standaRds and InteRPRetatIons Issued, But not aPPlIed.There are several new standards, amendments and interpretations that have not come into force for the year ended 31 December 2010, and which have not been applied in the preparation of these consolidated financial statements. The company has not carried out a comprehensive impact analysis of the new standards and interpretations, but provisional analyses suggest that these would have no material effect on the financial statements presented here.
neW accountIng standaRdsIfRss and IfRIcs Issued But not yet effectIveamendmentS to ifRS 7 finanCial inStRumentS - diSCloSuReSThe amendment relates to disclosure requirements for financial assets that are derecognised in their entirety, but where the entity has a continuing involvement. The amendments will assist users in understanding the implications of transfers of financial assets and the potential risks that may remain with the transferor. The amended IFRS 7 is effective for accounting periods beginning on or after 1 July 2011, but the standard is not yet approved by the EU. The Group expects to implement the amended IFRS 7 as of 1 January 2012.
ifRS 9 finanCial inStRumentSIFRS 9 replaces the classification and measurement rules in IAS 39 Financial Instruments- Recognition and measurement for financial instruments. According to IFRS 9 financial assets with basic loan features shall be measured at amortised cost, unless one opts to measure these assets at fair value. All other financial assets shall be measured at fair value. The classification and measure-ment of financial liabilities under IFRS 9 is a continuation from IAS 39, with the exception of financial liabilities designated at fair value through profit or loss (Fair value option), where change in fair value relating to own credit risk shall be separated and presented in other comprehensive income. IFRS 9 is effective for annual periods beginning on or after 1 January 2013, but the standard is not yet approved by the EU. The Group expects to apply IFRS 9 as of 1 January 2013.
Amendments to IFRIC 14 IAS 19 The Limit on a Defined Benefit Asset, Minimum Funding Requirements and their Interaction - Prepayments of a Minimum funding Requirement
The amendment to IFRIC 14 intends to correct an unintended consequence of IFRIC 14 IAS 19 The Limit on a Defined Benefit Asset, Minimum Funding Requirements and their Interaction. This amendment will allow entities to recognise a prepayment of pension contributions as an asset rather than as an expense. The amendment is effective for accounting periods beginning on or after 1 January 2011. The Group expects to implement the amendment as of 1 January 2011.

59noteS to the ConSolidated finanCial StatementS
annual imPRovementS PRojeCt 2010The IASB issued amendments to its standards and the related Basis for Conclusions in its annual “improvements to IFRSs”. The improvement project is an annual project that provides a mechanism for making necessary but non-urgent amendments. The improvements are effective for annual periods beginning on 1 July 2010 or later, but the improvements are not yet approved by the EU. The Group plans to implement the amendments from 1 January 2011.
■ IFRS 3Business Combinations: ‐ Clarifies that the amendments to IFRS 7, IAS 32 and IAS 39, that eliminate the exemption for contingent consideration, do not apply to contingent consideration that arose from business combinations whose acquisition dates precede the application of IFRS 3(R).
‐ Introduces a limit on the scope of the measurement choices for components of non-controlling interests. ‐ Clarification regarding the requirements of an entity (in a business combination) to account for the replacement of the acquiree’s share-based payment transaction. If the entity replaces the acquiree’s awards that expire as a consequence of the business combination, these are recognised as post-combination expenses.
■ IFRS 7 Financial Instruments – Disclosures: ‐ Emphasises the interaction between quantitative and qualitative disclosures and the nature and extent of risks associated with financial instruments. In addition changes are made to disclosure requirements relating to quantitative information and to credit risk.
■ IAS 1 Presentation of Financial Statements ‐ Clarifies that an entity shall present an analysis of other comprehensive income for each component of equity, either in the statement of changes in equity or in the notes to the financial statements.
■ IAS 27 Consolidated and Separate Financial Statements: ‐ Clarifies that the consequential amendments from IAS 27 made to IAS 21, IAS 28 and IAS 31, apply prospectively for annual periods beginning on or after 1 July 2009 or earlier when IAS 27 is applied early.
■ IAS 34 Interim Financial Reporting ‐ Provide guidance to illustrate how to apply disclosure principles in IAS 34 and add disclosure requirements concerning circumstances likely to affect fair values of financial instruments and their classification, transfers of financial instruments between different levels of the fair value hierarchy, changes in classification of financial assets and changes in contingent liabilities and assets.
■ IFRIC 13 Customer Loyalty Programmes ‐ Clarifies that when the fair value of award credits is measured based on the value of the awards for which they could be redeemed, the amount of discounts or incentives otherwise granted to customers not participating in the award credit scheme, is to be taken into account.

60 RS Platou aSa / annual RePoRt 2010
OVerVIew Of sIGNIfICANT sUbsIDIArIesthe followinG SuBSidiaRieS aRe inCluded in the ConSolidated aCCountS:
31.12.2010 31.12.2009
ComPany (inCludinG SuBSidiaRieS wheRe Rel-evant)
CountRy of inCoRPoRa-tion
main aCtivity ShaRe-holdinG
votinG RiGhtS
ShaRe-holdinG
votinG RiGhtS
RS Platou offShoRe aS noRway offShoRe BRokinG 100,00 % 100,00 % 100,00 % 100,00 %
RS Platou eConomiC
ReSeaRCh aS
noRway eConomiC ReSeaRCh 100,00 % 100,00 % 100,00 % 100,00 %
RS Platou ShiPBRokeRS aS noRway ShiPBRokinG 100,00 % 100,00 % 100,00 % 100,00 %
RS Platou finanS aS noRway finanCial SeRviCeS 50,01 % 50,01 % 50,01 % 50,01 %
RS Platou Real eState aS noRway finanCial SeRviCeS 31,50 % 50,50 % 31,50 % 50,50 %
RS Platou (uSa) inC. uSa offShoRe BRokinG 100,00 % 100,00 % 100,00 % 100,00 %
lone StaR, R.S. Platou inC. uSa ShiPBRokinG 71,10 % 71,10 % 63,80 % 63,80 %
RS Platou (SinGaPoRe) Pte. ltd. SinGaPoRe ShiP/offShoRe BRokinG 100,00 % 100,00 % 100,00 % 100,00 %
RS Platou (niGeRia) ltd niGeRia offShoRe BRokinG 99,00 % 99,00 % 99,00 % 99,00 %
the StewaRt GRouP ltd enGland offShoRe BRokinG 100,00 % 100,00 % 100,00 % 100,00 %
RS Platou llP enGland ShiPBRokinG 51,00 % 51,00 % 51,00 % 51,00 %
RS Platou maRketS noRGe inveStment BankinG 100,00 % 100,00 % 99,57 % 99,57 %
RS Platou hellaS ltd CyPRuS ShiPBRokinG 51,00 % 51,00 % 51,00 % 51,00 %
RS Platou Geneve (dRy) Sa SwitzeRland ShiPBRokinG 100,00 % 100,00 % 80,00 % 80,00 %
RS Platou ASA has actual control over RS Platou Real Estate AS.
In 2010 the group acquired an additional 20,0 % ownership interest in RS Platou Finans (Singapore) Pte. Ltd, an additional 7,3 % ownership interest in Lone Star, RS Platou Inc and an additional 0,4 % in RS Platou Markets AS. The acquisitions of non-controlling interests have been accounted for as equity transactions. Please refer to statement of changes in equity.
In 2009 the group acquired an additional 49,6 % ownership interest in RS Platou Markets AS. Please refer to statement of changes in equity.

61noteS to the ConSolidated finanCial StatementS
seGMeNT repOrTINGoPeRatIng segmentsFor management purposes the group has organised its activities into four operating segments:
shIPBRoKIngThe Shipbroking segment comprises activities relating to the purchase and sale of ships, newbuildings and chartering of dry cargo vessels, tanker vessels and industrial shipping vessels.
offshoReThe Offshore segment comprises activities relating to the sale and purchase, newbuilding and chartering of offshore related vessels.
fInanceThe Finance segment identifies shipping, offshore and real estate projects, for which equity capital and debt capital are syndicated. For existing projects, Finance is also responsible for project and corporate management.
maRKetsMarkets is licensed and supervised by the Norwegian Financial Supervisory Authority (“Finanstilsynet”). Markets offers a wide range of services within equity sales and trading, fixed income, research and corporate finance to both domestic and foreign institutional clients and investors.
The accounting principles of the reportable segments are the same as the Group’s accounting principles described in note 1.The Group assesses performance based on profit or loss before financial items.
Transactions between the operating segments are eliminated in the consolidated financial statements. Such transactions are based on market conditions. The operating segments’ operating profit or loss includes operating income and operating expenses from transactions between the operating segments.
The Group’s reportable segments are strategic business areas offering different products and services. Segment information pre-sented is consistent with the Group’s internal management reporting.
Assets, liabilities and financial items are not divided between the segments and are not reported upon at Group level. The Group considers that this is not significant information for understanding and analysing the segments within the RS Platou Group.

RS Platou aSa / annual RePoRt 201062
key fiGuReS PeR oPeRatinG SeGment 1 januaRy – 31 deCemBeR, fiGuReS in nok 1 000
ShiPBRokinG offShoRe finanCe maRketS unalloCated total
2010 2009 2010 2009 2010 2009 2010 2009 2010 2009 2010 2009
oPeRatinG RevenueS 339 054 308 241 356 660 360 529 65 493 62 098 231 946 108 703 -902 -2 970 992 250 836 601
otheR RevenueS 7 097 5 739 338 314 396 1 537 1 052 0 -7 015 -6 890 1 867 699
total oPeRatIng Revenues 346 151 313 980 356 998 360 843 65 889 63 635 232 998 108 703 -7 918 -9 860 994 117 837 300
oPeRatIng PRofIt BefoRe Bonus 160 867 140 171 233 131 231 702 36 000 36 535 75 385 -39 141 -4 787 -5 426 500 596 363 840
oPeRatIng PRofIt afteR Bonus 73 603 57 555 109 006 106 048 27 036 22 942 19 664 -88 779 -4 787 -5 663 224 522 92 103
net finanCial ReSult -43 954 -138 974 -43 954 -138 974
tax exPenSe 60 370 -5 964 60 370 -5 964
profiT afTer Tax from conTinuing operaTions 120 198 -40 907
oPeRatinG RevenueS PeR GeoGRaPhiCal SeGment 1 januaRy – 31 deCemBeR, fiGuReS in nok 1.000
GeoGRaPhiCal SeGment: total oPeRatinG RevenueS
2010 2009
noRway 313 244 351 794
uk 73 689 35 911
euRoPe 191 152 170 393
uSa 43 298 36 302
aSia 337 832 150 096
afRiCa 16 294 74 488
otheR 18 609 18 317
ToTal 994 117 837 300
Operating revenues from external customers are categorised by where the customers are located.
InfoRmatIon aBout maJoR customeRsNo single customer represents revenue amounting to 10 % or more of the revenue in any of the reportable segments.

63noteS to the ConSolidated finanCial StatementS
expeNses reGArDING reMUNerATION TO eMplOyees AND seNIOr MANAGeMeNTtotal SalaRieS and PayRoll CoStS 1 januaRy – 31 deCemBeR, fiGuReS in nok 1 000
2010 2009
SalaRieS 246 198 225 386
PenSion CoSt defined Benefit SChemeS (note 18) 18 574 16 153
PenSion CoSt defined ContRiBution SChemeS 1 958 10 609
otheR PeRSonnel Related CoStS 23 021 30 769
ToTal salarY and paYroll cosTs 289 751 282 917
BonuSeS 276 074 271 736
ToTal salarY and paYroll cosTs including bonuses 565 825 554 653
aveRaGe numBeR of full-time emPloyeeS emPloyed duRinG the finanCial yeaR:
2010 2009
noRway 190 186
ameRiCaS 26 26
afRiCa 11 11
aSia 66 51
euRoPe 53 38
ToTal 346 312
RemuneRatIon to senIoR management and BoaRd memBeRsRemuneRation to SenioR manaGement 1 januaRy – 31 deCemBeR 2010, fiGuReS in nok
2010 SalaRy BonuSBenefitS
in kind
PenSion CoSt ReCoGniSed in
the PeRiod
total RemuneR-
ation
gRouP management
PeteR m. ankeR, Ceo 1 124 283 6 200 000 52 665 103 097 7 480 045
wilhelm l. holSt, Coo 760 756 7 926 000 32 489 111 806 8 831 051
ChRiStian BaRtz -johanneSen, Coo (SinGaPoRe) 906 158 4 942 680 61 784 0 5 910 622
RiChaRd fulfoRd-Smith, Coo (london) 931 700 7 919 450 0 0 8 851 150
ChRiStian weSSel SvenSSon, head of finanCe 900 000 1 077 800 20 688 128 528 2 127 016
eRlend Bondø, Cfo 812 964 1 000 000 12 707 70 100 1 895 771
ToTal remuneraTion 5 435 861 29 065 930 180 333 413 531 35 095 655

64 RS Platou aSa / annual RePoRt 2010
RemuneRation to SenioR manaGement 1 januaRy – 31 deCemBeR 2009, fiGuReS in nok
SalaRy BonuS BenefitS in kind
PenSion CoSt ReCoGniSed
in the PeRiod
totalRemuneR-
ation
gRouP management
PeteR m. ankeR, Ceo 1 123 839 8 750 000 43 477 100 847 10 018 163
wilhelm l. holSt, Coo 760 756 6 000 000 40 799 109 343 6 910 898
ChRiStian BaRtz -johanneSen, Coo (SinGaPoRe) 559 844 3 671 490 455 215 0 4 686 549
RiChaRd fulfoRd-Smith, Coo (london) 1 716 050 0 0 0 1 716 050
ChRiStian weSSel SvenSSon, head of finanCe 908 212 1 618 061 19 212 114 923 2 660 408
eRik helBeRG, head of maRketS diviSion, fRom nov.2009 250 000 0 3 090 22 995 276 085
andeRS RønninGen, head of maRketS diviSion to nov. 2009 750 000 2 013 544 22 154 94 361 2 880 059
eRlend Bondø, Cfo, fRom may 2009 572 719 0 12 707 82 280 667 706
PeR eGeland, Cfo, inCl. may 2009 1 271 888 625 002 12 320 127 846 2 037 056
ToTal remuneraTion 7 913 308 22 678 097 608 974 652 595 31 852 974
The board members Marianne Lie and Birger Nergaard have each received director’s fee of NOK 100 000 in 2010 and 2009. The rest of the board members have not received director’s fee.
Senior management of the Group received a bonus based on individual performance and the overall profitability of the Group.Group management participate in the general pension scheme described in the note on Pensions. According to the general pension scheme, management is entitled to a pension of 70 % of the wage upon retirement, up to 12G, from the age of 67, based on an employ-ment period of 30 years. For shorter employment periods, the benefit will be proportionally reduced.
The general pension scheme also includes disability and surviving relative’s pension. The benefits for disability and surviving relative’s pension amount to the same as the retirement benefits.
The management of the Group has not received any remuneration or other financial benefits from other Group companies than what is shown above. No supplementary payments have been given for special services outside the normal functions for a manager.
No loans or guarantees have been provided to members of the senior management team, board members or members of other elected corporate bodies.
seveRance agReement – ceoThe CEO is entitled to 3 years’ severance pay.

65noteS to the ConSolidated finanCial StatementS
declaRatIon RegaRdIng the deteRmInatIon of salaRy and otheR RemuneRatIon to senIoR managementThe Group applies competitive remuneration principles that contribute toward attracting, developing and retaining highly qualified staff.
All employees in the Group participate in the group wide bonus schemes. In line with the long established practice within the Group, MNOK 276,1 has been allocated for bonuses for 2010. The allocation is based on operating profit before bonus. Remuneration to senior management is based on the same principles as remuneration to other employees. Remuneration to employees consists of a fixed salary and a variable bonus. The bonus pools are calculated on the basis of the each separate company’s earnings, as well as the individual’s performance and achieved results. The bonus payments, including social security tax, should not amount to more than 50 % of the company’s operating profit before bonus. Each separate company’s Board establishes the total basis for the bonus, the bonus to the CEO and the distribution to each division. The CEO and senior management subsequently decide the bonus for each employee.
All employees in RS Platou ASA are members of the company’s Group pension scheme.
The company currently has no share option plan for employees but considers introducing such a plan.
Senior management and brokers may receive other benefits such as free newspapers, telephone, car allowance and other employee benefits. Such benefits are provided on an individual basis.
ShaReS owned diReCtly oR By CloSe aSSoCiateS to the SenioR manaGement and BoaRd memBeRS:
31.12.2010 31.12.2009
gRouP management
PeteR m. ankeR, Ceo 2 397 334 2 397 334
wilhelm l. holSt, Coo 1 834 392 1 834 392
ChRiStian BaRtz -johanneSen, Coo (SinGaPoRe) 1 095 300 1 095 300
RiChaRd fulfoRd-Smith, Coo (london) 2 034 392 2 034 392
eRik helBeRG, head of maRketS diviSion 66 667 66 667
eRlend Bondø, Cfo 50 000 0
The board of direcTors
RaGnaR hoRn, ChaiRman of the BoaRd 4 815 360 4 815 360
maRianne aamodt 711 227 711 227
GuStave BRun-lie 1 985 893 1 985 893
maRianne lie 13 334 13 334
BiRGeR neRGaaRd 1 000 001 1 000 001
ToTal 16 003 900 15 953 900
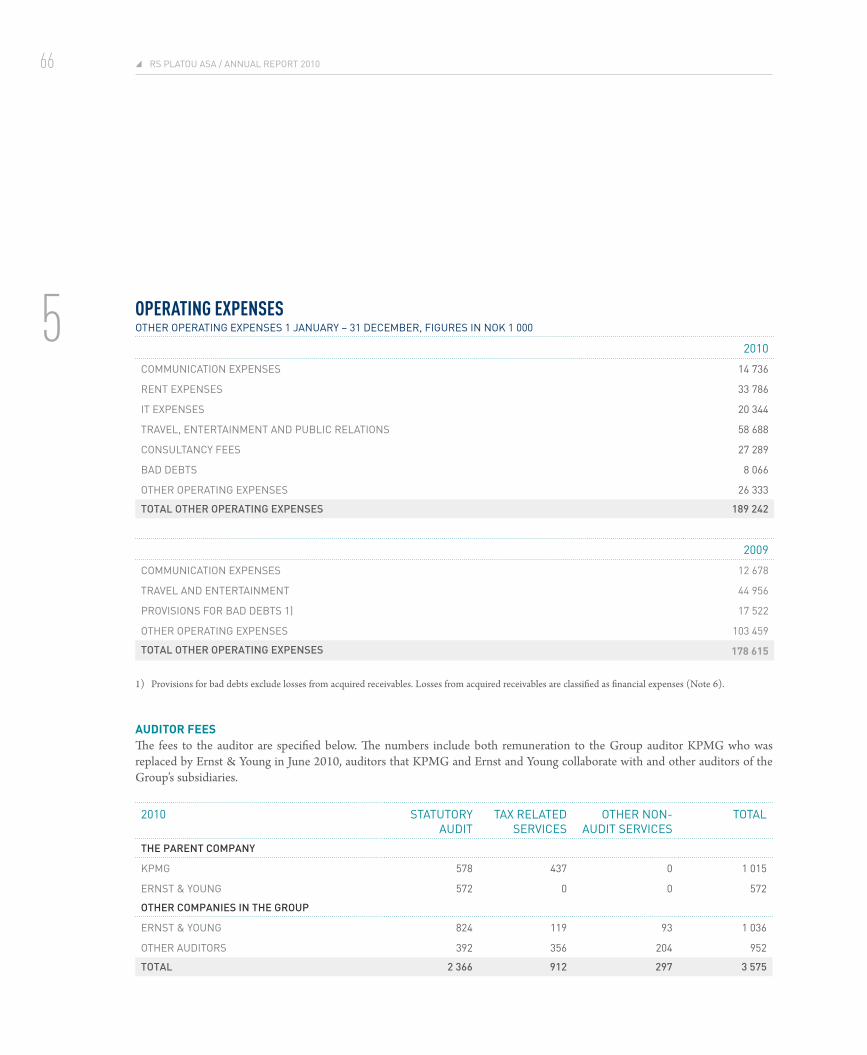
66 RS Platou aSa / annual RePoRt 2010
OperATING expeNsesotheR oPeRatinG exPenSeS 1 januaRy – 31 deCemBeR, fiGuReS in nok 1 000
2010
CommuniCation exPenSeS 14 736
Rent exPenSeS 33 786
it exPenSeS 20 344
tRavel, enteRtainment and PuBliC RelationS 58 688
ConSultanCy feeS 27 289
Bad deBtS 8 066
otheR oPeRatinG exPenSeS 26 333
ToTal oTher operaTing expenses 189 242
2009
CommuniCation exPenSeS 12 678
tRavel and enteRtainment 44 956
PRoviSionS foR Bad deBtS 1) 17 522
otheR oPeRatinG exPenSeS 103 459
ToTal oTher operaTing expenses 178 615
1) Provisions for bad debts exclude losses from acquired receivables. Losses from acquired receivables are classified as financial expenses (Note 6).
audItoR feesThe fees to the auditor are specified below. The numbers include both remuneration to the Group auditor KPMG who was replaced by Ernst & Young in June 2010, auditors that KPMG and Ernst and Young collaborate with and other auditors of the Group’s subsidiaries.
2010 StatutoRy audit
tax Related SeRviCeS
otheR non- audit SeRviCeS
total
The parenT companY
kPmG 578 437 0 1 015
eRnSt & younG 572 0 0 572
oTher companies in The group
eRnSt & younG 824 119 93 1 036
otheR auditoRS 392 356 204 952
ToTal 2 366 912 297 3 575

67noteS to the ConSolidated finanCial StatementS
2009 StatutoRy audit
tax Related SeRviCeS
otheR non- audit SeRviCeS
total
The parenT companY
kPmG 1 297 0 524 1 821
oTher companies in The group
kPmG 258 0 12 270
otheR auditoRS 695 147 51 893
total 2 250 147 587 2 984
ToTal 2 366 912 297 3 575
The fee to the auditor does not include value added tax.
fINANCIAl INCOMe AND fINANCIAl expeNsefinanCial inCome and finanCial exPenSeS 1 januaRy – 31 deCemBeR, fiGuReS in nok 1 000
finanCial inCome 2010 2009
ShaRe of PRofit fRom aSSoCiateS (note 11) 0 1 246
inteReSt inCome 10 983 25 029
dividendS ReCeived 0 87
inCome Related to finanCial inStRumentS 0 81 411
otheR finanCial inCome 3 521 5 330
ToTal financial income 14 505 113 105
finanCial exPenSeS 2010 2009
ShaRe of loSS fRom aSSoCiateS (note 11) -996 0
inteReSt exPenSeS -13 031 -25 657
otheR finanCial exPenSeS -10 709 -40 389
loSSeS fRom aCquiRed ReCeivaBleS -33 722 -186 032
ToTal financial expenses -58 459 -252 079
neT financial iTems -43 954 -138 974
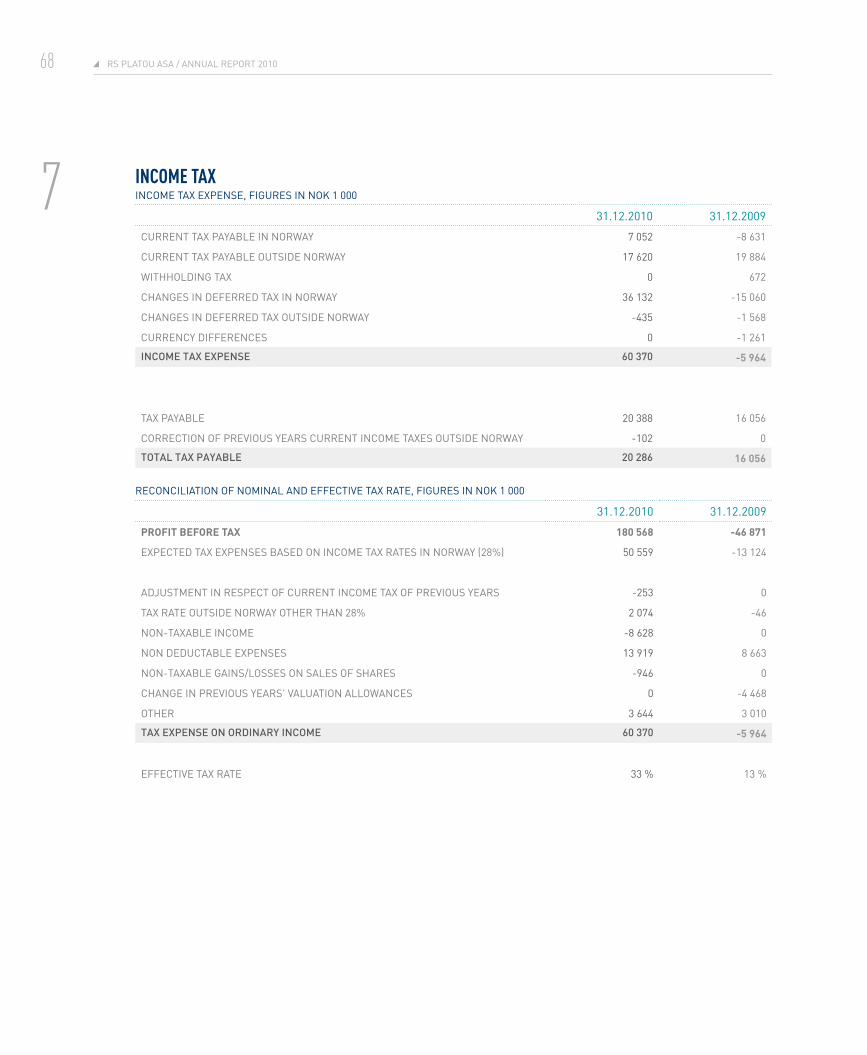
RS Platou aSa / annual RePoRt 201068
INCOMe TAxinCome tax exPenSe, fiGuReS in nok 1 000
31.12.2010 31.12.2009
CuRRent tax PayaBle in noRway 7 052 -8 631
CuRRent tax PayaBle outSide noRway 17 620 19 884
withholdinG tax 0 672
ChanGeS in defeRRed tax in noRway 36 132 -15 060
ChanGeS in defeRRed tax outSide noRway -435 -1 568
CuRRenCy diffeRenCeS 0 -1 261
income Tax expense 60 370 -5 964
tax PayaBle 20 388 16 056
CoRReCtion of PReviouS yeaRS CuRRent inCome taxeS outSide noRway -102 0
ToTal Tax paYable 20 286 16 056
ReConCiliation of nominal and effeCtive tax Rate, fiGuReS in nok 1 000
31.12.2010 31.12.2009
PRofIt BefoRe tax 180 568 -46 871
exPeCted tax exPenSeS BaSed on inCome tax RateS in noRway (28%) 50 559 -13 124
adjuStment in ReSPeCt of CuRRent inCome tax of PReviouS yeaRS -253 0
tax Rate outSide noRway otheR than 28% 2 074 -46
non-taxaBle inCome -8 628 0
non deduCtaBle exPenSeS 13 919 8 663
non-taxaBle GainS/loSSeS on SaleS of ShaReS -946 0
ChanGe in PReviouS yeaRS' valuation allowanCeS 0 -4 468
otheR 3 644 3 010
Tax expense on ordinarY income 60 370 -5 964
effeCtive tax Rate 33 % 13 %
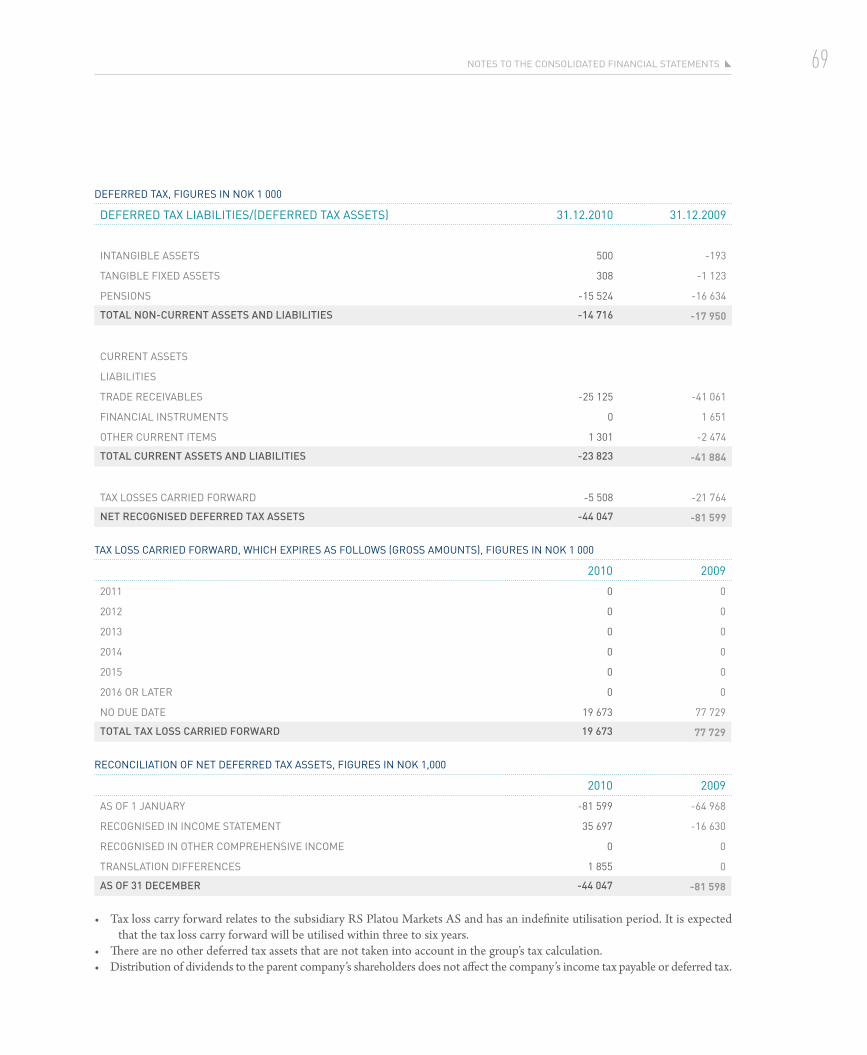
69noteS to the ConSolidated finanCial StatementS
defeRRed tax, fiGuReS in nok 1 000
defeRRed tax liaBilitieS/(defeRRed tax aSSetS) 31.12.2010 31.12.2009
intanGiBle aSSetS 500 -193
tanGiBle fixed aSSetS 308 -1 123
PenSionS -15 524 -16 634
ToTal non-currenT asseTs and liabiliTies -14 716 -17 950
CuRRent aSSetS
liaBilitieS
tRade ReCeivaBleS -25 125 -41 061
finanCial inStRumentS 0 1 651
otheR CuRRent itemS 1 301 -2 474
ToTal currenT asseTs and liabiliTies -23 823 -41 884
tax loSSeS CaRRied foRwaRd -5 508 -21 764
neT recognised deferred Tax asseTs -44 047 -81 599
tax loSS CaRRied foRwaRd, whiCh exPiReS aS followS (GRoSS amountS), fiGuReS in nok 1 000
2010 2009
2011 0 0
2012 0 0
2013 0 0
2014 0 0
2015 0 0
2016 oR lateR 0 0
no due date 19 673 77 729
ToTal Tax loss carried forward 19 673 77 729
ReConCiliation of net defeRRed tax aSSetS, fiGuReS in nok 1,000
2010 2009
aS of 1 januaRy -81 599 -64 968
ReCoGniSed in inCome Statement 35 697 -16 630
ReCoGniSed in otheR ComPRehenSive inCome 0 0
tRanSlation diffeRenCeS 1 855 0
as of 31 december -44 047 -81 598
• Tax loss carry forward relates to the subsidiary RS Platou Markets AS and has an indefinite utilisation period. It is expected that the tax loss carry forward will be utilised within three to six years.
• There are no other deferred tax assets that are not taken into account in the group’s tax calculation.• Distribution of dividends to the parent company’s shareholders does not affect the company’s income tax payable or deferred tax.

70 RS Platou aSa / annual RePoRt 2010
eArNINGs per sHAreThe basic earnings per share is calculated by dividing profit or loss attributable to the owners of the company (RS Platou ASA) of NOK 102 074 844 (NOK -12 244 009 in 2009) by the weighted average number of outstanding ordinary shares through the fiscal year of 40 494 876 (35 389 409 in 2009).
For the purpose of calculating diluted earnings per share, the Group adjusts profit or loss attributable to owners of the company, and the weighted average number of shares outstanding, for the effects of all dilutive potential ordinary shares, such as convertible obligations and share options. There were no such effects in 2009 and 2010.
oveRview of eaRninGS PeR ShaRe, fiGuReS in nok 1 000
2010 2009
PRofit foR the yeaR fRom ContinuinG oPeRationS 102 075 -12 244
profiT for The Year due To The holders of ordinarY shares 102 075 -12 244
diluTed profiT 2010 2009
PRofit foR the yeaR due to the holdeRS of oRdinaRy ShaReS 102 075 -12 244
diluTed profiT for The Year due To The holders of shares in The parenT companY 102 075 -12 244
2010 2009
aveRaGe numBeR of outStandinG ShaReS 40 495 35 389
effeCt of Potential dilution, oRdinaRy ShaReS 0 0
average number of ouTsTanding shares 40 495 35 389
earnings per share 2010 2009
ContinuinG oPeRationS
- oRdinaRy 2,52 (0,35)
- diluted 2,52 (0,35)

71noteS to the ConSolidated finanCial StatementS
prOperTy, plANT AND eqUIpMeNTthe followinG taBle PRovideS an oveRview of PRoPeRty, Plant and equiPment:
2010 2009
PRoPeRty, equiPment and vehi-CleS
PRoPeRty equiP-ment and vehiCleS
total PRoPeRty equiP-ment and vehiCleS
total
CoSt aS of 1 januaRy 10 915 63 717 74 632 10 254 44 981 55 235
additionS 77 19 612 19 688 661 27 635 28 296
diSPoSalS 0 -10 133 -10 133 -8 899 -8 899
exChanGe Rate diffeRenCeS -778 791 13 0 0 0
CoSt aS of 31 deCemBeR 10 214 73 988 84 201 10 915 63 717 74 632
aCCumulated dePReCiation aS of 31
deCemBeR
-817 -31 688 -32 505 -313 -28 310 -28 623
neT book value as of 31 december 9 397 42 299 51 696 10 602 35 407 46 009
dePReCiation foR the yeaR 263 13 511 13 774 297 9 800 10 097
the GRouP uSeS a StRaiGht line dePReCiation method foR all tanGiBle fixed aSSetS SuBjeCt to dePReCiation.
yeaRS
useful economIc lIfe
equiPment and vehiCleS 3-7
non-dePReCiaBle PRoPeRty, Plant and equiPment
CaBin kvitfjell
aRt total
CoSt 3 000 777 3 777
2010 2009
PRoPeRty 9 397 10 602
equiPment and vehiCleS 42 299 35 407
CaBin kvitfjell 3 000 3 000
aRt 777 777
ToTal neT book value properTY,
planT and equipmenT
55 473 49 786
The Group has not entered into any agreements to acquire new assets as of 31 December 2010.

72 RS Platou aSa / annual RePoRt 2010
INTANGIble AsseTsintanGiBle aSSetS at 31 deCemBeR, fiGuReS in nok 1 000
2010 2009
Com-miSSion
ReSeRve
Good-will
total Com-miSSion
ReSeRve
Good-will
total
cost as of 1 JanuaRy 12 909 141 792 154 701 12 909 155 235 168 145
additionS 0 0 0 0 774 774
tRanSlation diffeRenCeS -1 343 483 -860 0 -14 217 -14 222
cosT as of 31 december 11 566 142 275 153 841 12 909 141 792 154 696
accumulated ImPaIRments as of 1 JanuaRy 0 2 294 2 294 0 2 294 2 294
imPaiRmentS foR the yeaR BaSed on imPaiRment teSt 0 0 0 0 0 0
accumulaTed impairmenTs as of 31 december
0 2 294 2 294 0 2 294 2 294
accumulated amoRtIsatIon as of 1 JanuaRy 11 133 0 11 133 8 992 0 8 992
amoRtiSation foR the yeaR 754 0 754 1 832 0 1 832
tRanSlation diffeRenCeS -1 315 0 -1 315 309 0 309
aCCumulated amoRtiSation aS of 31 deCemBeR 10 572 0 10 572 11 133 0 11 133
neT book value 994 139 981 140 976 1 776 139 498 141 274
aCCumulated amoRtiSation and
imPaiRmentS
754 1 832
The commission reserve is amortised according to the contracts’ completion date, the last contract is scheduled for completion in 2012. The commission reserve relates to the cash-generating unit Stewart Group Ltd, within the offshore segment. Commission reserve includes the value in the forward book.

73noteS to the ConSolidated finanCial StatementS
Goodwill PeR aCquiSition / CaSh-GeneRatinG unit
aCquiSi-tion CoSt
imPaiR-mentS
additionS / diSPoSalS
tRanSla-tion dif-
feRenCeS
net Book value 31.12
lone StaR, R.S. Platou inC. (ShiPBRokinG) 4 511 1 208 -319 0 2 985
RS Platou offShoRe aS 1 086 1 086 0 0 0
RS Platou (aSia) Pte ltd. (1) 27 861 0 0 5 917 33 778
StewaRt GRouP ltd (offShoRe) 117 241 0 0 -15 194 102 047
RS Platou maRketS aS (maRketS) 1 172 0 0 0 1 172
ToTal 151 871 2 294 -319 -9 277 139 981
1) Goodwill related to RS Platou (Asia) PTE Ltd is divided 50 % within shipbroking segment and 50 % within offshore segment.
Goodwill is tested for impairment annually. Goodwill is allocated to cash-generating units based on acquisitions within different geographical areas with different market conditions.
The carrying amount of goodwill is allocated to the various cash-generating units (CGU) as shown in the table above.
The recoverable amount of a CGU is based on the CGU’s estimated value in use. The value in use is calculated on the basis of discounted expected future cash flows before tax. The applied discount rate is calculated on a before tax basis, taking into account risks specific to the cash flows.
Estimated cash flows are based on historical profits, budgets and forecasts approved by the management and board in the various CGU’s for the first five years. Beyond a five-year period, stable cash flows without growth are used.
The different discount rates used are based on geographical and other factors for the various CGU’s. The discount rates pre tax WACC used for the various units are as follows:
2010 2009
lone StaR, R.S. Platou inC. 11,19 % 13,45 %
RS Platou offShoRe aS 13,92 %
RS Platou (aSia) Pte ltd. 9,79 % 10,61 %
StewaRt GRouP ltd 12,35 % 13,70 %
RS Platou maRketS aS 13,82 % 13,92 %

74 RS Platou aSa / annual RePoRt 2010
The discount rate is estimated based on previous experiences and a weighted average cost of capital in the businesses. The weighted average cost of capital is calculated under the assumption of 30 % debt ratio and a market interest rate of 5,5 to 6,5 % in the various cash-generating units, dependent among other things on the functional currency of the CGU. The asset capital pricing model (CAPM) is applied when calculating the WACC. The WACC for each CGU and the assumptions for value in use estimates are disclosed in the table below.
CGu lone StaR RS Platou inC
RS Platou (aSia) Pte. ltd
the StewaRt GRouP ltd.
RS Platou maRketS aS
main inPut to
imPaRiment teSt
Board approved 2011
budget with approx same
revenues as in 2010.
Board approved 2011
budget, with slightly
higher revenues than in
2010.
Board approved 2011
budget, with slightly
lower revenues than in
2010.
Board approved 2011
budget with income in-
crease of 50 % from 2010
to 2011.
futuRe BudGet aS-
SumPtionS
2 % increase in revenues
from 2012 - 2015. Same
cost base as in 2011.
no terminal growth.
2 % increase in revenues
from 2012 - 2015. Slight
increase in costs follow-
ing increased head count.
no terminal growth.
2 % increase in revenues
from 2012 - 2015.
Geographical expansion
drives costs up about
7 %. no terminal growth.
2 % increase in revenues
from 2012 - 2015.
increased head count
budgeted in 2011.
no terminal growth.
Wacc (PRe tax) 12,37 % 9,61 % 12,17 % 13,82 %
ConditionS influ-
enCinG waCC
Primarily uS related
activities. Budgets
prepared in uSd. Risk
free rate based on 10
year uS t-bill rate. Beta
higher than norwegian
activities.
Global activities with over
weight of activities in far
east. Both shipping and
offshore exposure. Budg-
ets prepared in SGd. Risk
free rate based on 10
year government bonds.
Primarily global offshore
related exposure. Budg-
ets prepared in GBP. Risk
free rate based on 10
year government bonds.
less income visibility
than other CGus. main
exposure towards global
equity markets. Risk free
rate based on 10 year
government bonds.

75noteS to the ConSolidated finanCial StatementS
INVesTMeNTs IN AssOCIATes RS Platou maRketS aS Sold itS 50,00 % holdinG in RS Platou maRketS StRuCtuRed deRivativeS aS in auGuSt 2010.
CountRy induStRy ShaRe-holdinG
Book value
31.12.2009
additionS / diSPoS-
alS
ShaRe of PRofit
afteR tax
dividend Book value
31.12.2010
RS Platou maRketS
StRuCtuRed
deRivativeS aS
noRway maRketS 0,00 % 1 281 -1 281 0 0 0
Summarised financial information for 2009 of the associate, based on 100% figures:aSSetS liaBili-
tieSequity Rev-
enueSPRofit
afteR tax
RS Platou maRketS StRuCtuRed deRivativeS aS 6 137 3 574 2 563 50 -1 907
ACCOUNTs reCeIVAbleaCCountS ReCeivaBle, fiGuReS in nok 1 000
2010 2009
tRade ReCeivaBleS 365 134 495 002
imPaiRment -100 783 -119 799
otheR ReCeivaBleS 0 -887
Trade receivables/ financial insTrumenTs 264 351 374 316
The allowance for impairment of accounts receivable for 2010 was set at MNOK 101 (2009: MNOK 120). Losses on trade receivables are classified as other operating expenses in the income statement.
the movement in the allowanCe foR imPaiRment loSS iS aS followS:
2010 2009
oPeninG BalanCe 119 799 74 070
PRoviSion Bad deBtS foR the yeaR (note 5 and 6) 41 788 203 554
Bad deBSt ReCoGniSed in the yeaR -61 296 -158 079
ReveRSal of PReviouS PRoviSion 491 254
closing balance 100 783 119 799
Credit risk and currency risk regarding trade receivables are further described in note 19. As at 31 December, the Group had the following trade receivables specified by maturity:
total not due <30 d 30-60d 60-90d >90d
2010 264 351 46 363 55 839 9 652 37 452 115 046
2009 374 316 128 849 71 574 69 225 26 342 78 326

76 RS Platou aSa / annual RePoRt 2010
OTHer sHOrT-TerM reCeIVAblesfiGuReS in nok 1 000
2010 2009
SiGn-on feeS 29 742 17 393
PRePaid exPenSeS 7 875 3 578
aCCRued, non-invoiCed RevenueS 10 904 14 129
otheR 17 687 11 730
ToTal shorT-Term receivables 66 208 46 830
fINANCIAl INVesTMeNTsBook valueS, fiGuReS in nok 1 000
2010 2009
availaBle-foR-Sale 16 466 16 711
ShaReS held foR tRadinG PuRPoSeS 6 111 6 279
ToTal 22 577 22 989
The book value is equal to the fair value.
avaIlaBle-foR-sale InvestmentsOf the shares classified as available-for-sale, the investment in Mosvold Drilling PLC makes up the majority of the investments.
2010 level 1 level 2 level 3 total
Civita aS 0 0 350 350
Investments WIth less than 10% shaReholdIng
moSvold dRillinG PlC 0 0 14 256 14 256
tRiCom 0 1 750 0 1 750
noRdiC BeveRaGe ltd 0 5 0 5
RSPf 1 aS 0 0 105 105
ToTal 0 1 755 14 711 16 466
2009 level 1 level 2 level 3 total
Civita aS 0 0 250 250
Investments WIth less than 10% shaReholdIng
moSvold dRillinG PlC 0 14 256 14 256
tRiCom 0 1 750 0 1 750
noRdiC BeveRaGe ltd 0 5 0 5
otheR 0 0 450 450
ToTal 0 1 755 14 956 16 711

77noteS to the ConSolidated finanCial StatementS
shaRes held foR tRadIngmaRket value, fiGuReS in nok 1 000
2010 2009
level 1 level 2 level 3 level 1 level 2 level 3
3,0 % andel i volStad diS ii 0 0 4 760 0 0 4 760
eltek aSa 848 0 0 1 778 0 0
maRket value, fallaCy 505 0 0 -257 0 0
ToTal markeT value 1 352 0 4 760 1 521 0 4 760
CoSt PRiCe, fiGuReS in nok 1 000
2010 2009
level 1 level 2 level 3 level 1 level 2 level 3
3,0 % andel i volStad diS ii 0 0 5 576 0 0 5 576
eltek aSa 5 249 0 0 11 213 0 0
faiR value, fallaCy 426 0 0 -208 0 0
ToTal cosT price 5 675 0 5 576 11 005 0 5 576
SenSitivity, effeCtS in nok 1 000
ChanGe in ShaRe PRiCe effeCt on PRofit BefoRe tax effeCt on equity
2010 +5 % 306 86
-5 % -306 -86
2009 +5 % 314 88
-5 % -314 -88
CAsH AND CAsH eqUIVAleNTsfiGuReS in nok 1 000
2010 2009
CaSh 38 30
ShoRt-teRm dePoSitS 280 677 158 016
ToTal cash and cash equivalenTs recognised in
The consolidaTed sTaTemenT of financial posiTion
280 715 158 046
ToTal cash and cash equivalenTs recognised in
The consolidaTed sTaTemenT of cash flow
280 715 158 046
RS Platou ASA had undrawn multicurrency overdraft facilities of MNOK 110 at 31 December 2010 (31 December 2009: MNOK 3 and USD 2,5 million). A factoring agreement has been entered into whereby the RS Platou ASA’s current and future receivables, bank deposits and shares in material subsidiaries are included as pledges for the overdraft facility.
RS Markets AS had undrawn overdraft facilities of MNOK 100 at 31 December 2010. A factoring agreement has been entered into whereby the company’s current and future receivables and bank deposits are included as pledges for the overdraft facility.RS Platou (Asia) Pte Ltd had an undrawn overdraft facility of SGD 100 000 at December 2010.

78 RS Platou aSa / annual RePoRt 2010
sHAre CApITAl, sHAreHOlDers AND DIVIDeNDthe ComPany haS one ClaSS of ShaReS at a nominal value of nok 0,25.all outStandinG ShaReS have equal votinG RiGhtS.
ShaRe total ShaReS faiR value Book value
ShaReS 1 januaRy 2009 34 021 8 505 8 505
ShaRe iSSue duRinG 2009 6 667 1 667 1 667
shaRes 31 decemBeR 2009 40 688 10 172 10 172
ShaRe iSSue duRinG 2010 283 71 71
shaRes 31 decemBeR 2010 40 971 10 243 10 243
tReaSuRy ShaReS owned By RS Platou aSa 329 82 82
movement in the owneRShiP of own ShaReS:
tReaSuRy ShaReS numBeR tReaSuRy ShaReS
otheR Paid-in equity
otheR equity
total ComPen-
Sation
tReaSuRy ShaReS aS of 1 januaRy 2009 283 -73 9 805 -1 955 7 777
diSPoSalS 184 -44 -984 -133 -1 161
tReasuRy shaRes as of 31 decemBeR 2009 467 -117 8 821 -2 088 6 616
tReaSuRy ShaReS aS of 1 januaRy 2010 467 -117 8 821 -2 088 6 616
diSPoSalS -138 35 1 713 463 2 211
tReasuRy shaRes as of 31 decemBeR 2010 329 -82 10 534 -1 625 8 827
The shares were acquired as a result of employees leaving the company and disposed to new hired or existing employees.

79noteS to the ConSolidated finanCial StatementS
ShaReholdeRS at 31 deCemBeR 2010:
ShaReS ShaReholdinG votinG RiGhtS
RS Platou holdinG aS 10 944 000 26,7 % 26,7 %
lanGeBRu aS 2 397 334 5,9 % 5,9 %
RiChaRd fulfoRd-Smith 2 034 392 5,0 % 5,0 %
medvode aS 1 985 893 4,8 % 4,8 %
wlh inveSt aS 1 834 392 4,5 % 4,5 %
RaGnv. falCk aS 1 449 720 3,5 % 3,5 %
CaRmaG aS 1 301 893 3,2 % 3,2 %
jvt aS 1 246 880 3,0 % 3,0 %
SandeRBeRG aS 1 222 880 3,0 % 3,0 %
CluPea aS 1 095 300 2,7 % 2,7 %
momentum inveSt aS 1 046 280 2,6 % 2,6 %
aCane aS 1 000 001 2,4 % 2,4 %
faRøy inveSt aS 752 000 1,8 % 1,8 %
maRianne aamodt 711 227 1,7 % 1,7 %
Pål hvitStein 706 440 1,7 % 1,7 %
eo inveSt aS 692 000 1,7 % 1,7 %
GRøBe aS 684 773 1,7 % 1,7 %
SilveR line aS 648 560 1,6 % 1,6 %
noRfolk aS 621 440 1,5 % 1,5 %
otheRS leSS than 1,5 % 8 595 757 21,0 % 21,0 %
ToTal 40 971 162 100 % 100 %
All shares are owned directly or by close associates to employees or board members of the company or its subsidiaries, except shares owned by RS Platou Holding AS.
PRoPosed dIvIdend foR aPPRoval By the geneRal meetIngProposed dividend to be approved by the general meeting (not recognised as a liability at 31 December).
PRoPoSed dividend, fiGuReS in nok 1 000
2010 2009
nok 1.50 PeR ShaRe 61 457
nok 1.00 PeR ShaRe 40 867

80 RS Platou aSa / annual RePoRt 2010
lONG-TerM INTeresT-beArING lIAbIlITIesBook value, fiGuReS in 1 000
Book value
effeCtive inteReSt
Rate
matuRity 2010 2009
Bank loan 5,67 % 2015 89 557 80 000
Bank loan 5,56 % 2011 60 410 0
Bank loan 1,72 % 2014 2 183 2 891
total secuRed long-teRm lIaBIlItIes 152 150 82 891
unsecuRed
loan due to PReviouS owneRS of SuBSidiaRy 6,00 % 3 335 8 858
ConveRtiBle Bond loan 0 12 348
total unsecuRed long-teRm lIaBIlItIes 3 335 21 206
total lonG-teRm liaBilitieS 155 485 104 097
fiRSt yeaR RePayment of liaBilitieS 77 241 50 000
ToTal long-Term liabiliTies excluding firsT-Year's repaYmenTs 78 244 54 097
The effective interest rate is calculated as a weighted average. See Note 19 for a description of interest rate risk. According to loan covenants, the Group’s total bank loans cannot exceed 2,5 times operating profit after bonus and the Group must have total equity in excess of MNOK 250. Certain specified circumstances related to defined non-recurring costs may alter these covenants in favour of the Group as the minimum equity requirement may be reduced to MNOK 200.
BanK loansBank loans are mainly secured by the Group’s trade receivables and partly with real estate. No payments are due until maturity. The bank loans are recorded at amortised cost using the effective interest rate method.
There are covenants related to the bank loans. The Group is in compliance with those covenants. Significant changes in the company’s key figures are required for the company to be in breach of the covenants.
secuRItyPledGed aS SeCuRity, fiGuReS in nok 1 000
2010 2009
tRade ReCeivaBleS 228 908 100 015
Bank dePoSitS 66 798 30 985
PRoPeRty 13 085 10 906

81noteS to the ConSolidated finanCial StatementS
peNsIONsIn Norway, all companies are required to have an occupational pension scheme in accordance with the Norwegian Act on Mandatory Occupational Pensions. The Group offers defined pension schemes to all employees in Norway that satisfy the requirements of this law. The Group pays contributions to the defined contribution schemes, which entitles the employees pensions when reaching retirement age. The Group has five secured schemes, an unsecured pension scheme for early retirement, and a secured scheme in the UK that is not covered by the act on occupational pensions.
The Norwegian government provides social security benefits to all pensioners with Norwegian citizenship. The social security payments are calculated with a reference to a basis amount determined by the government (“G-regulation” or “G”) The secured schemes entitle a pensioner to receive an annual benefit equal to 70 % (limited to 12G) of his or her last salary, including payments from the social security office. The pension age in Norway is 67 years, and a pensioner is entitled to a pension for the rest of his or her life. The pension is calculated on the basis of the employee’s period of employment and salary. The pension expense is charged as an expense over the period the employee is employed and entitled to receive pension benefits.
oveRview of PenSion oBliGation at 31 deCemBeR, fiGuReS in nok 1 000
2010 2009
PReSent value of non-GuaRanteed PenSion liaBility inCludinG emPloyeR'S national
inSuRanCe ContRiButionS
462 2 508
PReSent value of GuaRanteed PenSion liaBility inCludinG emPloyeR'S national in-
SuRanCe ContRiButionS
250 601 236 573
net PenSion liaBility inCludinG emPloyeR'S national inSuRanCe ContRiButionS 251 063 239 081
faiR value of PenSion aSSetS 197 695 192 153
net PenSion liaBility inCludinG emPloyeR'S national inSuRanCe ContRiButionS 53 368 46 928
net non-ReCoGniSed aCtuaRial PRofit/ (loSS) -6 753 -4 075
ToTal pension liabiliTY* 46 616 42 853
*inCludinG emPloyeR'S national inSuRanCe ContRiButionS 4 915 4 529
the majoR CateGoRieS of Plan aSSetS in % at 31 deCemBeR
2010 2009
ShaReS 13,5 % 11,7 %
BondS 41,3 % 65,3 %
money maRket 7,7 % 0,0 %
PRoPeRty 16,0 % 16,2 %
loanS 12,8 % 0,0 %
otheR 8,6 % 6,8 %
100,0 % 100,0 %

82 RS Platou aSa / annual RePoRt 2010
the majoR CateGoRieS of Plan aSSetS foR the SeCuRed SCheme in the uk in % at 31 deCemBeR
2010 2009
equitieS 44,9 % 33,1 %
fixed inteReSt 34,5 % 0,0 %
PRoPeRty 7,2 % 0,0 %
CaSh 13,4 % 66,9 %
100,0 % 100,0 %
movementS in GRoSS PenSion oBliGationS duRinG the yeaR, fiGuReS in nok 1 000
2010 2009
GRoSS PenSion liaBility aS of 1 januaRy 234 534 243 114
Paid duRinG the yeaR -11 746 -5 955
SeRviCe and inteReSt exPenSe 27 439 32 360
aCtuaRial (PRofit) loSS (See Below) 1 260 -32 111
PayRoll tax of emPloyeR ContRiBution -886 -835
gross pension liabiliTY 31 december 250 601 236 573
movementS in the PReSent value of Plan aSSetS duRinG the yeaR, fiGuReS in nok 1 000
2010 2009
faiR value of aSSetS aS of 1 januaRy 190 389 184 654
emPloyeRS ContRiBution 6 282 4 025
dePoSitS duRinG the yeaR 0 5 924
diSBuRSementS duRinG the yeaR -11 746 -5 955
aCquiStion 3 917 0
exPeCted yield on PenSion aSSetS 9 779 10 819
aCtuaRial (loSS) PRofit -925 -7 313
gross pension asseTs as of 31 december 197 695 192 153
net PenSion exPenSe haS Been CalCulated aS followS, fiGuReS in nok 1 000
2010 2009
PReSent value of PenSion entitlementS 16 450 15 571
inteReSt exPenSe on liaBilitieS 10 989 9 649
exPeCted yield on PenSion aSSetS -9 779 -9 892
net aCtuaRial loSS (PRofit) ReCoGniSed in the PeRiod 913 -9
aCCRued national inSuRanCe ContRiButionS 0 835
neT pension cosT recognised in The income sTaTemenT in The period 18 574 16 153
cost of non-guaRanteed scheme PRevIously RecognIsed In the Income statement 2 046 1 245
net PensIon cost 20 620 17 398

83noteS to the ConSolidated finanCial StatementS
net PenSion exPenSe iS ReCoGniSed within the followinG line in the inCome Statement, fiGuReS in nok 1 000
2010 2009
SalaRieS and PayRoll CoStS 18 574 16 153
ToTal 18 574 16 153
aCtual RetuRn on PenSion Plan aSSetS (doeS not inClude the SeCuRed SCheme in the uk), fiGuReS in nok 1.000
2010 2009
619 -2 672
PRinCiPal aSSumPtionS uSed foR the aCtuaRial valuationS weRe aS followS.
2010 2009
diSCount inteReSt Rate 4,00 % 4,50 %
exPeCted yield on PenSion aSSetS 5,40 % 5,70 %
exPeCted SalaRy adjuStment 4,00 % 4,50 %
exPeCted PenSion adjuStment 1,30 % 1,40 %
exPeCted G-ReGulation 3,75 % 4,25 %
tuRnoveR 2,95 % 2,95 %
CoRRidoR 10,00 % 10,00 %
emPloyeR'S national inSuRanCe ContRiButionS 14,10 % 14,10 %
demoGRaPhiC aSSumPtionS ReGaRdinG moRtality k2004 k2004
PRinCiPal aSSumPtionS uSed foR the aCtuaRial valuationS weRe aS followS foR the SeCuRed SCheme in the uk.
2010 2009
diSCount inteReSt Rate 5,40 % 5,80 %
exPeCted yield on PenSion aSSetS 4,97 % 4,32 %
Rate of inCReaSe of PenSionS in Payment 3,25 % 4,50 %
Rate of inCReaSe of defeRRed PenSionS 3,25 % 1,40 %
The assumption post retirement mortality for the UK secured scheme at 31 December 2010 and 2009 was PA92 year of birth with medium cohort projections plus a one year age adjustment and PXA 92 calendar year tables c2030/2010.
The assumptions used for deciding pension expense and expected returns on plan assets for the year are those that were decided at the beginning of the year.
The assumptions used to decide the pension obligation and fair value of the pension plan assets on the balance sheet date are those that were decided at the end of the year.

84 RS Platou aSa / annual RePoRt 2010
aveRaGe exPeCted RemaininG yeaRS until RetiRement at 31 deCemBeR
2010 2009
RS Platou aSa 17 18
RS Platou finanS ShiPPinG aS 22 22
RS Platou aSSet manaGement aS 20 20
RS Platou inveStoR SeRviCe aS 24 24
RS Platou maRketS aS 21 20
the StewaRt GRouP ltd 21 21
numBeR of emPloyeeS in the SeCuRed SCheme at 31 deCemBeR
2010 2009
RS Platou aSa 99 101
RS Platou finanS ShiPPinG aS 10 11
RS Platou aSSet manaGement aS 1 1
RS Platou inveStoR SeRviCe aS 1 1
RS Platou maRketS aS 77 59
the StewaRt GRouP ltd 8 8
the taBle Below (doeS not inClude the SeCuRed SCheme in the uk) ShowS eStimateS of Potential effeCtS (PeRCentaGeS) of ChanGeS (PeRCentaGe PointS) in the key aSSumPtionS foR the SeCuRed SCheme on GRoSS PenSion oBliGation at 31 deCemBeR 2010 and 2009 and the SeRviCe CoSt foR the yeaR:
2010 diSCount Rate
SalaRy index
G-index annual PenSion adjuSt-
ment
ChanGeS in aSSumPtionS +1% -1% +1% -1% +1% -1% +1% -1%
exPeCted effeCt
PReSent value of PenSion
liaBilitieS -24,9 % 35,9 % 22,6 % -23,2 % -10,1 % 10,8 % 15,6 % -12,6 %
PenSion CoSt -20,0 % 27,1 % 11,8 % -14,3 % -5,7 % 4,7 % 14,2 % -11,9 %
2009 diSCount Rate
SalaRy index
G-index annual PenSion adjuSt-
ment
ChanGeS in aSSumPtionS +1% -1% +1% -1% +1% -1% +1% -1%
exPeCted effeCt
PReSent value of PenSion
liaBilitieS -23,3 % 33,0 % 21,0 % -23,0 % 1,9 % -10,7 % 13,9 % -11,4 %
PenSion CoSt -18,8 % 24,9 % 8,8 % -13,2 % -1,6 % -5,2 % 13,3 % -11,2 %

85noteS to the ConSolidated finanCial StatementS
Expected contributions to the plans for 2011, and the following estimates, are based on facts and conditions at 31 December 2010. The actual outcome may deviate substantially from those estimates. Changes in other assumptions not included in the table below may also influence the obligation and costs. These calculations are based on the same table for mortality and disability shown in the table above. The expected total pension expense for 2011 based on assumptions and number of members at 31 December 2010 is NOK 18 413 275. Of that amount, the service cost and interest expense are NOK 18 621 287 and NOK 6 668 781, respectively. The net pension expense for 2010 is NOK 16 338 943. This information does not include the scheme in the UK.
hiStoRiCal infoRmation (doeS not inClude the SeCuRed SCheme in the uk)
2010 2009 2008 2007 2006
PReSent value of PenSion liaBility 251 063 172 537 190 605 127 618 108 691
faiR value of PenSion aSSetS 197 695 126 142 125 044 114 887 88 087
ShoRtfall in PenSion SCheme 53 368 46 395 65 561 12 731 20 605
hiStoRiC ChanGe in PenSion liaBility 1 260 -32 111 11 179 -6 907 4 088
hiStoRiC ChanGe in PenSion aSSetS -925 -7 313 19 710 -283 -50
Estimated payment to the secured pension schemes in 2011 is NOK 10 391 000.
fINANCIAl INsTrUMeNTsfInancIal RIsKThe Group uses financial instruments such as bank loans and convertible loans. The purpose of these financial instruments is to obtain capital for investments that are necessary for the Group’s operations.
Furthermore, the Group has financial instruments such as accounts receivables and accounts payables etc., which are directly related to the day-to-day operations of the Group. For hedging purposes, the Group may use financial derivatives.
The Group does not use financial instruments, including financial derivatives, for trading purposes.
The most important financial risks facing the Group relates to liquidity risk, currency risk and credit risk. In addition, the Group is to some extent exposed interest rate risk.
cRedIt RIsK The Group is exposed to credit risk mainly from accounts receivable and other short-term receivables. The Group reduces its exposure to credit risk by requiring that all counterparts requiring credit from the Group, e.g. customers, must be approved and be subject to a credit check.
The Group has no significant credit risk linked to an individual counterpart or Group of counterparties that may be assessed as a Group due to similarities in credit risk.
The Group has guidelines for ensuring that sales are made only to customers with no previous material payment problems and that the amounts outstanding do not exceed determined credit limits.

86 RS Platou aSa / annual RePoRt 2010
The Group has guaranteed an overdraft facility limited to MNOK 5 held by a third party.
Maximum risk exposure is reflected in the financial statements as the carrying amount of financial assets. The Group considers its maximum risk exposure to be the carrying amount of trade receivables (see note 12) and other current assets.
The maximum exposure of credit risk on the balance sheet date was:
2010 2009
tRade and otheR ReCeivaBleS 264 351 374 316
total 264 351 374 316
maximum CRedit RiSk foR finanCial inStRumentS attRiButaBle to GeoGRaPhiCal SeGmentS at the BalanCe date waS:
2010 2009
noRway 202 862 295 089
uSa 6 389 12 775
united kinGdom 12 501 16 610
euRoPe 4 519 5 079
aSia 36 568 38 054
afRiCa 1 513 6 709
ToTal 264 351 374 316
InteRest Rate RIsKThe Group is exposed to interest rate risk through its financing activities (see Note 17). Parts of the interest-bearing debt have floating interest rates, hence the Group is affected by changes in the level of interest rates.
2010 ChanGe in inteReSt Rate (BaSiS PointS)
effeCt on PRofit BefoRe tax (nok 1 000)
effeCt on equity (nok 1 000)
+100 1 500 1 080
-100 -1 500 -1 080
lIquIdIty RIsK Liquidity risk is the risk that the Group is not able to service its financial liabilities as they fall due. The Group’s strategy for handling liquidity risk is to have sufficient funds available at all times to meet the Group’s financial obligations as they fall due, under both normal and extraordinary circumstances, without risking unacceptable losses or at the expense of the Group’s reputation. The following table shows the contractual maturity of the Group’s financial liabilities at the balance sheet date, based on undiscounted cash flows.

87noteS to the ConSolidated finanCial StatementS
2010 ReSidual teRm
amountS inCluded inteReStSwithin 6
montS6-12
monthS1-2
yeaRS2-5
yeaRS
moRe than 5 yeaRS total
aCCountS ReCeivaBleS 264 351 0 0 0 0 264 351
otheR CuRRent ReCeivaBleS 36 466 29 742 0 0 0 66 208
otheR non-CuRRent ReCeivaBleS 0 0 0 6 991 0 6 991
ToTal 300 817 29 742 0 6 991 0 337 550
2010 ReSidual teRm
within 6 montS
6-12 monthS
1-2 yeaRS
2-5 yeaRS
moRe than 5 yeaRS total
finanCial oBliGationS (non-deRivativeS)
loanS 8 827 67 969 13 495 39 479 25 714 155 485
aCCountS PayaBleS and otheR liaBilitieS 330 865 48 226 0 0 0 379 091
SoCial and CoRPoRate taxeS 20 286 0 0 0 0 20 286
ToTal 359 979 116 195 13 495 39 479 25 714 554 862
2009 ReSidual teRm
amountS inCluded inteReStSwithin 6
montS6-12
monthS1-2
yeaRS2-5
yeaRS
moRe than 5 yeaRS total
aCCountS ReCeivaBleS 374 316 0 0 0 0 374 316
otheR CuRRent ReCeivaBleS 46 830 0 0 0 0 46 830
otheR non-CuRRent ReCeivaBleS 0 0 0 6 919 0 6 919
ToTal 421 146 0 0 6 919 0 428 065
2009 ReSidual teRm
within 6 montS
6-12 monthS
1-2 yeaRS
2-5 yeaRS
moRe than 5 yeaRS total
finanCial oBliGationS (non-deRivativeS)
loanS 933 97 065 3 685 2 414 0 104 097
aCCountS PayaBleS and otheR liaBilitieS 386 428 77 288 0 0 9 135 472 851
SoCial and CoRPoRate taxeS 16 056 0 0 0 0 16 056
deRivativeS
foRwaRd CuRRenCy ContRaCtS 18 656 388 655 2 074 1 092 22 865
maRket value, foRwaRd ContRaCtS 74 616 0 0 0 0 74 616
ToTal 496 689 174 741 4 340 4 488 10 227 690 485
Forward contracts are recognised at fair value. The fair value measurement falls within Level 2 in the measurement category described in the accounting principles.

88 RS Platou aSa / annual RePoRt 2010
cuRRency RIsK The Group is exposed to currency exchange rate fluctuations linked to the value of NOK relative to other currencies because of operations in several countries with different functional currencies. The recognised amount of the Group’s net investments in foreign enterprises fluctuates with changes in Norwegian kroner compared to relevant currencies. The Group’s profit or loss after tax is also affected by changes in exchange rates since the financial statements of the foreign companies are translated into Norwegian kroner before inclusion in the consolidated financial statements, using average exchange rates for the period. Fluctua-tions in exchange rates may affect both the consolidated statement of comprehensive income and the consolidated statement of financial position. In terms of revenues, the main exposure is with the USD, however, the Group also has income in NOK, EUR and GBP amongst other currencies. The largest expenses are in NOK, however the Group also has significant expenses in GBP, USD and SGD. The Group may decide to use foreign currency swaps or forward exchange contracts to hedge its future exchange rate exposure. Currency risk is calculated for each foreign currency and takes into account assets and liabilities, non-capitalised obligations and highly likely purchases and sales in the currency in question. At 31 December 2010, the Group had not entered into currency contracts linked to future sales.
the SiGnifiCant exChanGe RateS aPPlied duRinG the yeaR aRe aS followS:
aveRaGe Rate SPot Rate
2010 2009 2010 2009
uSd 1 6,0453 6,2898 5,8564 5,7767
SGd 1 4,4408 4,3194 4,5646 4,1189
nGn 1 0,0395 0,0417 0,0385 0,0381
BRl 1 3,4400 3,5292
GBP 1 9,3400 9,8060 9,0680 9,3170
Chf 1 5,8120 5,7828 6,2503 5,5969
the taBle Below ShowS the effeCt of a ReaSonaBle and PoSSiBle ChanGe in exChanGe RateS to whiCh the GRouP iS exPoSed, Given that all otheR vaRiaBleS Remain ConStant.
effeCt on PRofit BefoRe tax, nok 1 000
effeCt on equity, nok
2010 uSd +5 % 36 969
uSd -5 % -36 -969
2010 SGd +5 % 1 665 3 303
SGd -5 % -1 665 -3 303
2010 Chf +5 % -73 156
Chf -5 % 73 -156
2010 GBP +5 % 1 805 2 113
GBP -5 % -1 805 -2 113

89noteS to the ConSolidated finanCial StatementS
calculatIng faIR valueThe fair value of financial assets classified as “available for sale” and “held for trading” is determined on the basis of quoted price on the balance sheet date to the extent quoted prices can be obtained. For non-quoted financial assets, the fair value is estimated using valuation methods based on assumptions not substantiated by observable market prices.
The fair value of forward exchange contracts is set using the forward exchange rate that can be observed on the balance sheet date. For all the above derivatives, the fair value is confirmed by the financial institution with which the Group has contracts.
The carrying amount of cash and cash equivalents, including bank overdrafts is approximately equal to the fair value since these instruments have a short term to maturity. Correspondingly, the recognised amount of accounts receivable, accounts payable, and long-term debt, are approximately equal to fair value.
faIR valueBelow is a comparison of book value and fair values for the Group’s financial instruments.
2010 2009
Book value faiR value Book value faiR value
financial asseTs
CaSh and CaSh equivalentS 280 715 280 715 158 046 158 046
tRade ReCeivaBleS 264 351 264 351 374 316 374 316
otheR CuRRent ReCeivaBleS 66 208 66 208 46 830 46 830
deRivativeS 0 0 0 0
"loanS and ReCeivaBleS
(lonG-teRm)" 9 168 9 168 8 979 8 979
fianCial inveStmentS 22 577 22 577 22 989 22 989
financial liabiliTies
aCCountS PayaBle 57 225 57 225 197 229 197 229
otheR CuRRent liaBilitieS 338 355 338 355 328 087 328 087
inTeresT-bearing liabiliTies:
Bank loanS 155 485 155 928 80 000 80 000
ConveRtiBle loan 0 0 12 348 12 348
otheR loan 0 0 11 749 11 749
deRivativeS 0 0 5 895 5 895
The basis for the fair value measurement is described above.

90 RS Platou aSa / annual RePoRt 2010
categoRIes of fInancIal assets and fInancIal lIaBIlItIes
2010
held-to-maturity
invest-ments
loans and
receiva-bles
available for sale
financial assets
financial liabilities
meas-ured at amor-
tised cost
other financial
liabili-ties total
held for trading in
acc with iaS 39
desig-nated
as such upon
initial recogni-
tion
held for trading
in ac-cordance with iaS
39
desig-nated
as such upon
initial recogni-
tion
aSSetS
finanCial aSSetS 8 288 16 466 24 754
aCCountS ReCeivaBle 271 293 271 293
otheR CuRRent aSSetS 66 208 66 208
0
ToTal financial asseTs 8 288 0 0 337 501 16 466 0 0 0 0 362 255
liaBilitieS
finanCial liaBilitieS 78 244 78 244
PRoviSionS 0
ShoRt teRm finanCial li-aBilitieS
77 241 77 241
aCCountS PayaBle 57 255 57 255
ToTal financial liabiliTies 0 0 0 0 0 0 0 212 740 0 212 740
2009
held-to-maturity
invest-ments
loans and
receiva-bles
available for sale
financial assets
financial liabilities
meas-ured at amor-
tised cost
other financial
liabili-ties total
held for trading in
acc with iaS 39
desig-nated
as such upon
initial recogni-
tion
held for trading
in ac-cordance with iaS
39
desig-nated
as such upon
initial recogni-
tion
aSSetS 0
finanCial aSSetS 14 234 16 711 30 945
aCCountS ReCeivaBle 381 235 381 235
otheR CuRRent aSSetS 46 830 46 830
0
ToTal financial asseTs 14 234 0 0 428 065 16 711 0 0 0 0 459 010
liaBilitieS
finanCial liaBilitieS 54 097 54 097
PRoviSionS 0
ShoRt teRm finanCial li-aBilitieS
50 000 50 000
aCCountS PayaBle 197 229 197 229
ToTal financial
liabiliTies 0 0 0 0 0 0 0 301 326 0 301 326
finanCial liaBilitieS at faiR value
finanCial liaBilitieS at faiR value
finanCial aSSetS at faiR value
finanCial aSSetS at faiR value

91noteS to the ConSolidated finanCial StatementS
leAsING AGreeMeNTsthe leaSinG exPenSeS ComPRiSed the followinG:
2010 2009
oRdinaRy leaSe 27 099 14 222
ContinGent exPenSeS 0 0
PaymentS ReCeived foR SuBleaSe -946 -360
ToTal 26 152 13 862
oveRview of futuRe minimum PaymentS:
2010 2009
within 1 yeaR 27 283 13 731
within 2 to 5 yeaRS 33 273 17 773
afteR 5 yeaRS 3 174 3 432
ToTal 63 729 34 936
The Group has four sublease agreements and expects to receive an annual income of NOK 1 027 151. All of the subleases are for short-term rental.
The company has entered into a several leasing agreements for offices on market terms. Most of the agreements can be extended.
relATeD pArTy TrANsACTIONsA specification of associates is listed in notes 2 and 11.
tRansactIons WIth assocIatesTransactions with associates are made as a part of the ordinary operations. The transactions are made on market conditions, and there are no significant transactions between the Group and associates that require disclosure.
RS Platou ASA has rented a flat from one of its employees. The flat is used by the employees of RS Platou ASA.
CONTINGeNT lIAbIlITIesIn April 2009, RS Platou Markets AS was sued by BNbank ASA who claimed compensation for breach of an alleged sublease contract for premises at Tjuvholmen, Oslo. Whereas Oslo City Court held that RS Platou Markets AS was liable to pay compensation of MNOK 40,5, in February 2011, the Court of Appeal gave a judgment in favour of RS Platou Markets AS and concluded that RS Platou Markets AS was not liable to pay any lease payment or compensation to BNbank ASA. An appeal by BNbank ASA to the Supreme Court of Norway must be filed within 1 April 2011. Appeals to the Supreme Court are only allowed in cases of important principle and needs an approval by the Interlocutory Appeals Committee of the Supreme Court in order to be heard by the Supreme Court. If the appeal is denied by this Committee, the judgment of the Court of Appeal becomes final and binding. The Group has made no provisions for BNbank ASA’s claim in its accounts as it is the Group’s opinion that it is highly unlikely that the judgment by the Court of Appeal will be changed.

92 RS Platou aSa / annual RePoRt 2010
eVeNTs AfTer THe bAlANCe sHeeT DATeRS Platou ASA has acquired all shares of RS Platou Asset Management AS. This company was earlier a subsidiary company of RS Platou Finans AS. RS Platou ASA is considering selling up to 49,99 % of RS Platou Markets AS and 20 % of the Stewart Group Ltd.
CApITAl reqUIreMeNTscaPItal stRuctuRe and equIty The main purpose of the Group’s management of capital structure is to ensure that the Group maintains a good credit rating and consequently receives reasonable financing terms from lenders and that the capital structure is adequate based on the Group’s operations.
The Group manages its capital structure by making necessary amendments based on a continuous assessment of the economic conditions under which the activity is conducted, and the prospects seen in the short and medium term. The capital structure is managed by adjusting dividend payments, repurchase of own shares, reducing the share capital or making new share offerings. No changes were made in the guidelines for this area in 2009 and 2010.
The Group monitors its capital structure by reviewing its equity ratio. The equity monitored includes equity attributable to the owners of the parent, both paid in capital and retained earnings.
The subsidiary RS Platou Markets AS, has a minimum capital requirement of 8 % as defined in the regulations issued by the Financial Supervisory Authority of Norway.

93noteS to the ConSolidated finanCial StatementS
CaPital Ratio at 31 deCemBeR 2010:
ComPany GRouP
equity 2010 2009 2010
Book equity 139 245 115 215 118 252
deduCtion in tieR 1 CaPital -6 498 0 0
defeRRed tax aSSetS -23 750 -56 725 -23 750
tieR 1 CaPital 108 997 58 490 94 502
deduCtion in tieR 2 CaPital -6 498 0 0
SuBoRdinated loan 40 000 40 000 40 000
tieR 2 CaPital 142 499 98 490 134 502
CaPital RequiRement
Settlement RiSk 11 431 15 527 11 959
unSettled tRanSaCtionS 0 575 0
maRket RiSk 160 331 160
CuRRenCy RiSk 663 1 761 2 859
oPeRational RiSk 38 141 49 835 38 141
tieR 2 CaPital in anotheR ComPany -1 040 0 0
total CaPital RequiRement 49 355 68 029 53 119
tieR 2 CaPital % 23,10 % 11,58 % 20,26 %
The Company has completed an evaluation of the company’s operational risks with the conclusion that the provision of operational risk according to the basic method gives a satisfactory capital requirement. RS Platou Markets AS has a large engagement against RS Platou ASA exceeding 25 % of tier 2 capital. The engagement is created by accounting dispositions adopted by the company’s Board of Directors in connection with its approval of the annual accounts for 2010. The engagement will be reduced immediately.

RS Platou aSa / annual RePoRt 201094
kaPitelSkille
accounTS for rS plaTou aSa

95aCCountS foR RS Platou aSa
note 2010 2009
oPeRatinG RevenueS 3 394 274 406 929
otheR RevenueS 11 069 5 329
ToTal revenues 405 343 412 259
SalaRieS and PayRoll CoStS 4,13 85 062 84 292
otheR oPeRatinG exPenSeS 65 088 76 513
dePReCiation and imPaiRment of tanGiBle aSSetS 6 4 323 3 183
operaTing expenses before bonuses 154 473 163 989
operaTing profiT before bonuses 250 870 248 270
BonuSeS 4 125 435 143 010
operaTing profiT 125 435 105 260
inteReSt inCome 2 657 3 487
dividendS 27 566 26 768
otheR finanCial inCome 316 53 743
inteReSt exPenSeS -8 205 -11 323
otheR finanCial exPenSeS -76 335 -7 876
neT financial income/expenses -54 001 64 799
PRofIt BefoRe tax 71 434 170 059
tax exPenSe 5 17 048 45 606
profiT afTer Tax on conTinuing operaTions 54 386 124 453
disTubuTion informaTion:
to dividend 61 457 40 688
Given GRouP ContRiBution 57 060 47 304
ReCeived GRouP ContRiBution -57 060 0
fRom/to otheR Retained eaRninGS -7 071 36 461
sum 54 386 124 453
INCOMe sTATeMeNT1 januaRy – 31 deCemBeR, fiGuReS in nok 1 000

96 RS Platou aSa / annual RePoRt 2010
note 2010 2009
asseTs
non-currenT asseTs
defeRRed tax 5 8 592 2 431
PRoPeRty, Plant and equiPment 6 21 360 15 208
inteRComPany lonG teRm loan 7 40 000 40 000
lonG-teRm ReCeivaBleS 546 679
inteRComPany lonG teRm ReCeivaBleS 7 10 394 32 389
net PenSion aSSetS 13 0 4 232
finanCial inveStmentS 1 382 56
inveStmentS in SuBSidaRieS 2 377 887 376 669
ToTal non-currenT asseTs 460 162 471 665
currenT asseTs
aCCountS ReCeivaBle 12 108 329 100 015
inteRComPany ShoRt-teRm ReCeivaBleS 7 42 814 40 841
otheR ShoRt-teRm ReCeivaBleS 8 751 5 188
finanCial inveStmentS 8 16 277 16 177
CaSh and CaSh equivalentS 12 25 112 30 985
ToTal currenT asseTs 201 282 193 205
ToTal asseTs 661 444 664 870
bAlANCe sHeeT – AsseTsfiGuReS in nok 1 000

97aCCountS foR RS Platou aSa
note 2010 2009equiTY
ShaRe CaPital 10 10 243 10 172
ShaRe PRemium aCCount 109 750 105 572
tReaSuRy ShaReS -82 -117
otheR Paid-in CaPital 10 534 8 821
ToTal paid-in capiTal 9 130 444 124 448
reTained earnings
otheR equity 135 507 142 069
ToTal reTained earnings 135 507 142 069
ToTal equiTY 265 952 266 517
long-Term liabiliTies
ConveRtiBle loan 0 12 348
otheR lonG teRm loan 11,12 76 698 32 516
PenSion liaBilitieS 13 1 563 1 724
ToTal long-Term liabiliTies 78 261 46 588
currenT liabiliTies
liaBilitieS due to CRedit inStitutionS 11,12 12 857 50 000
aCCountS PayaBle 2 126 2 171
taxeS PayaBle 5 14 7
dividend 61 457 40 688
inteRComPany CuRRent liaBilitieS 7 82 085 86 639
PRoviSionS foR BonuS, vaCation allowanCe and SoCial taxeS 137 190 134 874
otheR CuRRent liaBilitieS 21 502 37 386
ToTal currenT liabiliTies 317 231 351 765
ToTal liabiliTies 395 492 398 353
ToTal equiTY and liabiliTies 661 444 664 870
bAlANCe sHeeT – eqUITy AND lIAbIlITIesfiGuReS in nok 1 000
Oslo, 22 March 2011
Ragnar Horn (Chairman) Birger Nergaard Marianne Lie
Gustave Brun-Lie Marianne Aamodt Peter M. Anker (CEO)

98 RS Platou aSa / annual RePoRt 2010
2010 2009
cash flow from operaTing acTiviTies
PRofit BefoRe tax 71 434 170 059
adJustments
taxeS Paid -1 013 -78 549
dePReCiation and imPaiRmentS 4 323 3 183
amoRtiSation and imPaiRmentS 2 712 0
diffeRenCe Between PenSion CoSt and PenSion PaymentS 4 071 4 254
ChanGeS in tRade ReCeivaBleS, tRade PayaBleS and CuStomeR PRePaymentS -8 358 52 037
otheR ChanGeS 23 484 -78 500
net CaSh flow fRom oPeRatinG aCtivitieS 96 654 72 484
cash flow from invesTing acTiviTies
PuRChaSe of PRoPeRty, Plant and equiPment -10 648 -4 567
PRoCeedS fRom Sale of PRoPeRty, Plant and equiPment 172 0
PRoCeedS fRom RePayment of otheR inveStmentS 0 -135 434
net amount Paid out on PuRChaSe of SuBSidiaRieS -51 233 0
PuRChaSe of otheR inveStmentS -1 327 -45 550
net CaSh flow fRom inveStinG aCtivitieS -63 035 -185 552
cash flow from financing acTiviTies
iSSuanCe of ShaRe CaPital 4 249 99 000
tReaSuRy ShaReS 2 256 1 396
RePayment of BoRRowinGS -94 864 -25 000
new lonG-teRm BoRRowinGS 89 555 21 828
dividendS Paid -40 688 -101 747
net CaSh flow fRom finanCinG aCtivitieS -39 491 -4 523
net IncRease In cash and cash equIvalents -5 873 -117 590
cash and cash equIvalents as of 1 JanuaRy 30 985 148 575
cash and cash equIvalents as of 31 decemBeR 25 112 30 985
CAsH flOw sTATeMeNTfiGuReS in nok 1 000

99noteS to the RS Platou aSa`S finanCial StatementS
ACCOUNTING prINCIplesThe annual accounts for RS Platou ASA (the “Company”) have been prepared in accordance with the provisions of the Norwegian Accounting Act and generally accepted accounting principles in Norway.
use of assumPtIons and estImatesManagement has made estimates and assumptions that have affected the value of assets, liabilities, revenues, costs and information regarding potential obligations. Uncertainty surrounding these assumptions and estimates may result in changes that could cause material adjustments to the book values of assets and liabilities in the future.
cuRRency Transactions in foreign currencies are converted using the exchange rate prevailing on the date of the transaction. Monetary items in foreign currencies are converted to Norwegian kroner using the exchange rate prevailing on the balance sheet date. Currency adjustments that arise during conversion are recognised in profit or loss. Non-monetary assets and liabilities measured in terms of historical cost in a foreign currency are converted using the exchange rate prevailing on the transaction date. Non-monetary assets and liabilities measured at fair value, are converted to Norwegian kroner using the exchange rate prevailing on the date when the fair value was determined. Changes in exchange rates are recognised in profit or loss on an ongoing basis during the accounting period.
PRIncIPles foR Revenue RecognItIonThe revenues primarily consist of commissions from sales and purchases, contracting of newbuilds and chartering, corporate management, stock broking, and consultancy revenues related to financial advisory services.
Revenue is recognised when RS Platou ASA has a contractual entitlement to commission, normally at the time of completed contractual periods between the principals in the transaction.
Sale and PuRChaSeCommission earned from sale and purchase of existing vessels is invoiced and recognised in profit or loss upon the delivery of the vessel from the seller to the buyer. The commission is normally based on a percentage of the purchase price of the vessel.
newBuildinGSThe commission is normally based on a percentage of the purchase price of the vessel and the commission is invoiced and recognised in profit or loss based on the payment milestones as stipulated in the newbuilding contract negotiated between the ship owner and the yard. RS Platou ASA normally invoices the yard when the ship owner pays the yard based on the agreed milestones.
noTeS To rS plaTou aSa’S financial STaTemenTS

100 RS Platou aSa / annual RePoRt 2010
ChaRteRinGThe commission earned from chartering is normally based on a percentage of the charter rates as negotiated between the ship owner and the charterer. Invoicing and revenue recognition in profit or loss normally follows the payment from charterer to ship owner as negotiated in the chartering agreement.
Income taxThe tax charge consists of tax payable and the change in deferred tax. Deferred tax liabilities and deferred tax assets are calculated based on all the recognised differences between the accounting and tax value of assets and liabilities at a nominal rate of 28 %.
Deferred tax assets are recognised when it is probable that the company will have sufficient taxable profits in subsequent periods to be able to use the tax assets. The company recognises deferred tax assets not previously recorded to the extent that it has become likely that the company can use such deferred tax assets. Similarly, the company will reduce a deferred tax asset to the extent that the company no longer considers it likely that it can make use of such deferred tax asset.
Deferred tax and deferred tax assets are recognised at nominal value and are classified as non-current assets (long-term liabilities) in the balance sheet.
Tax payable and deferred tax are recognised in equity to the extent that the tax items relate to equity transactions.
classIfIcatIon and valuatIon of Balance sheet Items Current assets and current liabilities consist of receivables and payables due within one year, and items related to the inventory cycle. Other balance sheet items are classified as fixed assets / long term liabilities.
Current assets are valued at the lower of cost and fair value. Current liabilities are recognised at nominal value. Fixed assets are valued at cost, less depreciation and impairment losses. Long term liabilities are recognised at their nominal value.
tangIBle fIxed assetsFixed assets are measured at acquisition cost with a deduction for accumulated depreciation and write-downs. When assets are sold or transferred, the value in the balance sheet is derecognised and any losses or gains recognised in the profit and loss statement.
Acquisition costs for fixed assets are the purchase price, inclusive of charges/taxes and costs directly linked to the process of making the asset ready for use. Expenses incurred after the asset has been in use, such as ongoing maintenance costs, are expensed as incurred, whereas other expenses anticipated to result in future economic benefits are recorded in the balance sheet. Depreciation is calculated using the straight line method and by applying an economic life appropriate to the asset in question. The depreciation period and method of calculation is assessed on an annual basis. Residual value is estimated at the close of each year, and changes to such estimate are recorded in the financial statements as an estimate change.

101noteS to the RS Platou aSa`S finanCial StatementS
suBsIdIaRIes / assocIated comPanIesSubsidiaries and investments in associates are valued at cost. The investment is valued as cost of the shares in the subsidiary, less any impairment losses. An impairment loss is recognised if the impairment is not considered temporary, in accordance with generally accepted accounting principles. Impairment losses are reversed if the reason for the impairment loss is no longer valid in a later period.
Dividends, Group contributions and other distributions from subsidiaries are recognised in the same year as they are recognised in the financial statement of the provider. If dividends / Group contribution exceed withheld profits after the acquisition date, the excess amount represents repayment of invested capital, and the distribution will be deducted from the recorded value of the acquisition in the balance sheet for the parent company.
ReceIvaBlesTrade receivables and other receivables are recognised at nominal value less provision for bad debts. The provision for bad debts is made on the basis of individual assessments of each receivable.
shaRes Short term investments in shares are classified as current assets and are initially recognised at fair value (cost) and subsequently at the lower of cost and fair value.
PensIons Defined benefit plans are valued at the present value of accrued future pension benefits at the balance sheet date. Pension plan assets are valued at their fair value.
Changes in the pension obligations due to changes in pension plans are recognised over the estimated average remaining service period. The accumulated effect of changes in estimates and in financial and actuarial assumptions (actuarial gains or losses) that is less than 10 % of the higher of defined benefit pension obligations and pension plan assets at the beginning of the year is not recognised. When the accumulated effect is above the 10 % limit in the beginning of the financial period, the excess amount is recognised in the income statement over the estimated average remaining service period. The net pension cost for the period is classified as salaries and payroll costs.
cash floW statement The cash flow statement is prepared according to the indirect method. Cash and cash equivalents include cash and bank deposits.

102 RS Platou aSa / annual RePoRt 2010
sUbsIDIArIesfiGuReS in nok 1 000
31.12.10
ComPany main aCtivity ShaReholdinG votinG RiGhtS
RS Platou offShoRe aS offShoRe BRokinG 100,00 % 100,00 %
RS Platou eConomiC ReSeaRCh aS eConomiC ReSeaRCh 100,00 % 100,00 %
RS Platou ShiPBRokeRS aS ShiPBRokinG 100,00 % 100,00 %
RS Platou finanS aS finanCial SeRviCeS 50,01 % 50,01 %
RS Platou Real eState aS finanCial SeRviCeS 31,50 % 50,50 %
RS Platou (uSa) inC. offShoRe BRokinG 100,00 % 100,00 %
lone StaR, R.S. Platou inC. ShiPBRokinG 71,10 % 71,10 %
RS Platou (SinGaPoRe) Pte. ltd. ShiP/offShoRe BRokinG 100,00 % 100,00 %
RS Platou (niGeRia) ltd offShoRe BRokinG 99,00 % 99,00 %
the StewaRt GRouP ltd offShoRe BRokinG 100,00 % 100,00 %
RS Platou llP ShiPBRokinG 51,00 % 51,00 %
RS Platou hellaS ltd ShiPBRokinG 51,00 % 51,00 %
RS Platou maRketS aS inveStment BankinG 100,00 % 100,00 %
RS Platou (Geneva) ltd ShiPBRokinG 100,00 % 100,00 %
RS Platou tank (Geneva) ltd ShiPBRokinG 100,00 % 100,00 %
RS Platou dRy (Genève) Sa ShiPBRokinG 100,00 % 100,00 %
RS Platou BRazil ltda. offShoRe BRokinG 100,00 % 100,00 %
ComPany BalanCe 31.12.10 ReSult 2010 equity 31.12.10
RS Platou offShoRe aS 611 0 155
RS Platou eConomiC ReSeaRCh aS 100 0 132
RS Platou ShiPBRokeRS aS 120 1 113
RS Platou finanS aS 50 15 865 17 049
RS Platou Real eState aS 13 5 513 1 418
RS Platou (uSa) inC. 3 001 -33 9 676
lone StaR, R.S. Platou inC. 15 313 515 9 700
RS Platou (SinGaPoRe) Pte. ltd. 799 16 230 22 463
RS Platou (niGeRia) ltd 0 -2 522 540
the StewaRt GRouP ltd 119 742 14 622 6 026
RS Platou hellaS ltd 8 1 688 624
RS Platou llP 9 847 16 243 26 387
RS Platou maRketS aS 225 383 9 008 119 060
RS Platou Genève Sa 509 -61 221
RS Platou (tank) Genève Sa 597 74 418
RS Platou (dRy) Genève Sa 509 -1 446 3 116
RS Platou BRazil ltda. 1 287 -6 216 -6 155
ToTal 377 887 69 480 210 944

103noteS to the RS Platou aSa`S finanCial StatementS
INCOMe frOM THe sAle Of serVICes, ANAlyseD by GeOGrApHICAl MArkeT AND seGMeNTsfiGuReS in nok 1 000
2010 2009
noRway 118 909 190 144
uk 21 958 29 496
euRoPe 90 182 41 497
ameRiCa 11 317 10 281
aSia 150 389 77 338
afRiCa 1 288 58 173
oCeania 230 0
ToTal 394 274 406 929
2010 2009
ShiPBRokinG 181 956 218 851
offShoRe 212 318 186 920
unalloCated 0 1 158
ToTal 394 274 406 929
sAlArIes AND pAyrOll COsTfiGuReS in nok 1 000
2010 2009
SalaRieS 64 026 64 580
emPloyeRS' national inSuRanCe ContRiButionS 8 267 8 927
PenSion CoSt of defined ContRiBution SChemeS 6 745 5 538
otheR PeRSonnel Related CoStS 6 024 5 247
ToTal salarY and paYroll cosTs 85 062 84 292
BonuSeS inCl. inSuRanCe ContRiButionS 125 435 143 010
ToTal salarY and paYroll cosTs including bonuses 210 497 227 302
2010 2009
average number of full-Time emploYees emploYed 96 99
The CEO is included in the company’s defined benefit pension scheme and he is entitled to a severance pay of 3 years’ salary on termination of employment.Short-term interest bearing loans to employees at 31 December 2010 were NOK 574 891.

104 RS Platou aSa / annual RePoRt 2010
RemuneRation of SenioR manaGement, fiGuReS in nok 1 000
2010 SalaRy BonuS BenefitS in kind
PenSion CoSt in the PeRiod
total RemuneRation
manaGement
PeteR m. ankeR, Ceo 1 124 6 200 53 103 7 480
wilhelm l. holSt, Coo 761 7 926 32 112 8 831
eRlend Bondø, Cfo 813 1 000 17 70 1 900
ToTal remuneraTion 2 698 15 126 102 285 18 211
2009 SalaRy BonuS BenefitS in kind
PenSion CoSt in the PeRiod
total RemuneRation
manaGement
PeteR m. ankeR, Ceo 1 124 8 750 43 101 10 018
wilhelm l. holSt, Coo 761 6 000 41 109 6 911
eRlend Bondø, Cfo 573 0 13 82 668
ToTal remuneraTion 2 457 14 750 97 292 17 597
The board members Marianne Lie and Birger Nergaard have received director’s fee NOK 100 000 each in 2010, and the same amount in 2009. The other directors did not receive any director’s fee for the years 2009 and 2010.
Audit fees are details in note 5 in the Group accounts.

105noteS to the RS Platou aSa`S finanCial StatementS
TAxesfiGuReS in nok 1 000
31.12.2010 31.12.2009
CuRRent tax PayaBle in noRway 22 204 18 403
CuRRent tax Paid outSide noRway 1 298 0
CoRReCtion of PReviouS yeaRS CuRRent inCome taxeS in noRway -291 0
ChanGeS in defeRRed tax -6 161 27 203
ToTal income Tax expense 17 048 45 606
CuRRent tax PayaBle in noRway 22 204 18 403
tax on GRouP ContRiBution -22 190 -18 396
ToTal Tax paYable 14 7
Tax base calculaTion: 31.12.2010 31.12.2009
PRofit BefoRe tax 71 434 170 059
exPeCted tax exPenSeS BaSed on inCome tax RateS in noRway (28%) 20 002 47 617
CoRReCtion of PReviouS yeaRS CuRRent inCome taxeS in noRway -291 0
tax Rate outSide noRway 1 298 0
non-taxaBle inCome -7 725 -7 495
non deduCtaBle exPenSeS 2 807 4 759
non-taxaBle GainS/loSSeS on SaleS of ShaRe 804 516
otheR 155 209
Tax expense on ordinarY income 17 048 45 606
deferred Tax liabiliTies/-deferred Tax asseTs 31.12.2010 31.12.2009 changes
tanGiBle fixed aSSetS -8 615 506 -9 121
PenSionS -438 702 -1 140
ReCeivaBle tRade 460 -813 1 273
otheR inveStmentS at faiR value 0 -2 826 2 826
neT recognised deferred Tax asseTs -8 593 -2 431 -6 161

106 RS Platou aSa / annual RePoRt 2010
TANGIble fIxeD AsseTsfiGuReS in nok 1 000
2010 2009
PRoPeRty, equiPment and vehiCleS
PRoPeRty equiPment and
vehiCleS
total PRoPeRty equiPment and
vehiCleS
total
CoSt aS of 1 januaRy 3 000 24 668 27 668 3 000 20 136 23 136
additionS 0 10 648 10 648 0 4 532 4 532
diSPoSalS 0 -6 334 -6 334 0 0 0
CoSt aS of 31 deCemBeR 3 000 28 981 31 981 3 000 24 668 27 668
aCC. dePReCiation aS of 31 deCemBeR 0 -10 621 -10 621 0 -12 459 -12 459
net Book value aS of 31 deCemBeR 3 000 18 360 21 360 3 000 12 208 15 208
dePReCiation foR the yeaR 0 4 323 4 323 0 3 183 3 183
dePReCiation Rate 14-30% 14-30%
INTerCOMpANy reCeIVAblesfiGuReS in nok 1 000
31.12.2010 31.12.2009
lonG-teRm loan 40 000 40 000
otheR lonG-teRm ReCeivaBleS 10 394 32 389
ShoRt-teRm ReCeivaBleS 42 814 40 841
otheR CuRRent liaBilitieS* -82 085 -86 639
ToTal neT inTercompanY accounTs 11 123 26 591
* Other current liabilities includes group contribution.
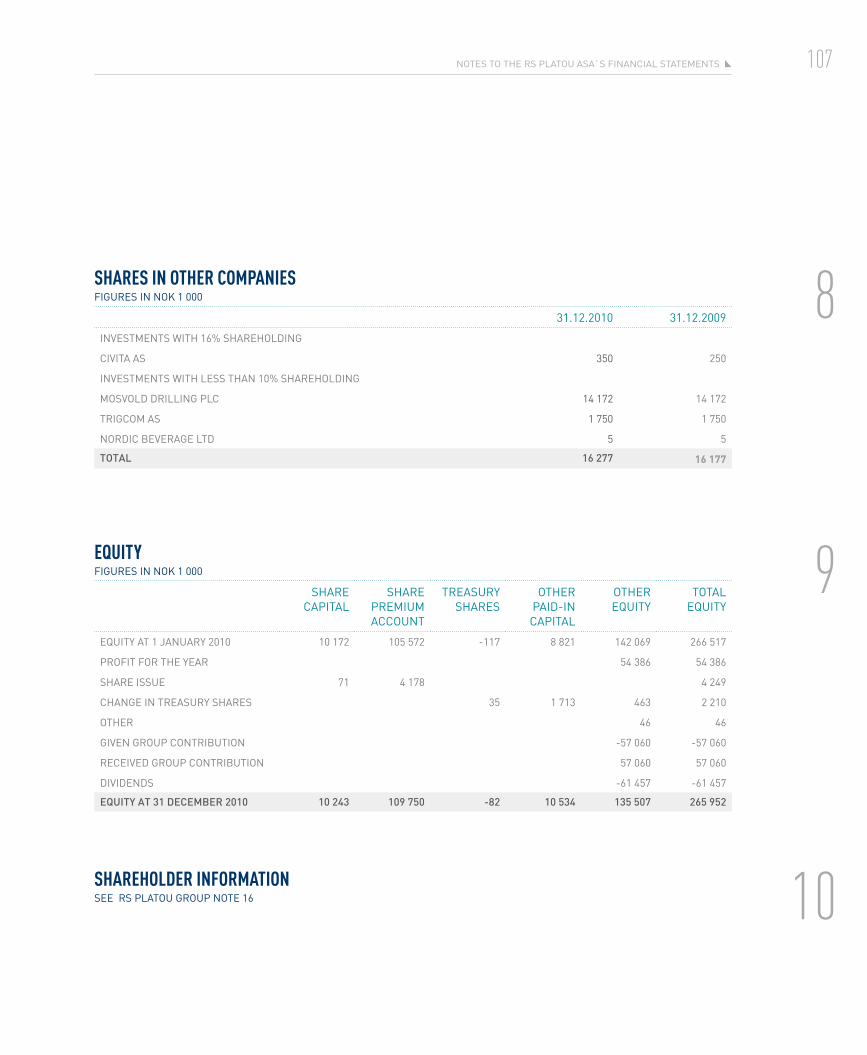
107noteS to the RS Platou aSa`S finanCial StatementS
sHAres IN OTHer COMpANIesfiGuReS in nok 1 000
31.12.2010 31.12.2009
inveStmentS with 16% ShaReholdinG
Civita aS 350 250
inveStmentS with leSS than 10% ShaReholdinG
moSvold dRillinG PlC 14 172 14 172
tRiGCom aS 1 750 1 750
noRdiC BeveRaGe ltd 5 5
ToTal 16 277 16 177
eqUITyfiGuReS in nok 1 000
ShaRe CaPital
ShaRe PRemium aCCount
tReaSuRy ShaReS
otheR Paid-in CaPital
otheR equity
total equity
equity at 1 januaRy 2010 10 172 105 572 -117 8 821 142 069 266 517
PRofit foR the yeaR 54 386 54 386
ShaRe iSSue 71 4 178 4 249
ChanGe in tReaSuRy ShaReS 35 1 713 463 2 210
otheR 46 46
Given GRouP ContRiBution -57 060 -57 060
ReCeived GRouP ContRiBution 57 060 57 060
dividendS -61 457 -61 457
equiTY aT 31 december 2010 10 243 109 750 -82 10 534 135 507 265 952
sHAreHOlDer INfOrMATIONSee RS Platou GRouP note 16

108 RS Platou aSa / annual RePoRt 2010
INTeresT beArING lIAbIlITIes TO CreDIT INsTITUTIONsfiGuReS in nok 1 000
31.12.2010 31.12.2009
oveRdRaft faCilitieS 12 190 0
Bank loan 90 000 80 000
ToTal 102 190 80 000
The bank loan was issued with security in the company’s trade receivables, bank deposits and shares in material subsidiaries. The final payment on the loan is due in December 2015. Instalments due after 12 months are classified as long-term liabilities. At 31 December the loan had a floating interest rate (3 months NIBOR + margin).
GUArANTees AND AsseTs pleDGeD As seCUrITy fOr lONG-TerM lOANsThe Company has a multi currency overdraft facility of MNOK 110 and a bank loan of MNOK 90. As security for the overdraft facilities, a factoring agreement has been made pledging current and future trade receivables. The bank deposits are also posted as security. These facilities were utilised from time to time during the year, but were not utilised on a net basis at year-end. No significant draws were made on the overdraft facilities in 2009 and were not utilised on a net basis at year-end 2009.
fiGuReS in nok 1 000
aSSetS PledGed aS SeCuRity 31.12.2010 31.12.2009
ShoRt-teRm Bank dePoSitS 37 303 30 985
aCCountS ReCeivaBle 108 329 100 015
ToTal 145 631 131 000
The Company has guaranteed an overdraft facility limited to MNOK 5 held by a third party.
The Company has guaranteed for RS Platou Markets AS third party debt of MNOK 60.
Covenants related to the Company’s external debt are linked to the performance of the Group, and no specific covenants apply to the Company’s profit or loss nor financial position.

109noteS to the RS Platou aSa`S finanCial StatementS
peNsION COsT AND peNsION lIAbIlITIesThe company has an unsecured pension scheme for early retirement covering two individuals until 2011. The pension cost related to this scheme is charged to operations. The unsecured pension obligation has been discounted at a rate of 7 %.
In Norway all companies are required to have an occupational pension scheme in accordance with the Norwegian Act on Mandatory Occupational Pensions. The company offers defined pension schemes to all employees in Norway that satisfy the requirements of this law. The company pays contributions to the defined contribution schemes, entitling the employees pensions upon reaching the age of retirement.
fiGuReS in nok 1 000
PenSion CoSt inCl. emPloyeR'S national inSuRanCe ContRiButionS 2010 2009
emPloieeS PenSion eaRninGS thiS yeaR 6 910 5 917
inteReSt exPenSe on liaBilitieS 5 670 5 201
yield on PenSion aSSetS -5 916 -6 080
adminiStRaSjonSkoStnadeR 0 0
net aCtuaRial loSS (PRofit) ReCoGniSed in the PeRiod 0 0
neT pension cosT recognised in The income sTaTemenT in The period 6 664 5 037
PenSion Benefit oBliGation 31.12.10 31.12.09
PReSent value of PenSion entitlementS -120 289 -106 987
value of PenSion aSSetS 108 000 104 525
-12 289 -2 462
net aCtuaRial loSS (PRofit) not ReCoGniSed 10 726 6 694
net value of GRouP PenSion aSSetS/-liaBilitieS -1 563 4 232
individual pension liabiliTies -527 -1 724
numBeR of emPloyeeS CoveRed By the GuaRanteed SCheme aS of 31.12.: 121 124
main aSSumPtionS 2010 2009
exPeCted yield on PenSion aSSetS 5,4 % 5,7 %
diSCount inteReSt Rate 4,6 % 5,4 %
exPeCted SalaRy adjuStment and G-ReGulation 4,0 % 4,5 %
exPeCted PenSion adjuStment 1,3 % 1,4 %

110 RS Platou aSa / annual RePoRt 2010
fINANCIAl MArkeT rIskThe company may use financial instruments to manage financial risk. Exchange rate fluctuations constitute both direct and indirect financial risks for the company. The company had not entered into any currency derivatives on the balance sheet date
leAsING AGreeMeNTsRS Platou ASA leases premises through a contract that expires on 31 December 2012 with an option of additional 5 years at market rates. The annual leasing cost including shared expenses is approx. MNOK 12,9.
eVeNTs AfTer THe bAlANCe sHeeT DATeRS Platou ASA has acquired all 100 % of the shares outstanding in RS Platou Asset Management AS. This company was previously a subsidiary of RS Platou Finans AS.

111auditoR`S RePoRt foR 2010
audiTor’S reporT for 2010

112 RS Platou aSa / annual RePoRt 2010
RS PLATOU
P.O. BOx 1604 Vika / N-0119 OslO / NOrwayswitchBOard: +47 23 11 20 00
www.PlatOu.cOm
design by maritimecolours.no