Embed Size (px)
Citation preview

2011 ANNUAL REPORT

About the CoverAs II-VI continues to strengthen its global presence, and specifi-cally in China, the Chinese proverb on the cover tells the story of II-VI in 2011. Guided by industry-leading core products and mission-consistent business strategies, 2011 brought II-VI much good fortune. New markets and growth opportunities have been captured, new companies have been acquired, new talent has been developed, and new synergies have been created.
About II-VIII-VI Incorporated, a global leader in engineered materials
and optoelectronic components, is a vertically integrated
manufacturing company that creates and markets products
for diversified markets, including industrial manufacturing,
military and aerospace, high-power electronics and
telecommunications, and thermoelectronics applications.
Headquartered in Saxonburg, Pennsylvania, with manu-
facturing, sales and distribution facilities worldwide, the
Company produces numerous crystalline compounds,
including zinc selenide for infrared laser optics, silicon
carbide for high-power electronic and microwave appli-
cations, bismuth telluride for thermoelectric coolers, and
yttrium vanadate for passive optical components for
telecommunications.

0
100
200
300
400
500
07 08 09 10 11
254.7
316.2292.2
345.1
502.8
Revenues from Continuing Operations($000)
287.9
360.9 368.4
509.0
647.2
Total Assets($000)
0
100
200
300
400
500
07 08 09 10 11
600
700
219.4
290.6322.9
410.9
523.1
Total Shareholders’ Equity($000)
0
100
200
300
400
500
07 08 09 10 11
Diluted Earnings per Share from Continuing Operations Diluted earnings per share have been adjusted to account for the two-for-one split of the Company’s common shares as a stock dividend distributed on June 24, 2011.
0.64
1.08
0.65 0.63
1.30
0
0.50
1.00
1.50
07 08 09 10 11
II-VI Incorporated 201 1 Annual Report 1
For the year ended June 30 201 1 2010
($000 except per share data)
Bookings $ 520,238 $ 387,595
Revenues $ 502,801 $ 345,091
Net earnings attributable to II-VI Incorporated $ 82,682 $ 38,577
Diluted earnings per share $ 1.30 $ 0.63
As of June 30
Total assets $ 647,202 $ 508,981
Total shareholders’ equity $ 523, 10 1 $ 410,860
Working capital $ 304,573 $ 215,085
Per share data have been adjusted to account for the two-for-one split of the Company’s common shares as a stock dividend distributed on June 24, 2011.
Financial Summary

2 II-VI Incorporated 201 1 Annual Report
Since my last letter to you, we have experienced tremendous
change. We have completed three acquisitions, investing
almost $1 13 million in new technologies, people and assets.
We have made over $70 million in strategic capital expenditures
at our worldwide manufacturing locations. We have expanded
our global workforce from just over 2,000 employees in
2008 to almost 6,200 as of June 30, 201 1. More than ever
before, II-VI is truly a global company.
Fiscal year 201 1 was another exceptional year for II-VI as we
established new records for revenues, earnings and bookings.
We experienced continued strength across all business
segments, enabling the Company to report a 1 14% increase in
net earnings, a 46% increase in revenues and a 34% increase
in bookings versus the prior year. These results highlight
the significant achievements throughout our Company and
help define four key attributes that were paramount in the
Company’s performance in fiscal year 201 1: Growth, Talent,
Innovation and Synergy.
GROWTH The global CO2 laser market continued to be
strong. This market recovered from the global economic
downturn much quicker than we had originally anticipated.
This recovery is in part due to the growing installed base
of nearly 60,000 high-powered CO2 industrial lasers world-
wide. Record revenues and bookings in the Infrared Optics
segment in fiscal year 201 1 were led by robust original
equipment manufacturers and aftermarket demand. To
address this demand, we continue to invest in our materials
growth capacity and worldwide manufacturing operations
in the United States, Singapore and China.
TALENT We enhanced our corporate leadership in 201 1
with the appointment of Dr. Howard H. Xia to the Company’s
Board of Directors. Dr. Xia’s extensive knowledge and
experience of the telecommunications industry and his
knowledge of international business, especially in China,
will provide valuable guidance to the Company. Dr. Xia
will join our Chairman of the Board, Dr. Carl J. Johnson,
who retired as an employee of the Company in May 2010,
as well as the remainder of the Board in the strategic
leadership of the Company. All our business units world-
wide made key additions to engineering, scientific and
technical talent which make II-VI a manufacturing leader.
INNOVATION We devote significant resources to research,
development and engineering programs directed at the
continuous improvement of existing products and processes
and to the timely development of new technologies,
materials and products. During 2011, we invested approxi-
mately $24 million in both internal and external research
and development activities in the areas of crystal growth,
materials engineering, fabrication, thin-film coating and
industry leading optoelectronic components to provide
our customers with new and innovative products and
solutions.
SYNERGY Synergy may be defined as two or more things
functioning together to produce results not independently
obtainable. Synergy contributed to the success of the
Company during 2011; we completed one acquisition,
integrated a second and negotiated a third. The recent
acquisitions of Photop Technologies, Inc. (Photop),
Shareholder Letter

II-VI Incorporated 201 1 Annual Report 3
Max Levy Autograph, Inc. (MLA) and Aegis Lightwave, Inc.
(Aegis) have helped position the Company to address new
opportunities and markets. Photop and Aegis, both leading
manufacturers of precision optics and crystal components
and optical devices, will join forces to enhance our ability
to address our customers’ growing needs for an advanced
product portfolio servicing the telecommunications
markets. Our acquisition of MLA, a manufacturer of micro-
fine mesh patterns for optical, mechanical and ceramic
components for applications such as target calibration
and suppression of electro-magnetic interference, adds
products and technology well matched with our Exotic
Electro-Optics business unit. Collectively, this group will
provide the Company a stronger platform to serve the
defense industry and will potentially enable market
diversification over the longer term.
As we complete our 40th year of business, we thank you,
our shareholders, for your continued interest in II-VI as well as
your ongoing trust and support. And of course, we would like
to sincerely thank our fellow employees at our 30 locations in
14 countries worldwide who have contributed their hard work
and overwhelming dedication this past year.
Francis J. KramerPresident and Chief Executive Officer

4 II-VI Incorporated 201 1 Annual Report
As the world experienced a much faster than
anticipated industrial market recovery, II-VI’s
unyielding focus on industry-leading products
was at the heart of its growth.
With a worldwide installed base of nearly 60,000 CO2 lasers,
the growth of Infrared Optics has been driven by increased
laser utilization and optic demand. For our European and
Japanese OEMs, growth has opened up the market and
aided selling efforts into China. For our aftermarket customers,
increased laser utilization drove growth. To address customer
demand, II-VI is increasing its worldwide manufacturing
capacity, primarily in the areas of zinc selenide growth.
Additional material growth capacity at the Saxonburg,
Pennsylvania, facility will help meet this demand. IR Optics
growth also has created new opportunities in China and
emerging markets, such as India and Brazil. II-VI is capitalizing
on this projected growth by dedicating efforts to better
support laser utilization in those emerging markets.
New growth for our Near-Infrared Optics business segment
was driven by the Company’s expansion into the telecommu-
nications market through the successful acquisition and
A focus on core fundamentals contributes to strong growth.
integration of Photop. Headquartered in Fuzhou, China, Photop
is a leading photonics designer and integrated manufacturer
of engineered materials, optical components and microchip
lasers. This strategic acquisition enabled II-VI to accelerate
its global growth strategy, expand its world-class R&D and
technology capabilities, and broaden and brighten II-VI and
Photop’s global growth prospects. By combining efforts, II-VI
enhanced its collective expertise in crystal materials and
optics to benefit our customers, shareholders and employees.
Our Pacific Rare Specialty Metals & Chemicals Inc. (PRM)
subsidiary experienced a 40% year-to-year growth in
revenues during 2011 due to rising product demand and
higher global metal prices. Products of PRM, a leading refiner
of tellurium and selenium metals and chemicals based in
the Philippines, are becoming increasingly critical in today’s
rapidly advancing technologies in solar (photovoltaics),
agricultural and industrial markets. PRM has positioned
itself for continued growth and leadership in these markets
through strategic investments in manufacturing capacity and
technology. PRM has assembled a world-class research team
of metallurgists, scientists and engineers who are developing
novel processes to improve the extraction processes of
tellurium and selenium from copper and zinc residues.
Tellurium Dioxide Powder
Selenium Metal LumpsGreen Lasers
Fiber Optic Components for Telecommunications
Crystals & Optics Tellurium Metal Ingot
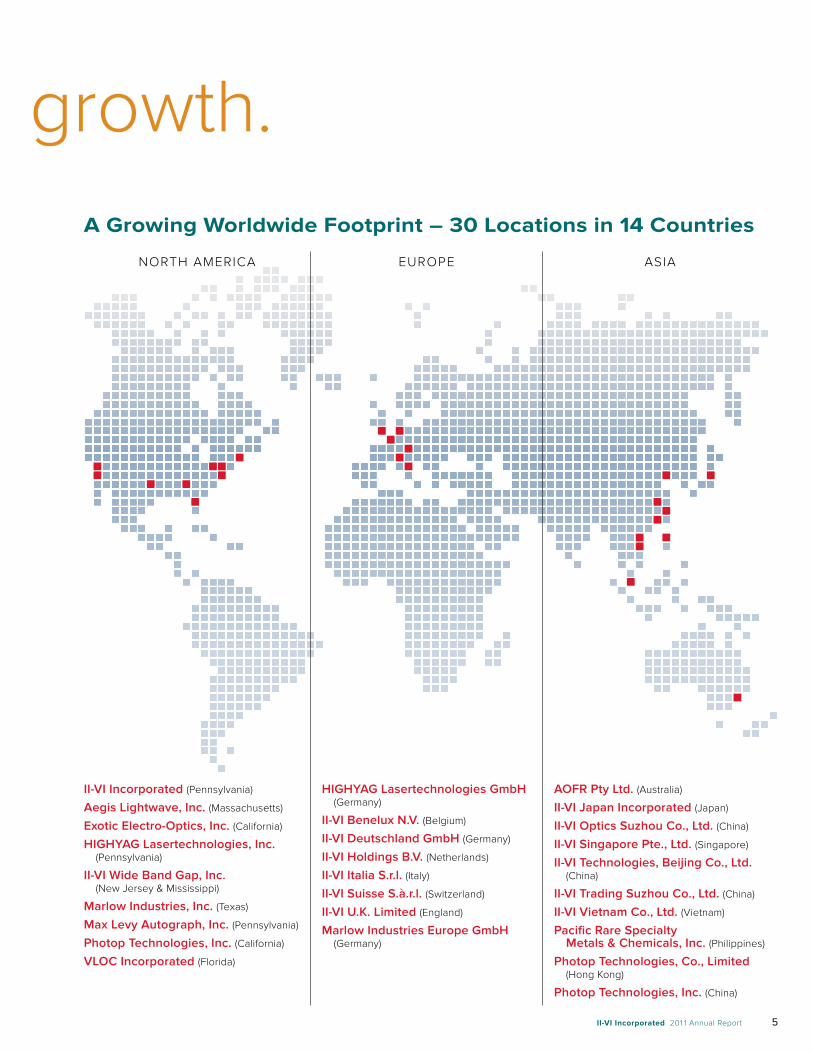
II-VI Incorporated (Pennsylvania)
Aegis Lightwave, Inc. (Massachusetts)
Exotic Electro-Optics, Inc. (California)
HIGHYAG Lasertechnologies, Inc. (Pennsylvania)
II-VI Wide Band Gap, Inc. (New Jersey & Mississippi)
Marlow Industries, Inc. (Texas)
Max Levy Autograph, Inc. (Pennsylvania)
Photop Technologies, Inc. (California)
VLOC Incorporated (Florida)
HIGHYAG Lasertechnologies GmbH (Germany)
II-VI Benelux N.V. (Belgium)
II-VI Deutschland GmbH (Germany)
II-VI Holdings B.V. (Netherlands)
II-VI Italia S.r.l. (Italy)
II-VI Suisse S.à.r.l. (Switzerland)
II-VI U.K. Limited (England)
Marlow Industries Europe GmbH (Germany)
AOFR Pty Ltd. (Australia)
II-VI Japan Incorporated (Japan)
II-VI Optics Suzhou Co., Ltd. (China)
II-VI Singapore Pte., Ltd. (Singapore)
II-VI Technologies, Beijing Co., Ltd. (China)
II-VI Trading Suzhou Co., Ltd. (China)
II-VI Vietnam Co., Ltd. (Vietnam)
Pacific Rare Specialty Metals & Chemicals, Inc. (Philippines)
Photop Technologies, Co., Limited (Hong Kong)
Photop Technologies, Inc. (China)
II-VI Incorporated 201 1 Annual Report 5
A focus on core fundamentals contributes to strong growth.
A Growing Worldwide Footprint – 30 Locations in 14 Countries
NORTH AMERICA EUROPE ASIA

6 II-VI Incorporated 201 1 Annual Report
At II-VI, we believe the success of our business is
directly related to the talented and highly skilled
individuals we employ. And while individuals bring
various skill sets and expertise to the table, team-
work and collaboration yield the ultimate results.
The debut of gesture recognition technology to the market
introduced new potential for II-VI. When a customer
approached Marlow Industries, Inc. (Marlow) to develop a
low-cost, high-volume thermoelectric module to cool the
laser inside their gesture recognition device, Marlow trans-
formed their high-performance concept into high-volume
production. Marlow engineering teams in Dallas and Vietnam
worked in unison to design, manufacture and market a product
under stringent requirements and timelines. An early success
milestone for this joint effort was the successful completion
of the process validation product build, which passed all the
qualification criteria the first time. Once the teams proved out
the process and prototype build, the product was transferred
Teamwork and talent drive new products and new potential.
to Vietnam for mass production. Throughout the project,
the Dallas team was responsible for the thermoelectric cooler
design, manufacturing process, tooling, test equipment
development and product qualification. The Vietnam team
was responsible for the factory, infrastructure set-up, paper-
less data management, staffing and day-to-day production
line management. In the end, Marlow shipped over 8 million
units with no escaping defects.
Although 10,000 miles separate Texas and Vietnam, the
accomplishments of these talented teams helped close the
distance and contributed to a record-breaking year at
Marlow in 201 1.
Marlow Vietnam production line.
Multi-stage Thermoelectric Cooler
Multi-stage Thermoelectric Cooler
Energy Harvesting Device
Single-stage Thermoelectric Cooler

II-VI Incorporated 201 1 Annual Report 7
Innovation is the creation of better or more
effective products, processes and technologies.
This accurately describes our efforts at Exotic
Electro-Optics (EEO), Max Levy Autograph (MLA)
and our Wide Bandgap Group (WBG) in 2011.
In December 2010, II-VI acquired MLA, a manufacturer of
micro-fine conductive mesh patterns for optical, mechanical
and ceramic components for applications such as circuitry,
targeting calibration and suppression of electro-magnetic
interference. MLA adds a portfolio of products and technology
well matched with our EEO subsidiary. Together, EEO and
MLA are able to provide customers innovative, high-performance
solutions for unique applications, such as the Electro-Optic
Targeting System (EOTS) for the Joint Strike Fighter (JSF).
The JSF F-35 aircraft is one of the most technologically
advanced and innovative fighter jets in the world. Its EOTS
allows the pilot to find and destroy enemy targets with greater
precision and at greater standoff distance than any other
targeting pod in the world. This system is the only targeting
pod that has been integrated into the aircraft. EEO’s sapphire
windows are critical to the development of this unique design
approach and require high precision and extreme durability.
Unique innovations drive new, high technology solutions.
The aircraft also has the ability to counter electronic interfer-
ence generated by the enemy in addition to operating multiple
electronic systems without interference from each other
based on microscopic metal screens applied to the windows
by MLA. MLA’s technology is also applicable for applications
that do not use optics, and this same technology can be used
to make vehicles nearly invisible to radar detection.
AT WBG, innovation fueled continued growth in market
share and capacity for high-performance, high-quality silicon
carbide (SiC) wafers. As the industry migrates to larger diameter
wafers, WBG has been developing larger diameter products.
Shipments of 100mm diameter wafers for radio frequency
(RF) applications grew rapidly, with an increase of more than
200% year-over-year. In anticipation of continued demand
for our SiC products, we are adding significant infrastructure.
At our New Jersey operations, we added floor space and
support systems for power and cooling to accommodate
a more than doubling of our SiC crystal growth capacity.
WBG also is expanding its Mississippi operations with a new
10,000-sq.ft. facility scheduled to be occupied in April 2012.
This facility will house a complete back-end manufacturing
line for WBG’s SiC substrates.
Silicon Carbide Wafers
Window Assembly for Fighter Jet Aircraft
Diamond Turned Conical Optic Lens Assembly with Patterned EMI Shield
Low-reflection Grating for UV Applications
Focal Plane Infrared Calibration Target

8 II-VI Incorporated 201 1 Annual Report
Acquisitions are a way for II-VI to expand business
and create shareholder value. Although we have
made several strategic acquisitions this year,
they share a common goal to create synergy;
generating extra energy and effectiveness
through combined efforts.
In July 201 1, II-VI acquired Aegis Lightwave, Inc. (Aegis) to
further strengthen our telecommunications product offerings
and, specifically, create synergies with Photop and other
II-VI subsidiaries. Aegis’s optical channel monitors and other
diverse products align with II-VI initiatives in the telecommu-
nications and industrial markets. Aegis will operate as part of
our Near-Infrared Optics segment and will work cooperatively
with Photop to enhance our ability to respond to our custom-
ers’ needs for advanced product portfolios. Ultimately, this
synergy will enhance our position to support growing deploy-
ments of 40G and 100G networks to develop next generation
telecommunication module technology. By combining forces,
Aegis will have access to more resources and markets and
Photop will be pivotal in helping increase market share in
China. Aegis’s AOFR subsidiary manufactures high-power
fiber couplers and combiners, which also complement II-VI’s
HIGHYAG subsidiary that manufactures one-micron fiber-
beam delivery systems for industrial lasers. Based in Australia,
AOFR is an industry leader in fused fiber components.
Optical Channel Monitor
Fiber Couplers
Acquisitions create new synergies and open up new possibilities.

United StatesSECURITIES AND EXCHANGE COMMISSION
Washington, D.C. 20549FORM 10-K
[X] Annual Report pursuant to Section 13 or 15(d) of the Securities Exchange Act of 1934
for the fiscal year ended June 30, 2011
[ ] Transition report pursuant to Section 13 or 15(d) of the Securities Exchange Act of 1934 for the transition period from ________ to ________.
Commission File Number: 0-16195
II-VI INCORPORATED(Exact name of registrant as specified in its charter)
PENNSYLVANIA 25-1214948(State or other jurisdiction of (I.R.S. Employer incorporation or organization) Identification No.)
375 Saxonburg BoulevardSaxonburg, PA 16056
(Address of principal executive offices) (Zip code)
Registrant's telephone number, including area code: 724-352-4455
Securities registered pursuant to Section 12(b) of the Act:
Title of Each Class Name of Each Exchange on Which RegisteredCommon Stock, no par value Nasdaq Global Select Market
Securities registered pursuant to Section 12(g) of the Act: None
Indicate by check mark if the registrant is a well-known seasoned issuer, as defined in Rule 405 of the Securities Act.
Yes X No
Indicate by check mark if the registrant is not required to file reports pursuant to Section 13 or Section 15(d) of the Exchange Act.
Yes No X
Indicate by check mark whether the registrant (1) has filed all reports required to be filed by Section 13 or 15(d) of the Securities Exchange Act of 1934 during the preceding 12 months (or for such shorter period that the registrant was required to file such reports), and (2) has been subject to such filing requirements for the past 90 days.
Yes X No
Indicate by check mark whether the registrant has submitted electronically and posted on its corporate Web site, if any, every Interactive Data File required to be submitted and posted pursuant to Rule 405 of Regulation S-T during the preceding 12 months (or for shorter period that the registrant was required to submit and post such files).
Yes X No
Indicate by check mark if disclosure of delinquent filers pursuant to Item 405 of Regulation S-K is not contained herein, and will not be contained, to the best of registrant's knowledge, in definitive proxy or information statements incorporated by reference in Part III of this Form 10-K or any amendment to this Form 10-K. [ X ]
Indicate by check mark whether the registrant is a large accelerated filer, an accelerated filer, a non-accelerated filer, or a smaller reporting company. See definition of “large accelerated filer,” “accelerated filer” and “smaller reporting company” in Rule 12b-2 of the Exchange Act. (Check one):
Large accelerated filer Accelerated filer Non-accelerated filer Smaller reporting company (Do not check if a smaller reporting company)
Indicate by check mark whether the registrant is a shell company (as defined in Rule 12b-2 of the Exchange Act).Yes No
Aggregate market value of outstanding Common Stock, no par value, held by non-affiliates of the Registrant at December 31, 2010, was approximately $1,228,692,000 based on the closing sale price reported on the Nasdaq Global Select Market. For purposes of this calculation only, directors and executive officers of the Registrant and their spouses are deemed to be affiliates of the Registrant.
Number of outstanding shares of Common Stock, no par value, at August 19, 2011, was 62,983,833. .

1
DOCUMENTS INCORPORATED BY REFERENCE
Portions of the registrant's definitive proxy statement, which will be issued in connection with the 2011Annual Meeting of Shareholders of II-VI Incorporated, are incorporated by reference into Part III of this Annual Report on Form 10-K.
Forward-Looking Statements
This Annual Report on Form 10-K (including certain information incorporated herein by reference) contains forward-looking statements made pursuant to Section 21E of the Securities Exchange Act of 1934, as amended (the “Exchange Act”), and the safe harbor provisions of the Private Securities Litigation Reform Act of 1995. These statements relate to the Company’s performance on a going-forward basis. Forward looking statements are also identified by words such as “expects,” “anticipates,” “intends,” “plans,” “projects” or similar expressions.
The forward-looking statements in this Form 10-K involve risks and uncertainties, which could cause actual results, performance or trends to differ materially from those expressed in the forward-looking statements herein or in previous disclosures. The Company believes that all forward-looking statements made by it have a reasonable basis, but there can be no assurance that these expectations, beliefs or projections as expressed in the forward-looking statements will actually occur or prove to be correct. Actual results could materially differ from such statements. In addition to general industry and economic conditions, including any failure to sustain the recent recovery from the global economic downturn, factors that could cause actual results to differ materially from those discussed in the forward-looking statements include, but are not limited to: (i) the failure of any one or more of the assumptions stated above to prove to be correct; (ii) the Risk Factors set forth in Item 1A of this Annual Report on Form 10-K; (iii)purchasing patterns from customers and end-users; (iv) timely release of new products, and acceptance of such new products by the market; (v) the introduction of new products by competitors and other competitive responses; (vi) the Company’s ability to devise and execute strategies to respond to market conditions; and/or (vii) the failure of the United States to further increase the federal debt ceiling which could impact the ability of agencies of the federal government to satisfy their payment obligations to the Company and could impact new orders from agencies of the federal government or a material delay in legislation further increasing the debt ceiling or federal budget delays whichcould have a material adverse effect on our results of operations and cash flows.

2
PART I
ITEM 1. BUSINESS
Introduction
II-VI Incorporated (“II-VI,” the “Company,” “we,” “us,” or “our”) was incorporated in Pennsylvania in 1971. Our executive offices are located at 375 Saxonburg Boulevard, Saxonburg, Pennsylvania 16056. Our telephone number is 724-352-4455. Reference to “II-VI,” the “Company,” “we,” “us,” or “our” in this Annual Report on Form 10-K, unless the context requires otherwise, refers to II-VI Incorporated and its wholly-owned and majority-owned subsidiaries. The Company's name is pronounced “Two Six Incorporated.” The majority of our revenues areattributable to the sale of optical components for industrial, military and medical laser applications,telecommunication products, compound semiconductor substrate-based products for industrial, medical and military applications, and elements for material processing and refinement. Reference to “fiscal” or “fiscal year” means our fiscal year ended June 30 for the year referenced.
The Company consists of four reportable segments: (i) Infrared Optics; (ii) Near Infrared Optics; (iii) Military and Materials; and (iv) the Compound Semiconductor Group. See below for a more detailed description of these segments.
In July 2011, the Company acquired all of the outstanding shares of Aegis Lightwave, Inc. (“Aegis”), a privately-held company based in Woburn, Massachusetts with additional locations in New Jersey and Australia, for approximately $52.0 million plus a working capital and debt adjustment of approximately $2.5 million. Aegis supplies tunable optical devices required for high speed optical networks that provide the bandwidth expansion necessary for increasing Internet traffic. Aegis will operate as part of our Near-Infrared Optics business segment. The Company’s financial results for the fiscal year ended June 30, 2011 do not include the results of Aegis, however the Company incurred $0.8 million of transaction costs, net of tax, which were required to be expensed in Fiscal 2011under current accounting standards. The following disclosures under Item 1 of this Annual Report on Form 10-Kexclude discussions pertaining to Aegis and its operations.
In December 2010, the Company acquired all of the outstanding shares of Max Levy Autograph, Inc. (“MLA”), a privately-held company based in Philadelphia, Pennsylvania. MLA manufactures micro-fine conductive mesh patterns for optical, mechanical and ceramic components for applications such as circuitry, metrology standards, targeting calibration and suppression of electro-magnetic interference. MLA became an operating unit within our Military & Materials business segment. The financial results include the results of MLA since the acquisition date.
In January 2010, the Company acquired all the outstanding shares of Photop Technologies, Inc. (“Photop”),a privately-held company based in Fuzhou, China with additional locations in China, the U.S. and Hong Kong. Photop is a vertically integrated manufacturer of crystal materials, optics, microchip lasers for display applications and optical modules for use in fiber optic communication networks and other diverse consumer and commercial applications. Photop became an operating unit within our Near-Infrared Optics business segment. The financial results include the results of Photop since the acquisition date.
In June 2009, the Company sold its x-ray and gamma-ray radiation sensor business, eV PRODUCTS, Inc.,which was previously reported in the Compound Semiconductor Group business segment. Financial and operational data included herein reflect the presentation of eV PRODUCTS, Inc. as a discontinued operation.
Our Internet address is www.ii-vi.com. Information contained on our website is not part of, and should not be construed as being incorporated by reference into, this Annual Report on Form 10-K. We post the following reports on our website as soon as reasonably practical after they are electronically filed with or furnished to the Securities and Exchange Commission (the “SEC”): our annual reports on Form 10-K, our quarterly reports on Form 10-Q, our current reports on Form 8-K, and any amendments to those reports or statements filed or furnished pursuant to Section 13(a) or 15(d) of the Securities Exchange Act of 1934. In addition, we post our proxy statements on Schedule 14A related to our annual shareholders’ meetings as well as reports filed by our directors, officers and ten-percent beneficial owners pursuant to Section 16 of the Exchange Act. We also make available on our website our

3
corporate governance documents, including the Company’s Code of Business Conduct and Ethics, governance guidelines and the charters for various board committees. All such documents are located on the Investors page of our website and are available free of charge.
Information Regarding Market Segments and Foreign Operations
Financial data regarding our revenues, results of operations, industry segments and international sales for the three years ended June 30, 2011 is set forth in the consolidated statements of earnings and in Note 14 to the Company's consolidated financial statements included in Item 8 of this Annual Report on Form 10-K. We also discuss certain Risk Factors set forth in Item 1A of this Annual Report on Form 10-K related to our foreign operations which are incorporated herein by reference.
General Description of Business
We develop, refine, manufacture and market high-technology materials and derivative precision components and products for precision use in industrial, military, telecommunications, photovoltaic, medical and aerospace applications. We use advanced engineered material growth technologies coupled with proprietary high-precision fabrication, micro-assembly, thin-film coating and electronic integration to enable complex optoelectronic devices and modules. Our products are supplied to manufacturers and users in a wide variety of markets including industrial, military, telecommunications, photovoltaic and medical and are deployed in applications that we believe reduce the cost and improve the performance of laser cutting, welding and marking operations; reduce the cost and improve the reliability of military related products; reduce the cost and improve the operations of telecommunication products;reduce the cost and improve the operations of photovoltaic products; reduce the cost and improve the reliability of equipment used in medical procedures; and reduce the cost and improve the performance of cooling and power generation solutions. A key strategy is to develop, refine and manufacture complex materials. We focus on providing critical components to the heart of our customers’ assembly lines for products such as high-power laser material processing systems, military fire control and missile guidance devices, fiber optics and wireless communication systems, photovoltaic systems, medical diagnostic systems and industrial, commercial and consumer thermal management systems. We develop, manufacture, refine and market infrared and near-infrared laser optical elements, military infrared optical components, telecommunication components, selenium and tellurium metals and chemicals, thermoelectric cooling and power generation systems and single crystal silicon carbide (SiC) substrates.
Our U.S. production operations are located in Pennsylvania, Florida, California, New Jersey, Texas and Mississippi and our non-U.S. production operations are based in Singapore, China, Vietnam, the Philippines and Germany. In addition to sales offices at most of our manufacturing sites, we have sales and marketing subsidiaries in Japan, Germany, China, Switzerland, Belgium, the United Kingdom (“U.K.”) and Italy. Approximately 59% of our revenues in the fiscal year ended June 30, 2011 were from product sales to customers outside of the U.S.
Our primary products are as follows:
Laser-related products for CO2 lasers and forward-looking infrared systems and high-precision optical elements used to focus and direct infrared lasers onto target work surfaces. The majority of these laser products require advanced optical materials that are internally produced.
Laser-related products for one micron lasers for cutting, drilling and welding in automotive, semiconductor and other material processing applications. We produce tools for laser material processing, including modular laser processing heads for fiber lasers, yttrium aluminum garnet (“YAG”)lasers and other one-micron laser systems. We also manufacture beam delivery systems including fiberoptic cables and modular beam systems.
Laser-related products for solid-state lasers, high-precision optical elements and assemblies used to focus and direct laser beams onto target work surfaces and Ultra-violet (“UV”) Filters used in systems to detect shoulder-launched missiles to help improve the survivability of low-flying aircraft if attacked. The majority of these laser products require advanced optical materials and crystals that are internally produced.
Optical and photonics components products for use in optical communication networks and other diverse consumer and commercial applications. We leverage our expertise in crystal materials and optics to design and manufacture a diverse range of customized optics and optical components such as optical

4
amplifier and wavelength management devices, optical routing and switching components, projection display components and laser devices.
Military infrared optical products and assemblies including optics for targeting and navigation systems.
Selenium and tellurium metals and chemicals via refining and reclamation processes. These products are used as additive materials for metallurgical, glass and animal feed applications, and are also used for photovoltaic, infrared optics, thermoelectric coolers, electronic and other industrial applications.
Thermoelectric coolers, thermoelectric systems, power generation modules and power generation systems based on highly engineered semiconductor materials that provide reliable and low cost temperature control or power generation capability.
SiC substrates which are wide bandgap semiconductor materials that enable fabrication of electronic devices for highly energy efficient, high frequency and high power applications.
Our Markets
Our market-focused businesses are organized by technology and products. Our business is comprised of the following primary markets:
– Design, manufacture and marketing of optical and electro-optical components and materials for infrared optics for industrial, medical and military applications by our II-VI Infrared operations.
– Design, manufacture and marketing of customized technology for laser material processing to deliver high-power one-micron laser light for industrial applications by our Infrared Optics’ HIGHYAG operations.
– Design, manufacture and marketing of ultra-violet, visible and near-infrared laser products for industrial, military, scientific and medical instruments, including laser gain materials and products for solid-state YAG and other crystal-based lasers by our VLOC Incorporated (“VLOC”) operations in the Near-Infrared Optics segment.
– Design, manufacture and marketing of a diverse range of customized optics and optical components for consumer and commercial applications such as fiber optic communications, projection and display products, lasers and biomedical instrumentation by our Photop operations in the Near-Infrared Optics segment.
– Design, manufacture and marketing of infrared optical components and optical assemblies for military applications and design, manufacturing and marketing of micro-fine conductive mesh patterns for military and commercial applications by our Military & Materials’ Military Infrared Optics operations.
– Refinement, reclamation, manufacturing and marketing of selenium and tellurium products for industrial and photovoltaic applications by our Military & Materials’ Materials Processing and Refinement operations.
– Design, manufacture and marketing of thermoelectric modules and assemblies for cooling, heating and power generation applications, in the defense, telecommunications, medical, automotive, gesture recognition, consumer and industrial markets by our Compound Semiconductor Group’s Marlow Industries, Inc. (“Marlow”) operations.
– Design, manufacture and marketing of single crystal SiC substrates for use in the defense and space, telecommunications, and industrial markets by our Compound Semiconductor Group’s Wide Bandgap Group (“WBG”) operations.
Infrared Optics Market. Over the last few years, significant increases in the installed worldwide base of lasermachines for a variety of laser processing applications have driven CO2 laser optics component consumption. It is estimated that there are nearly 60,000 CO2 laser systems currently deployed in the world. CO2 lasers offer benefits in a wide variety of cutting, welding, drilling, ablation, cladding, heat treating and marking applications for materials

5
such as steel alloys, non-ferrous metals, plastics, wood, paper, fiberboard, ceramics and composites. Laser systems enable the manufacturers to reduce part cost and improve quality, as well as improve process precision, speed, throughput, flexibility, repeatability and automation. Automobile manufacturers, for example, deploy lasers both to cut body components and to weld those parts together in high-throughput production lines. Manufacturers of motorcycles, lawn mowers and garden tractors cut, trim, and weld metal parts with lasers to reduce post-processing steps and, therefore, lower overall manufacturing costs. Furniture manufacturers utilize lasers because of their easily reconfigurable, low-cost prototyping and production capabilities for customer-specified designs. In high-speed food and pharmaceutical packaging lines, laser marking is used to provide automated product, date, and lot coding on containers. In addition to being installed by original equipment manufacturers (“OEMs”) of laser systems in new machine builds, our optical components are purchased as replacement parts by end users of laser machines to maintain proper system performance. We believe that the current addressable market serviced by our II-VI Infraredoperations is approximately $500 million.
One-Micron Laser Market. In many areas of material processing, laser technology has proven to be a better alternative to conventional production techniques. The precise cut and elegant seam are visible proof of a laser beam’s machining efficiency. Industrial applications such as cutting, drilling and welding have driven the recent market growth of the one-micron laser systems, and are demanding increased performance, lower total cost of ownership, ease of use and portability of one-micron laser systems. One-micron laser systems require efficient and reliable tools, including modular laser processing heads for fiber lasers, beam delivery systems including fiber optic cables and modular beam systems. We believe that the current addressable market serviced by our HIGHYAG operations is approximately $50 million.
Near-Infrared Optics Market. The Near-Infrared laser market is driven by applications in thetelecommunication, military, medical and industrial markets. The telecommunication market is being driven by demand for high-bandwidth communication capabilities by the growing number of Internet subscribers and broadband users worldwide and the greater reliance on high-bandwidth capabilities in our daily lives. For example,Internet activities, video and music downloads, gaming, social networking and other on-line interactive applications are growing rapidly. Communication networks are being extended closer to the end user with fiber-to-the-home and other fiber optical networks. Mobile data traffic also is increasing as smart phones continue to proliferate with increasingly sophisticated audio, photo, video, email and Internet capabilities. The resulting traffic, in turn, is felt throughout the network, including the core that depends on optical technology. Military applications include use in long-range surveillance, rangefinders, target designators, missile detection, countermeasures and high energy laser weapon systems. Medical applications include aesthetic, vision correction, dental, ophthalmic and diagnostic lasers. Industrial market segments are addressed by YAG lasers, which are used in higher power applications such as cutting and welding, and lower power applications such as marking and scribing. These industrial applications aredemanding higher performance levels for less cost, creating competition for other technologies. The near-infrared market also addresses opportunities in the semiconductor processing, instrumentation and research segments. Webelieve that the current addressable markets serviced by our Near-Infrared Optics segment is approximately $1.5billion.
Military Infrared Optics Market. We provide several key infrared optical components such as windows, domes and related subassemblies to the military market for infrared applications in night vision, targeting, navigation and Homeland Security systems. Infrared window and window assemblies for navigational and targeting systems are deployed on fixed and rotary-wing aircraft, such as the F-16 fighter jet, Apache Attack Helicopter, Joint Strike Fighterand ground vehicles such as the Abrams M-1 Tank and Bradley Fighting Vehicle. Infrared domes are used on missiles with infrared guidance systems ranging from small, man-portable designs to larger designs mounted on helicopters, fixed-wing aircraft and ground vehicles. Additionally, multiple fighter jets including the F-16 are being equipped with large area sapphire windows, manufactured by the Company, as a key component for the aircraft providing advanced targeting and imaging systems. The development and manufacture of these large area sapphire windows has played a key role in our ability to provide an even larger suite of sapphire panels that are a key component of the Joint Strike Fighter Electro Optical Targeting System. High-precision domes are an integral component of a missile’s targeting system providing efficient tactical capability while serving as a protective cover to its internal components. A key attribute to these systems is the ability to filter electro-magnetic interference (“EMI”)using micro-fine conductive mesh patterns. This technology is also applied to non-optical applications for absorbing and transmitting energy from the surfaces of aircraft and missiles. Our military infrared optical and non-optical products are sold primarily to U.S. Government prime contractors and directly to various U.S. Government agencies. These products have applications in commercial and medical markets as well. We believe that the current addressable market serviced by our Military Infrared Optics business is approximately $550 million.
Materials Processing and Refinement Market. Numerous processes require the presence of high-purity elements for proper processing. The Company’s Pacific Rare Specialty Metals & Chemicals, Inc. (“PRM”) business

6
addresses the market for two specific rare elements: selenium and tellurium. Selenium and tellurium usually are by-products of refining processes for other more common materials such as copper and zinc. High-purity selenium and tellurium are used in a variety of industrial applications, including the manufacture of steel and glass, the production of animal feeds and fertilizers, the manufacture of infrared optics and thermoelectric coolers and the production of photovoltaic solar panels. Our products are sold to customers who require selenium and/or tellurium in their manufacturing processes. We believe that the current addressable market serviced by our PRM business is approximately $150 million, although market estimates are highly dependent upon minor metal indexed pricing.
Thermoelectric Market. Thermoelectric Modules (“TEMs”) are solid-state semiconductor devices that act as small heat pumps to cool, heat, and temperature stabilize a wide range of materials, components and systems. Conversely, the principles underlying thermoelectrics allow TEMs to be used as a source of power when subjected to a temperature difference. TEMs are more reliable than alternative cooling solutions that require moving parts and provide more precise temperature control solutions than competing technologies. TEMs also have many other advantages which spurred the adoption of TEMs in a variety of industries and applications. For example, TEMs provide critical cooling and temperature stabilization solutions in a myriad of defense and space applications, including infrared cooled and un-cooled night vision technologies and thermal reference sources that are deployed in state-of-the-art weapons, as well as cooling high powered lasers used for range-finding target designation by military personnel. TEMs also allow for temperature stabilization of telecommunication lasers that generate and amplify optical signals for fiber optics systems. Thermoelectric based solutions appear in a variety of medical applications including instrumentation and analytical applications such as DNA replication, blood analyzers and medical laser equipment. The industrial, commercial, and consumer markets provide a variety of niche applications ranging from desktop refrigerators and wine coolers to gesture recognition technology, semiconductor process and test equipment. In addition, power generation applications are expanding into fields such as waste heat recovery, heat scavenging and co-generation. We believe the current addressable markets serviced by our Marlow operations is approximately $300million.
Silicon Carbide Substrate Market. Silicon Carbide (SiC) is a wide bandgap semiconductor material that offers high-temperature, high-power and high-frequency capabilities as a substrate for applications that are emerging at the high-performance end of the defense, telecommunication and industrial markets. SiC has certain intrinsic physical and electronic advantages over competing semiconductor materials such as Silicon and Gallium Arsenide. For example, the high thermal conductivity of SiC enables SiC-based devices to operate at high power levels and still dissipate the excess heat generated. Typically, our customers deposit either SiC or Gallium Nitride (GaN) epitaxial layers on a SiC substrate and then fabricate electronic devices. SiC and GaN-based structures are being developed and deployed for the manufacture of a wide variety of microwave and power switching devices. High-power, high-frequency SiC-based microwave devices are used in next generation wireless switching telecommunication applications and in both commercial and military radar applications. SiC-based, high-power, high-speed devices improve the performance, efficiency and reliability of electrical power transmission and distribution systems (“smart grid”), as well as power conditioning and switching in power supplies and motor controls in a wide variety of applications including aircraft, hybrid vehicles, industrial, communications and green energy applications. We believe the current addressable market serviced by our WBG operations is approximately $50 million.
Our Strategy
Our strategy is to build businesses with world-class, high-technology materials capabilities at their core. Our significant materials capabilities are as follows:
Infrared Optics: Zinc Selenide (ZnSe), Zinc Sulfide (ZnS), and Zinc Sulfide Multi Spectral (ZnS-MS)Near-Infrared Optics: Yttrium Aluminum Garnet (YAG), Yttrium Lithium Fluoride (YLF), Calcium Fluoride (CaF2), Yttrium Vanadate (YVO4), Potassium Titanyl Phosphate (KTP) and Barium Borate Oxide (BBO)Military Infrared Optics: Germanium (Ge) and Sapphire Materials Processing and Refinement: Selenium (Se) and Tellurium (Te)Thermoelectric Coolers: Bismuth Telluride (Bi2Te3)Silicon Carbide Substrates: Silicon Carbide (SiC)
We manufacture precision parts and components from these and other materials using our expertise in low damage surface and micro fabrication, thin-film coating and exacting metrology. A substantial portion of our business is based on contracts with market leaders, which enable our forward planning and production efficiencies. We intend to capitalize on the execution of this proven model, participate effectively in the growth of the markets and continue our focus on operational excellence as we execute additional growth initiatives.

7
Our specific strategies are as follows:
- Vertical-Integration. By combining the capabilities of our various business segments and operating units, we have created opportunities for our businesses to address manufacturing opportunities across multiple disciplines and markets. Where appropriate, we develop and/or acquire technological capabilities in areas such as material refinement, crystal growth, fabrication, diamond-turning, thin-film coating, metrology and assembly.
- Investment in Manufacturing Operations. We strategically invest in our manufacturing operations worldwide to increase production capacity and capabilities. The majority of our capital expenditures are for our manufacturing operations.
- Enhance Our Reputation as a Quality and Customer Service Leader. We are committed to understanding our customers' needs and meeting their expectations. We have established ourselves as a consistent, high quality supplier of components into our customers' assembly lines. In many cases, we deliver on a just-in-time basis. We believe our quality and delivery performance enhances our relationships with our customers.
- Identify New Products and Markets. We intend to identify new products and markets to meet evolving customer requirements for high performance materials. Due to the special properties of the advanced materials we produce, we believe there are numerous applications and markets for such materials.
- Utilize Asian Manufacturing Operations. Our manufacturing operations in Singapore, China, the Philippines and Vietnam play an important role in the operational and financial performance of the Company. We will continue to strategically invest in these operations and utilize their capabilities.
- Identify and Complete Strategic Acquisitions and Alliances. Some of the markets we participate in remain fragmented, and we expect consolidation to occur. We will carefully pursue strategic acquisitions and alliances with companies whose products or technologies may compliment our current products, expand our market opportunities or create synergies with our current capabilities. We intend to identify acquisition opportunities that accelerate our access to emerging high-growth segments of the markets we serve and further leverage our competencies and economies of scale.
- Pursue Military Programs and Leverage Capability in Other Markets. Our Military Infrared Optics business primarily serves military and defense applications. In addition, a portion of our other businesses are focused on products that are utilized in military and defense applications. Our strategy is to actively work with major defense contractors during the initial product development phase in order to incorporate our products into our customers’ systems. Military applications typically have demanding performance requirements and the capabilities used to service this market may be used to leverage high-end applications in other markets. Early participation in long-term programs has proven to be a successful strategy and a competitive advantage in addressing the military market and successful performance in this market has proven beneficial when pursuing high-end requirements in other markets.
- Balanced Approach to Research and Development. Our research and development program includes both internally and externally funded research and development expenditures targeting an overall investment ofbetween 5 and 7 percent of product revenues. We are committed to accepting the right mix of internally and externally funded research that ties closely to our long-term strategic objectives.
Our Products
The main products for each of our markets are described as follows:
Infrared Optics. We supply a broad line of precision infrared optical components such as lenses, output couplers, windows and mirrors for use in CO2 lasers. Our precision optical components are used to attenuate the amount of laser energy, enhance the properties of the laser beam and focus and direct laser beams to a target work surface. The optical components include both reflective and transmissive optics and are made from materials such as ZnSe, ZnS, copper, silicon, gallium arsenide and germanium. Transmissive optics used with CO2 lasers are predominately made from ZnSe. We believe we are the largest manufacturer of ZnSe in the world. We supply replacement optics to end users of CO2 lasers. Over time, optics may become contaminated and must be replaced to maintain peak laser operations. This aftermarket portion of our business continues to grow as laser applications proliferate worldwide and the installed base of serviceable laser systems increases each year. We estimate that 85% to

8
90% of our infrared optics sales service this installed base of CO2 laser systems. We serve the aftermarket via a combination of selling to OEMs and selling directly to system end users.
One-Micron Laser Components. Our broad expertise in laser technology, optics, sensor technology and laser applications enables us to supply a broad array of tools for laser materials processing, including modular laser processing heads for fiber lasers, YAG lasers and other one-micron laser systems. We also manufacture beam delivery systems including fiber optic cables and modular beam systems.
Near-Infrared Optics. We manufacture products across a broad spectral range, including UV, Visible and Near-Infrared. We offer a wide variety of standard and custom laser gain materials, optics and assemblies for telecommunications, military, medical, industrial, scientific and research and development laser systems. Laser gain materials are produced to stringent industry specifications and precisely fabricated to customer demands. Key materials and precision optical components for YAG and other solid-state laser systems complete our near-infrared optics product offerings. We manufacture waveplates, polarizers, lenses, prisms and mirrors for visible and near-infrared applications, which are used to control or alter visible or near-infrared energy and its polarization. In addition, we manufacture coated windows used as debris shields in the industrial and medical laser aftermarkets. Weoffer fiber optics and micro optics and photonic crystal parts for optical communications, optical and photonic crystal parts for instrumentation and laser applications, optical components and functional modules for optical communication networks, and diode pumped solid-state laser devices for optical instruments, display and biotechnology. Our Near-Infrared Optics segment also produces components for UV Filters used in early warning missile detection. The end use of the UV Filter products we make is in systems used to detect shoulder-launched missiles to help improve the survivability of low-flying aircraft when attacked.
Military Infrared Optics. We offer optics and optical subassemblies for infrared systems including thermal imaging, night vision, targeting and navigation systems. Our product offering is comprised of missile domes, electro-optical windows and subassemblies, imaging lenses and other components. Our precision optical products utilize infrared optical materials such as Sapphire, Germanium, Zinc Sulfide, Zinc Selenide, Silicon, and Spinel. In addition, our products also include visible and crystalline materials such as Calcium Fluoride, Barium Fluoride and Fused Silica. Our products are currently utilized on the F-35 fighter jet, Apache Attack Helicopter, Joint Strike Fighter and ground vehicles such as the Abrams M-1 Tank and Bradley Fighting Vehicle as typical examples.
Material Processing and Refinement. Our product offering includes selenium and tellurium metals and chemicals in a variety of purity levels and forms.
Thermoelectric Modules and Assemblies. We supply a broad array of thermoelectric modules and related assemblies to various market segments. In the defense market, TEMs are used in guidance systems, smart weapons and night vision systems, as well as soldier cooling. TEMs are also used in products providing temperaturestabilization for telecommunication lasers that generate and amplify optical signals for fiber optic communication systems. TEMs are also used in gesture recognition technology. We also produce and sell a variety of solutions from thermoelectric components to complete sub-assemblies used in the medical equipment market and other industrial andcommercial applications. Thermoelectric modules, used as power generators are also applied in a range of end-use applications. We offer single-stage TEMs, micro TEMs, multi-stage TEMs, planar multi-stage TEMs, extended life thermocyclers, thermoelectric thermal reference sources, power generators and thermoelectric assemblies.
Silicon Carbide. Our product offerings are 6H-SiC (semi-insulating) and 4H-SiC (conducting) poly-types and are available in sizes up to 100mm diameter. SiC substrates are used in wireless infrastructure, radio frequency (“RF”) electronics, power conversion and power switching industries.
Research, Development and Engineering
Our research and development program includes internally and externally funded research and development expenditures targeting an overall investment of between 5 and 7 percent of product revenues. From time to time, the ratio of externally funded contract activity to internally funded contract activity varies due to the variability ofgovernment research programs and changes in the focus of our internally funded research programs. We are committed to accepting the right mix of internally and externally funded research that ties closely to our long-term strategic objectives. The Company expects externally funded research and development to decrease in the near term due to governmental budget constraints.
We devote significant resources to research, development and engineering programs directed at the continuous improvement of existing products and processes and to the timely development of new technologies, materials and products. We believe that our research, development and engineering activities are essential to our

9
ability to establish and maintain a leadership position in each of the markets that we serve. As of June 30, 2011, we employed 704 people in research, development and engineering functions, 399 of whom are engineers or scientists. In addition, certain manufacturing personnel support or participate in research and development on an ongoing basis. Interaction between the development and manufacturing functions enhances the direction of projects, reduces costs and accelerates technology transfers.
During the fiscal year ended June 30, 2011, we focused our research and development investments in the following areas:
- Silicon Carbide Substrate Technology: SiC substrate technology development efforts continue to move forward, with emphasis in the areas of defect density reduction, substrate fabrication, surface polishing and diameter expansion. In fiscal year 2011, we began work on a new program funded by the Air Force Research Laboratory (“AFRL”) for development and manufacturing optimization of 100mm – 150mm 4H (semi-conducting) SiC substrates for high power switching applications and 6H (semi-insulating) SiC substrates for RF applications. Our research and development efforts in all of these areas have been both internally and externally funded.
- CVD Diamond Technology: The Company is currently developing chemical vapor deposition (“CVD”) synthetic diamond materials for various optical applications. Our research and development efforts in this area have been internally funded.
- Photonics Design: We have ongoing efforts to design, refine and improve our photonic crystal materials, precision optical and micro optical parts, passive and active optical components and laser devices forinstrumentation and display. Our research and development efforts in this area have been internally funded.
- Thermoelectric Materials and Devices: We continue to develop the industry-leading Bi2Te3 Micro-Alloyed Materials (“MAM”) for thermoelectric cooling applications. Enabled by the thermal performance and fine grain microstructure of MAM, our research and development has focused on achieving levels of miniaturization and watt density beyond the reach of TEMs based on single crystal and polycrystalline materials produced by standard crystal growth techniques. In addition, we are developing capabilities in thermoelectric power generation materials that, combined with our intellectual property position, will allow us to bring to market new thermoelectric compounds. Our research and development efforts in this area havebeen both internally and externally funded.
The development of our products and manufacturing processes is largely based on proprietary technical know-how and expertise. We rely on a combination of contract provisions, trade secret laws, invention disclosures and patents to protect our proprietary rights. We have entered into selective intellectual property licensing agreements. When faced with potential infringement of our proprietary information, we have in the past and continue currently to assert and vigorously protect our intellectual property rights.
Internally funded research and development expenditures were $16.1 million, $11.8 million and $10.2million for the fiscal years ended June 30, 2011, 2010 and 2009, respectively. For these same periods, the externally funded research and development expenditures were $7.8 million, $7.0 million and $7.5 million, respectively.
Marketing and Sales
We market our products through a direct sales force and through representatives and distributors around the world. Our market strategy is focused on understanding our customers’ requirements and building market awareness and acceptance of our products. New products are continually being produced and sold to our established customers in all markets.
Each of our subsidiaries is responsible for its own worldwide marketing and sales functions, although certain subsidiaries sell more than one product line. However, there is significant cooperation and coordination between our subsidiaries to utilize the most efficient and appropriate marketing channel when addressing the diverse applications within the markets. These subsidiaries and related product lines are as follows:
– The Infrared Optics marketing and sales activities are handled through a direct sales force in the U.S. and through our wholly-owned subsidiaries in Japan, Germany, Singapore, China, Belgium,Switzerland, the U.K. and Italy as well as through distributors throughout the rest of the world.

10
–
– The One-micron Laser marketing and sales activities are handled through a direct sales force in the U.S., Japan and Germany as well as through distributors throughout the rest of the world.
– The Near-Infrared Optics segment markets its products through its direct sales force in the U.S., China, Germany and Japan and through distributors throughout the rest of the world.
– The Military Infrared Optics marketing and sales initiative is handled through a direct sales force in the U.S.
– The Materials Processing and Refinement marketing and sales initiative is handled through a direct sales force in the Philippines and occasionally through non-exclusive distribution channels.
– The Thermoelectric marketing and sales initiative is handled through a direct sales force in the U.S., through our wholly-owned subsidiary in Germany, through direct sales forces co-located in II-VI offices in Japan, Singapore and China as well as through distributors throughout the rest of the world.
– The Silicon Carbide marketing and sales initiative is handled through a direct sales force in the U.S. and at our wholly-owned international subsidiaries.
Our sales forces develop effective communications with our OEM and end-user customers worldwide. Products are actively marketed through targeted mailings, telemarketing, select advertising, attendance at trade shows and customer partnerships. Our sales forces include a highly-trained team of application engineers to assist customers in designing, testing and qualifying our parts as key components of our customers' systems. As of June 30, 2011, we employed 225 individuals in sales, marketing and support.
We do business with a number of customers in the defense industry, who in turn generally contract with a governmental entity, typically a U.S. Governmental agency. Most governmental programs are subject to funding approval and can be modified or terminated without warning by a legislative or administrative body. The discussion provided in the section on Risk Factors set forth in Item 1A of this Annual Report Form 10-K related to our exposure to government markets is incorporated herein by reference.

11
Manufacturing Technology and Processes
As noted in the “Our Strategy” section, many of the products we produce depend on our ability to manufacture and refine technically challenging materials and components. The table below shows these key materials.
Product Line Materials Produced/Refined
Infrared Optics ZnSe, ZnS, ZnS-MSNear-Infrared Optics – VLOC YAG, YLF, and CaF2Near-Infrared Optics – Photop YVO4, KTP and BBOMilitary Infrared Optics Ge and SapphireMaterials Processing and Refinement Se and TeThermoelectric Modules and Assemblies Bi2Te3Silicon Carbide Substrates SiC
The ability to produce, process and refine these difficult materials and to control their quality and yields is an expertise of the Company. Processing these materials into finished products is also difficult to accomplish; yet the quality and reproducibility of these products are critical to the performance of our customers’ instruments and systems. In the markets we serve, there are a limited number of suppliers of many of the components we manufacture and there are very few industry-standard products.
Our network of worldwide manufacturing sites allows products to be produced in regions that provide cost-effective advantages and enable proximity to our customers. We employ numerous advanced manufacturing technologies and systems at our manufacturing facilities. These include automated Computer Numeric Control optical fabrication, high throughput thin-film coaters, micro-precision metrology and custom-engineered automated furnace controls for the crystal growth processes. Manufacturing products for use across the electro-magnetic spectrum requires the capability to repeatedly produce products with high yields to atomic tolerances. We embody a technology and quality mindset that gives our customers the confidence to utilize our products on a just-in-time basis straight into the heart of their production lines.
Export and Import Compliance
We are required to comply with various export/import control and economic sanctions laws, including:
– The International Traffic in Arms Regulations (“ITAR”) administered by the U.S. Department of State, Directorate of Defense Trade Controls, which, among other things, imposes license requirements on the export from the United States of defense articles and defense services which are items specifically designed or adapted for a military application and/or listed on the United States Munitions List;
– The Export Administration Regulations (“EAR”) administered by the U.S. Department of Commerce, Bureau of Industry and Security, which, among other things, imposes licensing requirements on the export or re-export of certain dual-use goods, technology and software which are items that potentially have both commercial and military applications;
– The regulations administered by the U.S. Department of Treasury, Office of Foreign Assets Control, which implement economic sanctions imposed against designated countries, governments and persons based on United States foreign policy and national security considerations; and
– The import regulatory activities of the U.S. Customs and Border Protection.
Foreign governments have also implemented similar export and import control regulations, which may affect our operations or transactions subject to their jurisdictions. The discussion provided in the section on Risk Factors set forth in Item 1A of this Annual Report Form 10-K related to our import and export compliance is incorporated herein by reference.

12
Sources of Supply
The major raw materials we use include zinc, selenium, zinc selenide, zinc sulfide, hydrogen selenide, hydrogen sulfide, tellurium, yttrium oxide, aluminum oxide, iridium, platinum, bismuth, silicon, thorium fluoride, antimony, carbon, gallium arsenide, copper, germanium, molybdenum, quartz, optical glass and other materials.Excluding our own production, there are more than two external suppliers for all of the above materials except for ZnSe, ZnS, hydrogen selenide and thorium fluoride, for which there is only one proven source of supply outside of the Company’s capabilities. For many materials, we have entered into purchase arrangements whereby suppliers provide discounts for annual volume purchases in excess of specified amounts.
The continued high-quality of and access to these materials is critical to the stability and predictability of our manufacturing yields. We conduct testing of materials at the onset of the production process. Additional research and capital investment may be needed to better define future starting material specifications. We have not experienced significant production delays due to shortages of materials. However, we do occasionally experience problems associated with vendor-supplied materials not meeting contract specifications for quality or purity. A significant failure of our suppliers to deliver sufficient quantities of necessary high-quality materials on a timely basis could have a materially adverse effect on the results of our operations.
Customers
Our existing customer base for infrared optics including our laser component products consists of over 6,000 customers worldwide. The main groups of customers for these products are as follows:
OEM and system integrators of industrial, medical and military laser systems. Representative customers include Rofin-Sinar Technologies, Trumpf, Inc. and Bystronic, Inc.
Laser end users who require replacement optics for their existing laser systems. Representative customers include Caterpillar, Inc. and GSI Group, Inc.
Military and aerospace customers who require products for use in advanced targeting, navigation and surveillance. Representative customers include Northrop Grumman Corporation and Lockheed-MartinCorporation.
For our one-micron laser products, our customers are automotive manufacturers, laser manufacturers and system integrators. Representative customers include Volkswagen Corporation, and Bystronic, Inc.
For our near-infrared laser-based optics and crystal products, our customers are OEMs and system integrators of solid-state lasers used in industrial, scientific, military and medical markets. Representative customers include Candela Corporation, Raytheon Company and Northrop Grumman Corporation.
For our near-infrared high-volume optics and components products our customers are system and sub-system integrators for telecommunications, data communications and cable TV, as well as manufacturers of commercial and consumer products such as instrumentation, display and projection devices.
For our military infrared optics products, our customers are manufacturers of equipment and devices for aerospace, defense, medical and commercial markets. Representative customers include Lockheed-MartinCorporation, Raytheon Company and various U.S. Government agencies.
For our materials processing and refining products, our customers are manufacturers and developers of materials for industrial applications, including the manufacturing of steel and glass, the production of animal feeds and fertilizers and the manufacturing of infrared optics, thermoelectric coolers and solar cells. Representativecustomers include Retorte Aurubis Group and 5NPlus, Inc.
For our thermoelectric products, our customers manufacture and develop equipment and devices for defense, space, telecommunications, medical, industrial, automotive, gesture recognition and commercial markets. Representative customers include Raytheon Company, Beckman Coulter, Inc. and Oclaro, Inc.
For our SiC products, our customers are manufacturers and developers of equipment and devices for highpower RF electronics and high-power and high-voltage switching and power conversion systems for both the U.S. Department of Defense and commercial applications.

13
Competition
We believe that we are a significant producer of products and services in our addressed markets. In the area of infrared laser optics and materials, we believe we are an industry leader. We believe that we are an industry leader in laser material processing tools for high-power one-micron laser systems. We are a significant supplier of YAG rods and near-infrared laser optics to the worldwide markets for defense, scientific, research, medical and industrial applications. We are a leading photonics designer and integrator of fiber optics, micro optics, precision optics, and photonics crystal materials for optical communication applications. We are a leading supplier of infrared optics used in complex military assemblies for targeting, navigation and thermal imaging systems to major military prime contractors. We believe we are a leading supplier of selenium and tellurium products for electronic, agricultural,photovoltaic and thermoelectric applications. We believe we are a global leader in the design and manufacturer of TEMs and thermal control assemblies. We believe we are a global leader in the manufacturing of single crystal semi-insulating SiC substrates for use in the defense and telecommunication markets, and a preferred alternative to the current leading supplier of SiC for industrial markets.
We compete on the basis of product technical specifications, quality, delivery time, technical support and pricing. Management believes that we compete favorably with respect to these factors and that our vertical integration, manufacturing facilities and equipment, experienced technical and manufacturing employees and worldwide marketing and distribution provide competitive advantages.
We have a number of present and potential competitors that are larger and have greater financial, selling, marketing or technical resources. Competitors producing infrared laser optics include Sumitomo Electric Industries, Ltd. and Ophir Optronics, Ltd. Competing producers of automated equipment and laser material processing tools to deliver high power one-micron laser systems include Optoskand AB, and Precitec, Inc. Competing producers of YAG materials and optics include Northrop Grumman Corporation and CVI Melles Griot. Competing producers of optical component and optics products include O-Net Communications Ltd., OPLINK Communication, Inc. and CASIX, Inc. Competing producers of infrared optics for military applications include DRS Technologies, Inc.,Goodrich Corporation and in-house fabrication and thin film coating capabilities of major military customers.Competing producers of selenium and tellurium metals and other chemicals include Umicore and Vital Chemical. Competing producers of TEMs include Komatsu, Ltd., Laird Technologies and Ferrotec Corporation. Competing producers of single crystal SiC substrates include Cree, Inc., Dow Corning Corporation and SiCrystal AG.
In addition to competitors who manufacture products similar to those we produce, there are other technologies or materials that can compete with our products.
Bookings and Backlog
We define our bookings as customer orders received that are expected to be converted to revenues over the next twelve months. For long-term customer orders, the Company records only those orders which are expected to be converted into revenues within twelve months from the end of the reporting period due to the inherent uncertainty of an order that far in the future. For the year ended June 30, 2011, our bookings, including those bookings converted to revenues prior to year end, were approximately $520 million compared to bookings of approximately $388 million for the year ended June 30, 2010.
We define our backlog as bookings that have not been converted to revenues by the end of the reporting period. Bookings are adjusted if changes in customer demands or production schedules move a delivery beyondtwelve months. As of June 30, 2011, our backlog was approximately $176 million compared to approximately $157million at June 30, 2010.
Employees
As of June 30, 2011, we employed 6,195 persons worldwide. Of these employees, 704 were engaged in research, development and engineering, 4,739 in direct production (of which 899 employees of Photop in China work under contract manufacturing arrangements for customers of the Company) and the remaining balance of the Company’s employees work in sales and marketing, administration, finance and support services. Our production staff includes highly skilled optical craftsmen. We have a long-standing practice of encouraging active employee participation in areas of operations management. We believe our relations with our employees to be good. We reward our employees with incentive compensation based on achievement of performance goals. There are 149employees located in the Philippines that are covered under a collective bargaining agreement.
14
Trade Secrets, Patents and Trademarks
We rely on our trade secrets, proprietary know-how, invention disclosures and patents to help us develop and maintain our competitive position. We have begun to aggressively pursue process and product patents in certain areas of our businesses. We have confidentiality and noncompetition agreements with certain personnel. We require that all U.S. employees sign a confidentiality and noncompetition agreement upon commencement of employment.
The processes and specialized equipment utilized in crystal growth, infrared materials fabrication and infrared optical coatings as developed by us are complex and difficult to duplicate. However, there can be no assurance that others will not develop or patent similar technology or that all aspects of our proprietary technology will be protected. Others have obtained patents covering a variety of infrared optical configurations and processes, and others could obtain patents covering technology similar to our technology. We may be required to obtain licenses under such patents, and there can be no assurance that we would be able to obtain such licenses, if required, on commercially reasonable terms, or that claims regarding rights to technology will not be asserted which may adversely affect our results of operations. In addition, our research and development contracts with agencies of the U.S. Government present a risk that project-specific technology could be disclosed to competitors as contract reporting requirements are fulfilled.
We currently hold several registered tradenames and trademarks including the following:
“II-VI Incorporated(TM)” tradename“Infraready Optics(TM)” tradename “MP-5(TM)” tradename “Marlow Industries, Inc. (TM)” tradename and trademark“Photop Technologies, Inc. (TM)” tradename“VLOC Incorporated(TM)” trademark
ITEM 1A. RISK FACTORS
The Company cautions investors that its performance and, therefore, any forward-looking statement is subject to risks and uncertainties. Various important factors including, but not limited to, the following may cause theCompany’s future results to differ materially from those projected in any forward-looking statement.
General Economic Conditions May Adversely Affect Our Business, Operating Results and Financial Condition
Current and future conditions in the economy have an inherent degree of uncertainty. As a result, it is difficult to estimate the level of growth or contraction for the economy as a whole. It is even more difficult to estimate growth or contraction in various parts, sectors and regions of the economy, including industrial, military,telecommunication, photovoltaic and medical markets in which we participate. Because all components of our forecasting are dependent upon estimates of growth or contraction in the markets we serve and demand for our products, the prevailing economic uncertainties render estimates of future income and expenditures very difficult to make. In addition, changes in general economic conditions may affect industries in which our customers operate. These changes could include decreases in the rate of consumption or use of our customers’ products due to economic downturn. These conditions may have a material adverse effect on demand for our customers’ product and, in turn, on demand for our products. Adverse changes have occurred and, although we have experienced improvements in worldwide markets and customers’ demand in fiscal year 2011, changes may occur in the future as a result of declining or flat global or regional economic conditions, fluctuations in currency and commodity prices, wavering confidence, capital expenditure reductions, unemployment, decline in stock markets, contraction of credit availability or other factors affecting economic conditions generally. For example, factors that may affect our operating results include disruptions to the credit and financial markets in the U.S., Europe and elsewhere; adverse effects of the ongoing sovereign debt crisis in Europe; the impact of a failure to further increase the debt ceiling in the U.S.;contractions or limited growth in consumer spending or consumer credit; and adverse economic conditions that maybe specific to the Internet, e-commerce and payments industries. These changes may negatively affect sales of products, increase exposure to losses from bad debt, and increase the cost and availability of financing and increase costs associated with manufacturing and distributing products. Any economic downturn or the failure to sustain the recent recovery from the global economic downturn could have a material adverse effect on our business, results of operations or financial condition.

15
Our Future Success Depends on International Sales and Management of Global Operations
Sales to customers in countries other than the U.S. accounted for approximately 59%, 49% and 44% of revenues during the years ended June 30, 2011, 2010 and 2009, respectively. We anticipate that international sales will continue to account for a significant portion of our revenues for the foreseeable future. In addition, we manufacture products in Singapore, China, Vietnam, the Philippines and Germany and maintain direct sales offices in Japan, Germany, Switzerland, the U.K., Belgium, Singapore, China and Italy. Sales and operations outside of the U.S. are subject to certain inherent risks, including fluctuations in the value of the U.S. dollar relative to foreign currencies, the current global economic uncertainties, tariffs, quotas, taxes and other market barriers, political and economic instability, restrictions on the export or import of technology, potentially limited intellectual property protection, difficulties in staffing and managing international operations and potentially adverse tax consequences. There can be no assurance that any of these factors will not have a material adverse effect on our business, results of operations or financial condition. In particular, currency exchange fluctuations in countries where we do business in the local currency could have a material adverse affect on our business, results of operations or financial condition by rendering us less price-competitive than foreign manufacturers. Our sales in Japan are denominated in Yen and, accordingly, are affected by fluctuations in the dollar/Yen currency exchange rates. We generally reduce our exposureto such fluctuations of the Yen through forward exchange agreements which target to hedge approximately 75% ofour sales in Japan. We do not engage in the speculative trading of financial derivatives. There can be no assurance, however, that our practices will reduce or eliminate the risk of fluctuation of the U.S. dollar/Japanese Yen exchange rate.
A Significant Portion of Our Business is Dependent on Other Cyclical Industries
Our business is significantly dependent on the demand for products produced by end-users of industrial lasers and telecommunication products. Many of these end-users are in industries that have historically experienced a highly cyclical demand for their products. As a result, demand for our products is subject to cyclical fluctuations. This cyclical demand could have a material adverse effect on our business, results of operations or financial condition.
There Are Limitations on the Protection of Our Intellectual Property
We rely on a combination of trade secrets, patents, copyright and trademark laws combined with employee noncompetition and nondisclosure agreements to protect our intellectual property rights. There can be no assurance that the steps taken by us will be adequate to prevent misappropriation of our technology or intellectual property.Furthermore, there can be no assurance that third-parties will not assert infringement claims against us in the future.Asserting our intellectual property rights or defending against third-party claims could involve substantial expense, thus materially and adversely affecting our business, results of operations or financial condition. In the event a third-party were successful in a claim that one of our processes infringed its proprietary rights, we could be required to pay substantial damages or royalties, or expend substantial amounts in order to obtain a license or modify processes so that they no longer infringe such proprietary rights, any of which could have a material adverse effect on our business,results of operations or financial condition.
We Depend on Highly Complex Manufacturing Processes Which Require Products from LimitedSources of Supply
We utilize high-quality, optical grade ZnSe in the production of many of our infrared optical products. We are the leading producer of ZnSe for our internal use and for external sale. The production of ZnSe is a complex process requiring a highly controlled environment. A number of factors, including defective or contaminated materials, could adversely affect our ability to achieve acceptable manufacturing yields of high quality ZnSe. ZnSe is available from only one significant outside source whose quantities and quality of ZnSe may be limited. Lack of adequate availability of high quality ZnSe would have a material adverse effect upon us. There can be no assurance that we will not experience manufacturing yield inefficiencies which could have a material adverse effect on our business, results of operations or financial condition.
We produce Hydrogen Selenide gas which is used in our production of ZnSe. There are risks inherent in the production and handling of such material. Our lack of proper handling of Hydrogen Selenide could require us to curtail our production of Hydrogen Selenide. Hydrogen Selenide is available from only one outside source whose quantities and quality may be limited. The cost of purchasing such material is greater than the cost of internal production. As a result, the purchase of a substantial portion of such material from the outside source would increase our ZnSe production costs. Therefore, an inability to internally produce Hydrogen Selenide could have a material adverse effect on our business, results of operations or financial condition.

16
In addition, we produce and utilize other high purity and relatively uncommon materials and compounds to manufacture our products including, but not limited to ZnS, YAG, YLF, CaF2, Ge, Se, Te, Bi2Te3 and SiC. Asignificant failure of our internal production processes or our suppliers to deliver sufficient quantities of these necessary materials on a timely basis could have a material adverse effect on our business, results of operations or financial condition.
Commodity Prices May Adversely Affect Our Results of Operations and Financial Condition
We are exposed to a variety of market risks, including the effects of changes in commodity prices. Our businesses purchase, produce and sell high purity Te, Se and other raw materials based upon quoted market prices from minor metal exchanges. As a result, changes in commodity prices which may not be recovered in our product sales could have a material adverse effect on our business, results of operations or financial condition.
We May Expand Product Lines and Markets by Acquiring Other Businesses
Our business strategy includes expanding our product lines and markets through internal product development and acquisitions. Any acquisition could result in potentially dilutive issuances of equity securities, the incurrence of debt and contingent liabilities and amortization expense related to intangible assets acquired, any of which could have a material adverse effect on our business, results of operations or financial condition. In addition, acquired businesses may be experiencing operating losses. Any acquisition will involve numerous risks, including difficulties in the assimilation of the acquired company's operations and products, uncertainties associated with operating in new markets and working with new customers and the potential loss of the acquired company's key personnel.
The following information relates to significant acquisitions made between July 1, 2004 and June 30, 2011.
Percentage OwnershipAcquired Party Year Acquired Business Segments as of June 30, 2011
Marlow Industries, Inc. Fiscal 2005 Compound Semiconductor Group 100%Pacific Rare Specialty Metals Fiscal 2007 Military & Materials 98%
& Chemicals, Inc. HIGHYAG Lasertechnologie GmbH Fiscal 2008 Infrared Optics 75%Photop Technologies, Inc. Fiscal 2010 Near-Infrared Optics 100%Max Levy Autograph Inc. Fiscal 2011 Military and Materials 100%
Continued U.S. Budget Deficits Could Result in Significant Defense Spending Cuts
With the increase in the military business within our Infrared Optics, Near-Infrared Optics and Military & Materials segments, sales to customers in the defense industry totaled approximately 23% of revenues in the fiscal year ended June 30, 2011. These customers in turn generally contract with a governmental entity, typically a U.S. governmental agency. Continued record U.S. Federal budget deficits could result in significant pressure to reduce the annual defense budget, which could result in delays and/or cancellations of major programs. Most governmental programs are subject to funding approval and can be modified or terminated with no warning upon the determination of a legislative or administrative body. The loss of or failure to obtain certain contracts or the loss of a major government customer could have a material adverse effect on our business, results of operations or financial condition.
Some Systems Are Complex in Design and May Contain Defects that Are Not Detected Until Deployed Which Could Increase Our Costs and Reduce Our Revenues
Some systems that utilize our products are inherently complex in design and require ongoing maintenance. As a result of the technical complexity of our products, changes in our or our suppliers' manufacturing processes or in the use of defective or contaminated materials by us or our suppliers could result in a material adverse effect on our ability to achieve acceptable manufacturing yields and product reliability. To the extent that we do not achieve acceptable yields or product reliability, our business, results of operation, financial condition or customer relationshipscould be materially adversely affected.

17
Our customers may discover defects in our products after the products have been fully deployed and operated under peak stress conditions. In addition, some of our products are combined with products from other vendors, which may contain defects. Should problems occur, it may be difficult to identify the source of the problem. If we are unable to fix defects or other problems, we could experience, among other things: loss of customers; increased costs of product returns and warranty expenses; damage to our brand reputation; failure to attract new customers or achieve market acceptance; diversion of development and engineering resources; or legal action by our customers. The occurrence of any one or more of the foregoing factors could have a material adverse effect on our business, results of operations or financial condition.
We May Encounter Substantial Competition
We may encounter substantial competition from other companies in the same market, including establishedcompanies with significant resources. Some of our competitors may have financial, technical, marketing or other capabilities more extensive than ours and may be able to respond more quickly than we can to new or emerging technologies and other competitive pressures. We may not be able to compete successfully against our present or future competitors, and competition could have a material adverse effect on our business, results of operations or financial condition.
The Market Price of Our Common Stock and the Stock Market in General Can Be Highly Volatile
Factors that could cause fluctuation in our stock price include, among other things, general economic and market conditions; actual or anticipated variations in operating results; changes in financial estimates by securities analysts; our inability to meet or exceed securities analysts’ estimates or expectations; conditions or trends in the industries in which our products are purchased; announcements by us or our competitors of significant acquisitions, strategic partnerships, divestitures, joint ventures or other strategic initiatives; capital commitments; additions or departures of key personnel; and sales of our Common Stock.
Many of these factors are beyond our control. These factors could cause the market price of our Common Stock to decline, regardless of our operating performance.
Our Success Depends on Our Ability to Retain Key Personnel
We are highly dependent upon the experience and continuing services of certain scientists, engineers,production and management personnel. Competition for the services of these personnel is intense, and there can be no assurance that we will be able to retain or attract the personnel necessary for our success. The loss of the services of our key personnel could have a material adverse effect on our business, results of operations or financial condition.
Our Success Depends on New Products and Processes
In order to meet our strategic objectives, we must continue to develop, manufacture and market new products, develop new processes and improve existing processes. As a result, we expect to continue to make significant investments in research and development and to continue to consider from time to time the strategic acquisition of businesses, products or technologies complementary to our business. Our success in developing, introducing and selling new and enhanced products depends upon a variety of factors including product selection, timely and efficient completion of product design and development, timely and efficient implementation of manufacturing and assembly processes, effective sales and marketing and product performance in the field. There can be no assurance that we will be able to develop and introduce new products or enhancements to our existing products and processes in a manner which satisfies customer needs or achieves market acceptance. The failure to do so could have a material adverse effect on our ability to grow our business.
Keeping Pace with Key Industry Developments is Essential
We are engaged in industries which will be affected by future developments. The introduction of products or processes utilizing new developments could render existing products or processes obsolete or unmarketable. Our continued success will depend upon our ability to develop and introduce on a timely and cost-effective basis new products, processes and applications that keep pace with developments and address increasingly sophisticated customer requirements. There can be no assurance that we will be successful in identifying, developing and marketing new products, applications and processes and that we will not experience difficulties that could delay or prevent the successful development, introduction and marketing of product or process enhancements or new products, applications or processes, or that our products, applications or processes will adequately meet the requirements of the

18
marketplace and achieve market acceptance. Our business, results of operations and financial condition could be materially and adversely affected if we were to incur delays in developing new products, applications or processes or ifwe do not gain market acceptance for the same.
Changes in Tax Rates, Tax Liabilities or Tax Accounting Rules Could Affect Future Results
As a global company, we are subject to taxation in the United States and various other countries and jurisdictions. As such, judgment is required to determine worldwide tax liabilities. Our future tax rates could be affected by changes in the composition of earnings in countries with differing tax rates or changes in tax laws. Changes in tax laws or tax rulings may have a significantly adverse impact on our effective tax rate. For example, proposals for fundamental U.S. international tax reform, if enacted, could have a significant adverse impact on our effective tax rate. In addition, we are subject to regular examination of our income tax returns by the Internal Revenue Service and other tax authorities. We regularly assess the likelihood of favorable or unfavorable outcomes resulting from these examinations to determine the adequacy of our provision for income taxes. Although we believe our tax estimates are reasonable, there can be no assurance that any final determination will not be materially different than the treatment reflected in our historical income tax provision and accruals, which could materially and adversely affect our business, results of operation or financial condition.
Declines in the Operating Performance of One of Our Business Segments Could Result in an Impairment of the Segment’s Goodwill and Indefinite-Lived Intangible Assets
As of June 30, 2011, we had goodwill and indefinite-lived intangible assets of approximately $64.3 millionand $9.6 million, respectively, on our Consolidated Balance Sheet. We test our goodwill and indefinite-lived intangible assets on an annual basis or when an indication of possible impairment exists in order to determine whether the carrying value of our assets is still supported by the fair value of the underlying business. To the extent that it is not, we are required to record an impairment charge to reduce the asset to fair value. A decline in the operating performance of any of our business segments could result in an impairment charge which could have a material adverse effect on our results of operations or financial condition.
Provisions in Our Articles of Incorporation and By-Laws May Limit the Price that Investors May be Willing to Pay in the Future for Shares of Our Common Stock
Our articles of incorporation and by-laws contain provisions which could make us a less attractive target for a hostile takeover or make more difficult or discourage a merger proposal, a tender offer or a proxy contest. Suchprovisions include: classification of the board of directors into three classes; a procedure which requires shareholders or the board of directors to nominate directors in advance of a meeting to elect such directors; the ability of the board of directors to issue additional shares of Common Stock or preferred stock without shareholder approval; and certain provisions requiring supermajority approval (at least two-thirds of the votes cast by all shareholders entitled to vote thereon, voting together as a single class). In addition, the Pennsylvania Business Corporation Law contains provisions which may have the effect of delaying or preventing a change in our control. All of these provisions may limit the price that investors may be willing to pay for shares of our Common Stock.
We Are Subject to Stringent Environmental Regulation
We use or generate certain hazardous substances in our research and manufacturing facilities. We believe that our handling of such substances is in material compliance with applicable local, state and federal environmental, safety and health regulations at each operating location. We invest substantially in proper protective equipment, process controls and specialized training to minimize risks to employees, surrounding communities and the environment resulting from the presence and handling of such hazardous substances. We regularly conduct employee physical examinations and workplace monitoring regarding such substances. When exposure problems or potential exposure problems have been uncovered, corrective actions have been implemented and re-occurrence has been minimal or non-existent. We do not carry environmental impairment insurance.
Relative to the generation and use of the hazardous substance Hydrogen Selenide, we have in place an emergency response plan. Special attention has been given to all procedures pertaining to this gaseous material to minimize the chances of its accidental release into the atmosphere.
With respect to the manufacturing, use, storage and disposal of the low-level radioactive material Thorium Fluoride, our facilities and procedures have been inspected and licensed by the Nuclear Regulatory Commission. Thorium-bearing by-products are collected and shipped as solid waste to a government-approved low-level radioactive waste disposal site in Clive, Utah.

19
The generation, use, collection, storage and disposal of all other hazardous by-products, such as suspended solids containing heavy metals or airborne particulates, are believed by us to be in material compliance with regulations. We believe that we have obtained all of the permits and licenses required for operation of our business.
Although we do not know of any material environmental, safety or health problems in our properties or processes, there can be no assurance that problems will not develop in the future which could have a material adverse effect on our business, results of operations or financial condition.
We Are Subject to Governmental Regulation
We are subject to extensive regulation by U.S. and non-U.S. governmental entities and other entities at the federal, state and local levels, including, but not limited to, the following:
We are required to comply with various import laws and export control and economic sanctions laws, which may affect our transactions with certain customers, business partners and other persons, including in certain cases dealings with or between our employees and subsidiaries. In certain circumstances, export control and economic sanctions regulations may prohibit the export of certain products, services and technologies, and in other circumstances we may be required to obtain an export license before exporting the controlled item. Compliance with the various import laws that apply to our businesses can restrict our access to, and increase the cost of obtaining, certain products and at times can interrupt our supply of imported inventory.
Exported technology necessary to develop and manufacture certain of the Company’s products are subject to U.S. export control laws and similar laws of other jurisdictions, and the Company may be subject to adverse regulatory consequences, including government oversight of facilities and export transactions, monetary penalties and other sanctions for violations of these laws. In many cases, exports of technology necessary to develop and manufacture the Company’s products are subject to U.S. export control laws. In certain instances, these regulations may prohibit the Company from developing or manufacturing certain of its products for specific end applications outside the United States.
Our agreements relating to the sale of products to government entities may be subject to termination, reduction or modification in the event of changes in government requirements, reductions in federal spending and other factors. We are also subject to investigation and audit for compliance with the requirements of government contracts, including requirements related to procurement integrity, export control, employment practices, the accuracy of records and the recording of costs. A failure to comply with these requirements might result in suspension of these contracts and suspension or debarment from government contracting or subcontracting.
In addition, failure to comply with any of these laws and regulations could result in civil and criminal, monetary and non-monetary penalties, disruptions to our business, limitations on our ability to import and export products and services, and damage to our reputation.
Natural Disasters or Other Global or Regional Catastrophic Events Could Disrupt Our Operations and Adversely Affect Results
Despite our concerted effort to minimize risk to our production capabilities and corporate information systems and to reduce the effect of unforeseen interruptions to us through business continuity planning, we still may be exposed to interruptions due to catastrophe, natural disaster, pandemic, terrorism or acts of war, which are beyond our control, such as the March 2011 earthquake in Japan. Disruptions to our facilities or systems, or to those of our key suppliers, could also interrupt operational processes and adversely impact our ability to manufacture our products and provide services and support to our customers. As a result, our business, results of operations or financial condition could be materially adversely affected.
Recently Issued Financial Accounting Standards
In June 2011, the Financial Accounting Standards Board (“FASB”) issued changes to the presentation of comprehensive income which requires entities to present the total of comprehensive income, the components of net income, and the components of other comprehensive income either in a single continuous statement of comprehensive income or in two separate but consecutive statements. Additionally, these changes require an entity to present on the face of the financial statements reclassification adjustments for items that are reclassified from other comprehensive

20
income to net income in the statements where the components of net income and the components of other comprehensive income are presented. The option to present components of other comprehensive income as part of the statement of changes in stockholders’ equity, which is the method of presentation used by the Company, will no longer be permitted. In addition, these changes will have no impact on the calculation and presentation of earnings per share. These changes, with retrospective application, become effective for the Company for interim and annual periods beginning in fiscal year 2013, with early adoption allowed. Other than the change in presentation, these changes will not have an impact on the Consolidated Financial Statements.
In April 2010, the FASB issued an accounting standard update related to revenue recognition under the milestone method. The objective of the accounting standard update is to provide guidance on defining a milestone and determining when it may be appropriate to apply the milestone method of revenue recognition for research or development transactions. This update became effective on a prospective basis for milestones achieved in fiscal years, and interim periods within those fiscal years, beginning on or after June 15, 2010. The adoption of this standard did not have a significant impact on the Company’s financial position, results of operations or cash flows.
In January 2010, the FASB issued amended standards requiring additional fair value disclosures. The amended standards require disclosures of transfers in and out of Levels 1 and 2 of the fair value hierarchy, as well as requiring gross basis disclosures for purchases, sales, issuances and settlements within the Level 3 reconciliation. Additionally, the update clarifies the requirement to determine the level of disaggregation for fair value measurement disclosures and to disclose valuation techniques and inputs used for both recurring and nonrecurring fair value measurements in either Level 2 or Level 3. The Company adopted the new guidance in the third quarter of fiscal 2010, except for the disclosures related to purchases, sales, issuance and settlements, which will be effective for the Company beginning in the first quarter of fiscal 2012. Because these new standards are related primarily to disclosures, their adoption has not had and is not expected to have a significant impact on the Company’s consolidated financial statements.
In October 2009, the FASB issued Accounting Standards Update 2009-13, “Multiple-Deliverable Revenue Arrangements,” codified in Accounting Standards Codification (“ASC”) Topic 605. This update provides applicationguidance on whether multiple deliverables exist, how the deliverables should be separated and how the consideration should be allocated to one or more units of accounting. This guidance establishes a selling price hierarchy fordetermining the selling price of a deliverable. The selling price used for each deliverable will be based on vendor-specific objective evidence, if available, third-party evidence if vendor-specific objective evidence is not available, or estimated selling price if neither vendor-specific or third-party evidence is available. This update became effective on a prospective basis for revenue arrangements entered into or materially modified in the fiscal year beginning on or after June 15, 2010. The adoption of this standard did not have a significant impact on the Company’s financial position, results of operations, or cash flows.
In June 2009, the FASB issued new guidance concerning the determination of the primary beneficiary of a variable interest entity (“VIE”). This new guidance amends current U.S. GAAP by: requiring ongoing reassessments of whether an enterprise is the primary beneficiary of a VIE; amending the quantitative approach previously required for determining the primary beneficiary of the VIE; modifying the guidance used to determine whether an entity is a VIE; adding an additional reconsideration event (e.g. troubled debt restructurings) for determining whether an entity is a VIE; and requiring enhanced disclosures regarding an entity’s involvement with a VIE. This new guidance became effective for the Company beginning in the first quarter of fiscal year 2011, with earlier adoption prohibited. The adoption of this standard did not have a significant impact on the Company’s financial position, results of operations, or cash flows.

21
ITEM 1B. UNRESOLVED STAFF COMMENTS
None.
ITEM 2. PROPERTIES
Information regarding our principal United States properties at June 30, 2011 is set forth below:
Location Primary Use(s) Primary Business Segment(s)Square Footage Ownership
Saxonburg, PA Manufacturing, Corporate Headquarters and Research and Development
Infrared Optics and Compound Semiconductor Group
252,000 Owned
Temecula, CA Manufacturing andResearch and Development
Military & Materials 83,000 Leased
Dallas, TX Manufacturing andResearch and Development
Compound Semiconductor Group 68,000 Owned and Leased
New Port Richey and Port Richey, FL
Manufacturing andResearch and Development
Near-Infrared Optics 67,000 Owned
Philadelphia, PA Manufacturing and Research and Development
Military & Materials 30,000 Leased
Pine Brook, NJ Manufacturing and Research and Development
Compound Semiconductor Group 26,000 Leased
Starkville, MS Manufacturing Compound Semiconductor Group 2,800 LeasedSunnyvale, CA Distribution Near-Infrared Optics 2,300 LeasedChatsworth, CA Distribution Near-Infrared Optics 1,200 LeasedWeatogue, CT Distribution Infrared Optics 700 Leased
Information regarding our principal foreign properties at June 30, 2011 is set forth below:
Location Primary Use(s) Primary Business Segment(s)Square Footage Ownership
China Manufacturing Infrared Optics, Near-Infrared Opticsand Compound Semiconductor Group
1,000,000 Leased
Philippines Manufacturing Military & Materials 226,000 LeasedVietnam Manufacturing Near-Infrared Optics and Compound
Semiconductor Group78,000 Leased
Singapore Manufacturing Infrared Optics 33,000 LeasedGermany Manufacturing and
DistributionInfrared Optics, Near-Infrared Opticsand Compound Semiconductor Group
22,000 Leased
Japan Distribution Infrared Optics, Near-Infrared Optics and Compound Semiconductor Group
3,000 Leased
Switzerland Distribution Infrared Optics 3,000 LeasedBelgium Distribution Infrared Optics 2,700 LeasedUnited Kingdom Distribution Infrared Optics and Near-Infrared
Optics 1,500 Leased
Italy Distribution Infrared Optics and Near-Infrared Optics
1,500 Leased
The square footage listed for each of the above properties represents facility square footage except in the case of the Philippines location which is land.

22
ITEM 3. LEGAL PROCEEDINGS
The Company and its subsidiaries are involved in various claims and lawsuits incidental to the business. Each of these matters is subject to various uncertainties, and it is possible that these matters may be resolvedunfavorably to the Company. Management believes, after consulting with legal counsel, that the ultimate liabilities, if any, resulting from such legal proceedings will not materially affect the Company’s financial position, liquidity or results of operation.
ITEM 4. REMOVED AND RESERVED
EXECUTIVE OFFICERS OF THE REGISTRANT
The executive officers of the Company and their respective ages and positions are as follows. Each executive officer listed has been appointed by the Board of Directors to serve until removed or until a successor is appointed and qualified. On December 31, 2010, Herman E. Reedy retired as Executive Vice President – Infrared Optics.
Name Age Position
Francis J. Kramer 62 President, Chief Executive Officer and DirectorCraig A. Creaturo 41 Chief Financial Officer and TreasurerVincent D. Mattera, Jr. 55 Executive Vice President James Martinelli 53 Vice President – Military & Materials Businesses
Francis J. Kramer has been employed by the Company since 1983, has been its President since 1985, andhas been its Chief Executive Officer since July 2007. Mr. Kramer has served as a Director of the Company since 1989. Previously, Mr. Kramer served as Chief Operating Officer from 1985 to June 2007. Mr. Kramer joined the Company as Vice President and General Manager of Manufacturing and was named Executive Vice President and General Manager of Manufacturing in 1984. Prior to his employment by the Company, Mr. Kramer was the Director of Operations for the Utility Communications Systems Group of Rockwell International Corp. Mr. Kramer graduated from the University of Pittsburgh with a B.S. degree in Industrial Engineering and from Purdue University with an M.S. degree in Industrial Administration.
Craig A. Creaturo has been employed by the Company since 1998 and has been its Chief Financial Officer since November 2004 and Treasurer since 2000. Previously, Mr. Creaturo served as Chief Accounting Officer, Director of Finance, Accounting and Information Systems and Corporate Controller. Prior to his employment by the Company, Mr. Creaturo was employed by the Pittsburgh, Pennsylvania office of Arthur Andersen LLP from 1992 to 1998 and served in the audit and attestation division with a final position as Audit Manager. Mr. Creaturo graduated from Grove City College with a B.S. degree in Accounting. Mr. Creaturo is a Certified Public Accountant in the Commonwealth of Pennsylvania and is a member of the American Institute of Certified Public Accountants and the Pennsylvania Institute of Certified Public Accountants.
Vincent D. Mattera, Jr., has been employed by the Company since 2004 and has been Executive Vice President since January 2010. Previously, Dr. Mattera was Vice President of the Compound Semiconductor Group from 2004 to 2010. Dr. Mattera served as a Director of the Company from 2000 to 2002. Dr. Mattera served as Vice President, Undersea Optical Transport, Agere Systems (formerly Lucent Technologies, Microelectronics and Communications Technologies Group) from 2001 to 2004. Previously, Dr. Mattera served as Optoelectronic Device Manufacturing and Process Development Vice President with Lucent Technologies, Microelectronics and Communications Technologies Group from 2000 until 2001. He was Director of Optoelectronic Device Manufacturing and Development at Lucent Technologies, Microelectronics Group from 1997 to 2000. From 1995 to 1997 he served as Director, Indium Phosphide Semiconductor Laser Chip Design and Process Development with Lucent Technologies, Microelectronics Group. From 1984 to 1995 he held management positions with AT&T Bell Laboratories. Dr. Mattera holds B.S. and Ph.D. degrees in Chemistry from the University of Rhode Island and Brown University, respectively.
James Martinelli has been employed by the Company since 1986 and has been Vice President – Military &Materials Businesses since February 2003. Previously, Mr. Martinelli served as General Manager of Laser Power Corporation from 2000 to 2003. Mr. Martinelli joined the Company as Accounting Manager in 1986, was named Corporate Controller in 1990 and named Chief Financial Officer and Treasurer in 1994. Prior to his employment with the Company, Mr. Martinelli served as Accounting Manager at Tippins Incorporated and Pennsylvania Engineering Corporation from 1980 to 1985. Mr. Martinelli graduated from Indiana University of Pennsylvania with a B.S. degree in Accounting.

23
PART II
ITEM 5. MARKET FOR REGISTRANT'S COMMON EQUITY, RELATED STOCKHOLDER MATTERS AND ISSUER PURCHASES OF EQUITY SECURITIES
The Company's Common Stock is traded on the NASDAQ Global Select Market under the symbol “IIVI.”The following table sets forth the range of high and low closing sale prices per share of the Company's Common Stock for the fiscal periods indicated, as reported by NASDAQ. The Company’s stock price per-share in the below table was adjusted to reflect the two-for-one stock split in fiscal 2011.
High LowFiscal 2011
First Quarter $18.80 $14.57Second Quarter $23.97 $17.90Third Quarter $26.02 $21.53Fourth Quarter $29.58 $22.20
High LowFiscal 2010
First Quarter $13.88 $9.71Second Quarter $16.43 $12.55Third Quarter $16.92 $12.79Fourth Quarter $18.95 $14.82
On August 19, 2011, the last reported sale price for the Company’s Common Stock was $17.53 per share. As of such date, there were approximately 816 holders of record of our Common Stock. The Company historically has not paid cash dividends and does not anticipate paying cash dividends in the foreseeable future.
During the fiscal year ended June 30, 2009, the Company completed a share repurchase program which was authorized by the Company’s Board of Directors. During fiscal year 2009, the Company purchased 1,000,000 shares of its Common Stock for $12.9 million pursuant to this repurchase program, which was completed in December 2008.As of June 30, 2010 and June 30, 2011, the Company did not have an open stock repurchase program.
The information incorporated by reference in Item 12 of this Form 10-K from our 2011 Proxy Statement under the heading “Equity Compensation Plan Information” is hereby incorporated by reference into this Item 5.

24
PERFORMANCE GRAPH
The following graph compares cumulative total stockholder return on the Company’s Common Stock with the cumulative total shareholder return of the companies listed in the Nasdaq Market Index and with a peer group of companies constructed by the Company for the period from June 30, 2006, through June 30, 2011. The Company changed its peer group in fiscal 2011 in order to better reflect comparability in terms of revenue, return on sales and market capitalization. The prior fiscal year’s peer group coinsisted of Ceradyne, Inc., Cree, Inc., Cymer, Inc., Park Electrochemical Corp., Rofin-Sinar Technologies, Inc. and Rogers Corp. The Company’s current fiscal year peer group includes Ceradyne, Inc., Cree, Inc., Cymer, Inc., Rofin-Sinar Technologies, Inc. and Rogers Corp.
COMPARISON OF FIVE YEAR CUMULATIVE TOTAL RETURNAMONG THE COMPANY, THE NASDAQ MARKET INDEX, THE PEER GROUP AND THE PRIOR
PEER GROUP
BaseYear2006 2007 2008 2009 2010 2011
The Company 100.00 148.47 190.82 121.48 161.91 279.78Peer Group Index 100.00 106.10 78.99 65.79 96.44 105.51Prior Peer Group 100.00 106.65 81.56 68.76 96.17 106.02NASDAQ Index 100.00 119.19 104.26 85.34 99.27 132.35
The above performance graph represents and compares the value, through June 30, 2011, of a hypothetical investment of $100 made at the closing price on June 30, 2006, in each of (i) the Company’s Common Stock, (ii) the companies comprising the Peer Group, and (iii) the Nasdaq Market Index and assuming, in each case, the reinvestment of dividends.

25
ITEM 6. SELECTED FINANCIAL DATA
FIVE-YEAR FINANCIAL SUMMARY
The following selected financial data for the five fiscal years presented are derived from II-VI’s audited consolidated financial statements as adjusted to reflect the Company’s eV PRODUCTS business as a discontinued operation for fiscal years 2009 and earlier. The data should be read in conjunction with the consolidated financial statements and the related notes thereto included elsewhere in this Annual Report Form 10-K.
Year Ended June 30, 2011 2010 2009 2008 2007(000 except per share data)
Statement of EarningsNet revenues from continuing operations $ 502,801 $ 345,091 $ 292,222 $ 316,191 $ 254,684Earnings from continuing operations $ 83,018 $ 38,735 $ 38,911 $ 65,698 $ 38,442Loss from discontinued operation $ — $ — $ (2,077) $ (1,425) $ (476)Net earnings attributable to noncontrolling interests $ 336 $ 158 $ 53 $ 5 $ —Net earnings attributable to II-VI Incorporated $ 82,682 $ 38,577 $ 36,781 $ 64,268 $ 37,966Basic earnings (loss) per share:
Continuing operations $ 1.33 $ 0.64 $ 0.66 $ 1.11 $ 0.66Discontinued operation $ — $ — $ (0.04) $ (0.03) $ (0.01)Consolidated $ 1.33 $ 0.64 $ 0.62 $ 1.08 $ 0.65
Diluted earnings (loss) per share:Continuing operations $ 1.30 $ 0.63 $ 0.65 $ 1.08 $ 0.64Discontinued operation $ — $ — $ (0.04) $ (0.03) $ (0.01)Consolidated $ 1.30 $ 0.63 $ 0.61 $ 1.06 $ 0.63
Diluted weighted average shares outstanding 63,612 61,504 60,164 60,978 60,456
Share and per share data for all periods presented were adjusted to reflect the two-for-one stock split in fiscal 2011.
Year Ended June 30, 2011 2010 2009 2008 2007($000)
Balance SheetWorking capital $ 304,573 $ 215,085 $ 198,244 $ 179,744 $ 110,635Total assets, including assets held for sale 647,202 508,981 368,416 360,926 287,924Long-term debt 15,000 3,384 3,665 3,791 14,940Total debt 18,729 3,384 3,665 3,791 14,995Retained earnings 378,365 295,683 257,106 220,325 158,287Shareholders’ equity 523,101 410,860 322,871 290,631 219,440

26
ITEM 7. MANAGEMENT'S DISCUSSION AND ANALYSIS OF FINANCIAL CONDITION AND RESULTSOF OPERATIONS
FORWARD-LOOKING STATEMENTS
Certain statements contained in this Management's Discussion and Analysis of Financial Condition and Results of Operations are forward-looking statements. Forward-looking statements are also identified by words such as “expects,” “anticipates,” “believes,” “intends,” “plans,” “projects,” or similar expressions. Actual results coulddiffer materially from those anticipated in these forward-looking statements for many reasons, including risk factors described in the Risk Factors set forth in Item 1A of this Annual Report on Form 10-K, which are incorporated herein by reference.
OVERVIEW
The Company generates revenues, earnings and cash flows from developing, manufacturing and marketing high-technology materials and derivative products for precision use in industrial, military, telecommunications,photovoltaic, medical and aerospace applications. We also generate revenue, earnings and cash flows from government funded research and development contracts relating to the development and manufacture of new technologies, materials and products.
Our customer base includes OEMs, laser end users, system integrators of high-power lasers, manufacturers of equipment and devices for the industrial, military, telecommunications, photovoltaic and medical markets, andU.S. Government prime contractors, various U.S. Government agencies and thermoelectric integrators.
CRITICAL ACCOUNTING ESTIMATES
The preparation of financial statements and related disclosures in conformity with accounting principles generally accepted in the United States of America and the Company’s discussion and analysis of its financial condition and results of operations requires the Company’s management to make judgments, assumptions and estimates that affect the amounts reported in its consolidated financial statements and accompanying notes. Note 1 ofthe Notes to our Consolidated Financial Statements contained in Item 8 of this Annual Report on Form 10-Kdescribes the significant accounting policies and accounting methods used in the preparation of the Company’s consolidated financial statements. Management bases its estimates on historical experience and on various other assumptions that it believes to be reasonable under the circumstances, the results of which form the basis for making judgments about the carrying values of assets and liabilities. Actual results may differ from these estimates.
Management believes the Company’s critical accounting estimates are those related to revenue recognition, allowance for doubtful accounts, warranty reserves, inventory valuation, valuation of long-lived assets including acquired intangibles and goodwill, accrual of bonus and profit sharing estimates, accrual of income tax liability estimates, accounting for share-based compensation and self-insurance for workers’ compensation. Management believes these estimates to be critical because they are both important to the portrayal of the Company’s financial condition and results of operations, and they require management to make judgments and estimates about matters that are inherently uncertain.
Management has discussed the development and selection of these critical accounting estimates with the Audit Committee of the Board of Directors and the Audit Committee has reviewed the foregoing disclosure. In addition, there are other items within our financial statements that require estimation, but are not deemed critical as defined above. Changes in estimates used in these and other items could have a material impact on the financial statements.
The Company recognizes revenues when the criteria of SEC Staff Accounting Bulletin (“SAB 104”) (as defined below) are met. Revenues for product shipments are realizable when we have persuasive evidence of a sales arrangement, the product has been shipped or delivered, the sale price is fixed or determinable and collectability is reasonably assured. Title and risk of loss passes from the Company to its customer at the time of shipment in most cases with the exception of certain customers. For these customers title does not pass and revenue is not recognized until the customer has received the product at its physical location.
We establish an allowance for doubtful accounts and warranty reserves based on historical experience and believe the collection of revenues, net of these reserves, is reasonably assured. Our allowance for doubtful accounts and warranty reserve balances at June 30, 2011 was approximately $0.8 million and $1.2 million, respectively. Our reserve estimates have historically been proven to be materially correct based upon actual charges incurred.

27
The Company’s revenue recognition policy is consistently applied across the Company’s segments, product lines and geographical locations. Further, we do not have post shipment obligations such as training or installation, customer acceptance provisions, credits and discounts, rebates and price protection or other similar privileges. Our distributors and agents who comprise less than 10% of consolidated revenue and have no additional product return rights beyond the right to return defective products that are covered by our warranty policy, are not granted price protection. We believe our revenue recognition practices are consistent with SAB 104 and that we have adequately considered the requirements of ASC 605 Revenue Recognition.Revenues generated from transactions other than product shipments are contract-related and have historically accounted for less than 5% of the Company’s consolidated revenues.
The Company establishes an allowance for doubtful accounts based on historical experience and believes the collection of revenues, net of these reserves, is reasonably assured. The allowance for doubtful accounts is an estimate for potential non-collection of accounts receivable based on historical experience. The Company has not experienceda non-collection of accounts receivable materially affecting its financial position or results of operations as of and for the fiscal years ended June 30, 2011, 2010 and 2009. If the financial condition of the Company’s customers were to deteriorate causing an impairment of their ability to make payments, additional provisions for bad debts could be required in future periods.
The Company records a warranty reserve as a charge against earnings based on a historical percentage of revenues utilizing actual returns over a period that approximates historical warranty experience. If actual returns in the future are not consistent with the historical data used to calculate these estimates, additional warranty reserves could be required.
The Company records a slow moving inventory reserve as a charge against earnings for all products on hand for more than twelve months to eighteen months depending on the products that have not been sold to customers or cannot be further manufactured for sale to alternative customers. An additional reserve is recorded for product on hand that is in excess of product sold to customers over the same periods noted above. If actual market conditions are less favorable than projected, additional inventory reserves may be required.
The Company tests goodwill and indefinite-lived intangible assets on an annual basis for impairment or when events or changes in circumstances indicate that goodwill or indefinite-lived intangible assets might be impaired. Other intangible assets are amortized over their estimated useful lives. The determination of the estimated useful lives of other intangible assets and whether goodwill or indefinite-lived intangibles are impaired involves judgments based upon long-term projections of future performance. Estimates of fair value are based on our projection of revenues, operating costs and cash flows of each reporting unit considering historical and anticipated results, general economic and market conditions. The fair values of the reporting units are determined using a discounted cash flow analysis based on historical and projected financial information as well as market analysis. The carrying value of goodwill at June 30, 2011, 2010 and 2009 was $64.3 million, $56.1 million and $26.1 million, respectively. The annual goodwill impairment analysis considers the financial projections of the reporting unit based on the most recently completed budgeting and long-term strategic planning processes and also considers the current financial performance compared to the prior projections of the reporting unit. Changes in our financial performance, judgments and projections could result in an impairment of goodwill or indefinite-lived intangible assets.
As a result of the purchase price allocations from our prior acquisitions and due to our decentralized structure, our goodwill is included in multiple reporting units. Due to the cyclical nature of our business, and the other factors described in the section on Risk Factors set forth in Item 1A of this Annual Report on Form 10-K, the profitability of our individual reporting units may periodically suffer from downturns in customer demand, operational challenges and other factors. These factors may have a relatively more pronounced impact on the individual reporting units as compared to the Company as a whole, and might adversely affect the fair value of the reporting units. If material adverse conditions occur that impact one or more of our reporting units, our determination of future fair value may not support the carrying amount of one or more of our reporting units, and the related goodwill would need to be written down.
The Company records certain bonus and profit sharing estimates as a charge against earnings. These estimates are adjusted to actual based on final results of operations achieved during the fiscal year. Certain partial bonus amounts are paid quarterly based on interim Company performance, and the remainder is paid after fiscal year end. Other bonuses are paid annually.
The Company prepares and files tax returns based on its interpretation of tax laws and regulations and records estimates based on these judgments and interpretations. In the normal course of business, the Company’s tax

28
returns are subject to examination by various taxing authorities, which may result in future tax, interest, and penalty assessments by these authorities. Inherent uncertainties exist in estimates of many tax positions due to changes in tax law resulting from legislation, regulation and/or as concluded through the various jurisdictions’ tax court systems. The Company recognizes the tax benefit from an uncertain tax position only if it is more likely than not that the tax position will be sustained on examination by the taxing authorities, based on the technical merits of the position. The tax benefits recognized in the financial statements from such a position are measured based on the largest benefit that has a greater than 50 percent likelihood of being realized upon ultimate resolution. The amount of unrecognized tax benefits is adjusted for changes in facts and circumstances. For example, adjustments could result from significant amendments to existing tax law and the issuance of regulations or interpretations by the taxing authorities, new information obtained during a tax examination, or resolution of an examination. The Company believes that itsestimates for uncertain tax positions are appropriate and sufficient to pay assessments that may result from examinations of its tax returns. The Company recognizes both accrued interest and penalties related to unrecognized tax benefits in income tax expense.
The Company has recorded valuation allowances against certain of its deferred tax assets, primarily those that have been generated from net operating losses in certain foreign taxing jurisdictions. In evaluating whether the Company would more likely than not recover these deferred tax assets, it has not assumed any future taxable income or tax planning strategies in the jurisdictions associated with these carry-forwards where history does not support such an assumption. Implementation of tax planning strategies to recover these deferred tax assets or future income generation in these jurisdictions could lead to the reversal of these valuation allowances and a reduction of income tax expense.
In accordance with ASC 718 “Compensation-Stock Compensation” (formerly SFAS No. 123 (revised 2004), (“SFAS 123(R)”) “Share-Based Payment”), the Company recognizes share-based compensation expense over the requisite service period of the individual grantees, which generally equals the vesting period.
The Company is self-insured for certain losses related to workers’ compensation for its U.S. employees.Additionally, third-party insurance is obtained to limit our exposure to these claims in excess of $0.3 million per occurrence and $0.9 million in the aggregate per policy year. When estimating its self-insurance liability, the Company considers a number of factors, including historical claims experience, demographic and severity factors and valuations provided by independent third party consultants. Periodically, management reviews its assumptions and the valuations to determine the adequacy of its self-insurance liability.
EXECUTIVE SUMMARY
The Company continued to see improvement in its worldwide markets in fiscal year 2011 resulting in increased customer demand. The acquisition of Photop made positive contributions to both the Company’s revenue and earnings growth and the Company continues to integrate Photop’s operations. In addition, the Company’s recentacquisition of Aegis should provide momentum going into fiscal year 2012 by capitalizing on opportunities within the telecommunication markets. The Company’s core industrial based segment, Infrared Optics has seen strengthening demand from its industrial based customers as laser machine utilization rates began to increase during fiscal 2011.The Company is anticipating building on this momentum into fiscal year 2012 by expanding its manufacturing capacity including capital expenditures at the majority of its business units to capitalize on the further strengthening of the worldwide economies.
On May 17, 2011, the Company’s Board of Directors declared a two-for-one stock split, in the form of a stock dividend, of the Company’s common stock for shareholders of record on June 3, 2011. The stock split was distributed on June 24, 2011 issuing one additional share of common stock for every share of common stock held. The applicable share and per share data for all periods included herein have been restated to give effect to this stock split.

29
Fiscal 2011 Compared to Fiscal 2010
RESULTS OF OPERATIONS
Overview (millions except per share data)
%2011 2010 Increase
Bookings 520.2$ 387.6$ 34%Revenues 502.8 345.1 46%Net Earnings attributable to II-VI Incorporated 82.7 38.6 114%Diluted earnings per share 1.30 0.63 106%
Year EndedJune 30,
The above results include MLA since the date of acquisition for the year ended June 30, 2011 only, as this acquisition was completed on December 6, 2010. The above results for the year ending June 30, 2010 include only six months of activity for Photop, as this acquisition was completed on January 4, 2010.
BOOKINGS Bookings increased 34% to $520.2 million in fiscal year 2011 compared to $387.6 million in fiscal year 2010. Included in bookings for the year ended June 30, 2011 and 2010 were approximately $118.4 million and $59.4 million, respectively, of bookings from Photop. Excluding Photop, the majority of the Company’s business units also realized higher levels of bookings in fiscal year 2011 compared to fiscal year 2010. The Company began seeing improved customer demand during the second half of fiscal year 2010 as worldwide economies began to rebound from their lower levels in the later part of fiscal year 2008. This trend continued for the full year of fiscal 2011. In addition to the bookings recorded by Photop, the general increase in bookings was due to strong product demand from the Company’s Infrared Optics, Military & Materials, and Compound Semiconductor Group segments. The Infrared Optics segment has benefited from growing levels of high-power laser systems being introduced into the global markets. As a result, bookings for Infrared Optics increased 39% during the current fiscal year when compared to the prior fiscal year. PRM recorded stronger bookings during the current fiscal year due to demand for its selenium and tellurium raw materials as well as favorable market pricing of these materials. The Compound Semiconductor Group segment grew bookings as a result of both the receipt of a government contract for silicon carbide growth and continued commercial acceptance of its silicon carbide products. In addition, the launch of Marlow’s gesture recognition product in fiscal year 2011 contributed to the segment’s bookings growth. WBG bookings for silicon carbide related products increased $15.0 million during the current fiscal year compared to the prior fiscal year while Marlow bookings increased $6.2 million during the current fiscal year compared to the prior fiscal year. These increases in bookings were somewhat offset by decreased bookings at the VLOC business unit due to delays in certain military related programs.
REVENUES Revenues increased 46% to $502.8 million in fiscal year 2011 compared to $345.1 million in fiscal year 2010. Included in revenues for the year ended June 30, 2011 and 2010 was approximately $118.6 million and $46.9 million, respectively, of revenues from Photop. Excluding Photop, the majority of the Company’s business units realized higher levels of revenues in fiscal year 2011 compared to fiscal year 2010. Specifically, revenue increased at the Company’s Marlow, PRM, and Infrared Optics businesses by 46%, 40%, and 34%, respectively. This growth in revenue reflects strong customer demand and higher order volume for the products of these business units as the global economy showed signs of recovery during fiscal year 2011.
NET EARNINGS Net earnings attributable to II-VI Incorporated increased 114% in fiscal year 2011 to $82.7 million ($1.30 per share-diluted) from $38.6 million ($0.63 per share-diluted) in fiscal year 2010. The increase in net earnings attributable to II-VI Incorporated during the current year compared to the prior fiscal year was primarily the result of the positive contribution of Photop to the Company’s operating results. In addition, the increase in net earnings is the result of the incremental margin realized on higher revenue levels as well as favorable margins, yield improvements and operating efficiencies throughout the Company’s business units. The Company also recognized a favorable impact on earnings as a result of certain of the Company’s foreign currencies strengthening against the U.S. dollar during the current fiscal year. Furthermore, the Company benefited from certain foreign tax incentives and a higher mix of foreign sourced income which is taxed at lower rates than income generated in the U.S. As a result, the Company’s effective tax rate was 18.4% for fiscal year 2011 compared to 24.5% for fiscal year 2010.

30
SEGMENTS Bookings, revenues and segment earnings for the Company’s reportable segments are discussed below. Segment earnings differ from income from operations in that segment earnings exclude certain operational expenses included in other expense – net as reported. Management believes segment earnings to be a useful measure as it reflects the results of segment performance over which management has direct control and is usedby management in its evaluation of segment performance. See also Note 14 included in Item 8 of this Annual Report on Form 10-K to the Company’s Consolidated Financial Statements for further information on the Company’s reportable segments.
Infrared Optics (millions)
%2011 2010 Increase
Bookings 193.8$ 139.4$ 39%Revenues 180.8 135.1 34%Segment earnings 46.2 24.6 88%
June 30,Year Ended
The Company’s Infrared Optics segment includes the combined operations of II-VI Infrared and HIGHYAG.
Bookings for fiscal year 2011 for Infrared Optics increased 39% to $193.8 million from $139.4 million in fiscal year 2010. The increase in bookings in the current fiscal year was driven by strong demand from international OEMs and aftermarket customers as laser utilization rates and new laser applications continue to drive growth. Increases in demand are pervasive across all geographic locations including Asia, Europe, and North America. In Europe, new machine builds continue to increase by high power OEMs and laser utilitization rates continue to improve. Industrial applications in the low power and via hole markets in Asia have strengthened while replacement part demand and U.S. military orders in North American markets have realized strong growth. In addition, HIGHYAG bookings nearly doubled during fiscal year 2011 when compared to fiscal year 2010 as a result of increased manufacturing applications utilizing one-micron beam delivery components, laser light cables, and laser welding and cutting heads.
Revenues for fiscal year 2011 for Infrared Optics increased 34% to $180.8 million from $135.1 million in fiscal year 2010. The increase in revenues during the current fiscal year compared to the prior fiscal year was primarily due to higher shipment volume to both OEM and aftermarket customers across all geographic markets as the segment continued to develop incremental opportunities in both high power and low power CO2 laser optics and components to capture developing markets and new laser applications.
Segment earnings for fiscal year 2011 for Infrared Optics increased 88% to $46.2 million from $24.6 million in fiscal year 2010. The increase in segment earnings during the current fiscal year compared to prior fiscal year was primarily due to the incremental margin realized on the segments higher shipment volume. In addition, segment earnings were favorably impacted during the current fiscal year as a result of improved production yields as well as favorable absorption of overhead costs due to increased production volumes.
Near-Infrared Optics (millions)
%2011 2010 Increase
Bookings 149.6$ 105.6$ 42%Revenues 159.8 88.5 81%Segment earnings 24.1 12.3 96%
June 30,Year Ended
The Company’s Near-Infrared Optics segment includes the combined operations of VLOC and Photop. The above results include Photop for six of the twelve months ended June 30, 2010 as this acquisition was completed in January 2010.
Bookings for fiscal year 2011 for Near-Infrared Optics increased 42% to $149.6 million from $105.6 million in fiscal year 2010. Included in bookings for the year ended June 30, 2011 and 2010 were approximately $118.4

31
million and $59.4 million, respectively, of bookings from Photop. Excluding Photop, bookings decreased during the current fiscal year when compared to the prior fiscal year. This decrease is the result of lower bookings at VLOC due to a Title III U.S. Government development contract that was received in fiscal year 2010 for the development of ceramic laser-gain materials. Due to recent changes in the government budgeting process, the funding of the next phase of this program was not extended in fiscal year 2011. Furthermore, the decrease in bookings at VLOC was due to lower orders for their UV Filter product line.
Revenues for fiscal year 2011 for Near-Infrared Optics increased 81% to $159.8 million compared to $88.5million in fiscal year 2010. Included in revenues for the year ended June 30, 2011 and 2010 was approximately$118.6 million and $46.9 million, respectively, of revenues from Photop. Excluding Photop, revenues decreased slightly due to a reduction in the shipment volume of the Company’s military product line as a result of government budget constraints and the uncertainty surrounding funding to support military programs.
Segment earnings for fiscal year 2011 for Near-Infrared Optics increased 96% to $24.1 million from $12.3million in fiscal year 2010. The increase in segment earnings for the current fiscal year compared to the prior fiscalyear was due primarily to the inclusion of Photop’s operating results for the full fiscal year in 2011. The increase in segment earnings related to Photop were somewhat offset by lower profitability due to reduced shipment volumes ofthe military product line at the VLOC business unit. Segment earnings in fiscal year 2011 were also negatively impacted by $1.0 million due to the resolution of a customer dispute at VLOC.
Military & Materials (millions)
%2011 2010 Increase
Bookings 92.0$ 79.0$ 16%Revenues 83.4 65.7 27%Segment earnings 15.3 9.3 65%
June 30,Year Ended
The Company’s Military & Materials segment includes the combined operations of the Company’s Exotic Electro-Optics (“EEO”), PRM, and MLA. The above results include the results of MLA since the date of acquisition for the year ended June 30, 2011 only, as this acquisition was completed in December of 2010. The operating results of MLA were insignificant.
Bookings for fiscal year 2011 for Military & Materials increased 16% to $92.0 million from $79.0 million in fiscal year 2010. The increase in bookings in the current fiscal year compared to the prior fiscal year was primarily the result of increased product demand at PRM. PRM continued to benefit from an increase in demand for its selenium and tellurium raw materials from its industrial-based customers, especially in China, as worldwide industrial markets became more active. In addition, higher market-index pricing for these two raw materials also contributed to the increased booking levels.
Revenues for fiscal year 2011 for Military & Materials increased 27% to $83.4 million compared to $65.7million in fiscal year 2010. The increase in revenues in the current fiscal year compared to the prior fiscal year was primarily due to stronger shipment volume of selenium and tellurium at PRM as well as increased pricing of such products. EEO realized increased revenues as a result of higher shipment volume of sapphire windows for the Joint Strike Fighter program.
Segment earnings for fiscal year 2011 for Military & Materials increased 65% to $15.3 million from $9.3million in fiscal year 2010. The improvement in segment earnings in the current year was primarily due to incremental margins realized on increased revenues at both EEO and PRM. In addition, PRM’s margins were favorably impacted as a result of the higher market pricing of selenium and tellurium.

32
Compound Semiconductor Group (millions)
%2011 2010 Increase
Bookings 84.8$ 63.5$ 34%Revenues 78.7 55.9 41%Segment earnings 13.2 5.5 141%
Year EndedJune 30,
The Compound Semiconductor Group includes the combined operations of Marlow, WBG and the Worldwide Materials Group (“WMG”).
Bookings for fiscal year 2011 from the Compound Semiconductor Group increased 34% to $84.8 million from $63.5 million in fiscal year 2010. The increase in bookings in the current fiscal year compared to the prior fiscal year was primarily due to increased bookings at the WBG business unit for large diameter silicon carbide substrates and further product acceptance from Japanese customers. Specifically, WBG received a $5.2 million contract from the U.S. Department of Defense which focuses on improving the growth processes of large diameter silicon carbide substrates. Bookings at Marlow increased due to orders for the gesture recognition product line and increased demand from defense, medical and automotive markets.
Revenues for fiscal year 2011 from the Compound Semiconductor Group increased 41% to $78.7 million compared to $55.9 million in fiscal year 2010. The increase in revenues in the current fiscal year compared to the prior fiscal year was primarily the result of higher shipments for gesture recognition product as the Marlow business unit continues to gain market share in the gesture recognition market. Additionally, shipment volumes for silicon carbide products at the WBG business unit continue to increase due to accelerated demand for such products within defense and commercial applications.
Segment earnings for fiscal year 2011 for the Compound Semiconductor Group increased 141% to $13.2million from $5.5 million in fiscal year 2010. The increase in segment earnings for the current fiscal year compared to the prior fiscal year was primarily the result of increased margins realized from the incremental revenues. In addition, the continued utilization of Marlow’s low cost commercial production facility in Vietnam had a favorable impact on segment earnings.
Overall:
Manufacturing gross margin, which is defined as net domestic and international revenue less cost of goods sold, for fiscal year 2011 was $204.5 million or 42% of revenues compared to $131.7 million or 39% of revenues in fiscal year 2010. The increase in manufacturing gross margin for fiscal year 2011 compared to the prior fiscal year was primarily due to the incremental margin realized on higher shipment levels at the majority of the Company’s operating units. In addition, product mix, yield improvements, pricing, operating efficiencies and favorable overhead absorption caused by higher shipment volumes at the Company’s business units favorably impacted manufacturing gross margin. Manufacturing gross margin was slightly offset by a $1.0 million charge recorded at VLOC relating to the resolution of a customer dispute.
Contract research and development gross margin, which is calculated as contract research and development revenues less contract research and development expense, for fiscal year 2011 was $2.4 million or 24% of revenues compared to contract research and development gross margin of $2.9 million or 29% of revenues for fiscal year 2010.The contract research and development revenues and costs are related primarily to development efforts in the Near-Infrared Optics and the Military & Materials segments as well as activities in the Compound Semiconductor Group. The lower contract research and development gross margin for fiscal year 2011 compared to the prior fiscal year was primarily due to certain contract rate adjustments and a higher mix of contracts with lower profit profiles.
Company-funded internal research and development expenses for fiscal year 2010 were $16.1 million or 3%of total revenues compared to $11.8 million or 3% of total revenues for fiscal year 2010. The increase in Company-funded internal research and development expense in the current fiscal year compared to the prior fiscal year is primarily the result of a full year of internal research and development activities at Photop focused on efforts to refine and improve its photonic crystal materials, optical parts, laser instrumentation and display optics.

33
Selling, general and administrative expenses for the fiscal year 2011 were $92.0 million or 18% of revenues compared to $71.1 million or 21% of revenues for the same period last fiscal year. The increase in selling general and administration expense for the current fiscal year compared to the prior fiscal year was primarily due to the additionof a full year of expenses related to Photop as well as higher worldwide bonus expense resulting from improved operating profitability. Selling, general and administrative expense as a percentage of revenues improved during the current fiscal year compared to the prior fiscal year primarily as a result of increased revenues outpacing incremental operating costs.
Interest expense for fiscal year 2011 and 2010 was $0.1 million. The low level of interest expense is the result of the Company having relatively low levels of average debt outstanding during fiscal years 2011 and 2010.The Company’s $15.0 million of outstanding long term debt as of June 30, 2011 was the result of a borrowing made near the end of the current fiscal year in anticipation of the Aegis acquisition.
Other income for fiscal 2011 was $3.1 million compared to other expense of $0.3 million for fiscal year 2010. The majority of other income for fiscal 2011 is the result of foreign currency gains as certain of the Company’s foreign subsidiaries currencies strengthened against the U.S. dollar. In contrast, the Company incurred unrealized foreign currency losses during the prior fiscal year as a result of the Company’s foreign currencies weakening against the U.S. dollar.
The Company’s effective income tax rate for fiscal year 2011 was 18.4% compared to an effective income tax rate of 24.5% for fiscal year 2010. The lower income tax rate in fiscal year 2011 was primarily the result of a higher concentration of income in foreign jurisdictions with lower tax rates as well as certain foreign tax incentives enjoyed in the current fiscal year.
Fiscal 2010 Compared to Fiscal 2009
RESULTS OF OPERATIONS
Overview (millions except per share data)
%2010 2009 Increase
Bookings 387.6$ 261.1$ 48%Revenues 345.1 292.2 18%Net Earnings attributable to II-VI Incorporated 38.6 36.8 5%Diluted earnings per share 0.63 0.61 3%
Year EndedJune 30,
The above results include Photop for six of the twelve months ended June 30, 2010 as this acquisition was completed on January 4, 2010.
BOOKINGS Bookings increased 48% to $387.6 million in fiscal year 2010 compared to $261.1 million in fiscal year 2009. Included in bookings for the year ended June 30, 2010 was approximately $59.4 million of bookings from Photop. Excluding Photop, the majority of the Company’s business units realized higher levels of bookings in fiscal year 2010 compared to fiscal year 2009. The Company began seeing improved customer demands during the second half of fiscal year 2010 as worldwide economies began to rebound from their lower levels in the later part of fiscal year 2008 and in fiscal year 2009. In addition to the bookings recorded by Photop, the major factors that contributed to the general increase in bookings include:
The Company’s PRM business which is included in the Company’s Military & Materials segment recognized an increase in bookings of over $20 million or 265%. The Company benefited from an increase in demand and pricing for its selenium and tellurium raw materials from its industrial-based customers, especially in China as worldwide industrial markets became more active.The Infrared Optics segment experienced an increase in bookings of over $19 million or 17% as a result of increased demand as its customer base began to increase laser machine utilization rates and replenish their inventory levels of spare optic parts.
REVENUES Revenues increased 18% to $345.1 million in fiscal year 2010 compared to $292.2 million in fiscal year 2009. Included in revenues for the year ended June 30, 2010 was approximately $46.9 million of revenues
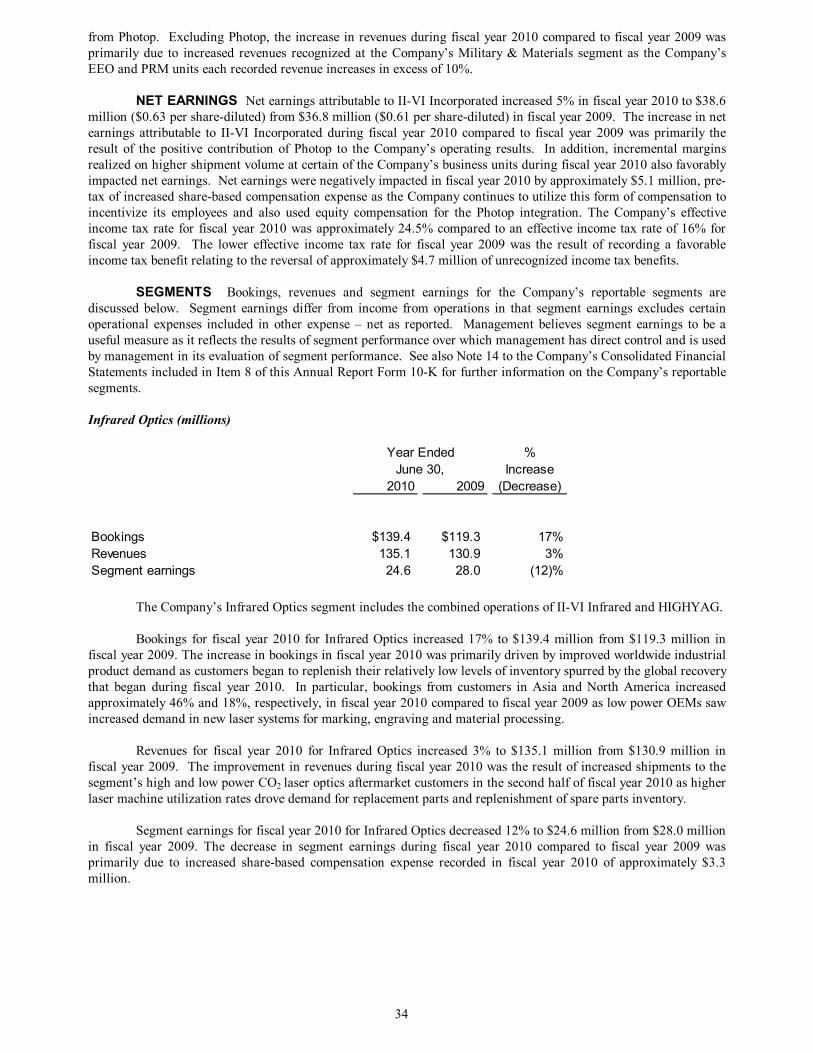
34
from Photop. Excluding Photop, the increase in revenues during fiscal year 2010 compared to fiscal year 2009 was primarily due to increased revenues recognized at the Company’s Military & Materials segment as the Company’s EEO and PRM units each recorded revenue increases in excess of 10%.
NET EARNINGS Net earnings attributable to II-VI Incorporated increased 5% in fiscal year 2010 to $38.6 million ($0.63 per share-diluted) from $36.8 million ($0.61 per share-diluted) in fiscal year 2009. The increase in net earnings attributable to II-VI Incorporated during fiscal year 2010 compared to fiscal year 2009 was primarily the result of the positive contribution of Photop to the Company’s operating results. In addition, incremental margins realized on higher shipment volume at certain of the Company’s business units during fiscal year 2010 also favorably impacted net earnings. Net earnings were negatively impacted in fiscal year 2010 by approximately $5.1 million, pre-tax of increased share-based compensation expense as the Company continues to utilize this form of compensation to incentivize its employees and also used equity compensation for the Photop integration. The Company’s effective income tax rate for fiscal year 2010 was approximately 24.5% compared to an effective income tax rate of 16% for fiscal year 2009. The lower effective income tax rate for fiscal year 2009 was the result of recording a favorable income tax benefit relating to the reversal of approximately $4.7 million of unrecognized income tax benefits.
SEGMENTS Bookings, revenues and segment earnings for the Company’s reportable segments are discussed below. Segment earnings differ from income from operations in that segment earnings excludes certain operational expenses included in other expense – net as reported. Management believes segment earnings to be a useful measure as it reflects the results of segment performance over which management has direct control and is usedby management in its evaluation of segment performance. See also Note 14 to the Company’s Consolidated Financial Statements included in Item 8 of this Annual Report Form 10-K for further information on the Company’s reportable segments.
Infrared Optics (millions)
%Increase
2010 2009 (Decrease)
Bookings $139.4 $119.3 17%Revenues 135.1 130.9 3%Segment earnings 24.6 28.0 (12)%
Year EndedJune 30,
The Company’s Infrared Optics segment includes the combined operations of II-VI Infrared and HIGHYAG.
Bookings for fiscal year 2010 for Infrared Optics increased 17% to $139.4 million from $119.3 million in fiscal year 2009. The increase in bookings in fiscal year 2010 was primarily driven by improved worldwide industrial product demand as customers began to replenish their relatively low levels of inventory spurred by the global recovery that began during fiscal year 2010. In particular, bookings from customers in Asia and North America increased approximately 46% and 18%, respectively, in fiscal year 2010 compared to fiscal year 2009 as low power OEMs saw increased demand in new laser systems for marking, engraving and material processing.
Revenues for fiscal year 2010 for Infrared Optics increased 3% to $135.1 million from $130.9 million in fiscal year 2009. The improvement in revenues during fiscal year 2010 was the result of increased shipments to the segment’s high and low power CO2 laser optics aftermarket customers in the second half of fiscal year 2010 as higher laser machine utilization rates drove demand for replacement parts and replenishment of spare parts inventory.
Segment earnings for fiscal year 2010 for Infrared Optics decreased 12% to $24.6 million from $28.0 million in fiscal year 2009. The decrease in segment earnings during fiscal year 2010 compared to fiscal year 2009 was primarily due to increased share-based compensation expense recorded in fiscal year 2010 of approximately $3.3 million.

35
Near-Infrared Optics (millions)
%2010 2009 Increase
Bookings $105.6 $37.8 180%Revenues 88.5 45.6 94%Segment earnings 12.3 7.1 73%
Year EndedJune 30,
The Company’s Near-Infrared Optics segment includes the combined operations of VLOC and Photop. The above results include Photop for six of the twelve months ended June 30, 2010 as this acquisition was completed in January 2010.
Bookings for fiscal year 2010 for Near-Infrared Optics increased 180% to $105.6 million from $37.8 million in fiscal year 2009. Included in bookings for fiscal year 2010 was approximately $59.4 million of bookings from Photop. Excluding Photop, bookings increased during the fiscal year 2010 primarily due to the timing of receipt of its UV Filter product orders compared to the timing of the order receipt in fiscal year 2009. In addition, the segment recorded higher YAG bookings in fiscal year 2010 as compared to fiscal 2009 due to increased demand from its industrial-and medical-based customers located in China and Germany.
Revenues for fiscal year 2010 for Near-Infrared Optics increased 94% to $88.5 million compared to $45.6 million in fiscal year 2009. Included in revenues for the fiscal year 2010 was approximately $46.9 million of revenues from Photop. Excluding Photop, revenues decreased primarily due to the continued planned reduction in the shipment volume of the Company’s UV Filter product line as a result of reduced demand from the Company’s military customers. In addition, the segment also realized lower external contract revenues in fiscal year 2010 due to the delay in the receipt of a contract in the current year.
Segment earnings for fiscal year 2010 for Near-Infrared Optics increased 73% to $12.3 million from $7.1 million in fiscal year 2009. The increase in segment earnings for fiscal year 2010 compared to fiscal year 2009 was due primarily to the inclusion of Photop’s operating results. The increase in segment earnings related to Photop wassomewhat offset by lower profitability due to reduced shipment volumes of the UV Filter product line.
Military & Materials (millions)
%2010 2009 Increase
Bookings $79.0 $50.0 58%Revenues 65.7 57.0 15%Segment earnings 9.3 6.5 43%
Year EndedJune 30,
The Company’s Military & Materials segment includes the combined operations of EEO and PRM.
Bookings for fiscal year 2010 for Military & Materials increased 58% to $79.0 million from $50.0 million in fiscal year 2009. The increase in bookings in fiscal year 2010 compared to fiscal year 2009 was primarily the result of increased product demand at PRM, which saw its bookings level increase by over three-fold from fiscal year 2009.PRM benefited from an increase in demand and pricing for its selenium and tellurium raw materials from its industrial-based customers, especially in China, as worldwide industrial markets became more active. In addition, higher market-index pricing for these two raw materials also contributed to the increased booking levels. EEO experienced a 14% increase in bookings in fiscal year 2010 compared to fiscal year 2009 primarily as a result of the Company’s continued expansion of its sapphire product line for the Joint Strike Fighter Program.
Revenues for fiscal year 2010 for Military & Materials increased 15% to $65.7 million compared to $57.0 million in fiscal year 2009. The increase in revenues in fiscal year 2010 compared to fiscal year 2009 was primarilydue to revenue improvements at both EEO and PRM. EEO realized increased revenues due to increased volume of shipments of its sapphire product line. PRM contributed to the segment’s revenue increase as PRM began benefitting

36
from the increasing worldwide industrial demand for both selenium used in glass and steel manufacturing and tellurium utilized in the photovoltaic industry.
Segment earnings for fiscal year 2010 for Military & Materials increased 43% to $9.3 million from $6.5 million in fiscal year 2009. The improvement in segment earnings in fiscal year 2010 was primarily due to incremental margins realized on increased revenues at both EEO and PRM. In addition, PRM’s margins werefavorably impacted as a result of the sale of ancillary materials such as gold and silver which carry a higher profit margin than the PRM’s main products.
Compound Semiconductor Group (millions)
Year Ended %June 30, Increase
2010 2009 (Decrease)
Bookings $63.5 $54.1 17%Revenues 55.9 58.7 (5)%Segment earnings 5.5 6.2 (11)%
The Compound Semiconductor Group includes the combined operations of Marlow, the Wide Bandgap Group (“WBG”) and the Worldwide Materials Group (“WMG”).
Bookings for fiscal year 2010 from the Compound Semiconductor Group increased 17% to $63.5 million from $54.1 million in fiscal year 2009. The increase in bookings in fiscal year 2010 compared to fiscal year 2009 was due to increased bookings at Marlow, which benefited from increased product demand from the majority of its markets in fiscal 2010, including defense, telecom, consumer and medical markets as customers introduced new products which require thermoelectric cooling and/or power generation technology. In addition, during the fourth quarter of fiscal year 2010, Marlow booked $2.0 million of a contract from a government agency for the development of advanced cooling modules for military applications.
Revenues for fiscal year 2010 from the Compound Semiconductor Group decreased 5% to $55.9 million compared to $58.7 million in fiscal year 2009. The decrease in revenues in fiscal year 2010 compared to fiscal year2009 was primarily the result of lower shipments at Marlow due to lower demand from industrial-based customers as a result of the general economic stagnation that existed during the first-half of fiscal year 2010. The lower revenues at Marlow were partially offset by increased revenue volume at WBG as the Company’s product portfolio continued to gain commercial acceptance from its customer base.
Segment earnings for fiscal year 2010 for the Compound Semiconductor Group decreased 11% to $5.5 million from $6.2 million in fiscal year 2009. The decrease in segment earnings for fiscal year 2010 compared to fiscal year 2009 was primarily the result of the lower shipment volume at Marlow primarily as a result of the general economic environment that Marlow encountered during the first half of fiscal year 2010 relating to its industrial-based customers.

37
Overall:
Manufacturing gross margin, which is defined as net domestic and international revenue less cost of goods sold, for fiscal year 2010 was $131.7 million or 39% of revenues compared to $113.1 million or 40% of revenues in fiscal year 2009. The increase in manufacturing gross margin stated in dollars for fiscal 2010 compared to fiscal year 2009 was primarily due to increased revenues recorded by the Company. Gross margin percentage decreased during fiscal year 2010 as a result of the inclusion of Photop which has lower gross margin levels in comparison to the Company’s historical margins.
Contract research and development gross margin, which is calculated as contract research and development revenues less contract research and development expense, for fiscal year 2010 was $2.9 million or 29% of revenues compared to contract research and development gross margin of $3.0 million or 28% of revenues for fiscal year 2009. During fiscal year 2010, the Company recorded $0.6 million less in contract revenues compared to fiscal year 2009 as a result of external delays in the awarding of contracts from the various government agencies. The higher gross margin for fiscal year 2010 despite lower contract revenues compared to fiscal year 2009 was the result of a more favorable mix of contracts related to defense and military programs which historically have higher profit margins.
Company-funded internal research and development expenses for fiscal year 2010 were $11.8 million or 3% of total revenues compared to $10.2 million or 3% of total revenues for fiscal year 2009. The increase in Company-funded internal research and development expense in relative dollars in fiscal year 2010 compared to fiscal year 2009was primarily the result of the inclusion of the research and development activities at Photop.
Selling, general and administrative expenses for the fiscal year 2010 were $71.1 million or 21% of revenues compared to $58.1 million or 20% of revenues for fiscal year 2009. The increase in the dollar amount of selling general and administration expense for fiscal year 2010 compared to fiscal year 2009 was primarily due to the addition of Photop as well as higher worldwide bonus expense resulting from improved operating profitability in fiscal year 2009 as well as increased levels of share-based compensation expense.
Interest expense for fiscal year 2010 was $0.1 million compared to $0.2 million for fiscal year 2009. The low level of interest expense was primarily the result of the Company having relatively low levels of debt outstanding for the fiscal years 2010 and 2009.
Other expense for fiscal 2010 was $0.3 million compared to other expense of $1.3 million for fiscal year 2009. Other expense for fiscal year 2010 consisted of foreign currency losses of $2.9 million due to the weakening of the Euro, which resulted in unrealized foreign currency losses for certain U.S. dollar denominated obligations at several of the Company’s international subsidiaries. Foreign currency losses during the fiscal year 2010 was partially offset by other income including equity earnings from the Company’s investments, interest income on excess cash reserves and unrealized gains on the Company’s deferred compensation plan. Other expense for fiscal 2009 consisted of foreign currency losses offset by equity earnings from the Company’s equity investments and interest income on excess cash reserves.
The Company’s effective income tax rate for fiscal year 2010 was 24.5% compared to an effective income tax rate of 16.0% for fiscal year 2009. The lower income tax rate in fiscal year 2009 was primarily the result of the Company recording a favorable income tax benefit of approximately $4.7 million relating to the reversal of unrecognized tax benefits resulting from the completion of the Internal Revenue Service’s examination of certain of the Company’s federal income tax returns
LIQUIDITY AND CAPITAL RESOURCES
Historically, our primary source of cash has been provided through operations and long-term borrowings. Other sources of cash include proceeds received from the exercise of stock options and sales of equity investments.Our historical uses of cash have been for capital expenditures, business acquisitions, payment of principal and interest on outstanding debt obligations and purchases of treasury stock. Supplemental information pertaining to our sources and uses of cash is presented as follows:

38
Sources (uses) of cash (millions):
2011 2010 2009
Net cash provided by operating activities 73.5$ 72.4$ 48.8$Proceeds from exercises of stock options 6.2 2.6 1.8Proceeds from collection of note receivable 2.0 - -Net proceeds/(payments) on long-term debt 15.0 (0.6) (0.5)Additions to property, plant and equipment (40.9) (13.8) (15.6)Purchase of businesses, net of cash acquired (12.8) (45.6) -Payment on cash earnout arrangement (6.0) - -Purchases of treasury stock - - (12.9)Investment in unconsolidated businesses (1.1) (4.8) (4.9)
Year EndedJune 30,
Cash provided by (used in) operating activities:
Cash provided by operating activities was $73.5 million and $72.4 million for the fiscal years ended June 30, 2011 and 2010, respectively. Despite the higher net earnings and non cash charges in fiscal year 2011, cash flows from operations remained consistent with fiscal year 2010 primarily due to increased working capital requirements necessary to support the current level of business activity. Specifically, the Company increased its inventory levels as a result of a planned inventory build to support the current level of demand for the Company’s products as well as higher prices of selenium and tellurium.
Cash provided by operating activities was $72.4 million and $48.8 million for the fiscal years ended June 30, 2010 and 2009, respectively. The increase in cash provided by operating activities for fiscal year 2010 compared to the fiscal year 2009 was due to improved working capital management relating to the Company’s inventory, accounts payable and accrued other current liabilities during fiscal year 2010. In addition, cash provided by operations in fiscalyear 2010 was also favorably impacted by the operating results of Photop.
Cash provided by (used in) investing activities:
Cash used in investing activities was $52.5 million and $65.1 million for the fiscal years ended June 30, 2011 and 2010, respectively. The decrease in cash used by investing activities in the current fiscal year compared to the same period last year was primarily the result of the Company’s cash consideration paid for its acquisition of Photop in prior fiscal year offset somewhat by increases in capital spending during the current fiscal year.
Cash used in investing activities was $65.1 million and $18.3 million for the fiscal years ended June 30, 2010 and 2009, respectively. The increase in cash used by investing activities in fiscal year 2010 compared to fiscal year 2009 was primarily the result of the Company’s cash consideration paid for its acquisition of Photop in the amount of $45.6 million.
Cash provided by (used in) financing activities:
Cash provided by financing activities was $19.2 million for the year ended June 30, 2011 compared to $3.0 million for the year ended June 30, 2010. During fiscal year 2011, cash generated from financing activities included $15.0 million in proceeds from long-term borrowings, $6.2 million from the exercise of stock options and $4.1 million of excess tax benefits from share-based compensation expense. These cash inflows were somewhat offset by a $6.0 million payment of a cash earnout arrangement in connection with the acquisition of Photop. During fiscal year 2010, cash generated from financing activities included $2.7 million of proceeds from the exercise of stock options and $1.0 million of excess tax benefits from share-based compensation expense. These cash inflows were slightly offset by $0.6 million of payments made on the Company’s Yen loan.
Cash provided by financing activities was $3.0 million for the year ended June 30, 2010 and cash used in financing activities was $10.3 million for the year ended June 30, 2009. During fiscal year 2010, cash generated from financing activities included $2.7 million of proceeds from the exercise of stock options and $1.0 million of excess tax benefits from share-based compensation expense. These cash inflows were slightly offset by $0.6 million of payments made on the Company’s Yen loan. During fiscal year 2009, the Company repurchased approximately $12.9 million of treasury stock.
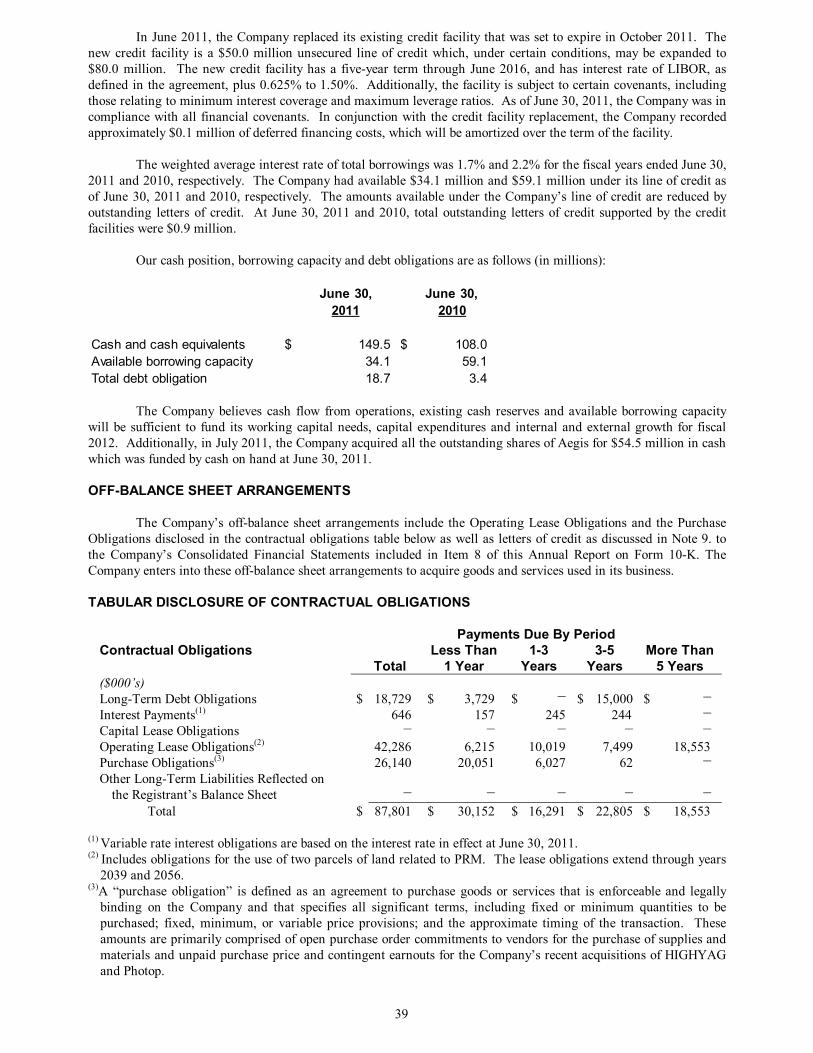
39
In June 2011, the Company replaced its existing credit facility that was set to expire in October 2011. The new credit facility is a $50.0 million unsecured line of credit which, under certain conditions, may be expanded to $80.0 million. The new credit facility has a five-year term through June 2016, and has interest rate of LIBOR, as defined in the agreement, plus 0.625% to 1.50%. Additionally, the facility is subject to certain covenants, including those relating to minimum interest coverage and maximum leverage ratios. As of June 30, 2011, the Company was in compliance with all financial covenants. In conjunction with the credit facility replacement, the Company recorded approximately $0.1 million of deferred financing costs, which will be amortized over the term of the facility.
The weighted average interest rate of total borrowings was 1.7% and 2.2% for the fiscal years ended June 30, 2011 and 2010, respectively. The Company had available $34.1 million and $59.1 million under its line of credit as of June 30, 2011 and 2010, respectively. The amounts available under the Company’s line of credit are reduced by outstanding letters of credit. At June 30, 2011 and 2010, total outstanding letters of credit supported by the credit facilities were $0.9 million.
Our cash position, borrowing capacity and debt obligations are as follows (in millions):
June 30, June 30,2011 2010
Cash and cash equivalents $ 149.5 $ 108.0Available borrowing capacity 34.1 59.1Total debt obligation 18.7 3.4
The Company believes cash flow from operations, existing cash reserves and available borrowing capacity will be sufficient to fund its working capital needs, capital expenditures and internal and external growth for fiscal 2012. Additionally, in July 2011, the Company acquired all the outstanding shares of Aegis for $54.5 million in cashwhich was funded by cash on hand at June 30, 2011.
OFF-BALANCE SHEET ARRANGEMENTS
The Company’s off-balance sheet arrangements include the Operating Lease Obligations and the Purchase Obligations disclosed in the contractual obligations table below as well as letters of credit as discussed in Note 9. to the Company’s Consolidated Financial Statements included in Item 8 of this Annual Report on Form 10-K. The Company enters into these off-balance sheet arrangements to acquire goods and services used in its business.
TABULAR DISCLOSURE OF CONTRACTUAL OBLIGATIONS
Payments Due By PeriodContractual Obligations
TotalLess Than
1 Year1-3
Years3-5
YearsMore Than
5 Years($000’s)Long-Term Debt Obligations $ 18,729 $ 3,729 $ — $ 15,000 $ —Interest Payments(1) 646 157 245 244 —Capital Lease Obligations — — — — —Operating Lease Obligations(2) 42,286 6,215 10,019 7,499 18,553Purchase Obligations(3) 26,140 20,051 6,027 62 —Other Long-Term Liabilities Reflected on
the Registrant’s Balance Sheet — — — — —Total $ 87,801 $ 30,152 $ 16,291 $ 22,805 $ 18,553
(1) Variable rate interest obligations are based on the interest rate in effect at June 30, 2011.(2) Includes obligations for the use of two parcels of land related to PRM. The lease obligations extend through years
2039 and 2056.(3)A “purchase obligation” is defined as an agreement to purchase goods or services that is enforceable and legally
binding on the Company and that specifies all significant terms, including fixed or minimum quantities to be purchased; fixed, minimum, or variable price provisions; and the approximate timing of the transaction. These amounts are primarily comprised of open purchase order commitments to vendors for the purchase of supplies and materials and unpaid purchase price and contingent earnouts for the Company’s recent acquisitions of HIGHYAGand Photop.
40
The gross unrecognized income tax benefits at June 30, 2011 which are excluded from the above table are $5.0 million. The Company is not able to reasonably estimate how the liability will increase or decrease over time.
ITEM 7A. QUANTITATIVE AND QUALITATIVE DISCLOSURES ABOUT MARKET RISK
MARKET RISKS
The Company is exposed to market risks arising from adverse changes in foreign currency exchange rates and interest rates. In the normal course of business, the Company uses a variety of techniques and derivative financial instruments as part of its overall risk management strategy primarily focused on its exposure to the Japanese Yen. No significant changes have occurred in the techniques and instruments used other than those described below.
The Company also has transactions denominated in Euros and British Pounds. Changes in the foreign currency exchange rates of the Company’s various currencies did not have a material impact on the results of operations for fiscal year 2011.
Foreign Exchange Risks
In the normal course of business, the Company enters into foreign currency forward exchange contracts with its financial institutions. The purpose of these contracts is to hedge ordinary business risks regarding foreign currencies on product sales. Foreign currency exchange contracts are used to limit transactional exposure to changes in currency rates. The Company enters into foreign currency forward contracts that permit it to sell specified amounts of foreign currencies expected to be received from its export sales for pre-established U.S. dollar amounts at specified dates. The forward contracts are denominated in the same foreign currencies in which export sales are denominated. These contracts provide the Company with an economic hedge in which settlement will occur in future periods and which otherwise would expose the Company to foreign currency risk. The Company monitors its positions and the credit ratings of the parties to these contracts. While the Company may be exposed to potential losses due to risk in the event of non-performance by the counterparties to these financial instruments, it does not anticipate such losses.
The Company previously entered into a low interest rate Yen loan with PNC Bank in an effort to minimize the foreign currency exposure in Japan. A change in the interest rate of 1% for this Yen loan would have had an immaterial impact to interest expense and a 10% change in the Yen to U.S. dollar exchange rate would have changed revenues in the range from a decrease of approximately $3.0 million to an increase of approximately $3.8 million for the twelve months ended June 30, 2011.
For II-VI Singapore Pte., Ltd. and its subsidiaries, II-VI Suisse S.a.r.l., and Pacific Rare Specialty Metals & Chemicals, Inc., the functional currency is the U.S. dollar. Gains and losses on the remeasurement of the local currency financial statements are included in net earnings. Foreign currency (losses) gains were $(0.4) million, $(0.2) million and $0.5 million for the years ended June 30, 2011, 2010 and 2009, respectively.
For all other foreign subsidiaries, the functional currency is the local currency. Assets and liabilities of those operations are translated into U.S. dollars using the period-end exchange rate while income and expenses are translated using the average exchange rates for the reporting period. Translation adjustments are recorded as accumulated other comprehensive income within shareholders’ equity.
Interest Rate Risks
As of June 30, 2011, the Company’s total borrowings of $18.7 million were from a loan of $3.7 milliondenominated in Japanese Yen and a line of credit borrowing of $15.0 million denominated in US dollars. As such, the Company is exposed to changes in interest rates. A change in the interest rate of 1% on these borrowings would have had an immaterial impact to interest expense for the fiscal year ended June 30, 2011.

41
ITEM 8. FINANCIAL STATEMENTS AND SUPPLEMENTARY DATA
MANAGEMENT’S REPORT ON INTERNAL CONTROL OVER FINANCIAL REPORTING
Management’s Responsibility for Preparation of the Financial Statements
Management is responsible for the preparation of the financial statements included in the annual report on Form 10-K. The financial statements were prepared in accordance with the accounting principles generally accepted in the United States of America and include amounts that are based on the best estimates and judgments of management. The other financial information contained in this annual report is consistent with the financial statements.
Management’s Report on Internal Control Over Financial Reporting
Management is responsible for establishing and maintaining adequate internal control over financial reporting. The Company’s internal control system is designed to provide reasonable assurance concerning the reliability of the financial data used in the preparation of the Company’s financial statements, as well as reasonable assurance with respect to safeguarding the Company’s assets from unauthorized use or disposition.
All internal control systems, no matter how well designed, have inherent limitations. Therefore, even those systems determined to be effective can provide only reasonable assurance with respect to financial statement presentation and other results of such systems.
Management conducted an evaluation of the effectiveness of the Company’s internal control over financial reporting as of June 30, 2011. In making this evaluation, management used the criteria set forth by the Committee of Sponsoring Organizations of the Treadway Commission (COSO) in Internal Control – Integrated Framework.Management’s evaluation included reviewing the documentation of its controls, evaluating the design effectiveness of controls and testing their operating effectiveness. Based on the evaluation, management concluded that as of June 30, 2011, the Company’s internal controls over financial reporting were effective and provides reasonable assurance that the accompanying financial statements do not contain any material misstatement.
Ernst & Young LLP, an independent registered public accounting firm, has issued their report on the effectiveness ofour internal control over financial reporting as of June 30, 2011. Their report is included herein.

42
Report of Independent Registered Public Accounting Firm
The Board of Directors and Shareholders of II-VI Incorporated and Subsidiaries:
We have audited II-VI Incorporated and Subsidiaries’ internal control over financial reporting as of June 30, 2011, based on criteria established in Internal Control—Integrated Framework issued by the Committee of Sponsoring Organizations of the Treadway Commission (the COSO criteria). II-VI Incorporated and Subsidiaries’ management is responsible for maintaining effective internal control over financial reporting, and for its assessment of the effectiveness of internal control over financial reporting included in the accompanying Management’s Report on Internal Control over Financial Reporting. Our responsibility is to express an opinion on the company’s internal control over financial reporting based on our audit.
We conducted our audit in accordance with the standards of the Public Company Accounting Oversight Board (United States). Those standards require that we plan and perform the audit to obtain reasonable assurance about whether effective internal control over financial reporting was maintained in all material respects. Our audit included obtaining an understanding of internal control over financial reporting, assessing the risk that a material weakness exists, testing and evaluating the design and operating effectiveness of internal control based on the assessed risk, and performing such other procedures as we considered necessary in the circumstances. We believe that our audit provides a reasonable basis for our opinion.
A company’s internal control over financial reporting is a process designed to provide reasonable assurance regarding the reliability of financial reporting and the preparation of financial statements for external purposes in accordance with generally accepted accounting principles. A company’s internal control over financial reporting includes those policies and procedures that (1) pertain to the maintenance of records that, in reasonable detail, accurately and fairly reflect the transactions and dispositions of the assets of the company; (2) provide reasonable assurance that transactions are recorded as necessary to permit preparation of financial statements in accordance with generally accepted accounting principles, and that receipts and expenditures of the company are being made only in accordance with authorizations of management and directors of the company; and (3) provide reasonable assurance regarding prevention or timely detection of unauthorized acquisition, use or disposition of the company’s assets that could have a material effect on the financial statements.
Because of its inherent limitations, internal control over financial reporting may not prevent or detect misstatements. Also, projections of any evaluation of effectiveness to future periods are subject to the risk that controls may become inadequate because of changes in conditions, or that the degree of compliance with the policies or procedures may deteriorate.
In our opinion, II-VI Incorporated and Subsidiaries maintained, in all material respects, effective internal control over financial reporting as of June 30, 2011, based on the COSO criteria.
We have also audited, in accordance with the standards of the Public Company Accounting Oversight Board (United States), the consolidated balance sheets of II-VI Incorporated and Subsidiaries as of June 30, 2011 and 2010, and the related consolidated statements of earnings, shareholders’ equity, and cash flows for each of the three years in the period ended June 30, 2011 of II-VI Incorporated and Subsidiaries and our report dated August 26, 2011 expressed an unqualified opinion thereon.
/s/ Ernst & Young LLP
Pittsburgh, PennsylvaniaAugust 26, 2011

43
Report of Independent Registered Public Accounting Firm
The Board of Directors and Shareholders of II-VI Incorporated and Subsidiaries:
We have audited the accompanying consolidated balance sheets of II-VI Incorporated and Subsidiaries as of June 30, 2011 and 2010, and the related consolidated statements of earnings, shareholders' equity, and cash flows for each of the three years in the period ended June 30, 2011. Our audits also included the financial statement schedule listed in the Index at Item 15(a)(2). These financial statements and schedule are the responsibility of the Company's management. Our responsibility is to express an opinion on these financial statements and schedule based on our audits.
We conducted our audits in accordance with the standards of the Public Company Accounting Oversight Board (United States). Those standards require that we plan and perform the audit to obtain reasonable assurance about whether the financial statements are free of material misstatement. An audit includes examining, on a test basis, evidence supporting the amounts and disclosures in the financial statements. An audit also includes assessing the accounting principles used and significant estimates made by management, as well as evaluating the overall financial statement presentation. We believe that our audits provide a reasonable basis for our opinion.
In our opinion, the financial statements referred to above present fairly, in all material respects, the consolidated financial position of II-VI Incorporated and Subsidiaries at June 30, 2011 and 2010, and the consolidated results of their operations and their cash flows for each of the three years in the period ended June 30, 2011, in conformity with U.S. generally accepted accounting principles. In addition, in our opinion, the financial statement schedule listed in Item 15(a)(2) presents fairly, in all material respects, the information set forth therein when read in conjunction with the related consolidated financial statements.
We also have audited, in accordance with the standards of the Public Company Accounting Oversight Board (United States), II-VI Incorporated and Subsidiaries’ internal control over financial reporting as of June 30, 2011, based on criteria established in Internal Control-Integrated Framework issued by the Committee of Sponsoring Organizations of the Treadway Commission and our report dated August 26, 2011 expressed an unqualified opinion thereon.
/s/ Ernst & Young LLP
Pittsburgh, PennsylvaniaAugust 26, 2011

44
II-VI INCORPORATED AND SUBSIDIARIESCONSOLIDATED BALANCE SHEETS
June 30, 2011 2010($000)Current AssetsCash and cash equivalents $ 149,460 $ 108,026Accounts receivable – less allowance for doubtful accounts of $766 and $1,081,respectively 90,606 78,624Inventories 126,430 81,397Deferred income taxes 8,215 5,382Prepaid and refundable income taxes 8,606 4,294Prepaid and other current assets 12,223 10,547Total Current Assets 395,540 288,270Property, plant and equipment, net 138,135 117,937Goodwill 64,262 56,088Other intangible assets, net 28,732 24,995Investments 15,458 15,269Deferred income taxes 3 3,029Other assets 5,072 3,393Total Assets $ 647,202 $ 508,981
Current LiabilitiesAccounts payable $ 25,065 $ 21,347Accrued salaries and wages 12,410 10,429Accrued bonuses 17,210 11,210Accrued profit sharing contribution 4,269 2,946Accrued income tax payable 5,290 7,510Deferred income taxes 141 83Other accrued liabilities 22,853 19,660Current portion of long-term debt 3,729 —Total Current Liabilities 90,967 73,185Long-term debt 15,000 3,384Deferred income taxes 6,641 6,195Unrecognized tax benefits 4,978 4,530Other liabilities 6,515 10,827Total Liabilities 124,101 98,121Shareholders’ EquityPreferred stock, no par value;
authorized – 5,000,000 shares; none issued — —Common Stock, no par value; authorized – 100,000,000 shares;
issued – 69,077,492 shares and68,242,562 shares, respectively 159,186 139,311
Accumulated other comprehensive income 13,116 4,008Retained earnings 378,365 295,683
550,667 439,002Treasury stock at cost, 6,393,659 shares and
6,484,940 shares, respectively 28,293 28,649Total II-VI Incorporated Shareholders’ Equity 522,374 410,353Noncontrolling Interests 727 507Total Shareholders’ Equity 523,101 410,860Total Liabilities and Shareholders’ Equity $ 647,202 $ 508,981See Notes to Consolidated Financial Statements.
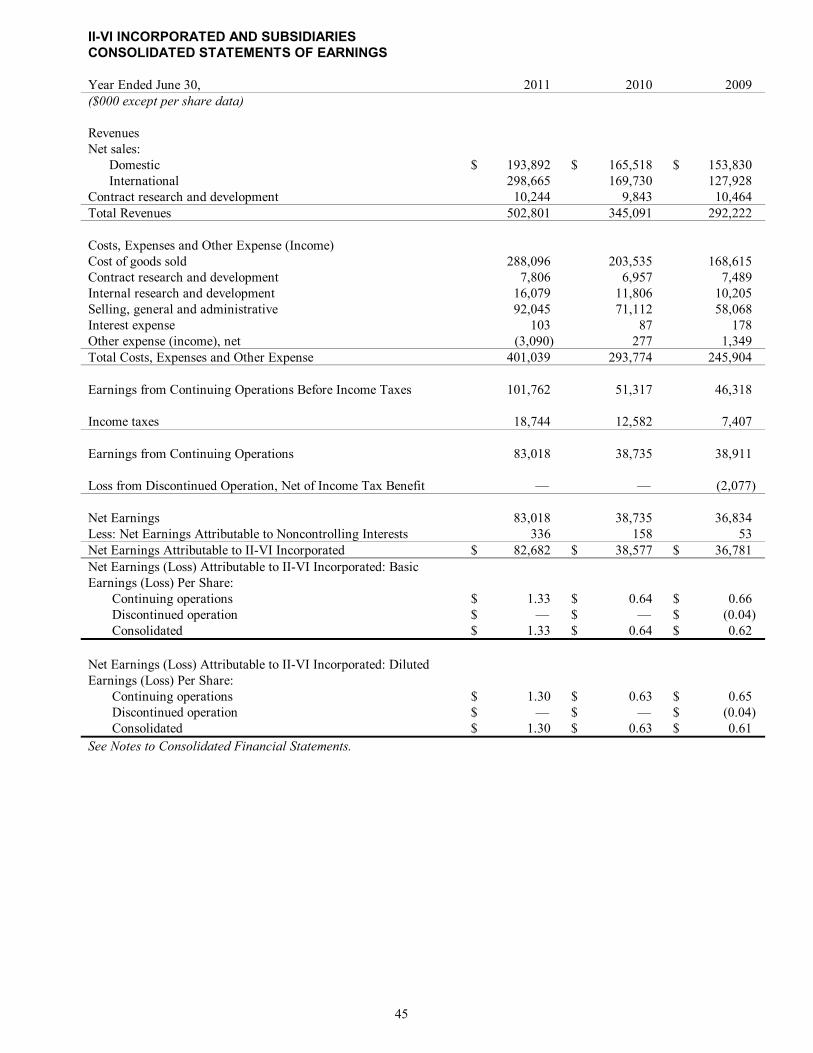
45
II-VI INCORPORATED AND SUBSIDIARIESCONSOLIDATED STATEMENTS OF EARNINGS
Year Ended June 30, 2011 2010 2009($000 except per share data)
RevenuesNet sales:
Domestic $ 193,892 $ 165,518 $ 153,830International 298,665 169,730 127,928
Contract research and development 10,244 9,843 10,464Total Revenues 502,801 345,091 292,222
Costs, Expenses and Other Expense (Income) Cost of goods sold 288,096 203,535 168,615Contract research and development 7,806 6,957 7,489Internal research and development 16,079 11,806 10,205Selling, general and administrative 92,045 71,112 58,068Interest expense 103 87 178Other expense (income), net (3,090) 277 1,349Total Costs, Expenses and Other Expense 401,039 293,774 245,904
Earnings from Continuing Operations Before Income Taxes 101,762 51,317 46,318
Income taxes 18,744 12,582 7,407
Earnings from Continuing Operations 83,018 38,735 38,911
Loss from Discontinued Operation, Net of Income Tax Benefit — — (2,077)
Net Earnings 83,018 38,735 36,834Less: Net Earnings Attributable to Noncontrolling Interests 336 158 53Net Earnings Attributable to II-VI Incorporated $ 82,682 $ 38,577 $ 36,781Net Earnings (Loss) Attributable to II-VI Incorporated: Basic Earnings (Loss) Per Share:
Continuing operations $ 1.33 $ 0.64 $ 0.66Discontinued operation $ — $ — $ (0.04)Consolidated $ 1.33 $ 0.64 $ 0.62
Net Earnings (Loss) Attributable to II-VI Incorporated: Diluted Earnings (Loss) Per Share:
Continuing operations $ 1.30 $ 0.63 $ 0.65Discontinued operation $ — $ — $ (0.04)Consolidated $ 1.30 $ 0.63 $ 0.61
See Notes to Consolidated Financial Statements.

46
II-VI INCORPORATED AND SUBSIDIARIESCONSOLIDATED STATEMENTS OF SHAREHOLDERS’ EQUITY
Common Stock
AccumulatedOther
Comprehensive Retained Treasury Stock Non-controlling(000) Shares Amount Income Earnings Shares Amount Interest TotalBalance – July 1, 2008Shares issued under stock incentive plansNet earningsPurchase of treasury stockTreasury stock in deferred compensation
planOther comprehensive income, net of taxShare-based compensation expenseExcess tax benefits from share-based compensation expenseOther comprehensive income (loss),
noncontrolling interests
65,213318——
———
—
—
$81,5851,798
——
52—
4,951
1,314
—
$3,576———
—223—
—
63
$220,325—
36,781—
———
—
—
(5,456)——
(1,000)
(2)——
—
—
$(15,360)——
(12,880)
(52)——
—
—
$505—53—
———
—
(63)
$290,6311,798
36,834(12,880)
—223
4,951
1,314
—Balance – June 30, 2009Shares issued under stock incentive plansNet earningsShares issued for acquisition of businessTreasury stock in deferred compensation
planOther comprehensive income, net of taxShare-based compensation expenseExcess tax benefits from share-based compensation expenseDistribution of noncontrolling interestsOther comprehensive income (loss),
noncontrolling interests
65,531420—
2,292
———
——
—
$89,7002,637
—36,851
357—
8,790
976—
—
$3,862———
—126—
——
20
$257,106—
38,577—
———
——
—
(6,458)———
(26)——
——
—
$(28,292)———
(357)——
——
—
$495—
158—
———
—(126)
(20)
$322,8712,637
38,73536,851
—126
8,790
976(126)
—
Balance – June 30, 2010Shares issued under stock incentive plansNet earningsTreasury stock in deferred compensation
planOther comprehensive income, net of taxShare-based compensation expenseExcess tax benefits from share-based compensation expenseDistribution of noncontrolling interestsOther comprehensive income (loss),
noncontrolling interests
68,243834—
———
——
—
$139,3116,206
—
(356)—
9,972
4,053—
—
$4,008——
—9,107
—
——
1
$295,683—
82,682
———
——
—
(6,484)——
90——
——
—
$(28,649)——
356——
——
—
$507—
336
———
—(115)
(1)
$410,8606,206
83,018
—9,1079,972
4,053(115)
—
Balance – June 30, 2011 69,077 $159,186 $13,116 $378,365 (6,394) $(28,293) $727 $523,101See Notes to Consolidated Financial Statements.
II-VI INCORPORATED AND SUBSIDIARIESCONSOLIDATED STATEMENTS OF COMPREHENSIVE INCOME
Year Ended June 30, 2011 2010 2009($000)Net earnings attributable to II-VI IncorporatedOther comprehensive income:
Foreign currency translation adjustments
$82,682
9,107
$38,577
126
$36,781
223Comprehensive Income $91,789 $38,703 $37,004See Notes to Consolidated Financial Statements.

47
II-VI INCORPORATED AND SUBSIDIARIESCONSOLIDATED STATEMENTS OF CASH FLOWS ($000)Year Ended June 30, 2011 2010 2009
Cash Flows from Operating ActivitiesNet earnings $ 83,018 $ 38,735 $ 36,834Adjustments to reconcile net earnings to net cash provided by operating activities:
Loss from discontinued operation, net of tax — — 2,077Depreciation 25,669 19,127 14,068Amortization 2,777 1,912 1,286Share-based compensation expense 9,972 8,790 4,951Gain on sale of equity investment (168) — —(Gain) Loss on foreign currency remeasurements and transactions (405) 2,951 2,693Net loss on disposals of property, plant and equipment 320 576 927Deferred income taxes (2,068) (951) (3,851)Excess tax benefits from share-based compensation expense (4,053) (976) (1,314)Earnings from equity investments (579) (375) (1,031)Dividends from equity investments 387 462 —
Increase (decrease) in cash from changes in:Accounts receivable (7,197) (23,447) 9,355Inventories (40,403) 2,657 (7,106)Accounts payable 2,647 6,488 (7,269)Income taxes payable (2,722) 6,459 2,381Other operating net assets 6,299 10,012 (5,166)
Net cash provided by operating activities:Continuing operations 73,494 72,420 48,835Discontinued operation — — 78
Net cash provided by operating activities 73,494 72,420 48,913Cash Flows from Investing ActivitiesAdditions to property, plant and equipment (40,859) (13,837) (15,557)Purchases of businesses, net of cash acquired (12,813) (45,600) —Investments in unconsolidated businesses (1,180) (4,814) (4,853)Proceeds from collection of notes receivable 2,000 — —Other investing activities 360 186 45Redemptions of marketable securities — — 3,000Payments on deferred purchase price of businesses — (997) (913)Net cash (used in) provided by investing activities:
Continuing operations (52,492) (65,062) (18,278)Discontinued operation — — 3,018
Net cash used in investing activities (52,492) (65,062) (15,260)Cash Flows from Financing ActivitiesProceeds on long-term borrowings 15,000 — 7,000Payments on long-term borrowings — (558) (7,509)Proceeds from exercise of stock options 6,206 2,611 1,798Excess tax benefits from share-based compensation expense 4,053 976 1,314Payments on cash earnout arrangement (6,000) — —Payments of deferred financing costs (105)Purchases of treasury stock — — (12,880)Net cash provided by (used in) financing activities 19,154 3,029 (10,277)
(Effect of exchange rate changes on cash and cash equivalents 1,278 1,709 2,719
Net increase in cash and cash equivalents 41,434 12,096 26,095
Cash and Cash Equivalents at Beginning of Period 108,026 95,930 69,835Cash and Cash Equivalents at End of Period $ 149,460 $ 108,026 $ 95,930
Non-cash transactions:Purchase of business by issuing Common Stock of the Company $ — $ 36,851 $ —Purchases of business utilizing earnout consideration recorded in current and long-term liabilities $ — $ 11,900 $ —
See Notes to Consolidated Financial Statements.
48
NOTES TO CONSOLIDATED FINANCIAL STATEMENTS
Note 1. NATURE OF BUSINESS AND SUMMARY OF SIGNIFICANT ACCOUNTING POLICIES
NATURE OF BUSINESS II-VI Incorporated and subsidiaries (the “Company” “we” “us” “our”), a worldwide leader in crystal growth technology, is a vertically-integrated manufacturing company that creates and markets products for a diversified customer base including industrial manufacturing, military and aerospace,telecommunications, high-power electronics, photovoltaic and thermoelectronics applications. The Company markets its products through its direct sales force and through distributors and agents.
The Company uses certain uncommon materials and compounds to manufacture its products. Some of these materials are available from only one proven outside source. The continued high quality of these materials is critical to the stability of the Company's manufacturing yields. The Company has not experienced significant production delays due to a shortage of materials. However, the Company does occasionally experience problems associated with vendor-supplied materials not meeting specifications for quality or purity. A significant failure of the Company's suppliers to deliver sufficient quantities of necessary high-quality materials on a timely basis could have a material adverse effect on the Company's results of operations.
In June 2009, the Company sold its x-ray and gamma-ray radiation business, eV PRODUCTS, Inc. eV PRODUCTS was previously reported in the Compound Semiconductor Group business segment. Financial and operational data included herein has been presented to reflect the presentation of eV PRODUCTS as a discontinued operation.
PRINCIPLES OF CONSOLIDATION The consolidated financial statements include the accounts of the Company. All significant intercompany transactions and balances have been eliminated.
FOREIGN CURRENCY TRANSLATION For II-VI Singapore Pte., Ltd. and its subsidiaries, II-VI Suisse S.a.r.l. and Pacific Rare Specialty Metals & Chemicals, Inc., the functional currency is the U.S. dollar. Gains and losses on the remeasurement of the local currency financial statements are included in net earnings. Foreign currencytranslation (losses) gains were $(0.4) million, $(0.2) million and $0.5 million for the years ended June 30, 2011, 2010and 2009, respectively.
For all other foreign subsidiaries, the functional currency is the local currency. Assets and liabilities of those operations are translated into U.S. dollars using period-end exchange rates while income and expenses are translated using the average exchange rates for the reporting period. Translation adjustments are recorded as accumulated other comprehensive income within shareholders' equity in the accompanying consolidated balance sheets.
CASH AND CASH EQUIVALENTS The Company considers highly liquid investment instruments with an original maturity of three months or less to be cash equivalents. The majority of cash and cash equivalents is invested in investment grade money market type instruments. We place our cash and cash equivalents with highcredit quality financial institutions and to date we have not experienced credit losses in these instruments. Cash of foreign subsidiaries is on deposit at banks in China, Vietnam, Singapore, Japan, Switzerland, the Netherlands,Germany, the Philippines, Belgium, Italy, Hong Kong and the U.K.
ACCOUNTS RECEIVABLE The Company establishes an allowance for doubtful accounts based on historical experience and believes the collection of revenues, net of this reserve is reasonably assured.
The Company factored a portion of the accounts receivable of its Japan subsidiary during each of the years ended June 30, 2011and 2010. Factoring is done with large banks in Japan. During the years ended June 30, 2011and 2010, $8.2 million and $3.9 million, respectively, of accounts receivable had been factored. As of June 30, 2011 and 2010, $0.2 million was included in Other accrued liabilities representing the Company’s obligation to the bank for these receivables factored with recourse.
INVENTORIES Inventories are valued at the lower of cost or market, with cost determined on the first-in, first-out basis. Inventory costs include material, labor and manufacturing overhead. The Company records aninventory reserve as a charge against earnings for all products on hand more than twelve months to eighteen months depending on the products that have not been sold to customers or cannot be further manufactured for sale to alternative customers. An additional reserve is recorded for product on hand that is in excess of product sold to customers over the same periods noted above. Inventories are presented net of reserves. The reserves totaled $5.4million and $3.6 million at June 30, 2011 and 2010, respectively.

49
PROPERTY, PLANT AND EQUIPMENT Property, plant and equipment are carried at cost or fair market value upon acquisition. Major improvements are capitalized, while maintenance and repairs are generally expensed as incurred. The Company reviews its property, plant and equipment and other long-lived assets for impairment whenever events or circumstances indicate that the carrying amounts may not be recoverable. Depreciation for financial reporting purposes is computed primarily by the straight-line method over the estimated useful lives for building, building improvements and land improvements of 10 to 20 years and 2 to 12 years for machinery and equipment.
GOODWILL The excess purchase price over the fair market value allocated to identifiable tangible and intangible net assets of businesses acquired is reported as goodwill in the accompanying consolidated balance sheets. The Company tests goodwill for impairment at least annually as of April 1, or when events or changes in circumstances indicate that goodwill might be impaired. The evaluation of impairment involves comparing the current fair value of the Company’s reporting units to the recorded value (including goodwill). The Company uses a discounted cash flow model (“DCF model”) and a market analysis to determine the current fair value of its reporting units. A number of significant assumptions and estimates are involved in estimating the forecasted cash flows used in the DCF model, including markets and market shares, sales volume and pricing, costs to produce, working capital changes and income tax rates. Management considers historical experience and all available information at the time the fair values of the reporting units are estimated.
INVESTMENTS In July 2009, the Company acquired a 40% non-controlling minority interest in Langfang Haobo Diamond Co., Ltd., a joint venture based in Beijing, China. The total purchase price of the investment was$5.9 million and is accounted for under the equity method of accounting. The Company’s pro-rata share of the loss from this investment was $0.3 million for the years ended June 30, 2011 and 2010. The total carrying value of the investment recorded as of June 30, 2011 and 2010 was $5.3 million and $5.6 million, respectively.
In March 2007, the Company acquired for $3.6 million a 10% non-controlling minority interest in Guangdong Fuxin Electronic Technology (Fuxin) based in Guangdong Province, China. In July 2008, the Company completed an additional non-controlling investment of 10.2% of the equity interests of Fuxin for approximately $4.9million. As a result, the Company has a total equity investment in Fuxin of 20.2% which is accounted for under the equity method of accounting. During the years ended June 30, 2011, 2010 and 2009, the Company’s pro-rata share of earnings from this investment was $0.9 million, $0.7 million and $1.1 million, respectively, and is recorded in other expense (income), net in the Consolidated Statements of Earnings. During the year ended June 30, 2011 and 2010,the Company recorded distributions from this equity investment of $0.4 million and $0.5 million, respectively. The total carrying value of the investment recorded as of June 30, 2011 and 2010 was $10.1 million and $9.6 million, respectively.
INTANGIBLES Intangible assets are initially recorded at their cost or fair market value upon acquisition. Finite-lived intangible assets are amortized for financial reporting purposes using the straight-line method over the estimated useful lives of the assets ranging from three years to ten years. Indefinite-lived intangible assets are not amortized but tested annually for impairment in the fourth quarter of the fiscal year, or when events or changes in circumstances indicate that indefinite-lived intangible assets might be impaired.
PREPAID AND OTHER CURRENT ASSETS In April 2005, the Company entered into a $2.0 million note purchase agreement with SemiSouth Laboratories, Inc. (“SemiSouth”), a customer and supplier of the Company. Under the terms of the agreement, the note receivable accrued interest at 10% per annum. The note receivable and the accrued interest were paid in full in November 2010.
ACCRUED BONUSES AND PROFIT SHARING CONTRIBUTION The Company records bonus and profit sharing estimates as a charge against earnings. These estimates are adjusted to actual based on final results of operations achieved during the fiscal year. Certain partial bonus amounts may be paid on an interim basis, and the remainder is paid after the fiscal year end after the final determination of the applicable percentage or amounts.Other bonuses are paid annually.
WARRANTY RESERVE The Company records a warranty reserve as a charge against earnings based on a percentage of revenues utilizing actual returns over a period that approximates historical warranty experience. The following table summarizes the change in the carrying value of the Company’s warranty reserve as of and for the years ended June 30, 2011, 2010 and 2009.

50
Year Ended June 30, 2011 2010 2009($000)Balance – Beginning of Year $ 1,037 $ 861 $ 777Settlements during the period (1,557) (1,353) (1,231)Additional warranty liability recorded 1,707 1,529 1,315Balance – End of Year $ 1,187 $ 1,037 $ 861
INCOME TAXES Deferred income tax assets and liabilities are determined based on the differences between the consolidated financial statement and tax basis of assets and liabilities using enacted tax rates in effect in the years in which the differences are expected to reverse. Valuation allowances are established when necessary to reduce deferred income tax assets to the amount more likely than not to be realized. The Company adopted certain provisions of ASC 740 Income Taxes which clarifies the financial statement recognition threshold and measurement attribute of a tax position taken or expected to be taken in a tax return. This interpretation also provides guidance on de-recognition, classification, interest and penalties, accounting in interim periods, disclosures and transition. The Company applies a more-likely-than-not recognition threshold for all tax uncertainties. The Standard only allows the recognition of those tax benefits that have a greater than 50% likelihood of being sustained upon examination by the taxing authorities. The Company classifies interest and penalties as an element of income tax expense.
REVENUE RECOGNITION The Company recognizes revenues when the criteria of SEC Staff Accounting Bulletin: No. 104 – Revenue Recognition in Financial Statements (“SAB 104”) are met. Revenues for product shipments are realizable when the Company has persuasive evidence of a sales arrangement, the product has been shipped or delivered, the sale price is fixed or determinable and collectability is reasonably assured. Title and risk of loss passes from the Company to its customer at the time of shipment in most cases with the exception of certain customers. For these customers, title does not pass and revenue is not recognized until the customer has received the product at its physical location.
We establish an allowance for doubtful accounts and a warranty reserve based on historical experience andbelieve the collection of revenues, net of these reserves, is reasonably assured. Our allowance for doubtful accounts and warranty reserve balances at June 30, 2011 was approximately $0.8 million and $1.2 million, respectively. Our reserve estimates have historically been proven to be materially correct based upon actual charges incurred.
The Company’s revenue recognition policy is consistently applied across the Company’s segments, product lines and geographical locations. Further, we do not have post shipment obligations such as training or installation, customer acceptance provisions, credits and discounts, rebates and price protection, or other similar privileges. Our distributors and agents who comprise less than 10% of consolidated revenue and have no additional product return rights beyond the right to return defective products that are covered by our warranty policy, are not granted price protection. We believe our revenue recognition practices are consistent with SAB 104 and that we have adequately considered the requirements of ASC 605 Revenue Recognition.Revenues generated from transactions other than product shipments are contract related and have historically accounted for less than 5% of the Company’s consolidated revenues.
SHIPPING AND HANDLING COSTS Shipping and handling costs billed to customers are included in revenues. Shipping and handling costs incurred by the Company are included in selling, general and administrative expenses in the accompanying Consolidated Statements of Earnings. Total shipping and handling revenue and costs included in revenues and in selling, general and administrative expenses were $0.3 million, $0.2 million and $0.3million for the years ended June 30, 2011, 2010 and 2009, respectively.
RESEARCH AND DEVELOPMENT Internal research and development costs and costs not related to customer and government funded research and development contracts are expensed as incurred.
SHARE-BASED COMPENSATION The Company follows ASC 718 “Compensation-Stock Compensation” (formerly SFAS No. 123 (revised 2004), (“SFAS 123(R)”) “Share-Based Payment”) ASC 718requires the recognition of the fair value of stock compensation in net earnings. The Company recognizes the share-based compensation expense over the requisite service period of the individual grantees, which generally equals the vesting period.
The Company recorded $10.0 million, $10.1 million and $5.0 million in share-based compensation expense in its Consolidated Statements of Earnings for the fiscal years ended June 30, 2011, 2010 and 2009, respectively. The share-based compensation expense is allocated approximately 20% to cost of goods sold and 80% to selling, general

51
and administrative expense in the Consolidated Statements of Earnings based upon the employee classification of the grantees. The Company utilized the Black-Scholes valuation model for estimating the fair value of stock optionexpense. During the fiscal years ended June 30, 2011, 2010 and 2009, the weighted-average fair value of options granted under the stock option plan was $8.45, $6.64 and $8.86, respectively, per option using the following assumptions:
Year EndedJune 30, 2011
Year EndedJune 30, 2010
Year EndedJune 30, 2009
Risk free interest rate 1.96% 3.22% 2.91%Expected volatility 47% 49% 41%Expected life of options 6.61 years 7.00 years 5.84 yearsDividend yield None None None
The risk-free interest rate is derived from the average U.S. Treasury Note rate during the period, which approximates the rate in effect at the time of grant related to the expected life of the options. The risk free interest rate shown above is the weighted average rate for all options granted during the fiscal year. Expected volatility is based on the historical volatility of the Company’s Common Stock over the period commensurate with the expected life of the options. The expected life calculation is based on the observed time to post-vesting exercise and/or forfeitures of options by our employees. The dividend yield of zero is based on the fact the Company has never paid cash dividends and has no intention to pay cash dividends in the future. The estimated annualized forfeitures are based on the Company’s historical experience of option pre-vesting cancellations and are estimated at a rate of 16%.The Company will record additional expense in future periods if the actual forfeiture rate is lower than estimated, and will record a recovery of expense in future periods if the actual forfeitures are higher than estimated.
WORKERS’ COMPENSATION The Company is self-insured for certain losses related to workers’ compensation for its U.S. employees. Additionally, third-party insurance is obtained to limit our exposure to these claims in excess of $0.3 million per occurrence and $0.9 million in the aggregate per policy year. When estimating the self-insurance liability, the Company considers a number of factors, including historical claims experience, demographic and severity factors and valuations provided by independent third party consultants. Periodically, management reviews its assumptions and the valuations to determine the adequacy of the self-insurance liability.
COMPREHENSIVE INCOME Comprehensive income is a measure of all changes in shareholders' equity that result from transactions and other economic events of the period other than transactions with owners. Accumulated other comprehensive income is a component of shareholders' equity and consists of accumulated foreign currency translation adjustments of $13.1 million and $4.0 million, net of income taxes of $2.4 million and $1.4million, as of June 30, 2011 and 2010, respectively.
FAIR VALUE MEASUREMENTS The Company adopted FASB ASC 820 (ASC 820), Fair Value Measurements and Disclosures (formerly referenced as FASB Statement of Financial Accounting Standard No. 157, Fair Value Measurements), which defines fair value, establishes guidelines for measuring fair value and expands disclosures regarding fair value measurements with respect to the Company’s financial assets and liabilities. The Company applies fair value accounting for all financial assets and liabilities that are recognized or disclosed at fairvalue in the financial statements. The Company defines fair value as the price that would be received from selling an asset or paid to transfer a liability in an orderly transaction between market participants at the measurement date. When determining the fair value measurements for assets and liabilities, the Company considers the principal or most advantageous market in which the Company would transact and the market-based risk measurements or assumptions that market participants would use in pricing the asset or liability, such as inherent risk, transfer restrictions and credit risk.
ESTIMATES The preparation of financial statements in conformity with accounting principles generally accepted in the United States of America requires management to make estimates and assumptions that affect the reported amounts of assets and liabilities and disclosure of contingent assets and liabilities at the date of the financial statements and the reported amounts of revenues and expenses during the reporting period. Actual results could differ from those estimates.
RECLASSIFICATIONS Certain amounts from prior year periods have been reclassified to conform to the current year presentation.
52
RECENTLY ISSUED FINANCIAL ACCOUNTING STANDARDS
In June 2011, the Financial Accounting Standards Board (“FASB”) issued changes to the presentation of comprehensive income which requires entities to present the total of comprehensive income, the components of net income, and the components of other comprehensive income either in a single continuous statement of comprehensive income or in two separate but consecutive statements. Additionally, these changes require an entity to present on the face of the financial statements reclassification adjustments for items that are reclassified from other comprehensive income to net income in the statements where the components of net income and the components of other comprehensive income are presented. The option to present components of other comprehensive income as part of the statement of changes in stockholders’ equity, which is the method of presentation used by the Company, will no longer be permitted. In addition, these changes will have no impact on the calculation and presentation of earnings per share. These changes, with retrospective application, become effective for the Company for interim and annual periods beginning in fiscal year 2013, with early adoption allowed. Other than the change in presentation, these changes will not have an impact on the Consolidated Financial Statements.
In April 2010, the FASB issued an accounting standard update related to revenue recognition under the milestone method. The objective of the accounting standard update is to provide guidance on defining a milestone and determining when it may be appropriate to apply the milestone method of revenue recognition for research or development transactions. This update was effective on a prospective basis for milestones achieved in fiscal years, and interim periods within those fiscal years, beginning on or after June 15, 2010. The adoption of this standard did not have a significant impact on the Company’s financial position, results of operations, or cash flows.
In January 2010, the FASB issued amended standards requiring additional fair value disclosures. The amended standards require disclosures of transfers in and out of Levels 1 and 2 of the fair value hierarchy, as well as requiring gross basis disclosures for purchases, sales, issuances and settlements within the Level 3 reconciliation. Additionally, the update clarifies the requirement to determine the level of disaggregation for fair value measurement disclosures and to disclose valuation techniques and inputs used for both recurring and nonrecurring fair value measurements in either Level 2 or Level 3. The Company adopted the new guidance in the third quarter of fiscal 2010, except for the disclosures related to purchases, sales, issuance and settlements, which will be effective for the Company beginning in the first quarter of fiscal 2012. Because these new standards are related primarily to disclosures, their adoption has not had and is not expected to have a significant impact on the Company’s consolidated financial statements.
In October 2009, the FASB issued Accounting Standards Update 2009-13, “Multiple-Deliverable Revenue Arrangements,” codified in ASC Topic 605. This update provides application guidance on whether multiple deliverables exist, how the deliverables should be separated and how the consideration should be allocated to one or more units of accounting. This guidance establishes a selling price hierarchy for determining the selling price of a deliverable. The selling price used for each deliverable will be based on vendor-specific objective evidence, ifavailable, third-party evidence if vendor-specific objective evidence is not available, or estimated selling price if neither vendor-specific or third-party evidence is available. This update was effective on a prospective basis for revenue arrangements entered into or materially modified in the fiscal year beginning on or after June 15, 2010. The adoption of this standard did not have a significant impact on the Company’s financial position, results of operations, or cash flows.
In June 2009, the FASB issued new guidance concerning the determination of the primary beneficiary of a variable interest entity (“VIE”). This new guidance amends current U.S. GAAP by: requiring ongoing reassessments of whether an enterprise is the primary beneficiary of a VIE; amending the quantitative approach previously required for determining the primary beneficiary of the VIE; modifying the guidance used to determine whether an entity is a VIE; adding an additional reconsideration event (e.g. troubled debt restructurings) for determining whether an entity is a VIE; and requiring enhanced disclosures regarding an entity’s involvement with a VIE. This new guidance waseffective for the Company beginning in its first quarter of fiscal 2011, with earlier adoption prohibited. The Company does not expect the impact of this new guidance to be material to its consolidated financial statements.
Note 2. STOCK SPLIT
On May 17, 2011, the Company’s Board of Directors declared a two-for-one stock split, in the form of a stock dividend, of the Company’s common stock for shareholders of record on June 3, 2011. The stock split was distributed on June 24, 2011 issuing one additional share of common stock for every share of common stock held. The applicable share and per share data for all periods included herein have been restated to give effect to this stock split.
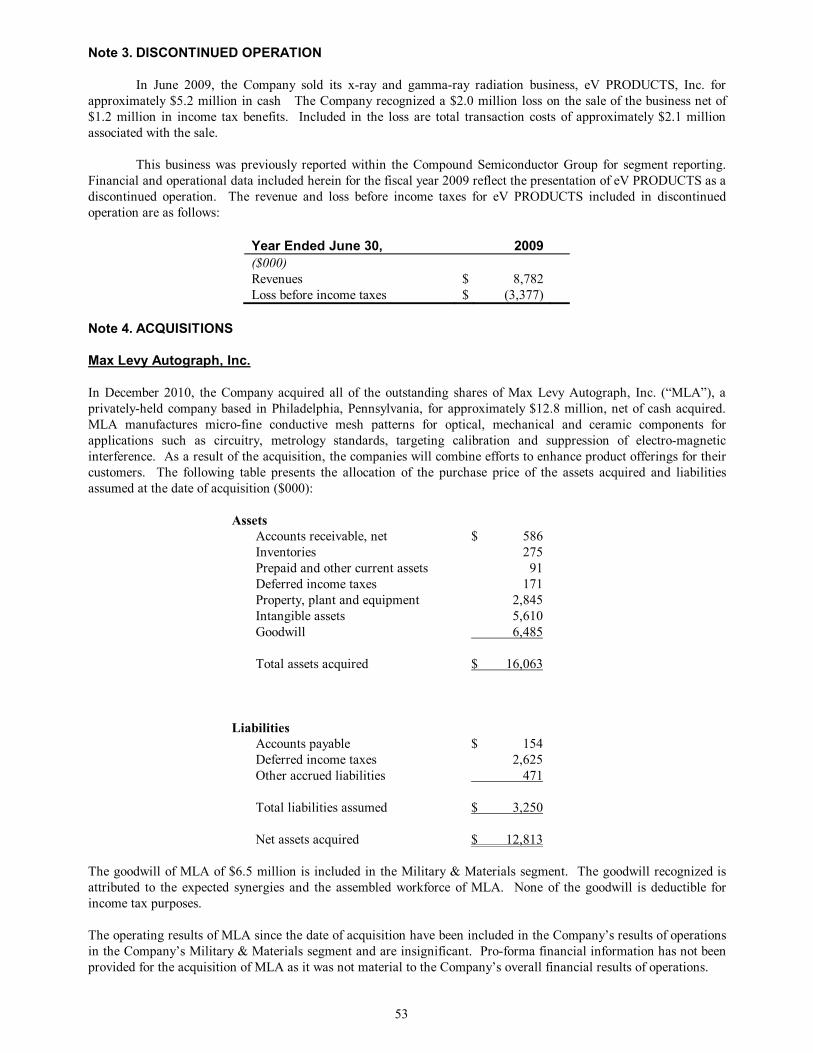
53
Note 3. DISCONTINUED OPERATION
In June 2009, the Company sold its x-ray and gamma-ray radiation business, eV PRODUCTS, Inc. for approximately $5.2 million in cash The Company recognized a $2.0 million loss on the sale of the business net of $1.2 million in income tax benefits. Included in the loss are total transaction costs of approximately $2.1 million associated with the sale.
This business was previously reported within the Compound Semiconductor Group for segment reporting.Financial and operational data included herein for the fiscal year 2009 reflect the presentation of eV PRODUCTS as a discontinued operation. The revenue and loss before income taxes for eV PRODUCTS included in discontinued operation are as follows:
Year Ended June 30, 2009($000)Revenues $ 8,782Loss before income taxes $ (3,377)
Note 4. ACQUISITIONS
Max Levy Autograph, Inc.
In December 2010, the Company acquired all of the outstanding shares of Max Levy Autograph, Inc. (“MLA”), a privately-held company based in Philadelphia, Pennsylvania, for approximately $12.8 million, net of cash acquired. MLA manufactures micro-fine conductive mesh patterns for optical, mechanical and ceramic components for applications such as circuitry, metrology standards, targeting calibration and suppression of electro-magnetic interference. As a result of the acquisition, the companies will combine efforts to enhance product offerings for their customers. The following table presents the allocation of the purchase price of the assets acquired and liabilities assumed at the date of acquisition ($000):
AssetsAccounts receivable, net $ 586Inventories 275Prepaid and other current assets 91Deferred income taxes 171Property, plant and equipment 2,845Intangible assets 5,610Goodwill 6,485
Total assets acquired $ 16,063
LiabilitiesAccounts payable $ 154Deferred income taxes 2,625Other accrued liabilities 471
Total liabilities assumed $ 3,250
Net assets acquired $ 12,813
The goodwill of MLA of $6.5 million is included in the Military & Materials segment. The goodwill recognized is attributed to the expected synergies and the assembled workforce of MLA. None of the goodwill is deductible for income tax purposes.
The operating results of MLA since the date of acquisition have been included in the Company’s results of operations in the Company’s Military & Materials segment and are insignificant. Pro-forma financial information has not been provided for the acquisition of MLA as it was not material to the Company’s overall financial results of operations.

54
Photop Technologies, Inc.
In January 2010, the Company acquired all the outstanding shares of Photop Technologies, Inc. (“Photop”), a privately held company based in Fuzhou, China. The results of Photop have been included in the consolidated financial statements since that date. Photop is a vertically integrated manufacturer of crystal materials, optics, microchip lasers for display applications and optical modules for use in fiber optic communication networks and other diverse consumer and commercial applications. As a result of the acquisition, the companies have combined efforts and enhanced the collective expertise in crystal materials and optics. The Company expects to achieve synergies by utilizing the Company’s worldwide distribution network to distribute Photop’s products as well as enhancing crystalgrowth processes.
Under the terms of the agreement, the initial consideration was $45.6 million in cash and 2,291,704 shares of II-VI Incorporated Common Stock valued at $36.9 million. The fair value of the shares of II-VI Incorporated’s Common Stock used for the transaction was determined based on the closing market price of the Company’s common stock on the acquisition date. In addition, the agreement provided up to $12.0 million of additional cash earnout opportunities based upon Photop achieving certain agreed upon financial targets in calendar years 2010 and 2011. The final purchase price was subject to customary closing adjustments, including working capital adjustments. During the fiscal year ended June 30, 2010, the Company completed the working capital review of Photop and, in accordance with the Merger Agreement, determined that there was no amount due to or from the selling shareholders. The purchase price is summarized as follows ($000):
Amount of cash paid $ 45,600Fair value of Common Stock issued by the Company 36,851Fair value of cash earnout arrangements 11,900
Total purchase price $ 94,351
The cash earnout arrangements require the Company to pay $12.0 million of additional consideration to Photop’s former shareholders if Photop’s earnings and revenues for calendar years 2010 and 2011 exceed established targets. In March 2011, the Company paid the full amount of the calendar year 2010 earnout of $6.0 million. The fair value of the remaining cash earnout arrangement at June 30, 2011 was $5.9 million, which is expected to be paid in March 2012 and was recorded in Other accrued liabilities in the Company’s Condensed Consolidated Balance Sheet at June 30, 2011. The Company estimated the fair value of the cash earnout arrangement using a probability-weighted discount model and employed present value techniques. The fair value of the remaining earnout arrangement was based on significant inputs not observable in the market and represents a Level 3 measurement as defined in ASC 820 “Fair Value Measurements and Disclosures.” The key assumptions used in applying the income approach were a 0.93% discount rate and an assumed 100% probability of achieving the financial targets under the earnout arrangement.
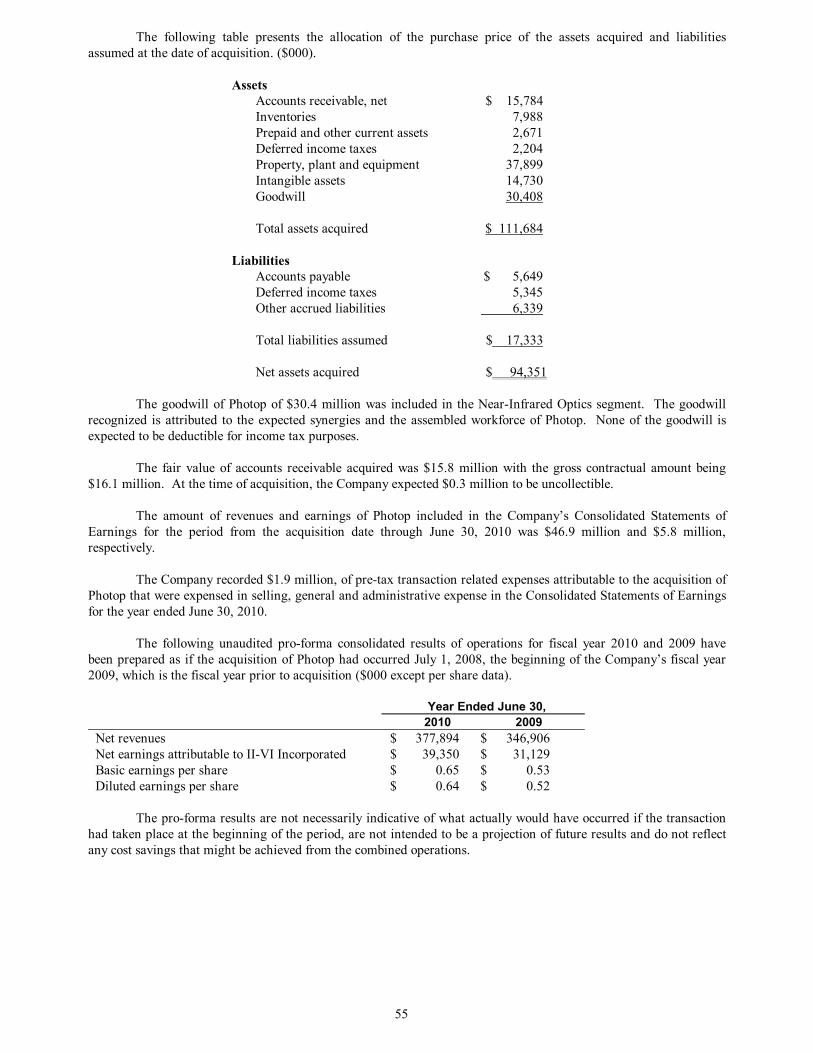
55
The following table presents the allocation of the purchase price of the assets acquired and liabilities assumed at the date of acquisition. ($000).
AssetsAccounts receivable, net $ 15,784Inventories 7,988Prepaid and other current assets 2,671Deferred income taxes 2,204Property, plant and equipment 37,899Intangible assets 14,730Goodwill 30,408
Total assets acquired $ 111,684
LiabilitiesAccounts payable $ 5,649Deferred income taxes 5,345Other accrued liabilities 6,339
Total liabilities assumed $ 17,333
Net assets acquired $ 94,351
The goodwill of Photop of $30.4 million was included in the Near-Infrared Optics segment. The goodwill recognized is attributed to the expected synergies and the assembled workforce of Photop. None of the goodwill is expected to be deductible for income tax purposes.
The fair value of accounts receivable acquired was $15.8 million with the gross contractual amount being $16.1 million. At the time of acquisition, the Company expected $0.3 million to be uncollectible.
The amount of revenues and earnings of Photop included in the Company’s Consolidated Statements of Earnings for the period from the acquisition date through June 30, 2010 was $46.9 million and $5.8 million,respectively.
The Company recorded $1.9 million, of pre-tax transaction related expenses attributable to the acquisition of Photop that were expensed in selling, general and administrative expense in the Consolidated Statements of Earnings for the year ended June 30, 2010.
The following unaudited pro-forma consolidated results of operations for fiscal year 2010 and 2009 have been prepared as if the acquisition of Photop had occurred July 1, 2008, the beginning of the Company’s fiscal year 2009, which is the fiscal year prior to acquisition ($000 except per share data).
Year Ended June 30,2010 2009
Net revenues $ 377,894 $ 346,906Net earnings attributable to II-VI Incorporated $ 39,350 $ 31,129Basic earnings per share $ 0.65 $ 0.53Diluted earnings per share $ 0.64 $ 0.52
The pro-forma results are not necessarily indicative of what actually would have occurred if the transaction had taken place at the beginning of the period, are not intended to be a projection of future results and do not reflect any cost savings that might be achieved from the combined operations.

56
Note 5. CONTRACT RECEIVABLES
The components of contract receivables, which are a component of accounts receivable, net, were as follows:
June 30, 2011 2010($000)
BilledCompleted contracts $ 65 $ 209Contracts in progress 487 2,161
552 2,370Unbilled 817 1,037
$ 1,369 $ 3,407
Note 6. INVENTORIES
The components of inventories were as follows:
Note 7. PROPERTY, PLANT AND EQUIPMENT
Property, plant and equipment at cost or valuation consist of the following:
June 30, 2011 2010($000)
Land and land improvements $ 2,043 $ 2,017Buildings and improvements 72,474 61,013Machinery and equipment 197,136 173,022Construction in progress 12,862 5,003
284,515 241,055Less accumulated depreciation (146,380) (123,118)
$ 138,135 $ 117,937
Depreciation expense was $25.7 million, $19.1 million and $14.1 million for the years ended June 30, 2011, 2010 and 2009, respectively.
Note 8. GOODWILL AND INTANGIBLE ASSETS
Goodwill represents the excess of the cost over the net tangible and identifiable intangible assets of acquired businesses. Identifiable intangible assets acquired in business combinations are recorded based upon fair market value at the date of acquisition.
June 30, 2011 2010($000)
Raw materials $ 53,108 $ 32,376Work in process 36,265 27,412Finished goods 37,057 21,609
$ 126,430 $ 81,397

57
Changes in the carrying amount of goodwill are as follows:
Year Ended June 30, 2011 2010($000)Balance – Beginning of Year $ 56,088 $ 26,141
Goodwill acquired – Photop — 30,408
Goodwill acquired - MLA 6,485 —
Foreign currency translation 1,689 (461)
Balance – End of Year $ 64,262 $ 56,088
In connection with the acquisition of MLA in December 2010, the Company recorded the excess purchase price over the net assets of the business acquired as goodwill in the accompanying Condensed Consolidated Balance Sheet based on the purchase price allocation.
In accordance with U.S. GAAP, the Company reviews the recoverability of goodwill at least annually and any time business conditions indicate a potential change in recoverability. The evaluation of impairment involves comparing the current fair value of the Company’s reporting units to the recorded value (including goodwill). The Company uses a discounted cash flow model (“DCF model”) and a market analysis to determine the current fair value of its reporting units. A number of significant assumptions and estimates are involved in estimating the forecasted cash flows used in the DCF model, including markets and market shares, sales volume and pricing, costs to produce, working capital changes and income tax rates. Management considers historical experience and all available information at the time the fair values of the reporting units are estimated. As of April 1 of fiscal years 2011 and 2010, the Company completed its annual impairment tests of its reporting units. Based on the results of these analyses, the Company’s goodwill of $64.3 million as of June 30, 2011 and $56.1 million as of June 30, 2010 was not impaired.
The gross carrying amount and accumulated amortization of the Company's intangible assets other than goodwill as of June 30, 2011 and 2010 were as follows:
June 30, 2011 June 30, 2010
($000)
Gross Carrying Amount
Accumulated Amortization
NetBookValue
Gross Carrying Amount
Accumulated Amortization
NetBookValue
Patents $ 16,009 $ (5,843) $ 10,166 $ 12,250 $ (4,451) $ 7,799Trademark 11,074 (811) 10,263 10,641 (739) 9,902Customer Lists 14,327 (6,024) 8,303 11,704 (4,410) 7,294Other 1,387 (1,387) — 1,371 (1,371) —Total $ 42,797 $ (14,065) $ 28,732 $ 35,966 $ (10,971) $ 24,995
Amortization expense recorded on the intangible assets for the years ended June 30, 2011, 2010 and 2009was $2.8 million, $1.9 million and $1.3 million, respectively. In connection with the acquisition of MLA, the Company completed its valuation of certain identifiable intangible assets during the recently completed year ended June 30, 2011. The Company recognized approximately $5.6 million of identifiable intangibles of MLA as a result of the valuation. The components of the identifiable intangible assets were $3.4 million for patents, $2.0 million forcustomer lists and $0.2 million for trade name. The patents and the customer lists are being amortized to expense over 120 months with a weighted average remaining life of approximately 96 months. The trade name was determined to have an indefinite life and is not amortized but tested annually for impairment.
In connection with the acquisitions of Marlow, Photop, and MLA, the Company acquired trade names with indefinite lives. The carrying amount of these trade names of $9.6 million is not amortized but tested annually for impairment. The Company completed its impairment test of these trade names with indefinite lives in the fourth quarter of fiscal years 2011 and 2010. Based on the results of these tests, the trade names were not impaired atneither June 30, 2011 nor 2010. Included in the gross carrying amount and accumulated amortization of the Company’s patents, customer list and other component of intangible assets and goodwill is the effect of the foreign currency translation of the portion relating to the Company’s German subsidiaries and Photop. The estimated amortization expense for existing intangible assets for each of the five succeeding years is as follows:

58
Year Ending June 30,($000)2012 $ 2,9462013 2,6662014 2,2392015 1,9832016 1,916
Note 9. DEBT
The components of debt were as follows:
June 30 2011 2010($000)Line of credit, interest at the LIBOR Rate, as defined,
Plus 0.625% to 1.50% and 0.50% to 1.25%, respectively $ 15,000 $ —Yen denominated term note, interest at the Japanese Yen Base Rate,
as defined, plus 1.49%, principal payable in full in June 2012 3,729 3,384Total debt 18,729 3,384Current portion of long-term debt 3,729 —Long-term debt $ 15,000 $ 3,384
In June 2011, the Company replaced its existing credit facility that was set to expire in October 2011. The new credit facility is a $50.0 million unsecured line of credit which, under certain conditions, may be expanded to $80.0 million. The new credit facility has a five-year term through June 2016, and has interest rate of LIBOR, as defined in the agreement, plus 0.625% to 1.50%. Additionally, the facility is subject to certain covenants, including those relating to minimum interest coverage and maximum leverage ratios. As of June 30, 2011, the Company was in compliance with all financial covenants. In conjunction with the credit facility replacement, the Company recorded approximately $0.1 million of deferred financing costs, which will be amortized over the term of the facility.
The weighted average interest rate of total borrowings was 1.7% and 2.2% for the years ended June 30, 2011and 2010, respectively. The Company had available $34.1 million and $59.1 million under its line of credit as of June 30, 2011 and 2010, respectively. The amounts available under the Company’s line of credit are reduced by outstanding letters of credit. At June 30, 2011 and 2010, total outstanding letters of credit supported by the credit facilities were $0.9 million.
At June 30, 2011 and 2010, the Company had 300 million Yen borrowed under the Yen denominated term note. Interest is at a rate equal to the Japanese Yen Base Rate, as defined in the loan agreement, plus 1.49%. The Japanese Yen Base Rate was 0.35% at June 30, 2011 and 0.90% at June 30, 2010.
The Company has a line of credit facility with a Singapore bank which permits maximum borrowings in the local currency of approximately $0.4 million for the fiscal years ended June 30, 2011 and 2010. Borrowings are payable upon demand with interest charged at the rate of 1.00% above the bank's prevailing prime lending rate. The interest rate was 5.25% at June 30, 2011 and June 30, 2010. At June 30, 2011 and 2010, there were no outstanding borrowings under this facility.

59
The aggregate annual amounts of principal payments required on the long-term debt are as follows:
Year Ending June 30,($000)2012 $ 3,7292013 $ —2014 $ —2015 $ —2016 $ 15,000Thereafter $ —
Interest and commitment fees paid during the fiscal years ended June 30, 2011, 2010 and 2009 totaled approximately $0.2 million each year.
Note 10. INCOME TAXES
The components of income tax expense (benefit) were as follows:
Year Ended June 30, 2011 2010 2009($000)Current:
Federal $ 4,566 $ 5,031 $ 5,045State 1,050 219 1,299Foreign 15,196 8,283 4,914
Total Current $ 20,812 $ 13,533 $ 11,258($000)Deferred:
Federal $ 868 $ (978) $ (3,837)State (357) (509) (3)Foreign (2,579) 536 (11)
Total Deferred $ (2,068) $ (951) $ (3,851)Total Income Tax Expense $ 18,744 $ 12,582 $ 7,407
Principal items comprising deferred income taxes were as follows:
June 30, 2011 2010($000)Deferred income tax assets Inventory capitalization $ 4,297 $ 1,864Non-deductible accruals 1,583 1,493Accrued employee benefits 6,163 4,079Net-operating loss and credit carryforwards 3,619 4,149Share-based compensation expense 9,092 7,292Other 269 609Valuation allowance (896) (1,176)Total deferred income tax assets $ 24,127 $ 18,310Deferred income tax liabilitiesTax over book accumulated depreciation $ (12,113) $ (8,336)Intangible assets (8,872) (6,854)Other (1,706) (987)Total deferred income tax liabilities $ (22,691) $ (16,177)Net deferred income taxes $ 1,436 $ 2,133

60
The reconciliation of income tax expense at the statutory federal rate to the reported income tax expense is as follows:
Year Ended June 30, 2011 % 2010 % 2009 %($000)Taxes at statutory rate $ 35,617 35 $ 17,961 35 $ 16,192 35Increase (decrease) in taxes resulting from:State income taxes – net of federal benefit 312 — (180) — 907 2Taxes on non U.S. earnings (14,004) (14) (6,225) (12) (4,061) (9)Settlement of unrecognized tax benefits — — — — (4,731) (10)Reversal of foreign tax credit valuation allowance — — — — (1,107) (2)Research and manufacturing incentive deductions (2,515) (2) (318) (1) (383) (1)Other (666) (1) 1,344 3 590 1
$ 18,744 18 $ 12,582 25 $ 7,407 16
During the year ended June 30, 2009, the Company adopted a tax planning strategy which enabled the utilization of foreign tax credit carryforwards. As a result, a deferred tax valuation allowance of $1.1 million was reversed to income and the Company recorded the benefit of foreign tax credits generated during the year ended June 30, 2009. During the fiscal year ended June 30, 2011 and 2010, $0.6 million and $0.5 million, respectively, offoreign tax credit carryforwards were utilized to offset current income taxes payable. Remaining foreign tax creditcarryforwards of $0.9 million expire in 2019.
During the fiscal years ended June 30, 2011, 2010, and 2009, net cash paid by the Company for income taxes was $22.7 million, $5.8 million, and $8.9 million, respectively.
Earnings before income taxes of our non-U.S. operations for June 30, 2011, 2010 and 2009 were $85.4million, $41.4 million and $22.4 million, respectively. The Company has not recorded deferred income taxes applicable to undistributed earnings of foreign subsidiaries that are indefinitely reinvested outside the U.S. If the earnings of such foreign subsidiaries were not indefinitely reinvested, an additional deferred tax liability of approximately $83 million and $57 million would have been required as of June 30, 2011 and 2010, respectively. It is the Company’s intention to permanently reinvest undistributed earnings of its foreign subsidiaries; therefore, no provision has been made for future income taxes on the undistributed earnings of foreign subsidiaries, as they are considered indefinitely reinvested.
The Company’s Vietnam subsidiary operated under a tax holiday and did not pay income taxes throughfiscal year 2010. For the year ended June 30, 2011, Vietnam’s income tax rate was approximately 5%. Effective July 1, 2011, Vietnam’s income tax rate was approximately 7.5%.
The sources of differences resulting in deferred income tax expense (benefit) from continuing operations and the related tax effect of each were as follows:
Year Ended June 30, 2011 2010 2009($000)Depreciation and amortization $ 2,754 $ (818) $ 1,433Inventory capitalization (2,661) 985 (680)Net operating loss and credit carryforwards net of valuation allowances 509 744 (3,658)
Share-based compensation expense (1,801) (2,084) (1,241)Other (869) 222 295
$ (2,068) $ (951) $ (3,851)
As of June 30, 2011, the Company had foreign operating loss carryforwards totaling $3.7 million. Of that amount, $2.8 million expire between 2013 and 2019; the remaining $0.9 million do not expire. The Company hasrecorded a valuation allowance against the majority of these foreign operating loss carryforwards. As of June 30, 2011, the Company had $1.3 million of state net operating loss carryforwards expiring in 2028 and 2029. For thefiscal year ended June 30, 2010, the Company did not utilize state net operating loss carryforwards. For the fiscal yearended June 30, 2011 and 2009, the Company utilized $1.6 million and $0.7 million, respectively, of state net operating losses to reduce current taxable income.

61
In July 2008, the Internal Revenue Service completed its examination of the Company’s income tax returns for fiscal years 2005 and 2006. As a result, during the fiscal year ended June 30, 2009 the Company reversed certain unrecognized tax benefits from those fiscal years and recognized an income tax benefit of approximately $4.7 million.
Changes in the liability for unrecognized tax benefits for the fiscal years ended June 30, 2011, 2010 and 2009 were as follows:
($000) 2011 2010 2009Balance at Beginning of Year $ 4,199 $ 2,575 $ 7,473Increases in current year tax positions 1,716 1,705 567Increases in prior year tax positions — — —Decreases in prior year tax positions — — —Settlements — — (5,449)Expiration of statute of limitations (1,171) (81) (16)Balance at End of Year $ 4,744 S 4,199 $ 2,575
The Company classifies all estimated and actual interest and penalties as income tax expense. During the years ended June 30, 2011 and 2010, the Company recognized a $0.1 million benefit and a $0.1 million expense,respectively, of interest and penalties within income tax expense. The Company had $0.2 million and $0.3 million of interest and penalties accrued at June 30, 2011 and 2010, respectively. The Company has classified the uncertain tax positions as non-current income tax liabilities as the amounts are not expected to be paid within one year. Including tax positions for which the Company determined that the tax position would not meet the more-likely-than-not recognition threshold upon examination by the tax authorities based upon the technical merits of the position, the total estimated unrecognized tax benefit that, if recognized, would affect our effective tax rate was approximately $3.7million at June 30, 2011. The Company expects a decrease of approximately $0.8 million of unrecognized tax benefits during the next twelve months.
Fiscal years 2008 to 2011 remain open to examination by the United States Internal Revenue Service, fiscal years 2007 to 2011 remain open to examination by certain state jurisdictions, and fiscal years 2005 to 2011 remain open to examination by certain foreign taxing jurisdictions. As of June 30, 2011, the Company’s fiscal year 2009 federal income tax return is under examination by the United States Internal Revenue Service and the Company’s fiscal years 2007, 2008, and 2009 California state income tax returns are under examination by the State of California’s Franchise Tax Board.

62
Note 11. EARNINGS PER SHARE
The following table sets forth the computation of earnings per share for the periods indicated. Weighted average shares issuable upon the exercise of stock options that were not included in the calculation were immaterial for fiscal year ended June 30, 2011, and were 998,000 and 596,000, respectively, for the fiscal years ended June 30, 2010 and 2009, because they were anti-dilutive.
Year Ending June 30, 2011 2010 2009($000 except per share)Earnings attributable to II-VI Incorporated $ 82,682 $ 38,577 $ 38,858Loss from discontinued operation — — (2,077)Net earnings attributable to II-VI Incorporated 82,682 38,577 36,781Divided by:
Weighted average shares 62,211 60,304 59,334
Basic earnings attributable to II-VI Incorporatedper common share $ 1.33 $ 0.64 $ 0.66
Basic loss from discontinued operation per common share $ — $ — $ (0.04)
Basic earnings attributable to II-VI Incorporated per common share $ 1.33 $ 0.64 $ 0.62
Earnings attributable to II-VI Incorporated $ 82,682 $ 38,577 $ 38,858Loss from discontinued operation — — (2,077)Net earnings attributable to II-VI Incorporated 82,682 38,577 36,781Divided by:
Weighted average shares 62,211 60,304 59,334Dilutive effect of Common Stock equivalents 1,401 1,200 830Diluted weighted average common shares 63,612 61,504 60,164
Diluted earnings attributable to II-VI Incorporatedper common share $ 1.30 $ 0.63 $ 0.65
Diluted loss from discontinued operation per common share $ — $ — $ (0.04)
Diluted earnings attributable to II-VI Incorporatedper common share $ 1.30 $ 0.63 $ 0.61
Note 12. OPERATING LEASES
The Company leases certain property under operating leases that expire at various dates through the year ending June 30, 2056. Future rental commitments applicable to the operating leases at June 30, 2011 are as follows:
Year Ending June 30,($000)2012 $ 6,2152013 5,3012014 4,7182015 4,3242016 3,174Thereafter 18,554
Rent expense was approximately $5.6 million, $4.1 million and $3.2 million for the fiscal years ended June 30, 2011, 2010 and 2009, respectively.
Note 13. SHARE-BASED COMPENSATION PLANS
The Board of Directors adopted the II-VI Incorporated 2009 Omnibus Incentive Plan (the “Plan”). The Plan was approved by the shareholders of the Company in November 2009. The Plan provides for the grant of non-qualified stock options, stock appreciation rights, restricted shares, deferred shares and performance units to employees, officers, directors and consultants of the Company. The maximum number of shares of the Company’s
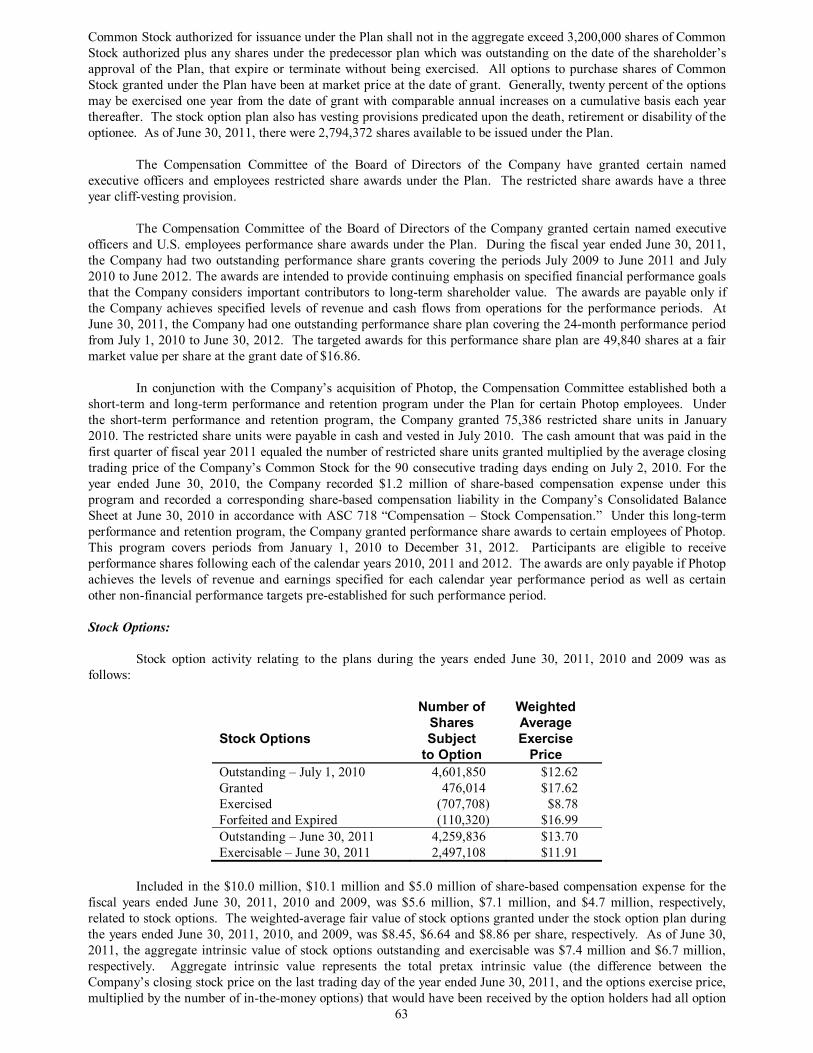
63
Common Stock authorized for issuance under the Plan shall not in the aggregate exceed 3,200,000 shares of Common Stock authorized plus any shares under the predecessor plan which was outstanding on the date of the shareholder’s approval of the Plan, that expire or terminate without being exercised. All options to purchase shares of Common Stock granted under the Plan have been at market price at the date of grant. Generally, twenty percent of the options may be exercised one year from the date of grant with comparable annual increases on a cumulative basis each year thereafter. The stock option plan also has vesting provisions predicated upon the death, retirement or disability of the optionee. As of June 30, 2011, there were 2,794,372 shares available to be issued under the Plan.
The Compensation Committee of the Board of Directors of the Company have granted certain named executive officers and employees restricted share awards under the Plan. The restricted share awards have a three year cliff-vesting provision.
The Compensation Committee of the Board of Directors of the Company granted certain named executive officers and U.S. employees performance share awards under the Plan. During the fiscal year ended June 30, 2011,the Company had two outstanding performance share grants covering the periods July 2009 to June 2011 and July2010 to June 2012. The awards are intended to provide continuing emphasis on specified financial performance goals that the Company considers important contributors to long-term shareholder value. The awards are payable only if the Company achieves specified levels of revenue and cash flows from operations for the performance periods. At June 30, 2011, the Company had one outstanding performance share plan covering the 24-month performance period from July 1, 2010 to June 30, 2012. The targeted awards for this performance share plan are 49,840 shares at a fair market value per share at the grant date of $16.86.
In conjunction with the Company’s acquisition of Photop, the Compensation Committee established both a short-term and long-term performance and retention program under the Plan for certain Photop employees. Under the short-term performance and retention program, the Company granted 75,386 restricted share units in January2010. The restricted share units were payable in cash and vested in July 2010. The cash amount that was paid in thefirst quarter of fiscal year 2011 equaled the number of restricted share units granted multiplied by the average closing trading price of the Company’s Common Stock for the 90 consecutive trading days ending on July 2, 2010. For the year ended June 30, 2010, the Company recorded $1.2 million of share-based compensation expense under this program and recorded a corresponding share-based compensation liability in the Company’s Consolidated Balance Sheet at June 30, 2010 in accordance with ASC 718 “Compensation – Stock Compensation.” Under this long-term performance and retention program, the Company granted performance share awards to certain employees of Photop. This program covers periods from January 1, 2010 to December 31, 2012. Participants are eligible to receive performance shares following each of the calendar years 2010, 2011 and 2012. The awards are only payable if Photopachieves the levels of revenue and earnings specified for each calendar year performance period as well as certain other non-financial performance targets pre-established for such performance period.
Stock Options:
Stock option activity relating to the plans during the years ended June 30, 2011, 2010 and 2009 was as follows:
Stock Options
Number ofShares Subject
to Option
Weighted AverageExercise
PriceOutstanding – July 1, 2010 4,601,850 $12.62Granted 476,014 $17.62Exercised (707,708) $8.78Forfeited and Expired (110,320) $16.99Outstanding – June 30, 2011 4,259,836 $13.70Exercisable – June 30, 2011 2,497,108 $11.91
Included in the $10.0 million, $10.1 million and $5.0 million of share-based compensation expense for the fiscal years ended June 30, 2011, 2010 and 2009, was $5.6 million, $7.1 million, and $4.7 million, respectively, related to stock options. The weighted-average fair value of stock options granted under the stock option plan during the years ended June 30, 2011, 2010, and 2009, was $8.45, $6.64 and $8.86 per share, respectively. As of June 30, 2011, the aggregate intrinsic value of stock options outstanding and exercisable was $7.4 million and $6.7 million, respectively. Aggregate intrinsic value represents the total pretax intrinsic value (the difference between the Company’s closing stock price on the last trading day of the year ended June 30, 2011, and the options exercise price, multiplied by the number of in-the-money options) that would have been received by the option holders had all option

64
holders exercised their options on June 30, 2011. This amount varies based on the fair market value of the Company’s stock. The total intrinsic value of stock options exercised during the years ended June 30, 2011, 2010, and 2009 was $6.1 million, $2.6 million, and $1.8 million, respectively. As of June 30, 2011, total unrecognized compensation cost related to non-vested stock option awards was $9.7 million. This cost is expected to be recognized over a weighted average period of approximately three years. Outstanding and exercisable stock options at June 30, 2011 were as follows:
Options Outstanding Options Exercisable
Range ofExercise Prices
Number ofShares
WeightedAverage
RemainingContractual
Term (Years)
WeightedAverageExercise
PriceNumber of
Shares
WeightedAverage
RemainingContractual
Term (Years)
WeightedAverageExercise
Price$3.23 - $5.60 245,000 1.51 $3.84 245,000 1.51 $3.84$5.75 - $8.80 516,446 3.28 $8.28 516,446 3.28 $8.28$8.92 - $13.89 1,955,320 6.04 $11.50 1,148,220 4.94 $11.07$14.01 - $21.62 841,294 7.82 $16.75 279,900 6.45 $16.38$23.03 - $27.18 701,776 7.01 $23.58 307,542 6.65 $23.49
4,259,836 5.95 $13.70 2,497,108 4.64 $11.91
Restricted Share Awards:
Restricted share award activity relating to the plans during the year ended June 30, 2011, was as follows:
Restricted Share AwardsNumber of
SharesWeighted Average
Grant Date Fair ValueNonvested at June 30, 2010 34,450 $12.08Granted 239,702 $17.63Vested (15,800) $16.86Forfeited (5,250) $17.89Nonvested – June 30, 2011 253,102 $16.92
Included in the $10.0 million, $10.1 million of share-based compensation expense for the fiscal years ended June 30, 2011 and 2010 was $1.3 million and $0.1 million, respectively, related to restricted share awards. There was no share-based compensation incurred in fiscal year 2009 related to restricted share awards. As of June 30, 2011, total unrecognized compensation cost related to non-vested restricted share awards was $3.1 million. This cost is expected to be recognized over a weighted average period of approximately two years. The restricted sharescompensation expense was calculated based on the number of shares expected to be earned multiplied by the stock price at the date of grant and is being recognized over the vesting period. The total fair value of the restricted stock granted during the years ended June 30, 2011 and 2010, was $4.2 million and $0.4 million, respectively. The total fair value of restricted stock vested during the year ended June 30, 2011 was $0.3 million.
Performance Share Awards:
Performance share award activity relating to the plans during the year ended June 30, 2011, was as follows:
Performance Share AwardsNumber of
SharesWeighted Average
Grant Date Fair ValueNonvested at June 30, 2010 388,720 $15.21Granted 85,390 $14.87Vested (213,608) $13.25Forfeited (8,936) $15.43Nonvested – June 30, 2011 251,566 $16.75
Included in the $10.0 million, $10.1 million and $5.0 million of share-based compensation expense for the fiscal years ended June 30, 2011, 2010 and 2009, was $3.1 million, $2.9 million and $0.3 million, respectively,related to performance share awards. As of June 30, 2011, total unrecognized compensation cost related to non-vested performance share awards was $3.9 million. This cost is expected to be recognized over a weighted average

65
period of approximately one year. The performance share compensation expense was calculated based on the estimated number of shares expected to be earned multiplied by the stock price at the date of grant and is being recognized over the vesting period. The total fair value of performance shares granted during the years ended June 30, 2011 and 2010, was $1.3 million and $5.9 million, respectively. The total fair value of performance stock vested during the year ended June 30, 2011 was $2.8 million.
Note 14. SEGMENT AND GEOGRAPHIC REPORTING
The Company reports its business segments using the “management approach” model for segment reporting. The Company determines its reportable business segments based on the way the chief operating decision maker organizes business segments within the Company for making operating decisions and assessing performance.
The Company has four reportable segments. The Company’s chief operating decision maker receives and reviews financial information in this format. The Company evaluates business segment performance based upon reported business segment earnings, which is defined as earnings before income taxes, interest and other income or expense. The segments are managed separately due to the production requirements and facilities that are unique to each segment. The Company has the following reportable segments at June 30, 2011: (i) Infrared Optics, which is theCompany’s infrared optics and material products businesses, HIGHYAG Lasertechnologie GmbH (“HIGHYAG”) and remaining corporate activities, primarily corporate assets and capital expenditures; (ii) Near-Infrared Optics, which is the Company’s VLOC Incorporated subsidiary, the China and Vietnam near-infrared operations, and Photop Technologies, Inc. (“Photop”); (iii) Military & Materials, which is the Company’s Exotic Electro-Optics, Inc. (“EEO”) subsidiary, Pacific Rare Specialty Metals & Chemicals, Inc. subsidiary (“PRM”), and the Max Levy Autograph, Inc. subsidiary (“MLA”); and (iv) the Compound Semiconductor Group, which is the aggregation of the Company’s Marlow Industries, Inc. (“Marlow”) subsidiary, the Wide Bandgap Materials Group (“WBG”) and the Worldwide Materials Group (“WMG”); WMG is responsible for the corporate research and development activities.
The Infrared Optics segment is divided into geographic locations in the U.S., Singapore, China, Germany, Switzerland, Japan, Belgium, the U.K and Italy. The Infrared Optics segment is directed by a general manager, while each geographic location is also directed by a general manager, and is further divided into production and administrative units that are directed by managers. The Infrared Optics segment designs, manufactures and markets optical and electro-optical components and materials sold under the II-VI brand name and used primarily in high-power CO2 lasers. The Infrared Optics segment also manufactures fiber-delivered beam delivery systems and processing tools for industrial lasers sold under the HIGHYAG brand name.
The Near-Infrared Optics segment is located in the U.S., China, Vietnam, Germany, Japan, the U.K, Italy,and Hong Kong. The Near-Infrared Optics segment is directed by a Corporate Executive Vice President. The Near-Infrared Optics segment is further divided into production and administrative units that are directed by managers. The Near-Infrared Optics segment manufactures crystal materials, optics, microchip lasers and optoelectronic modules for use in optical communication networks and other diverse consumer and commercial applications soldunder the Photop brand name. The Near-Infrared Optics segment also designs, manufactures and markets near-infrared and visible-light products for industrial, scientific, military and medical instruments and laser gain material and products for solid-state YAG lasers, YLF lasers and UV Filter components and sold under the VLOC brand name.
The Military & Materials segment is located in the U.S. and the Philippines. The Military & Materials segment is directed by a Corporate Vice President, while each geographic location is directed by a general manager. The Military & Materials segment is further divided into production and administrative units that are directed by managers. The Military & Materials segment designs, manufactures and markets infrared products for military applications under the EEO brand name, refines specialty metals, primarily selenium and tellurium under the PRM brand name, and manufactures and markets micro-fine conductive mesh patterns for optical, mechanical, and ceramic components for applications under the MLA brand name.
The Compound Semiconductor Group is located in the U.S., Japan, China, Vietnam and Germany. The Compound Semiconductor Group segment is directed by a Corporate Executive Vice President. In the Compound Semiconductor Group segment, Marlow designs and manufactures thermoelectric cooling and power generation solutions for use in defense and space, telecommunications, medical, consumer and industrial markets. The WBG Group manufactures and markets single crystal silicon carbide substrates for use in solid-state lighting, wireless infrastructure, radio frequency (“RF”) electronics and power switching industries. The WMG Group directs the corporate research and development initiatives.

66
The accounting policies of the segments are the same as those of the Company. All of the Company’s corporate expenses are allocated to the segments. The Company evaluates segment performance based upon reported segment earnings, which is defined as earnings before income taxes, interest and other income or expense. Inter-segment sales and transfers have been eliminated.
In December 2010, the Company completed its acquisition of MLA. See “Note 4. Acquisitions.” MLA is combined with the Company’s Military & Materials segment for financial reporting purposes. Segment earnings for the Military & Materials segment include the operating results of MLA since the acquisition date for the period ending June 30, 2011.
In January 2010, the Company completed its acquisition of Photop. See “Note 4. Acquisitions.” Photop is combined with the Company’s Near-Infrared Optics segment for financial reporting purposes. Segment earnings for the Near-Infrared Optics segment include the operating results of Photop since the acquisition date for the period ending June 30, 2010.
The Company sold its x-ray and gamma-ray radiation business, eV PRODUCTS, Inc., in June 2009. This business operated within the Compound Semiconductor Group. Segment information for the fiscal year 2009 periodpresented herein exclude eV PRODUCTS as this business was accounted for as a discontinued operation.
The following tables summarize selected financial information of the Company’s operations by segment:
InfraredOptics
Near-InfraredOptics
Military &Materials
CompoundSemiconductor
Group Eliminations Total($000)2011Revenues $ 180,827 $ 159,803 $ 83,426 $ 78,745 $ — $ 502,801Inter-segment revenues 3,282 299 6,520 5,015 (15,116) —Segment earnings 46,187 24,113 15,255 13,220 — 98,775Interest expense — — — — — (103)Other income, net — — — — — 3,090Earnings from continuing
operations before income taxes — — — — — 101,762Depreciation and amortization 8,268 13,710 3,079 3,389 — 28,446Segment assets 264,052 205,897 84,371 92,882 — 647,202Expenditures for property,
plant and equipment 9,065 16,795 5,414 9,585 — 40,859Equity investments — — — 15,458 — 15,458Goodwill 10,038 33,511 10,399 10,314 — 64,262

67
InfraredOptics
Near-InfraredOptics
Military &Materials
CompoundSemiconductor
Group Eliminations Total($000)2010Revenues $ 135,063 $ 88,499 $ 65,674 $ 55,855 $ — $ 345,091Inter-segment revenues 2,021 303 2,137 4,209 (8,670) —Segment earnings 24,582 12,304 9,307 5,488 51,681Interest expense — — — — — (87)Other expense, net — — — — — (277)Earnings from continuing
operations before income taxes — — — — — 51,317Depreciation and amortization 8,337 7,684 2,007 3,011 — 21,039Segment assets 216,385 174,449 51,097 67,050 — 508,981Expenditures for property,
plant and equipment 1,817 4,115 4,706 3,199 — 13,837Equity investments — — — 15,269 — 15,269Goodwill 9,525 32,335 3,914 10,314 — 56,088
InfraredOptics
Near-InfraredOptics
Military &Materials
CompoundSemiconductor
Group Eliminations Total($000)2009Revenues $ 130,949 $ 45,559 $ 57,016 $ 58,698 $ — $ 292,222Inter-segment revenues 1,482 225 2,217 4,758 (8,682) —Segment earnings 28,036 7,111 6,525 6,173 — 47,845Interest expense — — — — — (178)Other expense, net — — — — — (1,349)Earnings from continuing
operations before income taxes — — — — — 46,318Depreciation and amortization 7,895 2,854 1,653 2,952 — 15,354Expenditures for property,
plant and equipment 6,178 1,876 4,325 3,178 — 15,557
Geographic information for revenues from thecountry of origin, and long-lived assets from the country of origin, which include property, plant and equipment, goodwill and other intangibles, net of related depreciation and amortization, investments and other assets, is as follows:
RevenuesYear Ended June 30, 2011 2010 2009($000)United States $ 193,344 $ 172,466 $ 177,916Non-United States
China 128,101 53,821 6,045Germany 41,373 31,227 30,404Vietnam 35,675 15,402 15,093Philippines 34,799 24,940 21,285Japan 33,561 19,543 19,253Switzerland 10,699 7,425 7,691Singapore 7,542 5,751 4,427Italy 7,421 5,277 1,444United Kingdom 5,167 4,827 3,888Belgium 5,119 4,412 4,776
Total Non-United States 309,457 172,625 114,306$ 502,801 $ 345,091 $ $292,222

68
Long-Lived AssetsJune 30, 2011 2010($000)United States $ 128,733 $ 108,650Non-United States
China 91,181 84,803Netherlands 8,935 9,285Vietnam 7,990 5,525Germany 5,391 4,893Philippines 4,420 3,592Singapore 3,012 2,000Switzerland 1,291 1,384Belgium 273 274Japan 406 270Italy 16 17United Kingdom 14 18
Total Non - United States 122,929 112,061$ 251,662 $ 220,711
Note 15. FAIR VALUE OF FINANCIAL INSTRUMENTS
Effective July 1, 2008, the Company adopted ASC 820 “Fair Value Measurements and Disclosures,” which defines fair value, establishes a framework for measuring fair value and expands disclosures about fair value measurements. Fair value is defined as the exchange price that would be received for an asset or paid to transfer (an exit price) in the principal or most advantageous markets for the asset and liability in an orderly transaction between market participants at the measurement date. The Company estimates fair value of its financial instruments utilizing an established three-level hierarchy. The hierarchy is based upon the transparency of inputs to the valuation of an asset or liability as of the measurement date as follows:
Level 1 – Valuation is based upon unadjusted quoted prices for identical assets or liabilities in active markets.Level 2 – Valuation is based upon quoted prices for similar assets and liabilities in active markets, or other inputs that are observable for the asset or liability, either directly or indirectly, for substantially the full term of the financial instruments.Level 3 – Valuation is based upon other unobservable inputs that are significant to the fair value measurements.
The classification of fair value measurements within the hierarchy is based upon the lowest level of input that is significant to the measurement. At June 30, 2011, the Company had foreign currency forward contracts recorded at fair value. The fair values of these instruments were measured using valuations based upon quoted prices for similar assets and liabilities in active markets (Level 2) and are valued by reference to similar financial instruments, adjusted for creditrisk and restrictions and other terms specific to the contracts. At June 30, 2011, the Company had contingent earnout arrangements recorded at fair value related to the acquisition of Photop. The fair value of the earnout arrangements werebased on significant inputs not observable in the market and represents a Level 3 measurement as defined in ASC 820. The Company uses the income approach in measuring the fair value of the earnout arrangements, which included a 0.93% discount rate and an assumed 100% probability of achieving the financial targets under the earnout arrangements.During the fiscal year ended June 30, 2011, the Company paid $6.0 million of these earnout arrangements. The fair value remeasurement of the earnout arrangements for the period ending June 30, 2011 was insignificant. The following table provides a summary by level of the fair value of financial instruments that are measured on a recurring basis as of June 30, 2011 and June 30, 2010 ($000):

69
Fair Value Measurements at June 30, 2011 Using:
June 30, 2011
Quoted Prices in
Active Markets for
Identical Assets
(Level 1)
Significant Other
Observable Inputs
(Level 2)
Significant Unobservable
Inputs (Level 3)
Liabilities:Contingent earnout arrangement $ 5,941 $ — $ — $ 5,941Foreign currency forward contracts $ 174 $ — $ 174 $ —
Fair Value Measurements at June 30, 2010 Using:
June 30, 2010
Quoted Prices in
Active Markets for
Identical Assets
(Level 1)
Significant Other
Observable Inputs
(Level 2)
Significant Unobservable
Inputs (Level 3)
Liabilities:Contingent earnout arrangements $ 11,900 $ — $ — $ 11,900Foreign currency forward contracts $ 228 $ — $ 228 $ —
The carrying value of Cash and cash equivalents, Accounts receivable and Accounts payable approximate fair value because of the short-term maturity of those instruments. The Company’s borrowing are at variable interest rates and accordingly their carrying amounts approximate fair value.
Note 16. DERIVATIVE INSTRUMENTS
The Company, from time to time, purchases foreign currency forward exchange contracts, primarily in Japanese Yen, that permit it to sell specified amounts of these foreign currencies expected to be received from its export sales for pre-established U.S. dollar amounts at specified dates. These contracts are entered into to limit transactional exposure to changes in currency exchange rates of export sales transactions in which settlement will occur in future periods and which otherwise would expose the Company, on the basis of its aggregate net cash flows in respective currencies, to foreign currency risk.
The Company has recorded the difference in the fair market value and the contract value of these contracts on the Company’s Consolidated Statement of Earnings. These contracts have a total contract value of $7.8 million and $7.1 million at June 30, 2011 and 2010, respectively. As of June 30, 2011, these forward contracts had expiration dates ranging from July 5, 2011 through October 4, 2011 with Japanese Yen denominations ranging from 150 million Yen to 170 million Yen. The Company does not account for these contracts as hedges as defined by U.S. GAAP and records the change in the fair value of these contracts in the results of operations as they occur. The fair value measurement takes into consideration foreign currency rates and the current creditworthiness of the counterparties to these contracts, as applicable, and is based upon quoted prices for similar assets and liabilities in active markets, or other inputs that are observable for the asset or liability, either directly or indirectly, for substantially the full term of the financial instruments and thus represents a Level 2 measurement as defined in ASC 820 “Fair Value Measurements and Disclosures.” These contracts are recorded in Other accrued liabilities in the Company’s Consolidated Balance Sheets. The change in the fair value of these contracts for the periods ending June 30, 2011 and 2010 was insignificant.
Note 17. EMPLOYEE BENEFIT PLANS
Eligible U.S. employees of the Company participate in a profit sharing retirement plan. Contributions accrued for the plan are made at the discretion of the Company's board of directors and were $4.3 million, $2.9million and $3.0 million for the years ended June 30, 2011, 2010 and 2009, respectively.
The Company has an employee stock purchase plan available for employees who have completed six months of continuous employment with the Company. The employee may purchase the Company’s Common Stock at 5% below the prevailing market price. The amount of shares which may be bought by an employee during each fiscal

70
year is limited to 10% of the employee's base pay. This plan, as amended, limits the number of shares of Common Stock available for purchase to 1,600,000 shares. There were 611,784 and 627,328 shares of Common Stockavailable for purchase under the plan at June 30, 2011 and 2010, respectively.
As a requirement of a collective bargaining agreement, PRM maintains a defined benefit plan for substantially all of its employees. The plan provides for retirement benefits based on a certain percentage of the latest monthly salary of an employee per year of service. The pension liability was $0.7 million as of June 30, 2011 and 2010.
The Company has no program for post-retirement health and welfare benefits.
The II-VI Incorporated Deferred Compensation Plan (the “Compensation Plan”) is designed to allow officers and key employees of the Company to defer receipt of compensation into a trust fund for retirement purposes. Under the Compensation Plan, eligible participants can elect to defer up to 100% of discretionary incentive compensation, performance shares and restricted shares, into the Compensation Plan. The Compensation Plan is a nonqualified, defined contribution employees' retirement plan. At the Company's discretion, the Compensation Plan may be funded by the Company making contributions based on compensation deferrals, matching contributions and discretionary contributions. Compensation deferrals will be based on an election by the participant to defer a percentage of compensation under the Compensation Plan. All assets in the Compensation Plan are subject to claims of the Company's creditors until such amounts are paid to the Compensation Plan participants. Employees of the Company made contributions to the Compensation Plan in the amount of approximately $2.9 million, $1.0 million and $0.2million for the years ended June 30, 2011, 2010, and 2009, respectively. There were no employer contributions made to the Compensation Plan for the years ended June 30, 2011, 2010 and 2009.
Note 18. COMMITMENTS AND CONTINGENCIES
The Company has purchase commitments for materials and supplies as part of the ordinary conduct of business. A few of the commitments are long-term and are based on minimum purchase requirements. Due to the proprietary nature of some of the Company’s materials and processes, certain contracts may contain penalty provisions for early termination. The Company does not believe that a significant amount of penalties is reasonably likely to be incurred under these commitments based upon historical experience and current expectation. In addition, the Company has payment commitments relating to its acquisitions of HIGHYAG and Photop. Future commitments are as follows:
Year Ending June 30,($000)2012 $ 20,0512013 4,6262014 1,4012015 62
Note 19. STOCK REPURCHASE PROGRAM
On October 23, 2008, the Board of Directors authorized the Company to purchase up to 1,000,000 shares of its Common Stock. The repurchase program called for shares to be purchased in the open market or in private transactions from time to time. Shares purchased by the Company are retained as treasury stock and available for general corporate purposes. During the quarter ended December 31, 2008, the Company completed this repurchase program by purchasing 1,000,000 shares of its Common Stock for $12.9 million.
Note 20. SUBSEQUENT EVENTS
In July 2011, the Company acquired all of the outstanding shares of Aegis Lightwave, Inc. (“Aegis”), a privately held company based in Woburn, Massachusetts with additional locations in New Jersey and Australia, for approximately $52.0 million plus working capital and debt adjustments of approximately $2.5 million. Aegis supplies tunable optical devices required for high speed optical networks that provide the bandwidth expansion necessary for increasing Internettraffic. The final purchase price will be subject to customary closing adjustments, including working capital adjustments. The results for the fiscal year ended June 30, 2011 do not include any operating results of Aegis, but do include certain transaction-related expenses attributable to the acquisition of Aegis of approximately $0.8 million, pre-tax, which are required to be expensed under current accounting standards. Due to the close proximity of this acquisition subsequent to the year ended June 30, 2011, the Company was unable to make certain disclosures as required by U.S. GAAP related to

71
this acquisition as the purchase price allocation and related accounting for Aegis was not substantially complete as of the filing date of this Form 10-K.
QUARTERLY FINANCIAL DATA (unaudited)
FISCAL 2011
QUARTER ENDEDSeptember 30,
2010December 31,
2010March 31,
2011June 30,
2011($000 except per share data)Net revenues $ 120,134 $ 120,887 $ 129,997 $ 131,783Cost of goods sold,
including contract activity 70,898 70,851 77,149 77,004Internal research and development 3,846 3,357 3,892 4,984Selling, general and administrative 22,729 21,991 23,286 24,039Interest expense 30 25 34 14Other expense (income) – net (2,062) 460 (1,431) (57)Earnings from continuing operations
before income taxes 24,693 24,203 27,067 25,799Income taxes 6,292 4,948 3,871 3,633Net Earnings $ 18,401 $ 19,255 $ 23,196 $ 22,166Net Earnings Attributable to
Noncontrolling Interests $ 34 $ 98 $ 77 $ 127Net Earnings Attributable to
II-VI Incorporated $ 18,367 $ 19,157 $ 23,119 $ 22,039Net Earnings Attributable to II-VI Incorporated: Basic earnings per share: $ 0.30 $ 0.31 $ 0.37 $ 0.35
Net Earnings Attributable to II-VI Incorporated: Diluted earnings per share: $ 0.29 $ 0.30 $ 0.36 $ 0.34

72
FISCAL 2010
QUARTER ENDEDSeptember 30,
2009December 31,
2009March 31,
2010June 30,
2010($000 except per share data)Net revenues $ 65,538 $ 68,785 $ 97,531 $ 113,237Cost of goods sold,
including contract activity 39,668 42,379 60,779 67,666Internal research and development 2,435 2,287 3,238 3,846Selling, general and administrative 14,939 16,921 18,985 20,267Interest expense 24 19 1 43Other expense (income) – net 73 (205) 82 327Earnings from continuing operations
before income taxes 8,399 7,384 14,446 21,088Income taxes 2,100 1,400 4,208 4,874Net Earnings $ 6,299 $ 5,984 $ 10,238 $ 16,214Net Earnings (Loss) Attributable to
Noncontrolling Interests $ (7) $ 3 $ (75) $ 237Net Earnings Attributable to
II-VI Incorporated $ 6,306 $ 5,981 $ 10,313 $ 15,977Net Earnings Attributable to II-VI Incorporated: Basic earnings per share: $ 0.11 $ 0.10 $ 0.17 $ 0.26
Net Earnings Attributable to II-VI Incorporated: Diluted earnings per share: $ 0.11 $ 0.10 $ 0.17 $ 0.25

73
SCHEDULE II
II-VI INCORPORATED AND SUBSIDIARIES
VALUATION AND QUALIFYING ACCOUNTSYEARS ENDED JUNE 30, 2011, 2010, AND 2009
(IN THOUSANDS OF DOLLARS)
Additions
Balance at Beginning
of Year
Charged to
Expense
Charged to Other Accounts
Deduction from Reserves
Balance at End of Year
YEAR ENDED JUNE 30, 2011:Allowance for doubtful accounts $ 1,081 $ (38) $ (17) $ (260)2 $ 766Warranty reserves $ 1,037 $ 1,707 $ — $ (1,557) $ 1,187
YEAR ENDED JUNE 30, 2010:Allowance for doubtful accounts $ 1,029 $ 115 $ 1021 $ (165)2 $ 1,081Warranty reserves $ 861 $ 1,612 $ (83) 3 $ (1,353) $ 1,037
YEAR ENDED JUNE 30, 2009:Allowance for doubtful accounts $ 1,170 $ (312) $ 1713 $ — $ 1,029Warranty reserves $ 777 $ 1,145 $ 1703 $ (1,231) $ 861
1 Primarily relates to allowance for doubtful accounts from the acquisition of Photop, ($297) offset by foreign currency translations and transfers to other accounts.
2 Primarily relates to write-offs of accounts receivable.3 Primarily relates to allowance for doubtful accounts and warranty reserve transferred from eV PRODUCTS Inc. as
the Company retained the accounts receivable, related allowance for doubtful accounts and warranty obligation as part of the sale of eV PRODUCTS Inc.

74
ITEM 9. CHANGES IN AND DISAGREEMENTS WITH ACCOUNTANTS ON ACCOUNTING AND FINANCIAL DISCLOSURE
None.
ITEM 9A. CONTROLS AND PROCEDURES
Evaluation of Disclosure Controls and Procedures
The Company’s management evaluated, with the participation of Francis J. Kramer, the Company’s President and Chief Executive Officer and Craig A. Creaturo, the Company’s Chief Financial Officer and Treasurer,the effectiveness of the Company’s disclosure controls and procedures (as defined in Rules 13a-15(e) and 15d-15(e) ofthe Securities Exchange Act of 1934, as amended) as of the end of the period covered by this annual report on Form 10-K. The Company’s disclosure controls were designed to provide reasonable assurance that information required to be disclosed in reports that we file or submit under the Securities Exchange Act of 1934 is recorded, processed, summarized and reported within the time periods specified in the rules and forms of the Securities and Exchange Commission. It should be noted that the design of any system of controls is based in part upon certain assumptions about the likelihood of future events, and there can be no assurance that any design will succeed in achieving its stated goals under all potential future conditions, regardless of how remote. However, the controls have been designed to provide reasonable assurance of achieving the controls’ stated goals. Based on that evaluation, Messrs.Kramer and Creaturo concluded that the Company’s disclosure controls and procedures are effective at the reasonable assurance level.
Management’s Report on Internal Control Over Financial Reporting
Our management is responsible for establishing and maintaining adequate internal control over financial reporting, as such term is defined in Rule 13a-15(f) and 15d-15(f) under the Securities Exchange Act of 1934. Under the supervision and with the participation of our management, including our Chief Executive Officer and Chief Financial Officer, we conducted an evaluation of the effectiveness of our internal control over financial reporting based on the “Internal Control-Integrated Framework” issued by the Committee of Sponsoring Organizations (COSO) of the Treadway Commission. See the “Report of Management” which is set forth under Item 8 of this Annual Report on Form 10-K and is incorporated herein by reference.
Report of the Registered Public Accounting Firm
The report of Ernst & Young LLP, an independent registered public accounting firm with respect to our internal control over financial reporting is included in Item 8 of this Annual Report on Form 10-K..
Changes in Internal Control over Financial Reporting
There have been no changes in the Company's internal controls over financial reporting that occurred during our most recent quarter that has materially affected, or is reasonably likely to materially affect, our internal control over financial reporting.
ITEM 9B. OTHER INFORMATION
None.

75
PART III
ITEM 10. DIRECTORS AND EXECUTIVE OFFICERS OF THE REGISTRANT
The information set forth above in Part I of this Annual Report on Form 10-K under the caption “Executive Officers of the Registrant” is incorporated herein by reference. The other information required by this item is incorporated herein by reference to the information set forth under the captions “Election of Directors,” “Meetings and Committees of the Board of Directors" and “Other Information - Section 16(a) Beneficial Ownership Reporting Compliance” in the Company's definitive proxy statement for the 2011 Annual Meeting of Shareholders to be filed pursuant to Regulation 14A of the Exchange Act (the “Proxy Statement”).
Audit Committee Financial Expert
The information as to the Audit Committee and the Audit Committee Financial Expert is incorporated herein by reference to the information set forth under the caption “Meetings and Committees of the Board of Directors-Audit Committee” in the Company’s Proxy Statement.
Code of Ethics
The Company has adopted its Code of Business Conduct and Ethics for all of its employees and its Code of Ethics for Senior Financial Officers including the principal executive officer and principal financial officer. The Code of Business Conduct and Ethics and Code of Ethics for Senior Financial Officers can be found on the Company’s Internet web site at www.ii-vi.com under “Investors Information – Corporate Governance Documents.”Any person may also obtain a copy of the Code of Business Conduct and/or the Code of Ethics for Senior Financial Officer without charge by submitting their request to the Chief Financial Officer and Treasurer of II-VI Incorporated, 375 Saxonburg Boulevard, Saxonburg, Pennsylvania 16056 or by calling (724) 352-4455.
The web site and information contained on it or incorporated in it are not intended to be incorporated in this Annual Report on Form 10-K or other filings with the SEC.
ITEM 11. EXECUTIVE COMPENSATION
The information required by this item is incorporated herein by reference to the information set forth under the caption “Executive Compensation” in the Company's Proxy Statement.
ITEM 12. SECURITY OWNERSHIP OF CERTAIN BENEFICIAL OWNERS AND MANAGEMENT AND RELATED STOCKHOLDER MATTERS
The information required by this item is incorporated herein by reference to the information set forth under the captions “Equity Compensation Plan Information” and “Principal Shareholders” in the Company’s Proxy Statement.
ITEM 13. CERTAIN RELATIONSHIPS AND RELATED TRANSACTIONS AND DIRECTOR INDEPENDENCE
The information required by this item is incorporated herein by reference to the information set forth under the caption “Director Independence and Corporate Governance” in the Company’s Proxy Statement.
ITEM 14. PRINCIPAL ACCOUNTANT FEES AND SERVICES
The information required by this item is incorporated herein by reference to the information set forth under the caption “Ratification of Selection of Independent Registered Public Accounting Firm” in the Company’s Proxy Statement.

76
PART IV
ITEM 15. EXHIBITS AND FINANCIAL STATEMENT SCHEDULES
(a) (1) Financial Statements
The financial statements are set forth under Item 8 of this annual report on Form 10-K.
(2) Schedules
Schedule II – Valuation and Qualifying Accounts for each of the three years in the period ended June 30, 2011 is set forth under Item 8 of this annual report on Form 10-K.
Financial statements, financial statement schedules and exhibits not listed have been omitted where the required information is included in the consolidated financial statements or notes thereto, or is not applicable or required.
(3) Exhibits.
ExhibitNumber Description of Exhibit
2.01 Merger Agreement by and among II-VI Incorporated herein by reference is Exhibit 2.1Incorporated, II-VI Holdings B.V., II-VI to II-VI’s Current Report on Form 8-K filed onCayman, Inc. Photop Technologies, Inc. January 4, 2010.And the Shareholder Representative namedTherein, dated as of December 28, 2009
3.01 Amended and Restated Articles of Incorporated herein by reference is Exhibit 3.1Incorporation of II-VI Incorporated to II-VI’s Current Report on Form 8-K filed on
November 12, 2004.
3.02 Amended and Restated By-Laws of Incorporated herein by reference is Exhibit 3.2 to II-VI Incorporated II-VI’s Annual Report on Form 10-K for the fiscal
year ended June 30, 2009.
10.01 II-VI Incorporated Amended and Incorporated herein by reference is Exhibit 10.04 toRestated Employees’ Stock Purchase II-VI’s Registration Statement No. 33-16389 on Plan Form S-1.
10.02 First Amendment to the II-VI Incorporated Incorporated herein by reference is Exhibit 10.01 to Amended and Restated Employees’ II-VI’s Quarterly Report on Form 10-Q for the Stock Purchase Plan Quarter Ended March 31, 1996.
10.03 II-VI Incorporated Amended and Incorporated herein by reference is Exhibit 10.05 Restated Employees’ Profit-Sharing to II-VI’s Registration Statement No. 33-16389Plan and Trust Agreement, as amended on Form S-1.
10.04 Form of Representative Agreement Incorporated herein by reference is Exhibit 10.15 between II-VI and its foreign to II-VI’s Registration Statement No. 33-16389representatives on Form S-1.

77
10.05 Form of Employment Agreement* Incorporated herein by reference is Exhibit 10.16 to II-VI’s Registration Statement No. 33-16389on Form S-1.
10.06 Description of Management-By- Incorporated herein by reference is Exhibit 10.09 Objective Plan* to II-VI’s Annual Report on Form 10-K for the fiscal
year ended June 30, 1993.
10.07 Trust Under the II-VI Incorporated Incorporated herein by reference is Exhibit 10.13 Deferred Compensation Plan* to II-VI’s Annual Report on Form 10-K for the fiscal
year ended June 30, 1996.
10.08 Description of Bonus Incentive Plan* Incorporated herein by reference is Exhibit 10.14 to II-VI’s Annual Report on Form 10-K for the fiscal year ended June 30, 1996.
10.09 Amended and Restated II-VI Incorporated herein by reference is Exhibit 10.01 toIncorporated Deferred II-VI’s Quarterly Report on Form 10-Q for the Compensation Plan* Quarter Ended December 31, 1996.
10.10 II-VI Incorporated Stock Option Plan of 2001* Incorporated herein by reference is Exhibit 4.1to II-VI’s Registration Statement No. 333-74682on Form S-8.
10.11 Example Form of Stock Option Agreement Incorporated herein by reference is Exhibit 10.17 to under the II-VI Incorporated Stock Option II-VI’s Annual Report on Form 10-K for the fiscal year Plan of 2001* ended June 30, 2004.
10.12 II-VI Incorporated Arrangement for Incorporated herein by reference is Exhibit 10.12 to Director Compensation* II-VI’s Annual report on Form 10-K for the fiscal year
Ended June 30, 2009.
10.13 II-VI Incorporated 2005 Incorporated herein by reference is Exhibit AOmnibus Incentive Plan* to II-VI’s Definitive Proxy Statement on Schedule 14A
filed on September 26, 2005.
10.14 Form of Nonqualified Stock Option Incorporated herein by reference is Exhibit 10.01under the II-VI Incorporated 2005 to II-VI’s Quarterly Report on Form 10-Q for theOmnibus Incentive Plan* Quarter Ended December 31, 2005.
10.15 Form of Restricted Share Award Incorporated herein by reference is Exhibit 10.02under the II-VI Incorporated 2005 to II-VI’s Quarterly Report on Form 10-Q for theOmnibus Incentive Plan* Quarter Ended December 31, 2005.
10.16 Form of Deferred Share Award Incorporated herein by reference is Exhibit 10.03under the II-VI Incorporated 2005 to II-VI’s Quarterly Report on Form 10-Q for theOmnibus Incentive Plan* Quarter Ended December 31, 2005.
10.17 Form of Performance Unit Award Incorporated herein by reference is Exhibit 10.04under the II-VI Incorporated 2005 to II-VI’s Quarterly Report on Form 10-Q for theOmnibus Incentive Plan* Quarter Ended December 31, 2005.
10.18 Form of Stock Appreciation Rights Incorporated herein by reference is Exhibit 10.05Award under the II-VI Incorporated to II-VI’s Quarterly Report on Form 10-Q for the2005 Omnibus Incentive Plan* Quarter Ended December 31, 2005.

78
10.19 Form of Performance Share Award Incorporated herein by referenceunder the II-VI Incorporated is Exhibit 10.19 to II-VI’s Annual Report on 2005 Omnibus Incentive Plan* Form 10-K for the fiscal year ended June 30, 2007.
10.20 300,000,000 Japanese Yen Term Loan Incorporated herein by reference is Exhibit 10.2 toSecond Amendment to Second Amended II-VI’s Current Report on Form 8-K filed on and Restated Letter Agreement by and October 26, 2006.among II-VI Japan Incorporated and PNCBank, National Association datedOctober 23, 2006.
10.21 Second Allonge to Rate Protection Term Incorporated here by reference is Exhibit 10.3 to Note by and among II-VI Japan Incorporated II-VI’s Current Report on Form 8-K filed on in favor of PNC Bank, National Association October 26, 2006.dated October 23, 2006.
10.22 Amended and Restated Employment Incorporated herein by reference to Exhibit 10.1 toAgreement by and between II-VI and II-VI’s Current Report on Form 8-K filed onFrancis J. Kramer September 24, 2008.
10.23 Amended and Restated Employment Incorporated herein by reference to Exhibit 10.1 toAgreement by and between II-VI and II-VI’s Current Report on Form 8-K filed onVincent D. Mattera, Jr. September 24, 2008.
10.24 Description of Discretionary Incentive Plan* Incorporated herein by reference is Exhibit 10.27 to II-VI’s Annual Report on Form 10-K for the fiscal year ended June 30, 2009.
10.25 II-VI Incorporated 2009 Incorporated herein by reference is Exhibit AOmnibus Incentive Plan* to II-VI’s Definitive Proxy Statement on Schedule 14A
filed on September 25, 2009.
10.26 $50,000,000 Revolving Credit Facility, Incorporated herein by reference is Exhibit 10.1 toCredit Agreement by and among II-VI II-VI’s Current Report on Form 8-K filed on Incorporated and The Guarantors Party June 17, 2011.Hereto and The Banks Party Hereto andPNC Bank, National Association,As Agent Dated as of June 15, 2011.
21.01 List of Subsidiaries of II-VI Incorporated Filed herewith.
23.01 Consent of Ernst & Young LLP Filed herewith.

79
31.01 Certification of the Chief Executive Filed herewith.Officer pursuant to Rule 13a-14(a) of the Securities Exchange Act of 1934, asamended, and Section 302 of the Sarbanes-Oxley Act of 2002
31.02 Certification of the Chief Financial Filed herewith.Officer pursuant to Rule 13a-14(a) of the Securities Exchange Act of 1934, asamended, and Section 302 of the Sarbanes-Oxley Act of 2002
32.01 Certification of the Chief Executive Filed herewith.Officer pursuant to Rule 13a-14(b) of the Securities Exchange Act of 1934, asamended, and 18 U.S.C. § 1350 as adopted pursuant to Section 906 of the Sarbanes-Oxley Act of 2002
32.02 Certification of the Chief Financial Filed herewith.Officer pursuant to Rule 13a-14(b) of the Securities Exchange Act of 1934, asamended, and 18 U.S.C. § 1350 as adopted pursuant to Section 906 of the Sarbanes-Oxley Act of 2002
101 Interactive Data File**
______* Denotes management contract or compensatory plan, contract or arrangement.
The Registrant will furnish to the Commission upon request copies of any instruments not filed herewith which authorize the issuance of long-term obligations of the Registrant not in excess of 10% of the Registrant’s total assets on a consolidated basis.
** In accordance with Rule 406T of Regulation S-T promulgated by the Securities and Exchange Commission, Exhibit 101 is deemed not filed or part of a registration statement or prospectus for purposes of Section 11 or 12 of theSecurities Act of 1933, is deemed not filed for purposes of Section 18 of the Securities Exchange Act of 1934, and otherwise is not subject to liability under these sections.

80
SIGNATURES
Pursuant to the requirements of Section 13 or 15(d) of the Securities Exchange Act of 1934, the registrant has duly caused this report to be signed on its behalf by the undersigned, thereunto duly authorized.
II-VI INCORPORATED
Date: August 26, 2011 By: /s/ Francis J. KramerFrancis J. Kramer
President, Chief Executive Officer and Director
Pursuant to the requirements of the Securities Exchange Act of 1934, this report has been signed below by the following persons on behalf of the registrant and in the capacities and on the dates indicated.
Principal Executive Officer:
Date: August 26, 2011 By: /s/ Francis J. KramerFrancis J. Kramer
President, Chief Executive Officer and Director
Principal Financial and Accounting Officer:
Date: August 26, 2011 By: /s/ Craig A. CreaturoCraig A. Creaturo
Chief Financial Officer and Treasurer
Date: August 26, 2011 By: /s/ Carl J. JohnsonCarl J. Johnson
Director
Date: August 26, 2011 By: /s/ Joseph J. CorasantiJoseph J. Corasanti
Director
Date: August 26, 2011 By: /s/ Wendy F. DiCiccoWendy F. DiCicco
Director
Date: August 26, 2011 By: /s/ Thomas E. MistlerThomas E. Mistler
Director
Date: August 26, 2011 By: /s/ RADM Marc Y. E. Pelaez (retired)RADM Marc Y. E. Pelaez (retired)
Director
Date: August 26, 2011 By: /s/ Peter W. SognefestPeter W. Sognefest
Director
Date: August 26, 2011 By: /s/ Howard H. XiaHoward H. Xia
Director

81
EXHIBIT INDEX
2.01 Merger Agreement by and among II-VI Incorporated herein by reference is Exhibit 2.1Incorporated, II-VI Holdings B.V., II-VI to II-VI’s Current Report on Form 8-K filed onCayman, Inc. Photop Technologies, Inc. January 4, 2010.And the Shareholder Representative namedTherein, dated as of December 28, 2009
3.01 Amended and Restated Articles of Incorporated herein by reference is Exhibit 3.1Incorporation of II-VI Incorporated to II-VI’s Current Report on Form 8-K filed on
November 12, 2004.
3.02 Amended and Restated By-Laws of Incorporated herein by reference is Exhibit 3.2 toII-VI Incorporated II-VI’s Annual Report on Form 10-K for the fiscal year
ended June 30, 2009.
10.01 II-VI Incorporated Amended and Incorporated herein by reference is Exhibit 10.04 toRestated Employees’ Stock Purchase II-VI’s Registration Statement No. 33-16389 on Plan Form S-1.
10.02 First Amendment to the II-VI Incorporated Incorporated herein by reference is Exhibit 10.01 to Amended and Restated Employees’ II-VI’s Quarterly Report on Form 10-Q for the Stock Purchase Plan Quarter Ended March 31, 1996.
10.03 II-VI Incorporated Amended and Incorporated herein by reference is Exhibit 10.05 Restated Employees’ Profit-Sharing to II-VI’s Registration Statement No. 33-16389Plan and Trust Agreement, as amended on Form S-1.
10.04 Form of Representative Agreement Incorporated herein by reference is Exhibit 10.15 between II-VI and its foreign to II-VI’s Registration Statement No. 33-16389representatives on Form S-1.
10.05 Form of Employment Agreement* Incorporated herein by reference is Exhibit 10.16 to II-VI’s Registration Statement No. 33-16389on Form S-1.
10.06 Description of Management-By- Incorporated herein by reference is Exhibit 10.09 Objective Plan* to II-VI’s Annual Report on Form 10-K for the fiscal
year ended June 30, 1993.
10.07 Trust Under the II-VI Incorporated Incorporated herein by reference is Exhibit 10.13 Deferred Compensation Plan* to II-VI’s Annual Report on Form 10-K for the fiscal
year ended June 30, 1996.
10.08 Description of Bonus Incentive Plan* Incorporated herein by reference is Exhibit 10.14 to II-VI’s Annual Report on Form 10-K for the fiscal year ended June 30, 1996.
10.09 Amended and Restated II-VI Incorporated herein by reference is Exhibit 10.01 toIncorporated Deferred II-VI’s Quarterly Report on Form 10-Q for the Compensation Plan* Quarter Ended December 31, 1996.
10.10 II-VI Incorporated Stock Option Plan of 2001* Incorporated herein by reference is Exhibit 4.1to II-VI’s Registration Statement No. 333-74682on Form S-8.

82
10.11 Example Form of Stock Option Agreement Incorporated herein by reference is Exhibit 10.17 to under the II-VI Incorporated Stock Option II-VI’s Annual Report on Form 10-K for the fiscal year Plan of 2001* ended June 30, 2004.
10.12 II-VI Incorporated Arrangement for Incorporated herein by reference is Exhibit 10.12 to Director Compensation* II-VI’s Annual report on Form 10-K for the fiscal year
Ended June 30, 2009.
10.13 II-VI Incorporated 2005 Incorporated herein by reference is Exhibit AOmnibus Incentive Plan* to II-VI’s Definitive Proxy Statement on Schedule 14A
filed on September 26, 2005.
10.14 Form of Nonqualified Stock Option Incorporated herein by reference is Exhibit 10.01under the II-VI Incorporated 2005 to II-VI’s Quarterly Report on Form 10-Q for theOmnibus Incentive Plan* Quarter Ended December 31, 2005.
10.15 Form of Restricted Share Award Incorporated herein by reference is Exhibit 10.02under the II-VI Incorporated 2005 to II-VI’s Quarterly Report on Form 10-Q for theOmnibus Incentive Plan* Quarter Ended December 31, 2005.
10.16 Form of Deferred Share Award Incorporated herein by reference is Exhibit 10.03under the II-VI Incorporated 2005 to II-VI’s Quarterly Report on Form 10-Q for theOmnibus Incentive Plan* Quarter Ended December 31, 2005.
10.17 Form of Performance Unit Award Incorporated herein by reference is Exhibit 10.04under the II-VI Incorporated 2005 to II-VI’s Quarterly Report on Form 10-Q for theOmnibus Incentive Plan* Quarter Ended December 31, 2005.
10.18 Form of Stock Appreciation Rights Incorporated herein by reference is Exhibit 10.05Award under the II-VI Incorporated to II-VI’s Quarterly Report on Form 10-Q for the2005 Omnibus Incentive Plan* Quarter Ended December 31, 2005.
10.19 Form of Performance Share Award Incorporated herein by referenceunder the II-VI Incorporated is Exhibit 10.19 to II-VI’s Annual Report on 2005 Omnibus Incentive Plan* Form 10-K for the fiscal year ended June 30, 2007.
10.20 300,000,000 Japanese Yen Term Loan Incorporated herein by reference is Exhibit 10.2 toSecond Amendment to Second Amended II-VI’s Current Report on Form 8-K filed on and Restated Letter Agreement by and October 26, 2006.among II-VI Japan Incorporated and PNCBank, National Association datedOctober 23, 2006.
10.21 Second Allonge to Rate Protection Term Incorporated here by reference is Exhibit 10.3 to Note by and among II-VI Japan Incorporated II-VI’s Current Report on Form 8-K filed on in favor of PNC Bank, National Association October 26, 2006.dated October 23, 2006.
10.22 Amended and Restated Employment Incorporated herein by reference to Exhibit 10.1 toAgreement by and between II-VI and II-VI’s Current Report on Form 8-K filed onFrancis J. Kramer September 24, 2008.
10.23 Amended and Restated Employment Incorporated herein by reference to Exhibit 10.1 toAgreement by and between II-VI and II-VI’s Current Report on Form 8-K filed onVincent D. Mattera, Jr. September 24, 2008.

83
10.24 Description of Discretionary Incentive Plan* Incorporated herein by reference is Exhibit 10.27 to II-VI’s Annual Report on Form 10-K for the fiscal year ended June 30, 2009.
10.25 II-VI Incorporated 2009 Incorporated herein by reference is Exhibit AOmnibus Incentive Plan* to II-VI’s Definitive Proxy Statement on Schedule 14A
filed on September 25, 2009.
10.26 $50,000,000 Revolving Credit Facility, Incorporated herein by reference is Exhibit 10.1 toCredit Agreement by and among II-VI II-VI’s Current Report on Form 8-K filed on Incorporated and The Guarantors Party June 17, 2011.Hereto and The Banks Party Hereto andPNC Bank, National Association,As Agent Dated as of June 15, 2011.
21.01 List of Subsidiaries of II-VI Incorporated Filed herewith.
23.01 Consent of Ernst & Young LLP Filed herewith.
31.01 Certification of the Chief Executive Filed herewith.Officer pursuant to Rule 13a-14(a) of the Securities Exchange Act of 1934, asamended, and Section 302 of the Sarbanes-Oxley Act of 2002
31.02 Certification of the Chief Financial Filed herewith.Officer pursuant to Rule 13a-14(a) of the Securities Exchange Act of 1934, asamended, and Section 302 of the Sarbanes-Oxley Act of 2002
32.01 Certification of the Chief Executive Filed herewith.Officer pursuant to Rule 13a-14(b) of the Securities Exchange Act of 1934, asamended, and 18 U.S.C. § 1350 as adopted pursuant to Section 906 of the Sarbanes-Oxley Act of 2002
32.02 Certification of the Chief Financial Filed herewith.Officer pursuant to Rule 13a-14(b) of the Securities Exchange Act of 1934, asamended, and 18 U.S.C. § 1350 as adopted pursuant to Section 906 of the Sarbanes-Oxley Act of 2002
101 Interactive Data File**
______* Denotes management contract or compensatory plan, contract or arrangement.
The Registrant will furnish to the Commission upon request copies of any instruments not filed herewith which authorize the issuance of long-term obligations of the Registrant not in excess of 10% of the Registrant’s total assets on a consolidated basis.
** In accordance with Rule 406T of Regulation S-T promulgated by the Securities and Exchange Commission, Exhibit 101 is deemed not filed or part of a registration statement or prospectus for purposes of Section 11 or 12 of theSecurities Act of 1933, is deemed not filed for purposes of Section 18 of the Securities Exchange Act of 1934, and otherwise is not subject to liability under these sections.
84
Exhibit 31.01
CERTIFICATIONS
I, Francis J. Kramer, certify that:
1. I have reviewed this annual report on Form 10-K of II-VI Incorporated;
2. Based on my knowledge, this report does not contain any untrue statement of a material fact or omit to state a material fact necessary to make the statements made, in light of the circumstances under which such statements were made, not misleading with respect to the period covered by this report;
3. Based on my knowledge, the financial statements, and other financial information included in this report, fairly present in all material respects the financial condition, results of operations and cash flows of the registrant as of, and for, the periods presented in this report;
4. The registrant’s other certifying officers and I are responsible for establishing and maintaining disclosure controls and procedures (as defined in Exchange Act Rules 13a-15(e) and 15d-15(e)) and internal control over financial reporting (as defined in Exchange Act Rules 13a-15(f) and 15d-15(f)) for the registrant and have:
a) Designed such disclosure controls and procedures, or caused such disclosure controls and procedures to be designed under our supervision, to ensure that material information relating to the registrant, including its consolidated subsidiaries, is made known to us by others within those entities, particularly during the period in which this report is being prepared;
b) Designed such internal control over financial reporting, or caused such internal control over financial reporting to be designed under our supervision, to provide reasonable assurance regarding the reliability of financial reporting and the preparation of financial statements for external purposes in accordance with generally accepted accounting principles;
c) Evaluated the effectiveness of the registrant’s disclosure controls and procedures and presented in this report our conclusions about the effectiveness of the disclosure controls and procedures, as of the end of the period covered by this report based on such evaluation; and
d) Disclosed in this report any change in the registrant’s internal control over financial reporting that occurred during the registrant’s most recent fiscal quarter (the registrant’s fourth fiscal quarter in case of an annual report) that has materially affected, or is reasonably likely to materially affect, the registrant’s internal control over financial reporting; and
5. The registrant’s other certifying officers and I have disclosed, based on our most recent evaluation of internal control over financial reporting, to the registrant’s auditors and the audit committee of the registrant’s board of directors (or persons performing the equivalent functions):
a) All significant deficiencies and material weaknesses in the design or operation of internal control over financial reporting which are reasonably likely to adversely affect the registrant’s ability to record, process, summarize and report financial information; and
b) Any fraud, whether or not material, that involves management or other employees who have a significant role in the registrant’s internal control over financial reporting.
August 26, 2011 By: /s/ Francis J. Kramer Francis J. Kramer
President and Chief Executive Officer

85
Exhibit 31.02
CERTIFICATIONS
I, Craig A. Creaturo, certify that:
1. I have reviewed this annual report on Form 10-K of II-VI Incorporated;
2. Based on my knowledge, this report does not contain any untrue statement of a material fact or omit to state a material fact necessary to make the statements made, in light of the circumstances under which such statements were made, not misleading with respect to the period covered by this report;
3. Based on my knowledge, the financial statements, and other financial information included in this report, fairly present in all material respects the financial condition, results of operations and cash flows of the registrant as of, and for, the periods presented in this report;
4. The registrant’s other certifying officers and I are responsible for establishing and maintaining disclosure controls and procedures (as defined in Exchange Act Rules 13a-15(e) and 15d-15(e)) and internal control over financial reporting (as defined in Exchange Act Rules 13a-15(f) and 15d-15(f)) for the registrant and have:
a) Designed such disclosure controls and procedures, or caused such disclosure controls and procedures to be designed under our supervision, to ensure that material information relating to the registrant, including its consolidated subsidiaries, is made known to us by others within those entities, particularly during the period in which this report is being prepared;
b) Designed such internal control over financial reporting, or caused such internal control over financial reporting to be designed under our supervision, to provide reasonable assurance regarding the reliability of financial reporting and the preparation of financial statements for external purposes in accordance with generally accepted accounting principles;
c) Evaluated the effectiveness of the registrant’s disclosure controls and procedures and presented in this report our conclusions about the effectiveness of the disclosure controls and procedures, as of the end of the period covered by this report based on such evaluation; and
d) Disclosed in this report any change in the registrant’s internal control over financial reporting that occurred during the registrant’s most recent fiscal quarter (the registrant’s fourth fiscal quarter in case of an annual report) that has materially affected, or is reasonably likely to materially affect, the registrant’s internal control over financial reporting; and
5. The registrant’s other certifying officers and I have disclosed, based on our most recent evaluation of internal control over financial reporting, to the registrant’s auditors and the audit committee of the registrant’s board of directors (or persons performing the equivalent functions):
a) All significant deficiencies and material weaknesses in the design or operation of internal control over financial reporting which are reasonably likely to adversely affect the registrant’s ability to record, process, summarize and report financial information; and
b) Any fraud, whether or not material, that involves management or other employees who have a significant role in the registrant’s internal control over financial reporting.
August 26, 2011 By: /s/ Craig A. Creaturo Craig A. Creaturo
Chief Financial Officer and Treasurer

86
Exhibit 32.01
CERTIFICATION PURSUANT TO18 U.S.C. SECTION 1350,
AS ADOPTED PURSUANT TOSECTION 906 OF THE SARBANES-OXLEY ACT OF 2002
In connection with the Annual Report of II-VI Incorporated (the “Corporation”) on Form 10-K for the year ended June 30, 2011 as filed with the Securities and Exchange Commission on the date hereof (the “Report”), the undersigned officer of the Corporation certifies, pursuant to 18 U.S.C. § 1350, as adopted pursuant to Section 906 of the Sarbanes-Oxley Act of 2002, that, to his knowledge:
(1) The Report fully complies with the requirements of Section 13(a) or 15(d) of the Securities Exchange Act of 1934; and
(2) The information contained in the Report fairly presents, in all material respects, the financial condition and results of operations of the Corporation.
Date: August 26, 2011 /s/ Francis J. KramerFrancis J. Kramer
President and Chief Executive Officer
*This certification is made solely for purposes of 18 U.S.C. Section 1350, subject to the knowledge standard contained therein, and not for any other purpose.

87
Exhibit 32.02
CERTIFICATION PURSUANT TO18 U.S.C. SECTION 1350,
AS ADOPTED PURSUANT TOSECTION 906 OF THE SARBANES-OXLEY ACT OF 2002
In connection with the Annual Report of II-VI Incorporated (the “Corporation”) on Form 10-K for the year ended June 30, 2011 as filed with the Securities and Exchange Commission on the date hereof (the “Report”), the undersigned officer of the Corporation certifies, pursuant to 18 U.S.C. § 1350, as adopted pursuant to Section 906 of the Sarbanes-Oxley Act of 2002, that, to his knowledge:
(1) The Report fully complies with the requirements of Section 13(a) or 15(d) of the Securities Exchange Act of 1934; and
(2) The information contained in the Report fairly presents, in all material respects, the financial condition and results of operations of the Corporation.
Date: August 26, 2011 /s/ Craig A. CreaturoCraig A. Creaturo
Chief Financial Officer and Treasurer
*This certification is made solely for purposes of 18 U.S.C. Section 1350, subject to the knowledge standard contained therein, and not for any other purpose.

Board of DirectorsJoseph J. Corasanti
President and Chief Executive Officer CONMED Corporation
Wendy F. DiCiccoChief Financial Officer Quench USA
Carl J. JohnsonChairman of the Board Co-founder of II-VI Incorporated
Francis J. KramerPresident and Chief Executive Officer II-VI Incorporated
Thomas E. MistlerRetired Executive
Marc Y. E. PelaezRear Admiral, United States Navy (retired)
Peter W. SognefestPresident, Chief Executive Officer and Chairman Seamoc, Inc.
Howard H. XiaGeneral Manager Vodafone China Limited
Executive OfficersFrancis J. Kramer
President and Chief Executive Officer
Vincent D. Mattera, Jr.Executive Vice President
Craig A. CreaturoChief Financial Officer and Treasurer
James MartinelliVice President – Military & Materials Businesses
Annual MeetingFriday, November 4, 201 1 Offices of the Company 375 Saxonburg Boulevard Saxonburg, PA 16056
Shareholder Meeting at 1:30 PM EST
Stock ListingThe common stock of II-VI Incorporated is traded on Nasdaq under the trading symbol “IIVI.”
Transfer AgentAmerican Stock Transfer & Trust Company 6201 15th Ave, 3rd Floor Brooklyn, NY 1 1219 1.800.937.5449
Independent Registered Public AccountantsErnst & Young LLP 2100 One PPG Place Pittsburgh, PA 15222
Corporate CounselSherrard, German & Kelly, P.C. 28th Floor, Two PNC Plaza Pittsburgh, PA 15222
Securities CounselBuchanan Ingersoll & Rooney PC One Oxford Centre 301 Grant Street, 20th Floor Pittsburgh, PA 15219
Corporate Information
II-VI Incorporated is an Equal Opportunity Employer. As such, it is the Company’s policy to promote equal employment opportunities and to prohibit discrimination on the basis of
race, color, religion, sex, age, national origin, disability or status as a veteran in all aspects of employment, including recruiting, hiring, training and promoting personnel. In fulfilling this
commitment, the Company shall comply with the letter and spirit of the laws, regulations and Executive Orders governing equal opportunity in employment, including the Civil Rights Act
of 1964, Executive Order 11246, Revised Order Number 4, and amendments thereto.

II-VI Incorporated
375 Saxonburg Boulevard Saxonburg, PA 16056
724.352.4455
www.ii-vi.com