Embed Size (px)
Citation preview
The State of Downtown
2011 Progress Report
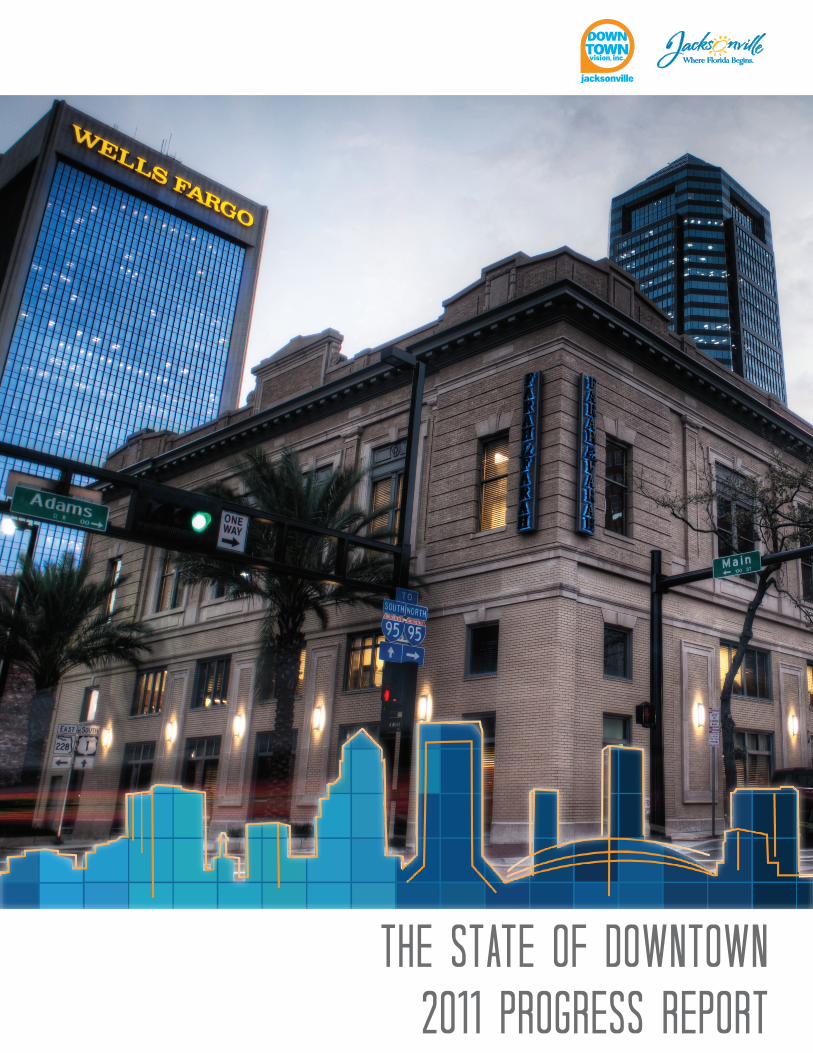
Table of Contents
Year in Review 3Development 5Office Market & Employment 9Residential Market 13Culture & Entertainment 15Retail, Restaurants & Nightlife 18 Hotels & Conventions 20Parking & Transportation 22 Quality of Life 24Credits 25Downtown Map 26
Burro Bar opened at 100 E. Adams in May 2011
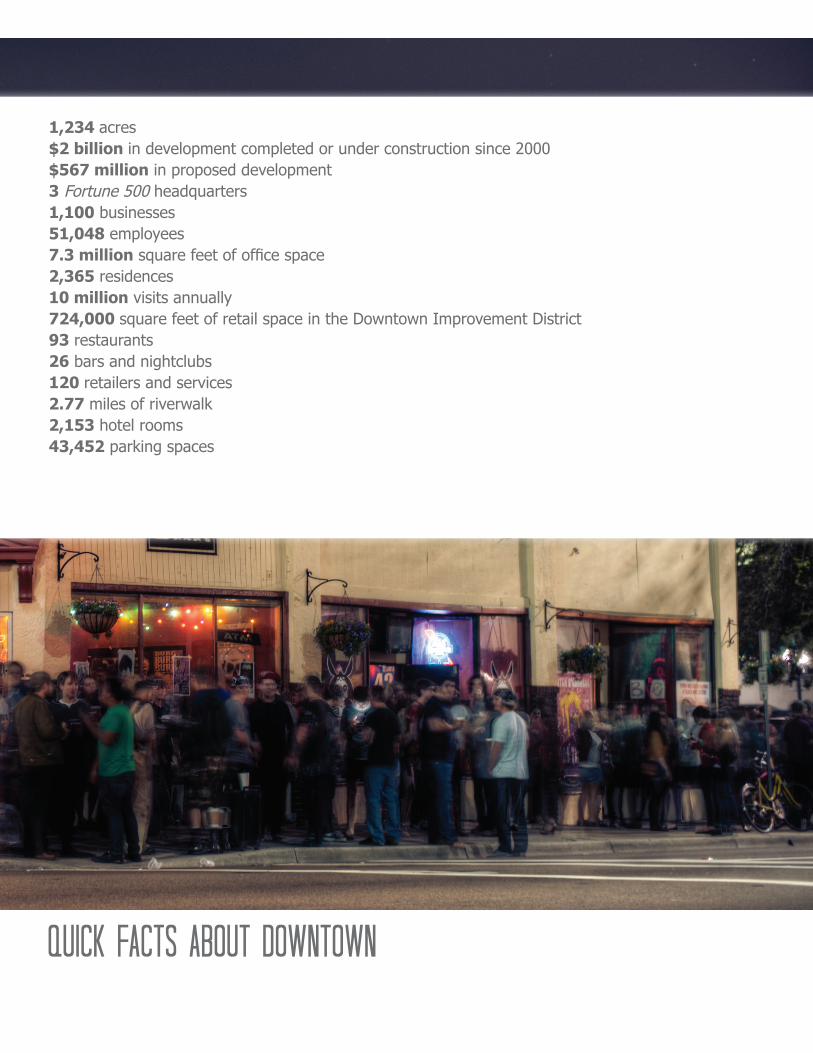
Quick Facts About Downtown
1,234 acres$2 billion in development completed or under construction since 2000$567 million in proposed development3 Fortune 500 headquarters1,100 businesses51,048 employees7.3 million square feet of office space2,365 residences10 million visits annually724,000 square feet of retail space in the Downtown Improvement District93 restaurants26 bars and nightclubs120 retailers and services2.77 miles of riverwalk2,153 hotel rooms43,452 parking spaces
3
Year in Review
Last year was a great year for Downtown Jacksonville. Downtown began to regain momentum, with a strong commitment from Mayor Brown, the completion of improvements to several parks and public spaces and renewed business interest in
relocating Downtown. There were several significant milestones, including:
Newly-elected Mayor Alvin Brown made Downtown a top priority.
EverBank announced plans to move 1,600 employees to Downtown, which will increase employment in the Downtown core by 8%.
The City of Jacksonville completed several significant capital projects, including improvements to Laura Street, Friendship Park and Fountain, Metropolitan Park, Treaty Oak Park, Shipyards site and the Riverside Arts Market.
Jacksonville City Council enacted legislation to improve the appearance of surface parking lots, which will improve the parking experience and the pedestrian environment.
The JAX Chamber Downtown Committee developed a plan to market Downtown Jacksonville.
The Florida Department of Transportation completed the reconstruction of the I-10/I-95 interchange and the Hart Bridge repainting project, improving access to Downtown.
Several indicators show that Downtown Jacksonville is improving. Though Downtown continues to face challenges, there’s
a lot of good news for Downtown:
Development
More than $186 million (12 projects) in development was completed in 2011 and several new projects were announced, including the new Parador parking garage, JAX Chamber’s building renovation and a sustainability resource center.
Office
There was more activity in the office market, with nine new leases signed last year. Interest in leasing near the new
courthouse continues to increase and additional leasing activity is expected to occur through 2013.
Residential Sales and occupancy of Downtown residential units improved in 2011 and three new Downtown residential projects
totaling more than 660 units have been announced, including 220 Riverside, Riverside Park and The Ambassador Lofts.
Culture, Entertainment & Recreation
Although the number of visits to Downtown in 2011 remained steady, several venues experienced increased attendance.
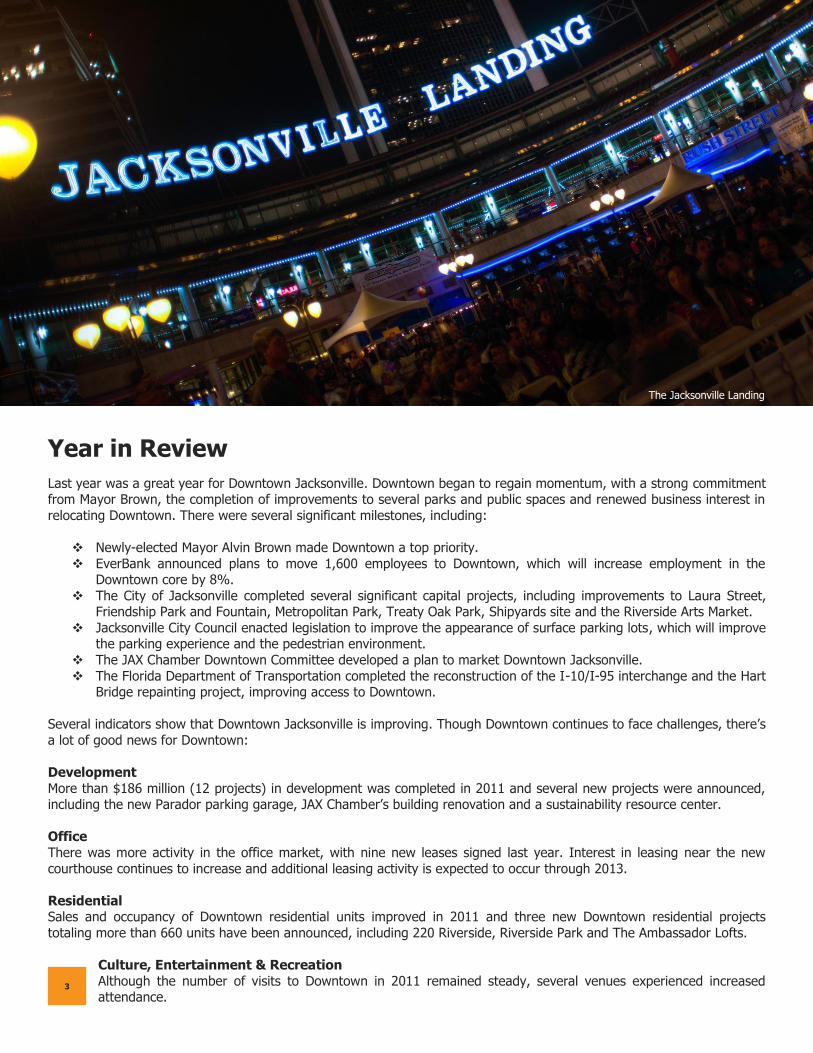
The Jacksonville Landing
The Jacksonville Landing
4
Additionally, a renewed focus on public/private partnerships and attracting independent event producers has increased the number of events Downtown.
Retail, Restaurants & Nightlife
Downtown’s retail vacancy declined in 2011 and several new businesses opened, including six restaurants, four nightlife venues and several clothiers and gift shops.
Hotels & Conventions In 2011, Downtown’s hotel occupancy and convention attendance increased.
Parking & Transportation
With more than 43,000 parking spaces Downtown, there is ample available parking for employees and visitors, and the
construction of an additional 600 parking spaces by Parador Partners is expected to commence in 2012.
Quality of Life Downtown continues to be one of the safest neighborhoods in Jacksonville, with a crime rate that is 59% lower than the
average Duval County crime rate.
2012 promises to be another great year for Downtown. Mayor Brown is reorganizing the city’s economic development
offices, including a dedicated Downtown Investment Authority, which will enhance Downtown’s ability to attract new businesses, jobs and development. The new Duval County Courthouse will open in May, which, coupled with EverBank's
move, will bring nearly 4,000 people to this area of Downtown daily. Other projects on the horizon include the construction of the Parador parking garage on the lot across the street from The Jacksonville Landing, plans to
reconstruct the Southbank riverfront, the implementation of Downtown Vision, Inc.'s façade grant program along Laura
Street, and the construction of the U.S. Green Building Council's Sustainability Resource Center in the Library Garage. Additionally, the City of Jacksonville and Downtown organizations and stakeholders are partnering to create initiatives to
reduce nuisance activity in Downtown.
Downtown is the face of Jacksonville and Downtown’s success directly impacts job creation and provides stability for the
local economy. If Downtown is vibrant, Jacksonville as a region becomes more attractive to businesses, investors, a diverse workforce and visitors.
With extensive infrastructure, great and historic architecture, the St. Johns River, a central location and easy access via
transit and two major interstates, Downtown has tremendous potential. We urge you to explore everything Downtown has to offer and look forward to another great year for Downtown!
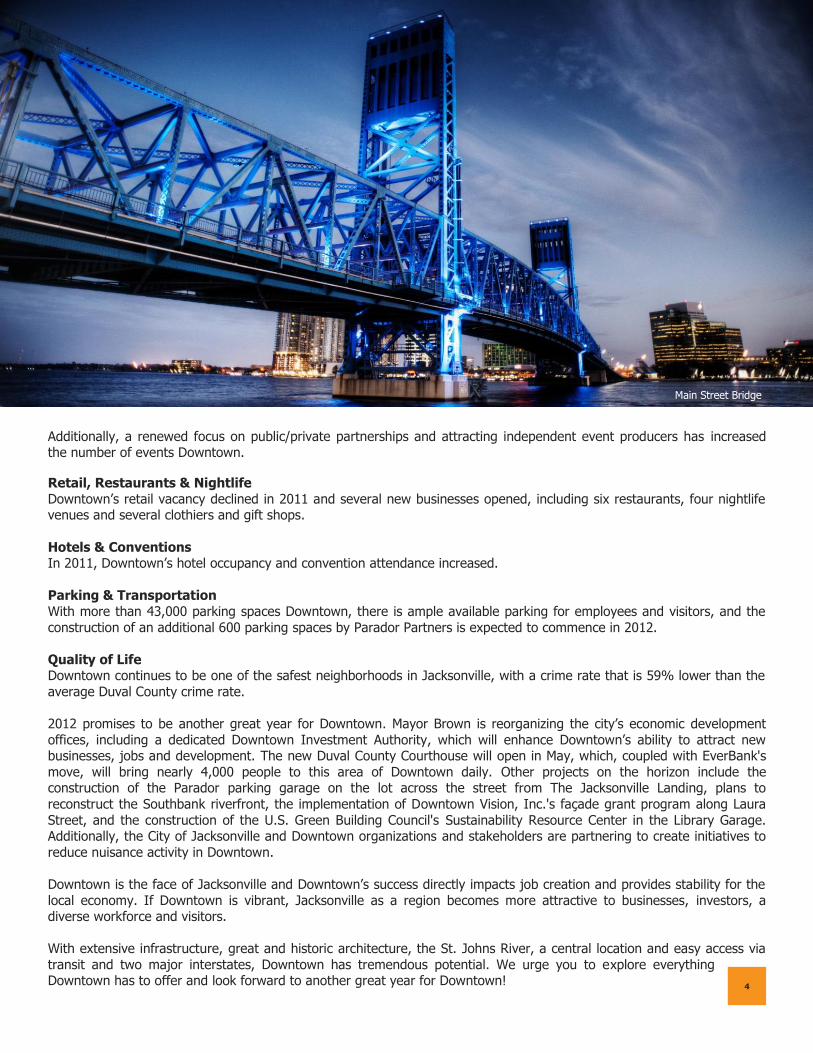
Main Street Bridge
Development
During the past 12 years, 85 projects totaling more than $1.4 billion in development have been completed in Downtown. At the beginning of 2012, there were seven
projects totaling nearly $586 million under construction, with an additional $567 million (19 projects) proposed for development.
Government improvements to infrastructure and public space continue to be the major source of Downtown development. Of the 12 projects completed in 2011, five
were infrastructure improvements and five were upgrades to Downtown parks; four of the seven projects currently under construction are public buildings or
infrastructure improvements.
2012 will be a busy year for the Downtown core. When the new county courthouse
is completed in May, approximately 2,000 employees and visitors will relocate from the existing riverfront county courthouse to the west side of the Downtown core.
Conversations are underway on future use and development of the soon-to-be vacant current courthouse, courthouse annex and parking lot.
In the Downtown core, five significant historic buildings are under consideration for development – the Laura Street Trio, the former Barnett Bank building and the
former Haydon Burns Library. Rehabilitation of these buildings, located in the heart of Downtown, is paramount to Downtown’s success.
Several private property owners in Downtown are upgrading their buildings. Improvements to interior common areas and façade improvements will help attract new businesses to Downtown and improve the overall quality of the Downtown
streetscape.
Finally, and perhaps most significantly, the creation of the new Downtown Investment Authority will help streamline Downtown development and attract new developments and businesses to Downtown. This organization will engage
directly in Downtown development and re-development and will maintain a constant focus on Downtown.
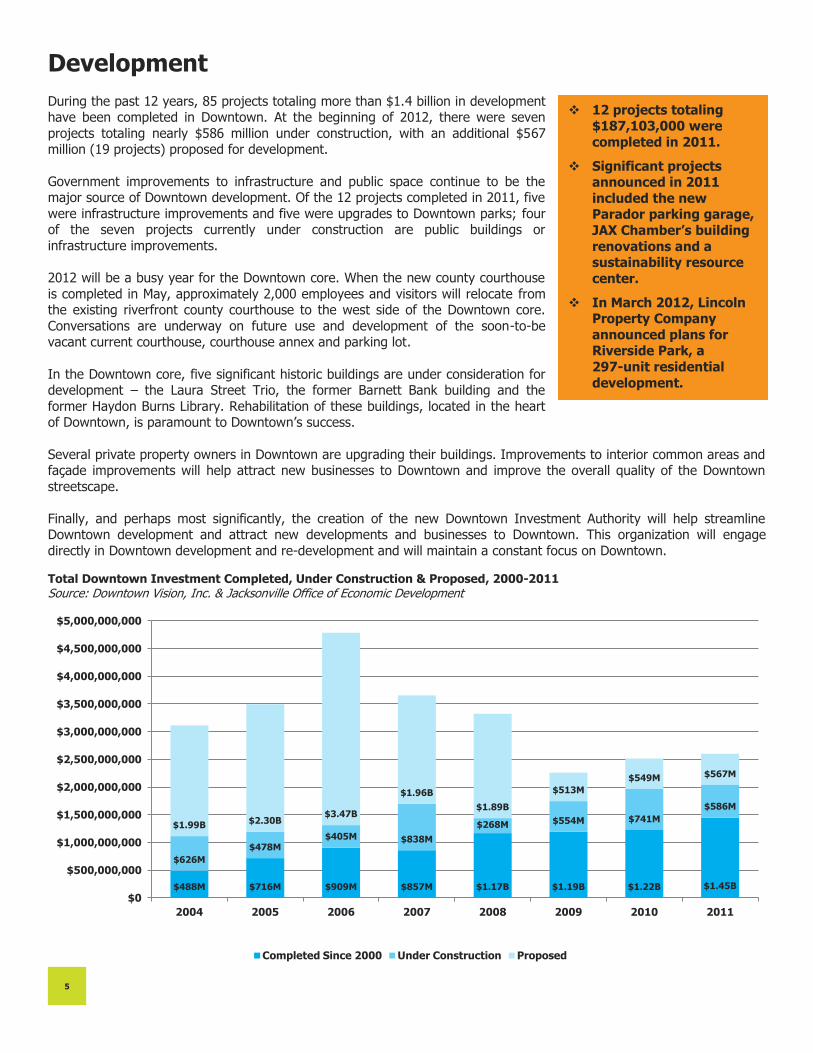
Total Downtown Investment Completed, Under Construction & Proposed, 2000-2011 Source: Downtown Vision, Inc. & Jacksonville Office of Economic Development
$488M $716M $909M $857M $1.17B $1.19B $1.22B $1.45B
$626M
$478M $405M $838M
$268M $554M $741M
$586M
$1.99B $2.30B $3.47B
$1.96B
$1.89B
$513M
$549M $567M
$0
$500,000,000
$1,000,000,000
$1,500,000,000
$2,000,000,000
$2,500,000,000
$3,000,000,000
$3,500,000,000
$4,000,000,000
$4,500,000,000
$5,000,000,000
2004 2005 2006 2007 2008 2009 2010 2011
Completed Since 2000 Under Construction Proposed
Duval County Courthouse
5
12 projects totaling $187,103,000 were
completed in 2011.
Significant projects announced in 2011
included the new Parador parking garage,
JAX Chamber’s building
renovations and a sustainability resource
center.
In March 2012, Lincoln Property Company
announced plans for Riverside Park, a
297-unit residential
development.
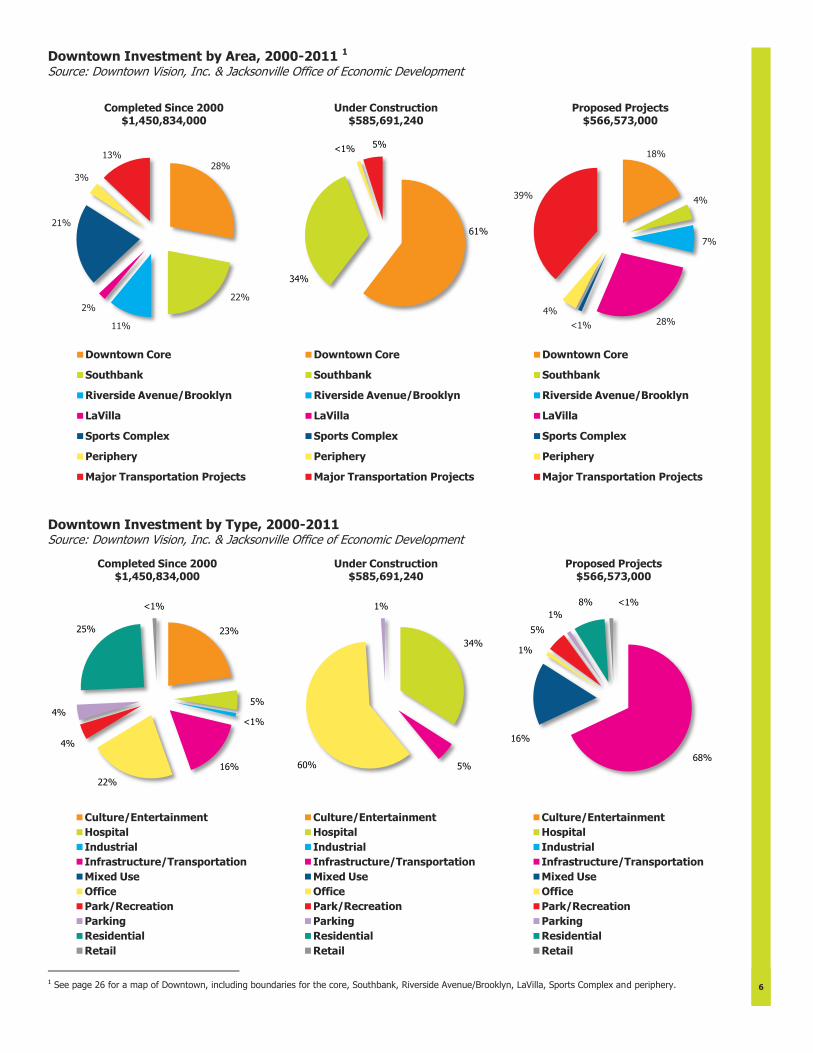
Downtown Investment by Area, 2000-2011 1 Source: Downtown Vision, Inc. & Jacksonville Office of Economic Development
Downtown Investment by Type, 2000-2011 Source: Downtown Vision, Inc. & Jacksonville Office of Economic Development
1 See page 26 for a map of Downtown, including boundaries for the core, Southbank, Riverside Avenue/Brooklyn, LaVilla, Sports Complex and periphery.
28%
22%
11%
2%
21%
3%
13%
Completed Since 2000 $1,450,834,000
Downtown Core
Southbank
Riverside Avenue/Brooklyn
LaVilla
Sports Complex
Periphery
Major Transportation Projects
61%
34%
<1% 5%
Under Construction $585,691,240
Downtown Core
Southbank
Riverside Avenue/Brooklyn
LaVilla
Sports Complex
Periphery
Major Transportation Projects
18%
4%
7%
28% <1%
4%
39%
Proposed Projects $566,573,000
Downtown Core
Southbank
Riverside Avenue/Brooklyn
LaVilla
Sports Complex
Periphery
Major Transportation Projects
23%
5%
<1%
16%
22%
4%
4%
25%
<1%
Completed Since 2000 $1,450,834,000
Culture/Entertainment
Hospital
Industrial
Infrastructure/Transportation
Mixed Use
Office
Park/Recreation
Parking
Residential
Retail
34%
5% 60%
1%
Under Construction $585,691,240
Culture/Entertainment
Hospital
Industrial
Infrastructure/Transportation
Mixed Use
Office
Park/Recreation
Parking
Residential
Retail
68%
16%
1%
5%
1%
8% <1%
Proposed Projects $566,573,000
Culture/Entertainment
Hospital
Industrial
Infrastructure/Transportation
Mixed Use
Office
Park/Recreation
Parking
Residential
Retail
6
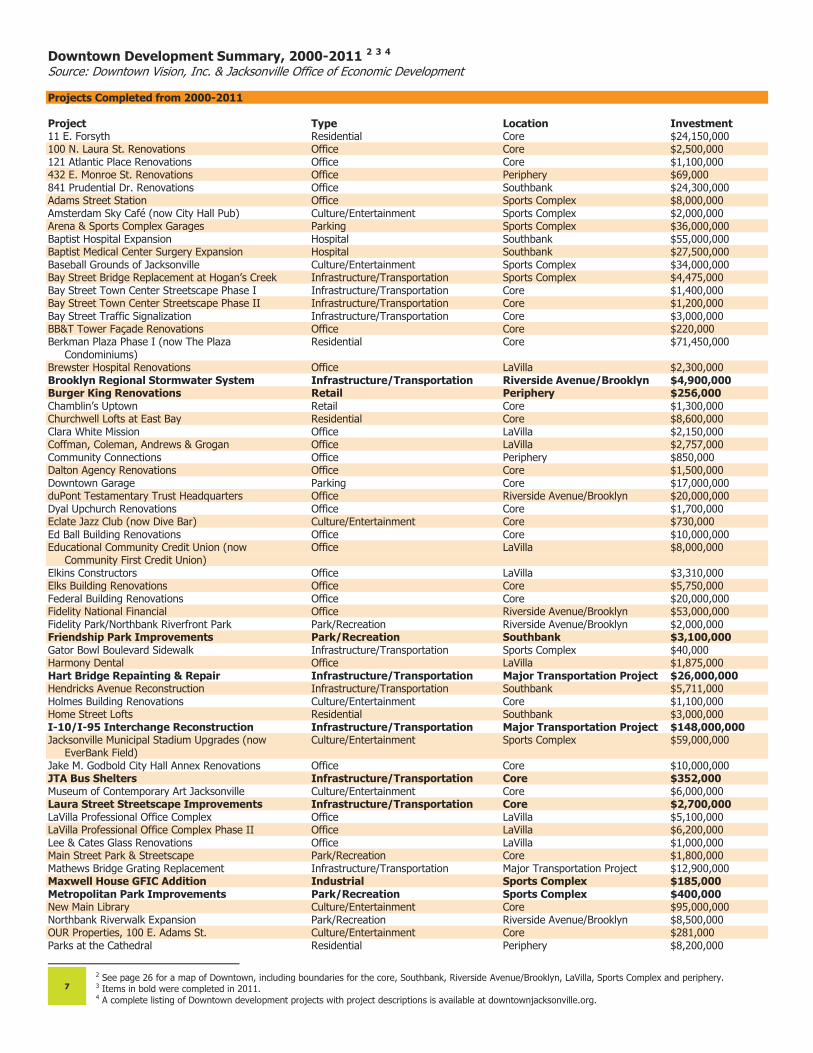
Downtown Development Summary, 2000-2011 2 3 4 Source: Downtown Vision, Inc. & Jacksonville Office of Economic Development Projects Completed from 2000-2011 Project Type Location Investment 11 E. Forsyth Residential Core $24,150,000 100 N. Laura St. Renovations Office Core $2,500,000 121 Atlantic Place Renovations Office Core $1,100,000 432 E. Monroe St. Renovations Office Periphery $69,000 841 Prudential Dr. Renovations Office Southbank $24,300,000 Adams Street Station Office Sports Complex $8,000,000 Amsterdam Sky Café (now City Hall Pub) Culture/Entertainment Sports Complex $2,000,000 Arena & Sports Complex Garages Parking Sports Complex $36,000,000 Baptist Hospital Expansion Hospital Southbank $55,000,000 Baptist Medical Center Surgery Expansion Hospital Southbank $27,500,000 Baseball Grounds of Jacksonville Culture/Entertainment Sports Complex $34,000,000 Bay Street Bridge Replacement at Hogan’s Creek Infrastructure/Transportation Sports Complex $4,475,000 Bay Street Town Center Streetscape Phase I Infrastructure/Transportation Core $1,400,000 Bay Street Town Center Streetscape Phase II Infrastructure/Transportation Core $1,200,000 Bay Street Traffic Signalization Infrastructure/Transportation Core $3,000,000 BB&T Tower Façade Renovations Office Core $220,000 Berkman Plaza Phase I (now The Plaza Residential Core $71,450,000 Condominiums) Brewster Hospital Renovations Office LaVilla $2,300,000 Brooklyn Regional Stormwater System Infrastructure/Transportation Riverside Avenue/Brooklyn $4,900,000 Burger King Renovations Retail Periphery $256,000 Chamblin’s Uptown Retail Core $1,300,000 Churchwell Lofts at East Bay Residential Core $8,600,000 Clara White Mission Office LaVilla $2,150,000 Coffman, Coleman, Andrews & Grogan Office LaVilla $2,757,000 Community Connections Office Periphery $850,000 Dalton Agency Renovations Office Core $1,500,000 Downtown Garage Parking Core $17,000,000 duPont Testamentary Trust Headquarters Office Riverside Avenue/Brooklyn $20,000,000 Dyal Upchurch Renovations Office Core $1,700,000 Eclate Jazz Club (now Dive Bar) Culture/Entertainment Core $730,000 Ed Ball Building Renovations Office Core $10,000,000 Educational Community Credit Union (now Office LaVilla $8,000,000 Community First Credit Union) Elkins Constructors Office LaVilla $3,310,000 Elks Building Renovations Office Core $5,750,000 Federal Building Renovations Office Core $20,000,000 Fidelity National Financial Office Riverside Avenue/Brooklyn $53,000,000 Fidelity Park/Northbank Riverfront Park Park/Recreation Riverside Avenue/Brooklyn $2,000,000 Friendship Park Improvements Park/Recreation Southbank $3,100,000 Gator Bowl Boulevard Sidewalk Infrastructure/Transportation Sports Complex $40,000 Harmony Dental Office LaVilla $1,875,000 Hart Bridge Repainting & Repair Infrastructure/Transportation Major Transportation Project $26,000,000 Hendricks Avenue Reconstruction Infrastructure/Transportation Southbank $5,711,000 Holmes Building Renovations Culture/Entertainment Core $1,100,000 Home Street Lofts Residential Southbank $3,000,000 I-10/I-95 Interchange Reconstruction Infrastructure/Transportation Major Transportation Project $148,000,000 Jacksonville Municipal Stadium Upgrades (now Culture/Entertainment Sports Complex $59,000,000 EverBank Field) Jake M. Godbold City Hall Annex Renovations Office Core $10,000,000 JTA Bus Shelters Infrastructure/Transportation Core $352,000 Museum of Contemporary Art Jacksonville Culture/Entertainment Core $6,000,000 Laura Street Streetscape Improvements Infrastructure/Transportation Core $2,700,000 LaVilla Professional Office Complex Office LaVilla $5,100,000 LaVilla Professional Office Complex Phase II Office LaVilla $6,200,000 Lee & Cates Glass Renovations Office LaVilla $1,000,000 Main Street Park & Streetscape Park/Recreation Core $1,800,000 Mathews Bridge Grating Replacement Infrastructure/Transportation Major Transportation Project $12,900,000 Maxwell House GFIC Addition Industrial Sports Complex $185,000 Metropolitan Park Improvements Park/Recreation Sports Complex $400,000 New Main Library Culture/Entertainment Core $95,000,000 Northbank Riverwalk Expansion Park/Recreation Riverside Avenue/Brooklyn $8,500,000 OUR Properties, 100 E. Adams St. Culture/Entertainment Core $281,000 Parks at the Cathedral Residential Periphery $8,200,000
2 See page 26 for a map of Downtown, including boundaries for the core, Southbank, Riverside Avenue/Brooklyn, LaVilla, Sports Complex and periphery. 3 Items in bold were completed in 2011. 4 A complete listing of Downtown development projects with project descriptions is available at downtownjacksonville.org.
3
3
7
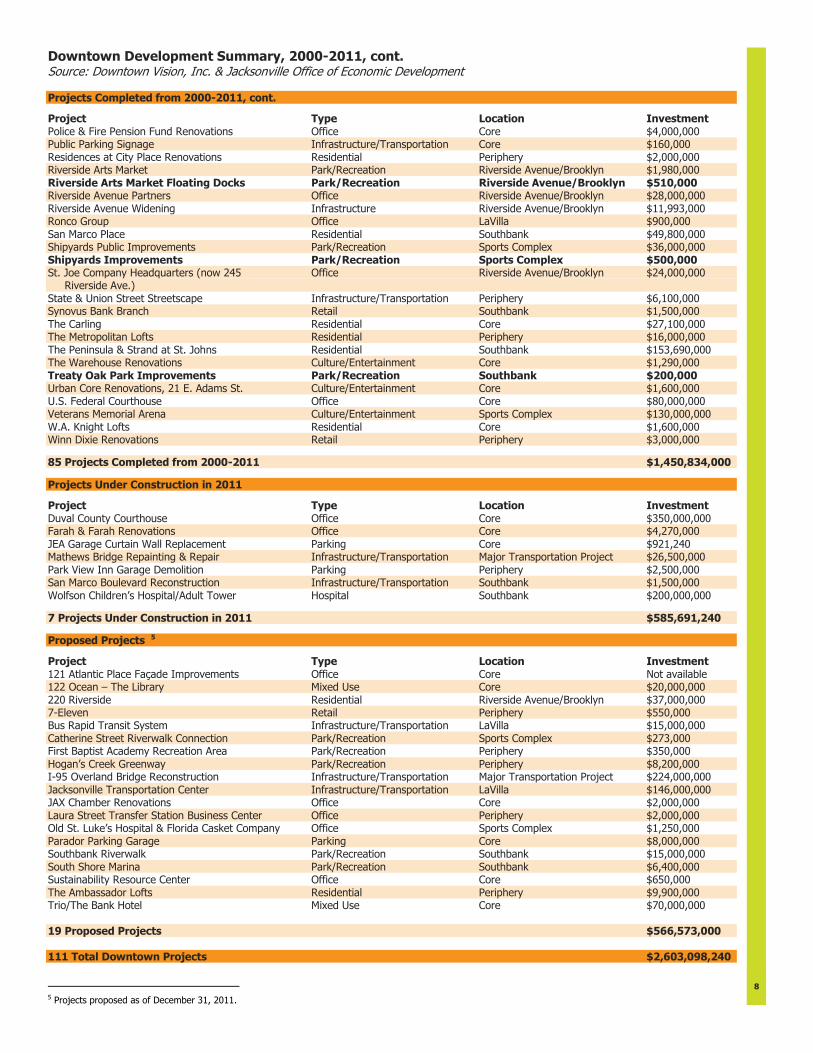
Downtown Development Summary, 2000-2011, cont. Source: Downtown Vision, Inc. & Jacksonville Office of Economic Development Projects Completed from 2000-2011, cont.
Project Type Location Investment Police & Fire Pension Fund Renovations Office Core $4,000,000 Public Parking Signage Infrastructure/Transportation Core $160,000 Residences at City Place Renovations Residential Periphery $2,000,000 Riverside Arts Market Park/Recreation Riverside Avenue/Brooklyn $1,980,000 Riverside Arts Market Floating Docks Park/Recreation Riverside Avenue/Brooklyn $510,000 Riverside Avenue Partners Office Riverside Avenue/Brooklyn $28,000,000 Riverside Avenue Widening Infrastructure Riverside Avenue/Brooklyn $11,993,000 Ronco Group Office LaVilla $900,000 San Marco Place Residential Southbank $49,800,000 Shipyards Public Improvements Park/Recreation Sports Complex $36,000,000 Shipyards Improvements Park/Recreation Sports Complex $500,000 St. Joe Company Headquarters (now 245 Office Riverside Avenue/Brooklyn $24,000,000 Riverside Ave.) State & Union Street Streetscape Infrastructure/Transportation Periphery $6,100,000 Synovus Bank Branch Retail Southbank $1,500,000 The Carling Residential Core $27,100,000 The Metropolitan Lofts Residential Periphery $16,000,000 The Peninsula & Strand at St. Johns Residential Southbank $153,690,000 The Warehouse Renovations Culture/Entertainment Core $1,290,000 Treaty Oak Park Improvements Park/Recreation Southbank $200,000 Urban Core Renovations, 21 E. Adams St. Culture/Entertainment Core $1,600,000 U.S. Federal Courthouse Office Core $80,000,000 Veterans Memorial Arena Culture/Entertainment Sports Complex $130,000,000 W.A. Knight Lofts Residential Core $1,600,000 Winn Dixie Renovations Retail Periphery $3,000,000
85 Projects Completed from 2000-2011 $1,450,834,000
Projects Under Construction in 2011
Project Type Location Investment Duval County Courthouse Office Core $350,000,000 Farah & Farah Renovations Office Core $4,270,000 JEA Garage Curtain Wall Replacement Parking Core $921,240 Mathews Bridge Repainting & Repair Infrastructure/Transportation Major Transportation Project $26,500,000 Park View Inn Garage Demolition Parking Periphery $2,500,000 San Marco Boulevard Reconstruction Infrastructure/Transportation Southbank $1,500,000 Wolfson Children’s Hospital/Adult Tower Hospital Southbank $200,000,000
7 Projects Under Construction in 2011 $585,691,240
Proposed Projects 5
Project Type Location Investment 121 Atlantic Place Façade Improvements Office Core Not available 122 Ocean – The Library Mixed Use Core $20,000,000 220 Riverside Residential Riverside Avenue/Brooklyn $37,000,000 7-Eleven Retail Periphery $550,000 Bus Rapid Transit System Infrastructure/Transportation LaVilla $15,000,000 Catherine Street Riverwalk Connection Park/Recreation Sports Complex $273,000 First Baptist Academy Recreation Area Park/Recreation Periphery $350,000 Hogan’s Creek Greenway Park/Recreation Periphery $8,200,000 I-95 Overland Bridge Reconstruction Infrastructure/Transportation Major Transportation Project $224,000,000 Jacksonville Transportation Center Infrastructure/Transportation LaVilla $146,000,000 JAX Chamber Renovations Office Core $2,000,000 Laura Street Transfer Station Business Center Office Periphery $2,000,000 Old St. Luke’s Hospital & Florida Casket Company Office Sports Complex $1,250,000 Parador Parking Garage Parking Core $8,000,000 Southbank Riverwalk Park/Recreation Southbank $15,000,000 South Shore Marina Park/Recreation Southbank $6,400,000 Sustainability Resource Center Office Core $650,000 The Ambassador Lofts Residential Periphery $9,900,000 Trio/The Bank Hotel Mixed Use Core $70,000,000 19 Proposed Projects $566,573,000 111 Total Downtown Projects $2,603,098,240
5 Projects proposed as of December 31, 2011.
3
8
Downtown Jacksonville
has the most affordable central business district
office space in Florida.
Bank of America Tower achieved LEED
certification in 2011, furthering Downtown’s
position as one of the most sustainable
neighborhoods in Jacksonville.
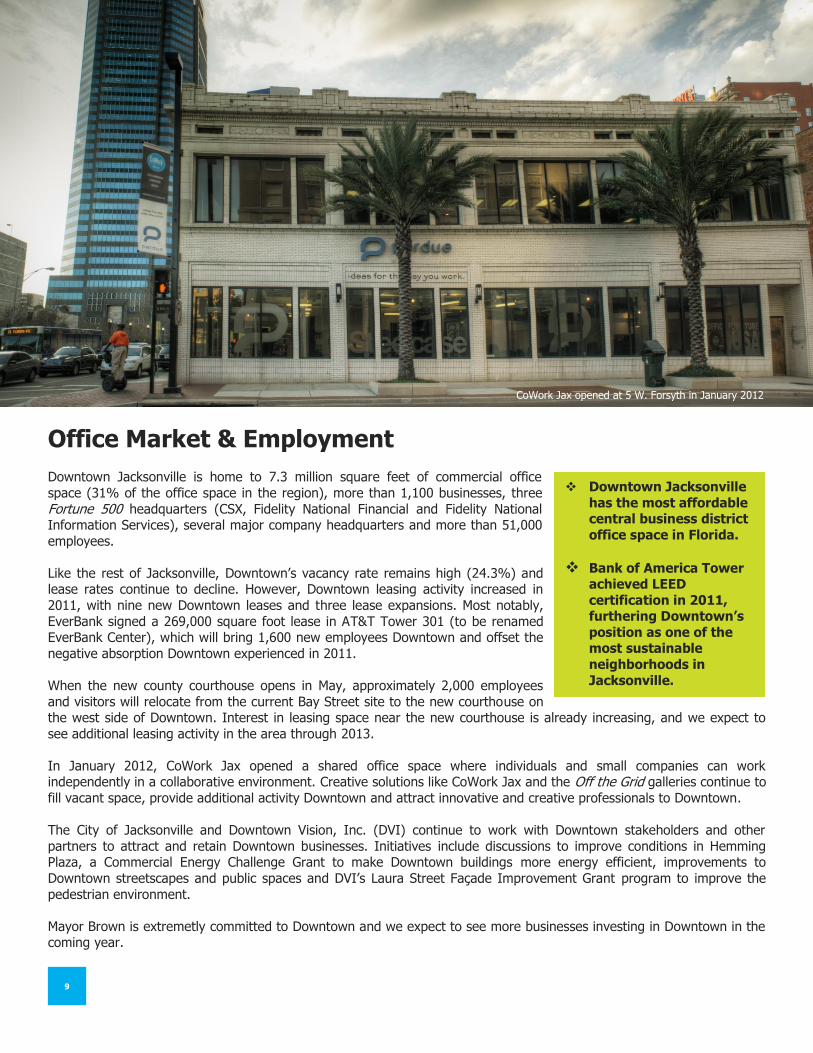
Office Market & Employment Downtown Jacksonville is home to 7.3 million square feet of commercial office
space (31% of the office space in the region), more than 1,100 businesses, three
Fortune 500 headquarters (CSX, Fidelity National Financial and Fidelity National Information Services), several major company headquarters and more than 51,000
employees.
Like the rest of Jacksonville, Downtown’s vacancy rate remains high (24.3%) and lease rates continue to decline. However, Downtown leasing activity increased in
2011, with nine new Downtown leases and three lease expansions. Most notably,
EverBank signed a 269,000 square foot lease in AT&T Tower 301 (to be renamed EverBank Center), which will bring 1,600 new employees Downtown and offset the
negative absorption Downtown experienced in 2011.
When the new county courthouse opens in May, approximately 2,000 employees
and visitors will relocate from the current Bay Street site to the new courthouse on the west side of Downtown. Interest in leasing space near the new courthouse is already increasing, and we expect to
see additional leasing activity in the area through 2013.
In January 2012, CoWork Jax opened a shared office space where individuals and small companies can work independently in a collaborative environment. Creative solutions like CoWork Jax and the Off the Grid galleries continue to
fill vacant space, provide additional activity Downtown and attract innovative and creative professionals to Downtown.
The City of Jacksonville and Downtown Vision, Inc. (DVI) continue to work with Downtown stakeholders and other
partners to attract and retain Downtown businesses. Initiatives include discussions to improve conditions in Hemming Plaza, a Commercial Energy Challenge Grant to make Downtown buildings more energy efficient, improvements to
Downtown streetscapes and public spaces and DVI’s Laura Street Façade Improvement Grant program to improve the
pedestrian environment.
Mayor Brown is extremetly committed to Downtown and we expect to see more businesses investing in Downtown in the coming year.
4
9
CoWork Jax opened at 5 W. Forsyth in January 2012
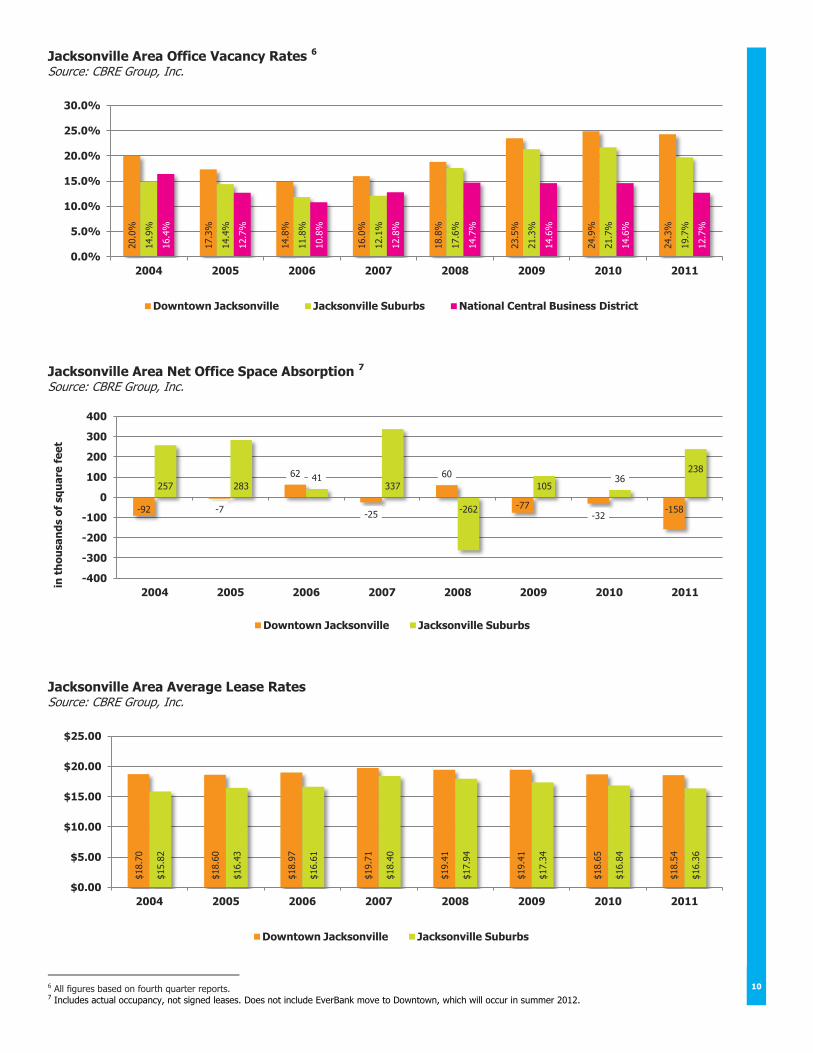
Jacksonville Area Office Vacancy Rates 6 Source: CBRE Group, Inc.
Jacksonville Area Net Office Space Absorption 7 Source: CBRE Group, Inc.
Jacksonville Area Average Lease Rates Source: CBRE Group, Inc.
6 All figures based on fourth quarter reports. 7 Includes actual occupancy, not signed leases. Does not include EverBank move to Downtown, which will occur in summer 2012.
20.0
%
17.3
%
14.8
%
16.0
%
18.8
%
23.5
%
24.9
%
24.3
%
14.9
%
14.4
%
11.8
%
12.1
%
17.6
%
21.3
%
21.7
%
19.7
%
16.4
%
12.7
%
10.8
%
12.8
%
14.7
%
14.6
%
14.6
%
12.7
%
0.0%
5.0%
10.0%
15.0%
20.0%
25.0%
30.0%
2004 2005 2006 2007 2008 2009 2010 2011
Downtown Jacksonville Jacksonville Suburbs National Central Business District
-92 -7
62
-25
60
-77 -32
-158
257 283 41
337
-262
105 36
238
-400
-300
-200
-100
0
100
200
300
400
2004 2005 2006 2007 2008 2009 2010 2011
in t
ho
usa
nd
s o
f sq
ua
re f
ee
t
Downtown Jacksonville Jacksonville Suburbs
$18.7
0
$18.6
0
$18.9
7
$19.7
1
$19.4
1
$19.4
1
$18.6
5
$18.5
4
$15.8
2
$16.4
3
$16.6
1
$18.4
0
$17.9
4
$17.3
4
$16.8
4
$16.3
6
$0.00
$5.00
$10.00
$15.00
$20.00
$25.00
2004 2005 2006 2007 2008 2009 2010 2011
Downtown Jacksonville Jacksonville Suburbs
10
10
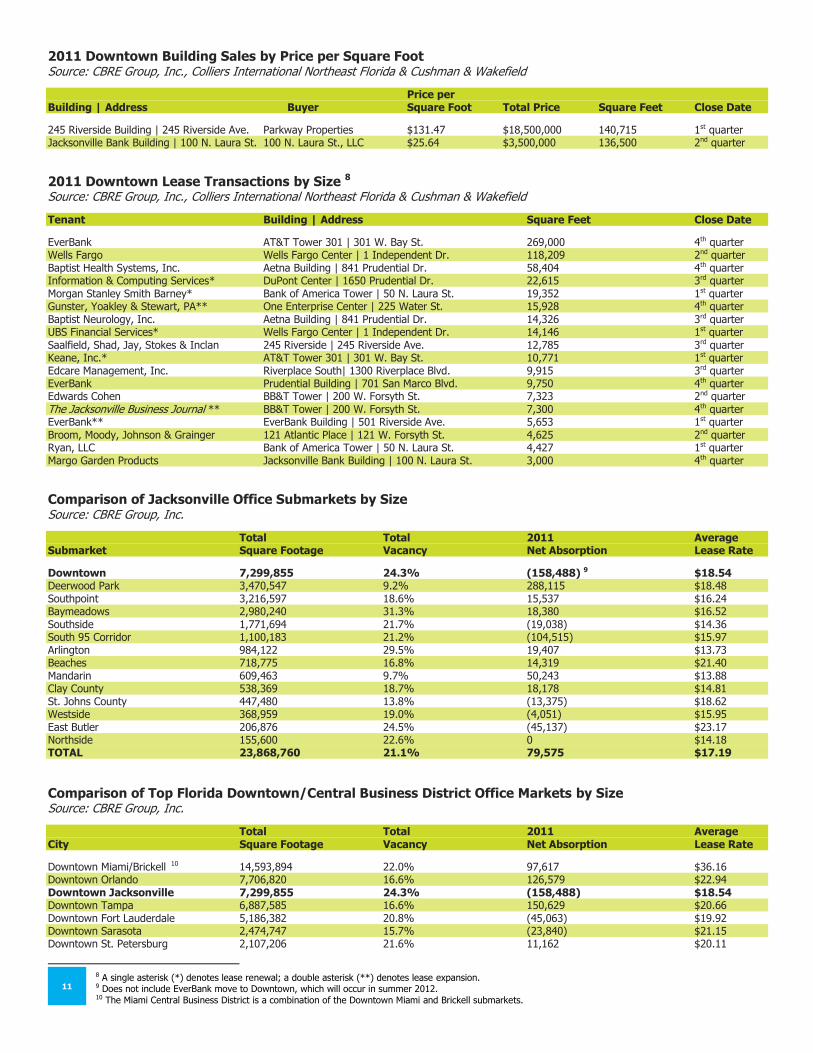
2011 Downtown Building Sales by Price per Square Foot Source: CBRE Group, Inc., Colliers International Northeast Florida & Cushman & Wakefield
Price per Building | Address Buyer Square Foot Total Price Square Feet Close Date
245 Riverside Building | 245 Riverside Ave. Parkway Properties $131.47 $18,500,000 140,715 1st quarter Jacksonville Bank Building | 100 N. Laura St. 100 N. Laura St., LLC $25.64 $3,500,000 136,500 2nd quarter
2011 Downtown Lease Transactions by Size 8 Source: CBRE Group, Inc., Colliers International Northeast Florida & Cushman & Wakefield
Tenant Building | Address Square Feet Close Date
EverBank AT&T Tower 301 | 301 W. Bay St. 269,000 4th quarter Wells Fargo Wells Fargo Center | 1 Independent Dr. 118,209 2nd quarter Baptist Health Systems, Inc. Aetna Building | 841 Prudential Dr. 58,404 4th quarter Information & Computing Services* DuPont Center | 1650 Prudential Dr. 22,615 3rd quarter Morgan Stanley Smith Barney* Bank of America Tower | 50 N. Laura St. 19,352 1st quarter Gunster, Yoakley & Stewart, PA** One Enterprise Center | 225 Water St. 15,928 4th quarter Baptist Neurology, Inc. Aetna Building | 841 Prudential Dr. 14,326 3rd quarter UBS Financial Services* Wells Fargo Center | 1 Independent Dr. 14,146 1st quarter Saalfield, Shad, Jay, Stokes & Inclan 245 Riverside | 245 Riverside Ave. 12,785 3rd quarter Keane, Inc.* AT&T Tower 301 | 301 W. Bay St. 10,771 1st quarter Edcare Management, Inc. Riverplace South| 1300 Riverplace Blvd. 9,915 3rd quarter EverBank Prudential Building | 701 San Marco Blvd. 9,750 4th quarter Edwards Cohen BB&T Tower | 200 W. Forsyth St. 7,323 2nd quarter The Jacksonville Business Journal ** BB&T Tower | 200 W. Forsyth St. 7,300 4th quarter EverBank** EverBank Building | 501 Riverside Ave. 5,653 1st quarter Broom, Moody, Johnson & Grainger 121 Atlantic Place | 121 W. Forsyth St. 4,625 2nd quarter Ryan, LLC Bank of America Tower | 50 N. Laura St. 4,427 1st quarter Margo Garden Products Jacksonville Bank Building | 100 N. Laura St. 3,000 4th quarter
Comparison of Jacksonville Office Submarkets by Size Source: CBRE Group, Inc.
Total Total 2011 Average Submarket Square Footage Vacancy Net Absorption Lease Rate
Downtown 7,299,855 24.3% (158,488) 9 $18.54 Deerwood Park 3,470,547 9.2% 288,115 $18.48 Southpoint 3,216,597 18.6% 15,537 $16.24 Baymeadows 2,980,240 31.3% 18,380 $16.52 Southside 1,771,694 21.7% (19,038) $14.36 South 95 Corridor 1,100,183 21.2% (104,515) $15.97 Arlington 984,122 29.5% 19,407 $13.73 Beaches 718,775 16.8% 14,319 $21.40 Mandarin 609,463 9.7% 50,243 $13.88 Clay County 538,369 18.7% 18,178 $14.81 St. Johns County 447,480 13.8% (13,375) $18.62 Westside 368,959 19.0% (4,051) $15.95 East Butler 206,876 24.5% (45,137) $23.17 Northside 155,600 22.6% 0 $14.18 TOTAL 23,868,760 21.1% 79,575 $17.19
Comparison of Top Florida Downtown/Central Business District Office Markets by Size Source: CBRE Group, Inc.
Total Total 2011 Average City Square Footage Vacancy Net Absorption Lease Rate
Downtown Miami/Brickell 10 14,593,894 22.0% 97,617 $36.16 Downtown Orlando 7,706,820 16.6% 126,579 $22.94 Downtown Jacksonville 7,299,855 24.3% (158,488) $18.54 Downtown Tampa 6,887,585 16.6% 150,629 $20.66 Downtown Fort Lauderdale 5,186,382 20.8% (45,063) $19.92 Downtown Sarasota 2,474,747 15.7% (23,840) $21.15 Downtown St. Petersburg 2,107,206 21.6% 11,162 $20.11
8 A single asterisk (*) denotes lease renewal; a double asterisk (**) denotes lease expansion. 9 Does not include EverBank move to Downtown, which will occur in summer 2012.
10 The Miami Central Business District is a combination of the Downtown Miami and Brickell submarkets.
11
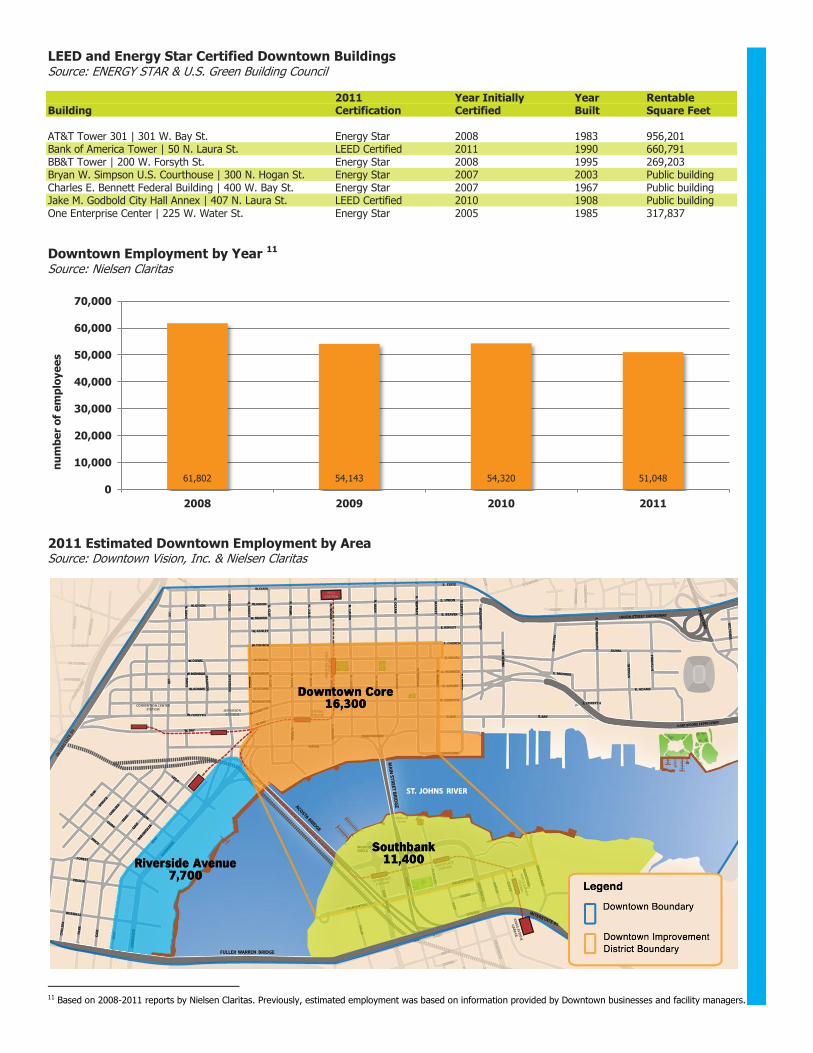
LEED and Energy Star Certified Downtown Buildings Source: ENERGY STAR & U.S. Green Building Council 2011 Year Initially Year Rentable Building Certification Certified Built Square Feet AT&T Tower 301 | 301 W. Bay St. Energy Star 2008 1983 956,201 Bank of America Tower | 50 N. Laura St. LEED Certified 2011 1990 660,791 BB&T Tower | 200 W. Forsyth St. Energy Star 2008 1995 269,203 Bryan W. Simpson U.S. Courthouse | 300 N. Hogan St. Energy Star 2007 2003 Public building Charles E. Bennett Federal Building | 400 W. Bay St. Energy Star 2007 1967 Public building Jake M. Godbold City Hall Annex | 407 N. Laura St. LEED Certified 2010 1908 Public building One Enterprise Center | 225 W. Water St. Energy Star 2005 1985 317,837
Downtown Employment by Year 11 Source: Nielsen Claritas
2011 Estimated Downtown Employment by Area Source: Downtown Vision, Inc. & Nielsen Claritas
11 Based on 2008-2011 reports by Nielsen Claritas. Previously, estimated employment was based on information provided by Downtown businesses and facility managers.
61,802 54,143 54,320 51,048
0
10,000
20,000
30,000
40,000
50,000
60,000
70,000
2008 2009 2010 2011
nu
mb
er
of
em
plo
ye
es
11
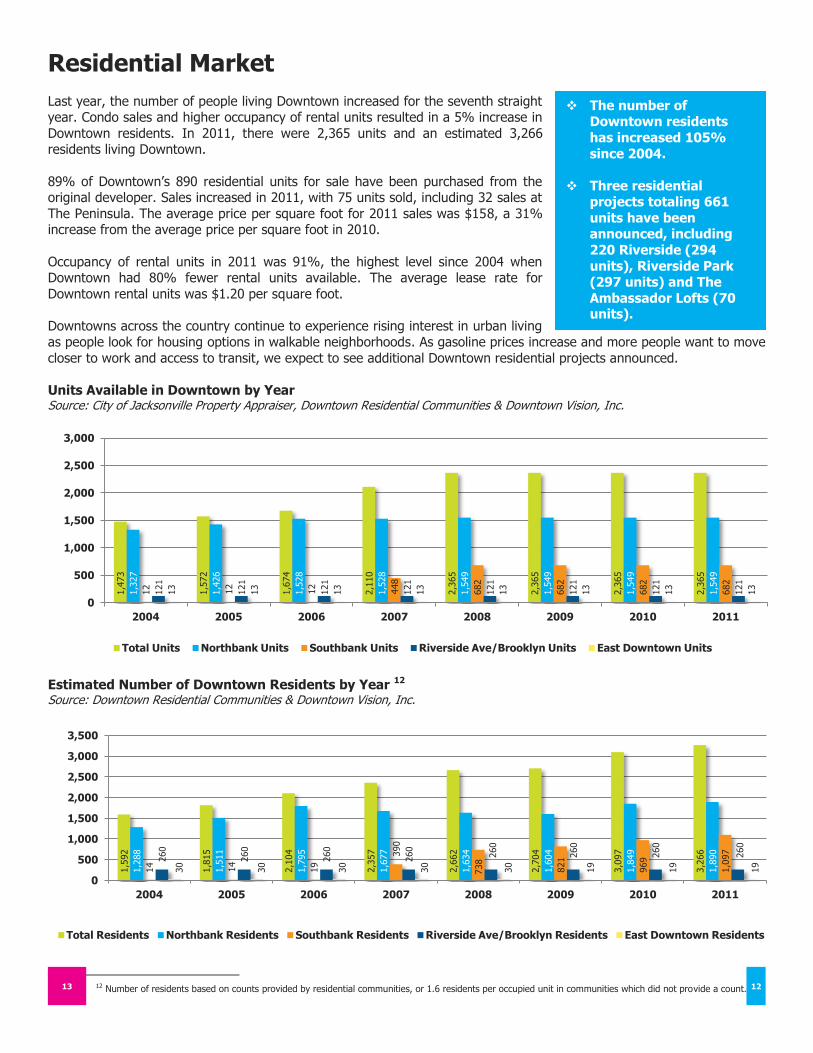
The number of Downtown residents
has increased 105%
since 2004.
Three residential projects totaling 661
units have been announced, including
220 Riverside (294
units), Riverside Park (297 units) and The
Ambassador Lofts (70 units).
Residential Market
Last year, the number of people living Downtown increased for the seventh straight year. Condo sales and higher occupancy of rental units resulted in a 5% increase in
Downtown residents. In 2011, there were 2,365 units and an estimated 3,266 residents living Downtown.
89% of Downtown’s 890 residential units for sale have been purchased from the original developer. Sales increased in 2011, with 75 units sold, including 32 sales at
The Peninsula. The average price per square foot for 2011 sales was $158, a 31% increase from the average price per square foot in 2010.
Occupancy of rental units in 2011 was 91%, the highest level since 2004 when Downtown had 80% fewer rental units available. The average lease rate for
Downtown rental units was $1.20 per square foot.
Downtowns across the country continue to experience rising interest in urban living as people look for housing options in walkable neighborhoods. As gasoline prices increase and more people want to move
closer to work and access to transit, we expect to see additional Downtown residential projects announced.
Units Available in Downtown by Year Source: City of Jacksonville Property Appraiser, Downtown Residential Communities & Downtown Vision, Inc.
Estimated Number of Downtown Residents by Year 12 Source: Downtown Residential Communities & Downtown Vision, Inc.
12 Number of residents based on counts provided by residential communities, or 1.6 residents per occupied unit in communities which did not provide a count.
1,4
73
1,5
72
1,6
74
2,1
10
2,3
65
2,3
65
2,3
65
2,3
65
1,3
27
1,4
26
1,5
28
1,5
28
1,5
49
1,5
49
1,5
49
1,5
49
12
12
12
448
682
682
682
682
121
121
121
121
121
121
121
121
13
13
13
13
13
13
13
13
0
500
1,000
1,500
2,000
2,500
3,000
2004 2005 2006 2007 2008 2009 2010 2011
Total Units Northbank Units Southbank Units Riverside Ave/Brooklyn Units East Downtown Units
1,5
92
1,8
15
2,1
04
2,3
57
2,6
62
2,7
04
3,0
97
3,2
66
1,2
88
1,5
11
1,7
95
1,6
77
1,6
34
1,6
04
1,8
49
1,8
90
14
14
19
390
738
821
969
1,0
97
260
260
260
260
260
260
260
260
30
30
30
30
30
19
19
19
0
500
1,000
1,500
2,000
2,500
3,000
3,500
2004 2005 2006 2007 2008 2009 2010 2011
Total Residents Northbank Residents Southbank Residents Riverside Ave/Brooklyn Residents East Downtown Residents
6
13 12
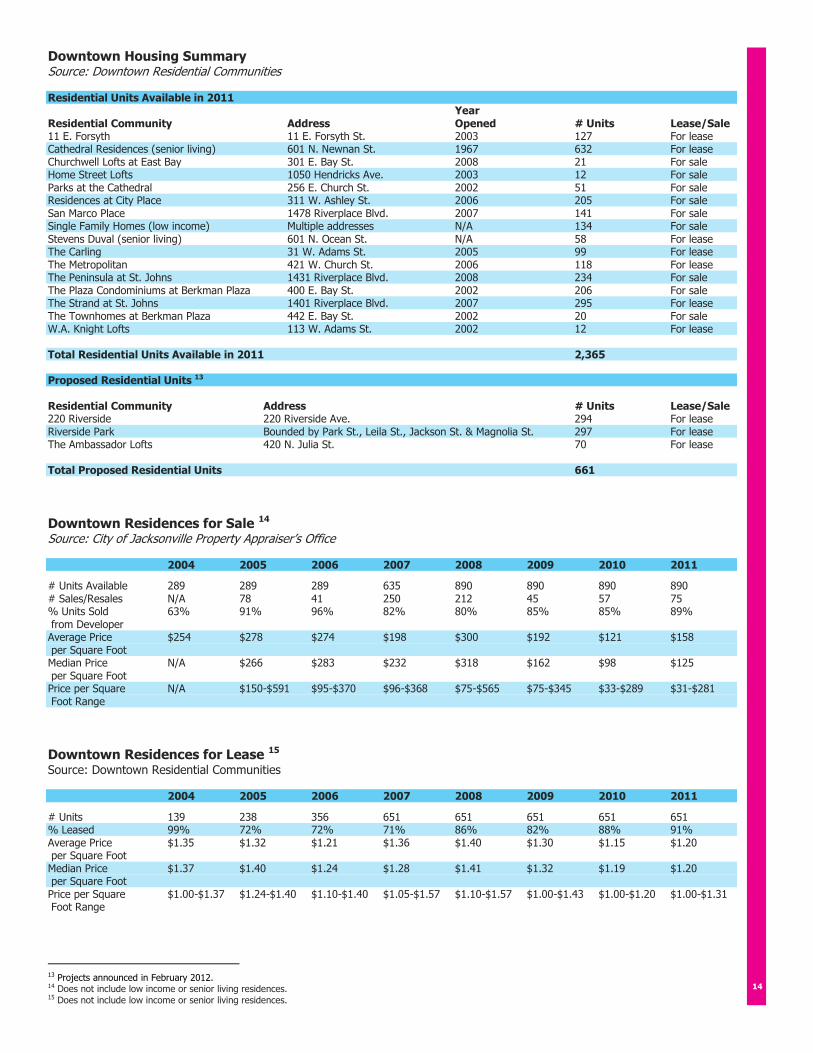
Downtown Housing Summary Source: Downtown Residential Communities Residential Units Available in 2011 Year Residential Community Address Opened # Units Lease/Sale 11 E. Forsyth 11 E. Forsyth St. 2003 127 For lease Cathedral Residences (senior living) 601 N. Newnan St. 1967 632 For lease Churchwell Lofts at East Bay 301 E. Bay St. 2008 21 For sale Home Street Lofts 1050 Hendricks Ave. 2003 12 For sale Parks at the Cathedral 256 E. Church St. 2002 51 For sale Residences at City Place 311 W. Ashley St. 2006 205 For sale San Marco Place 1478 Riverplace Blvd. 2007 141 For sale Single Family Homes (low income) Multiple addresses N/A 134 For sale Stevens Duval (senior living) 601 N. Ocean St. N/A 58 For lease The Carling 31 W. Adams St. 2005 99 For lease The Metropolitan 421 W. Church St. 2006 118 For lease The Peninsula at St. Johns 1431 Riverplace Blvd. 2008 234 For sale The Plaza Condominiums at Berkman Plaza 400 E. Bay St. 2002 206 For sale The Strand at St. Johns 1401 Riverplace Blvd. 2007 295 For lease The Townhomes at Berkman Plaza 442 E. Bay St. 2002 20 For sale W.A. Knight Lofts 113 W. Adams St. 2002 12 For lease Total Residential Units Available in 2011 2,365 Proposed Residential Units 13 Residential Community Address # Units Lease/Sale 220 Riverside 220 Riverside Ave. 294 For lease Riverside Park Bounded by Park St., Leila St., Jackson St. & Magnolia St. 297 For lease The Ambassador Lofts 420 N. Julia St. 70 For lease Total Proposed Residential Units 661
Downtown Residences for Sale 14 Source: City of Jacksonville Property Appraiser’s Office 2004 2005 2006 2007 2008 2009 2010 2011
# Units Available 289 289 289 635 890 890 890 890 # Sales/Resales N/A 78 41 250 212 45 57 75 % Units Sold 63% 91% 96% 82% 80% 85% 85% 89% from Developer Average Price $254 $278 $274 $198 $300 $192 $121 $158 per Square Foot Median Price N/A $266 $283 $232 $318 $162 $98 $125 per Square Foot Price per Square N/A $150-$591 $95-$370 $96-$368 $75-$565 $75-$345 $33-$289 $31-$281 Foot Range
Downtown Residences for Lease 15 Source: Downtown Residential Communities 2004 2005 2006 2007 2008 2009 2010 2011
# Units 139 238 356 651 651 651 651 651 % Leased 99% 72% 72% 71% 86% 82% 88% 91% Average Price $1.35 $1.32 $1.21 $1.36 $1.40 $1.30 $1.15 $1.20 per Square Foot Median Price $1.37 $1.40 $1.24 $1.28 $1.41 $1.32 $1.19 $1.20 per Square Foot Price per Square $1.00-$1.37 $1.24-$1.40 $1.10-$1.40 $1.05-$1.57 $1.10-$1.57 $1.00-$1.43 $1.00-$1.20 $1.00-$1.31 Foot Range
13 Projects announced in February 2012. 14 Does not include low income or senior living residences. 15 Does not include low income or senior living residences.
7
14
Downtown’s riverwalk is
2.77 miles.
The City of Jacksonville invested more than $4.7
million in improvements
to Downtown parks and pedestrian public spaces
in 2011.
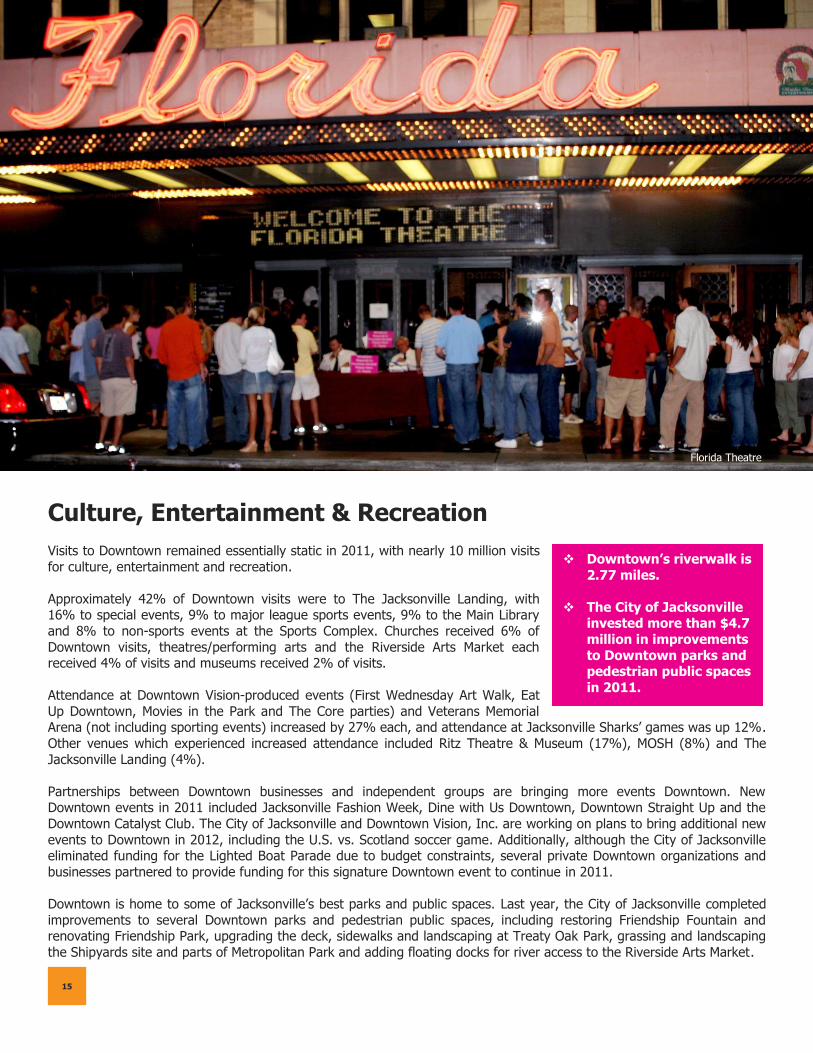
Culture, Entertainment & Recreation
Visits to Downtown remained essentially static in 2011, with nearly 10 million visits
for culture, entertainment and recreation.
Approximately 42% of Downtown visits were to The Jacksonville Landing, with 16% to special events, 9% to major league sports events, 9% to the Main Library
and 8% to non-sports events at the Sports Complex. Churches received 6% of
Downtown visits, theatres/performing arts and the Riverside Arts Market each received 4% of visits and museums received 2% of visits.
Attendance at Downtown Vision-produced events (First Wednesday Art Walk, Eat
Up Downtown, Movies in the Park and The Core parties) and Veterans Memorial Arena (not including sporting events) increased by 27% each, and attendance at Jacksonville Sharks’ games was up 12%.
Other venues which experienced increased attendance included Ritz Theatre & Museum (17%), MOSH (8%) and The
Jacksonville Landing (4%).
Partnerships between Downtown businesses and independent groups are bringing more events Downtown. New Downtown events in 2011 included Jacksonville Fashion Week, Dine with Us Downtown, Downtown Straight Up and the
Downtown Catalyst Club. The City of Jacksonville and Downtown Vision, Inc. are working on plans to bring additional new
events to Downtown in 2012, including the U.S. vs. Scotland soccer game. Additionally, although the City of Jacksonville eliminated funding for the Lighted Boat Parade due to budget constraints, several private Downtown organizations and
businesses partnered to provide funding for this signature Downtown event to continue in 2011.
Downtown is home to some of Jacksonville’s best parks and public spaces. Last year, the City of Jacksonville completed
improvements to several Downtown parks and pedestrian public spaces, including restoring Friendship Fountain and renovating Friendship Park, upgrading the deck, sidewalks and landscaping at Treaty Oak Park, grassing and landscaping
the Shipyards site and parts of Metropolitan Park and adding floating docks for river access to the Riverside Arts Market.
9 12
12
15
Florida Theatre
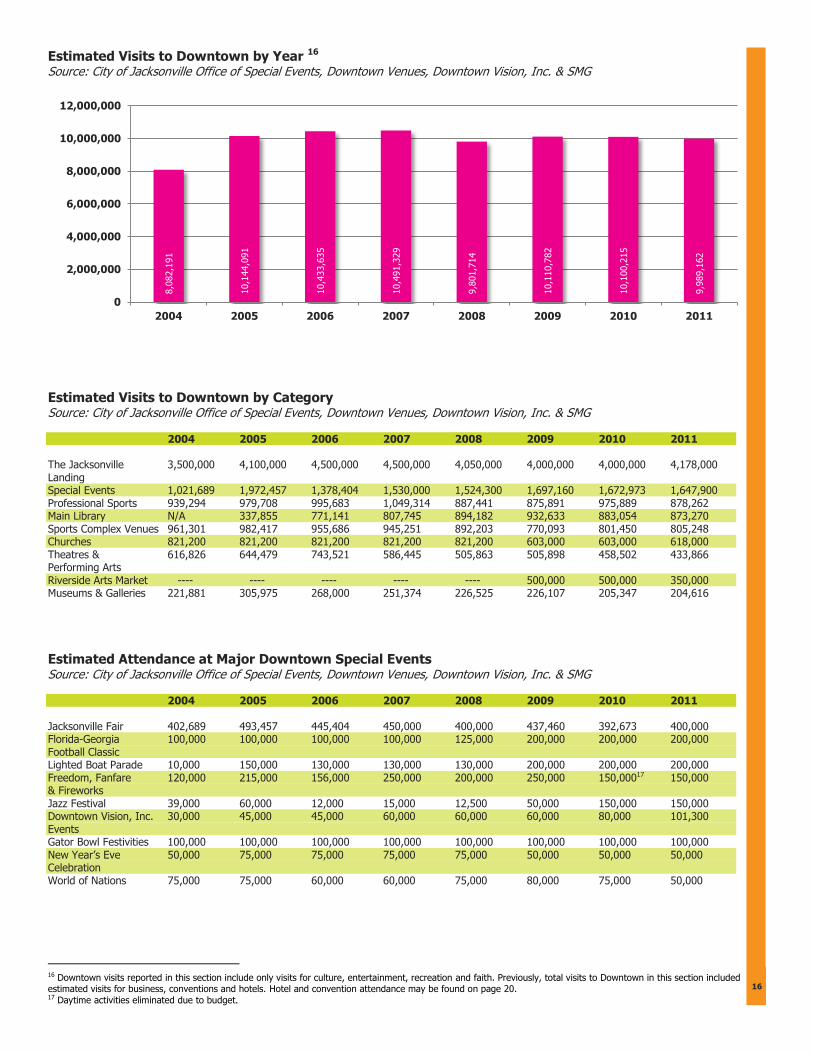
Estimated Visits to Downtown by Year 16 Source: City of Jacksonville Office of Special Events, Downtown Venues, Downtown Vision, Inc. & SMG
Estimated Visits to Downtown by Category Source: City of Jacksonville Office of Special Events, Downtown Venues, Downtown Vision, Inc. & SMG 2004 2005 2006 2007 2008 2009 2010 2011 The Jacksonville 3,500,000 4,100,000 4,500,000 4,500,000 4,050,000 4,000,000 4,000,000 4,178,000 Landing Special Events 1,021,689 1,972,457 1,378,404 1,530,000 1,524,300 1,697,160 1,672,973 1,647,900 Professional Sports 939,294 979,708 995,683 1,049,314 887,441 875,891 975,889 878,262 Main Library N/A 337,855 771,141 807,745 894,182 932,633 883,054 873,270 Sports Complex Venues 961,301 982,417 955,686 945,251 892,203 770,093 801,450 805,248 Churches 821,200 821,200 821,200 821,200 821,200 603,000 603,000 618,000 Theatres & 616,826 644,479 743,521 586,445 505,863 505,898 458,502 433,866 Performing Arts Riverside Arts Market ---- ---- ---- ---- ---- 500,000 500,000 350,000 Museums & Galleries 221,881 305,975 268,000 251,374 226,525 226,107 205,347 204,616
Estimated Attendance at Major Downtown Special Events Source: City of Jacksonville Office of Special Events, Downtown Venues, Downtown Vision, Inc. & SMG 2004 2005 2006 2007 2008 2009 2010 2011 Jacksonville Fair 402,689 493,457 445,404 450,000 400,000 437,460 392,673 400,000 Florida-Georgia 100,000 100,000 100,000 100,000 125,000 200,000 200,000 200,000 Football Classic Lighted Boat Parade 10,000 150,000 130,000 130,000 130,000 200,000 200,000 200,000 Freedom, Fanfare 120,000 215,000 156,000 250,000 200,000 250,000 150,00017 150,000 & Fireworks Jazz Festival 39,000 60,000 12,000 15,000 12,500 50,000 150,000 150,000 Downtown Vision, Inc. 30,000 45,000 45,000 60,000 60,000 60,000 80,000 101,300 Events Gator Bowl Festivities 100,000 100,000 100,000 100,000 100,000 100,000 100,000 100,000 New Year’s Eve 50,000 75,000 75,000 75,000 75,000 50,000 50,000 50,000 Celebration World of Nations 75,000 75,000 60,000 60,000 75,000 80,000 75,000 50,000
16 Downtown visits reported in this section include only visits for culture, entertainment, recreation and faith. Previously, total visits to Downtown in this section included estimated visits for business, conventions and hotels. Hotel and convention attendance may be found on page 20. 17 Daytime activities eliminated due to budget.
8,0
82,1
91
10,1
44,0
91
10,4
33,6
35
10,4
91,3
29
9,8
01,7
14
10,1
10,7
82
10,1
00,2
15
9,9
89,1
62
0
2,000,000
4,000,000
6,000,000
8,000,000
10,000,000
12,000,000
2004 2005 2006 2007 2008 2009 2010 2011
13
13
16
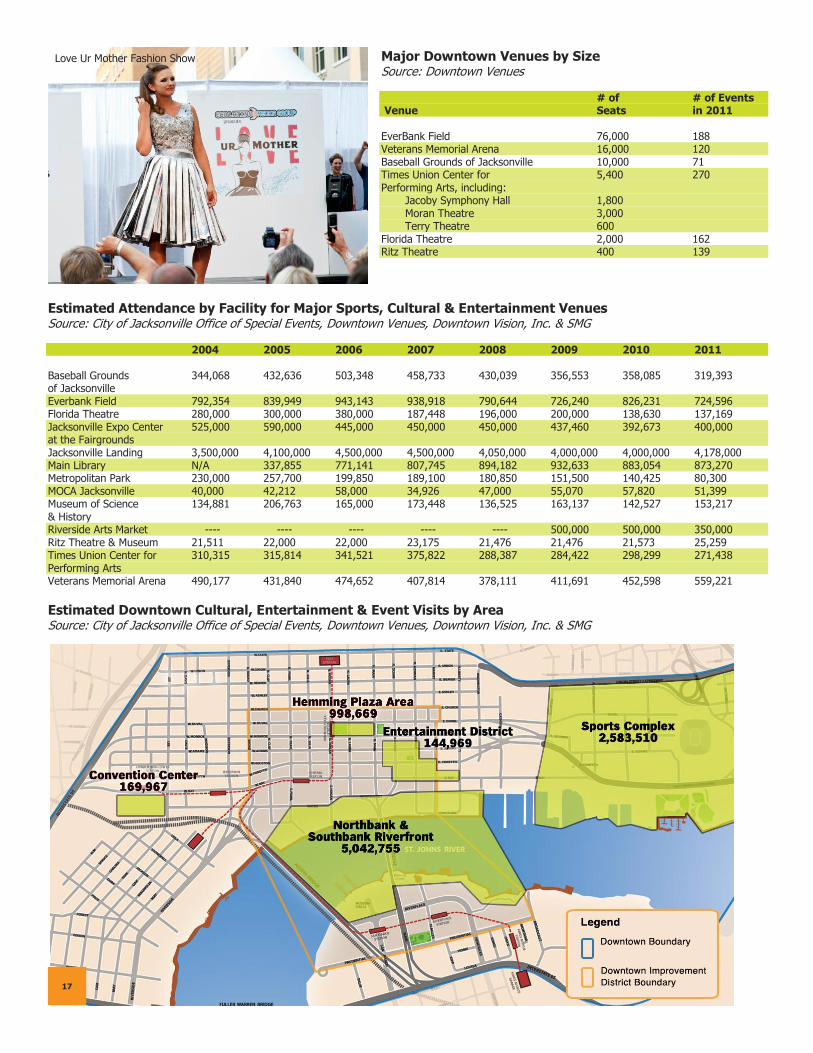
Major Downtown Venues by Size Source: Downtown Venues # of # of Events Venue Seats in 2011 EverBank Field 76,000 188 Veterans Memorial Arena 16,000 120 Baseball Grounds of Jacksonville 10,000 71 Times Union Center for 5,400 270 Performing Arts, including: Jacoby Symphony Hall 1,800 Moran Theatre 3,000 Terry Theatre 600 Florida Theatre 2,000 162 Ritz Theatre 400 139
Estimated Attendance by Facility for Major Sports, Cultural & Entertainment Venues Source: City of Jacksonville Office of Special Events, Downtown Venues, Downtown Vision, Inc. & SMG 2004 2005 2006 2007 2008 2009 2010 2011 Baseball Grounds 344,068 432,636 503,348 458,733 430,039 356,553 358,085 319,393 of Jacksonville Everbank Field 792,354 839,949 943,143 938,918 790,644 726,240 826,231 724,596 Florida Theatre 280,000 300,000 380,000 187,448 196,000 200,000 138,630 137,169 Jacksonville Expo Center 525,000 590,000 445,000 450,000 450,000 437,460 392,673 400,000 at the Fairgrounds Jacksonville Landing 3,500,000 4,100,000 4,500,000 4,500,000 4,050,000 4,000,000 4,000,000 4,178,000 Main Library N/A 337,855 771,141 807,745 894,182 932,633 883,054 873,270 Metropolitan Park 230,000 257,700 199,850 189,100 180,850 151,500 140,425 80,300 MOCA Jacksonville 40,000 42,212 58,000 34,926 47,000 55,070 57,820 51,399 Museum of Science 134,881 206,763 165,000 173,448 136,525 163,137 142,527 153,217 & History Riverside Arts Market ---- ---- ---- ---- ---- 500,000 500,000 350,000 Ritz Theatre & Museum 21,511 22,000 22,000 23,175 21,476 21,476 21,573 25,259 Times Union Center for 310,315 315,814 341,521 375,822 288,387 284,422 298,299 271,438 Performing Arts Veterans Memorial Arena 490,177 431,840 474,652 407,814 378,111 411,691 452,598 559,221
Estimated Downtown Cultural, Entertainment & Event Visits by Area Source: City of Jacksonville Office of Special Events, Downtown Venues, Downtown Vision, Inc. & SMG
14
17
Love Ur Mother Fashion Show
Temporary Off the Grid
galleries occupy 4% of vacant Downtown
Improvement District retail space.
Six new nightlife venues have opened Downtown
since January 2011.
There are 30 Downtown restaurants offering
dining at night and on
the weekends.
Retail, Restaurants & Nightlife
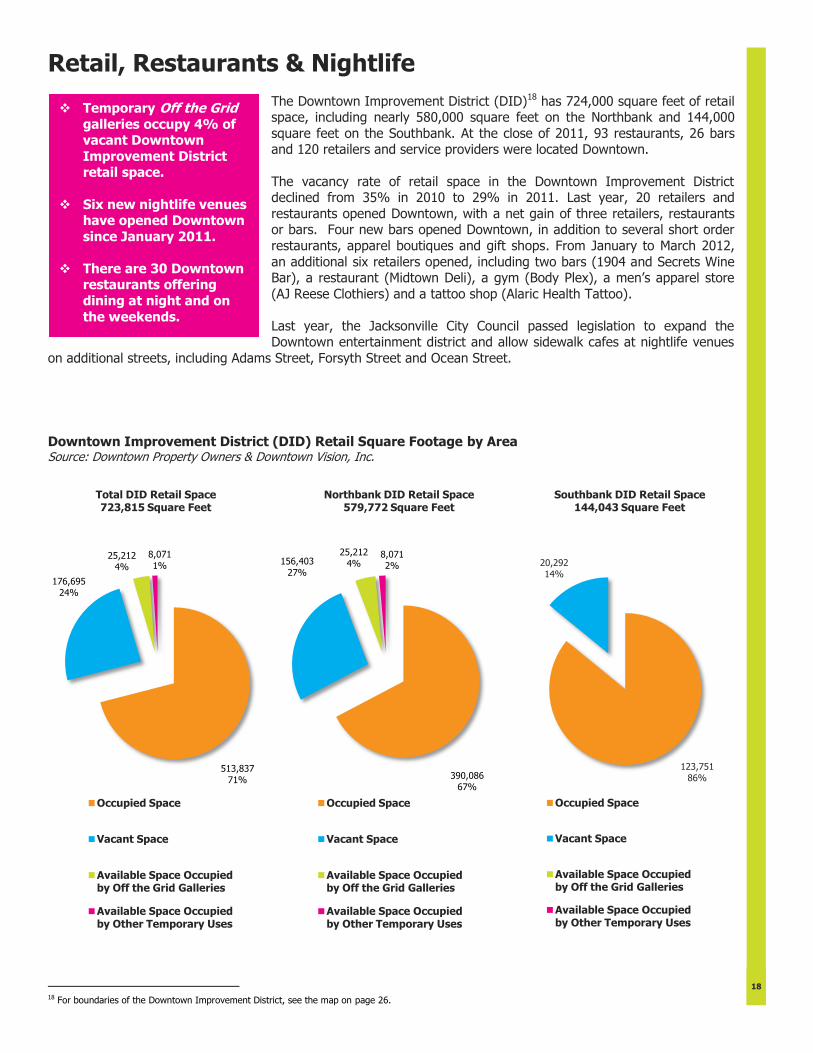
The Downtown Improvement District (DID)18 has 724,000 square feet of retail space, including nearly 580,000 square feet on the Northbank and 144,000
square feet on the Southbank. At the close of 2011, 93 restaurants, 26 bars and 120 retailers and service providers were located Downtown.
The vacancy rate of retail space in the Downtown Improvement District declined from 35% in 2010 to 29% in 2011. Last year, 20 retailers and
restaurants opened Downtown, with a net gain of three retailers, restaurants or bars. Four new bars opened Downtown, in addition to several short order
restaurants, apparel boutiques and gift shops. From January to March 2012,
an additional six retailers opened, including two bars (1904 and Secrets Wine Bar), a restaurant (Midtown Deli), a gym (Body Plex), a men’s apparel store
(AJ Reese Clothiers) and a tattoo shop (Alaric Health Tattoo).
Last year, the Jacksonville City Council passed legislation to expand the Downtown entertainment district and allow sidewalk cafes at nightlife venues
on additional streets, including Adams Street, Forsyth Street and Ocean Street.
Downtown Improvement District (DID) Retail Square Footage by Area Source: Downtown Property Owners & Downtown Vision, Inc.
18 For boundaries of the Downtown Improvement District, see the map on page 26.
513,837
71%
176,695
24%
25,212
4%
8,071
1%
Total DID Retail Space 723,815 Square Feet
Occupied Space
Vacant Space
Available Space Occupied by Off the Grid Galleries
Available Space Occupied by Other Temporary Uses
390,086
67%
156,403
27%
25,212
4% 8,071
2%
Northbank DID Retail Space 579,772 Square Feet
Occupied Space
Vacant Space
Available Space Occupied by Off the Grid Galleries
Available Space Occupied by Other Temporary Uses
123,751
86%
20,292
14%
Southbank DID Retail Space 144,043 Square Feet
Occupied Space
Vacant Space
Available Space Occupied by Off the Grid Galleries
Available Space Occupied by Other Temporary Uses
Chamblin’s Bookmine
18
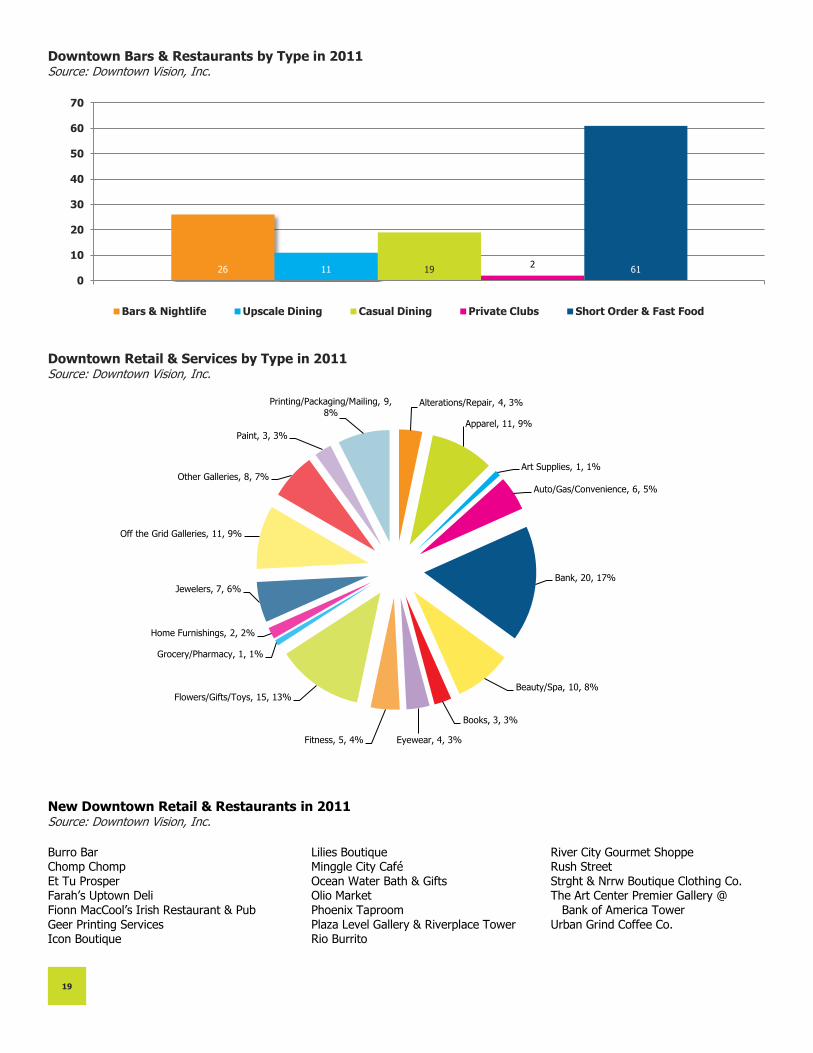
Downtown Bars & Restaurants by Type in 2011 Source: Downtown Vision, Inc.
Downtown Retail & Services by Type in 2011 Source: Downtown Vision, Inc.
New Downtown Retail & Restaurants in 2011 Source: Downtown Vision, Inc.
Burro Bar Lilies Boutique River City Gourmet Shoppe Chomp Chomp Minggle City Café Rush Street Et Tu Prosper Ocean Water Bath & Gifts Strght & Nrrw Boutique Clothing Co. Farah’s Uptown Deli Olio Market The Art Center Premier Gallery @ Fionn MacCool’s Irish Restaurant & Pub Phoenix Taproom Bank of America Tower Geer Printing Services Plaza Level Gallery & Riverplace Tower Urban Grind Coffee Co. Icon Boutique Rio Burrito
26 11 19 2
61
0
10
20
30
40
50
60
70
Bars & Nightlife Upscale Dining Casual Dining Private Clubs Short Order & Fast Food
Alterations/Repair, 4, 3%
Apparel, 11, 9%
Art Supplies, 1, 1%
Auto/Gas/Convenience, 6, 5%
Bank, 20, 17%
Beauty/Spa, 10, 8%
Books, 3, 3%
Eyewear, 4, 3% Fitness, 5, 4%
Flowers/Gifts/Toys, 15, 13%
Grocery/Pharmacy, 1, 1%
Home Furnishings, 2, 2%
Jewelers, 7, 6%
Off the Grid Galleries, 11, 9%
Other Galleries, 8, 7%
Paint, 3, 3%
Printing/Packaging/Mailing, 9,
8%
15
16
19
15
64% 65% 66% 63% 50% 55% 57%
0%
10%
20%
30%
40%
50%
60%
70%
2005 2006 2007 2008 2009 2010 2011
587,068 612,959 675,277 643,607 510,800 561,879 582,331
0
100,000
200,000
300,000
400,000
500,000
600,000
700,000
800,000
2005 2006 2007 2008 2009 2010 2011
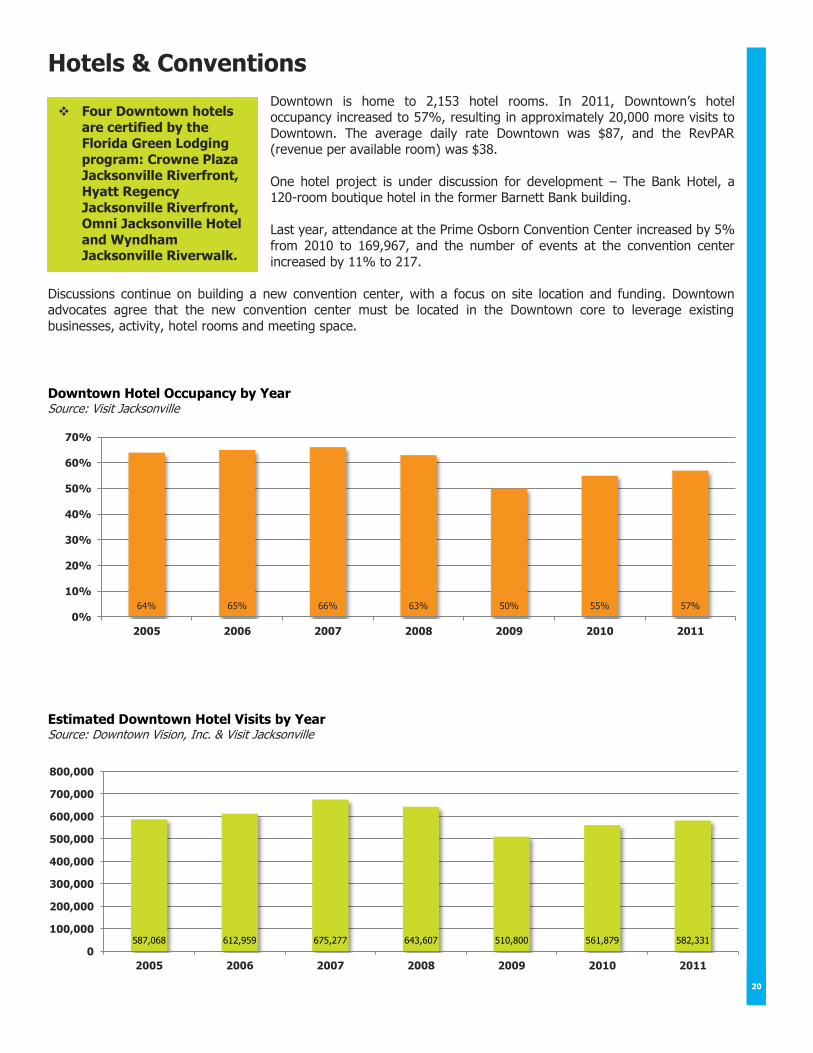
Hotels & Conventions
Downtown is home to 2,153 hotel rooms. In 2011, Downtown’s hotel occupancy increased to 57%, resulting in approximately 20,000 more visits to
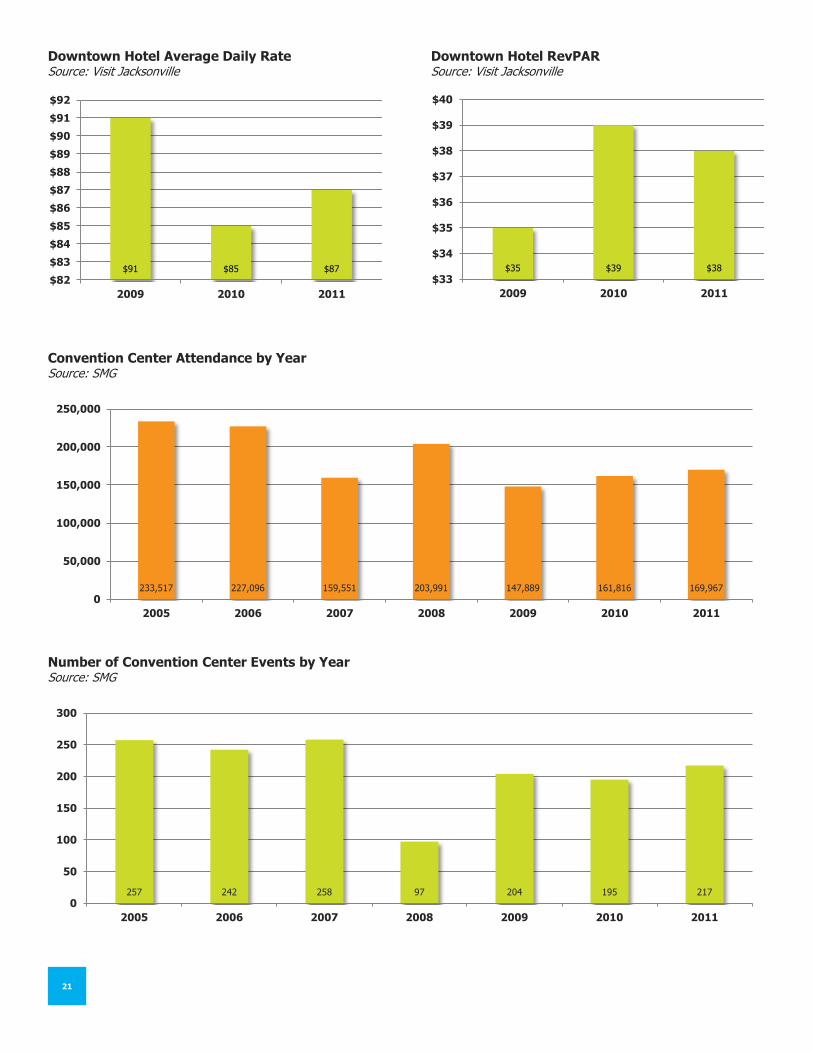
Downtown. The average daily rate Downtown was $87, and the RevPAR (revenue per available room) was $38.
One hotel project is under discussion for development – The Bank Hotel, a 120-room boutique hotel in the former Barnett Bank building.
Last year, attendance at the Prime Osborn Convention Center increased by 5%
from 2010 to 169,967, and the number of events at the convention center
increased by 11% to 217.
Discussions continue on building a new convention center, with a focus on site location and funding. Downtown advocates agree that the new convention center must be located in the Downtown core to leverage existing
businesses, activity, hotel rooms and meeting space.
Downtown Hotel Occupancy by Year Source: Visit Jacksonville
Estimated Downtown Hotel Visits by Year Source: Downtown Vision, Inc. & Visit Jacksonville
20
Four Downtown hotels
are certified by the Florida Green Lodging
program: Crowne Plaza Jacksonville Riverfront,
Hyatt Regency
Jacksonville Riverfront, Omni Jacksonville Hotel
and Wyndham Jacksonville Riverwalk.
$91 $85 $87
$82
$83
$84
$85
$86
$87
$88
$89
$90
$91
$92
2009 2010 2011
$35 $39 $38
$33
$34
$35
$36
$37
$38
$39
$40
2009 2010 2011
Downtown Hotel Average Daily Rate Downtown Hotel RevPAR Source: Visit Jacksonville Source: Visit Jacksonville
Convention Center Attendance by Year Source: SMG
Number of Convention Center Events by Year Source: SMG
233,517 227,096 159,551 203,991 147,889 161,816 169,967
0
50,000
100,000
150,000
200,000
250,000
2005 2006 2007 2008 2009 2010 2011
257 242 258 97 204 195 217
0
50
100
150
200
250
300
2005 2006 2007 2008 2009 2010 2011
17
21
Parking & Transportation
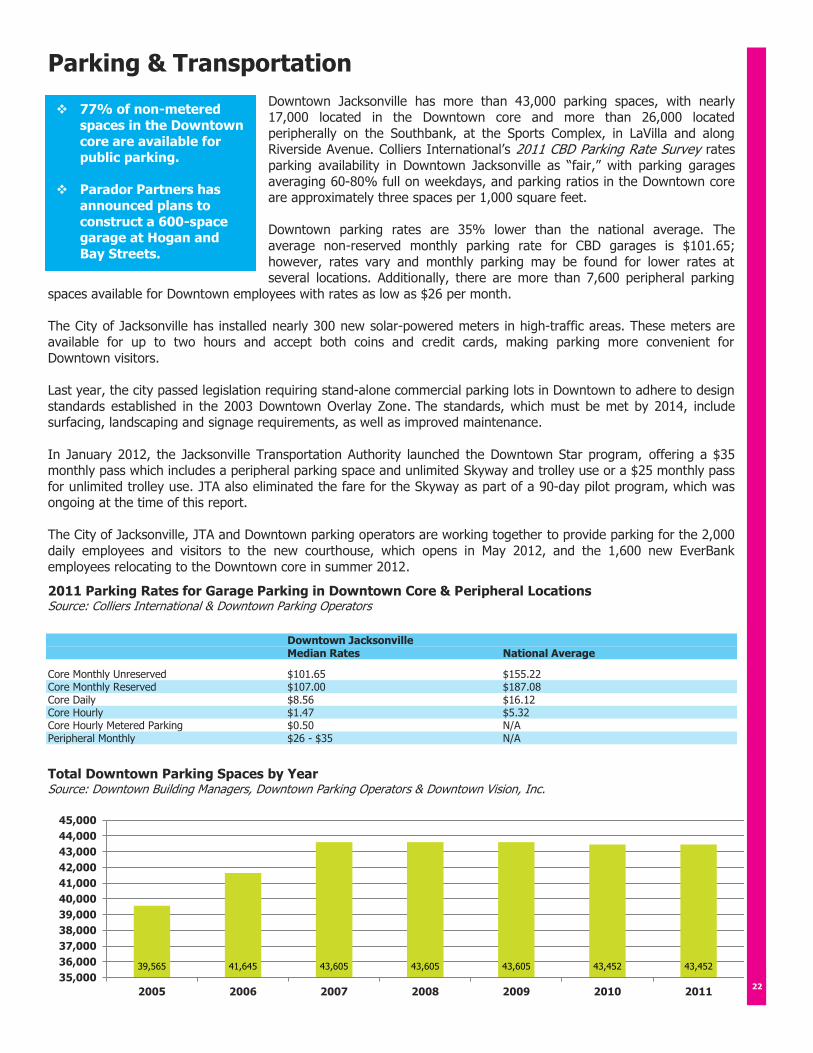
Downtown Jacksonville has more than 43,000 parking spaces, with nearly 17,000 located in the Downtown core and more than 26,000 located
peripherally on the Southbank, at the Sports Complex, in LaVilla and along Riverside Avenue. Colliers International’s 2011 CBD Parking Rate Survey rates
parking availability in Downtown Jacksonville as “fair,” with parking garages
averaging 60-80% full on weekdays, and parking ratios in the Downtown core are approximately three spaces per 1,000 square feet.
Downtown parking rates are 35% lower than the national average. The
average non-reserved monthly parking rate for CBD garages is $101.65;
however, rates vary and monthly parking may be found for lower rates at several locations. Additionally, there are more than 7,600 peripheral parking
spaces available for Downtown employees with rates as low as $26 per month.
The City of Jacksonville has installed nearly 300 new solar-powered meters in high-traffic areas. These meters are available for up to two hours and accept both coins and credit cards, making parking more convenient for
Downtown visitors.
Last year, the city passed legislation requiring stand-alone commercial parking lots in Downtown to adhere to design
standards established in the 2003 Downtown Overlay Zone. The standards, which must be met by 2014, include surfacing, landscaping and signage requirements, as well as improved maintenance.
In January 2012, the Jacksonville Transportation Authority launched the Downtown Star program, offering a $35 monthly pass which includes a peripheral parking space and unlimited Skyway and trolley use or a $25 monthly pass
for unlimited trolley use. JTA also eliminated the fare for the Skyway as part of a 90-day pilot program, which was ongoing at the time of this report.
The City of Jacksonville, JTA and Downtown parking operators are working together to provide parking for the 2,000
daily employees and visitors to the new courthouse, which opens in May 2012, and the 1,600 new EverBank
employees relocating to the Downtown core in summer 2012.
2011 Parking Rates for Garage Parking in Downtown Core & Peripheral Locations Source: Colliers International & Downtown Parking Operators
Downtown Jacksonville Median Rates National Average
Core Monthly Unreserved $101.65 $155.22 Core Monthly Reserved $107.00 $187.08 Core Daily $8.56 $16.12 Core Hourly $1.47 $5.32 Core Hourly Metered Parking $0.50 N/A Peripheral Monthly $26 - $35 N/A
Total Downtown Parking Spaces by Year Source: Downtown Building Managers, Downtown Parking Operators & Downtown Vision, Inc.
39,565 41,645 43,605 43,605 43,605 43,452 43,452
35,000
36,000
37,000
38,000
39,000
40,000
41,000
42,000
43,000
44,000
45,000
2005 2006 2007 2008 2009 2010 2011
22
77% of non-metered
spaces in the Downtown
core are available for public parking.
Parador Partners has
announced plans to
construct a 600-space garage at Hogan and
Bay Streets.
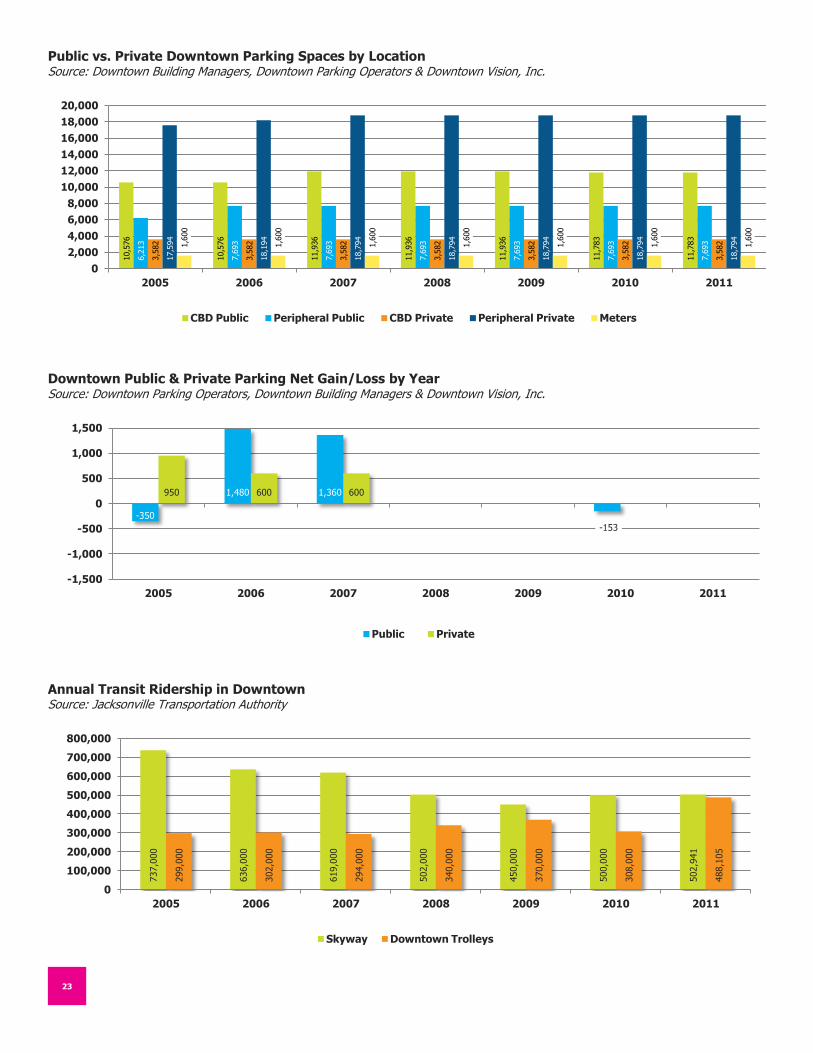
Public vs. Private Downtown Parking Spaces by Location Source: Downtown Building Managers, Downtown Parking Operators & Downtown Vision, Inc.
Downtown Public & Private Parking Net Gain/Loss by Year Source: Downtown Parking Operators, Downtown Building Managers & Downtown Vision, Inc.
Annual Transit Ridership in Downtown Source: Jacksonville Transportation Authority
10,5
76
10,5
76
11,9
36
11,9
36
11,9
36
11,7
83
11,7
83
6,2
13
7,6
93
7,6
93
7,6
93
7,6
93
7,6
93
7,6
93
3,5
82
3,5
82
3,5
82
3,5
82
3,5
82
3,5
82
3,5
82
17,5
94
18,1
94
18,7
94
18,7
94
18,7
94
18,7
94
18,7
94
1,6
00
1,6
00
1,6
00
1,6
00
1,6
00
1,6
00
1,6
00
0
2,000
4,000
6,000
8,000
10,000
12,000
14,000
16,000
18,000
20,000
2005 2006 2007 2008 2009 2010 2011
CBD Public Peripheral Public CBD Private Peripheral Private Meters
-350
1,480 1,360
-153
950 600 600
-1,500
-1,000
-500
0
500
1,000
1,500
2005 2006 2007 2008 2009 2010 2011
Public Private
737,0
00
636,0
00
619,0
00
502,0
00
450,0
00
500,0
00
502,9
41
299,0
00
302,0
00
294,0
00
340,0
00
370,0
00
308,0
00
488,1
05
0
100,000
200,000
300,000
400,000
500,000
600,000
700,000
800,000
2005 2006 2007 2008 2009 2010 2011
Skyway Downtown Trolleys
18
23
The Downtown crime
rate was 59% lower
than the Duval County crime rate in 2010.
Downtown crime has
declined 14% since
2009.
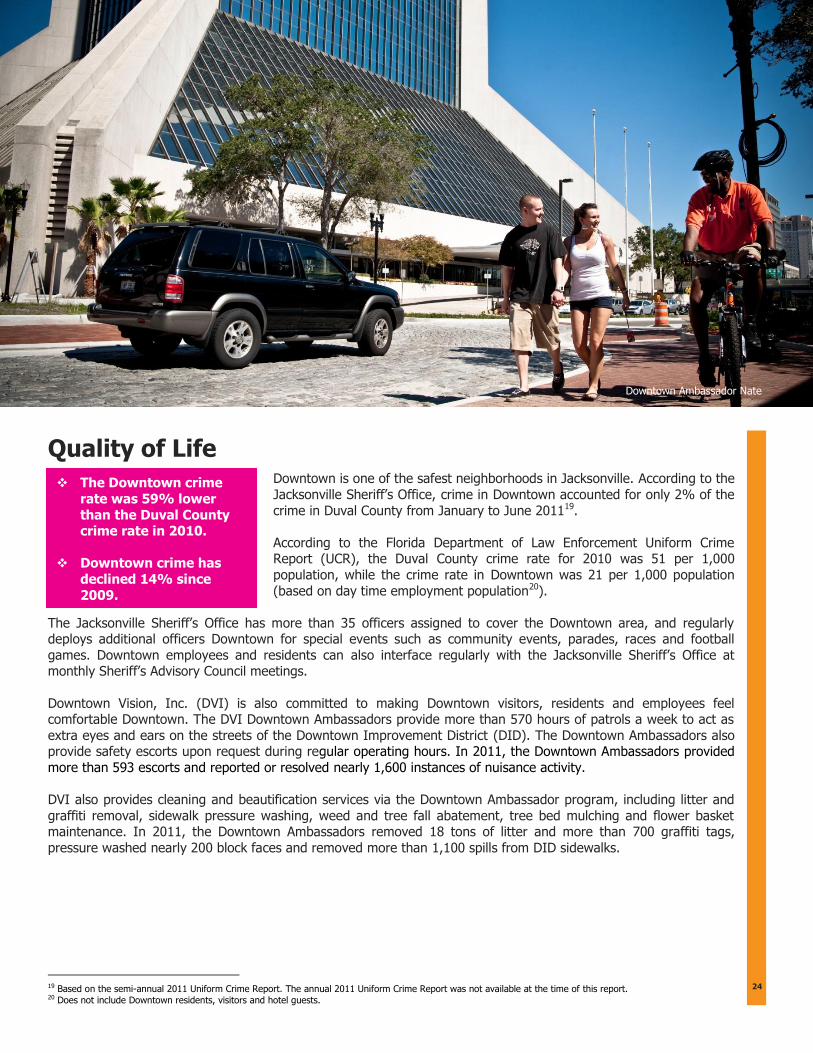
Quality of Life
Downtown is one of the safest neighborhoods in Jacksonville. According to the
Jacksonville Sheriff’s Office, crime in Downtown accounted for only 2% of the
crime in Duval County from January to June 201119.
According to the Florida Department of Law Enforcement Uniform Crime Report (UCR), the Duval County crime rate for 2010 was 51 per 1,000
population, while the crime rate in Downtown was 21 per 1,000 population
(based on day time employment population20).
The Jacksonville Sheriff’s Office has more than 35 officers assigned to cover the Downtown area, and regularly deploys additional officers Downtown for special events such as community events, parades, races and football
games. Downtown employees and residents can also interface regularly with the Jacksonville Sheriff’s Office at monthly Sheriff’s Advisory Council meetings.
Downtown Vision, Inc. (DVI) is also committed to making Downtown visitors, residents and employees feel comfortable Downtown. The DVI Downtown Ambassadors provide more than 570 hours of patrols a week to act as
extra eyes and ears on the streets of the Downtown Improvement District (DID). The Downtown Ambassadors also provide safety escorts upon request during regular operating hours. In 2011, the Downtown Ambassadors provided
more than 593 escorts and reported or resolved nearly 1,600 instances of nuisance activity.
DVI also provides cleaning and beautification services via the Downtown Ambassador program, including litter and
graffiti removal, sidewalk pressure washing, weed and tree fall abatement, tree bed mulching and flower basket maintenance. In 2011, the Downtown Ambassadors removed 18 tons of litter and more than 700 graffiti tags,
pressure washed nearly 200 block faces and removed more than 1,100 spills from DID sidewalks.
19 Based on the semi-annual 2011 Uniform Crime Report. The annual 2011 Uniform Crime Report was not available at the time of this report. 20 Does not include Downtown residents, visitors and hotel guests.
24
Downtown Ambassador Nate
Acosta Bridge
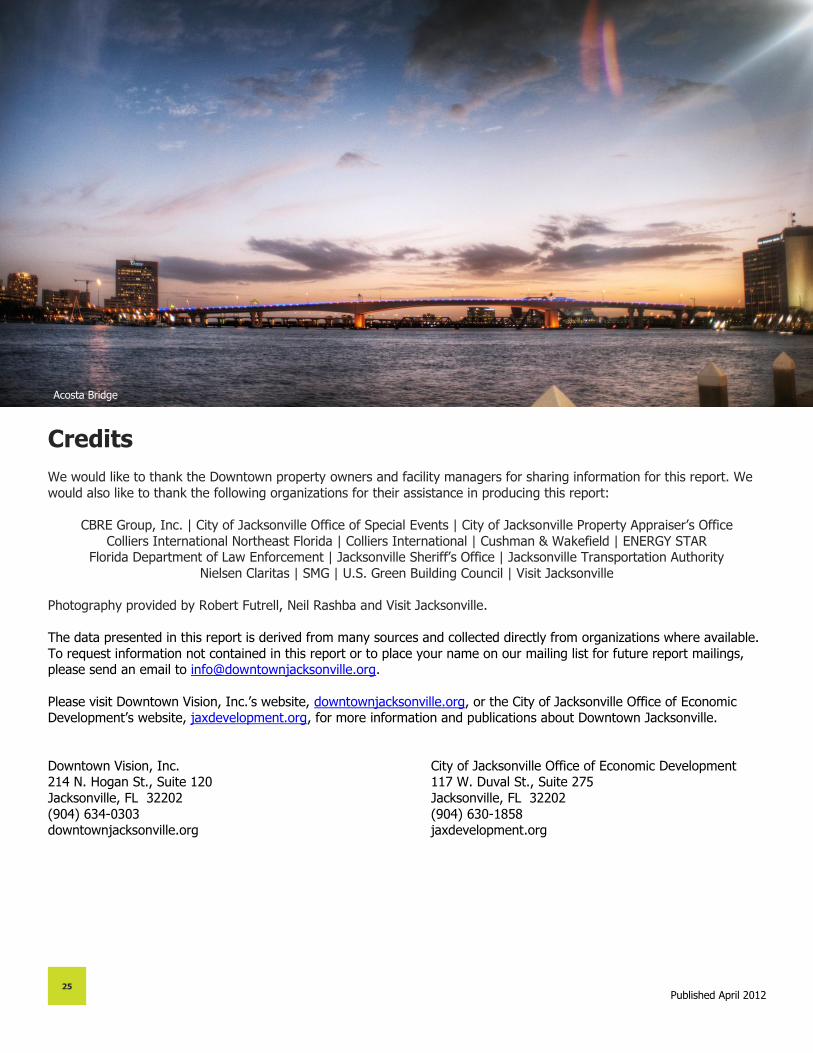
Credits We would like to thank the Downtown property owners and facility managers for sharing information for this report. We
would also like to thank the following organizations for their assistance in producing this report:
CBRE Group, Inc. | City of Jacksonville Office of Special Events | City of Jacksonville Property Appraiser’s Office
Colliers International Northeast Florida | Colliers International | Cushman & Wakefield | ENERGY STAR Florida Department of Law Enforcement | Jacksonville Sheriff’s Office | Jacksonville Transportation Authority
Nielsen Claritas | SMG | U.S. Green Building Council | Visit Jacksonville
Photography provided by Robert Futrell, Neil Rashba and Visit Jacksonville.
The data presented in this report is derived from many sources and collected directly from organizations where available.
To request information not contained in this report or to place your name on our mailing list for future report mailings, please send an email to [email protected].
Please visit Downtown Vision, Inc.’s website, downtownjacksonville.org, or the City of Jacksonville Office of Economic Development’s website, jaxdevelopment.org, for more information and publications about Downtown Jacksonville.
Downtown Vision, Inc. City of Jacksonville Office of Economic Development 214 N. Hogan St., Suite 120 117 W. Duval St., Suite 275
Jacksonville, FL 32202 Jacksonville, FL 32202
(904) 634-0303 (904) 630-1858 downtownjacksonville.org jaxdevelopment.org
Published April 2012
19
19
25
Acosta Bridge
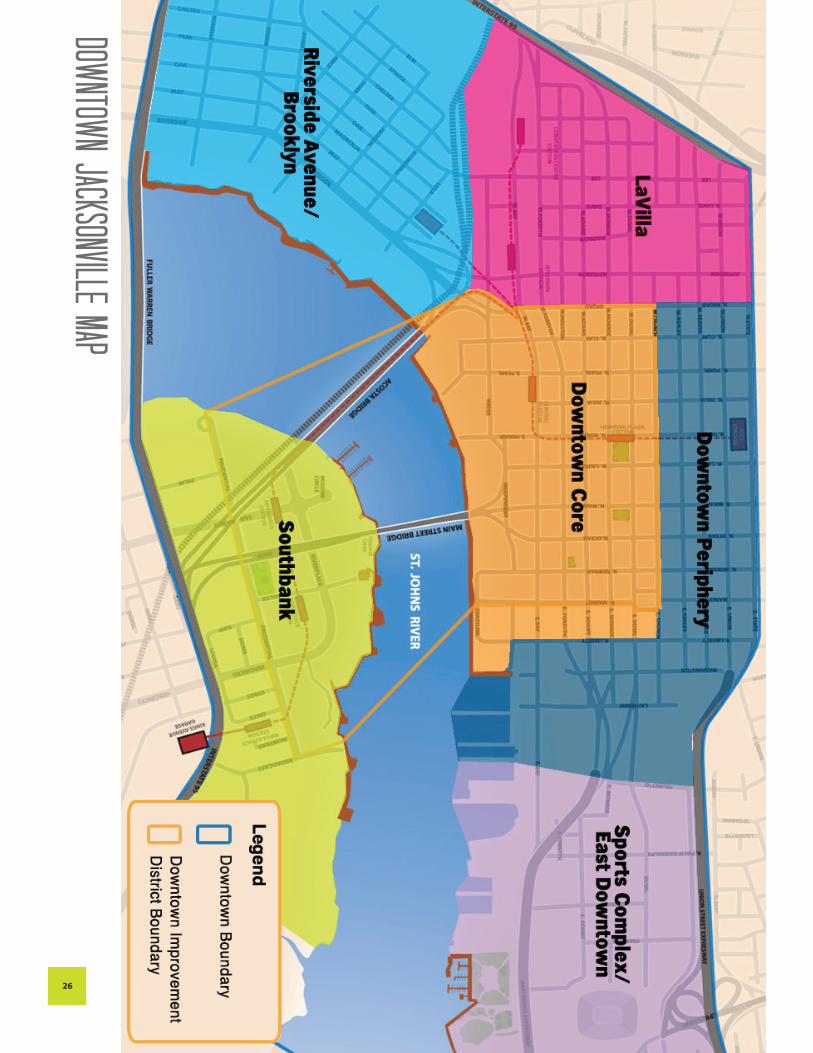
Downtow
n Jacksonville Map
26
Downtown Vision, Inc. 214 N. Hogan St., Ste. 120Jacksonville, FL 32202904.634.0303downtownjacksonville.org
City of jacksonville office of economic development117 W. Duval St., 2nd FlJacksonville, FL 32202904.630.1858jaxdevelopment.org