Embed Size (px)
Citation preview

Australian Aid—managed by GRM International on behalf of the Australian Government
FINAL REPORT
Annual Sector Financial Report (2012): An annual review of Indonesian education sector financing 04 April 2014


ANNUAL SECTOR FINANCIAL REPORT (2012) i
TABLE OF CONTENTS
TABLE OF CONTENTS I
LIST OF TABLES AND FIGURES II
ABBREVIATIONS AND ACRONYMS IV
PREFACE VI
EXECUTIVE SUMMARY VII
1 INTRODUCTION, APPROACH AND METHODOLOGY 2
2 FINANCIAL PERFORMANCE AT NATIONAL LEVEL 7
3 FINANCIAL PERFORMANCE AT DISTRICT LEVEL 18
4 THE BOTTOM-LINE 58
5 NEXT STEPS 65
ANNEX A - EP LOGIC ARCHITECTURE 66
ANNEX B – STATISTICAL TABLE RELATED TO EP DISTRICTS 67

ANNUAL SECTOR FINANCIAL REPORT (2012) ii
LIST OF TABLES AND FIGURES
Table 1 National Level Education Financing Data 2001-2012........................................................... 8
Figure 1: Education Expenditure as Proportion of Total National Public Expenditure, 2001-2012 ...... 9
Figure 2: National Public Expenditure on Education, Rp. Trillion 2001-2012 .................................... 10
Figure 3: Annual Growth in Education Expenditure (Rp. trillion), 2001-2012 ................................... 11
Figure 4: Education Expenditure as Proportion of GDP, 2001-2012 ................................................ 12
Figure 5: Composition of Aggregate District Education Expenditure, 2009-2011 ............................. 13
Figure 6: Education Expenditure by Sub-Sector, 2008 and 2009 ....................................................... 15
Figure 7: Basic Education Share of Central Level Expenditures for MoEC and MoRA, 2006-2009 .... 15
Figure 8: Number of Districts Included in ASFR Analysis, (2006-2012) ............................................ 19
Figure 9: Education Expenditure as % of Total District Budget (APBD 2006-2012) .......................... 19
Figure 10: Average District APBD and APBD for Education, 2006-2012 .......................................... 22
Figure 11: Rural and Urban District Education Expenditure as % of Total District Budget (APBD 2006-2012) .............................................................................................................................. 22
Figure 12: Education Expenditure as % of Total District Expenditure by Districts according to Poverty Quintile, (APBD 2006-2012) ....................................................................................... 23
Figure 13: Average District APBD and APBD for Education, by poverty quintile 2006-2012 ............ 24
Figure 14: Education Expenditure as % of Total District Expenditure by Island Grouping (APBD 2006-2012) .............................................................................................................................. 25
Figure 15: EP Districts - Average Education Allocations as Proportion of District Budget, 2012 ...... 25
Figure 16: EP Districts with Low Budget Allocation for Education (< than 20% of district budget), 2012 ........................................................................................................................................ 26
Figure 17: EP Districts with high Budget Allocation for Education (>than 50% of district budget), 2012 ........................................................................................................................................ 27
Figure 18: Districts with very low financial share for education (less than 15% of APBD Expenditure) 2009 -2012 .............................................................................................................................. 28
Figure 19: Poorest Districts with very low financial share for education (less than 15% of APBD Expenditure) 2012 ................................................................................................................... 29
Figure 20: APBD Education Expenditure as % of Total district Expenditure in BEP and Non-BEP Supported Districts (APBD 2006-2012) ................................................................................... 30
Figure 21: BEP Districts with low financial share for education (less than 20% of APBD Expenditure) 2009 and 2012 ......................................................................................................................... 31
Figure 22: Annual Growth in APBD Education Expenditure, 2007 -2011, by Poverty Quintile ......... 32
Figure 23: Annual Growth in District Education Expenditure, (APBD 2007-2012) ........................... 34
Figure 24: Poorest Districts (Quintile 5), Negative Annual Growth in Education Expenditure, (APBD 2010-2012) .............................................................................................................................. 35
Figure 25: Total Number of Districts, with Negative Annual Growth in APBD Education Expenditure, 2007 -2011 .......................................................................................................... 36

ANNUAL SECTOR FINANCIAL REPORT (2012) iii
Figure 26: Number of Districts with declining annual education expenditure ................................... 36
Figure 27: EP Poorest Districts with declining annual education expenditure (2012 vs 2011) ........... 37
Figure 28: Component 1 districts with declining annual education expenditure (2012 vs 2011) ....... 37
Figure 29: Component 2 districts with declining annual education expenditure (2012 vs 2011) ....... 38
Figure 30: Component 1 & 2 districts with declining annual education expenditure (2012 vs 2011) . 38
Figure 31: BEP and Non-BEP Districts - Annual Growth in District Education Expenditure, (APBD 2007-2012) .............................................................................................................................. 39
Figure 32: Number of Districts, with Negative Annual Growth in APBD Education Expenditure
(2007-2011) ............................................................................................................................. 39
Figure 33: Average District Education Expenditure per all Students, 2006-2012 (Rp. millions.) ........ 40
Figure 34: Comparison - Expenditure per All Students vs. Expenditure per Public Students, (Rp.
millions) ................................................................................................................................... 42
Figure 35: Average APBD Education Expenditure per Student (Rp. millions), 2008-12 by Island ...... 43
Figure 36: Papua: Average Annual Growth in District Education Budget, (Rp. millions) 2010-12 ...... 44
Figure 37: Average District Expenditure per Student, EP Districts and Others 2012 (Rp. millions) .. 45
Figure 38: EP Districts with Low Expenditure per Student, 2012 (Rp. millions) ............................... 46
Figure 39: EP Districts with very high per student expenditure, 2012 (Rp. millions)......................... 47
Figure 40: Equity Slope of Funding - Average APBD Education Expenditure per Student (Rp millions), by Poverty Quintile, 2008-12 ................................................................................................... 48
Figure 41: Cost and Student Load Comparison - Average APBD Education Expenditure per Student
(Rp millions) and Numbers of Students, by Poverty Quintile, 2012 .......................................... 49
Figure 42: Critical Education Funding Status (CEFS) Districts – Districts with low growth in
education budget, low share of district budget and low expenditure per student, 2010-2012 .. 50
Figure 43: Realised Education Expenditure as % of Planned Expenditure 2006 -2009 ....................... 51
Figure 44: Realised Education Expenditure as % of Planned Expenditure 2006-09, EP and Non-EP districts .................................................................................................................................... 52
Figure 45: Realised Education Expenditure as % of Planned Expenditure 2006 - 2009, by Poverty Quintile ................................................................................................................................... 53
Figure 46: BOS Grants as % of Education & Culture Budget 2006-2010 (public schools only) .......... 54
Figure 47: BOS Grants as % of Education & Culture Budget 2006-2011, by Poverty Quintile .......... 56
Table 2: Progress against Key Indicators .......................................................................................... 60
Table 3: Possible Risks Affecting the EP ........................................................................................... 63

ANNUAL SECTOR FINANCIAL REPORT (2012) iv
ABBREVIATIONS AND ACRONYMS
Bahasa Indonesia English
ACER Dewan Penelitian Pendidikan Australia Australian Council for Educational Research
ADB Bank Pembangunan Asia Asian Development Bank
APK Angka Partisipasi Kasar Gross Enrolment Rate
APM Angka Partisipasi Murni Net Enrolment Rate
AusAID Badan Australia untuk Pembangunan
Internasional
Australian Agency for International
Development
AWP Rencana Kerja Tahunan Annual Work Plan
Balitbang Badan Penelitian dan Pengembangan Centre for Research and Development
Bappenas Badan Perencanaan Pembangunan Nasional National Development Planning Agency
BEP Program Pendidikan Dasar Australia-Indonesia Australia-Indonesia Basic Education Program
BOS BantuanOperasional Sekolah School Operational Fund
BOS Buku Bantuan Operasional Sekolah Buku School Operation Funds for Textbooks
BSNP Badan Standar Nasional Pendidikan National Education Standards Board
CCR Rasio Kelas-Ruang Kelas Class-Classroom Ratio
CSAS Kontraktor untuk Layanan Kepenasehatan
Strategis
Contractor for Strategic Advisory Services
DFAT Departemen Luar Negeri dan Perdagangan Department of Foreign Affairs and Trade
(Australian)
DG Direktorat Jendral Directorate General
EC Komisi Eropa European Commission
EFA Pendidikan untuk Semua Education for All
ESP Rencana Strategis Pendidikan Education Strategic Plan
ESSP Education Sector Support Program Education Sector Support Program
ESWG Kelompok Kerja Sektor Pendidikan Education Sector Working Group
GDP Pendapatan Domestik Bruto Gross Domestic Product
GER Angka Pendaftaran Kasar Gross Enrolment Rate
GoA Pemerintah Australia Government of Australia
GOI Pemerintah Indonesia Government of Indonesia
JSS Sekolah Menengah Pertama Junior Secondary School
KPI Indikator Kunci dari ? Key Performance Indicator
LAKIP Laporan Akuntabilitas Kinerja Publik Public Performance Accountability Report
MCPM Kontraktor Pelaksana untuk Pengelolaan
Program
Managing Contractor Program Management
MDA Kajian Tengah Dekade Mid-Decade Assessment
MoF Kementrian Keuangan Ministry of Finance
MoEC Kemendikbud Ministry of Education and Culture

ANNUAL SECTOR FINANCIAL REPORT (2012) v
MoRA Kementrian Agama Ministry of Religious Affairs
NER Angka Pendaftaran Murni Net Enrolment Rate
NFE Pendidikan Non-formal Non-Formal Education
PAM Matriks Aksi Kebijakan Policy Action Matrix
PCMU Unit Pengelola dan Koordinasi Program Program Coordination and Management Unit
PMPTK Peningkatan Mutu Pendidik dan Tenaga
Kependidikan
Quality Improvement of Teachers and
Education Personnel
POM Monitoring dan Pengawasan Kinerja Performance Oversight and Monitoring
PSC Komite Pengarah Program Program Steering Committee
PTP Matrix Matriks Sasaran dan Kinerja Program Program Targets and Performance Matrix
PUSLIT Pusat Penelitian Center for Research
PUSPENDIK Pusat Statistik Pendidikan Center for Education Statistics
Renstra Rencana Strategis Strategic Plan
Rp. Rupiah Rupiah
SCR Rasio Siswa Ruang Kelas Student Classroom Ratio
SD Sekolah Dasar Primary School
SIKD Sistem Informasi Keuangan Daerah Regional Finance Information system
SMA Sekolah Menengah Atas Senior Secondary School
SMP Sekolah Menengah Pertama Junior Secondary School
SWAP Pendekatan Sektor secara Luas Sector Wide Approach
SPI Indikator Kinerja Tambahan Supplementary Performance Indicator
STR Rasio Siswa Guru Student Teacher Ratio
SUSENAS Survei Sosial Ekonomi Nasional National Socio-Economic Survey
TA Bantuan Teknis Technical Assistance
ToR Kerangka Acuan Kerja Term of Reference
UN Perserikatan Bangsa-Bangsa United Nations
USAID Badan Amerika Serikat untuk Pembangunan
Internasional
United States Agency for International
Development

ANNUAL SECTOR FINANCIAL REPORT (2012) vi
PREFACE
This report is intended to provide high level monitoring of national and district trends in education
financing. The purpose of the monitoring is to inform the Governments of Indonesia and Australia as
they implement the Education Partnership (2011-2016).
This is the sixth Annual Sector Financial Report (previously known as the Annual Financial
Performance Report). It is a continuation of last year’s report published by the Performance
Oversight and Monitoring team of the Education Partnership, and a series of three annual reports
that were prepared by the same author for the Basic Education Program and delivered through the
Contractor for Strategic Advisory Services. Copies of these reports are held by the Australian
Embassy and the Indonesian Ministry of Education and Culture.
The author is Education Economist Mr. Adam Rorris. He has worked in close collaboration with, and
has benefitted from the support of, the Ministry of Finance and the Ministry of Education and
Culture (MOEC). The consultant acknowledges the support and advice of the many people that
contributed to the study. Data analysis support was provided by Mr. Ahmad Evandri. The views and
opinions expressed in this report are those of the author and do not necessarily reflect those of the
Governments of Indonesia or Australia.
Amendment history
Version Notes and modifications Created by/modified by
1.0 Initial Draft Report (06 December 2013) Creator: Adam Rorris
1.1 Draft Report (09 February 2014) Modifier: Adam Rorris
1.2 FInal Report (04 April 2014) Modifier: Adam Rorris

ANNUAL SECTOR FINANCIAL REPORT (2012) vii
EXECUTIVE SUMMARY
Background
The Annual Sector Financial Report (ASFR) 2012 monitors and reports on trends in education
financing in Indonesia. This is the sixth Annual Sector Financial Report (previously known as the
Annual Financial Performance Report) and follows a series of reports produced by the same author
for the AusAID supported Contractor Strategic Advisory Services (CSAS) team. The report is intended
for the use of high level government officials and education sector experts in the Governments of
Indonesia and Australia. It provides succinct analysis and is intended to be an accessible tool for
operational planning. The objectives of this report are:
1. To identify trends in the quantum and distribution of education funding in relation to
national policy and school needs.
2. To monitor education sector and school resourcing from the standpoint of the key RENSTRA
themes of access, quality improvement and improved accountability.
3. To provide a record of education financing in those districts directly benefiting from
Components 1 and 2 of the Australian-Indonesia Education Partnership (EP).
4. To inform the Government of Australia (GoA), the Government of Indonesia (GoI) and other
donors of the effectiveness and efficiency of current school funding mechanisms.
5. To support the capacity of GoI institutions to monitor and report on school financing.
The report has a particular focus on district level expenditures. Indonesian district level expenditure
patterns are increasingly important as districts have increased responsibility for education
management under the Indonesian government’s decentralization policy. Monitoring patterns of
expenditure by districts will become an increasingly important role for the Ministry of Education and
Culture (MoEC) and the Ministry of Religious Affairs (MoRA) to ensure that national funding norms
and procedures are being implemented appropriately. Financial analysis of education allocations
therefore needs to have a district level disaggregation to assess the variability in fiscal capacity and
actual allocations for education resourcing.
A wide range in the poverty status of districts, and the importance of education in lifting district
populations out of poverty, mean that vulnerable groups stand to benefit most from well-targeted
education investment. Monitoring and evaluation of district level education financing provides the
tools to do so.
Key Performance Indicators and Analysis
The report analysis is framed by a set of Key Performance Indicators (KPI). The KPI focus attention on
the main RENSTRA themes and the government’s financial commitment to education. Most of these
KPI are reported on at a national level by the GoI as part of its international Education for All (EFA)
reporting obligations.
Each of the indicators is described as being either a lead or lag indicator. Lag indicators are
summative in nature. They describe the current state of progress toward an expected outcome. Lead

ANNUAL SECTOR FINANCIAL REPORT (2012) viii
indicators are those which capture the rate of movement towards an outcome or have a clear causal
relationship to a desired outcome.
A summary of the results and findings for each of the indicators is presented in table format as part
of this Executive Summary. This includes a summary assessment of the indicator result being
positive, negative or uneven. A `Positive’ result indicates it is supportive of RENSTRA objectives; a
‘Negative’ result suggests it is contradictory to RENSTRA objectives; and an ‘Uneven’ result indicates
large variation between districts.
This report has utilized the Enhanced Analytical Facility (EAF) as a database and warehousing tool.
The EAF has brought together education, finance and socio-economic data sets from a very wide
range of sources. Greater inter-relational analysis of these data sets and enhanced visualization
capacity from new software adds power and improves readability of the report. The EAF was again
updated for this 2012 report, with updates to financial and enrolment data for 2011 and the addition
of new data for 2012.
Key Findings
1. Strong real growth in national public expenditure for education in 2012.
The GoI had particularly impressive growth in real and nominal terms in 2006 and 2009. Since
2009, growth in education expenditures had marginally outpaced inflation, but there was a
plateau in the real increase of national funding for education. In 2012 we see the first significant
increase in real terms for education funding.
2. Government commitment to meet a 20% target for education expenditure share of national
budget has been met for the fourth year in a row.
The national expenditures for education in 2012 met the 20% target. Unlike the previous three
budget years, this has generated a large year-on-year increase in real funds available for
education. Education has benefited from total national public revenues and expenditures which
have grown at a significantly faster rate than inflation.
3. Average district level education expenditures across Indonesia have increased from 27% of the
total district budget (APBD) in 2006 to nearly 35% share in 2012.
4. Education expenditures at the district level rose from 31% in 2009 to 35% in 2012
This demonstrates that districts have, on average, strengthened their commitment toward
education spending during the period 2009-2012.
5. The lowest average share of budget allocation for education (at the district level) was found in
Papua (16%) and Maluku island group (25%).
While Maluku has shown growth since 2010, Papua has dropped again from an 18% education
share of district budgets in 2010 to 16% in 2012. The island groups of Sulawesi, Kalimantan and
Maluku went in the opposite direction and posted annual increases in the education share of
district expenditures in 2012.
6. Nationally, there are 30 districts which allocated less than 15% of their total district budget
(APBD) on education in 2012.

ANNUAL SECTOR FINANCIAL REPORT (2012) ix
Of the 30 districts spending less than 15% of their budget on education, 22 are in the poorest
quintile, and 17 of these are found in Papua.
7. The poorest districts have consistently committed the lowest proportion of their budget
towards education during the period 2006-2012 (average 31% in 2012).
8. In 2012 nearly 100 districts (nearly 20%) posted a decline in their education budget.
This is a marked deterioration from 2011, when only 22 districts posted a decline in their annual
education budget allocation.
9. The problem of contracting education budgets is focused on Papua.
Twenty of the 31 districts recording a decline in nominal annual district education expenditure
are located in Papua.
10. Average district expenditure per student across the country grew but not as strongly as for
2011.
Average education expenditure per student has grown to Rp. 3.1 million in 2012, from an
average Rp. 2.8 million in 2011. Highest allocations per student are found in the poorest districts
(quintile 5) at an average Rp. 3.4 million per student.
11. The most striking aspect of the breakdown of per student expenditure is that the Papua island
group declines in the annual per student allocation for education in 2012.
In Papua, per student allocations for education drop 12% from Rp. 6.26 million in 2011 to Rp.
5.48 million in 2012.
12. To achieve better learning outcomes across the poorest districts, the district governments in
poorest districts will need to grow their education spending more quickly and drive a stronger
‘equity slope’ in education funding distribution.
During the four year period 2008-2011, Indonesia displayed overall growth in per student
expenditures, with a linear trend for greater expenditures in the poorest districts. In 2012 the
slope of this equity spending was halted, with slower growth in the poorest districts.
13. In 2012, the BOS grants have increased as a proportion of the district education budget (up to
14%).
This outcome is a result of slower growth in the district education budget, and an increase in the
value of the BOS grants themselves. The per-pupil BOS allocation has increased from Rp 397,000
to Rp 580,000 per primary student and from Rp. 570,000 to Rp. 710,000 per junior secondary
student per year in 2012.
14. There were six districts in 2012 that meet Critical Education Funding Status (CEFS) criteria
compared to 2011 (2 districts), 2010(12 districts) and 2009 (16 districts).
The CEFS diagnostic tool developed by the ASFPR identifies districts that have (i) low expenditure
per student, (ii) small education share of the district budget, and (iii) weak annual growth in their
education budget.

ANNUAL SECTOR FINANCIAL REPORT (2012) x
Possible Impacts on the Sustainability of Benefits Stemming from
EP Investments
1. At a macro level, there is solid evidence to suggest that the GoI will continue to invest heavily in
education. This should flow through in its support for district budgets. National funding for the
education sector is expected to remain strong. Adherence to a proportional budget allocation
for education enhances the ability of the education sector to anticipate future allocations and
plan accordingly by creating a more stable financing framework. The proportional allocation
approach toward education financing enhances predictability and steady growth of the
education budget in a growing economy.
2. School systems require a substantial share of non-salary related expenditures to (i) provide a full
range of resources (apart from teachers) to schools, and (ii) maintain buildings and provide for
additional capital and equipment needs. Most recent data show the average salary share of
expenditures in districts had come down to 75% of total district level expenditures. In the
context of the additional salary costs associated with the teacher certification process, this is a
very positive achievement. However, some districts spend well in excess of this on salaries,
leaving these districts with very little to spend on PD or maintenance of school buildings.
3. Eighteen EP districts contributed less than the 20% national target for education, which is
considerably lower than the 2012 national average of 35%. This low share of funding for
education in specific districts may threaten the sustainability of EP investments in the future.
4. One recurring concern is that some districts with the highest poverty rates are persistently
allocating a significantly smaller share (less than 15%) of resources for education than the
national average (35%). This low commitment from some of the poorest districts makes it harder
for them to catch up on educational development. It also indicates which districts may have
further scope to grow their education budget and cover the cost associated with PD and the
maintenance of new school buildings as might be funded under the EP.
5. Papua and Maluku stand out as two provinces that spend the least for education as a proportion
of total district funds. Papua in particular stands out because on average it experienced a decline
in expenditure per student in 2012 compared to 2011. There is scope to increase education
funding in these areas to cover the additional but modest recurrent costs associated with the EP
investments.
6. Most EP districts are showing growth in per student allocations for education. This provides a
good financial base for further improvements. However in 2012, nearly 100 districts (of which 59
were EP districts) contracted their education budget compared to the previous year. There will
be good and sound reasons for this in many cases, but where it reflects a shifting priority away
from education it may jeopardize the ability of districts to meet future financial commitments to
PD and building maintenance.
7. Growing BOS funds provide much needed discretionary funds to schools. The challenge for
government will be to put in place the appropriate training, monitoring and support to enable
the effective use of these funds as well as identifying the inevitable instances where these funds
are not properly expended or adequately reported.

ANNUAL SECTOR FINANCIAL REPORT (2012) xi
Progress against Key Indicators
INDICATOR DESCRIPTION LEVEL RELATED GOAL RESULT COMMENT AND IMPLICATIONS
KPI 1
Share of public
expenditure
Public expenditure on education as
percentage of total public
expenditure (covers MoEC and
MoRA expenditure)
National Government
commitment Positive
Comment: Significant growth in allocations as proportion
of national expenditure, from 12% 2001 (12%) to 20% by
2012.
Implications: Stable growth in education financing is
positive for further investment.
KPI 2
Share of GDP
Public expenditure on education as
percentage of GDP
National
Government
commitment Positive
Comment: Education expenditure, as a proportion of
GDP, increased from 3.3% in 2011 to 3.5% in 2012.
KPI 3
Share of non-salary
resources
% share of education budget
spending on non-salary costs. National Quality Positive
Comment: No new data available for 2012. Non-salary
share of expenditures in 2011 increased to 25% of total
district level expenditures (up from 13% in 2010).
Implications: Growth in budget is not being solely
consumed by salaries. New budget allocations were
especially strong for capital items.
KPI 4
National commitment to
non-formal learning
Public expenditure on literacy and
non-formal education (NFE) as
percentage of public expenditure
on education
National Equity/access Negative
Comment: No new data available for 2012. NFE
expenditure is approximately 1% of total expenditure for
education.
Implications: Key advantage of NFE is its cost-
effectiveness; increased levels of investment are needed
to maximise possible economic and social returns.
KPI 5
Commitment to basic
education relative to
national wealth
Public recurrent expenditure on
basic education as percentage of
all public education expenditure
National Equity/access Positive
Comment: Report has updated data to most recent year
available. In 2009 basic education accounted for
approximately 56% of education expenditure. By
contrast, less than 20% of MORA education expenditure
was on basic education.
Implications: It is unclear what has been driving the
fluctuations in the basic education share of MoRA
expenditures, so difficult to assess implications.
KPI 6 Education as % of total public District Government Neutral Comment: The strong increase in the education share of

ANNUAL SECTOR FINANCIAL REPORT (2012) xii
INDICATOR DESCRIPTION LEVEL RELATED GOAL RESULT COMMENT AND IMPLICATIONS
District commitment to
education
expenditures commitment
Equity/access
district budgets in 2011 was reversed in 2012, with the
education share dropping just over 1% from 36.7%.
Implications: Some districts showing negative growth
should be monitored
KPI 7
Annual growth in
spending in the poorest
districts
Annual % change in public
expenditures for education in
lowest quintile districts compared
to national % change in public
expenditure for education
District
Equity/access Negative
Comment: In 2012, 31 of the poorest districts
experienced a contraction in their nominal education
expenditure (before accounting for inflation).
Implications: Nearly one third of poorest quintile districts
(100) reduced their annual budget allocation for
education in 2012
KPI 8
Average district
expenditure per student
Public expenditure from APBD
divided by total number of school
students
District
Government
commitment
Quality
Positive
Comment: Average expenditure per student across the
country grew in 2012 but not as strongly as for 2011.
Implications: Some districts showing negative growth
should be monitored
KPI 9
Actual education
expenditure as % of
planned expenditure
Realised APBD for education as %
of planned APBD for education District
Government
commitment Positive
Comment: No new data available for 2012. Districts in
2007 (the last year for which verified data are available)
managed to spend nearly 100% of their planned budget.
This was a significant improvement on 2006 where only
91% of funds were spent nationally.
Implications: Updated data are required to reach
conclusions about possible changes in expenditure
patterns
SPI 1
Discretionary school
funds as % of total
district school
expenditure
Estimated BOS expenditure as % of
total school expenditure District Quality Positive
Comment: In 2012, the BOS grants increased as a
proportion of the district education budget as a result of
slower growth in the district education budget, and an
increase in the value of the BOS grants themselves.
Implications: Principals and school committees have
greater than ever funds for discretionary spending at
school level

ANNUAL SECTOR FINANCIAL REPORT (2012) xiii
Risk Areas for the Education Partnership
# FINDING POSSIBLE CONSEQUENCES FOR THE EP
RA1
Some EP districts (including some with the highest poverty rates)
are persistently allocating a very low share of their resources to
education.
This low commitment may threaten districts’ ability to sustain recurrent expenditures
associated with EP investments.
RA2 Papua (and to a lesser extent Maluku) have many districts
performing badly on numerous financing indicators.
EP investments in these two provinces run the risk of losing effectiveness if they are not
supported by district financial commitment.
RA3 In 2012, 59 EP districts contracted their education budget
compared to the previous year. This may continue into the future.
Where this reflects a shifting priority away from education it may jeopardise the ability of
districts to meet future financial commitments to professional development and building
maintenance.
Suggested Next Steps
NEXT STEPS (AND LEVEL OF URGENCY) PRIME RESPONSIBILITY
NS1: EP districts which have very small share of total district budget allocated for education should be
monitored and engaged in a dialogue to understand current allocations and future plans (**). POM, with DFAT’s approval
NS2: Focus diagnostic and policy response efforts on the Papua and Maluku island groups to understand the
factors driving (i) low education share of district budgets, (ii) the average decline in budget allocations in 2012
compared to 2011 (**).
DFAT (with POM, where appropriate)
NS3: Engage in dialogue with a sample of EP districts that reduced their 2012 education budget allocations
compared to 2011. Detailed diagnostics on (i) poorest EP districts that had an annual reduction in their 2012
Budget, and (ii) districts with annual drop greater than 10%. Diagnoses to understand reasons for drop and
monitor change in allocations in 2013 and 2014 district budgets (**).
MOEC and POM (with DFAT’s approval)
NS4: Liaise with MoEC and other central agencies so as promote the introduction of district report cards on
education. These report cards should be produced on annual basis and include key educational development
and financial indicators (*). DFAT
NB: Red - high urgency (***); orange - medium urgency (**); green - low urgency (*)


Introduction, Approach and Methodology
ANNUAL SECTOR FINANCIAL REPORT (2012) 2
1 INTRODUCTION, APPROACH AND METHODOLOGY
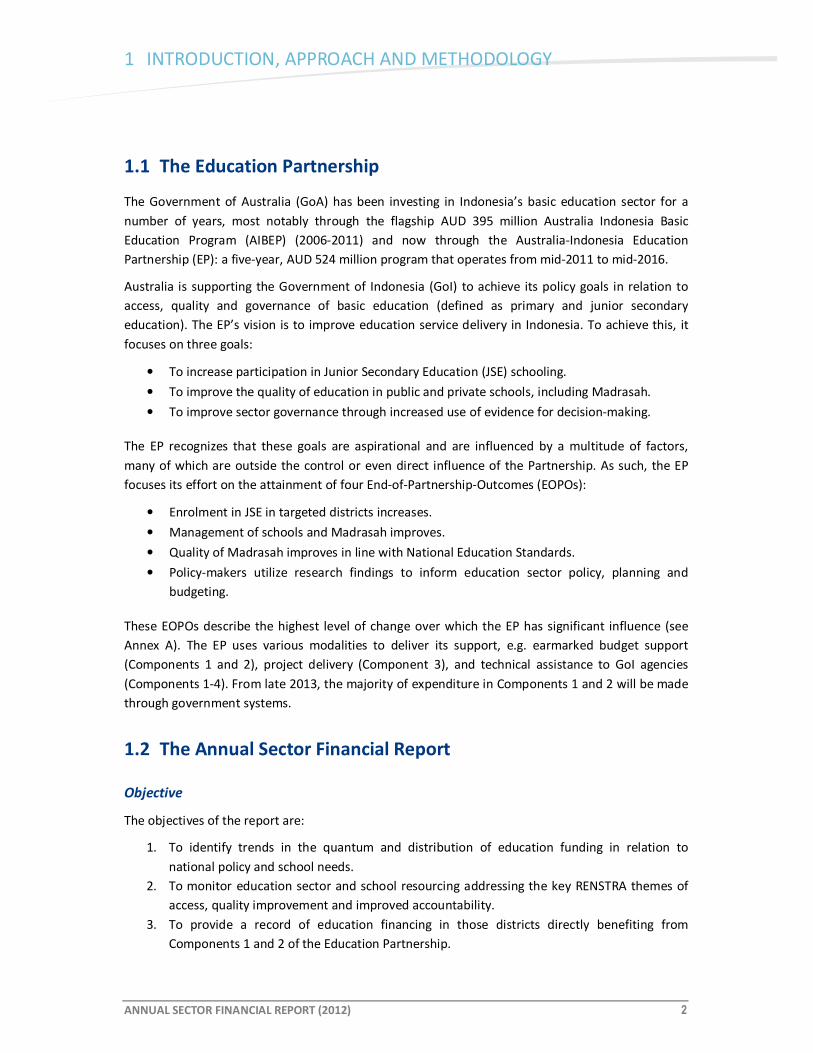
1.1 The Education Partnership
The Government of Australia (GoA) has been investing in Indonesia’s basic education sector for a
number of years, most notably through the flagship AUD 395 million Australia Indonesia Basic
Education Program (AIBEP) (2006-2011) and now through the Australia-Indonesia Education
Partnership (EP): a five-year, AUD 524 million program that operates from mid-2011 to mid-2016.
Australia is supporting the Government of Indonesia (GoI) to achieve its policy goals in relation to
access, quality and governance of basic education (defined as primary and junior secondary
education). The EP’s vision is to improve education service delivery in Indonesia. To achieve this, it
focuses on three goals:
• To increase participation in Junior Secondary Education (JSE) schooling.
• To improve the quality of education in public and private schools, including Madrasah.
• To improve sector governance through increased use of evidence for decision-making.
The EP recognizes that these goals are aspirational and are influenced by a multitude of factors,
many of which are outside the control or even direct influence of the Partnership. As such, the EP
focuses its effort on the attainment of four End-of-Partnership-Outcomes (EOPOs):
• Enrolment in JSE in targeted districts increases.
• Management of schools and Madrasah improves.
• Quality of Madrasah improves in line with National Education Standards.
• Policy-makers utilize research findings to inform education sector policy, planning and
budgeting.
These EOPOs describe the highest level of change over which the EP has significant influence (see
Annex A). The EP uses various modalities to deliver its support, e.g. earmarked budget support
(Components 1 and 2), project delivery (Component 3), and technical assistance to GoI agencies
(Components 1-4). From late 2013, the majority of expenditure in Components 1 and 2 will be made
through government systems.
1.2 The Annual Sector Financial Report
Objective
The objectives of the report are:
1. To identify trends in the quantum and distribution of education funding in relation to
national policy and school needs.
2. To monitor education sector and school resourcing addressing the key RENSTRA themes of
access, quality improvement and improved accountability.
3. To provide a record of education financing in those districts directly benefiting from
Components 1 and 2 of the Education Partnership.
ANNUAL SECTOR FINANCIAL REPORT (2012) 3
4. To inform GoA, GoI and other donors of the effectiveness and efficiency of current school
funding mechanisms.
5. To support the capacity of GoI institutions to monitor and report on school financing.
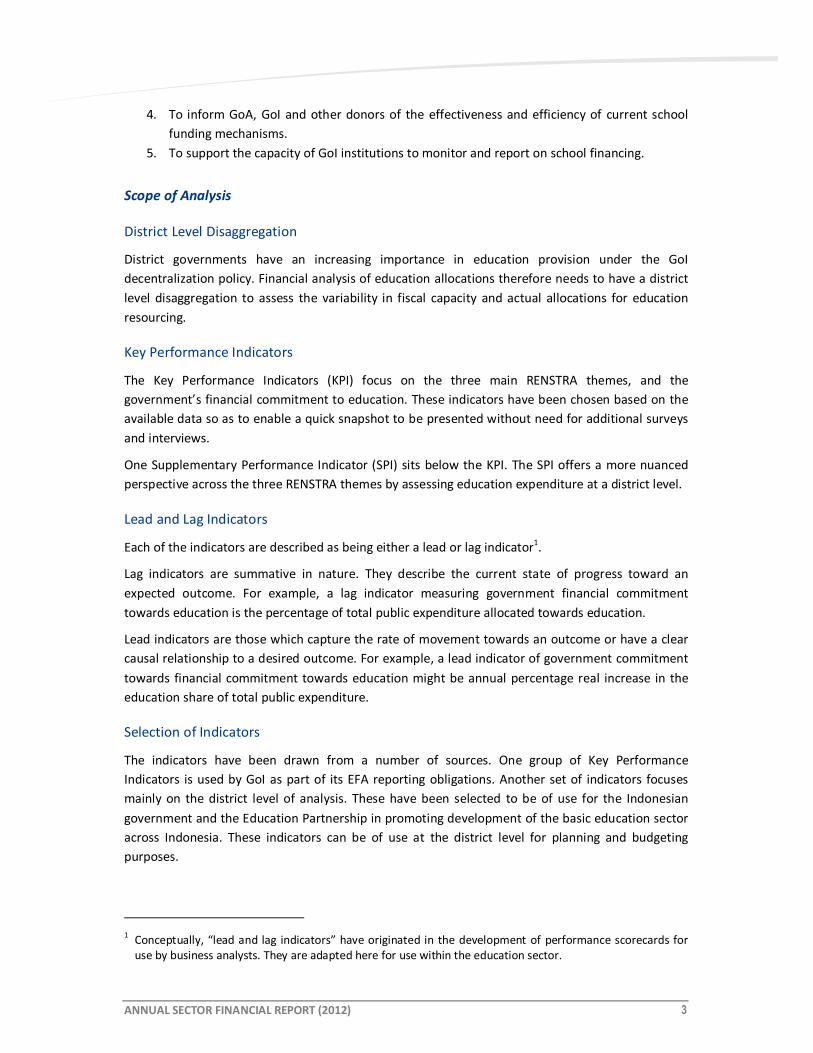
Scope of Analysis
District Level Disaggregation
District governments have an increasing importance in education provision under the GoI
decentralization policy. Financial analysis of education allocations therefore needs to have a district
level disaggregation to assess the variability in fiscal capacity and actual allocations for education
resourcing.
Key Performance Indicators
The Key Performance Indicators (KPI) focus on the three main RENSTRA themes, and the
government’s financial commitment to education. These indicators have been chosen based on the
available data so as to enable a quick snapshot to be presented without need for additional surveys
and interviews.
One Supplementary Performance Indicator (SPI) sits below the KPI. The SPI offers a more nuanced
perspective across the three RENSTRA themes by assessing education expenditure at a district level.
Lead and Lag Indicators
Each of the indicators are described as being either a lead or lag indicator1.
Lag indicators are summative in nature. They describe the current state of progress toward an
expected outcome. For example, a lag indicator measuring government financial commitment
towards education is the percentage of total public expenditure allocated towards education.
Lead indicators are those which capture the rate of movement towards an outcome or have a clear
causal relationship to a desired outcome. For example, a lead indicator of government commitment
towards financial commitment towards education might be annual percentage real increase in the
education share of total public expenditure.
Selection of Indicators
The indicators have been drawn from a number of sources. One group of Key Performance
Indicators is used by GoI as part of its EFA reporting obligations. Another set of indicators focuses
mainly on the district level of analysis. These have been selected to be of use for the Indonesian
government and the Education Partnership in promoting development of the basic education sector
across Indonesia. These indicators can be of use at the district level for planning and budgeting
purposes.
1 Conceptually, “lead and lag indicators” have originated in the development of performance scorecards for
use by business analysts. They are adapted here for use within the education sector.

ANNUAL SECTOR FINANCIAL REPORT (2012) 4
1.3 The Evidence Base
Data Sources and Collections: Financial Data
National Level Financial Data
This report has been able to update some of the historical data used in previous reports. Data for the
period 2001-2005 remains unchanged but there have been revisions for the period 2006-2008. The
government compiled comprehensive multi-year data on national and sub-national expenditures on
education in its submission to the Supreme Court case on its legal obligation to allocate at least 20%
of the national budget towards education (Supreme Court Decision Number 13/PUU-VI/2008). These
data have replaced the previous estimates generated by the World Bank in 2006 and 2007, and CSAS
for 2008.
Detailed financial data for 2009-2012 has been collected from Financial Note and Indonesian Revised
Budget Papers 2010-2012. These documents are published by the Ministry of Finance.
District Level Financial
District level financial data have been collected from the Ministry of Finance (MoF) Regional
Financial Information System (SIKD). For district financial data for the years 2006-2007 the author
worked with the Officers of the SIKD section to be given access to the available SIKD records. The
SIKD collects in hard copy the budget and actual expenditures of all districts and provinces. A
painstaking process of manually sorting through the paper financial records of all districts and
provinces was undertaken.
From 2008 onwards it has been possible to access the electronic records of district budgets
submitted to the SIKD. Near complete financial records for all districts and provinces were obtained
for 2007 and for approximately 78% of all districts in 2006. Data collection from 2008 onwards has
been direct from the electronic records within the SIKD section of the MoF.
Data Sources and Collections: Non-Financial Data
Education
Data for student, teacher and school facilities are derived from the statistical collection of the
Education Census conducted by MoRA and MoEC. These data have been collected and stored in the
Enhanced Analytical Facility (EAF) that is kept with MoEC Balitbang. This database has been built
from available government statistical collections and represents authoritative government-
sanctioned data. The database includes population data collected from the Bureau of Central
Statistics (BPS).
Poverty
Poverty is an important analytical filter for the ASFR. Financial data analysis includes an examination
of poverty by segregating districts into poverty quintiles. The Poverty quintiles are based on the “P0”
poverty scale developed by Survei Sosial Ekonomi Nasional (SUSENAS). This scale captures the
ANNUAL SECTOR FINANCIAL REPORT (2012) 5
incidence of poverty (the proportion of people living below the poverty line)2. The ASFR indicators
and analysis are available to be used and incorporated within existing mandatory reports of MoEC
and MoRA.
The data underpinning most of the indicators at the district level are sourced from GoI statistical
collections. This should mean the indicators can be reported within other regular reports. At the
district level, these indicators will be useful and could be incorporated within their reporting
systems.
2 The official method for calculating the incidence of poverty in Indonesia is the basic needs approach
developed by the BPS. The method is based on consumption related aspects of poverty with a poverty line
determined using average consumption in Rupiah for a list of basic essential food items and non-food bundle
items. An individual who is below the poverty line is considered to be poor. The PO index is the proportion of
all people living below that poverty line

Financial Performance at National Level

ANNUAL SECTOR FINANCIAL REPORT (2012) 7
2 FINANCIAL PERFORMANCE AT NATIONAL LEVEL
2.1 Introduction
Public funding for education in Indonesia is provided mostly by the central and provincial levels of
government, with the provincial level providing a smaller share. National level analysis of aggregate
public expenditure is complicated because of these different sources of funding and the
subsidization of salaries and services provided by the central level of government.
The national trends in the public financing of education are analyzed in this section. Key
Performance Indicators (KPIs) provide a macro-level assessment of government commitment
towards education. Each KPI has been assigned a ranking that indicates change on the year before
(neutral, positive, negative).
For the period 2001-2005 this report relies on data collected by the World Bank and presented in its
publication Investing in Indonesia’s Education (World Bank, 2007). For the period 2006-2008, the GoI
compiled comprehensive multi-year data on national and sub-national expenditures towards
education in its submission to the Supreme Court case on its legal obligation to allocate at least 20%
of the national budget towards education (Supreme Court Decision Number 13/PUU-VI/2008).
Detailed finance data for 2009 and 2010 has been collected from the Financial Note and Indonesian
Revised Budget 2010, section III-2, (published by MoF, 2010), and from Financial Note and
Indonesian Proposed Budget 2011, section iv-100, MoF 2010. Financial data for 2012 have been
collected from Nota Keuangan dan Rancangan Anggaran Pendapatan dan Belanja Negara Tahun
Anggaran (published by MoF 2012). An English language version of this publication could not be
accessed for 2012.
The key financial data that have been assembled to drive the national level financing are presented
in the table over-page.

ANNUAL SECTOR FINANCIAL REPORT (2012) 8
Table 1 National Level Education Financing Data 2001-20121
ITEM 2001 2002 2003 2004 2005 2006 2007 2008 2009 2010 2011 2012
Nominal National
Education Expenditures
(Rp trillion) (1)
42.3 53.1 64.8 63.1 78.6 122.99 142.2 154 207.41 225.2 243.3 286.6
National Education
Expenditures (Rp trillion
2001 prices) (2) (3)
42.3 47.8 55.4 50.4 52.1 76.1 82.2 79.2 106.4 109.4 109.9 124.8
Education Exp. As % of
National Public Exp.
(% Total National Exp.)
12.0% 15.8% 16.0% 14.2% 13.9% 17.6% 18.9% 15.6% 20.0% 20.0% 20.2% 20.2%
National Education
Exp. (% GDP) 2.5% 2.8% 3.2% 2.8% 2.9% 3.7% 3.6% 3.1% 3.7% 3.5% 3.3% 3.5%
Total Nominal National
Expenditures (Rp trillion) 352.8 336.5 405.4 445.3 565.1 699.1 752.4 989.5 1037.1 1126.2 1202.0 1418.5
GDP at Current Prices (4)
(Rp trillion)
1684.0 1897.8 2013.6 2273.1 2729.7 3339.2 3949.3 4954.0 5613.4 6436.2 7427.1 8241.9
Total Real National
Expenditures (Rp. Trillion
2001 prices)
352.8 302.7 346.3 356.0 374.5 432.7 435.0 508.8 532.2 547.3 543.1 617.5
1. Financial data for 2005-2008 from (CC: Constitutional Court Decision PUU-13/2008) where Government of Indonesia provided a
detailed breakdown of expenditure allocations. Data for 2001-2004 collected by World Bank and presented in its publication
Investing in Indonesia's Education (WB, 2007).
2. Inflation data for 2001-2006 from BPS Key Indicators of Indonesia Table 5.2 Inflation Rate Year on Year 2002-2007 Statistic
http://dds.bps.go.id/eng/download_file/Booklet_indikatorkunci.pdf. This line compares expenditures at constant 2001 prices to
remove the cost of price inflation across years
3. Inflation rate for 2007-2009 from BPS Statistical Yearbook 2009 Table 12.5 Composite Inflation Rate 2006-2009. Inflation rate For
2010-2012, BPS Statistical YearBook 2012 http://www.bps.go.id/eng/flip/flip11/index3.php
4. GDP at current prices from Bureau of Statistics 2001-2009, For 2010 - 2012, BPS Gross Domestic Product at Current Market Prices By
Industrial Origin (Billion Rupiahs), http://www.bps.go.id/eng/tab_sub/view.php?kat=2&tabel=1&daftar=1&id_subyek=11¬ab=1
1 National level data captures expenditures from all Ministries, not just MOEC and MORA.

ANNUAL SECTOR FINANCIAL REPORT (2012) 9
2.2 Key Performance Indicators
KPI 1: Education Expenditure as Proportion of Total Public Expenditure
Figure 1: Education Expenditure as Proportion of Total National Public Expenditure, 2001-2012
KPI 1 EDUCATION EXPENDITURE AS PROPORTION OF TOTAL PUBLIC EXPENDITURE
STATUS AND TRENDS
Result Positive Data availability Full
Observations
• GoI’s commitment to meet a 20% target for education expenditure share of national
budget has been met for the fourth year in a row (see Figure 1).
• The nominal value of public expenditures for education increased from 207 trillion in
2009 to 287 trillion by 2012 (see Figure 2 over-page).
• The public expenditure for education (not accounting for price inflation) increased
by approximately 38% between 2009 and 2012.
• The real value of public expenditure for education increased by 17% during the
period 2009- 2012. Almost all of the real increase in funding occurred in 2012.
• In 2001 constant prices, national education expenditures increased more than 2.6
times their original 2002 value of Rp. 48 trillion to more than Rp. 124 trillion by
2012.
• Annual increases in national education expenditure have been uneven. The growth
in public expenditure (while still positive) has been uneven in its nominal value and
2001 constant prices. Sharp increases in public expenditure for education in the
years 2003 and 2006 were followed by contractions in 2004 and 2008.
• Annual growth in national public expenditure for education in 2012 exceeded price
inflation for the first time since 2009. The GoI had particularly impressive growth in
real and nominal terms in 2006 and 2009. Growth in education expenditures had
marginally outpaced inflation since 2009 but there was a plateau in the real increase
2001 2002 2003 2004 2005 2006 2007 2008 2009 2010 2011 2012
Education Exp. As % of National PublicExp.
(% Total National Exp.)12.0% 15.8% 16.0% 14.2% 13.9% 17.6% 18.9% 15.6% 20.0% 20.0% 20.2% 20.2%
0.0%
5.0%
10.0%
15.0%
20.0%
25.0%
National Public Education Exp
enditure as % of
National Public Exp
enditure

ANNUAL SECTOR FINANCIAL REPORT (2012) 10
KPI 1 EDUCATION EXPENDITURE AS PROPORTION OF TOTAL PUBLIC EXPENDITURE
STATUS AND TRENDS
of national funding for education. In 2012 we see the first significant increase in real
terms for education funding. When accounting for the eroding impact of price
inflation over time, the real increase in funding for education can be observed. The
periods 2003-2005 and 2007-2008 saw a virtual pause (or even a slight decline) in
real education expenditures
IMPLICATIONS AND MATTERS ARISING
For the
performance of the
education sector
• The national expenditures for education in 2012 met the 20% target. Unlike the
previous three budget years, this has generated a large year-on-year increase in real
funds available for education. Education has benefited from total national public
revenues and expenditures which have grown at a significantly faster rate than
inflation.
• Adherence to a proportional budget allocation for education should enhance the
ability of the education sector to anticipate future allocations and plan accordingly
by creating a more stable financing framework. The proportional allocation
approach toward education financing (i.e. 20% of available national public budget)
will enhance predictability and steady growth of the education budget. The
exception to this will be in the case of an economic downturn that depresses GoI
revenues or where there is a change government fiscal policy settings, leading to
reduced public expenditure as a proportion gross domestic product.
For the
performance of the
Education
Partnership
• National funding flowing to schools should not be reduced and total funds available
are unlikely to be reduced.
Figure 2: National Public Expenditure on Education, Rp. Trillion 2001-2012

ANNUAL SECTOR FINANCIAL REPORT (2012) 11
Figure 3: Annual Growth in Education Expenditure (Rp. trillion), 2001-2012

ANNUAL SECTOR FINANCIAL REPORT (2012) 12
KPI 2: Education Expenditure as Proportion of GDP
Figure 4: Education Expenditure as Proportion of GDP, 2001-2012
KPI 2 EDUCATION EXPENDITURE AS PROPORTION OF GDP
STATUS AND TRENDS
Result Positive Data availability Full
Observations
• This indicator captures the national public commitment towards education in
relation to the economic wealth being generated. By mapping education
expenditure with GDP it avoids comparison problems with other countries which
may have different sized public sectors. The indicator is also useful for comparing
expenditure trends in a country which has altered the size of its public sector across
time. Generally, this indicator is used in tandem with “education share of public
expenditure”.
• Education expenditure as a proportion of GDP increased from 3.3% in 2011 to 3.5%
in 2012 (see Figure 4, above). Education as a percentage of GDP rose from 2.5% in
2001 to a high point of 3.7% by 2009. In 2007 when the latest comparison figures
are available, Indonesian education expenditure as a share of GDP (3.6%) was equal
to the East Asia regional average.
• While national education expenditure grew at the same pace as national public
expenditure for the period 2008-12, it has grown unevenly but marginally faster
than GDP during this period.
IMPLICATIONS AND MATTERS ARISING
For the
performance of the
education sector
• Expressed as a percentage of GDP, future growth in public allocations will become
contingent on an increase in public expenditures as a proportion of GDP. In a year
such as 2012 where government grows public expenditures at a faster rate than
GDP, then public expenditure as a proportion of GDP will increase if government
enforces its policy setting of a minimum 20% allocation for education expenditure.
Education expenditure as a percentage of GDP may decline if (i) fiscal settings
reduce public expenditures as a proportion of GDP, and (ii) the government does not
exceed the 20% target for education as a proportion of total public expenditure.
2001 2002 2003 2004 2005 2006 2007 2008 2009 2010 2011 2012
National EducationExp. (% GDP)
2.5% 2.8% 3.2% 2.8% 2.9% 3.7% 3.6% 3.1% 3.7% 3.5% 3.3% 3.5%
0.0%
0.5%
1.0%
1.5%
2.0%
2.5%
3.0%
3.5%
4.0%
4.5%
5.0%
Ed
uc
ati
on
Ex
pen
dit
ure
as
P
erc
en
tag
e o
f G
DP
(%
)
ANNUAL SECTOR FINANCIAL REPORT (2012) 13
KPI 3: Education Non-salary Expenditure as Share of Total Expenditure
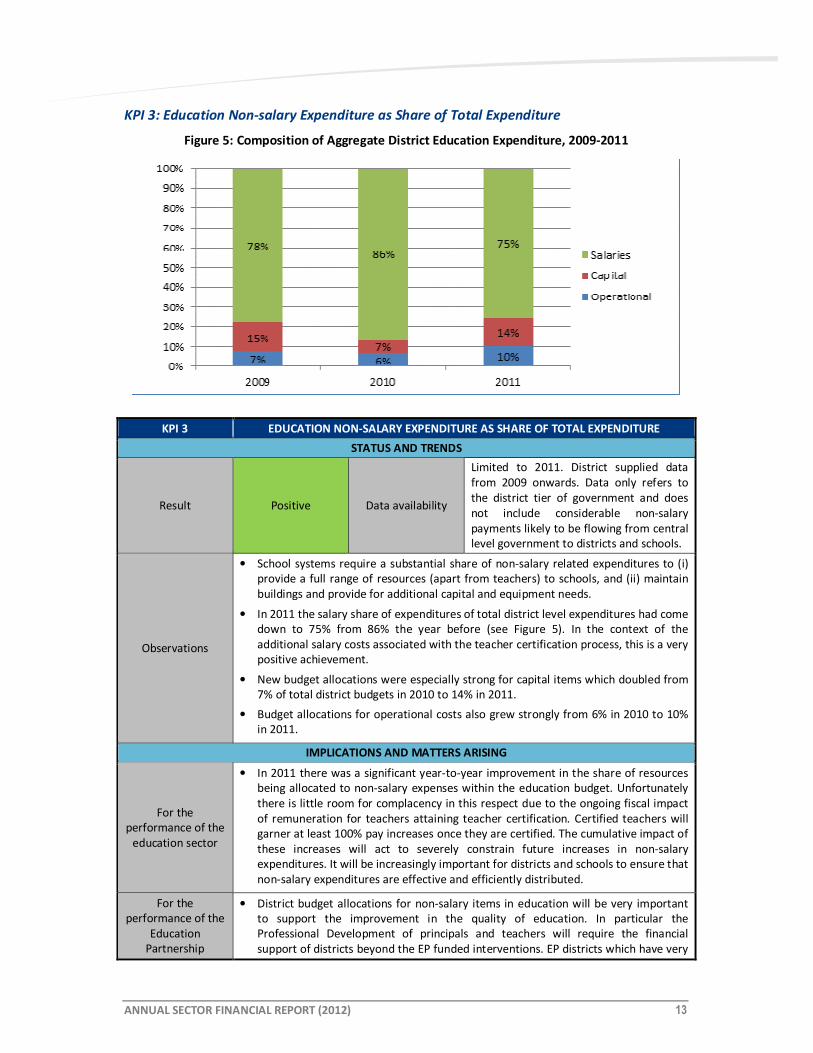
Figure 5: Composition of Aggregate District Education Expenditure, 2009-2011
KPI 3 EDUCATION NON-SALARY EXPENDITURE AS SHARE OF TOTAL EXPENDITURE
STATUS AND TRENDS
Result Positive Data availability
Limited to 2011. District supplied data
from 2009 onwards. Data only refers to
the district tier of government and does
not include considerable non-salary
payments likely to be flowing from central
level government to districts and schools.
Observations
• School systems require a substantial share of non-salary related expenditures to (i)
provide a full range of resources (apart from teachers) to schools, and (ii) maintain
buildings and provide for additional capital and equipment needs.
• In 2011 the salary share of expenditures of total district level expenditures had come
down to 75% from 86% the year before (see Figure 5). In the context of the
additional salary costs associated with the teacher certification process, this is a very
positive achievement.
• New budget allocations were especially strong for capital items which doubled from
7% of total district budgets in 2010 to 14% in 2011.
• Budget allocations for operational costs also grew strongly from 6% in 2010 to 10%
in 2011.
IMPLICATIONS AND MATTERS ARISING
For the
performance of the
education sector
• In 2011 there was a significant year-to-year improvement in the share of resources
being allocated to non-salary expenses within the education budget. Unfortunately
there is little room for complacency in this respect due to the ongoing fiscal impact
of remuneration for teachers attaining teacher certification. Certified teachers will
garner at least 100% pay increases once they are certified. The cumulative impact of
these increases will act to severely constrain future increases in non-salary
expenditures. It will be increasingly important for districts and schools to ensure that
non-salary expenditures are effective and efficiently distributed.
For the
performance of the
Education
Partnership
• District budget allocations for non-salary items in education will be very important
to support the improvement in the quality of education. In particular the
Professional Development of principals and teachers will require the financial
support of districts beyond the EP funded interventions. EP districts which have very
ANNUAL SECTOR FINANCIAL REPORT (2012) 14
KPI 3 EDUCATION NON-SALARY EXPENDITURE AS SHARE OF TOTAL EXPENDITURE
STATUS AND TRENDS
little funding allocated for operational activities (outside of salaries) should be
monitored and engaged in a policy dialogue to understand current allocations and
future plans.

ANNUAL SECTOR FINANCIAL REPORT (2012) 15
KPI 4: Expenditure on Basic Education as % of All Education Expenditure &
KPI 5: Expenditure on Non Formal Education as % of All Education Expenditure
Figure 6: Education Expenditure by Sub-Sector, 2008 and 2009
Figure 7: Basic Education Share of Central Level Expenditures for MoEC and MoRA, 2006-2009
57.6 56
9.2 10.1
8.2 10.8
22.9 21.3
0%
10%
20%
30%
40%
50%
60%
70%
80%
90%
100%
2008 2009
Other programs
Universities
Senior Secondary
Basic Education
ECED
ANNUAL SECTOR FINANCIAL REPORT (2012) 16
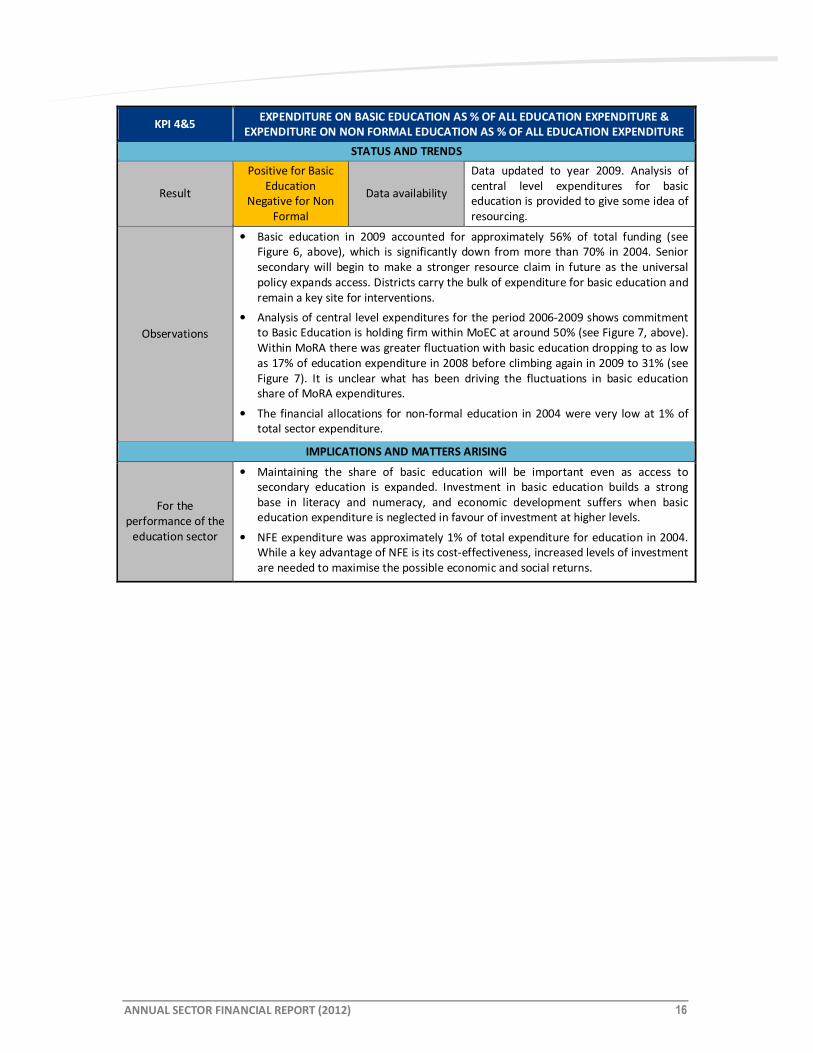
KPI 4&5 EXPENDITURE ON BASIC EDUCATION AS % OF ALL EDUCATION EXPENDITURE &
EXPENDITURE ON NON FORMAL EDUCATION AS % OF ALL EDUCATION EXPENDITURE
STATUS AND TRENDS
Result
Positive for Basic
Education
Negative for Non
Formal
Data availability
Data updated to year 2009. Analysis of
central level expenditures for basic
education is provided to give some idea of
resourcing.
Observations
• Basic education in 2009 accounted for approximately 56% of total funding (see
Figure 6, above), which is significantly down from more than 70% in 2004. Senior
secondary will begin to make a stronger resource claim in future as the universal
policy expands access. Districts carry the bulk of expenditure for basic education and
remain a key site for interventions.
• Analysis of central level expenditures for the period 2006-2009 shows commitment
to Basic Education is holding firm within MoEC at around 50% (see Figure 7, above).
Within MoRA there was greater fluctuation with basic education dropping to as low
as 17% of education expenditure in 2008 before climbing again in 2009 to 31% (see
Figure 7). It is unclear what has been driving the fluctuations in basic education
share of MoRA expenditures.
• The financial allocations for non-formal education in 2004 were very low at 1% of
total sector expenditure.
IMPLICATIONS AND MATTERS ARISING
For the
performance of the
education sector
• Maintaining the share of basic education will be important even as access to
secondary education is expanded. Investment in basic education builds a strong
base in literacy and numeracy, and economic development suffers when basic
education expenditure is neglected in favour of investment at higher levels.
• NFE expenditure was approximately 1% of total expenditure for education in 2004.
While a key advantage of NFE is its cost-effectiveness, increased levels of investment
are needed to maximise the possible economic and social returns.

Financial Performance at District Level

ANNUAL SECTOR FINANCIAL REPORT (2012) 18
3 FINANCIAL PERFORMANCE AT DISTRICT LEVEL
3.1 Introduction
District-level expenditure patterns are increasingly important because districts have increased
responsibility for education management under decentralisation. Monitoring patterns of
expenditure by districts will become an increasingly important role for MoEC and MoRA so they can
better ensure that national funding norms and procedures are being implemented appropriately.
The wide range of districts’ poverty status and the importance of education in lifting district
populations out of poverty also mean that vulnerable groups stand to benefit most from well-
targeted investments in education.
These district level analyses also can support the Australian government funded EP at the district
level. Most directly, the sustainability and success of Component 2 will depend on districts being
able and willing to finance professional development of key personnel, e.g. principals and
supervisors. As such, it is important to monitor trends in district level education financing.
This section provides comparisons of district-level education expenditures for 2006-2012. The year
2006 is a useful benchmark to identify the nature and extent of education spending at the district
level because it is before the commencement of the Australian government funded expenditures
through the BEP program that preceded the current EP.
The district-level analysis provides comparisons in district expenditures between (i) rural and urban
districts, (ii) EP and non-EP districts (with some reference to the earlier Australian funded BEP
districts, (ii) districts sorted into poverty quintile rankings, (iv) provinces, and (v) island groups.
The district poverty analysis is driven by the distribution of all districts (rural and urban) into poverty
quintiles. This means there are approximately 100 districts in each quintile. Quintile 1 (richest)
‘hosts’ the 100 districts which have the lowest percentage of individuals living in poverty. This
measure of poverty is taken from the BSP PO poverty index that is widely used for measuring
poverty in Indonesia.
The ASFR is based on data collected electronically for the period 2010 to 2012. District data prior to
this period have been collected directly from the SIKD section of MoF. The SIKD collected in hard
copy format the budget and actual expenditures of all districts and provinces. The non-financial data
(teacher and enrolments) have been collected from MoEC. Since 2010, these data have been
supplemented by data collected electronically from the MoF. The 2010 ASFR was the first to have an
entire year that was derived entirely from electronic records provided by SIKD MoF. The data
provided by the MoF is subjected to logic tests and assessed for it completeness.
The district analysis utilizes five KPIs to examine district financing of education across Indonesia. The
financial data only captures district government expenditures within each district. The financial
analysis does not therefore capture the allocations made by central or provincial governments which
may flow into the education sector within each district. It does not capture the MoRA allocations for
public and private Madrasah which are central government allocations. The district analysis is
therefore only useful as an indicator of district government priorities and expenditure patterns.

ANNUAL SECTOR FINANCIAL REPORT (2012) 19
The figure below presents the number of districts which have supplied data to MOF and MOEC that
has been used monitor the KPIs of the district level analysis.
Figure 8: Number of Districts Included in ASFR Analysis, (2006-2012)
3.2 Key Performance Indicators
KPI 6: District Financial Commitment to Education
Figure 9: Education Expenditure as % of Total District Budget (APBD 2006-2012)

ANNUAL SECTOR FINANCIAL REPORT (2012) 20
KPI 6 DISTRICT FINANCIAL COMMITMENT TO EDUCATION
STATUS AND TRENDS
Result Neutral Data availability
Financial data for 2012 was available for
487 districts and enrolment data for 496
districts out of a total 497 districts.
Observations
• Average district level education expenditures across Indonesia have increased from
27% of the total district budget (APBD) in 2006 to just over 35% in 2012 (see Figure
9, above).
• The strong increase in 2011 was reversed in 2012 with the education share dropping
just over 1% from 36.7%.
• This small reduction in the average education share of district budgets in 2012 came
after a sharp increase in 2011. This mitigates its negative significance.
• The overall increased share of education expenditures at the district level from 31%
in 2009 to 35% in 2012 demonstrates that districts, on average, strengthened their
commitment toward education spending during the period 2009-2012.
• The slight reduction in share of allocations towards education is consistent for urban
and rural areas. Rural areas dropped from average 37% share in 2011 to 36% in
2012, with urban 35% to 34% respectively.
• While these averages show maintenance of financial commitment to education, it
does disguise some variation between districts, provinces and islands. Comparison
of the fluctuations of individual districts may not be useful as their expenditure may
be significantly affected by one-off large annual investments.
• The lowest average share of budget allocation for education was found in Papua
(16%) and Maluku island group (25%). While Maluku has shown growth since 2010,
Papua has dropped again from an 18% education share of district budgets in 2010 to
16% in 2012.
• Districts in Bali had a significant drop in the average education share of district
budgets, from 39% in 2011 to 34% in 2012.
• The island groups of Sulawesi, Kalimantan and Maluku went in the opposite
direction and posted annual increases in the education share of district expenditures
in 2012.
• Nationally, 30 districts allocated less than 15% of their total district budget (APBD) to
education in 2012. Of the 30 districts, 22 are in the poorest quintile, and 17 of these
are found in Papua.
• Nineteen districts allocated less than 15% of their total district budget (APBD) to
education for four years in a row during the period 2009-2012.
• Analysis of districts by their poverty quintile, shows that the poorest districts have
consistently committed the lowest proportion of their budget (average 31% in 2012)
towards education during the period 2006-2012.
• The poorest quintiles (4 and 5) are the ones to have recorded the biggest annual
drop in the education share of district expenditures.
Observations about
EP districts
• On average, the EP districts committed a greater proportion of their budget towards
education than the non-participating districts. On average, Component 1 districts
allocated 39% of their budget in 2012, compared with 32% for the non-participating
districts.
• Eighteen EP districts contributed less than the 20% national target to education.
They were also considerably lower than the national average of 35% for education in
2012.
• Reflecting a positive high level of financial commitment towards education, 36 EP
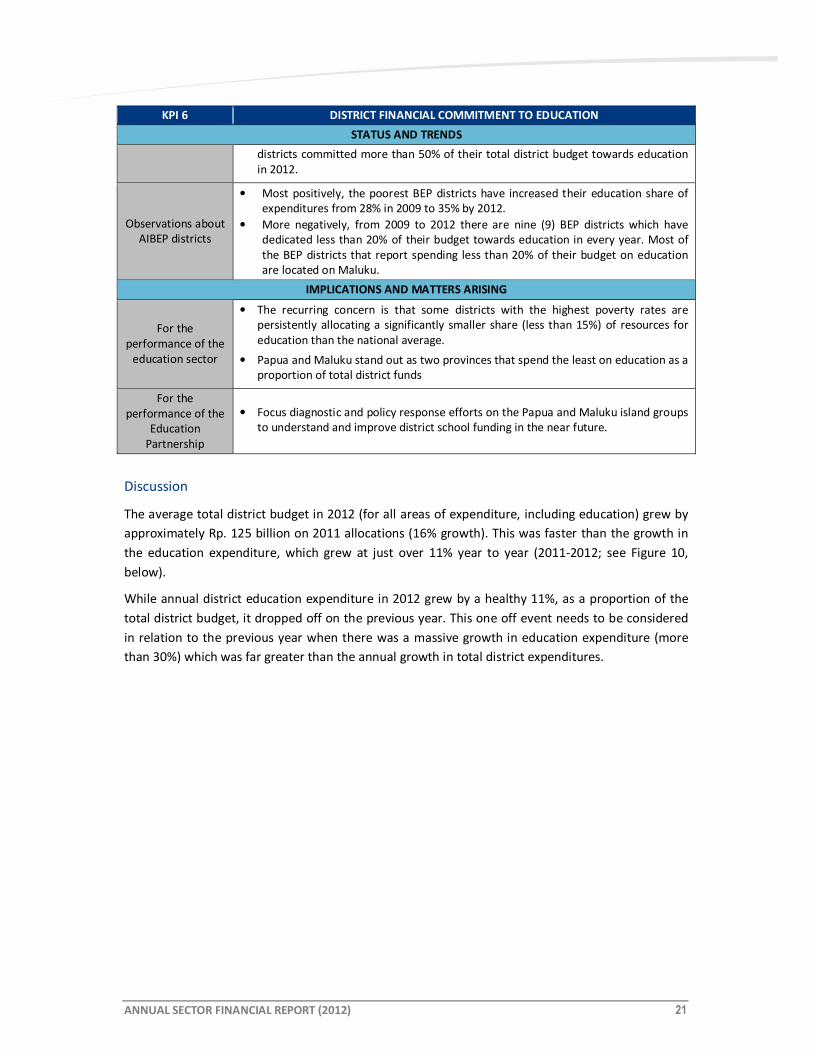
ANNUAL SECTOR FINANCIAL REPORT (2012) 21
KPI 6 DISTRICT FINANCIAL COMMITMENT TO EDUCATION
STATUS AND TRENDS
districts committed more than 50% of their total district budget towards education
in 2012.
Observations about
AIBEP districts
• Most positively, the poorest BEP districts have increased their education share of
expenditures from 28% in 2009 to 35% by 2012.
• More negatively, from 2009 to 2012 there are nine (9) BEP districts which have
dedicated less than 20% of their budget towards education in every year. Most of
the BEP districts that report spending less than 20% of their budget on education
are located on Maluku.
IMPLICATIONS AND MATTERS ARISING
For the
performance of the
education sector
• The recurring concern is that some districts with the highest poverty rates are
persistently allocating a significantly smaller share (less than 15%) of resources for
education than the national average.
• Papua and Maluku stand out as two provinces that spend the least on education as a
proportion of total district funds
For the
performance of the
Education
Partnership
• Focus diagnostic and policy response efforts on the Papua and Maluku island groups
to understand and improve district school funding in the near future.
Discussion
The average total district budget in 2012 (for all areas of expenditure, including education) grew by
approximately Rp. 125 billion on 2011 allocations (16% growth). This was faster than the growth in
the education expenditure, which grew at just over 11% year to year (2011-2012; see Figure 10,
below).
While annual district education expenditure in 2012 grew by a healthy 11%, as a proportion of the
total district budget, it dropped off on the previous year. This one off event needs to be considered
in relation to the previous year when there was a massive growth in education expenditure (more
than 30%) which was far greater than the annual growth in total district expenditures.

ANNUAL SECTOR FINANCIAL REPORT (2012) 22
Figure 10: Average District APBD and APBD for Education, 2006-2012
Both urban and rural districts have retained a high allocation of the district budgets towards
education (more than 34%). While rural districts have remained largely unchanged in their
proportionate share for education, urban areas slightly dropped to 36% (see Figure 11, below).
Figure 11: Rural and Urban District Education Expenditure as % of Total District Budget (APBD
2006-2012)
Districts in most poverty quintiles increased their average allocation share for education between
2006 and 2011, with the single major exception of quintile 3 which had a significant fall, and the
smaller decrease of poorest districts (quintile 5) in 2010 (see Figure 12, below). The year 2011
marked a change with significant increases in the education share of district budgets across districts
from all poverty quintiles.

ANNUAL SECTOR FINANCIAL REPORT (2012) 23
In 2012 there is a change with reduced allocation share towards education across districts in all
poverty quintiles except for the richest which recorded a small increase.
Poverty quintile analysis still shows that the poorest districts have consistently committed the lowest
proportion of their budget (average 31%) towards education during the period 2006-2012.
More concerning is that the poorest quintiles (4 and 5) are the ones to have recorded the biggest
drops in the education share of district expenditures. The poorest quintile has had the biggest drop
and allocates less than any other quintile (31.5%).
Figure 12: Education Expenditure as % of Total District Expenditure by Districts according to
Poverty Quintile, (APBD 2006-2012)
From 2009 onwards, the average size of district global budgets (for all sectors) directly corresponds
to their poverty quintile status. The richest quintile districts have an average district budget in 2012
of Rp. 1.1 trillion compared to the poorest districts Rp. 700 trillion. The other three quintiles are
distributed within this range according to their quintile rank.
In education expenditure, the poorest quintile districts are the clear outlier with an average district
education budget of Rp. 216 trillion compared to the all the other quintiles which are grouped
between Rp. 338 – 363 trillion (see Figure 13).

ANNUAL SECTOR FINANCIAL REPORT (2012) 24
Figure 13: Average District APBD and APBD for Education, by poverty quintile 2006-2012
Following the big increases in education expenditure in 2011, there were moderate declines in
education share of expenditure in the island groups of Java, Sumatera and Papua. There was a
significant drop of more than 5% in Bali.
Of particular concern, is that Papua alone remains below the average 20% commitment of district
funds towards education. It has further retreated from the 20% commitment, with expenditures
declining from 18% of funds in 2011 to 16% in 2012.
The island groups of Sulawesi, Kalimantan and Maluku went in the opposite direction and posted an
annual increase the education share of district expenditures in 2012 (see Figure 14, below).

ANNUAL SECTOR FINANCIAL REPORT (2012) 25
Figure 14: Education Expenditure as % of Total District Expenditure by Island Grouping (APBD
2006-2012)
Education Partnership (EP) districts
On average, the districts participating in the EP (see Annex B) have been committing a greater
proportion of their budget towards education than the non-participating districts. On average
Component 1 districts were the highest and allocated 39% of their budget in 2012, compared with
32% for the non-participating districts (see Figure 15, below).
Figure 15: EP Districts - Average Education Allocations as Proportion of District Budget, 2012
ANNUAL SECTOR FINANCIAL REPORT (2012) 26
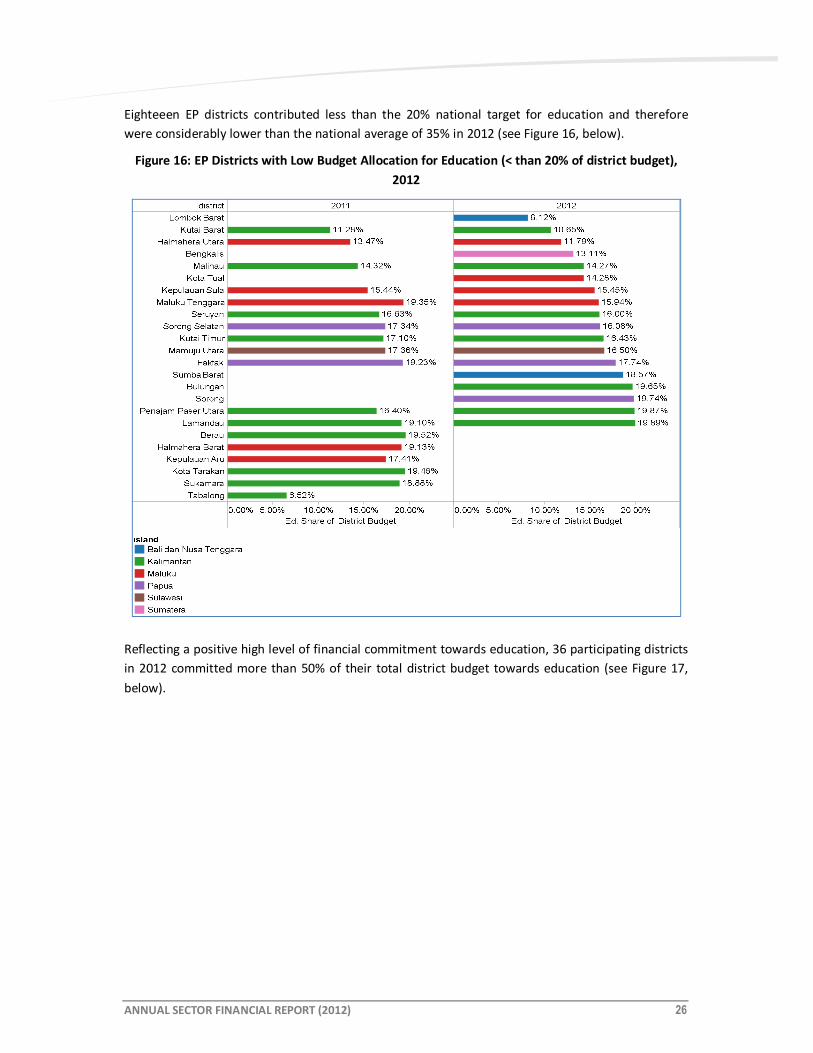
Eighteeen EP districts contributed less than the 20% national target for education and therefore
were considerably lower than the national average of 35% in 2012 (see Figure 16, below).
Figure 16: EP Districts with Low Budget Allocation for Education (< than 20% of district budget),
2012
Reflecting a positive high level of financial commitment towards education, 36 participating districts
in 2012 committed more than 50% of their total district budget towards education (see Figure 17,
below).

ANNUAL SECTOR FINANCIAL REPORT (2012) 27
Figure 17: EP Districts with high Budget Allocation for Education (>than 50% of district budget),
2012
Nationally, 30 districts had less than 15% expenditure on education in 2012. Of these districts, 19
have allocated less than 15% of their total district budget (APBD) every year during the period 2009-
2012.
Figure 18, below, shows every district that allocated less than 15% of their district budget on
education in any of the three budget years during 2009-2012. It would be useful to understand why
the education budget share is so low in these districts and to what extent they represent policy
related or demand side factors as well as possible misreporting to the MoF.

ANNUAL SECTOR FINANCIAL REPORT (2012) 28
Figure 18: Districts with very low financial share for education (less than 15% of APBD
Expenditure) 2009 -2012

ANNUAL SECTOR FINANCIAL REPORT (2012) 29
* Districts that are blank for one year have exceeded the benchmark for that year.
Looking at the 30 districts which in 2012 committed less than 15% of their budget towards
education, we find that 22 of these districts belong to the poorest quintile of districts. Of these 22
poorest quintile districts, 17 are found in Papua and 5 are in Maluku (see Figure 19, below).
Figure 19: Poorest Districts with very low financial share for education (less than 15% of APBD
Expenditure) 2012
It is interesting to look at the experience of the GoA funded BEP districts to see how their education
expenditure patterns have evolved during and since the GoA investments.

ANNUAL SECTOR FINANCIAL REPORT (2012) 30
Figure 20: APBD Education Expenditure as % of Total district Expenditure in BEP and Non-BEP
Supported Districts (APBD 2006-2012)
While BEP districts have committed a share of their district budget that is broadly in line with the
national average, there are some BEP districts that have spent considerably less.
This report presents three years of results from 2009 to 2012 showing there have been 9 BEP
districts which have dedicated less than 20% of their budget towards education in every year.
Most of the BEP districts that report spending less than 20% of their budget on education in both are
located on Maluku. While some of the low figures may be due to poor reporting, the persistence of
these low allocations shares in consecutive years suggest there are other factors involved.
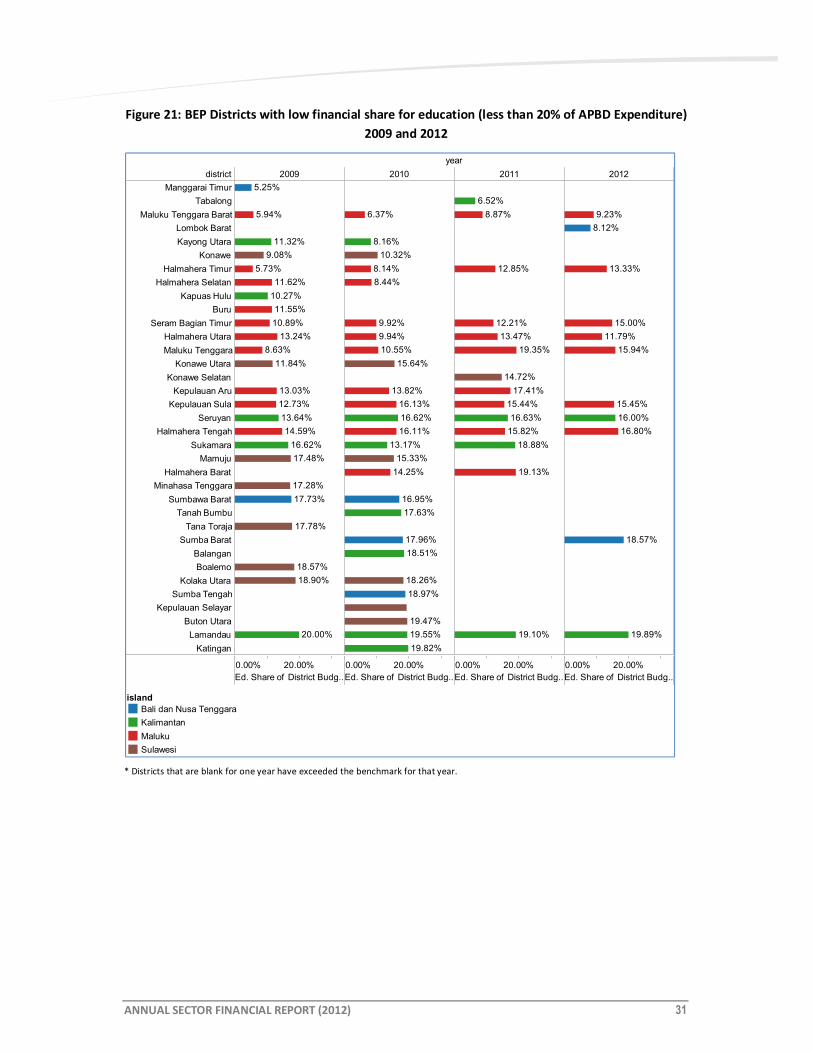
ANNUAL SECTOR FINANCIAL REPORT (2012) 31
Figure 21: BEP Districts with low financial share for education (less than 20% of APBD Expenditure)
2009 and 2012
* Districts that are blank for one year have exceeded the benchmark for that year.
district
year
2009 2010 2011 2012
0.00% 20.00%
Ed. Share of District Budg..
0.00% 20.00%
Ed. Share of District Budg..
0.00% 20.00%
Ed. Share of District Budg..
0.00% 20.00%
Ed. Share of District Budg..
Manggarai Timur
Tabalong
Maluku Tenggara Barat
Lombok Barat
Kayong Utara
Konawe
Halmahera Timur
Halmahera Selatan
Kapuas Hulu
Buru
Seram Bagian Timur
Halmahera Utara
Maluku Tenggara
Konawe Utara
Konawe Selatan
Kepulauan Aru
Kepulauan Sula
Seruyan
Halmahera Tengah
Sukamara
Mamuju
Halmahera Barat
Minahasa Tenggara
Sumbawa Barat
Tanah Bumbu
Tana Toraja
Sumba Barat
Balangan
Boalemo
Kolaka Utara
Sumba Tengah
Kepulauan Selayar
Buton Utara
Lamandau
Katingan
17.73%
11.32%
10.27%
13.64%
16.62%
20.00%
11.62%
11.55%
10.89%
13.24%
13.03%
12.73%
14.59%
11.84%
17.48%
17.28%
17.78%
18.57%
18.90%
5.25%
5.94%
5.73%
8.63%
9.08%
16.95%
17.96%
18.97%
16.62%
13.17%
17.63%
18.51%
19.55%
19.82%
10.55%
13.82%
16.13%
16.11%
14.25%
10.32%
15.64%
15.33%
18.26%
19.47%
8.16%
6.37%
8.14%
8.44%
9.92%
9.94%
16.63%
18.88%
19.10%
12.85%
12.21%
13.47%
19.35%
17.41%
15.44%
15.82%
19.13%
14.72%
6.52%
8.87%
18.57%
16.00%
19.89%
13.33%
15.00%
11.79%
15.94%
15.45%
16.80%
8.12%
9.23%
island
Bali dan Nusa Tenggara
Kalimantan
Maluku
Sulawesi

ANNUAL SECTOR FINANCIAL REPORT (2012) 32
KPI 7: Annual Growth in Education Spending for the Poorest Districts
Figure 22: Annual Growth in APBD Education Expenditure, 2007 -2011, by Poverty Quintile
KPI 7 ANNUAL GROWTH IN EDUCATION SPENDING FOR THE POOREST DISTRICTS
STATUS AND TRENDS
Result Negative Data availability
Financial data for 2012 was available for
487 districts and enrolment data for 496
districts out of a total 497 districts.
Observations
• On the positive side, poorest districts (i.e. those in the bottom quintile) recorded a
7% average annual growth in their 2012 education budget on the previous year. This
follows a very strong positive growth (40%) in 2011, a mild contraction in 2010, and
annual growth of 10% and 5% between 2007-08 and 2008-09 budgets (see Figure
22, above).
• On balance, however, it is a poor result for the poorest districts which have the
lowest average percentage increase in budget allocations for education of all the
poverty quintiles. Their growth of education budgets is marginally above the annual
inflation rate.
• In 2012 100 districts (nearly 20%) showed a decline in their education budget. A
marked deterioration from 2011, when only 22 districts experienced a decline in
annual education budget allocation.
• Looking specifically at the poorest quintile districts in 2012, the problem of
contracting education budgets is again focused on Papua. Twenty of the 31 districts
recording a decline in nominal annual district education expenditure are located in
Papua.
• In 2012, 31 of the poorest districts experienced a contraction in their nominal
education expenditure (before accounting for inflation) compared to the previous
district annual budget. This is a retreat from the previous year when only 6 poorest
quintile districts experienced an annual decline.

ANNUAL SECTOR FINANCIAL REPORT (2012) 33
KPI 7 ANNUAL GROWTH IN EDUCATION SPENDING FOR THE POOREST DISTRICTS
STATUS AND TRENDS
• Urban districts with an average annual growth of 14% in year to year allocations
grew more strongly than urban districts (11%).
Observations about
EP districts
• In 2012 EP districts on average grew their education budgets by 12% on the previous
year’s budget.
• However, 59 EP districts showed an annual contraction in their education budget
compared to the previous year.
Observations about
AIBEP districts
• In 2012, BEP districts within all poverty quintiles showed annual growth in education
expenditure.
IMPLICATIONS AND MATTERS ARISING
For the
performance of the
education sector
• Poorest districts had the lowest average percentage increase in budget allocations
for education of all the poverty quintiles. Their growth of education budgets is
marginally above the annual inflation rate.
• In 2012 nearly 100 districts (nearly 20%) showed an annual decline their education
budget; a deterioration from 2011 when only 22 districts showed an annual drop in
their education budget allocation.
• A diagnostic assessment should be considered for Papua and those poorest districts
which are reducing their education expenditures.
For the
performance of the
Education
Partnership
• There is merit in speaking with those EP districts that reduced their 2012 education
budget allocations compared to 2011
• There may also be merit in running detailed diagnostics on (i) a sample of poorest EP
districts that had an annual reduction in their 2012, and (ii) a sample of districts with
annual drop greater than 10%. The diagnoses could be used to better understand
reasons for the drop and to monitor change in allocations in 2013 and 2014 district
budgets.
Discussion
The average annual growth rate of district education budgets in 2012 was a strong 12%. This follows
a very strong growth in 2011 (36%). Although the chart may show a dip from the previous year, a
12% annual growth in education spending is very healthy. The strongest growth was shown by the
urban districts, which had annual growth of 14% compared with an 11% annual growth of urban
districts (see Figure 23, below).

ANNUAL SECTOR FINANCIAL REPORT (2012) 34
Figure 23: Annual Growth in District Education Expenditure, (APBD 2007-2012)
In 2012, 31 of the poorest districts experienced a contraction in their nominal education expenditure
(before accounting for inflation) compared to the previous district annual budget. This is a retreat
from the previous year when only 6 poorest quintile districts experienced an annual decline in the
dedicated 2011 district budget funds for education (compared with the 2010 district budget
allocations).
Papua remains the focus of the decline - twenty of the districts recording a decline in nominal annual
district education expenditure (out of 31) are located in Papua.

ANNUAL SECTOR FINANCIAL REPORT (2012) 35
Figure 24: Poorest Districts (Quintile 5), Negative Annual Growth in Education Expenditure, (APBD
2010-2012)
Poverty quintile analysis of districts with declining education budget allocations in 2012 shows them
to be distributed across all quintiles although 31 of the 97 are from the poorest quintile.
p0Quintile district
year
2010 2011 2012
-40.00% -20.00%
Education Budget Annual Growth
-40.00% -20.00%
Education Budget Annual Growth
-40.00% -20.00%
Education Budget Annual Growth
Poorest Bener Meriah
Dogiyai
Fakfak
Sorong Selatan
Maluku Tenggara
Teluk Bintuni
Lembata
Kepulauan Meranti
Buru
Manokwari
Seram Bagian Timur
Maluku Barat Daya
Tolikara
Paniai
Bangkalan
Lampung Utara
Lombok Utara
Keerom
Aceh Utara
Mamberamo Raya
Intan Jaya
Halmahera Timur
Kepulauan Yapen
Lanny Jaya
Maybrat
Pidie
Supiori
Kota Tual
Nias Utara
Nduga
Yalimo
Sumba Barat
Asmat
Bengkulu Selatan
Biak Numfor
Boven Digoel
Ende
Gayo Lues
Halmahera Tengah
Kaur
Kota Subulussalam
Kulon Progo
Lampung Timur
Manggarai
Mappi
Mimika
Pegunungan Bintang
Polewali Mandar
Poso
Raja Ampat
Rembang
Sampang
Sarmi
Seluma
Simeulue
Sorong
Sumba Tengah
Sumba Timur
Sumbawa
Sumbawa Barat
Timor Tengah Utara
Waropen
Wonosobo
-16.91%
-22.09%
-10.65%
-12.02%
-36.20%
-17.18%
-29.73%
-14.15%
-18.77%
-12.89%
-10.43%
-18.44%
-18.38%
-16.29%
-11.64%
-16.06%
-24.73%
-13.27%
-31.13%
-7.74%
-3.67%
-3.68%
-6.40%
-4.49%
-1.16%
-4.62%
-4.42%
-9.60%
-8.39%
-7.63%
-4.33%
-5.44%
-6.27%
-2.27%
-9.44%
-2.90%
-6.52%
-10.33%
-14.87%
-20.68%
-6.26%
-6.39%
-8.51%
-42.66%
-15.84%
-30.22%
-12.68%
-14.58%
-19.89%
-25.34%
-25.70%
-29.90%
-32.64%
-40.11%
-25.79%
-31.65%
-4.43%
-7.87%
-7.14%
-2.99%
-4.62%
-5.81%
-6.74%
-1.30%
-1.48%
-2.04%
-3.59%
-5.07%
-6.89%
-6.94%
-8.30%
-0.42%
-4.47%
-7.54%
-9.07%
island
Bali dan Nusa Tenggara
Jawa
Maluku
Papua
Sulawesi
Sumatera

ANNUAL SECTOR FINANCIAL REPORT (2012) 36
Figure 25: Total Number of Districts, with Negative Annual Growth in APBD Education
Expenditure, 2007 -2011
In 2012 there was an increase in the number of EP districts (59 in 2012)that experienced a decline in
their annual allocation for education compared to the previous year.
Figure 26: Number of Districts with declining annual education expenditure
A particular concern is to observe the number of poorest districts (bottom 20% by poverty ranking)
which provided less for education than the previous year. In 2012 there were 22 EP poorest districts
which provided less for education than their previous budget.
Number of Districts

ANNUAL SECTOR FINANCIAL REPORT (2012) 37
Figure 27: EP Poorest Districts with declining annual education expenditure (2012 vs 2011)
The following four tables provide (i) the name of those EP districts which had an annual decline their
financial commitment towards education in 2012, and (ii) the percentage drop in their financial
commitment to education compared to the value of the previous year’s budget .
Figure 28: Component 1 districts with declining annual education expenditure (2012 vs 2011)

ANNUAL SECTOR FINANCIAL REPORT (2012) 38
Figure 29: Component 2 districts with declining annual education expenditure (2012 vs 2011)
Figure 30: Component 1 & 2 districts with declining annual education expenditure (2012 vs 2011)
BEP districts had a strong growth in education expenditures with a national average of 12% that was
marginally above the national average growth for all districts.

ANNUAL SECTOR FINANCIAL REPORT (2012) 39
Figure 31: BEP and Non-BEP Districts - Annual Growth in District Education Expenditure, (APBD
2007-2012)
In 2012 there were 97 districts showing a decline in the education budget. This is deterioration from
2011, where 22 districts experienced a decline in annual education budget allocation. In 2012, nearly
20% of districts showed a decline in budget commitment towards education.
Figure 32: Number of Districts, with Negative Annual Growth in APBD Education Expenditure
(2007-2011)

ANNUAL SECTOR FINANCIAL REPORT (2012) 40
KPI 8: Average District Expenditure per Student
Figure 33: Average District Education Expenditure per all Students, 2006-2012 (Rp. millions.)
KPI 8 AVERAGE DISTRICT EXPENDITURE PER STUDENT
STATUS AND TRENDS
Result Positive Data availability
Financial data for 2012 was available for
487 districts and enrolment data for 496
districts out of a total 497 districts.
Observations
• Average expenditure per student across the country grew but not as strongly as for
2011. Average education expenditure per student has grown to Rp. 3.1 million in
2012, from an average Rp. 2.8 million in 2011 (see Figure 33, above).
• Average per student expenditure is higher in rural districts and reached Rp. 2.9
million per student in 2012 compared to Rp. 2.4 million per student in the urban
areas.
• Highest allocations per student are found in the poorest districts (quintile 5) at an
average Rp. 3.4 million per student.
• The richest quintile districts are the outliers with per student expenditures at Rp.
2.8 million. The poorest districts are on average allocating 28% more per student
than the richest.
• Districts in the far eastern region of the country tend to have significantly higher
costs per student than districts in the western region because of the lower density of
populations. Average expenditure per student in 2012 was again highest in the
island groups of Papua (Rp. 5.5 million) and Kalimantan (Rp. 4.9 million). Lowest
expenditure by a considerable margin is found on Java with Rp. 2.6 million per
student.
• The most striking aspect of the breakdown of per student expenditure is that the
Papua island group declines in the annual per student allocation for education in
2012. In Papua, per student allocations for education drop 12% from Rp. 6.26 million
in 2011 to Rp. 5.48 million in 2012.
• The ‘per student allocation’ is greatly affected by the sparseness of population.
More sparsely populated districts (such as those in the eastern region and many of

ANNUAL SECTOR FINANCIAL REPORT (2012) 41
KPI 8 AVERAGE DISTRICT EXPENDITURE PER STUDENT
STATUS AND TRENDS
those in the poorest quintile districts) have higher average salary costs. This is
because of both lower student/teacher ratios and higher salary related costs
associated with remote area allowances.
• During the four year period 2008-2011, Indonesia displayed an overall growth in per
student expenditures, with a linear trend for greater expenditures in the poorest
districts. In 2012 the slope of this equity spending was halted, with slower growth in
the poorest districts.
Observations about
EP districts
• District expenditure per student has been increasing across EP participating and
non-participating districts.
• These increases disguise great internal variation in district allocations. Twenty-five
EP districts allocate less than Rp. 2.2 million per student. On the positive side, 33 EP
districts allocate above Rp. 6.2 million per student, which is more than double the
national average per student allocation for education.
Observations about
AIBEP districts
• Per student expenditure in BEP districts has started from a higher base but
consistently grown over time at a similar rate to the other non-BEP districts.
IMPLICATIONS AND MATTERS ARISING
For the
performance of the
education sector
• To achieve better learning outcomes across the poorest districts, the district
governments in poorest districts will need to grow their education spending more
quickly and drive a stronger ‘equity slope’ in education funding distribution.
• The reasons behind the decline in per student allocations towards education in
Papua districts need to be understood.
For the
performance of the
Education
Partnership
• Most EP districts are showing growth in per student allocations for education which
provides a good financial base for further improvements.
• EP districts that have reduced their per student allocations in 2012. There is merit in
monitoring 2013 and 2014 budget allocations for any continuation of a declining
trend.
A more nuanced analysis of per student education expenditure looks at district expenditures per
public MoEC school students. This provides a more accurate measure because districts are only
responsible for teacher salaries and other operational expenses of MoEC public schools. By excluding
private school students from per student calculations it is possible to remove the bias of different
rates of enrolment in private schools across districts.
The national average education expenditure per public students in 2011 was Rp. 4 million per
student (from a previous year average of Rp. 3 million). Average expenditure per student for urban
districts (Rp. 3.91 million) remains very close to rural districts (Rp. 3.98 million). Because there are
proportionately greater numbers of private school students in urban areas, this indicator neutralizes
the trend of the broader indicator expenditure per all students.
This analysis could not be undertaken for 2012 because student enrolment data for this year has
been able to be disaggregated into public and private enrolments.

ANNUAL SECTOR FINANCIAL REPORT (2012) 42
Figure 34: Comparison - Expenditure per All Students vs. Expenditure per Public Students, (Rp.
millions)
Districts in the far eastern region of the country tend to have significantly higher costs per student
than districts in the western region because of the lower density of populations. Average
expenditure per student in 2012 was again highest in the island groups of Papua (Rp. 5.5 million) and
Kalimantan (Rp. 4.9 million). Lowest expenditure by a considerable margin is found on Java with Rp.
2.6 million per student. To some extent the lower unit costs in java reflect the population density
which makes it easier to run schools at maximum capacity and consistently high student: teacher
ratios.

ANNUAL SECTOR FINANCIAL REPORT (2012) 43
Figure 35: Average APBD Education Expenditure per Student (Rp. millions), 2008-12 by Island
The most striking aspect of the breakdown of the 2012 per student expenditure is that the Papua
island group declines in the annual per student allocation. In Papua, per student allocations for
education drop 12% from Rp. 6.26 million in 2011 to Rp. 5.48 million in 2012.
The table below presents a breakdown of the average annual growth in district education budgets
within the Papua island group. It shows that with the exception of Kota Sorong in one year (2010)
the annual decline in district education budgets has only occurred in the poorest quintile districts. In
2012, seventeen (17) of the poorest districts in Papua (from a total 41 districts) showed an annual
decline in their allocations for education.
Some districts showing negative growth in 2012 had recorded very strong annual growth in the
previous year. This might be an explanation why expenditures leveled off in 2012. Many other
districts did not have such strong growth and it is unclear why so many districts in Papua had an
annual drop in their 2012 education allocations.
Ed. Expenditure per All Students

ANNUAL SECTOR FINANCIAL REPORT (2012) 44
Figure 36: Papua: Average Annual Growth in District Education Budget, (Rp. millions) 2010-12
District expenditure per student has been increasing across EP districts. By 2012, the non-
participating districts had a higher average allocation for education (Rp. 3.3 mill.) compared to
participating districts (Rp. 2.8 – 3.2 mill.).

ANNUAL SECTOR FINANCIAL REPORT (2012) 45
Figure 37: Average District Expenditure per Student, EP Districts and Others 2012 (Rp. millions)
These averages disguise great internal variation district allocations. For operational purposes it may
be useful to identify the low and high end outliers in terms of per student allocations. Compared to
the national average Rp. 3.1 million allocation per student, there are 25 EP disricts allocating less
than Rp. 2.2 million per student.
Some caution needs to be exercised in interpreting these figures. A high percentage of student
enrolments in the private school sector will provide a misleadingly low estimate the actual financing
for schools. The private school enrolments are likely to have the biggest impact in the richest urban
districts with a likely higher share of well resourced private schools. The table below shows there are
six districts (out of 25) which are in the richest quintile and committing less than Rp. 2.2 million per
student.

ANNUAL SECTOR FINANCIAL REPORT (2012) 46
Figure 38: EP Districts with Low Expenditure per Student, 2012 (Rp. millions)
Conversely, there are 33 EP districts that are allocating more than double (Rp. 6.2 million) the
national average per student allocation for education.

ANNUAL SECTOR FINANCIAL REPORT (2012) 47
Figure 39: EP Districts with very high per student expenditure, 2012 (Rp. millions)
Unit cost calculations are greatly affected by the sparseness of populations and care needs to be
taken when comparing districts. Care should be taken to compare like with like districts in order to
get a true feel for the district government commitment and possible impact on quality.
Reasonable distribution of public education funds should generally provide greater funding per
student to the poorest areas. This weighted distribution of government funds can enable the
poorest communities to overcome a financial inability to pay for services. It also helps to cover the
higher cost of servicing poor communities that are also in remote or difficult to reach areas.
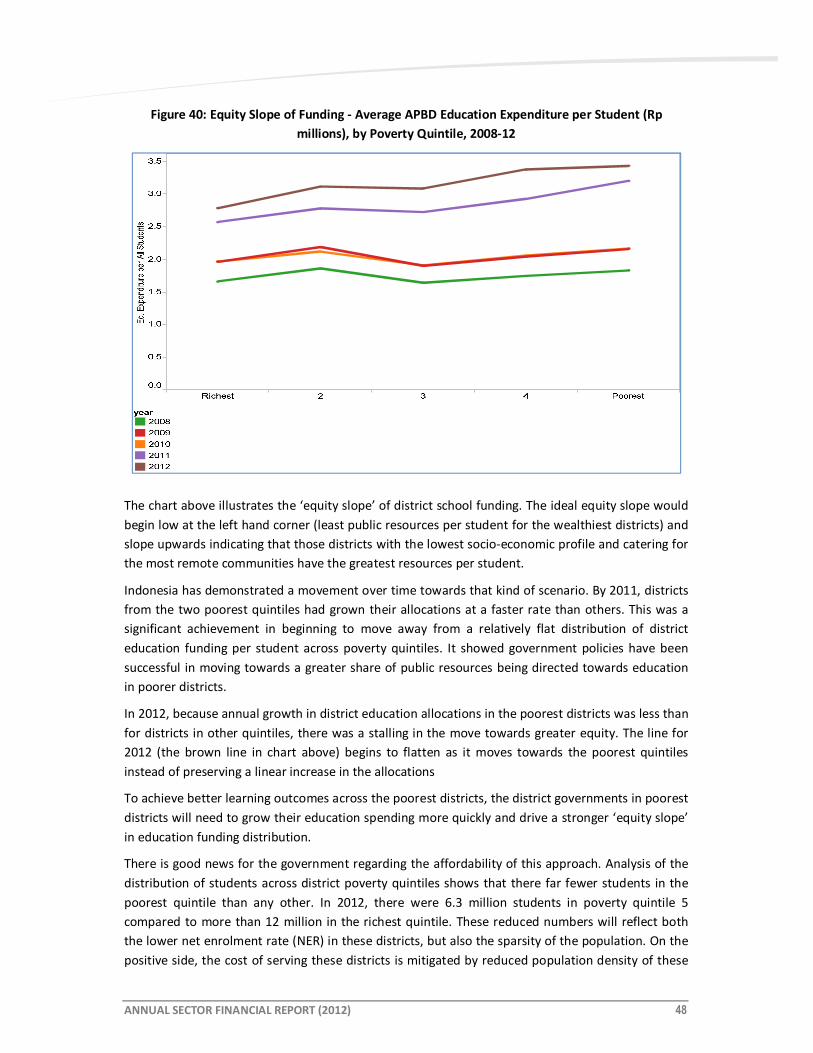
ANNUAL SECTOR FINANCIAL REPORT (2012) 48
Figure 40: Equity Slope of Funding - Average APBD Education Expenditure per Student (Rp
millions), by Poverty Quintile, 2008-12
The chart above illustrates the ‘equity slope’ of district school funding. The ideal equity slope would
begin low at the left hand corner (least public resources per student for the wealthiest districts) and
slope upwards indicating that those districts with the lowest socio-economic profile and catering for
the most remote communities have the greatest resources per student.
Indonesia has demonstrated a movement over time towards that kind of scenario. By 2011, districts
from the two poorest quintiles had grown their allocations at a faster rate than others. This was a
significant achievement in beginning to move away from a relatively flat distribution of district
education funding per student across poverty quintiles. It showed government policies have been
successful in moving towards a greater share of public resources being directed towards education
in poorer districts.
In 2012, because annual growth in district education allocations in the poorest districts was less than
for districts in other quintiles, there was a stalling in the move towards greater equity. The line for
2012 (the brown line in chart above) begins to flatten as it moves towards the poorest quintiles
instead of preserving a linear increase in the allocations
To achieve better learning outcomes across the poorest districts, the district governments in poorest
districts will need to grow their education spending more quickly and drive a stronger ‘equity slope’
in education funding distribution.
There is good news for the government regarding the affordability of this approach. Analysis of the
distribution of students across district poverty quintiles shows that there far fewer students in the
poorest quintile than any other. In 2012, there were 6.3 million students in poverty quintile 5
compared to more than 12 million in the richest quintile. These reduced numbers will reflect both
the lower net enrolment rate (NER) in these districts, but also the sparsity of the population. On the
positive side, the cost of serving these districts is mitigated by reduced population density of these
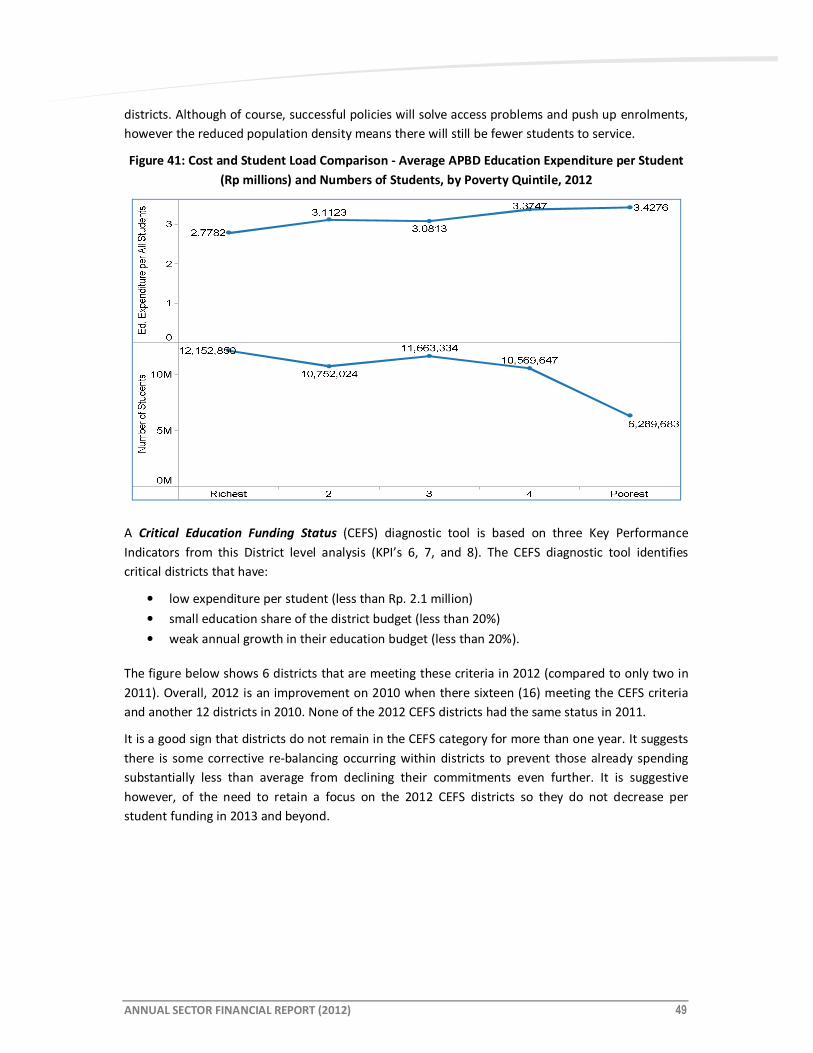
ANNUAL SECTOR FINANCIAL REPORT (2012) 49
districts. Although of course, successful policies will solve access problems and push up enrolments,
however the reduced population density means there will still be fewer students to service.
Figure 41: Cost and Student Load Comparison - Average APBD Education Expenditure per Student
(Rp millions) and Numbers of Students, by Poverty Quintile, 2012
A Critical Education Funding Status (CEFS) diagnostic tool is based on three Key Performance
Indicators from this District level analysis (KPI’s 6, 7, and 8). The CEFS diagnostic tool identifies
critical districts that have:
• low expenditure per student (less than Rp. 2.1 million)
• small education share of the district budget (less than 20%)
• weak annual growth in their education budget (less than 20%).
The figure below shows 6 districts that are meeting these criteria in 2012 (compared to only two in
2011). Overall, 2012 is an improvement on 2010 when there sixteen (16) meeting the CEFS criteria
and another 12 districts in 2010. None of the 2012 CEFS districts had the same status in 2011.
It is a good sign that districts do not remain in the CEFS category for more than one year. It suggests
there is some corrective re-balancing occurring within districts to prevent those already spending
substantially less than average from declining their commitments even further. It is suggestive
however, of the need to retain a focus on the 2012 CEFS districts so they do not decrease per
student funding in 2013 and beyond.

ANNUAL SECTOR FINANCIAL REPORT (2012) 50
Figure 42: Critical Education Funding Status (CEFS) Districts – Districts with low growth in
education budget, low share of district budget and low expenditure per student, 2010-2012

ANNUAL SECTOR FINANCIAL REPORT (2012) 51
KPI 9: Actual district education expenditure as % of planned education expenditure
Figure 43: Realised Education Expenditure as % of Planned Expenditure 2006 -2009
KPI 9 ACTUAL DISTRICT EDUCATION EXPENDITURE AS % OF PLANNED EDUCATION
EXPENDITURE
STATUS AND TRENDS
Result Negative Data availability Financial data were limited up to the year
2007.
Observations
• Budget data for 2006 are from the ‘final revised budget’ documents and reflect the
final allocation. Revised budget data for 2007 were not available. Data collected are
from the ‘planned budget’ documents which reflect a bid by the district education
office for funds. This budget may then be revised downwards in the ‘revised final
budget’. The 2007 financial data are therefore not from identical planning
documents and may be responsible for an upwards shift in percentage of budget
realized as actual expenditure.
• Data for 2008 and 2009 have been collected but are not robust to update this
analysis from the previous report.
• Districts in 2007 managed to spend nearly 100% of their planned budget. This was a
significant improvement on 2006 where only 91% of funds were spent nationally.
• Poverty quintile analysis shows that the top two poverty quintile districts on average
overspent their planned education budget in 2007. The lowest average rate of
realisation was with the poorest quintile districts that only spent 91% of their
planned budget.
Observations about
EP districts
• In 2007 EP districts were largely spending around the national average of 100% of
budget funds, with the exception of Component 2 districts which were spending
90%.
Observations about
AIBEP districts
• The average BEP district increased its actual expenditure to 100% of budgeted
allocations in 2007. This was up from 92% expenditure in 2006.

ANNUAL SECTOR FINANCIAL REPORT (2012) 52
KPI 9 ACTUAL DISTRICT EDUCATION EXPENDITURE AS % OF PLANNED EDUCATION
EXPENDITURE
STATUS AND TRENDS
IMPLICATIONS AND MATTERS ARISING
For the
performance of the
education sector
• More recent actual expenditure data are required to make any comment on
implications for the education sector
For the
performance of the
Education
Partnership
• More recent actual expenditure data are required to make any comment on
implications for the Education Partnership
Figure 44: Realised Education Expenditure as % of Planned Expenditure 2006-09, EP and Non-EP
districts

ANNUAL SECTOR FINANCIAL REPORT (2012) 53
Figure 45: Realised Education Expenditure as % of Planned Expenditure 2006 - 2009, by Poverty
Quintile
Policy Implications: Too many districts may be failing to expend their allocated annual education
budgets. The difficulty of the poorest districts in expending their budgets is of a particular concern
given the access and quality problems in these districts. The quantum of funds may not be the
greatest problem facing some districts, and/or there may be other problems related to
disbursement restrictions and reporting or planning requirements.
However, more recent data is required to confirm that these findings still apply or if there have been
any significant changes.

ANNUAL SECTOR FINANCIAL REPORT (2012) 54
SPI: Discretionary School Expenditure as Percentage of Total Education Expenditure
Figure 46: BOS Grants as % of Education & Culture Budget 2006-2010 (public schools only)
SPI DISCRETIONARY SCHOOL EXPENDITURE AS PERCENTAGE OF TOTAL EDUCATION
EXPENDITURE
STATUS AND TRENDS
Result Positive Data availability BOS grants are used as a proxy variable for
discretionary expenditure.
Observations
• The BOS grants distributed by districts provide a key source of discretionary funds
available to schools under their own management. They have injected a dramatic
new dimension to school resourcing. Direct payment to schools minimizes the
opportunities for leakage before the funds reach the school.
• BOS grants offer great potential for funding innovative and securely resourced
interventions at schools that have an ongoing recurrent funding base. This allows
school principals to plan around these allocations instead of pursuing submission
based grant models.
• In 2012, the BOS grants have increased as a proportion of the district education
budget as a result of slower growth in the district education budget, and an increase
in the value of the BOS grants themselves (see Figure 46, above).
• The per-pupil BOS allocation has increased from Rp 397,000 to Rp 580,000 per
primary student and from RP. 570,000 to RP. 710,000 per junior secondary student
per year in 2012.
IMPLICATIONS AND MATTERS ARISING
For the
performance of the
education sector
• BOS grants provide a critical injection of funds at the school level. It is important that
these funds are utilised as effectively as possible. The injection of such a large scale
of funds to schools poses an obvious fiduciary risk. This risk appears at the school
level where there have been wide spread reports of funds not being used
appropriately or not being accounted for as required.
• The challenge for government will be to put in place the appropriate training,
monitoring and support to enable the effective use of these funds as well as
identifying the inevitable instances where these funds are not properly expended or

ANNUAL SECTOR FINANCIAL REPORT (2012) 55
SPI DISCRETIONARY SCHOOL EXPENDITURE AS PERCENTAGE OF TOTAL EDUCATION
EXPENDITURE
STATUS AND TRENDS
adequately reported.
For the
performance of the
Education
Partnership
• DFAT may wish to help clarify and strengthen the role of the school committees in
the management of BOS funds as part of its current and/or upcoming programing.
Background: In 2011, the BOS grants were distributed to the district level of government which will
then made payments to schools. This changed flow of funding was designed to reflect the function
and responsibilities of local government towards education under the decentralization policy. It
provided districts with significantly greater non-salary related resources to distribute amongst their
schools. This was to help strengthen the relevance and importance of district monitoring and
support teams for schools within their jurisdiction. However, the policy increased the pressure and
expectations of schools that were relying upon the efficiency and effectiveness of the district offices.
The district management of the BOS distribution by district governments became a matter of
national controversy during 2011. The widespread failure of many districts to manage these funds
properly meant that delays and errors in the distribution of BOS funding were seen as a failure at the
local rather than central level. By late 2011, the disbursement and general management of BOS
funds by the district level was considered a gross failure. The program was subsequently brought
back under the control of MoEC for the 2012 school year. BOS funds in 2012 were distributed by the
province (acting as the representative of the central government) directly to the schools.
BOS grants, as a percentage of total education expenditure, are affected by the share of students
progressing to secondary education. The per capita BOS grants for junior secondary students are
35% higher in value than grants for primary students. Districts with higher proportionate enrolment
at secondary level have an increased proportionate weight in their BOS grants. As a consequence,
inter-poverty quintile comparisons are distorted by differences in secondary level enrolment rates.
The significance of the BOS expenditures in comparison with total district expenditures declined for
districts across all poverty quintiles between 2007 and 2008. This reflected the expanding outlays for
education being made by the district levels of government during this period. However by 2009 and
with the impact of the increase in the size of the per capita grants, the BOS had again risen in
significance to 2006 levels.
In 2011, the BOS funds represented a smaller share of total expenditure as teacher salaries and
allowances increased sharply. These salary and emolument increases are a flow on effect of the
teacher certification process and will continue for a few more years (at least until 2015). In addition
to salary increases, 2011 saw increases in district allocations for capital expenditures and other
operational expenses.
In 2012, the BOS grants have increased as a proportion of the district education budget as a result of
slower growth in the district education budget, and an increase in the value of the BOS grants
themselves. The per-pupil BOS allocation has increased from Rp 397,000 to Rp 580,000 per primary
student and from Rp. 570,000 to Rp. 710,000 per junior secondary student per year in 2012. The BOS
program covers around 44 million students in 228,000 primary and secondary schools.

ANNUAL SECTOR FINANCIAL REPORT (2012) 56
It is estimated that in 2012 the BOS program spent US$3.07 billion (Rp 27.67 trillion), which
represents about 8 percent of total education spending in Indonesia. The BOS allocation has
increased five-fold from US$560 million in 2005 to US$3.07 billion in 2012. By increasing the amount
of discretionary funds available to schools, the BOS program can help pave the way for more
effective expenditures at the school level.
The BOS grants represent a smaller proportion of total expenditures for schooling in the poorest
districts. This is because of the higher teacher costs (such as remote area allowances) and the lower
student: teacher ratios which increase the per student teacher cost in these districts. As a
consequence, the BOS funds represent a smaller contribution to the overall cost of delivering
services to these districts. All other poverty quintile districts are more closely bunched together.
Figure 47: BOS Grants as % of Education & Culture Budget 2006-2011, by Poverty Quintile
BOS as %
District Ed. Budget

The Bottom-Line

ANNUAL SECTOR FINANCIAL REPORT (2012) 58
4 THE BOTTOM-LINE
4.1 What do the trends in sector financing mean for the education
sector?
1. Strong real growth in national public expenditure for education in 2012.
The GoI had particularly impressive growth in real and nominal terms in 2006 and 2009. Since
2009, growth in education expenditures had marginally outpaced inflation, but there was a
plateau in the real increase of national funding for education. In 2012 we see the first significant
increase in real terms for education funding.
2. Government commitment to meet a 20% target for education expenditure share of national
budget has been met for the fourth year in a row.
The national expenditures for education in 2012 met the 20% target. Unlike the previous three
budget years, this has generated a large year-on-year increase in real funds available for
education. Education has benefited from total national public revenues and expenditures which
have grown at a significantly faster rate than inflation.
3. Average district level education expenditures across Indonesia have increased from 27% of the
total district budget (APBD) in 2006 to nearly 35% share in 2012.
4. Education expenditures at the district level rose from 31% in 2009 to 35% in 2012
This demonstrates that districts have, on average, strengthened their commitment toward
education spending during the period 2009-2012.
5. The lowest average share of budget allocation for education was found in Papua (16%) and
Maluku island group (25%).
While Maluku has shown growth since 2010, Papua has dropped again from an 18% education
share of district budgets in 2010 to 16% in 2012. The island groups of Sulawesi, Kalimantan and
Maluku went in the opposite direction and posted annual increases in the education share of
district expenditures in 2012.
6. Nationally, there are 30 districts which allocated less than 15% of their total district budget
(APBD) on education in 2012.
Of the 30 districts spending less than 15% of their budget on education, 22 are in the poorest
quintile, and 17 of these are found in Papua.
7. The poorest districts have consistently committed the lowest proportion of their budget
towards education during the period 2006-2012 (average 31% in 2012).
8. In 2012 nearly 100 districts (nearly 20%) posted a decline in their education budget.
This is a marked deterioration from 2011, when only 22 districts posted a decline in their annual
education budget allocation.
9. The problem of contracting education budgets is focused on Papua.

ANNUAL SECTOR FINANCIAL REPORT (2012) 59
Twenty of the 31 districts recording a decline in nominal annual district education expenditure
are located in Papua.
10. Average district expenditure per student across the country grew but not as strongly as for
2011.
Average education expenditure per student has grown to Rp. 3.1 million in 2012, from an
average Rp. 2.8 million in 2011. Highest allocations per student are found in the poorest districts
(quintile 5) at an average Rp. 3.4 million per student.
11. The most striking aspect of the breakdown of per student expenditure is that the Papua island
group declines in the annual per student allocation for education in 2012.
In Papua, per student allocations for education drop 12% from Rp. 6.26 million in 2011 to Rp.
5.48 million in 2012.
12. To achieve better learning outcomes across the poorest districts, the district governments in
poorest districts will need to grow their education spending more quickly and drive a stronger
‘equity slope’ in education funding distribution.
During the four year period 2008-2011, Indonesia displayed overall growth in per student
expenditures, with a linear trend for greater expenditures in the poorest districts. In 2012 the
slope of this equity spending was halted, with slower growth in the poorest districts.
13. In 2012, the BOS grants have increased as a proportion of the district education budget (up to
14%).
This outcome is a result of slower growth in the district education budget, and an increase in the
value of the BOS grants themselves. The per-pupil BOS allocation has increased from Rp 397,000
to Rp 580,000 per primary student and from Rp. 570,000 to Rp. 710,000 per junior secondary
student per year in 2012.
14. There were six districts in 2012 that meet Critical Education Funding Status (CEFS) criteria
compared to 2011 (2 districts), 2010(12 districts) and 2009 (16 districts).
The CEFS diagnostic tool developed by the ASFR identifies districts that have (i) low expenditure
per student, (ii) small education share of the district budget, and (iii) weak annual growth in their
education budget.

ANNUAL SECTOR FINANCIAL REPORT (2012) 60
Table 2: Progress against Key Indicators
INDICATOR DESCRIPTION LEVEL RELATED GOAL RESULT COMMENT AND IMPLICATIONS
KPI 1
Share of public
expenditure
Public expenditure on education as
percentage of total public
expenditure (covers MoEC and
MoRA expenditure)
National Government
commitment Positive
Comment: Significant growth in allocations as proportion
of national expenditure, from 12% 2001 (12%) to 20% by
2012.
Implications: Stable growth in education financing is
positive for further investment.
KPI 2
Share of GDP
Public expenditure on education as
percentage of GDP
National
Government
commitment Positive
Comment: Education expenditure, as a proportion of
GDP, increased from 3.3% in 2011 to 3.5% in 2012.
KPI 3
Share of non-salary
resources
% share of education budget
spending on non-salary costs. National Quality Positive
Comment: Non-salary share of expenditures in 2011
increased to 25% of total district level expenditures (up
from 13% in 2010).
Implications: Growth in budget is not being solely
consumed by salaries. New budget allocations were
especially strong for capital items.
KPI 4
National commitment to
non-formal learning
Public expenditure on literacy and
non-formal education (NFE) as
percentage of public expenditure
on education
National Equity/access Negative
Comment: NFE expenditure is approximately 1% of total
expenditure for education.
Implications: Key advantage of NFE is its cost-
effectiveness; increased levels of investment are needed
to maximise possible economic and social returns.
KPI 5
Commitment to basic
education relative to
national wealth
Public recurrent expenditure on
basic education as percentage of
all public education expenditure
National Equity/access Positive
Comment: In 2009 basic education accounted for
approximately 56% of education expenditure. By
contrast, less than 20% of MORA education expenditure
was on basic education.
Implications: It is unclear what has been driving the
fluctuations in the basic education share of MoRA
expenditures.
KPI 6
District commitment to
education
Education as % of total public
expenditures
District
Government
commitment
Equity/access
Neutral
Comment: The strong increase in the education share of
district budgets in 2011 was reversed in 2012, with the
education share dropping just over 1% from 36.7%.
Implications: Some districts showing negative growth

ANNUAL SECTOR FINANCIAL REPORT (2012) 61
INDICATOR DESCRIPTION LEVEL RELATED GOAL RESULT COMMENT AND IMPLICATIONS
should be monitored
KPI 7
Annual growth in
spending in the poorest
districts
Annual % change in public
expenditures for education in
lowest quintile districts compared
to national % change in public
expenditure for education
District
Equity/access Negative
Comment: In 2012, 31 of the poorest districts
experienced a contraction in their nominal education
expenditure (before accounting for inflation).
Implications: Nearly one third of poorest quintile districts
(100) reduced their annual budget allocation for
education in 2012
KPI 8
Average district
expenditure per student
Public expenditure from APBD
divided by total number of school
students
District
Government
commitment
Quality
Positive
Comment: Average expenditure per student across the
country grew in 2012 but not as strongly as for 2011.
Implications: Some districts showing negative growth
should be monitored
KPI 9
Actual education
expenditure as % of
planned expenditure
Realised APBD for education as %
of planned APBD for education District
Government
commitment Positive
Comment: Districts in 2007 (the last year for which
verified data are available) managed to spend nearly
100% of their planned budget. This was a significant
improvement on 2006 where only 91% of funds were
spent nationally.
Implications: Updated data are required to reach
conclusions about possible changes in expenditure
patterns
SPI 1
Discretionary school
funds as % of total
district school
expenditure
Estimated BOS expenditure as % of
total school expenditure District Quality Positive
Comment: In 2012, the BOS grants increased as a
proportion of the district education budget as a result of
slower growth in the district education budget, and an
increase in the value of the BOS grants themselves.
Implications: Principals and school committees have
greater than ever funds for discretionary spending at
school level

ANNUAL SECTOR FINANCIAL REPORT (2012) 62
4.2 What do the trends in sector financing mean for the Education
Partnership?
Possible Impacts on the Sustainability of Benefits Stemming from EP Investments
1. At a macro level, there is solid evidence to suggest that the GoI will continue to invest heavily in
education. This should flow through in its support for district budgets. National funding for the
education sector is expected to remain strong. Adherence to a proportional budget allocation for
education enhances the ability of the education sector to anticipate future allocations and plan
accordingly by creating a more stable financing framework. The proportional allocation approach
toward education financing enhances predictability and steady growth of the education budget
in a growing economy.
2. School systems require a substantial share of non-salary related expenditures to (i) provide a full
range of resources (apart from teachers) to schools, and (ii) maintain buildings and provide for
additional capital and equipment needs. Most recent data show the average salary share of
expenditures in districts had come down to 75% of total district level expenditures. In the
context of the additional salary costs associated with the teacher certification process, this is a
very positive achievement. However, some districts spend well in excess of this on salaries,
leaving these districts with very little to spend on PD or maintenance of school buildings.
3. There are 18 EP districts that contributed less than the 20% national target for education, which
is considerably lower than the national average of 35% for education in 2012. This low share of
funding for education in specific districts may threaten the sustainability of EP investments in
the future.
4. One recurring concern is that some districts with the highest poverty rates are persistently
allocating a significantly smaller share (less than 15%) of resources for education than the
national average (35%). This low commitment from some of the poorest districts makes it harder
for them to catch up on educational development. It also indicates which districts may have
further scope to grow their education budget and cover the cost associated with PD and the
maintenance of new school buildings as might be funded under the EP.
5. Papua and Maluku stand out as two provinces that spend the least for education as a proportion
of total district funds. Papua in particular stands out because on average it experienced a decline
in expenditure per student in 2012 compared to 2011. There is scope to increase education
funding in these areas to cover the additional but modest recurrent costs associated with the EP
investments.
6. Most EP districts are showing growth in per student allocations for education. This provides a
good financial base for further improvements. However in 2012, nearly 100 districts (of which 59
were EP districts) contracted their education budget compared to the previous year. There will
be good and sound reasons for this in many cases, but where it reflects a shifting priority away
from education it may jeopardize the ability of districts to meet future financial commitments to
PD and building maintenance.

ANNUAL SECTOR FINANCIAL REPORT (2012) 63
7. Growing BOS funds provide much needed discretionary funds to schools. The challenge for
government will be to put in place the appropriate training, monitoring and support to enable
the effective use of these funds as well as identifying the inevitable instances where these funds
are not properly expended or adequately reported.
Implications for the EP Management: Risks and Opportunities
As the previous section would suggest, the evolving context poses several risks to the aspirations of
the EP. The four most significant and realistic risks are captured in Table xx, below.
Table 3: Possible Risks Affecting the EP
# FINDING POSSIBLE CONSEQUENCES FOR THE EP
RA1
Some EP districts (including some with
the highest poverty rates) are persistently
allocating a very low share of their
resources to education.
This low commitment may threaten districts’ ability to
sustain recurrent expenditures associated with EP
investments.
RA2
Papua (and to a lesser extent Maluku)
have many districts performing badly on
numerous financing indicators.
EP investments in these two provinces run the risk of losing
effectiveness if they are not supported by district financial
commitment.
RA3
In 2012, 59 EP districts contracted their
education budget compared to the
previous year. This may continue into the
future.
Where this reflects a shifting priority away from education
it may jeopardise the ability of districts to meet future
financial commitments to professional development and
building maintenance.

Next steps

ANNUAL SECTOR FINANCIAL REPORT (2012) 65
5 NEXT STEPS
SUGGESTED NEXT STEPS (AND LEVEL OF URGENCY) PRIME RESPONSIBILITY
NS1: EP districts which have very small share of total district budget
allocated for education should be monitored and engaged in a
dialogue to understand current allocations and future plans (**).
POM, with DFAT’s approval
NS2: Focus diagnostic and policy response efforts on the Papua and
Maluku island groups to understand the factors driving (i) low
education share of district budgets, (ii) the average decline in budget
allocations in 2012 compared to 2011 (**).
DFAT (with POM, where
appropriate)
NS3: Engage in dialogue with a sample of EP districts that reduced their
2012 education budget allocations compared to 2011. Detailed
diagnostics on (i) poorest EP districts that had an annual reduction in
their 2012 Budget, and (ii) districts with annual drop greater than 10%.
Diagnoses to understand reasons for drop and monitor change in
allocations in 2013 and 2014 district budgets (**).
MOEC and POM (with DFAT’s
approval)
NS4: Liaise with MoEC and other central agencies so as promote the
introduction of district report cards on education. These report cards
should be produced on annual basis and include key educational
development and financial indicators (*).
DFAT
NB: Red - high urgency; orange - medium urgency (**); green – low urgency (*)

ANNUAL SECTOR FINANCIAL REPORT (2012) 66
Annex A - EP LOGIC ARCHITECTURE

ANNUAL SECTOR FINANCIAL REPORT (2012) 67
Annex B – Statistical Table Related to EP Districts
COMPONENT 1: 2012
Island District
Education
Expenditure
per All
Students
(Rp. Million)
Education
Share of
District
Budget
Education
Budget
Annual
Growth
District
Education
Budget
(APBD)
(Rp. Million)
Bali dan Nusa
Tenggara
Belu 3.06 45% 37% 316,685
Flores Timur 4.55 44% 24% 277,521
Kupang 4.00 37% 11% 286,757
Lombok Tengah 2.66 51% 0% 505,807
Sabu Raijua 6.30 37% 35% 126,207
Sumba Barat 1.16 19% -43% 43,353
Sumba Barat Daya 1.75 37% 18% 159,586
Sumba Timur 3.00 36% 8% 218,650
Sumbawa 3.40 39% 1% 314,925
Jawa
Bandung 2.10 50% -2% 1,313,527
Bandung Barat 1.86 45% 4% 604,077
Bangkalan 2.39 42% -7% 508,449
Batang 3.64 51% 27% 470,784
Bekasi 1.53 33% 28% 805,877
Cianjur 1.66 47% -10% 795,934
Garut 2.12 53% 7% 1,221,553
Grobogan 2.40 50% -1% 635,214
Indramayu 2.53 51% 9% 877,127
Kebumen 2.80 52% 2% 723,605
Kediri 3.08 49% 19% 755,409
Lebak 2.01 49% -4% 595,738
Pasuruan 2.60 44% 4% 701,494
Ponorogo 4.18 50% -3% 620,269
Probolinggo 2.70 43% 13% 550,374
Purwakarta 2.26 39% -8% 426,055
Situbondo 3.82 45% 15% 440,419
Tangerang 1.19 30% -6% 732,582
Tuban 3.17 45% 4% 602,511
Kalimantan
Balangan 7.21 29% 12% 181,665
Barito Kuala
Barito Timur 7.48 29% 22% 160,630
Bengkayang 3.15 32% -7% 176,345
Bulungan 10.92 20% 16% 308,660
Kapuas Hulu 4.78 28% 16% 250,022
Ketapang 2.91 28% -8% 287,101
Landak 2.95 38% 13% 271,312
Malinau 15.30 14% 42% 269,389
Sekadau 4.22 37% 25% 183,515
Sukamara 9.04 21% 22% 94,661

ANNUAL SECTOR FINANCIAL REPORT (2012) 68
COMPONENT 1: 2012
Island District
Education
Expenditure
per All
Students
(Rp. Million)
Education
Share of
District
Budget
Education
Budget
Annual
Growth
District
Education
Budget
(APBD)
(Rp. Million)
Maluku
Buru 4.21 31% -5% 135,219
Buru Selatan 3.90 20% 8% 66,940
Maluku Tengah 4.38 52% 5% 466,427
Sulawesi
Banggai 3.60 38% 17% 287,854
Banggai Kepulauan 4.08 35% 34% 192,422
Bolaang Mongondow 3.81 34% 13% 184,391
Bolaang Mongondow
Selatan 6.55 26% 33% 84,224
Bolaang Mongondow
Timur 5.65 23% -24% 68,301
Bulukumba 4.02 50% 5% 361,992
Buton 2.49 38% 0% 203,226
Kepulauan Sangihe 8.90 40% 31% 224,250
Kota Bitung 3.65 30% 13% 156,191
Luwu 2.68 40% 13% 250,366
Luwu Utara 3.34 37% 36% 259,703
Mamasa 5.85 35% 17% 159,008
Mamuju Utara 3.12 16% 8% 71,030
Muna 3.66 41% -12% 300,546
Pinrang 3.52 43% 19% 298,655
Poso 6.58 43% 52% 309,403
Sumatera
Batubara 2.60 38% 10% 249,587
Bintan 5.73 21% 15% 171,999
Dairi 3.01 42% 19% 250,172
Empat Lawang 2.28 22% -7% 119,268
Humbang Hasundutan 4.00 42% 14% 222,765
Indragiri Hulu 3.62 33% 7% 325,311
Karo 4.37 45% 4% 369,862
Kepahiang 4.29 29% 6% 122,821
Kota Payakumbuh 4.69 35% 28% 169,677
Labuhanbatu 1.85 40% 14% 282,371
Lampung Selatan 2.56 49% 20% 517,572
Lampung Tengah 3.25 66% 9% 778,763
Lampung Utara 2.57 61% -8% 358,805
Mandailing Natal 2.61 45% 2% 305,352
Merangin 3.33 34% 14% 266,775
Muara Enim 2.92 36% 7% 491,545
Muaro Jambi 3.77 34% 1% 261,520
Musi Banyuasin 4.36 23% 6% 565,038

ANNUAL SECTOR FINANCIAL REPORT (2012) 69
COMPONENT 1: 2012
Island District
Education
Expenditure
per All
Students
(Rp. Million)
Education
Share of
District
Budget
Education
Budget
Annual
Growth
District
Education
Budget
(APBD)
(Rp. Million)
Nias Selatan 2.35 39% 9% 237,942
Nias Utara 2.03 25% -32% 81,266
Ogan Komering Ilir 2.97 37% 11% 462,206
OKU Selatan 2.50 28% -3% 175,903
Pasaman Barat 3.18 43% 18% 295,775
Sarolangun 4.62 32% 23% 282,089
Seluma 4.43 37% 8% 179,084
Simalungun 3.65 51% 23% 714,191
Tanggamus 3.03 43% 13% 368,257
Tanjung Jabung Barat 3.67 26% 9% 230,571
Tapanuli Selatan 3.37 34% 2% 241,005
Tapanuli Tengah 2.85 38% -9% 240,214
Toba Samosir 4.63 43% 35% 248,701
Tulang Bawang 1.83 25% 11% 167,358
COMPONENT 2: 2012
Island District
Education
Expenditure
per All
Students
(Rp. Million)
Education
Share of
District
Budget
Education
Budget
Annual
Growth
District
Education
Budget
(APBD)
(Rp. Million)
Bali dan Nusa
Tenggara
Badung 4.19 22% 28% 449,683
Bangli 4.83 34% -4% 200,862
Gianyar 4.62 43% 10% 428,140
Jembrana
Klungkung 6.35 40% 13% 234,932
Kota Bima 5.07 42% 18% 199,968
Kota Denpasar 2.30 30% 3% 367,497
Lombok Barat 2.23 8% 10% 324,303
Sumba Tengah 4.40 24% 13% 86,333
Jawa
Bantul 4.57 53% 47% 634,363
Banyumas 3.13 51% 8% 909,646
Banyuwangi 2.77 47% 137% 816,842
Bojonegoro 3.43 44% 8% 735,958
Cilacap 2.26 47% 29% 796,468
Demak 2.54 47% 12% 556,295
Gresik 2.29 35% 11% 516,099
GunungKidul 5.41 57% 10% 618,102
Jombang 2.23 46% 10% 587,419

ANNUAL SECTOR FINANCIAL REPORT (2012) 70
COMPONENT 2: 2012
Island District
Education
Expenditure
per All
Students
(Rp. Million)
Education
Share of
District
Budget
Education
Budget
Annual
Growth
District
Education
Budget
(APBD)
(Rp. Million)
Karanganyar 4.27 51% 20% 601,620
Kendal 3.08 48% 11% 561,553
Kota Banjar 3.16 30% 10% 128,119
Kota Batu 4.12 31% 12% 149,539
Kota Bekasi 1.65 31% 0% 738,032
Kota Cimahi 3.12 37% 26% 338,419
Kota Depok 1.33 26% 6% 403,762
Kota Jakarta Barat
Kota Jakarta Selatan
Kota Jakarta Timur
Kota Jakarta Utara
Kota Madiun 4.85 42% 18% 254,106
Kota Magelang 5.05 37% 508% 207,933
Kota Sukabumi 2.86 32% 335% 215,661
Kota Surakarta 3.55 45% 10% 535,444
Kota Tangerang 2.07 35% 9% 732,334
Kota Tasikmalaya 2.25 39% 8% 327,739
Kota Tegal 3.61 37% 38% 224,961
Kota Yogyakarta 3.12 37% 10% 342,630
Kulon Progo 5.42 51% 13% 422,278
Lumajang 3.09 47% -3% 544,505
Madiun 4.82 49% 6% 504,110
Magelang 3.86 58% 22% 791,133
Malang 1.82 35% -7% 752,250
Ngawi 3.94 51% 562% 562,406
Pati 3.14 47% 22% 705,089
Pekalongan 3.04 51% 17% 535,831
Purbalingga 3.51 54% 21% 597,521
Purworejo 4.27 55% 11% 610,358
Semarang 2.81 42% 5% 460,943
Serang 1.94 41% 24% 615,141
Sidoarjo 2.28 36% 11% 787,519
Sleman 4.00 47% 43% 676,502
Sragen 3.96 55% 15% 672,156
Sukoharjo 3.95 50% 7% 552,034
Sumedang 3.26 48% 10% 680,327
Tegal 2.18 49% 3% 642,077
Kalimantan Barito Selatan 6.33 31% 35% 199,065
Berau 8.60 22% 26% 365,155

ANNUAL SECTOR FINANCIAL REPORT (2012) 71
COMPONENT 2: 2012
Island District
Education
Expenditure
per All
Students
(Rp. Million)
Education
Share of
District
Budget
Education
Budget
Annual
Growth
District
Education
Budget
(APBD)
(Rp. Million)
Gunung Mas 6.65 30% -2% 170,678
Hulu Sungai Selatan 6.77 44% 16% 284,572
Hulu Sungai Utara 5.57 35% 0% 255,689
Kota Balikpapan 3.55 23% 3% 427,360
Kota Banjarbaru 4.12 33% 16% 179,475
Kota Banjarmasin 3.30 40% 11% 430,336
Kota Bontang 7.99 22% -27% 288,848
Kota PalangkaRaya 5.66 45% 7% 297,085
Kota Pontianak 2.74 37% 10% 378,726
Kota Samarinda 3.47 28% -12% 550,786
Kota Tarakan 8.71 23% 135% 350,937
Kotabaru 4.52 26% 19% 280,564
Kotawaringin Timur 3.42 34% 26% 297,149
Kutai Barat 4.15 11% 3% 176,103
Kutai Kartanegara 8.36 24% 19% 1,204,014
Penajam Paser Utara 9.36 20% 29% 306,305
Pulang Pisau 7.20 37% 21% 201,049
Tabalong 4.56 24% -14% 224,523
Tanah Laut 5.25 35% 33% 314,047
Tapin 6.73 30% 21% 235,181
Maluku
Halmahera Barat 3.60 24% 61% 111,256
Halmahera Utara 1.30 12% -3% 67,148
Kepulauan Aru 4.40 25% 41% 114,855
Kepulauan Sula 2.06 15% 4% 96,858
Kota Ambon 5.00 55% 15% 391,943
Kota Ternate 4.70 34% 7% 202,286
Kota Tidore Kepulauan 6.73 34% 31% 167,747
Kota Tual 3.00 14% -30% 49,489
Maluku Tenggara 2.46 16% -3% 75,344
Seram Bagian Barat 3.26 37% 11% 181,257
Papua
Fakfak 6.42 18% -1% 126,136
Kota Jayapura 3.89 33% 11% 252,246
Manokwari 4.13 26% -5% 227,788
Sorong 5.69 20% 13% 151,971
Sorong Selatan 7.11 16% -2% 91,023
Sulawesi
Barru 5.77 47% 8% 233,105
Bone Bolango 6.17 42% 32% 194,191
Gowa 2.64 47% 18% 394,090
Kepulauan Selayar 4.83 29% 7% 135,390

ANNUAL SECTOR FINANCIAL REPORT (2012) 72
COMPONENT 2: 2012
Island District
Education
Expenditure
per All
Students
(Rp. Million)
Education
Share of
District
Budget
Education
Budget
Annual
Growth
District
Education
Budget
(APBD)
(Rp. Million)
Kepulauan Talaud 6.91 29% 1% 134,180
Kota Gorontalo 5.13 40% 13% 228,613
Kota Kendari 4.56 37% 32% 326,828
Kota Palu 4.56 46% 18% 348,282
Kota Tomohon 4.61 26% 8% 99,158
Minahasa Utara 5.41 40% 69% 211,621
Sidenreng Rappang 4.81 44% 8% 286,163
Soppeng 6.32 48% 28% 307,144
Wakatobi 4.96 33% 14% 142,923
Sumatera
Aceh Barat Daya 4.43 28% 17% 145,815
Aceh Jaya 7.87 30% 6% 134,124
Aceh Selatan 3.65 30% -4% 188,944
Aceh Singkil 3.30 25% 7% 100,066
Aceh Tenggara 3.12 30% 8% 168,960
Belitung 5.14 27% 11% 168,020
Bengkalis 3.50 13% -39% 489,789
Bengkulu Selatan 5.50 37% 2% 206,078
Kota Banda Aceh 5.99 42% 39% 332,980
Kota Bengkulu 3.42 42% 5% 265,456
Kota Binjai 3.41 37% 25% 243,864
Kota Dumai 3.82 26% 9% 234,915
Kota Langsa 3.72 39% 9% 156,589
Kota Lhokseumawe 3.74 30% 15% 171,635
Kota Lubuk linggau 3.45 32% 17% 180,469
Kota Medan 2.02 29% 25% 1,101,600
Kota Metro 4.70 39% 19% 208,597
Kota Padang 3.52 45% 13% 662,785
Kota Palembang 3.15 53% 31% 1,058,144
Kota PangkalPinang 3.88 29% 6% 158,443
Kota Pariaman 6.02 38% 2% 161,027
Kota Sabang 15.50 27% 10% 110,626
Kota Subulussalam 3.46 27% 8% 84,088
Kota Tanjung Pinang 4.31 24% 10% 184,661
Lima Puluh Kota 5.12 48% 5% 374,457
Nagan Raya 6.42 37% 8% 199,983
Ogan Ilir 3.34 34% 2% 286,299
Pesisir Selatan 3.91 52% 19% 443,278
Samosir 4.69 38% 1% 167,907
Sijunjung 4.94 38% 4% 238,223

ANNUAL SECTOR FINANCIAL REPORT (2012) 73
COMPONENT 2: 2012
Island District
Education
Expenditure
per All
Students
(Rp. Million)
Education
Share of
District
Budget
Education
Budget
Annual
Growth
District
Education
Budget
(APBD)
(Rp. Million)
Simeulue 5.41 32% 26% 129,278
Tanah Datar 4.53 48% 11% 342,207
Tapanuli Utara 3.64 45% 0% 313,278
COMPONENT 1 AND 2 (DISTRICTS WITH BOTH) : 2012
Island District
Education
Expenditure
per All
Students
(Rp. Million)
Education
Share of
District
Budget
Education
Budget
Annual
Growth
District
Education
Budget
(APBD)
(Rp. Million)
Bali dan Nusa
Tenggara
Alor 4.17 36% 15% 216,410
Bima 3.22 46% 10% 402,789
Buleleng 4.42 50% 2% 581,071
Ende 4.56 47% 42% 319,529
KarangAsem 4.79 42% 2% 411,667
Kota Kupang 2.90 38% 7% 234,327
Lembata 4.03 29% -4% 122,098
Lombok Timur 2.45 49% 13% 625,105
Lombok Utara 2.77 26% -8% 106,684
Manggarai 2.54 40% 22% 225,815
Manggarai Timur 2.34 38% 43% 191,965
Nagekeo 4.06 35% 38% 144,312
Ngada 2.94 26% -11% 109,930
Rote Ndao 4.08 32% 1% 124,297
Sikka 2.93 34% 9% 213,090
Sumbawa Barat 5.59 24% -5% 144,755
Tabanan 5.83 42% 10% 423,184
Timor Tengah Selatan 2.62 43% 4% 320,882
Timor Tengah Utara 2.92 34% 10% 201,825
Jawa
Blitar 4.27 56% 15% 771,255
Bogor 1.11 34% -12% 1,132,804
Bondowoso 3.50 45% 28% 443,122
Brebes 2.27 50% 4% 783,166
Ciamis 2.89 58% 1% 845,289
Cirebon 2.07 44% -1% 886,234
Kota Malang 2.86 41% 19% 512,812
Nganjuk 2.80 45% -2% 549,303
Pacitan 5.09 52% 12% 466,943
Pandeglang 2.31 54% 19% 673,846

ANNUAL SECTOR FINANCIAL REPORT (2012) 74
COMPONENT 1 AND 2 (DISTRICTS WITH BOTH) : 2012
Island District
Education
Expenditure
per All
Students
(Rp. Million)
Education
Share of
District
Budget
Education
Budget
Annual
Growth
District
Education
Budget
(APBD)
(Rp. Million)
Sukabumi 1.77 48% 10% 897,862
Tasikmalaya 2.17 53% -2% 756,466
Wonogiri 4.73 57% 12% 761,471
Kalimantan
Banjar 4.35 41% 27% 397,411
Kapuas 4.63 38% 18% 372,570
Katingan 5.22 23% 3% 178,431
Kayong Utara 5.07 26% 7% 117,324
Kota Singkawang 3.77 34% 3% 185,154
Kotawaringin Barat 3.51 26% 16% 183,317
Kubu Raya 3.09 42% 4% 350,530
Kutai Timur 7.24 16% 14% 441,151
Lamandau 6.92 20% 22% 105,383
Melawi 3.63 29% 9% 165,689
Murung Raya 5.70 22% -4% 160,248
Paser 6.44 23% 11% 338,351
Pontianak 4.01 40% 16% 216,721
Sambas 3.37 43% 0% 390,117
Sanggau 3.99 40% 6% 357,047
Seruyan 3.87 16% -2% 114,662
Sintang 3.37 33% 4% 308,447
Tanah Bumbu 3.68 25% -2% 214,034
Sulawesi
Bantaeng 3.73 34% -6% 155,714
Boalemo 4.41 34% 5% 142,780
Bombana 4.12 30% 48% 154,926
Bone 3.11 41% 81% 493,643
Buton Utara 4.82 24% 27% 95,722
Donggala 3.65 42% 11% 281,470
Enrekang 3.78 36% -9% 198,598
Gorontalo 3.64 47% 5% 303,803
Jeneponto 2.78 36% -2% 237,760
Konawe Utara 5.42 21% -4% 96,532
Luwu Timur 3.19 27% 23% 193,839
Majene 7.48 39% 11% 186,229
Mamuju 3.13 39% 11% 186,586
Maros 3.07 35% -2% 226,796
Minahasa Selatan 4.04 39% 15% 184,201
Morowali 4.52 30% 26% 229,170
Pangkajene Kepulauan 4.65 46% 13% 337,959
Parigi Moutong 2.36 34% 23% 232,396

ANNUAL SECTOR FINANCIAL REPORT (2012) 75
COMPONENT 1 AND 2 (DISTRICTS WITH BOTH) : 2012
Island District
Education
Expenditure
per All
Students
(Rp. Million)
Education
Share of
District
Budget
Education
Budget
Annual
Growth
District
Education
Budget
(APBD)
(Rp. Million)
Pohuwato 4.90 33% 32% 153,330
Polewali Mandar 5.47 50% 15% 326,636
Sigi 5.24 40% 34% 230,435
Sinjai 4.67 50% 17% 281,268
Tana Toraja 2.99 33% 35% 203,550
Tolitoli 3.43 33% 11% 184,851
Wajo 4.06 34% 25% 298,791
Sumatera
Aceh Barat 5.83 46% 26% 251,263
Aceh Besar 4.74 41% 12% 316,403
Aceh Tamiang 3.59 38% 11% 225,338
Aceh Tengah 5.33 39% 23% 240,132
Aceh Timur 2.56 32% 2% 239,209
Aceh Utara 2.58 32% -9% 352,908
Bangka 3.79 32% 12% 226,523
Bangka Barat 4.17 30% 17% 152,231
Bangka Selatan 4.04 26% 12% 141,091
Bangka Tengah 4.33 27% 55% 135,324
BanyuAsin 3.24 42% 17% 473,570
Belitung Timur 7.27 25% 6% 151,749
Bener Meriah 4.60 33% 0% 155,391
Bengkulu Utara 3.25 33% 9% 200,918
Bireuen 3.90 44% 7% 369,076
Deli Serdang 2.44 45% 22% 913,822
DharmasRaya 4.14 35% 2% 174,371
Gayo Lues 5.14 23% 32% 114,061
Kampar 4.16 39% 9% 663,704
Kaur 4.86 30% 18% 126,676
Kerinci 4.42 33% -1% 234,105
Kota Batam 2.62 29% 2% 404,749
Kuantan Singingi 4.28 30% -2% 296,275
Mukomuko 3.65 24% 7% 144,264
Ogan Komering Ulu 3.18 29% 21% 245,003
Padang Pariaman 4.52 55% 4% 445,973
Pelalawan 4.10 20% 22% 271,561
Pidie 2.55 59% -26% 254,262
Pidie Jaya 3.90 34% 9% 137,336
Pringsewu 5.15 56% 42% 418,422
Rejang Lebong 3.71 36% 36% 222,888
Rokan Hulu 2.68 25% 13% 296,904

ANNUAL SECTOR FINANCIAL REPORT (2012) 76
COMPONENT 1 AND 2 (DISTRICTS WITH BOTH) : 2012
Island District
Education
Expenditure
per All
Students
(Rp. Million)
Education
Share of
District
Budget
Education
Budget
Annual
Growth
District
Education
Budget
(APBD)
(Rp. Million)
Serdang Bedagai 2.81 46% 10% 386,287
Solok 4.24 47% 4% 349,535
Tebo 3.36 37% 20% 237,203

Australia’s Education Partnership with Indonesia
Education Partnership Performance Oversight and Monitoring
EP-POM
19th
floor Ratu Plaza Building
Jl. Jend. Sudirman No. 9
Jakarta 10270
T: 021 720 6616
F: 021 720 6616 ext.100
Australian Aid – managed by GRM International Pty Ltd
www.kemitraanpendidikan.or.id