Embed Size (px)
Citation preview

1
2012 Massachusetts Investor
Conference
Thursday, December 13,
2012

2
Disclaimer This investor presentation is provided for your general information and convenience only and does not constitute an offer to sell or a
solicitation of an offer to buy securities. The information contained herein does not constitute a sufficient basis for making a decision with
respect to the purchase or sale of any security, and is not intended to constitute investment advice of any kind.
All information regarding or relating to bonds issued or to be issued by the Commonwealth of Massachusetts, the Massachusetts Bay
Transportation Authority, the Massachusetts Port Authority, the Massachusetts Water Pollution Abatement Trust, the Massachusetts
Water Resources Authority, the University of Massachusetts Building Authority, the Massachusetts State College Building Authority, the
Massachusetts Housing Finance Agency, Massachusetts Department of Transportation, the Massachusetts School Building Authority, the
Massachusetts Development Finance Agency, or the Massachusetts Educational Financing Authority (the “Issuers”) is qualified in its
entirety by the applicable Official Statement and any related primary and continuing disclosure documents and filings, all of which
documents and filings should be reviewed before any investment decision is made with respect to any such bonds.
With respect to each Issuer’s section of this investor presentation, such section has been furnished by such Issuer and includes
information obtained from other sources that are believed by such Issuer to be reliable, but is not guaranteed as to accuracy or
completeness. The information and expressions of opinion contained in this investor presentation are subject to change without notice.
The information contained in this investor presentation speaks only as of the date such information was prepared and has not been
updated since that date. Accordingly, such information may not address all factors which may be material to an investor and may contain
omissions of fact or statements that are not accurate because of the passage of time or changes in facts or circumstances subsequent to
the date of such information. The Issuers are under no obligation to update any of the information set forth in this investor presentation.
None of the Issuers or their respective representatives or agents, including any underwriters of bonds issued or to be issued by any of the
Issuers, shall have any liability whatsoever in negligence or otherwise for any loss however arising from any use of this investor
presentation or its contents or otherwise arising in connection with this investor presentation.
No dealer, broker, salesperson or any other person has been authorized by any of the Issuers to give any information or to make any
representation in connection with the Issuers or any bonds of any of the Issuers, and, if given or made, such other information or
representation must not be relied upon as having been authorized by any of the Issuers.
This investor presentation includes forward-looking statements based on current beliefs and expectations about future events. Forward-
looking statements include financial projections and estimates and their underlying assumptions, statements regarding plans, objectives
and expectations with respect to future events. Forward-looking statements are not guarantees of future performance and are subject to
inherent risks, uncertainties and assumptions about the Issuers, changes in economic conditions globally, nationally or in Massachusetts,
and political and regulatory factors. Those events are uncertain; their outcome may differ from current expectations, which may in turn
significantly affect expected results. Actual results may differ materially from those projected or implied in these forward-looking
statements. Any forward-looking statement contained in this investor presentation speaks as of the date of this presentation. The Issuers
undertake no obligation to publicly revise or update any forward-looking statements in light of new information or future events.
2012 Massachusetts Investor Conference

3
Agenda
2012 Massachusetts Investor Conference
Time Presentation Presenter(s) 7:30 - 8:00 Registration & Breakfast --
8:00 - 8:30 Conference Welcome Honorable Deval L. Patrick, Governor of Massachusetts
8:30 - 9:00 Update on the Commonwealth Honorable Steven Grossman, State Treasurer
9:00 - 9:30 Presentation: “The Massachusetts Economy: A
Long-Term Perspective”
Alan Clayton-Matthews, MassBenchmarks & Northeastern
University
9:30 - 10:00 Credit Panel: Water: Mass. Water Resources
Authority, Mass. Water Pollution Abatement Trust
Fred Laskey & Rachel Madden, MWRA; Sue Perez, Steve
McCurdy & Drew Smith, MWPAT
10:00 - 10:15 Break / Coffee
10:15 - 11:00 Credit Panel: Education: Mass. School Building
Authority, Mass. State College Building Authority,
UMass Building Authority
Vin Alabiso, MSBA; Edward Adelman, MSCBA; Katherine
Craven, UMBA
11:00 - 11:45 Investor Roundtable Panel Chris Alwine, Vanguard
11:45 - 12:45 LUNCH & Presentation John Cross, Securities & Exchange Commission
12:45 - 1:30 Credit Panel: The Commonwealth of Massachusetts
Secretary of Administration & Finance, Jay Gonzalez;
Colin MacNaught, State Treasurer’s Office
1:30 - 2:15 2013 Market Outlook Tom Doe, Municipal Market Advisors
2:15 - 2:30 Break/Coffee
2:30 - 3:15 Credit Panel: Transportation: MassDOT & MassPort Dana Levenson, MassDOT;
John Pranckevicius & Betsy Taylor, MassPort
3:15 - 3:45 Updates to the EMMA System Justin Pica & Ritta McLauglin, MSRB
3:45 – 4:15 Credit Panel: Economic Development:
MassDevelopment, MassHousing
Steve Chilton, MDFA; Charles Karimbakas, MHFA

4
Table of Contents
2012 Massachusetts Investor Conference
Section Page
“The Massachusetts Economy: A Long-Term Perspective” 7
Massachusetts Water Resources Authority 18
Massachusetts Water Pollution Abatement Trust 46
Massachusetts School Building Authority 61
Massachusetts State College Building Authority 85
University of Massachusetts Building Authority 97
The Commonwealth of Massachusetts 111
2013 Market Outlook 144
Massachusetts Department of Transportation 169
Massachusetts Port Authority 180
Updates to the EMMA System 195
Massachusetts Development Finance Agency 229
Massachusetts Finance Housing Agency 238

5
2012 Massachusetts Investor Conference
Conference Welcome
Honorable Deval L. Patrick
Governor of Massachusetts
Presented by:

6
2012 Massachusetts Investor Conference
Update on the Commonwealth
Treasurer Steven Grossman
Presented by:

7
2012 Massachusetts Investor Conference
The Massachusetts Economy:
A Long-Term Perspective
Alan Clayton-Matthews
Northeastern University
December 13, 2012
Presented by:

8
Massachusetts has out-performed the nation in the recession
and the recovery to date.
4.3
1.9
3.7 3.6
-0.8
2.7
2.0
5.4
1.9
2.6
2.2
2.4 2.42.3 2.2
2.62.4
0.1
2.5
1.3
4.1
2.0
1.3
2.7
-2.0
-1.0
0.0
1.0
2.0
3.0
4.0
5.0
6.0
2010 2011 2012 2013
Qu
arte
rly
Gro
wth
at
An
nu
al R
ate
s (%
)Growth in Real Product, Massachusetts vs. U.S.
Massachusetts U.S.
Source: U.S., Bureau of Economic Analysis; Massachusetts: MassBenchmarks
Projected

9
The state has a slower growing population than the U.S….
-1%
0%
1%
2%
1987 1991 1995 1999 2003 2007 2011 2015 2019
Population Growth, Massachusetts versus U.S., Annual Rate
Massachusetts U.S.
Source: Census Bureau History, Global Insight Forecast

10
…and slower-growing employment.
-7%
-6%
-5%
-4%
-3%
-2%
-1%
0%
1%
2%
3%
4%
1987 1991 1995 1999 2003 2007 2011 2015 2019
Employment Growth, Massachusetts versus U.S., from Same Quarter Prior Year
Massachusetts U.S.
Source: BLS History, Global Insight Forecast

11
However, output growth often matches or exceeds that of the
U.S….
-6%
-4%
-2%
0%
2%
4%
6%
8%
10%
12%
14%
1987 1991 1995 1999 2003 2007 2011 2015 2019
Real GDP Growth, Massachusetts versus U.S., from Same Quarter Prior Year
Massachusetts U.S.
Source: BEA History, Global Insight Forecast
Massachusetts history interpolated from annual data by Global Insight

12
… and over the long-term, U.S. and state output growth has been virtually
identical; and is expected to equal that of the U.S. over the next 10 years.
50
60
70
80
90
100
110
120
130
140
150
1987 1991 1995 1999 2003 2007 2011 2015 2019
Real Gross Domestic Product, Massachusetts versus U.S., 2005=100
Massachusetts U.S.
Source: BEA History, Global Insight Forecast
Massachusetts history interpolated from annual data by Global Insight

13
How is this possible? Because of faster productivity growth.
0%
1%
2%
3%
4%
1993 1996 1999 2002 2005 2008 2011 2014 2017 2020
Productivity Growth, Massachusetts versus U.S., Annual Rate, Centered 5-Year Centered Moving Average
Massachusetts U.S.
Source: BEA and BLS History, Global Insight Forecast
Productivity is Real GDP per Non-Farm Payroll Job

14
Higher productivity means higher incomes.
$-
$10,000
$20,000
$30,000
$40,000
$50,000
$60,000
$70,000
$80,000
$90,000
1987 1991 1995 1999 2003 2007 2011 2015 2019
Per Capita Personal Income, Massachusetts versus U.S.
Massachusetts U.S.
Source: BEA History, Global Insight Forecast

15
Faster productivity growth results in faster-growing incomes.
100%
105%
110%
115%
120%
125%
130%
135%
1987 1991 1995 1999 2003 2007 2011 2015 2019
Ratio of Massachusetts to U.S. Per Capita Personal Income
Source: BEA History, Global Insight Forecast

16
The basis of the state’s economic performance is its highly-
educated workforce…
0.0%
10.0%
20.0%
30.0%
40.0%
50.0%
60.0%
25 30 35 40 45 50 55 60 65
Age
Percent of Persons 25 and Older with a BA or Higher Degree, by Age, 2009
Massachusetts U.S.
Source: American Community Survey, 2009 PUMS

17
...especially at the high end, which gives Massachusetts a
powerful comparative advantage in the global economy.
0.0%
5.0%
10.0%
15.0%
20.0%
25.0%
25 30 35 40 45 50 55 60 65
Age
Percent of Persons 25 and Older with an Advanced Degree, by Age, 2009
Massachusetts U.S.
Source: American Community Survey, 2009 PUMS

18
2012 Massachusetts Investor Conference
Massachusetts Water
Resources Authority
Massachusetts Water Resources Authority:
Frederick A. Laskey, Executive Director
Rachel Madden, Director of Administration and Finance
Thomas Durkin, Treasurer
Presented by:

19
MWRA Service Area
MWRA provides wholesale water and wastewater services to over 2.5 million customers in 61 communities
On average, MWRA delivers 200 million gallons per day to its water customers
MWRA collects and treats an average of 350 million gallons of wastewater per day, with a peak capacity of 1.2 billion gallons
2012 Massachusetts Investor Conference

20
MWRA Has Spent $7.1 Billion To Rebuild The Water And Sewer Systems
Boston Harbor Project
MetroWest Supply Tunnel Hultman Aqueduct Rehab Spot Pond Supply Mains
Braintree-Weymouth Relief Facilities
Norumbega Covered Storage
Weston Aqueduct Supply Mains
Carroll Water Treatment Plant UV Treatment
Union Park
East Boston Branch Sewer
North Dorchester Bay CSO
Community Managed CSO Projects
Deer Island Asset Protection
$0
$100
$200
$300
$400
$500
$600
$700
$ M
illio
ns
Actual Projected
2012 Massachusetts Investor Conference

21
Over 80% Of Spending Has Been For Mandated Projects
$0
$100
$200
$300
$400
$500
$600
$700
FY86 FY88 FY90 FY92 FY94 FY96 FY98 FY00 FY02 FY04 FY06 FY08 FY10 FY12
Mill
ions
Mandated(Court Orders, Consent Orders)
Non-Mandated(Pipeline Rehabilitation and Infrastructure Replacement)
2012 Massachusetts Investor Conference

22
MWRA’s Capital Finance Program
As of June 30, 2012, MWRA had approximately $5.94 billion in debt:
Senior Lien General $3.49 Multi-Modal
Subordinated $1.19
Mass WPAT$1.12
TECP$0.14
2012 Massachusetts Investor Conference

23
MWRA’s Capital Finance Program
MWRA’s Credit Ratings were most recently affirmed in November 2012:
Moody's Standard and Poor's FitchRatings
Senior – Aa1 Senior – AA+ Senior – AA+
Subordinate – Aa2 Subordinate - AA Subordinate – AA
2012 Massachusetts Investor Conference

24
An Environmental Success Story
In 2002, $3.8 billion Boston Harbor Project was completed
About 350 million gallons of wastewater is treated at the new Deer Island Treatment plant every day
Treated wastewater is discharged 9.5 miles out into the deeper waters of Massachusetts Bay
Sludge is transported to Quincy where it is recycled into fertilizer
2012 Massachusetts Investor Conference

25
Dramatic Improvements In Water Quality – Even In Wet Weather
Average Enterococcus counts in Boston Harbor in wet weather
The lighter the blue, the better
1987-1998 (Before Secondary Treatment
and South System transfer)
1999 - 2011 (After Secondary Treatment
and New Outfall)
1999 - 2011 1987 - 1991
2012 Massachusetts Investor Conference

26
Combined Sewer Overflow Control Program
Four communities - Boston,
Brookline, Cambridge,
Chelsea and Somerville -
have combined sewer
systems that connect to
MWRA's sewer system
Boston Harbor, the
Charles, the Mystic and the
Neponset Rivers are
subject to overflows of
combined stormwater and
sewage during heavy rains
2012 Massachusetts Investor Conference

27
Annual CSO Volume Has Been Reduced Dramatically
0
0.5
1
1.5
2
2.5
3
3.5
1988 1992 2011 2015
(Billio
n G
allo
ns)
Untreated Treated
• 29 of 35 projects have been completed to date
• Annual CSO volumes have already been reduced by 2.7 billion gallons
• By 2015, 93% of the remaining CSO flows will be treated
6 2012 Massachusetts Investor Conference
28
South Boston CSO Tunnel Completed in May 2011
2012 Massachusetts Investor Conference

29
Boston Now Has Some Of The Cleanest Urban Beaches In The Country
2012 Massachusetts Investor Conference

30
The MWRA Water System Has Been Modernized
MetroWest
Water Supply Tunnel
Nash Hill
Loring Road
Fells Spot Pond
Norumbega
CWTP Blue Hills
Pipeline Rehabilitation
Watershed Protection
John J. Carroll
Water Treatment Plant
Quabbin
Water Treatment Plant
2012 Massachusetts Investor Conference

31
John J. Carroll Water Treatment Plant
Complete in July 2005
Treatment Processes:
– Ozonation for primary disinfection
– Corrosion control
– Chloramination for secondary disinfection
– Fluoridation
2012 Massachusetts Investor Conference

32
Carroll Water Treatment Plant UV Disinfection
• Required to meet new federal regulations
• Work is 75% complete
2012 Massachusetts Investor Conference
33
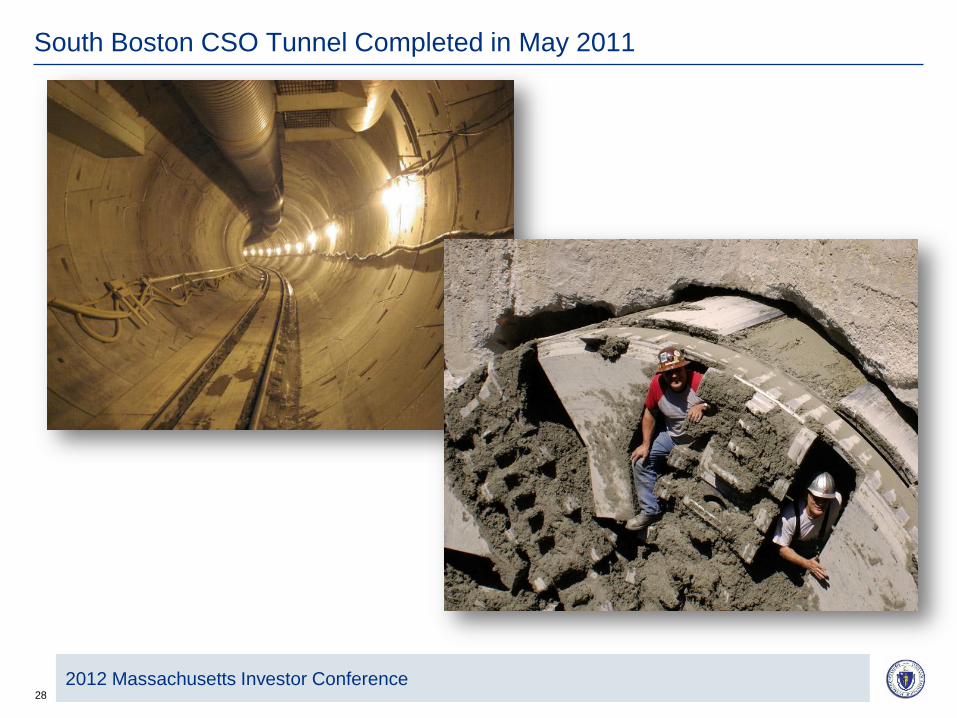
MetroWest Water Supply Tunnel
The MetroWest Water Supply Tunnel was brought on-line in November 2003
By March 2004, the Tunnel was being fully utilized allowing the shutdown of the Hultman Aqueduct for repair
2012 Massachusetts Investor Conference

34
May 1, 2010 Water Main Break
On May 1st, a break occurred on a 10-foot diameter water main in Weston
Use of the emergency water system also triggered a precautionary “boil water order” for 2 million residents in 30 affected communities
The leak was repaired quickly and the system was back to normal in under 72 hours
2012 Massachusetts Investor Conference

35
Hultman Aqueduct Rehabilitation
• Rehabilitation of the 15-mile Hultman Aqueduct is nearly complete
2012 Massachusetts Investor Conference

36
Norumbega Covered Storage Facility
The tank was completed in May 2004
It provides 115 million gallons of storage for metropolitan Boston
2012 Massachusetts Investor Conference

37
Covered Storage Projects
• MWRA is building seven new covered storage tanks to replace all open reservoirs
• Six are completed and on-line
Nash Hill
Loring Road
Fells Spot Pond
Norumbega
Walnut
Hill
Blue Hills
2012 Massachusetts Investor Conference

38
Spot Pond Storage Facility
20-million-gallon buried water tank currently under construction
Buried emergency pump station will provide redundancy 21 communities
2012 Massachusetts Investor Conference

39
Drinking Water Quality Is Excellent
2012 Massachusetts Investor Conference
40
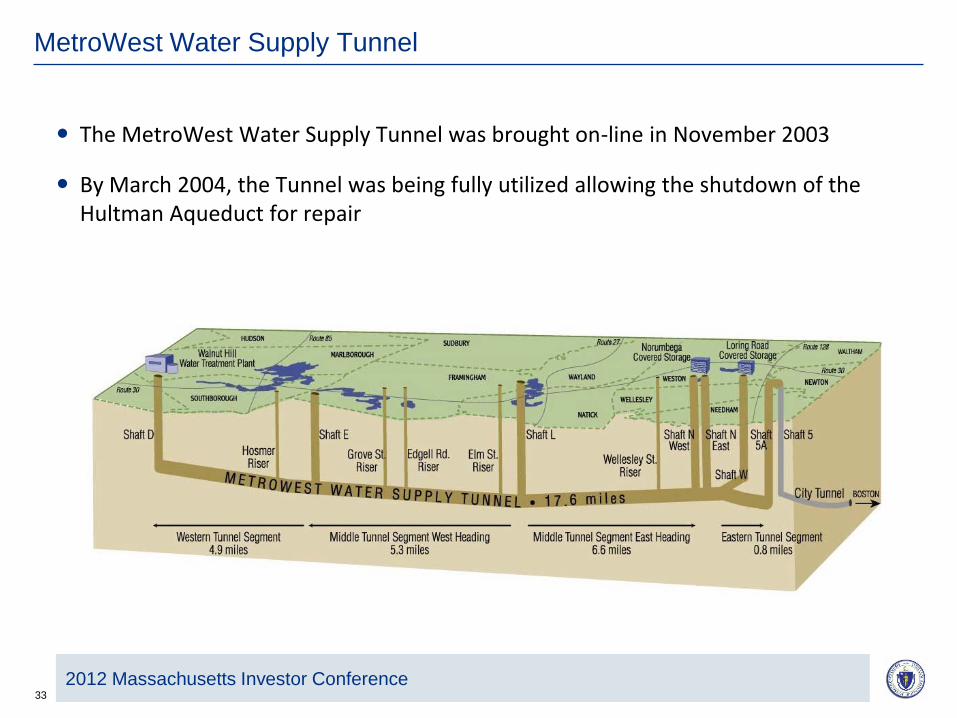
MWRA Utilizes Renewable Energy
2012 Massachusetts Investor Conference

41
Future Challenges: Maintenance
• Parts of the “new” Deer Island Treatment Plant have been on-line for almost 20 years
2012 Massachusetts Investor Conference

42
Future Challenges: Water System Redundancy
2012 Massachusetts Investor Conference

43
Future Challenges: Stormwater
2012 Massachusetts Investor Conference

44
Future Challenges: Aging Local Infrastructure
2012 Massachusetts Investor Conference

45
Future Challenges: Another Hurricane Sandy
2012 Massachusetts Investor Conference

46
2012 Massachusetts Investor Conference
Massachusetts Water Pollution
Abatement Trust
Massachusetts Water Pollution Abatement Trust:
Sue Perez, Executive Director
Presented by:

47
Massachusetts Water Pollution Abatement Trust (MWPAT) - Overview
2012 Massachusetts Investor Conference
Established in 1989 to improve the water quality in the Commonwealth through the provision of low-
cost capital financing to cities, towns and other eligible entities, and to maintain stewardship of public
funds with prudence, professionalism and integrity
Administered by a three-member board chaired by the Treasurer of the Commonwealth, and includes
the Secretary of the Executive Office for Administration and Finance, and the Commissioner of the
Department of Environmental Protection
Oversees financing for the clean water (“CW”) and drinking water (“DW”) state revolving funds (“SRFs”)
in partnership with DEP
– Trust receives significant federal and Commonwealth support – over $2.0 billion in federal
capitalization grants and state matching funds through FY 2012
Provides subsidized loans to local governmental units for CW and DW infrastructure development
– Projects financed are those ranked as a priority based on responses to a series of questions
intended to identify the most relevant public health and environmental related projects
Since its establishment, the Trust has provided approximately $5.7 billion in loans to nearly
300 borrowers to improve and maintain the quality of water in the Commonwealth – an
estimated 97% of Massachusetts citizens have benefited from these essential projects

48
Clean Water Projects Financed through SRF Program
2012 Massachusetts Investor Conference
Clean Water SRF
Maintenance and upgrade of municipal wastewater systems
is critical to protecting the Commonwealth’s environment,
meeting the public health needs of its citizens, and
promoting business development
The 2012 CWSRF Intended Use Plan (IUP) offered $302
million to finance clean water projects:
– Replacement of aged infrastructure components
– Installation of advance water treatment technologies
– Reduction to the carbon footprint of treatment facilities by
installing more energy efficient equipment
Additional subsidies provided for Renewable Energy
Generation and Environmental Justice Communities
$302 million of SRF Funded projects
estimated to create 1,800 construction
and engineering jobs

49
Drinking Water Projects Financed through SRF Program
2012 Massachusetts Investor Conference
Drinking Water SRF
Every citizen in the Commonwealth has the right to safe and
clean drinking water, and they depend on their federal, state
and local governments to protect this right
The 2012 DWSRF Intended Use Plan (IUP) offered $115
million to finance drinking water projects:
– Construction or upgrade of a municipal water treatment
facility
– Replacement or rehabilitation of water mains and pump
stations to address deficiencies in the water supply
distribution system
– Construction or rehabilitation of water storage tanks to
ensure a reliable water supply
– Additional subsidies provided for Renewable Energy
Generation and Environmental Justice Communities
$115 million of SRF Funded projects
estimated to create 690 construction and
engineering jobs

50
Leveraged State Revolving Fund Programs
2012 Massachusetts Investor Conference
Massachusetts is among the
largest SRF programs in the
country
– Historically, one of the top 5
states in dollars lent for
infrastructure investment
compared to each dollar
received from federal
government
– $2.0 billion in federal grants and
state matching funds leveraged
to $5.7 billion in project
financing
– 2009 ARRA Grants ($133.1
million for clean water and
$52.1 million for drinking water)
were committed by the Trust as
additional subsidization in the
form of principal forgiveness to
eligible borrowers
Federal Capitalization Grant and State Matching Funds
51
Financing Programs
2012 Massachusetts Investor Conference
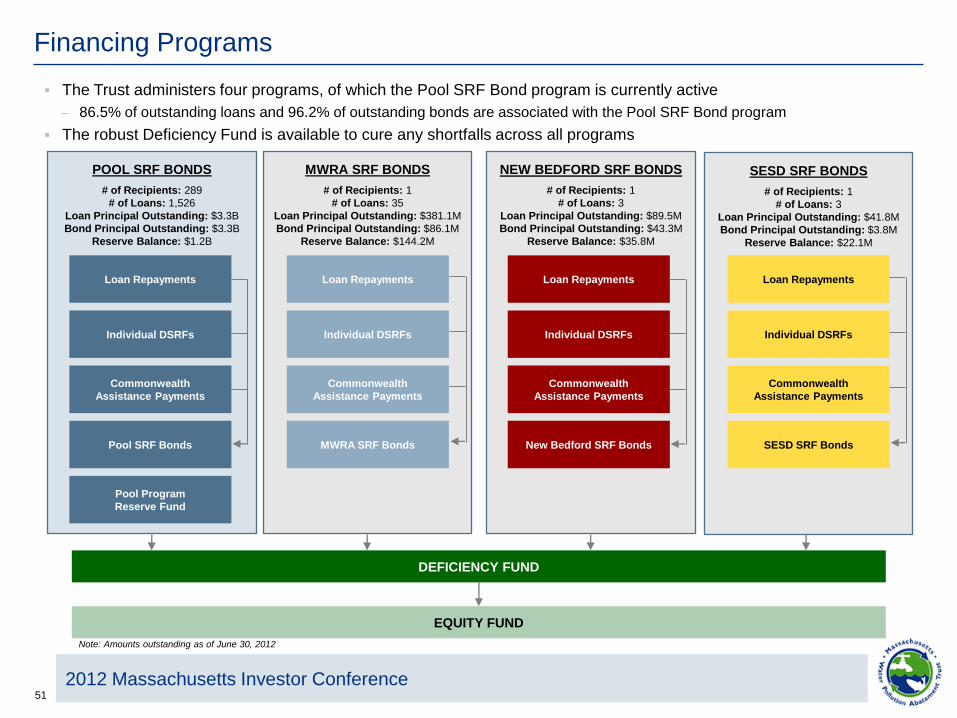
The Trust administers four programs, of which the Pool SRF Bond program is currently active
– 86.5% of outstanding loans and 96.2% of outstanding bonds are associated with the Pool SRF Bond program
The robust Deficiency Fund is available to cure any shortfalls across all programs
EQUITY FUND
DEFICIENCY FUND
SESD SRF BONDS
# of Recipients: 1
# of Loans: 3
Loan Principal Outstanding: $41.8M
Bond Principal Outstanding: $3.8M
Reserve Balance: $22.1M
NEW BEDFORD SRF BONDS
# of Recipients: 1
# of Loans: 3
Loan Principal Outstanding: $89.5M
Bond Principal Outstanding: $43.3M
Reserve Balance: $35.8M
POOL SRF BONDS
# of Recipients: 289
# of Loans: 1,526
Loan Principal Outstanding: $3.3B
Bond Principal Outstanding: $3.3B
Reserve Balance: $1.2B
MWRA SRF BONDS
# of Recipients: 1
# of Loans: 35
Loan Principal Outstanding: $381.1M
Bond Principal Outstanding: $86.1M
Reserve Balance: $144.2M
SESD SRF Bonds
Commonwealth
Assistance Payments
Individual DSRFs
Loan Repayments
New Bedford SRF Bonds
Commonwealth
Assistance Payments
Individual DSRFs
Loan Repayments
MWRA SRF Bonds
Commonwealth
Assistance Payments
Individual DSRFs
Loan Repayments
Pool Program
Reserve Fund
Pool SRF Bonds
Commonwealth
Assistance Payments
Loan Repayments
Individual DSRFs
Note: Amounts outstanding as of June 30, 2012

52
MWPAT Debt Profile
2012 Massachusetts Investor Conference
MWPAT Debt Service by FY*
Total Debt Outstanding: $3.5 billion
Maximum Annual Debt Service: $359.7 million
Average Annual Debt Service: $157.9 million
Weighted Average Life of Debt: 16.2 years
Capital Structure:
— Fixed Rate Mode: 100%
— Unhedged Variable Rate Mode: 0%
— Derivatives Exposure: $77.3 million CPI Bonds, swapped to a fixed rate
Key Statistics
*As of June 30, 2012

53
Security and Structure
2012 Massachusetts Investor Conference
Contract
Assistance
Payments
Secures all Bonds issued by the Trust on a parity basis
Amounts released from DSRFs securing MWRA, SESD, and New
Bedford Bonds not already released are transferred to the
Deficiency Fund, together with funds released from the Pool
Program Reserve Fund
Deficiency
Fund
Each Debt Service Reserve Fund secures its respective Bonds –
as bonds amortize, proportional amounts of reserve funds “de-
allocate” and are available as security
42% of Reserve funds invested in laddered portfolios of U.S.
Treasuries and Agencies – remainder are invested in GICs, the
bulk of which carry at least “AA” category ratings
Reserve
Funds
Secures all Bonds issued by the Trust on a parity basis
Amounts released from DSRFs securing MWRA, SESD, and New
Bedford Bonds not already released are transferred to the
Deficiency Fund, together with funds released from the Pool
Program Reserve Fund
Deficiency
Fund
$495.8 million in current and future assistance payments have
been pledged by the Commonwealth to the Trust on behalf of
program borrowers
Secured by the full faith and credit of the Commonwealth, which is
rated “Aa1/AA+/AA+”
Secures all Bonds issued by the Trust on a parity basis
Amounts released from DSRFs securing MWRA, SESD, and New
Bedford Bonds not already released are transferred to the
Deficiency Fund, together with funds released from the Pool
Program Reserve Fund
Deficiency
Fund
Secures all Bonds issued by the Trust on a parity basis
Amounts released from DSRFs securing MWRA, SESD, and New
Bedford Bonds not already released are transferred to the
Deficiency Fund, together with funds released from the Pool
Program Reserve Fund
Deficiency
Fund
Secures all Bonds issued by the Trust on a parity basis
Amounts released from DSRFs securing MWRA, SESD, and New
Bedford Bonds not already released are transferred to the
Deficiency Fund, together with funds released from the Pool
Program Reserve Fund
Deficiency
Fund
Composed of multiple revenue streams from nearly 300 unique
borrowers
Payments are due to the Trust 15 days in advance of debt service
payments
Loan
Repayments
Bonds are secured by direct and cascading cashflows consisting of loan repayments, Commonwealth
contract assistance payments, reserve fund earnings, and balances in the Pool Program Reserve Fund
and Deficiency funds
Commonwealth
Assistance
Payments
11%
Loan Repayments
78%
Reserve
Earnings
11%
Pledged Sources Securing Bonds

54
Loan Portfolio
The Trust’s loan portfolio provides a stable and secure source of repayment for the Bonds
– 75% of Pool SRF Program loans are secured by a general obligation pledge of the borrowers
Strong legal protections for loan repayments are bolstered by a local aid intercept whereby, upon a
borrower’s default, the Trust is authorized to obtain Commonwealth financial assistance that would
otherwise be transferred to the borrower
The essentiality of water and wastewater service underlies the security of the loan repayment streams
Rank Recipient
Loan Principal
Outstanding % of Total
1 MWRA $1,086,783,383 28.04%
2 Upper Blackstone Water Poll. Abatement Dist. 154,667,222 3.99%
3 City of Fall River 141,884,950 3.66%
4 City of New Bedford 136,077,946 3.51%
5 City of Brockton 100,223,232 2.59%
6 City of Lowell 82,504,643 2.13%
7 City of Taunton 79,128,575 2.04%
8 City of Chicopee 61,471,288 1.59%
9 Town of Nantucket 56,681,014 1.46%
10 Springfield Water and Sewer Commission 56,085,524 1.45%
11 Lynn Water and Sewer Commission 55,104,004 1.42%
12 City of Framingham 52,098,546 1.34%
13 South Essex Sewerage District 51,743,443 1.33%
14 City of Gloucester 50,279,712 1.30%
15 Town of Westborough 49,220,633 1.27%
277 Total all others 1,662,522,456
42.89%
Top 15 Borrowers Across All Programs High Quality Financing Book
Large and diverse pool of borrowers with
sound credit quality
Based on loan principal outstanding,
roughly 97% of program borrowers are
rated “A3/A-” or better and 65% are rated
“Aa3/AA-” or better
No leveraged loans have ever defaulted
MWRA – which is the Trust’s largest
borrower and serves 61 member
communities in and around the metropolitan
Boston area – is rated “Aa1/AA+/AA+”
7
2012 Massachusetts Investor Conference

55
DSRF Investments
The Trust has approximately $1.3 billion in reserves outstanding
– As bonds amortize, proportional amounts of DSRFs “de-allocate” and are available as security
42% of outstanding DSRFs are invested in laddered portfolios of U.S. Treasuries and Agencies
The Trust continues to opportunistically manage away from exposure to third party investment providers
– Recently, the Trust had the opportunity to terminate $119.1 million of guaranteed investment contracts
(“GICs”)
Remaining DSRFs are invested in GICs, the bulk of which carry at least “AA” category ratings
The Series 16 Bonds did not fund a DSRF and will thus avoid exposure to today’s more challenging
reinvestment environment
DSRF Investment Breakdown
U.S.
Treasuries and
Agencies
42%
“AA”
Category
45%
“A”
Category
13%
Note: Based on the highest rating. Data as of 11/30/12
2012 Massachusetts Investor Conference

56
Flow of Funds
SRF Program Funds
Investment Earnings
State Matching
Funds
Federal Grants
As borrowers pay down the principal balances of
their loans and as the Trust pays debt service on
its bonds, proportional amounts are released from
reserves and/or loans pledged to secure related
bonds and are returned to the SRF program funds.
Revenue Fund
Reserve Fund
Earnings
Loan Repayments
Contract Assistance
Debt Service Fund
Rebate Fund
Pool Program Reserve Fund
Deficiency Fund
2012 Massachusetts Investor Conference

57
Security for the Trust Bonds
2012 Massachusetts Investor Conference
The Trust applies the federal grants and state matching funds and other moneys available to
the Trust (SRF Program Funds) to make loans or to provide security for its Bonds.
– In the past, the Trust has applied SRF Program Funds to establish reserve funds to
secure the bonds issued to fund such projects – earnings on these reserve funds were
used to pay debt service
– Beginning with Series 16, the Trust may apply its SRF Program Funds to fund loans to
borrowers that will be pledged as security to the bonds – interest payments on these
loans will be used to pay debt service
– The program reflects the combination of Reserve Fund and Cash Flow models, utilizing
loans and reserve funds to secure bonds
Trust’s Series 16 Bonds applied the Cash Flow Model - allowed for an additional $121 million in projects to
be funded rather than SRF Program Funds deposited into a reserve fund.
Reserve
Fund
Model
Bond Series Financings
Cash
Flow
Model
Hybrid
Model

58
Credit Highlights
2012 Massachusetts Investor Conference
Strong Borrower Fundamentals
No leveraged loans have ever defaulted
Strong default tolerances meeting the AAA criteria of all three rating agencies
Local aid intercept
Programmatic Strength
Highly rated and diverse loan pool with strong security provisions
Commonwealth Assistance Payments are a source of program subsidy
Additional security at a program level (Pool Program Reserve Fund and
Deficiency Fund)
Support and Management
Repeat borrowers and constant municipal contact ensure Trust awareness of
local considerations
Bonds trade actively in the secondary market.
Maturity of the Program
Essentiality of the water and wastewater infrastructure projects being funded
The Trust constitutes the single largest financing source of essential water
infrastructure projects in the Commonwealth
The Trust continues to be a strong “Aaa/AAA/AAA” rated credit by Moody’s, S&P and Fitch. Maintaining the
AAA bond rating reduces the cost of borrowing, thus reducing the cost incurred by the Commonwealth to
subsidize the loans.
“Large and diverse pool of
underlying borrowers with sound
credit characteristics.” Moody’s
Investors Service – May 21, 2012
“The stable outlook reflects our
expectation that pledged revenues
will continue to provide strong debt
service coverage consistent with the
rating level, given historical trends.”
Standard & Poor’s Ratings Services
– May 18, 2012
“An extremely strong enterprise risk
profile, given that the pool has
ongoing support from multiple levels
of government and was established
by statute…” Standard & Poor’s
Ratings Services – May 18, 2012

59
MWPAT Anticipated Borrowings – Spring 2013
2012 Massachusetts Investor Conference
Pool 17 SRF Bonds
– ~ $150 - $200 million new money
– February/March 2013
– Structure as Hybrid – primarily cash flow model (little to no reserve fund)
Given current market rates, continue to evaluate refunding opportunities
– Over $100 million in potential refunding opportunities

60
2012 Massachusetts Investor Conference
15 Minute Break

61
2012 Massachusetts Investor Conference
Massachusetts School
Building Authority
Massachusetts School Building Authority:
Vin Alabiso, Chief Financial Officer
Presented by:

62
Massachusetts School Building Authority
1. Overview
3. Key Credit Strengths
4. Debt Profile
5. Ratings and Forward Calendar
2. Capital Pipeline and Program Initiatives
2012 Massachusetts Investor Conference

63
MSBA - Overview
1 Excludes taxes imposed on the sales of meals and certain other items. Please refer to the MSBA’s Official Statement
for a full definition of MSBA’s Dedicated Sales Tax Revenue Amount.
• The MSBA was created by Ch. 208 of the Acts of 2004 to effectively
manage, plan, and create a new, financially-sustainable school building
construction and renovation grant program
• 7-member Board chaired by State Treasurer Steven Grossman
• The Commonwealth irrevocably dedicated a 1% statewide sales tax to
the MSBA’s bond program1
• The MSBA instituted a number of changes to the Commonwealth’s
previous school building assistance program:
– Implemented programmatic oversight and controls to ensure efficiency
and solvency of the program
– Ended entitlement culture for school building grants
– Created competitive application process based on need and project
urgency
– Implemented regulations to focus on intensive pre-design scope,
schedule, and budget
• The MSBA has made more than $9.2 billion grant payments to districts
since 2004
2012 Massachusetts Investor Conference

64
MSBA - History
• In 2004, the MSBA was established to replace the Commonwealth’s
unsustainable school building assistance program, which had accumulated more
than $10 billion in liabilities and a multi-year funding and audit backlog for
hundreds of projects
• Chapter 208 of the Acts of 2004 ended the former school building assistance
program and created the MSBA, charged with:
– Succeeding to the powers of the Department of Education, inheriting
outstanding payments and audits for 1,156 previously authorized projects
– Achieving the effective management, planning and financial sustainability
of a new program for school building construction grants
– Revising regulations for a new program of grants for school construction
– Accepting applications for new grant program starting July 2007
2012 Massachusetts Investor Conference

65
Former Program - Inherited Commitments Update
• 94% of the total inherited Waiting
List liability/commitment retired to
date
• 74% of the total inherited Prior
Grant commitment retired to date
$5.1B Inherited Prior Grants Status
$1.3B , 26%
$3.8B , 74%
Payments and audit
savings to date
Remaining Prior Grant
commitments
* Includes payment and audit savings through 11/15/2012.
MSBA Inherited Programs
Grant Payments
$0
$500
$1,000
$1,500
$2,000
$2,500
FY2005
FY2006
FY2007
FY2008
FY2009
FY2010
FY2011
FY2012
FY2013
YTD
*
Fiscal Year
Gra
nt
Pa
ym
en
ts (
in m
illi
on
s)
Waiting List
Prior Grants
*Reflects payments made through 11/15/2012.
$5.5B Inherited Waiting List Status
$5,211.6* , 94%
$87.7* , 2%
$200.7* , 4%
Payments and audit
savings to date
Est. remaining annual
payments (FY14-FY24)
Est. remaining Progress
Payments
* Amounts in millions. Includes payment and audit savings through 11/15/2012.
2012 Massachusetts Investor Conference

66
New Program Solutions
The MSBA has implemented programmatic oversight and controls to ensure the grant program stays within available resources:
Focused New Program Spending
– Emphasis on core academic spaces, such as classrooms and science labs
– Adherence to educationally-sound MSBA space guidelines/standards
– “Pay as you build” Progress Payment system
Completed Two Capital Surveys of Approximately 1,800 School Facilities Across the Commonwealth
– Identified baseline public school inventory
Limited Grant Approvals to Available Funds
– Develop individual project budgets
– Require districts to design to agreed-upon budget/scope
– MSBA/local district financial commitment clearly documented
The MSBA has utilized taxpayers’ resources to support cost-effective and educationally appropriate programs:
Created “Model School” Program
– Adapts proven designs for reuse
Created Green and Accelerated Repair Programs
– Focus on preservation of existing assets by performing energy efficiency upgrades that will extend useful life of facilities
– Projects progress on accelerated schedule using streamlined procurement process
– Authorized nearly 170 Green Repair projects with estimated grants totaling approximately $223 million
– Authorized 14 Accelerated Repair projects to date with estimated grants of $12.6 million
Established Science Lab Initiative
– Enhances learning environments and facilitates delivery of 21st century science curriculum
– Funds up to $60 million in prototype designs for high school science labs
2012 Massachusetts Investor Conference

67
Massachusetts School Building Authority
1. Overview
3. Key Credit Strengths
4. Debt Profile
5. Ratings and Forward Calendar
2. Capital Pipeline and Program Initiatives
2012 Massachusetts Investor Conference

68
• Robust capital pipeline with more than 350 projects
• Project scopes range from energy efficiency repairs to new construction
Source: MSBA website, as of October 1, 2012.
MSBA projects across the Commonwealth
Partnering with school districts across the Commonwealth
2012 Massachusetts Investor Conference

69
MSBA Capital Pipeline Project Status - Capital Pipeline, All Projects (as of October Board of Directors’
Meeting)
2012 Massachusetts Investor Conference

70
Capital Pipeline - Grant Payments Update
More than $1.1 billion
reimbursement payments made
for New Program projects since
FY08
$226.1 million New Program
payments made FY13 YTD
FY13 YTD weekly average of
$24.8 million project costs
submitted for review through
Progress Payment
reimbursement system
FY13 YTD average of $11.6
million reimbursements paid
weekly for Capital Pipeline
project costs
MSBA New Program Grant Payments
$-
$100,000,000
$200,000,000
$300,000,000
$400,000,000
$500,000,000
$600,000,000
FY2008 FY2009 FY2010 FY2011 FY2012 FY2013
YTD*
Fiscal Year
Ne
w P
rog
ram
Gra
nt
Pa
ym
en
ts
*Reflects payments made through 11/15/2012.
FY13 Progress Payment System Activity
Total Weekly Project Costs Submitted
$0$10,000,000$20,000,000$30,000,000$40,000,000$50,000,000$60,000,000$70,000,000$80,000,000
7/2/
2012
- 7/8/2
012
7/16
/2012
- 7/22/
2012
7/30
/2012
- 8/5/2
012
8/13
/2012
- 8/19/
2012
8/27
/2012
- 9/2/2
012
9/10
/2012
- 9/16/
2012
9/24
/2012
- 9/30/
2012
10/8/2
012 -
10/1
4/20
12
10/22/2
012
- 10/
28/2
012
11/5/2
012 -
11/1
1/20
12
Week
To
tal S
ub
mit
ted
Co
sts
2012 Massachusetts Investor Conference

71
Capital Pipeline: Accelerated Repair Program
Utilizes best practices from the former Green Repair Program (172 projects) and is primarily for the repair and/or replacement of roofs, windows, and/or boilers with the potential to include additional systems as may be determined by the MSBA
Districts with repair needs in their facilities can apply through the Statement of Interest Process
Focuses on the preservation of existing assets by performing energy-efficient and cost-saving upgrades, which will result in direct operational savings for school districts
Districts invited into the Accelerated Repair Program are required to use pre-qualified Owner’s Project Managers (OPMs) and designers, and adhere to other requirements unique to this program, such as implementing an accelerated project schedule
2012 Massachusetts Investor Conference

72
Capital Pipeline: Model School Program
4
3
11
0
2
4
6
8
10
12
Elementary Middle/Middle High High
Elementary
Middle/Middle High
High
Seeks to effectively adapt and re-use the design of successful, recently constructed elementary, middle and high schools
18 districts currently participating
Up to five additional reimbursement percentage points for participation
Model School Program Task Force
– Input from design, construction and project management professionals
2012 Massachusetts Investor Conference

73 www.MassSchoolBuildings.org
Model School Chosen
(Whitman-Hanson Regional High School)
Rendering
of New
Hingham
Middle School
Capital Pipeline: Model School Program
New Norwood
High School
2012 Massachusetts Investor Conference

74
Capital Pipeline: Science Lab Initiative
• Program updates otherwise sound educational facilitates and enhances delivery of a 21st century science curriculum
• Six grants approved to date:
– Total project budgets: $26.1 million
– Estimated maximum total facilities grants: $15.3 million
A competitive grant program established through 2012 SOI process
www.MassSchoolBuildings.org/news_events/Science_Lab_Video
2012 Massachusetts Investor Conference

75
Program Initiative: Commissioning
• MSBA-commissioned buildings undergo an intensive quality
assurance process that begins during design and continues
through construction, occupancy, and operations
• Ensures facility operates efficiently, and as intended
• Prepares facility staff to operate and maintain building systems
and equipment
• Critical component in “green” building programs, including LEED
and MA-CHPS
• 100% Funded by the MSBA
MSBA fully-funded process involving independent third party testing a
building’s systems and materials and the operation of the building as a whole
$15.9 million commissioning contracts executed to date
191 contracts for 241 schools
2012 Massachusetts Investor Conference

76
Massachusetts School Building Authority
1. Overview
3. Key Credit Strengths
4. Debt Profile
5. Ratings and Forward Calendar
2. Capital Pipeline and Grant Initiatives
2012 Massachusetts Investor Conference

77
• Unconditional Gross Pledge of a 1% statewide sales tax1
– Sales tax supported by the strong, diverse Massachusetts economy
– Massachusetts is home to 11 Fortune 500 corporate headquarters
• Strong Coverage Levels on Senior & Subordinate Liens
– Dilution of pledged revenue is restricted by an Additional Bonds Test
of 1.40x maximum Adjusted Senior Bond Debt Service Requirement
on Senior Bonds, and 1.30x maximum Adjusted Bond Debt Service
Requirement on Subordinate Bonds
– Historic coverage ratios on Senior Lien Debt in excess of 2x
– Current Senior Lien MADS coverage ratio of 2.05x
• Fully Cash Funded Debt Service Reserve Funds
– $488 million in cash funded Debt Service Reserve Funds
• No Operational Risk
– MSBA does not pay for the operational costs of the infrastructure
projects it helps fund
• MSBA Tax Revenue is not Subject to Appropriation
• Statutory Non-Impairment Covenant
• Monthly funding of principal and interest on Senior Lien Bonds
MSBA - Key Credit Features
1 Excludes taxes imposed on the sales of meals and certain other items. Please refer to the MSBA’s
Official Statement for a full definition of MSBA’s Dedicated Sales Tax Revenue Amount.
Department of
Revenue
SMART Fund
Trustee
Bond Related
Costs Fund
(For Costs Related
to Senior Bonds)
Subordinated Debt
Service Fund
Subordinated Debt
Service Reserve Fund
Bond Related
Costs Fund
(For Costs Related to
Subordinated Bonds)
Senior Debt Service
Reserve Fund
Senior Debt
Service Fund
Revenue Fund
Dedicated
Payments
Additional
Revenues
Subordinated
Sinking Fund
Accounts
Sinking Fund
Deposits
Dedicated Sales Tax
Revenue Amount
Massachusetts School
Building Authority
2012 Massachusetts Investor Conference

78 Massachusetts School Building Authority
• Growth in all but 6 of the last 37 years
• Long history of favorable growth rates
• Strong performance across economic cycles
1 Total sales tax receipts after reimbursements and abatements, less the Statutorily Exempted Revenue. 2 These data are presented as an estimate of historical Dedicated Sales Tax Revenue Amount based on historical sales tax receipts, and represent a 1% sales tax. 3 In January 1998, the payment schedule for businesses with tax liabilities greater than $25,000 per year was changed to simpli fy the time period on which such
payments are based. While the timing change did not affect the amount of tax owed by the affected businesses, the new payment schedule caused a one-
time delay in receipt of tax revenues realized in FY 1998. According to DOR, approximately $105 million less in sales tax revenue was collected in FY 1998
as a result of this change.
4 A tax amnesty program was in effect for a portion of FY 2003 which, according to DOR, generated approximately $42 million of sales and use tax revenues. 5 Reflects additional revenue due to sales tax rate increase from 5.0% to 6.25% (estimated by DOR to be approximately $739 mill ion in FY 2010 and $918 million in FY 2011), and elimination of sales tax exemption for alcoholic beverages for the period between August
1, 2009 and January 1, 2011 (estimated by DOR to be $96.6 million in FY 2010 and $81.0 million in FY 2011, of which amounts $15.5 million and $13.0 million, respectively, are included in the Dedicated Sales Tax Revenue Amount for each respective year). 6 Amounts for FY 2012 are estimated by DOR and unaudited. 7 Amounts for FY 2013 are based on the Commonwealth’s revised FY 2013 tax revenue estimate as of December 4, 2012.
FY
Sales Tax
Receipts1
Applicable % of
Sales Tax
Receipts2
% Increase/
Decrease
1977 $441.8 $88.4 27.2%
1978 520.7 104.1 17.8%
1979 577.8 115.6 11.0%
1980 608.4 121.7 5.3%
1981 704.2 140.8 15.7%
1982 753.1 150.6 7.0%
1983 865.3 173.1 14.9%
1984 1,041.8 208.4 20.4%
1985 1,209.5 241.9 16.1%
1986 1,452.1 290.4 20.1%
1987 1,600.0 320.0 10.2%
1988 1,733.3 346.7 8.3%
1989 1,787.1 357.4 3.1%
1990 1,660.5 332.1 (7.1%)
1991 1,617.7 323.5 (2.6%)
1992 1,682.3 336.5 4.0%
1993 1,821.0 364.2 8.2%
1994 1,978.8 395.8 8.7%
1995 2,137.0 427.4 8.0%
1996 2,252.1 450.4 5.4%
1997 2,494.7 498.9 10.8%
1998 (3) 2,572.4 514.5 3.1%
1999 2,833.0 566.6 10.1%
2000 3,107.2 621.4 9.7%
2001 3,273.0 654.6 5.3%
2002 3,193.9 638.8 (2.4%)
2003 (4) 3,196.0 639.2 0.1%
2004 3,211.1 642.2 0.5%
2005 3,330.8 666.2 3.7%
2006 3,420.2 684.0 2.7%
2007 3,458.9 691.8 1.1%
2008 3,453.8 690.8 (0.1%)
2009 3,239.0 647.8 (6.2%)
2010 (5) 3,852.1 637.1 (1.7%)
2011 (5) 4,091.5 654.7 2.8%
2012 (6) 4,190.6 670.5 2.4%
2013 (7) 4,264.4 682.3 1.8%
Dedicated 1 Cent Statewide Sales Tax ($’s in Millions)
0
100
200
300
400
500
600
700
800
1977
1979
1981
1983
1985
1987
1989
1991
1993
1995
1997
1999
2001
2003
2005
2007
2009
2011
2013
($’s
in
Millio
ns)
Strong History of Statewide Sales Tax Growth
2012 Massachusetts Investor Conference

79
FY13 SMART Sales Tax Collections
Total sales collections through October were $5M (2.3%) greater than collections through same period in FY12
Collections have exhibited growth each month over the same month in the previous year
Month Jul Aug Sep Oct YTD
FY12 Collections ($ in thousands) 59,646 54,111 52,414 56,434 222,606
FY13 Collections ($ in thousands) 60,514 56,214 53,253 57,667 227,648
Change ($ in thousands) 868 2,103 839 1,232 5,042
% Change 1.5% 3.9% 1.6% 2.2% 2.3%
Monthly SMART Collections
0
50,000
100,000
150,000
200,000
250,000
Jul Aug Sep Oct YTD
To
tal
Sale
s T
ax C
oll
ecti
on
s (
$ i
n t
ho
usan
ds)
FY12 Collections ($ in thousands)
FY13 Collections ($ in thousands)
2012 Massachusetts Investor Conference

80
Massachusetts School Building Authority
1. Overview
3. Key Credit Strengths
4. Debt Profile
5. Ratings and Forward Calendar
2. Capital Pipeline and Grant Initiatives
2012 Massachusetts Investor Conference

81 Massachusetts School Building Authority
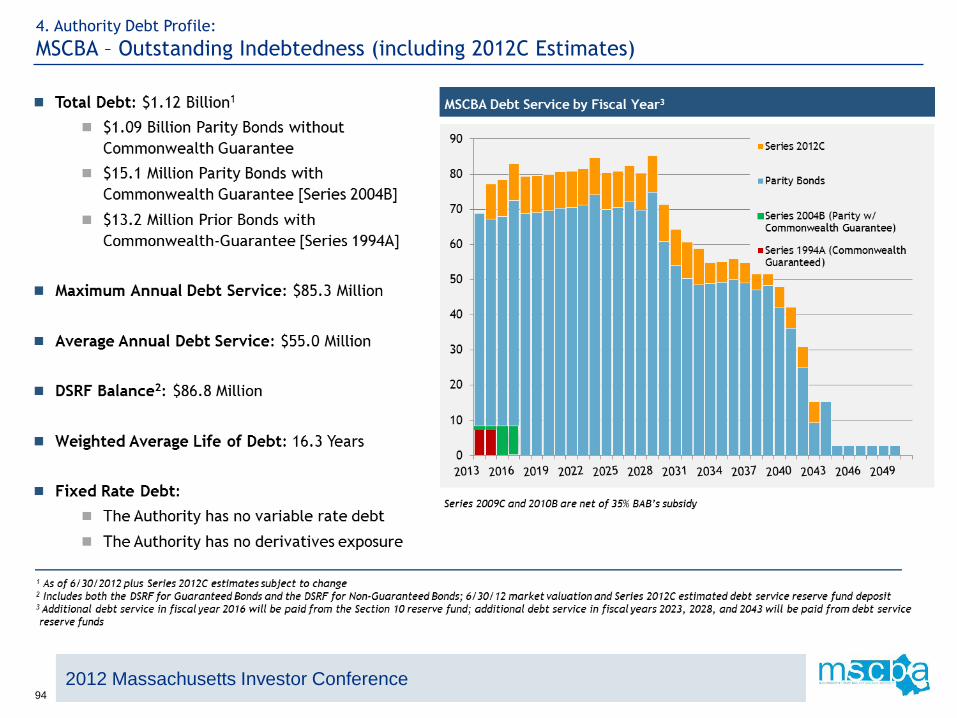
1 Debt service reflects the impact of 2012 Series A and B refunding bonds. Debt service does not account for expected Debt Service Reserve Account earnings and the Federal BAB and QSCB subsidies; however, debt service is net of the amounts that are expected to be paid from Debt Service Reserve Account releases.
• $4.95 billion of Senior Lien debt outstanding as of November 15, 2012
• $293.38 million of Subordinate Lien debt outstanding as of November 15, 2012
– 100% comprised of Qualified School Construction Bond issuance
• Senior Lien MADS (net of Debt Service Reserve Account releases) totals approximately $367.62 million
• 100% of MSBA’s debt portfolio comprised of fixed rate debt
• FY13 refunding issuances (2012 Series A and 2012 Series B) generated more than $150.01 million net PV savings
MSBA Debt Service1 vs. Sales Tax Revenues
2
2
2
MSBA – Outstanding Debt
2012 Massachusetts Investor Conference

82
Massachusetts School Building Authority
1. Overview
3. Key Credit Strengths
4. Debt Profile
5. Ratings and Forward Calendar
2. Capital Pipeline and Grant Initiatives
2012 Massachusetts Investor Conference

83
Ratings
Recent affirmation of strong credit ratings as part of MSBA’s $916 million 2012
Series B refunding issuance
– Fitch: AA+
– Moody’s: Aa1
– S&P: AA+
Forward Calendar
New Money Issuance (~$500 million) – Q2 calendar 2013
Qualification of underwriters to be conducted Q1 calendar 2013
MSBA – Ratings and Forward Calendar
2012 Massachusetts Investor Conference

84
• Jack McCarthy, Executive Director
– (617) 720-4466, [email protected]
• Vin Alabiso, Chief Financial Officer
– (617) 720-4466, [email protected]
• Susan Flanagan-Cahill, General Counsel
– (617) 720-4466, [email protected]
• Ken Wissman, Chief Financial Advisor
– (617) 720-4466, [email protected]
Contact Information
Massachusetts School Building Authority
2012 Massachusetts Investor Conference

85
2012 Massachusetts Investor Conference
Massachusetts State College
Building Authority
Massachusetts State College Building Authority:
Edward H. Adelman, Executive Director
Presented by:

86
Massachusetts State College Building Authority
2012 Massachusetts Investor Conference
1. Overview
2. Demand for State University and Campus Facilities
3. Bond Security Features
4. Authority Debt Profile
5. Project Delivery and Management
6. Future Borrowing Needs
Weygand H
all B
ridgew
ate
r Sta
te U
niv
ers
ity

87
2012 Massachusetts Investor Conference
Massachusetts Maritime Academy
Fitchburg State University
Massachusetts College of Liberal Arts
Worcester State University
Bridgewater State University
Salem State University
Framingham State University
Westfield State University
The Massachusetts State University System
Massachusetts College of Art and Design
1. Overview:
MSCBA – Authority System Overview
The Authority finances, designs, constructs, and manages residential and student activity
facilities on the campuses of the nine State Universities
The Authority portfolio currently has capacity for approximately 15,000 students in 43
residential complexes. These facilities house approximately 42% of the undergraduate
student population

88
2012 Massachusetts Investor Conference
Demand
Full Occupancy; Increasing Enrollment
High Interest in Residential Campus Experience
Improved Facility Condition
Affordable Rent and Fees
Revenue and Reserves
Strong Project Revenues, Pledges, and Reserves
Multiple Years of Increases in Authority Reserves
No Variable Rate Debt; No Derivatives Exposure
All Revenue Available for All Debt
Statutory Appropriations Intercept (Pre-Default)
Strong Commonwealth Rating: Aa1 (Moody’s)
and AA+ (S&P)
Strong Intercept Mechanics
Improved Appropriations/Debt Service Coverage
Ratio
North Hall Framingham State University
1. Overview:
MSCBA – Key Credit Strengths

89
2012 Massachusetts Investor Conference
Undergraduate headcount has increased steadily from 34,748 in Fall 2002 to 42,127 in
Fall 2012, an increase of 21%
Fall 2011 to Fall 2012 undergraduate headcount rose by 1.2%
State University Undergraduate Headcount1
30,000
32,000
34,000
36,000
38,000
40,000
42,000
Fall
2002
Fall
2003
Fall
2004
Fall
2005
Fall
2006
Fall
2007
Fall
2008
Fall
2009
Fall
2010
Fall
2011
Fall
2012
(# o
f Stu
dents
)
Source: Baard of Higher Education 1 Early estimates for Fall 2012
2. Demand:
MSCBA – State University Enrollment

90
2012 Massachusetts Investor Conference
Residence hall design capacity (# of beds) has increased 48% from 10,065 in 2001 to
14,863 in 2012
Residence hall occupancy has remained stable at over 100% actual occupancy since
academic year 2003-2004, even as the number of beds has increased by nearly 4,800
All of the State Universities residence halls are fully occupied, with the majority having
Fall 2012 occupancy greater than 100%
Source: Authority
System Actual Occupancy versus Design Capacity
2. Demand:
MSCBA – State University Residence Hall Capacity and Occupancy

91
2012 Massachusetts Investor Conference
3. Bond Security Features:
MSCBA – Flow of Funds Established by Trust Agreement

92
2012 Massachusetts Investor Conference
3. Bond Security Features:
MSCBA – Total Revenue, Reserves and Pledges Available for Debt Service

93
2012 Massachusetts Investor Conference
3. Bond Security Features:
MSCBA – Projected Reserve Levels
94
2012 Massachusetts Investor Conference
4. Authority Debt Profile:
MSCBA – Outstanding Indebtedness (including 2012C Estimates)

95
2012 Massachusetts Investor Conference
Qualifications-based selection process
Completion bonus/penalties
Track record for on-time and-on budget
performance
Build and sustain quality facilities
Schedule and fund periodic
reinvestment
Bonding and insurance
“The new dorm tower at
Massachusetts College of Art and
Design is the most interesting
Boston high-rise in years.”
Robert Campbell
architecture critic
The Boston Globe
Sunday, May 13, 2012
Treehouse Residence Mass College of Art and Design
5. Project Delivery and Management:
MSCBA – Project Approach

96
2012 Massachusetts Investor Conference
For further information, please contact:
Edward Adelman
Executive Director
617/933-8337
Visit on the web:
www.mscba.org
Currently, the Authority expects to issue approximately $80 million in both 2014 and
2015 to fund two new residence halls and renovations to student activity facilities
Fitness & Recreation Center Salem State University
6. Future Borrowing Needs:
MSCBA – Upcoming Issuances

97
2012 Massachusetts Investor Conference
University of Massachusetts
Building Authority Presented by:
Katherine Craven
Executive Director
The University of Massachusetts Building Authority

98
University of Massachusetts Building Authority
2012 Massachusetts Investor Conference
History
Created by Mass. Legislature in 1960
Merged with Lowell University and Southeastern Mass University Authorities in 1995
First issuer in Mass. to use taxable Build America Bonds
Completed the Authority’s first competitive bond sale in 2011
Governance
11 Members
Appointed by the Governor
5 Members must be UMass Trustees
2 Non-Trustee Members must be alumni of the University
Non-Trustee Members serve 6 year terms
Trustee Members serve as long as they are Trustees

99
University of Massachusetts Building Authority
2012 Massachusetts Investor Conference
-
200,000
400,000
600,000
800,000
1,000,000
1,200,000
1,400,000
1,600,000
1,800,000
2,000,000
2004 2005 2006 2007 2008 2009 2010 2011 2012
Debt Outstanding (in thousands) – June 30, 2012

100
University of Massachusetts Building Authority
2012 Massachusetts Investor Conference
75%
25%
0%
Debt Outstanding – June 30, 2012
Fixed Rate
Synthetic Fixed Rate
Variable Rate

101
University of Massachusetts Building Authority
2012 Massachusetts Investor Conference
58%17%
18%
7%
Debt Credit Support – June 30, 2012
University Credit
Insured
Credit Enhanced
CommonwealthGuaranteed

102
University of Massachusetts Building Authority
2012 Massachusetts Investor Conference

103
University of Massachusetts Building Authority
2012 Massachusetts Investor Conference
Projects
104
University of Massachusetts Building Authority
2012 Massachusetts Investor Conference
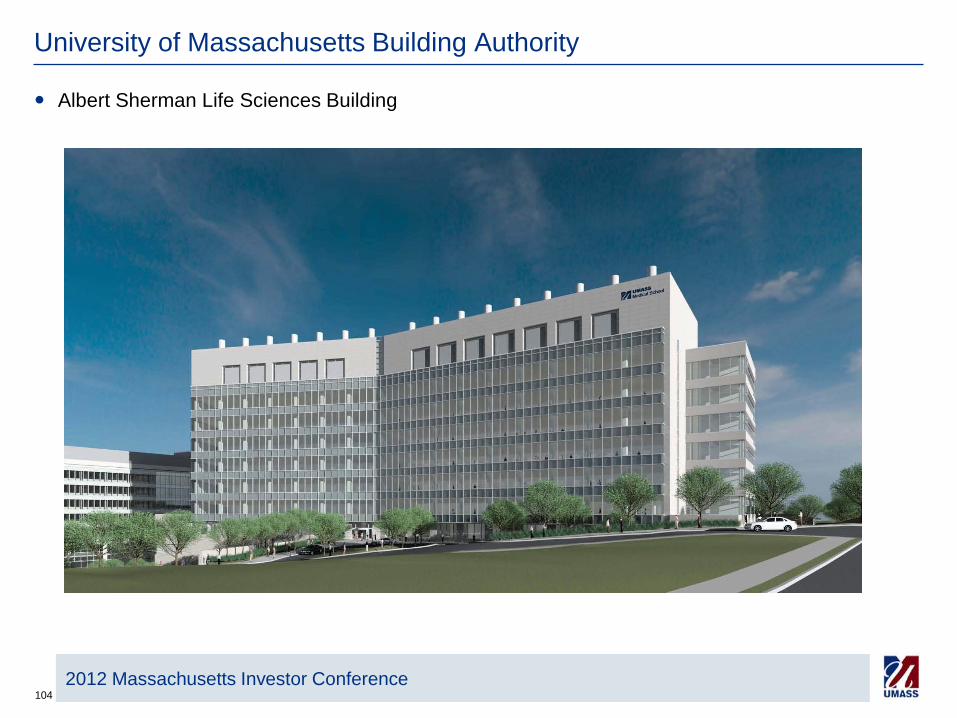
Albert Sherman Life Sciences Building

105
1
0
5
Capital Improvement Requirements:
Debt Financing
Five-year plan proposes $1.73 billion in debt funded spending
• $700 million already borrowed
• $1 billion to be borrowed during the five-year period (Next planned borrowing- Spring 2013)
• UMass maintains strong Aa2/AA ratings, providing market access for a variety of financing alternatives
and attractive borrowing costs
Fitch Ratings Report:
“Management continues to prudently
oversee an extensive capital improvement
program meant to enhance teaching and
research facilities, and elevate the
university’s academic standing.”
Debt Service – Existing plus $1
billion of new bonds
2012 Massachusetts Investor Conference
University of Massachusetts Building Authority

106
University of Massachusetts Building Authority
2012 Massachusetts Investor Conference
Credit Review
Rating Agencies:
Moody’s Aa2
Fitch AA
S&P AA (Commonwealth Guarantee Debt)
University of Massachusetts
69,600+ students over 5 campus system (Fall 2011)
Nearly 14,000 degrees conferred (2010 – 2011)
13,500+ admissions (Fall 2011)
$586+ million in research expenditures and continues to grow at an 8.1% increase over FY
2010

107
University of Massachusetts Building Authority
2012 Massachusetts Investor Conference
University of Massachusetts
In the Fall of 2011 the Times of London ranked UMass as the 64th best University in the
world.
Ranked behind only Harvard, MIT and Tufts in Massachusetts
The Times of London 2011 World Reputational Rankings ranked UMass 19th in the world in
reputation.
The 2012 U.S. News rankings of primary care medicine ranked UMass Worcester 7th out of
146 institutions.
In 2010, the most current ranking, UMass ranked 13th nationwide in terms of universities
generating revenues from licensing and technology transfer.
UMassOnline, which delivers 100+ programs to diverse and geographically dispersed
learners, increased by 11% in 2011 to over 50,000 enrollments.
UMass endowment assets grew by 15% in 2012 and exceeded $529 million.
(Source: The University of Massachusetts 2012 Annual Indicators Report and University personnel)

108
2012 Massachusetts Investor Conference
Investor Roundtable Panel
Colin MacNaught, Office of the State Treasurer
Moderated by:
Chris Alwine, Vanguard

109
2012 Massachusetts Investor Conference
Presentation By:
John J. Cross III
Securities and Exchange Commission
Director of the Municipal Securities Office

110
2012 Massachusetts Investor Conference
John J. Cross III, Securities and Exchange Commission, Director of the Municipal Securities Office
John Cross has a broad range of experience with municipal finance transactions in nearly every
state, including experience with some of largest and most complex municipal financings ever
undertaken. Mr. Cross has been a leader in the public policy area affecting municipal finance.
For the past several years, Mr. Cross has been serving as the Associate Tax Legislative Counsel in
the Office of Tax Policy at the U.S. Treasury Department, where he has had significant responsibility
for legislative, regulatory and budgetary tax matters affecting municipal bonds. Mr. Cross led the
agency’s implementation of the municipal bond provisions of the 2009 Recovery Act, which included
public guidance on Build America Bonds and other targeted municipal bond programs. He also
played a significant role in the Treasury Department’s efforts to address municipal bond market
challenges in the 2008 financial crisis.
Prior to working at the Treasury Department, Mr. Cross was a partner at national municipal bond
specialty law firm Hawkins Delafield & Wood LLP from 1994 to 2006. He previously served as a
counsel at the Internal Revenue Service in the Financial Institutions and Products division, where his
work involved derivative financial products that were used with municipal bonds.
Mr. Cross has been active in several professional organizations, including the National Association of
Bond Lawyers (NABL), where he’s a former board member. He’s also a member of the editorial
board for Municipal Finance Journal. Mr. Cross received his B.A. from Brown University in 1978, a
J.D. from Vanderbilt University School of Law in 1981, where he was a member of the Vanderbilt Law
Review, and a Masters of Laws in Taxation from Georgetown University Law Center in 1988. He is
married to Meredith Cross, who is Director of the SEC’s Division of Corporation Finance.
111
2012 Massachusetts Investor Conference
The Commonwealth of Massachusetts
Executive Office for Administration and Finance:
Jay Gonzalez, Secretary
Greg Mennis, Assistant Secretary for Fiscal Policy
Scott Jordan, Assistant Secretary for Capital Finance
Michael Esmond, Budget Director
State Treasurer’s Office:
Colin MacNaught, Assistant Treasurer for Debt Management
Delia Rissmiller, Investor Relations Manager
Presented by:

112
The Commonwealth of Massachusetts – Fiscal 2013 Update
2012 Massachusetts Investor Conference
• FY 2013 signed on-time, and in balance, totaling approximately $32.5 billion, an increase of
4.9%.
• As of the signing of the budget, the reliance on one-time resources was estimated to be
$616 million, down from $669 min fiscal 2012 and over $1.9 billion in fiscal 2011.
• As we will discuss further in the presentation, ANF continues its efforts to develop and
improve long-term fiscal planning models and policies. Based on ANF’s long-term models,
this level of non-recurring resources is safely within a sustainable level for the state’s
annual budget.
• The fiscal 2013 budget continues to reform, including such areas as, community colleges
governance, accountability and effectiveness; programs and services for homeless
families; state facilities managements; performance management and budget
transparency; and, efforts to control health care spending for the state and employers
across the Commonwealth.
• Spending controls continue. While the fiscal 2013 budget did not require the same level of
reductions and related spending control measures as some previous budgets, state
agencies must continue to find ways to limit growth in their costs and operate more
efficiently.

113
The Commonwealth of Massachusetts – Fiscal 2013 Update
2012 Massachusetts Investor Conference
On December 4, 2012, pursuant to Section 9C of Chapter 29 of the Massachusetts General
Laws, the Secretary of Administration and Finance advised the Governor of a budgetary
shortfall of revenues totaling $540 million with respect to the appropriations approved to
date for fiscal 2013.
On the same day, the Secretary revised the tax revenue estimate for fiscal 2013 to $21.496
billion, which represents a reduction of $515 million from the revenue estimate assumed in
the fiscal 2013 budget adjusted for subsequent tax law changes.
On December 4th the Governor announced a balanced set of solutions, and filed
accompanying legislation, that would close the gap.
The Administration and Legislature have established a number of prudent fiscal policies to
ensure structurally-balanced budgets and long-term fiscal sustainability. These have been
codified through changes in law and in the Administration’s Long-Term Fiscal Policy
Framework.
One of these fiscal policies is a commitment to solve no more than half of any mid-year tax
revenue shortfall with rainy day funds or other one-time, non-recurring resources. This
policy ensures a balanced set of budgetary solutions that will better position the state to
absorb the impact the tax revenue reduction may have in subsequent years as well.

114
The Commonwealth of Massachusetts – Fiscal 2013 Update
2012 Massachusetts Investor Conference
Overview of Budget Balancing Measures
Fiscal Action Plan
Change in Estimated FY 2013 Tax Receipts: (515)
Year-To-Date Dedicated One-Time Tax Settlements: (25)
Projected Budgetary Shortfall: (540)
Non-Recurring Solutions:
Increase Rainy Day Fund: 200
One-Time Medicaid Revenue: 49
One-Time Executive Branch Reductions: 10
Other Fund Surpluses: 11
sub-total: 270
Recurring Solutions:
Additional Federal Revenues: 49
Non-Executive Branch Reductions (1%): 25
Reduced Sales Tax Transfer to School Building Authority 20
Local Aid Reduction (1%) 9
Executive Branch Reductions (net)*: 147
Health Care and Debt Service Savings: 20
sub-total: 270

115
The Commonwealth of Massachusetts – Fiscal 2013 Update
2012 Massachusetts Investor Conference
Nationally, the rate of economic growth has been slower than in typical post-recession
periods and, over the last few months, economic growth has been slower across the
country than had been projected at this time last year when we developed the tax revenue
estimate for the fiscal 2013 budget.
The slow-down in economic growth is largely due to the uncertainty caused by the so-called
“fiscal cliff” and the federal fiscal condition generally.
Though we have proactively addressed the current projected shortfall, inaction by the
federal government to address the so-called “fiscal cliff” would have a significant impact to
state tax revenues. Some forecasts project a $300 million fiscal 2013 tax revenue hit as a
result of full sequestration and expiration of tax cuts.

116
The Commonwealth of Massachusetts – Reserves
2012 Massachusetts Investor Conference
The fiscal 2012 estimates released by the National Association of State Budget Officers
(NASBO) in June 2011, together with the results reported in the Commonwealth’s fiscal
2012 Statutory Basis Financial Report, indicate that Massachusetts’s Stabilization Fund
balance of $1.652 billion is estimated to be the third highest reserve fund balance in the
nation in absolute size
After accounting for the additional withdrawals from the Fund in fiscal 2013 the projected
ending balance would b $1.192 billion, one of the highest in the nation.
This is a direct of result of prudent budget management by the Administration and
Legislature, fiscal 2012 was the second year in a row that had a year-on-year increase.
In addition, two recently passed amendments to state finance law have also helped to
increase the balance of the state’s reserves
– A provision that requires the deposit of any one-time settlements greater than $10 million
to the Stabilization Fund resulted in a $375 million being added to the fund in fiscal 2012.
– A provision that requires any tax revenue from capital gains that exceeds $1 billion in a
fiscal year is to be deposited into the Stabilization Fund is projected to result in a $90
million deposit into the fund in fiscal 2013.

117
The Commonwealth of Massachusetts – Reserves
2012 Massachusetts Investor Conference
1,137
1,728
2,155
2,335
2,119
841
669
1,379
1,652
1,192
0
500
1,000
1,500
2,000
2,500
$s
in
mil
lio
ns
2004 2005 2006 2007 2008 2009 2010 2011 2012 2013
Fiscal Year
Stabilization Fund Balances
by Fiscal Year

118
The Commonwealth of Massachusetts – Looking Forward – Fiscal 2014 Overview
2012 Massachusetts Investor Conference
House 1 Development. A&F is actively working with state agencies now to develop the
Governor’s budget for next year.
With a continued uncertain revenue picture, A&F developed competing scenarios of
potential impacts resulting from some or all of the fiscal cliff occurring on January 1,
2013.
The state FY 2014 tax consensus hearing process will begin on December 11 with the
joint A&F and legislative hearing at which economic forecasters will provide testimony
on likely revenues and related economic factors. Actual revenue forecasts for FY 2014
tax collections and related distributions of dedicated tax streams will not be finalized
until early to mid January 2013.
The Governor’s budget will be filed on Wednesday, January 23, 2013.
The impact of the “fiscal cliff” would be significant to the Commonwealth’s fiscal 2014
tax revenues, with some forecast’s projecting a revenue loss of $1 billion as a result of
full sequestration and expiration of tax cuts.

119
The Commonwealth of Massachusetts – Capital Investment Plan
2012 Massachusetts Investor Conference
Statewide, five-year capital plan. The plan coordinates capital expenditures by state
agencies and authorities that are funded primarily with Commonwealth debt, third party
payments and federal reimbursements.
Limit on Borrowing, from all sources. The Administration limits bond-funded capital
expenditures, known as the “bond cap.” fiscal 2013 bond cap is $1.875 billion with an
additional $93 million in unused capacity from the prior fiscal year.
Bond cap determination is based on the Debt Affordability Analysis and policies in which
A&F sets the annual borrowing limit at an amount sized to keep debt service within 8% of
budgeted revenues
The Administration has conservatively constrained the bond cap in FY16 and FY17 at the
fiscal 2015 level. Future debt affordability analysis may show sufficient revenue growth to
allow increased bond cap in future plans.

120
The Commonwealth of Massachusetts – Capital Investment Plan
2012 Massachusetts Investor Conference
-
500,000,000
1,000,000,000
1,500,000,000
2,000,000,000
2,500,000,000
FY12 FY13 FY14 FY15 FY16 FY17
Unused Capacity
State Bond Cap

121
The Commonwealth of Massachusetts – Long Term Fiscal Policy Framework
2012 Massachusetts Investor Conference
• The Administration has adopted a long-term fiscal policy framework to promote:
• Achieving structural budget balance
• The integration of long-term forecasting with current year budget development
• Clear thinking about long-term fiscal impacts of policy decisions and proposals
• A collaborative approach to maintenance and improvement of fiscal policy and planning,
using data and input from all state government stakeholders
• Policy goals:
• Structural balance
• Sustainable spending growth
• Disciplined management of long-term liabilities

122
The Commonwealth of Massachusetts – Long Term Fiscal Policy Framework
2012 Massachusetts Investor Conference
Long Term Fiscal Policy – Process Flow
Long
-
Term Tax Revenue
Caseload Forecasting and Policy Impact
Macro Assumptions
Five Year Model
Revenue / Spending Growth

123
The Commonwealth of Massachusetts – Long Term Fiscal Policy Framework - Update
2012 Massachusetts Investor Conference
• Structural Balance:
• fiscal 2013 forecast is in structural balance based on an estimated cyclical deficit of $1B
and a projected use of $796M in one-time resources ($886M in one-time spending net of
$90M in stabilization fund deposits). One-time spending in fiscal 2011 and fiscal 2012
was also substantially below the cyclical deficit.
• The long-term revenue forecast will be updated in December, concurrent with the
consensus revenue process, and will incorporate risk (fiscal cliff) scenarios.
• Sustainable Spending Growth:
• Five-year projections from May of this year indicated spending growth of 5.0% by FY17,
leading to structural budget deficits based on projected long-term revenue growth of
4.0%. The rate of spending growth was driven largely by assumed high rates of growth
in health care costs.
• The base case five-year projections for the January 2013 update to the policy framework
will incorporate lower rates of growth in spending based on the health care cost
containment legislation. The risk of higher rates of health care cost growth will be
captured in scenario analyses.
• The updated five-year projections will also include the estimated impact of the Affordable
Care Act as well as federal budget/deficit reduction initiatives (e.g. sequestration)

124
The Commonwealth of Massachusetts – Long Term Fiscal Policy Framework - Update
2012 Massachusetts Investor Conference
• Disciplined Management of Long-Term Liabilities:
• The updated policy framework will include an evaluation of the impact of pension reform
and recent changes to the state’s pension valuation.
• A comprehensive measure for long-term liabilities (debt, pension, OPEB, deferred
maintenance) and the potential impact of recommendations from the OPEB commission
are also being evaluated
125
II. Disclosure Enhancements: Devoting Resources to Be a Market
Leader
2012 Massachusetts Investor Conference

126
Massachusetts’ Investor Disclosure Enhancements
2012 Massachusetts Investor Conference
• Investor Disclosure • Continue to re-write and overall information statements and
supplements, enhancing sections based on investor or regulatory
feedback and focusing on plain English.
• Enhanced pension liability / asset sections in 2010 and 2011
• Working to incorporate economic narrative
• Developing formal schedule of disclosure releases to make
disclosure more predictable
• More voluntary filings on EMMA
• Continuing to seek investor feedback
• Investor Communication & Outreach • Annual investor conference
• Targeting investors in Boston and outside region for one-on-one
meetings away from financings
• First state to implement quarterly investor conference calls
• Revenue, budget, debt updates, as well as
• Access to senior leadership of the state
• Investor surveys
• New Consolidated Investor Website • Website dedicated to investor needs, data consolidated across the
Commonwealth
• Debt reports, bond authorizations
• Cash flow reports
• Forward financing calendar
• Monthly revenue reports
• Operating & capital budgets
• CAFRs, pension and OPEB actuarial reports
• Disclosure and O.S. archives, rating information
• Goals • The Commonwealth’s goal is to have the best investor
disclosure and investor outreach program in the
municipal market place
• Better disclosure documents, better investor website
and more predictability in disclosure publications
• Focusing on investor outreach efforts

127
Enhancements to Information Statements
2012 Massachusetts Investor Conference
The foundation of Massachusetts’ enhanced disclosure program is the emphasis on improving the state’s
written disclosure document
Like other states, Massachusetts is always striving to meet or exceed the best practice recommendations
of such groups as the NFMA, GFOA and NABL for its disclosure documents
But we’ve also focused on investor feedback – through formal and informal surveys – for re-writes or
enhancements of specific sections
For example, we rewrote our pension liability / asset sections in 2010, 2011 & 2012 based on feedback
from investors
By the time NABL had finalized their recommendations to issuers in May 2012, Massachusetts
pension disclosure had met nearly all recommendations (projections by end of 2012)
We are currently working to include an economic narrative into our information statements for the first
time, to be a resource to investors in addition to the quarterly economic statistical section that we currently
provide
Incorporated recommendations from “A Plain English Handbook: How to Create Clear SEC Disclosure
Documents” (1998)
Tried to make the document more readable, with more logical flow, defined page breaks, consistent
use of data, more tables, etc.

128
Enhancements to Information Statements
2012 Massachusetts Investor Conference
In 2012, we introduced two big changes in terms of the process around the release of the Information
Statement
First, starting in 2012, the Commonwealth moved away from Information Statement Supplements
Full re-write of the information statement – roughly 100 page document – each time disclosure is updated
Second, developed formal schedule of disclosure releases six times per year to make disclosure more
predictable, again based on investor recommendations
The Information Statement is released on or about the fifth business day of every other month
The scheduled of disclosure releases has been published to the market
Disclosure updates every January, March, May, July, September, November
10b-5 letters, modeled after Sarbanes-Oxley
Whether the state is selling bonds or not it has committed to following this schedule
Investors know when to expect disclosure data – should give investors more confidence knowing they will
have reliable information in the future to make informed buy or sell decisions

129
More Voluntary Filings to EMMA
2012 Massachusetts Investor Conference
Our goal is to have many more voluntary filings on EMMA, including:
Cash flow statements
Rating agency presentations
Investor presentations
Revenue reports and forecasts
Investor questions and answers
Transcripts of investor conference calls

130
Investor Communication
2012 Massachusetts Investor Conference
• The second phase of Massachusetts’ enhanced disclosure program is more direct investor outreach
• Massachusetts is the first state to implement regular investor conference calls
• Live calls, modeled on corporate earnings calls
• Scheduled for roughly 7 days after disclosure is updated, six planned per year
• Access to senior leadership of the state, whether or not state is selling bonds
• Regular updates on the economy, revenues, budgets, capital updates, as well as one “big topic” per
call
Commonwealth of Massachusetts 2012/2013 Investor Disclosure & Conference Call Schedule
Disclosure Update
Targeted Investor
Conference Call "Big Topic" Participants
9-May-12 21-May-12 Disclosure Enhancements Treasury
23-Jul-12 30-Jul-12 FY12 Revenue Review Dept of Revenue
10-Sep-12 17-Sep-12 Review of Major Spending Categories Admin & Finance
16-Nov-12 14-Nov-12 Review of 2012 Pension Actuarial Report State Actuary, PERAC
7-Jan-13 14-Jan-13 State Financial Controls & Financial Statements State Comptroller
7-Mar-13 14-Mar-13 Review of Updated 5-Year Capital Plan Admin & Finance

131
Investor Communication
2012 Massachusetts Investor Conference
• Massachusetts is hosting its second annual investor conference December 2012
• Ongoing targeting of investors in Boston and outside region for one-on-one meetings away from
financings (New York, Chicago, San Francisco)
• Focus on existing large holders of Massachusetts bonds and large investors who don’t hold a lot
of Massachusetts bonds
• Continue to seek investor feedback on disclosure and liquidity via third party surveys
• Investor email subscriber list
• Twitter feed for investors: @BuyMassBonds

132
New Investor Website
2012 Massachusetts Investor Conference
The third phase of Massachusetts’s enhanced disclosure program – and perhaps the most important, is a
new consolidated website dedicated to investors
There are three issues around improving continuing disclosure in the municipal market:
1. Timeliness
2. Format, and
3. Frequency
Massachusetts’ goal is to address these issues for investors through a new website
Use of new website to efficiently provide more information to investors and more information more
frequently to investors
Recently released SEC report on muni disclosure said the increased use of issuer websites would be
useful
Also follows GFOA Best Practices: Using a Website for Disclosure (2002 and 2010); Using Websites to
Improve Access to Budget Documents and Financial Reports (2003); and Website Presentation of Official
Financial Documents (2009)

133
New Investor Website
2012 Massachusetts Investor Conference
The Treasury’s existing debt management website will have its content re-purposed for debt material that
may be pertinent for investors
The new investor website will consolidate all of the information currently available to investors on different
websites
Target to go live January 1
Approximately 25,000 pages of downloadable information, including:
Debt schedules, bond authorizations, variable rate summaries, swap summaries
Cash flow and short-term investment reports
Monthly revenue reports
Operating & capital budgets, including supp budgets
CAFRs, pension and OPEB actuarial reports
Forward consolidated issuer financing calendar
Disclosure and Official Statement archives
Live links to MSRB secondary market trading activity by CUSIP numbers

134
New Investor Website
2012 Massachusetts Investor Conference

135
New Investor Website
2012 Massachusetts Investor Conference

136
New Investor Website
2012 Massachusetts Investor Conference

137
New Investor Website
2012 Massachusetts Investor Conference

138
New Investor Website
2012 Massachusetts Investor Conference
Timeliness, format and frequency…
In developing our new website, we’ve tried to address those areas by asking a couple of simple questions
State financial data changes continuously, while state financing-related disclosures may be quarterly or
less often – in Massachusetts case, six times per year
Even with six disclosures per year, relevant state economic indicators change continuously
Also, some state economic indicators are available from state agencies before being released by
the Federal government (e.g., Employment data from state labor and workforce development
agencies who feed the BLS)
The gap between when an economic or financial data point changes and when its formally disclosed by a
state in its bond disclosure represents a cost and an opportunity
These information gaps will always translate into “uncertainty discounts” being imposed by investors on
state borrowings
A successful closing of those gaps would reduce the “uncertainty discount” imposed by investors
So, how could we close the gaps?

139
New Investor Website
29
Using a enhanced investor website, the Internet presents a pathway for collapsing the disclosure cycle
from bi-monthly or less often, to potentially real time
What do we mean by “Real Time Disclosure”?
Dynamically updating Massachusetts financial indicators (revenues, spending, cash flow, etc)
Dynamically updating economic indicators (employment, jobs, GDP, etc)
Analytically accessible numeric data
Provide data such that investors have the ability to:
Drag individual data series to their desktops for viewing and analysis
Download entire data tables
Monitor Massachusetts tables in Excel worksheets, with dynamic updating
Pull current Massachusetts data into investors’ proprietary internal systems
What would this require?
Continuous information flows from state reporting units to a central disclosure platform – in
Massachusetts’ case, a dedicated set of pages on its new investor website
Dedicated pages would feature all of the data points and tables current presented in the state’s
Information Statement and Quarterly Economic Statistical Report
And ultimately, continuous information flows from the state’s investor website to the desktops of credit
analysts and portfolio managers at major investment firms
2012 Massachusetts Investor Conference

140
New Investor Website
2012 Massachusetts Investor Conference
What would this look like?
Continuously updating disclosure data on the Commonwealth’s investor website
As an example, a monthly tax revenue table from the state’s Information Statement

141
New Investor Website
2012 Massachusetts Investor Conference
• Each line on the table would be interactive, with one click on a data point leading an investor to the data
source (website of the source of the original data) or to a pop-up window showing some kind of trend
analysis
• Transforms the table of data into one that provides instant trend analysis or historical perspective

142
New Investor Website
3
• Working with our website programmers, we’d like to allow investors to select from the hundreds of
different tables and data points to highlight the ones that are most important to their analysis
• Drag and drop the selected data to their own desktop
2012 Massachusetts Investor Conference

143
New Investor Website
3
• This feature would allow an investor to receive continuous data updates in real time being delivered right
to their desk top
• We think features like this, on a dedicated website, closes the information gaps that might normally exist
and addresses the timeliness, format and frequency objectives
2012 Massachusetts Investor Conference

144
2012 Massachusetts Investor Conference
2013 Market Outlook
Municipal Market Advisors:
Tom Doe, CEO and Founder
Presented by:

145
MMA The Power of Independence
MUNICIPAL MARKET OUTLOOK: 2013
Thomas G. Doe, Founder and CEO
www. mma-research.com
Municipal Market Advisors, Inc. December 13, 2012
75 Main St. Concord, MA 01742
978-287-0014

146
MMA The Power of Independence
Municipal market has been historically driven by the demand component.
Illiquidity and limited price discovery have been masked in the strong market.
The legacy of Meredith Whitney has continued to shape the public coverage
and perception of risk; as well as investor and regulator behavior.
MMA’s greatest concern is the next period of illiquidity and the adverse
consequences to investors and more importantly to issuers.
The discussion regarding the continued exemption of municipal bonds must be
focused on how capital will be made accessible for infrastructure projects that
create jobs, and a better US economy and society.

147
MMA The Power of Independence
$1,750
$624
$353 $330 $272
$0
$200
$400
$600
$800
$1,000
$1,200
$1,400
$1,600
$1,800
$2,000
Households Mutual Funds Banks Prop/Cas. Ins. Money Funds
$B
's
Ownership of Municipal Bonds by Investor Segment$ Outstanding ($B) as of 3Q12

148
MMA The Power of Independence
$ Qtr % Qtr % Ann
Households 1,891 51.0% 1,816 48.7% 1,750 47.1% (66) -4% -7%
Money Funds 292 7.9% 272 7.3% 272 7.3% (0) 0% -7%
Mutual Funds 535 14.4% 596 16.0% 624 16.8% 28 5% 17%
Closed End Fds 80 2.2% 84 2.2% 85 2.3% 1 1% 6%
Non-Fin. Cos. 20 0.5% 21 0.6% 21 0.6% 1 2% 7%
Banks 287 7.7% 330 8.8% 353 9.5% 23 7% 23%
Broker Dealers 37 1.0% 31 0.8% 29 0.8% (2) -7% -21%
Prop/Cas. Ins. 328 8.9% 330 8.8% 330 8.9% 1 0% 1%
Life Insurers 120 3.2% 121 3.2% 122 3.3% 1 1% 2%
GSEs and Gov'ts 22 0.6% 19 0.5% 18 0.5% (1) -7% -18%
Foreign Buyers 80 2.1% 89 2.4% 92 2.5% 3 3% 15%
Total 3,708 100% 3,733 100% 3,720 100% (13) 0% 0%
Ownership of Municipal Bonds by Investor Segment
Investor
Segment
$ Outstanding ($Bn) Change
3q11 2q12 3q12

149
MMA The Power of Independence
2 to 5 5 to 10 10 to 20 20 to 30
1/20/11 113 151 139 15
11/30/12 34 85 75 37
60-day Avg. 40 102 80 38
'11 - '12 Avg. 67 119 110 36
0
40
80
120
160
Bas
is P
oin
tsMMA 5% Curve Slope Comparison (Bps)
1/20/11 11/30/12 60-day Avg. '11 - '12 Avg.

150
MMA The Power of Independence
2 Year 5 Year10
Year15
Year20
Year25
Year30
Year
Average TRR (through lastyear end)
4.03% 5.17% 6.55% 7.48% 8.00% 8.31% 8.49%
2012 0.53% 2.13% 5.40% 8.38% 10.96% 12.03% 11.90%
0%
5%
10%
15%
TRR
%MMA Total Rate of Return (TRR)
2012 v. Average ('83-'11) - as of November 2012
Average TRR (through last year end) 2012

151
MMA The Power of Independence
0
20
40
60
80
100
120
140
160
80 82 84 86 88 90 92 94 96 98 00 02 04 06 08 10 12
Bas
is P
oin
ts
Bond Buyer Revenue vs. G.O. Spread (bps) January, 1980 - December, 2012

152
MMA The Power of Independence
0.02.04.06.08.0
10.012.014.016.018.020.0
MU
B
NYF
CM
F
SUB
PW
Z
PZA PZT PV
I
TFI
INY
SHM
CX
A
VR
D
SMB
ITM
MLN
HYD
PR
B
TRR
(%
)
Municipal ETF Performance (%): 2012 YTD
iShares (Maroon) ; Powershares (Green); Nuveen (Blue) Van Eck (Gray) Source: Bloomberg
HYD AUM > 150% YTD

153
MMA The Power of Independence
-40
-20
0
20
40
60
80
Jul-07 May-08 Mar-09 Dec-09 Oct-10 Jul-11 May-12
Bas
is P
oin
t Sp
read
MMA Municipal Value Index Indicative 10-yr Spread:Evaluated Barclay Index vs. MMA Median
July, '07 - November '12 (Average: 8bps, Last: -22bps)
VALUE for Investors
Opportunity for Issuers

154
MMA The Power of Independence
1.501.62
0.42
0.020.00
0.50
1.00
1.50
2.00
MMA 5% 10-Yr Treasury 10-Yr
Yie
ld %
Current Municipal & Treasury 10-Year Yields vs. Yield Objectives to Attain Breakeven After Average
Historical Correction
Current Breakeven Yield

155
MMA The Power of Independence
-1%
29%
-1%
-19%
5%
-19%-7%
-27%
$277
$178
$206
$283
$394 $389$421
$294$350
$0
$100
$200
$300
$400
$500
$600
-40.0%
-20.0%
0.0%
20.0%
40.0%
60.0%
80.0%
Avg A
nn
ual Issu
ance
$B
's
De
cem
be
r vs
. No
vem
be
r C
han
ge %
December vs. November Issuance Change vs. Annual Total Issuance (By Era of Demand)
December vs. November
Annual Average

156
MMA The Power of Independence
Period 2012 ($B's) 2011 ($B's) Difference (%)
Nov $32.1 $14.0 128.7%
Dec $35.8 $21.1 69.9%
Period 2013 ($B's) 2012 ($B's) Difference (%)
1Q $55.0 $74.4 -26.1%
Source: IDC
Difference in Municipal Reinvestment (No Coupons)

157
MMA The Power of Independence
High-grade (i.e. AAA) benchmarks and transactions in both primary and
secondary markets exert inordinate amount of influence on all evaluations
and market perception of value.
A small number of participants can influence price discovery as the universe
of firms providing liquidity and remaining consistently active in both
primary and secondary has become more concentrated.
Regulators have the resources to monitor all dealer activity to note irregular
behavior that can potentially distort evaluations and disrupt liquidity.
Investors can misinterpret liquidity/volatility as default risk.

158
MMA The Power of Independence
54.4%
19.5%
8.8% 7.9% 9.4%
0.0%
10.0%
20.0%
30.0%
40.0%
50.0%
60.0%
1 to 5 6 to 10 11 to 20 21 to 40 40+
% o
f P
ar
Distribution of Customer Trades by Number of Dealer Firms: 2011
(% based on par amount)
% of Par Source: MSRB

159
MMA The Power of Independence
90%
3%7%
Breakdown of Outstanding Municipals (%)
Investment Grade from atLeast One Agency
Below Investment Grade
Unrated
Source: Bloomberg

160
MMA The Power of Independence
7.80
8.20
8.60
9.00
9.40
9.80
10.20
3.70
4.00
4.30
4.60
4.90
5.20
5.50
10/15 11/9 12/4 12/29 1/23 2/17 3/14
OH
To
ba
cco Y
ield
(%)
Be
nch
ma
rk Y
ield
s (%
)
MMA Benchmark 30-Yr Yields &OH Tobacco's 5 7/8 '47
MMA 5% MMA Par OH Tobacco (118217au2)
S&P tobaccodowngrade 11/12
Whitney on CBS
MMA on CNBC

161
MMA The Power of Independence
Date MMA 30yr 5% Par (M's) Trades High Low Average
11/8/2010 3.98 85 5 8.10 7.70 7.80
11/9/2010 4.10 14455 17 8.18 7.70 7.91
11/10/2010 4.16 1035 16 8.24 7.70 7.90
11/12/2010 4.21 15550 7 8.80 7.99 8.58
11/15/2010 4.33 17905 7 8.95 8.41 8.71
11/16/2010 4.44 455 4 9.09 8.63 8.83
Ohio Buckeyes 5.875 '47

162
MMA The Power of Independence
0.92
0.97
1.02
1.07
1.12
-$6.0
-$4.0
-$2.0
$0.0
$2.0
Dec-10 May-11 Nov-11 Apr-12 Oct-12
MM
A G
M Fu
nd
Ind
exIn
flo
ws
$B
's
ICI Weekly Municipal Mutual Fund Net Inflows ($B) vs. MMAGeneral Municipal Fund Price index
Net Inflows GM Mutual Fund Price Index

163
MMA The Power of Independence
12154 55
336 331
90
177
109
30
14796
47
159
4.00
6.00
8.00
10.00
12.00
0
100
200
300
400
Yield (%)B
asis
Po
ints
Municipal Yield Change and High Yield Level During Periods of Adversity & Illiquidity: Bond Buyer 20 GO Index
Change (bps) Yield High (%)Source: Bond Buyer, MMA

164
MMA The Power of Independence
Sector NOV All Notices DEFAULT Support Other
ALL $3,371 (87) $46,375 (698) $11,707 (373) $24,989 (209) $9,679 (116)
IDB $313 (2) $5,571 (53) $4,385 (29) $673 (15) $512 (9)
Land Secured $930 (55) $4,794 (289) $3,297 (181) $1,181 (91) $316 (17)
Toll Road/Transit none $3,677 (3) $90 (1) $1,339 (1) $2,249 (1)
Local Housing $26 (6) $712 (61) $554 (47) $76 (8) $82 (6)
Retirement $411 (7) $1,738 (67) $425 (28) $270 (12) $1,043 (27)
Hospital $87 (4) $848 (29) $412 (14) $259 (4) $178 (11)
Hotel $8 (1) $820 (13) $346 (7) $377 (5) $98 (1)
Other Risky Sectors $210 (4) $21,329 (134) $2,133 (59) $15,359 (54) $3,837 (21)
Safe Sectors (GO, Non-Go, Wtr, etc) $3,885 (83) $6,884 (49) $65 (7) $5,455 (19) $1,364 (23)
Initially Non-Rated Bonds $1,658 (75) $14,187 (518) $9,487 (323) $2,727 (129) $1,973 (66)
Initially Insured/LOC Bonds $1,333 (5) $20,144 (80) $94 (6) $14,471 (53) $5,579 (21)
Initially Rated, Uninsured Bonds $380 (7) $11,388 (71) $1,592 (23) $7,727 (25) $2,069 (23)
Par (and #) of Outstanding Muni Bonds With an Uncured Default, Reserve Draw, or Other Impairment ($MM)

165
MMA The Power of Independence
$24 $27 $29
$32 $36
$39 $43 $43
$53 $58
$61 $67
$70
$0
$10
$20
$30
$40
$50
$60
$70
$80
2000 2001 2002 2003 2004 2005 2006 2007 2008 2009 2010 2011 2012
Puerto Rico: Total Outstanding Debt

166
Federal Government Policies Loom over the Municipal Market
Bipartisan tax reform and deficit reduction discussion is omnipresent for the
first time since 1986 tax reform.
Office of Management & Budget (OMB) released a report noting that BAB
subsidies would be part of the automatic cuts to take effect if Congress
does not find a solution to avoid the “sequestration.”
• If the BABs subsidy has been targeted, it is reasonable to assume that
a hypothetical, parameter-limited tax-exemption would be as well.
• Altering BABs subsidy contributed to mobilizing issuer groups to
defend exemption: NAST, NGA & GFOA.
Federal tax-exemption for municipal bonds as a deficit-reduction tool has
been proposed.
Democrats philosophically have disdain for exemption; Republicans are
ambivalent to the extent that tax-reform is a larger goal.

167
MMA continues to see the President’s plan of diluting the after-tax value of
most tax preferences to an effective tax rate of 28% most likely to develop
– but time is short relative to the broad resistance to it.
• This would achieve the goals of “broadening the tax base” and
increasing taxes on the 1% while softening the direct blow on various
stakeholders.
• Some Republican Committee staffers have indicated that Republicans
would support such a move in negotiations and have even called it
“reasonable.”
168
2012 Massachusetts Investor Conference
15 Minute Break

169
2012 Massachusetts Investor Conference
Massachusetts Department of
Transportation
Massachusetts Department of Transportation:
Dana Levenson, Chief Financial Officer
Presented by:

170
Massachusetts Department
of Transportation and the
Massachusetts Bay
Transportation Authority
Debt Service, Credit Ratings, and
Operating Results
Presented by:
Dana R. Levenson
Chief Financial Officer
2012 Massachusetts Investor Conference

171
MassDOT Chief Financial Officer, Dana R. Levenson Dana Levenson has been the Chief Financial Officer of the Massachusetts Department of Transportation since November 2011. He has oversight
over the financial matters of the four operating divisions of MassDOT: Aeronautics, Highways, Rail and Transit Division, and Registry of Motor
Vehicles.
Most recently, he spent four years at The Royal Bank of Scotland as Managing Director in charge of the firm’s infrastructure banking business in the
Americas. In this capacity, he lead the effort either: a) advising investors in large infrastructure assets of the most effective financing tools available
and arranging the financing; or b) advising sellers of infrastructure assets as to methodologies to maximize value. Investors included global private
equity sponsor funds, pension funds and international construction/concession companies; sellers included state and local governments and private
corporations. Infrastructure assets transacted included: Airports, Harbors/Marinas, Lotteries, On- and Off-Street Parking Systems, Ports, Renewable
& Contracted Power, Toll Roads & Bridges as well as social infrastructure such as Courthouses, Jails, Hospitals, and Schools, with geographic
coverage: extending to Brazil, Canada, Mexico, and the U.S. Transaction sizes ranged from $200 million to $10+ billion.
Prior to joining RBS, Levenson was the City of Chicago’s Chief Financial Officer from 2004 to 2007 with responsibility for the City Comptroller’s
Office, the Departments of Budget and Management, Procurement Services, and the Department of Revenue. In particular, he was responsible for
the long-term lease concession sales of both the Chicago Skyway for $1.83 billion in 2005 and the Chicago Downtown Parking System in 2006 for
$563 million. He also led the effort to raise the City’s bond ratings to their highest levels since 1978.
While at RBS, Levenson suggested to Mayor Richard M, Daley that a bi-partisan commission be established to study the City of Chicago’s pensions,
with the intention of supplying a solution to correct the under-funded status of the City’s retirement plans. The result was the report of the
Commission to Strengthen Chicago’s Pensions, which Levenson co-chaired, which was released in March, 2010.
Before joining the City of Chicago, Levenson was a Managing Director with Bank One in Chicago and with Bank of America in both Chicago and
London. Prior to that, he spent more than 11 years at Kidder, Peabody in New York City, eventually running its Fixed-Income Syndicate
Desk. Levenson began his career in New York at Chemical Bank.
Levenson received his M.B.A. from New York University in 1985 and his B.A., with honors, in European History from Brown University in 1979. He is
a past president of the Investment Association of New York and a former Governor of the Bond Club of New York. He served on the boards of the
Chicago Low Income Housing Trust Fund and La Rabida Children’s Hospital and remains active on the boards of the Spertus Institute of Jewish
Studies, the Massachusetts Symphony Orchestra, and Worcester (MA) Academy. Levenson has also co-chaired the Chicago Gun-Turn-In and was
a Commissioner of the National Surface Transportation Infrastructure Finance Commission as appointed by U.S. Department of Transportation
Secretary Mary Peters.
2012 Massachusetts Investor Conference

172
MassDOT – Authorizing Legislation MassDOT was established by Chapter 25 of the Acts of 2009 of the Commonwealth of
Massachusetts known as the Transportation Reform Act
The purpose of the Transportation Reform Act is to develop a comprehensive, multi-modal, long-range transportation finance plan for the Commonwealth of Massachusetts that addresses both fiscal issues and future transportation services
MassDOT is comprised of: the Highway Division, the Rail and Transit Division, the Aeronautics Division and the Registry of Motor Vehicles. MassDOT is governed by the Secretary of Transportation, Richard A. Davey, and a seven-member board appointed by the Governor of Massachusetts, Deval L. Patrick.
Accomplishments:
MassDOT refunded $109 million of outstanding Western Turnpike fixed rate debt in 2011 and achieved net present value savings of $9.4 million
MassDOT refunded $2.0 billion of outstanding Metropolitan Highway System fixed and variable rate debt in 2010 and achieved net present value savings of $54 million
MassDOT received an upgrade from Standard & Poor’s in October 2012 on the Metropolitan Highway System Senior Bonds to A+ from A. The outlook is stable
2012 Massachusetts Investor Conference

173
Amount Outstanding Final Average
METROPOLITAN HIGHWAY SYSTEM: Bonds Financing Issued Principal Moody's S&P Fitch Maturity Coupon
1997 Series A Cap. Appreciation Bonds Senior Bonds Fixed Rate $ 42,006,617 $ 42,006,617 A3 A+ A+ January 1, 2029 5.618%
1997 Series C Cap. Appreciation Bonds Senior Bonds Fixed Rate $ 89,136,006 $ 89,136,006 A3 A+ A+ January 1, 2023 5.491%
2010 Series B Refunding Bonds Senior Bonds Fixed Rate $ 882,310,000 $ 848,990,000 A3 A+ A+ January 1, 2037 4.975%
2010 Series B Refunding Bonds Subordinated Bonds Fixed Rate $ 261,220,000 $ 261,220,000 Aa2 AA+ AA January 1, 2035 4.981%
2010 Series A-1 Refunding Bonds Senior Bonds Variable Rate 100,000,000 100,000,000 A1 / VMIG2 AAA / A-1 AA / F1 January 1, 2037 VR
2010 Series A-2 Refunding Bonds Senior Bonds Variable Rate 107,665,000 107,665,000 Aa1/ VMIG1 AAA / A-1+ AA+ / F1+ January 1, 2037 VR
$ 207,665,000 $ 207,665,000
2010 Series A-1 / A-7 Refunding Bonds Subordinated Bonds Variable Rate 592,335,000 592,335,000 Aa2 / VMIG1 AA+ / A-1 AA / F1+ January 1, 2039 VR
$ 2,074,672,623 $ 2,041,352,623
WESTERN TURNPIKE SYSTEM:
2011 Series A & B Refunding Bonds Senior Bonds Fixed Rate 90,110,000 90,110,000 Aa3 Not Rated AA- January 1, 2017 2.233%
Total $ 2,164,782,623 $ 2,131,462,623
N.B.: All ratings by each of the three ratings agencies for all bonds that are the obligation of MassDOT (above) are designated as "Stable."
Massachusetts Department of Transportation – Outstanding Debt as of December 1, 2012
2012 Massachusetts Investor Conference

174
MassDOT : Operating Results & Operating Revenue
MassDOT
MassDOT 1st Quarter
FY2012 FY2013
Total Revenues $ 741,657 $ 288,938
Operating Expenses $ 475,905 $ 173,538
Debt Service Expenses $ 152,820 $ 47,542
Total Expenses $ 628,725 $ 221,080
Excess Revenues / (Expenses) $ 112,932 $ 67,858
Operating Results ($000s = Millions)
($000s = Thousands)
2012 Massachusetts Investor Conference

175
MBTA – Authorizing Legislation
In November 1999, the Commonwealth enacted legislation to forward fund the MBTA as of July 1, 2000
This change in funding MBTA’s operations differs from the previous process, in which the Commonwealth financed the MBTA’s operating losses typically 18 months after the close of the fiscal year on a net cost-of-service basis
The enabling legislation replaced the net cost-of-service payment with two dedicated revenue streams:
Annual assessments levied on municipalities in the MBTA service area, which will be used primarily to pay debt service on assessment bonds. The assessments are guaranteed to equal approximately $136 million annually by legislation and, as per the statute, will escalate annually at the lesser of the previous year’s inflation rate or 2.5%
A carving out of 1% of the existing 6.25% statewide sales tax, which is pledged first to bonds and then used for operations of the MBTA. The act provides that the 1% dedicated sales tax must be equal to the greater of the amount raised by a 1% statewide sales tax or a floor (base revenue amount) of $767 million (FY 2010), and is subject to upward adjustment under certain circumstances
2012 Massachusetts Investor Conference

176
MBTA – Accomplishments
Operational:
MBTA ridership increasing significantly over the past year
MBTA Board approved the first fare increase since 2007 of 23% and modest reductions in
service beginning July 1, 2012
Integration of RTAs & other transit modes on the Charlie Card; supporting the interoperability of
transportation in the Commonwealth
Financial :
Over last decade, growth in Transit-Oriented Development projects: sale or lease of rights for
over 50 development projects and significant expansion of non-fare revenue initiatives (parking,
advertising, and lease of North Station)
MBTA continues to invest in and maintain core assets; % of funds allocated in CIP for State of
Good Repair projects increased from 63% in 1993 to 95% in 2012
Approximately 85% of MBTA’s outstanding debt is fixed rate, ensuring budget certainty, with a
small percentage of variable rate debt that provides some diversity and flexibility. Managing and
maintaining a conservative debt profile has supported MBTA’s strong credit ratings, preserved its
access to the financial markets despite volatility in the marketplace since the 2008 collapse of
Lehman Brothers, and allowed MBTA to consistently achieve a very low cost of capital over the
years.
2012 Massachusetts Investor Conference

177
Massachusetts Bay Transportation Authority – Outstanding Debt as of December 1, 2012
Amount Outstanding Final Average
Financing Issued Principal Moody's S&P Fitch Maturity Coupon
MBTA Bonds:
General Transportation System Bonds Fixed Rate $ 1,915,470,000 $ 295,445,000 Aa1 AA+ AA+ March 1, 2022 5.714%
General Transportation System Bonds Variable Rate 266,388,000 199,255,000 Aa1/VMIG1 AA+/A-1+ AA+/F1+ March 1, 2030 VR
Boston Metropolitan District (BMD) Fixed Rate 17,515,000 6,080,000 Aa1 N/A N/A December 1, 2014 5.156%
Sales Tax Bonds Fixed Rate 3,558,964,760 3,030,556,178 Aa2 AAA N/A July 1, 2037 4.941%
Sales Tax Bonds Variable Rate 256,375,000 254,925,000 Aa2/VMIG1 AAA/A-1 N/A July 1, 2026 VR
Assessment Bonds Fixed Rate 1,757,425,000 872,215,000 Aa1 AAA N/A July 1, 2035 4.846%
Mass Bay Transit Parking Bonds Fixed Rate 304,585,000 304,585,000 A1 A+ N/A July 1, 2041 4.731%
Revenue Build America (BABs): Fixed Rate 428,300,000 428,300,000 Aa2 AAA N/A July 1, 2040 5.216%
Commercial Paper Variable Rate 250,000,000 93,375,000 P-1 A-1+ N/A February 28, 2024 VR
Total $ 8,755,022,760 $ 5,484,736,178
2012 Massachusetts Investor Conference

178
MBTA : Operating Results & Ridership
MBTA
MBTA 1st Quarter
FY2012 FY2013
Total Revenues $ 1,657,346 $ 447,276
Operating Expenses $ 1,292,577 $ 326,095
Debt Service Expenses $ 362,606 $ 109,110
Total Expenses $ 1,655,183 $ 435,205
Excess Revenues / (Expenses) $ 2,163 $ 12,071
Operating Results (000s = Millions)
($000s = Thousands)
2012 Massachusetts Investor Conference

179
MassDOT Contact Information:
Contact: Title: Phone Number: Email Address:
Dana R. Levenson Chief Financial Officer - MassDOT 857 - 368 - 9130 [email protected]
Elizabeth A. Pellegrini Treasurer - MassDOT 857 - 368 - 9127 [email protected]
Kathleen J. Doyle Finance - MassDOT 857 - 368 - 9159 [email protected]
John E. Belliveau Finance - MassDOT 857 - 368 - 9161 [email protected]
MBTA Contact Information:
Contact: Title: Phone Number: Email Address:
Jonathan R. Davis Acting Administrator, Rail & Transit Division 617 - 222 - 4246 [email protected]
Laura M. Guadagno Director, Compliance & Reporting - MBTA 617 - 222 - 4775 [email protected]
2012 Massachusetts Investor Conference

180
2012 Massachusetts Investor Conference
Massachusetts Port Authority
Massachusetts Port Authority:
John Pranckevicius, Chief Financial Officer
Betsy Taylor, Director of Finance and Treasury
Presented by:

181
Overview of Massport’s Presentation
1. Massport’s Organizational Structure
2. Business Plan Activities and Operating Profile
3. FY 13 Operating Budget
4. Debt Structure & Ratings
5. Debt Policy & Metrics supporting strong credit ratings
2012 Massachusetts Investor Conference

182
Massachusetts Port Authority Overview • Massport’s owns and operates Logan International Airport, Hanscom and
Worcester Airports, Maritime Properties, South Boston Real Estate, and other real
estate holdings.
• Massport Port Authority is an economic engine for the Commonwealth with over
$9.0 billion in economic activity is generated for the region with about 20,000
employees employed by our facilities and a total of 100,000 jobs connected to our
business activities.
• Massport is governed by a seven member board; Secretary of Transportation and
six Governor appointed members with staggered seven year terms each.
• Massport’s new CEO, Thomas P. Glynn, was appointed September 2012
Tom is a seasoned executive with over 40 years of experience
- Chief Operating Officer, Partners HealthCare for 14 years
- Deputy U.S. Labor Secretary in the Clinton Administration, 1993 to 1996
- Sr. Vice President Finance and Administration, Brown University, early 1990s
- General Manager of the MBTA, appointed in 1989
- Deputy Commissioner of MA Dept. of Public Welfare, during mid 1980s
- Lecturer in Public Policy at Harvard Kennedy Schools of Government
6 2012 Massachusetts Investor Conference

183
Massport’s Business activity is stable 1. Logan International Airport
• 29.3 million passengers served in FY 12, up 3.2% over last year.
• 4.8 M Rental Car transaction days generated, up nearly 10%.
• PFC revenues are 1.3% higher than a year ago.
• JetBlue is Logan’s most popular airline with 24% market share, Delta, American and US Airways have around 11% market share each.
• 1% overall passenger growth expected in FY 13. Japan Airlines fueling International passenger growth, while domestic traffic expected to be stable.
• Parking exits expected to be slightly lower, however overall parking revenues expected to increase due to change in daily parking rate increase.
2. Hanscom Airport is growing with over 100,000 sq ft of additional hangar space sized for global reach aircraft to service MA aviation market.
3. Maritime Business Operations
• 380,000 cruise passengers serviced at CruisePort Boston with 117 ships using our newly renovated Black Falcon terminal.
• 107,000 containers serviced at Conley Terminal in FY 12, equal to FY 11, with volumes trending higher for the first four months.
• 3.8 million square feet of commercial real estate mostly in South Boston generates about $16 million in revenue annually.
2012 Massachusetts Investor Conference

184
29.3 million passengers
Used Logan International Airport in
FY 12
2.6 million vehicles
parked at Logan facilities
in last 12 months
Logan’s business is stable as economic challenges remain and airlines
consolidate their operations
-9.5%
-4.6%
6.0%
7.3%
5.03%
11.1%
6.5%6.8%
11.0%
8.3%7.6%
11.3%
7.2%5.2%
-0.9%
2.1%3.7%
6.0%
9.5%
1.5%0.1%
1.1%0.1%
-3.0%
-20.0%
-15.0%
-10.0%
-5.0%
0.0%
5.0%
10.0%
15.0%
No
v-0
8D
ec-
08
Jan
-09
Fe
b-0
9M
ar-
09
Ap
r-0
9M
ay
-09
Jun
-09
Jul-
09
Au
g-0
9S
ep
-09
Oct-
09
No
v-0
9D
ec-
09
Jan
-10
Fe
b-1
0M
ar-
10
Ap
r-1
0M
ay
-10
Jun
-10
Jul-
10
Au
g-1
0S
ep
-10
Oct-
10
No
v-1
0D
ec-
10
Jan
-11
Fe
b-1
1M
ar-
11
Ap
r-1
1M
ay
-11
Jun
-11
Jul-
11
Au
g-1
1S
ep
-11
Oct-
11
No
v-1
1D
ec-
11
Jan
-12
Fe
b-1
2M
ar-
12
Ap
r-1
2M
ay
-12
Jun
-12
Jul-
12
Au
g-1
2S
ep
-12
Oct-
12
37 months of growth
year over year comparison
-9.0%-9.3%
3.1%3.4%
9.69%
5.5%
14.7%
10.7%
8.0%
12.2%
9.6%
5.8%6.8%
10.9%
8.2%
8.9%
3.8%4.5%
4.1%
9.0%
14.9%
11.5%
3.0%
15.0%
4.6%
8.6%
-15.0%
-10.0%
-5.0%
0.0%
5.0%
10.0%
15.0%
20.0%
No
v-0
8D
ec-0
8Ja
n-0
9F
eb
-09
Ma
r-0
9A
pr-0
9M
ay
-09
Jun
-09
Jul-
09
Au
g-0
9S
ep
-09
Oct-
09
No
v-0
9D
ec-0
9Ja
n-1
0F
eb
-10
Ma
r-1
0A
pr-1
0M
ay
-10
Jun
-10
Jul-
10
Au
g-1
0S
ep
-10
Oct-
10
No
v-1
0D
ec-1
0Ja
n-1
1F
eb
-11
Ma
r-1
1A
pr-1
1M
ay
-11
Jun
-11
Jul-
11
Au
g-1
1S
ep
-11
Oct-
11
No
v-1
1D
ec-1
1Ja
n-1
2F
eb
-12
Ma
r-1
2A
pr-1
2M
ay
-12
Jun
-12
Jul-
12
Au
g-1
2S
ep
-12
Oct-
12
Parking Revenue: 37 months of growth
year over year
Blue shaded boxes represents months with new parking rates in effect
2012 Massachusetts Investor Conference

185
Logan International Airport 10 Month Forecast of Scheduled Departures
Forecast in Green beginning from November 2012 Forward
Logan International Airport passenger activity expected to
increase in the second half of 2013
2012 Massachusetts Investor Conference

186
Logan continues to capture greater share of the total New England aviation
passengers
2012 Massachusetts Investor Conference

187
FY13 business plan maintains financial sustainability
Massport’s revenue expected to grow by 1.8%, to $578 M, a $10 M increase over FY12
- Logan revenue to rise 7.7%, or $35M on record passenger activity, increased parking revenues, concession sales, and rental car business.
- Maritime’s revenue of $70M is projected to be level with the FY 12 actuals. Suspension of COSCO’s Suez Canal service required $22M budget adjustment to be made for the year.
Total Massport operating expenses of $380M declined 1%, or $4.0M from FY 12 budget.
$198M million in operating earnings expected to be generated to invest in Massport’s facilities
– $101 million in debt service payments on $1.1 billion in general aviation bonds outstanding.
– $59.4 million dedicated to keep Massport assets in state of “good repair”
– $37.0 million for pay-go capital projects approved in the Authority’s capital program.
2012 Massachusetts Investor Conference

188
FY 13 net revenue funds bond obligations & the FY12-FY16 Capital Plan
In Million $ FY11 FY12 FY12 FY13
Actual Actual Budget BudgetOperating Revenues
Logan 455,699 474,514 457,330 492,648 35,318 7.7%
Hanscom 9,371 9,984 9,415 9,703 288 3.1%
Worcester 911 1,269 898 599 (299) -33.3%
Maritime 70,709 74,030 91,676 69,940 (21,736) -23.7%
Investment Income 8,340 6,695 8,060 4,735 (3,325) -41.3%
Total Operating Revenues 545,030 566,492 567,379 577,625 10,246 1.8%Operating Expenses
Logan 268,632 267,573 286,081 294,684 8,603 3.0%
Hanscom 9,786 8,287 9,174 9,900 726 7.9%
Worcester 5,142 5,177 5,578 5,250 (328) -5.9%
Maritime 70,714 71,635 83,567 70,566 (13,001) -15.6%
Total Operating Expenses 354,274 352,672 384,400 380,400 (4,000) -1.0%
Contribution Margin 190,756 213,820 182,979 197,225 14,245 7.8%
% Contribution Margin 35.0% 37.7% 32.2% 34.1%
FY12 Budget vs
FY11 Budget
2012 Massachusetts Investor Conference

189
FY12-16 Capital funding is diverse with 36% from internally generated funds
Massport is investing over $1.1 Billion into its Infrastructure and the Economy
Maintenance Reserve Fund, $ 256 M
Revenue Bonds,$144 M
Improvement & Extension Fund, $142 M
Customer Facility Chage (Conrac) $233 M
Federal & State Grants, $ 195 M
Passenger Facility Charges, $130 M
2012 Massachusetts Investor Conference
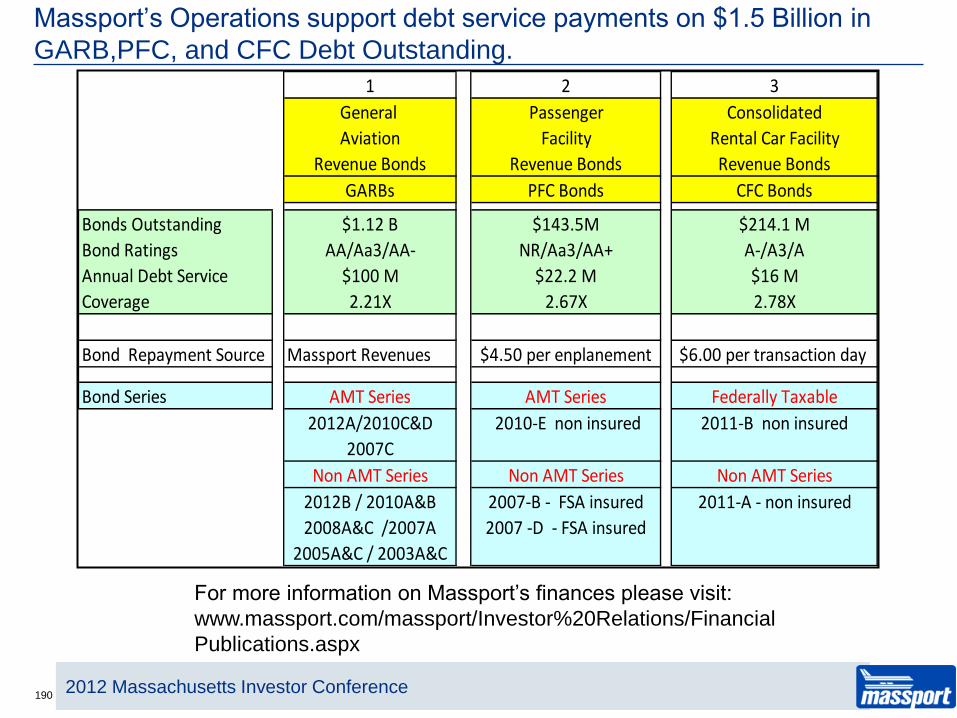
190
Massport’s Operations support debt service payments on $1.5 Billion in
GARB,PFC, and CFC Debt Outstanding.
1 2 3
General Passenger Consolidated
Aviation Facility Rental Car Facility
Revenue Bonds Revenue Bonds Revenue Bonds
GARBs PFC Bonds CFC Bonds
Bonds Outstanding $1.12 B $143.5M $214.1 M
Bond Ratings AA/Aa3/AA- NR/Aa3/AA+ A-/A3/A
Annual Debt Service $100 M $22.2 M $16 M
Coverage 2.21X 2.67X 2.78X
Bond Repayment Source Massport Revenues $4.50 per enplanement $6.00 per transaction day
Bond Series AMT Series AMT Series Federally Taxable
2012A/2010C&D 2010-E non insured 2011-B non insured
2007C
Non AMT Series Non AMT Series Non AMT Series
2012B / 2010A&B 2007-B - FSA insured 2011-A - non insured
2008A&C /2007A 2007 -D - FSA insured
2005A&C / 2003A&C
For more information on Massport’s finances please visit:
www.massport.com/massport/Investor%20Relations/Financial
Publications.aspx
2012 Massachusetts Investor Conference

191
Massport has Conservative Debt Structure and High Bond Ratings
$0
$20
$40
$60
$80
$100
$120
$140
2011 2013 2015 2017 2019 2021 2023 2025 2027 2029 2031 2033 2035 2037 2039
Mil
lio
ns
General Aiport Revenue Bonds
General Aviation Revenue Bonds
• Credit Rating: Aa3/AA-/AA
ratings
• $1.3 Billion in GARB debt
outstanding
• 90%/10% fixed rate v. variable
• No swaps or swaptions
ConRac Revenue Bonds
• $214 million total CFC debt
Issued
($58 M Tax Exempt / $156 M
taxable)
• Credit Rating: A/A3/A-
• Fixed Rate Debt
5.00
10.00
15.00
20.00
25.00
30.00
2011 2012 2013 2014 2015 2016
Forecasted
Actuals
Debt Service
2012 Massachusetts Investor Conference

192
Board approved Debt Policy establishes strong financial benchmarks to
maintain AA credit rating
• Board approved major financial targets to achieve fiscal policy objectives:
• At least 1.75x or greater debt service coverage in any given year,
with a goal to average 2.0x over the 5-year time frame
• At least 200 days cash on hand each year with the goal of attaining 250 days
• Operating ratio (operating and PILOT expenses/operating revenues) should be no more
than 70%.
• Bond financed non-aeronautical projects will generate revenues sufficient to meet
1.50X debt coverage, otherwise projects should be funded with pay-go capital
funds
• Bond financed aeronautical projects’ debt service and coverage included in Airline
Rates & Charges
• Board will review Debt Policy every two years to evaluate results and make
adjustments as required should bond rating agency criteria change, to maintain a
strong credit rating (Last reviewed March 2012).
2012 Massachusetts Investor Conference

193
Massport’s FY12-FY16 Capital Plan and FY13 Budget successfully support
key debt metrics
Massport's
Debt Policy FY11 FY12 FY13 FY14 FY15 FY16
Financial metrics Goals Actual Actual Budget Forecast Forecast Forecast
Debt Coverage 1.75 2.07 2.21 2.01 2.07 1.87 2.00
Contribution Margin ≥ 30% 35.0% 38.0% 32.0% 30.0% 29.7% 29.2%
Airline Cost/Enplaned Passenger - $14.52 $13.75 $14.30 $14.99 $15.41 $15.76
Operating Ratio ≤ 70% 65.0% 62.0% 68.0% 70.4% 70.7% 71.3%
Days Cash 200 328 343 330 283 264 279
Note: Operating ratio i s expenses with PILOT / divided by operating revenue.
2012 Massachusetts Investor Conference

194
Massport’s credit profile remains strong, business activity seems stable, and new
Leadership will drive organizational performance
1. Boston Logan International Airport serves a strong and diversified O&D market
• Logan Airport passenger growth exceeded 3.0% in FY 12. Passenger growth has slowed
in recent months due to business uncertainty (European Union, U.S. fiscal cliff, economy)
Hurricane Sandy, and consolidation of Airline capacity
• Logan Airport has the one of the highest percentages of local O&D traffic nationally –
<90% O&D
2. Logan Airport has significant airline diversity with strong growth in low cost carrier
service
• In FY12, 46% of Logan’s passengers flew JetBLue, Delta or US Airways
• All other carriers accounted for 54% of passenger traffic
• International Travel is being boosted by the addition of Japan Airlines
3. Manageable $1.0 billion capital program with modest plans for future GARB
borrowings ($100 M new money sale issued in August 2012).
4. Management continues to produce strong financial results with focus on business
line P&L’s and Debt Service coverage exceeding 2.0X
5. Massport maintains a conservative debt profile with emphasis on level debt
payments for GARB debt, PFC coverage remains healthy, and CFC revenue
collections exceeding original forecasts.
2012 Massachusetts Investor Conference

195
2012 Massachusetts Investor Conference
Updates to the EMMA System
Municipal Securities Rulemaking Board:
Justin Pica, Director, Product Management- Market Transparency
Ritta McLaughlin, Chief Education Officer
Presented by:

Commonwealth of Massachusetts
Investor Conference Continuing Disclosures
December 13, 2012
Boston, MA

197
Self-regulatory organization for municipal securities market
Protects investors and state and local governments
Regulates financial professionals
Operates the Electronic Municipal Market Access (EMMA®)
website at http://emma.msrb.org to provide transparency and support
a fair and efficient market
About the MSRB
Municipal Securities Rulemaking Board 197

198 1
9
8
MSRB FY 2013 Priorities
Review MSRB Rules
Advance Municipal Advisor Regulation
Improve Continuing Disclosure
Implement Long-Range Plan for Municipal Market Transparency

199 1
9
9
Review MSRB Rules
Re-examine MSRB rules for municipal securities dealers and
municipal advisors – Ensure ongoing relevance of rules to the market
– Improve consistency with the rules of other regulators
– Provide for the efficient operation of the municipal market
200 2
0
0
Advance Municipal Advisor Regulation
Establish a set of core rules and standards of professional
qualification for municipal advisors – Revise proposed draft rules following adoption of final SEC definition of “municipal advisor”
– Incorporate industry input into development of professional qualification exam

201 2
0
1
Improve Continuing Disclosure
Serve as a resource to help state and local governments
understand their disclosure obligations to investors and how to use
the Electronic Municipal Market Access (EMMA®) website to meet
those obligations
– Provide education and outreach to improve continuing disclosure practices
– Enhance the EMMA® website with improved portal for submission of continuing disclosures and issuer homepages and
alerts for integrated display and dissemination of information

202
Ensures that bondholders stay apprised of important developments
that could affect the value of their bonds
Enhances the bond issuer’s market competitiveness – prospective
investors value openness and transparency
Communication with current and prospective investors is facilitated
by the EMMA® website
Why Communicating with
Investors Matters
Municipal Securities Rulemaking Board 202

203
One of the key methods for communicating with investors is through
continuing disclosures
Continuing disclosures provide investors with ongoing information
about municipal securities
Timely and complete continuing disclosures help investors make
informed decisions about municipal securities
Communicating through
Continuing Disclosures
Municipal Securities Rulemaking Board 203

204
To submit continuing disclosures to EMMA Dataport, register with the
MSRB and create an account in MSRB Gateway
Organization Accounts
– Allow multiple staff within the organization to view and manage submissions of data
and disclosure documents to EMMA®
Video tutorials available in the
Online Training section of MSRB.org
– Submitting Continuing Disclosures
– Creating and Controlling Groups
Submitting Continuing Disclosure
to the EMMA Website
Municipal Securities Rulemaking Board 204

205
State and local governments can provide additional
information to market participants on a voluntary basis via
EMMA®, including:
– Pre-sale information such as preliminary official statements and
investor presentations
– Information about the timing of and accounting standard used to
prepare annual financials
– An investor website address
Voluntary Disclosure
Municipal Securities Rulemaking Board 205

206
The MSRB also is encouraging state and local governments to
voluntarily make available on EMMA® information about bank loan
financings
Potential investors may not be aware of bank loans incurred by a
state or local government or their impact on the municipal
government’s outstanding debt until the release of audited financial
statements
Voluntary disclosure through EMMA® would provide timely access to
this information for market participants
Voluntary Bank Loan Disclosure
Municipal Securities Rulemaking Board 206

207
State and Local Government Toolkit
– No-cost resource for state and local governments
– Designed for small to mid-sized issuers
– Includes videos, fact sheets and guides about the
process of issuing municipal bonds and using the
EMMA® website
– Provides details about EMMA® Trade Monitor
MSRB Resources for State
and Local Governments
Municipal Securities Rulemaking Board 207

208
EMMA® Trade Monitor
– Export trade data from the EMMA® website
to a desktop application for analysis of
secondary market trading activity
– Analyze the prices, yield and amount of
secondary market trade activity of municipal
bonds
– Help evaluate pricing for new issues
– Access with an MSRB Gateway
Organization Account
MSRB Resources for State
and Local Governments
Municipal Securities Rulemaking Board 208

209
MSRB Resources for Investors
Investor Toolkit
– Available on MSRB.org
– Provides investors with basic information
about navigating the municipal market
– Designed to help investors gain confidence
in their ability to evaluate, purchase and
monitor municipal bond investments, and
learn how to use EMMA®
Municipal Securities Rulemaking Board 209

210
Long Range Plan for Market
Transparency
– Roadmap for further development of
EMMA® as a tool for market
transparency
– Ensures EMMA® will remain aligned
with the needs of the municipal
market and responsive to changes
– Establishes vision for “EMMA 2.0”
Planned EMMA Enhancements
Municipal Securities Rulemaking Board 210

Commonwealth of Massachusetts
Investor Conference Continuing Disclosures
December 13, 2012
Boston, MA

EMMA Enhancements and
MSRB Long Range Plan for Market Transparency
Products
2012 Massachusetts Investor Conference
December 13, 2012

213
Electronic Municipal Market Access (EMMA®) Website
Serves as comprehensive, centralized source of information on the municipal
securities market
Promotes market transparency
Facilitates timely and complete submission of disclosure information
Launched in 2008
2
1
3
http://emma.msrb.org

214
EMMA® Website
2
1
4

215
EMMA® Website
2
1
5
EMMA provides:
– Official statements
– Advanced refunding documents
– Preliminary official statements
– Continuing disclosures
– Real-time transaction data
– Current interest rates for ARS and VRDOs
– Current credit ratings
– Market statistics

216
Recent Key Enhancements: Trade Data
February – Offered end-of-day email alerts
May – Added yield to display of inter-dealer trades to facilitate comparisons with customer trades
November – Raised from $1 – 5 MM the threshold for display of exact par values in real-time
November – Increased number of customer trades disseminated by building in a tolerance to P/Y check
2
1
6

217
Recent Key Enhancements: EMMA
February – Added disclosure details to alert emails and provided ability to select specific email alert categories
April – Established historical subscriptions to EMMA data
September – Improved access to and display of 529 Plans
September – Added monthly statistical data on new issuance volume to the market statistics page
October – Implemented overhauled advanced search
November – Introduced MyEMMA for managing alerts and saving advanced search criteria
2
1
7

218
Long Range Plan for MSRB Market Transparency Products
Roadmap for further development of EMMA as a tool for market
transparency
Ensures EMMA will remain aligned with the needs of the municipal
market and responsive to changes
Published in February 2012
2
1
8

219
Purpose of Long Range Plan
Guide the evolution of the MSRB’s market transparency products
Maximize transparency benefits for the protection of investors and state and local governments
Provide for the efficient allocation of MSRB resources
Solicit feedback from industry stakeholders
2
1
9

220
Elements of “EMMA 2.0”
• Enhanced search functionality
• Broadened alerts functionality
• Integrated display of information
• Expanded universe of information
• New user account options Improved submission portal
• Central transparency platform
2
2
0

221
EMMA 2.0 – Enhanced Search Functionality
• Improve plain English search capabilities
• Enable searches based on additional descriptive data criteria
• Provide for searches that utilize a combination of security
descriptive and market activity data
• Continued ability to access securities by CUSIP number
2
2
1

222
EMMA 2.0 – Expanded Universe of Information
• Enhance existing document or data collections
• Introduce new categories of information
– Information on upcoming new issues
– Access to NIIDS indicative data
– Primary or continuing disclosure documents in interactive data formats
– Conflict of interest disclosures for underwriters and municipal advisors
– Municipal derivatives disclosures, and more
2
2
2
223
EMMA 2.0 – Expanded Universe of Information
• Expand the breadth, depth and frequency of the statistical
information to provide a fuller understanding of:
– Current state of the market
– Market trends
– Key statistics from other markets
2
2
3

224
EMMA 2.0 – Integrated Display of Information
• Allow state government users to manage an individualized
homepage with information about state bond issues and
other relevant statewide disclosures
• Provide direct links to each state’s counties,
municipalities, agencies, authorities and districts
• Over time, add homepages for additional governmental
entities
2
2
4

225
EMMA 2.0 – New User Account Options
• MyEMMA - Manage personal preferences, save frequently used searches, create portfolios of securities to track through a
personal ticker, and more
• Free state and local government accounts - Access enhanced tools for analyzing data and disclosures, and more
• Professional Accounts - Provide data export services and access to value added information
2
2
5

226
EMMA 2.0 – Enhanced Collection Portal
Improve the process by which continuing disclosure documents are submitted to EMMA and made available to investors
MSRB to provide additional guidance to state and local governments to enhance their understanding of how to provide
annual financial disclosures for posting on EMMA
MSRB to provide guidance to investors on continuing disclosures expected to be available for specific categories of
municipal securities
2
2
6

227
EMMA 2.0 – Real-Time Central Transparency Platform
• Overhaul of Real-time Trade Reporting System (RTRS)
• Centralized venue providing public access to real-time pre
and post-trade pricing information across the municipal
market
• Integrate pricing information with the full library of disclosure
documents and information available on EMMA
2
2
7

EMMA Enhancements and
MSRB Long Range Plan for Market Transparency
Products
2012 Massachusetts Investor Conference
December 13, 2012

229
2012 Massachusetts Investor Conference
Massachusetts Development Finance Agency
(MassDevelopment)
MassDevelopment:
Steve Chilton, Senior Vice President - Investment Banking (Bond Issuance)
Presented by:

230
MassDevelopment
2012 Massachusetts Investor Conference
Overview of Presentation
• Overview of MassDevelopment
• Conduit Bonds
• Governmental Bonds
• I-Cubed and Other Infrastructure Programs

231
MassDevelopment – Overview
2012 Massachusetts Investor Conference
Who We Are
• State’s finance and development agency
• Promotes capital investment and economic development in Massachusetts by providing
financing and development solutions
• Financed or managed 280 projects generating investment of over $2.3 billion in the
Massachusetts economy in FY2012
• Formed in 1998 under Chapter 23G (Massachusetts General Laws) by the merger of
Massachusetts Industrial Finance Agency (created in 1978) and Government Land Bank
• Massachusetts Health and Educational Facilities Authority (Mass HEFA) merged into
MassDevelopment in October 2010
Primary tools
• Tax exempt (and taxable) bond issuance
• Lending
• Real estate planning and development

232
MassDevelopment – Overview
2012 Massachusetts Investor Conference __
Real Estate Development
• Provides real estate advice to municipalities
• Undertakes real estate development projects that would not have been completed by
the private sector alone including surplus public properties and closed military bases
• Redevelopment projects include Devens (former military base), 100 Cambridge Street
(former Saltonstall state office building in Boston), Village Hill Northampton (former
state hospital) and 1550 Main Street (former federal office building in Springfield)
• Bonds issued to finance 100 Cambridge Street, Devens Electric Utility System, and
various conduit borrowers
Lending
• Loans and loan participations
• Loan guarantees to banks
Tax Exempt (and Taxable) Bond issuance
• Conduit Bonds
• Governmental Bonds

233
MassDevelopment – Conduit Bonds
2012 Massachusetts Investor Conference __
Conduit Bond Issuance
• MassDevelopment issues conduit bonds for:
• Manufacturing (industrial development bonds)
• Environmental facilities
• 501(c)(3) non-profit borrowers (hospitals, colleges, schools, etc.)
• Affordable rental housing
• Infrastructure financings
• Around 100 bond issues a year; over $2.2 billion in FY2012 and $3.5 billion in FY2011.
• Issued as public bond issues, private placements and bank direct purchases as
determined by the conduit borrower.
• Housing bonds issued as unenhanced bonds, LOC backed bonds, and bonds supported
by federal government programs.
• Other bonds issued as unenhanced and credit enhanced issues.
• Conduit bonds are special obligations of the Agency – payable by Borrowers - not
general obligations of the Agency and not obligations of the Commonwealth
• Observed and Anticipated Trends in MassDevelopment Conduit Bond Issuance
• Public vs. Private
• Sectors (Infrastructure, Non-Profits, Rental Housing, Environmental, Manufacturing)

234
MassDevelopment – Governmental Bonds
__
Infrastructure Programs
MassDevelopment can issue bonds for infrastructure under 3 programs which were established in
recent years. Key difference in programs = “who pays”:
• Local Infrastructure Development Program (Chapter 23L)
• Property owner can finance public infrastructure improvements with tax-exempt bonds.
• Bonds issued by MassDevelopment and debt service is paid through a special
assessment on the property. Credit on bonds is based on the property owner and/or credit
enhancement.
• District Improvement Financing (“DIF”), called TIF in other states (Chapter 40Q)
• Public infrastructure improvements can be financed from local incremental property taxes.
• Bonds issued by municipality or MassDevelopment and may require credit support from
the municipality or the developer. Credit based upon incremental property taxes within
district.
• Infrastructure Investment Incentives Act (“I-Cubed”). Legislation last revised in Ch. 238 of the
Acts of 2012
• Program promotes public infrastructure improvements to support certified economic
development projects. Credit based upon State’s General Obligation.
2012 Massachusetts Investor Conference

235
MassDevelopment – I-Cubed
2012 Massachusetts Investor Conference __
Program Description
• Designed to increase economic activity in the Commonwealth by creating partnerships between the Commonwealth, MassDevelopment, a private developer and the host municipality.
• The program funds public infrastructure improvements for economic development projects that bring significant net new tax revenues to the Commonwealth.
• Project must be approved and certified by the Commonwealth after a rigorous review process including projected coverage of debt service by net new tax revenues of 1.5x.
• If net new tax revenues to the Commonwealth are less than debt service, then the municipality and/or the developer are required to make up the shortfall (to provide for the financing to at least be revenue neutral to the Commonwealth).
Security for Bonds
• MassDevelopment issues special obligation bonds secured by State Infrastructure Development Assistance for Debt Service.
• The Commonwealth’s obligation to pay the State Infrastructure Development Assistance for Debt Service is a General Obligation of the Commonwealth, for which its full faith and credit are pledged.
• Recent issue of interim taxable notes received Commonwealth ratings of Moody’s Aa1 and S&P AA+, based on the Commonwealth’s credit.

236
MassDevelopment – I-Cubed
Additional Program Details
• Program currently authorized to issue $325 million with approximately $150 million of public infrastructure improvements preliminarily approved.
• Anticipate first tax-exempt bond issue in 2013.
• Bonds typically expected to be between $10 million and $50 million.
• Maximum of 3 projects or 31% of the authorized program size may be issued in any municipality.
__

237
MassDevelopment – Governmental Bonds
2012 Massachusetts Investor Conference
Devens Electric System
• $8,145,000 Revenue Refunding Bonds issued in 2011; $7,805,000 outstanding (12/1/12).
• Financed the design, construction, installation and associated costs of capital
improvement to the Electric System at Devens.
• Payable solely from the Revenues of the Agency derived from the Electric System and
from certain other funds.
• 1.25 x Rate Covenant
M/SRBC Project (100 Cambridge Street Financing)
• $195,810,000 Revenue Bonds issued in 1992; $91,660,000 tax-exempt and $73,450,000
taxable bonds outstanding (12/1/12).
• Financed renovation of existing 22 story former state office building and garage as part of
a redevelopment, resulting in a mixed use office, residential and retail complex.
• Payable solely from the Revenues derived from ownership and operation of the Project.
• Baa2/BBB rating based on MBIA (National Public Finance Guarantee Corp.) insurance.

238
2012 Massachusetts Investor Conference
MassHousing
MassHousing:
Chuck Karimbakas, Director of Financial and Capital Planning
Presented by:

239
Traditional Housing Bonds Price Significantly Worse than Taxable Alternatives
-
0.50
1.00
1.50
2.00
2.50
3.00
3.50
4.00
2 3 5 7 10 30
Maturity
%
UST
AAA Muni
AA Housing
2012 Massachusetts Investor Conference
• Housing Bonds
•Spread to MMD by maturity
• 30 year maturity drives lending rate (low 4’s)
• Agencies
• Spread to TRE
• Priced to average life based on prepayment assumption
• 10 year TRE drives lending rate (low 3’s)
3.00
4.00
5.00
6.00
7.00
2006 2007 2008 2009 2010 2011 2012
Fannie Mae Commitment Rate
J.P. Morgan 30-Year Housing Bond Indication

240
Housing Finance Agencies (HFA) Issuance Down Significantly
2012 Massachusetts Investor Conference

241
Fannie / Freddie / Ginnie Have Made Up Over 88% of the Mortgage Market Since 2008
Total Market Originations by Product ($bn)Total Market Originations by Product ($bn)
Source: Inside Mortgage Finance
88%
Agency
(est)
9%>1%
3%
67%
21%
108 78
3,945 2,920 3,120 2,980 2,430 1,700 1,815 1,570 1,350 1,447
2012 Massachusetts Investor Conference

242
Market Differences
U.S. fixed income market = $36.4 trillion (SIFMA,
3Q2011)
Mortgage-related assets = $8.74 trillion (24% of total
market)
– Agency MBS = $5.05 trillion (14% of total)
Municipal assets = $3.53 trillion (10% of total)
Daily trading volumes are dramatically different
Agency MBS = approximately $60 billion
Fixed rate municipal bonds = $6.38 billion (MSRB,
2011)
– Housing = $111.7 million (MSRB, 2011)
Bond Structure
Credit Homogeneity
Optionality
Issue Size / Liquidity
Real-Time Information
Pricing Transparency
Product Differences
Source: J.P. Morgan / Bloomberg – Fannie Mae
Housing yields reflect AMT rates prior to July 2008; non-AMT rates thereafter
Market and Product Differences Make the Agency MBS Execution More Efficient
2012 Massachusetts Investor Conference

243
The Challenge: Address Structure, Credit, and Disclosure inefficiencies of
Mortgage Revenue Bonds
Pre-Crisis
Whole loans
Parity resolution
10 year optional call
Cross call
Bi-annual Debt Service
Loans partially originated at closing
Limited disclosure on collateral
Post Crisis
Agency MBS
Stand alone resolution
No 10 year call
No cross calling
Monthly debt service
MBS fully originated at closing
Real-time MBS information on Bloomberg 2012 Massachusetts Investor Conference
244
Traditional MRB Agency MBS TEMPS
Tax-Exempt Yes No Yes
Ratings AAA and AA Not Rated AAA
Payments Semi-Annual Monthly Monthly
ReportingAnnual (limited
information)Monthly Remittance Monthly Remittance
Continuing Disclosure
ObligationQuarterly 15c2-12 None Exempt
Traditional MRB Agency MBS TEMPS
Tax-Exempt Yes No Yes
Ratings AAA and AA Not Rated AAA
Payments Semi-Annual Monthly Monthly
ReportingAnnual (limited
information)Monthly Remittance Monthly Remittance
Continuing Disclosure
ObligationQuarterly 15c2-12 None Exempt
Tax-Exempt Mortgage Participation Securities (TEMPS) Combines the Best of Traditional MRBs and Agency MBS
2012 Massachusetts Investor Conference

245
2012 Massachusetts Investor Conference

246
2012 Massachusetts Investor Conference
Almost 50% of Volume Cap over last two years was for rental housing
Rental Volume Cap also generates tax credit equity (“4% credits”)
Last year, MassHousing’s rental loans generated approximately $.50 of tax credit equity for every $1.00 of lending, leveraging the economic development benefit
Over the past several years, preservation lending has dominated MassHousing’s rental lending
However, MassHousing financed more new affordable units in 2012 than at any time since 2006
A greater emphasis, as recently announced by the Governor, on the production of new units is expected over the next several years
Consistent Rental Lending in a Difficult Market

247
2012 Massachusetts Investor Conference
• MassHousing is the largest FHA Risk Share lender in the country • In 2012, MassHousing created a new Aaa indenture for rental lending • The new Aaa indenture has attracted cross-over buyers (AFL-CIO HIT) • New pass-through structures likely in 2013
Pass-Through Structures for Rental Financing

248
2013 Issuance Driven by Several Factors
Tax Reform
– Mortgage Interest Deduction
– Tax Exemption
– Marginal Tax Rates
Future of GSEs
– Reduced Role for Fannie and Freddie
– Higher fees/premium to cover losses
Housing Market Improvement
– New units
Interest Rates
– QE3 and beyond
MassHousing and all HFAs will have to continue to evolve in order to move their missions forward
2012 Massachusetts Investor Conference

249
2012 Massachusetts Investor Conference
2012 Massachusetts Investor Conference
Thank You for Attending


![Investor Presentation / Intimation of investor conference [Company Update]](https://img.pdfslide.net/doc/110x75/577c7b771a28abe05497d5fd/investor-presentation-intimation-of-investor-conference-company-update.jpg)