Embed Size (px)
Citation preview

1
5th May 2021
Investor Conference WebinarResults for Q1 2021

Presenters
VYTAUTAS SINIUS, CEO
DONATAS SAVICKAS, CFO
Investor Conference Webinar
3
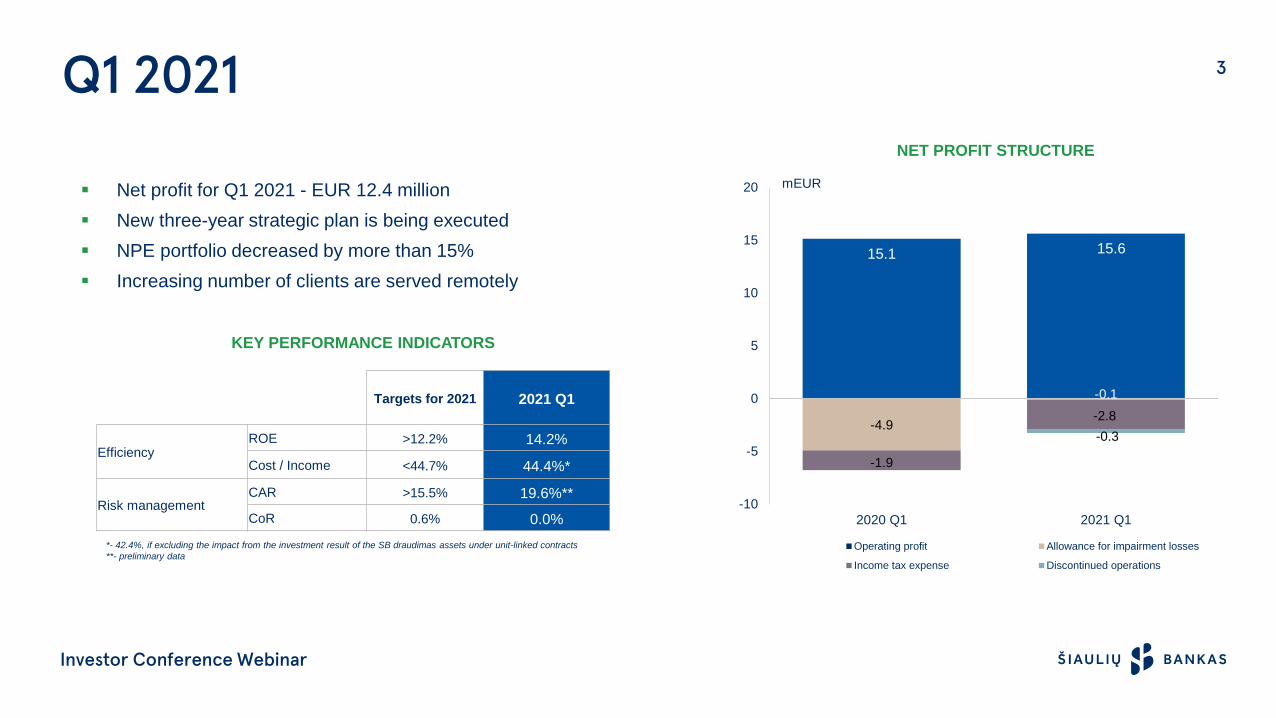
15.1 15.6
-4.9
-0.1
-1.9
-2.8
-0.3
-10
-5
0
5
10
15
20
2020 Q1 2021 Q1
mEUR
Operating profit Allowance for impairment losses
Income tax expense Discontinued operations
Q1 2021
Investor Conference Webinar
▪ Net profit for Q1 2021 - EUR 12.4 million
▪ New three-year strategic plan is being executed
▪ NPE portfolio decreased by more than 15%
▪ Increasing number of clients are served remotely
Targets for 2021 2021 Q1
EfficiencyROE >12.2% 14.2%
Cost / Income <44.7% 44.4%*
Risk managementCAR >15.5% 19.6%**
CoR 0.6% 0.0%
KEY PERFORMANCE INDICATORS
NET PROFIT STRUCTURE
*- 42.4%, if excluding the impact from the investment result of the SB draudimas assets under unit-linked contracts
**- preliminary data
4
0
200
400
600
800
1000
1200
1400
1600
2020-25 2020-29 2020-33 2020-37 2020-41 2020-45 2020-49 2020-53 2021-04 2021-08 2021-12 2021-16
Macro & COVID situation update
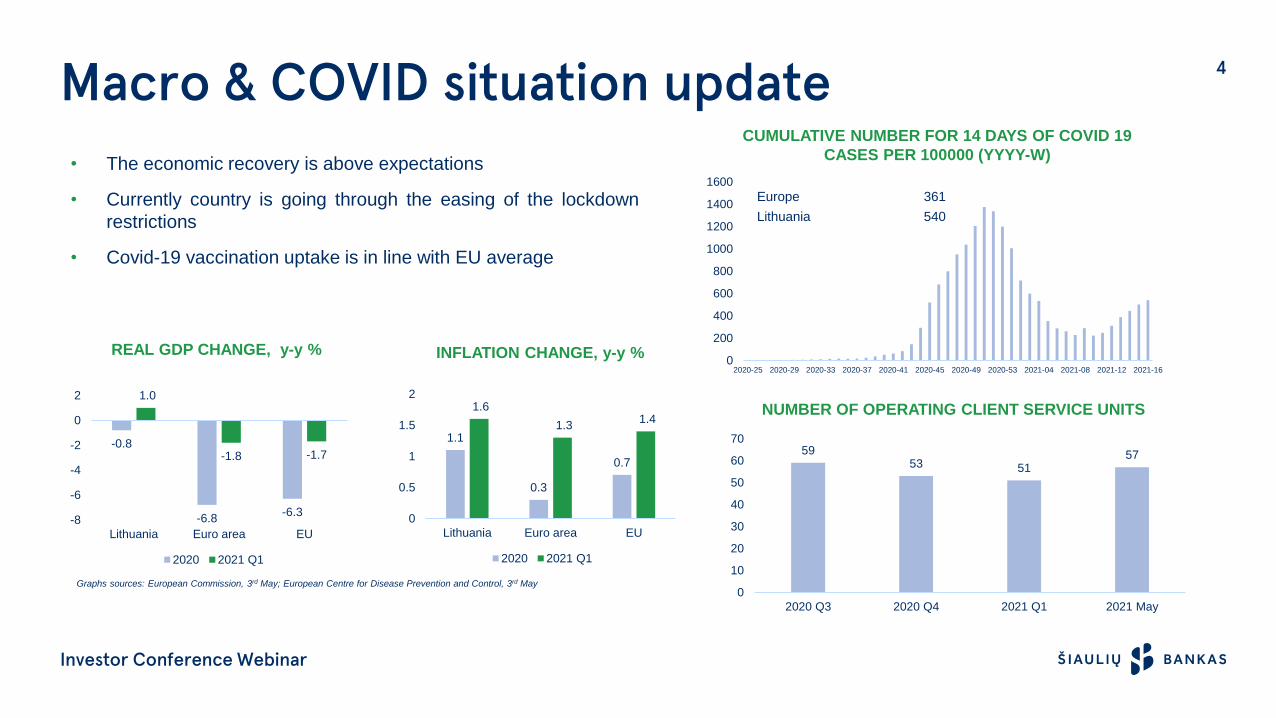
• The economic recovery is above expectations
• Currently country is going through the easing of the lockdown
restrictions
• Covid-19 vaccination uptake is in line with EU average
Investor Conference Webinar
INFLATION CHANGE, y-y %REAL GDP CHANGE, y-y %
-0.8
-6.8-6.3
1.0
-1.8 -1.7
-8
-6
-4
-2
0
2
Lithuania Euro area EU
2020 2021 Q1
1.1
0.3
0.7
1.6
1.3 1.4
0
0.5
1
1.5
2
Lithuania Euro area EU
2020 2021 Q1
CUMULATIVE NUMBER FOR 14 DAYS OF COVID 19
CASES PER 100000 (YYYY-W)
Europe 361
Lithuania 540
Graphs sources: European Commission, 3rd May; European Centre for Disease Prevention and Control, 3rd May
NUMBER OF OPERATING CLIENT SERVICE UNITS
5953 51
57
0
10
20
30
40
50
60
70
2020 Q3 2020 Q4 2021 Q1 2021 May
5
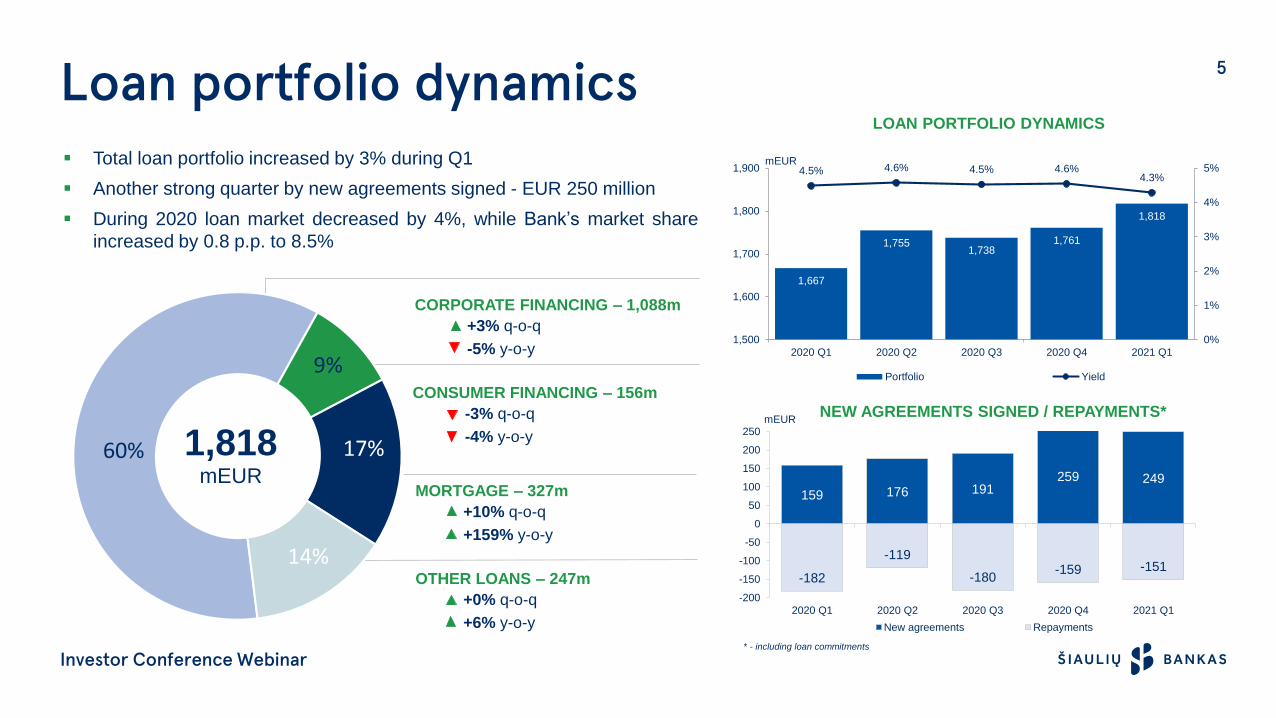
159 176 191259 249
-182
-119
-180-159 -151
-200
-150
-100
-50
0
50
100
150
200
250
2020 Q1 2020 Q2 2020 Q3 2020 Q4 2021 Q1
mEUR
New agreements Repayments
▪ Total loan portfolio increased by 3% during Q1
▪ Another strong quarter by new agreements signed - EUR 250 million
▪ During 2020 loan market decreased by 4%, while Bank’s market share
increased by 0.8 p.p. to 8.5%
Loan portfolio dynamicsLOAN PORTFOLIO DYNAMICS
NEW AGREEMENTS SIGNED / REPAYMENTS*
14%
8%
CORPORATE FINANCING – 1,088m
+3% q-o-q
-5% y-o-y
CONSUMER FINANCING – 156m
-3% q-o-q
-4% y-o-y
MORTGAGE – 327m
+10% q-o-q
+159% y-o-y
OTHER LOANS – 247m
+0% q-o-q
+6% y-o-y
1,818mEUR
60%
9%
14%
17%
* - including loan commitments
Investor Conference Webinar
1,667
1,7551,738
1,761
1,818
4.5% 4.6% 4.5% 4.6%4.3%
0%
1%
2%
3%
4%
5%
1,500
1,600
1,700
1,800
1,900
2020 Q1 2020 Q2 2020 Q3 2020 Q4 2021 Q1
mEUR
Portfolio Yield
6
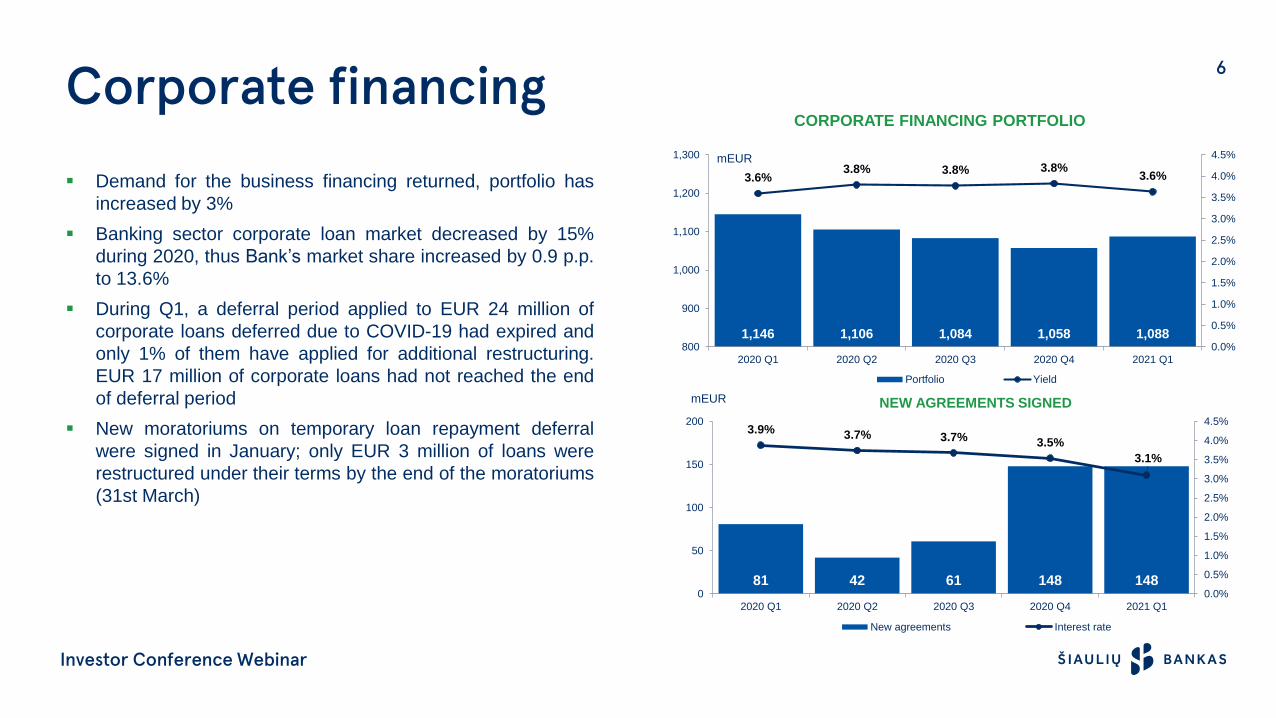
1,146 1,106 1,084 1,058 1,088
3.6%3.8% 3.8% 3.8%
3.6%
0.0%
0.5%
1.0%
1.5%
2.0%
2.5%
3.0%
3.5%
4.0%
4.5%
800
900
1,000
1,100
1,200
1,300
2020 Q1 2020 Q2 2020 Q3 2020 Q4 2021 Q1
mEUR
Portfolio Yield
Corporate financing
Investor Conference Webinar
▪ Demand for the business financing returned, portfolio has
increased by 3%
▪ Banking sector corporate loan market decreased by 15%
during 2020, thus Bank’s market share increased by 0.9 p.p.
to 13.6%
▪ During Q1, a deferral period applied to EUR 24 million of
corporate loans deferred due to COVID-19 had expired and
only 1% of them have applied for additional restructuring.
EUR 17 million of corporate loans had not reached the end
of deferral period
▪ New moratoriums on temporary loan repayment deferral
were signed in January; only EUR 3 million of loans were
restructured under their terms by the end of the moratoriums
(31st March)
CORPORATE FINANCING PORTFOLIO
NEW AGREEMENTS SIGNED
81 42 61 148 148
3.9% 3.7% 3.7% 3.5%
3.1%
0.0%
0.5%
1.0%
1.5%
2.0%
2.5%
3.0%
3.5%
4.0%
4.5%
0
50
100
150
200
2020 Q1 2020 Q2 2020 Q3 2020 Q4 2021 Q1
mEUR
New agreements Interest rate
7
126
247 267297
327
2.6% 2.6% 2.6% 2.6%2.4%
1.0%
1.5%
2.0%
2.5%
3.0%
0
50
100
150
200
250
300
2020 Q1 2020 Q2 2020 Q3 2020 Q4 2021 Q1
mEUR
Portfolio Yield
Mortgages
MORTGAGES PORTFOLIO
27.3
13.9
27.1
35.7
41.2
2.5% 2.5% 2.5%2.4% 2.3%
1.0%
1.5%
2.0%
2.5%
3.0%
0
10
20
30
40
50
2020 Q1 2020 Q2 2020 Q3 2020 Q4 2021 Q1
mEUR
New agreements, mEUR Interest rate, %
NEW AGREEMENTS SIGNED
+10%
Consumer financing
162 162 164 160 156
11.9% 11.6% 11.8% 11.6%10.8%
4%
6%
8%
10%
12%
14%
0
50
100
150
200
2020 Q1 2020 Q2 2020 Q3 2020 Q4 2021 Q1
mEUR
Portfolio Yield
31.6 27.2 32.6 28.3 26.0
11.1%10.6% 10.9%
9.5%10.0%
4%
6%
8%
10%
12%
0
10
20
30
40
50
2020 Q1 2020 Q2 2020 Q3 2020 Q4 2021 Q1
mEUR
New agreements, mEUR Interest rate, %
NEW AGREEMENTS SIGNED
CONSUMER FINANCING PORTFOLIO
-3%
Investor Conference Webinar
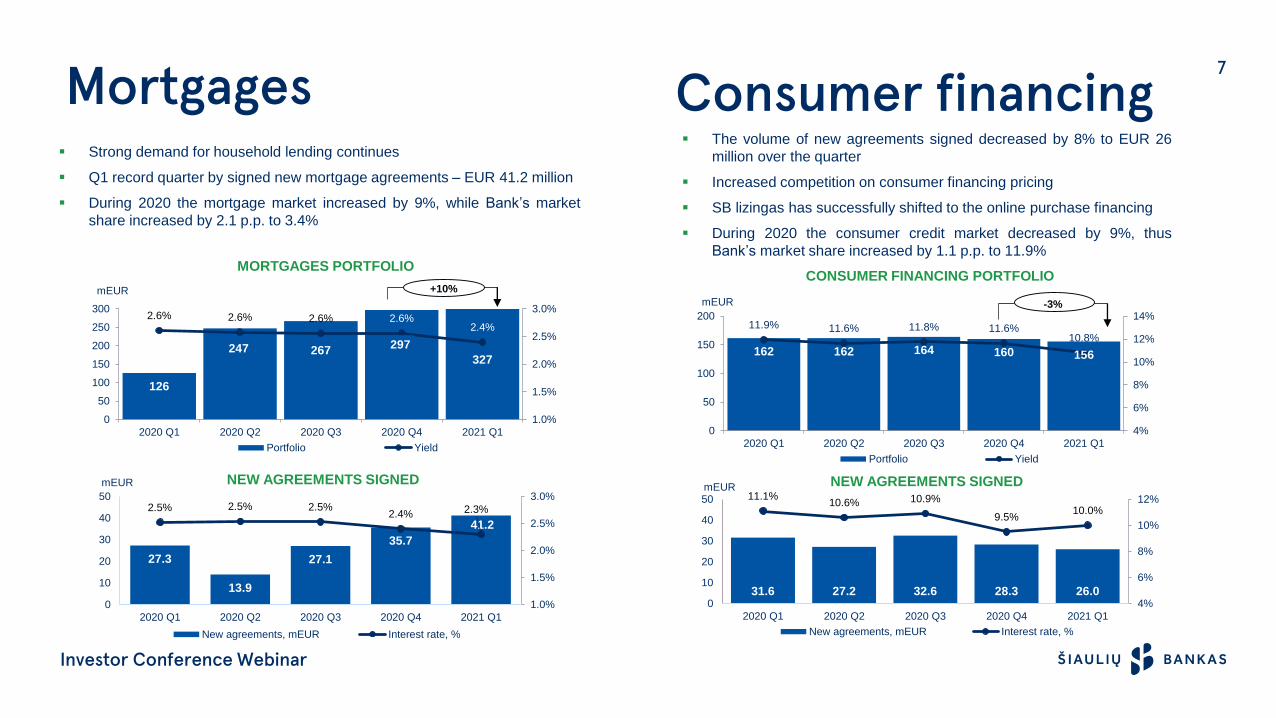
▪ The volume of new agreements signed decreased by 8% to EUR 26
million over the quarter
▪ Increased competition on consumer financing pricing
▪ SB lizingas has successfully shifted to the online purchase financing
▪ During 2020 the consumer credit market decreased by 9%, thus
Bank’s market share increased by 1.1 p.p. to 11.9%
▪ Strong demand for household lending continues
▪ Q1 record quarter by signed new mortgage agreements – EUR 41.2 million
▪ During 2020 the mortgage market increased by 9%, while Bank’s market
share increased by 2.1 p.p. to 3.4%
8
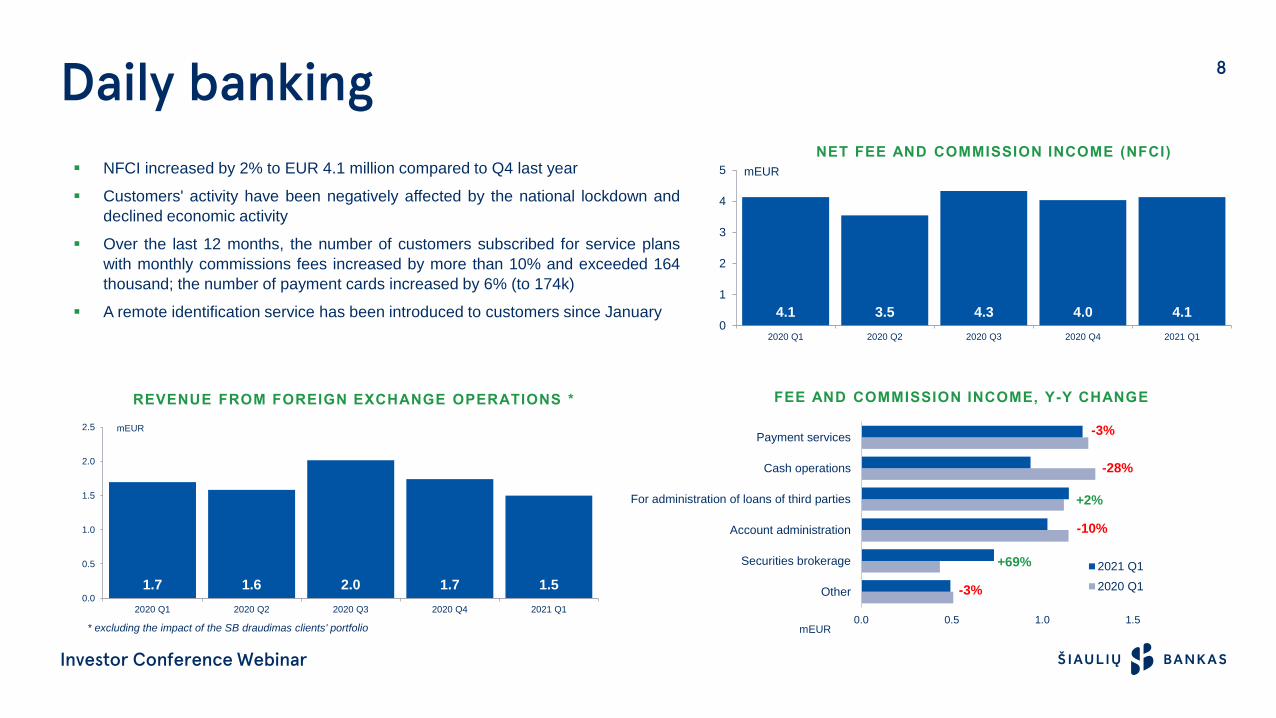
▪ NFCI increased by 2% to EUR 4.1 million compared to Q4 last year
▪ Customers' activity have been negatively affected by the national lockdown and
declined economic activity
▪ Over the last 12 months, the number of customers subscribed for service plans
with monthly commissions fees increased by more than 10% and exceeded 164
thousand; the number of payment cards increased by 6% (to 174k)
▪ A remote identification service has been introduced to customers since January
Daily bankingNET FEE AND COMMISSION INCOME (NFCI)
FEE AND COMMISSION INCOME, Y-Y CHANGE
mEUR
Investor Conference Webinar
-3%
+69%
-10%
+2%
-28%
-3%
0.0 0.5 1.0 1.5
Other
Securities brokerage
Account administration
For administration of loans of third parties
Cash operations
Payment services
2021 Q1
2020 Q1
4.1 3.5 4.3 4.0 4.10
1
2
3
4
5
2020 Q1 2020 Q2 2020 Q3 2020 Q4 2021 Q1
mEUR
1.7 1.6 2.0 1.7 1.50.0
0.5
1.0
1.5
2.0
2.5
2020 Q1 2020 Q2 2020 Q3 2020 Q4 2021 Q1
mEUR
REVENUE FROM FOREIGN EXCHANGE OPERATIONS *
* excluding the impact of the SB draudimas clients' portfolio
9Funding
Investor Conference Webinar
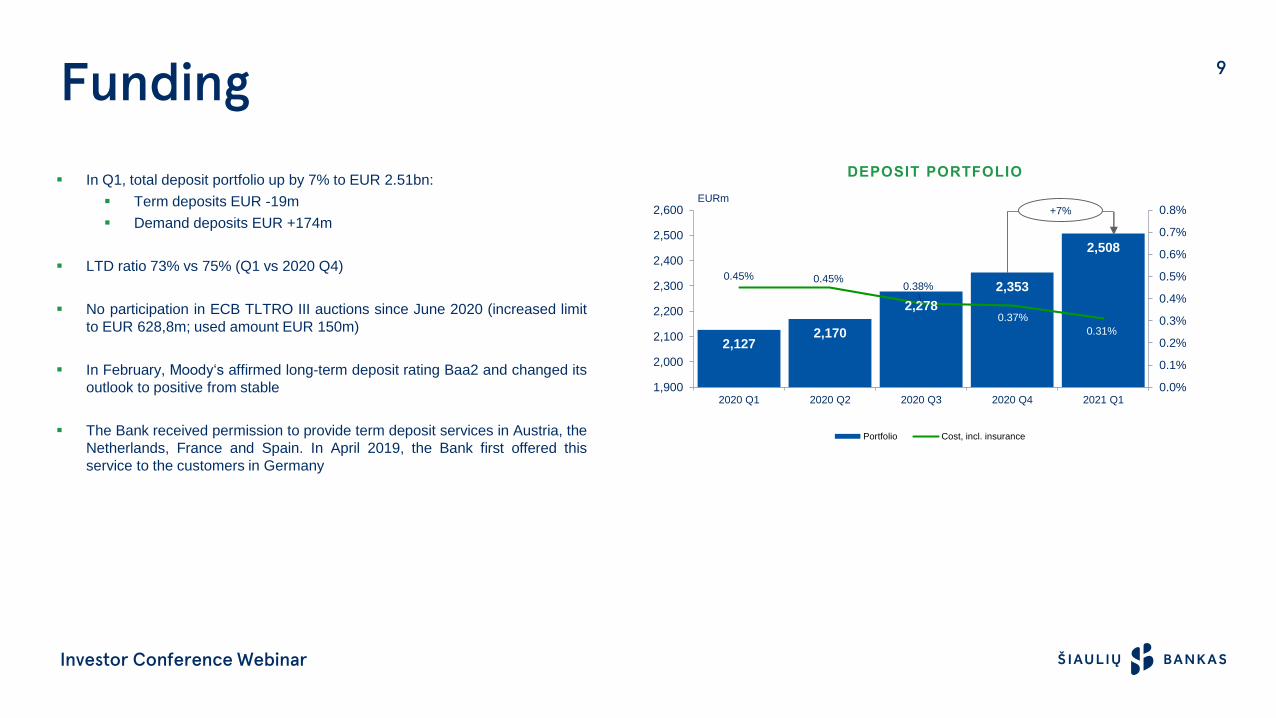
▪ In Q1, total deposit portfolio up by 7% to EUR 2.51bn:
▪ Term deposits EUR -19m
▪ Demand deposits EUR +174m
▪ LTD ratio 73% vs 75% (Q1 vs 2020 Q4)
▪ No participation in ECB TLTRO III auctions since June 2020 (increased limit
to EUR 628,8m; used amount EUR 150m)
▪ In February, Moody‘s affirmed long-term deposit rating Baa2 and changed its
outlook to positive from stable
▪ The Bank received permission to provide term deposit services in Austria, the
Netherlands, France and Spain. In April 2019, the Bank first offered this
service to the customers in Germany
2,1272,170
2,278
2,353
2,508
0.45% 0.45%0.38%
0.37%
0.31%
0.0%
0.1%
0.2%
0.3%
0.4%
0.5%
0.6%
0.7%
0.8%
1,900
2,000
2,100
2,200
2,300
2,400
2,500
2,600
2020 Q1 2020 Q2 2020 Q3 2020 Q4 2021 Q1
EURm
Portfolio Cost, incl. insurance
DEPOSIT PORTFOLIO
+7%
10
20.6
19.6*
4
6
8
10
12
14
16
18
20
22
2020 2021 Q1
%
CAR
CAR (interim profit incl.)Minimum requirement
Risk appetite
Capital & risk management
Investor Conference Webinar
CAPITAL ADEQUACY RATIO
* - forecast data
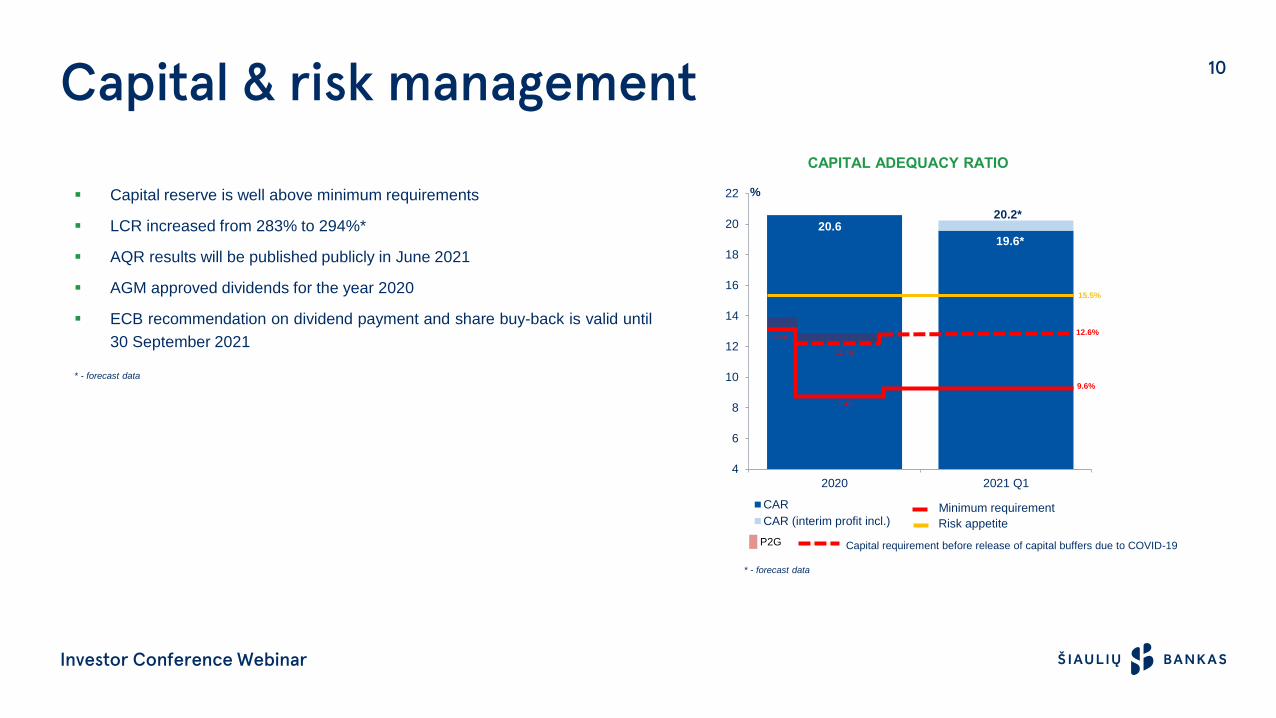
▪ Capital reserve is well above minimum requirements
▪ LCR increased from 283% to 294%*
▪ AQR results will be published publicly in June 2021
▪ AGM approved dividends for the year 2020
▪ ECB recommendation on dividend payment and share buy-back is valid until
30 September 2021
20.2*
15.5%
12.6%
9.6%
13.4%
Capital requirement before release of capital buffers due to COVID-19
9.4%
12.4%
P2G
* - forecast data
11
0.7%
-0.2%
0.2%
0.5%0.6%
0.01%
-1.0%
-0.5%
0.0%
0.5%
1.0%-12
-8
-4
0
4
8
12
2016 2017 2018 2019 2020 2021 Q1
mEURLoan impairment losses CoR
Loan portfolio qualityCOST OF RISK (COR)
NPE (LOANS)
Investor Conference Webinar
5.4%5.1%
5.1%
6.9%
5.6%
0
20
40
60
80
100
120
140
0%
2%
4%
6%
8%
10%
2020 Q1 2020 Q2 2020 Q3 2020 Q4 2021 Q1
mEUR
Gross value Gross value / Loan portfolio
LOANS PAST DUE >30 DAYS
4.2%3.6%
3.3%3.0%
2.3%
0%
2%
4%
6%
8%
10%
2020 Q1 2020 Q2 2020 Q3 2020 Q4 2021 Q10
20
40
60
80
100
mEUR
Gross value Gross value / Loan portfolio
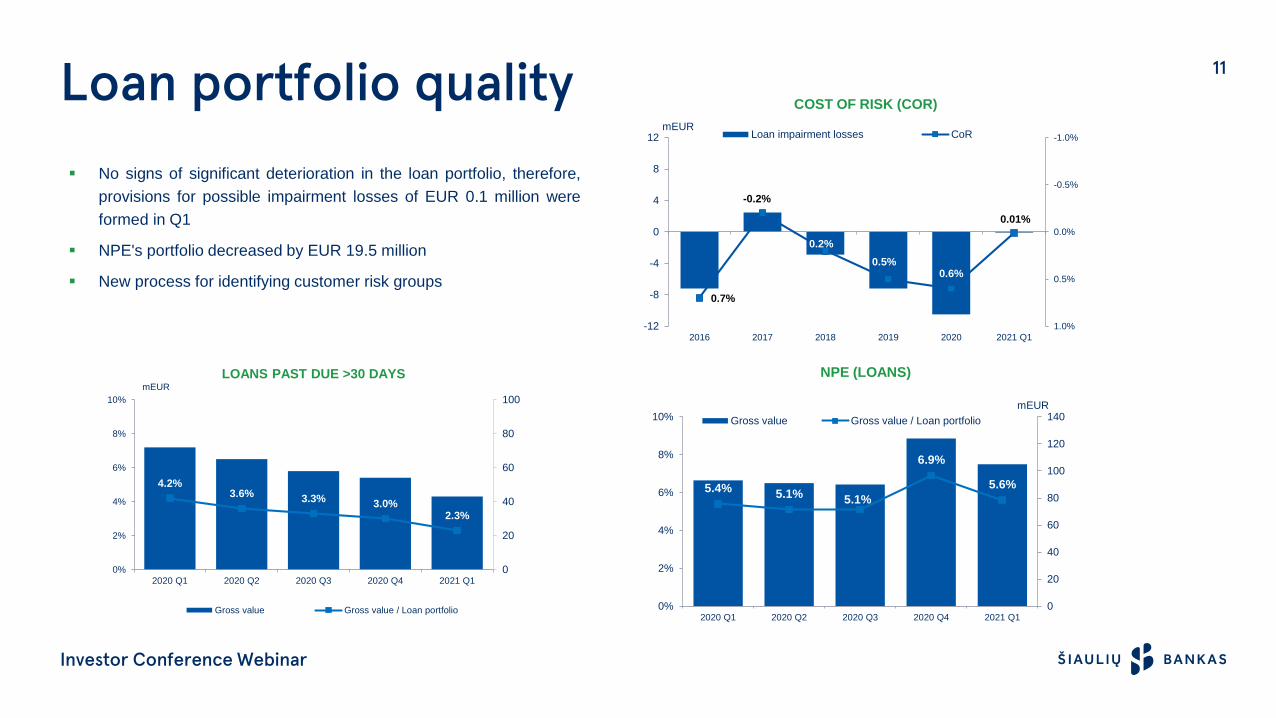
▪ No signs of significant deterioration in the loan portfolio, therefore,
provisions for possible impairment losses of EUR 0.1 million were
formed in Q1
▪ NPE's portfolio decreased by EUR 19.5 million
▪ New process for identifying customer risk groups
12
2020Y
Price -1.6%
Turnover EUR 84.5m
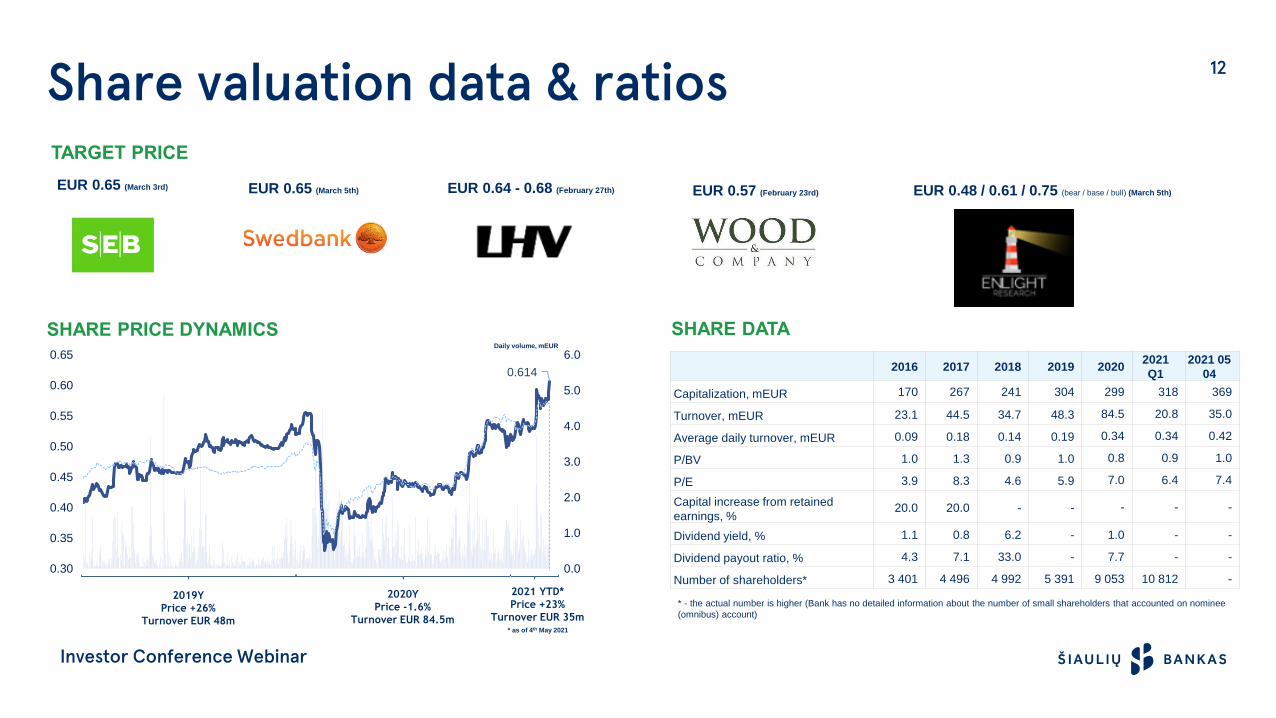
SHARE DATASHARE PRICE DYNAMICS
Share valuation data & ratios
* as of 4th May 2021
2016 2017 2018 2019 20202021
Q1
2021 05
04
Capitalization, mEUR 170 267 241 304 299 318 369
Turnover, mEUR 23.1 44.5 34.7 48.3 84.5 20.8 35.0
Average daily turnover, mEUR 0.09 0.18 0.14 0.19 0.34 0.34 0.42
P/BV 1.0 1.3 0.9 1.0 0.8 0.9 1.0
P/E 3.9 8.3 4.6 5.9 7.0 6.4 7.4
Capital increase from retained
earnings, %20.0 20.0 - - - - -
Dividend yield, % 1.1 0.8 6.2 - 1.0 - -
Dividend payout ratio, % 4.3 7.1 33.0 - 7.7 - -
Number of shareholders* 3 401 4 496 4 992 5 391 9 053 10 812 -
2019Y
Price +26%
Turnover EUR 48m
Daily volume, mEUR
Investor Conference Webinar
0.614
0.0
1.0
2.0
3.0
4.0
5.0
6.0
0.30
0.35
0.40
0.45
0.50
0.55
0.60
0.65
2021 YTD*
Price +23%
Turnover EUR 35m
* - the actual number is higher (Bank has no detailed information about the number of small shareholders that accounted on nominee
(omnibus) account)
TARGET PRICE
EUR 0.65 (March 5th) EUR 0.64 - 0.68 (February 27th) EUR 0.57 (February 23rd)EUR 0.65 (March 3rd) EUR 0.48 / 0.61 / 0.75 (bear / base / bull) (March 5th)

13Q&A
Investor Conference Webinar
14
Investor Conference Webinar
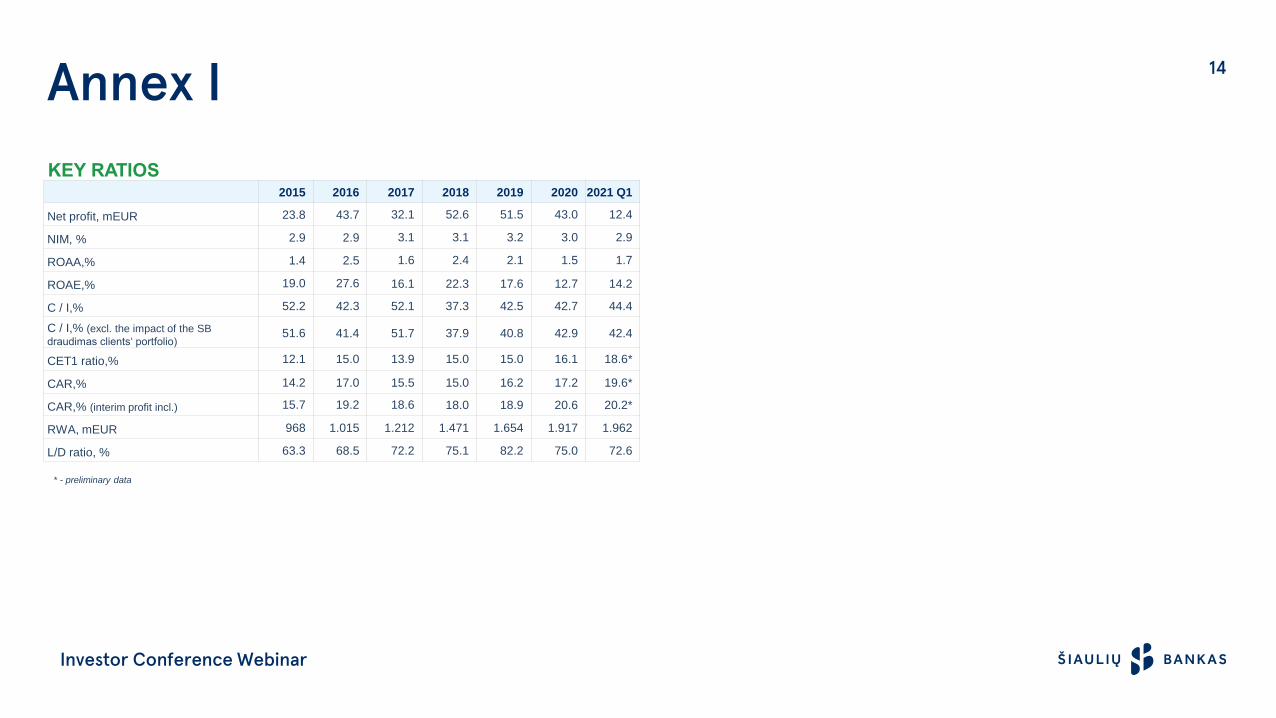
KEY RATIOS
Annex I
* - preliminary data
2015 2016 2017 2018 2019 2020 2021 Q1
Net profit, mEUR 23.8 43.7 32.1 52.6 51.5 43.0 12.4
NIM, % 2.9 2.9 3.1 3.1 3.2 3.0 2.9
ROAA,% 1.4 2.5 1.6 2.4 2.1 1.5 1.7
ROAE,% 19.0 27.6 16.1 22.3 17.6 12.7 14.2
C / I,% 52.2 42.3 52.1 37.3 42.5 42.7 44.4
C / I,% (excl. the impact of the SB
draudimas clients‘ portfolio)51.6 41.4 51.7 37.9 40.8 42.9 42.4
CET1 ratio,% 12.1 15.0 13.9 15.0 15.0 16.1 18.6*
CAR,% 14.2 17.0 15.5 15.0 16.2 17.2 19.6*
CAR,% (interim profit incl.) 15.7 19.2 18.6 18.0 18.9 20.6 20.2*
RWA, mEUR 968 1.015 1.212 1.471 1.654 1.917 1.962
L/D ratio, % 63.3 68.5 72.2 75.1 82.2 75.0 72.6


![[On-Demand Webinar] First Time Investor Masterclass](https://img.pdfslide.net/doc/110x75/58cf0a481a28ab5f2b8b57d3/on-demand-webinar-first-time-investor-masterclass.jpg)


![[On-Demand Webinar] First Time Property Investor Webinar](https://img.pdfslide.net/doc/110x75/5a65f8837f8b9a21248b4d91/on-demand-webinar-first-time-property-investor-webinar.jpg)