Embed Size (px)
Citation preview
8/9/2019 2012 Velocity Measurement Technology Comparison
http://slidepdf.com/reader/full/2012-velocity-measurement-technology-comparison 1/69
Annual Conference
Anaheim 27 Apr 2012
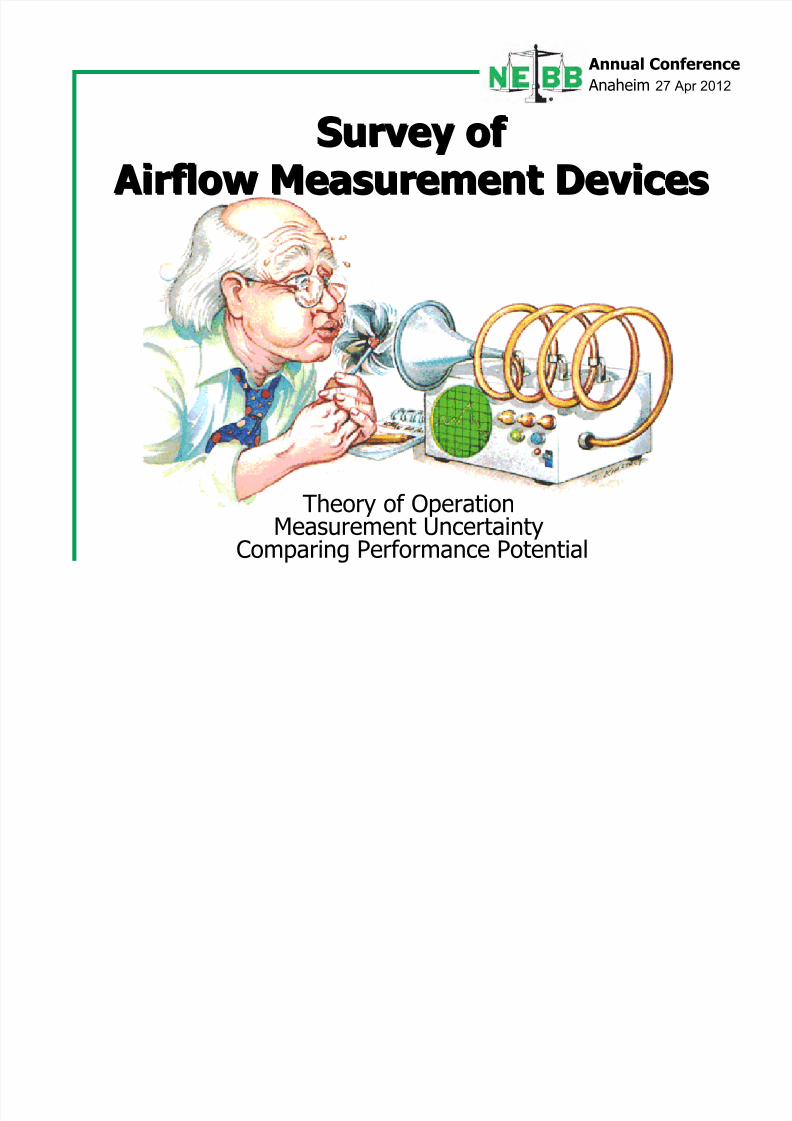
Survey ofSurvey of
Airflow Measurement Devices Airflow Measurement Devices
Theory of Operation
Measurement UncertaintyComparing Performance Potential
8/9/2019 2012 Velocity Measurement Technology Comparison
http://slidepdf.com/reader/full/2012-velocity-measurement-technology-comparison 2/69
Annual Conference
Anaheim 27 Apr 2012
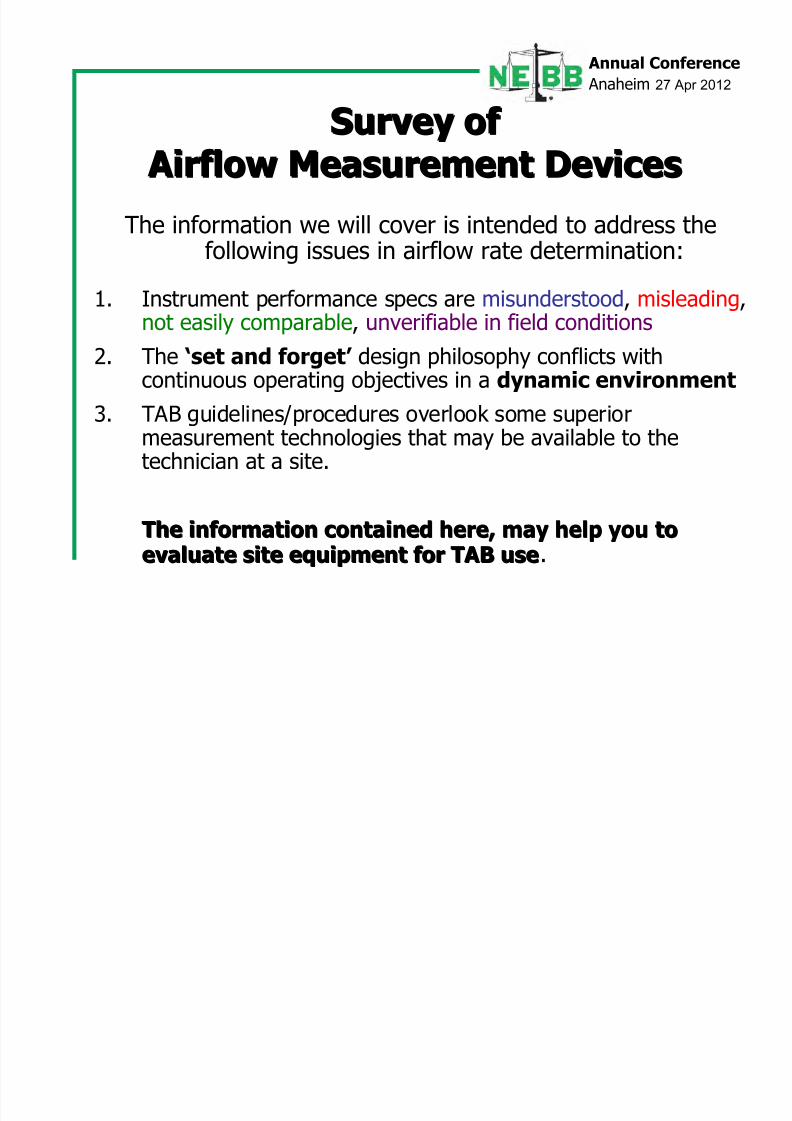
The information we will cover is intended to address thefollowing issues in airflow rate determination:
1. Instrument performance specs are misunderstood, misleading,
not easily comparable, unverifiable in field conditions
2. The ‘set and forget’ design philosophy conflicts withcontinuous operating objectives in a dynamic environment
3. TAB guidelines/procedures overlook some superiormeasurement technologies that may be available to thetechnician at a site.
The information contained here, may help you toThe information contained here, may help you toevaluate site equipment for TAB useevaluate site equipment for TAB use.
Survey ofSurvey of
Airflow Measurement Devices Airflow Measurement Devices
8/9/2019 2012 Velocity Measurement Technology Comparison
http://slidepdf.com/reader/full/2012-velocity-measurement-technology-comparison 3/69
Annual Conference
Anaheim 27 Apr 2012
Portable InstrumentsPortable Instruments
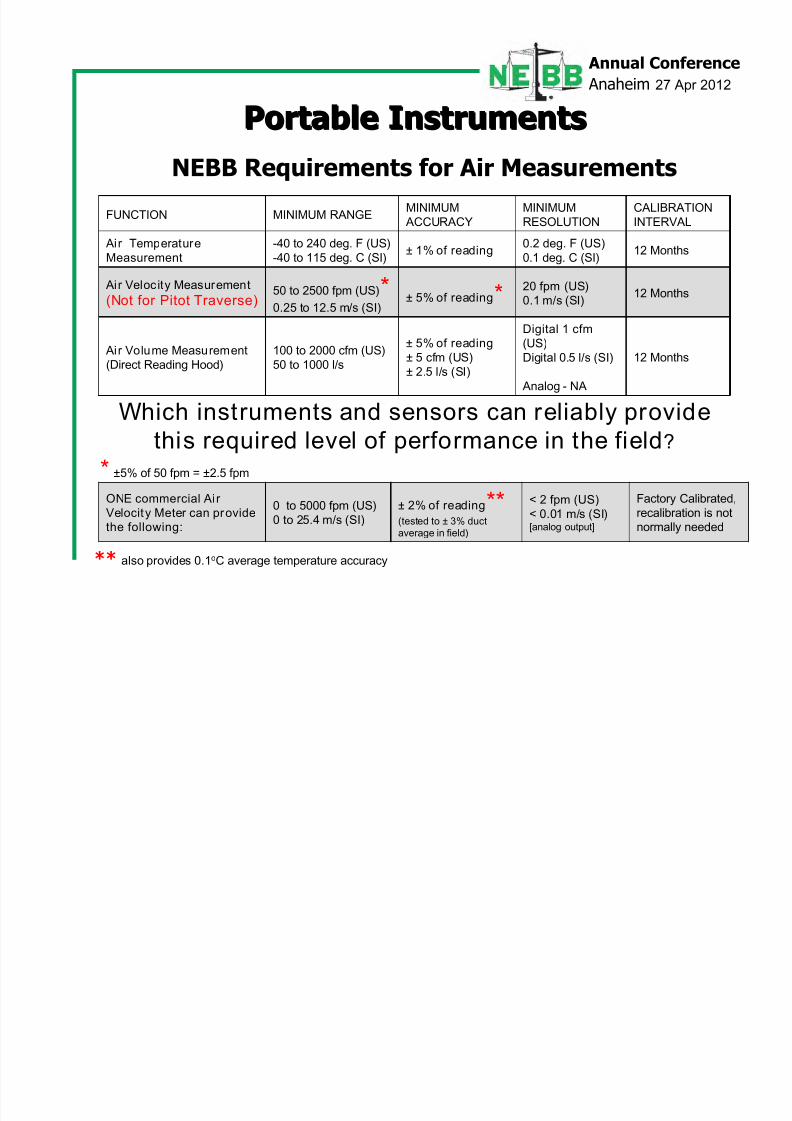
12 Months
Digital 1 cfm
(US)
Digital 0.5 l/s (SI)
Analog - NA
± 5% of reading
± 5 cfm (US)
± 2.5 l/s (SI)
100 to 2000 cfm (US)
50 to 1000 l/s
Ai r Volume Measurement
(Direct Reading Hood)
12 Months20 fpm (US)
0.1 m/s (SI)± 5% of reading*50 to 2500 fpm (US)*0.25 to 12.5 m/s (SI)
Ai r Velocity Measurement
(Not for Pitot Traverse)
12 Months0.2 deg. F (US)
0.1 deg. C (SI)± 1% of reading
-40 to 240 deg. F (US)
-40 to 115 deg. C (SI)
Ai r Temperature
Measurement
CALIBRATIONINTERVALMINIMUMRESOLUTIONMINIMUM ACCURACYMINIMUM RANGEFUNCTION
NEBB Requirements for Air Measurements
Which instruments and sensors can reliably provide
this required level of performance in the field?
* ±5% of 50 fpm = ±2.5 fpm
Factory Calibrated,
recalibration is not
normally needed
< 2 fpm (US)
< 0.01 m/s (SI)[analog output]
± 2% of reading**(tested to ± 3% duct
average in field)
0 to 5000 fpm (US)
0 to 25.4 m/s (SI)
ONE commercial Air
Velocity Meter can provide
the following:
** also provides 0.1oC average temperature accuracy
8/9/2019 2012 Velocity Measurement Technology Comparison
http://slidepdf.com/reader/full/2012-velocity-measurement-technology-comparison 4/69
Annual Conference
Anaheim 27 Apr 2012
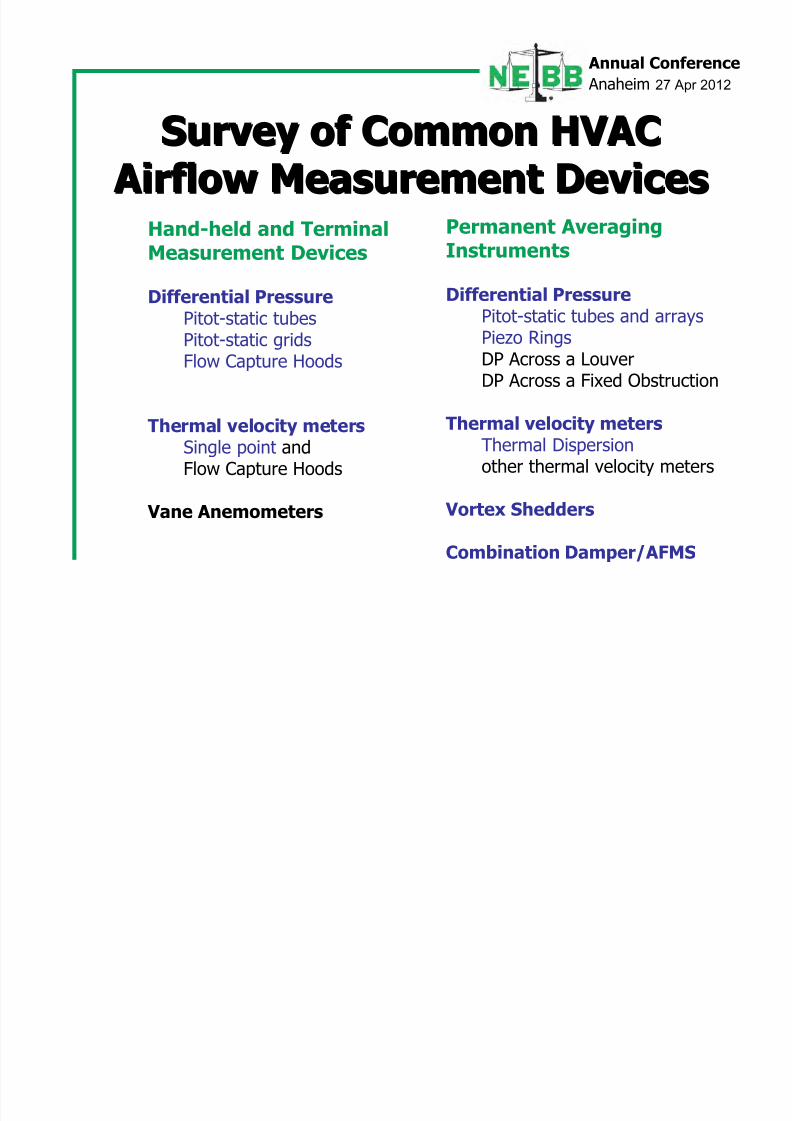
Survey of Common HVACSurvey of Common HVAC
Airflow Measurement Devices Airflow Measurement DevicesPermanent AveragingInstruments
Differential Pressure
Pitot-static tubes and arraysPiezo RingsDP Across a LouverDP Across a Fixed Obstruction
Thermal velocity metersThermal Dispersionother thermal velocity meters
Vortex Shedders
Combination Damper/AFMS
Hand-held and TerminalMeasurement Devices
Differential Pressure
Pitot-static tubesPitot-static gridsFlow Capture Hoods
Thermal velocity metersSingle point andFlow Capture Hoods
Vane Anemometers
8/9/2019 2012 Velocity Measurement Technology Comparison
http://slidepdf.com/reader/full/2012-velocity-measurement-technology-comparison 5/69
Annual Conference
Anaheim 27 Apr 2012
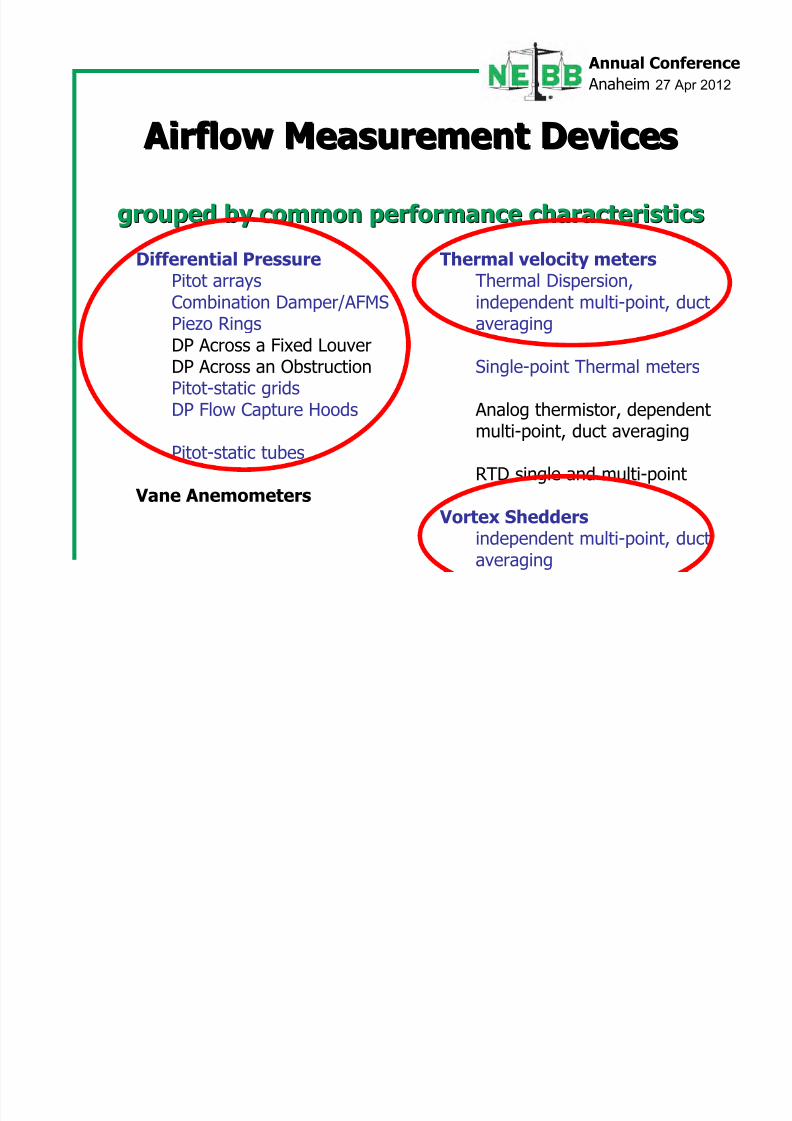
Airflow Measurement Devices Airflow Measurement Devices
grouped by common performance characteristicsgrouped by common performance characteristics
Differential PressurePitot arraysCombination Damper/AFMS
Piezo RingsDP Across a Fixed LouverDP Across an ObstructionPitot-static gridsDP Flow Capture Hoods
Pitot-static tubes
Vane Anemometers
Thermal velocity metersThermal Dispersion,independent multi-point, duct
averaging
Single-point Thermal meters
Analog thermistor, dependent
multi-point, duct averaging
RTD single and multi-point
Vortex Shedders
independent multi-point, ductaveraging
8/9/2019 2012 Velocity Measurement Technology Comparison
http://slidepdf.com/reader/full/2012-velocity-measurement-technology-comparison 6/69
Annual Conference
Anaheim 27 Apr 2012
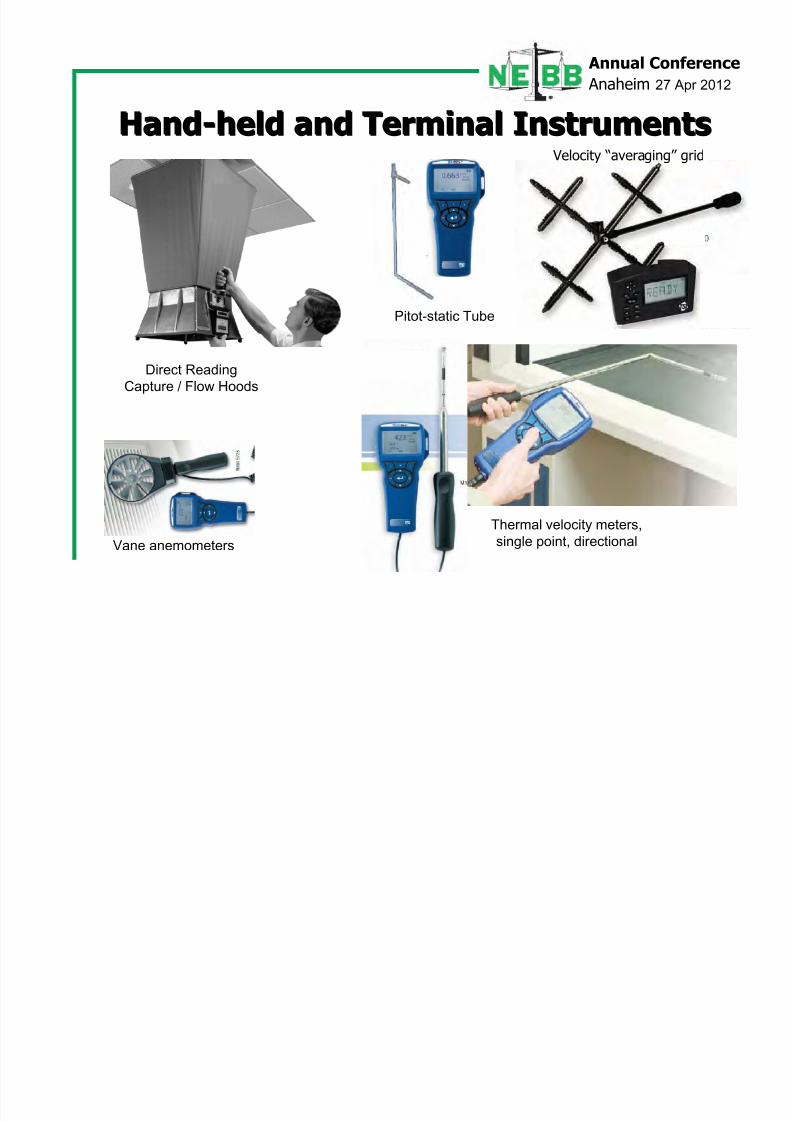
HandHand--held and Terminal Instrumentsheld and Terminal Instruments
Thermal velocity meters,
single point, directional
Pitot-static Tube
Direct Reading
Capture / Flow Hoods
Vane anemometers
Velocity “averaging” grid
8/9/2019 2012 Velocity Measurement Technology Comparison
http://slidepdf.com/reader/full/2012-velocity-measurement-technology-comparison 7/69
Annual Conference
Anaheim 27 Apr 2012
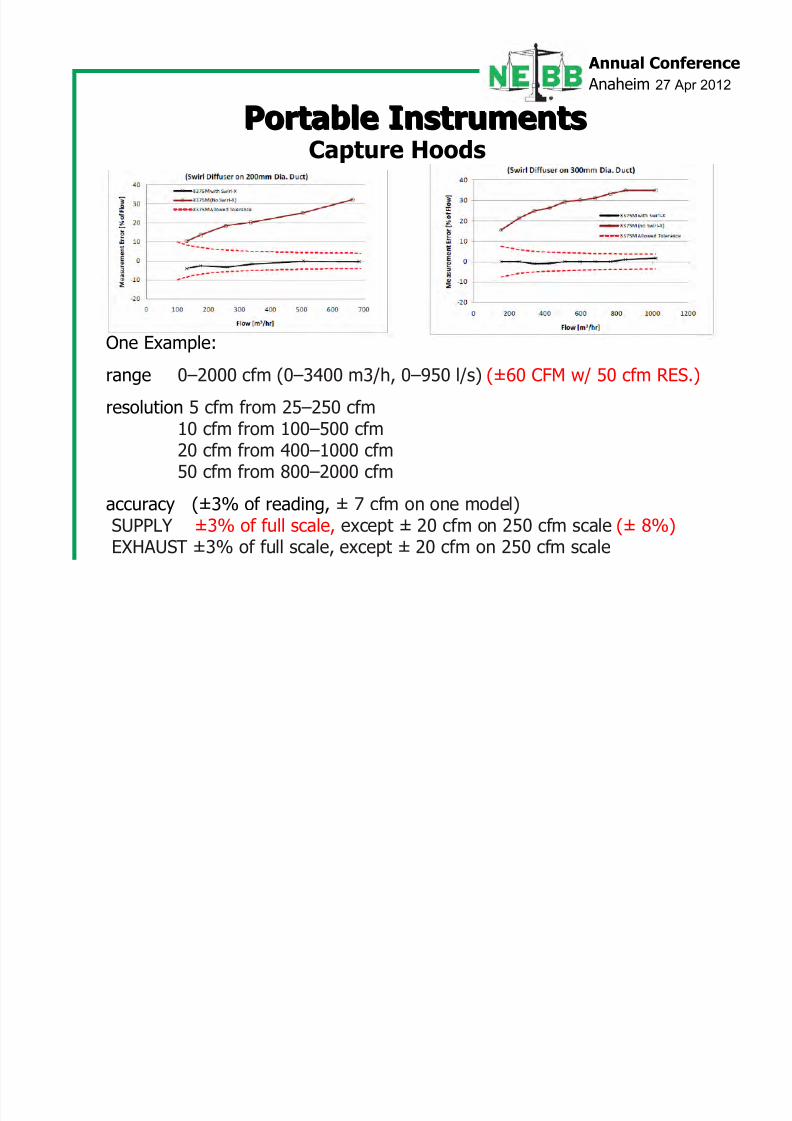
Portable InstrumentsPortable InstrumentsCapture Hoods
One Example:
range 0–2000 cfm (0–3400 m3/h, 0–950 l/s) (±60 CFM w/ 50 cfm RES.)
resolution 5 cfm from 25–250 cfm
10 cfm from 100–500 cfm20 cfm from 400–1000 cfm50 cfm from 800–2000 cfm
accuracy (±3% of reading, ± 7 cfm on one model)
SUPPLY ±3% of full scale, except ± 20 cfm on 250 cfm scale (± 8%)EXHAUST ±3% of full scale, except ± 20 cfm on 250 cfm scale
8/9/2019 2012 Velocity Measurement Technology Comparison
http://slidepdf.com/reader/full/2012-velocity-measurement-technology-comparison 8/69
Annual Conference
Anaheim 27 Apr 2012
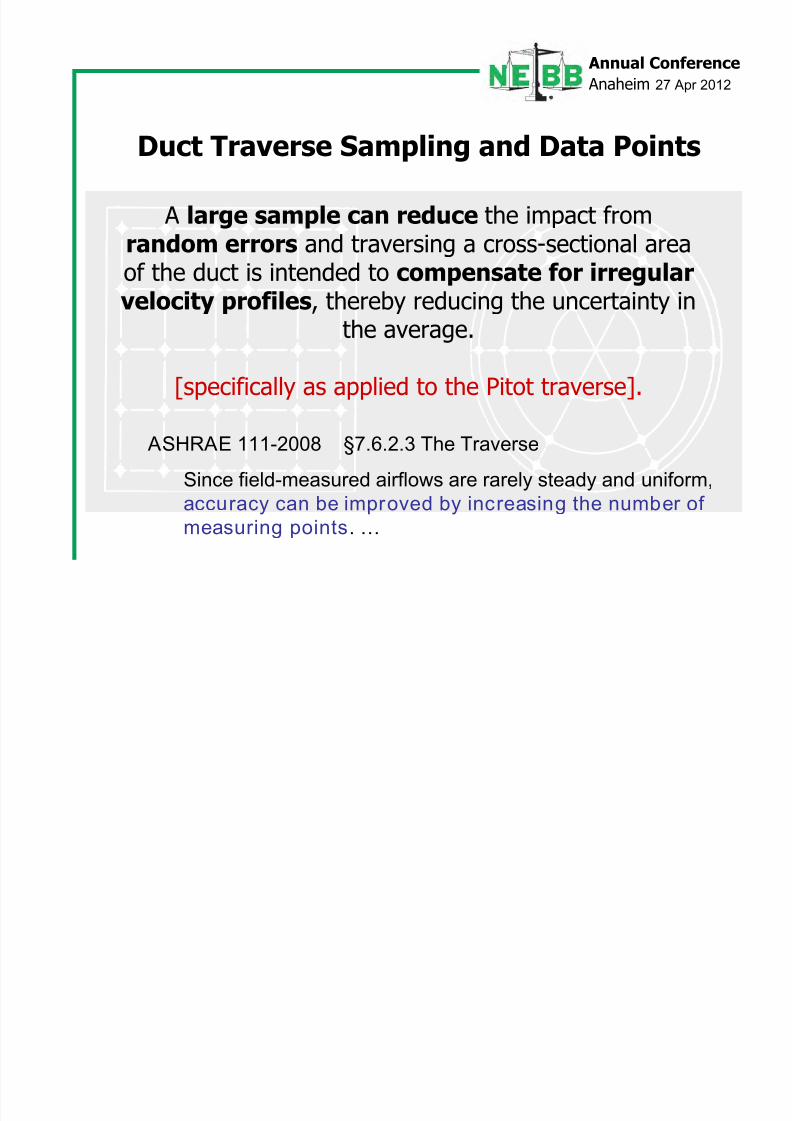
ASHRAE 111-2008 §7.6.2.3 The Traverse
Since field-measured airflows are rarely steady and uniform,
accuracy can be improved by increasing the number of
measuring points. …
Duct Traverse Sampling and Data Points
A large sample can reduce the impact fromrandom errors and traversing a cross-sectional areaof the duct is intended to compensate for irregularvelocity profiles, thereby reducing the uncertainty in
the average.
[specifically as applied to the Pitot traverse].
8/9/2019 2012 Velocity Measurement Technology Comparison
http://slidepdf.com/reader/full/2012-velocity-measurement-technology-comparison 9/69
Annual Conference
Anaheim 27 Apr 2012
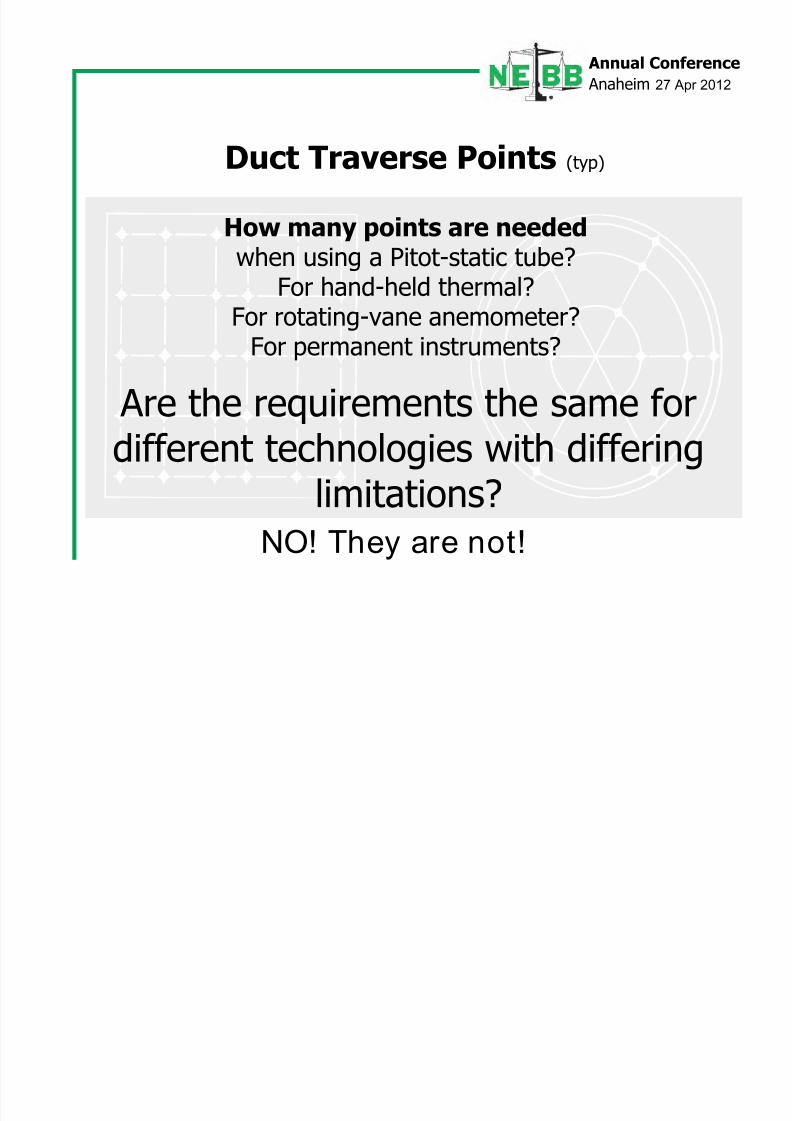
How many points are neededwhen using a Pitot-static tube?
For hand-held thermal?
For rotating-vane anemometer?For permanent instruments?
Duct Traverse Points (typ)
Are the requirements the same fordifferent technologies with differing
limitations?
NO! They are not!
8/9/2019 2012 Velocity Measurement Technology Comparison
http://slidepdf.com/reader/full/2012-velocity-measurement-technology-comparison 10/69
Annual Conference
Anaheim 27 Apr 2012
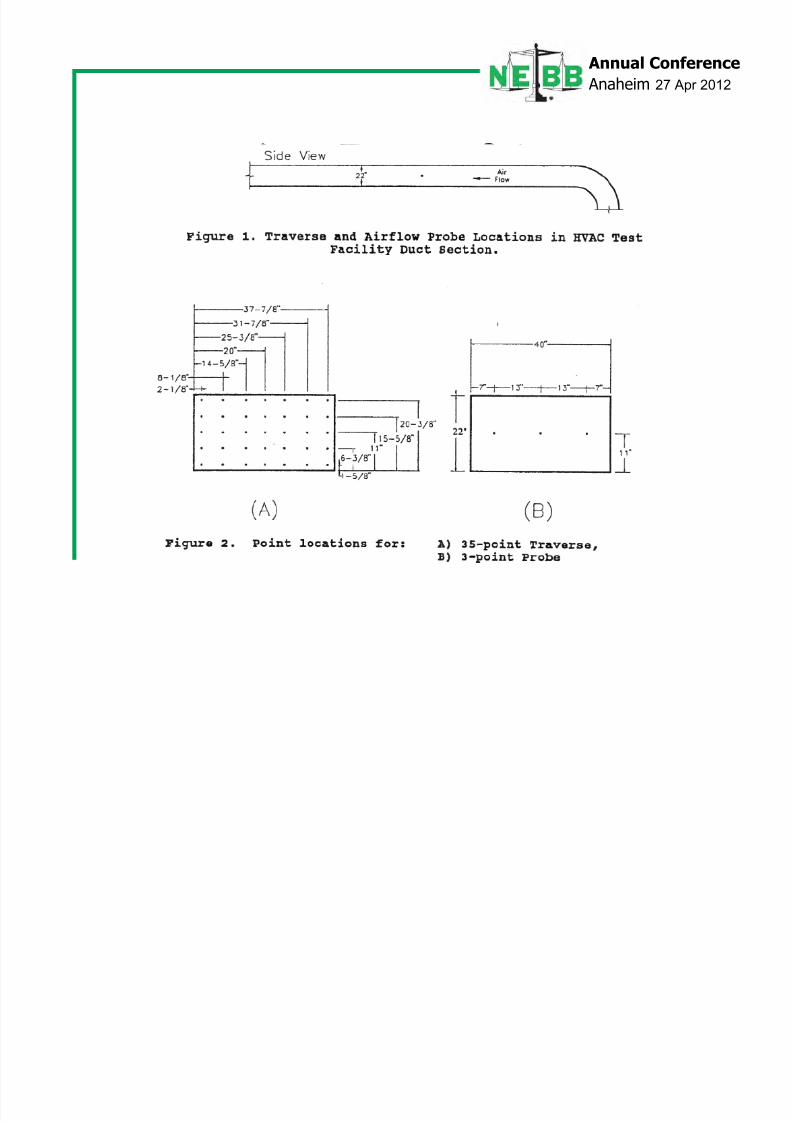
A research paper prepared by the Construction Engineering Research
Laboratory (CERL) in Champaign, IL (est. 1995-96) was presented at aUSACE Regional Conference.
The first three conclusions of their research are summarized below
(based on test comparisons using an early ducted BiG Thermistor 3-
sensor probe):• An air flow straightener is not required to get an accurate airflow
measurement
• Air flow instrumentation need not be located more than 2 duct
diameters downstream of an [unvaned - radiused] elbow
• A 3-point averaging air f low measurement instrument can
provide accuracy comparable to a 35-point traverse
measurement and to a measurement based on ASHRAEor SMACNA guidelines.
AIR FLOW MEASUREMENT ACCURACYDavid M. Schwenk
8/9/2019 2012 Velocity Measurement Technology Comparison
http://slidepdf.com/reader/full/2012-velocity-measurement-technology-comparison 11/69
Annual Conference
Anaheim 27 Apr 2012
Duct Traverse Points
8/9/2019 2012 Velocity Measurement Technology Comparison
http://slidepdf.com/reader/full/2012-velocity-measurement-technology-comparison 12/69
Annual Conference
Anaheim 27 Apr 2012
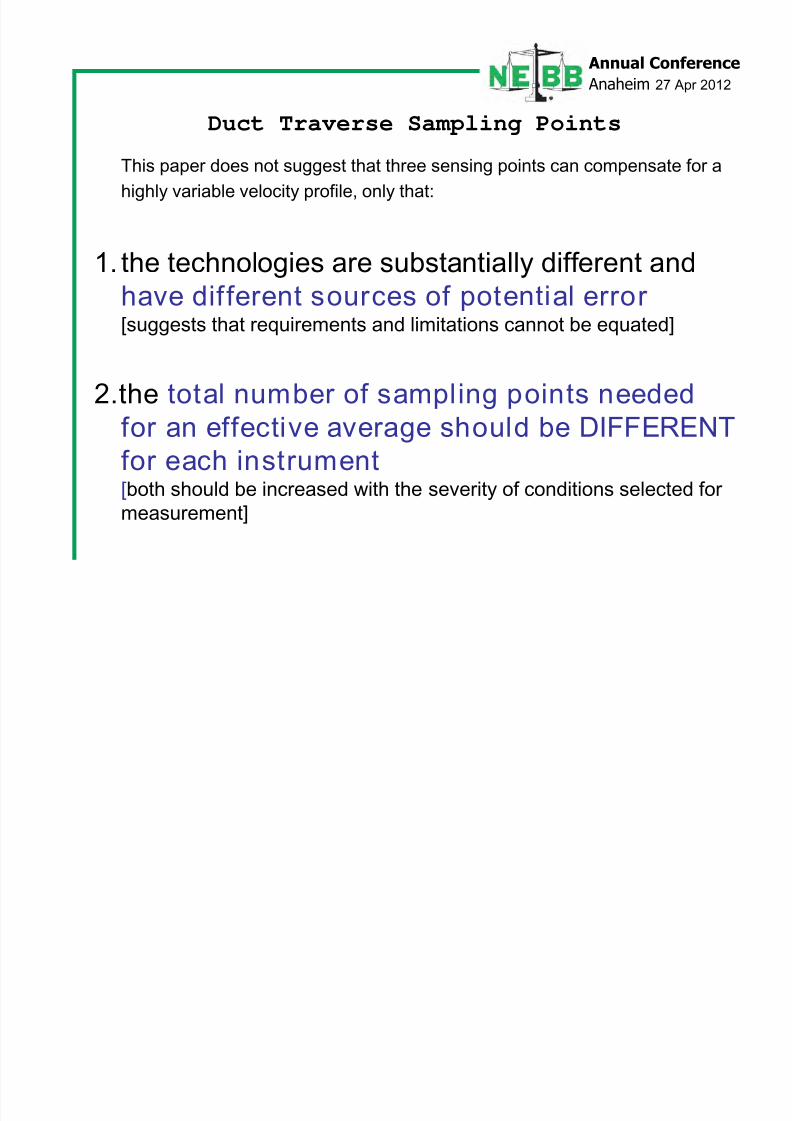
This paper does not suggest that three sensing points can compensate for a
highly variable velocity profile, only that:
1. the technologies are substantially different and
have different sources of potential error[suggests that requirements and limitations cannot be equated]
2.the total number of sampling points needed
for an effective average should be DIFFERENTfor each instrument[both should be increased with the severity of conditions selected for
measurement]
Duct Traverse Sampling Points
8/9/2019 2012 Velocity Measurement Technology Comparison
http://slidepdf.com/reader/full/2012-velocity-measurement-technology-comparison 13/69
Annual Conference
Anaheim 27 Apr 2012
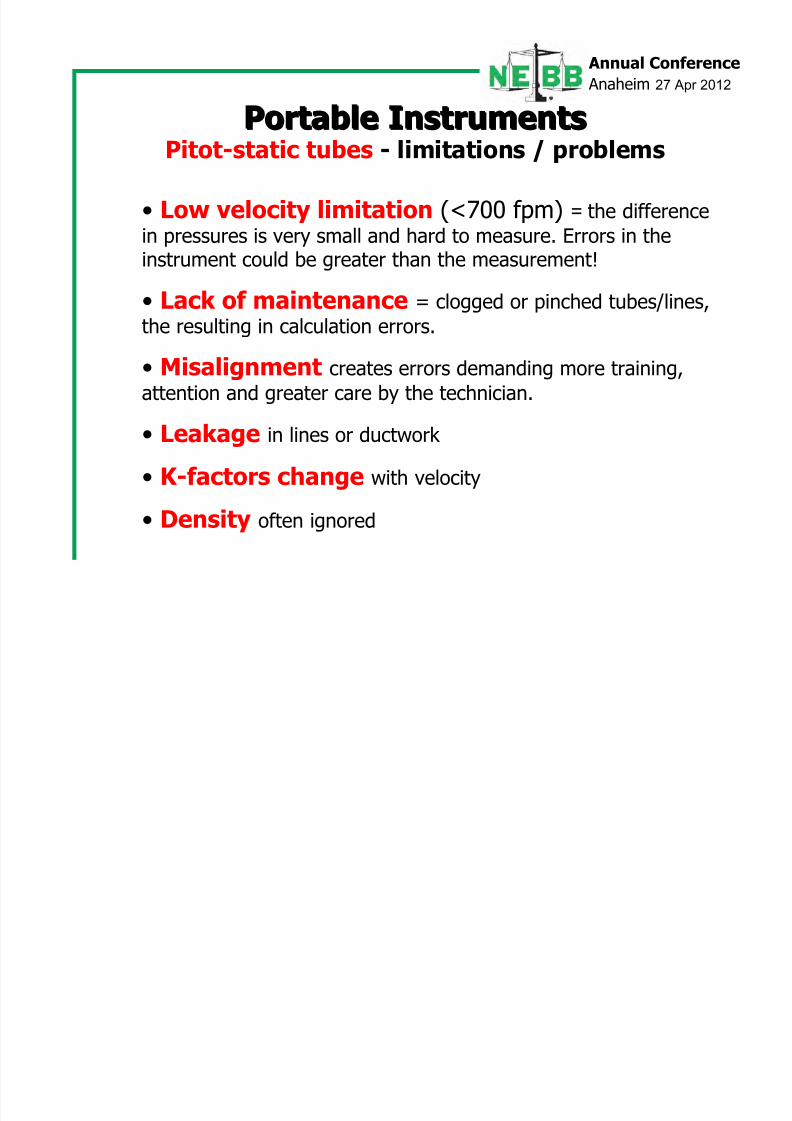
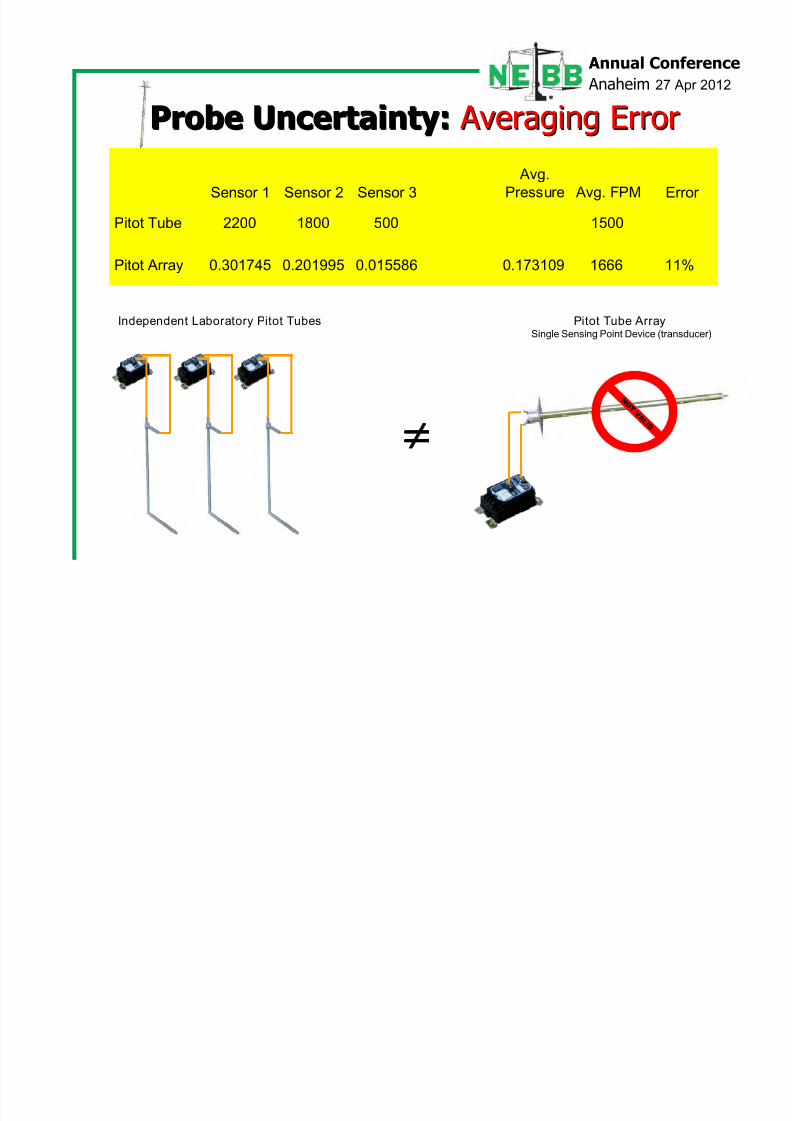
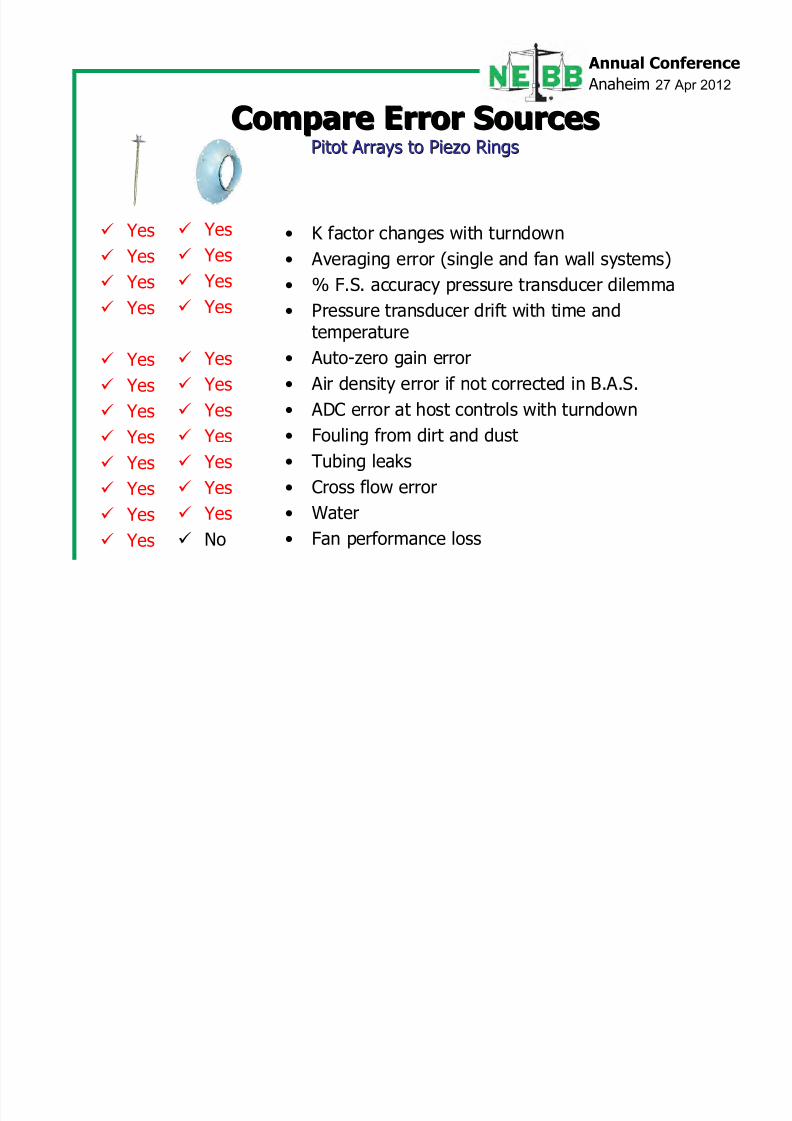
Portable InstrumentsPortable InstrumentsPitot-static tubes - limitations / problems
• Low velocity limitation (<700 fpm) = the differencein pressures is very small and hard to measure. Errors in theinstrument could be greater than the measurement!
• Lack of maintenance = clogged or pinched tubes/lines,
the resulting in calculation errors.
• Misalignment creates errors demanding more training,
attention and greater care by the technician.
• Leakage in lines or ductwork
• K-factors change with velocity
• Density often ignored
8/9/2019 2012 Velocity Measurement Technology Comparison
http://slidepdf.com/reader/full/2012-velocity-measurement-technology-comparison 14/69
Annual Conference
Anaheim 27 Apr 2012
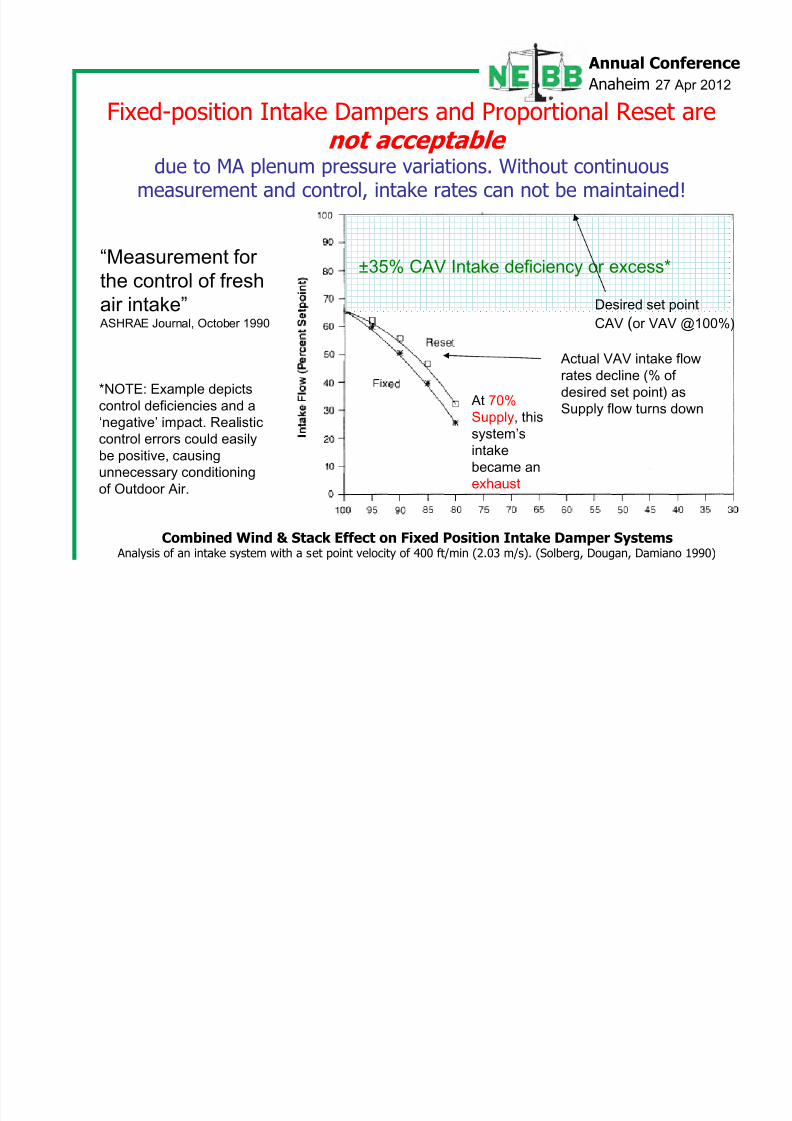
“Measurement for
the control of fresh
air intake” ASHRAE Journal, October 1990
Combined Wind & Stack Effect on Fixed Position Intake Damper Systems Analysis of an intake system with a set point velocity of 400 ft/min (2.03 m/s). (Solberg, Dougan, Damiano 1990)
±35% CAV Intake deficiency or excess*
Desired set point
CAV (or VAV @100%)
Actual VAV intake flow
rates decline (% of
desired set point) as
Supply flow turns down At 70%
Supply, this
system’sintake
became an
exhaust
*NOTE: Example depicts
control deficiencies and a
‘negative’ impact. Realistic
control errors could easily
be positive, causing
unnecessary conditioning
of Outdoor Air.
Fixed-position Intake Dampers and Proportional Reset arenot acceptable
due to MA plenum pressure variations. Without continuousmeasurement and control, intake rates can not be maintained!
8/9/2019 2012 Velocity Measurement Technology Comparison
http://slidepdf.com/reader/full/2012-velocity-measurement-technology-comparison 15/69
Annual Conference
Anaheim 27 Apr 2012
Fixed-position Intake Dampers and Proportional Reset arenot acceptable
due to MA plenum pressure variations. Without continuousmeasurement and control, intake rates can not be maintained!
ASHRAE Standards 62.1 (ventilation), 90.1 (energy), 189.1 (high
performance green buildings)
ICC Mechanical Code – IMC Chapter 4: Ventilation
LEED Rating Systems – 2009 and proposed 2012 certificationrequirements
CA Title XXIV Energy Code – 2009
1. Standards and Codes have effectively eliminated these methods bymaking it economically disadvantageous to use them.
2. The industry has embraced the energy savings potential of variable
speed/capacity/demand control to automatically adjust systems in
response to changing conditions.
3. This type of dynamic operation demands dynamic control. I N
D I R E C T
I N
D I R E C T
P
r e s s u r e
P
r e s s u r e
D I R
E C T
D I R
E C T
M o t i v a t o r s
M o t i v a t o r s
8/9/2019 2012 Velocity Measurement Technology Comparison
http://slidepdf.com/reader/full/2012-velocity-measurement-technology-comparison 16/69
Annual Conference
Anaheim 27 Apr 2012
Fixed-position Intake Dampers and Proportional Reset arenot acceptable
1. These historical system designs are dependant upon
TAB field measurements for set up and to verify
performance.
2. Intake systems (CAV and VAV) are very difficult to
measure directly
3. It’s nearly impossible to estimate them reliably
using indirect means allowed by most
guidelines/procedures (the assumptions requiredproduce a large amount of uncertainty in the result).
WHAT CAN WE DO?WHAT CAN WE DO?

8/9/2019 2012 Velocity Measurement Technology Comparison
http://slidepdf.com/reader/full/2012-velocity-measurement-technology-comparison 17/69
Annual Conference
Anaheim 27 Apr 2012
All Permanent
Instruments are not
Created Equal !!
Everything is NOT accurate to 2%, contrary totheir promotional l iterature, and especially not
under field conditions.
8/9/2019 2012 Velocity Measurement Technology Comparison
http://slidepdf.com/reader/full/2012-velocity-measurement-technology-comparison 18/69
Annual Conference
Anaheim 27 Apr 2012
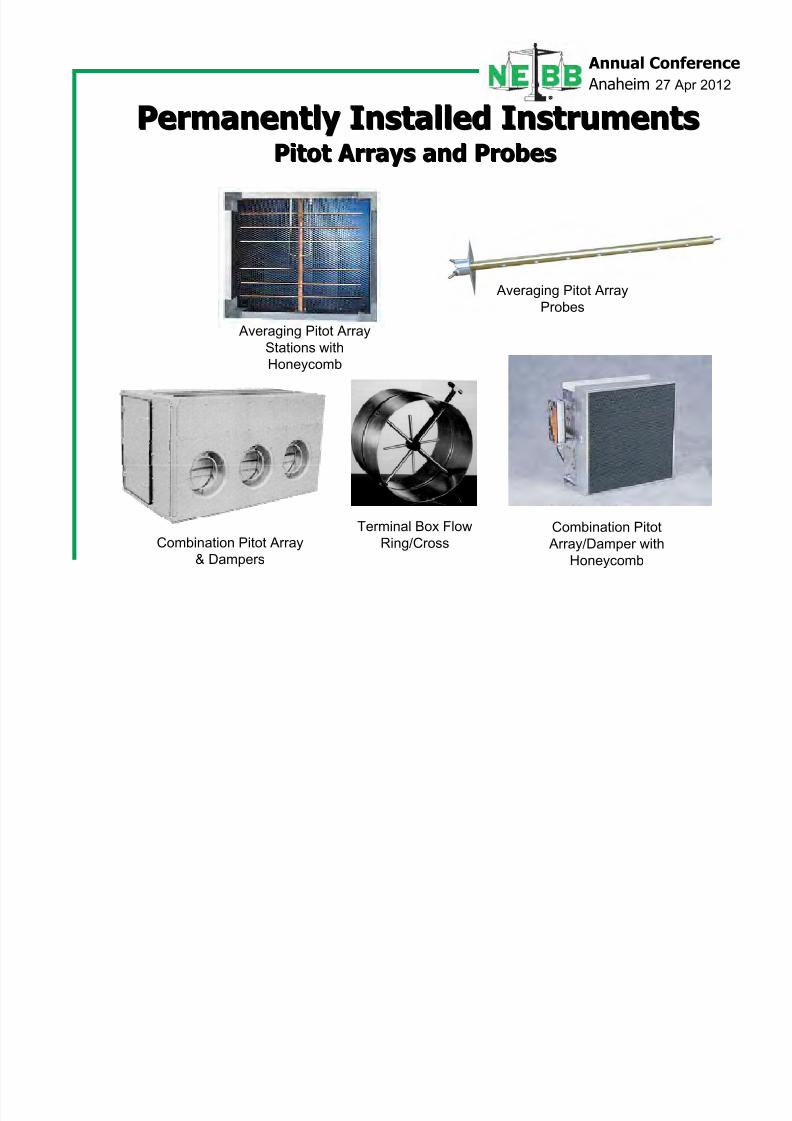
Permanently Installed InstrumentsPermanently Installed Instruments
Averaging Pitot Array
Stations with
Honeycomb
Averaging Pitot Array
Probes
Combination Pitot
Array/Damper with
Honeycomb
Combination Pitot Array& Dampers
Terminal Box Flow
Ring/Cross
Pitot Arrays and ProbesPitot Arrays and Probes
8/9/2019 2012 Velocity Measurement Technology Comparison
http://slidepdf.com/reader/full/2012-velocity-measurement-technology-comparison 19/69
Annual Conference
Anaheim 27 Apr 2012
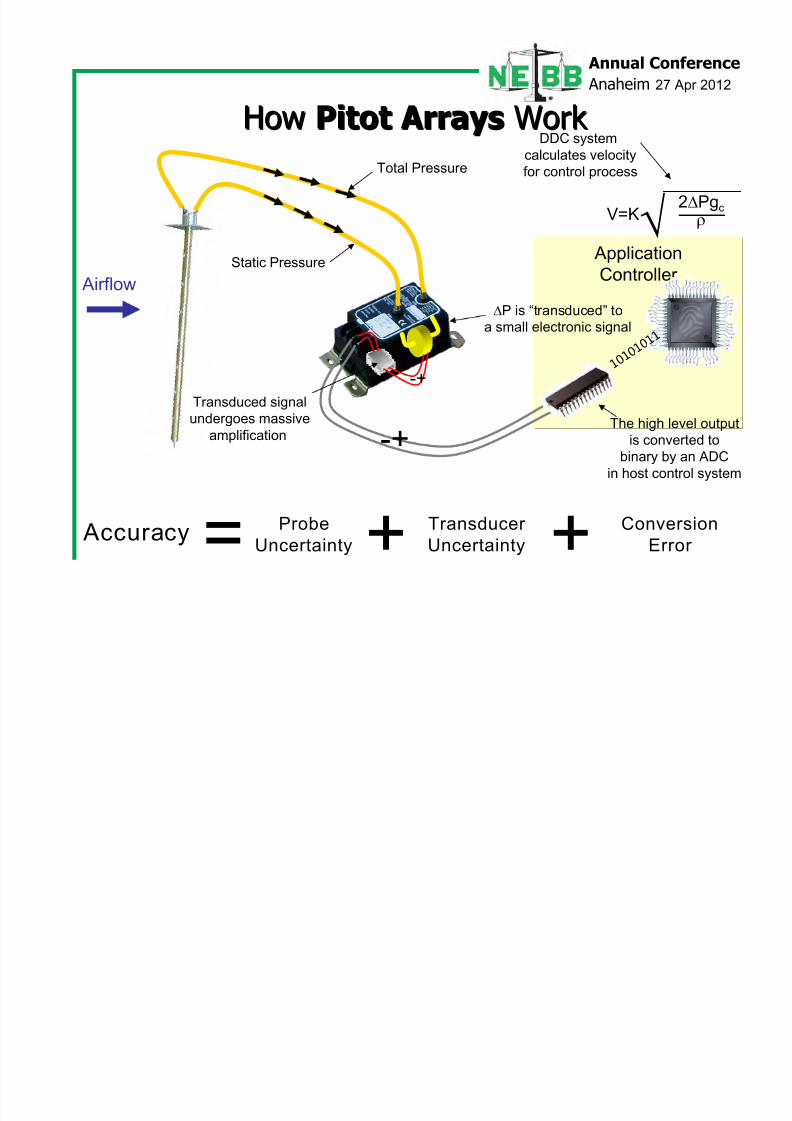
Application
Controller
HowHow Pitot ArraysPitot Arrays Work Work
1 0 1 0
1 0 1 1
Total Pressure
Static Pressure
P is “transduced” to
a small electronic signal
Transduced signal
undergoes massive
amplificationThe high level output
is converted to
binary by an ADC
in host control system
2Pgc
V=K
DDC system
calculates velocity
for control process
Airflow
-+
-+
+ +Probe
Uncertainty
Transducer
Uncertainty
Conversion
Error Accuracy
=
8/9/2019 2012 Velocity Measurement Technology Comparison
http://slidepdf.com/reader/full/2012-velocity-measurement-technology-comparison 20/69
Annual Conference
Anaheim 27 Apr 2012
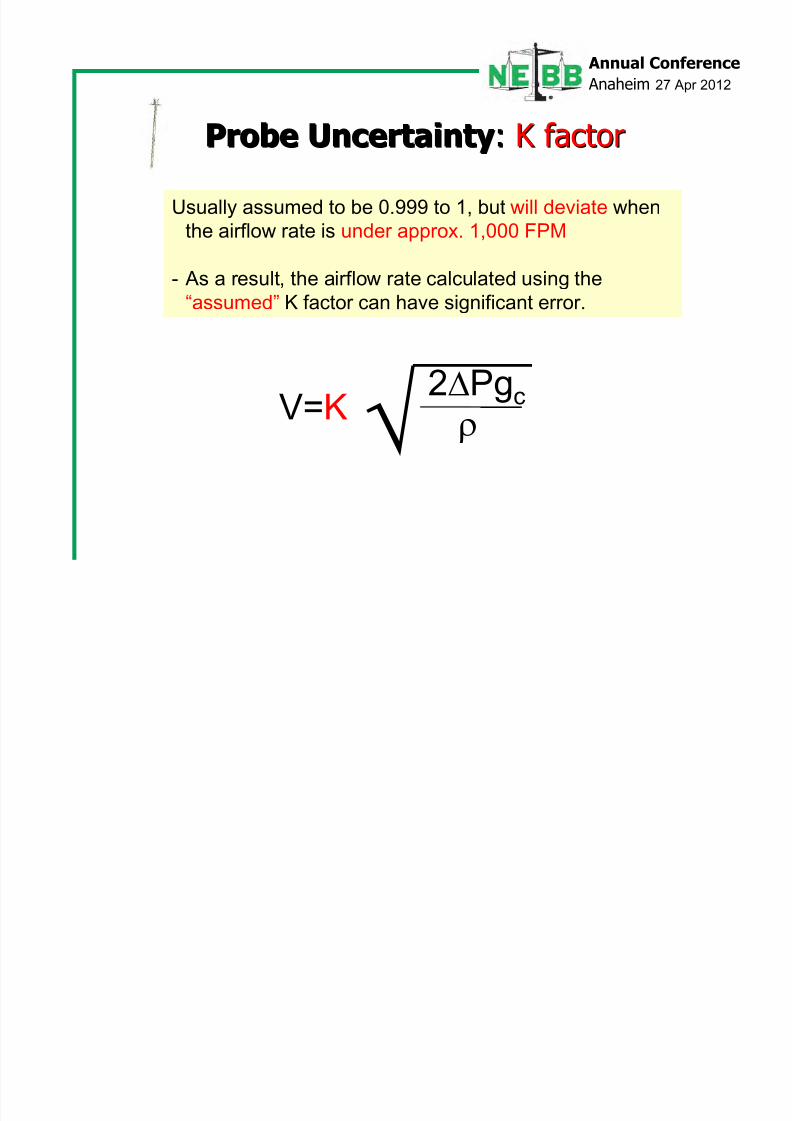
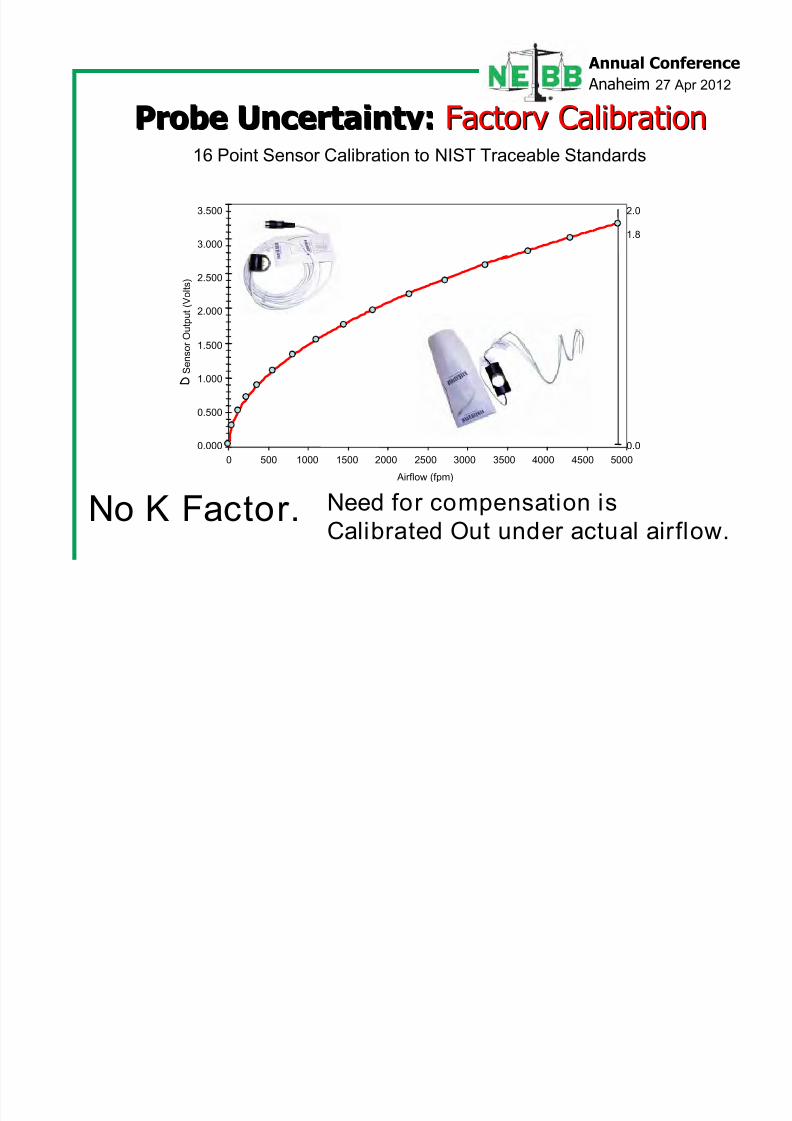
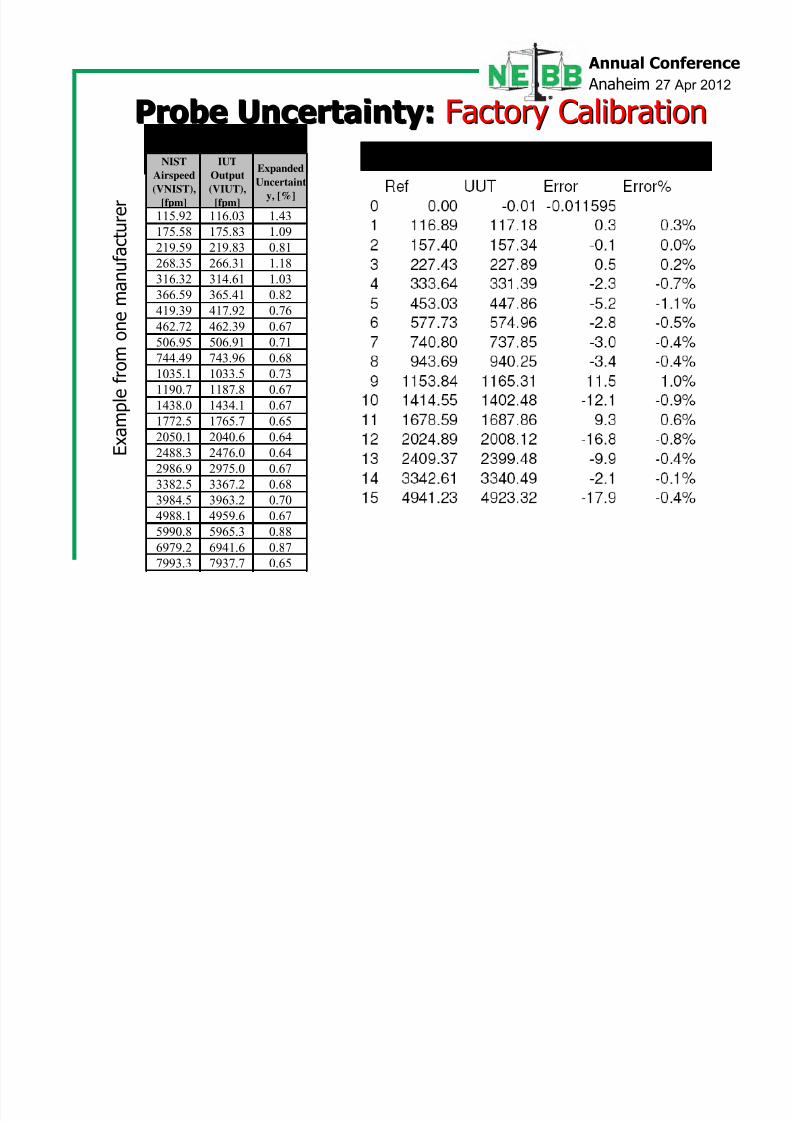
Probe UncertaintyProbe Uncertainty:: K K factorfactor
2PgcV=K
Usually assumed to be 0.999 to 1, but will deviate when
the airflow rate is under approx. 1,000 FPM
- As a result, the airflow rate calculated using the
“assumed” K factor can have significant error.
8/9/2019 2012 Velocity Measurement Technology Comparison
http://slidepdf.com/reader/full/2012-velocity-measurement-technology-comparison 21/69
8/9/2019 2012 Velocity Measurement Technology Comparison
http://slidepdf.com/reader/full/2012-velocity-measurement-technology-comparison 22/69
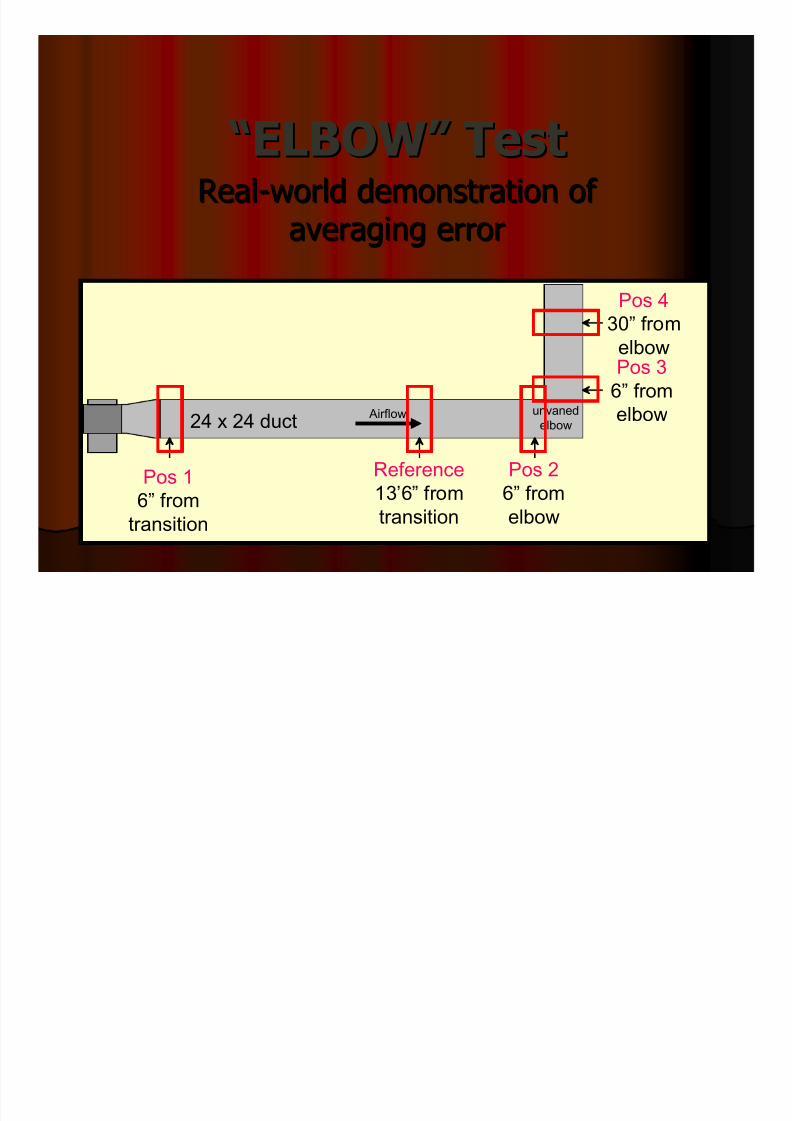
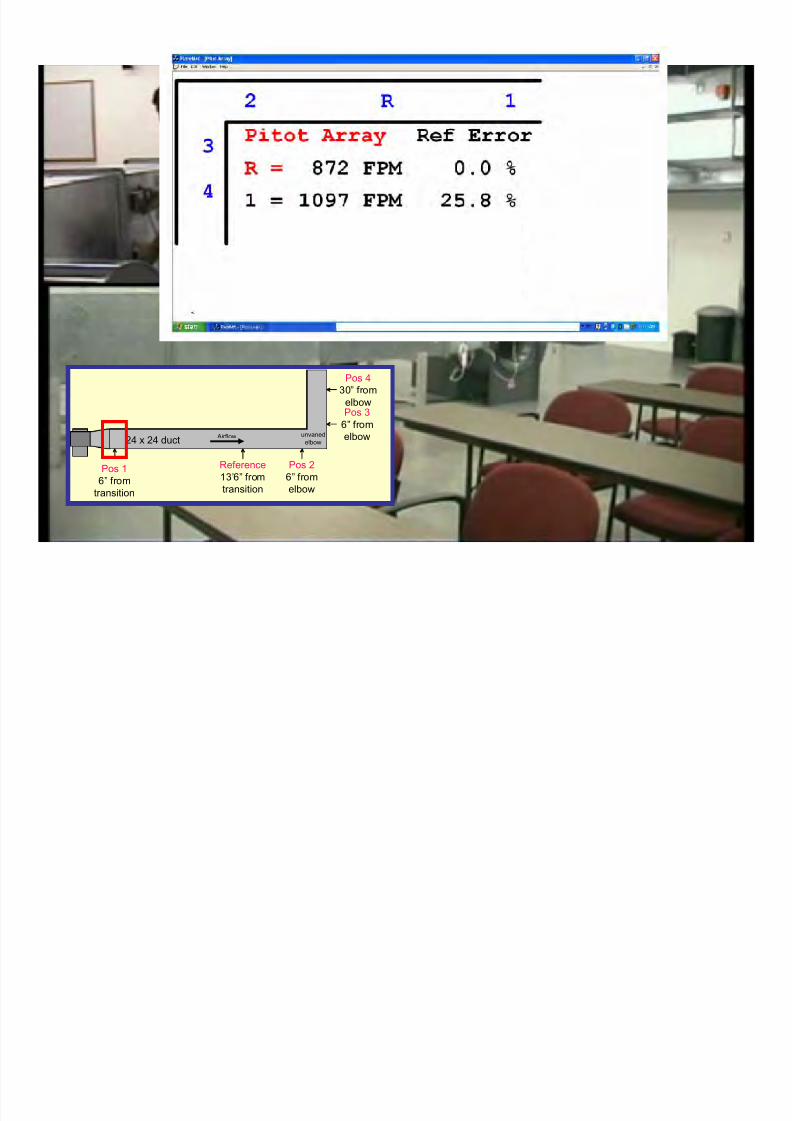
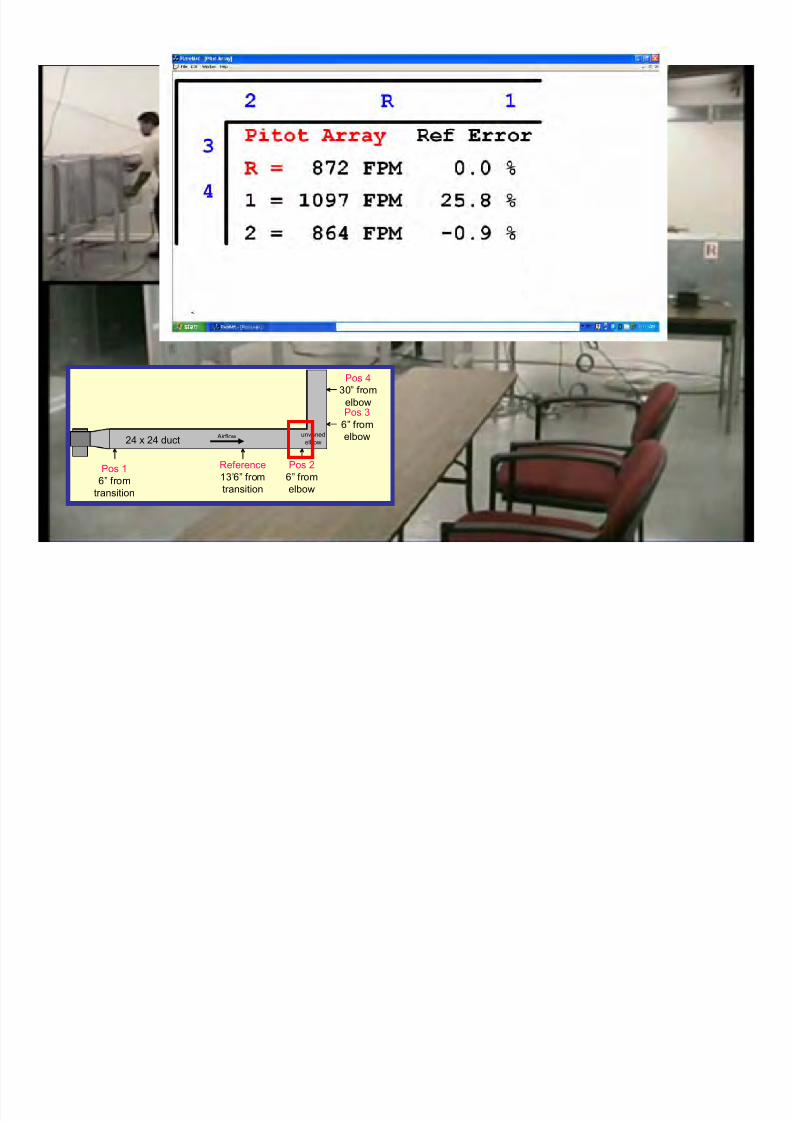
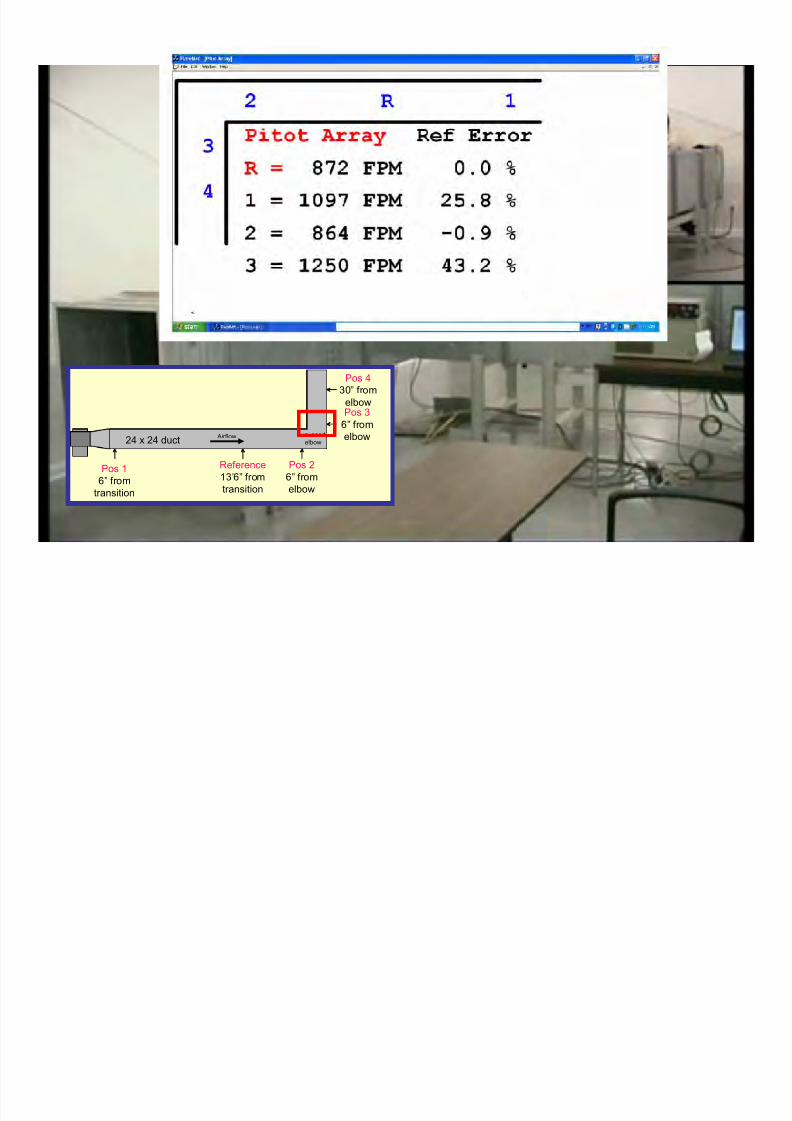
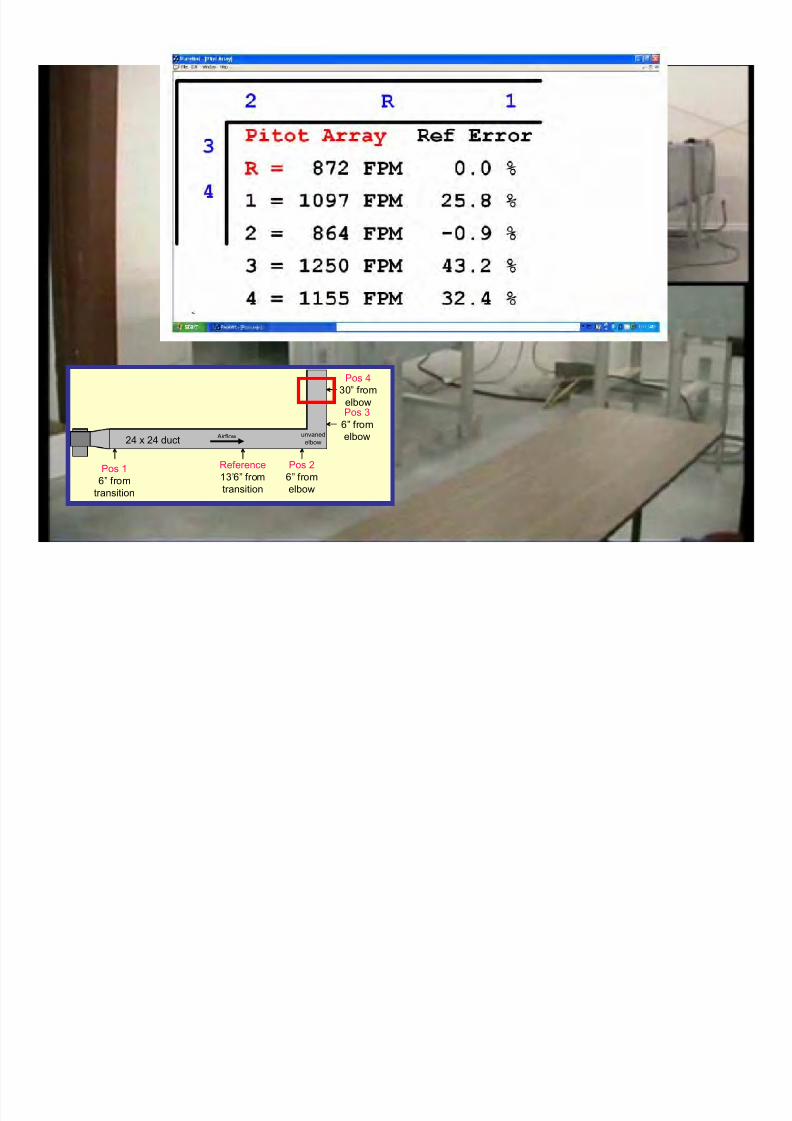
“ “ELBOWELBOW” ” TestTestRealReal--world demonstration ofworld demonstration of
averaging erroraveraging error
Pos 1
6” from
transition
Reference
13’6” from
transition
Pos 2
6” from
elbow
Pos 3
6” from
elbow
Pos 4
30” fromelbow
unvaned
elbow24 x 24 duct Airflow
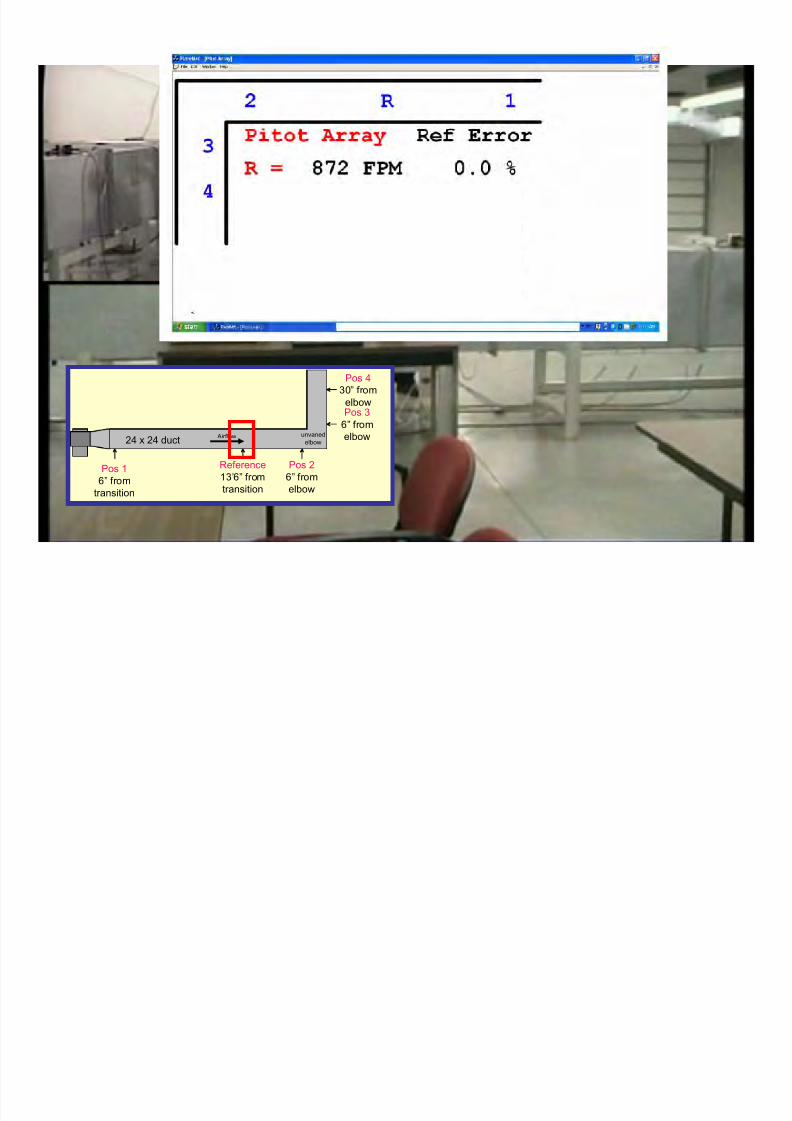
8/9/2019 2012 Velocity Measurement Technology Comparison
http://slidepdf.com/reader/full/2012-velocity-measurement-technology-comparison 23/69
Pos 1
6” from
transition
Reference
13’6” from
transition
Pos 2
6” from
elbow
Pos 3
6” from
elbow
Pos 4
30” from
elbow
unvanedelbow24 x 24 duct
Airflow
8/9/2019 2012 Velocity Measurement Technology Comparison
http://slidepdf.com/reader/full/2012-velocity-measurement-technology-comparison 24/69
Pos 1
6” from
transition
Reference
13’6” from
transition
Pos 2
6” from
elbow
Pos 3
6” from
elbow
Pos 4
30” from
elbow
unvanedelbow24 x 24 duct
Airflow
8/9/2019 2012 Velocity Measurement Technology Comparison
http://slidepdf.com/reader/full/2012-velocity-measurement-technology-comparison 25/69
Pos 1
6” from
transition
Reference
13’6” from
transition
Pos 2
6” from
elbow
Pos 3
6” from
elbow
Pos 4
30” from
elbow
unvanedelbow24 x 24 duct
Airflow
8/9/2019 2012 Velocity Measurement Technology Comparison
http://slidepdf.com/reader/full/2012-velocity-measurement-technology-comparison 26/69
Pos 1
6” from
transition
Reference
13’6” from
transition
Pos 2
6” from
elbow
Pos 3
6” from
elbow
Pos 4
30” from
elbow
unvanedelbow24 x 24 duct
Airflow
8/9/2019 2012 Velocity Measurement Technology Comparison
http://slidepdf.com/reader/full/2012-velocity-measurement-technology-comparison 27/69
Pos 1
6” from
transition
Reference
13’6” from
transition
Pos 2
6” from
elbow
Pos 3
6” from
elbow
Pos 4
30” from
elbow
unvanedelbow24 x 24 duct
Airflow
8/9/2019 2012 Velocity Measurement Technology Comparison
http://slidepdf.com/reader/full/2012-velocity-measurement-technology-comparison 28/69
Annual Conference
Anaheim 27 Apr 2012
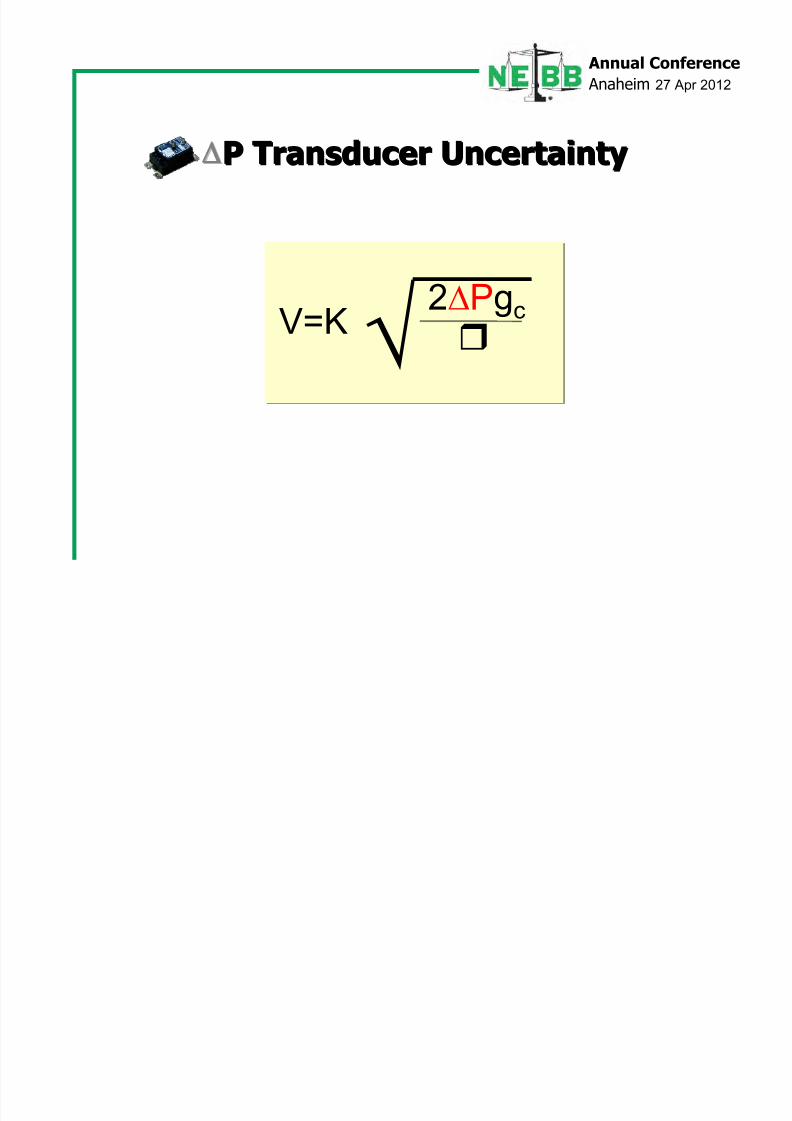
P Transducer UncertaintyP Transducer Uncertainty
2PgcV=K
8/9/2019 2012 Velocity Measurement Technology Comparison
http://slidepdf.com/reader/full/2012-velocity-measurement-technology-comparison 29/69
Annual Conference
Anaheim 27 Apr 2012
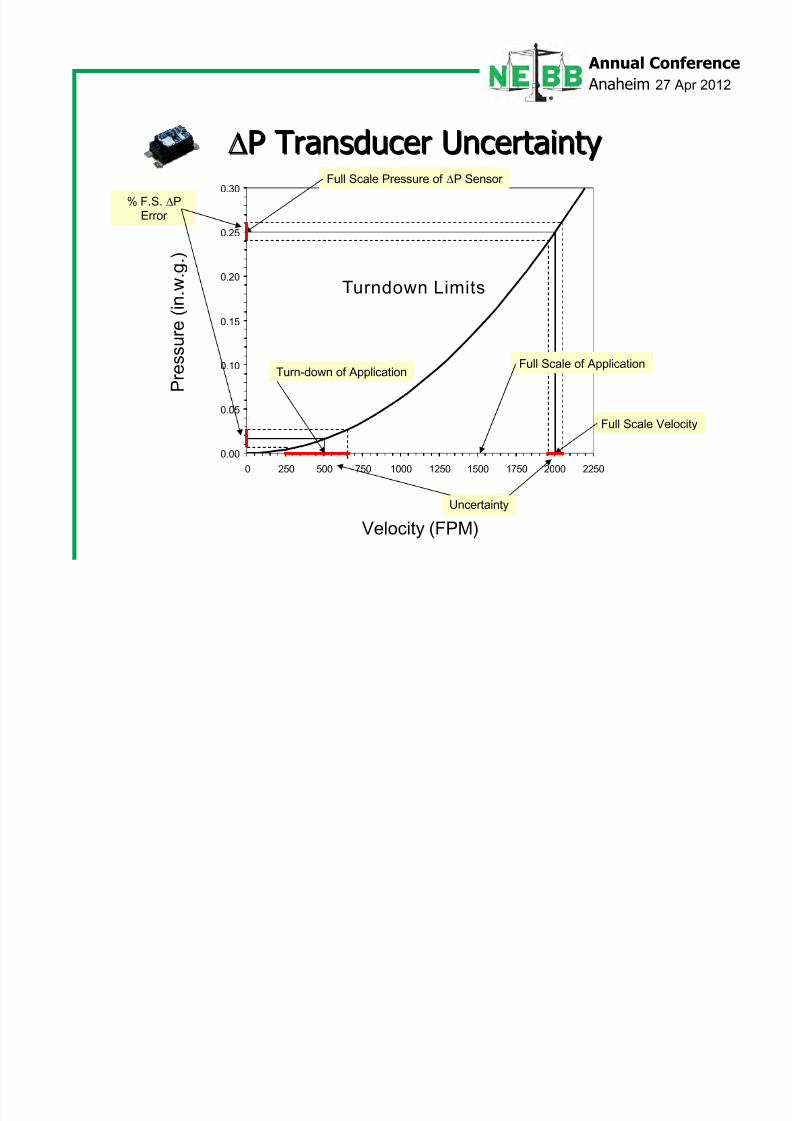
0.00
0.05
0.10
0.15
0.20
0.25
0.30
0 250 500 750 1000 1250 1500 1750 2000 2250
Full Scale Pressure of P Sensor
Full Scale Velocity
Full Scale of ApplicationTurn-down of Application
% F.S. P
Error
Uncertainty
P Transducer UncertaintyP Transducer Uncertainty
Velocity (FPM)
P r e s s u r e
( i n . w . g . )
Turndown Limits
8/9/2019 2012 Velocity Measurement Technology Comparison
http://slidepdf.com/reader/full/2012-velocity-measurement-technology-comparison 30/69
Annual Conference
Anaheim 27 Apr 2012
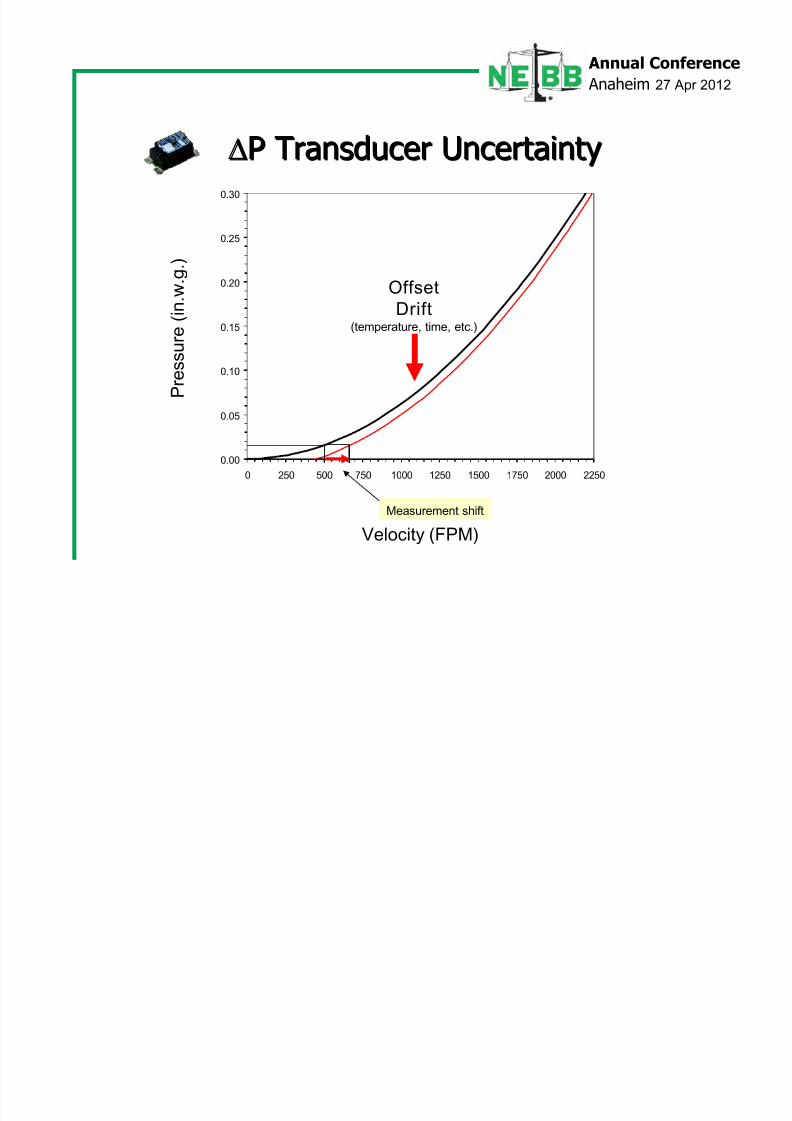
0.00
0.05
0.10
0.15
0.20
0.25
0.30
0 250 500 750 1000 1250 1500 1750 2000 2250
P Transducer UncertaintyP Transducer Uncertainty
Velocity (FPM)
P r e s s u r e
( i n . w . g . )
Offset
Drift
(temperature, time, etc.)
Measurement shift
8/9/2019 2012 Velocity Measurement Technology Comparison
http://slidepdf.com/reader/full/2012-velocity-measurement-technology-comparison 31/69
Annual Conference
Anaheim 27 Apr 2012
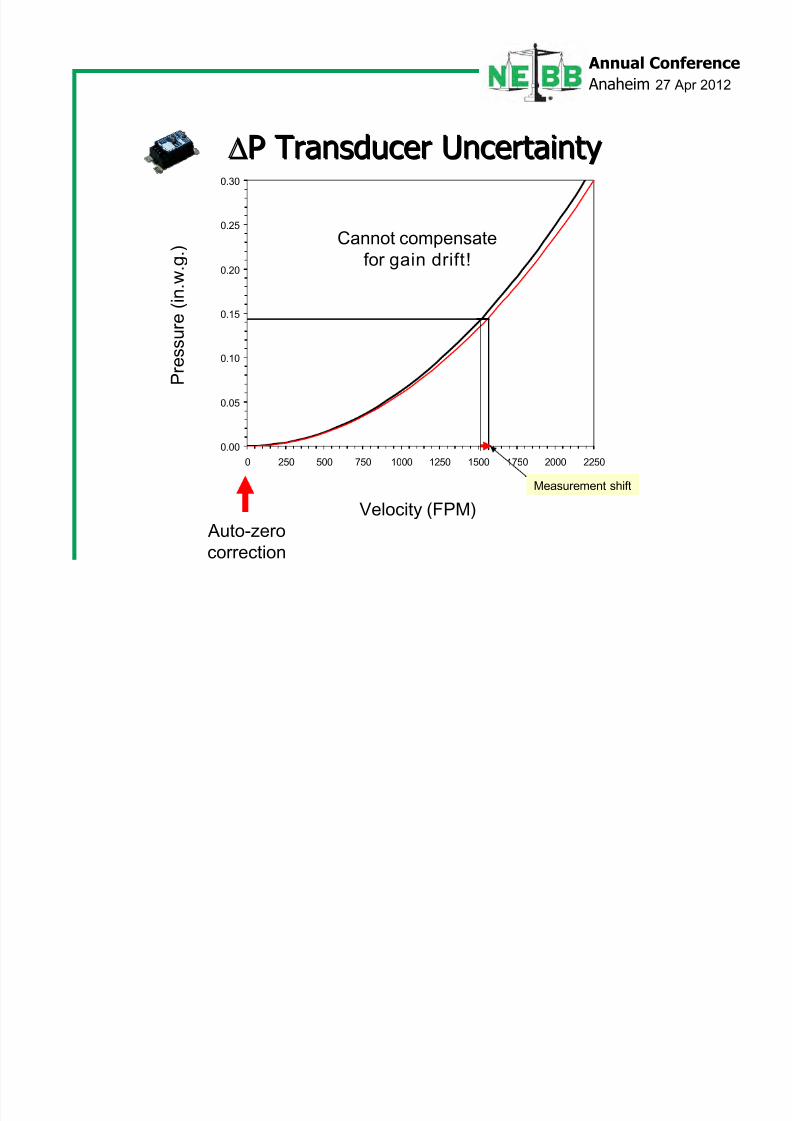
P Transducer UncertaintyP Transducer Uncertainty
0.00
0.05
0.10
0.15
0.20
0.25
0.30
0 250 500 750 1000 1250 1500 1750 2000 2250
Auto-zero
correction
Cannot compensate
for gain drift!
Measurement shift
Velocity (FPM)
P r e s s u r
e ( i n . w . g . )
8/9/2019 2012 Velocity Measurement Technology Comparison
http://slidepdf.com/reader/full/2012-velocity-measurement-technology-comparison 32/69
Annual Conference
Anaheim 27 Apr 2012
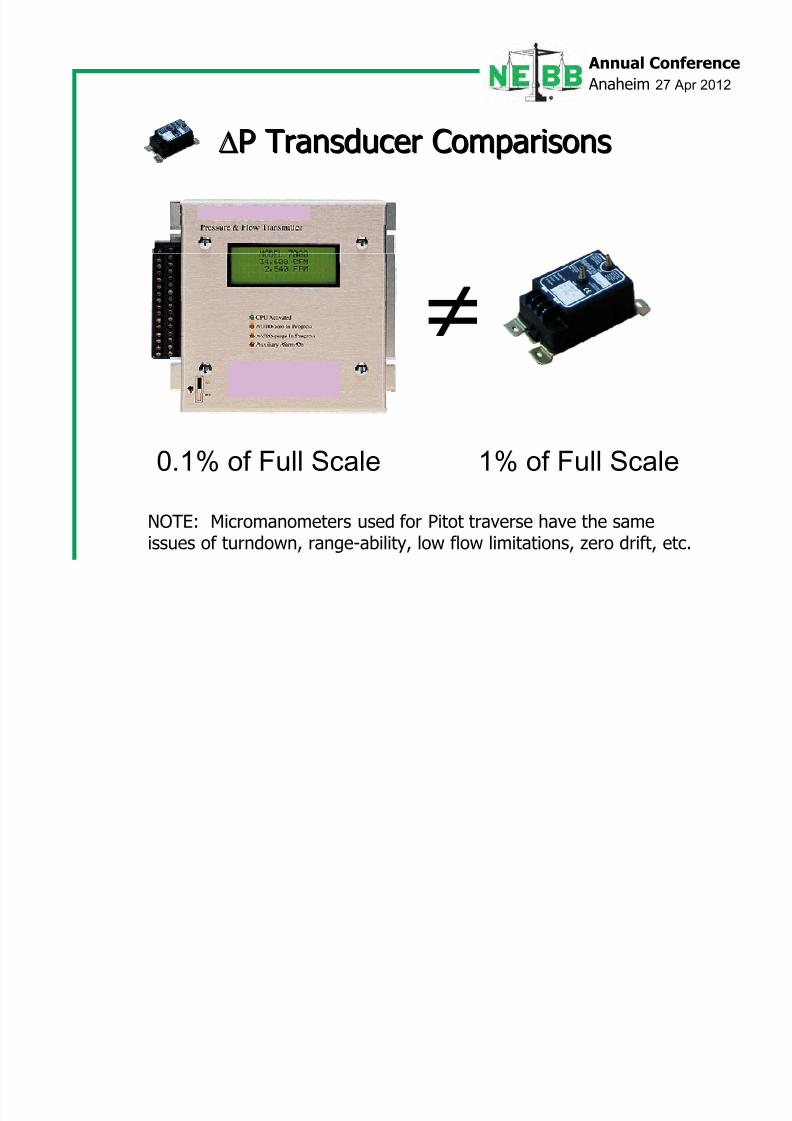
P Transducer ComparisonsP Transducer Comparisons
0.1% of Full Scale 1% of Full Scale
NOTE: Micromanometers used for Pitot traverse have the same
issues of turndown, range-ability, low flow limitations, zero drift, etc.
8/9/2019 2012 Velocity Measurement Technology Comparison
http://slidepdf.com/reader/full/2012-velocity-measurement-technology-comparison 33/69
Annual Conference
Anaheim 27 Apr 2012
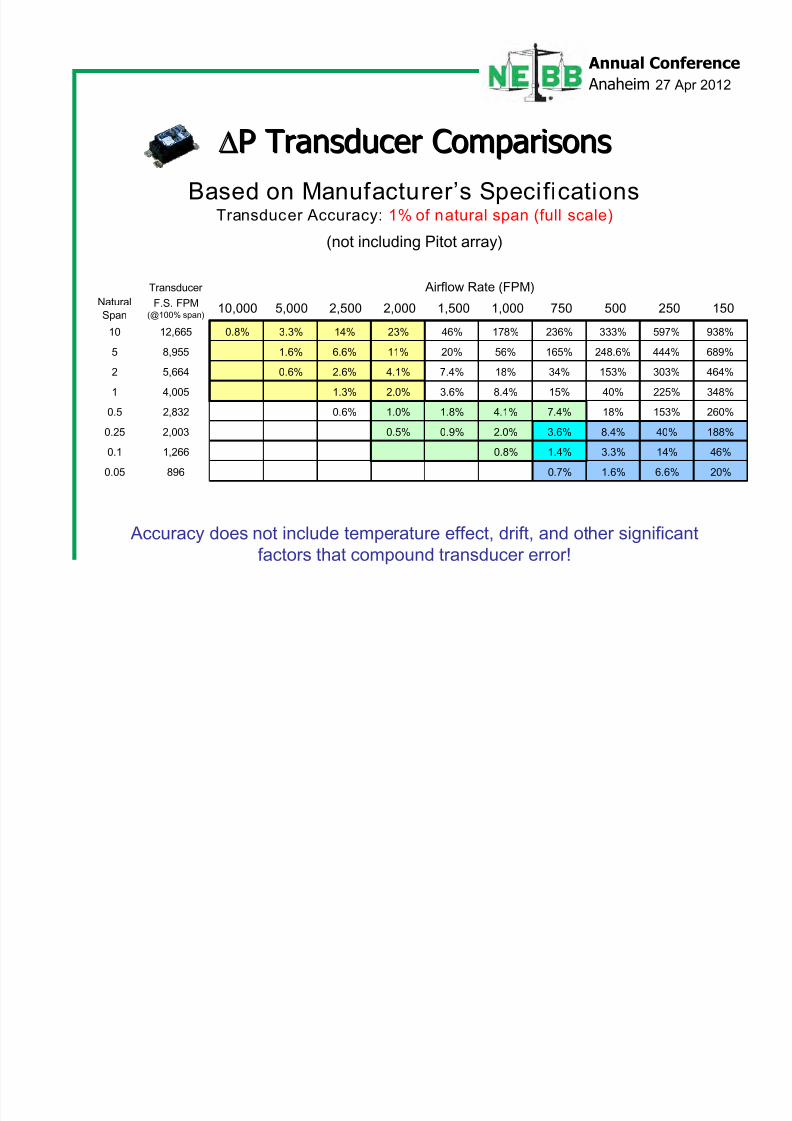
Based on Manufacturer’s Specifications
Transducer Accuracy: 1% of natural span (full scale)(not including Pitot array)
Transducer
Natural
SpanF.S. FPM
(@100% span)10,000 5,000 2,500 2,000 1,500 1,000 750 500 250 150
10 12,665 0.8% 3.3% 14% 23% 46% 178% 236% 333% 597% 938%
5 8,955 1.6% 6.6% 11% 20% 56% 165% 248.6% 444% 689%
2 5,664 0.6% 2.6% 4.1% 7.4% 18% 34% 153% 303% 464%
1 4,005 1.3% 2.0% 3.6% 8.4% 15% 40% 225% 348%
0.5 2,832 0.6% 1.0% 1.8% 4.1% 7.4% 18% 153% 260%
0.25 2,003 0.5% 0.9% 2.0% 3.6% 8.4% 40% 188%
0.1 1,266 0.8% 1.4% 3.3% 14% 46%
0.05 896 0.7% 1.6% 6.6% 20%
Airflow Rate (FPM)
Accuracy does not include temperature effect, drift, and other significantfactors that compound transducer error!
P Transducer ComparisonsP Transducer Comparisons
8/9/2019 2012 Velocity Measurement Technology Comparison
http://slidepdf.com/reader/full/2012-velocity-measurement-technology-comparison 34/69
8/9/2019 2012 Velocity Measurement Technology Comparison
http://slidepdf.com/reader/full/2012-velocity-measurement-technology-comparison 35/69
Annual Conference
Anaheim 27 Apr 2012
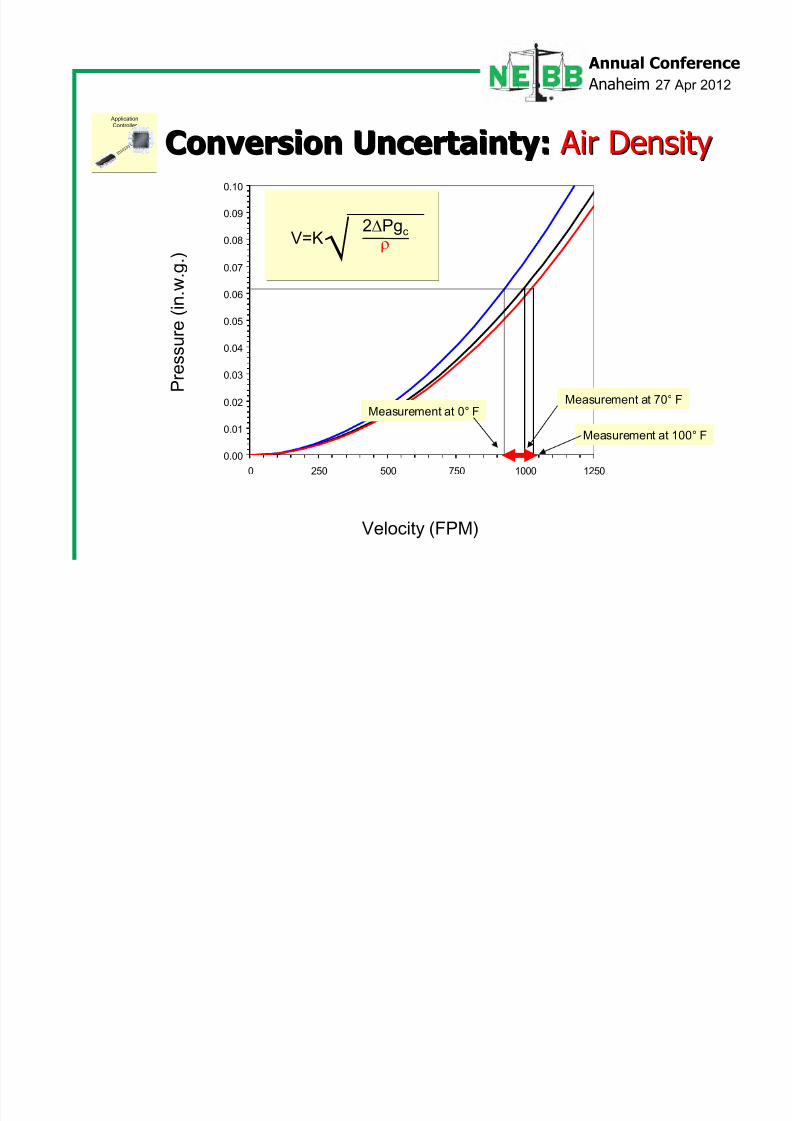
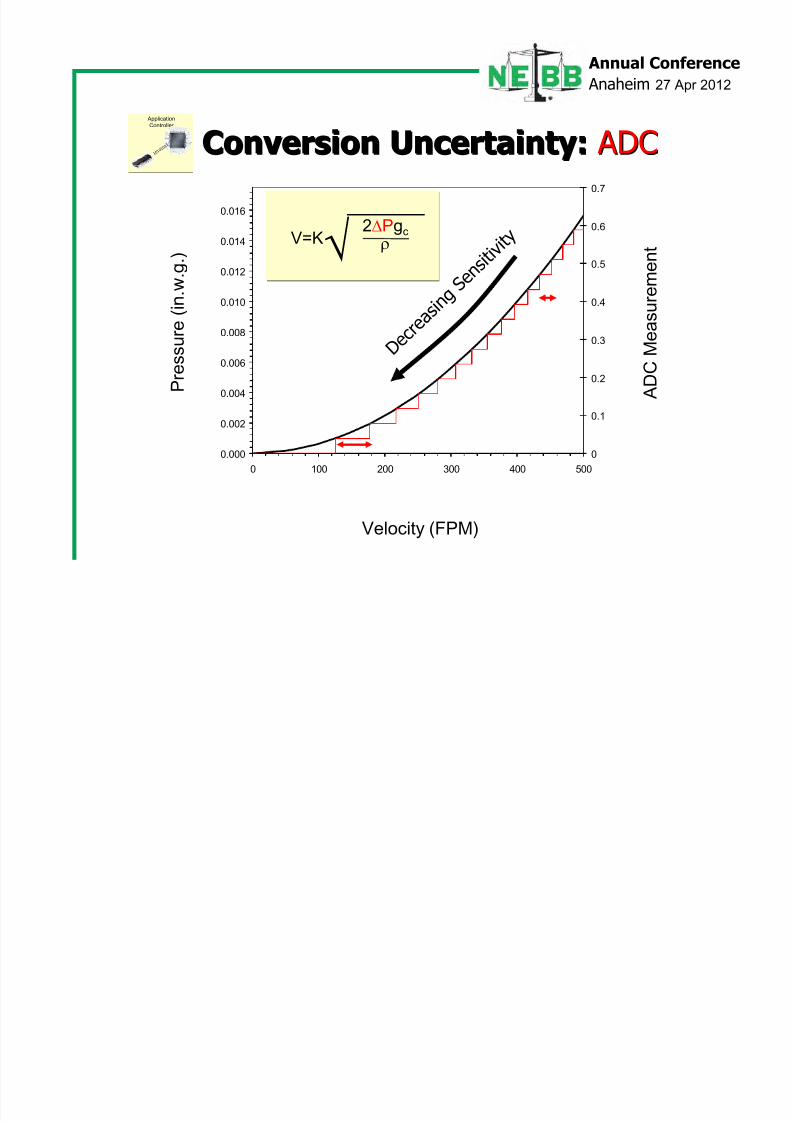
Conversion Uncertainty:Conversion Uncertainty: ADC ADC
0.000
0.002
0.004
0.006
0.008
0.010
0.012
0.014
0.016
0 100 200 300 400 500
0
0.1
0.2
0.3
0.4
0.5
0.6
0.7
Velocity (FPM)
P r e s s u r e
( i n . w . g . )
A D C
M e a
s u r e m e n t
2PgcV=K
Application
Controller
1 0 1 0
1 0 1 1
D e c r e
a s i n
g S e
n s i t i
v i t y
8/9/2019 2012 Velocity Measurement Technology Comparison
http://slidepdf.com/reader/full/2012-velocity-measurement-technology-comparison 36/69
Annual Conference
Anaheim 27 Apr 2012
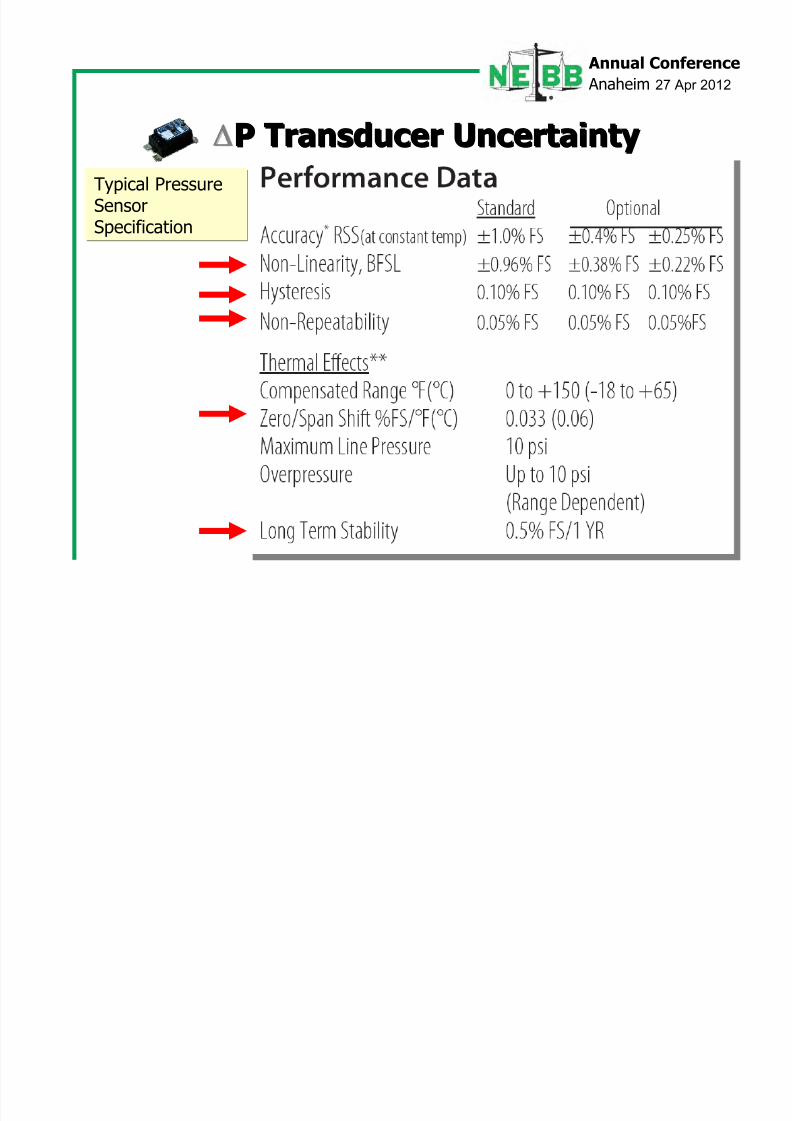
P TransducerP Transducer UncertaintyUncertainty
Typical PressureSensor
Specification
8/9/2019 2012 Velocity Measurement Technology Comparison
http://slidepdf.com/reader/full/2012-velocity-measurement-technology-comparison 37/69
Annual Conference
Anaheim 27 Apr 2012
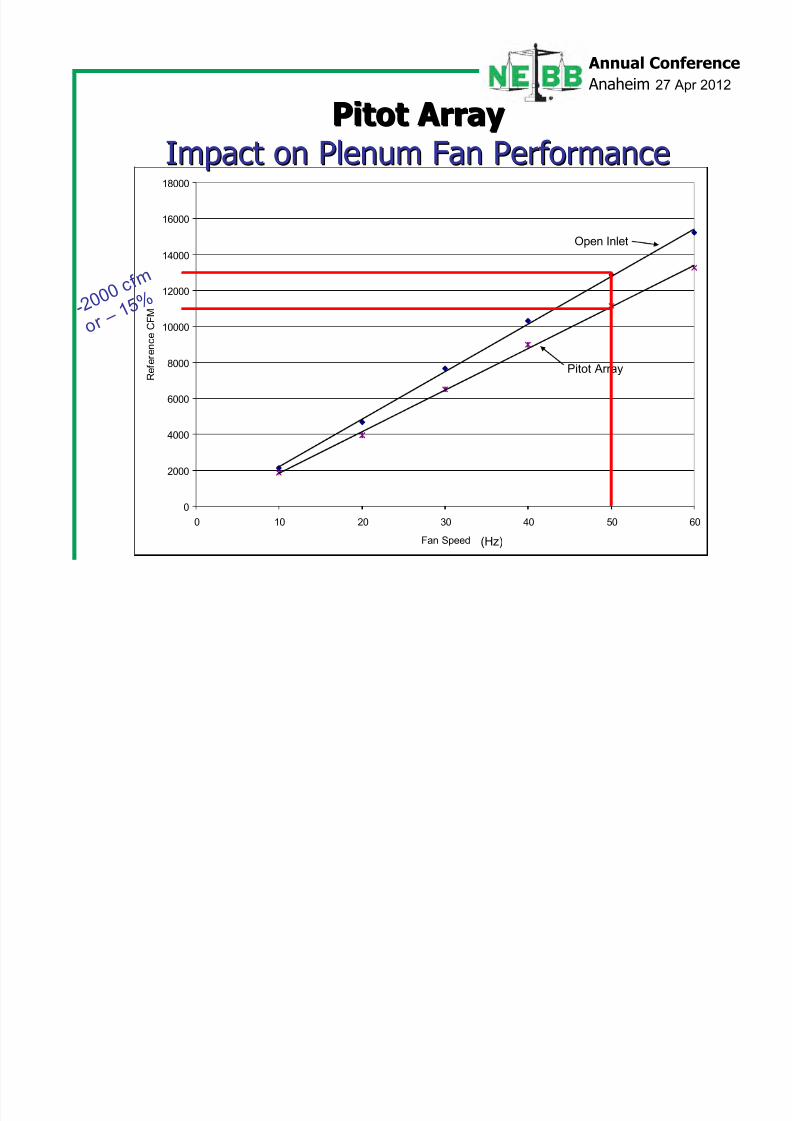
0
2000
4000
6000
8000
10000
12000
14000
16000
18000
0 10 20 30 40 50 60
Fan Speed
R e f e r e n c e C
F M
Open Inlet
Pitot Array
- 2 0 0 0
c f m
o r –
1 5 %
(Hz)
Pitot ArrayPitot ArrayImpact on Plenum Fan PerformanceImpact on Plenum Fan Performance
8/9/2019 2012 Velocity Measurement Technology Comparison
http://slidepdf.com/reader/full/2012-velocity-measurement-technology-comparison 38/69
Annual Conference
Anaheim 27 Apr 2012
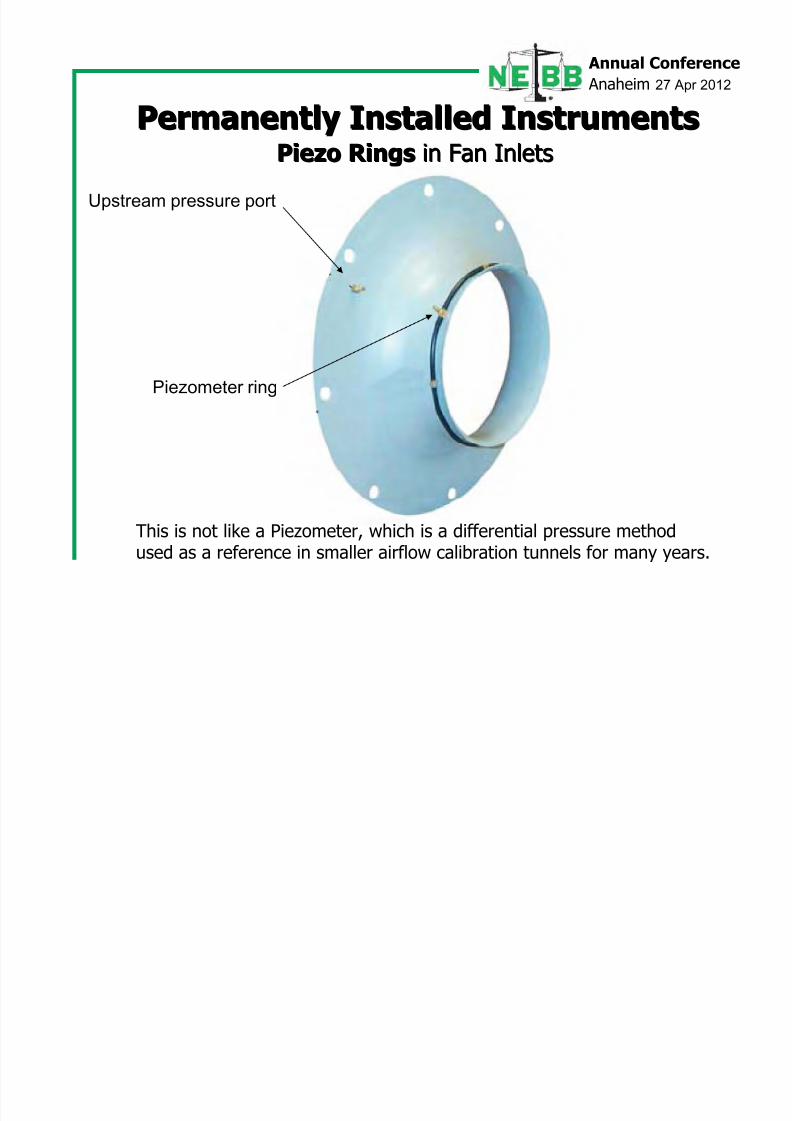
Piezo RingsPiezo Rings in Fan Inletsin Fan Inlets
Upstream pressure port
Piezometer ring
This is not like a Piezometer, which is a differential pressure methodused as a reference in smaller airflow calibration tunnels for many years.
Permanently Installed InstrumentsPermanently Installed Instruments
l f
8/9/2019 2012 Velocity Measurement Technology Comparison
http://slidepdf.com/reader/full/2012-velocity-measurement-technology-comparison 39/69
Annual Conference
Anaheim 27 Apr 2012
Application
Controller
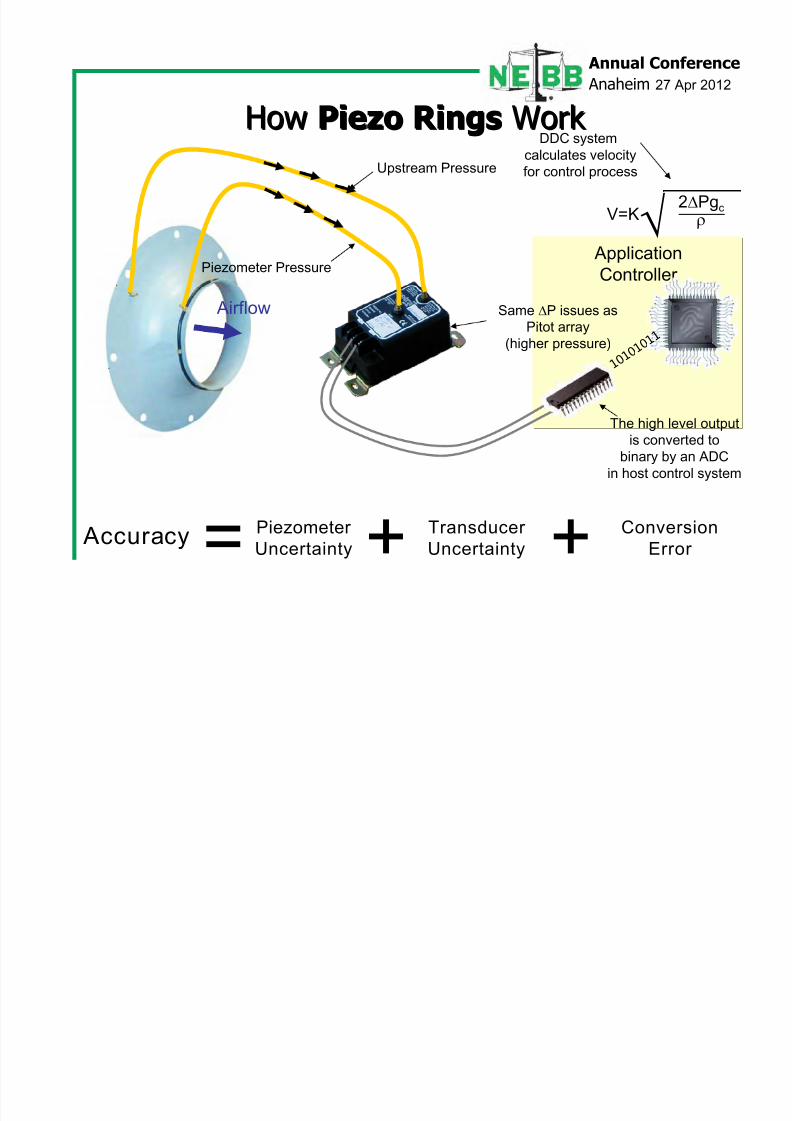
HowHow Piezo RingsPiezo Rings Work Work
1 0 1 0
1 0 1 1
Upstream Pressure
Piezometer Pressure
Same P issues as
Pitot array(higher pressure)
The high level output
is converted tobinary by an ADC
in host control system
2Pgc
V=K
DDC system
calculates velocity
for control process
Airflow
+ +Piezometer
Uncertainty
Transducer
Uncertainty
Conversion
Error Accuracy
=
8/9/2019 2012 Velocity Measurement Technology Comparison
http://slidepdf.com/reader/full/2012-velocity-measurement-technology-comparison 40/69
Ann al Confe ence
8/9/2019 2012 Velocity Measurement Technology Comparison
http://slidepdf.com/reader/full/2012-velocity-measurement-technology-comparison 41/69
Annual Conference
Anaheim 27 Apr 2012
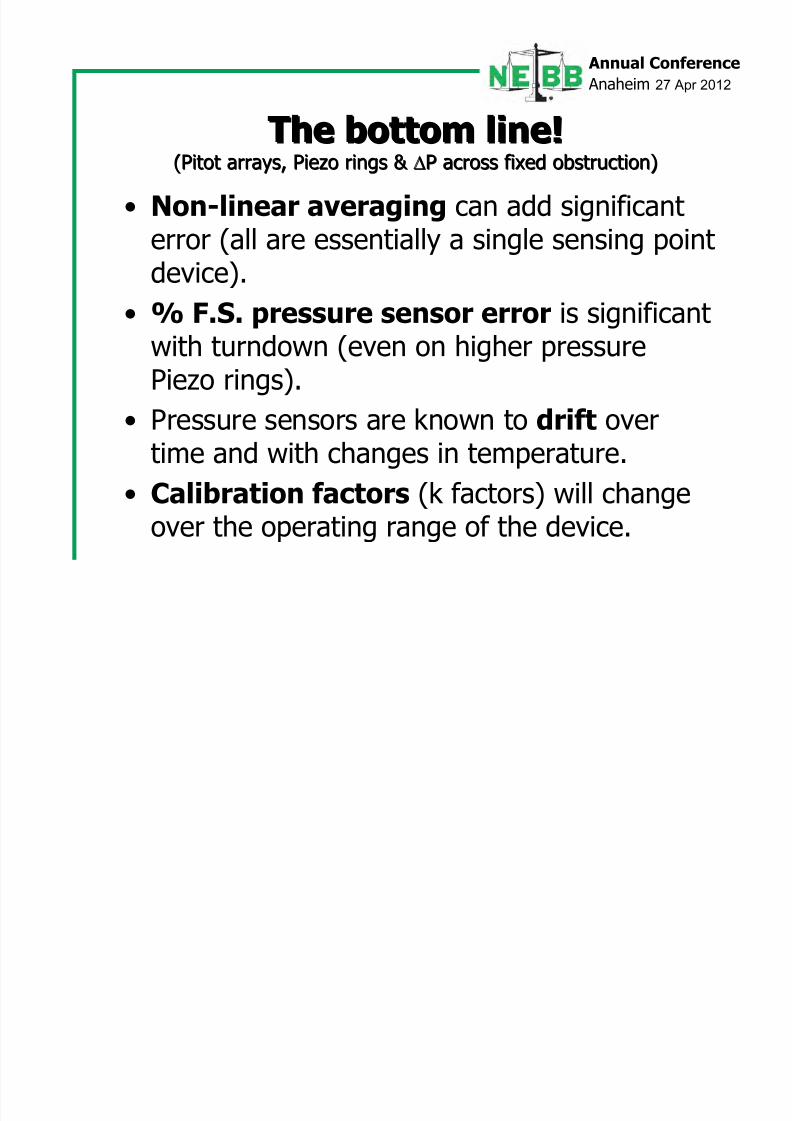
The bottom line!The bottom line!(Pitot arrays, Piezo rings &(Pitot arrays, Piezo rings & P across fixed obstruction)P across fixed obstruction)
• Non-linear averaging can add significanterror (all are essentially a single sensing pointdevice).
• % F.S. pressure sensor error is significantwith turndown (even on higher pressurePiezo rings).
• Pressure sensors are known to drift overtime and with changes in temperature.
• Calibration factors (k factors) will changeover the operating range of the device.
Annual Conference
8/9/2019 2012 Velocity Measurement Technology Comparison
http://slidepdf.com/reader/full/2012-velocity-measurement-technology-comparison 42/69
Annual Conference
Anaheim 27 Apr 2012
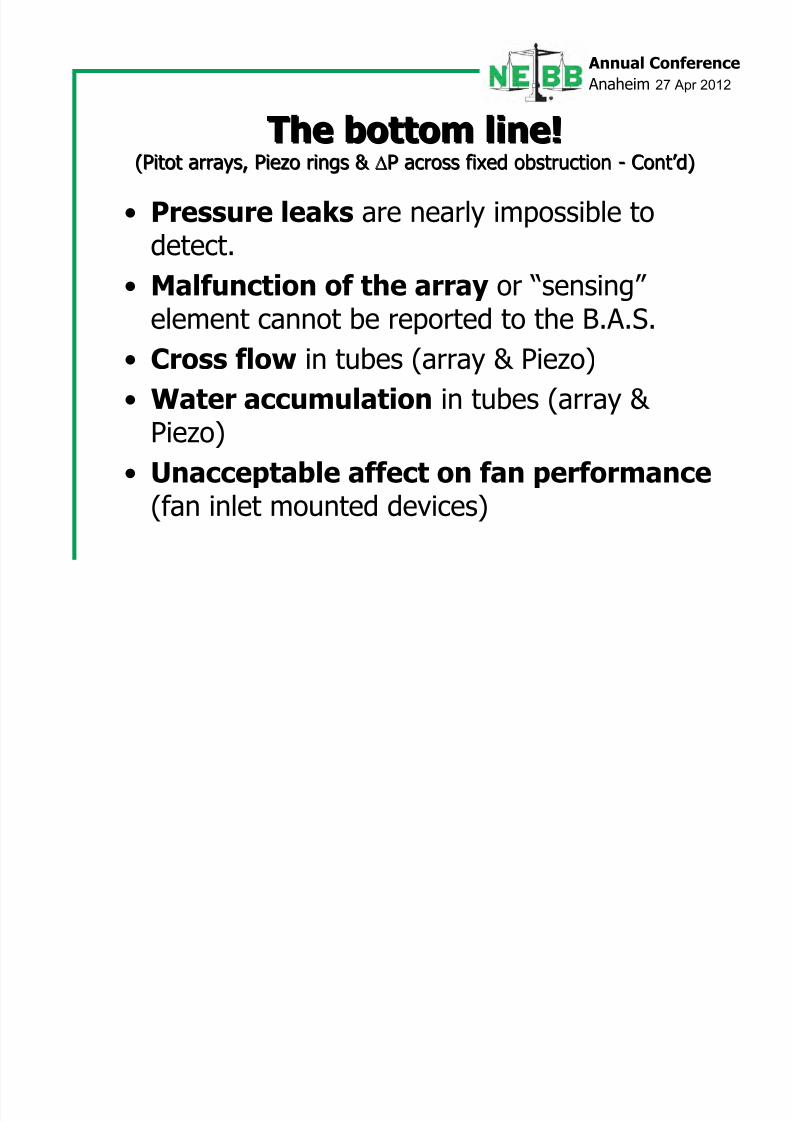
The bottom line!The bottom line!(Pitot arrays, Piezo rings &(Pitot arrays, Piezo rings & P across fixed obstructionP across fixed obstruction -- ContCont’ ’ d)d)
• Pressure leaks are nearly impossible todetect.
• Malfunction of the array or “sensing”
element cannot be reported to the B.A.S.• Cross flow in tubes (array & Piezo)
• Water accumulation in tubes (array &
Piezo)• Unacceptable affect on fan performance
(fan inlet mounted devices)
Annual Conference
8/9/2019 2012 Velocity Measurement Technology Comparison
http://slidepdf.com/reader/full/2012-velocity-measurement-technology-comparison 43/69
Annual Conference
Anaheim 27 Apr 2012
Pitot Arrays and Probes
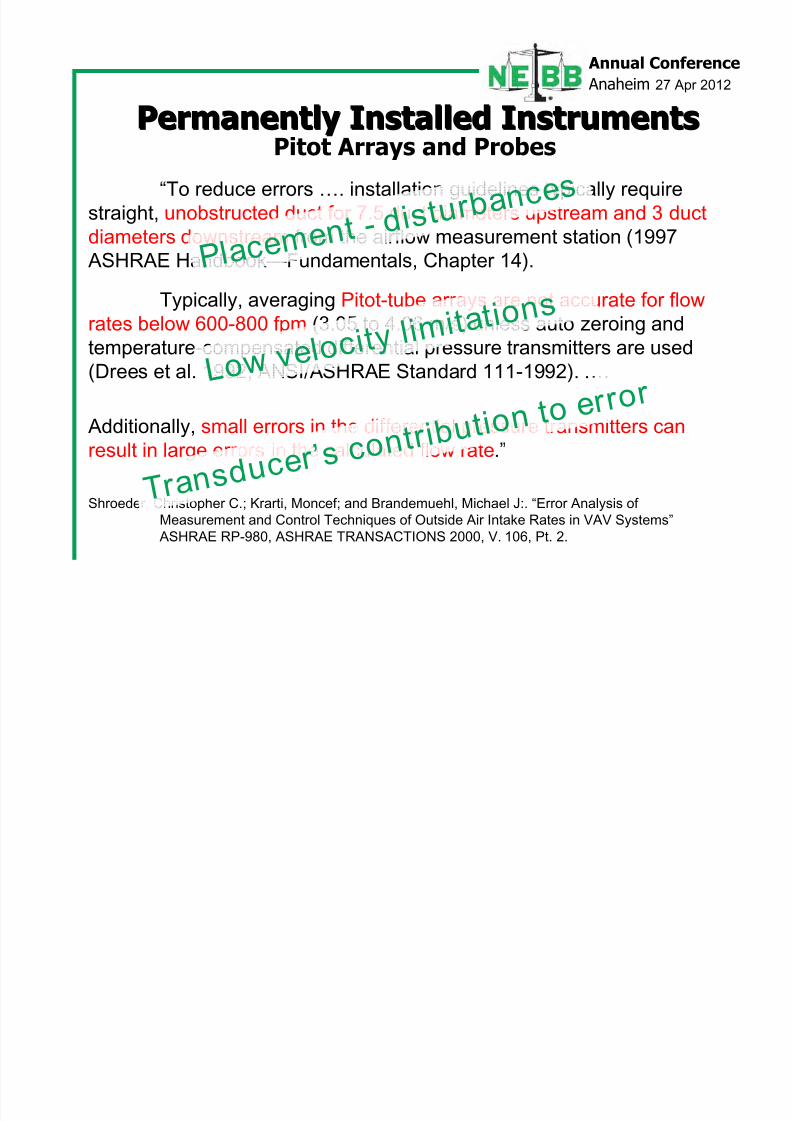
“To reduce errors …. installation guidelines typically require
straight, unobstructed duct for 7.5 duct diameters upstream and 3 duct
diameters downstream from the airflow measurement station (1997
ASHRAE Handbook—Fundamentals, Chapter 14).
Typically, averaging Pitot-tube arrays are not accurate for flow
rates below 600-800 fpm (3.05 to 4.06 m/s) unless auto zeroing andtemperature-compensated differential pressure transmitters are used
(Drees et al. 1992; ANSI/ASHRAE Standard 111-1992). ….
Additionally, small errors in the differential pressure transmitters can
result in large errors in the calculated flow rate.”
Shroeder, Christopher C.; Krarti, Moncef; and Brandemuehl, Michael J:. “Error Analysis of
Measurement and Control Techniques of Outside Air Intake Rates in VAV Systems”
ASHRAE RP-980, ASHRAE TRANSACTIONS 2000, V. 106, Pt. 2.
P l a c e m e n t - d i s t u
r b a n c e s
L o w v e l o c i t y l i m i t a t i o n s
T r a n s d u c e r
’ s c o n t r i b u t i o n t o e
r r o r
Permanently Installed InstrumentsPermanently Installed Instruments
8/9/2019 2012 Velocity Measurement Technology Comparison
http://slidepdf.com/reader/full/2012-velocity-measurement-technology-comparison 44/69
Annual Conference
8/9/2019 2012 Velocity Measurement Technology Comparison
http://slidepdf.com/reader/full/2012-velocity-measurement-technology-comparison 45/69
Annual Conference
Anaheim 27 Apr 2012
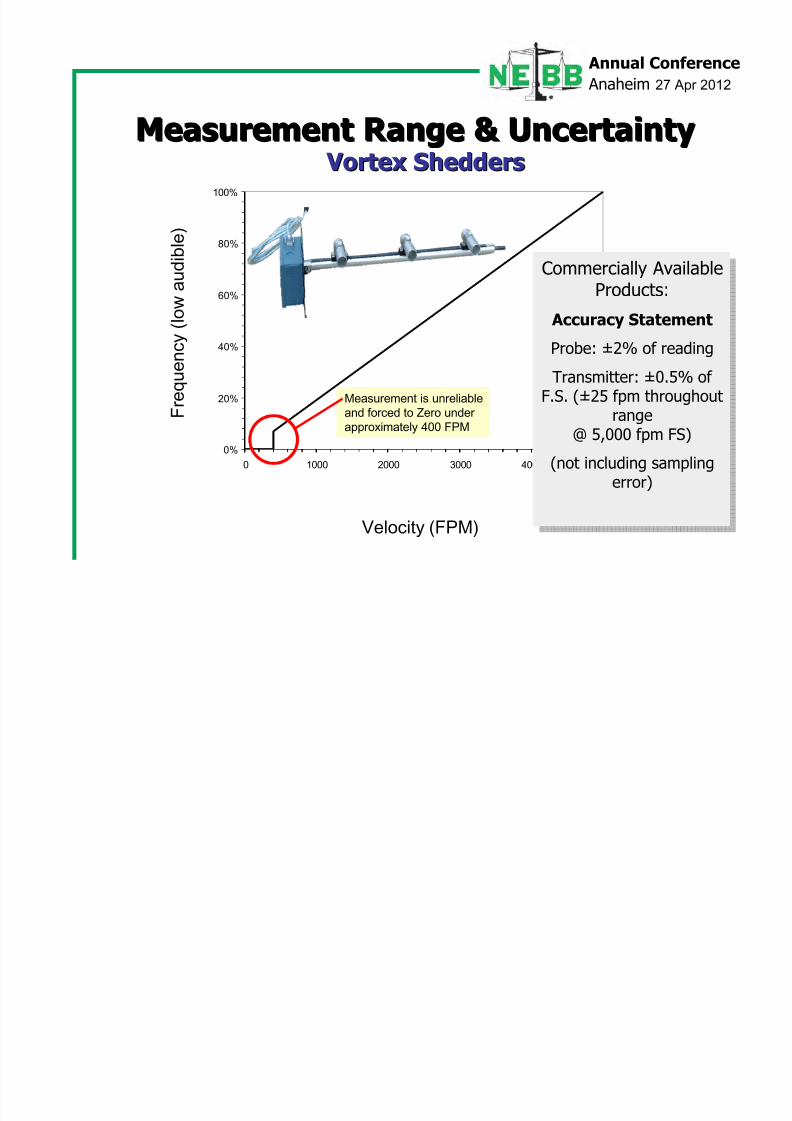
0%
20%
40%
60%
80%
100%
0 1000 2000 3000 4000 5000
Measurement Range & UncertaintyMeasurement Range & Uncertainty
Velocity (FPM)
F r e q u e n c y ( l o w
a u d i b l e )
Measurement is unreliable
and forced to Zero under
approximately 400 FPM
Commercially AvailableProducts:
Accuracy StatementProbe: ±2% of reading
Transmitter: ±0.5% ofF.S. (±25 fpm throughout
range
@ 5,000 fpm FS)
(not including samplingerror)
Commercially AvailableProducts:
Accuracy Statement
Probe: ±2% of reading
Transmitter: ±0.5% ofF.S. (±25 fpm throughout
range
@ 5,000 fpm FS)(not including sampling
error)
Vortex Shedders Vortex Shedders
Annual Conference
8/9/2019 2012 Velocity Measurement Technology Comparison
http://slidepdf.com/reader/full/2012-velocity-measurement-technology-comparison 46/69
Annual Conference
Anaheim 27 Apr 2012
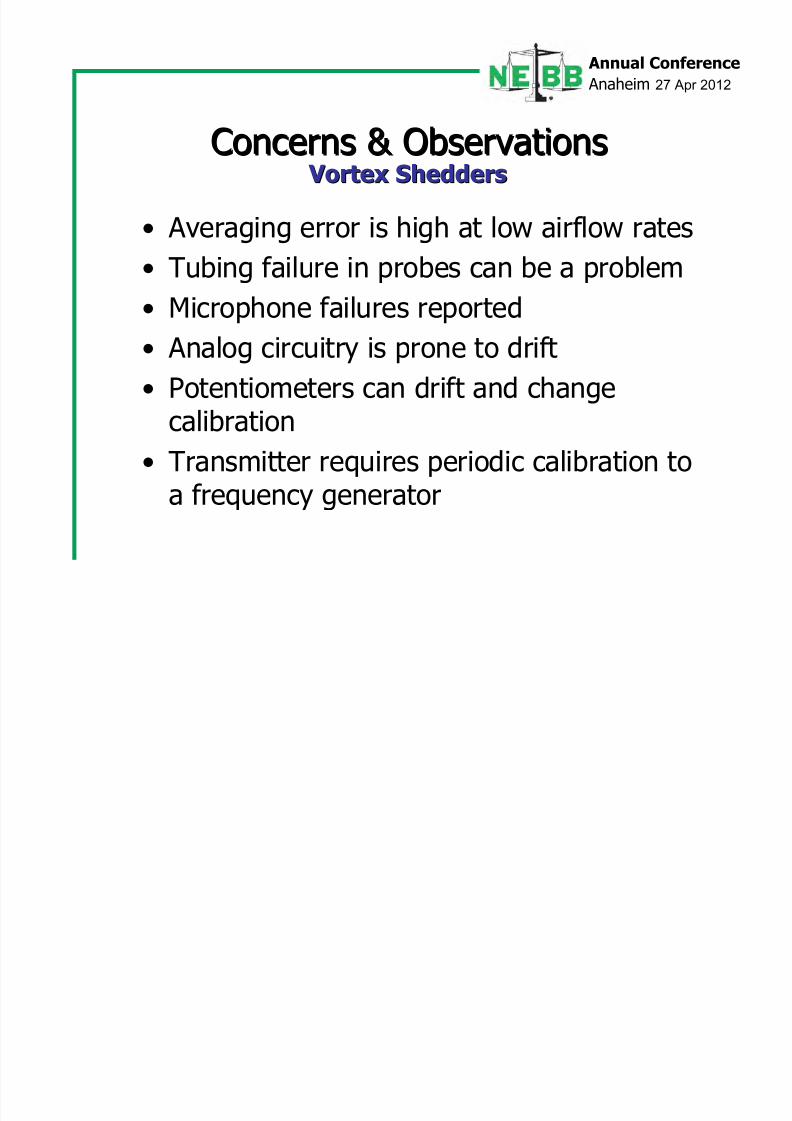
Concerns & ObservationsConcerns & Observations
• Averaging error is high at low airflow rates• Tubing failure in probes can be a problem
• Microphone failures reported
• Analog circuitry is prone to drift
• Potentiometers can drift and changecalibration
• Transmitter requires periodic calibration toa frequency generator
Vortex Shedders Vortex Shedders
Annual Conference
8/9/2019 2012 Velocity Measurement Technology Comparison
http://slidepdf.com/reader/full/2012-velocity-measurement-technology-comparison 47/69
Anaheim 27 Apr 2012
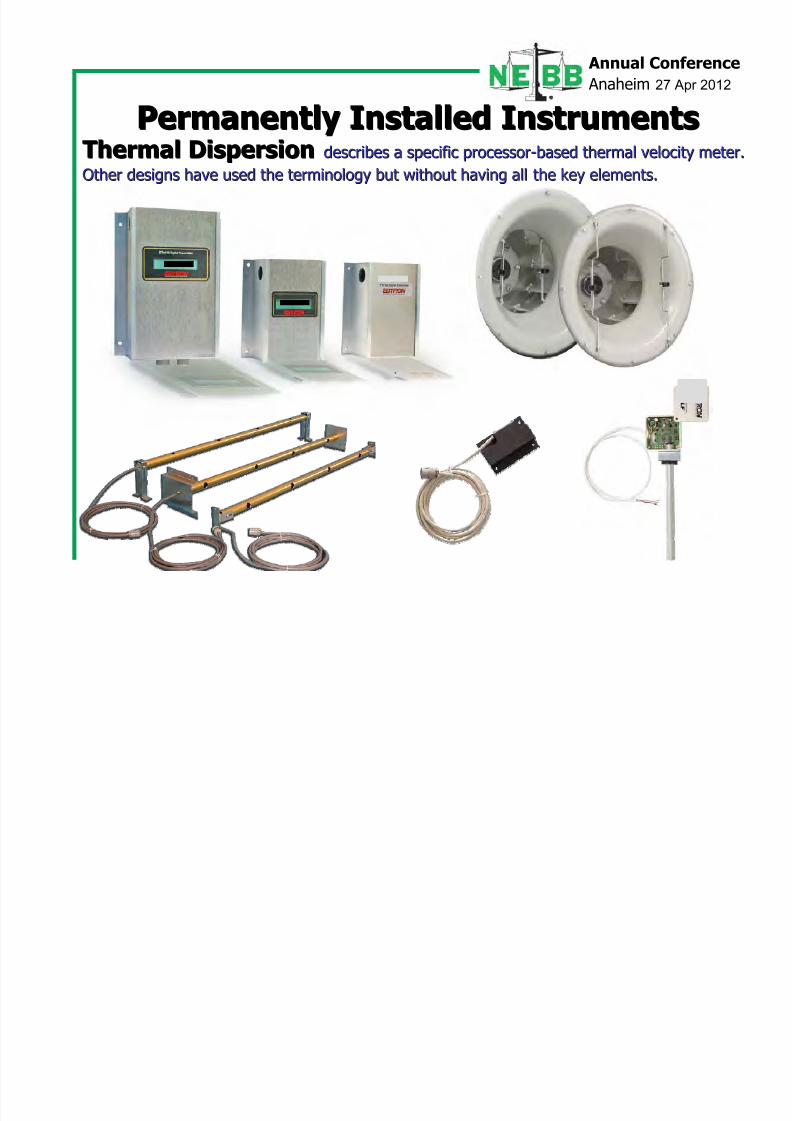
Thermal DispersionThermal Dispersion describes a specific processordescribes a specific processor--based thermal velocity meter.based thermal velocity meter.
Other designs have used the terminology but without having all tOther designs have used the terminology but without having all the key elements.he key elements.
Permanently Installed InstrumentsPermanently Installed Instruments
Annual Conference
8/9/2019 2012 Velocity Measurement Technology Comparison
http://slidepdf.com/reader/full/2012-velocity-measurement-technology-comparison 48/69
Anaheim 27 Apr 2012
Application
Controller
1 0 1 0
1 0 1 1
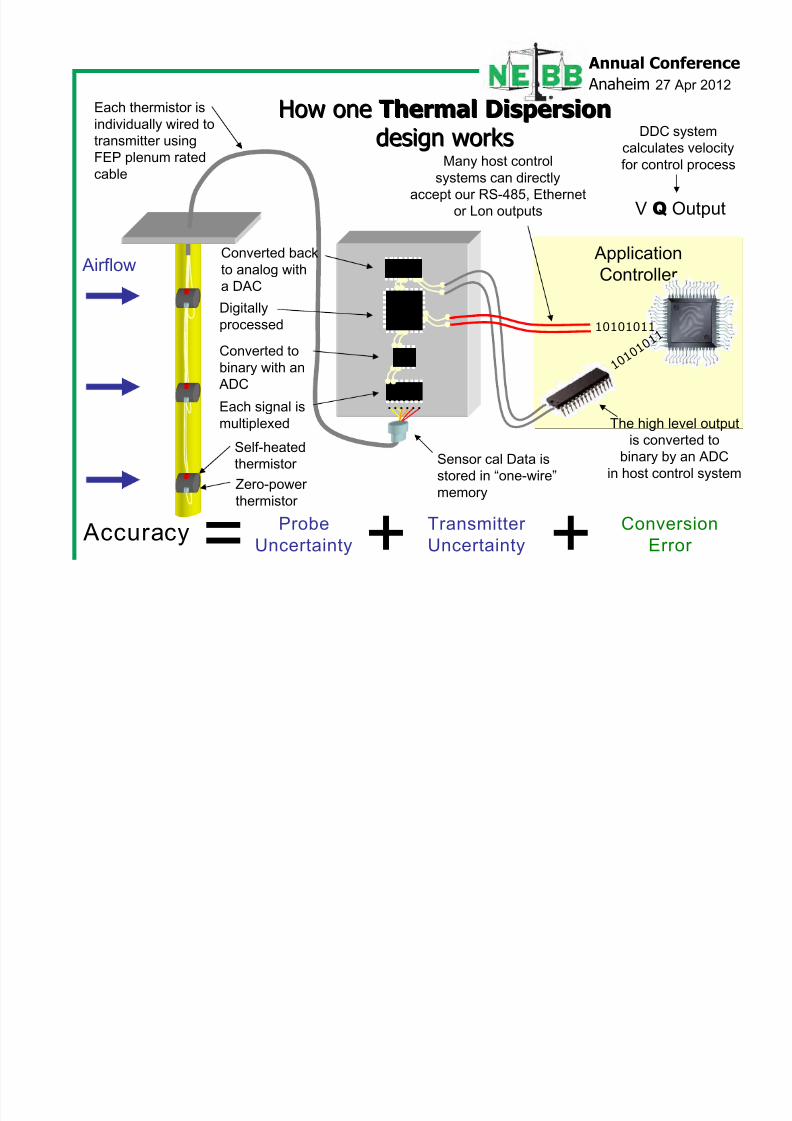
……
10101011
Airflow
Self-heated
thermistor
Zero-power
thermistor
Each thermistor is
individually wired totransmitter using
FEP plenum rated
cable
Each signal is
multiplexed
Converted to
binary with an
ADC
Digitally
processed
Converted back
to analog with
a DAC
How oneHow one Thermal DispersionThermal Dispersiondesign worksdesign works
The high level output
is converted tobinary by an ADC
in host control system
V Q Output
DDC system
calculates velocity
for control processMany host control
systems can directly
accept our RS-485, Ethernet
or Lon outputs
Sensor cal Data is
stored in “one-wire”
memory
+ +Probe
Uncertainty
Transmitter
Uncertainty
Conversion
Error Accuracy
=
Annual Conference
8/9/2019 2012 Velocity Measurement Technology Comparison
http://slidepdf.com/reader/full/2012-velocity-measurement-technology-comparison 49/69
Anaheim 27 Apr 2012
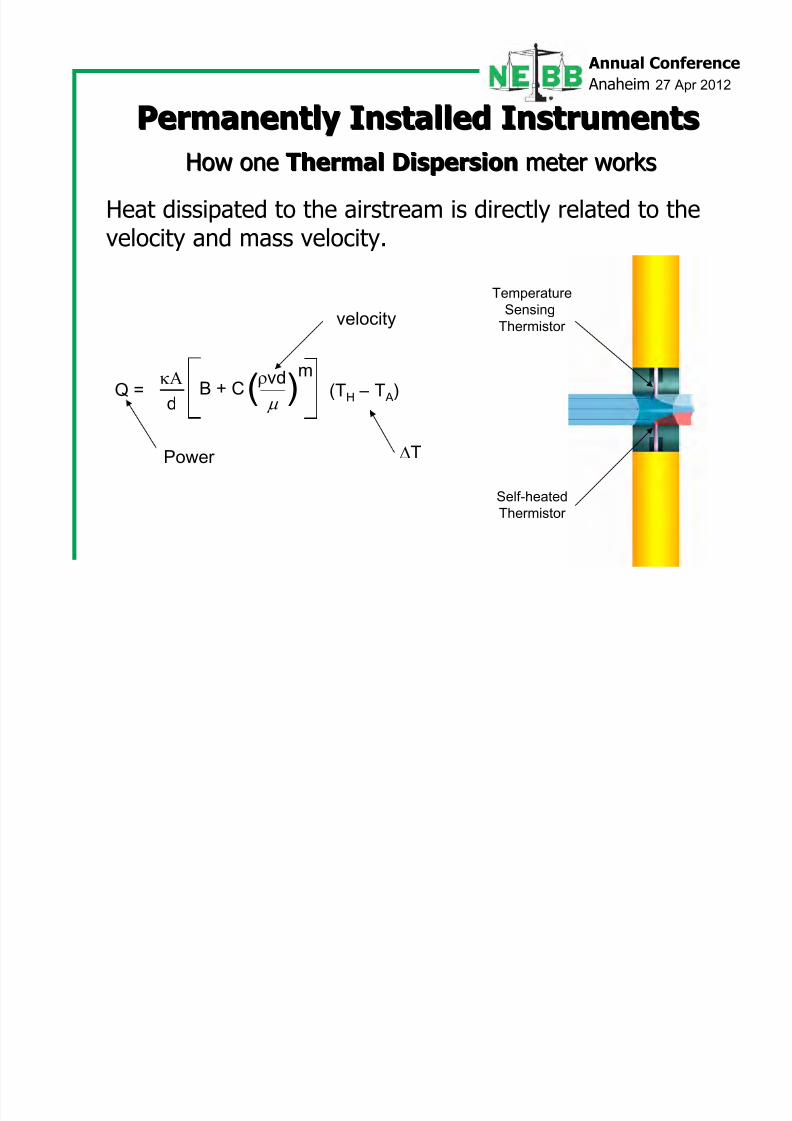
How oneHow one Thermal DispersionThermal Dispersion meter worksmeter works
Heat dissipated to the airstream is directly related to thevelocity and mass velocity.
Q =
dB + C(vd
)
m(TH – T A)
Power T
velocity
Temperature
Sensing
Thermistor
Self-heated
Thermistor
Permanently Installed InstrumentsPermanently Installed Instruments
Annual Conference
8/9/2019 2012 Velocity Measurement Technology Comparison
http://slidepdf.com/reader/full/2012-velocity-measurement-technology-comparison 50/69
Anaheim 27 Apr 2012
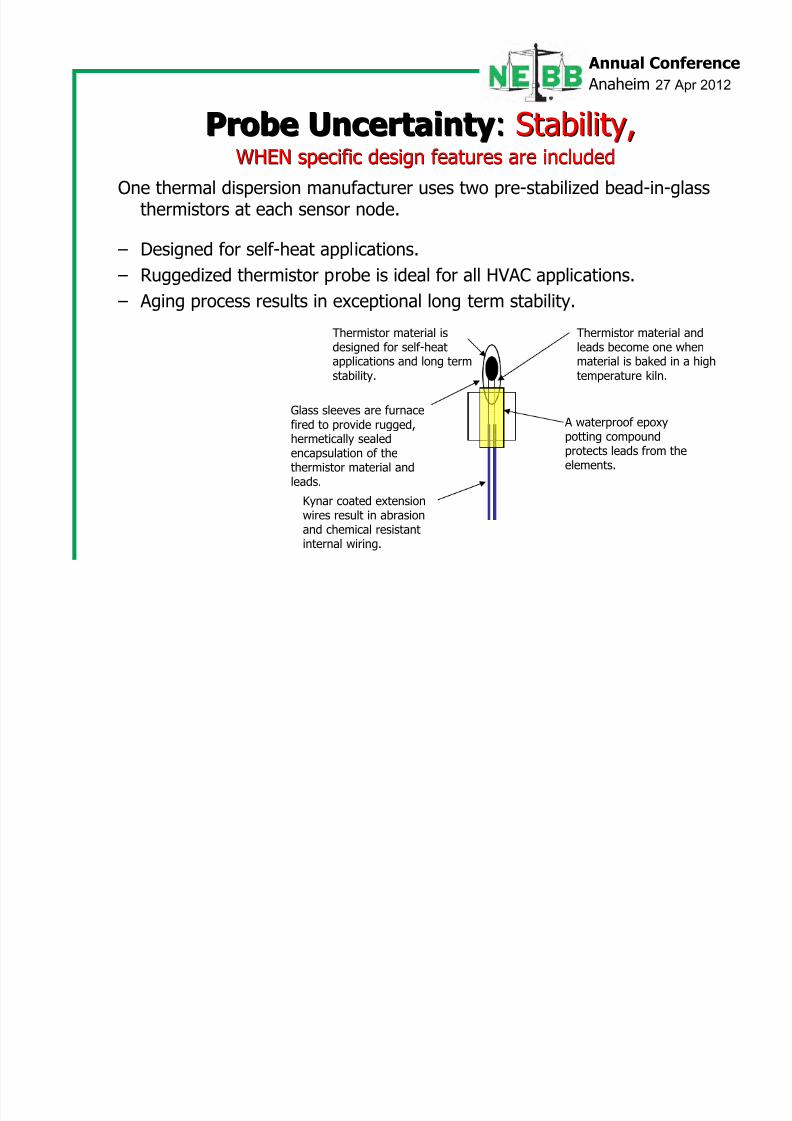
Thermistor material andleads become one whenmaterial is baked in a hightemperature kiln.
Thermistor material isdesigned for self-heatapplications and long termstability.
Glass sleeves are furnacefired to provide rugged,
hermetically sealedencapsulation of thethermistor material andleads.
A waterproof epoxy
potting compoundprotects leads from theelements.
Kynar coated extensionwires result in abrasionand chemical resistant
internal wiring.
One thermal dispersion manufacturer uses two pre-stabilized bead-in-glassthermistors at each sensor node.
– Designed for self-heat applications.
– Ruggedized thermistor probe is ideal for all HVAC applications.
– Aging process results in exceptional long term stability.
Probe UncertaintyProbe Uncertainty:: Stability,Stability,WHEN specific design features are includedWHEN specific design features are included
8/9/2019 2012 Velocity Measurement Technology Comparison
http://slidepdf.com/reader/full/2012-velocity-measurement-technology-comparison 51/69
8/9/2019 2012 Velocity Measurement Technology Comparison
http://slidepdf.com/reader/full/2012-velocity-measurement-technology-comparison 52/69
Annual Conference
A h i
8/9/2019 2012 Velocity Measurement Technology Comparison
http://slidepdf.com/reader/full/2012-velocity-measurement-technology-comparison 53/69
Anaheim 27 Apr 2012
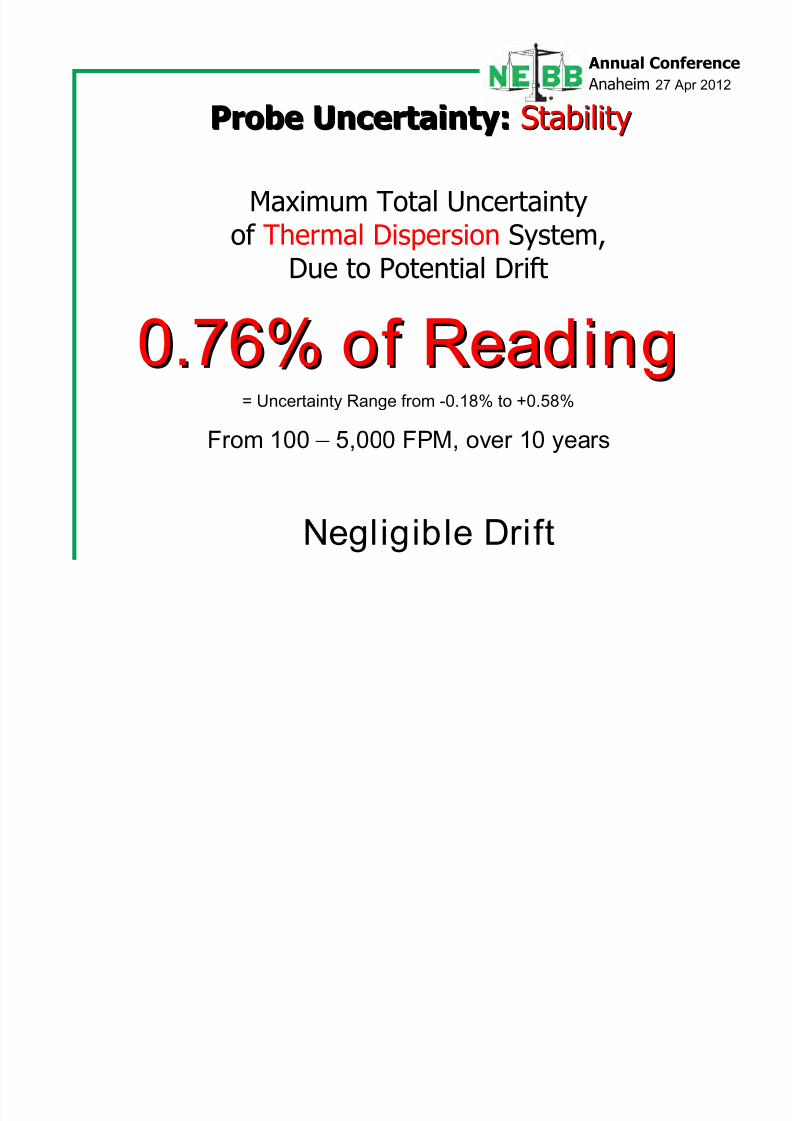
Probe Uncertainty:Probe Uncertainty: StabilityStability
Negligible Drift
Maximum Total Uncertainty
of Thermal Dispersion System,Due to Potential Drift
0.76% of Reading0.76% of Reading= Uncertainty Range from -0.18% to +0.58%
From 100 – 5,000 FPM, over 10 years
Annual Conference
A h i 27 A 2012
8/9/2019 2012 Velocity Measurement Technology Comparison
http://slidepdf.com/reader/full/2012-velocity-measurement-technology-comparison 54/69
Anaheim 27 Apr 2012
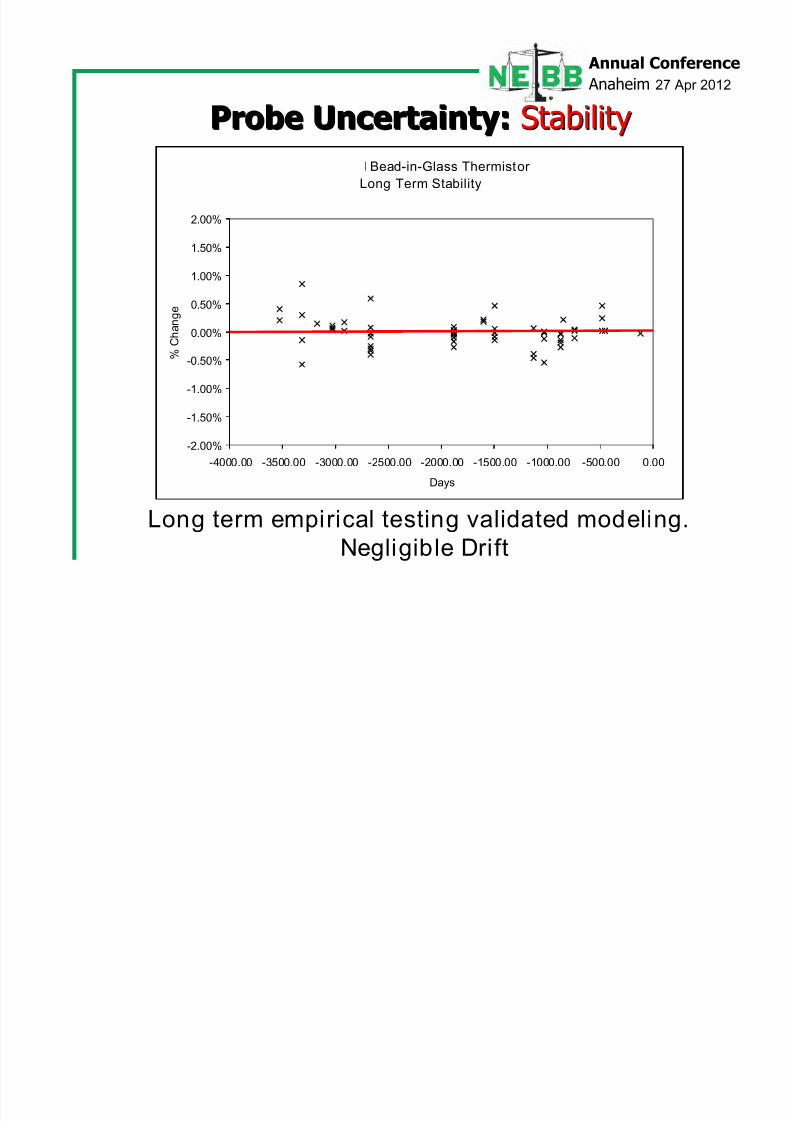
Probe Uncertainty:Probe Uncertainty: StabilityStabilityEBTRON Bead-in-Glass Thermistor
Long Term Stability
-2.00%
-1.50%
-1.00%
-0.50%
0.00%
0.50%
1.00%
1.50%
2.00%
-4000.00 -3500.00 -3000.00 -2500.00 -2000.00 -1500.00 -1000.00 -500.00 0.00
Days
% C
h
a n g e
Long term empirical testing validated modeling.
Negligible Drift
Annual Conference
Anaheim 27 A 2012
8/9/2019 2012 Velocity Measurement Technology Comparison
http://slidepdf.com/reader/full/2012-velocity-measurement-technology-comparison 55/69
Anaheim 27 Apr 2012
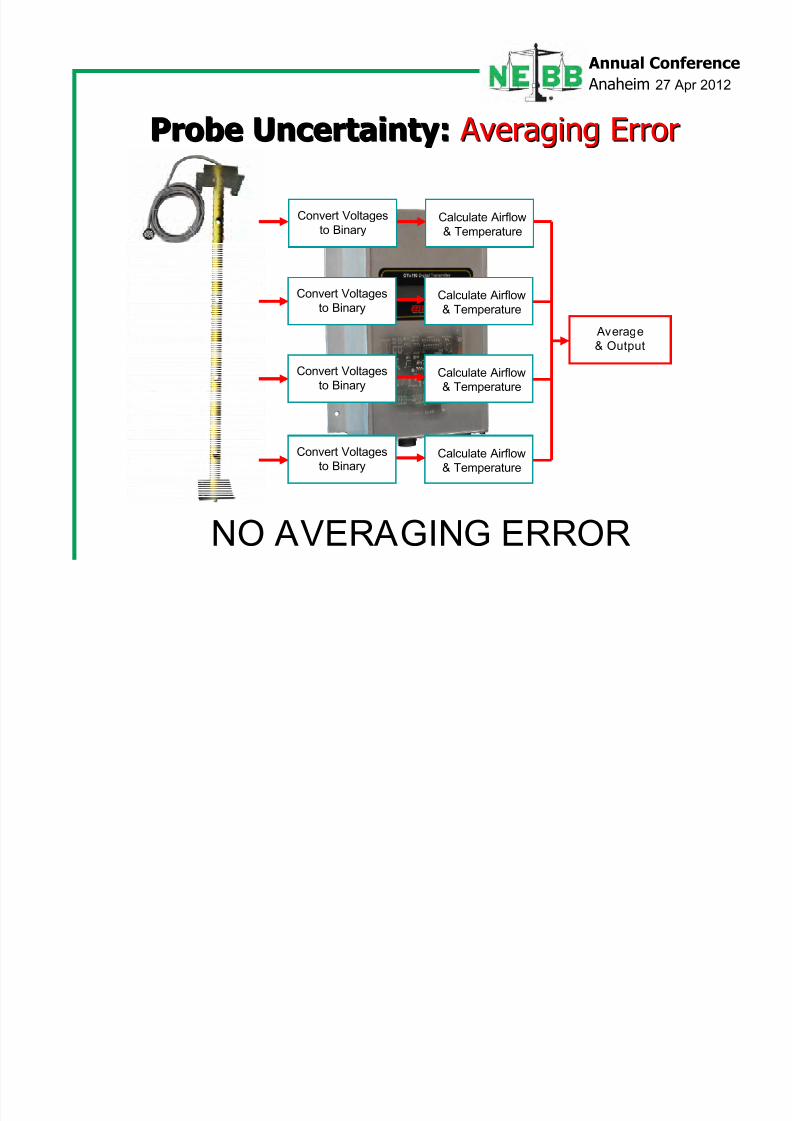
Probe Uncertainty:Probe Uncertainty: Averaging Error Averaging Error
Average& Output
Calculate Airflow
& Temperature
Calculate Airflow
& Temperature
Calculate Airflow
& Temperature
Calculate Airflow
& Temperature
Convert Voltages
to Binary
Convert Voltages
to Binary
Convert Voltages
to Binary
Convert Voltages
to Binary
NO AVERAGING ERROR
Annual Conference
Anaheim 27 Apr 2012
8/9/2019 2012 Velocity Measurement Technology Comparison
http://slidepdf.com/reader/full/2012-velocity-measurement-technology-comparison 56/69
Anaheim 27 Apr 2012
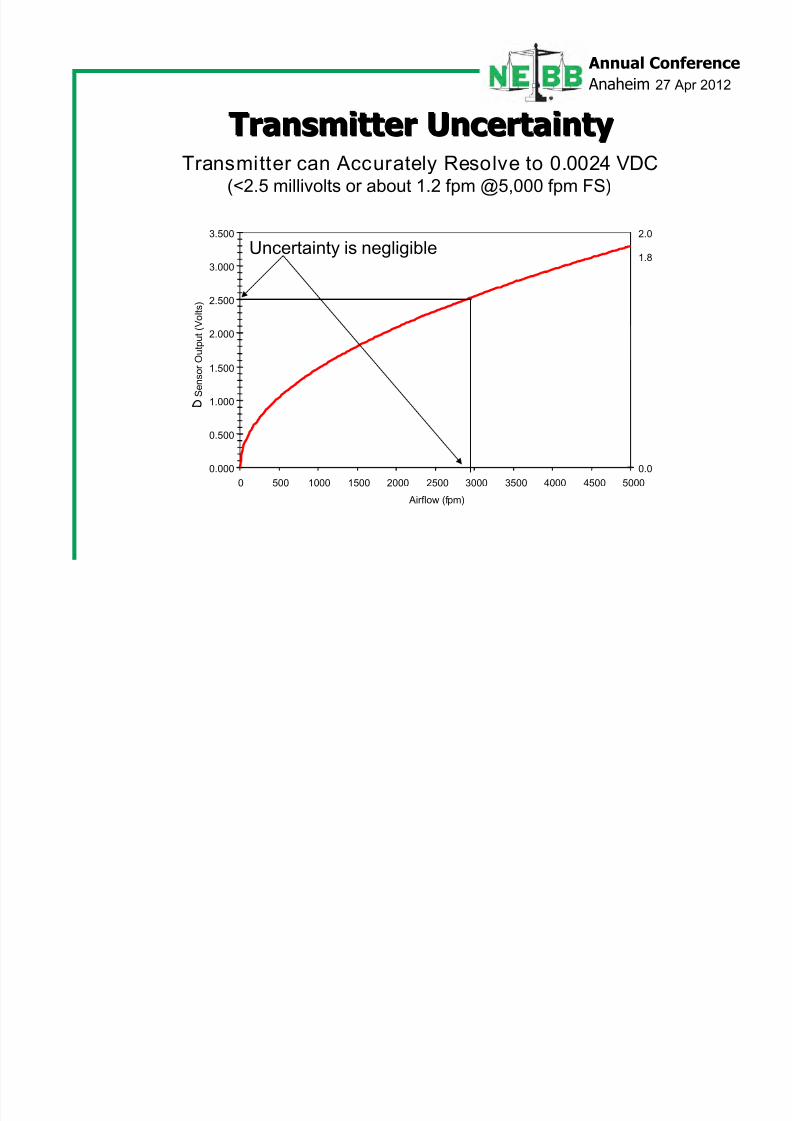
0.000
0.500
1.000
1.500
2.000
2.500
3.000
3.500
0 500 1000 1500 2000 2500 3000 3500 4000 4500 5000
Airflow (fpm)
S e n s o r O u t p u t
( V o l t s )
0.0
2.0
1.8
D
Transmitter UncertaintyTransmitter UncertaintyTransmitter can Accurately Resolve to 0.0024 VDC
(<2.5 millivolts or about 1.2 fpm @5,000 fpm FS)
Uncertainty is negligible
Annual Conference
Anaheim 27 Apr 2012
8/9/2019 2012 Velocity Measurement Technology Comparison
http://slidepdf.com/reader/full/2012-velocity-measurement-technology-comparison 57/69
Anaheim 27 Apr 2012
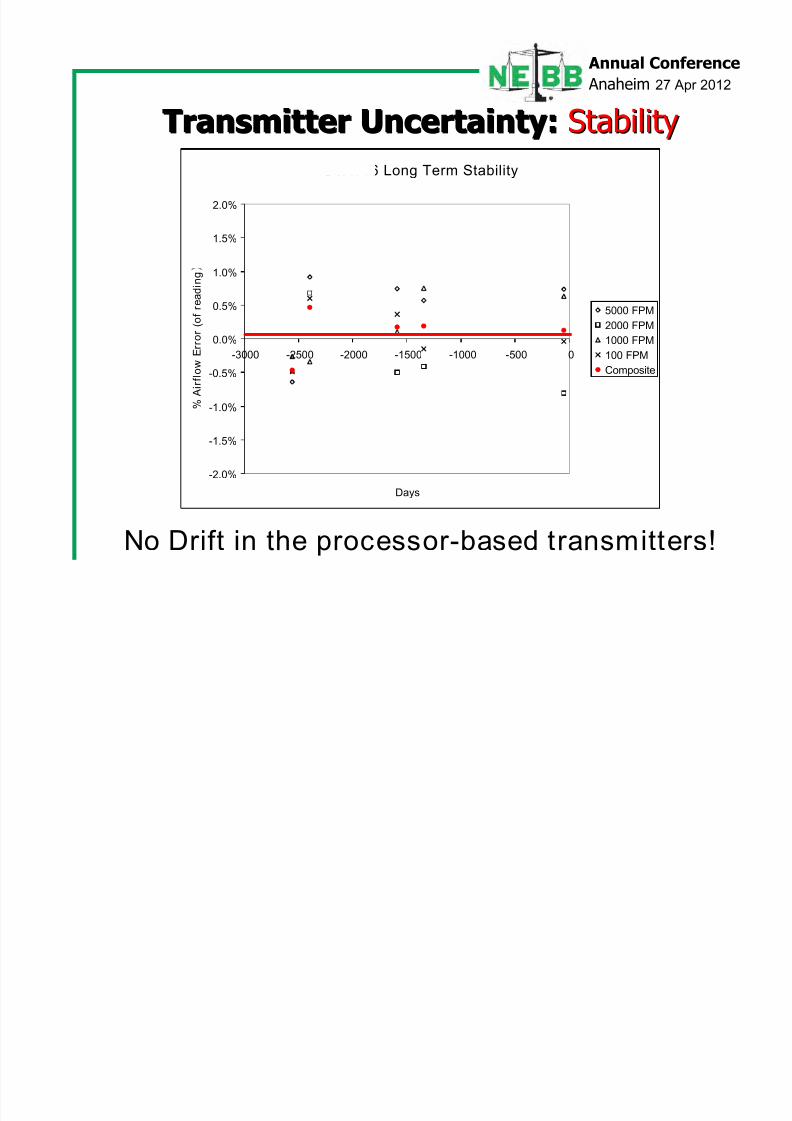
Transmitter Uncertainty:Transmitter Uncertainty: StabilityStabilityGTA116 Long Term Stability
-2.0%
-1.5%
-1.0%
-0.5%
0.0%
0.5%
1.0%
1.5%
2.0%
-3000 -2500 -2000 -1500 -1000 -500 0
Days
% A
i r f l o w
E r r o r ( o f r e a d i n g
5000 FPM
2000 FPM
1000 FPM
100 FPM
Composite
No Drift in the processor-based transmitters!
Annual Conference
Anaheim 27 Apr 2012
8/9/2019 2012 Velocity Measurement Technology Comparison
http://slidepdf.com/reader/full/2012-velocity-measurement-technology-comparison 58/69
Anaheim 27 Apr 2012
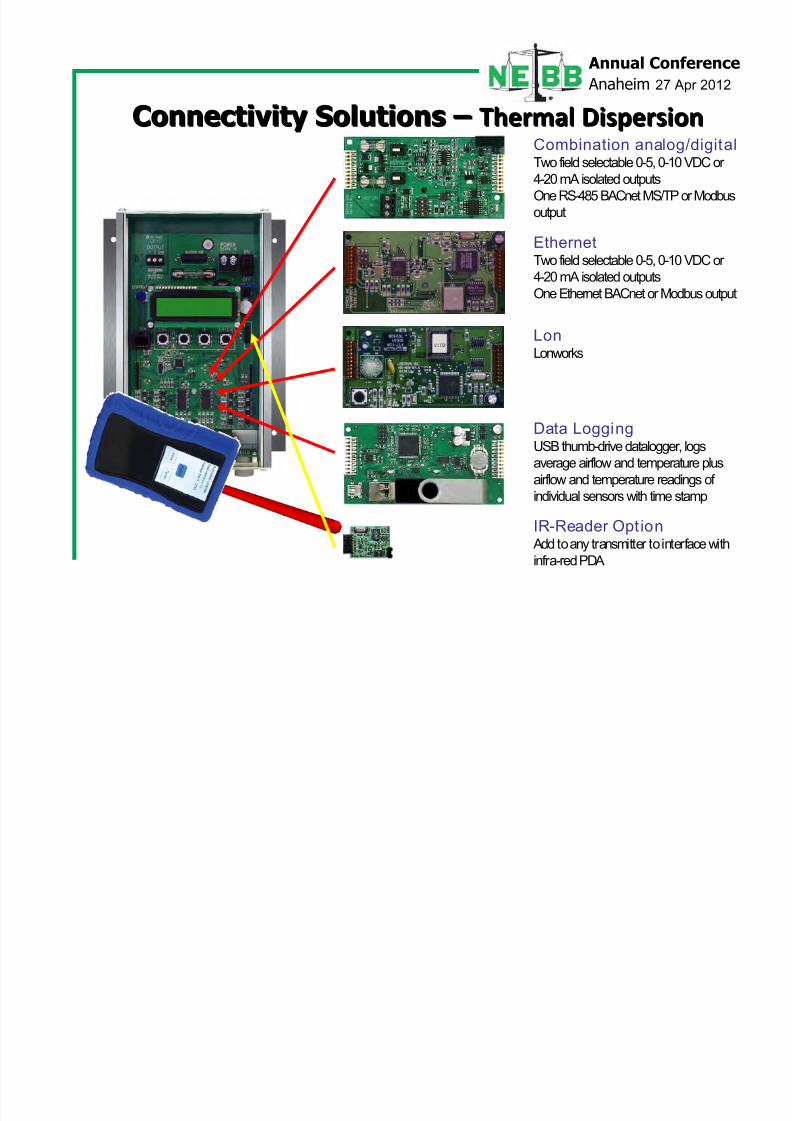
Connectivity SolutionsConnectivity Solutions – – Thermal
DispersionThermal
DispersionCombination analog/digitalTwo field selectable 0-5, 0-10 VDC or
4-20 mA isolated outputs
One RS-485 BACnet MS/TP or Modbus
output
LonLonworks
Data LoggingUSB thumb-drive datalogger, logsaverage airflow and temperature plus
airflow and temperature readings of
individual sensors with time stamp
IR-Reader Option
Add to any transmitter to interface withinfra-red PDA
EthernetTwo field selectable 0-5, 0-10 VDC or
4-20 mA isolated outputs
One Ethernet BACnet or Modbus output
Annual Conference
Anaheim 27 Apr 2012
8/9/2019 2012 Velocity Measurement Technology Comparison
http://slidepdf.com/reader/full/2012-velocity-measurement-technology-comparison 59/69
Anaheim 27 Apr 2012
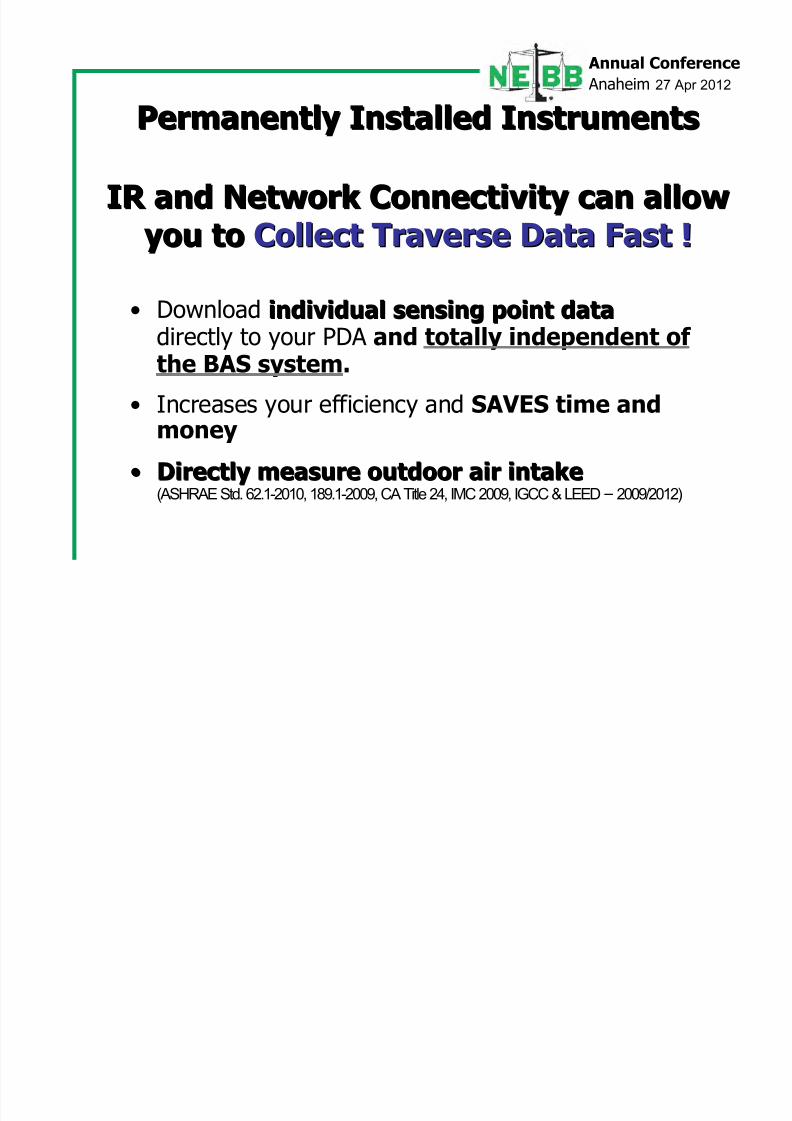
• Download individual sensing point dataindividual sensing point data
directly to your PDA and totally independent ofthe BAS system.
• Increases your efficiency and SAVES time and
money•• Directly measure outdoor air intakeDirectly measure outdoor air intake
(ASHRAE Std. 62.1-2010, 189.1-2009, CA Title 24, IMC 2009, IGCC & LEED – 2009/2012)
IR and Network Connectivity can allowIR and Network Connectivity can allow
you to you to Collect Traverse Data Fast !Collect Traverse Data Fast !
Permanently Installed InstrumentsPermanently Installed Instruments
Annual Conference
Anaheim 27 Apr 2012
8/9/2019 2012 Velocity Measurement Technology Comparison
http://slidepdf.com/reader/full/2012-velocity-measurement-technology-comparison 60/69
Anaheim 27 Apr 2012
AFMS
AFMS
AFM
S
AFMS
AFMS
AFM
S
AFMS
AFMS
AFMS
AFMS
AFMS
AFMS
AFMS
AFMS
AFMS
AFMS
AFMS
AFMS
AFMS
AFMS
1D
0.5D 1.5D
3D 1.5D
3D
0.5D 1.5D
0.5D0.5D 0.5D
1.5D
1.5D
1D1D
1.5D
0.75D 1.5D0.75D 0.75D
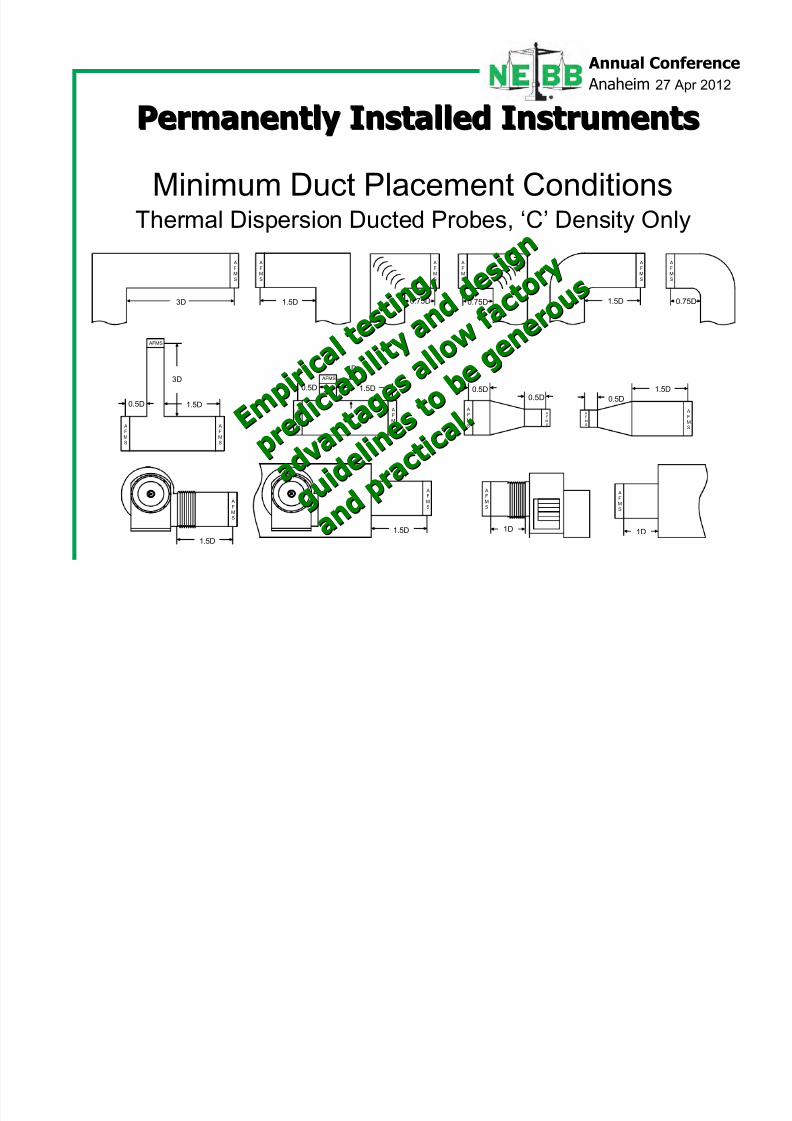
Minimum Duct Placement Conditions
Thermal Dispersion Ducted Probes, ‘C’ Density Only
E m p i r i c
a l t e s t i n
g ,
E m p i r i c
a l t e s t i n
g ,
p r e
d i c t a b
i l i t y a n d
d e s i g
n
p r e d i c t
a b i l i t y a
n d d e s i g
n
a d v a n t a
g e s a
l l o w f a
c t o r y
a d v a n t a
g e s a
l l o w f a
c t o r y
g u i d
e l i n e s t
o b e g
e n e r o u s
g u i d
e l i n e s t
o b e g
e n e r o u s
a n d p r a c t i c a
l .
a n d p
r a c t i c a
l .
Permanently Installed InstrumentsPermanently Installed Instruments
Annual Conference
Anaheim 27 Apr 2012
8/9/2019 2012 Velocity Measurement Technology Comparison
http://slidepdf.com/reader/full/2012-velocity-measurement-technology-comparison 61/69
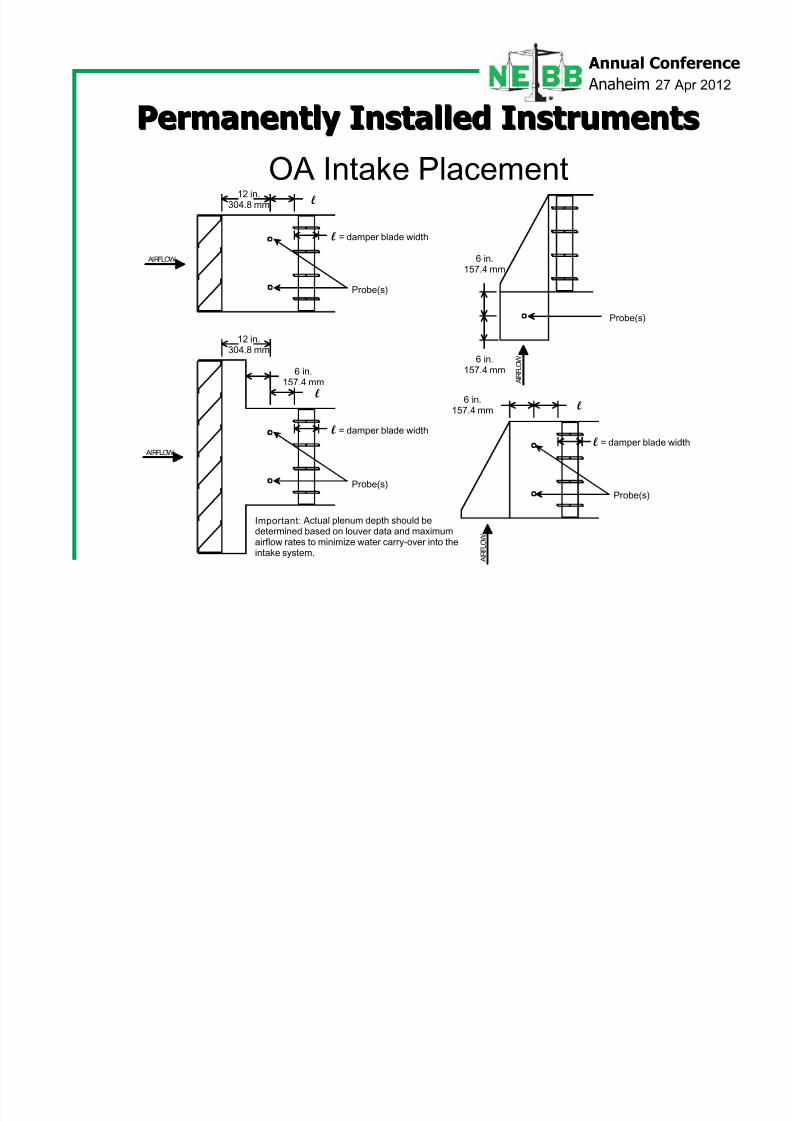
p
l = damper blade width
12 in.304.8 mm
l
l = damper blade width
6 in.157.4 mm
l = damper blade width
l
6 in.157.4 mm
6 in.157.4 mm
Probe(s)
Probe(s)
Probe(s)
Probe(s)
l
6 in.157.4 mm
Important: Actual plenum depth should bedetermined based on louver data and maximumairflow rates to minimize water carry-over into the
intake system.
AIRFLOW
AIRFLOW
A I R F L O W
A I R F L O W
12 in.304.8 mm
OA Intake PlacementPermanently Installed InstrumentsPermanently Installed Instruments
Annual Conference
Anaheim 27 Apr 2012
8/9/2019 2012 Velocity Measurement Technology Comparison
http://slidepdf.com/reader/full/2012-velocity-measurement-technology-comparison 62/69
p
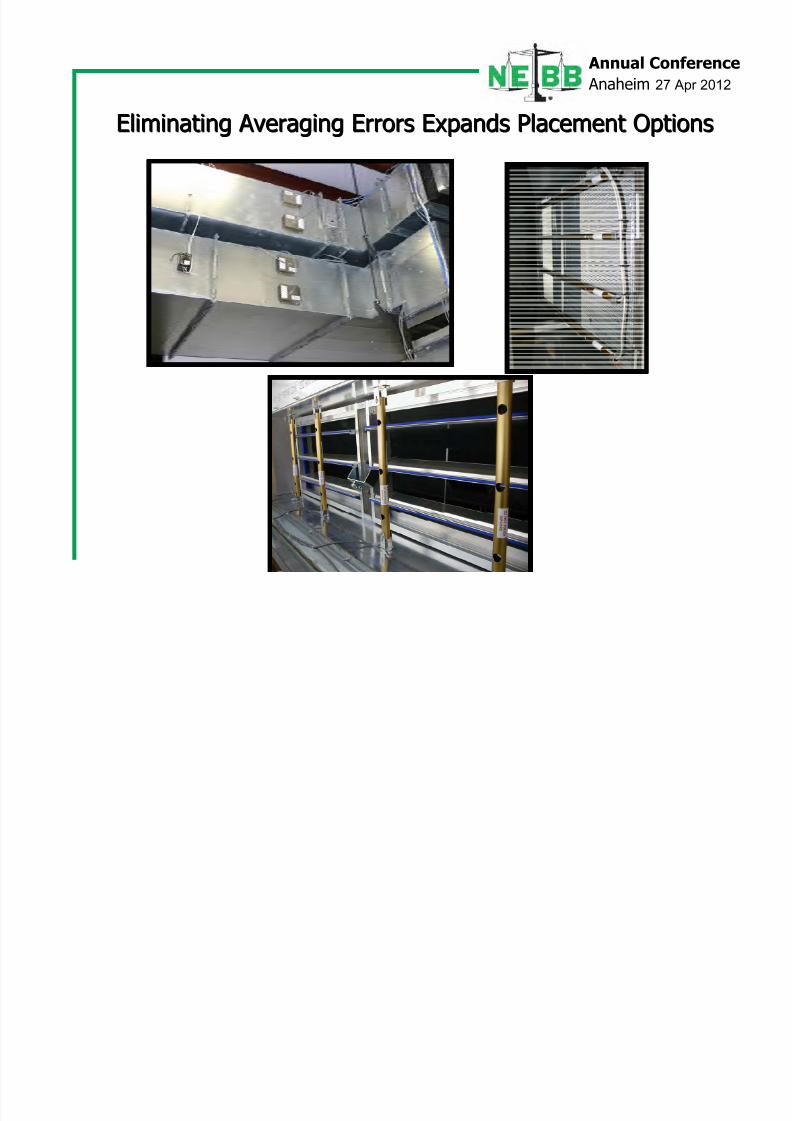
Eliminating Averaging Errors Expands Placement OptionsEliminating Averaging Errors Expands Placement Options
rr
8/9/2019 2012 Velocity Measurement Technology Comparison
http://slidepdf.com/reader/full/2012-velocity-measurement-technology-comparison 63/69
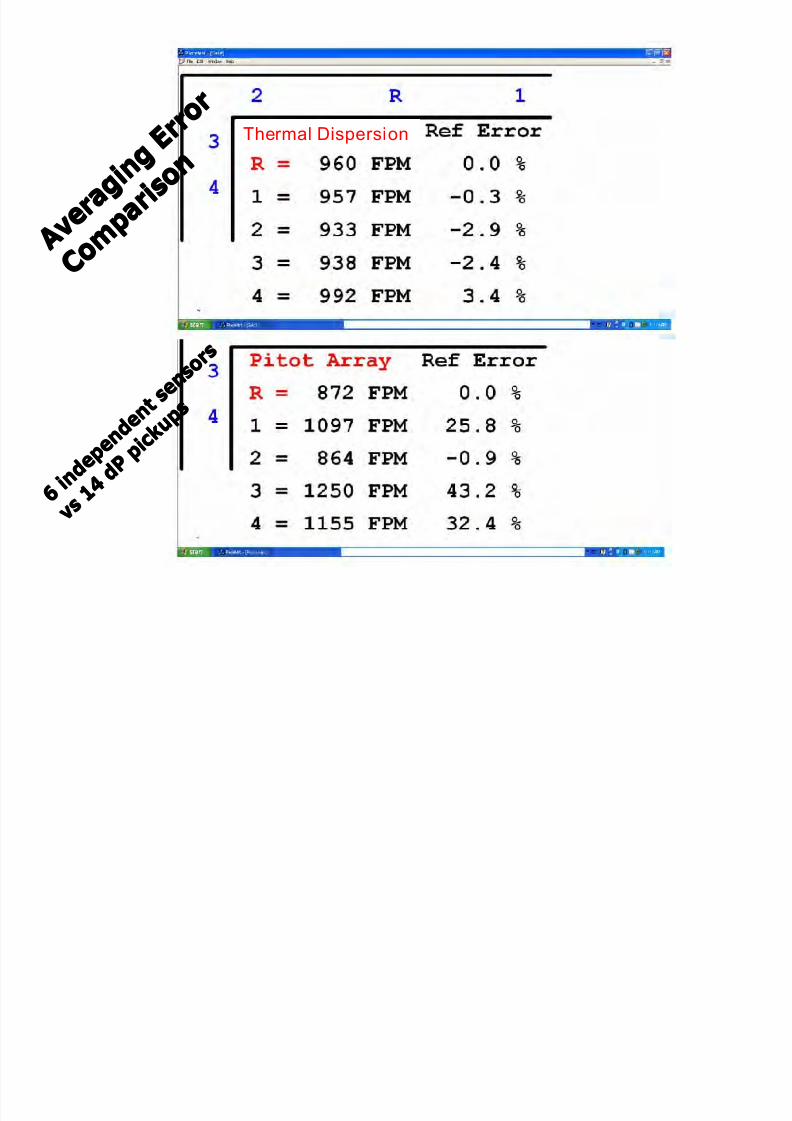
Thermal Dispersion
A v e
r a g i n g
E r r o
r
A v e r a g i n
g E r r o
r
C o m p
a r i s o n
C o m p
a r i s o n
6 i n
d e p e n
d e n t
s e n
s o r s
6 i n
d e p e n
d e n t
s e n
s o r s
v s v s 1 4
1 4
d P d P p i c k
u p s
p i c k u
p s
Annual Conference
Anaheim 27 Apr 2012
8/9/2019 2012 Velocity Measurement Technology Comparison
http://slidepdf.com/reader/full/2012-velocity-measurement-technology-comparison 64/69
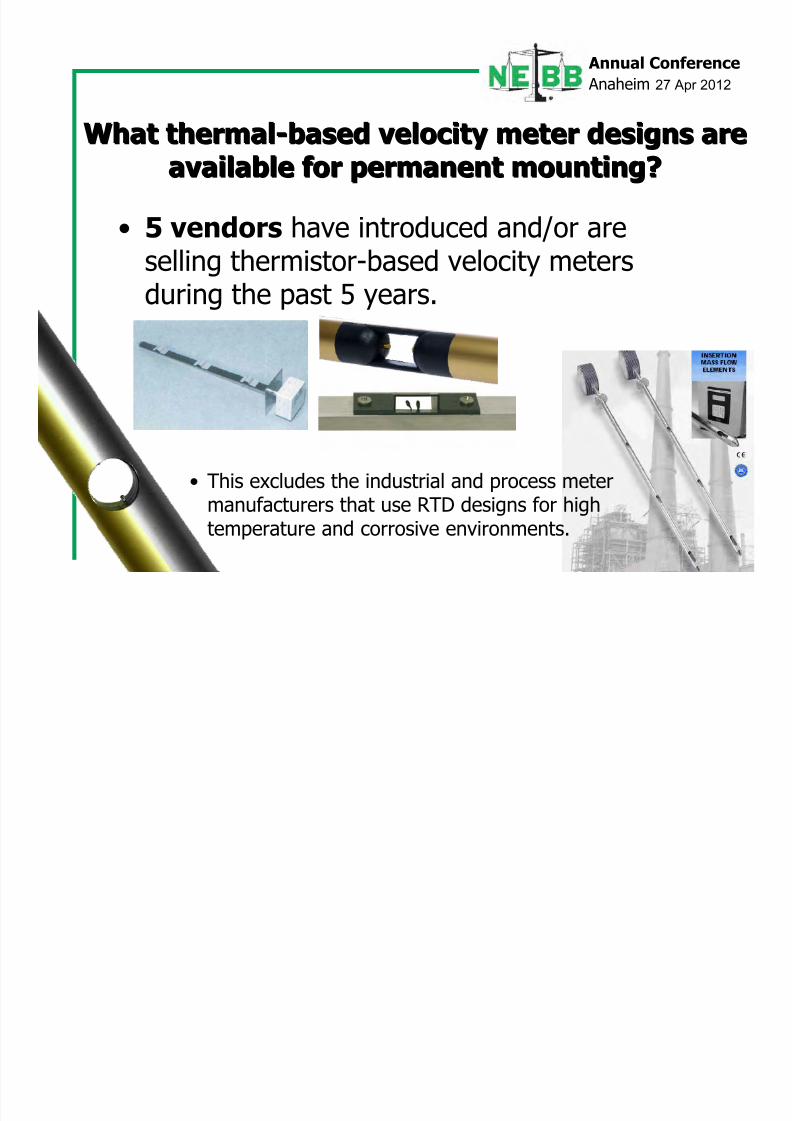
• 5 vendors have introduced and/or areselling thermistor-based velocity metersduring the past 5 years.
• This excludes the industrial and process metermanufacturers that use RTD designs for hightemperature and corrosive environments.
What thermalWhat thermal--based velocity meter designs arebased velocity meter designs areavailable for permanent mounting?available for permanent mounting?
Annual Conference
Anaheim 27 Apr 2012
8/9/2019 2012 Velocity Measurement Technology Comparison
http://slidepdf.com/reader/full/2012-velocity-measurement-technology-comparison 65/69
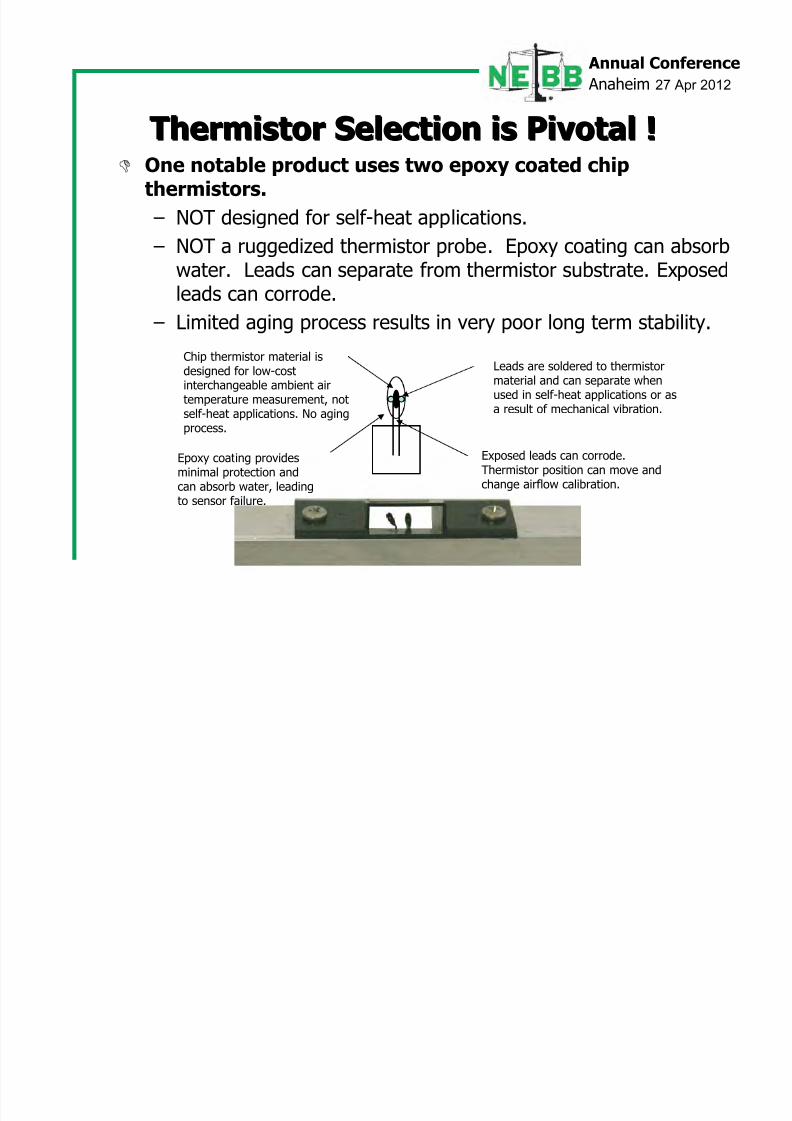
One notable product uses two epoxy coated chipthermistors.
– NOT designed for self-heat applications.
– NOT a ruggedized thermistor probe. Epoxy coating can absorbwater. Leads can separate from thermistor substrate. Exposedleads can corrode.
– Limited aging process results in very poor long term stability.
Thermistor Selection is Pivotal !Thermistor Selection is Pivotal !
Leads are soldered to thermistormaterial and can separate whenused in self-heat applications or asa result of mechanical vibration.
Chip thermistor material isdesigned for low-costinterchangeable ambient airtemperature measurement, notself-heat applications. No agingprocess.
Epoxy coating providesminimal protection andcan absorb water, leadingto sensor failure.
Exposed leads can corrode.Thermistor position can move andchange airflow calibration.
Annual Conference
Anaheim 27 Apr 2012
8/9/2019 2012 Velocity Measurement Technology Comparison
http://slidepdf.com/reader/full/2012-velocity-measurement-technology-comparison 66/69
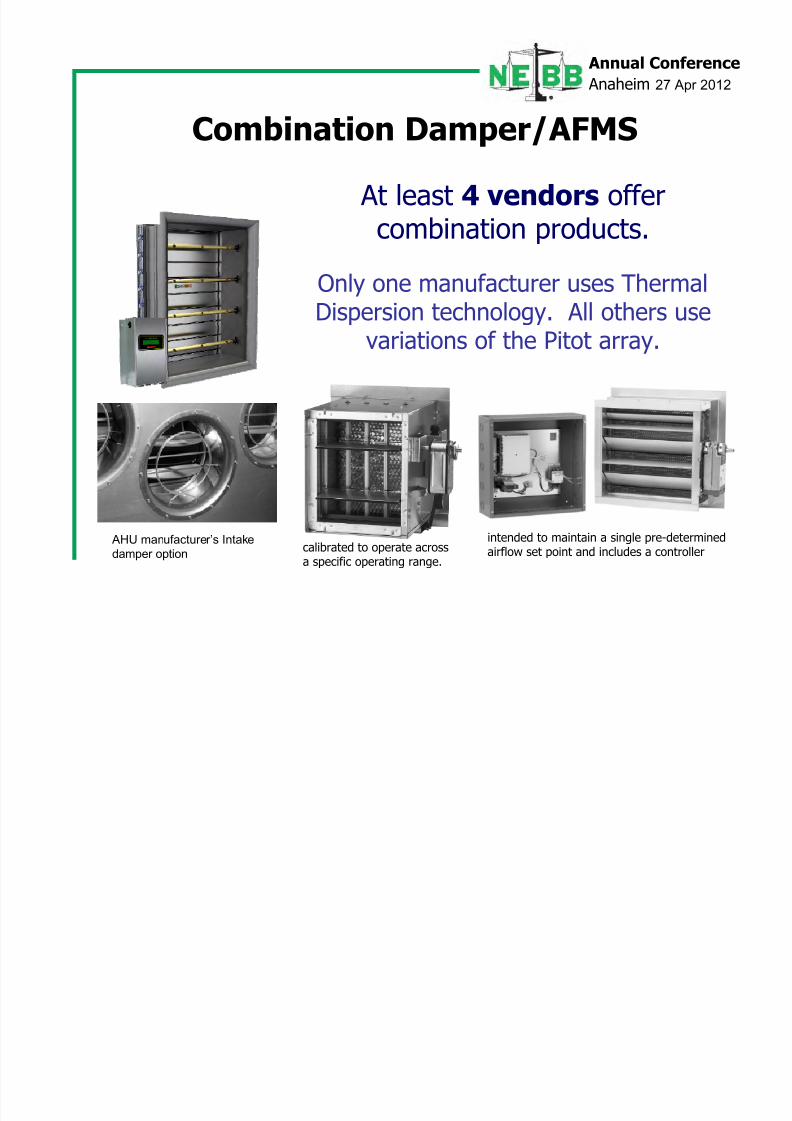
At least 4 vendors offer
combination products.
Only one manufacturer uses ThermalDispersion technology. All others use
variations of the Pitot array.
Combination Damper/AFMS
calibrated to operate acrossa specific operating range.
intended to maintain a single pre-determined
airflow set point and includes a controller
AHU manufacturer’s Intake
damper option
Annual Conference
Anaheim 27 Apr 2012
10 f 16 Mi i TAB Ai P d b S ti fi d

8/9/2019 2012 Velocity Measurement Technology Comparison
http://slidepdf.com/reader/full/2012-velocity-measurement-technology-comparison 67/69
10 of 16 Minimum TAB Air Procedures can be Satisfiedwith Qualified Permanent Instruments, already on site
Where modulating dampers or economizers are provided, take measurement atfull design flow - return air, minimum outside air, and 100 percent outside air
mode of operation.
Measure temperature conditions across supply, return and exhaust dampers tocheck leakage.
Adjust outside air automatic dampers, supply, return and exhaust dampers for
design conditions.
Vary total system air quantities by adjustment of fan speeds. Provide drivechanges recommendations to installing contractor.
Measure air quantities at air inlets and outlets.
Make air quantity measurements in ducts by Pitot tube traverse entire cross
sectional area of duct.
Test and adjust air handling and distribution systems to provide required ordesign quantities for supply, return, outside, and exhaust air.
Set adjustments of automatically operated dampers to operate as specified.
Test and record outside air, mixed air, and discharge temperatures
Test and adjust fan speed to design requirements.
Annual Conference
Anaheim 27 Apr 2012
8/9/2019 2012 Velocity Measurement Technology Comparison
http://slidepdf.com/reader/full/2012-velocity-measurement-technology-comparison 68/69
Airflow Measurement Devices Airflow Measurement Devices
Devices having substantially greater,
verifiable performance can provide superiorTAB field results, reduce TAB labor costs
and time investments.
In locations diff icult to measure with a Pitot,
these devices can provide a superior basis
for set up or field verification – the key for thetechnician is product knowledge, understanding
and confidence.
Annual Conference
Anaheim 27 Apr 2012

8/9/2019 2012 Velocity Measurement Technology Comparison
http://slidepdf.com/reader/full/2012-velocity-measurement-technology-comparison 69/69
1663 Hwy. 701 S. • Loris, SC 29569 USAToll Free: 800.2EBTRON (800.232.8766) • Local Phone: +1.843.756.1828 • Fax: +1.843.756.1838
Internet: www.ebtron.com • e-Mail: [email protected]
Thermal Dispersion Airflow Measurement
®
Member ASHRAE, and Copyright © 2012, EBTRON, Inc. All brand names, trademarks and registered trademarks
are the property of their respective owners.
Material in this presentation is for training purposes only.
Reproduction, distribution or use for purposes other than
training is prohibited by EBTRON.
Materials, research, time and travel costs required for thepreparation and presentation of this seminar were provided by:
Len DamianoEmail: [email protected]