Embed Size (px)
Citation preview
2014ANNUAL REPORT
CONTENTSFINANCIAL HIGHLIGHTS ...............................................4
MESSAGES ........................................................................5
MANAGEMENT’S DISCUSSION AND ANALYSIS ......9
Operating Environment .....................................................................10Condensed Consolidated Financial Results ..................................13Performance by Activity ................................................................. 16
Market Analysis and Research ..................................................................................... 17Assisted Housing .................................................................................................................. 20Mortgage Loan Insurance ............................................................................................... 24Securitization .......................................................................................................................... 35People and Processes ........................................................................................................ 42
Risk Management .....................................................................................44
CONSOLIDATED FINANCIAL STATEMENTS ..........55
OTHER INFORMATION ..............................................119
EXPECTED OUTCOMES ...........................................125
We helpCanadians
meet their housing needs
Canada’sAuthority
on housing
TheHeartworld-leadingof a
housing system
CMHC
OUR VISION
OUR MISSION
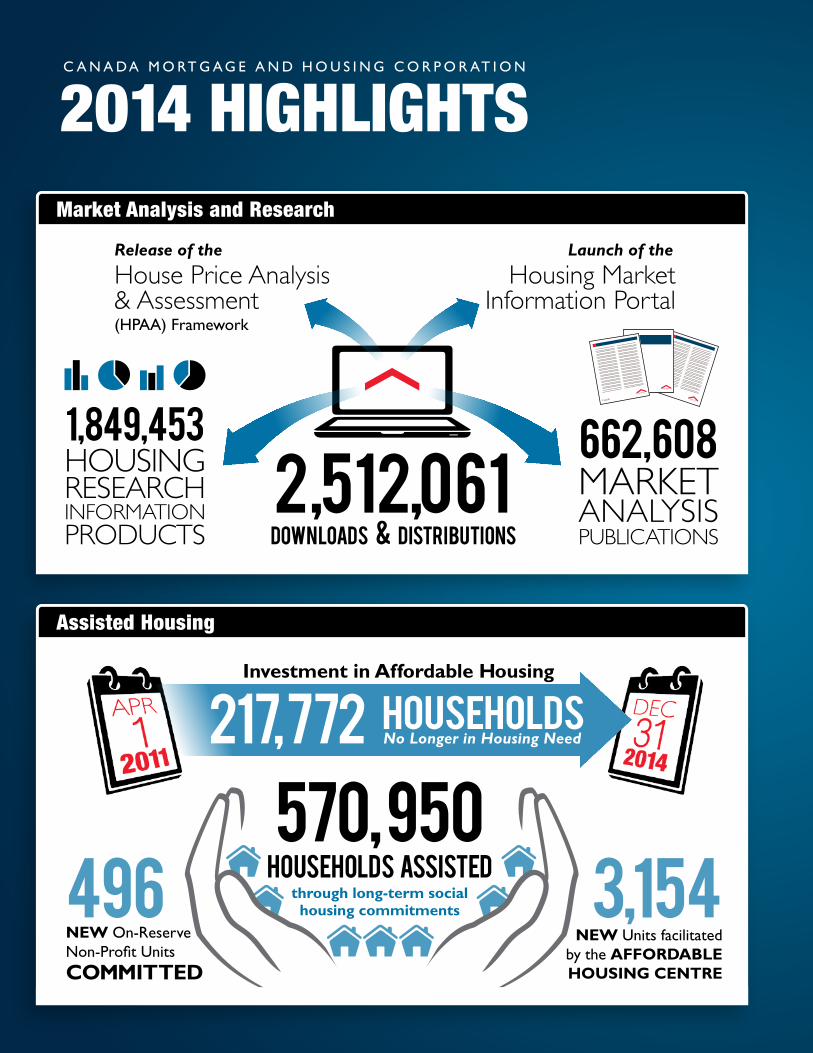
Launch of the
Housing Market Information Portal
Release of the
House Price Analysis & Assessment(HPAA) Framework
2,512,061downloads & Distributions
1,849,453HOUSINGRESEARCHINFORMATIONPRODUCTS
Market Analysis and Research
Assisted Housing
496 3,154NEW On-Reserve Non-Profit UnitsCOMMITTED
217,772 HOUSEHOLDSNo Longer in Housing Need
Investment in Affordable Housing
570,950Households assisted
MARKETANALYSISPUBLICATIONS
662,608
2014 HIGHLIGHTS
NEW Units facilitated by the AFFORDABLE HOUSING CENTRE
through long-term social housing commitments
C A N A DA M O RT G A G E A N D H O U S I N G C O R P O R AT I O N
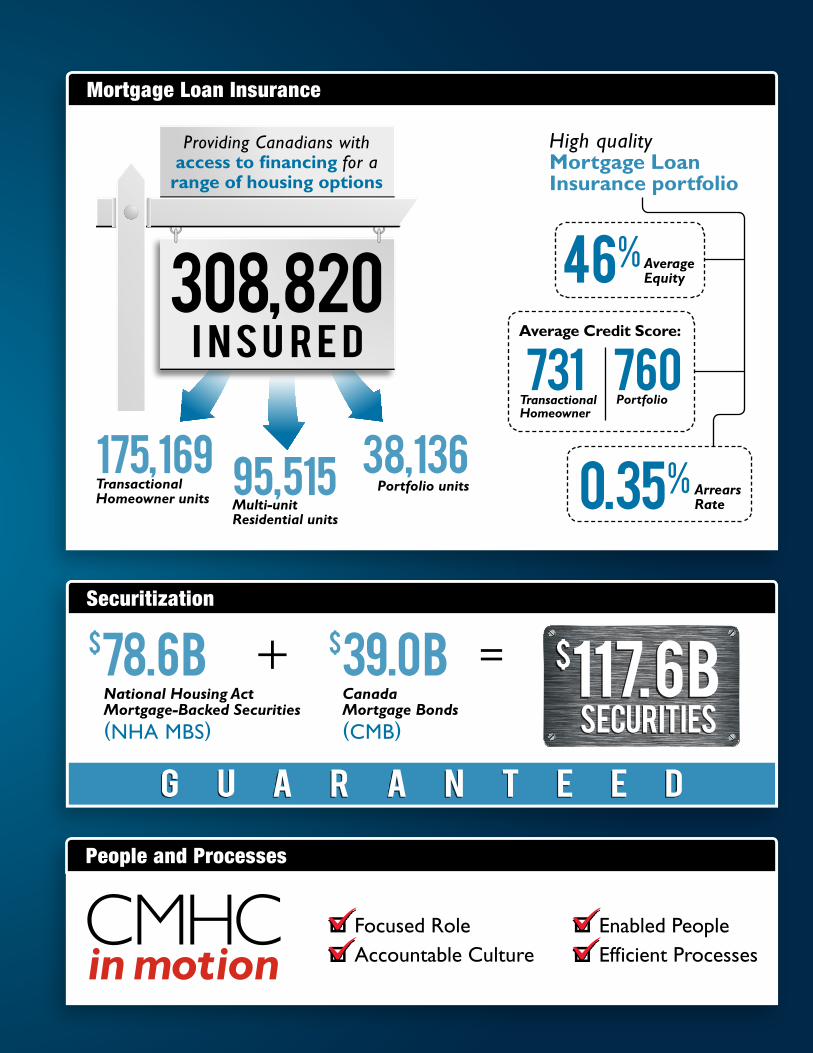
Focused RoleAccountable Culture
Enabled PeopleEfficient Processes
CMHCin motion
$78.6BNational Housing Act Mortgage-Backed Securities (NHA MBS)
$39.0BCanada Mortgage Bonds (CMB)
People and Processes
95,515Multi-unit Residential units
Mortgage Loan Insurance
Securitization
308,820I n s u r e d
Providing Canadians with access to financing for a
range of housing options
$117.6BSecurities
G u a r a n t e e d
High quality Mortgage Loan Insurance portfolio
46% Average Equity
Arrears Rate0.35%
Transactional Homeowner
Average Credit Score:
731 760Portfolio
175,169Transactional Homeowner units
38,136Portfolio units
Canada Mor tgage and Housing Corporation 2014 ANNUAL REPORT4
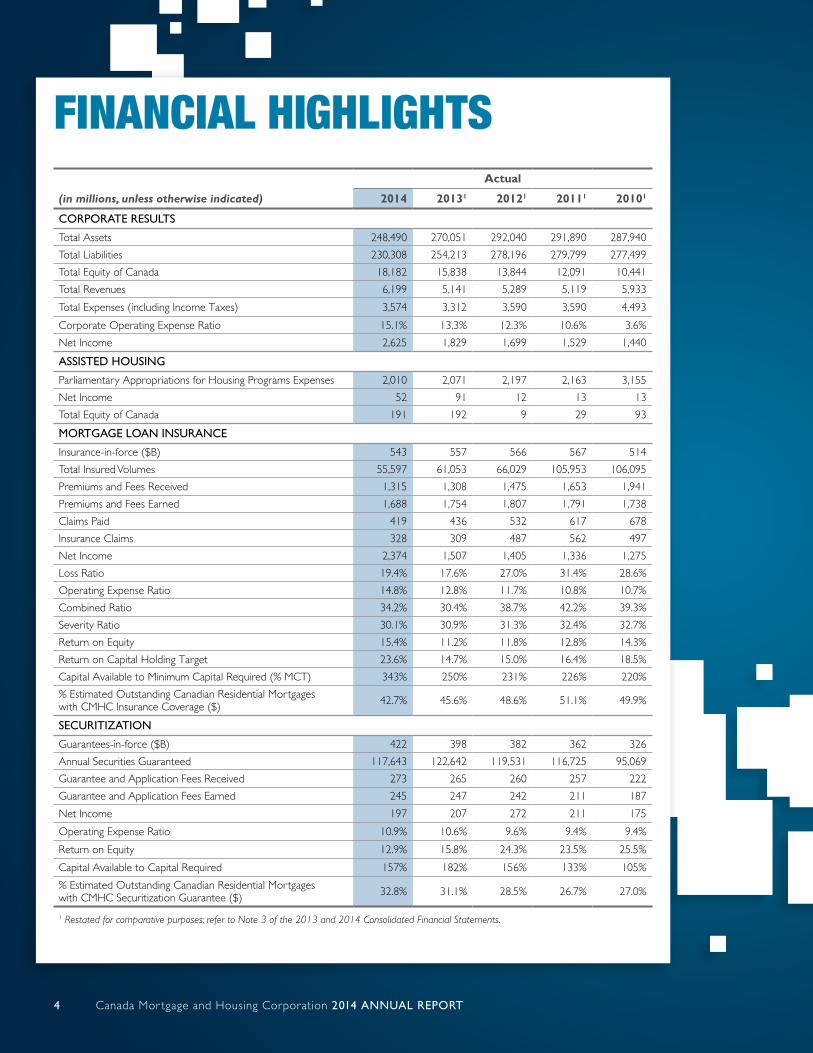
FINANCIAL HIGHLIGHTS
(in millions, unless otherwise indicated)
Actual
2014 20131 20121 20111 20101
CORPORATE RESULTS
Total Assets 248,490 270,051 292,040 291,890 287,940
Total Liabilities 230,308 254,213 278,196 279,799 277,499
Total Equity of Canada 18,182 15,838 13,844 12,091 10,441
Total Revenues 6,199 5,141 5,289 5,119 5,933
Total Expenses (including Income Taxes) 3,574 3,312 3,590 3,590 4,493
Corporate Operating Expense Ratio 15.1% 13.3% 12.3% 10.6% 3.6%
Net Income 2,625 1,829 1,699 1,529 1,440
ASSISTED HOUSING
Parliamentary Appropriations for Housing Programs Expenses 2,010 2,071 2,197 2,163 3,155
Net Income 52 91 12 13 13
Total Equity of Canada 191 192 9 29 93
MORTGAGE LOAN INSURANCE
Insurance-in-force ($B) 543 557 566 567 514
Total Insured Volumes 55,597 61,053 66,029 105,953 106,095
Premiums and Fees Received 1,315 1,308 1,475 1,653 1,941
Premiums and Fees Earned 1,688 1,754 1,807 1,791 1,738
Claims Paid 419 436 532 617 678
Insurance Claims 328 309 487 562 497
Net Income 2,374 1,507 1,405 1,336 1,275
Loss Ratio 19.4% 17.6% 27.0% 31.4% 28.6%
Operating Expense Ratio 14.8% 12.8% 11.7% 10.8% 10.7%
Combined Ratio 34.2% 30.4% 38.7% 42.2% 39.3%
Severity Ratio 30.1% 30.9% 31.3% 32.4% 32.7%
Return on Equity 15.4% 11.2% 11.8% 12.8% 14.3%
Return on Capital Holding Target 23.6% 14.7% 15.0% 16.4% 18.5%
Capital Available to Minimum Capital Required (% MCT) 343% 250% 231% 226% 220%
% Estimated Outstanding Canadian Residential Mortgages with CMHC Insurance Coverage ($) 42.7% 45.6% 48.6% 51.1% 49.9%
SECURITIZATION
Guarantees-in-force ($B) 422 398 382 362 326
Annual Securities Guaranteed 117,643 122,642 119,531 116,725 95,069
Guarantee and Application Fees Received 273 265 260 257 222
Guarantee and Application Fees Earned 245 247 242 211 187
Net Income 197 207 272 211 175
Operating Expense Ratio 10.9% 10.6% 9.6% 9.4% 9.4%
Return on Equity 12.9% 15.8% 24.3% 23.5% 25.5%
Capital Available to Capital Required 157% 182% 156% 133% 105%
% Estimated Outstanding Canadian Residential Mortgages with CMHC Securitization Guarantee ($) 32.8% 31.1% 28.5% 26.7% 27.0%
1 Restated for comparative purposes; refer to Note 3 of the 2013 and 2014 Consolidated Financial Statements.

MESSAGE FROM THE CHAIRPERSON
On behalf of the Board of Directors, I am pleased to present CMHC’s 2014 Annual Report. This
year, the Board focused on setting a course for CMHC that will ensure it is well positioned for the
future to fulfill its mandate.
Canada’s housing markets remained balanced for the most part in 2014 but there are emerging
risks – notably the decline in oil prices in the latter part of the year, potential overvaluation and
overbuilding in some markets and high levels of household debt. In addition, global events are
contributing to instability around the world to which Canada is not immune. The impact of economic
shocks, regardless of their cause, underscores the priority the Board set for CMHC in 2014 to
improve its risk management practices and to bolster its data and analysis of housing markets.
Through its mortgage loan insurance and securitization guarantee programs, CMHC facilitates
national access to mortgage financing and contributes to the stability of the financial system. At the
same time, these programs present real risks to the taxpayer. In support of the Government’s efforts
to reduce taxpayer exposure to the housing sector, in 2014 CMHC discontinued certain mortgage
loan insurance products and increased premiums. These decisions were made in the context of
retaining CMHC’s ability to fulfill its core mandate while ensuring that it has the ability to scale up
in times of economic duress to support financial stability, if required.
Part of CMHC’s mandate is the support the Corporation provides to Canadians whose housing needs are not
adequately met in the market. CMHC ensures that federal housing investments deliver maximum benefits to
Canadians in need. Strong partnerships with other orders of government and housing providers are essential
to CMHC’s success in this area.
We have challenged CMHC to become a higher-performing organization and, as Board members, we have
also challenged ourselves. This year, we undertook a peer assessment to identify areas for Board member
development and improvement in the performance of our duties as stewards of the Corporation.
I would also like to acknowledge the outstanding support the Board received from CMHC management and
employees in achieving our objectives this year.
Robert P. Kelly
Chairperson
Canada Mor tgage and Housing Corporation 2014 ANNUAL REPORT 5
I would like to take this opportunity to thank Michael Horgan, Rennie Pieterman, Michael Gendron and
Brian Johnston, who retired from the Board this year. Recently, Sandra Hanington departed as a result of her
appointment as Master of the Royal Canadian Mint. On behalf of the Board, I thank them for their contribution
and wish them well in their future endeavours. The Board also welcomes new members Paul Rochon, the
Deputy Minister of Finance, as well as Navjeet (Bob) Dhillon and Peter Sharpe who were appointed in
February 2015.

MESSAGE FROM THE PRESIDENT
I’m very proud of what we accomplished in 2014, my first year as CMHC’s President and CEO.
We moved quickly to articulate a new mission and vision that set the direction for our work in 2014
and for the future. Our mission to help Canadians meet their housing needs has helped us focus on
activities that contribute most to fulfilling our mandate and to better serving Canadians. Our vision
to be the heart of a world-leading housing system signals our aspiration not only to preserve but
to improve financial stability and access to housing.
Guided by our mission and vision, we pursued challenging goals for CMHC in 2014. Our activities and
accomplishments for the year are discussed throughout this report. In particular, I want to highlight
key achievements that most resonate with our refocused approach.
This approach starts with ensuring that Canadians have access to housing financing through our
mortgage loan insurance products while minimizing taxpayer exposure to risk. In keeping with our
mission to help Canadians meet their housing needs, we discontinued second home mortgage
loan insurance. We also no longer offer products to self-employed borrowers without 3rd party
validation. As part of our efforts to ensure we have the capital required to be able to respond in
times of economic duress, and minimize taxpayer exposure, we increased insurance premiums for
Homeowner and 1-4 unit rental properties.
CMHC’s securitization programs provide a reliable source of long-term mortgage funding for residential
mortgage lenders. At the same time, we have a role to play in shaping the market. Increases to come into
effect in 2015 to our guarantee fees for National Housing Act Mortgage-Backed Securities (NHA MBS) and
to Canada Mortgage Bonds (CMB) are an important step toward further reducing taxpayer exposure to the
housing sector and encouraging alternative funding options in the private market.
In 2014 we also took additional steps to integrate risk management into all of our activities by introducing a
risk governance model (“Three Lines of Defence”) which sets out responsibilities for managing risk at all levels
of the organization.
Over the year, I had the opportunity to meet with many others who share our commitment to improve
access to quality, affordable housing for lower income Canadians, seniors, Aboriginal families and people with
disabilities. In November, I met with my provincial and territorial government colleagues to strengthen our
partnerships on affordable housing. Throughout 2014, we worked with provinces and territories to extend
bilateral Investment in Affordable Housing Agreements (IAH) to 2019. Federal commitments under these
agreements will total more than $1.9 billion since their inception in 2011. In support of housing programs
on and off-reserve, CMHC spent just over $2 billion in Parliamentary appropriations on behalf of the
Government of Canada in 2014. Through these investments, CMHC is helping to create affordable housing
solutions to meet the needs of Canadians.
Canada Mor tgage and Housing Corporation 2014 ANNUAL REPORT6
We want ours to be the leading voice in canadian market analysis and housing research and, in 2014, we
made great strides toward this goal. By increasing reporting activities and by creating tools and products to
help Canadians make more informed decisions, we addressed transparency concerns regarding gaps in the
information we report. CMHC’s Insurance Business Supplement provided clarity with respect to our residential
mortgage insurance business, while research on foreign investments in condominium markets, the launch of
the Housing Market Information Portal and the release of the initial results from our House Price Analysis and
Assessment (HPAA) framework have all expanded the availability and quality of housing market data.
I am very thankful for the efforts and dedication of our employees across the country. Together in 2014, we
took steps to transform CMHC into the higher-performing organization we want to be and to bring greater
value to Canadians. This transformation is anchored by the four pillars of our CMHC in Motion program of
change – a Focused Role, an Accountable Culture, Enabled People and Efficient Processes. Change is often
difficult, but our employees have remained steadfast and resilient in ensuring CMHC continues to deliver
the best possible service to Canadians. It is through their passion and commitment that CMHC will continue
to Build, Lead, Succeed.
Evan W. Siddall
President and Chief Executive Officer
Canada Mor tgage and Housing Corporation 2014 ANNUAL REPORT 7


MANAGEMENT’S DISCUSSION AND ANALYSISThe following Management’s Discussion and Analysis (MD&A) of the financial condition and results of
operations as approved by the Board of Directors on 26 March 2015 is prepared for the year ended
31 December 2014. This MD&A should be read in conjunction with the audited Consolidated Financial
Statements. Unless otherwise indicated, all financial information in this report has been prepared in accordance
with International Financial Reporting Standards (IFRS) and all amounts are expressed in Canadian dollars.
Forward-Looking StatementsOur Annual Report contains forward-looking statements including, but not limited to, statements made in the “Operating
Environment”, “Performance by Activity”, “Risk Management”, and “Expected Outcomes” sections of the report. Specific
forward-looking statements include, but are not limited to, statements with respect to our outlook for the regulatory
environment in which we operate, the outlook and priorities for each activity and the risk environment.
By their nature, forward-looking statements require us to make assumptions and are subject to inherent risks and
uncertainties. These risks and uncertainties, many of which are beyond our control, include, but are not limited to, national
and international economic, financial and regulatory conditions, and could cause actual results to differ materially from the
expectations expressed in these forward-looking statements. Forward-looking statements are typically identified by words
such as “may”, “should”, “could”, “would”, “will”, as well as expressions such as “believe”, “expect”, “forecast”, “anticipate”,
“intend”, “plan”, “estimate” and other similar expressions.
The forward-looking information contained in the Annual Report is presented to assist readers in understanding our
financial condition and performance. It may not be suitable for other purposes and readers should not place undue
reliance on it. The forward-looking statements are based on management’s current predictions, forecasts, projections,
expectations and conclusions and the assumptions related to these predictions, forecasts, projections, expectations and
conclusions may not prove to be correct. We do not undertake to update any forward-looking statements made in this
Annual Report.
Non-IFRS Measures We use a number of financial measures to assess our performance. Some of these measures are not calculated in
accordance with IFRS, are not defined by IFRS, and do not have standardized meanings that would ensure consistency and
comparability with other institutions. These non-IFRS measures are presented to supplement the information disclosed
in the Consolidated Financial Statements and Notes to the Consolidated Financial Statements which are prepared in
accordance with IFRS and may be useful in analyzing performance and understanding the measures used by management
in its financial and operational decision making. Where non-IFRS measures are used throughout the Annual Report, a
definition of the term will be disclosed in the Glossary for Non-IFRS Financial Measures section at the end of this MD&A.
Canada Mor tgage and Housing Corporation 2014 ANNUAL REPORT 9
Canada Mor tgage and Housing Corporation 2014 ANNUAL REPORT10
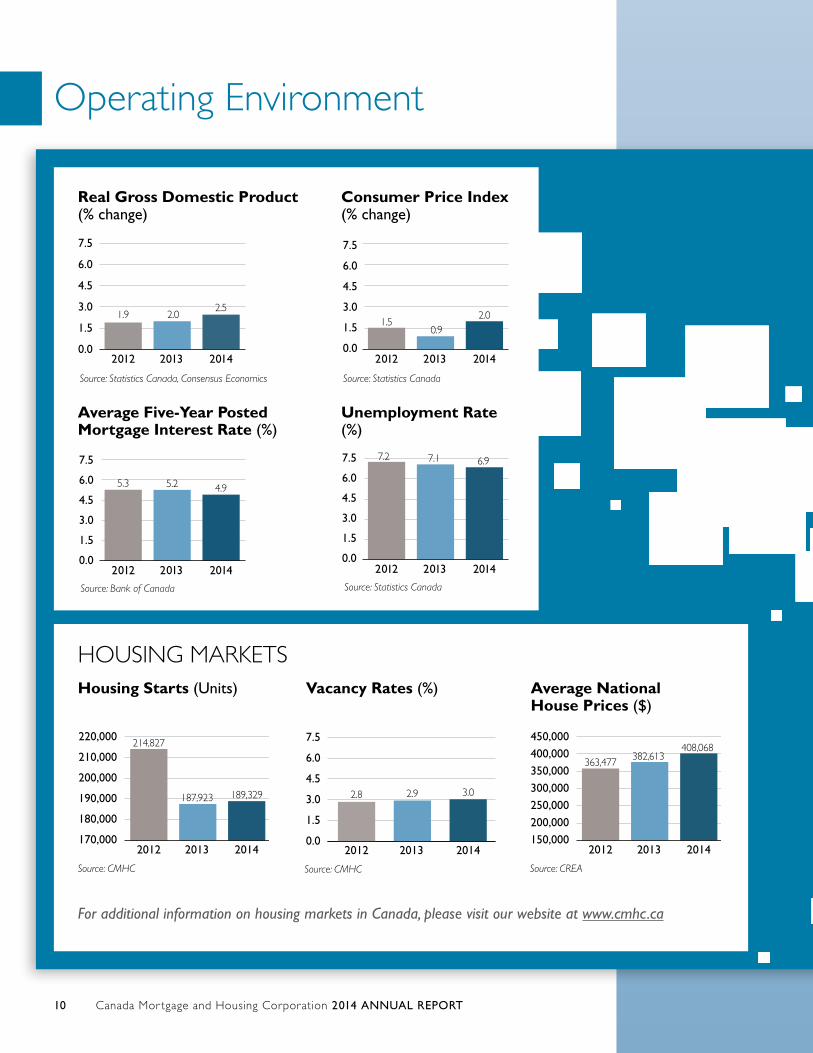
Operating Environment
For additional information on housing markets in Canada, please visit our website at www.cmhc.ca
Consumer Price Index (% change)
Real Gross Domestic Product (% change)
Unemployment Rate (%)
Average Five-Year Posted Mortgage Interest Rate (%)
HOUSING MARKETSVacancy Rates (%)Housing Starts (Units)
2012 2013 2014
220,000
210,000
200,000
190,000
180,000
170,000
Source: CMHC
189,329187,923
214,827
2012 2013 2014
Source: CMHC
7.5
6.0
4.5
3.0
1.5
0.0
3.02.92.8
Average National House Prices ($)
2012 2013 2014
450,000400,000350,000300,000250,000200,000150,000
Source: CREA
408,068 363,477 382,613
Source: Statistics Canada, Consensus Economics
7.5
6.0
4.5
3.0
1.5
0.02012 2013 2014
2.52.01.9
Source: Statistics Canada
7.5
6.0
4.5
3.0
1.5
0.02012 2013 2014
2.00.9
1.5
Source: Bank of Canada
7.5
6.0
4.5
3.0
1.5
0.02012 2013 2014
4.95.25.3
Source: Statistics Canada
7.5
6.0
4.5
3.0
1.5
0.02012 2013 2014
6.97.17.2
Canada Mor tgage and Housing Corporation 2014 ANNUAL REPORT 11
Economic Conditions and Housing Indicators
In 2014, resale market conditions remained balanced and broadly in-line with key indicators such as employment,
gross domestic product (GDP) and population growth. Nationally, the average Multiple Listing Service® (MLS®)
price increased by 6.7% relative to 2013 due in part to greater MLS® sales growth in more expensive markets
in Ontario and British Columbia. The rental vacancy rate remained stable, as demand for rental housing was
supported by net migration and steady levels of full-time employment in the 15 to 24 age group. Total housing
starts remained at a similar level as in 2013, supported by low mortgage rates and employment. Fundamentals
supporting Canada’s housing markets, such as migration, employment and income, were stronger in the western
part of the country.
Economic conditions in Canada in 2015 overall are projected to be stable relative to 2014 according to the
Consensus of Economic Forecasters of Canada, albeit with regional differences due to lower oil prices. The
Consensus Private Sector Forecasters Survey as of 8 February 2015 notes that:
■■ Canadian GDP is forecast to increase between 1.9% and 2.5% in 2015.
■■ The overall Canadian unemployment rate should decline, and is expected to be between 6.4% to 6.9% in
2015 compared to 6.9% in 2014.
■■ Low interest rates will continue to support Canada’s housing market in 2015.
We expect housing starts to moderate at a gradual pace over the forecast horizon, from 189,329 units in 2014
to 187,400 units in 2015 and 185,100 units in 2016. MLS® sales in 2015 are expected to remain close to levels
observed in 2014. By 2016, we expect demand for existing units to moderate slightly relative to 2014 and 2015,
but still remain above their level over the 2009 to 2013 period. We expect national market conditions to remain
relatively balanced and house prices are projected to remain in line with underlying demographic and economic
factors. We expect the average MLS® price for Canada to increase by 1.5% in 2015 to $414,200 and by 1.6% in
2016 to $420,900. The average price for Canada is pushed up by the impact of higher priced markets such as
Vancouver and Toronto. Excluding these two Census Metropolitan Areas, the average MLS® price for Canada
is forecast to be $332,180 in 2015 and $339,450 in 2016. While the outlook for the Canadian housing sector
is one of general stability, there are global and domestic risks to consider. The most significant downside risk
to recently emerge is the decline in world oil prices. Household debt is also a vulnerability that requires close
monitoring. The Canadian debt-to-income ratio continues to trend up, rising from 161.5 in the second quarter
of 2014 to 162.6 in the third quarter of 2014.
Mortgage Loan Insurance DevelopmentsIn recent years, the Government of Canada has taken a number of measures to help ensure that Canada’s
financial system remains strong and to reinforce the housing finance framework. Limiting government exposure
to the housing sector continues to be an important objective of CMHC.
Amendments to the National Housing Act (NHA) and the Protection of Residential Mortgage or Hypothecary Insurance Act (PRMHIA) in Part 6, Division 24 of the Economic Action Plan 2014 Act, No.1
On 19 June 2014, Bill C-31, an Act to implement certain provisions of the budget tabled in Parliament on
11 February 2014 and other measures (Economic Action Plan 2014 Act, No. 1) received Royal Assent. The Act
brings several amendments to the NHA and PRMHIA that affect us. Specifically, the Act explicitly extends
regulation-making power over government-backed insurance to existing insured loans (as opposed to only new
insurance) under the PRMHIA and the NHA. In addition, it amends PRMHIA to require that mortgage loans
insured before the coming into force of PRMHIA must also comply with any regulations under the PRMHIA
that relate to mortgage loans that may back securities guaranteed under the NHA.
Canada Mor tgage and Housing Corporation 2014 ANNUAL REPORT12
Fees Payable to the Government of Canada
Pursuant to section 8.2 of the NHA, effective 1 January 2014, our mortgage loan insurance business is subject
to a risk fee payable to the Government of Canada of 3.25% of premiums written and an additional 10 basis
points on new portfolio insurance written. Our fee of 3.25% takes into account the full government backing
of our insurance liabilities as opposed to the 90% guarantee of private mortgage insurers.
OSFI Guideline B-21: Residential Mortgage Insurance Underwriting Practices and Procedures
The Office of the Superintendent of Financial Institutions (OSFI) published its final Guideline B-21 Residential
Mortgage Insurance Underwriting Practices and Procedures for mortgage insurers on 6 November 2014. Most
of the practices and procedures in the guideline have already been adopted and we do not anticipate any
significant changes to our operations.
Minimum Capital Test for Mortgage Loan Insurers
OSFI is in the process of developing a new capital framework specific to mortgage insurers which will replace
the current Minimum Capital Test (MCT). This new framework is not expected to be in place until 2016 or
later. As a result, mortgage loan insurers are expected to use an interim capital framework, which is a modified
version of the MCT for federally regulated property and casualty insurers that was released by OSFI on
24 September 2014. Our MCT ratio declined by 17 percentage points as at 1 January 2015 under the
modified MCT.
Review of Mortgage Loan Insurance Business
We evaluated our mortgage loan insurance products in 2014 against our new mission statement, which
emphasizes housing needs. This review resulted in the elimination of certain product offerings, including the
availability of insurance on loans for second homes, borrowers without independent income validation, and
condominium construction financing.
Effective 1 May 2014, we increased our mortgage loan insurance premiums by approximately 15% on all
Transactional Homeowner loans and 1-4 unit rental properties. In addition, effective 31 July 2014, we aligned
our low ratio transactional mortgage loan insurance product with our high ratio product by establishing
maximum housing prices, amortization periods and debt servicing ratios.
Other initiatives to support the efficient functioning and competitiveness of the housing finance system included
modifications to our Portfolio insurance with a revised annual allocation of $9 billion and the elimination of the
substitution feature for new Portfolio pools (those insured after 31 December 2013).
Securitization DevelopmentsAnnual Limit on New Securities Guaranteed
Pursuant to the NHA, the Minister of Finance approves the terms and conditions for our Securitization Programs,
including the maximum guarantees for the year. In 2014, the maximums were $80 billion and $40 billion for
NHA MBS and CMB, respectively, and will remain at these levels for 2015. Effective 1 April 2015, the fees we
pay to the Government of Canada for their guarantee increased.
Covered Bonds
Beginning in the fourth quarter, the European Union (EU) recognized Canadian Covered Bonds as a Level 2A
liquid asset for the purposes of EU-based financial institutions complying with the Liquidity Coverage Ratio
under Basel III.
Canada Mor tgage and Housing Corporation 2014 ANNUAL REPORT 13
Investment in Affordable HousingEconomic Action Plan 2013 confirmed the Government of Canada’s continued commitment to working
with provinces and territories to develop and implement solutions to housing by renewing the Investment in
Affordable Housing (IAH) to March 2019. This federal investment of $1.25 billion is being provided through
CMHC over five years, and is cost-shared by provinces and territories. Funds provided to provinces and
territories through the IAH will support the use of apprentices, which will support training of skilled labour.
By early 2015, all jurisdictions had agreements in place to extend IAH for another five years to 2019.
Government DirectionAs a federal Crown corporation which receives Parliamentary Appropriations, CMHC participates in
Government fiscal restraint. A two-year operating budget freeze was introduced for fiscal years 2014/15 and
2015/16. Although the freeze does not apply to our non-appropriations based activities, we respect the spirit
and intent of the freeze for our commercial operations.
We have taken steps to ensure the long-term sustainability of our pension plan and to manage costs. In this
context, we introduced a defined contribution component to our pension plan effective 4 April 2013 for
all new hires. For the defined benefit component, steps have been taken to achieve a 50/50 cost sharing
arrangement by 2017.
Condensed Consolidated Financial ResultsCondensed Consolidated Balance Sheet
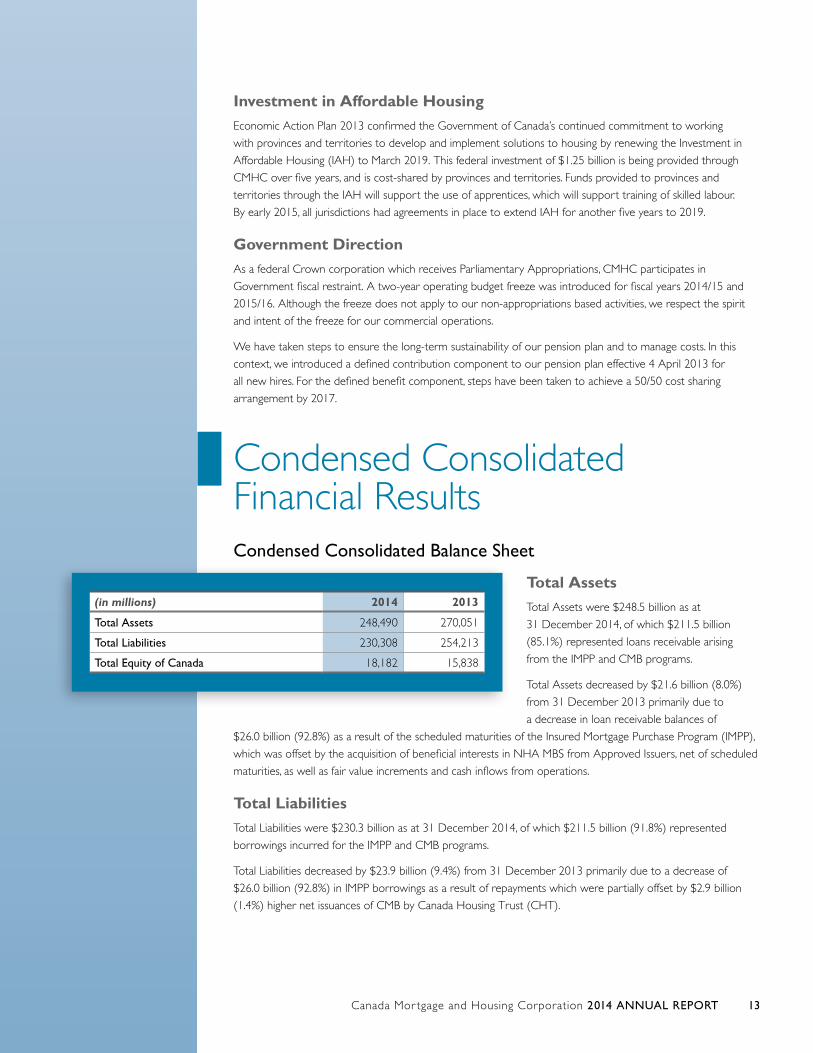
Total Assets Total Assets were $248.5 billion as at
31 December 2014, of which $211.5 billion
(85.1%) represented loans receivable arising
from the IMPP and CMB programs.
Total Assets decreased by $21.6 billion (8.0%)
from 31 December 2013 primarily due to
a decrease in loan receivable balances of
$26.0 billion (92.8%) as a result of the scheduled maturities of the Insured Mortgage Purchase Program (IMPP),
which was offset by the acquisition of beneficial interests in NHA MBS from Approved Issuers, net of scheduled
maturities, as well as fair value increments and cash inflows from operations.
Total Liabilities Total Liabilities were $230.3 billion as at 31 December 2014, of which $211.5 billion (91.8%) represented
borrowings incurred for the IMPP and CMB programs.
Total Liabilities decreased by $23.9 billion (9.4%) from 31 December 2013 primarily due to a decrease of
$26.0 billion (92.8%) in IMPP borrowings as a result of repayments which were partially offset by $2.9 billion
(1.4%) higher net issuances of CMB by Canada Housing Trust (CHT).
(in millions) 2014 2013
Total Assets 248,490 270,051
Total Liabilities 230,308 254,213
Total Equity of Canada 18,182 15,838
Canada Mor tgage and Housing Corporation 2014 ANNUAL REPORT14
Total Equity of CanadaTotal Equity of Canada was $18,182 million at 31 December 2014, an increase of $2,344 million (14.8%)
representing the Comprehensive Income recognized in 2014.
Condensed Consolidated Statement of Income and Comprehensive Income
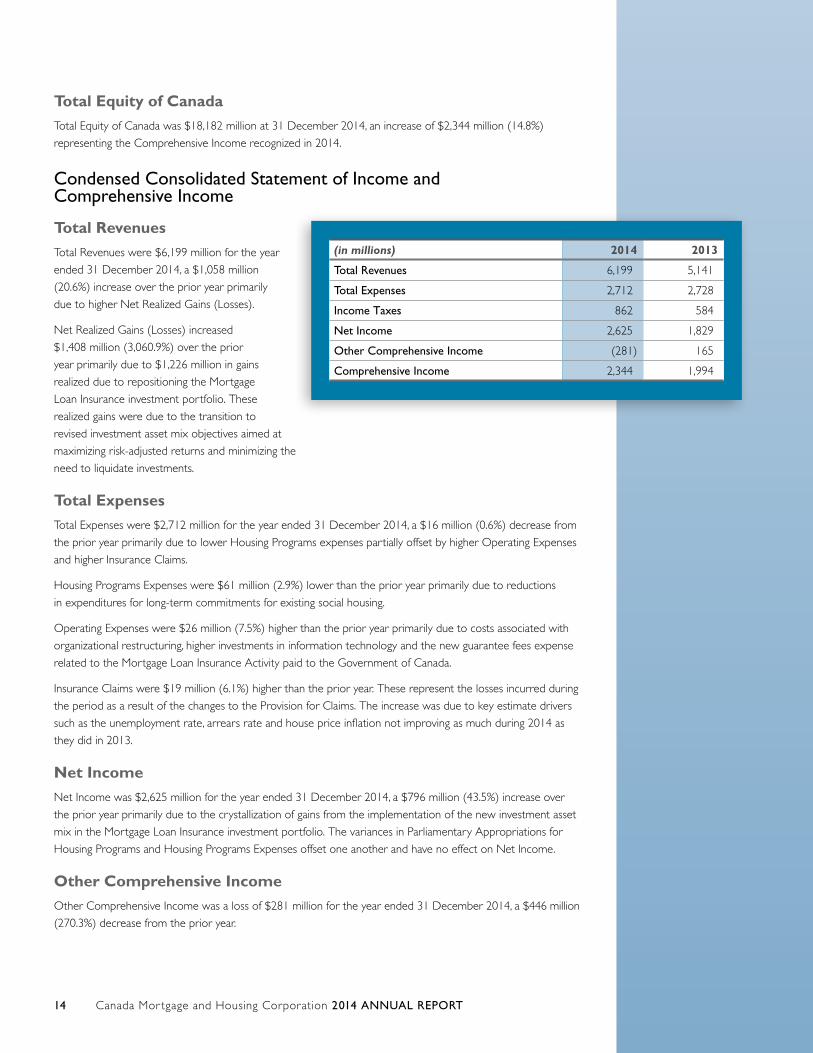
Total RevenuesTotal Revenues were $6,199 million for the year
ended 31 December 2014, a $1,058 million
(20.6%) increase over the prior year primarily
due to higher Net Realized Gains (Losses).
Net Realized Gains (Losses) increased
$1,408 million (3,060.9%) over the prior
year primarily due to $1,226 million in gains
realized due to repositioning the Mortgage
Loan Insurance investment portfolio. These
realized gains were due to the transition to
revised investment asset mix objectives aimed at
maximizing risk-adjusted returns and minimizing the
need to liquidate investments.
Total ExpensesTotal Expenses were $2,712 million for the year ended 31 December 2014, a $16 million (0.6%) decrease from
the prior year primarily due to lower Housing Programs expenses partially offset by higher Operating Expenses
and higher Insurance Claims.
Housing Programs Expenses were $61 million (2.9%) lower than the prior year primarily due to reductions
in expenditures for long-term commitments for existing social housing.
Operating Expenses were $26 million (7.5%) higher than the prior year primarily due to costs associated with
organizational restructuring, higher investments in information technology and the new guarantee fees expense
related to the Mortgage Loan Insurance Activity paid to the Government of Canada.
Insurance Claims were $19 million (6.1%) higher than the prior year. These represent the losses incurred during
the period as a result of the changes to the Provision for Claims. The increase was due to key estimate drivers
such as the unemployment rate, arrears rate and house price inflation not improving as much during 2014 as
they did in 2013.
Net IncomeNet Income was $2,625 million for the year ended 31 December 2014, a $796 million (43.5%) increase over
the prior year primarily due to the crystallization of gains from the implementation of the new investment asset
mix in the Mortgage Loan Insurance investment portfolio. The variances in Parliamentary Appropriations for
Housing Programs and Housing Programs Expenses offset one another and have no effect on Net Income.
Other Comprehensive Income Other Comprehensive Income was a loss of $281 million for the year ended 31 December 2014, a $446 million
(270.3%) decrease from the prior year.
(in millions) 2014 2013
Total Revenues 6,199 5,141
Total Expenses 2,712 2,728
Income Taxes 862 584
Net Income 2,625 1,829
Other Comprehensive Income (281) 165
Comprehensive Income 2,344 1,994
Canada Mor tgage and Housing Corporation 2014 ANNUAL REPORT 15
Net Unrealized Gains from Available for Sale Financial Instruments (net of tax) increased over the prior year
by $470 million (47,000%) primarily due to stronger market performance. The bond portfolio gains were
significantly higher due to a steep decline in yields during 2014 compared to a significant increase in yields
during 2013.
Offsetting this, was a $515 million (547.9%) Reclassification of Prior Years’ Net Unrealized (Gains) Losses
Realized in the Period in Net Income (net of tax) due to the implementation of a new investment asset mix
in the Mortgage Loan Insurance portfolio during the third and fourth quarters. Further, Remeasurements of the
Net Defined Benefit Plan decreased year-over-year by $401 million (154.2%) primarily as a result of a decline in
the discount rate in 2014 (from 4.8% to 4.0%) compared to an increase in the discount rate last year (3.9% to
4.8% in 2013).
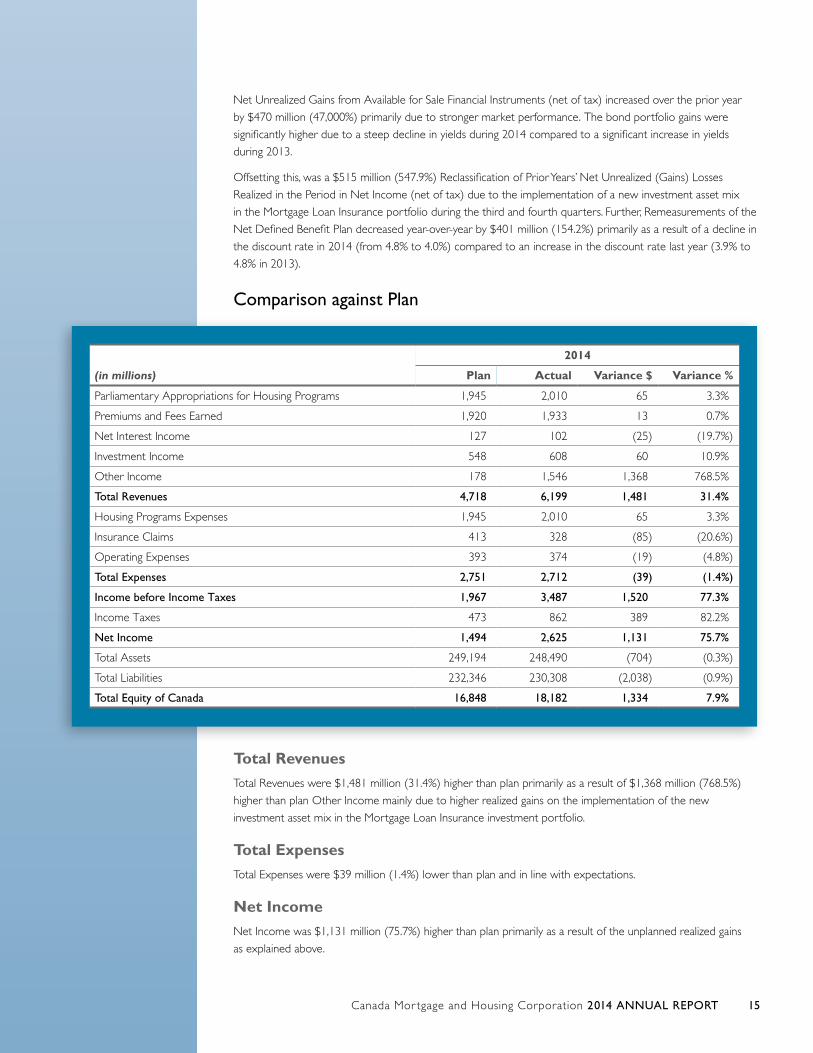
Comparison against Plan
Total Revenues Total Revenues were $1,481 million (31.4%) higher than plan primarily as a result of $1,368 million (768.5%)
higher than plan Other Income mainly due to higher realized gains on the implementation of the new
investment asset mix in the Mortgage Loan Insurance investment portfolio.
Total ExpensesTotal Expenses were $39 million (1.4%) lower than plan and in line with expectations.
Net IncomeNet Income was $1,131 million (75.7%) higher than plan primarily as a result of the unplanned realized gains
as explained above.
(in millions)
2014
Plan Actual Variance $ Variance %
Parliamentary Appropriations for Housing Programs 1,945 2,010 65 3.3%
Premiums and Fees Earned 1,920 1,933 13 0.7%
Net Interest Income 127 102 (25) (19.7%)
Investment Income 548 608 60 10.9%
Other Income 178 1,546 1,368 768.5%
Total Revenues 4,718 6,199 1,481 31.4%
Housing Programs Expenses 1,945 2,010 65 3.3%
Insurance Claims 413 328 (85) (20.6%)
Operating Expenses 393 374 (19) (4.8%)
Total Expenses 2,751 2,712 (39) (1.4%)
Income before Income Taxes 1,967 3,487 1,520 77.3%
Income Taxes 473 862 389 82.2%
Net Income 1,494 2,625 1,131 75.7%
Total Assets 249,194 248,490 (704) (0.3%)
Total Liabilities 232,346 230,308 (2,038) (0.9%)
Total Equity of Canada 16,848 18,182 1,334 7.9%
Canada Mor tgage and Housing Corporation 2014 ANNUAL REPORT16
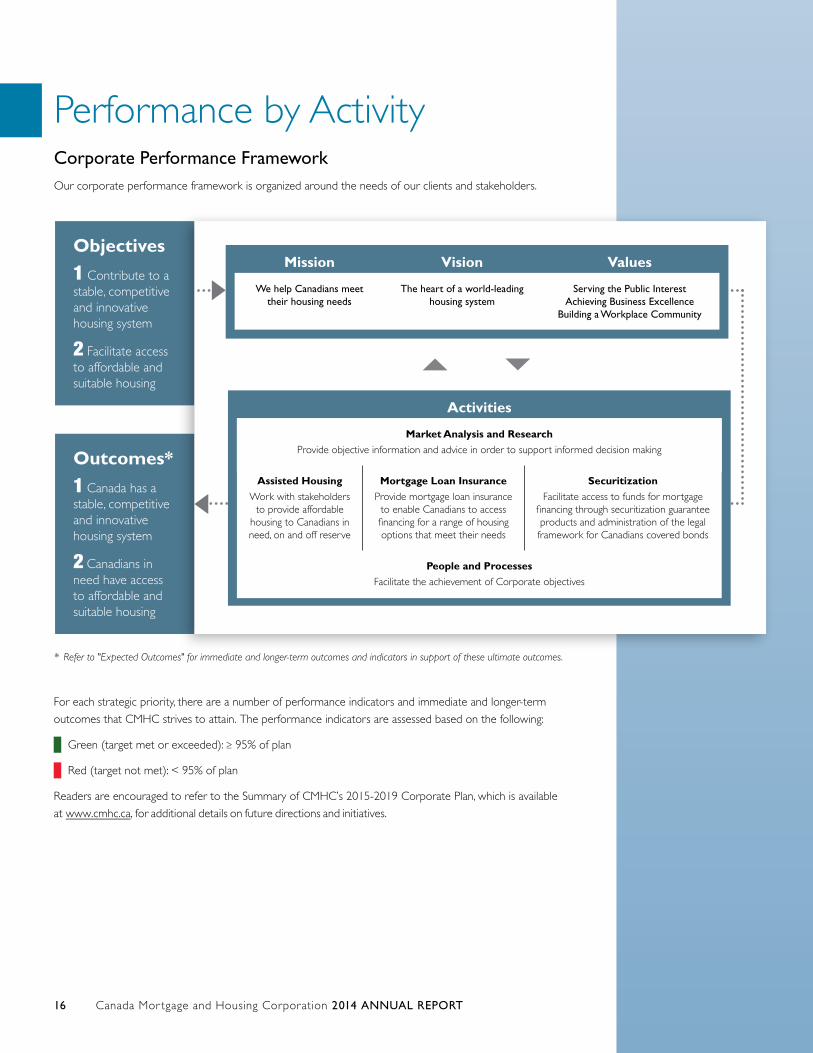
Performance by Activity Corporate Performance FrameworkOur corporate performance framework is organized around the needs of our clients and stakeholders.
* Refer to "Expected Outcomes" for immediate and longer-term outcomes and indicators in support of these ultimate outcomes.
For each strategic priority, there are a number of performance indicators and immediate and longer-term
outcomes that CMHC strives to attain. The performance indicators are assessed based on the following:
Green (target met or exceeded): ≥ 95% of plan
Red (target not met): < 95% of plan
Readers are encouraged to refer to the Summary of CMHC’s 2015-2019 Corporate Plan, which is available
at www.cmhc.ca, for additional details on future directions and initiatives.
Mission Vision Values
We help Canadians meet their housing needs
The heart of a world-leading housing system
Serving the Public Interest Achieving Business Excellence
Building a Workplace Community
Activities
Market Analysis and Research Provide objective information and advice in order to support informed decision making
Assisted HousingWork with stakeholders
to provide affordable housing to Canadians in need, on and off reserve
Mortgage Loan InsuranceProvide mortgage loan insurance
to enable Canadians to access financing for a range of housing options that meet their needs
SecuritizationFacilitate access to funds for mortgage
financing through securitization guarantee products and administration of the legal framework for Canadians covered bonds
People and ProcessesFacilitate the achievement of Corporate objectives
Objectives
1 Contribute to astable, competitive and innovative housing system
2 Facilitate accessto affordable and suitable housing
Outcomes*
1 Canada has astable, competitive and innovative housing system
2 Canadians inneed have access to affordable and suitable housing
Canada Mor tgage and Housing Corporation 2014 ANNUAL REPORT 17
MARKET ANALYSIS AND RESEARCH
Description of Activity
Our Market Analysis and Research Activities support informed decision making through the creation,
interpretation and sharing of housing related data and information. We undertake surveys, data analysis and
forecasting at the local, provincial and national levels and undertake research on a range of issues that support
a well-functioning housing system and promote housing affordability and choice. These efforts improve the
understanding of current and future housing challenges in Canada and facilitate the development of housing-
related policy.
Financial Highlights
■■ Research expenditures decreased in 2014 primarily as a result of the federal government’s review of spending
under Economic Action Plan 2012.
Non-Financial Highlights
■■ Launch of Housing Market Information Portal
■■ Public release of House Price Analysis and Assessment (HPAA) Framework
■■ Public release of inaugural Condominium Owners Survey Report for Toronto and Vancouver
■■ Publication of statistics on foreign investor activity for 11 of the largest Canadian condominium markets
■■ Completion of CMHC’s leading edge EQuilibriumTM Sustainable Housing Demonstration Initiative
■■ Accurate forecasts for housing starts within 2.4% of actual
■■ 662,608 market analysis publications downloaded or distributed
■■ 1,849,453 housing research information products downloaded or distributed
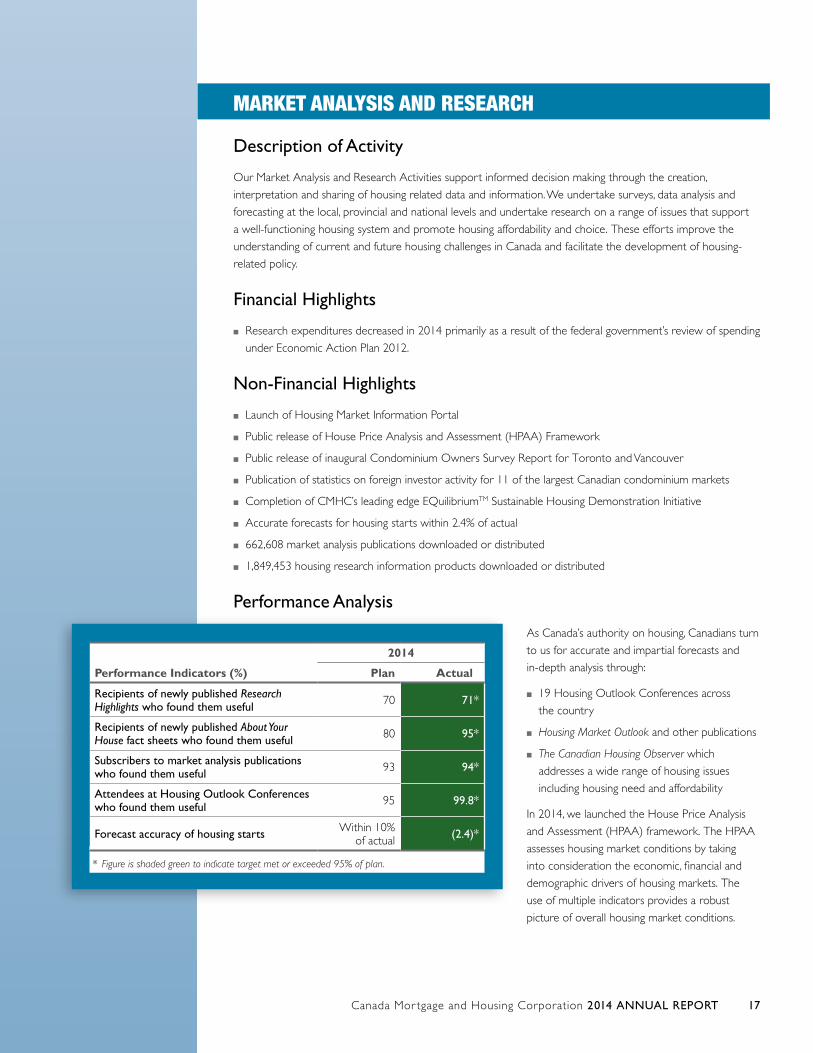
Performance Analysis
As Canada’s authority on housing, Canadians turn
to us for accurate and impartial forecasts and
in-depth analysis through:
■■ 19 Housing Outlook Conferences across
the country
■■ Housing Market Outlook and other publications
■■ The Canadian Housing Observer which
addresses a wide range of housing issues
including housing need and affordability
In 2014, we launched the House Price Analysis
and Assessment (HPAA) framework. The HPAA
assesses housing market conditions by taking
into consideration the economic, financial and
demographic drivers of housing markets. The
use of multiple indicators provides a robust
picture of overall housing market conditions.
Performance Indicators (%)
2014
Plan Actual
Recipients of newly published Research Highlights who found them useful 70 71*
Recipients of newly published About Your House fact sheets who found them useful 80 95*
Subscribers to market analysis publications who found them useful 93 94*
Attendees at Housing Outlook Conferences who found them useful 95 99.8*
Forecast accuracy of housing starts Within 10% of actual (2.4)*
* Figure is shaded green to indicate target met or exceeded 95% of plan.
Canada Mor tgage and Housing Corporation 2014 ANNUAL REPORT18
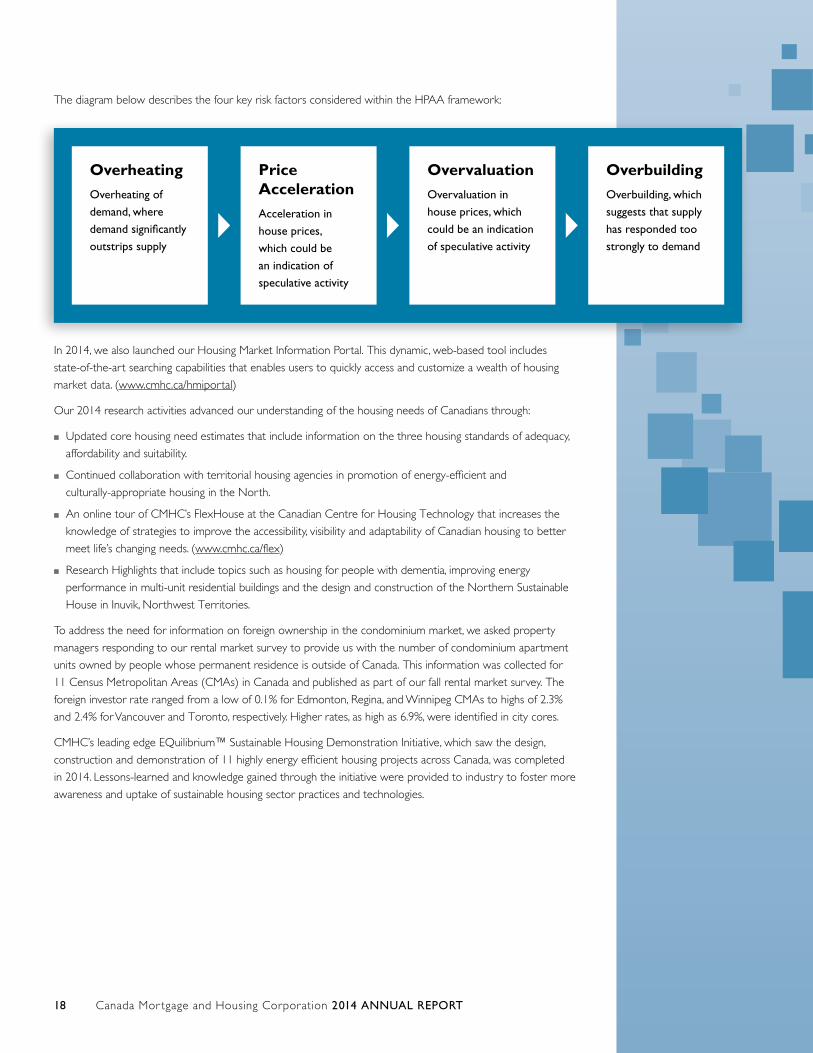
The diagram below describes the four key risk factors considered within the HPAA framework:
In 2014, we also launched our Housing Market Information Portal. This dynamic, web-based tool includes
state-of-the-art searching capabilities that enables users to quickly access and customize a wealth of housing
market data. (www.cmhc.ca/hmiportal)
Our 2014 research activities advanced our understanding of the housing needs of Canadians through:
■■ Updated core housing need estimates that include information on the three housing standards of adequacy,
affordability and suitability.
■■ Continued collaboration with territorial housing agencies in promotion of energy-efficient and
culturally-appropriate housing in the North.
■■ An online tour of CMHC’s FlexHouse at the Canadian Centre for Housing Technology that increases the
knowledge of strategies to improve the accessibility, visibility and adaptability of Canadian housing to better
meet life’s changing needs. (www.cmhc.ca/flex)
■■ Research Highlights that include topics such as housing for people with dementia, improving energy
performance in multi-unit residential buildings and the design and construction of the Northern Sustainable
House in Inuvik, Northwest Territories.
To address the need for information on foreign ownership in the condominium market, we asked property
managers responding to our rental market survey to provide us with the number of condominium apartment
units owned by people whose permanent residence is outside of Canada. This information was collected for
11 Census Metropolitan Areas (CMAs) in Canada and published as part of our fall rental market survey. The
foreign investor rate ranged from a low of 0.1% for Edmonton, Regina, and Winnipeg CMAs to highs of 2.3%
and 2.4% for Vancouver and Toronto, respectively. Higher rates, as high as 6.9%, were identified in city cores.
CMHC’s leading edge EQuilibrium™ Sustainable Housing Demonstration Initiative, which saw the design,
construction and demonstration of 11 highly energy efficient housing projects across Canada, was completed
in 2014. Lessons-learned and knowledge gained through the initiative were provided to industry to foster more
awareness and uptake of sustainable housing sector practices and technologies.
OverheatingOverheating of demand, where demand significantly outstrips supply
Price AccelerationAcceleration in house prices, which could be an indication of speculative activity
OvervaluationOvervaluation in house prices, which could be an indication of speculative activity
OverbuildingOverbuilding, which suggests that supply has responded too strongly to demand
Canada Mor tgage and Housing Corporation 2014 ANNUAL REPORT 19
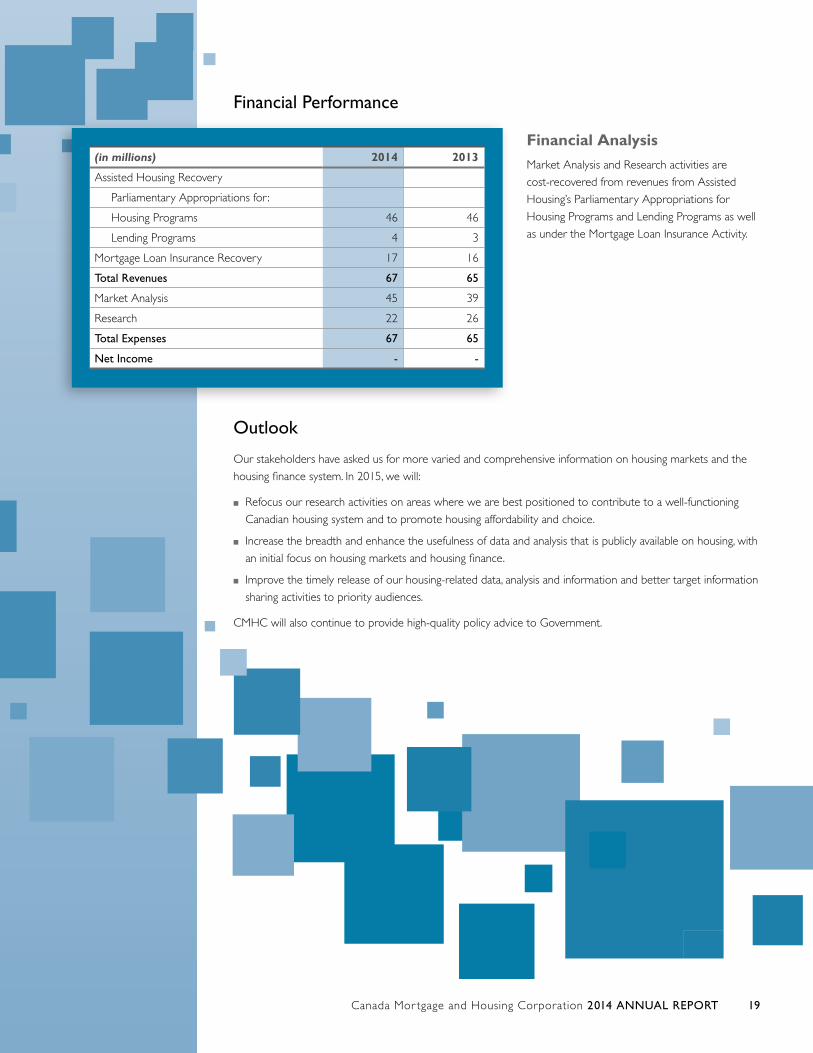
Financial Performance
Financial AnalysisMarket Analysis and Research activities are
cost-recovered from revenues from Assisted
Housing’s Parliamentary Appropriations for
Housing Programs and Lending Programs as well
as under the Mortgage Loan Insurance Activity.
Outlook
Our stakeholders have asked us for more varied and comprehensive information on housing markets and the
housing finance system. In 2015, we will:
■■ Refocus our research activities on areas where we are best positioned to contribute to a well-functioning
Canadian housing system and to promote housing affordability and choice.
■■ Increase the breadth and enhance the usefulness of data and analysis that is publicly available on housing, with
an initial focus on housing markets and housing finance.
■■ Improve the timely release of our housing-related data, analysis and information and better target information
sharing activities to priority audiences.
CMHC will also continue to provide high-quality policy advice to Government.
(in millions) 2014 2013
Assisted Housing Recovery
Parliamentary Appropriations for :
Housing Programs 46 46
Lending Programs 4 3
Mortgage Loan Insurance Recovery 17 16
Total Revenues 67 65
Market Analysis 45 39
Research 22 26
Total Expenses 67 65
Net Income - -
Canada Mor tgage and Housing Corporation 2014 ANNUAL REPORT20
ASSISTED HOUSING
Description of Activity
Our Assisted Housing Activity provides financial assistance for existing social housing both off and on-reserve,
and funding for affordable housing delivered through partnerships with provinces and territories. We support
the creation of affordable housing through Seed Funding, Proposal Development Funding, Mortgage Loan
Insurance underwriting flexibilities, information and advice. We provide assistance for new construction,
renovation and repairs on-reserve, and support for Aboriginal capacity building.
Lending ProgramsWe make loans to social housing sponsors, First Nations, provinces, territories and municipalities, as well as
non-subsidized housing support. We can offer loans at below market interest rates due to our ability to obtain
funding through the Crown Borrowing Program. We operate our Lending Programs on a long-term, breakeven
basis in order to help reduce project operating costs, thereby lowering direct subsidies for social housing.
Housing ProgramsWe receive Parliamentary Appropriations to fund our Housing Programs. Housing Programs operate on
a breakeven basis as appropriations equal expenditures each year. The majority of the funding in Housing
Programs helped support low-income households living in existing social housing on and off-reserve. In addition,
funding is provided for housing programs on-reserve and other housing related services.
Funding is also provided for new commitments of affordable housing, including the renewed Investment in
Affordable Housing (IAH) and the investment in Nunavut housing. Agreements were reached with 12 provinces
and territories to extend funding for affordable housing through the IAH for the period of 2014 to 2019. Under
this joint federal-provincial-territorial initiative which began in 2011, the federal government is providing more
than $1.9 billion over eight years to help reduce the number of Canadians in housing need. The remaining
$70 million in funding of the additional $100 million for new affordable housing in Nunavut announced in the
Economic Action Plan is also being delivered through the IAH extension. Since April 2011, 217,772 households
have benefitted from this funding.
CMHC also manages assets transferred from the Federal Co-operative Housing Stabilization Fund (the Fund)
since the termination of its Indenture of Trust in April 2010. The Fund was set up under the federal Co-operative
Housing Program and provides assistance to co-operative housing projects in financial difficulty committed
under this program. The assets transferred from the Stabilization Fund are available to assist co-ops with an
Indexed Linked Mortgage (ILM) in financial difficulty. Transferred mortgage receivables under administration
during the year decreased from $45.8 million to $45.0 million at year end. Other assets transferred from the
Stabilization Fund to CMHC that are available to assist ILM Co-ops in financial difficulty were $16.4 million at
year end, which included $3.0 million in restricted funds for loan commitments approved but not yet advanced.
Financial Highlights
■■ $2,010 million in support of Housing Programs, including $1,655 million to fund long-term commitments for
existing social housing and $302 million for new commitments of affordable housing.
■■ $39 million decrease in Net Income for the Lending Programs over the prior year as a result of a decrease in
Net Interest Income.
Canada Mor tgage and Housing Corporation 2014 ANNUAL REPORT 21
Non-Financial Highlights
■■ 12 Investment in Affordable Housing (IAH) agreements for the 2014-2019 period were signed with
provinces and territories, the remaining agreement was in place early in 2015.
■■ 570,950 households assisted in existing social housing on and off-reserve.
■■ 496 new units committed under the On-Reserve Non-Profit Housing Program.
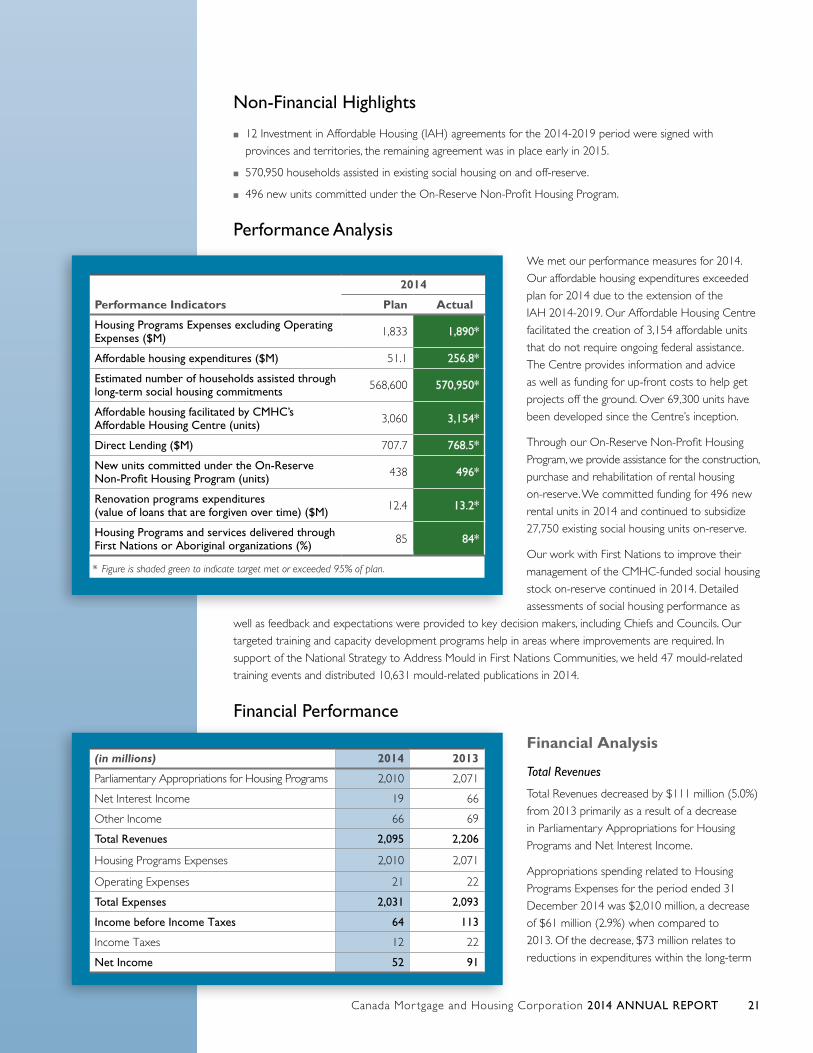
Performance Analysis
We met our performance measures for 2014.
Our affordable housing expenditures exceeded
plan for 2014 due to the extension of the
IAH 2014-2019. Our Affordable Housing Centre
facilitated the creation of 3,154 affordable units
that do not require ongoing federal assistance.
The Centre provides information and advice
as well as funding for up-front costs to help get
projects off the ground. Over 69,300 units have
been developed since the Centre’s inception.
Through our On-Reserve Non-Profit Housing
Program, we provide assistance for the construction,
purchase and rehabilitation of rental housing
on-reserve. We committed funding for 496 new
rental units in 2014 and continued to subsidize
27,750 existing social housing units on-reserve.
Our work with First Nations to improve their
management of the CMHC-funded social housing
stock on-reserve continued in 2014. Detailed
assessments of social housing performance as
well as feedback and expectations were provided to key decision makers, including Chiefs and Councils. Our
targeted training and capacity development programs help in areas where improvements are required. In
support of the National Strategy to Address Mould in First Nations Communities, we held 47 mould-related
training events and distributed 10,631 mould-related publications in 2014.
Financial Performance
Financial Analysis
Total Revenues
Total Revenues decreased by $111 million (5.0%)
from 2013 primarily as a result of a decrease
in Parliamentary Appropriations for Housing
Programs and Net Interest Income.
Appropriations spending related to Housing
Programs Expenses for the period ended 31
December 2014 was $2,010 million, a decrease
of $61 million (2.9%) when compared to
2013. Of the decrease, $73 million relates to
reductions in expenditures within the long-term
(in millions) 2014 2013
Parliamentary Appropriations for Housing Programs 2,010 2,071
Net Interest Income 19 66
Other Income 66 69
Total Revenues 2,095 2,206
Housing Programs Expenses 2,010 2,071
Operating Expenses 21 22
Total Expenses 2,031 2,093
Income before Income Taxes 64 113
Income Taxes 12 22
Net Income 52 91
Performance Indicators
2014
Plan Actual
Housing Programs Expenses excluding Operating Expenses ($M) 1,833 1,890*
Affordable housing expenditures ($M) 51.1 256.8*
Estimated number of households assisted through long-term social housing commitments 568,600 570,950*
Affordable housing facilitated by CMHC’s Affordable Housing Centre (units) 3,060 3,154*
Direct Lending ($M) 707.7 768.5*
New units committed under the On-Reserve Non-Profit Housing Program (units) 438 496*
Renovation programs expenditures (value of loans that are forgiven over time) ($M) 12.4 13.2*
Housing Programs and services delivered through First Nations or Aboriginal organizations (%) 85 84*
* Figure is shaded green to indicate target met or exceeded 95% of plan.
Canada Mor tgage and Housing Corporation 2014 ANNUAL REPORT22
commitments for existing social housing. Other variances include a decrease of $76 million due to the timing
of expenditures under the Investment in Affordable Housing, partially offset by an increase of $85 million for
affordable housing in Nunavut.
Net Interest Income decreased by $47 million (71.2%) from the prior year primarily due to an interest loss
recovery of $12 million during 2014 compared to $53 million in 2013. These interest losses were incurred by
CMHC as a result of prepayment and re-pricing activities. The reimbursement is included in Interest Income
and recovered from the Government through Parliamentary Appropriations for Housing Programs (refer to
Note 9 of the Consolidated Financial Statements).
Total Expenses
Total Expenses decreased by $62 million (3.0%) primarily as a result of lower Housing Programs expenses of
$61 million (2.9%) as explained in the Total Revenues section.
Net Income
Net Income decreased by $39 million (42.9%) over the prior period. This decline is primarily the result of the
decrease in Net Interest Income.
Capital Management
Capital adequacy is a risk in our Lending portfolio due to declining business which affects our ability to maintain
breakeven programs.
Refer to the Consolidated Financial Statements Note 18 - Capital Management for complete disclosure on
Capital Management.
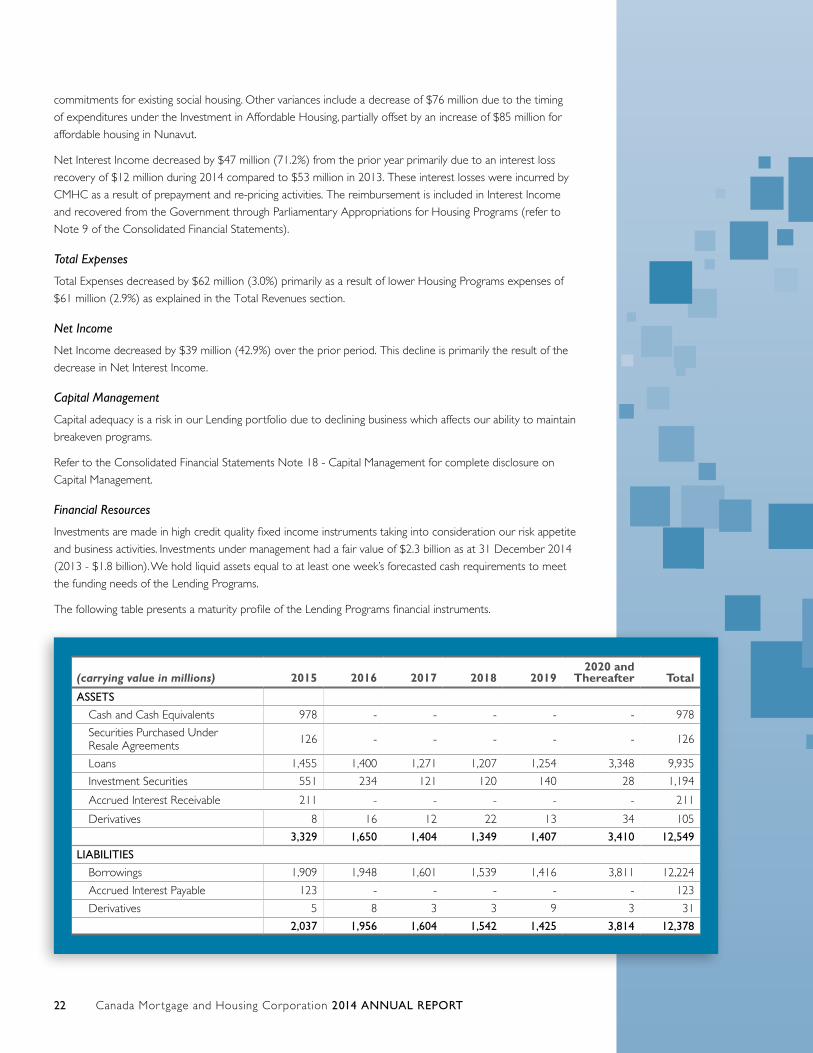
Financial Resources
Investments are made in high credit quality fixed income instruments taking into consideration our risk appetite
and business activities. Investments under management had a fair value of $2.3 billion as at 31 December 2014
(2013 - $1.8 billion). We hold liquid assets equal to at least one week’s forecasted cash requirements to meet
the funding needs of the Lending Programs.
The following table presents a maturity profile of the Lending Programs financial instruments.
(carrying value in millions) 2015 2016 2017 2018 20192020 and
Thereafter Total
ASSETS
Cash and Cash Equivalents 978 - - - - - 978
Securities Purchased Under Resale Agreements 126 - - - - - 126
Loans 1,455 1,400 1,271 1,207 1,254 3,348 9,935
Investment Securities 551 234 121 120 140 28 1,194
Accrued Interest Receivable 211 - - - - - 211
Derivatives 8 16 12 22 13 34 105
3,329 1,650 1,404 1,349 1,407 3,410 12,549
LIABILITIES
Borrowings 1,909 1,948 1,601 1,539 1,416 3,811 12,224
Accrued Interest Payable 123 - - - - - 123
Derivatives 5 8 3 3 9 3 31
2,037 1,956 1,604 1,542 1,425 3,814 12,378
Canada Mor tgage and Housing Corporation 2014 ANNUAL REPORT 23
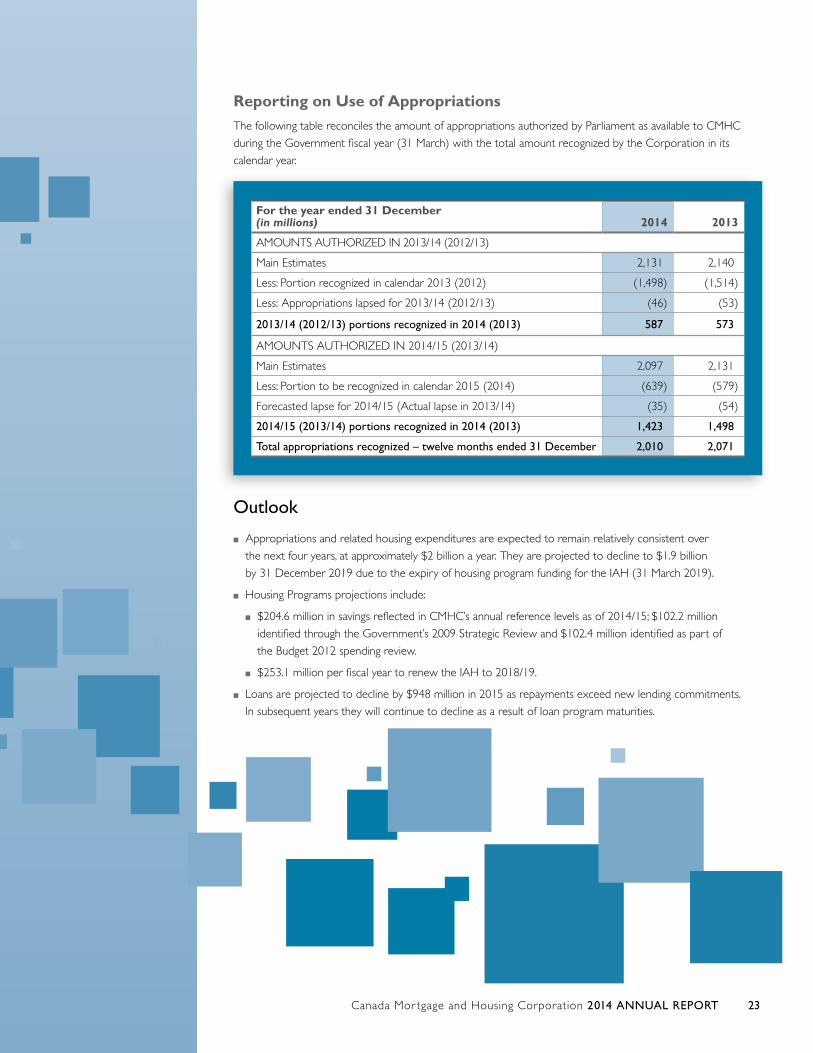
Reporting on Use of Appropriations The following table reconciles the amount of appropriations authorized by Parliament as available to CMHC
during the Government fiscal year (31 March) with the total amount recognized by the Corporation in its
calendar year.
Outlook
■■ Appropriations and related housing expenditures are expected to remain relatively consistent over
the next four years, at approximately $2 billion a year. They are projected to decline to $1.9 billion
by 31 December 2019 due to the expiry of housing program funding for the IAH (31 March 2019).
■■ Housing Programs projections include:
■■ $204.6 million in savings reflected in CMHC’s annual reference levels as of 2014/15; $102.2 million
identified through the Government’s 2009 Strategic Review and $102.4 million identified as part of
the Budget 2012 spending review.
■■ $253.1 million per fiscal year to renew the IAH to 2018/19.
■■ Loans are projected to decline by $948 million in 2015 as repayments exceed new lending commitments.
In subsequent years they will continue to decline as a result of loan program maturities.
For the year ended 31 December (in millions) 2014 2013
AMOUNTS AUTHORIZED IN 2013/14 (2012/13)
Main Estimates 2,131 2,140
Less: Portion recognized in calendar 2013 (2012) (1,498) (1,514)
Less: Appropriations lapsed for 2013/14 (2012/13) (46) (53)
2013/14 (2012/13) portions recognized in 2014 (2013) 587 573
AMOUNTS AUTHORIZED IN 2014/15 (2013/14)
Main Estimates 2,097 2,131
Less: Portion to be recognized in calendar 2015 (2014) (639) (579)
Forecasted lapse for 2014/15 (Actual lapse in 2013/14) (35) (54)
2014/15 (2013/14) portions recognized in 2014 (2013) 1,423 1,498
Total appropriations recognized – twelve months ended 31 December 2,010 2,071
Canada Mor tgage and Housing Corporation 2014 ANNUAL REPORT24
MORTGAGE LOAN INSURANCE
Description of Activity
We provide mortgage loan insurance for Transactional Homeowner, Portfolio and Multi-unit Residential loans
in all parts of Canada, including in areas or markets not served or under-served by private mortgage insurers.
We operate these programs on a commercial basis. Revenue from premiums, fees and investments cover
all expenses, including insurance claims losses, and we are expected to generate a reasonable return for the
Government of Canada, with due regard for loss.
Our Products ■■ Transactional Homeowner – insurance against borrower default for loans secured by residential properties
of 4 or fewer units at the time the loan is originated, the cost of which is paid to CMHC by lenders but
usually passed on to the borrower, and includes:
■■ High ratio homeowner loans – the borrower has less than a 20% down payment at origination. At
least one of the units must be owner-occupied. Mortgage loan insurance on these loans is a legislative
requirement for federally regulated lenders and for most provincially regulated lenders.
■■ Low ratio homeowner loans – the borrower has a down payment of 20% or more at origination.
Mortgage loan insurance on these loans is not a legislative requirement; however, lenders may require
mortgage insurance as a condition of approving the loan. Units can be owner-occupied or non-owner
occupied (i.e. rental units).
■■ Portfolio – insurance against borrower default for pools of low ratio mortgages that are under repayment
and secured by residential properties of 4 or fewer units. Unlike Transactional Homeowner Insurance,
premiums are not passed on to the borrower.
■■ Multi-unit Residential – insurance provided exclusively by CMHC in the marketplace against borrower
default on loans for the construction, purchase and refinancing of Multi-unit Residential properties consisting
of 5 or more units. These properties include rental buildings, licensed care facilities, retirement homes,
affordable housing projects and purpose-built student housing.
Financial Highlights
■■ Net Income of $2,374 million in 2014, an increase of 57.5% over 2013
■■ Total Assets of $23,765 million
■■ Total Equity of Canada of $16,418 million, which is 343% of the minimum capital required
■■ Insurance-in-force of $543 billion, a decline of $14 billion from 2013
■■ $9 billion annual limit of issuance of portfolio insurance
Canada Mor tgage and Housing Corporation 2014 ANNUAL REPORT 25
Non-Financial Highlights
■■ Product review to emphasize housing needs; elimination of:
■■ Insurance on loans for second homes,
■■ Borrowers without independent income validation, and
■■ Condominium construction financing.
■■ Portfolio quality:
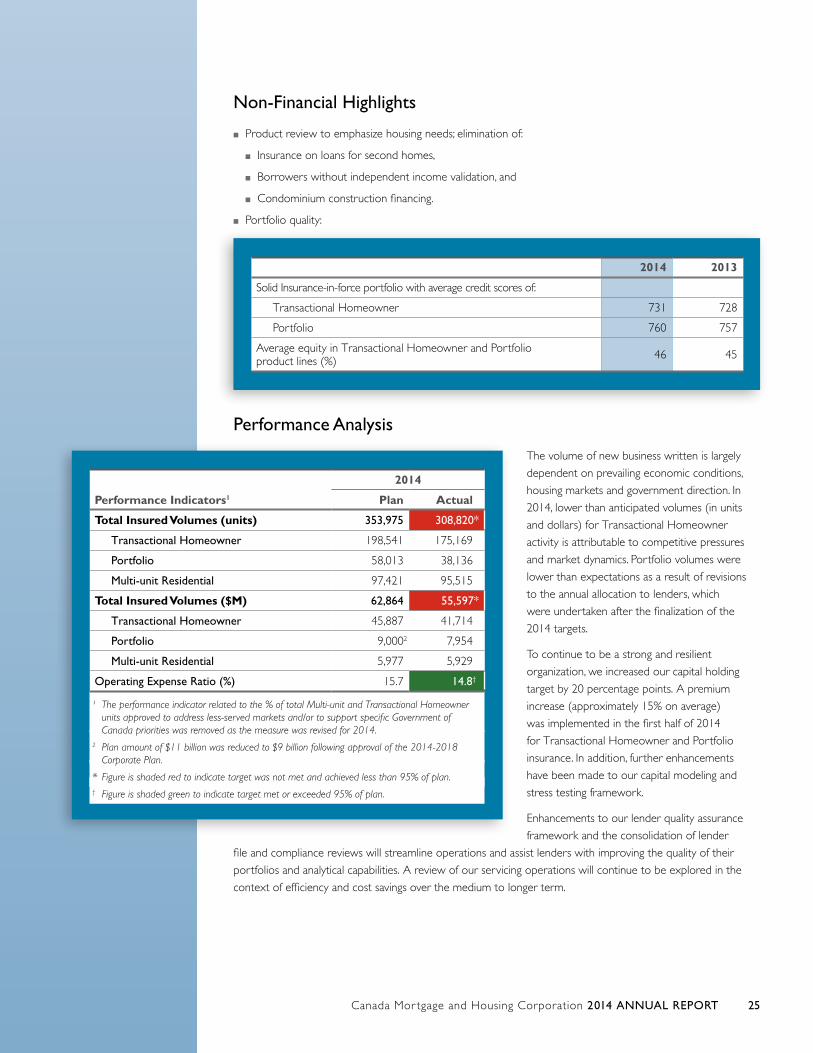
Performance Analysis
The volume of new business written is largely
dependent on prevailing economic conditions,
housing markets and government direction. In
2014, lower than anticipated volumes (in units
and dollars) for Transactional Homeowner
activity is attributable to competitive pressures
and market dynamics. Portfolio volumes were
lower than expectations as a result of revisions
to the annual allocation to lenders, which
were undertaken after the finalization of the
2014 targets.
To continue to be a strong and resilient
organization, we increased our capital holding
target by 20 percentage points. A premium
increase (approximately 15% on average)
was implemented in the first half of 2014
for Transactional Homeowner and Portfolio
insurance. In addition, further enhancements
have been made to our capital modeling and
stress testing framework.
Enhancements to our lender quality assurance
framework and the consolidation of lender
file and compliance reviews will streamline operations and assist lenders with improving the quality of their
portfolios and analytical capabilities. A review of our servicing operations will continue to be explored in the
context of efficiency and cost savings over the medium to longer term.
2014 2013
Solid Insurance-in-force portfolio with average credit scores of:
Transactional Homeowner 731 728
Portfolio 760 757
Average equity in Transactional Homeowner and Portfolio product lines (%) 46 45
Performance Indicators1
2014
Plan Actual
Total Insured Volumes (units) 353,975 308,820*
Transactional Homeowner 198,541 175,169
Portfolio 58,013 38,136
Multi-unit Residential 97,421 95,515
Total Insured Volumes ($M) 62,864 55,597*
Transactional Homeowner 45,887 41,714
Portfolio 9,0002 7,954
Multi-unit Residential 5,977 5,929
Operating Expense Ratio (%) 15.7 14.8†
¹ The performance indicator related to the % of total Multi-unit and Transactional Homeowner units approved to address less-served markets and/or to support specific Government of Canada priorities was removed as the measure was revised for 2014.
2 Plan amount of $11 billion was reduced to $9 billion following approval of the 2014-2018 Corporate Plan.
* Figure is shaded red to indicate target was not met and achieved less than 95% of plan.† Figure is shaded green to indicate target met or exceeded 95% of plan.
Canada Mor tgage and Housing Corporation 2014 ANNUAL REPORT26
MORTGAGE LOAN INSURANCE AT A GLANCE
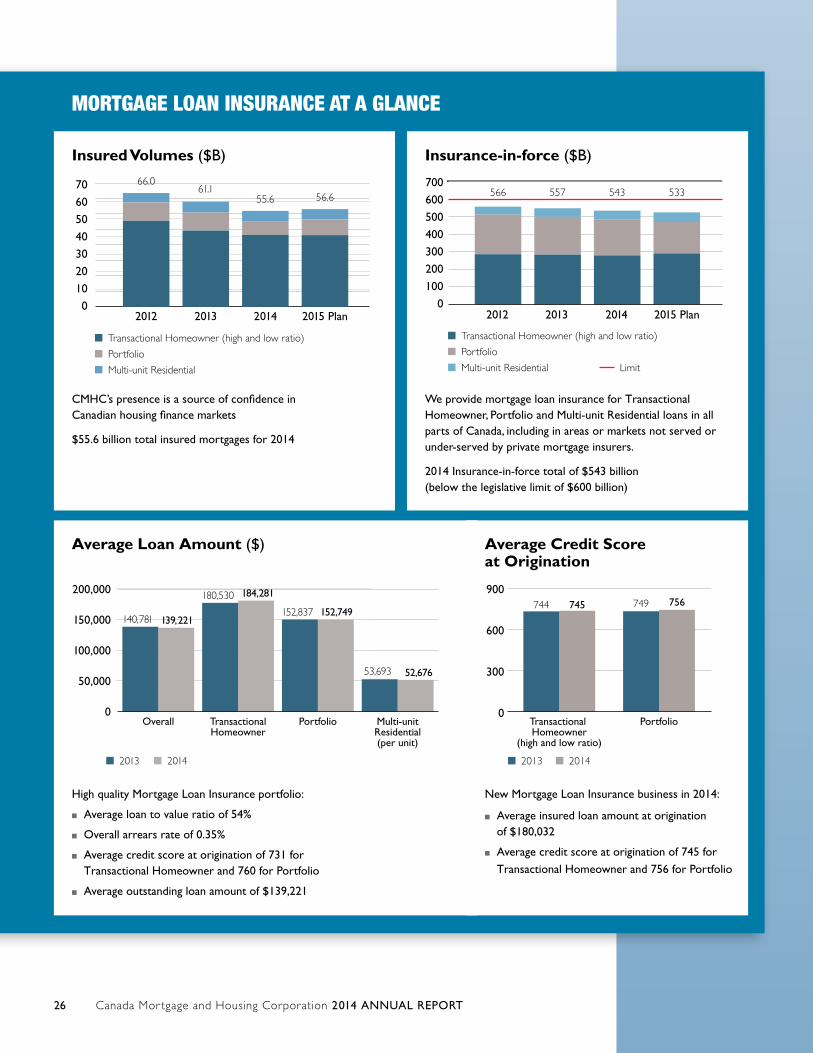
Insured Volumes ($B)
2012 2013 2015 Plan
706050403020100
Transactional Homeowner (high and low ratio)
Portfolio
Multi-unit Residential
2014
66.061.1
56.655.6
CMHC’s presence is a source of confidence in Canadian housing finance markets
$55.6 billion total insured mortgages for 2014
Insurance-in-force ($B)
2012 2013 2015 Plan
700600500400300200100
0
Transactional Homeowner (high and low ratio)
Portfolio
Multi-unit Residential
2014
566 557 533543
Limit
We provide mortgage loan insurance for Transactional Homeowner, Portfolio and Multi-unit Residential loans in all parts of Canada, including in areas or markets not served or under-served by private mortgage insurers.
2014 Insurance-in-force total of $543 billion (below the legislative limit of $600 billion)
Average Loan Amount ($)
High quality Mortgage Loan Insurance portfolio:
■■ Average loan to value ratio of 54%
■■ Overall arrears rate of 0.35%
■■ Average credit score at origination of 731 for Transactional Homeowner and 760 for Portfolio
■■ Average outstanding loan amount of $139,221
Average Credit Score at Origination
New Mortgage Loan Insurance business in 2014:
■■ Average insured loan amount at origination of $180,032
■■ Average credit score at origination of 745 for Transactional Homeowner and 756 for Portfolio
Overall TransactionalHomeowner
Multi-unitResidential(per unit)
200,000
150,000
100,000
50,000
0Portfolio
139,221
180,530 184,281
53,693 52,676
152,837 152,749
2013 2014
140,781
Transactional Homeowner
(high and low ratio)
900
600
300
0
2013 2014
Portfolio
744 745 749 756
Canada Mor tgage and Housing Corporation 2014 ANNUAL REPORT 27
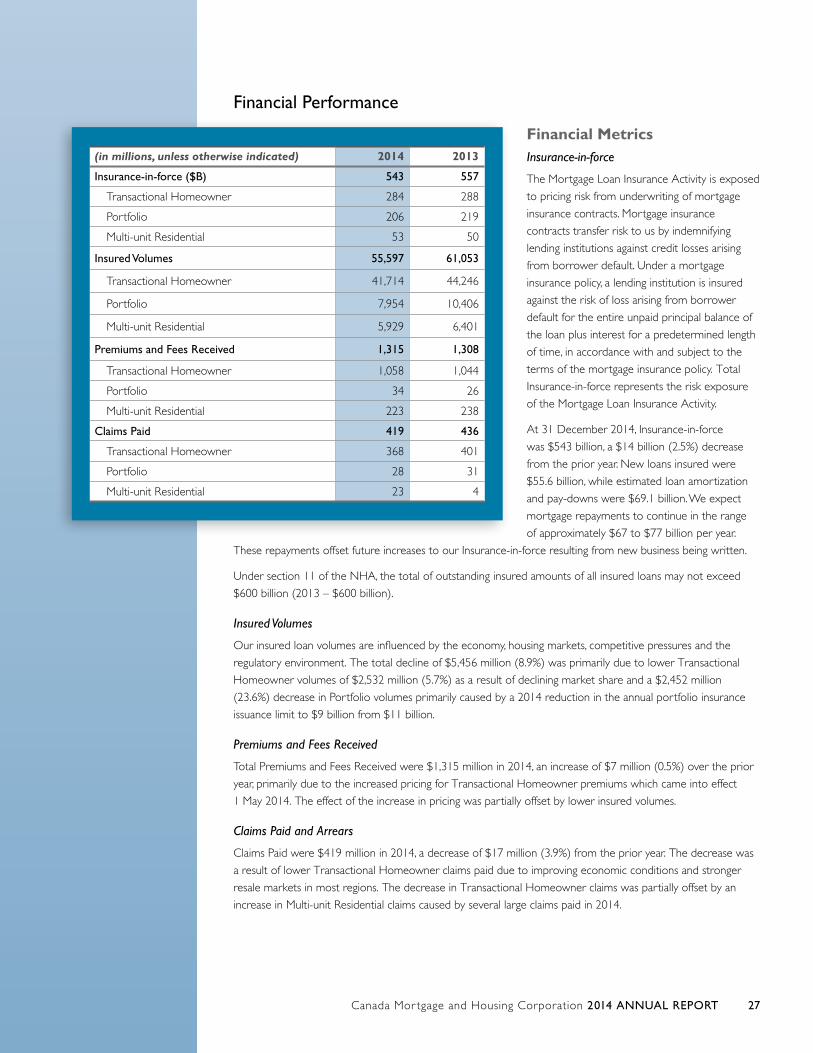
Financial Performance
Financial MetricsInsurance-in-force
The Mortgage Loan Insurance Activity is exposed
to pricing risk from underwriting of mortgage
insurance contracts. Mortgage insurance
contracts transfer risk to us by indemnifying
lending institutions against credit losses arising
from borrower default. Under a mortgage
insurance policy, a lending institution is insured
against the risk of loss arising from borrower
default for the entire unpaid principal balance of
the loan plus interest for a predetermined length
of time, in accordance with and subject to the
terms of the mortgage insurance policy. Total
Insurance-in-force represents the risk exposure
of the Mortgage Loan Insurance Activity.
At 31 December 2014, Insurance-in-force
was $543 billion, a $14 billion (2.5%) decrease
from the prior year. New loans insured were
$55.6 billion, while estimated loan amortization
and pay-downs were $69.1 billion. We expect
mortgage repayments to continue in the range
of approximately $67 to $77 billion per year.
These repayments offset future increases to our Insurance-in-force resulting from new business being written.
Under section 11 of the NHA, the total of outstanding insured amounts of all insured loans may not exceed
$600 billion (2013 – $600 billion).
Insured Volumes
Our insured loan volumes are influenced by the economy, housing markets, competitive pressures and the
regulatory environment. The total decline of $5,456 million (8.9%) was primarily due to lower Transactional
Homeowner volumes of $2,532 million (5.7%) as a result of declining market share and a $2,452 million
(23.6%) decrease in Portfolio volumes primarily caused by a 2014 reduction in the annual portfolio insurance
issuance limit to $9 billion from $11 billion.
Premiums and Fees Received
Total Premiums and Fees Received were $1,315 million in 2014, an increase of $7 million (0.5%) over the prior
year, primarily due to the increased pricing for Transactional Homeowner premiums which came into effect
1 May 2014. The effect of the increase in pricing was partially offset by lower insured volumes.
Claims Paid and Arrears
Claims Paid were $419 million in 2014, a decrease of $17 million (3.9%) from the prior year. The decrease was
a result of lower Transactional Homeowner claims paid due to improving economic conditions and stronger
resale markets in most regions. The decrease in Transactional Homeowner claims was partially offset by an
increase in Multi-unit Residential claims caused by several large claims paid in 2014.
(in millions, unless otherwise indicated) 2014 2013
Insurance-in-force ($B) 543 557
Transactional Homeowner 284 288
Portfolio 206 219
Multi-unit Residential 53 50
Insured Volumes 55,597 61,053
Transactional Homeowner 41,714 44,246
Portfolio 7,954 10,406
Multi-unit Residential 5,929 6,401
Premiums and Fees Received 1,315 1,308
Transactional Homeowner 1,058 1,044
Portfolio 34 26
Multi-unit Residential 223 238
Claims Paid 419 436
Transactional Homeowner 368 401
Portfolio 28 31
Multi-unit Residential 23 4
Canada Mor tgage and Housing Corporation 2014 ANNUAL REPORT28
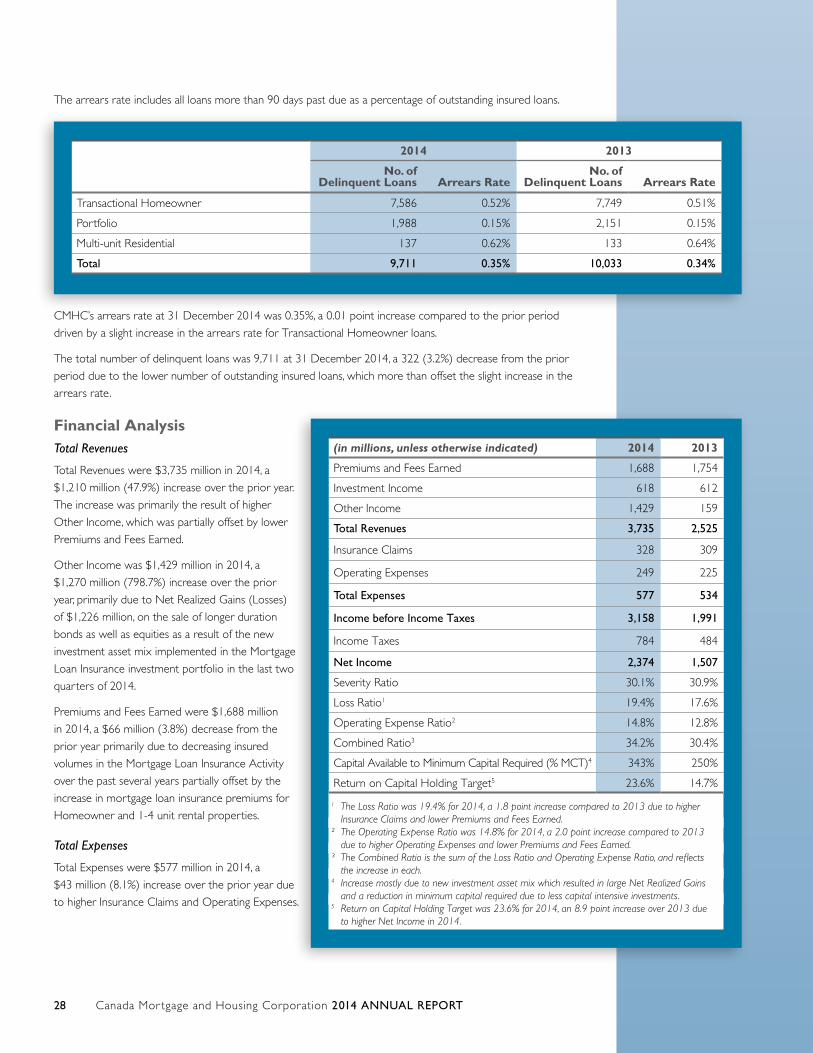
The arrears rate includes all loans more than 90 days past due as a percentage of outstanding insured loans.
CMHC’s arrears rate at 31 December 2014 was 0.35%, a 0.01 point increase compared to the prior period
driven by a slight increase in the arrears rate for Transactional Homeowner loans.
The total number of delinquent loans was 9,711 at 31 December 2014, a 322 (3.2%) decrease from the prior
period due to the lower number of outstanding insured loans, which more than offset the slight increase in the
arrears rate.
Financial Analysis Total Revenues
Total Revenues were $3,735 million in 2014, a
$1,210 million (47.9%) increase over the prior year.
The increase was primarily the result of higher
Other Income, which was partially offset by lower
Premiums and Fees Earned.
Other Income was $1,429 million in 2014, a
$1,270 million (798.7%) increase over the prior
year, primarily due to Net Realized Gains (Losses)
of $1,226 million, on the sale of longer duration
bonds as well as equities as a result of the new
investment asset mix implemented in the Mortgage
Loan Insurance investment portfolio in the last two
quarters of 2014.
Premiums and Fees Earned were $1,688 million
in 2014, a $66 million (3.8%) decrease from the
prior year primarily due to decreasing insured
volumes in the Mortgage Loan Insurance Activity
over the past several years partially offset by the
increase in mortgage loan insurance premiums for
Homeowner and 1-4 unit rental properties.
Total Expenses
Total Expenses were $577 million in 2014, a
$43 million (8.1%) increase over the prior year due
to higher Insurance Claims and Operating Expenses.
2014 2013
No. of Delinquent Loans Arrears Rate
No. of Delinquent Loans Arrears Rate
Transactional Homeowner 7,586 0.52% 7,749 0.51%
Portfolio 1,988 0.15% 2,151 0.15%
Multi-unit Residential 137 0.62% 133 0.64%
Total 9,711 0.35% 10,033 0.34%
(in millions, unless otherwise indicated) 2014 2013
Premiums and Fees Earned 1,688 1,754
Investment Income 618 612
Other Income 1,429 159
Total Revenues 3,735 2,525
Insurance Claims 328 309
Operating Expenses 249 225
Total Expenses 577 534
Income before Income Taxes 3,158 1,991
Income Taxes 784 484
Net Income 2,374 1,507
Severity Ratio 30.1% 30.9%
Loss Ratio1 19.4% 17.6%
Operating Expense Ratio2 14.8% 12.8%
Combined Ratio3 34.2% 30.4%
Capital Available to Minimum Capital Required (% MCT)4 343% 250%
Return on Capital Holding Target5 23.6% 14.7%
1 The Loss Ratio was 19.4% for 2014, a 1.8 point increase compared to 2013 due to higher Insurance Claims and lower Premiums and Fees Earned.
² The Operating Expense Ratio was 14.8% for 2014, a 2.0 point increase compared to 2013 due to higher Operating Expenses and lower Premiums and Fees Earned.
³ The Combined Ratio is the sum of the Loss Ratio and Operating Expense Ratio, and reflects the increase in each.
4 Increase mostly due to new investment asset mix which resulted in large Net Realized Gains and a reduction in minimum capital required due to less capital intensive investments.
5 Return on Capital Holding Target was 23.6% for 2014, an 8.9 point increase over 2013 due to higher Net Income in 2014.
Canada Mor tgage and Housing Corporation 2014 ANNUAL REPORT 29
Insurance Claims were $328 million in 2014, a $19 million (6.1%) increase over the prior year. These represent
the losses incurred during the period as a result of the changes to the provision for claims. The increase was
due to key estimate drivers such as house price inflation and the unemployment rate not improving as much
during 2014 as they did in 2013.
Operating Expenses were $249 million in 2014, a $24 million (10.7%) increase over the prior year primarily due
to organizational restructuring, new insurance guarantee fees paid to the Government of Canada and higher
investments in information and technology.
Net Income
Net Income was $2,374 million in 2014, an $867 million (57.5%) increase over the prior year. Net Realized
Gains (Losses) of $919 million (net of tax), as a result of the new investment asset mix in the Mortgage Loan
Insurance investment portfolio, had the largest effect on Net Income. This was partially offset by a decrease in
Premiums and Fees Earned and increases in Insurance Claims and Operating Expenses as previously described.
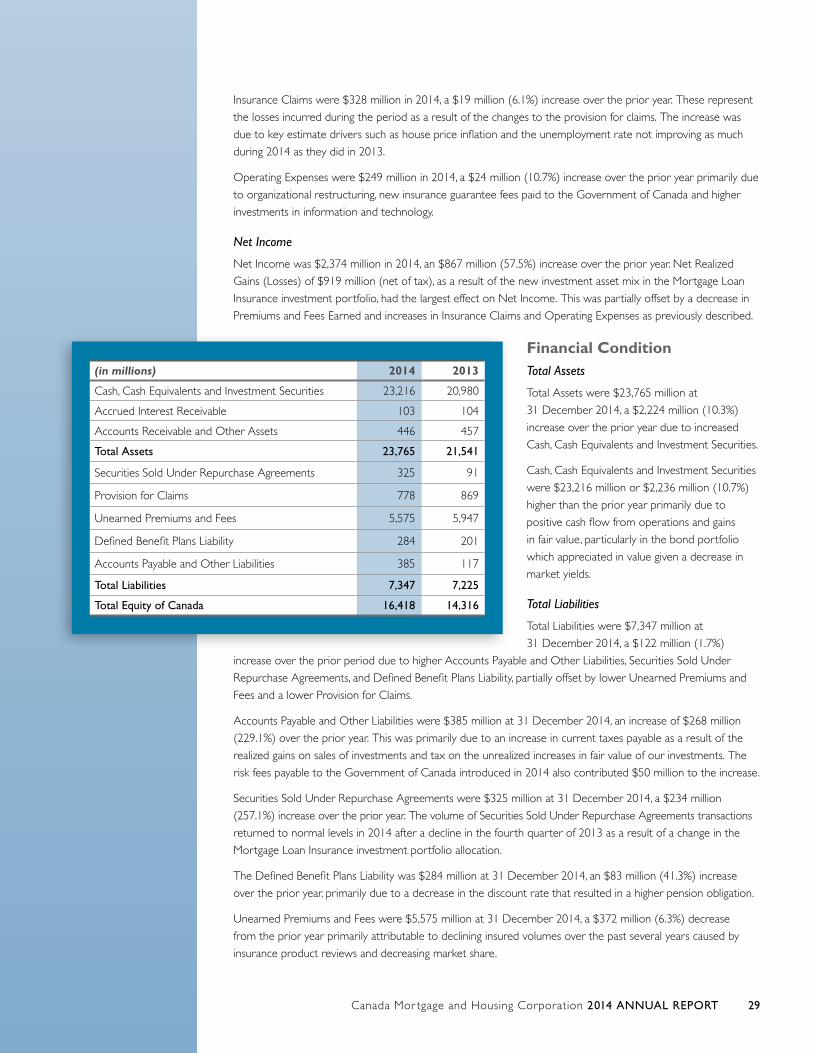
Financial ConditionTotal Assets
Total Assets were $23,765 million at
31 December 2014, a $2,224 million (10.3%)
increase over the prior year due to increased
Cash, Cash Equivalents and Investment Securities.
Cash, Cash Equivalents and Investment Securities
were $23,216 million or $2,236 million (10.7%)
higher than the prior year primarily due to
positive cash flow from operations and gains
in fair value, particularly in the bond portfolio
which appreciated in value given a decrease in
market yields.
Total Liabilities
Total Liabilities were $7,347 million at
31 December 2014, a $122 million (1.7%)
increase over the prior period due to higher Accounts Payable and Other Liabilities, Securities Sold Under
Repurchase Agreements, and Defined Benefit Plans Liability, partially offset by lower Unearned Premiums and
Fees and a lower Provision for Claims.
Accounts Payable and Other Liabilities were $385 million at 31 December 2014, an increase of $268 million
(229.1%) over the prior year. This was primarily due to an increase in current taxes payable as a result of the
realized gains on sales of investments and tax on the unrealized increases in fair value of our investments. The
risk fees payable to the Government of Canada introduced in 2014 also contributed $50 million to the increase.
Securities Sold Under Repurchase Agreements were $325 million at 31 December 2014, a $234 million
(257.1%) increase over the prior year. The volume of Securities Sold Under Repurchase Agreements transactions
returned to normal levels in 2014 after a decline in the fourth quarter of 2013 as a result of a change in the
Mortgage Loan Insurance investment portfolio allocation.
The Defined Benefit Plans Liability was $284 million at 31 December 2014, an $83 million (41.3%) increase
over the prior year, primarily due to a decrease in the discount rate that resulted in a higher pension obligation.
Unearned Premiums and Fees were $5,575 million at 31 December 2014, a $372 million (6.3%) decrease
from the prior year primarily attributable to declining insured volumes over the past several years caused by
insurance product reviews and decreasing market share.
(in millions) 2014 2013
Cash, Cash Equivalents and Investment Securities 23,216 20,980
Accrued Interest Receivable 103 104
Accounts Receivable and Other Assets 446 457
Total Assets 23,765 21,541
Securities Sold Under Repurchase Agreements 325 91
Provision for Claims 778 869
Unearned Premiums and Fees 5,575 5,947
Defined Benefit Plans Liability 284 201
Accounts Payable and Other Liabilities 385 117
Total Liabilities 7,347 7,225
Total Equity of Canada 16,418 14,316
Canada Mor tgage and Housing Corporation 2014 ANNUAL REPORT30
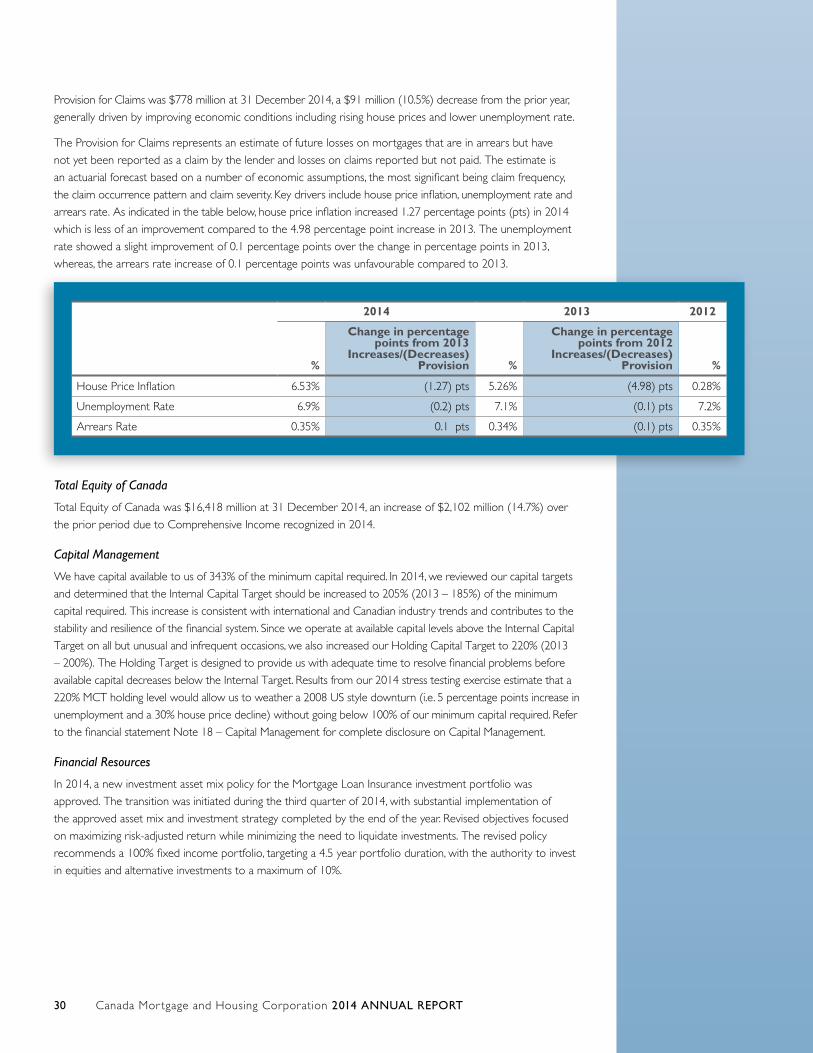
Provision for Claims was $778 million at 31 December 2014, a $91 million (10.5%) decrease from the prior year,
generally driven by improving economic conditions including rising house prices and lower unemployment rate.
The Provision for Claims represents an estimate of future losses on mortgages that are in arrears but have
not yet been reported as a claim by the lender and losses on claims reported but not paid. The estimate is
an actuarial forecast based on a number of economic assumptions, the most significant being claim frequency,
the claim occurrence pattern and claim severity. Key drivers include house price inflation, unemployment rate and
arrears rate. As indicated in the table below, house price inflation increased 1.27 percentage points (pts) in 2014
which is less of an improvement compared to the 4.98 percentage point increase in 2013. The unemployment
rate showed a slight improvement of 0.1 percentage points over the change in percentage points in 2013,
whereas, the arrears rate increase of 0.1 percentage points was unfavourable compared to 2013.
Total Equity of Canada
Total Equity of Canada was $16,418 million at 31 December 2014, an increase of $2,102 million (14.7%) over
the prior period due to Comprehensive Income recognized in 2014.
Capital Management
We have capital available to us of 343% of the minimum capital required. In 2014, we reviewed our capital targets
and determined that the Internal Capital Target should be increased to 205% (2013 – 185%) of the minimum
capital required. This increase is consistent with international and Canadian industry trends and contributes to the
stability and resilience of the financial system. Since we operate at available capital levels above the Internal Capital
Target on all but unusual and infrequent occasions, we also increased our Holding Capital Target to 220% (2013
– 200%). The Holding Target is designed to provide us with adequate time to resolve financial problems before
available capital decreases below the Internal Target. Results from our 2014 stress testing exercise estimate that a
220% MCT holding level would allow us to weather a 2008 US style downturn (i.e. 5 percentage points increase in
unemployment and a 30% house price decline) without going below 100% of our minimum capital required. Refer
to the financial statement Note 18 – Capital Management for complete disclosure on Capital Management.
Financial Resources
In 2014, a new investment asset mix policy for the Mortgage Loan Insurance investment portfolio was
approved. The transition was initiated during the third quarter of 2014, with substantial implementation of
the approved asset mix and investment strategy completed by the end of the year. Revised objectives focused
on maximizing risk-adjusted return while minimizing the need to liquidate investments. The revised policy
recommends a 100% fixed income portfolio, targeting a 4.5 year portfolio duration, with the authority to invest
in equities and alternative investments to a maximum of 10%.
2014 2013 2012
%
Change in percentage points from 2013
Increases/(Decreases) Provision %
Change in percentage points from 2012
Increases/(Decreases) Provision %
House Price Inflation 6.53% (1.27) pts 5.26% (4.98) pts 0.28%
Unemployment Rate 6.9% (0.2) pts 7.1% (0.1) pts 7.2%
Arrears Rate 0.35% 0.1 pts 0.34% (0.1) pts 0.35%
Canada Mor tgage and Housing Corporation 2014 ANNUAL REPORT 31
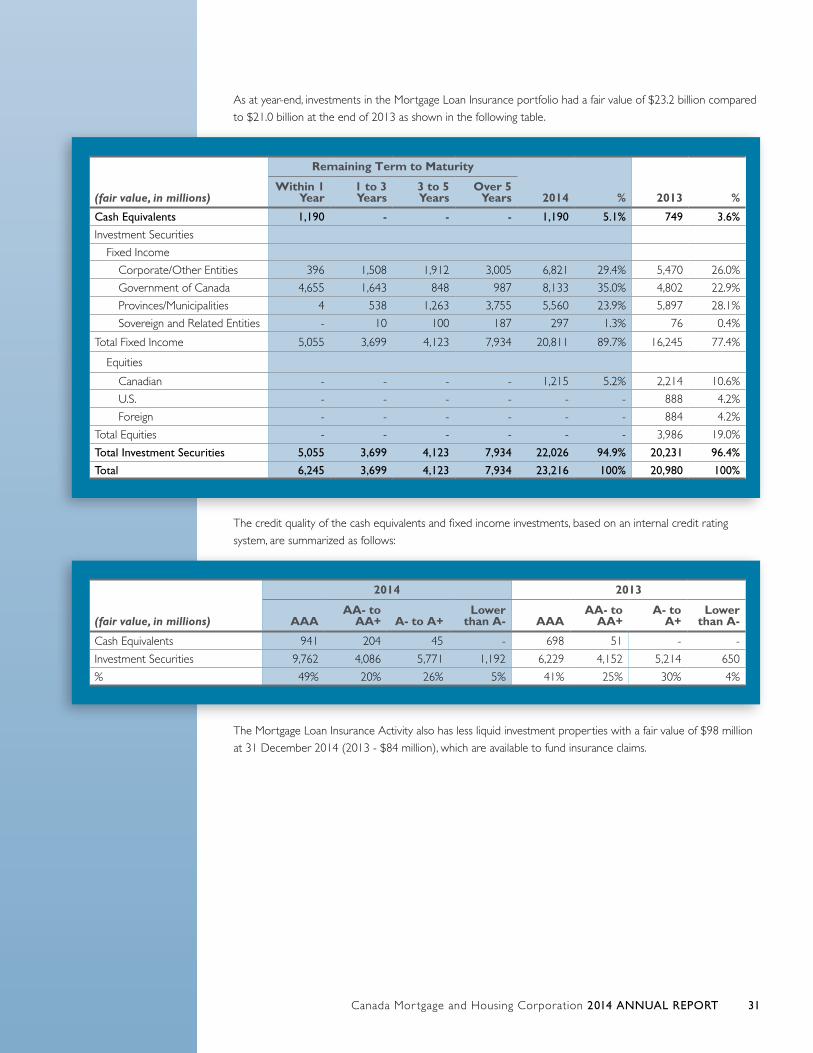
As at year-end, investments in the Mortgage Loan Insurance portfolio had a fair value of $23.2 billion compared
to $21.0 billion at the end of 2013 as shown in the following table.
The credit quality of the cash equivalents and fixed income investments, based on an internal credit rating
system, are summarized as follows:
The Mortgage Loan Insurance Activity also has less liquid investment properties with a fair value of $98 million
at 31 December 2014 (2013 - $84 million), which are available to fund insurance claims.
(fair value, in millions)
Remaining Term to Maturity
2014 % 2013 %Within 1
Year1 to 3 Years
3 to 5 Years
Over 5 Years
Cash Equivalents 1,190 - - - 1,190 5.1% 749 3.6%
Investment Securities
Fixed Income
Corporate/Other Entities 396 1,508 1,912 3,005 6,821 29.4% 5,470 26.0%
Government of Canada 4,655 1,643 848 987 8,133 35.0% 4,802 22.9%
Provinces/Municipalities 4 538 1,263 3,755 5,560 23.9% 5,897 28.1%
Sovereign and Related Entities - 10 100 187 297 1.3% 76 0.4%
Total Fixed Income 5,055 3,699 4,123 7,934 20,811 89.7% 16,245 77.4%
Equities
Canadian - - - - 1,215 5.2% 2,214 10.6%
U.S. - - - - - - 888 4.2%
Foreign - - - - - - 884 4.2%
Total Equities - - - - - - 3,986 19.0%
Total Investment Securities 5,055 3,699 4,123 7,934 22,026 94.9% 20,231 96.4%
Total 6,245 3,699 4,123 7,934 23,216 100% 20,980 100%
(fair value, in millions)
2014 2013
AAAAA- to
AA+ A- to A+Lower
than A- AAAAA- to
AA+A- to
A+Lower
than A-
Cash Equivalents 941 204 45 - 698 51 - -
Investment Securities 9,762 4,086 5,771 1,192 6,229 4,152 5,214 650
% 49% 20% 26% 5% 41% 25% 30% 4%
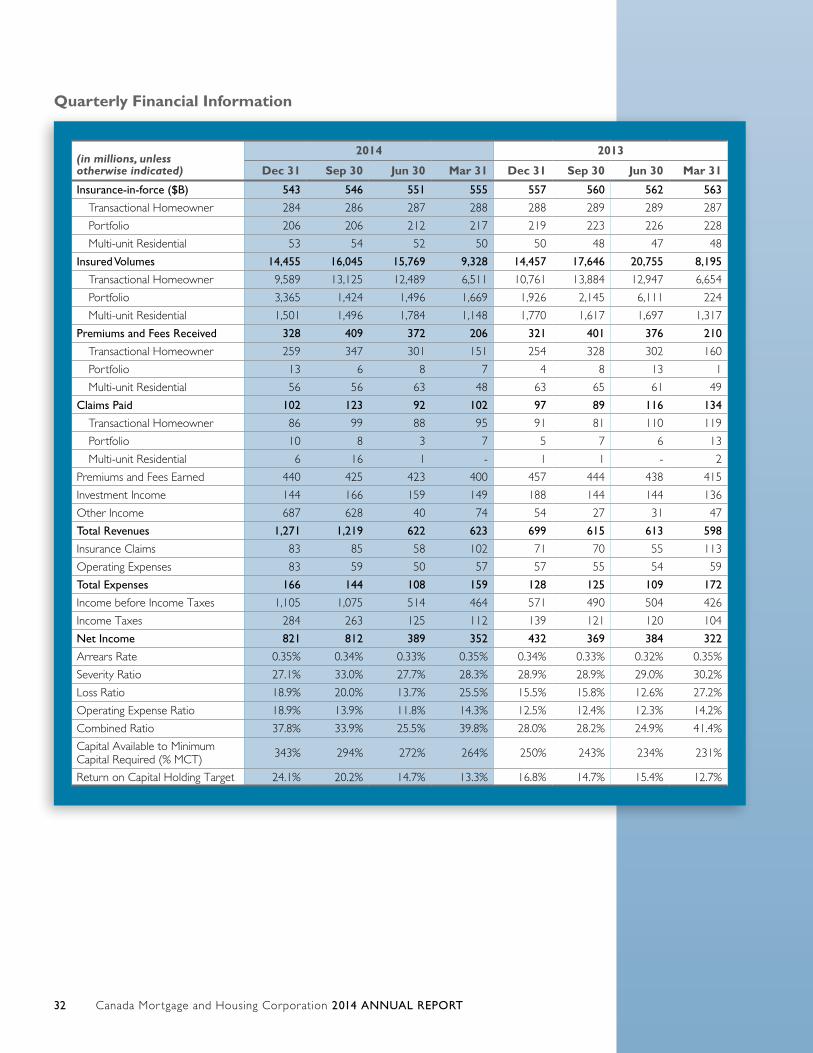
Canada Mor tgage and Housing Corporation 2014 ANNUAL REPORT32
Quarterly Financial Information
(in millions, unless otherwise indicated)
2014 2013
Dec 31 Sep 30 Jun 30 Mar 31 Dec 31 Sep 30 Jun 30 Mar 31
Insurance-in-force ($B) 543 546 551 555 557 560 562 563
Transactional Homeowner 284 286 287 288 288 289 289 287
Portfolio 206 206 212 217 219 223 226 228
Multi-unit Residential 53 54 52 50 50 48 47 48
Insured Volumes 14,455 16,045 15,769 9,328 14,457 17,646 20,755 8,195
Transactional Homeowner 9,589 13,125 12,489 6,511 10,761 13,884 12,947 6,654
Portfolio 3,365 1,424 1,496 1,669 1,926 2,145 6,111 224
Multi-unit Residential 1,501 1,496 1,784 1,148 1,770 1,617 1,697 1,317
Premiums and Fees Received 328 409 372 206 321 401 376 210
Transactional Homeowner 259 347 301 151 254 328 302 160
Portfolio 13 6 8 7 4 8 13 1
Multi-unit Residential 56 56 63 48 63 65 61 49
Claims Paid 102 123 92 102 97 89 116 134
Transactional Homeowner 86 99 88 95 91 81 110 119
Portfolio 10 8 3 7 5 7 6 13
Multi-unit Residential 6 16 1 - 1 1 - 2
Premiums and Fees Earned 440 425 423 400 457 444 438 415
Investment Income 144 166 159 149 188 144 144 136
Other Income 687 628 40 74 54 27 31 47
Total Revenues 1,271 1,219 622 623 699 615 613 598
Insurance Claims 83 85 58 102 71 70 55 113
Operating Expenses 83 59 50 57 57 55 54 59
Total Expenses 166 144 108 159 128 125 109 172
Income before Income Taxes 1,105 1,075 514 464 571 490 504 426
Income Taxes 284 263 125 112 139 121 120 104
Net Income 821 812 389 352 432 369 384 322
Arrears Rate 0.35% 0.34% 0.33% 0.35% 0.34% 0.33% 0.32% 0.35%
Severity Ratio 27.1% 33.0% 27.7% 28.3% 28.9% 28.9% 29.0% 30.2%
Loss Ratio 18.9% 20.0% 13.7% 25.5% 15.5% 15.8% 12.6% 27.2%
Operating Expense Ratio 18.9% 13.9% 11.8% 14.3% 12.5% 12.4% 12.3% 14.2%
Combined Ratio 37.8% 33.9% 25.5% 39.8% 28.0% 28.2% 24.9% 41.4%
Capital Available to Minimum Capital Required (% MCT) 343% 294% 272% 264% 250% 243% 234% 231%
Return on Capital Holding Target 24.1% 20.2% 14.7% 13.3% 16.8% 14.7% 15.4% 12.7%
Canada Mor tgage and Housing Corporation 2014 ANNUAL REPORT 33
Quarterly Trend AnalysisOur mortgage loan insurance business is exposed to seasonal variability, driven by the level of mortgage
originations and related mortgage loan insurance policies written at different times during the year. Purchase
transactions and insured volumes typically peak in the spring and summer months and are at their lowest level
in the first quarter. For Premiums and Fees Received, the trend over the past eight quarters of declining year-
over-year insured volumes was offset by the increased pricing for Transactional Homeowner premiums which
came into effect 1 May 2014.
Financial results are also impacted by short and long-term changes in economic, employment and housing
market trends as well as government regulations. These variables affect Claims Paid and Insurance Claims, as do
the characteristics of the Insurance-in-force portfolio such as size and age.
Fourth Quarter ReviewQ4 2014 vs. Q4 2013
Within the total insured volumes in Q4 2014, Transactional Homeowner volumes decreased by $1,172 million
(10.9%) from Q4 2013 mainly due to a decrease in market share, whereas Portfolio volumes increased by
$1,439 million (74.7%) from Q4 2013, with lenders insuring more of their annual allocation later in the year
in 2014 than 2013. Multi-unit Residential volumes decreased by $269 million (15.2%) from Q4 2013 due to
decreases in refinance transactions.
Total Premiums and Fees Received were $328 million in Q4 2014, a $7 million (2.2%) increase over Q4 2013.
The increase in premium pricing for Transactional Homeowner insurance and growth in property values offset
the decline in insured volumes. Premiums and Fees Received for other business were directionally consistent
with changes in their volumes.
Total Revenues were $1,271 million in Q4 2014, an increase of $572 million (81.8%) over Q4 2013 primarily
due to higher Net Realized Gains (Losses), a component of Other Income. Net Realized Gains (Losses)
increased by $670 million (3,350.0%) due to the new investment asset mix in the Mortgage Loan Insurance
investment portfolio.
Operating Expenses were $83 million in Q4 2014, a $26 million (45.6%) increase over Q4 2013 mainly due
to costs associated with organizational restructuring, higher investments in technology and the new insurance
guarantee fees paid to the Government of Canada.
Q4 2014 vs. Q3 2014
Total insured volumes were $14,455 million in Q4 2014, a decrease of $1,590 million (9.9%) from Q3 2014.
The decrease was mainly driven by the seasonal decline in Transactional Homeowner volumes, partially offset
by higher Portfolio volumes as lenders insured more of their annual allocation after lower take-up earlier in
2014. The seasonal decline in insured volumes led to lower Premiums and Fees Received in Q4 2014.
Total Revenues were $1,271 million in Q4 2014, an increase of $52 million (4.3%) over Q3 2014. This was
mainly due to an increase in Other Income of $59 million (9.4%), primarily as a result of realized gains on a
greater volume of bond sales. This was partially offset by a decrease of $22 million (13.3%) in Investment
Income caused by lower dividend income on reduced holdings of equities. Premiums and Fees Earned increased
by $15 million (3.5%).
Claims Paid were $102 million in Q4 2014, a $21 million (17.1%) decrease mainly as a result of several large
Multi-unit Residential claims being paid in Q3 2014.
Operating Expenses were $83 million in Q4 2014, a $24 million (40.7%) increase over the prior period mainly
due to costs associated organizational restructuring and higher investments in technology.
Canada Mor tgage and Housing Corporation 2014 ANNUAL REPORT34
Outlook
The Mortgage Loan Insurance Activity has a high level of exposure to the Canadian housing market and is
influenced by a number of factors including interest rate trends, house price inflation, the unemployment rate,
government regulation and competition within the Canadian housing finance market.
■■ Insurance-in-force is expected to decrease to approximately $533 billion by the end of 2015 as mortgage
repayments continue to outpace new insurance written.
■■ The increased pricing of Transactional Homeowner premiums and the new risk fee payable to the Government
of Canada, both introduced in 2014, will be more fully reflected in earnings over the coming periods.
■■ Projected Net Income is expected to decline from $2,374 million in 2014 to $1,458 million in 2015 as the
gains realized on the implementation of the new investment asset mix in the Mortgage Loan Insurance
investment portfolio are not expected to re-occur.
Canada Mor tgage and Housing Corporation 2014 ANNUAL REPORT 35
SECURITIZATION
Description of Activity
We facilitate access to funds for residential mortgage financing through securitization guarantee products and
administration of the legal framework for Canadian covered bonds. Our mandate is to promote the efficient
functioning and competitiveness of the housing finance market, and promote and contribute to the stability
of the financial system. Under the Securitization Activity, we guarantee the timely payment of interest and
principal of securities issued on the basis of eligible housing loans. The guarantee of mortgage-backed securities
is provided on a commercial basis. Revenues cover all expenses and we are expected to generate a reasonable
return for the Government of Canada with due regard for loss.
Our Programs■■ Mortgage-Backed Securities – The NHA MBS Program provides a framework for transforming insured
residential mortgages into marketable amortizing securities issued by Approved Issuers. The residential
mortgages are insured against borrower default and are insured in accordance with the Government of
Canada reinsurance framework. The timely payment of interest and principal to investors is guaranteed by
CMHC and backed by the Government of Canada.
■■ Canada Mortgage Bonds – Under the CMB Program, CHT, a special purpose trust, issues non-amortizing
CMB to investors and uses the proceeds to purchase NHA MBS issued under the NHA MBS program.
Monthly cash flows from the amortizing NHA MBS are transformed via swaps into non-amortizing bond
cash flows with fixed or floating rate interest payments and principal at maturity (a “bullet” payment). The
timely payment of interest and principal on CMB to investors is guaranteed by CMHC and backed by the
Government of Canada. We consolidate the accounts of CHT. CHT’s assets and liabilities are neither owned
by nor held for our benefit. The beneficiaries of the Trust, after payment of all obligations, are one or more
charitable organizations.
■■ Legal Framework for Canadian Registered Covered Bond Programs – We are responsible for the
administration of the Covered Bond legal framework. We operate the legal framework on a cost recovery
basis. Neither the Government nor CMHC provide any guarantees or backing for covered bond issues.
The Insured Mortgage Purchase Program is included within the Securitization Activity and was introduced
in 2008 as a temporary measure to maintain the availability of longer term credit in Canada. From October
2008 until March 2010, CMHC purchased the beneficial interest in NHA MBS, through reverse auction,
from Canadian financial institutions using funds borrowed from the government. With each auction, swap
agreements were entered into where we pay all interest received on NHA MBS and reinvestment securities,
net of expenses, to swap counterparties and we receive payments equal to the interest due on IMPP-related
borrowings. The NHA MBS reinvestment assets and swaps are not recognized on the Balance Sheet. These
arrangements are discussed in further detail in Notes 2, 4 and 19 of the Consolidated Financial Statements.
The IMPP reached maturity in early 2015, at which time all loans and borrowings from the government had
been repaid.
Canada Mor tgage and Housing Corporation 2014 ANNUAL REPORT36
Financial Highlights
■■ Net Income decreased by $10 million (4.8%) to $197 million compared to the prior year, primarily due
to the on-going wind-up of the IMPP.
■■ Capital available of $1,663 million represented 157% of the capital required, a decrease from 182% in
the prior year primarily due to capital framework enhancements which increased capital requirements to
accommodate the Securitization Activity’s due regard for counterparty risk, operational risk and interest
rate risk.
■■ Guarantee and Application Fees Received increased by $8 million (3.0%) to $273 million compared to the
prior year primarily due to higher volumes of guaranteed NHA MBS issuances in the four and five-year terms
which carry higher guarantee fees.
Non-Financial Highlights
■■ CMHC reviewed guarantee products and pricing to ensure continued alignment with Government of Canada
objectives and direction. In support of the government’s efforts to enhance the Canadian housing finance
framework, CMHC announced on 1 December 2014 increases to guarantee fees. The revised guarantee
fees, effective 1 April 2015, are intended to encourage the development of alternative funding options in
the private market.
■■ We implemented CMHC’s Liquidity Management Framework with respect to the Timely Payment
Guarantee. This framework ensures adequate internal liquidity for all business lines, including a call on the
timely payment guarantee under our Securitization programs, and identifies the Corporation’s liquidity risk
tolerance. The provision of a formal liquidity management framework document is in line with broader
regulatory guidelines proposed by OSFI and industry.
■■ In 2014, the NHA MBS Indemnity Calculation Methodology, effective 1 November 2014, was introduced
to improve the comparability across pools and issuers by standardizing the calculation of prepayment
indemnities for certain pool types. We have also made improvements to the NHA MBS Information Circular
to make it easier for investors to read, understand and compare provisions that can significantly impact cash
flow and prepayment risk.
■■ We amended requirements which previously restricted mortgage loans within an NHA MBS to be insured
by the same insurer. The new policy permits an NHA MBS to contain mortgage loans insured by one or
more approved mortgage insurers and is expected to satisfy the needs of NHA MBS Program participants,
create administrative efficiencies, facilitate larger and liquid NHA MBS and increase competitiveness in the
mortgage market.
■■ We increased visibility of the Canadian Registered Covered Bond Program. The European Union now
considers Canadian Covered Bonds as a Level 2A liquid asset for the purposes of EU based financial
institutions meeting the Liquidity Coverage Ratio under Basel III. European investors increased familiarity
with covered bond instruments led to a large Canadian Covered Bond issuance, by issuers, in the last
quarter of 2014.
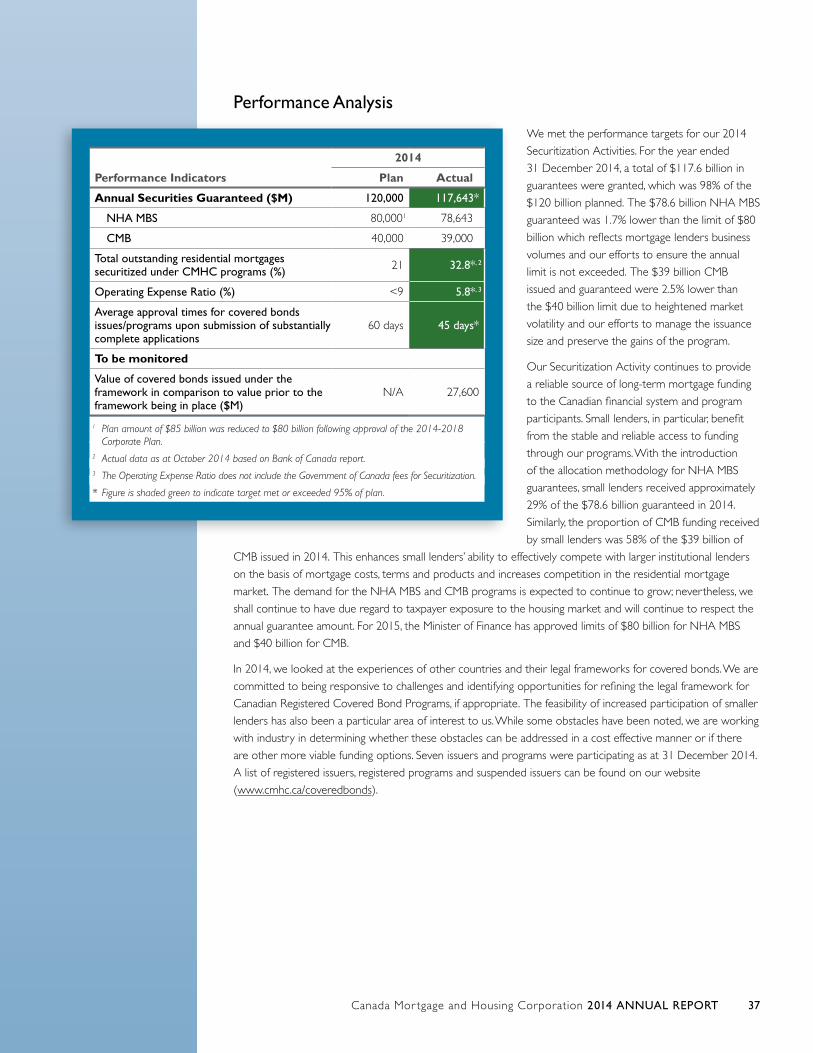
Canada Mor tgage and Housing Corporation 2014 ANNUAL REPORT 37
Performance Analysis
We met the performance targets for our 2014
Securitization Activities. For the year ended
31 December 2014, a total of $117.6 billion in
guarantees were granted, which was 98% of the
$120 billion planned. The $78.6 billion NHA MBS
guaranteed was 1.7% lower than the limit of $80
billion which reflects mortgage lenders business
volumes and our efforts to ensure the annual
limit is not exceeded. The $39 billion CMB
issued and guaranteed were 2.5% lower than
the $40 billion limit due to heightened market
volatility and our efforts to manage the issuance
size and preserve the gains of the program.
Our Securitization Activity continues to provide
a reliable source of long-term mortgage funding
to the Canadian financial system and program
participants. Small lenders, in particular, benefit
from the stable and reliable access to funding
through our programs. With the introduction
of the allocation methodology for NHA MBS
guarantees, small lenders received approximately
29% of the $78.6 billion guaranteed in 2014.
Similarly, the proportion of CMB funding received
by small lenders was 58% of the $39 billion of
CMB issued in 2014. This enhances small lenders’ ability to effectively compete with larger institutional lenders
on the basis of mortgage costs, terms and products and increases competition in the residential mortgage
market. The demand for the NHA MBS and CMB programs is expected to continue to grow; nevertheless, we
shall continue to have due regard to taxpayer exposure to the housing market and will continue to respect the
annual guarantee amount. For 2015, the Minister of Finance has approved limits of $80 billion for NHA MBS
and $40 billion for CMB.
In 2014, we looked at the experiences of other countries and their legal frameworks for covered bonds. We are
committed to being responsive to challenges and identifying opportunities for refining the legal framework for
Canadian Registered Covered Bond Programs, if appropriate. The feasibility of increased participation of smaller
lenders has also been a particular area of interest to us. While some obstacles have been noted, we are working
with industry in determining whether these obstacles can be addressed in a cost effective manner or if there
are other more viable funding options. Seven issuers and programs were participating as at 31 December 2014.
A list of registered issuers, registered programs and suspended issuers can be found on our website
(www.cmhc.ca/coveredbonds).
Performance Indicators
2014
Plan Actual
Annual Securities Guaranteed ($M) 120,000 117,643*
NHA MBS 80,0001 78,643
CMB 40,000 39,000
Total outstanding residential mortgages securitized under CMHC programs (%) 21 32.8*, 2
Operating Expense Ratio (%) <9 5.8*, 3
Average approval times for covered bonds issues/programs upon submission of substantially complete applications
60 days 45 days*
To be monitored
Value of covered bonds issued under the framework in comparison to value prior to the framework being in place ($M)
N/A 27,600
1 Plan amount of $85 billion was reduced to $80 billion following approval of the 2014-2018 Corporate Plan.
2 Actual data as at October 2014 based on Bank of Canada report.3 The Operating Expense Ratio does not include the Government of Canada fees for Securitization.
* Figure is shaded green to indicate target met or exceeded 95% of plan.
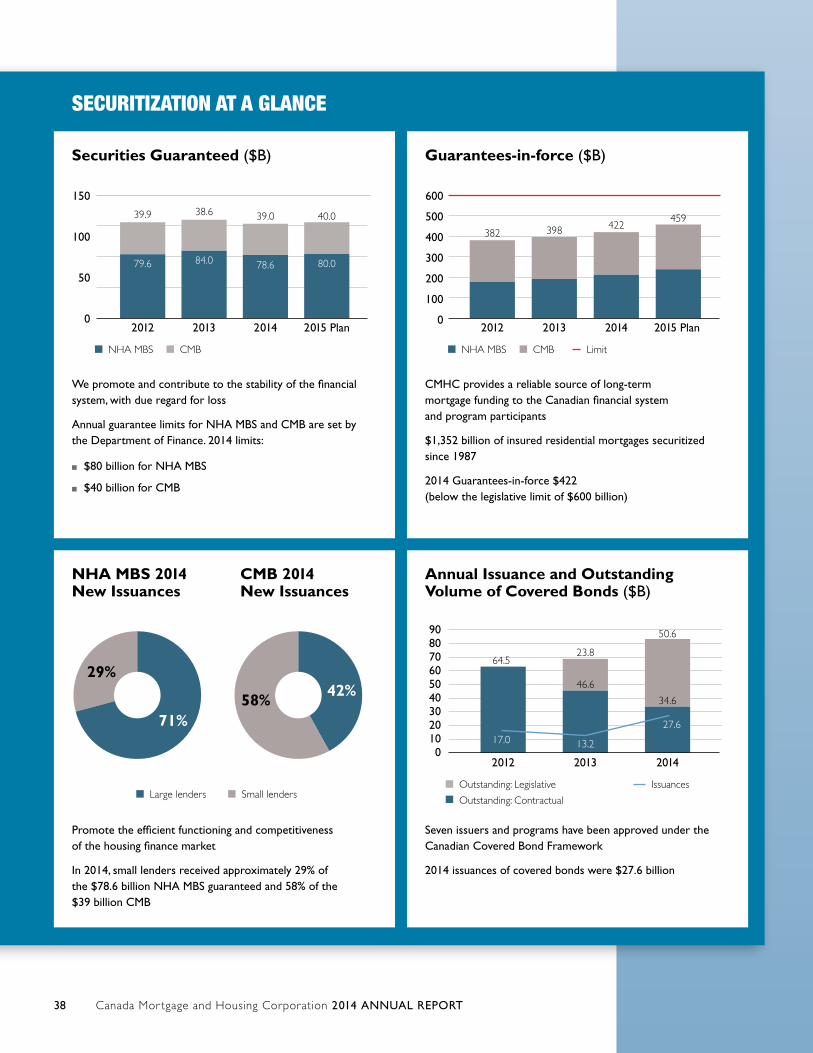
Canada Mor tgage and Housing Corporation 2014 ANNUAL REPORT38
SECURITIZATION AT A GLANCE
Guarantees-in-force ($B)
2012 2013 2015 Plan
600
500
400
300
200
100
0
NHA MBS CMB Limit
2014
382 398 422459
CMHC provides a reliable source of long-term mortgage funding to the Canadian financial system and program participants
$1,352 billion of insured residential mortgages securitized since 1987
2014 Guarantees-in-force $422 (below the legislative limit of $600 billion)
Securities Guaranteed ($B)
2012 2013 2015 Plan
150
100
50
0
NHA MBS CMB
2014
39.9
79.6
38.6
84.0
40.0
80.0
39.0
78.6
We promote and contribute to the stability of the financial system, with due regard for loss
Annual guarantee limits for NHA MBS and CMB are set by the Department of Finance. 2014 limits:
■■ $80 billion for NHA MBS
■■ $40 billion for CMB
NHA MBS 2014 New Issuances
29%
71%
Large lenders Small lenders
58%42%
Promote the efficient functioning and competitiveness of the housing finance market
In 2014, small lenders received approximately 29% of the $78.6 billion NHA MBS guaranteed and 58% of the $39 billion CMB
Annual Issuance and Outstanding Volume of Covered Bonds ($B)
2012 2013
Outstanding: Legislative
Outstanding: Contractual
Issuances
2014
9080706050403020100
50.6
23.8
17.0
34.6
46.6
27.6
13.2
64.5
Seven issuers and programs have been approved under the Canadian Covered Bond Framework
2014 issuances of covered bonds were $27.6 billion
CMB 2014 New Issuances
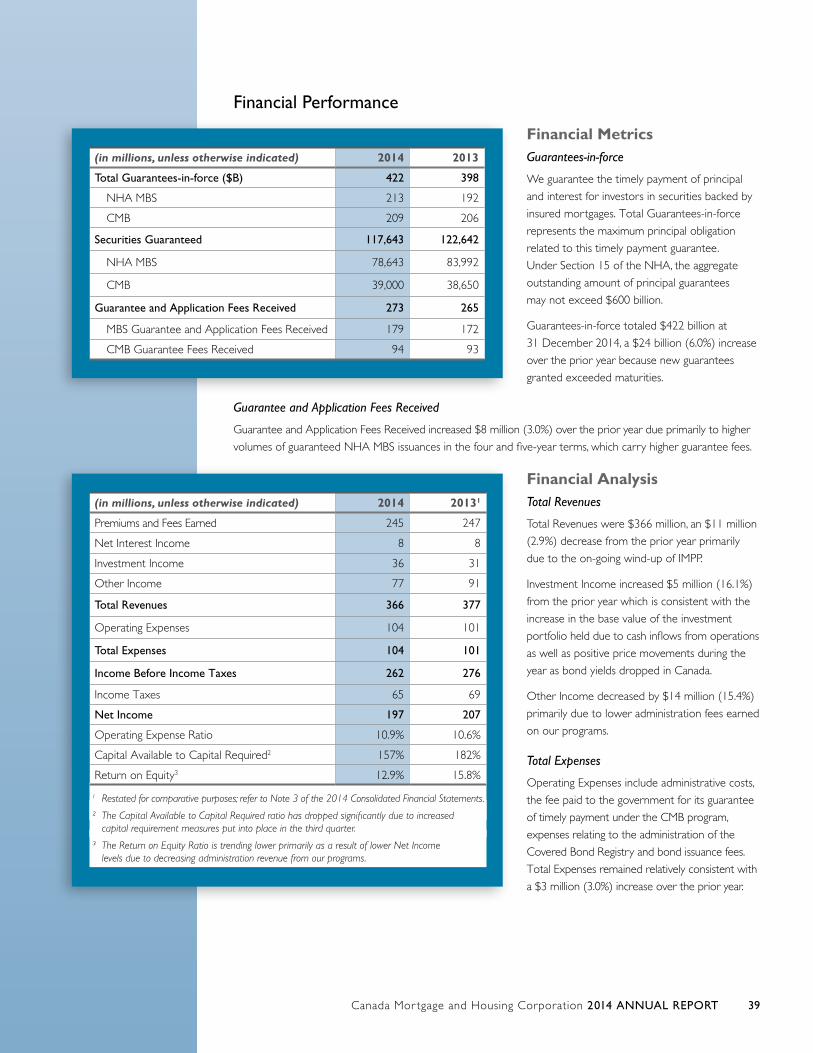
Canada Mor tgage and Housing Corporation 2014 ANNUAL REPORT 39
Financial Performance
Financial Metrics Guarantees-in-force
We guarantee the timely payment of principal
and interest for investors in securities backed by
insured mortgages. Total Guarantees-in-force
represents the maximum principal obligation
related to this timely payment guarantee.
Under Section 15 of the NHA, the aggregate
outstanding amount of principal guarantees
may not exceed $600 billion.
Guarantees-in-force totaled $422 billion at
31 December 2014, a $24 billion (6.0%) increase
over the prior year because new guarantees
granted exceeded maturities.
Guarantee and Application Fees Received
Guarantee and Application Fees Received increased $8 million (3.0%) over the prior year due primarily to higher
volumes of guaranteed NHA MBS issuances in the four and five-year terms, which carry higher guarantee fees.
Financial AnalysisTotal Revenues
Total Revenues were $366 million, an $11 million
(2.9%) decrease from the prior year primarily
due to the on-going wind-up of IMPP.
Investment Income increased $5 million (16.1%)
from the prior year which is consistent with the
increase in the base value of the investment
portfolio held due to cash inflows from operations
as well as positive price movements during the
year as bond yields dropped in Canada.
Other Income decreased by $14 million (15.4%)
primarily due to lower administration fees earned
on our programs.
Total Expenses
Operating Expenses include administrative costs,
the fee paid to the government for its guarantee
of timely payment under the CMB program,
expenses relating to the administration of the
Covered Bond Registry and bond issuance fees.
Total Expenses remained relatively consistent with
a $3 million (3.0%) increase over the prior year.
(in millions, unless otherwise indicated) 2014 2013
Total Guarantees-in-force ($B) 422 398
NHA MBS 213 192
CMB 209 206
Securities Guaranteed 117,643 122,642
NHA MBS 78,643 83,992
CMB 39,000 38,650
Guarantee and Application Fees Received 273 265
MBS Guarantee and Application Fees Received 179 172
CMB Guarantee Fees Received 94 93
(in millions, unless otherwise indicated) 2014 20131
Premiums and Fees Earned 245 247
Net Interest Income 8 8
Investment Income 36 31
Other Income 77 91
Total Revenues 366 377
Operating Expenses 104 101
Total Expenses 104 101
Income Before Income Taxes 262 276
Income Taxes 65 69
Net Income 197 207
Operating Expense Ratio 10.9% 10.6%
Capital Available to Capital Required2 157% 182%
Return on Equity3 12.9% 15.8%
1 Restated for comparative purposes; refer to Note 3 of the 2014 Consolidated Financial Statements.
² The Capital Available to Capital Required ratio has dropped significantly due to increased capital requirement measures put into place in the third quarter.
³ The Return on Equity Ratio is trending lower primarily as a result of lower Net Income levels due to decreasing administration revenue from our programs.
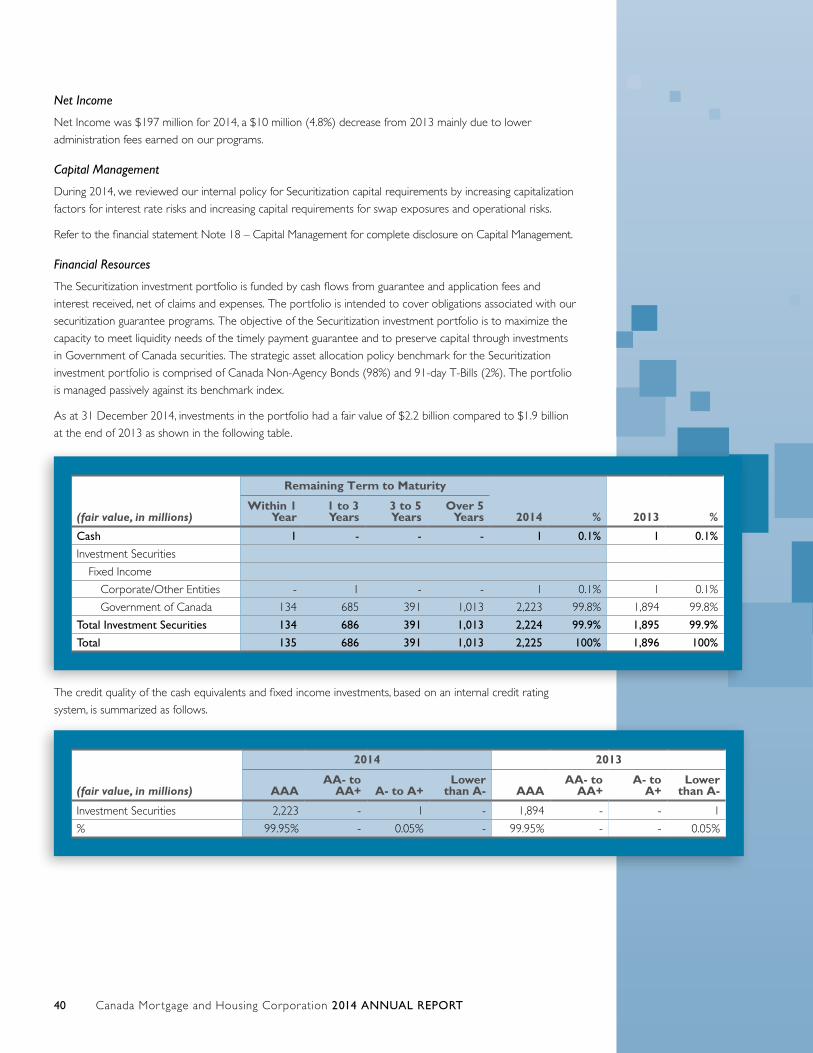
Canada Mor tgage and Housing Corporation 2014 ANNUAL REPORT40
Net Income
Net Income was $197 million for 2014, a $10 million (4.8%) decrease from 2013 mainly due to lower
administration fees earned on our programs.
Capital Management
During 2014, we reviewed our internal policy for Securitization capital requirements by increasing capitalization
factors for interest rate risks and increasing capital requirements for swap exposures and operational risks.
Refer to the financial statement Note 18 – Capital Management for complete disclosure on Capital Management.
Financial Resources
The Securitization investment portfolio is funded by cash flows from guarantee and application fees and
interest received, net of claims and expenses. The portfolio is intended to cover obligations associated with our
securitization guarantee programs. The objective of the Securitization investment portfolio is to maximize the
capacity to meet liquidity needs of the timely payment guarantee and to preserve capital through investments
in Government of Canada securities. The strategic asset allocation policy benchmark for the Securitization
investment portfolio is comprised of Canada Non-Agency Bonds (98%) and 91-day T-Bills (2%). The portfolio
is managed passively against its benchmark index.
As at 31 December 2014, investments in the portfolio had a fair value of $2.2 billion compared to $1.9 billion
at the end of 2013 as shown in the following table.
The credit quality of the cash equivalents and fixed income investments, based on an internal credit rating
system, is summarized as follows.
(fair value, in millions)
Remaining Term to Maturity
2014 % 2013 %Within 1
Year1 to 3 Years
3 to 5 Years
Over 5 Years
Cash 1 - - - 1 0.1% 1 0.1%
Investment Securities
Fixed Income
Corporate/Other Entities - 1 - - 1 0.1% 1 0.1%
Government of Canada 134 685 391 1,013 2,223 99.8% 1,894 99.8%
Total Investment Securities 134 686 391 1,013 2,224 99.9% 1,895 99.9%
Total 135 686 391 1,013 2,225 100% 1,896 100%
(fair value, in millions)
2014 2013
AAAAA- to
AA+ A- to A+Lower
than A- AAAAA- to
AA+A- to
A+Lower
than A-
Investment Securities 2,223 - 1 - 1,894 - - 1
% 99.95% - 0.05% - 99.95% - - 0.05%
Canada Mor tgage and Housing Corporation 2014 ANNUAL REPORT 41
Quarterly Financial Information The Minister of Finance approves the annual limit on new NHA MBS and CMB issuance volumes. The capital
available to minimum capital required ratio has dropped in the third and fourth quarters as a result of capital
framework enhancements that increased the amount of capital required; partially offset by the ongoing upwards
pressure on the ratio due to IMPP repayments.
Outlook
■■ Due to the wind-up of IMPP early in 2015, the related loans and borrowing from the government were repaid.
Estimated balance sheet impact is a $2,024 million decrease in Loans and Accrued Interest Receivable as well as
Borrowings and Accrued Interest Payable. The estimated impact to Net Income is a $3 million decrease.
■■ 2015 issuance limits approved by the Minister of Finance are consistent with the 2014 levels.
■■ Effective 1 April 2015, guarantee fees charged to issuers on NHA MBS and CMB are set to increase. This will
cause an increase in Guarantee Fees Received and cause a gradual increase to Premiums and Fees Earned as
the fee is amortized over the life of the instrument.
■■ Effective 1 April 2015, fees paid to the Government of Canada for their guarantee will increase. This will
cause an increase in Accounts Payable and Other Liabilities, an increase in Operating Expenses and lower
Net Income.
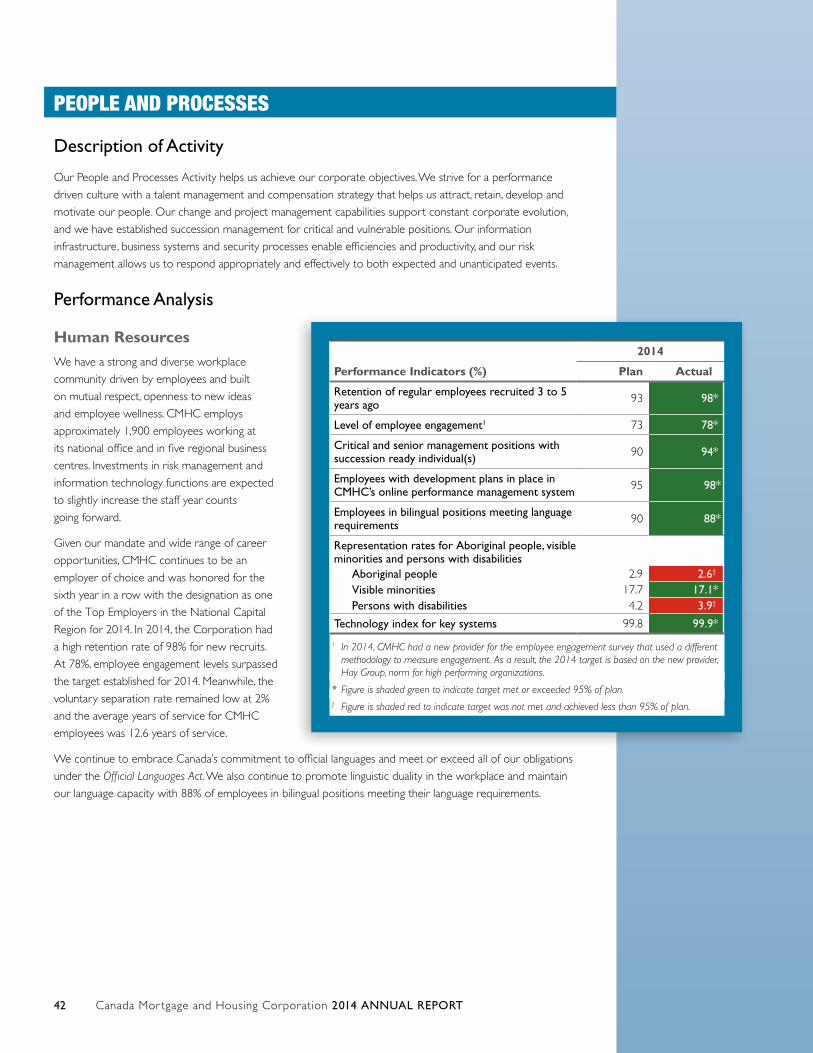
Canada Mor tgage and Housing Corporation 2014 ANNUAL REPORT42
PEOPLE AND PROCESSES
Description of Activity
Our People and Processes Activity helps us achieve our corporate objectives. We strive for a performance
driven culture with a talent management and compensation strategy that helps us attract, retain, develop and
motivate our people. Our change and project management capabilities support constant corporate evolution,
and we have established succession management for critical and vulnerable positions. Our information
infrastructure, business systems and security processes enable efficiencies and productivity, and our risk
management allows us to respond appropriately and effectively to both expected and unanticipated events.
Performance Analysis
Human ResourcesWe have a strong and diverse workplace
community driven by employees and built
on mutual respect, openness to new ideas
and employee wellness. CMHC employs
approximately 1,900 employees working at
its national office and in five regional business
centres. Investments in risk management and
information technology functions are expected
to slightly increase the staff year counts
going forward.
Given our mandate and wide range of career
opportunities, CMHC continues to be an
employer of choice and was honored for the
sixth year in a row with the designation as one
of the Top Employers in the National Capital
Region for 2014. In 2014, the Corporation had
a high retention rate of 98% for new recruits.
At 78%, employee engagement levels surpassed
the target established for 2014. Meanwhile, the
voluntary separation rate remained low at 2%
and the average years of service for CMHC
employees was 12.6 years of service.
We continue to embrace Canada’s commitment to official languages and meet or exceed all of our obligations
under the Official Languages Act. We also continue to promote linguistic duality in the workplace and maintain
our language capacity with 88% of employees in bilingual positions meeting their language requirements.
Performance Indicators (%)
2014
Plan Actual
Retention of regular employees recruited 3 to 5 years ago 93 98*
Level of employee engagement1 73 78*
Critical and senior management positions with succession ready individual(s) 90 94*
Employees with development plans in place in CMHC’s online performance management system 95 98*
Employees in bilingual positions meeting language requirements 90 88*
Representation rates for Aboriginal people, visible minorities and persons with disabilities
Aboriginal people 2.9 2.6†
Visible minorities 17.7 17.1*Persons with disabilities 4.2 3.9†
Technology index for key systems 99.8 99.9*
1 In 2014, CMHC had a new provider for the employee engagement survey that used a different methodology to measure engagement. As a result, the 2014 target is based on the new provider, Hay Group, norm for high performing organizations.
* Figure is shaded green to indicate target met or exceeded 95% of plan.† Figure is shaded red to indicate target was not met and achieved less than 95% of plan.
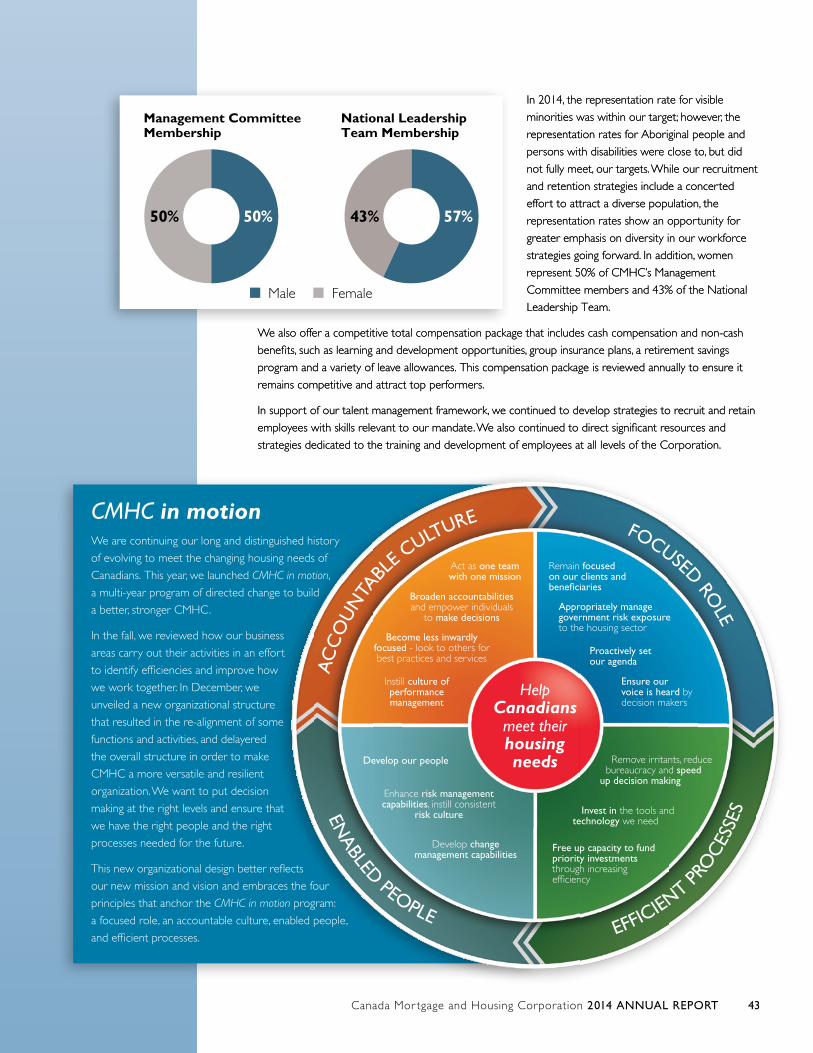
Canada Mor tgage and Housing Corporation 2014 ANNUAL REPORT 43
In 2014, the representation rate for visible
minorities was within our target; however, the
representation rates for Aboriginal people and
persons with disabilities were close to, but did
not fully meet, our targets. While our recruitment
and retention strategies include a concerted
effort to attract a diverse population, the
representation rates show an opportunity for
greater emphasis on diversity in our workforce
strategies going forward. In addition, women
represent 50% of CMHC’s Management
Committee members and 43% of the National
Leadership Team.
We also offer a competitive total compensation package that includes cash compensation and non-cash
benefits, such as learning and development opportunities, group insurance plans, a retirement savings
program and a variety of leave allowances. This compensation package is reviewed annually to ensure it
remains competitive and attract top performers.
In support of our talent management framework, we continued to develop strategies to recruit and retain
employees with skills relevant to our mandate. We also continued to direct significant resources and
strategies dedicated to the training and development of employees at all levels of the Corporation.
National Leadership Team Membership
Management Committee Membership
50% 50%
Male Female
43% 57%
CMHC in motionWe are continuing our long and distinguished history
of evolving to meet the changing housing needs of
Canadians. This year, we launched CMHC in motion,
a multi-year program of directed change to build
a better, stronger CMHC.
In the fall, we reviewed how our business
areas carry out their activities in an effort
to identify efficiencies and improve how
we work together. In December, we
unveiled a new organizational structure
that resulted in the re-alignment of some
functions and activities, and delayered
the overall structure in order to make
CMHC a more versatile and resilient
organization. We want to put decision
making at the right levels and ensure that
we have the right people and the right
processes needed for the future.
This new organizational design better reflects
our new mission and vision and embraces the four
principles that anchor the CMHC in motion program:
a focused role, an accountable culture, enabled people,
and efficient processes.
AC
CO
UN
TABL
E CULTURE FOCUSED ROLE
ENABLED
PEOPLEEFFICIEN
T PRO
CES
SES
Broaden accountabilities and empower individuals
to make decisions
Instill culture of performance management
Become less inwardly focused - look to others for best practices and services
Develop our people
Enhance risk management capabilities, instill consistent
risk culture
Develop change management capabilities
Remain focused on our clients and bene� ciaries
Appropriately manage government risk exposure to the housing sector
Proactively set our agenda
Ensure our voice is heard by decision makers
Remove irritants, reduce bureaucracy and speed up decision making
Invest in the tools and technology we need
Free up capacity to fund priority investments through increasing ef� ciency
Act as one team with one mission
HelpCanadians
meet theirhousing needs
Canada Mor tgage and Housing Corporation 2014 ANNUAL REPORT44
Information & TechnologyDuring 2014, we laid the foundation for Information and Technology (I&T) to transform our technology
landscape. To this end, we are embarking on a five-year I&T Strategic Investment Plan in four categories;
business applications, technology security, core infrastructure and technology modernization. In-line with CMHC
in motion, I&T underwent a major process to re-evaluate its functions and processes. A new structure was put
in place which provides the necessary I&T governance and operational excellence to support the strategic
investments in technology. With a renewed focus on demand management, quality assurance testing, corporate
project management, corporate process re-design and enterprise architecture, I&T is positioned to play a critical
role in supporting CMHC’s business priorities.
Risk Management and Internal AuditAn independent risk management function is responsible for the oversight of risks faced by CMHC and
an independent internal audit function provides objective assurances as to the effectiveness of our risk
management, control and governance processes. In addition, the NHA specifies that the Superintendent of
Financial Institutions, at least once each calendar year, will make or cause to be made any examination or inquiry
that the Superintendent considers to be necessary or expedient to determine if the Corporation is carrying on
any or all of its commercial activities in a safe and sound manner with due regard to loss. The Superintendent
reports the results of this examination and makes recommendations to the Board of Directors, the Minister for
CMHC and the Minister of Finance.
Risk Management We have a structured risk management approach that ensures regular risk assessment and reporting, including
an annual review and approval of the Enterprise Risk Management (ERM) policies, regular updates to the ERM
Risk Register, Risk Appetite Statement Reports and Quarterly Risk Management Reports. These practices
ensure that top and emerging risks are appropriately identified and managed and provide a forward-looking
assessment of potential issues.
Top and Emerging Risks
Economic volatility and uncertaintyThe global and Canadian economic environments continue to be exposed to uncertainty and potential
volatility which could, in turn, cause adverse value fluctuations to CMHC (e.g. investments, insurance liabilities,
etc.). The combination of global and domestic market risks may put added negative pressure on the Canadian
economy. Some of the more negative potential outcomes for both the global and Canadian economies include
a recession, a sustained period of low or no economic growth, shocks to the equity markets, a rapid rise in
interest rates, inflation, unemployment and/or decreasing house prices. Economic and market developments are
continually monitored and regular stress testing is performed to ensure the potential implication of this volatility
are well understood and responded to appropriately.
Canada Mor tgage and Housing Corporation 2014 ANNUAL REPORT 45
Canadian household debtAverage Canadian household debt remains elevated while household assets are illiquid and concentrated in
real estate. This could negatively impact the ability of homeowners to manage debt and mortgage repayments
if interest rates rise. This remains a concern, especially as persistently low mortgage interest rates continue to
sustain housing market activity. We are closely monitoring housing market trends. High levels debt could impact
the ability of homeowners to manage debt and mortgage repayments in the event of an economic shock.
Operational risks related to change and restructuring at CMHCWe have made changes to our structure and processes in order to better achieve our refined vision of shaping
the market and continuing to appropriately manage government exposures. A change management team, and
the ongoing attention of senior management and the Board, are ensuring that the impacts and issues resulting
from these changes are being closely monitored. In addition, we are working to address ageing technology
issues.
CybersecurityTechnology and information security risks have significantly increased in recent years, due to the constantly
growing sophistication and volume of cyber attacks. Significant resources are being devoted to monitoring our
security systems and additional investments in these capabilities will continue in the coming years.
Capital adequacy risk managementWe continue to refine and enhance our capitalization models supported by a comprehensive stress testing
framework to ensure that CMHC continues to hold sufficient capital to survive relatively severe scenarios. We
conduct sensitivity testing, solvency testing and use deterministic scenarios to test our capital adequacy.
Risk Management Framework
Risk management is an integral part of our strategic and operational decision making. Our ERM policies and
governance structure guide the Corporation in its risk management activities and assist us with appropriately
identifying and managing our principal risks and opportunities. Our risk appetite, governance structure, and ERM
framework help define, assess and categorize the risks to which we are exposed. Additionally, CMHC’s Risk
Appetite Framework includes our risk capacity statement, risk appetite principles and risk appetite statements.
Our risk appetite has been established at both the Corporate level and for our main business activities.
Our Risk Management Governance Model
We are committed to continuously refining our approach to risk management in accordance with industry best
practices and changes in our operating environment. In 2014, CMHC developed and adopted a “Three Lines of
Defence” risk governance model to further enhance the Corporation’s risk governance structure and culture.
This model is intended to advance the understanding, discussion, evaluation and management of risks at all levels
of the organization and across all of our activities. Implementation will continue over the course of 2015.
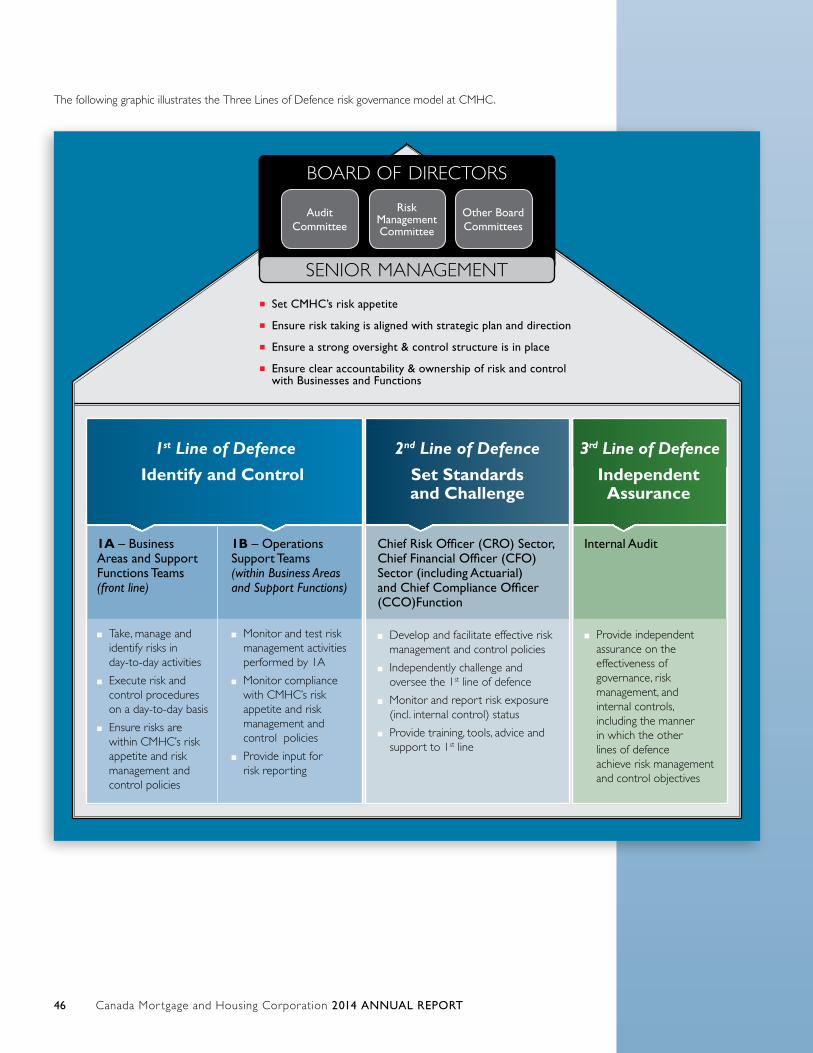
Canada Mor tgage and Housing Corporation 2014 ANNUAL REPORT46
The following graphic illustrates the Three Lines of Defence risk governance model at CMHC.
■ Set CMHC’s risk appetite
■ Ensure risk taking is aligned with strategic plan and direction
■ Ensure a strong oversight & control structure is in place
■ Ensure clear accountability & ownership of risk and control with Businesses and Functions
1st Line of Defence
Identify and Control
1A – Business Areas and Support Functions Teams (front line)
■■ Take, manage and identify risks in day-to-day activities
■■ Execute risk and control procedures on a day-to-day basis
■■ Ensure risks are within CMHC’s risk appetite and risk management and control policies
1B – Operations Support Teams (within Business Areas and Support Functions)
■■ Monitor and test risk management activities performed by 1A
■■ Monitor compliance with CMHC’s risk appetite and risk management and control policies
■■ Provide input for risk reporting
2nd Line of Defence
Set Standards and Challenge
Chief Risk Officer (CRO) Sector, Chief Financial Officer (CFO)Sector (including Actuarial) and Chief Compliance Officer (CCO)Function
■■ Develop and facilitate effective risk management and control policies
■■ Independently challenge and oversee the 1st line of defence
■■ Monitor and report risk exposure (incl. internal control) status
■■ Provide training, tools, advice and support to 1st line
Independent Assurance
Internal Audit
■■ Provide independent assurance on the effectiveness of governance, risk management, and internal controls, including the manner in which the other lines of defence achieve risk management and control objectives
3rd Line of Defence
BOARD OF DIRECTORS
Risk Management Committee
Other Board Committees
Audit Committee
SENIOR MANAGEMENT
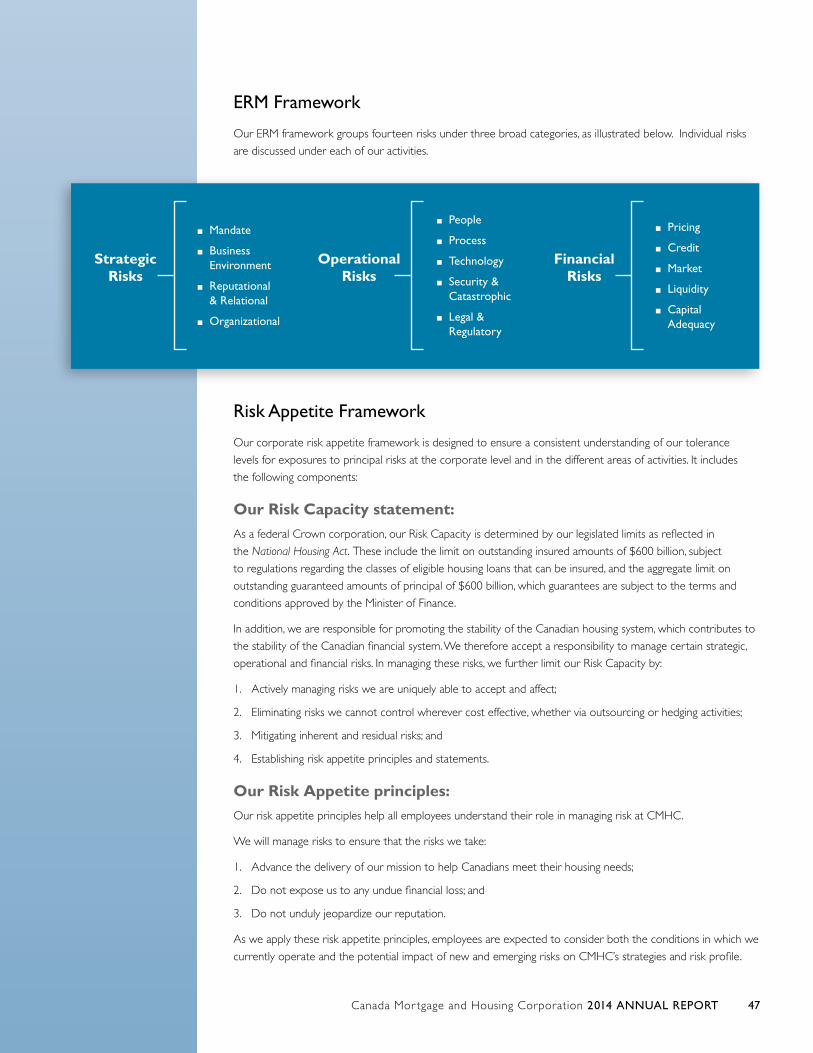
Canada Mor tgage and Housing Corporation 2014 ANNUAL REPORT 47
ERM Framework
Our ERM framework groups fourteen risks under three broad categories, as illustrated below. Individual risks
are discussed under each of our activities.
Risk Appetite Framework
Our corporate risk appetite framework is designed to ensure a consistent understanding of our tolerance
levels for exposures to principal risks at the corporate level and in the different areas of activities. It includes
the following components:
Our Risk Capacity statement:As a federal Crown corporation, our Risk Capacity is determined by our legislated limits as reflected in
the National Housing Act. These include the limit on outstanding insured amounts of $600 billion, subject
to regulations regarding the classes of eligible housing loans that can be insured, and the aggregate limit on
outstanding guaranteed amounts of principal of $600 billion, which guarantees are subject to the terms and
conditions approved by the Minister of Finance.
In addition, we are responsible for promoting the stability of the Canadian housing system, which contributes to
the stability of the Canadian financial system. We therefore accept a responsibility to manage certain strategic,
operational and financial risks. In managing these risks, we further limit our Risk Capacity by:
1. Actively managing risks we are uniquely able to accept and affect;
2. Eliminating risks we cannot control wherever cost effective, whether via outsourcing or hedging activities;
3. Mitigating inherent and residual risks; and
4. Establishing risk appetite principles and statements.
Our Risk Appetite principles:Our risk appetite principles help all employees understand their role in managing risk at CMHC.
We will manage risks to ensure that the risks we take:
1. Advance the delivery of our mission to help Canadians meet their housing needs;
2. Do not expose us to any undue financial loss; and
3. Do not unduly jeopardize our reputation.
As we apply these risk appetite principles, employees are expected to consider both the conditions in which we
currently operate and the potential impact of new and emerging risks on CMHC’s strategies and risk profile.
■■ Pricing
■■ Credit
■■ Market
■■ Liquidity
■■ Capital Adequacy
Financial Risks
■■ People
■■ Process
■■ Technology
■■ Security & Catastrophic
■■ Legal & Regulatory
Operational Risks
■■ Mandate
■■ Business Environment
■■ Reputational & Relational
■■ Organizational
Strategic Risks
Canada Mor tgage and Housing Corporation 2014 ANNUAL REPORT48
Our Risk Appetite statement:Our risk appetite statement is designed to ensure a consistent understanding of risk exposures which are
acceptable or unacceptable to the Corporation and describes our attitude toward risks in the following terms:
“We will:
■■ Manage risks appropriate to the delivery of CMHC’s mission to help Canadians meet their housing
needs, with due regard for loss.
■■ Comply with all applicable statutory and regulatory requirements, including the annual approval of
Parliamentary Appropriations and CMHC’s Corporate Plan.
■■ Maintain capital and liquidity levels in Mortgage Loan Insurance and Securitization to adequately survive
significant financial and other crises.
■■ Take appropriate risks in order to explore innovative opportunities which could lead to new processes
or improvements to existing processes, and to new products or policy development to help meet
our mandate.
■■ Maintain sufficient operational capabilities to be able to provide access to services for Canadians
in all regions of Canada and to also be able to promote and contribute to the stability of the
financial system.”
The statement also indicates that, during the organization’s five-year corporate planning horizon, we want a very
high level of confidence that:
■■ Spending on government-funded programs will not vary from approved funding by more than a specified
percentage.
■■ Exposures to financial risk expressed as a percentage of capital in three primary business lines – Assisted
Housing, Mortgage Loan Insurance and Securitization – will not exceed specified risk levels.
■■ Variances of operating expenses to budget will not exceed a specified maximum variance.
It also includes reputational and achievement of objectives tolerances statements. The statement concludes by
specifying that a minimum percentage of the annual priorities in the Corporate Plan should also be achieved.
In order to manage our risks at a more granular level, our risk appetite statement is supplemented by business
Activity risk appetite statements. These statements include thresholds and limits for specific business and
functional area risks.
Our Business Activity Risks
Assisted HousingOn behalf of the Government of Canada, CMHC makes annual investments of approximately $2 billion
for housing, through Parliamentary Appropriations for Housing Programs expenditures, including operating
expenses. Funding is provided primarily to provinces, territories, First Nations and project proponents
through various agreements. These agreements outline the appropriate use of the funding and contain a clear
accountability framework. We do not pay claims and suspend the subsidy where there are material compliance
issues. There is a risk that housing programs funding may not be used in accordance with approved program
parameters leading to reputational and mandate issues.
We hold and make loans under the National Housing Act (NHA) to social housing sponsors, First Nations,
provinces, territories and municipalities for federally-subsidized housing. These loans can be offered to social
housing sponsors at lower interest rates because we borrow funds through the Crown Borrowing Program.
The estimated fair value of loans arising from CMHC’s Assisted Housing is $11 billion on an outstanding balance
of $10 billion as at 31 December 2014. The principal risks associated with this activity include credit risk, market
risk, including prepayment and interest rate risks and pricing risk.
Canada Mor tgage and Housing Corporation 2014 ANNUAL REPORT 49
Credit Risk
Credit risk in the Lending portfolio arises from the risk of loss due to the failure of counterparties to meet their
contractual obligations. Our loan portfolio includes loans for social housing projects administered jointly or by
provinces and territories as well as those administered by CMHC both on and off-reserve. We lend to a large
number of non-profit entities that do not issue public debt, and therefore do not have credit ratings established
by independent credit rating agencies. Losses due to default on these loans are largely recoverable from various
levels of government.
Credit risk is managed by examining annual project level reports, including audited financial statements
submitted by social housing project sponsors. These reports enable us to detect potential problems and
intervene, as appropriate, should a project face financial difficulty. Workouts or restructurings, which may involve
additional financing or assistance, are determined on a case-by-case basis.
Our Lending Program is assured full collection of principal and accrued interest on the majority of the loans.
As at 31 December 2014, CMHC was assured full collection of principal and accrued interest on 77% of its
loans (2013 – 77%). The remaining 23% of loans (largely under the Municipal Infrastructure Lending Program)
are assessed on a regular basis to determine if provisions for loss are necessary. As at year-end 2014, there was
one impaired loan identified and a $22 million provision for loss was recorded.
Market Risk
We operate our Lending Program on a breakeven basis. The vast majority of the loans are closed to
prepayment for the duration of the mortgage term selected by the housing group. The underlying debt (the
monies that we borrow to fund the mortgage) matches, to the extent possible, the term of the loan. As such,
prepayment activity, including the restructuring of closed loans, has the potential to cause us to incur losses.
We mitigate our exposure to prepayment risk by applying the terms and conditions of our loans, including
prepayment clauses. We also accept prepayment of some closed loans in certain circumstances. In these cases,
prepayment penalties will apply. For example, for eligible non-profit and co-operative housing projects requiring
capital repairs and renovations, a yield maintenance prepayment penalty consistent with private lending
institutions will apply, mitigating our prepayment risk.
We are exposed to interest rate risk when asset and liability principal and interest cash flows have different
interest payments or maturity dates. The severity of the risk is dependent on the size and direction of interest
rate changes and the size of the mismatched positions. Our risk management policies specify that the maximum
exposure of the financing margin to interest rate movements with a confidence level of 95% be fixed at
$1.5 million over a 12-month horizon.
Liquidity Risk
Our Lending Program has minimal liquidity risks. Any potential liquidity shortfall is mitigated through ongoing
cash management activities, and ultimate access to funding from the Department of Finance through the Crown
Borrowing Program.
Pricing Risk
Direct Lending interest rates are set based on operating costs, slippage, funding costs and related hedging costs.
A review of Direct Lending costs is conducted periodically to determine if the rate charged to Direct Lending
borrowers is sufficient to recover our administrative costs in respect of this program.
Mortgage Loan Insurance Activity Risks The primary risk of financial loss from the Mortgage Loan Insurance Activity is represented by the amount of
future claims associated with insured mortgages relative to insurance premiums received. We manage this risk
through prudent underwriting, lender quality assurance, a sound capital management framework, sensitivity and
stress testing framework and product pricing. The principal risks associated with this activity include credit risk,
market risk, liquidity risk and capital adequacy risk.
Canada Mor tgage and Housing Corporation 2014 ANNUAL REPORT50
Credit Risk
Credit risk, as it relates to Insurance Activities, is managed through a number of processes including assessment
of underwriting of mortgage loan insurance applications and continuous monitoring of Approved Lenders’
portfolios and underwriting practices.
Assessing Mortgage Loan Insurance Applications
We prudently manage mortgage loan insurance risk for different types of residential properties through
a rigorous underwriting process, as described below:
Transactional Homeowner insurance (four units or less) – high ratio or low ratio loansRisks related to Transactional Homeowner mortgage loan insurance are assessed through our proprietary
automated mortgage loan insurance risk assessment and approval system, emili, which is used by Approved
Lenders and by CMHC underwriters across the country. emili assesses an application’s overall risk by looking
at the borrower, the property, the market in which the property is located, as well as the overall characteristics
of the loan. The results of these risk assessments are synthesized to determine the overall risk of default.
If necessary, underwriters can take further steps to determine if risk-mitigating actions are required to effectively
reduce the overall risk to a level that is acceptable and prudent or may indicate that the application for
insurance is declined. We monitor and adjust our risk assessment models based on actual claims experience
and local market conditions. The emili overall risk rating, along with the size of the loan and policy
considerations, determines the required approval authority.
Multi-unit Residential insurance (in excess of four units)Risks associated with Multi-unit mortgage loan insurance are also assessed through detailed and thorough
underwriting processes that include analysis and risk assessment of the borrower, the property, the market in
which the property is located and the overall characteristics of the loan. A standardized risk assessment tool
is employed by underwriters to assign a risk rating to each of these major risk components. The risk ratings,
along with the size of the loan and policy considerations, determine the required approval authority.
Portfolio insurance (homeowner - four units or less) Loans submitted for Portfolio insurance are assessed through an automated underwriting system similar to
emili. The assessments include an analysis and risk assessment of the borrower, the property, the market in
which the property is located, and the overall characteristics of each individual loan. Individual pools are then
priced accordingly.
Monitoring Approved Lenders’ Insured Portfolios
Through our Quality Assurance Framework and lender operational reviews, we further manage risks by
assessing lenders’ insured loan portfolios, compliance with our underwriting requirements and by working
with lenders on a regular basis to maintain quality standards in the underwriting and servicing of their portfolios.
We monitor the performance of individual lenders and helps ensure that any deficiencies are addressed in a
systematic, comprehensive and timely manner.
Mortgage Loan Insurance – Investment Portfolio
In the context of our insurance-related investment portfolio, credit risk is the risk of loss arising from a
counterparty’s or an Approved Issuer’s inability to fulfill their contractual obligations. Credit risk includes default
risk, settlement risk, and downgrade risk, and encompasses both the probability of loss and the probable size
of the loss net of recoveries and collateral over appropriate time horizons. We are exposed to credit risk
from various sources directly and indirectly, including directly from investment and hedging activities. Exposures
associated with the Corporation’s financial transacting and financial instruments are consolidated and measured
on an aggregate basis by counterparty or Approved Issuer for all investing and hedging activities. Total exposure
is calculated using estimated fair values plus an estimate for future replacement costs, as appropriate. Exposure
limits are established by Approved Issuer or counterparty for the Insurance Activity subject to rating, term, and
diversification limits.
Canada Mor tgage and Housing Corporation 2014 ANNUAL REPORT 51
Market Risk
Interest rate, currency and equity price risks for our Insurance Activities derive from asset and liability
mismatches inherent in the cash flow timing associated with the Insurance assets and liabilities. We manage
market risk through our strategic asset allocation process, which includes consideration of overall risk and
return in selecting a specific asset allocation strategy, benchmarks and risk tolerances and controls.
Financial risks also arise from the investment portfolio associated with our Mortgage Loan Insurance Activity.
The investment portfolio for mortgage loan insurance consists of cash flows from premiums, application fees,
and interest received, net of claims and expenses. We use our Mortgage Loan Insurance portfolio to cover
obligations associated with the provision of mortgage loan insurance to lenders.
The objective of the Mortgage Loan Insurance investment portfolio is to maximize risk adjusted returns
while minimizing the potential of being required to liquidate investments. This is achieved through investments
with an emphasis on diversified, high-quality, income producing securities and other assets, subject to our risk
appetite statements.
Liquidity Risk
The Insurance program requires liquidity to fund claims payments as they occur. Insurance claims payments
are generally funded from insurance Premiums and Fees Received. Given the long lead time between the
occurrence of a loan default and the payment of an insurance claim, and because insurance premiums and
fees typically exceed claims payments, there is no significant liquidity risk in the Insurance program.
Capital Adequacy
Our Capital Management Framework follows OSFI regulations with respect to the use of the Minimum Capital
Test (MCT) for insurance companies. The MCT is the ratio of capital available to capital required. Our capital
available is equal to Mortgage Loan Insurance Retained Earnings plus Accumulated Other Comprehensive
Income, minus assets with a capital requirement of 100%. Capital required is calculated by applying risk factors
to assets, policy liabilities and other exposures.
The following represents CMHC’s capital management framework for its mortgage loan insurance activity:
■■ Minimum Regulatory Capital 100% MCT: Below 100% MCT, an insurance company would no longer be
allowed to write new business. A level below 0% MCT indicates insolvency.
■■ Internal Capital Target 205% MCT: The Internal Capital Target provides adequate time for Management
to resolve financial problems that may arise, while minimizing the need for regulatory intervention. In 2014,
the Board reviewed the results of the stress testing for the 2015 Corporate Plan and approved an increase
to 205% MCT for the Internal Capital Target. The increase reflects a more conservative assessment of the
impact of adverse economic conditions.
■■ Holding Capital Target 220% MCT: CMHC has selected a Holding Capital Target of 220% MCT so that the
likelihood of falling below the Internal Capital Target is less than 5% over a five-year period.
Using 10,000 consistent economic scenarios, CMHC’s sensitivity testing framework simulates the impact of
each of these economic scenarios on the 2015-2019 Corporate Plan as well as other plausible adverse business
scenarios. Each scenario includes 10 years of new business which then runs off over the next 20 years. The
economic scenarios include 30 years of outcomes for real GDP growth, the unemployment rate, the five-year
mortgage rate, and investment returns for up to 40 asset classes.
The economic variables are used to generate outcomes for the volume of Mortgage Loan Insurance written,
short-term changes in claim frequencies, changes in house prices and investment returns/yields.
Results of economic and business stress tests remain within the Corporation’s risk and capital tolerance levels.
Testing has also validated that CMHC’s Internal Capital Target level of 205% MCT and the Holding Capital
Target of 220% MCT meet the Capital Management Framework requirements.

Canada Mor tgage and Housing Corporation 2014 ANNUAL REPORT52
CMHC continues to focus on monitoring and proactively managing the performance of its insurance business by
enhancing its capital framework and taking steps to ensure that pricing remains appropriate for risk underwritten.
Securitization Activity Risks We guarantee the timely payment of interest and principal of NHA MBS issued by Approved Issuers and of
CMB issued by the Canada Housing Trust. Our major risk of financial loss arising from the guarantee is making
timely payments when an issuer is unable to honour its commitments and the assets backing the securities are
insufficient. Timely payment guarantee risks are mitigated by requiring participants to meet minimum standards
and robust legal and operational frameworks such as limits on volumes, eligibility requirements for participants
and mortgages to be securitized. The principal risks associated with this activity include credit risk, market risk,
liquidity risk, capital adequacy and pricing risk and reputational risk.
We are responsible for administrating the Canadian Covered Bond Framework and registry, and for approving
registered issuers and their covered bond guarantors. Covered bond issues are not guaranteed by CMHC or
the Government of Canada. The principal risk associated with this activity is reputational risk.
Credit Risk
For NHA MBS, the risk associated with issuer default is mitigated by both quality assessment and monitoring
of the issuers, and by a minimum spread requirement between the security coupon and the lowest mortgage
rate in the pool. In the event of issuer default, the spread is available to us to mitigate our guarantee risk and for
retaining third-party issuers for the continued servicing of underlying mortgages and the NHA MBS payments.
All securitized mortgages have full mortgage default insurance coverage. An upfront guarantee fee based on
the term of the security is paid to us by the Approved Issuers in exchange for the CMHC guarantee.
For the CMB program, the Issuer Trustee maintains the trust property and ensures that the Trust fulfills its
obligations, while the Trust Administrator is responsible for the day-to-day management of CHT operations.
The Trust is exposed to the credit risk of its counterparties through swap and repurchase (repo) agreements.
The swap counterparties effectively absorb all prepayment and reinvestment risk associated with the assets held
by CHT. The use of highly rated counterparties and collateralization help mitigate the risk of default.
A drop below an established credit rating triggers monthly interest retention by the CHT. Repo counterparty
credit risk is mitigated through rating requirements, transaction limits, and collateral.
The risk of default on the investments held by the Trust is managed by limiting the eligible investments to highly
rated securities including NHA MBS, obligations issued by the Government of Canada and limited amounts of
AAA equivalent short-term asset-backed commercial paper (ABCP). Additionally, none of the Trust-permitted
investments, including the NHA MBS, are permitted to have a maturity date beyond that of the related
CMB issue.
Our Securitization investment portfolio is managed with the objective of identifying, diversifying and managing
credit exposure and related risks associated with our investing activities. The objective is to protect it from
financial default or credit loss from exposures to a counterparty or issuer and to minimize expected losses
within the context of expected returns. For investment purposes, credit risk is the risk of loss arising from a
counterparty’s or an Approved Issuer’s inability to fulfil its contractual obligations. Credit risk includes default risk,
settlement risk, and downgrade risk, and encompasses both the probability of loss and the probable size of the
loss net of recoveries and collateral over appropriate time horizons.
In the context of the Securitization portfolio, there is limited credit risk associated with the portfolio’s
investments in Government of Canada securities; however, credit risk may arise in relation to repurchase
transactions that may be undertaken to meet calls on the timely payment guarantee. Exposure limits are
established by Approved Issuer or counterparty for the Securitization Activity.
Canada Mor tgage and Housing Corporation 2014 ANNUAL REPORT 53
Market Risk
Our Securitization Activity market risk is associated with the interest rate risk resulting from cash flow
mismatches between the assets and liabilities in the CMB Program.
For the NHA MBS Program, the NHA MBS guarantees provided do not expose us to market risk. The interest
rate and prepayment risk (within eligible pools) from the underlying mortgages is passed through to investors.
Only in a situation of issuer default are we exposed to temporary funding risk until a replacement servicer
is found.
For the CMB Program, CHT is exposed to interest rate risk stemming from the possibility that the rate of
interest earned on NHA MBS and eligible Trust-permitted investments will not be sufficient to meet its
interest obligations on the CMB issues. This risk is managed through interest rate swaps with approved swap
counterparties. The swaps effectively transform the interest rate risk (i.e. prepayment and reinvestment risk)
associated with the assets held by CHT into counterparty risk, which is managed through our credit policies
and controls. Thus, only in a situation of swap counterparty default and if CHT is unable to find a suitable swap
replacement, would CHT be exposed to interest rate risk.
The Securitization investment portfolio is managed to constrain the risk of loss from adverse movements
in interest rates through policy controls and limits which establish appropriate risk and return tradeoffs. The
objective of the Securitization investment portfolio is to maximize the capacity to meet liquidity needs of the
timely payment guarantee and to preserve capital through investments in Government of Canada securities.
Liquidity Risk
Both the NHA MBS and CMB programs face liquidity risk in the event of a call on the timely payment guarantee.
Potential liquidity call under the timely payment guarantee is contingent on the performance of participants and
service providers in the Securitization programs to meet their obligations. The liquidity risk is mitigated with risk
management policies, liquid assets and liquidity management processes, minimum standards for participants, the
collection of collateral, legal and operational frameworks and the collection of guarantee fees.
All investment assets held by the Corporation (the majority of which are invested in high quality government
instruments) for the purposes of its business lines can be utilized to satisfy a call on the timely payment
guarantee on an interim basis until funds can be sourced through the government or otherwise recovered.
While we maintain internal sources of liquidity that are appropriate in relation to our risk appetite, funding can
be sourced through the Department of Finance and the Crown Borrowing Program for amounts beyond our
available liquidity.
Capital Adequacy
Our Capital Management Framework for our Securitization Activity incorporates elements from OSFI’s Minimum
Capital Test (MCT) capital requirements for insurance companies for asset exposures and principles from the
Basel Committee on Banking Supervision (BCBS) for counterparty credit risk and guarantee exposures as
applicable. Capital available is equal to Securitization Retained Earnings plus Accumulated Other Comprehensive
Income minus assets with a capital requirement of 100%. We regularly review our internal capital requirement
targets and guarantee fees are reviewed periodically to ensure our pricing remains appropriate.
Reputational Risk
With our role in administering the Canadian Covered Bond Framework, there is the risk that CMHC may
be perceived as providing a direct or indirect guarantee of regulated Covered Bond Programs. The regulatory
Covered Bond Framework has been structured to minimize the potential perception that CMHC, and the
Government of Canada, provide any kind of guarantee to covered bond investors.


CONSOLIDATED FINANCIAL STATEMENTSContents
Management’s Responsibility for Financial Reporting 56
Independent Auditors' Report 57
Consolidated Balance Sheet 58
Consolidated Statement of Income and Comprehensive Income 59
Consolidated Statement of Equity of Canada 60
Consolidated Statement of Cash Flows 61
Notes to Consolidated Financial Statements 62
Note 1 - Corporate Information 62
Note 2 - Basis of Preparation and Significant Accounting Policies 63
Note 3 - Current and Future Accounting Changes 72
Note 4 - Critical Judgements in Applying Accounting Policies and Making Estimates 76
Note 5 - Fair Value Measurements 77
Note 6 - Investment Securities 85
Note 7 - Loans 86
Note 8 - Derivatives 88
Note 9 - Parliamentary Appropriations and Housing Programs Expenses 88
Note 10 - Accounts Receivable and Other Assets 90
Note 11 - Investment Property 90
Note 12 - Borrowings 91
Note 13 - Accounts Payable and Other Liabilities 92
Note 14 - Pension and Other Post-Employment Benefits 92
Note 15 - Mortgage Loan Insurance 97
Note 16 - Securitization 100
Note 17 - Income Taxes 101
Note 18 - Capital Management 102
Note 19 - Financial Instruments Income and Expenses 104
Note 20 - Structured Entities 105
Note 21 - Market Risk 106
Note 22 - Credit Risk 108
Note 23 - Liquidity Risk 111
Note 24 - Segmented Information 112
Note 25 - Related Party Transactions 115
Note 26 - Commitments and Contigent Liabilities 116
Note 27 - Operating Expenses 117
Note 28 - Current and Non-Current Assets and Liabilities 117
Note 29 - Comparative Figures 117
Canada Mor tgage and Housing Corporation 2014 ANNUAL REPORT 55
Canada Mor tgage and Housing Corporation 2014 ANNUAL REPORT56
Management’s Responsibility For Financial ReportingYear ended 31 December 2014
Management is responsible for the integrity and objectivity of the Consolidated Financial Statements and related financial information
presented in this annual report. The Consolidated Financial Statements have been prepared in accordance with International Financial
Reporting Standards and, consequently, include amounts which are based on the best estimates and judgment of Management. The
financial information contained elsewhere in this Annual Report is consistent with that in the Consolidated Financial Statements.
In carrying out its responsibilities, Management maintains appropriate financial systems and related internal controls to provide
reasonable assurance that financial information is reliable, assets are safeguarded, transactions are properly authorized and are in
accordance with the relevant legislation, by-laws of the Corporation and government directives, resources are managed efficiently and
economically, and operations are carried out effectively. The system of internal controls is supported by internal audit, which conducts
periodic audits of different aspects of the operations.
The Board of Directors, acting through the Audit Committee whose members are neither officers nor employees of the Corporation,
oversees Management's responsibilities for financial reporting and internal control systems. The Board of Directors, upon the
recommendation of the Audit Committee, has approved the Consolidated Financial Statements.
Ernst & Young LLP and the Office of the Auditor General of Canada have audited the Consolidated Financial Statements. The auditors
have full access to, and meet periodically with, the Audit Committee to discuss their audit and related matters.
Evan Siddall, BA, LL.B
President and Chief Executive Officer
Brian Naish, CPA, CA
Chief Financial Officer
26 March 2015
Canada Mor tgage and Housing Corporation 2014 ANNUAL REPORT 57
INDEPENDENT AUDITORS' REPORT
To the Minister of Employment and Social Development
Report on the Consolidated Financial Statements
We have audited the accompanying consolidated financial statements of Canada Mortgage and Housing Corporation, which comprise the consolidated balance sheet as at 31 December 2014, and the consolidated statement of income and comprehensive income, the consolidated statement of equity of Canada and the consolidated statement of cash flows for the year then ended, and a summary of significant accounting policies and other explanatory information.
Management’s Responsibility for the Consolidated Financial Statements
Management is responsible for the preparation and fair presentation of these consolidated financial statements in accordance with International Financial Reporting Standards, and for such internal control as management determines is necessary to enable the preparation of consolidated financial statements that are free from material misstatement, whether due to fraud or error.
Auditors’ Responsibility
Our responsibility is to express an opinion on these consolidated financial statements based on our audit. We conducted our audit in accordance with Canadian generally accepted auditing standards. Those standards require that we comply with ethical requirements and plan and perform the audit to obtain reasonable assurance about whether the consolidated financial statements are free from material misstatement.
An audit involves performing procedures to obtain audit evidence about the amounts and disclosures in the consolidated financial statements. The procedures selected depend on the auditor’s judgment, including the assessment of the risks of material misstatement of the consolidated financial statements, whether due to fraud or error. In making those risk assessments, the auditor considers internal control relevant to the entity’s preparation and fair presentation of the consolidated financial statements in order to design audit procedures that are appropriate in the circumstances, but not for the purpose of expressing an opinion on the effectiveness of the entity’s internal control. An audit also includes evaluating the appropriateness of accounting policies used and the reasonableness of accounting estimates made by management, as well as evaluating the overall presentation of the consolidated financial statements.
We believe that the audit evidence we have obtained is sufficient and appropriate to provide a basis for our audit opinion.
Opinion
In our opinion, the consolidated financial statements present fairly, in all material respects, the financial position of Canada Mortgage and Housing Corporation as at 31 December 2014, and its financial performance and its cash flows for the year then ended in accordance with International Financial Reporting Standards.
Report on Other Legal and Regulatory Requirements
As required by the Financial Administration Act, we report that, in our opinion, the accounting principles in International Financial Reporting Standards have been applied on a basis consistent with that of the preceding year.
Further, in our opinion, the transactions of Canada Mortgage and Housing Corporation that have come to our notice during our audit of the consolidated financial statements have, in all significant respects, been in accordance with Part X of the Financial Administration Act and regulations, the Canada Mortgage and Housing Corporation Act, the National Housing Act, the by-laws of the Canada Mortgage and Housing Corporation, and the directives issued pursuant to section 89 of the Financial Administration Act, described in Note 1 to the consolidated financial statements.
Clyde M. MacLellan, FCPA, FCA Assistant Auditor General for the Auditor General of Canada
Chartered Professional Accountants Licensed Public Accountants
26 March 2015 Ottawa, Canada
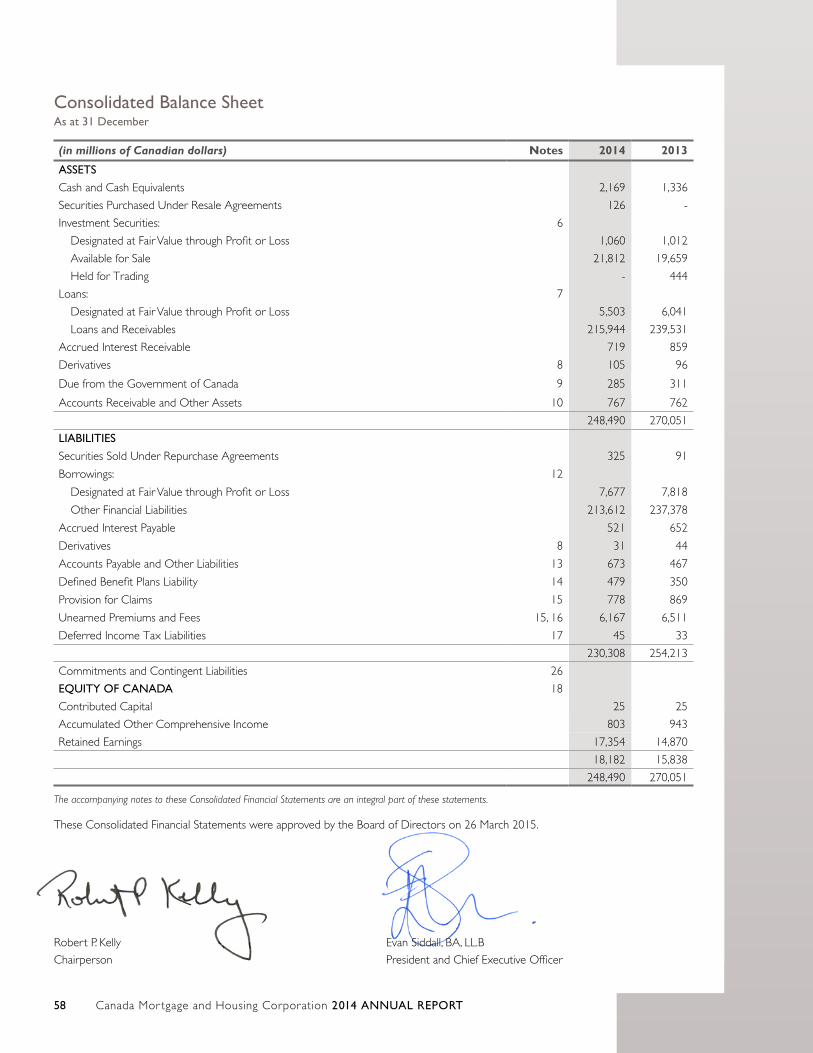
Canada Mor tgage and Housing Corporation 2014 ANNUAL REPORT58
Consolidated Balance Sheet As at 31 December
(in millions of Canadian dollars) Notes 2014 2013
ASSETS
Cash and Cash Equivalents 2,169 1,336
Securities Purchased Under Resale Agreements 126 -
Investment Securities: 6
Designated at Fair Value through Profit or Loss 1,060 1,012
Available for Sale 21,812 19,659
Held for Trading - 444
Loans: 7
Designated at Fair Value through Profit or Loss 5,503 6,041
Loans and Receivables 215,944 239,531
Accrued Interest Receivable 719 859
Derivatives 8 105 96
Due from the Government of Canada 9 285 311
Accounts Receivable and Other Assets 10 767 762
248,490 270,051
LIABILITIES
Securities Sold Under Repurchase Agreements 325 91
Borrowings: 12
Designated at Fair Value through Profit or Loss 7,677 7,818
Other Financial Liabilities 213,612 237,378
Accrued Interest Payable 521 652
Derivatives 8 31 44
Accounts Payable and Other Liabilities 13 673 467
Defined Benefit Plans Liability 14 479 350
Provision for Claims 15 778 869
Unearned Premiums and Fees 15, 16 6,167 6,511
Deferred Income Tax Liabilities 17 45 33
230,308 254,213
Commitments and Contingent Liabilities 26
EQUITY OF CANADA 18
Contributed Capital 25 25
Accumulated Other Comprehensive Income 803 943
Retained Earnings 17,354 14,870
18,182 15,838
248,490 270,051
The accompanying notes to these Consolidated Financial Statements are an integral part of these statements.
These Consolidated Financial Statements were approved by the Board of Directors on 26 March 2015.
Robert P. Kelly
Chairperson
Evan Siddall, BA, LL.B
President and Chief Executive Officer
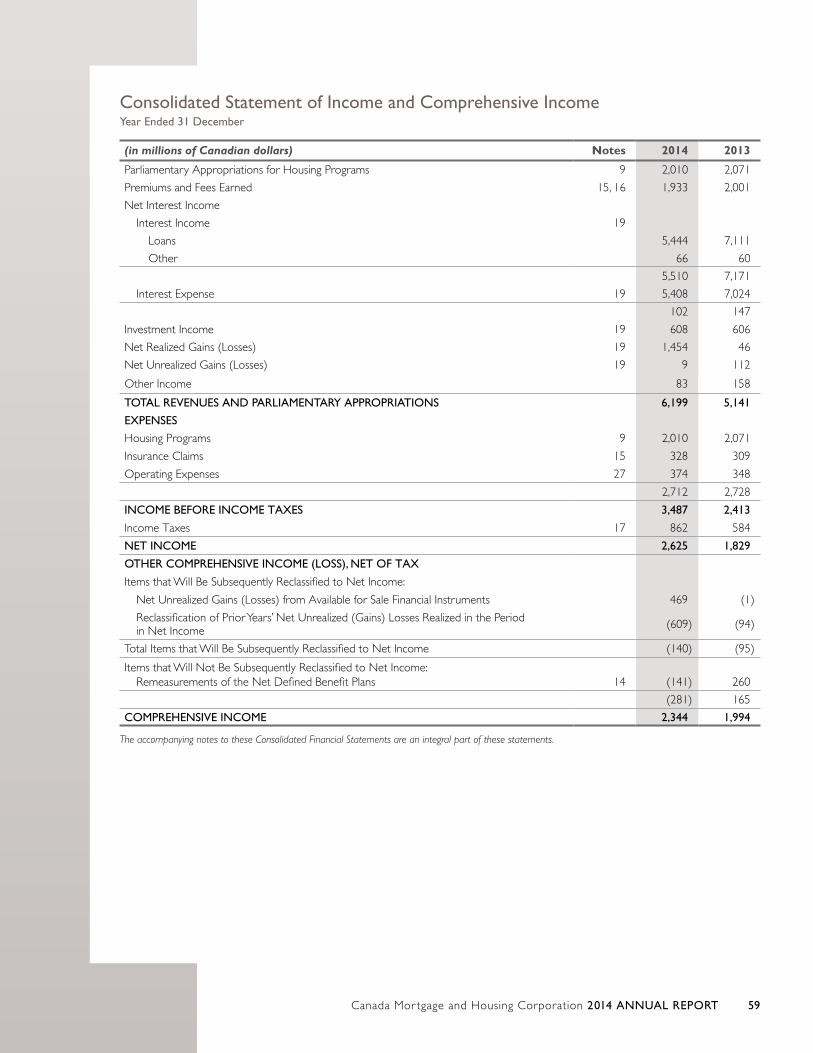
Canada Mor tgage and Housing Corporation 2014 ANNUAL REPORT 59
Consolidated Statement of Income and Comprehensive Income Year Ended 31 December
(in millions of Canadian dollars) Notes 2014 2013
Parliamentary Appropriations for Housing Programs 9 2,010 2,071
Premiums and Fees Earned 15, 16 1,933 2,001
Net Interest Income
Interest Income 19
Loans 5,444 7,111
Other 66 60
5,510 7,171
Interest Expense 19 5,408 7,024
102 147
Investment Income 19 608 606
Net Realized Gains (Losses) 19 1,454 46
Net Unrealized Gains (Losses) 19 9 112
Other Income 83 158
TOTAL REVENUES AND PARLIAMENTARY APPROPRIATIONS 6,199 5,141
EXPENSES
Housing Programs 9 2,010 2,071
Insurance Claims 15 328 309
Operating Expenses 27 374 348
2,712 2,728
INCOME BEFORE INCOME TAXES 3,487 2,413
Income Taxes 17 862 584
NET INCOME 2,625 1,829
OTHER COMPREHENSIVE INCOME (LOSS), NET OF TAX
Items that Will Be Subsequently Reclassified to Net Income:
Net Unrealized Gains (Losses) from Available for Sale Financial Instruments 469 (1)
Reclassification of Prior Years’ Net Unrealized (Gains) Losses Realized in the Period in Net Income (609) (94)
Total Items that Will Be Subsequently Reclassified to Net Income (140) (95)
Items that Will Not Be Subsequently Reclassified to Net Income:Remeasurements of the Net Defined Benefit Plans 14 (141) 260
(281) 165
COMPREHENSIVE INCOME 2,344 1,994
The accompanying notes to these Consolidated Financial Statements are an integral part of these statements.
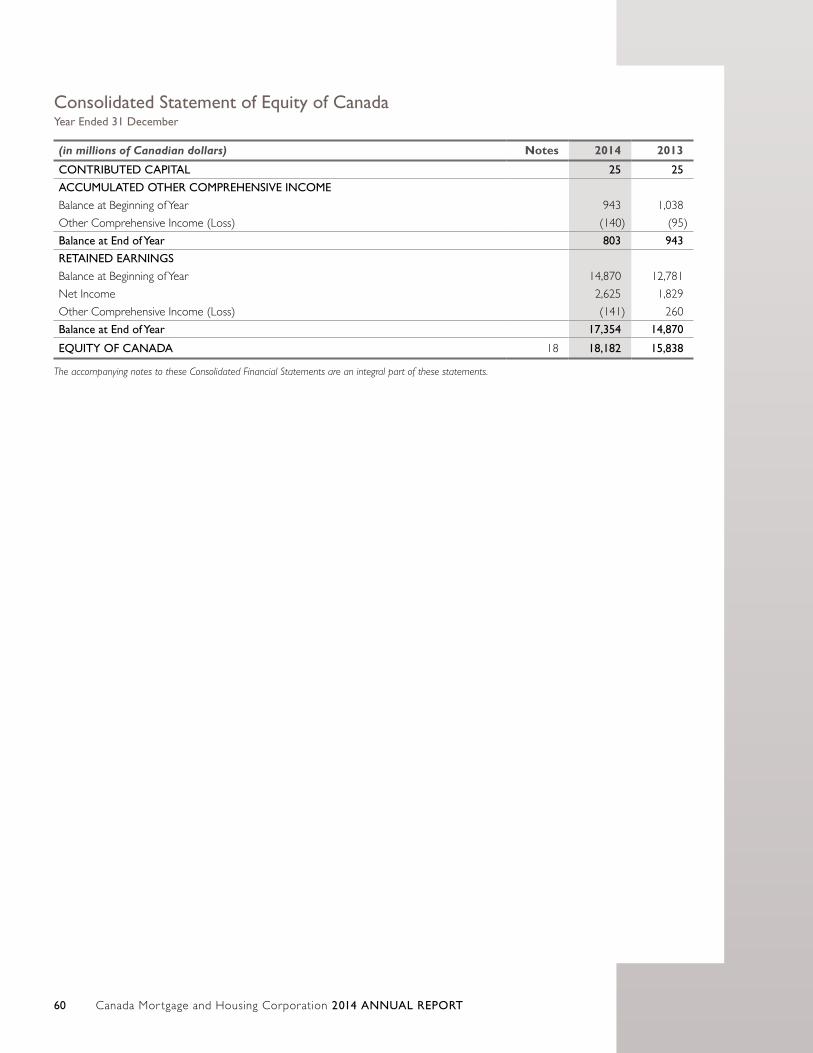
Canada Mor tgage and Housing Corporation 2014 ANNUAL REPORT60
Consolidated Statement of Equity of Canada Year Ended 31 December
(in millions of Canadian dollars) Notes 2014 2013
CONTRIBUTED CAPITAL 25 25
ACCUMULATED OTHER COMPREHENSIVE INCOME
Balance at Beginning of Year 943 1,038
Other Comprehensive Income (Loss) (140) (95)
Balance at End of Year 803 943
RETAINED EARNINGS
Balance at Beginning of Year 14,870 12,781
Net Income 2,625 1,829
Other Comprehensive Income (Loss) (141) 260
Balance at End of Year 17,354 14,870
EQUITY OF CANADA 18 18,182 15,838
The accompanying notes to these Consolidated Financial Statements are an integral part of these statements.
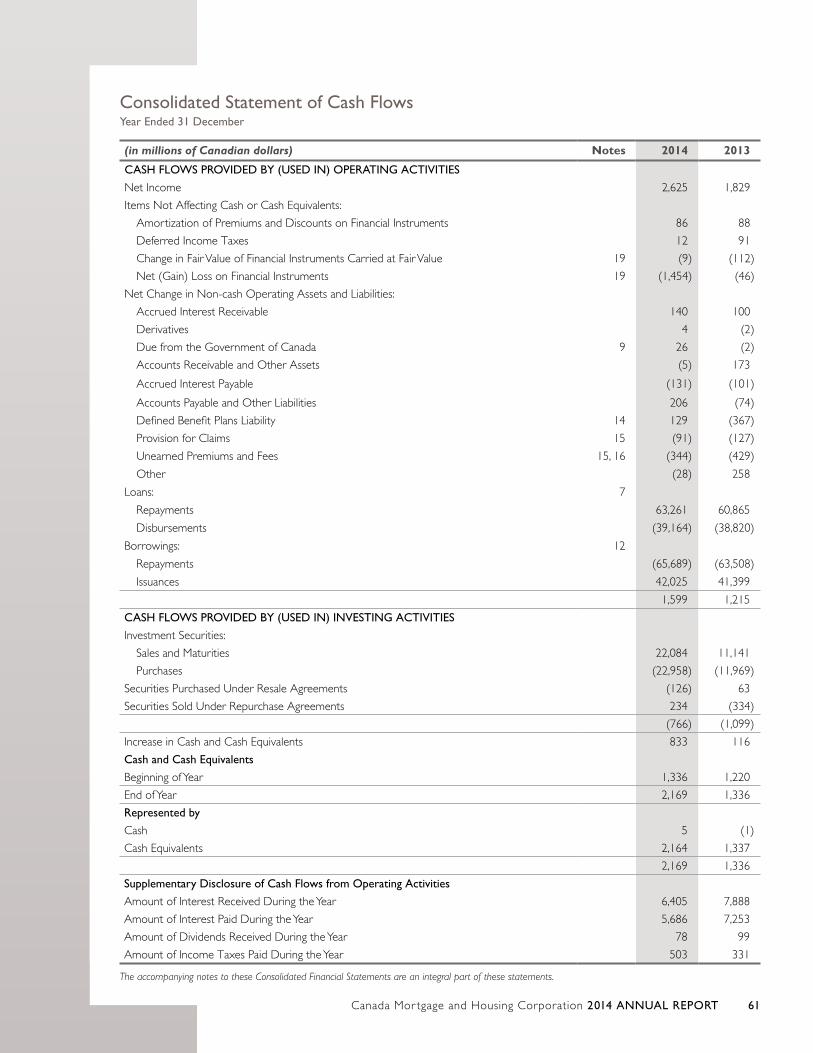
Canada Mor tgage and Housing Corporation 2014 ANNUAL REPORT 61
Consolidated Statement of Cash Flows Year Ended 31 December
(in millions of Canadian dollars) Notes 2014 2013
CASH FLOWS PROVIDED BY (USED IN) OPERATING ACTIVITIES
Net Income 2,625 1,829
Items Not Affecting Cash or Cash Equivalents:
Amortization of Premiums and Discounts on Financial Instruments 86 88
Deferred Income Taxes 12 91
Change in Fair Value of Financial Instruments Carried at Fair Value 19 (9) (112)
Net (Gain) Loss on Financial Instruments 19 (1,454) (46)
Net Change in Non-cash Operating Assets and Liabilities:
Accrued Interest Receivable 140 100
Derivatives 4 (2)
Due from the Government of Canada 9 26 (2)
Accounts Receivable and Other Assets (5) 173
Accrued Interest Payable (131) (101)
Accounts Payable and Other Liabilities 206 (74)
Defined Benefit Plans Liability 14 129 (367)
Provision for Claims 15 (91) (127)
Unearned Premiums and Fees 15, 16 (344) (429)
Other (28) 258
Loans: 7
Repayments 63,261 60,865
Disbursements (39,164) (38,820)
Borrowings: 12
Repayments (65,689) (63,508)
Issuances 42,025 41,399
1,599 1,215
CASH FLOWS PROVIDED BY (USED IN) INVESTING ACTIVITIES
Investment Securities:
Sales and Maturities 22,084 11,141
Purchases (22,958) (11,969)
Securities Purchased Under Resale Agreements (126) 63
Securities Sold Under Repurchase Agreements 234 (334)
(766) (1,099)
Increase in Cash and Cash Equivalents 833 116
Cash and Cash Equivalents
Beginning of Year 1,336 1,220
End of Year 2,169 1,336
Represented by
Cash 5 (1)
Cash Equivalents 2,164 1,337
2,169 1,336
Supplementary Disclosure of Cash Flows from Operating Activities
Amount of Interest Received During the Year 6,405 7,888
Amount of Interest Paid During the Year 5,686 7,253
Amount of Dividends Received During the Year 78 99
Amount of Income Taxes Paid During the Year 503 331
The accompanying notes to these Consolidated Financial Statements are an integral part of these statements.
Canada Mor tgage and Housing Corporation 2014 ANNUAL REPORT62
Notes to Consolidated Financial StatementsYear Ended 31 December 2014
1. Corporate Information CMHC was established in Canada as a Crown corporation in 1946 by the Canada Mortgage and Housing Corporation Act (the “CMHC
Act”) to carry out the provisions of the National Housing Act (the “NHA”). We are also subject to Part X of the Financial Administration
Act (the “FAA”) by virtue of being listed in Part 1 of Schedule III, wholly owned by the Government of Canada, and an agent Crown
corporation. The Corporation’s National Office is located at 700 Montreal Road, Ottawa, Ontario, Canada.
Within the Public Accounts of Canada, the annual Consolidated Net Income reduces the Government’s annual deficit; the Consolidated
Retained Earnings and Accumulated Other Comprehensive Income reduce the Government’s accumulated deficit.
In September 2008, CMHC, together with a number of other Crown corporations, was issued a directive (P.C. 2008-1598) pursuant to
Section 89 of the FAA requiring due consideration to the personal integrity of those to whom it lends or provides benefits. We continue
to meet the requirements of this directive. In December 2014, the Corporation was issued another directive (P.C. 2014-1380) pursuant
to Section 89 of the FAA directing CMHC to implement pension plan reforms. These are intended to ensure that pension plans of
Crown corporations provide a 50:50 current service cost-sharing ratio between employees and employer for pension contributions to
be phased in for all members by 31 December 2017. The Corporation’s implementation strategy will be outlined in its corporate plans
until commitments under this directive are fully implemented.
Our mandate, as set out in the NHA, is to promote the construction of new houses, the repair and modernization of existing houses,
and the improvement of housing and living conditions. In relation to financing for housing, the NHA’s purpose is to promote housing
affordability and choice, to facilitate access to, and competition and efficiency in the provision of, housing finance, to protect the
availability of adequate funding for housing, and generally to contribute to the well-being of the housing sector. In addition, we have
the following objectives in carrying out any activities related to mortgage loan insurance and guarantee programs and in administering
the Canadian covered bond legal framework: (a) to promote the efficient functioning and competitiveness of the housing finance
market; (b) to promote and contribute to the stability of the financial system, including the housing market; and (c) to have due regard
to the Corporation's exposure to loss. Our mandate is carried out through the following activities: Market Analysis and Research,
Assisted Housing, Mortgage Loan Insurance, Securitization and People and Processes.
Canada Mor tgage and Housing Corporation 2014 ANNUAL REPORT 63
2. Basis of Preparation and Significant Accounting Policies
Basis of Preparation
Our Consolidated Financial Statements have been prepared in accordance with International Financial Reporting Standards (IFRS)
effective as at 31 December 2014 as issued by the International Accounting Standards Board (IASB).
For purpose of these Consolidated Financial Statements, the Mortgage Loan Insurance, Securitization and Assisted Housing Activities
have been defined as reportable segments. Market Analysis and Research and People and Processes activities are cost recovered from
these three reportable segments.
They have been prepared on a going concern basis using a historical cost basis except for the following items in the Consolidated
Balance Sheet:
■■ Fair Value through Profit or Loss financial assets and liabilities are measured at fair value as are Available for Sale (AFS) financial assets;
■■ Investment Property presented within Accounts Receivable and Other Assets is measured at fair value; and
■■ Defined benefit liabilities for post-employment benefit plans are recognized at the present value of the defined benefit obligations,
offset by the fair value of plan assets.
Functional Currency
Our Consolidated Financial Statements are stated in millions of Canadian dollars, which is the functional currency.
Basis of Consolidation
These Consolidated Financial Statements include the accounts of CMHC and, as required by IFRS 10: Consolidated Financial Statements
(IFRS 10), the accounts of Canada Housing Trust (CHT) within the Securitization Activity and, until it was liquidated and terminated
in 2014, Nordea International Equity Fund (Nordea), an equity fund included in the investment portfolio within the Mortgage Loan
Insurance Activity.
Inter-segment balances and transactions have been eliminated in these Consolidated Financial Statements.
The significant accounting policies used in the preparation of our Consolidated Financial Statements are summarized below:
Financial Instruments
We classify our financial assets in the following categories: Financial Assets at Fair Value through Profit or Loss, Available for Sale, Loans
and Receivables, and Held to Maturity. Two classifications are used for financial liabilities: Financial Liabilities at Fair Value through Profit
or Loss and Other Financial Liabilities.
We further categorize financial instruments at Fair Value through Profit or Loss as either Held for Trading or Designated at Fair Value
through Profit or Loss.
The classification is determined by Management at initial recognition based on its intent and the characteristics of the financial instrument.
Canada Mor tgage and Housing Corporation 2014 ANNUAL REPORT64
Classification Accounting Treatment
Designated at Fair Value through Profit or Loss
International Accounting Standards (IAS) 39 Financial Instruments: Recognition and Measurement provides an entity the option of classifying a financial instrument as Designated at Fair Value through Profit or Loss when doing so results in more relevant information because either :
a) it eliminates or significantly reduces a measurement or recognition inconsistency that would otherwise arise from measuring the assets or liabilities or recognizing the gains or losses on them on different bases; or
b) the financial instrument belongs to a group managed and evaluated on a fair value basis in accordance with documented risk management or investment strategies and information about the group is provided internally to Key Management Personnel.
This designation is irrevocable.
Financial Instruments Designated at Fair Value through Profit or Loss are initially recognized at fair value. They are subsequently measured at fair value. Unrealized gains and losses arising from changes in fair value are recorded in Net Unrealized Gains (Losses). Gains and losses realized on disposition are recorded in Net Realized Gains (Losses). Transaction costs are expensed as incurred.
Held for Trading (HFT) HFT financial instruments are either derivatives or financial instruments acquired or incurred principally for the purpose of selling or repurchasing in the near term.
HFT financial instruments are initially recognized at fair value. They are subsequently measured at fair value. Unrealized gains and losses arising from changes in fair value are recorded in Net Unrealized Gains (Losses). Gains and losses realized on disposition are recorded in Net Realized Gains (Losses). Transaction costs are expensed as incurred.
Loans and Receivables Loans and Receivables are non-derivative financial assets with fixed or determinable payments that are not quoted in an active market except for those that Management has classified as Designated at Fair Value through Profit or Loss. Loans and Receivables are initially recognized at fair value plus transaction costs. They are subsequently measured at amortized cost using the effective interest method. When Loans and Receivables are determined to be impaired, the changes in their estimated realizable value are recorded in Net Income.
Held to Maturity (HTM) HTM financial assets are non-derivative financial assets with fixed or determinable payments and a fixed maturity, other than Loans and Receivables, that Management has the positive intention and ability to hold to maturity.
HTM financial assets are initially recognized at fair value plus transaction costs. They are subsequently measured at amortized cost using the effective interest method. When HTM financial assets are determined to be impaired, their changes in fair value are recorded in Net Realized Gains (Losses).
Available for Sale (AFS) AFS financial assets are non-derivative financial assets which are neither classified as HFT, HTM, Loans and Receivables nor Designated at Fair Value through Profit or Loss. AFS financial assets are initially recognized at fair value plus transaction costs. They are subsequently measured at fair value. Unrealized gains and losses arising from changes in fair value are recorded in Other Comprehensive Income (Loss) (OCI) until the financial asset is sold, derecognized, or determined to be impaired at which time they are transferred to Net Income and reported in Net Realized Gains (Losses).
Accumulated Other Comprehensive Income (AOCI) consists only of unrealized gains and losses for AFS financial instruments.
Other Financial Liabilities Other Financial Liabilities are non-derivative financial liabilities which have not been Designated at Fair Value.
Other Financial Liabilities are initially recognized at fair value plus transaction costs. They are subsequently measured at amortized cost using the effective interest method with interest expense recorded in Interest Expense.
Canada Mor tgage and Housing Corporation 2014 ANNUAL REPORT 65
Settlement date accounting is used for purchases and sales of financial assets and financial liabilities. Realized gains and losses on sales are
recognized on a weighted average cost basis.
Financial Instruments Designated at Fair Value through Profit or Loss
We designate certain financial instruments at Fair Value through Profit or Loss. All items Designated at Fair Value through Profit and
Loss, with the exception of certain Investment Securities held within the Mortgage Loan Insurance and Securitization Activities relate to
the Assisted Housing Activity. For certain portfolios of Loans and associated Borrowings, the Assisted Housing Activity uses Derivatives
to manage refinancing and reinvestment risks as well as mismatches between the timing of receipts from assets and payments of
liabilities. Classifying the Loans and associated Borrowings as Designated at Fair Value through Profit or Loss significantly reduces the
measurement inconsistency that would otherwise arise from measuring them at amortized cost and measuring the Derivatives at fair
value. Certain Investment Securities within the Mortgage Loan Insurance and Securitization Activities are also classified as Designated
at Fair Value as they are managed and reported to Management on a fair value basis.
Impairment of Financial Instruments
Management assesses at each Consolidated Balance Sheet date whether there is objective evidence that financial assets are impaired.
A financial asset is considered impaired and impairment losses are incurred if, and only if, there is objective evidence of impairment
as a result of one or more events that occurred after the initial recognition of the asset and that loss event(s) has an impact on the
estimated future cash flows of the asset that can be reliably estimated.
As part of its assessment, Management performs a review for any objective evidence of impairment, which includes observable data
indicating significant financial difficulty of the issuer, defaults or delinquencies in the payment of interest or principal, the disappearance
of an active market for the financial asset because of the issuer’s financial difficulties, and bankruptcy or other financial reorganization
of the issuer. Credit rating downgrades are considered in our assessment, although they alone might not represent objective evidence
of impairment.
AFS Equity Investment Securities
For equity Investment Securities classified as AFS, objective evidence of impairment also includes a significant or prolonged decline in fair
value below cost, or if significant adverse changes have taken place in the technological, market, economic or legal environment in which
the issuer operates. In determining whether a decline in fair value below cost is significant or prolonged, we apply certain quantitative
tests to the total position in each equity security supplemented with a qualitative assessment of the financial condition of the issuer.
For equity Investment Securities classified as AFS that are identified as impaired, the cumulative unrealized loss previously recorded in
OCI is reclassified from OCI and recognized as an impairment loss in Net Income for the period through Net Realized Gains (Losses).
Further declines in the fair value of impaired AFS equity instruments are recognized in Net Income, while increases in fair value are
recorded in OCI.
AFS Debt Investment Securities
For debt Investment Securities classified as AFS that are identified as impaired, the cumulative unrealized loss previously recorded in OCI
is reclassified from OCI and recognized as an impairment loss in Net Income for the period through Net Realized Gains (Losses). If the
fair value of an impaired debt instrument classified as AFS subsequently increases and the increase can be related objectively to an event
occurring after the impairment loss was recognized, the impairment loss is reversed in Net Income, with the reversal limited in amount
to the previously recognized impairment loss. Otherwise, subsequent increases in fair value are recorded in OCI.
Loans and Receivables and HTM Financial Assets
For financial assets classified as Loans and Receivables or HTM that are identified as impaired, the carrying amount is reduced to the
present value of estimated future cash flows (excluding future credit losses not yet incurred) discounted at the original effective interest
rate, with the impairment loss being recorded in Net Income for the period through Net Realized Gains (Losses). Previously recognized
impairment losses can be reversed if the loss decreases and the decrease can be related objectively to an event occurring after the
impairment was recognized. Impairment losses can be reversed to the extent that the carrying amount of the financial asset does not
exceed what the amortized cost would have been had the impairment not occurred.
Canada Mor tgage and Housing Corporation 2014 ANNUAL REPORT66
We establish an allowance for credit losses for certain loans and receivables recorded in Accounts Receivable and Other Assets from
the Mortgage Loan Insurance Activity. This allowance provides for estimated amounts that may not be recovered. Factors that are
considered in assessing the estimated realizable amount include, but are not limited to, underlying asset valuation, and any changes in
market and economic outlook. The allowance for credit losses is included as a reduction to Accounts Receivable and Other Assets and
any change in the allowance is included in Insurance Claims expense.
In certain circumstances, we may modify a loan for economic or legal reasons related to a borrower’s financial difficulties. This could
include circumstances where we may take an assignment of the insured mortgage and pay the insured lender the loan balance rather
than proceed with the acquisition or could include us making advances to a project in order to help it return to a state where the
borrower can manage their mortgage obligations.
Once a loan is modified, if management still does not expect full collection of payment under the modified terms, the loan is classified
as impaired. An impaired loan is measured at its estimated realizable value determined by discounting the expected future cash flows
at the loan’s original effective interest rate. For some loans, interest is accrued only to the extent that there is an expectation of receipt.
A loan is no longer considered impaired when all past due amounts, including interest, have been recovered and it is determined that
the principal and interest are fully collectable in accordance with the original contractual terms of the loan or revised terms.
Loans are written off, either partially or in full against the related allowance for credit losses when we judge that there is no realistic
prospect of future recovery.
Cash and Cash Equivalents
Cash and Cash Equivalents are comprised of cash and short-term highly liquid investments with a term to maturity of 98 days or less
from the date of acquisition that are readily convertible to known amounts of cash and which are subject to an insignificant risk of
change in value. Cash Equivalents funded by Securities Sold Under Repurchase Agreements are classified as HTM. Otherwise, Cash
Equivalents in the Assisted Housing Activity are Designated at Fair Value and those in the Mortgage Loan Insurance and Securitization
Activities are classified as AFS. Cash Equivalents must have a minimum credit rating of R-1 (Low) or equivalent as determined by S&P,
Moody’s or DBRS at the time they are purchased. Interest income on these investments is recorded in Interest Income for the Assisted
Housing Activity and in Investment Income for the Mortgage Loan Insurance and Securitization Activities.
Securities Purchased Under Resale Agreements and Sold Under Repurchase Agreements
Securities Purchased Under Resale Agreements (Reverse Repurchase Agreements) consist of the purchase of securities, typically
Government treasury bills or bonds, with the commitment to resell the securities to the original seller at a specified price and future
date in the near term. They are treated as collateralized transactions and are classified as Loans and Receivables.
Securities Sold Under Repurchase Agreements (Repurchase Agreements) consist of the sale of securities with the commitment to
repurchase the securities from the original buyer at a specified price and future date in the near term. They are classified as Other
Financial Liabilities. Proceeds received from these agreements are generally invested in Securities Purchased Under Resale Agreements
or Cash Equivalents for the purpose of generating additional income. These transactions are entered into simultaneously with matching
terms to maturity.
The associated interest earned and interest expenses are recorded in Net Interest Income for the Assisted Housing Activity and in
Investment Income for the Mortgage Loan Insurance and Securitization Activities.
Investment Securities
Investment Securities in the Assisted Housing Activity are comprised of fixed income securities and are Designated at Fair Value through
Profit or Loss. Investment Securities in the Mortgage Loan Insurance Activity are comprised of fixed income and equity securities and
are classified as AFS, HFT or Designated at Fair Value through Profit or Loss. The Securitization Activity holds fixed income Investment
Securities classified as AFS or Designated at Fair value through Profit and Loss. Interest income on fixed income investments is recorded
in Interest Income for the Assisted Housing Activity and in Investment Income for the Mortgage Loan Insurance and Securitization
Activities using the effective interest method. Dividend income on equity investments is recorded in Investment Income when the right
to the dividend is established.
Canada Mor tgage and Housing Corporation 2014 ANNUAL REPORT 67
Loans
Designated at Fair Value through Profit or Loss
Included in this category are economically hedged loans made under the Assisted Housing Activity, through the Lending Programs, in
support of housing programs and initiatives. These loans form part of the lending hedging structure which uses derivatives to hedge
refinancing and reinvestment risks and to hedge mismatches in cash flows.
Interest earned is recognized in Interest Income using the effective interest method.
Loans and Receivables
Insured Mortgage Purchase Program (IMPP) and the Canada Mortgage Bonds (CMB) ProgramThese loans represent amounts due from Canadian financial institutions as a result of the sale of their beneficial interest in NHA MBS
securities to CMHC. Loans arising from the IMPP have been funded by Borrowings from the Government of Canada. Loans arising from
the CMB program are funded by the issuance of Canada Mortgage Bonds. Under these arrangements, substantially all of the risks and
rewards of the NHA MBS are retained by the issuers through swap agreements with the Corporation.
The NHA MBS and investments arising from the reinvestment of principal proceeds distributed by the NHA MBS serve as collateral
to the loans and are not recognized on the Consolidated Balance Sheet. This collateral is however held in the name of the Corporation
and represents the sole source of principal repayments for the loans. The amount due from the swap counterparties represents the
interest earned on the loans and is recognized in Interest Income.
Lending ProgramsIncluded in this category are loans made under the Assisted Housing Activity, through the Lending Programs which are not economically
hedged. Payments on these loans are fixed and the loans do not have quoted prices in an active market. Where loans contain
forgiveness clauses, they are recorded net of the forgiveness, and that forgiveness is reimbursed through parliamentary appropriations
when the loans are advanced.
Interest rate losses resulting from loans containing interest rate clauses that are lower than the interest cost on the related borrowings
are reimbursed through parliamentary appropriations. These loans were issued from 1946 to 1984 through provisions of the National
Housing Act. Continued receipt of appropriations going forward is assumed. If the appropriations are not received in a future year, the
valuation of these loans would change.
Interest earned is recognized in Interest Income using the effective interest method.
Derivatives
We enter into derivatives such as interest rate swaps, interest rate futures and equity index futures in order to manage our exposure
to market risks. Derivatives are not used for speculative purposes.
Derivatives are classified as HFT as they have not been designated as eligible hedges for accounting purposes and are carried at fair
value on the Consolidated Balance Sheet. Derivatives with a positive fair value are reported as assets, while derivatives with a negative
fair value are reported as liabilities.
We do not have derivatives embedded in other financial instruments (host contracts) which require separation.
The net of interest income and expense is recorded in Interest Income as earned and incurred.
Parliamentary Appropriations and Housing Programs Expenses
Under the Assisted Housing Activity, we receive parliamentary appropriations to fund housing programs and initiatives.
Parliamentary Appropriations
Parliamentary appropriations are recognized as revenue in the fiscal year for which the appropriations were approved and over the
same period as the related Housing Programs expenses.
Canada Mor tgage and Housing Corporation 2014 ANNUAL REPORT68
Housing Programs Expenses
Housing Programs expenses, including operating costs incurred to administer the Housing Programs, are recorded on an accrual basis
not exceeding the maximum parliamentary appropriations voted by Parliament.
Those expenses incurred but not yet reimbursed are recorded in the Consolidated Balance Sheet as Due from the Government
of Canada.
Non-current Assets Held for Sale
Real estate acquired by the Mortgage Loan Insurance Activity through loan default is classified as Non-current Assets Held for Sale
when its carrying amount will be recovered principally through a sale transaction. The criteria for Held for Sale classification includes
Management’s commitment to a plan to sell the selected assets and the expectation that such a sale will be completed within a
12 month period. Events or circumstances beyond our control may extend the period to complete the sale beyond one year. Such
assets continue to be classified as Held for Sale as Management remains committed to its plan to sell the asset. Non-current Assets
Held for Sale are measured at the lower of their carrying amount and their fair value less cost to sell and are included in Accounts
Receivables and Other Assets. Impairment losses and any subsequent reversals are recognized in Insurance Claims expense in the
period in which they occur. Non-current Assets Held for Sale are not depreciated.
Investment Property
Investment properties, which are included in Accounts Receivable and Other Assets, are properties held to earn rental income or for
capital appreciation, or both. Investment properties are initially recognized at cost plus transaction costs. Subsequent to initial recognition,
they are measured at fair value. Gains or losses arising from changes in fair value are recognized in Other Income in the period in which
they arise. Investment property rental income and expenses are recorded in Other Income. For certain investment properties under the
Assisted Housing Activity, expenses are recoverable from the Minister and these are recorded in Housing Programs appropriations.
Borrowings
Designated at Fair Value through Profit or Loss
Capital Market Borrowings Borrowings from the Capital Markets represent borrowings incurred between 1993 and April 2008 to fund Loans in the Assisted
Housing Activity. They are Designated at Fair Value through Profit or Loss and form part of the lending hedging structure.
Borrowings from the Government of CanadaSince April 2008, the Assisted Housing Activity has been borrowing under the terms of the Crown Borrowing Agreement. These
borrowings are incurred to fund Loans in the Lending Programs that are Designated at Fair Value through Profit or Loss and form part
of the lending hedging structure.
Other Financial Liabilities
Canada Mortgage BondsCMB, which we issue and guarantee, are interest-bearing bullet bonds. Coupon interest payments are made semi-annually for fixed
rate CMB and quarterly for floating rate CMB. Principal repayments on the bonds are made at the end of the term. CMB are classified
as Other Financial Liabilities. The Approved MBS Sellers reimburse CHT for the cost of arranging financing, including the fees paid to
CMHC as Guarantor and Financial Services Advisor, underwriters and others for the distribution of CMB. These reimbursements are
recognized in Other Income on the same basis as the related expenses.
We may purchase and resell CMB in the market for investment purposes. Purchases are treated as retirements of debt with the
difference between the purchase price and the carrying value of the CMB being recognized as a gain or loss in Net Realized Gains
(Losses). Subsequent sales are treated as re-issuance of the debt with gains and losses deferred and amortized over the remaining life
of the CMB sold.
Borrowings from the Government of CanadaOther Government of Canada Borrowings represents borrowings incurred to fund loans in the Assisted Housing Activity that are not
economically hedged and that have been classified as Loans and Receivable. These borrowings also include borrowings to fund the loans
made under the IMPP in the Securitization Activity.
Canada Mor tgage and Housing Corporation 2014 ANNUAL REPORT 69
For all Borrowings, interest expenses are recognized in Interest Expense using the effective interest method.
Pension and Other Post-employment Benefits
We have a number of benefit arrangements which provide pension and other post-employment benefits to eligible employees.
These include a federally regulated pension plan (the Pension Plan), an unregistered supplemental pension plan (the Supplemental
Plan) and other non-pension post-employment defined benefits consisting mainly of severance pay and life and medical insurance.
The Supplemental Plan offers benefits in excess of statutory limits as defined under the Income Tax Act.
Both the Pension Plan and the Supplemental Plan have two components: a defined benefit component and a defined contribution
component. Employees who joined the Corporation prior to 4 April 2013 are eligible for the defined benefit component of both
the Pension and the Supplemental Plan. Employees who joined the Corporation on or after that date are eligible for the defined
contribution component of the Pension and Supplemental Plans.
The Pension Plan is subject to the federal Pension Benefits Standards Act, 1985 (PBSA) and its regulations and to the Income Tax Act
(ITA). The Pension Plan is registered with the Office of the Superintendent of Financial Institutions (OSFI) and the Canada Revenue
Agency (CRA).
Defined Benefit Plans
The defined benefit plans include the defined benefit component of the Pension Plan and the Supplemental Plan as well as the other
non-pension post-employment defined benefits. The benefits available under both the defined benefit component of the Pension Plan
and the Supplemental Plan are based on length of service and average earnings over the best five-year period.
The net defined benefit liability recognized is the present value of the obligations under the defined benefit plans less the assets of those
plans. The defined benefit plan assets are limited to the present value of any economic benefits available in the form of reductions in
future contributions to these plans.
Net benefit costs of the plans are the current service costs, the net of the interest cost on the defined benefit obligation, the interest
income on the plan assets and gain or loss on curtailment. They are included in Operating Expenses on the Consolidated Statement
of Income and Comprehensive Income.
Remeasurements of the defined benefit plans include actuarial gains and losses and changes in the return on plan assets (excluding
net interest) and are recognized in Other Comprehensive Income (Loss) as incurred and then flow into Retained Earnings on the
Consolidated Balance Sheet. As such, they are not reclassified to profit or loss in subsequent periods.
Defined Contribution Plans
The defined contribution plans include the defined contribution component of the Pension Plan and the Supplemental Plan. Employer
contributions to the plans are recognized as an expense as employees render service in exchange for such contributions.
Mortgage Loan Insurance
Product Classification
We classify our mortgage loan insurance as an insurance contract as the lender faces uncertainty with regard to potential borrower
default on a mortgage and therefore pays a premium to transfer the risk to us. If the borrower defaults, the claim is significantly larger
than the actual premium. Such contracts remain insurance contracts until the underlying insured mortgages are fully repaid. They are
measured in accordance with IFRS 4 Insurance Contracts.
Premium Revenue
Mortgage loan insurance premiums are due at the inception of the mortgage being insured at which time they are deferred (unearned
premiums) and recognized as income over the period covered by the insurance contract using factors determined by the Appointed
Actuary. These factors reflect the long-term pattern for default risk of the underlying mortgages. Mortgage loan insurance premiums
related insurance on loans made under various social housing programs as well as loans financed by Index Linked Mortgages (ILM)
under the Federal Co-operative Housing Program are recognized immediately in the year in which they are received.
Canada Mor tgage and Housing Corporation 2014 ANNUAL REPORT70
Unearned Premiums
Unearned Premiums represent the unamortized portion of the policy premiums at the Consolidated Balance Sheet date and therefore
relate to claims that may occur from the Consolidated Balance Sheet date to the termination of the insurance policies. Management
and the Appointed Actuary on a quarterly and annual basis, compare the unearned premiums to an estimate of total future claims
on a discounted basis to ensure the amount is sufficient. Should such amount not be sufficient, a provision for premium deficiency
is recorded.
Provision for Claims
The Provision for Claims represents an estimate for expected claims and the related settlement expenses, net of the related expected
property sale proceeds, for defaults from the mortgage insurance business that have occurred on or before the Consolidated Balance
Sheet date. The provision takes into consideration the estimate of the expected ultimate cost of claims reported but not paid and
claims Incurred But Not Reported (IBNR) at the Consolidated Balance Sheet date, the time value of money and, in accordance with
accepted actuarial practice, includes an explicit provision for adverse deviation. The estimate of IBNR is generally subject to a greater
degree of uncertainty than that for reported claims.
The process of determining the provision necessarily involves risks that the actual results will deviate, perhaps significantly, from the
estimates made.
The change in the estimated Provision for Claims is recorded in Insurance Claims on the Consolidated Statement of Income and
Comprehensive Income in the year in which they occur.
The Provision for Claims also includes a provision amount relating to insurance on loans made under various social housing programs
as well as loans financed by ILM under the Federal Co-operative Housing Program. This provision is based on the assumptions that the
cumulative premiums received and related investment income will be sufficient to meet future claim payouts. Due to the uniqueness of
these programs, their provision is established as the fund balance plus a margin for adverse deviation.
Insurance Policy Liability Adequacy
Liability adequacy tests are performed quarterly by Management and annually as part of the Actuarial Valuation to ensure the adequacy of
insurance policy liabilities net of Deferred Acquisition Costs (DAC) assets with respect to the Provision for Claims and Unearned Premiums.
Current best estimates of future contractual cash flows, claims handling and administration costs, and investment returns from the assets
backing the liabilities are taken into account in the tests. Where a deficiency is highlighted by the test, DAC assets are written off first, and
insurance liabilities are increased once the DAC assets are written off in full. Any premium deficiency is immediately recognized in Net
Income. The liability adequacy test for the Corporation has identified that no provision for premium deficiency is required.
Fees
Application fees designed to recover part or all acquisition costs associated with issuing mortgage loan insurance policies are deferred
and amortized on the same basis as the related premiums.
Deferred Acquisition Costs
A portion of acquisition costs relating to the Unearned Premiums is deferred and amortized over the estimated lives of the relevant
contracts. The deferred acquisition costs are included in Accounts Receivable and Other Assets.
Net Estimated Borrower Recoveries
We estimate the net borrower recoveries related to claims paid based on historical data in accordance with Canadian accepted
actuarial practice. Changes to the estimated borrower recovery balance are recorded in Insurance Claims expense in the year in
which they are determined. Net Estimated Borrower Recoveries are included in Accounts Receivable and Other Assets.
Guarantee Fees
We pay guarantee fees to the Receiver General to compensate for mortgage insurance risks. These fees are deferred and recognized
as expense over the period covered by the insurance contract.
Canada Mor tgage and Housing Corporation 2014 ANNUAL REPORT 71
Timely Payment Guarantees
Classification
Financial guarantee contracts are defined as those that require the issuer to make specified payments to reimburse the holder for a loss
it incurs because a specified debtor fails to make payment when due. We classify the timely payment guarantee for NHA MBS and CMB
as a financial guarantee contract. Such contracts remain financial guarantee contracts until all rights and obligations are extinguished or
expire and are presented in accordance with IAS 39 Financial Instruments: Recognition and Measurement.
Recognition and Measurement
Timely payment guarantee fees are initially recognized in Unearned Premiums and Fees at fair value (the premium received) plus
transaction costs. Subsequently, they are measured at the amount initially recognized less the amortization of guarantee fee revenue.
Should the estimated amount required to settle the timely payment guarantee obligations exceed this amount, a provision is recognized.
Application and Compensatory fees are recognized as revenues in the period where the related services are rendered. Direct costs
associated with issuing timely payment guarantees are recognized in Operating Expenses as incurred.
Income Taxes
CMHC is a prescribed federal Crown corporation under Reg. 7100 of the Income Tax Act (ITA) and is subject to federal income tax as
a prescribed corporation for purposes of subsection 27(2) of the ITA. We are not subject to provincial income tax. CHT is subject to
federal and provincial income taxes on the amount of taxable income for the period and is permitted a deduction for all amounts paid
or payable to CHT’s beneficiaries in determining income for tax purposes. As all taxable income was distributed to the beneficiaries, no
provision for income taxes has been reflected for CHT in these Consolidated Financial Statements.
We use the liability method of accounting for income taxes. Under this method, Deferred Income Tax Assets and Liabilities are
recognized based on the estimated tax effect of temporary differences between the carrying value of assets and liabilities on the
financial statements and their respective tax bases. The Corporation uses substantively enacted income tax rates at the Consolidated
Balance Sheet date that are expected to be in
effect when the asset is realized or the liability is settled. The carrying amount of Deferred Income Tax Assets is reviewed at each
reporting date and reduced to the extent that it is no longer probable that sufficient taxable profit will be available to allow all or part
of the Deferred Income Tax Asset to be utilized.
Related Party Transactions
Except for funds borrowed from the Government of Canada under the Crown Borrowing Program, related party transactions are
made on terms equivalent to those that prevail in arm’s length transactions. Funds borrowed under the Crown Borrowing Program
are at below market rates thereby allowing us to make loans at below market rates which lowers the government’s cost to subsidize
social housing.
Contingent Liabilities
Contingent liabilities are possible obligations whose existence will be confirmed only by uncertain future events or present obligations
where the transfer of economic benefit is uncertain or cannot be reliably measured.
Foreign Currency Translation
Monetary assets and liabilities denominated in foreign currencies are translated into Canadian dollars at exchange rates prevailing at the
Consolidated Balance Sheet date. Exchange gains and losses resulting from the translation of foreign denominated balances are included
in Net Unrealized Gains (Losses). Purchases and sales of foreign securities and the related income are translated into Canadian dollars at
the exchange rates prevailing on the respective dates of the transactions.
Canada Mor tgage and Housing Corporation 2014 ANNUAL REPORT72
3. Current and Future Accounting Changes
Current Accounting Changes
IAS 32 Financial Instruments: Presentation
On 16 December 2011, the IASB issued amendments to IAS 32 Financial Instruments: Presentation that came effective 1 January 2014 to
clarify the application of offsetting requirements for financial assets and financial liabilities. These amendments had no material impact on
our Consolidated Financial Statements.
IAS 36 Impairment of Assets
On 29 May 2013, the IASB issued amendments to IAS 36 Impairments of Assets that came effective 1 January 2014 in conjunction with
the issuance of IFRS 13 Fair Value Measurement. IAS 36 was amended to remove fair value guidance from the standard and ensure
consistency with IFRS 13’s fair value framework. These amendments had no material impact on our Consolidated Financial Statements.
IFRIC 21 Levies
On 20 May 2013, the IASB issued an IFRS Interpretations Committee (IFRIC) Interpretation, IFRIC 21 Levies, to clarify when an entity should
recognize a liability to pay a levy. This interpretation came effective 1 January 2014 and had no material impact on our Consolidated
Financial Statements.
Change in Reportable Segments
A new President and CEO was appointed effective 1 January 2014. In March 2014, Senior Management announced our new mission
which defines our focus as an organization and mandate as a Crown corporation. Arising from these changes, we performed a general
review of our reportable segments and made aggregations which better align with the delivery of our new mission. The Securitization
Activity and CHT were aggregated in the Securitization Activity and the Housing Programs and Lending Activities now form the
Assisted Housing Activity. Our reasons for aggregations are:
■■ The similar nature of the products and services;
■■ The similar nature of the production processes;
■■ The similar type or class of customer for the products and services;
■■ The similar methods used to distribute the products or provide the services; and
■■ The similar nature of the regulatory environment.
Aggregation of the Securitization Activity and CHT
They both support our objective of ensuring adequate supply of funds for mortgage lending through mortgage securitization. Through the
CMB program in its entirety (including the guarantee by Securitization), we contribute to the stability of the financial system by allowing
lenders to access funds for residential mortgage lending. Both segments’ business is generated by market demand for NHA MBS. The higher
the demand for NHA MBS, the greater the issuances of CMB by CHT and new securities guaranteed by Securitization.
There are many similarities in the nature of the production processes, customers and methods of distribution. CMB are available to both
institutional investors and retail investors and can be bought through investment dealers, banks, trust companies, and other types of
financial institutions. The guarantee takes effect at issuance.
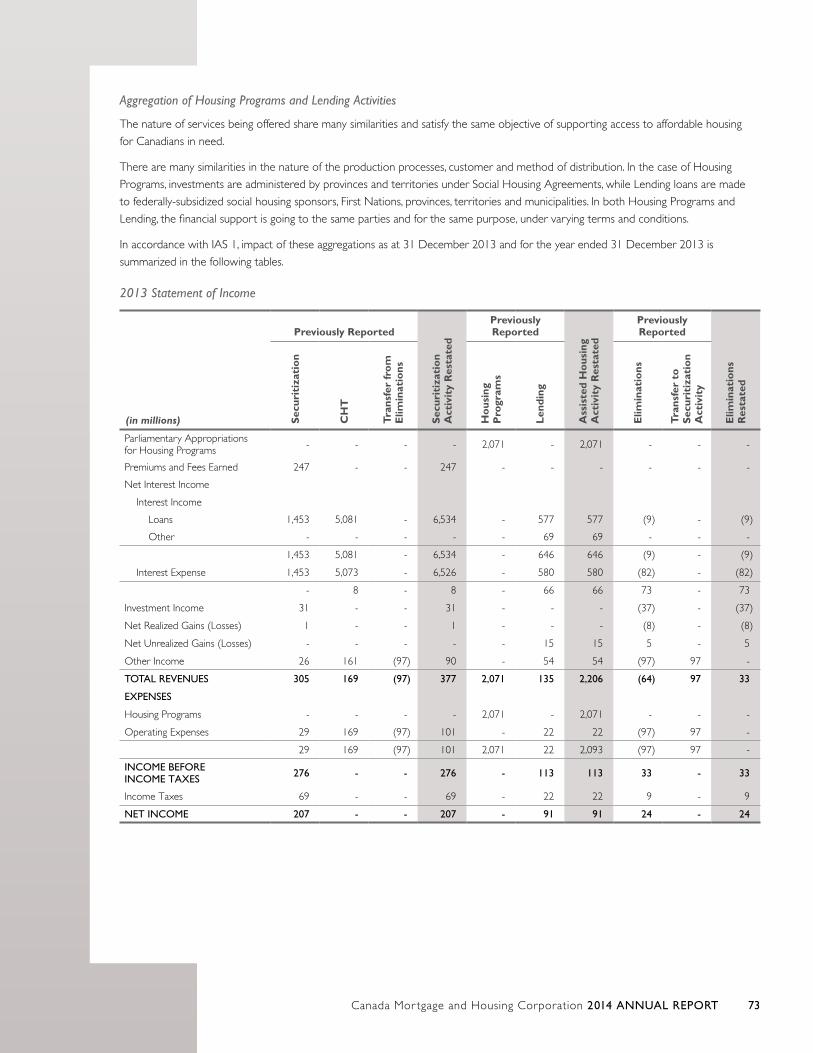
Canada Mor tgage and Housing Corporation 2014 ANNUAL REPORT 73
Aggregation of Housing Programs and Lending Activities
The nature of services being offered share many similarities and satisfy the same objective of supporting access to affordable housing
for Canadians in need.
There are many similarities in the nature of the production processes, customer and method of distribution. In the case of Housing
Programs, investments are administered by provinces and territories under Social Housing Agreements, while Lending loans are made
to federally-subsidized social housing sponsors, First Nations, provinces, territories and municipalities. In both Housing Programs and
Lending, the financial support is going to the same parties and for the same purpose, under varying terms and conditions.
In accordance with IAS 1, impact of these aggregations as at 31 December 2013 and for the year ended 31 December 2013 is
summarized in the following tables.
2013 Statement of Income
(in millions)
Previously Reported
Sec
urit
izat
ion
Act
ivit
y R
esta
ted
Previously Reported
Ass
iste
d H
ous
ing
Act
ivit
y R
esta
ted
Previously Reported
Elim
inat
ions
R
esta
ted
Sec
urit
izat
ion
CH
T
Tra
nsfe
r fr
om
E
limin
atio
ns
Ho
usin
g P
rogr
ams
Len
ding
Elim
inat
ions
Tra
nsfe
r to
S
ecur
itiz
atio
n A
ctiv
ity
Parliamentary Appropriations for Housing Programs - - - - 2,071 - 2,071 - - -
Premiums and Fees Earned 247 - - 247 - - - - - -
Net Interest Income
Interest Income
Loans 1,453 5,081 - 6,534 - 577 577 (9) - (9)
Other - - - - - 69 69 - - -
1,453 5,081 - 6,534 - 646 646 (9) - (9)
Interest Expense 1,453 5,073 - 6,526 - 580 580 (82) - (82)
- 8 - 8 - 66 66 73 - 73
Investment Income 31 - - 31 - - - (37) - (37)
Net Realized Gains (Losses) 1 - - 1 - - - (8) - (8)
Net Unrealized Gains (Losses) - - - - - 15 15 5 - 5
Other Income 26 161 (97) 90 - 54 54 (97) 97 -
TOTAL REVENUES 305 169 (97) 377 2,071 135 2,206 (64) 97 33
EXPENSES
Housing Programs - - - - 2,071 - 2,071 - - -
Operating Expenses 29 169 (97) 101 - 22 22 (97) 97 -
29 169 (97) 101 2,071 22 2,093 (97) 97 -
INCOME BEFORE INCOME TAXES 276 - - 276 - 113 113 33 - 33
Income Taxes 69 - - 69 - 22 22 9 - 9
NET INCOME 207 - - 207 - 91 91 24 - 24
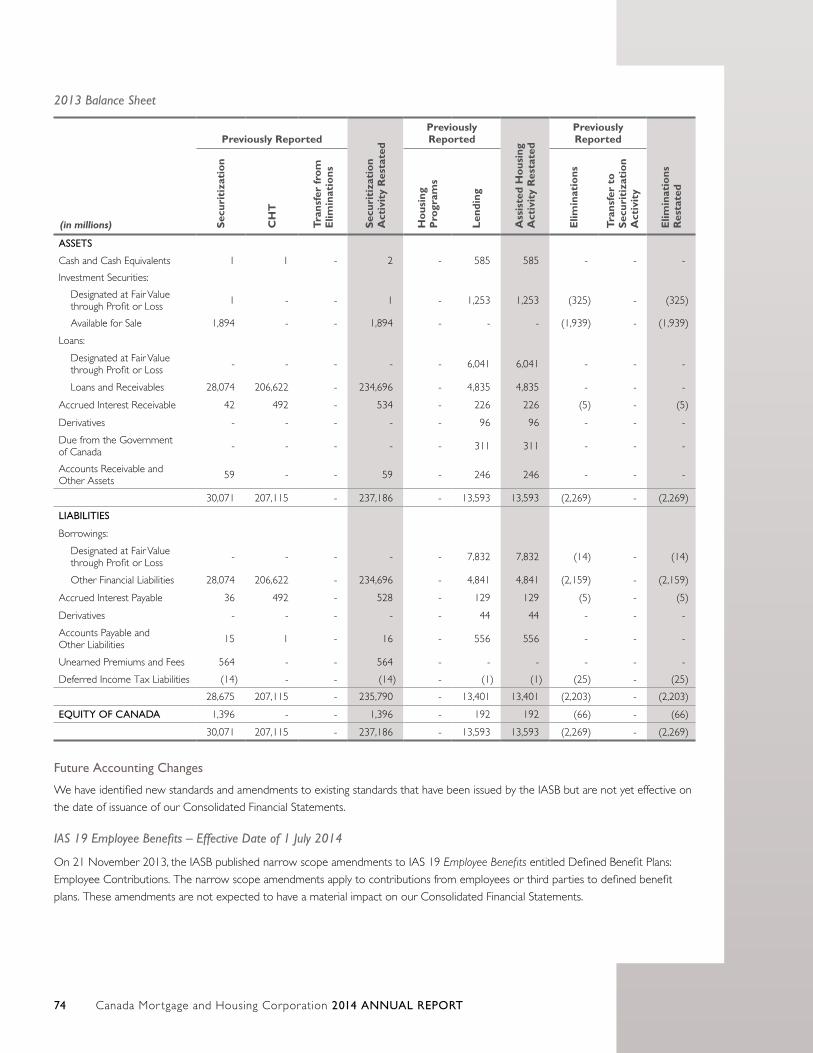
Canada Mor tgage and Housing Corporation 2014 ANNUAL REPORT74
2013 Balance Sheet
(in millions)
Previously Reported
Sec
urit
izat
ion
Act
ivit
y R
esta
ted
Previously Reported
Ass
iste
d H
ous
ing
Act
ivit
y R
esta
ted
Previously Reported
Elim
inat
ions
R
esta
ted
Sec
urit
izat
ion
CH
T
Tra
nsfe
r fr
om
E
limin
atio
ns
Ho
usin
g P
rogr
ams
Len
ding
Elim
inat
ions
Tra
nsfe
r to
S
ecur
itiz
atio
n A
ctiv
ity
ASSETS
Cash and Cash Equivalents 1 1 - 2 - 585 585 - - -
Investment Securities:
Designated at Fair Value through Profit or Loss 1 - - 1 - 1,253 1,253 (325) - (325)
Available for Sale 1,894 - - 1,894 - - - (1,939) - (1,939)
Loans:
Designated at Fair Value through Profit or Loss - - - - - 6,041 6,041 - - -
Loans and Receivables 28,074 206,622 - 234,696 - 4,835 4,835 - - -
Accrued Interest Receivable 42 492 - 534 - 226 226 (5) - (5)
Derivatives - - - - - 96 96 - - -
Due from the Government of Canada - - - - - 311 311 - - -
Accounts Receivable and Other Assets 59 - - 59 - 246 246 - - -
30,071 207,115 - 237,186 - 13,593 13,593 (2,269) - (2,269)
LIABILITIES
Borrowings:
Designated at Fair Value through Profit or Loss - - - - - 7,832 7,832 (14) - (14)
Other Financial Liabilities 28,074 206,622 - 234,696 - 4,841 4,841 (2,159) - (2,159)
Accrued Interest Payable 36 492 - 528 - 129 129 (5) - (5)
Derivatives - - - - - 44 44 - - -
Accounts Payable and Other Liabilities 15 1 - 16 - 556 556 - - -
Unearned Premiums and Fees 564 - - 564 - - - - - -
Deferred Income Tax Liabilities (14) - - (14) - (1) (1) (25) - (25)
28,675 207,115 - 235,790 - 13,401 13,401 (2,203) - (2,203)
EQUITY OF CANADA 1,396 - - 1,396 - 192 192 (66) - (66)
30,071 207,115 - 237,186 - 13,593 13,593 (2,269) - (2,269)
Future Accounting Changes
We have identified new standards and amendments to existing standards that have been issued by the IASB but are not yet effective on
the date of issuance of our Consolidated Financial Statements.
IAS 19 Employee Benefits – Effective Date of 1 July 2014
On 21 November 2013, the IASB published narrow scope amendments to IAS 19 Employee Benefits entitled Defined Benefit Plans:
Employee Contributions. The narrow scope amendments apply to contributions from employees or third parties to defined benefit
plans. These amendments are not expected to have a material impact on our Consolidated Financial Statements.
Canada Mor tgage and Housing Corporation 2014 ANNUAL REPORT 75
IAS 16 Property, Plant and Equipment and IAS 38 Intangible Assets – Effective Date of 1 January 2016
On 12 May 2014, the IASB issued amendments to IAS 16 Property, Plant and Equipment and IAS 38 Intangible Assets that clarify the
acceptable methods of depreciation and amortization. Earlier application is permitted. These amendments are not expected to have
a material impact on our Consolidated Financial Statements.
IAS 1 Presentation of Financial Statements – Effective Date of 1 January 2016
On 18 December 2014, the IASB issued amendments to IAS 1 Presentation of Financial Statements that further encourage companies
to apply professional judgment in determining what information to disclose in their financial statements. Earlier application is permitted.
These amendments are not expected to have a material impact on our Consolidated Financial Statements.
IFRS 15 Revenue from Contracts with Customers – Effective Date of 1 January 2017
On 28 May 2014, the IASB issued IFRS 15 Revenue from Contracts with Customers that will replace IAS 18 Revenue, IAS 11 Construction
Contracts and related Interpretations. This standard sets out the requirements for recognizing revenue that apply to all contracts with
customers (except for contracts that are within the scope of the standards on leases, insurance contracts and financial instruments).
IFRS 15 establishes a comprehensive 5 step framework for determining when to recognize revenue and how much revenue to
recognize. The core principle of the framework is that a company should recognize revenue when a performance obligation is satisfied
to transfer the promised goods or services to the customer in an amount that reflects the consideration to which the company expects
to be entitled in exchange for those goods or services. This performance obligation may be satisfied at a point in time or over time.
Earlier application of IFRS 15 is permitted. We have not yet determined the full impact of this new standard on our Consolidated
Financial Statements.
IFRS 9 Financial Instruments – Effective Date of 1 January 2018
On 24 July 2014, the IASB issued the final version of IFRS 9 Financial Instruments, bringing together the classification and measurement,
impairment and hedge accounting phases of the IASB’s project to replace IAS 39 Financial Instruments: Recognition and Measurement.
IFRS 9 introduces a principle-based approach to classification and measurement of financial assets based on an entity’s business
model for managing the financial assets and the contractual cash flow characteristics of those assets. Financial liability classification and
measurement requirements of IAS 39 are carried forward to IFRS 9 with the exception of changes in fair value of financial liabilities
designated at fair value through profit or loss. Changes in fair value of such liabilities due to an entity’s own credit risk are recognized
in other comprehensive income unless doing so would create an accounting mismatch, in which case, the entire fair value change is
presented in profit or loss.
IFRS 9 introduces a new impairment model to replace the existing IAS 39 impairment requirements in order to provide more useful
information about an entity’s expected credit losses on financial instruments.
IFRS 9 incorporates new hedge accounting requirements which better aligns an entity's accounting treatment with risk management
activities and improves disclosure requirements. Accounting for macro hedging activities is not included in the new model and will be
addressed at a later date.
Earlier application of IFRS 9 is permitted. We have not yet determined the full impact of this new standard on our Consolidated Financial
Statements but will review it in conjunction with any possible changes to IFRS 4 Insurance Contracts standard.
Canada Mor tgage and Housing Corporation 2014 ANNUAL REPORT76
4. Critical Judgments in Applying Accounting Policies and Making Estimates
Judgments in Applying Accounting Policies
In the process of applying the accounting policies, Management is required to make various judgments, apart from those involving
estimations, that can significantly affect the amounts recognized in the Consolidated Financial Statements. The judgments having the
most significant effect on the amounts recognized in our Consolidated Financial Statements are:
■■ Consolidation – significant judgments are applied in the assessment of whether the substance of the relationship between CMHC
and CHT indicates that, as per IFRS 10, CMHC controls CHT. CMHC guarantees the timely payment of principal and interest on the
Canada Mortgage Bonds, and chooses when to provide that guarantee. CHT cannot undertake new business (i.e. issue new bonds)
without the benefit of a guarantee, and its only available guarantor at present is CMHC. Within that context, CMHC has direct
influence on the activities of CHT and can use this influence to manage its exposure to CHT;
■■ Derecognition – in assessing whether transfers of NHA MBS from Issuers to the Corporation under the CMB program and IMPP
qualify for derecognition, significant judgment is applied in determining whether substantially all the risks and rewards of ownership
of the NHA MBS have been transferred. Per IAS 39 Financial Instruments – Recognition and Measurement requirements, we have
determined that the sellers of NHA MBS to the Corporation failed the derecognition criteria as they retain the risk and rewards of
the NHA MBS through swap agreements. As a result, we do not recognize the underlying NHA MBS on the Consolidated Balance
Sheet but rather account for the transfer as a loan; and
■■ Impairment of Available for Sale Financial Instruments – significant judgment is applied in assessing if there is objective evidence of
impairment, including whether declines in the fair value of AFS equity instruments below cost are significant and/or prolonged.
Use of Estimates and Assumptions
The preparation of our Consolidated Financial Statements requires Management to make estimates and assumptions. These estimates
and assumptions affect the reported amounts of assets, liabilities, comprehensive income and related disclosures. Key areas where
Management has made estimates and assumptions include those related to Provision for Claims, Unearned Premiums, Fair Value
of Financial Instruments, and Pension and Other Post-employment Benefits. Actual results could differ from these estimates and
assumptions. Where these differ, the impact will be recorded in future periods.
Provision for Claims
The Provision for Claims represents an estimate for expected claims and the related settlement expenses, net of the related expected
property sale proceeds, for defaults from the mortgage loan insurance business that have occurred on or before the Consolidated
Balance Sheet date. In calculating the estimated liability, an estimate of losses on defaults that have been incurred but not reported is
made using historical experience and the time value of money, which considers prevailing legal, economic, social and regulatory trends.
See Note 15 for further details.
Unearned Premiums
Mortgage loan insurance premiums are deferred and recognized as revenue over the period covered by the insurance contracts using
actuarially determined factors that are reviewed quarterly by Management and annually as part of the Actuarial Valuation. The premium
earning factors are derived from claim occurrence patterns based on the principle that premiums will be earned at the same rate as
claims are incurred. See Note 15 for further details.
Financial Instruments
Financial instruments carried at fair value are measured based on quoted market prices observable in the market or amounts derived from
cash flow models or other valuation methodologies. The fair value measurement hierarchy described in Note 5 reflects the significance
of the inputs used in making these measurements.
Canada Mor tgage and Housing Corporation 2014 ANNUAL REPORT 77
Pension and Other Post-employment Benefits
The annual cost of the defined benefit pension and other post-employment benefits earned by employees is actuarially determined
using the projected unit credit method prorated on service and Management's best estimate of compensation increases, retirement ages
of employees, mortality of members and expected health care costs. These assumptions are of a long-term nature, which is consistent
with the nature of post-employment benefits. See Note 14 for further details.
5. Fair Value Measurements
Fair Value Measurement
We carry certain financial instruments and non-financial assets at fair value in the Consolidated Balance Sheet and disclose the fair value of
certain other items. Fair value is determined using a consistent measurement framework.
Fair value is the price that would be received to sell an asset or paid to transfer a liability in an orderly transaction between market
participants at the measurement date under current market conditions. The fair value of an asset or a liability is measured using
the assumptions that market participants would use when pricing the asset or liability, assuming that market participants act in their
economic best interest. Fair value measurement of non-financial assets (i.e., Non-current Assets Held for Sale and Investment Property)
takes into account a market participant’s ability to generate economic benefits by using the asset in its highest and best use or by
selling it to another market participant that would use the asset in its highest and best use. For financial instruments, accrued interest is
separately recorded and disclosed.
Fair Value Hierarchy
The methods used to measure fair value make maximum use of relevant observable inputs and minimize the use of unobservable
inputs. Fair value measurements are classified in a fair value hierarchy as Level 1, 2 or 3 according to the observability of the most
significant inputs used in making the measurements.
Level 1
Assets and liabilities that are measured based on unadjusted quoted prices in active markets for identical assets or liabilities.
Level 2
Assets and liabilities not quoted in active markets that are measured by discounting expected future cash flows, making maximum use of
directly or indirectly observable market data such as yield curves and implied forward curves constructed from benchmark interest rates
and credit spreads of identical or similar assets or liabilities.
Level 3
Assets and liabilities not quoted in active markets that are measured using valuation techniques. Where possible, inputs to the valuation
techniques are based on observable market data such as yield curves and implied forward curves constructed from benchmark interest
rates and credit spreads of similar assets or liabilities. Where observable inputs are not available, unobservable inputs are used. For Level
3 assets and liabilities, unobservable inputs are significant to the overall measurement of fair value.

Canada Mor tgage and Housing Corporation 2014 ANNUAL REPORT78
We have processes and controls in place to ensure fair value is appropriately measured. The valuation of Level 2 and 3 financial
instruments is performed by the Risk Management Division (RMD). The RMD is independent of the investment and treasury functions
and reports directly to the President and CEO through the Chief Risk Officer. RMD develops the models and methodologies to
determine fair value which are reviewed and monitored on an ongoing basis. The validity of Level 2 and 3 valuations is verified against
market transactions involving identical or similar instruments on an ongoing basis.
For Investment Property, fair value is determined by property appraisers who hold recognized and relevant professional qualifications.
Valuations are performed by independent external property appraisers and our internal appraisers on a rotating basis.
Methods and Assumptions
We measure fair value using the following methods and assumptions.
Cash Equivalents
Treasury bills are valued using unadjusted closing bid price quotes from active markets. Other money market instruments such as
bankers’ acceptances and commercial paper are valued by discounting future cash flows using observable discount rate curves.
Investment Securities
Fixed income and equity securities traded in active markets are valued using closing bid price quotes from those markets. For the
Investment Securities for which quoted prices in active markets are not available, valuation techniques are used to measure fair value
as described below.
For certain floating rate bonds, fair value is determined by discounting expected future cash flows using observable discount rate curves
for instruments having similar characteristics. Future cash flows are estimated based on observable implied forward rate curves.
The fair value of the variable rate asset-backed securities received in the restructuring of the Canadian asset-backed commercial paper
market is determined by discounting expected future cash flows using observable market discount rates and an unobservable risk
premium which takes into account the lack of market liquidity and inherent risk of the securities.
For our private limited partnership equity investment, fair value is measured as our share of the partnership’s net asset value. In
measuring net asset value, the fair value of the partnership’s real estate assets is determined at least annually by independent appraisers
using the income approach or the market approach, and the fair value of its long-term debt is measured by discounting expected future
cash flows.
Loans
Loans are valued by discounting future cash flows using discount rate curves that reflect the collection guarantees provided by provincial,
territorial or federal levels of government. Inputs into the discount model are the Government of Canada yield curve and spreads
derived from assets with comparable financial risks.
Canada Mor tgage and Housing Corporation 2014 ANNUAL REPORT 79
Derivatives
Interest rate swaps are valued by discounting estimated future cash flows using observable discount rate curves. Future cash flows for
floating rate legs are estimated based on observable implied forward rate curves. An adjustment is made to reflect the credit risk that
either counterparty may not be able to fulfil its obligations. Inputs to this adjustment include market-implied default rates and estimated
recovery rates, and the adjustment takes into account master netting and collateral arrangements in place.
Investment Property
The fair value of Investment Property is determined using either the income approach or the market approach, incorporating the
highest and best use of the property. Of the total fair value of investment properties, 43.0% (2013 – 32.9%) was based on valuations
performed by independent valuators and 57.0% (2013 – 67.1%) was based on internal valuations.
The income approach is primarily applied in determining the fair value of rent-producing properties. Under the income approach, fair
value is based upon the present value of expected future cash flows of each property using an unobservable discount rate reflective
of the characteristics of the property. Future cash flows are estimated using unobservable assumptions about future rental values and
vacancy rates.
The market approach is primarily applied in determining the fair value of vacant land. Under the market approach, fair value is
based upon market transactions involving comparable property, with adjustments made to reflect the unique aspects of the property
being valued.
The highest and best use of the Investment Property held in the Assisted Housing Activity ($149 million as at 31 December 2014;
$150 million as at 31 December 2013) differs from its current use as these investment properties are used to carry out CMHC’s social
housing mandate.
Borrowings
The fair value of Capital Market Borrowings is measured using unadjusted closing ask price quotes from active markets. Borrowings from
the Government of Canada are valued by discounting future cash flows using discount rate curves derived from the directly observable
yields of our market-traded borrowings.
Financial Instruments with Fair Value Equal to Carrying Value
We have assessed that the fair value of Securities Purchased Under Resale Agreements, Accrued Interest Receivable, Due from the
Government of Canada, Accounts Receivable, Securities Sold Under Repurchase Agreements, Accrued Interest Payable and Accounts
Payable approximates their carrying value largely due to the short-term maturities of these instruments.
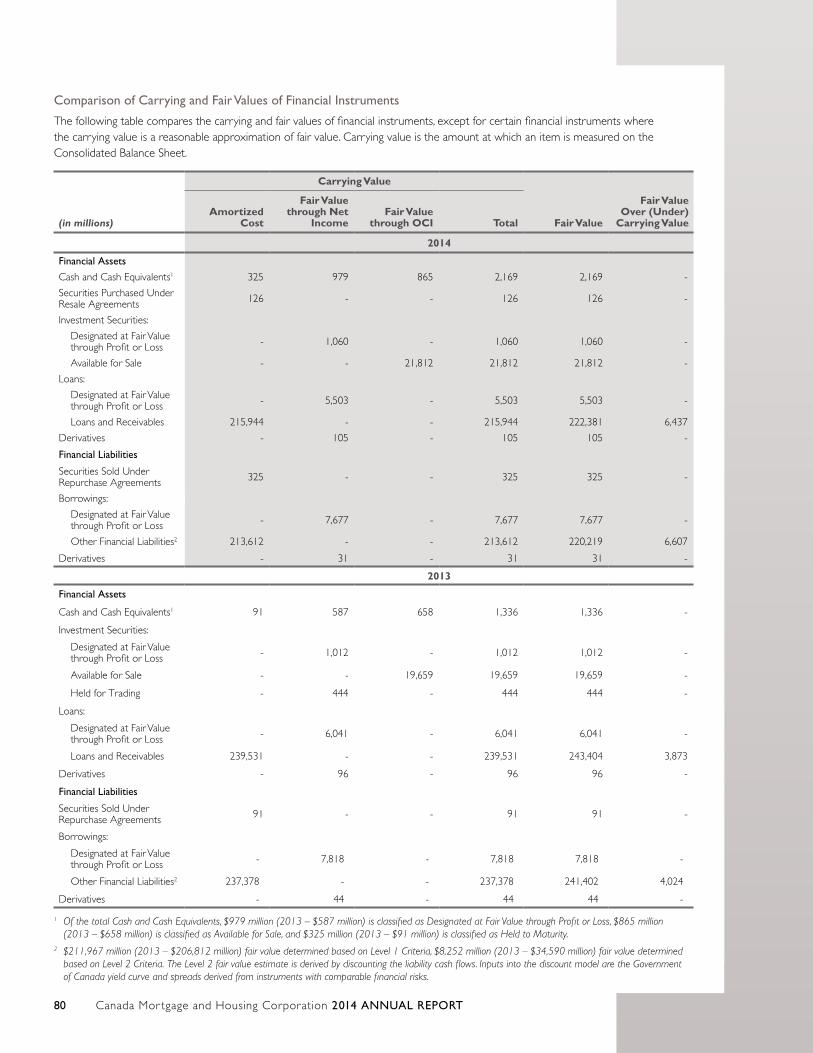
Canada Mor tgage and Housing Corporation 2014 ANNUAL REPORT80
Comparison of Carrying and Fair Values of Financial Instruments
The following table compares the carrying and fair values of financial instruments, except for certain financial instruments where the carrying value is a reasonable approximation of fair value. Carrying value is the amount at which an item is measured on the Consolidated Balance Sheet.
(in millions)
Carrying Value
Fair Value
Fair Value Over (Under)
Carrying ValueAmortized
Cost
Fair Value through Net
IncomeFair Value
through OCI Total
2014
Financial Assets
Cash and Cash Equivalents1 325 979 865 2,169 2,169 -
Securities Purchased Under Resale Agreements 126 - - 126 126 -
Investment Securities:
Designated at Fair Value through Profit or Loss - 1,060 - 1,060 1,060 -
Available for Sale - - 21,812 21,812 21,812 -
Loans:
Designated at Fair Value through Profit or Loss - 5,503 - 5,503 5,503 -
Loans and Receivables 215,944 - - 215,944 222,381 6,437
Derivatives - 105 - 105 105 -
Financial Liabilities
Securities Sold Under Repurchase Agreements 325 - - 325 325 -
Borrowings:
Designated at Fair Value through Profit or Loss - 7,677 - 7,677 7,677 -
Other Financial Liabilities2 213,612 - - 213,612 220,219 6,607
Derivatives - 31 - 31 31 -
2013
Financial Assets
Cash and Cash Equivalents1 91 587 658 1,336 1,336 -
Investment Securities:
Designated at Fair Value through Profit or Loss - 1,012 - 1,012 1,012 -
Available for Sale - - 19,659 19,659 19,659 -
Held for Trading - 444 - 444 444 -
Loans:
Designated at Fair Value through Profit or Loss - 6,041 - 6,041 6,041 -
Loans and Receivables 239,531 - - 239,531 243,404 3,873
Derivatives - 96 - 96 96 -
Financial Liabilities
Securities Sold Under Repurchase Agreements 91 - - 91 91 -
Borrowings:
Designated at Fair Value through Profit or Loss - 7,818 - 7,818 7,818 -
Other Financial Liabilities2 237,378 - - 237,378 241,402 4,024
Derivatives - 44 - 44 44 -
1 Of the total Cash and Cash Equivalents, $979 million (2013 – $587 million) is classified as Designated at Fair Value through Profit or Loss, $865 million (2013 – $658 million) is classified as Available for Sale, and $325 million (2013 – $91 million) is classified as Held to Maturity.
2 $211,967 million (2013 – $206,812 million) fair value determined based on Level 1 Criteria, $8,252 million (2013 – $34,590 million) fair value determined based on Level 2 Criteria. The Level 2 fair value estimate is derived by discounting the liability cash flows. Inputs into the discount model are the Government of Canada yield curve and spreads derived from instruments with comparable financial risks.
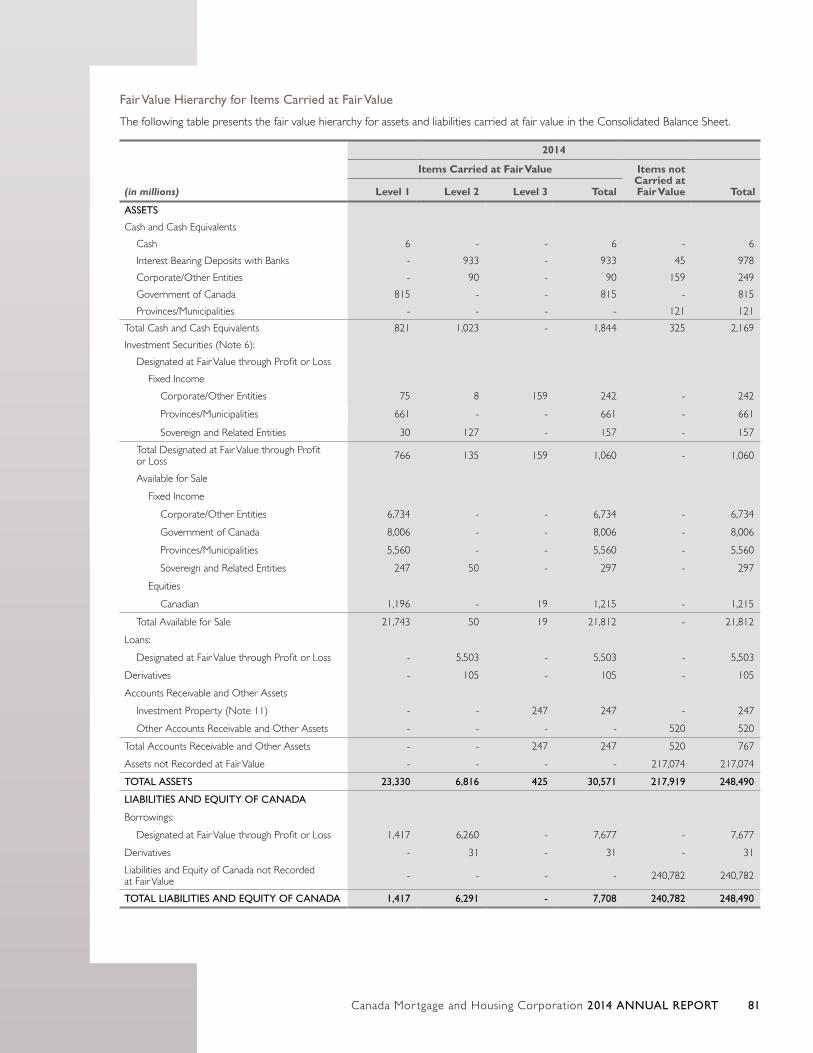
Canada Mor tgage and Housing Corporation 2014 ANNUAL REPORT 81
Fair Value Hierarchy for Items Carried at Fair Value
The following table presents the fair value hierarchy for assets and liabilities carried at fair value in the Consolidated Balance Sheet.
(in millions)
2014
Items Carried at Fair Value Items not Carried at Fair Value TotalLevel 1 Level 2 Level 3 Total
ASSETS
Cash and Cash Equivalents
Cash 6 - - 6 - 6
Interest Bearing Deposits with Banks - 933 - 933 45 978
Corporate/Other Entities - 90 - 90 159 249
Government of Canada 815 - - 815 - 815
Provinces/Municipalities - - - - 121 121
Total Cash and Cash Equivalents 821 1,023 - 1,844 325 2,169
Investment Securities (Note 6):
Designated at Fair Value through Profit or Loss
Fixed Income
Corporate/Other Entities 75 8 159 242 - 242
Provinces/Municipalities 661 - - 661 - 661
Sovereign and Related Entities 30 127 - 157 - 157
Total Designated at Fair Value through Profit or Loss 766 135 159 1,060 - 1,060
Available for Sale
Fixed Income
Corporate/Other Entities 6,734 - - 6,734 - 6,734
Government of Canada 8,006 - - 8,006 - 8,006
Provinces/Municipalities 5,560 - - 5,560 - 5,560
Sovereign and Related Entities 247 50 - 297 - 297
Equities
Canadian 1,196 - 19 1,215 - 1,215
Total Available for Sale 21,743 50 19 21,812 - 21,812
Loans:
Designated at Fair Value through Profit or Loss - 5,503 - 5,503 - 5,503
Derivatives - 105 - 105 - 105
Accounts Receivable and Other Assets
Investment Property (Note 11) - - 247 247 - 247
Other Accounts Receivable and Other Assets - - - - 520 520
Total Accounts Receivable and Other Assets - - 247 247 520 767
Assets not Recorded at Fair Value - - - - 217,074 217,074
TOTAL ASSETS 23,330 6,816 425 30,571 217,919 248,490
LIABILITIES AND EQUITY OF CANADA
Borrowings:
Designated at Fair Value through Profit or Loss 1,417 6,260 - 7,677 - 7,677
Derivatives - 31 - 31 - 31
Liabilities and Equity of Canada not Recorded at Fair Value - - - - 240,782 240,782
TOTAL LIABILITIES AND EQUITY OF CANADA 1,417 6,291 - 7,708 240,782 248,490
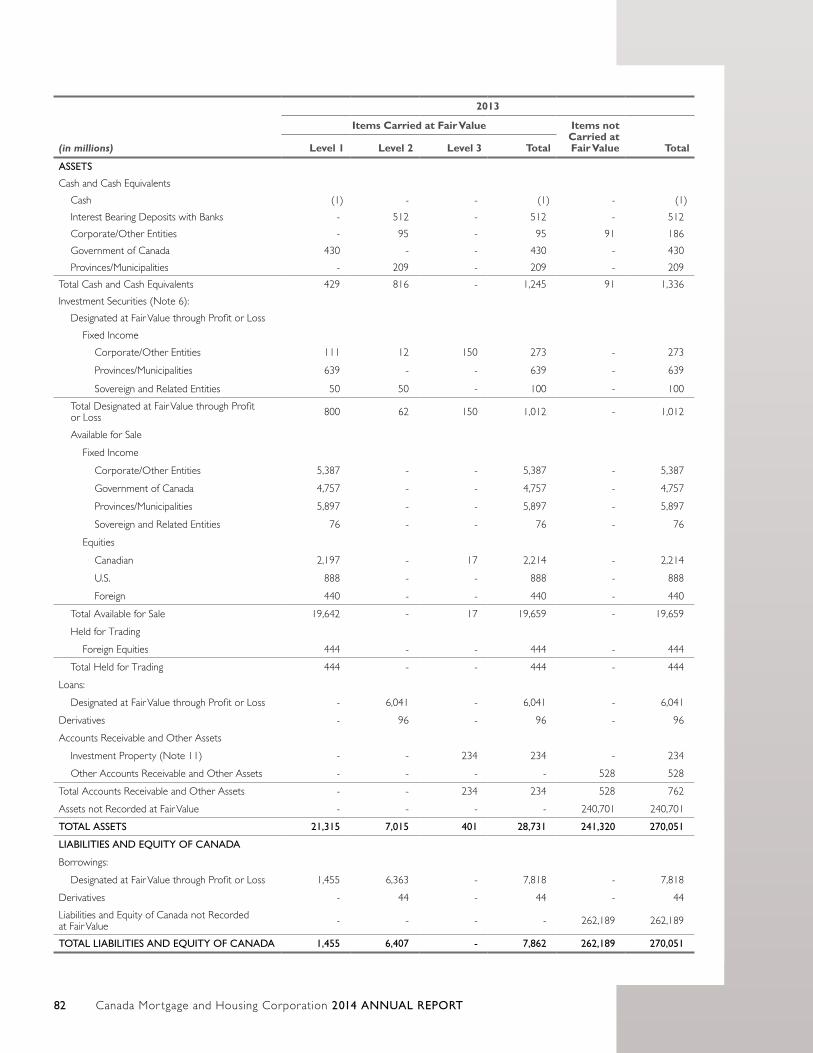
Canada Mor tgage and Housing Corporation 2014 ANNUAL REPORT82
(in millions)
2013
Items Carried at Fair Value Items not Carried at Fair Value TotalLevel 1 Level 2 Level 3 Total
ASSETS
Cash and Cash Equivalents
Cash (1) - - (1) - (1)
Interest Bearing Deposits with Banks - 512 - 512 - 512
Corporate/Other Entities - 95 - 95 91 186
Government of Canada 430 - - 430 - 430
Provinces/Municipalities - 209 - 209 - 209
Total Cash and Cash Equivalents 429 816 - 1,245 91 1,336
Investment Securities (Note 6):
Designated at Fair Value through Profit or Loss
Fixed Income
Corporate/Other Entities 111 12 150 273 - 273
Provinces/Municipalities 639 - - 639 - 639
Sovereign and Related Entities 50 50 - 100 - 100
Total Designated at Fair Value through Profit or Loss 800 62 150 1,012 - 1,012
Available for Sale
Fixed Income
Corporate/Other Entities 5,387 - - 5,387 - 5,387
Government of Canada 4,757 - - 4,757 - 4,757
Provinces/Municipalities 5,897 - - 5,897 - 5,897
Sovereign and Related Entities 76 - - 76 - 76
Equities
Canadian 2,197 - 17 2,214 - 2,214
U.S. 888 - - 888 - 888
Foreign 440 - - 440 - 440
Total Available for Sale 19,642 - 17 19,659 - 19,659
Held for Trading
Foreign Equities 444 - - 444 - 444
Total Held for Trading 444 - - 444 - 444
Loans:
Designated at Fair Value through Profit or Loss - 6,041 - 6,041 - 6,041
Derivatives - 96 - 96 - 96
Accounts Receivable and Other Assets
Investment Property (Note 11) - - 234 234 - 234
Other Accounts Receivable and Other Assets - - - - 528 528
Total Accounts Receivable and Other Assets - - 234 234 528 762
Assets not Recorded at Fair Value - - - - 240,701 240,701
TOTAL ASSETS 21,315 7,015 401 28,731 241,320 270,051
LIABILITIES AND EQUITY OF CANADA
Borrowings:
Designated at Fair Value through Profit or Loss 1,455 6,363 - 7,818 - 7,818
Derivatives - 44 - 44 - 44
Liabilities and Equity of Canada not Recorded at Fair Value - - - - 262,189 262,189
TOTAL LIABILITIES AND EQUITY OF CANADA 1,455 6,407 - 7,862 262,189 270,051
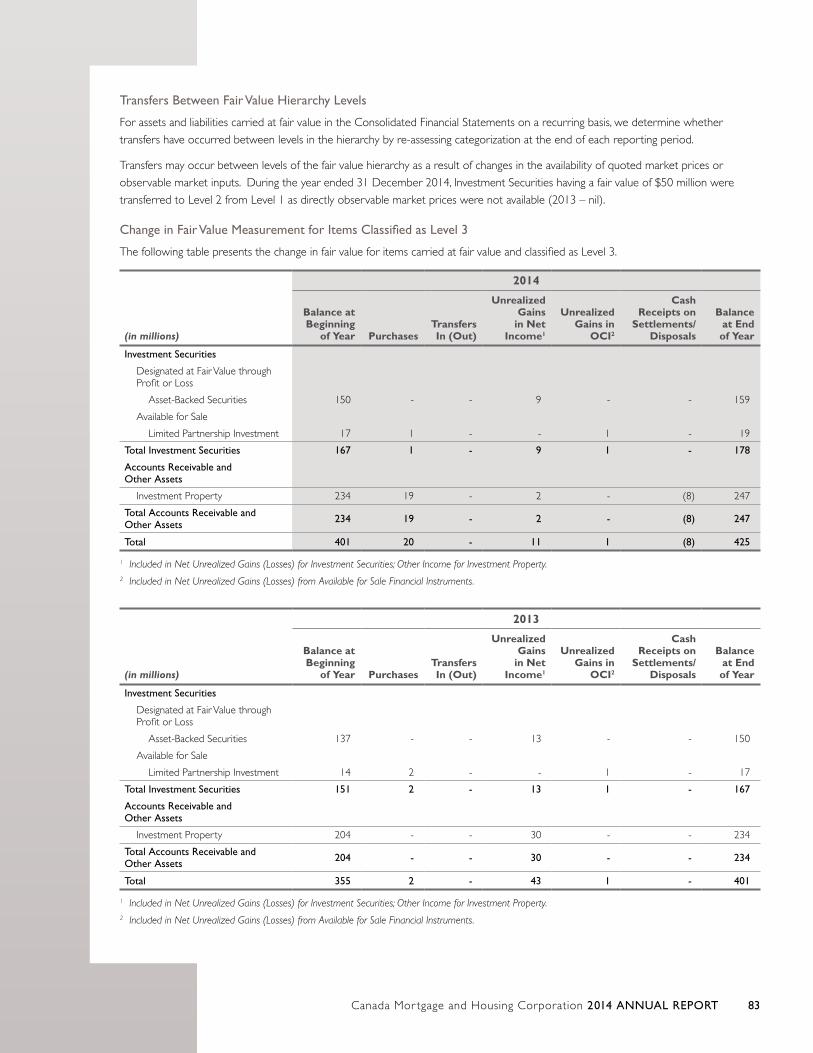
Canada Mor tgage and Housing Corporation 2014 ANNUAL REPORT 83
Transfers Between Fair Value Hierarchy Levels
For assets and liabilities carried at fair value in the Consolidated Financial Statements on a recurring basis, we determine whether
transfers have occurred between levels in the hierarchy by re-assessing categorization at the end of each reporting period.
Transfers may occur between levels of the fair value hierarchy as a result of changes in the availability of quoted market prices or
observable market inputs. During the year ended 31 December 2014, Investment Securities having a fair value of $50 million were
transferred to Level 2 from Level 1 as directly observable market prices were not available (2013 – nil).
Change in Fair Value Measurement for Items Classified as Level 3
The following table presents the change in fair value for items carried at fair value and classified as Level 3.
(in millions)
2014
Balance at Beginning
of Year PurchasesTransfers In (Out)
Unrealized Gains
in Net Income1
Unrealized Gains in
OCI2
Cash Receipts on
Settlements/ Disposals
Balance at End of Year
Investment Securities
Designated at Fair Value through Profit or Loss
Asset-Backed Securities 150 - - 9 - - 159
Available for Sale
Limited Partnership Investment 17 1 - - 1 - 19
Total Investment Securities 167 1 - 9 1 - 178
Accounts Receivable and Other Assets
Investment Property 234 19 - 2 - (8) 247
Total Accounts Receivable and Other Assets 234 19 - 2 - (8) 247
Total 401 20 - 11 1 (8) 425
1 Included in Net Unrealized Gains (Losses) for Investment Securities; Other Income for Investment Property.2 Included in Net Unrealized Gains (Losses) from Available for Sale Financial Instruments.
(in millions)
2013
Balance at Beginning
of Year PurchasesTransfers In (Out)
Unrealized Gains
in Net Income1
Unrealized Gains in
OCI2
Cash Receipts on
Settlements/ Disposals
Balance at End of Year
Investment Securities
Designated at Fair Value through Profit or Loss
Asset-Backed Securities 137 - - 13 - - 150
Available for Sale
Limited Partnership Investment 14 2 - - 1 - 17
Total Investment Securities 151 2 - 13 1 - 167
Accounts Receivable and Other Assets
Investment Property 204 - - 30 - - 234
Total Accounts Receivable and Other Assets 204 - - 30 - - 234
Total 355 2 - 43 1 - 401
1 Included in Net Unrealized Gains (Losses) for Investment Securities; Other Income for Investment Property.2 Included in Net Unrealized Gains (Losses) from Available for Sale Financial Instruments.
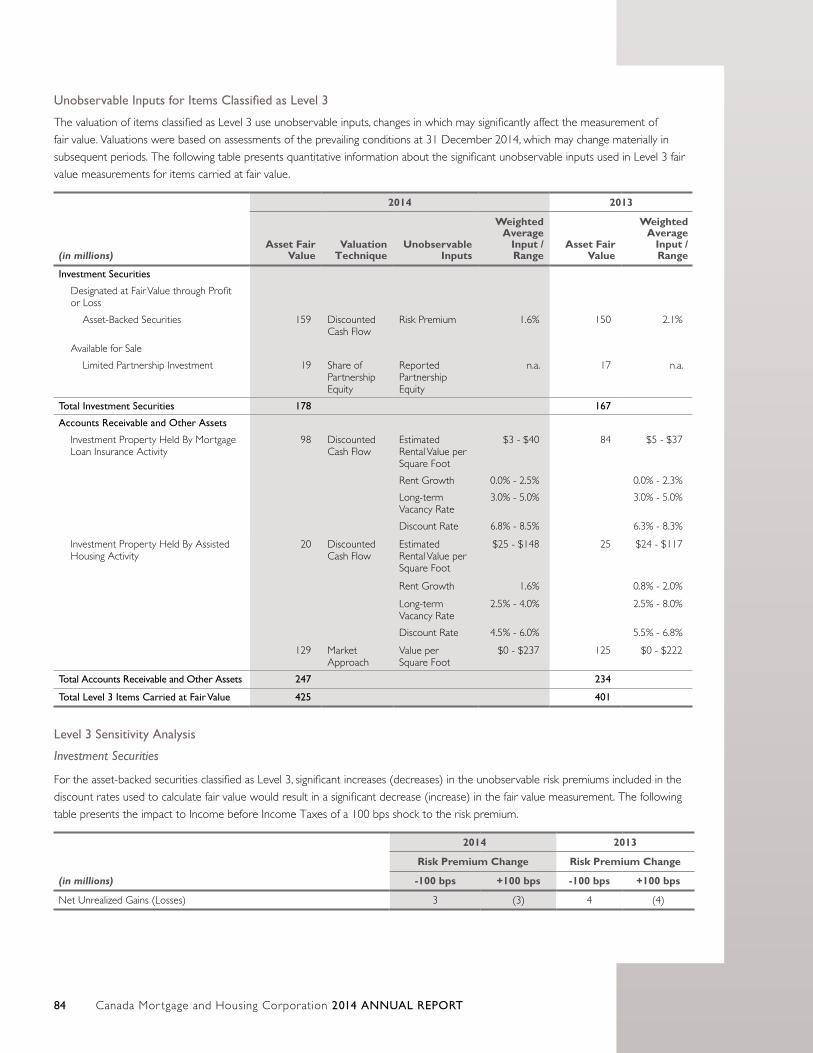
Canada Mor tgage and Housing Corporation 2014 ANNUAL REPORT84
Unobservable Inputs for Items Classified as Level 3
The valuation of items classified as Level 3 use unobservable inputs, changes in which may significantly affect the measurement of
fair value. Valuations were based on assessments of the prevailing conditions at 31 December 2014, which may change materially in
subsequent periods. The following table presents quantitative information about the significant unobservable inputs used in Level 3 fair
value measurements for items carried at fair value.
(in millions)
2014 2013
Asset Fair Value
Valuation Technique
Unobservable Inputs
Weighted Average
Input / Range
Asset Fair Value
Weighted Average
Input / Range
Investment Securities
Designated at Fair Value through Profit or Loss
Asset-Backed Securities 159 Discounted Cash Flow
Risk Premium 1.6% 150 2.1%
Available for Sale
Limited Partnership Investment 19 Share of Partnership Equity
Reported Partnership Equity
n.a. 17 n.a.
Total Investment Securities 178 167
Accounts Receivable and Other Assets
Investment Property Held By Mortgage Loan Insurance Activity
98 Discounted Cash Flow
Estimated Rental Value per Square Foot
$3 - $40 84 $5 - $37
Rent Growth 0.0% - 2.5% 0.0% - 2.3%
Long-term Vacancy Rate
3.0% - 5.0% 3.0% - 5.0%
Discount Rate 6.8% - 8.5% 6.3% - 8.3%
Investment Property Held By Assisted Housing Activity
20 Discounted Cash Flow
Estimated Rental Value per Square Foot
$25 - $148 25 $24 - $117
Rent Growth 1.6% 0.8% - 2.0%
Long-term Vacancy Rate
2.5% - 4.0% 2.5% - 8.0%
Discount Rate 4.5% - 6.0% 5.5% - 6.8%
129 Market Approach
Value per Square Foot
$0 - $237 125 $0 - $222
Total Accounts Receivable and Other Assets 247 234
Total Level 3 Items Carried at Fair Value 425 401
Level 3 Sensitivity Analysis
Investment Securities
For the asset-backed securities classified as Level 3, significant increases (decreases) in the unobservable risk premiums included in the
discount rates used to calculate fair value would result in a significant decrease (increase) in the fair value measurement. The following
table presents the impact to Income before Income Taxes of a 100 bps shock to the risk premium.
(in millions)
2014 2013
Risk Premium Change Risk Premium Change
-100 bps +100 bps -100 bps +100 bps
Net Unrealized Gains (Losses) 3 (3) 4 (4)
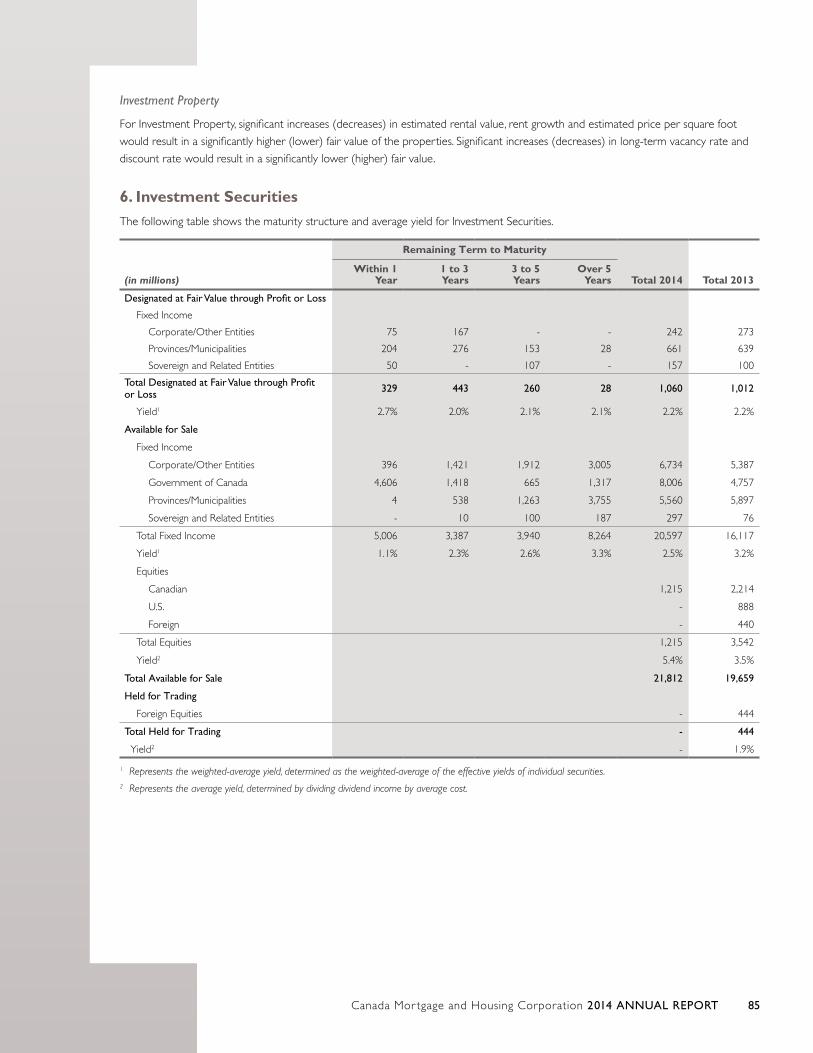
Canada Mor tgage and Housing Corporation 2014 ANNUAL REPORT 85
Investment Property
For Investment Property, significant increases (decreases) in estimated rental value, rent growth and estimated price per square foot
would result in a significantly higher (lower) fair value of the properties. Significant increases (decreases) in long-term vacancy rate and
discount rate would result in a significantly lower (higher) fair value.
6. Investment SecuritiesThe following table shows the maturity structure and average yield for Investment Securities.
(in millions)
Remaining Term to Maturity
Total 2014 Total 2013Within 1
Year1 to 3 Years
3 to 5 Years
Over 5 Years
Designated at Fair Value through Profit or Loss
Fixed Income
Corporate/Other Entities 75 167 - - 242 273
Provinces/Municipalities 204 276 153 28 661 639
Sovereign and Related Entities 50 - 107 - 157 100
Total Designated at Fair Value through Profit or Loss 329 443 260 28 1,060 1,012
Yield1 2.7% 2.0% 2.1% 2.1% 2.2% 2.2%
Available for Sale
Fixed Income
Corporate/Other Entities 396 1,421 1,912 3,005 6,734 5,387
Government of Canada 4,606 1,418 665 1,317 8,006 4,757
Provinces/Municipalities 4 538 1,263 3,755 5,560 5,897
Sovereign and Related Entities - 10 100 187 297 76
Total Fixed Income 5,006 3,387 3,940 8,264 20,597 16,117
Yield1 1.1% 2.3% 2.6% 3.3% 2.5% 3.2%
Equities
Canadian 1,215 2,214
U.S. - 888
Foreign - 440
Total Equities 1,215 3,542
Yield2 5.4% 3.5%
Total Available for Sale 21,812 19,659
Held for Trading
Foreign Equities - 444
Total Held for Trading - 444
Yield2 - 1.9%
1 Represents the weighted-average yield, determined as the weighted-average of the effective yields of individual securities.2 Represents the average yield, determined by dividing dividend income by average cost.
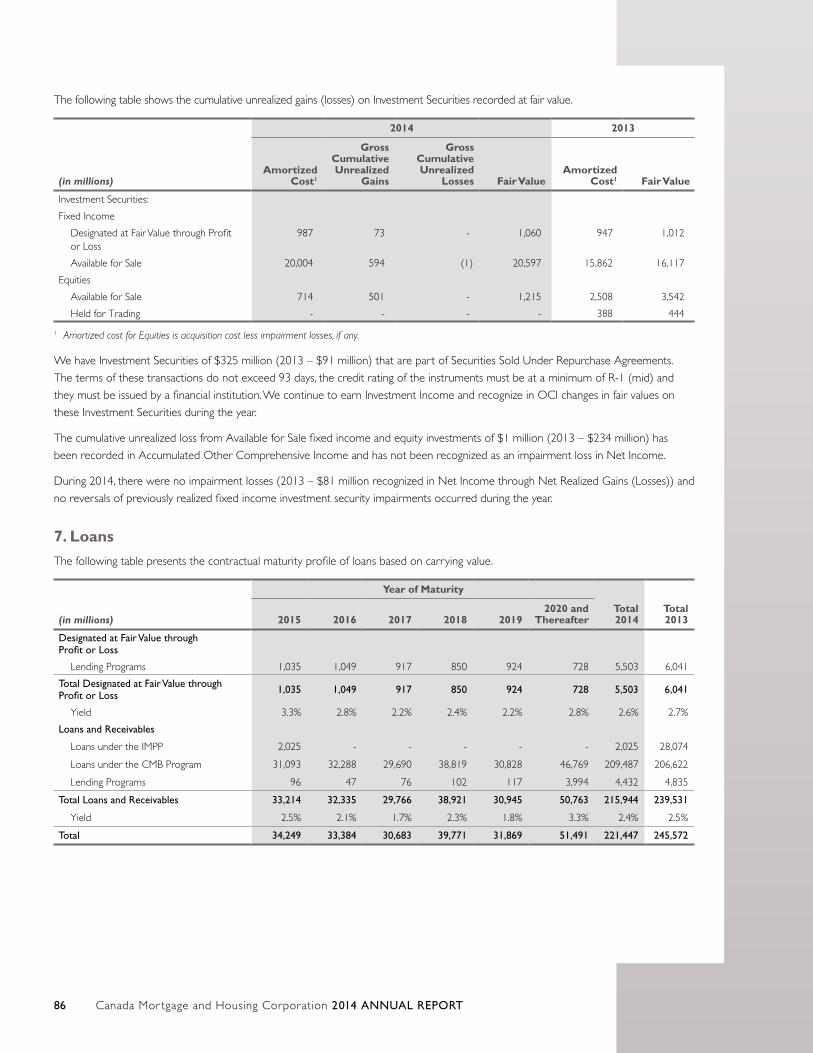
Canada Mor tgage and Housing Corporation 2014 ANNUAL REPORT86
The following table shows the cumulative unrealized gains (losses) on Investment Securities recorded at fair value.
(in millions)
2014 2013
Amortized Cost1
Gross Cumulative Unrealized
Gains
Gross Cumulative Unrealized
Losses Fair ValueAmortized
Cost1 Fair Value
Investment Securities:
Fixed Income
Designated at Fair Value through Profit or Loss
987 73 - 1,060 947 1,012
Available for Sale 20,004 594 (1) 20,597 15,862 16,117
Equities
Available for Sale 714 501 - 1,215 2,508 3,542
Held for Trading - - - - 388 444
1 Amortized cost for Equities is acquisition cost less impairment losses, if any.
We have Investment Securities of $325 million (2013 – $91 million) that are part of Securities Sold Under Repurchase Agreements.
The terms of these transactions do not exceed 93 days, the credit rating of the instruments must be at a minimum of R-1 (mid) and
they must be issued by a financial institution. We continue to earn Investment Income and recognize in OCI changes in fair values on
these Investment Securities during the year.
The cumulative unrealized loss from Available for Sale fixed income and equity investments of $1 million (2013 – $234 million) has
been recorded in Accumulated Other Comprehensive Income and has not been recognized as an impairment loss in Net Income.
During 2014, there were no impairment losses (2013 – $81 million recognized in Net Income through Net Realized Gains (Losses)) and
no reversals of previously realized fixed income investment security impairments occurred during the year.
7. LoansThe following table presents the contractual maturity profile of loans based on carrying value.
(in millions)
Year of Maturity
Total 2014
Total 20132015 2016 2017 2018 2019
2020 and Thereafter
Designated at Fair Value through Profit or Loss
Lending Programs 1,035 1,049 917 850 924 728 5,503 6,041
Total Designated at Fair Value through Profit or Loss 1,035 1,049 917 850 924 728 5,503 6,041
Yield 3.3% 2.8% 2.2% 2.4% 2.2% 2.8% 2.6% 2.7%
Loans and Receivables
Loans under the IMPP 2,025 - - - - - 2,025 28,074
Loans under the CMB Program 31,093 32,288 29,690 38,819 30,828 46,769 209,487 206,622
Lending Programs 96 47 76 102 117 3,994 4,432 4,835
Total Loans and Receivables 33,214 32,335 29,766 38,921 30,945 50,763 215,944 239,531
Yield 2.5% 2.1% 1.7% 2.3% 1.8% 3.3% 2.4% 2.5%
Total 34,249 33,384 30,683 39,771 31,869 51,491 221,447 245,572
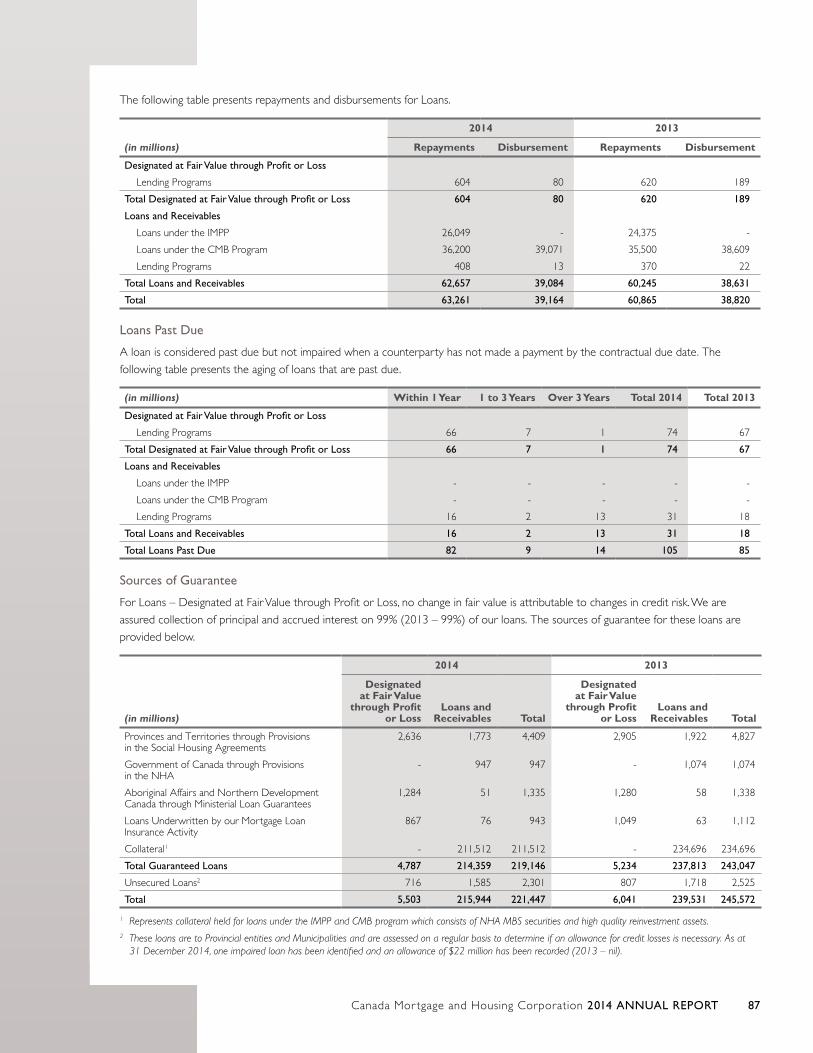
Canada Mor tgage and Housing Corporation 2014 ANNUAL REPORT 87
The following table presents repayments and disbursements for Loans.
(in millions)
2014 2013
Repayments Disbursement Repayments Disbursement
Designated at Fair Value through Profit or Loss
Lending Programs 604 80 620 189
Total Designated at Fair Value through Profit or Loss 604 80 620 189
Loans and Receivables
Loans under the IMPP 26,049 - 24,375 -
Loans under the CMB Program 36,200 39,071 35,500 38,609
Lending Programs 408 13 370 22
Total Loans and Receivables 62,657 39,084 60,245 38,631
Total 63,261 39,164 60,865 38,820
Loans Past Due
A loan is considered past due but not impaired when a counterparty has not made a payment by the contractual due date. The
following table presents the aging of loans that are past due.
(in millions) Within 1 Year 1 to 3 Years Over 3 Years Total 2014 Total 2013
Designated at Fair Value through Profit or Loss
Lending Programs 66 7 1 74 67
Total Designated at Fair Value through Profit or Loss 66 7 1 74 67
Loans and Receivables
Loans under the IMPP - - - - -
Loans under the CMB Program - - - - -
Lending Programs 16 2 13 31 18
Total Loans and Receivables 16 2 13 31 18
Total Loans Past Due 82 9 14 105 85
Sources of Guarantee
For Loans – Designated at Fair Value through Profit or Loss, no change in fair value is attributable to changes in credit risk. We are
assured collection of principal and accrued interest on 99% (2013 – 99%) of our loans. The sources of guarantee for these loans are
provided below.
(in millions)
2014 2013
Designated at Fair Value
through Profit or Loss
Loans and Receivables Total
Designated at Fair Value
through Profit or Loss
Loans and Receivables Total
Provinces and Territories through Provisions in the Social Housing Agreements
2,636 1,773 4,409 2,905 1,922 4,827
Government of Canada through Provisions in the NHA
- 947 947 - 1,074 1,074
Aboriginal Affairs and Northern Development Canada through Ministerial Loan Guarantees
1,284 51 1,335 1,280 58 1,338
Loans Underwritten by our Mortgage Loan Insurance Activity
867 76 943 1,049 63 1,112
Collateral1 - 211,512 211,512 - 234,696 234,696
Total Guaranteed Loans 4,787 214,359 219,146 5,234 237,813 243,047
Unsecured Loans2 716 1,585 2,301 807 1,718 2,525
Total 5,503 215,944 221,447 6,041 239,531 245,572
1 Represents collateral held for loans under the IMPP and CMB program which consists of NHA MBS securities and high quality reinvestment assets.2 These loans are to Provincial entities and Municipalities and are assessed on a regular basis to determine if an allowance for credit losses is necessary. As at
31 December 2014, one impaired loan has been identified and an allowance of $22 million has been recorded (2013 – nil).
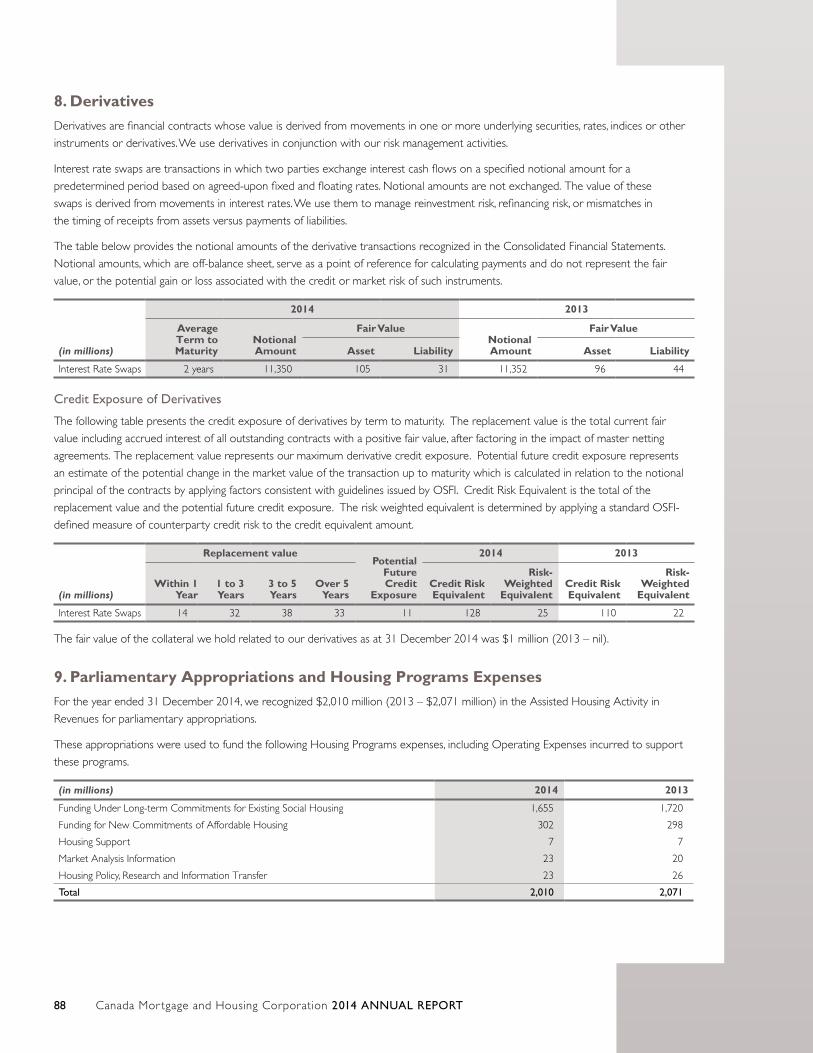
Canada Mor tgage and Housing Corporation 2014 ANNUAL REPORT88
8. Derivatives Derivatives are financial contracts whose value is derived from movements in one or more underlying securities, rates, indices or other
instruments or derivatives. We use derivatives in conjunction with our risk management activities.
Interest rate swaps are transactions in which two parties exchange interest cash flows on a specified notional amount for a
predetermined period based on agreed-upon fixed and floating rates. Notional amounts are not exchanged. The value of these
swaps is derived from movements in interest rates. We use them to manage reinvestment risk, refinancing risk, or mismatches in
the timing of receipts from assets versus payments of liabilities.
The table below provides the notional amounts of the derivative transactions recognized in the Consolidated Financial Statements.
Notional amounts, which are off-balance sheet, serve as a point of reference for calculating payments and do not represent the fair
value, or the potential gain or loss associated with the credit or market risk of such instruments.
(in millions)
2014 2013
Average Term to Maturity
Notional Amount
Fair ValueNotional Amount
Fair Value
Asset Liability Asset Liability
Interest Rate Swaps 2 years 11,350 105 31 11,352 96 44
Credit Exposure of Derivatives
The following table presents the credit exposure of derivatives by term to maturity. The replacement value is the total current fair
value including accrued interest of all outstanding contracts with a positive fair value, after factoring in the impact of master netting
agreements. The replacement value represents our maximum derivative credit exposure. Potential future credit exposure represents
an estimate of the potential change in the market value of the transaction up to maturity which is calculated in relation to the notional
principal of the contracts by applying factors consistent with guidelines issued by OSFI. Credit Risk Equivalent is the total of the
replacement value and the potential future credit exposure. The risk weighted equivalent is determined by applying a standard OSFI-
defined measure of counterparty credit risk to the credit equivalent amount.
(in millions)
Replacement valuePotential
Future Credit
Exposure
2014 2013
Within 1 Year
1 to 3 Years
3 to 5 Years
Over 5 Years
Credit Risk Equivalent
Risk-Weighted
EquivalentCredit Risk Equivalent
Risk-Weighted
Equivalent
Interest Rate Swaps 14 32 38 33 11 128 25 110 22
The fair value of the collateral we hold related to our derivatives as at 31 December 2014 was $1 million (2013 – nil).
9. Parliamentary Appropriations and Housing Programs ExpensesFor the year ended 31 December 2014, we recognized $2,010 million (2013 – $2,071 million) in the Assisted Housing Activity in
Revenues for parliamentary appropriations.
These appropriations were used to fund the following Housing Programs expenses, including Operating Expenses incurred to support
these programs.
(in millions) 2014 2013
Funding Under Long-term Commitments for Existing Social Housing 1,655 1,720
Funding for New Commitments of Affordable Housing 302 298
Housing Support 7 7
Market Analysis Information 23 20
Housing Policy, Research and Information Transfer 23 26
Total 2,010 2,071
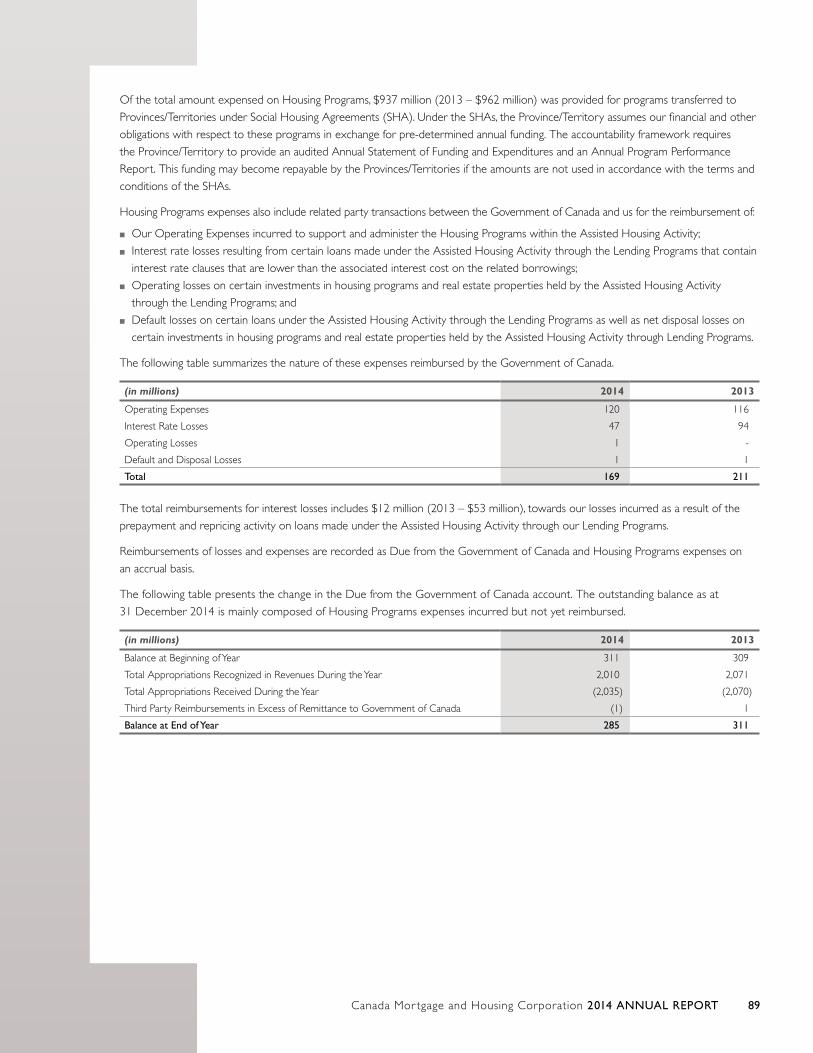
Canada Mor tgage and Housing Corporation 2014 ANNUAL REPORT 89
Of the total amount expensed on Housing Programs, $937 million (2013 – $962 million) was provided for programs transferred to
Provinces/Territories under Social Housing Agreements (SHA). Under the SHAs, the Province/Territory assumes our financial and other
obligations with respect to these programs in exchange for pre-determined annual funding. The accountability framework requires
the Province/Territory to provide an audited Annual Statement of Funding and Expenditures and an Annual Program Performance
Report. This funding may become repayable by the Provinces/Territories if the amounts are not used in accordance with the terms and
conditions of the SHAs.
Housing Programs expenses also include related party transactions between the Government of Canada and us for the reimbursement of:
■■ Our Operating Expenses incurred to support and administer the Housing Programs within the Assisted Housing Activity;
■■ Interest rate losses resulting from certain loans made under the Assisted Housing Activity through the Lending Programs that contain
interest rate clauses that are lower than the associated interest cost on the related borrowings;
■■ Operating losses on certain investments in housing programs and real estate properties held by the Assisted Housing Activity
through the Lending Programs; and
■■ Default losses on certain loans under the Assisted Housing Activity through the Lending Programs as well as net disposal losses on
certain investments in housing programs and real estate properties held by the Assisted Housing Activity through Lending Programs.
The following table summarizes the nature of these expenses reimbursed by the Government of Canada.
(in millions) 2014 2013
Operating Expenses 120 116
Interest Rate Losses 47 94
Operating Losses 1 -
Default and Disposal Losses 1 1
Total 169 211
The total reimbursements for interest losses includes $12 million (2013 – $53 million), towards our losses incurred as a result of the
prepayment and repricing activity on loans made under the Assisted Housing Activity through our Lending Programs.
Reimbursements of losses and expenses are recorded as Due from the Government of Canada and Housing Programs expenses on
an accrual basis.
The following table presents the change in the Due from the Government of Canada account. The outstanding balance as at
31 December 2014 is mainly composed of Housing Programs expenses incurred but not yet reimbursed.
(in millions) 2014 2013
Balance at Beginning of Year 311 309
Total Appropriations Recognized in Revenues During the Year 2,010 2,071
Total Appropriations Received During the Year (2,035) (2,070)
Third Party Reimbursements in Excess of Remittance to Government of Canada (1) 1
Balance at End of Year 285 311
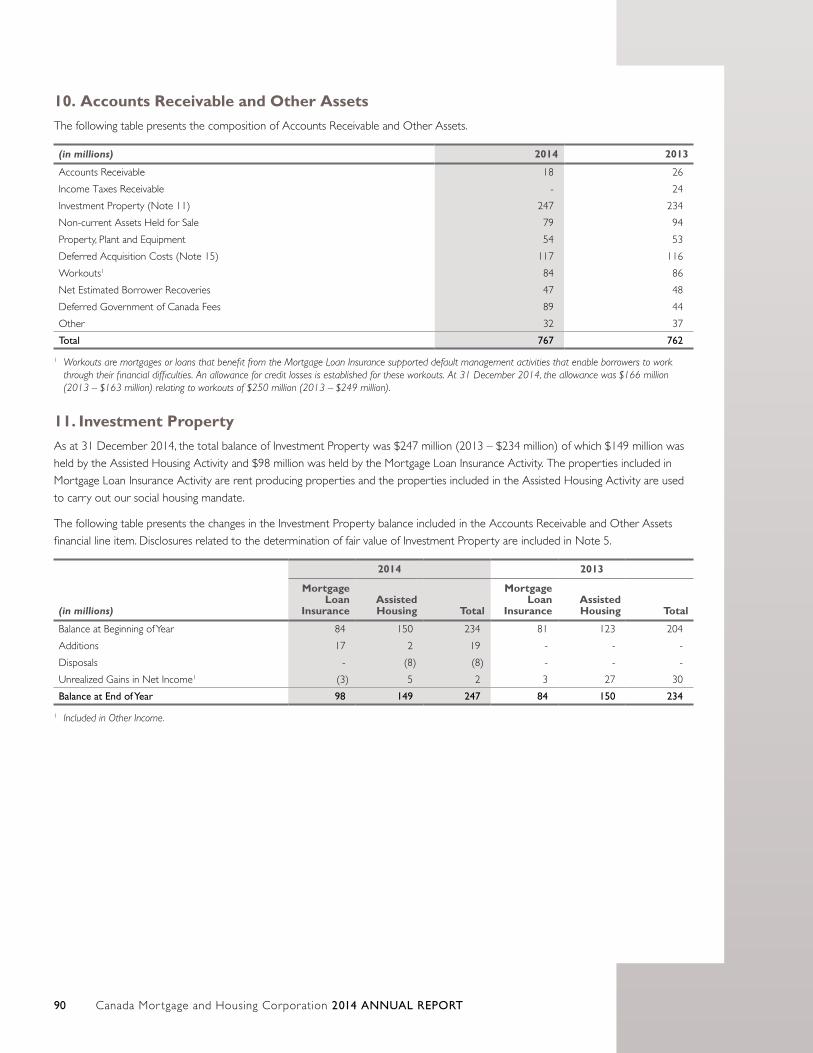
Canada Mor tgage and Housing Corporation 2014 ANNUAL REPORT90
10. Accounts Receivable and Other AssetsThe following table presents the composition of Accounts Receivable and Other Assets.
(in millions) 2014 2013
Accounts Receivable 18 26
Income Taxes Receivable - 24
Investment Property (Note 11) 247 234
Non-current Assets Held for Sale 79 94
Property, Plant and Equipment 54 53
Deferred Acquisition Costs (Note 15) 117 116
Workouts1 84 86
Net Estimated Borrower Recoveries 47 48
Deferred Government of Canada Fees 89 44
Other 32 37
Total 767 762
1 Workouts are mortgages or loans that benefit from the Mortgage Loan Insurance supported default management activities that enable borrowers to work through their financial difficulties. An allowance for credit losses is established for these workouts. At 31 December 2014, the allowance was $166 million (2013 – $163 million) relating to workouts of $250 million (2013 – $249 million).
11. Investment PropertyAs at 31 December 2014, the total balance of Investment Property was $247 million (2013 – $234 million) of which $149 million was
held by the Assisted Housing Activity and $98 million was held by the Mortgage Loan Insurance Activity. The properties included in
Mortgage Loan Insurance Activity are rent producing properties and the properties included in the Assisted Housing Activity are used
to carry out our social housing mandate.
The following table presents the changes in the Investment Property balance included in the Accounts Receivable and Other Assets
financial line item. Disclosures related to the determination of fair value of Investment Property are included in Note 5.
(in millions)
2014 2013
Mortgage Loan
InsuranceAssisted Housing Total
Mortgage Loan
InsuranceAssisted Housing Total
Balance at Beginning of Year 84 150 234 81 123 204
Additions 17 2 19 - - -
Disposals - (8) (8) - - -
Unrealized Gains in Net Income1 (3) 5 2 3 27 30
Balance at End of Year 98 149 247 84 150 234
1 Included in Other Income.
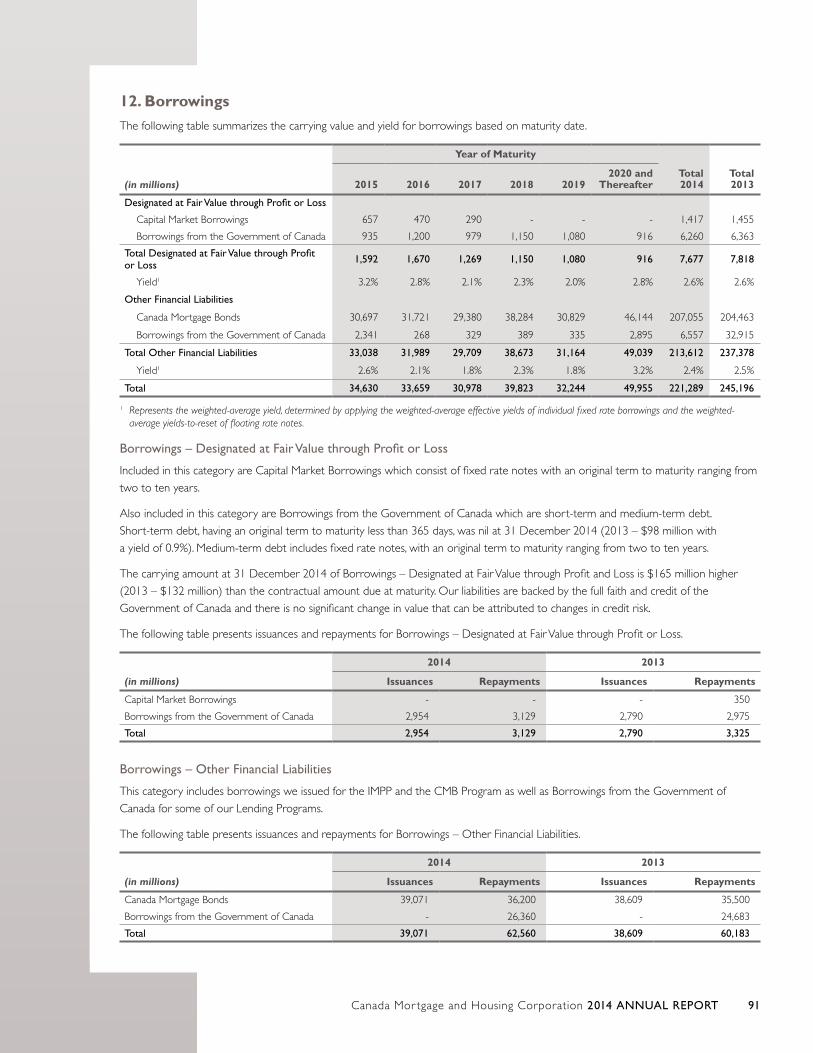
Canada Mor tgage and Housing Corporation 2014 ANNUAL REPORT 91
12. BorrowingsThe following table summarizes the carrying value and yield for borrowings based on maturity date.
(in millions)
Year of Maturity
Total 2014
Total 20132015 2016 2017 2018 2019
2020 and Thereafter
Designated at Fair Value through Profit or Loss
Capital Market Borrowings 657 470 290 - - - 1,417 1,455
Borrowings from the Government of Canada 935 1,200 979 1,150 1,080 916 6,260 6,363
Total Designated at Fair Value through Profit or Loss 1,592 1,670 1,269 1,150 1,080 916 7,677 7,818
Yield1 3.2% 2.8% 2.1% 2.3% 2.0% 2.8% 2.6% 2.6%
Other Financial Liabilities
Canada Mortgage Bonds 30,697 31,721 29,380 38,284 30,829 46,144 207,055 204,463
Borrowings from the Government of Canada 2,341 268 329 389 335 2,895 6,557 32,915
Total Other Financial Liabilities 33,038 31,989 29,709 38,673 31,164 49,039 213,612 237,378
Yield1 2.6% 2.1% 1.8% 2.3% 1.8% 3.2% 2.4% 2.5%
Total 34,630 33,659 30,978 39,823 32,244 49,955 221,289 245,196
1 Represents the weighted-average yield, determined by applying the weighted-average effective yields of individual fixed rate borrowings and the weighted-average yields-to-reset of floating rate notes.
Borrowings – Designated at Fair Value through Profit or Loss
Included in this category are Capital Market Borrowings which consist of fixed rate notes with an original term to maturity ranging from
two to ten years.
Also included in this category are Borrowings from the Government of Canada which are short-term and medium-term debt.
Short-term debt, having an original term to maturity less than 365 days, was nil at 31 December 2014 (2013 – $98 million with
a yield of 0.9%). Medium-term debt includes fixed rate notes, with an original term to maturity ranging from two to ten years.
The carrying amount at 31 December 2014 of Borrowings – Designated at Fair Value through Profit and Loss is $165 million higher
(2013 – $132 million) than the contractual amount due at maturity. Our liabilities are backed by the full faith and credit of the
Government of Canada and there is no significant change in value that can be attributed to changes in credit risk.
The following table presents issuances and repayments for Borrowings – Designated at Fair Value through Profit or Loss.
(in millions)
2014 2013
Issuances Repayments Issuances Repayments
Capital Market Borrowings - - - 350
Borrowings from the Government of Canada 2,954 3,129 2,790 2,975
Total 2,954 3,129 2,790 3,325
Borrowings – Other Financial Liabilities
This category includes borrowings we issued for the IMPP and the CMB Program as well as Borrowings from the Government of
Canada for some of our Lending Programs.
The following table presents issuances and repayments for Borrowings – Other Financial Liabilities.
(in millions)
2014 2013
Issuances Repayments Issuances Repayments
Canada Mortgage Bonds 39,071 36,200 38,609 35,500
Borrowings from the Government of Canada - 26,360 - 24,683
Total 39,071 62,560 38,609 60,183
Canada Mor tgage and Housing Corporation 2014 ANNUAL REPORT92
Borrowing Authorities
The Minister of Finance approves CMHC’s Borrowing Plan annually and establishes limits and parameters for borrowings. The
Borrowing Authorities provide a maximum debt outstanding limit for 2014 of $43.5 billion. This limit includes Capital Market Borrowings
and Borrowings from the Government of Canada that were incurred since April 2008 in the Assisted Housing and Securitization
Activities, whose combined outstanding principal balance was $11.2 billion at 31 December 2014. The legislative authority, which does
not apply to borrowings of CHT, requires that the total indebtedness outstanding at any time, other than to the Government of Canada,
not exceed $20 billion. The outstanding principal balance of this indebtedness was $1.4 billion as at 31 December 2014.
13. Accounts Payable and Other LiabilitiesThe following table presents the composition of Accounts Payable and Other Liabilities.
(in millions) 2014 2013
Income Taxes Payable 231 -
Accrued Housing Programs Expenses 234 263
Other Miscellaneous Liabilities 208 204
Total 673 467
14. Pension and Other Post-Employment BenefitsDefined Benefit Plans
The defined benefit plans include the defined benefit component of the Pension Plan and the Supplemental Plan as well as the other
non-pension post-employment defined benefit plans.
Effective 4 April 2013, the defined benefit component of the Pension Plan and the Supplemental Plan are closed to new entrants.
Our defined benefit component of the Pension Plan requires contributions to be made to a separately administered fund (the Pension
Fund) whereas the defined benefit component of the Supplemental Plan and the other non-pension post-employment defined benefits
are unfunded and the benefits are paid directly by the Corporation.
Pursuant to a trust agreement we entered into between with the Pension Fund Trustees (the Trustees), they are responsible for the
management and administration of the Pension Fund. There are eight Trustees, including our President, one member of the Board
of Directors, three members of senior management and three Pension Council members (a combination of current and retired
employees). The Trustees set investment policies and objectives within the context of the Enterprise Risk Management policies
established by the Board of Directors, and periodically review the Pension Fund’s asset allocation policy. The Pension Fund’s Investment
Committee assists the Trustees in the investment management of the defined benefit component of the Pension Plan.
The Pension Fund’s asset allocation policy is based upon the principle of diversification of investments among various asset classes
relative to the liabilities of the defined benefit component of the Pension Plan. The current policy has been established at 57%
public equity investments, 28% fixed income securities and 15% inflation sensitive assets. The policy includes permissible ranges
around these percentage weights. The investments of the Pension Fund are subject to credit, liquidity and market risks. The most
significant of these risks is asset volatility due to market conditions. The liabilities of the defined benefit component of the Pension
Fund are adjusted to the Consumer Price Index and as such, they are subject to interest rate risks, inflation risk and changes in the
life expectancy of the plan members. The most significant is interest rate risk as the present value of the liabilities is calculated using
a discount rate set with reference to Canadian AA-Corporate bond yields. If the Pension Fund assets underperform this yield, the
funded position of the defined benefit component of the Pension Plan decreases. Financial risks are managed primarily through the
diversification of assets and prudent investment strategies.
Canada Mor tgage and Housing Corporation 2014 ANNUAL REPORT 93
The actuarial valuation on a going concern basis of our defined benefit component of the Pension Plan reports a surplus as at
31 December 2014. As a result, we are not required to make going concern special payments. The valuation on a solvency basis,
which assumes that the plan is wound up at the valuation date, reports a deficit as at 31 December 2014 and we are required to
make special payments of $85.4 million in 2015 to reduce the solvency deficiency. As permitted under the Pension Benefits Standards
Act, 1985 (PBSA) and its related regulations, we are seeking approval to reduce the amount of the solvency special payments. If the
reduction is approved, it will decrease the solvency special payments in 2015 from $85.4 million to $43.7 million. As such, the total
special payments are expected to be $43.7 million in 2015 (2014 – $54 million).
We continue to make full normal contributions and to monitor the defined benefit component of the Pension Plan. The next actuarial
valuation will be undertaken at year-end 2015, with the results reported in the 2015 Annual Report Consolidated Financial Statements.
The defined benefit obligation relating to the defined benefit plans is funded as follows:
(in millions)
Pension Benefit Plans Other Post-employment Benefit Plans
2014 2013 2014 2013
Wholly or Partially Funded 1,935 1,667 - -
Wholly Unfunded 67 52 196 175
Defined Benefit Obligation 2,002 1,719 196 175
Obligation and Assets
Information about the defined benefit plans is as follows:
Year ended 31 Dec. 2014 (in millions)
1 Jan.
2014
Pension Expense Included in Net Income
Benefits Paid
Remeas. of the
Net Def. Benefit
Plans Incl. in
OCI1
Employees’ Contri-butions
CMHC’s Contri-butions
31 Dec. 2014
Current Service
Cost
Interest Cost/
Income Curtailment
Sub-total
Included in Net
Income
Pension Benefit Plans
Defined Benefit Obligation 1,719 31 80 (3) 108 (85) 244 16 - 2,002
Fair Value of Plan Assets 1,544 - 72 - 72 (85) 96 16 76 1,719
Pension Benefit Plans Liability 175 31 8 (3) 36 - 148 - (76) 283
Other Post-employment Benefit Plans
Defined Benefit Obligation 175 4 8 (9) 3 (7) 25 - - 196
Fair Value of Plan Assets - - - - - (7) - - 7 -
Other Post-employment Benefit Plans Liability
175 4 8 (9) 3 - 25 - (7) 196
Defined Benefit Plans Liability 350 35 16 (12) 39 - 173 - (83) 479
1 The detailed breakdown of Remeasurements of the Net Defined Benefit Plans Included in OCI is found in additional tables below.
Canada Mor tgage and Housing Corporation 2014 ANNUAL REPORT94
Year ended 31 Dec. 2013 (in millions)
1 Jan.
2013
Pension Expense Included in Net Income
Benefits Paid
Remeas. of the
Net Def. Benefit
Plans Incl. in
OCI1
Employees’ Contri-butions
CMHC’s Contri-butions
31 Dec. 2013
Current Service
Cost
Interest Cost/
Income Curtailment
Sub-total
Included in Net
Income
Pension Benefit Plans
Defined Benefit Obligation 1,806 33 70 - 103 (77) (128) 15 - 1,719
Fair Value of Plan Assets 1,299 - 49 - 49 (77) 153 15 105 1,544
Pension Benefit Plans Liability 507 33 21 - 54 - (281) - (105) 175
Other Post-employment Benefit Plans
Defined Benefit Obligation 210 6 8 - 14 (7) (42) - - 175
Fair Value of Plan Assets - - - - - (7) - - 7 -
Other Post-employment Benefit Plans Liability
210 6 8 - 14 - (42) - (7) 175
Defined Benefit Plans Liability 717 39 29 - 68 - (323) - (112) 350
1 The detailed breakdown of Remeasurements of the Net Defined Benefit Plans Included in OCI is found in additional tables below.
Plan membership decreased by 193 members (approximately 12.9%) resulting in a curtailment gain of $12 million.
The following tables present further detailed information on the various sources of Remeasurement in OCI included in the prior table:
Year ended 31 December 2014 (in millions)
Remeasurement Gains/Losses Included in OCI
Return of Plan Assets (Excluding
Amounts Included in Interest Income)
Actuarial Changes Arising
from Changes in Demographic
Assumptions
Actuarial Changes Arising
from Changes in Financial
Assumptions
Actuarial Changes
Arising from Plan
Experience
Total Included
in OCI
Pension Benefit Plans
Defined Benefit Obligation - 30 212 2 244
Fair Value of Plan Assets 96 - - - 96
Pension Benefit Plans Liability (96) 30 212 2 148
Other Post-employment Benefit Plans
Defined Benefit Obligation - - 25 - 25
Fair Value of Plan Assets - - - - -
Other Post-employment Benefit Plans Liability - - 25 - 25
Defined Benefit Plans Liability (96) 30 237 2 173
Canada Mor tgage and Housing Corporation 2014 ANNUAL REPORT 95
Year ended 31 December 2013 (in millions)
Remeasurement Gains/Losses Included in OCI
Return of Plan Assets (Excluding
Amounts Included in Interest Income)
Actuarial Changes Arising
from Changes in Demographic
Assumptions
Actuarial Changes Arising
from Changes in Financial
Assumptions
Actuarial Changes
Arising from Plan
Experience
Total Included
in OCI
Pension Benefit Plans
Defined Benefit Obligation - 107 (250) 15 (128)
Fair Value of Plan Assets 153 - - - 153
Pension Benefit Plans Liability (153) 107 (250) 15 (281)
Other Post-employment Benefit Plans
Defined Benefit Obligation - 1 (39) (4) (42)
Fair Value of Plan Assets - - - - -
Other Post-employment Benefit Plans Liability - 1 (39) (4) (42)
Defined Benefit Plans Liability (153) 108 (289) 11 (323)
The Remeasurement of Plan Assets is the difference between the actual rate of return on the defined benefit pension plan assets and
the discount rate used to measure the obligation. The actual return on plan assets was $168 million (2013 – $202 million).
Information on the fair value of the investments which are administered by the Trustees is as follows:
(in millions, unless otherwise indicated)
2014 2013
Quoted Unquoted Total In % Quoted Unquoted Total In %
Cash and cash equivalents 2 - 2 0.1% 2 - 2 0.1%
Short-term Investments1 66 - 66 3.8% 32 - 32 2.1%
Bonds and Debentures2
Securities Issued or Guaranteed by the Government of Canada
98 - 98 5.7% 96 - 96 6.2%
Other Securities 294 - 294 17.1% 225 - 225 14.6%
Equities
Canadian Equities 490 2 492 28.6% 475 - 475 30.8%
Foreign Equities 563 - 563 32.9% 514 - 514 33.3%
Infrastructure - 21 21 1.2% - 19 19 1.2%
Real Return Securities3 35 - 35 2.0% 29 - 29 1.9%
Real Estate - 145 145 8.5% - 151 151 9.8%
Total 1,548 168 1,716 100.0% 1,373 170 1,543 100.0%
1 Includes $66 million or 3.8% (2013 – $32 million or 2.3%) of investments made in securities issued or guaranteed by related parties.2 Includes $48 million or 2.8% (2013 – $33 million or 2.4%) of investments made in securities we guaranteed (Canada Mortgage Bonds) and $50 million
or 2.9% (2013 – $63 million or 4.6%) of investments made in securities issued or guaranteed by related parties.3 Includes $31 million or 1.8% (2013 – $26 million or 1.9%) of investments made in securities issued or guaranteed by related parties.
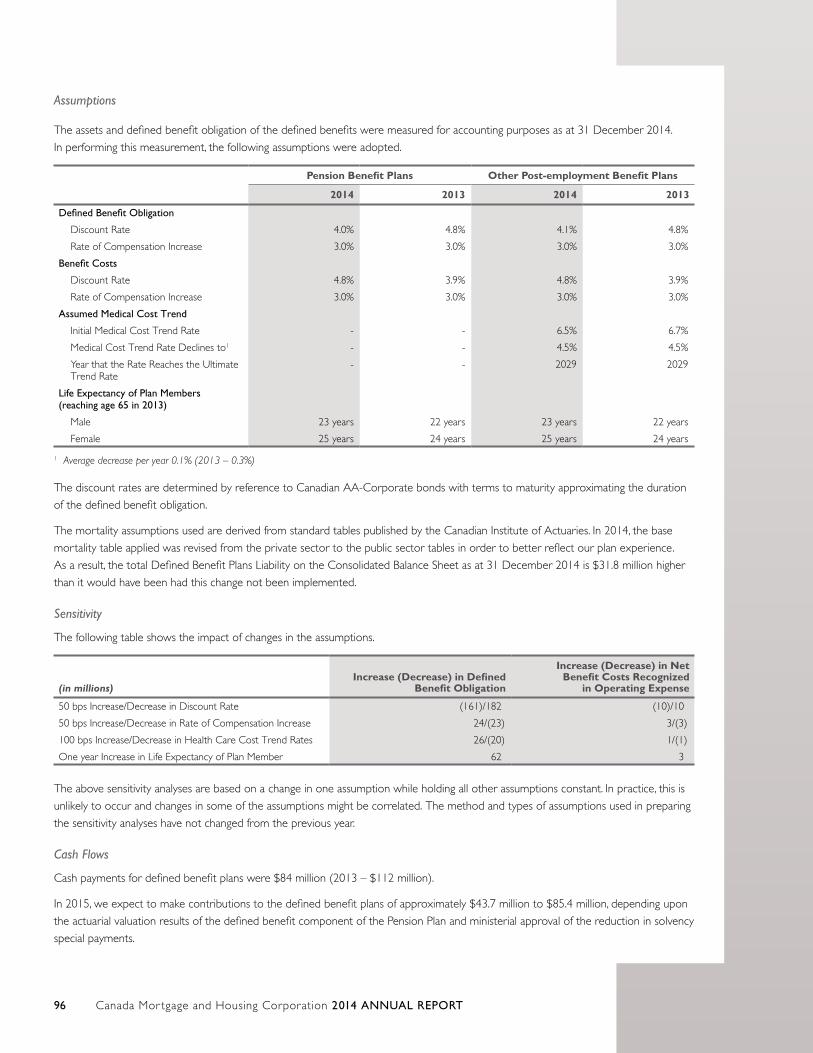
Canada Mor tgage and Housing Corporation 2014 ANNUAL REPORT96
Assumptions
The assets and defined benefit obligation of the defined benefits were measured for accounting purposes as at 31 December 2014.
In performing this measurement, the following assumptions were adopted.
Pension Benefit Plans Other Post-employment Benefit Plans
2014 2013 2014 2013
Defined Benefit Obligation
Discount Rate 4.0% 4.8% 4.1% 4.8%
Rate of Compensation Increase 3.0% 3.0% 3.0% 3.0%
Benefit Costs
Discount Rate 4.8% 3.9% 4.8% 3.9%
Rate of Compensation Increase 3.0% 3.0% 3.0% 3.0%
Assumed Medical Cost Trend
Initial Medical Cost Trend Rate - - 6.5% 6.7%
Medical Cost Trend Rate Declines to1 - - 4.5% 4.5%
Year that the Rate Reaches the Ultimate Trend Rate
- - 2029 2029
Life Expectancy of Plan Members (reaching age 65 in 2013)
Male 23 years 22 years 23 years 22 years
Female 25 years 24 years 25 years 24 years
1 Average decrease per year 0.1% (2013 – 0.3%)
The discount rates are determined by reference to Canadian AA-Corporate bonds with terms to maturity approximating the duration
of the defined benefit obligation.
The mortality assumptions used are derived from standard tables published by the Canadian Institute of Actuaries. In 2014, the base
mortality table applied was revised from the private sector to the public sector tables in order to better reflect our plan experience.
As a result, the total Defined Benefit Plans Liability on the Consolidated Balance Sheet as at 31 December 2014 is $31.8 million higher
than it would have been had this change not been implemented.
Sensitivity
The following table shows the impact of changes in the assumptions.
(in millions)Increase (Decrease) in Defined
Benefit Obligation
Increase (Decrease) in Net Benefit Costs Recognized
in Operating Expense
50 bps Increase/Decrease in Discount Rate (161)/182 (10)/10
50 bps Increase/Decrease in Rate of Compensation Increase 24/(23) 3/(3)
100 bps Increase/Decrease in Health Care Cost Trend Rates 26/(20) 1/(1)
One year Increase in Life Expectancy of Plan Member 62 3
The above sensitivity analyses are based on a change in one assumption while holding all other assumptions constant. In practice, this is
unlikely to occur and changes in some of the assumptions might be correlated. The method and types of assumptions used in preparing
the sensitivity analyses have not changed from the previous year.
Cash Flows
Cash payments for defined benefit plans were $84 million (2013 – $112 million).
In 2015, we expect to make contributions to the defined benefit plans of approximately $43.7 million to $85.4 million, depending upon
the actuarial valuation results of the defined benefit component of the Pension Plan and ministerial approval of the reduction in solvency
special payments.
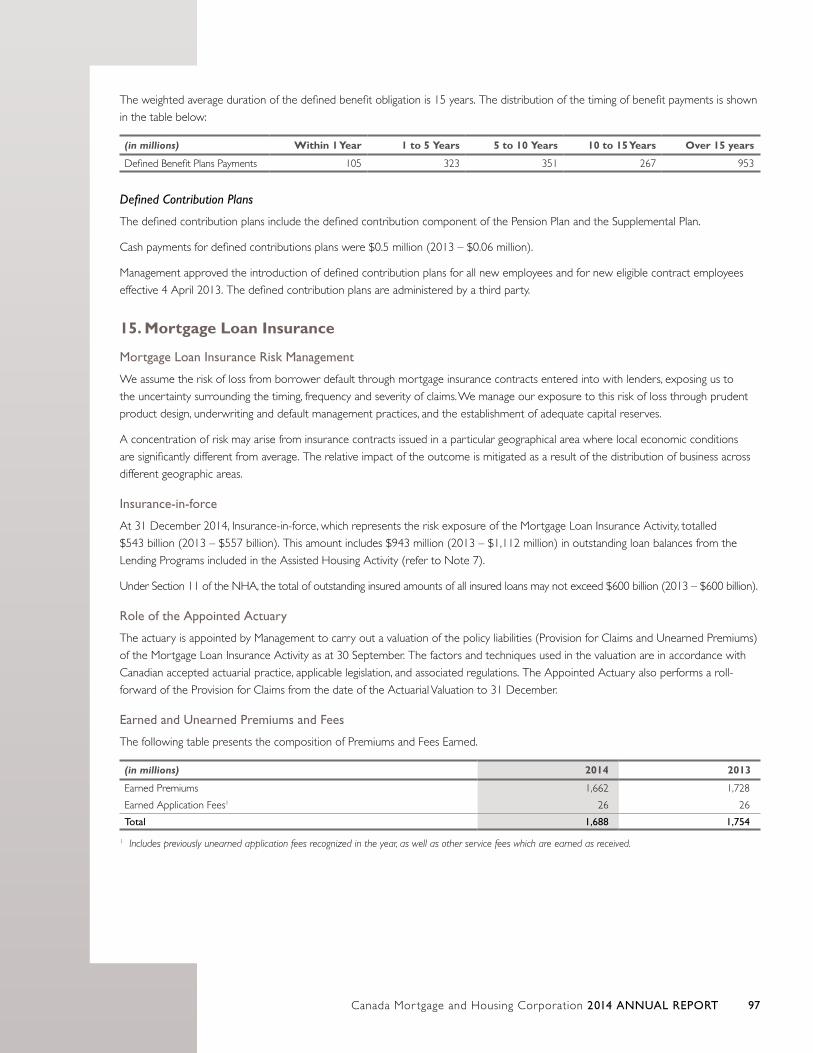
Canada Mor tgage and Housing Corporation 2014 ANNUAL REPORT 97
The weighted average duration of the defined benefit obligation is 15 years. The distribution of the timing of benefit payments is shown
in the table below:
(in millions) Within 1 Year 1 to 5 Years 5 to 10 Years 10 to 15 Years Over 15 years
Defined Benefit Plans Payments 105 323 351 267 953
Defined Contribution Plans
The defined contribution plans include the defined contribution component of the Pension Plan and the Supplemental Plan.
Cash payments for defined contributions plans were $0.5 million (2013 – $0.06 million).
Management approved the introduction of defined contribution plans for all new employees and for new eligible contract employees
effective 4 April 2013. The defined contribution plans are administered by a third party.
15. Mortgage Loan Insurance
Mortgage Loan Insurance Risk Management
We assume the risk of loss from borrower default through mortgage insurance contracts entered into with lenders, exposing us to
the uncertainty surrounding the timing, frequency and severity of claims. We manage our exposure to this risk of loss through prudent
product design, underwriting and default management practices, and the establishment of adequate capital reserves.
A concentration of risk may arise from insurance contracts issued in a particular geographical area where local economic conditions
are significantly different from average. The relative impact of the outcome is mitigated as a result of the distribution of business across
different geographic areas.
Insurance-in-force
At 31 December 2014, Insurance-in-force, which represents the risk exposure of the Mortgage Loan Insurance Activity, totalled
$543 billion (2013 – $557 billion). This amount includes $943 million (2013 – $1,112 million) in outstanding loan balances from the
Lending Programs included in the Assisted Housing Activity (refer to Note 7).
Under Section 11 of the NHA, the total of outstanding insured amounts of all insured loans may not exceed $600 billion (2013 – $600 billion).
Role of the Appointed Actuary
The actuary is appointed by Management to carry out a valuation of the policy liabilities (Provision for Claims and Unearned Premiums)
of the Mortgage Loan Insurance Activity as at 30 September. The factors and techniques used in the valuation are in accordance with
Canadian accepted actuarial practice, applicable legislation, and associated regulations. The Appointed Actuary also performs a roll-
forward of the Provision for Claims from the date of the Actuarial Valuation to 31 December.
Earned and Unearned Premiums and Fees
The following table presents the composition of Premiums and Fees Earned.
(in millions) 2014 2013
Earned Premiums 1,662 1,728
Earned Application Fees1 26 26
Total 1,688 1,754
1 Includes previously unearned application fees recognized in the year, as well as other service fees which are earned as received.
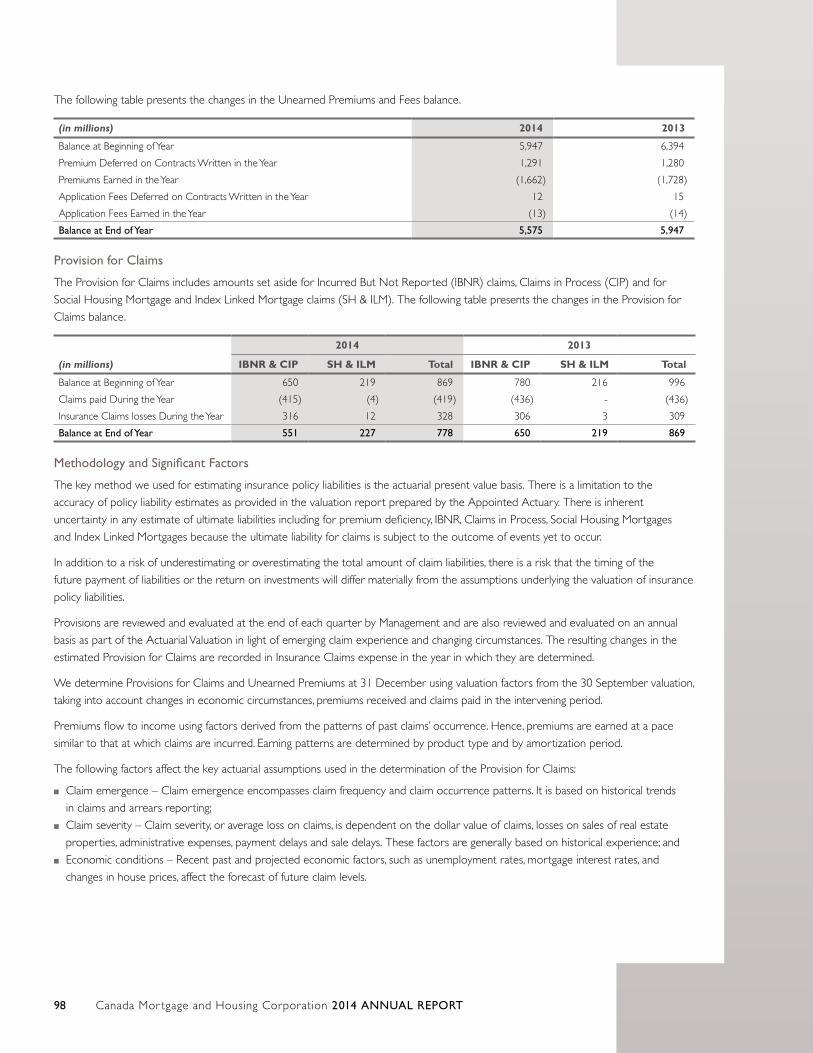
Canada Mor tgage and Housing Corporation 2014 ANNUAL REPORT98
The following table presents the changes in the Unearned Premiums and Fees balance.
(in millions) 2014 2013
Balance at Beginning of Year 5,947 6,394
Premium Deferred on Contracts Written in the Year 1,291 1,280
Premiums Earned in the Year (1,662) (1,728)
Application Fees Deferred on Contracts Written in the Year 12 15
Application Fees Earned in the Year (13) (14)
Balance at End of Year 5,575 5,947
Provision for Claims
The Provision for Claims includes amounts set aside for Incurred But Not Reported (IBNR) claims, Claims in Process (CIP) and for
Social Housing Mortgage and Index Linked Mortgage claims (SH & ILM). The following table presents the changes in the Provision for
Claims balance.
(in millions)
2014 2013
IBNR & CIP SH & ILM Total IBNR & CIP SH & ILM Total
Balance at Beginning of Year 650 219 869 780 216 996
Claims paid During the Year (415) (4) (419) (436) - (436)
Insurance Claims losses During the Year 316 12 328 306 3 309
Balance at End of Year 551 227 778 650 219 869
Methodology and Significant Factors
The key method we used for estimating insurance policy liabilities is the actuarial present value basis. There is a limitation to the
accuracy of policy liability estimates as provided in the valuation report prepared by the Appointed Actuary. There is inherent
uncertainty in any estimate of ultimate liabilities including for premium deficiency, IBNR, Claims in Process, Social Housing Mortgages
and Index Linked Mortgages because the ultimate liability for claims is subject to the outcome of events yet to occur.
In addition to a risk of underestimating or overestimating the total amount of claim liabilities, there is a risk that the timing of the
future payment of liabilities or the return on investments will differ materially from the assumptions underlying the valuation of insurance
policy liabilities.
Provisions are reviewed and evaluated at the end of each quarter by Management and are also reviewed and evaluated on an annual
basis as part of the Actuarial Valuation in light of emerging claim experience and changing circumstances. The resulting changes in the
estimated Provision for Claims are recorded in Insurance Claims expense in the year in which they are determined.
We determine Provisions for Claims and Unearned Premiums at 31 December using valuation factors from the 30 September valuation,
taking into account changes in economic circumstances, premiums received and claims paid in the intervening period.
Premiums flow to income using factors derived from the patterns of past claims’ occurrence. Hence, premiums are earned at a pace
similar to that at which claims are incurred. Earning patterns are determined by product type and by amortization period.
The following factors affect the key actuarial assumptions used in the determination of the Provision for Claims:
■■ Claim emergence – Claim emergence encompasses claim frequency and claim occurrence patterns. It is based on historical trends
in claims and arrears reporting;
■■ Claim severity – Claim severity, or average loss on claims, is dependent on the dollar value of claims, losses on sales of real estate
properties, administrative expenses, payment delays and sale delays. These factors are generally based on historical experience; and
■■ Economic conditions – Recent past and projected economic factors, such as unemployment rates, mortgage interest rates, and
changes in house prices, affect the forecast of future claim levels.
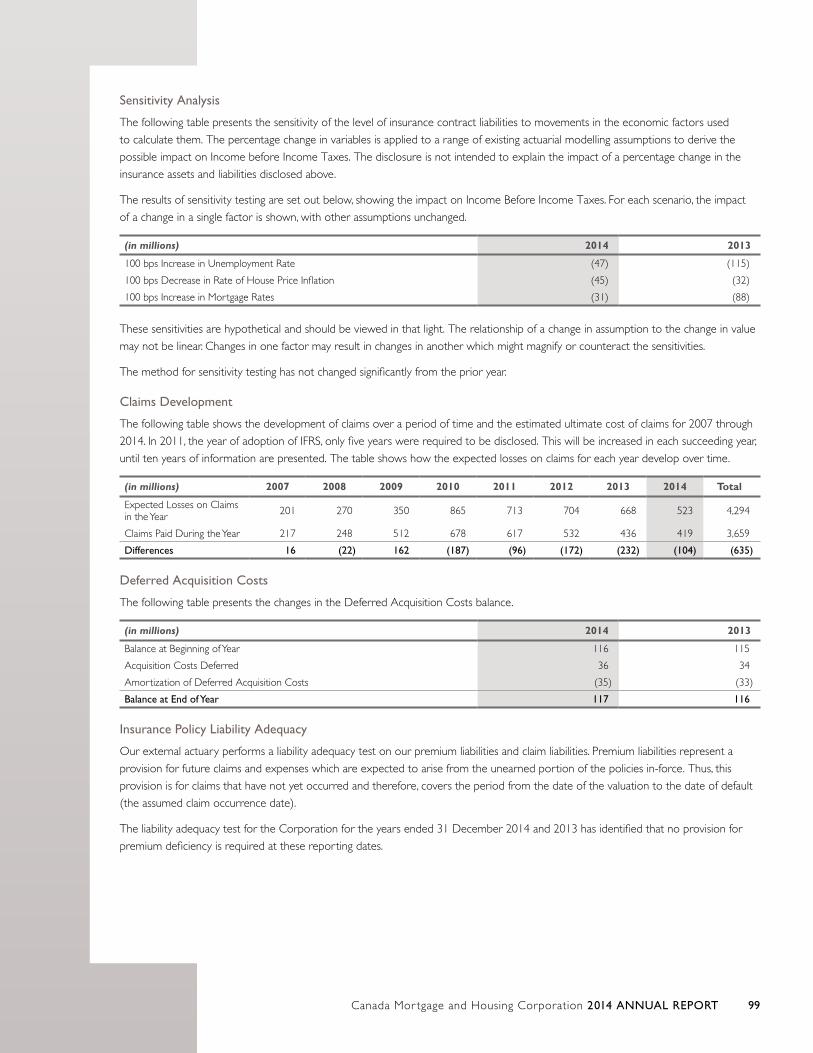
Canada Mor tgage and Housing Corporation 2014 ANNUAL REPORT 99
Sensitivity Analysis
The following table presents the sensitivity of the level of insurance contract liabilities to movements in the economic factors used
to calculate them. The percentage change in variables is applied to a range of existing actuarial modelling assumptions to derive the
possible impact on Income before Income Taxes. The disclosure is not intended to explain the impact of a percentage change in the
insurance assets and liabilities disclosed above.
The results of sensitivity testing are set out below, showing the impact on Income Before Income Taxes. For each scenario, the impact
of a change in a single factor is shown, with other assumptions unchanged.
(in millions) 2014 2013
100 bps Increase in Unemployment Rate (47) (115)
100 bps Decrease in Rate of House Price Inflation (45) (32)
100 bps Increase in Mortgage Rates (31) (88)
These sensitivities are hypothetical and should be viewed in that light. The relationship of a change in assumption to the change in value
may not be linear. Changes in one factor may result in changes in another which might magnify or counteract the sensitivities.
The method for sensitivity testing has not changed significantly from the prior year.
Claims Development
The following table shows the development of claims over a period of time and the estimated ultimate cost of claims for 2007 through
2014. In 2011, the year of adoption of IFRS, only five years were required to be disclosed. This will be increased in each succeeding year,
until ten years of information are presented. The table shows how the expected losses on claims for each year develop over time.
(in millions) 2007 2008 2009 2010 2011 2012 2013 2014 Total
Expected Losses on Claims in the Year 201 270 350 865 713 704 668 523 4,294
Claims Paid During the Year 217 248 512 678 617 532 436 419 3,659
Differences 16 (22) 162 (187) (96) (172) (232) (104) (635)
Deferred Acquisition Costs
The following table presents the changes in the Deferred Acquisition Costs balance.
(in millions) 2014 2013
Balance at Beginning of Year 116 115
Acquisition Costs Deferred 36 34
Amortization of Deferred Acquisition Costs (35) (33)
Balance at End of Year 117 116
Insurance Policy Liability Adequacy
Our external actuary performs a liability adequacy test on our premium liabilities and claim liabilities. Premium liabilities represent a
provision for future claims and expenses which are expected to arise from the unearned portion of the policies in-force. Thus, this
provision is for claims that have not yet occurred and therefore, covers the period from the date of the valuation to the date of default
(the assumed claim occurrence date).
The liability adequacy test for the Corporation for the years ended 31 December 2014 and 2013 has identified that no provision for
premium deficiency is required at these reporting dates.
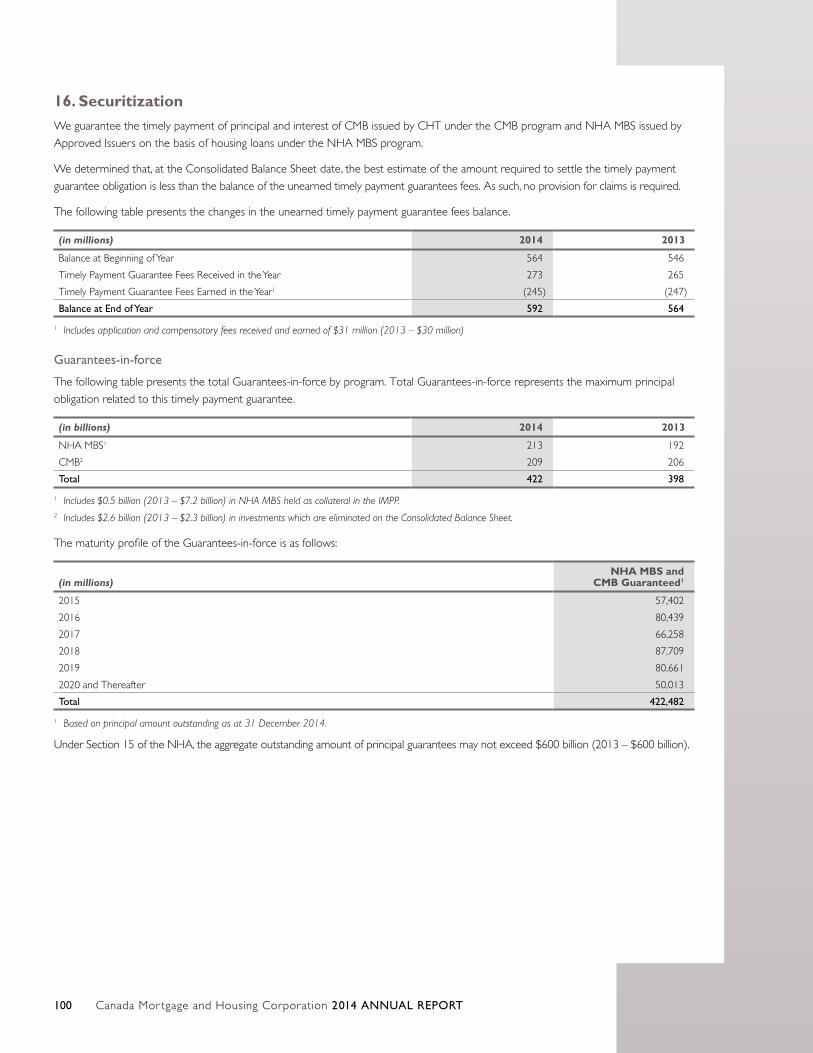
Canada Mor tgage and Housing Corporation 2014 ANNUAL REPORT100
16. Securitization We guarantee the timely payment of principal and interest of CMB issued by CHT under the CMB program and NHA MBS issued by
Approved Issuers on the basis of housing loans under the NHA MBS program.
We determined that, at the Consolidated Balance Sheet date, the best estimate of the amount required to settle the timely payment
guarantee obligation is less than the balance of the unearned timely payment guarantees fees. As such, no provision for claims is required.
The following table presents the changes in the unearned timely payment guarantee fees balance.
(in millions) 2014 2013
Balance at Beginning of Year 564 546
Timely Payment Guarantee Fees Received in the Year 273 265
Timely Payment Guarantee Fees Earned in the Year1 (245) (247)
Balance at End of Year 592 564
1 Includes application and compensatory fees received and earned of $31 million (2013 – $30 million)
Guarantees-in-force
The following table presents the total Guarantees-in-force by program. Total Guarantees-in-force represents the maximum principal
obligation related to this timely payment guarantee.
(in billions) 2014 2013
NHA MBS1 213 192
CMB2 209 206
Total 422 398
1 Includes $0.5 billion (2013 – $7.2 billion) in NHA MBS held as collateral in the IMPP. 2 Includes $2.6 billion (2013 – $2.3 billion) in investments which are eliminated on the Consolidated Balance Sheet.
The maturity profile of the Guarantees-in-force is as follows:
(in millions)NHA MBS and
CMB Guaranteed1
2015 57,402
2016 80,439
2017 66,258
2018 87,709
2019 80,661
2020 and Thereafter 50,013
Total 422,482
1 Based on principal amount outstanding as at 31 December 2014.
Under Section 15 of the NHA, the aggregate outstanding amount of principal guarantees may not exceed $600 billion (2013 – $600 billion).
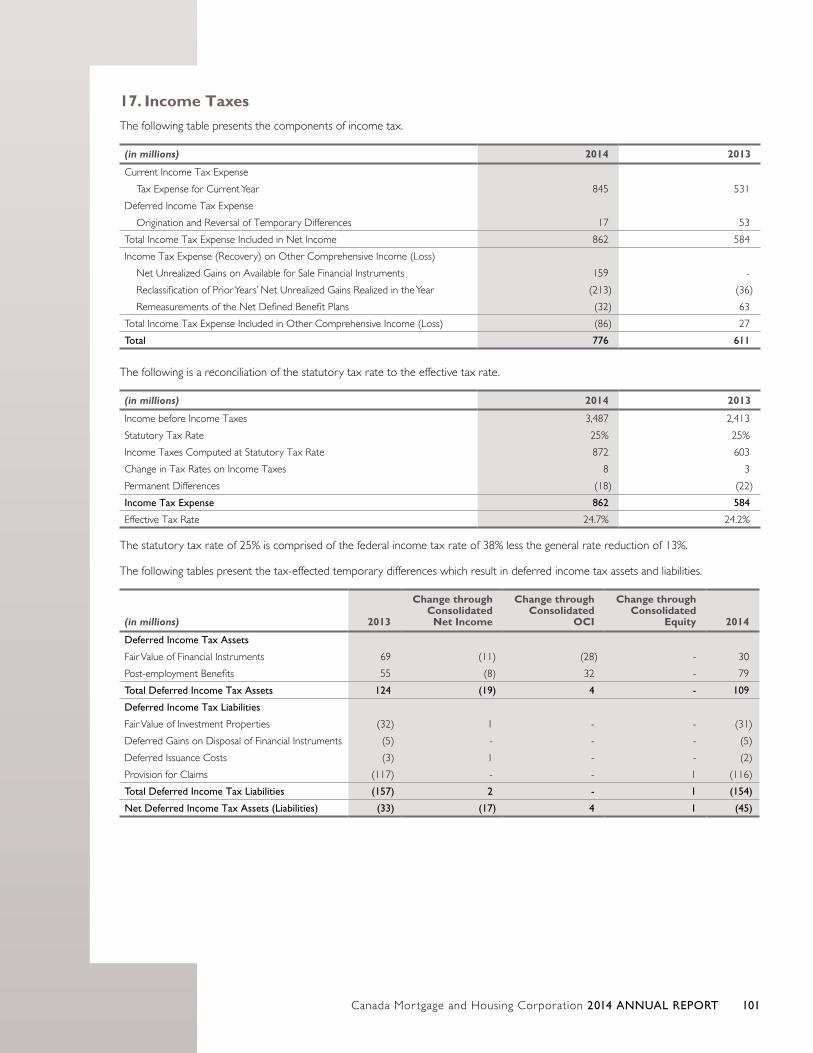
Canada Mor tgage and Housing Corporation 2014 ANNUAL REPORT 101
17. Income TaxesThe following table presents the components of income tax.
(in millions) 2014 2013
Current Income Tax Expense
Tax Expense for Current Year 845 531
Deferred Income Tax Expense
Origination and Reversal of Temporary Differences 17 53
Total Income Tax Expense Included in Net Income 862 584
Income Tax Expense (Recovery) on Other Comprehensive Income (Loss)
Net Unrealized Gains on Available for Sale Financial Instruments 159 -
Reclassification of Prior Years’ Net Unrealized Gains Realized in the Year (213) (36)
Remeasurements of the Net Defined Benefit Plans (32) 63
Total Income Tax Expense Included in Other Comprehensive Income (Loss) (86) 27
Total 776 611
The following is a reconciliation of the statutory tax rate to the effective tax rate.
(in millions) 2014 2013
Income before Income Taxes 3,487 2,413
Statutory Tax Rate 25% 25%
Income Taxes Computed at Statutory Tax Rate 872 603
Change in Tax Rates on Income Taxes 8 3
Permanent Differences (18) (22)
Income Tax Expense 862 584
Effective Tax Rate 24.7% 24.2%
The statutory tax rate of 25% is comprised of the federal income tax rate of 38% less the general rate reduction of 13%.
The following tables present the tax-effected temporary differences which result in deferred income tax assets and liabilities.
(in millions) 2013
Change through Consolidated
Net Income
Change through Consolidated
OCI
Change through Consolidated
Equity 2014
Deferred Income Tax Assets
Fair Value of Financial Instruments 69 (11) (28) - 30
Post-employment Benefits 55 (8) 32 - 79
Total Deferred Income Tax Assets 124 (19) 4 - 109
Deferred Income Tax Liabilities
Fair Value of Investment Properties (32) 1 - - (31)
Deferred Gains on Disposal of Financial Instruments (5) - - - (5)
Deferred Issuance Costs (3) 1 - - (2)
Provision for Claims (117) - - 1 (116)
Total Deferred Income Tax Liabilities (157) 2 - 1 (154)
Net Deferred Income Tax Assets (Liabilities) (33) (17) 4 1 (45)
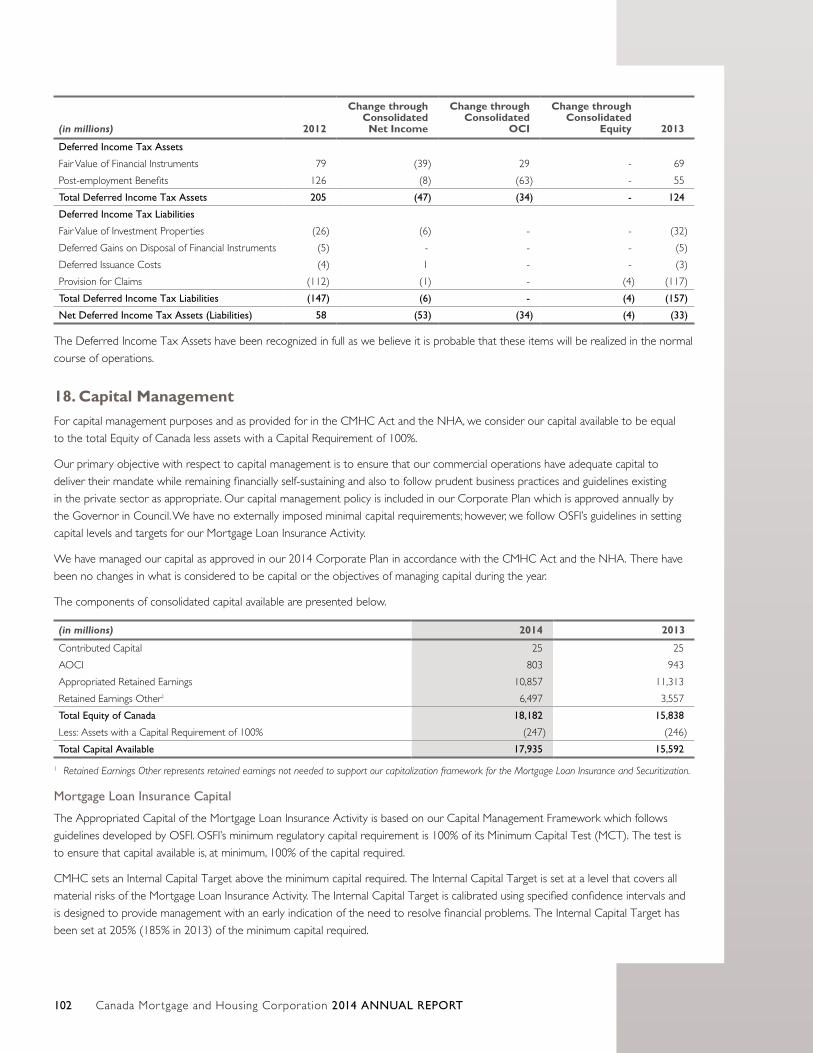
Canada Mor tgage and Housing Corporation 2014 ANNUAL REPORT102
(in millions) 2012
Change through Consolidated
Net Income
Change through Consolidated
OCI
Change through Consolidated
Equity 2013
Deferred Income Tax Assets
Fair Value of Financial Instruments 79 (39) 29 - 69
Post-employment Benefits 126 (8) (63) - 55
Total Deferred Income Tax Assets 205 (47) (34) - 124
Deferred Income Tax Liabilities
Fair Value of Investment Properties (26) (6) - - (32)
Deferred Gains on Disposal of Financial Instruments (5) - - - (5)
Deferred Issuance Costs (4) 1 - - (3)
Provision for Claims (112) (1) - (4) (117)
Total Deferred Income Tax Liabilities (147) (6) - (4) (157)
Net Deferred Income Tax Assets (Liabilities) 58 (53) (34) (4) (33)
The Deferred Income Tax Assets have been recognized in full as we believe it is probable that these items will be realized in the normal
course of operations.
18. Capital Management For capital management purposes and as provided for in the CMHC Act and the NHA, we consider our capital available to be equal
to the total Equity of Canada less assets with a Capital Requirement of 100%.
Our primary objective with respect to capital management is to ensure that our commercial operations have adequate capital to
deliver their mandate while remaining financially self-sustaining and also to follow prudent business practices and guidelines existing
in the private sector as appropriate. Our capital management policy is included in our Corporate Plan which is approved annually by
the Governor in Council. We have no externally imposed minimal capital requirements; however, we follow OSFI’s guidelines in setting
capital levels and targets for our Mortgage Loan Insurance Activity.
We have managed our capital as approved in our 2014 Corporate Plan in accordance with the CMHC Act and the NHA. There have
been no changes in what is considered to be capital or the objectives of managing capital during the year.
The components of consolidated capital available are presented below.
(in millions) 2014 2013
Contributed Capital 25 25
AOCI 803 943
Appropriated Retained Earnings 10,857 11,313
Retained Earnings Other1 6,497 3,557
Total Equity of Canada 18,182 15,838
Less: Assets with a Capital Requirement of 100% (247) (246)
Total Capital Available 17,935 15,592
1 Retained Earnings Other represents retained earnings not needed to support our capitalization framework for the Mortgage Loan Insurance and Securitization.
Mortgage Loan Insurance Capital
The Appropriated Capital of the Mortgage Loan Insurance Activity is based on our Capital Management Framework which follows
guidelines developed by OSFI. OSFI’s minimum regulatory capital requirement is 100% of its Minimum Capital Test (MCT). The test is
to ensure that capital available is, at minimum, 100% of the capital required.
CMHC sets an Internal Capital Target above the minimum capital required. The Internal Capital Target is set at a level that covers all
material risks of the Mortgage Loan Insurance Activity. The Internal Capital Target is calibrated using specified confidence intervals and
is designed to provide management with an early indication of the need to resolve financial problems. The Internal Capital Target has
been set at 205% (185% in 2013) of the minimum capital required.
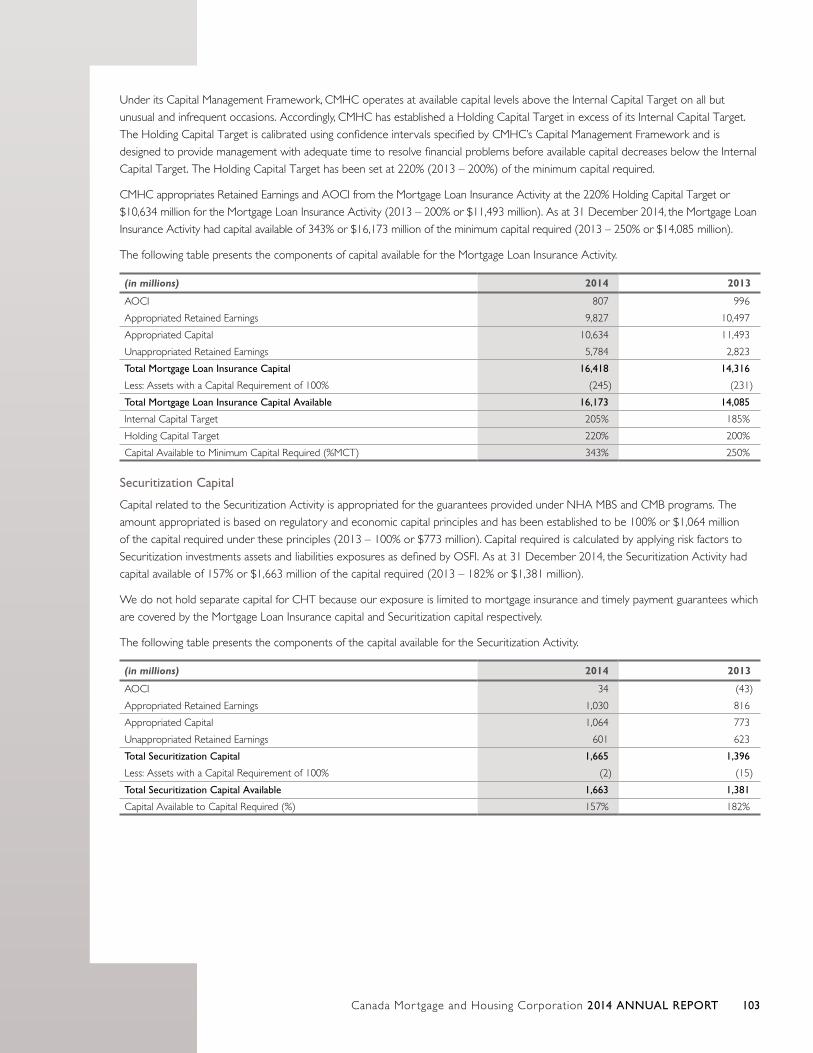
Canada Mor tgage and Housing Corporation 2014 ANNUAL REPORT 103
Under its Capital Management Framework, CMHC operates at available capital levels above the Internal Capital Target on all but
unusual and infrequent occasions. Accordingly, CMHC has established a Holding Capital Target in excess of its Internal Capital Target.
The Holding Capital Target is calibrated using confidence intervals specified by CMHC’s Capital Management Framework and is
designed to provide management with adequate time to resolve financial problems before available capital decreases below the Internal
Capital Target. The Holding Capital Target has been set at 220% (2013 – 200%) of the minimum capital required.
CMHC appropriates Retained Earnings and AOCI from the Mortgage Loan Insurance Activity at the 220% Holding Capital Target or
$10,634 million for the Mortgage Loan Insurance Activity (2013 – 200% or $11,493 million). As at 31 December 2014, the Mortgage Loan
Insurance Activity had capital available of 343% or $16,173 million of the minimum capital required (2013 – 250% or $14,085 million).
The following table presents the components of capital available for the Mortgage Loan Insurance Activity.
(in millions) 2014 2013
AOCI 807 996
Appropriated Retained Earnings 9,827 10,497
Appropriated Capital 10,634 11,493
Unappropriated Retained Earnings 5,784 2,823
Total Mortgage Loan Insurance Capital 16,418 14,316
Less: Assets with a Capital Requirement of 100% (245) (231)
Total Mortgage Loan Insurance Capital Available 16,173 14,085
Internal Capital Target 205% 185%
Holding Capital Target 220% 200%
Capital Available to Minimum Capital Required (%MCT) 343% 250%
Securitization Capital
Capital related to the Securitization Activity is appropriated for the guarantees provided under NHA MBS and CMB programs. The
amount appropriated is based on regulatory and economic capital principles and has been established to be 100% or $1,064 million
of the capital required under these principles (2013 – 100% or $773 million). Capital required is calculated by applying risk factors to
Securitization investments assets and liabilities exposures as defined by OSFI. As at 31 December 2014, the Securitization Activity had
capital available of 157% or $1,663 million of the capital required (2013 – 182% or $1,381 million).
We do not hold separate capital for CHT because our exposure is limited to mortgage insurance and timely payment guarantees which
are covered by the Mortgage Loan Insurance capital and Securitization capital respectively.
The following table presents the components of the capital available for the Securitization Activity.
(in millions) 2014 2013
AOCI 34 (43)
Appropriated Retained Earnings 1,030 816
Appropriated Capital 1,064 773
Unappropriated Retained Earnings 601 623
Total Securitization Capital 1,665 1,396
Less: Assets with a Capital Requirement of 100% (2) (15)
Total Securitization Capital Available 1,663 1,381
Capital Available to Capital Required (%) 157% 182%
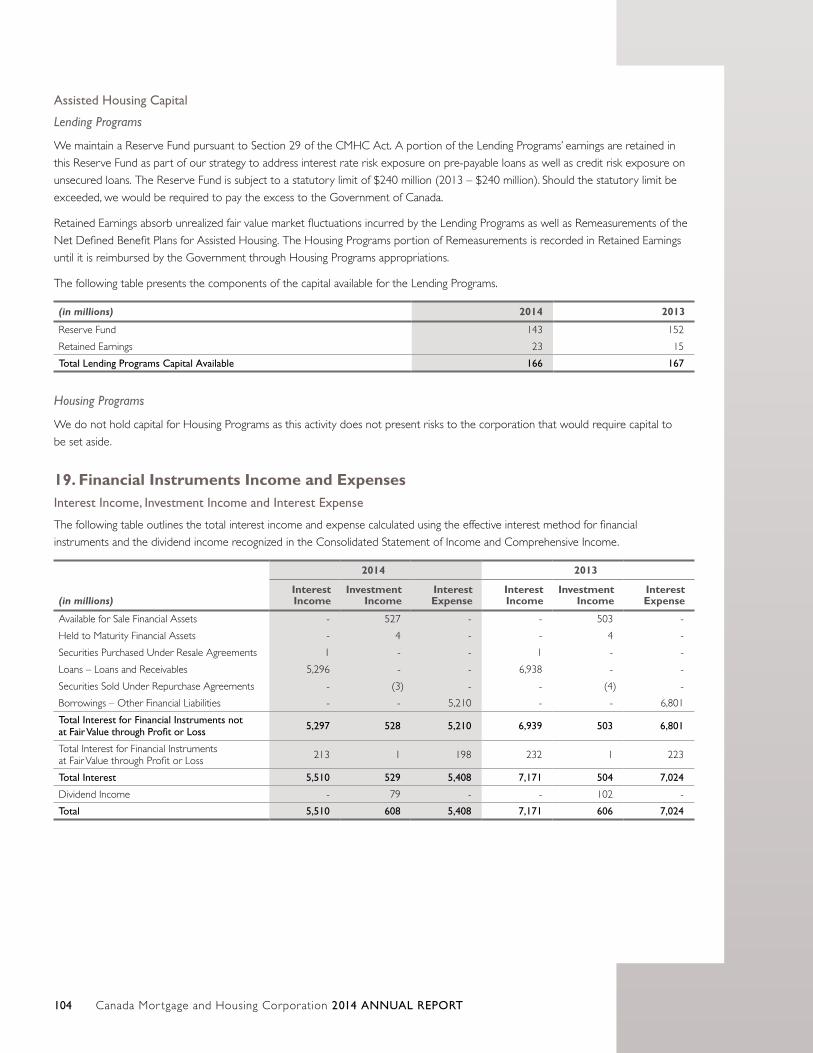
Canada Mor tgage and Housing Corporation 2014 ANNUAL REPORT104
Assisted Housing Capital
Lending Programs
We maintain a Reserve Fund pursuant to Section 29 of the CMHC Act. A portion of the Lending Programs’ earnings are retained in
this Reserve Fund as part of our strategy to address interest rate risk exposure on pre-payable loans as well as credit risk exposure on
unsecured loans. The Reserve Fund is subject to a statutory limit of $240 million (2013 – $240 million). Should the statutory limit be
exceeded, we would be required to pay the excess to the Government of Canada.
Retained Earnings absorb unrealized fair value market fluctuations incurred by the Lending Programs as well as Remeasurements of the
Net Defined Benefit Plans for Assisted Housing. The Housing Programs portion of Remeasurements is recorded in Retained Earnings
until it is reimbursed by the Government through Housing Programs appropriations.
The following table presents the components of the capital available for the Lending Programs.
(in millions) 2014 2013
Reserve Fund 143 152
Retained Earnings 23 15
Total Lending Programs Capital Available 166 167
Housing Programs
We do not hold capital for Housing Programs as this activity does not present risks to the corporation that would require capital to
be set aside.
19. Financial Instruments Income and ExpensesInterest Income, Investment Income and Interest Expense
The following table outlines the total interest income and expense calculated using the effective interest method for financial
instruments and the dividend income recognized in the Consolidated Statement of Income and Comprehensive Income.
(in millions)
2014 2013
Interest Income
Investment Income
Interest Expense
Interest Income
Investment Income
Interest Expense
Available for Sale Financial Assets - 527 - - 503 -
Held to Maturity Financial Assets - 4 - - 4 -
Securities Purchased Under Resale Agreements 1 - - 1 - -
Loans – Loans and Receivables 5,296 - - 6,938 - -
Securities Sold Under Repurchase Agreements - (3) - - (4) -
Borrowings – Other Financial Liabilities - - 5,210 - - 6,801
Total Interest for Financial Instruments not at Fair Value through Profit or Loss 5,297 528 5,210 6,939 503 6,801
Total Interest for Financial Instruments at Fair Value through Profit or Loss 213 1 198 232 1 223
Total Interest 5,510 529 5,408 7,171 504 7,024
Dividend Income - 79 - - 102 -
Total 5,510 608 5,408 7,171 606 7,024
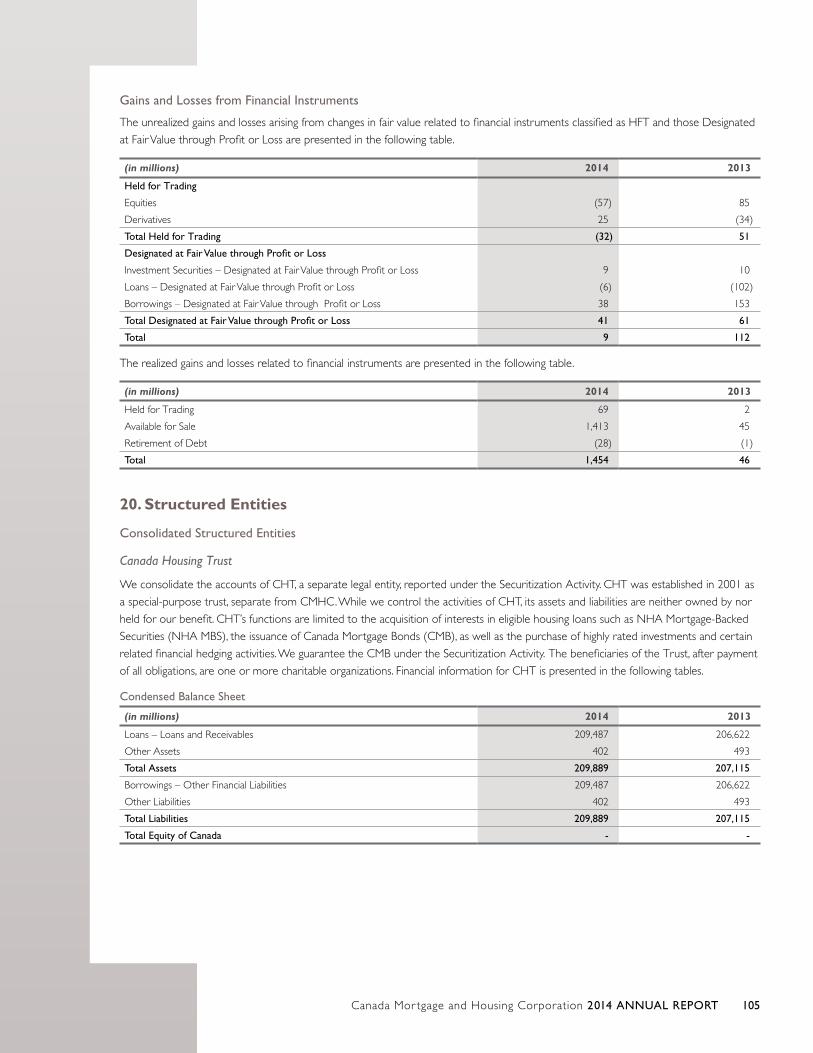
Canada Mor tgage and Housing Corporation 2014 ANNUAL REPORT 105
Gains and Losses from Financial Instruments
The unrealized gains and losses arising from changes in fair value related to financial instruments classified as HFT and those Designated
at Fair Value through Profit or Loss are presented in the following table.
(in millions) 2014 2013
Held for Trading
Equities (57) 85
Derivatives 25 (34)
Total Held for Trading (32) 51
Designated at Fair Value through Profit or Loss
Investment Securities – Designated at Fair Value through Profit or Loss 9 10
Loans – Designated at Fair Value through Profit or Loss (6) (102)
Borrowings – Designated at Fair Value through Profit or Loss 38 153
Total Designated at Fair Value through Profit or Loss 41 61
Total 9 112
The realized gains and losses related to financial instruments are presented in the following table.
(in millions) 2014 2013
Held for Trading 69 2
Available for Sale 1,413 45
Retirement of Debt (28) (1)
Total 1,454 46
20. Structured Entities
Consolidated Structured Entities
Canada Housing Trust
We consolidate the accounts of CHT, a separate legal entity, reported under the Securitization Activity. CHT was established in 2001 as
a special-purpose trust, separate from CMHC. While we control the activities of CHT, its assets and liabilities are neither owned by nor
held for our benefit. CHT’s functions are limited to the acquisition of interests in eligible housing loans such as NHA Mortgage-Backed
Securities (NHA MBS), the issuance of Canada Mortgage Bonds (CMB), as well as the purchase of highly rated investments and certain
related financial hedging activities. We guarantee the CMB under the Securitization Activity. The beneficiaries of the Trust, after payment
of all obligations, are one or more charitable organizations. Financial information for CHT is presented in the following tables.
Condensed Balance Sheet
(in millions) 2014 2013
Loans – Loans and Receivables 209,487 206,622
Other Assets 402 493
Total Assets 209,889 207,115
Borrowings – Other Financial Liabilities 209,487 206,622
Other Liabilities 402 493
Total Liabilities 209,889 207,115
Total Equity of Canada - -
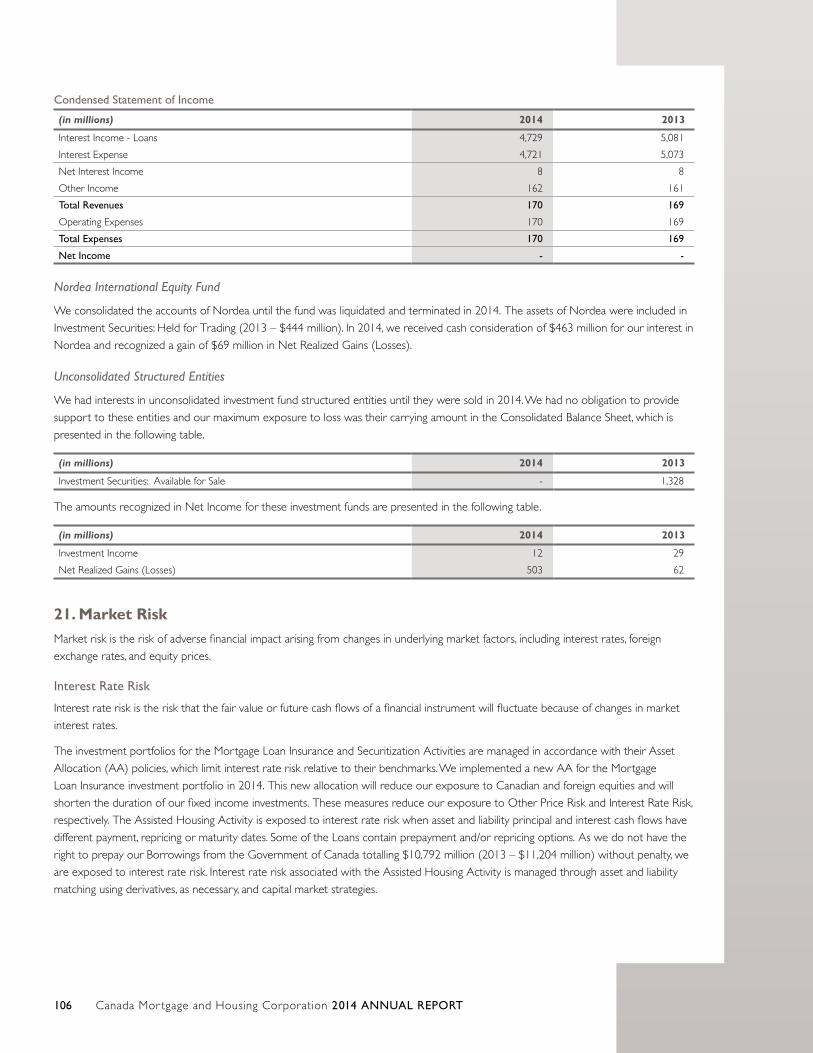
Canada Mor tgage and Housing Corporation 2014 ANNUAL REPORT106
Condensed Statement of Income
(in millions) 2014 2013
Interest Income - Loans 4,729 5,081
Interest Expense 4,721 5,073
Net Interest Income 8 8
Other Income 162 161
Total Revenues 170 169
Operating Expenses 170 169
Total Expenses 170 169
Net Income - -
Nordea International Equity Fund
We consolidated the accounts of Nordea until the fund was liquidated and terminated in 2014. The assets of Nordea were included in
Investment Securities: Held for Trading (2013 – $444 million). In 2014, we received cash consideration of $463 million for our interest in
Nordea and recognized a gain of $69 million in Net Realized Gains (Losses).
Unconsolidated Structured Entities
We had interests in unconsolidated investment fund structured entities until they were sold in 2014. We had no obligation to provide
support to these entities and our maximum exposure to loss was their carrying amount in the Consolidated Balance Sheet, which is
presented in the following table.
(in millions) 2014 2013
Investment Securities: Available for Sale - 1,328
The amounts recognized in Net Income for these investment funds are presented in the following table.
(in millions) 2014 2013
Investment Income 12 29
Net Realized Gains (Losses) 503 62
21. Market RiskMarket risk is the risk of adverse financial impact arising from changes in underlying market factors, including interest rates, foreign
exchange rates, and equity prices.
Interest Rate Risk
Interest rate risk is the risk that the fair value or future cash flows of a financial instrument will fluctuate because of changes in market
interest rates.
The investment portfolios for the Mortgage Loan Insurance and Securitization Activities are managed in accordance with their Asset
Allocation (AA) policies, which limit interest rate risk relative to their benchmarks. We implemented a new AA for the Mortgage
Loan Insurance investment portfolio in 2014. This new allocation will reduce our exposure to Canadian and foreign equities and will
shorten the duration of our fixed income investments. These measures reduce our exposure to Other Price Risk and Interest Rate Risk,
respectively. The Assisted Housing Activity is exposed to interest rate risk when asset and liability principal and interest cash flows have
different payment, repricing or maturity dates. Some of the Loans contain prepayment and/or repricing options. As we do not have the
right to prepay our Borrowings from the Government of Canada totalling $10,792 million (2013 – $11,204 million) without penalty, we
are exposed to interest rate risk. Interest rate risk associated with the Assisted Housing Activity is managed through asset and liability
matching using derivatives, as necessary, and capital market strategies.
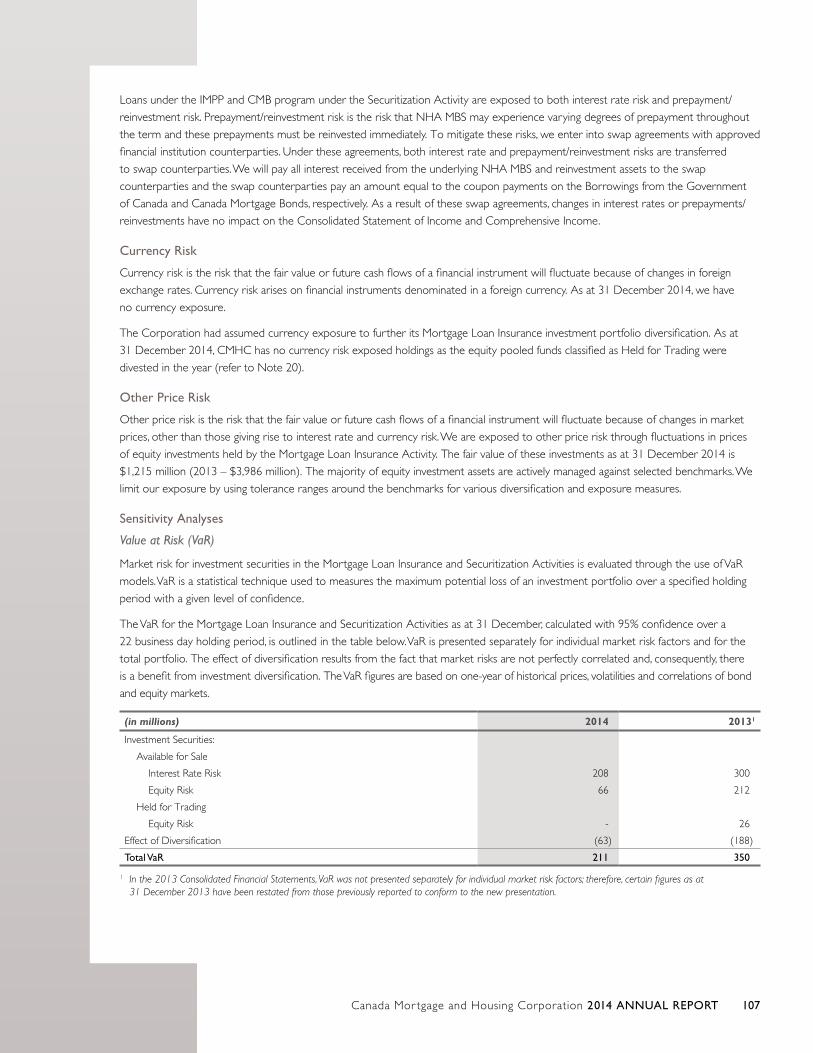
Canada Mor tgage and Housing Corporation 2014 ANNUAL REPORT 107
Loans under the IMPP and CMB program under the Securitization Activity are exposed to both interest rate risk and prepayment/
reinvestment risk. Prepayment/reinvestment risk is the risk that NHA MBS may experience varying degrees of prepayment throughout
the term and these prepayments must be reinvested immediately. To mitigate these risks, we enter into swap agreements with approved
financial institution counterparties. Under these agreements, both interest rate and prepayment/reinvestment risks are transferred
to swap counterparties. We will pay all interest received from the underlying NHA MBS and reinvestment assets to the swap
counterparties and the swap counterparties pay an amount equal to the coupon payments on the Borrowings from the Government
of Canada and Canada Mortgage Bonds, respectively. As a result of these swap agreements, changes in interest rates or prepayments/
reinvestments have no impact on the Consolidated Statement of Income and Comprehensive Income.
Currency Risk
Currency risk is the risk that the fair value or future cash flows of a financial instrument will fluctuate because of changes in foreign
exchange rates. Currency risk arises on financial instruments denominated in a foreign currency. As at 31 December 2014, we have
no currency exposure.
The Corporation had assumed currency exposure to further its Mortgage Loan Insurance investment portfolio diversification. As at
31 December 2014, CMHC has no currency risk exposed holdings as the equity pooled funds classified as Held for Trading were
divested in the year (refer to Note 20).
Other Price Risk
Other price risk is the risk that the fair value or future cash flows of a financial instrument will fluctuate because of changes in market
prices, other than those giving rise to interest rate and currency risk. We are exposed to other price risk through fluctuations in prices
of equity investments held by the Mortgage Loan Insurance Activity. The fair value of these investments as at 31 December 2014 is
$1,215 million (2013 – $3,986 million). The majority of equity investment assets are actively managed against selected benchmarks. We
limit our exposure by using tolerance ranges around the benchmarks for various diversification and exposure measures.
Sensitivity Analyses
Value at Risk (VaR)
Market risk for investment securities in the Mortgage Loan Insurance and Securitization Activities is evaluated through the use of VaR
models. VaR is a statistical technique used to measures the maximum potential loss of an investment portfolio over a specified holding
period with a given level of confidence.
The VaR for the Mortgage Loan Insurance and Securitization Activities as at 31 December, calculated with 95% confidence over a
22 business day holding period, is outlined in the table below. VaR is presented separately for individual market risk factors and for the
total portfolio. The effect of diversification results from the fact that market risks are not perfectly correlated and, consequently, there
is a benefit from investment diversification. The VaR figures are based on one-year of historical prices, volatilities and correlations of bond
and equity markets.
(in millions) 2014 20131
Investment Securities:
Available for Sale
Interest Rate Risk 208 300
Equity Risk 66 212
Held for Trading
Equity Risk - 26
Effect of Diversification (63) (188)
Total VaR 211 350
1 In the 2013 Consolidated Financial Statements, VaR was not presented separately for individual market risk factors; therefore, certain figures as at 31 December 2013 have been restated from those previously reported to conform to the new presentation.
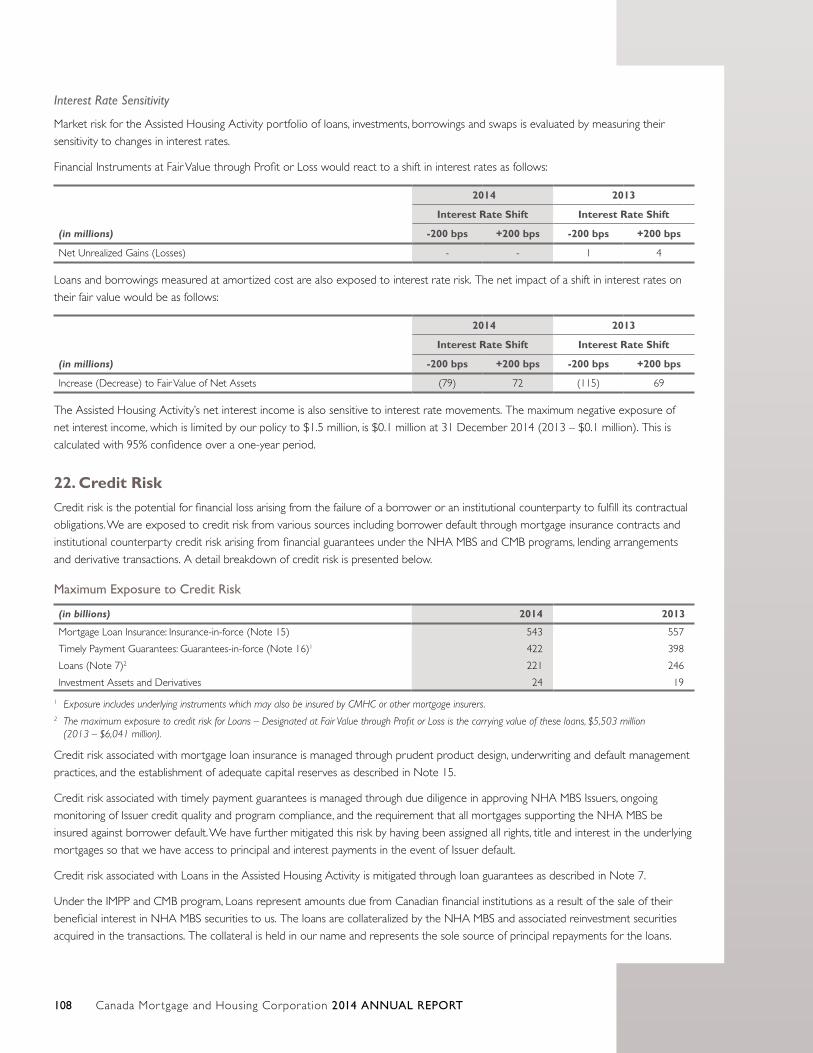
Canada Mor tgage and Housing Corporation 2014 ANNUAL REPORT108
Interest Rate Sensitivity
Market risk for the Assisted Housing Activity portfolio of loans, investments, borrowings and swaps is evaluated by measuring their
sensitivity to changes in interest rates.
Financial Instruments at Fair Value through Profit or Loss would react to a shift in interest rates as follows:
(in millions)
2014 2013
Interest Rate Shift Interest Rate Shift
-200 bps +200 bps -200 bps +200 bps
Net Unrealized Gains (Losses) - - 1 4
Loans and borrowings measured at amortized cost are also exposed to interest rate risk. The net impact of a shift in interest rates on
their fair value would be as follows:
(in millions)
2014 2013
Interest Rate Shift Interest Rate Shift
-200 bps +200 bps -200 bps +200 bps
Increase (Decrease) to Fair Value of Net Assets (79) 72 (115) 69
The Assisted Housing Activity’s net interest income is also sensitive to interest rate movements. The maximum negative exposure of
net interest income, which is limited by our policy to $1.5 million, is $0.1 million at 31 December 2014 (2013 – $0.1 million). This is
calculated with 95% confidence over a one-year period.
22. Credit Risk Credit risk is the potential for financial loss arising from the failure of a borrower or an institutional counterparty to fulfill its contractual
obligations. We are exposed to credit risk from various sources including borrower default through mortgage insurance contracts and
institutional counterparty credit risk arising from financial guarantees under the NHA MBS and CMB programs, lending arrangements
and derivative transactions. A detail breakdown of credit risk is presented below.
Maximum Exposure to Credit Risk
(in billions) 2014 2013
Mortgage Loan Insurance: Insurance-in-force (Note 15) 543 557
Timely Payment Guarantees: Guarantees-in-force (Note 16)1 422 398
Loans (Note 7)2 221 246
Investment Assets and Derivatives 24 19
1 Exposure includes underlying instruments which may also be insured by CMHC or other mortgage insurers.2 The maximum exposure to credit risk for Loans – Designated at Fair Value through Profit or Loss is the carrying value of these loans, $5,503 million
(2013 – $6,041 million).
Credit risk associated with mortgage loan insurance is managed through prudent product design, underwriting and default management
practices, and the establishment of adequate capital reserves as described in Note 15.
Credit risk associated with timely payment guarantees is managed through due diligence in approving NHA MBS Issuers, ongoing
monitoring of Issuer credit quality and program compliance, and the requirement that all mortgages supporting the NHA MBS be
insured against borrower default. We have further mitigated this risk by having been assigned all rights, title and interest in the underlying
mortgages so that we have access to principal and interest payments in the event of Issuer default.
Credit risk associated with Loans in the Assisted Housing Activity is mitigated through loan guarantees as described in Note 7.
Under the IMPP and CMB program, Loans represent amounts due from Canadian financial institutions as a result of the sale of their
beneficial interest in NHA MBS securities to us. The loans are collateralized by the NHA MBS and associated reinvestment securities
acquired in the transactions. The collateral is held in our name and represents the sole source of principal repayments for the loans.
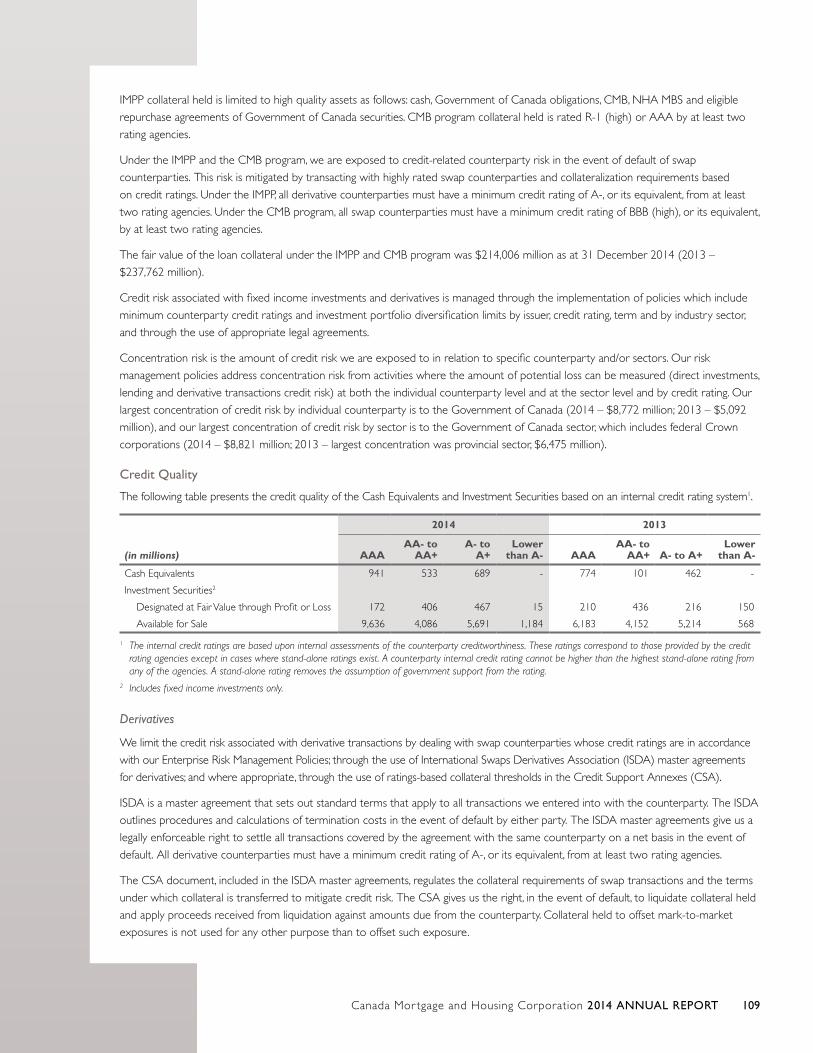
Canada Mor tgage and Housing Corporation 2014 ANNUAL REPORT 109
IMPP collateral held is limited to high quality assets as follows: cash, Government of Canada obligations, CMB, NHA MBS and eligible
repurchase agreements of Government of Canada securities. CMB program collateral held is rated R-1 (high) or AAA by at least two
rating agencies.
Under the IMPP and the CMB program, we are exposed to credit-related counterparty risk in the event of default of swap
counterparties. This risk is mitigated by transacting with highly rated swap counterparties and collateralization requirements based
on credit ratings. Under the IMPP, all derivative counterparties must have a minimum credit rating of A-, or its equivalent, from at least
two rating agencies. Under the CMB program, all swap counterparties must have a minimum credit rating of BBB (high), or its equivalent,
by at least two rating agencies.
The fair value of the loan collateral under the IMPP and CMB program was $214,006 million as at 31 December 2014 (2013 –
$237,762 million).
Credit risk associated with fixed income investments and derivatives is managed through the implementation of policies which include
minimum counterparty credit ratings and investment portfolio diversification limits by issuer, credit rating, term and by industry sector,
and through the use of appropriate legal agreements.
Concentration risk is the amount of credit risk we are exposed to in relation to specific counterparty and/or sectors. Our risk
management policies address concentration risk from activities where the amount of potential loss can be measured (direct investments,
lending and derivative transactions credit risk) at both the individual counterparty level and at the sector level and by credit rating. Our
largest concentration of credit risk by individual counterparty is to the Government of Canada (2014 – $8,772 million; 2013 – $5,092
million), and our largest concentration of credit risk by sector is to the Government of Canada sector, which includes federal Crown
corporations (2014 – $8,821 million; 2013 – largest concentration was provincial sector, $6,475 million).
Credit Quality
The following table presents the credit quality of the Cash Equivalents and Investment Securities based on an internal credit rating system1.
(in millions)
2014 2013
AAA AA- to
AA+A- to
A+Lower
than A- AAA AA- to
AA+ A- to A+Lower
than A-
Cash Equivalents 941 533 689 - 774 101 462 -
Investment Securities2
Designated at Fair Value through Profit or Loss 172 406 467 15 210 436 216 150
Available for Sale 9,636 4,086 5,691 1,184 6,183 4,152 5,214 568
1 The internal credit ratings are based upon internal assessments of the counterparty creditworthiness. These ratings correspond to those provided by the credit rating agencies except in cases where stand-alone ratings exist. A counterparty internal credit rating cannot be higher than the highest stand-alone rating from any of the agencies. A stand-alone rating removes the assumption of government support from the rating.
2 Includes fixed income investments only.
Derivatives
We limit the credit risk associated with derivative transactions by dealing with swap counterparties whose credit ratings are in accordance
with our Enterprise Risk Management Policies; through the use of International Swaps Derivatives Association (ISDA) master agreements
for derivatives; and where appropriate, through the use of ratings-based collateral thresholds in the Credit Support Annexes (CSA).
ISDA is a master agreement that sets out standard terms that apply to all transactions we entered into with the counterparty. The ISDA
outlines procedures and calculations of termination costs in the event of default by either party. The ISDA master agreements give us a
legally enforceable right to settle all transactions covered by the agreement with the same counterparty on a net basis in the event of
default. All derivative counterparties must have a minimum credit rating of A-, or its equivalent, from at least two rating agencies.
The CSA document, included in the ISDA master agreements, regulates the collateral requirements of swap transactions and the terms
under which collateral is transferred to mitigate credit risk. The CSA gives us the right, in the event of default, to liquidate collateral held
and apply proceeds received from liquidation against amounts due from the counterparty. Collateral held to offset mark-to-market
exposures is not used for any other purpose than to offset such exposure.
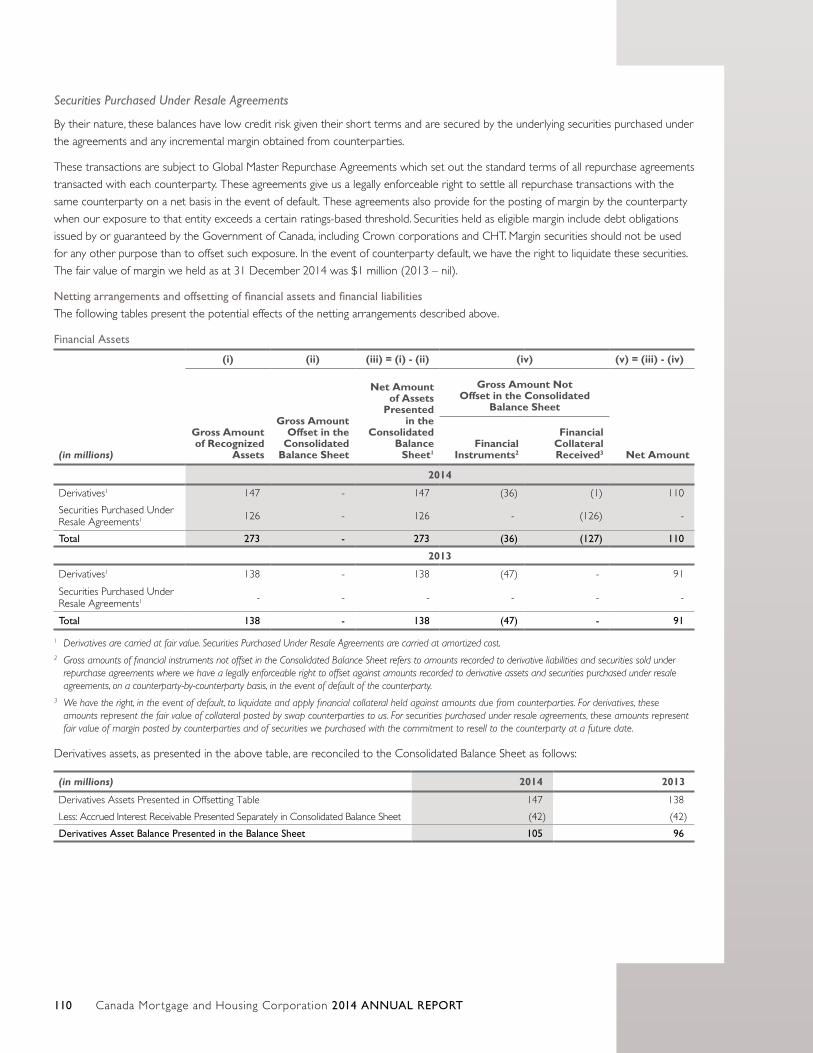
Canada Mor tgage and Housing Corporation 2014 ANNUAL REPORT110
Securities Purchased Under Resale Agreements
By their nature, these balances have low credit risk given their short terms and are secured by the underlying securities purchased under
the agreements and any incremental margin obtained from counterparties.
These transactions are subject to Global Master Repurchase Agreements which set out the standard terms of all repurchase agreements
transacted with each counterparty. These agreements give us a legally enforceable right to settle all repurchase transactions with the
same counterparty on a net basis in the event of default. These agreements also provide for the posting of margin by the counterparty
when our exposure to that entity exceeds a certain ratings-based threshold. Securities held as eligible margin include debt obligations
issued by or guaranteed by the Government of Canada, including Crown corporations and CHT. Margin securities should not be used
for any other purpose than to offset such exposure. In the event of counterparty default, we have the right to liquidate these securities.
The fair value of margin we held as at 31 December 2014 was $1 million (2013 – nil).
Netting arrangements and offsetting of financial assets and financial liabilities The following tables present the potential effects of the netting arrangements described above.
Financial Assets
(in millions)
(i) (ii) (iii) = (i) - (ii) (iv) (v) = (iii) - (iv)
Gross Amount of Recognized
Assets
Gross Amount Offset in the
Consolidated Balance Sheet
Net Amount of Assets
Presented in the
Consolidated Balance
Sheet1
Gross Amount Not Offset in the Consolidated
Balance Sheet
Net AmountFinancial
Instruments2
Financial Collateral Received3
2014
Derivatives1 147 - 147 (36) (1) 110
Securities Purchased Under Resale Agreements1 126 - 126 - (126) -
Total 273 - 273 (36) (127) 110
2013
Derivatives1 138 - 138 (47) - 91
Securities Purchased Under Resale Agreements1 - - - - - -
Total 138 - 138 (47) - 91
1 Derivatives are carried at fair value. Securities Purchased Under Resale Agreements are carried at amortized cost.2 Gross amounts of financial instruments not offset in the Consolidated Balance Sheet refers to amounts recorded to derivative liabilities and securities sold under
repurchase agreements where we have a legally enforceable right to offset against amounts recorded to derivative assets and securities purchased under resale agreements, on a counterparty-by-counterparty basis, in the event of default of the counterparty.
3 We have the right, in the event of default, to liquidate and apply financial collateral held against amounts due from counterparties. For derivatives, these amounts represent the fair value of collateral posted by swap counterparties to us. For securities purchased under resale agreements, these amounts represent fair value of margin posted by counterparties and of securities we purchased with the commitment to resell to the counterparty at a future date.
Derivatives assets, as presented in the above table, are reconciled to the Consolidated Balance Sheet as follows:
(in millions) 2014 2013
Derivatives Assets Presented in Offsetting Table 147 138
Less: Accrued Interest Receivable Presented Separately in Consolidated Balance Sheet (42) (42)
Derivatives Asset Balance Presented in the Balance Sheet 105 96
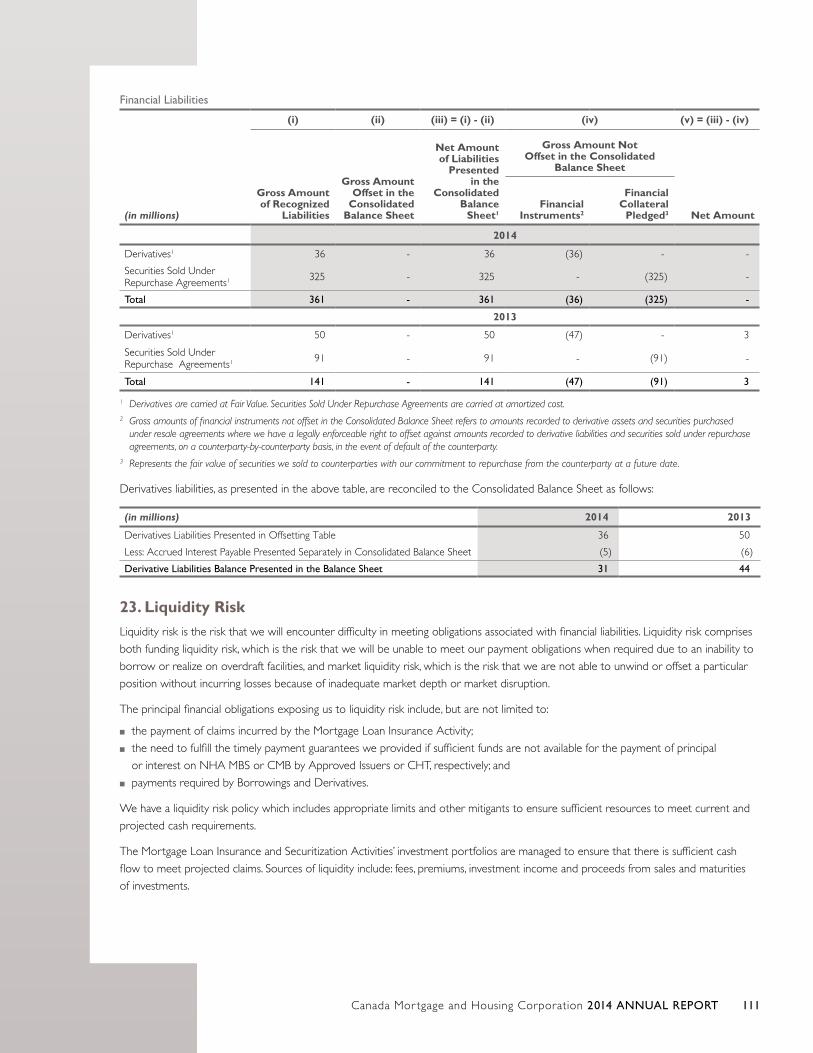
Canada Mor tgage and Housing Corporation 2014 ANNUAL REPORT 111
Financial Liabilities
(in millions)
(i) (ii) (iii) = (i) - (ii) (iv) (v) = (iii) - (iv)
Gross Amount of Recognized
Liabilities
Gross Amount Offset in the
Consolidated Balance Sheet
Net Amount of Liabilities
Presented in the
Consolidated Balance
Sheet1
Gross Amount Not Offset in the Consolidated
Balance Sheet
Net AmountFinancial
Instruments2
Financial Collateral
Pledged3
2014
Derivatives1 36 - 36 (36) - -
Securities Sold Under Repurchase Agreements1 325 - 325 - (325) -
Total 361 - 361 (36) (325) -
2013
Derivatives1 50 - 50 (47) - 3
Securities Sold Under Repurchase Agreements1 91 - 91 - (91) -
Total 141 - 141 (47) (91) 3
1 Derivatives are carried at Fair Value. Securities Sold Under Repurchase Agreements are carried at amortized cost.2 Gross amounts of financial instruments not offset in the Consolidated Balance Sheet refers to amounts recorded to derivative assets and securities purchased
under resale agreements where we have a legally enforceable right to offset against amounts recorded to derivative liabilities and securities sold under repurchase agreements, on a counterparty-by-counterparty basis, in the event of default of the counterparty.
3 Represents the fair value of securities we sold to counterparties with our commitment to repurchase from the counterparty at a future date.
Derivatives liabilities, as presented in the above table, are reconciled to the Consolidated Balance Sheet as follows:
(in millions) 2014 2013
Derivatives Liabilities Presented in Offsetting Table 36 50
Less: Accrued Interest Payable Presented Separately in Consolidated Balance Sheet (5) (6)
Derivative Liabilities Balance Presented in the Balance Sheet 31 44
23. Liquidity Risk Liquidity risk is the risk that we will encounter difficulty in meeting obligations associated with financial liabilities. Liquidity risk comprises
both funding liquidity risk, which is the risk that we will be unable to meet our payment obligations when required due to an inability to
borrow or realize on overdraft facilities, and market liquidity risk, which is the risk that we are not able to unwind or offset a particular
position without incurring losses because of inadequate market depth or market disruption.
The principal financial obligations exposing us to liquidity risk include, but are not limited to:
■■ the payment of claims incurred by the Mortgage Loan Insurance Activity;
■■ the need to fulfill the timely payment guarantees we provided if sufficient funds are not available for the payment of principal
or interest on NHA MBS or CMB by Approved Issuers or CHT, respectively; and
■■ payments required by Borrowings and Derivatives.
We have a liquidity risk policy which includes appropriate limits and other mitigants to ensure sufficient resources to meet current and
projected cash requirements.
The Mortgage Loan Insurance and Securitization Activities’ investment portfolios are managed to ensure that there is sufficient cash
flow to meet projected claims. Sources of liquidity include: fees, premiums, investment income and proceeds from sales and maturities
of investments.
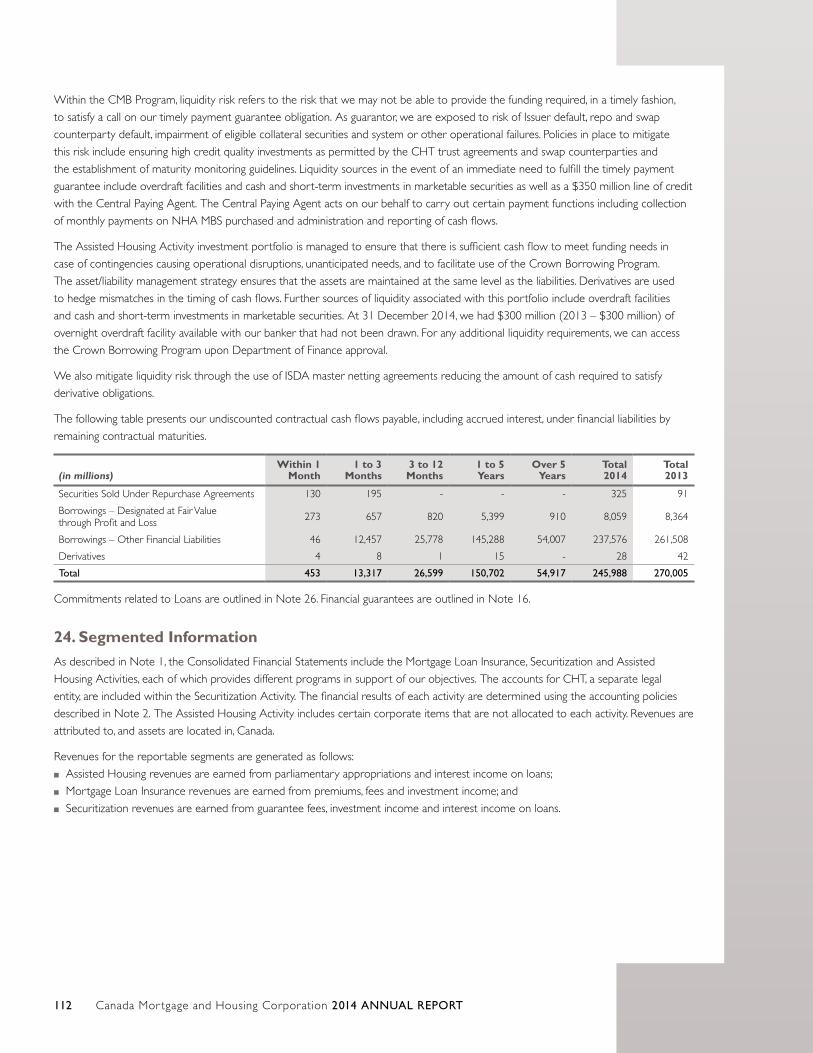
Canada Mor tgage and Housing Corporation 2014 ANNUAL REPORT112
Within the CMB Program, liquidity risk refers to the risk that we may not be able to provide the funding required, in a timely fashion,
to satisfy a call on our timely payment guarantee obligation. As guarantor, we are exposed to risk of Issuer default, repo and swap
counterparty default, impairment of eligible collateral securities and system or other operational failures. Policies in place to mitigate
this risk include ensuring high credit quality investments as permitted by the CHT trust agreements and swap counterparties and
the establishment of maturity monitoring guidelines. Liquidity sources in the event of an immediate need to fulfill the timely payment
guarantee include overdraft facilities and cash and short-term investments in marketable securities as well as a $350 million line of credit
with the Central Paying Agent. The Central Paying Agent acts on our behalf to carry out certain payment functions including collection
of monthly payments on NHA MBS purchased and administration and reporting of cash flows.
The Assisted Housing Activity investment portfolio is managed to ensure that there is sufficient cash flow to meet funding needs in
case of contingencies causing operational disruptions, unanticipated needs, and to facilitate use of the Crown Borrowing Program.
The asset/liability management strategy ensures that the assets are maintained at the same level as the liabilities. Derivatives are used
to hedge mismatches in the timing of cash flows. Further sources of liquidity associated with this portfolio include overdraft facilities
and cash and short-term investments in marketable securities. At 31 December 2014, we had $300 million (2013 – $300 million) of
overnight overdraft facility available with our banker that had not been drawn. For any additional liquidity requirements, we can access
the Crown Borrowing Program upon Department of Finance approval.
We also mitigate liquidity risk through the use of ISDA master netting agreements reducing the amount of cash required to satisfy
derivative obligations.
The following table presents our undiscounted contractual cash flows payable, including accrued interest, under financial liabilities by
remaining contractual maturities.
(in millions)Within 1
Month1 to 3
Months3 to 12 Months
1 to 5 Years
Over 5 Years
Total 2014
Total 2013
Securities Sold Under Repurchase Agreements 130 195 - - - 325 91
Borrowings – Designated at Fair Value through Profit and Loss 273 657 820 5,399 910 8,059 8,364
Borrowings – Other Financial Liabilities 46 12,457 25,778 145,288 54,007 237,576 261,508
Derivatives 4 8 1 15 - 28 42
Total 453 13,317 26,599 150,702 54,917 245,988 270,005
Commitments related to Loans are outlined in Note 26. Financial guarantees are outlined in Note 16.
24. Segmented InformationAs described in Note 1, the Consolidated Financial Statements include the Mortgage Loan Insurance, Securitization and Assisted
Housing Activities, each of which provides different programs in support of our objectives. The accounts for CHT, a separate legal
entity, are included within the Securitization Activity. The financial results of each activity are determined using the accounting policies
described in Note 2. The Assisted Housing Activity includes certain corporate items that are not allocated to each activity. Revenues are
attributed to, and assets are located in, Canada.
Revenues for the reportable segments are generated as follows:
■■ Assisted Housing revenues are earned from parliamentary appropriations and interest income on loans;
■■ Mortgage Loan Insurance revenues are earned from premiums, fees and investment income; and
■■ Securitization revenues are earned from guarantee fees, investment income and interest income on loans.
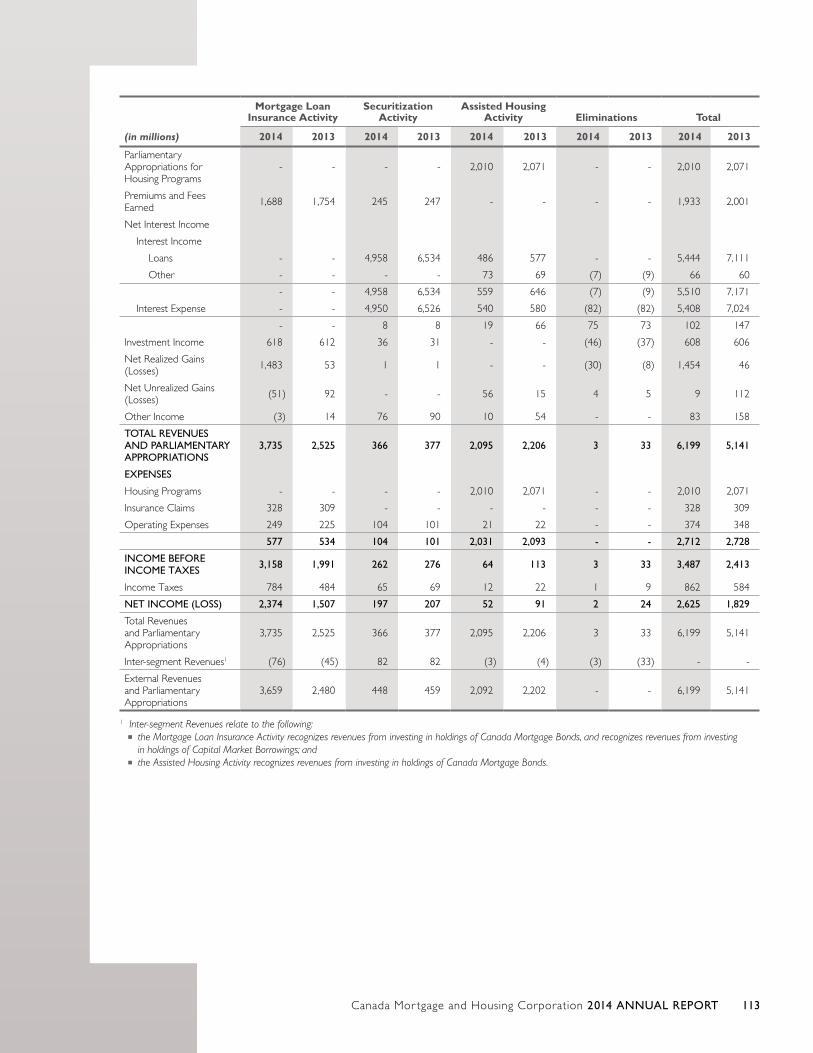
Canada Mor tgage and Housing Corporation 2014 ANNUAL REPORT 113
(in millions)
Mortgage Loan Insurance Activity
Securitization Activity
Assisted Housing Activity Eliminations Total
2014 2013 2014 2013 2014 2013 2014 2013 2014 2013
Parliamentary Appropriations for Housing Programs
- - - - 2,010 2,071 - - 2,010 2,071
Premiums and Fees Earned 1,688 1,754 245 247 - - - - 1,933 2,001
Net Interest Income
Interest Income
Loans - - 4,958 6,534 486 577 - - 5,444 7,111
Other - - - - 73 69 (7) (9) 66 60
- - 4,958 6,534 559 646 (7) (9) 5,510 7,171
Interest Expense - - 4,950 6,526 540 580 (82) (82) 5,408 7,024
- - 8 8 19 66 75 73 102 147
Investment Income 618 612 36 31 - - (46) (37) 608 606
Net Realized Gains (Losses) 1,483 53 1 1 - - (30) (8) 1,454 46
Net Unrealized Gains (Losses) (51) 92 - - 56 15 4 5 9 112
Other Income (3) 14 76 90 10 54 - - 83 158
TOTAL REVENUES AND PARLIAMENTARY APPROPRIATIONS
3,735 2,525 366 377 2,095 2,206 3 33 6,199 5,141
EXPENSES
Housing Programs - - - - 2,010 2,071 - - 2,010 2,071
Insurance Claims 328 309 - - - - - - 328 309
Operating Expenses 249 225 104 101 21 22 - - 374 348
577 534 104 101 2,031 2,093 - - 2,712 2,728
INCOME BEFORE INCOME TAXES 3,158 1,991 262 276 64 113 3 33 3,487 2,413
Income Taxes 784 484 65 69 12 22 1 9 862 584
NET INCOME (LOSS) 2,374 1,507 197 207 52 91 2 24 2,625 1,829
Total Revenues and Parliamentary Appropriations
3,735 2,525 366 377 2,095 2,206 3 33 6,199 5,141
Inter-segment Revenues1 (76) (45) 82 82 (3) (4) (3) (33) - -
External Revenues and Parliamentary Appropriations
3,659 2,480 448 459 2,092 2,202 - - 6,199 5,141
1 Inter-segment Revenues relate to the following:■■ the Mortgage Loan Insurance Activity recognizes revenues from investing in holdings of Canada Mortgage Bonds, and recognizes revenues from investing in holdings of Capital Market Borrowings; and
■■ the Assisted Housing Activity recognizes revenues from investing in holdings of Canada Mortgage Bonds.
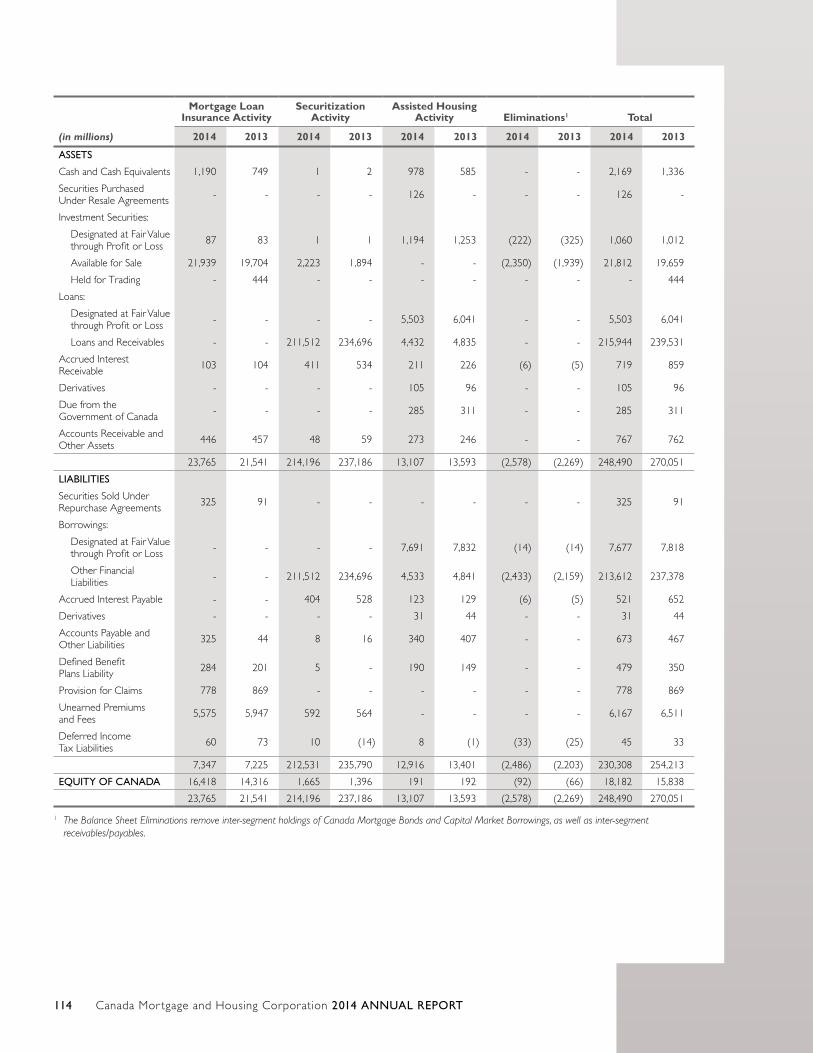
Canada Mor tgage and Housing Corporation 2014 ANNUAL REPORT114
(in millions)
Mortgage Loan Insurance Activity
Securitization Activity
Assisted Housing Activity Eliminations1 Total
2014 2013 2014 2013 2014 2013 2014 2013 2014 2013
ASSETS
Cash and Cash Equivalents 1,190 749 1 2 978 585 - - 2,169 1,336
Securities Purchased Under Resale Agreements - - - - 126 - - - 126 -
Investment Securities:
Designated at Fair Value through Profit or Loss 87 83 1 1 1,194 1,253 (222) (325) 1,060 1,012
Available for Sale 21,939 19,704 2,223 1,894 - - (2,350) (1,939) 21,812 19,659
Held for Trading - 444 - - - - - - - 444
Loans:
Designated at Fair Value through Profit or Loss - - - - 5,503 6,041 - - 5,503 6,041
Loans and Receivables - - 211,512 234,696 4,432 4,835 - - 215,944 239,531
Accrued Interest Receivable 103 104 411 534 211 226 (6) (5) 719 859
Derivatives - - - - 105 96 - - 105 96
Due from the Government of Canada - - - - 285 311 - - 285 311
Accounts Receivable and Other Assets 446 457 48 59 273 246 - - 767 762
23,765 21,541 214,196 237,186 13,107 13,593 (2,578) (2,269) 248,490 270,051
LIABILITIES
Securities Sold Under Repurchase Agreements 325 91 - - - - - - 325 91
Borrowings:
Designated at Fair Value through Profit or Loss - - - - 7,691 7,832 (14) (14) 7,677 7,818
Other Financial Liabilities - - 211,512 234,696 4,533 4,841 (2,433) (2,159) 213,612 237,378
Accrued Interest Payable - - 404 528 123 129 (6) (5) 521 652
Derivatives - - - - 31 44 - - 31 44
Accounts Payable and Other Liabilities 325 44 8 16 340 407 - - 673 467
Defined Benefit Plans Liability 284 201 5 - 190 149 - - 479 350
Provision for Claims 778 869 - - - - - - 778 869
Unearned Premiums and Fees 5,575 5,947 592 564 - - - - 6,167 6,511
Deferred Income Tax Liabilities 60 73 10 (14) 8 (1) (33) (25) 45 33
7,347 7,225 212,531 235,790 12,916 13,401 (2,486) (2,203) 230,308 254,213
EQUITY OF CANADA 16,418 14,316 1,665 1,396 191 192 (92) (66) 18,182 15,838
23,765 21,541 214,196 237,186 13,107 13,593 (2,578) (2,269) 248,490 270,051
1 The Balance Sheet Eliminations remove inter-segment holdings of Canada Mortgage Bonds and Capital Market Borrowings, as well as inter-segment receivables/payables.
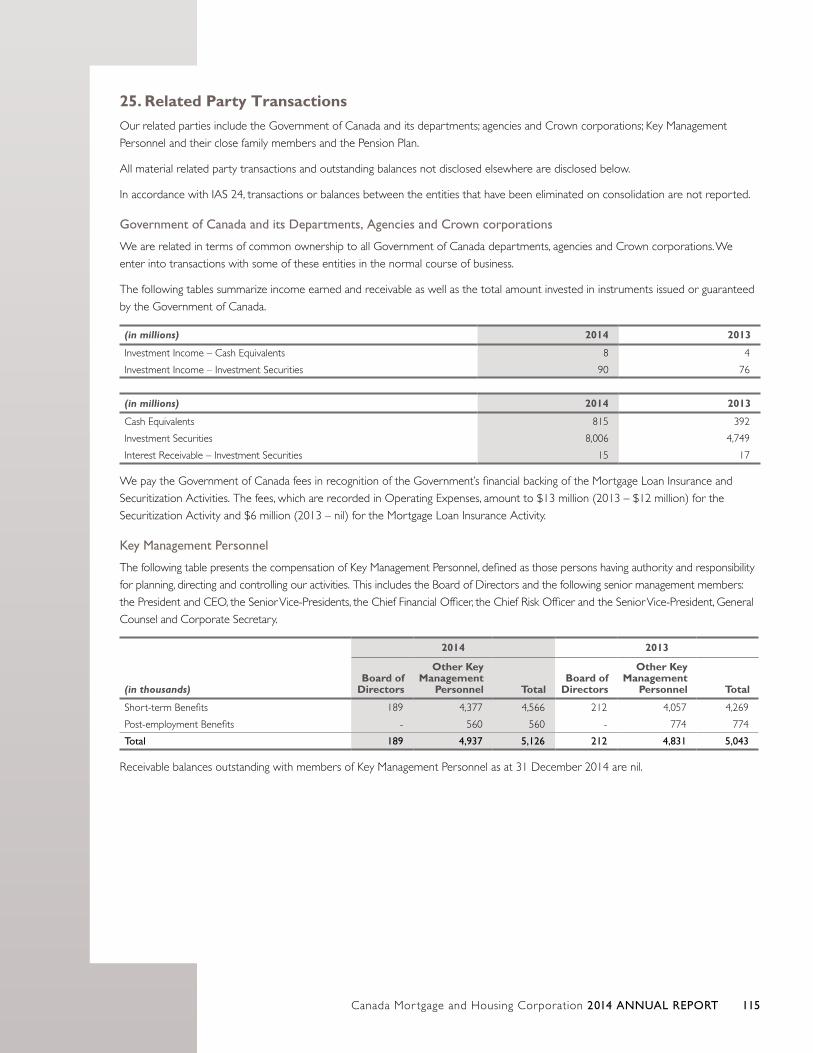
Canada Mor tgage and Housing Corporation 2014 ANNUAL REPORT 115
25. Related Party TransactionsOur related parties include the Government of Canada and its departments; agencies and Crown corporations; Key Management
Personnel and their close family members and the Pension Plan.
All material related party transactions and outstanding balances not disclosed elsewhere are disclosed below.
In accordance with IAS 24, transactions or balances between the entities that have been eliminated on consolidation are not reported.
Government of Canada and its Departments, Agencies and Crown corporations
We are related in terms of common ownership to all Government of Canada departments, agencies and Crown corporations. We
enter into transactions with some of these entities in the normal course of business.
The following tables summarize income earned and receivable as well as the total amount invested in instruments issued or guaranteed
by the Government of Canada.
(in millions) 2014 2013
Investment Income – Cash Equivalents 8 4
Investment Income – Investment Securities 90 76
(in millions) 2014 2013
Cash Equivalents 815 392
Investment Securities 8,006 4,749
Interest Receivable – Investment Securities 15 17
We pay the Government of Canada fees in recognition of the Government’s financial backing of the Mortgage Loan Insurance and
Securitization Activities. The fees, which are recorded in Operating Expenses, amount to $13 million (2013 – $12 million) for the
Securitization Activity and $6 million (2013 – nil) for the Mortgage Loan Insurance Activity.
Key Management Personnel
The following table presents the compensation of Key Management Personnel, defined as those persons having authority and responsibility
for planning, directing and controlling our activities. This includes the Board of Directors and the following senior management members:
the President and CEO, the Senior Vice-Presidents, the Chief Financial Officer, the Chief Risk Officer and the Senior Vice-President, General
Counsel and Corporate Secretary.
(in thousands)
2014 2013
Board of Directors
Other Key Management
Personnel TotalBoard of
Directors
Other Key Management
Personnel Total
Short-term Benefits 189 4,377 4,566 212 4,057 4,269
Post-employment Benefits - 560 560 - 774 774
Total 189 4,937 5,126 212 4,831 5,043
Receivable balances outstanding with members of Key Management Personnel as at 31 December 2014 are nil.
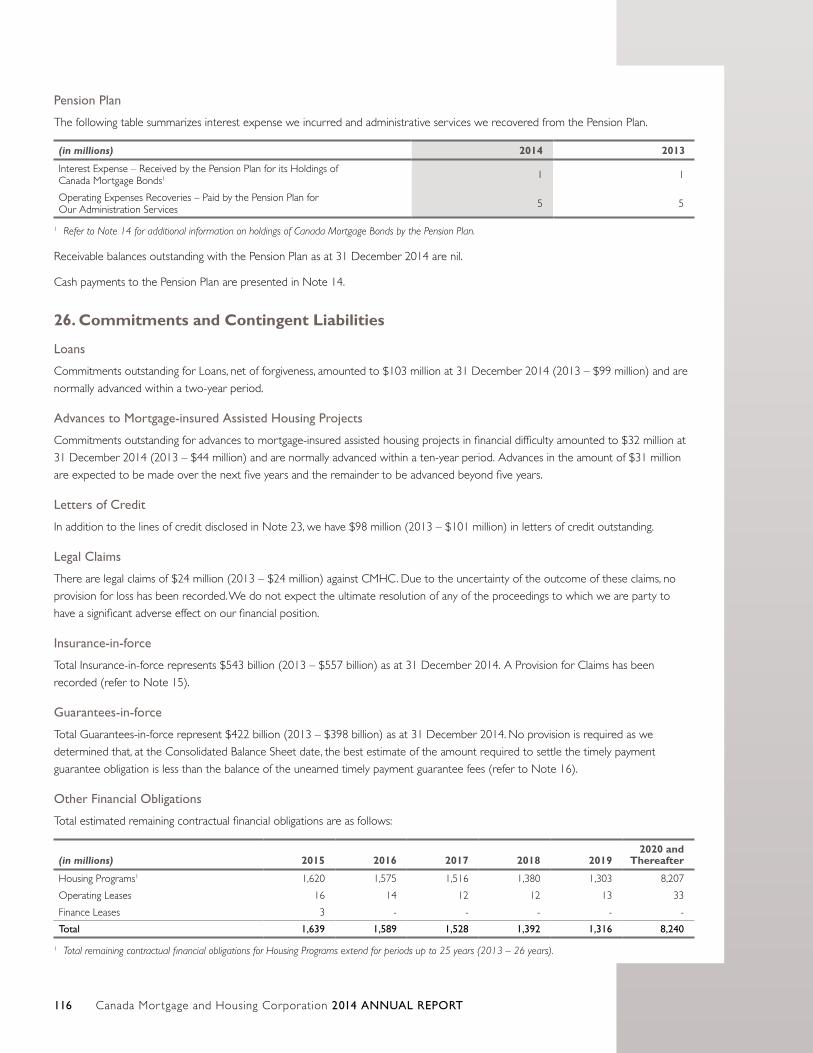
Canada Mor tgage and Housing Corporation 2014 ANNUAL REPORT116
Pension Plan
The following table summarizes interest expense we incurred and administrative services we recovered from the Pension Plan.
(in millions) 2014 2013
Interest Expense – Received by the Pension Plan for its Holdings of Canada Mortgage Bonds1 1 1
Operating Expenses Recoveries – Paid by the Pension Plan for Our Administration Services 5 5
1 Refer to Note 14 for additional information on holdings of Canada Mortgage Bonds by the Pension Plan.
Receivable balances outstanding with the Pension Plan as at 31 December 2014 are nil.
Cash payments to the Pension Plan are presented in Note 14.
26. Commitments and Contingent Liabilities
Loans
Commitments outstanding for Loans, net of forgiveness, amounted to $103 million at 31 December 2014 (2013 – $99 million) and are
normally advanced within a two-year period.
Advances to Mortgage-insured Assisted Housing Projects
Commitments outstanding for advances to mortgage-insured assisted housing projects in financial difficulty amounted to $32 million at
31 December 2014 (2013 – $44 million) and are normally advanced within a ten-year period. Advances in the amount of $31 million
are expected to be made over the next five years and the remainder to be advanced beyond five years.
Letters of Credit
In addition to the lines of credit disclosed in Note 23, we have $98 million (2013 – $101 million) in letters of credit outstanding.
Legal Claims
There are legal claims of $24 million (2013 – $24 million) against CMHC. Due to the uncertainty of the outcome of these claims, no
provision for loss has been recorded. We do not expect the ultimate resolution of any of the proceedings to which we are party to
have a significant adverse effect on our financial position.
Insurance-in-force
Total Insurance-in-force represents $543 billion (2013 – $557 billion) as at 31 December 2014. A Provision for Claims has been
recorded (refer to Note 15).
Guarantees-in-force
Total Guarantees-in-force represent $422 billion (2013 – $398 billion) as at 31 December 2014. No provision is required as we
determined that, at the Consolidated Balance Sheet date, the best estimate of the amount required to settle the timely payment
guarantee obligation is less than the balance of the unearned timely payment guarantee fees (refer to Note 16).
Other Financial Obligations
Total estimated remaining contractual financial obligations are as follows:
(in millions) 2015 2016 2017 2018 20192020 and
Thereafter
Housing Programs1 1,620 1,575 1,516 1,380 1,303 8,207
Operating Leases 16 14 12 12 13 33
Finance Leases 3 - - - - -
Total 1,639 1,589 1,528 1,392 1,316 8,240
1 Total remaining contractual financial obligations for Housing Programs extend for periods up to 25 years (2013 – 26 years).
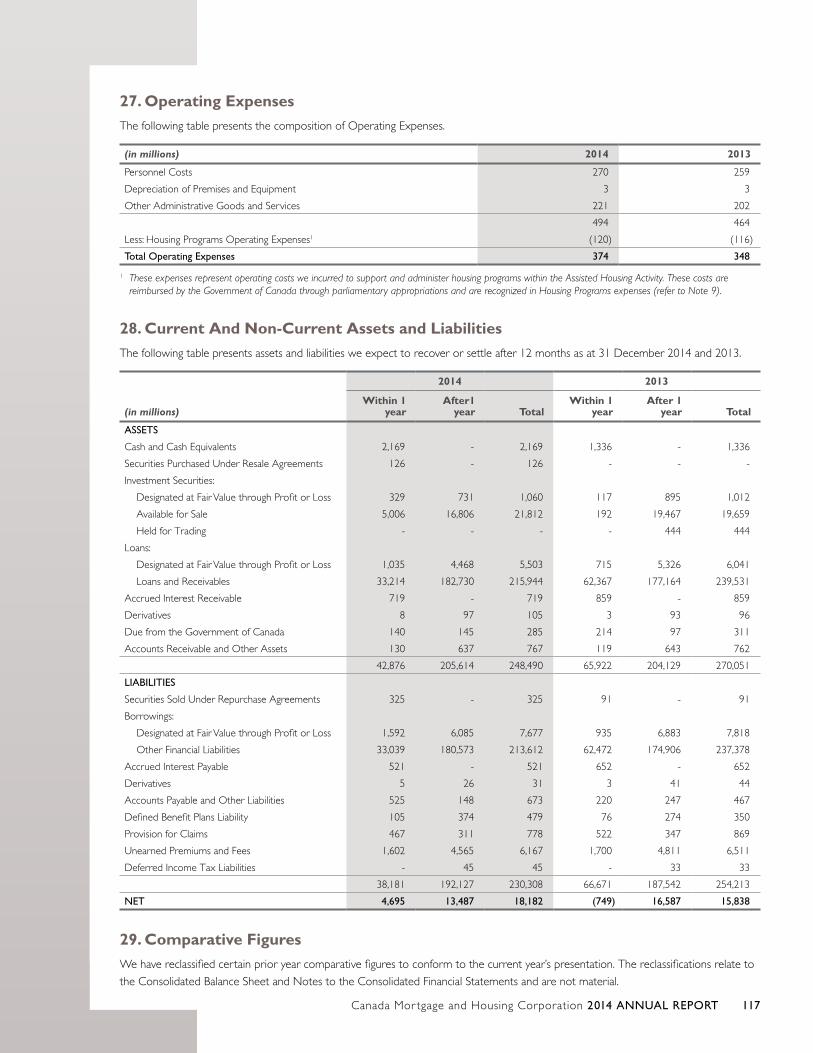
Canada Mor tgage and Housing Corporation 2014 ANNUAL REPORT 117
27. Operating ExpensesThe following table presents the composition of Operating Expenses.
(in millions) 2014 2013
Personnel Costs 270 259
Depreciation of Premises and Equipment 3 3
Other Administrative Goods and Services 221 202
494 464
Less: Housing Programs Operating Expenses1 (120) (116)
Total Operating Expenses 374 348
1 These expenses represent operating costs we incurred to support and administer housing programs within the Assisted Housing Activity. These costs are reimbursed by the Government of Canada through parliamentary appropriations and are recognized in Housing Programs expenses (refer to Note 9).
28. Current And Non-Current Assets and LiabilitiesThe following table presents assets and liabilities we expect to recover or settle after 12 months as at 31 December 2014 and 2013.
(in millions)
2014 2013
Within 1 year
After1 year Total
Within 1 year
After 1 year Total
ASSETS
Cash and Cash Equivalents 2,169 - 2,169 1,336 - 1,336
Securities Purchased Under Resale Agreements 126 - 126 - - -
Investment Securities:
Designated at Fair Value through Profit or Loss 329 731 1,060 117 895 1,012
Available for Sale 5,006 16,806 21,812 192 19,467 19,659
Held for Trading - - - - 444 444
Loans:
Designated at Fair Value through Profit or Loss 1,035 4,468 5,503 715 5,326 6,041
Loans and Receivables 33,214 182,730 215,944 62,367 177,164 239,531
Accrued Interest Receivable 719 - 719 859 - 859
Derivatives 8 97 105 3 93 96
Due from the Government of Canada 140 145 285 214 97 311
Accounts Receivable and Other Assets 130 637 767 119 643 762
42,876 205,614 248,490 65,922 204,129 270,051
LIABILITIES
Securities Sold Under Repurchase Agreements 325 - 325 91 - 91
Borrowings:
Designated at Fair Value through Profit or Loss 1,592 6,085 7,677 935 6,883 7,818
Other Financial Liabilities 33,039 180,573 213,612 62,472 174,906 237,378
Accrued Interest Payable 521 - 521 652 - 652
Derivatives 5 26 31 3 41 44
Accounts Payable and Other Liabilities 525 148 673 220 247 467
Defined Benefit Plans Liability 105 374 479 76 274 350
Provision for Claims 467 311 778 522 347 869
Unearned Premiums and Fees 1,602 4,565 6,167 1,700 4,811 6,511
Deferred Income Tax Liabilities - 45 45 - 33 33
38,181 192,127 230,308 66,671 187,542 254,213
NET 4,695 13,487 18,182 (749) 16,587 15,838
29. Comparative FiguresWe have reclassified certain prior year comparative figures to conform to the current year’s presentation. The reclassifications relate to
the Consolidated Balance Sheet and Notes to the Consolidated Financial Statements and are not material.

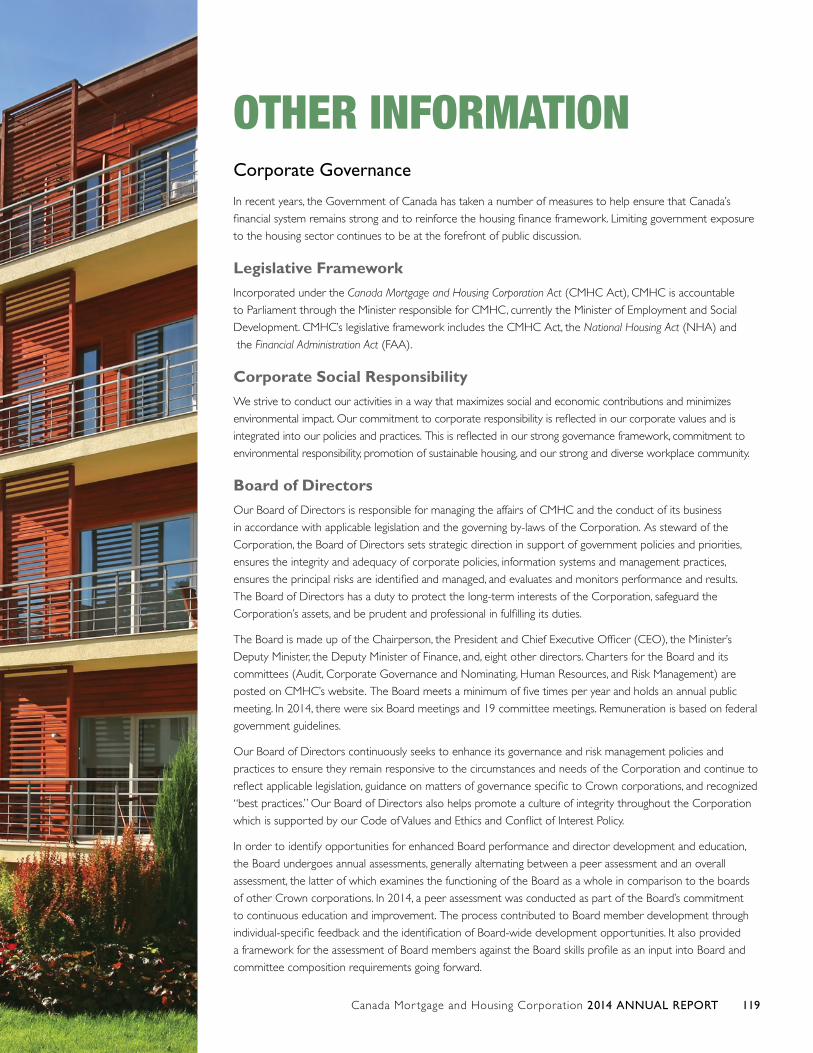
OTHER INFORMATIONCorporate Governance
In recent years, the Government of Canada has taken a number of measures to help ensure that Canada’s
financial system remains strong and to reinforce the housing finance framework. Limiting government exposure
to the housing sector continues to be at the forefront of public discussion.
Legislative FrameworkIncorporated under the Canada Mortgage and Housing Corporation Act (CMHC Act), CMHC is accountable
to Parliament through the Minister responsible for CMHC, currently the Minister of Employment and Social
Development. CMHC’s legislative framework includes the CMHC Act, the National Housing Act (NHA) and
the Financial Administration Act (FAA).
Corporate Social ResponsibilityWe strive to conduct our activities in a way that maximizes social and economic contributions and minimizes
environmental impact. Our commitment to corporate responsibility is reflected in our corporate values and is
integrated into our policies and practices. This is reflected in our strong governance framework, commitment to
environmental responsibility, promotion of sustainable housing, and our strong and diverse workplace community.
Board of DirectorsOur Board of Directors is responsible for managing the affairs of CMHC and the conduct of its business
in accordance with applicable legislation and the governing by-laws of the Corporation. As steward of the
Corporation, the Board of Directors sets strategic direction in support of government policies and priorities,
ensures the integrity and adequacy of corporate policies, information systems and management practices,
ensures the principal risks are identified and managed, and evaluates and monitors performance and results.
The Board of Directors has a duty to protect the long-term interests of the Corporation, safeguard the
Corporation’s assets, and be prudent and professional in fulfilling its duties.
The Board is made up of the Chairperson, the President and Chief Executive Officer (CEO), the Minister’s
Deputy Minister, the Deputy Minister of Finance, and, eight other directors. Charters for the Board and its
committees (Audit, Corporate Governance and Nominating, Human Resources, and Risk Management) are
posted on CMHC’s website. The Board meets a minimum of five times per year and holds an annual public
meeting. In 2014, there were six Board meetings and 19 committee meetings. Remuneration is based on federal
government guidelines.
Our Board of Directors continuously seeks to enhance its governance and risk management policies and
practices to ensure they remain responsive to the circumstances and needs of the Corporation and continue to
reflect applicable legislation, guidance on matters of governance specific to Crown corporations, and recognized
“best practices.” Our Board of Directors also helps promote a culture of integrity throughout the Corporation
which is supported by our Code of Values and Ethics and Conflict of Interest Policy.
In order to identify opportunities for enhanced Board performance and director development and education,
the Board undergoes annual assessments, generally alternating between a peer assessment and an overall
assessment, the latter of which examines the functioning of the Board as a whole in comparison to the boards
of other Crown corporations. In 2014, a peer assessment was conducted as part of the Board’s commitment
to continuous education and improvement. The process contributed to Board member development through
individual-specific feedback and the identification of Board-wide development opportunities. It also provided
a framework for the assessment of Board members against the Board skills profile as an input into Board and
committee composition requirements going forward.
Canada Mor tgage and Housing Corporation 2014 ANNUAL REPORT 119
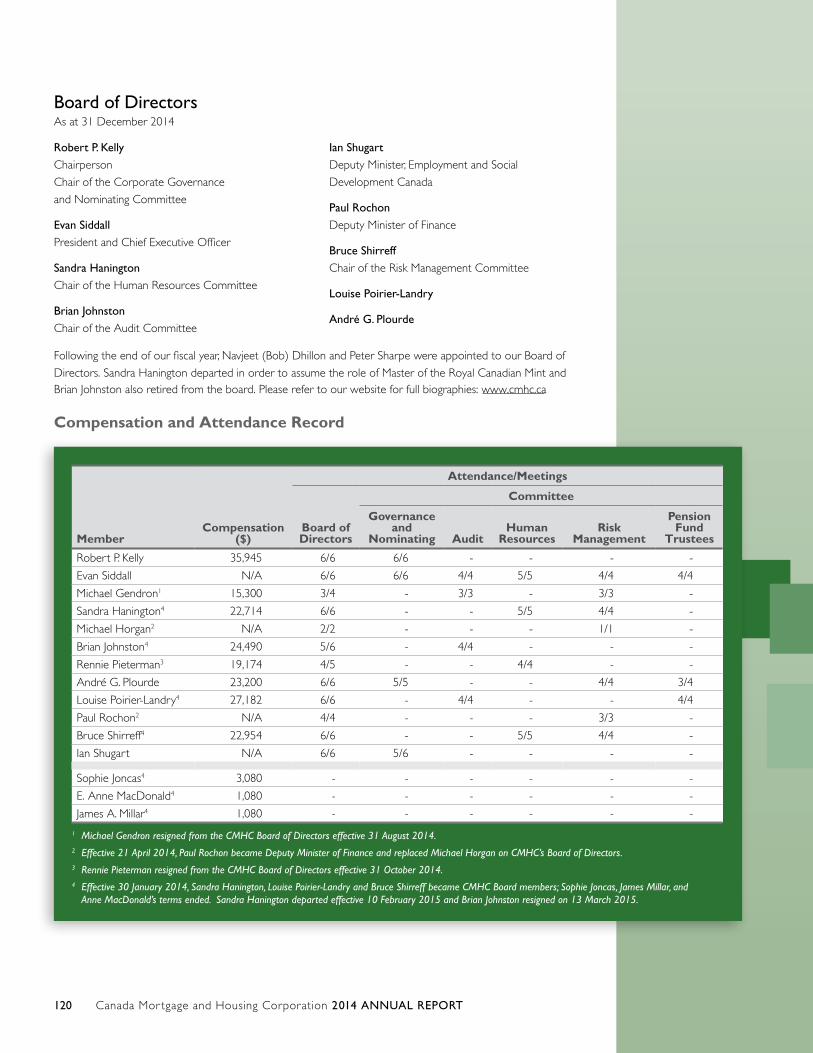
Canada Mor tgage and Housing Corporation 2014 ANNUAL REPORT120
Board of DirectorsAs at 31 December 2014
MemberCompensation
($)
Attendance/Meetings
Board of Directors
Committee
Governance and
Nominating AuditHuman
ResourcesRisk
Management
Pension Fund
Trustees
Robert P. Kelly 35,945 6/6 6/6 - - - -
Evan Siddall N/A 6/6 6/6 4/4 5/5 4/4 4/4
Michael Gendron1 15,300 3/4 - 3/3 - 3/3 -
Sandra Hanington4 22,714 6/6 - - 5/5 4/4 -
Michael Horgan2 N/A 2/2 - - - 1/1 -
Brian Johnston4 24,490 5/6 - 4/4 - - -
Rennie Pieterman3 19,174 4/5 - - 4/4 - -
André G. Plourde 23,200 6/6 5/5 - - 4/4 3/4
Louise Poirier-Landry4 27,182 6/6 - 4/4 - - 4/4
Paul Rochon2 N/A 4/4 - - - 3/3 -
Bruce Shirreff4 22,954 6/6 - - 5/5 4/4 -
Ian Shugart N/A 6/6 5/6 - - - -
Sophie Joncas4 3,080 - - - - - -
E. Anne MacDonald4 1,080 - - - - - -
James A. Millar4 1,080 - - - - - -
1 Michael Gendron resigned from the CMHC Board of Directors effective 31 August 2014.2 Effective 21 April 2014, Paul Rochon became Deputy Minister of Finance and replaced Michael Horgan on CMHC’s Board of Directors. 3 Rennie Pieterman resigned from the CMHC Board of Directors effective 31 October 2014.4 Effective 30 January 2014, Sandra Hanington, Louise Poirier-Landry and Bruce Shirreff became CMHC Board members; Sophie Joncas, James Millar, and
Anne MacDonald’s terms ended. Sandra Hanington departed effective 10 February 2015 and Brian Johnston resigned on 13 March 2015.
Robert P. Kelly Chairperson
Chair of the Corporate Governance
and Nominating Committee
Evan Siddall President and Chief Executive Officer
Sandra Hanington Chair of the Human Resources Committee
Brian Johnston Chair of the Audit Committee
Ian Shugart Deputy Minister, Employment and Social
Development Canada
Paul Rochon Deputy Minister of Finance
Bruce Shirreff Chair of the Risk Management Committee
Louise Poirier-Landry
André G. Plourde
Following the end of our fiscal year, Navjeet (Bob) Dhillon and Peter Sharpe were appointed to our Board of
Directors. Sandra Hanington departed in order to assume the role of Master of the Royal Canadian Mint and Brian Johnston also retired from the board. Please refer to our website for full biographies: www.cmhc.ca
Compensation and Attendance Record
Canada Mor tgage and Housing Corporation 2014 ANNUAL REPORT 121
Senior ManagementAs at 31 December 2014
Fatima Barros Regional Vice-President,
Prairies and Territories
Isabelle Bougie Regional Vice-President, Quebec
Debra Darke1 Senior Vice-President,
Corporate Development, Policy and Research
Peter De Barros Vice-President, Public Affairs
Sébastien Gignac1 Senior Vice-President,
General Counsel and Corporate Secretary
Christina Haddad Regional Vice-President, Ontario
Kathryn Howard1 Senior Vice-President,
Human Resources
Charles MacArthur1 Senior Vice-President,
Regional Operations and Assisted Housing
Steven Mennill1 Senior Vice-President,
Insurance
Audrey Moritz Regional Vice-President, Atlantic
Brian Naish1
Chief Financial Officer
Helen Polatajko Vice-President, Information and Technology
Caroline Sanfaçon Regional Vice-President, British Columbia
Pierre Serré1
Chief Risk Officer
Evan Siddall1
President and Chief Executive Officer
Carla Staresina Vice-President, Affordable Housing
Marie-Claude Tremblay1 Chief of Staff
Michel Tremblay Vice-President, Audit
Glen Trevisani Vice-President, Insurance Operations
Wojo Zielonka1 Senior Vice-President,
Capital Markets
1 Member of Executive Committee
Canada Mor tgage and Housing Corporation 2014 ANNUAL REPORT122
Glossary
Non-IFRS Financial MeasuresWe use a number of financial measures to assess our performance,
some of which are not calculated in accordance with IFRS, are not
defined by IFRS, and do not have standardized meaning that would
ensure consistency and comparability with other institutions.
Arrears Rate
The ratio (expressed as a percentage) of all loans that are
typically more than 90 days past due to the number of outstanding
insured loans.
Capital Available To Capital Required
Under the Securitization Activity, this means the ratio (expressed as
a percentage) of capital available to capital required where capital
available is calculated as total equity adjusted for assets with a
capital requirement of 100% and capital required is calculated by
applying risk factors to investment asset and liability exposures using
a framework developed in accordance with both regulatory and
economic capital principals.
Capital Available To Minimum Capital Required
Under the Mortgage Loan Insurance Activity, this means the ratio
(expressed as a percentage) of capital available to minimum capital
required where capital available is calculated as total equity adjusted
for assets with a capital requirement of 100% and minimum capital
required is calculated by applying risk factors to investment asset and
liability exposures in accordance with guidelines established by OSFI.
Corporate Operating Expense Ratio
The ratio (expressed as a percentage) of operating budget expenses
for all of CMHC's activities (excluding CHT) during the period to
premiums, fees, guarantee, and application fees received, net interest
income from lending programs and normalized parliamentary
appropriations.
Guarantees-in-force (GIF)
The total guarantees related to the timely payment of principal and
interest of NHA MBS for investors in securities issued by Approved
Issuers on the basis of housing loans through the NHA MBS program
and the CMB issued by the CHT.
Insurance-in-force (IIF)
The total amount of outstanding loan balances covered by mortgage
loan insurance policies at a specific period in time.
Loss Ratio
The ratio (expressed as a percentage) of the Insurance Claims
incurred during the period to the Premiums and Fees Earned in
the period in the Mortgage Loan Insurance Activity.
Minimum Capital Test (MCT)
The minimum capital required calculated by applying risk factors to the
Mortgage Loan Insurance Activity’s assets and liabilities using a defined
methodology prescribed by OSFI.
Operating Expense Ratio
Mortgage Loan Insurance Activity: the ratio (expressed as a percentage)
of Operating Expenses during the period to Premiums and Fees Earned
during the period for the Mortgage Loan Insurance Activity.
Securitization Activity: the ratio (expressed as a percentage) of
Operating Expenses during the period, exclusive of those related to
the administration of the covered bond legal framework, to guarantee
fees earned during the period.
Return on Capital Holding Target (ROCHT)
Reflects annualized Net Income, adjusted to reflect earnings based on
CMHC’s capital holding level of 220% MCT, divided by the weighted
average capital holding target for the period.
Return on Equity
The annualized Net Income divided by the average of the beginning and
ending Equity for the period, used to highlight the operating performance.
Severity Ratio
The ratio (expressed as a percentage) of Insurance Claims to the
original insured loan amount for the claims paid in the period.
Other Glossary TermsCanada Housing Trust (CHT)
The CHT is a special purpose trust that acquires interests in eligible
insured housing loans, such as NHA MBS, and issues CMB. The CHT
also purchases highly rated investments and undertakes certain related
financial hedging activities. We consolidate the accounts of CHT with
securitization. CHT’s assets and liabilities are neither owned by nor
held for our benefit. The beneficiaries of the trust, after payment of
all obligations, are one or more charitable organizations.
Consensus Forecast
The consensus forecast is published monthly by consensus economics
and is an average of the forecasts provided by 17 major financial
and economic institutions. It includes variables such as real GDP,
employment, unemployment rate and interest rates.
Canada Mor tgage and Housing Corporation 2014 ANNUAL REPORT 123
emili
A proprietary online automated mortgage loan insurance risk
assessment and approval system we developed.
Housing Programs
All activities funded by parliamentary appropriations under assisted
housing and market analysis and research.
Housing Support
Contractual commitments for housing and municipal infrastructure
that help to reduce affordability problems for low and moderate-
income households, to provide accommodation for students and to
provide production of moderately priced rental housing. The program
also provides ancillary services to support our mandate. This includes
the affordable housing centre, the housing related infrastructure
loans to municipalities and other long-term commitments such as
the market housing programs and the community services program.
Insured Mortgage Purchase Program (IMPP)
A program established by the Government of Canada which
authorized us to purchase up to $125 billion in NHA MBS
from Canadian financial institutions between October 2008 and
March 2010 as a temporary measure to maintain the availability of
longer-term credit in Canada. A total of $69.3 billion in NHA MBS
was purchased by CMHC through a competitive auction process.
Investment in Affordable Housing 2011-2019 (IAH)
Since April 2011, new federal funding for affordable housing has been
provided through the IAH. Originally announced as a three-year
commitment (2011-2014), the IAH has been extended to 2019 for
a total federal investment of more than $1.9 billion over eight years
toward reducing the number of Canadians in housing need. Under the
IAH, provinces and territories cost-match the federal investment and
are responsible for program design and delivery.
Large Lenders
The five largest Canadian Financial Institutions who participate in
the Canadian Registered Covered Bond Programs, unless otherwise
specifically stated in the text.
Lending Programs
We make loans under the NHA to federally-subsidized social housing
sponsors, first nations, provinces, territories and municipalities as
well as non-subsidized housing support loans. Our loan portfolio is
comprised of a mix of renewable and non-renewable loans which
may be on or off-reserve. Direct Lending is the current borrowing
initiative we use to refinance our renewable loans as well as to finance
new commitments on-reserve. These loans can be financed at lower
interest rates due to our status as a federal Crown corporation. As
such, we are able to lower the cost of government assistance required
for social housing projects. Direct lending is operated on a planned
breakeven basis.
Municipal Infrastructure Lending Program 2009-2011 (MILP)
Under Canada’s Economic Action Plan (Budget 2009), we provided $2
billion in direct low-cost loans to municipalities over a two-year period
ending 31 March 2011 to fund housing-related municipal infrastructure.
Proposal Development Funding (PDF)
An interest-free loan of up to $100,000 to support activities carried
out during the early stages of developing an affordable housing project.
PDF is available for projects that are expected to be developed without
long-term Government of Canada subsidies. Eligible costs include soil
load-bearing tests, environmental site assessments, project drawings
and specifications, development permits and certain professional
and consulting fees. The loan is repayable upon the first advance of
mortgage funding and a portion of the loan may be forgiven if it meets
criteria for affordable housing as defined by CMHC.
Seed Funding
Seed funding consists of a contribution and a loan, totaling a maximum
of $20,000 to support activities carried out in the early stages of
developing affordable housing project proposals. Eligible expenses
include costs for housing market studies, need and demand analyses,
the preparation of business plans, preliminary financial viability analyses,
preliminary project designs, as well as the costs to incorporate an
entity. The loan portion of seed funding is repayable upon the first
advance of mortgage funding.
Small Lenders
All financial institutions who participate in the Canadian Registered
Covered Bond Programs, excluding those specifically defined as
large lenders.

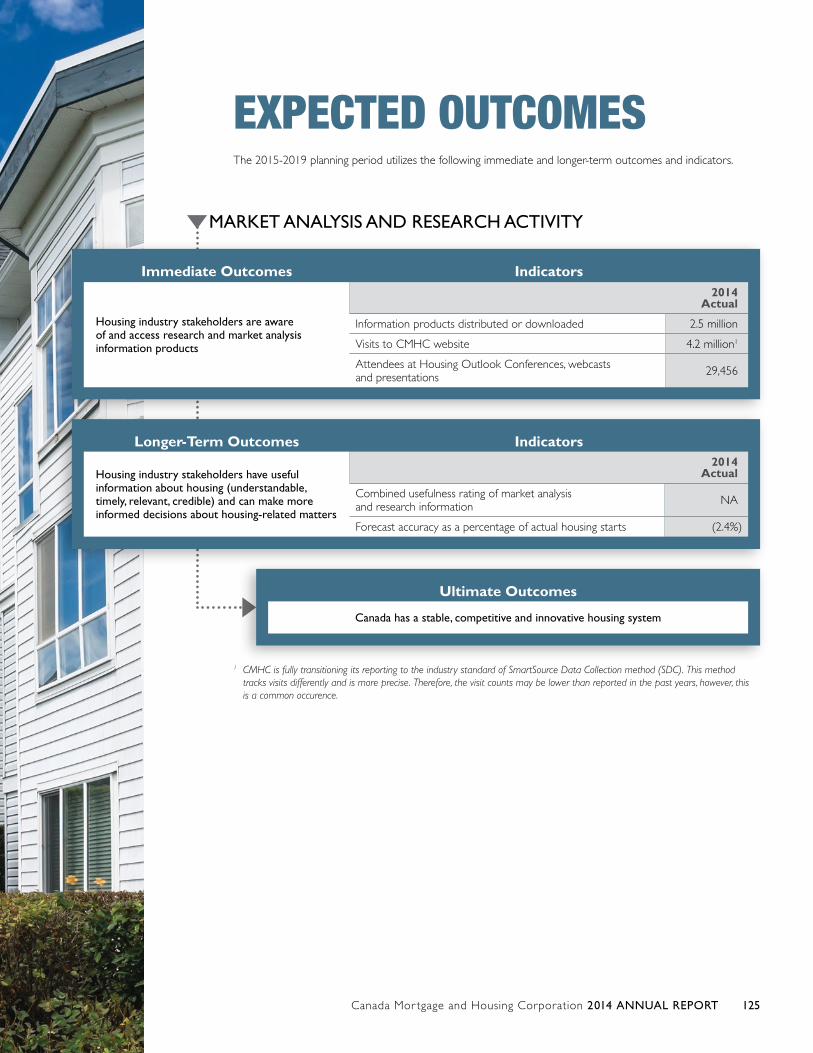
EXPECTED OUTCOMES The 2015-2019 planning period utilizes the following immediate and longer-term outcomes and indicators.
Immediate Outcomes Indicators
Housing industry stakeholders are aware of and access research and market analysis information products
2014 Actual
Information products distributed or downloaded 2.5 million
Visits to CMHC website 4.2 million1
Attendees at Housing Outlook Conferences, webcasts and presentations 29,456
Longer-Term Outcomes Indicators
Housing industry stakeholders have useful information about housing (understandable, timely, relevant, credible) and can make more informed decisions about housing-related matters
2014 Actual
Combined usefulness rating of market analysis and research information NA
Forecast accuracy as a percentage of actual housing starts (2.4%)
Ultimate Outcomes
Canada has a stable, competitive and innovative housing system
MARKET ANALYSIS AND RESEARCH ACTIVITY
Canada Mor tgage and Housing Corporation 2014 ANNUAL REPORT 125
1 CMHC is fully transitioning its reporting to the industry standard of SmartSource Data Collection method (SDC). This method tracks visits differently and is more precise. Therefore, the visit counts may be lower than reported in the past years, however, this is a common occurence.
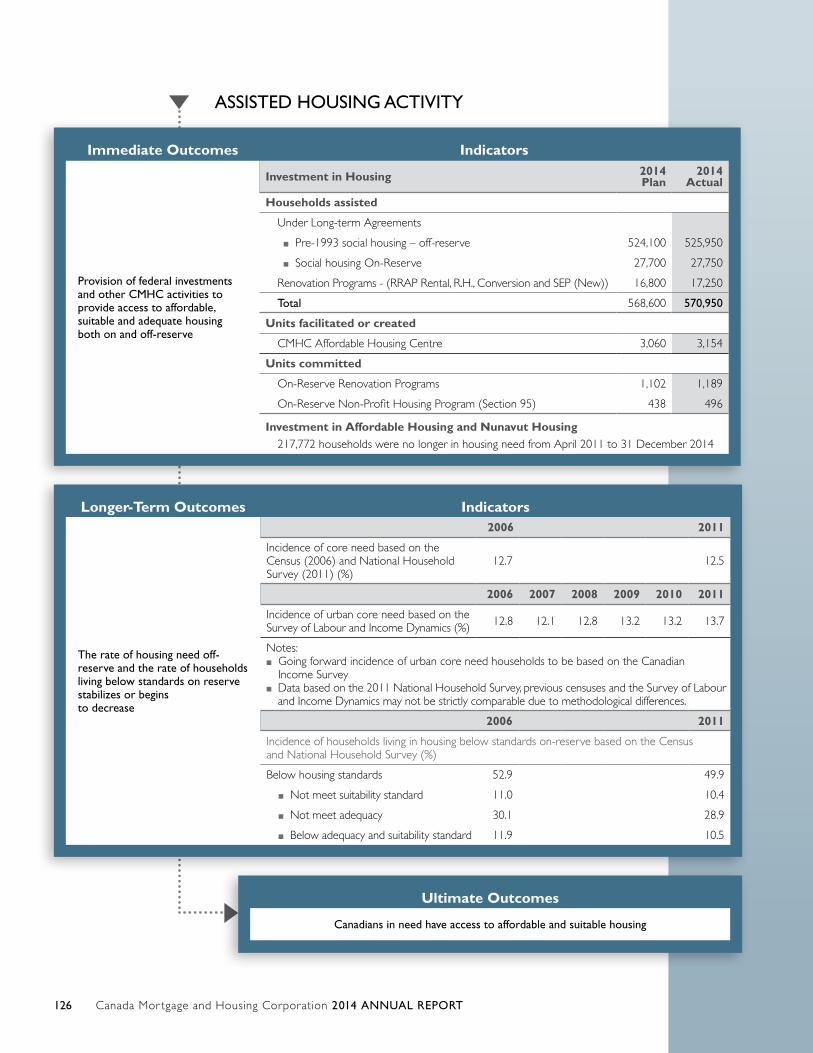
Canada Mor tgage and Housing Corporation 2014 ANNUAL REPORT126
ASSISTED HOUSING ACTIVITY
Immediate Outcomes Indicators
Provision of federal investments and other CMHC activities to provide access to affordable, suitable and adequate housing both on and off-reserve
Investment in Housing 2014 Plan
2014 Actual
Households assisted
Under Long-term Agreements
■ Pre-1993 social housing – off-reserve 524,100 525,950
■ Social housing On-Reserve 27,700 27,750
Renovation Programs - (RRAP Rental, R.H., Conversion and SEP (New)) 16,800 17,250
Total 568,600 570,950
Units facilitated or created
CMHC Affordable Housing Centre 3,060 3,154
Units committed
On-Reserve Renovation Programs 1,102 1,189
On-Reserve Non-Profit Housing Program (Section 95) 438 496
Investment in Affordable Housing and Nunavut Housing217,772 households were no longer in housing need from April 2011 to 31 December 2014
Longer-Term Outcomes Indicators
The rate of housing need off-reserve and the rate of households living below standards on reserve stabilizes or begins to decrease
2006 2011
Incidence of core need based on the Census (2006) and National Household Survey (2011) (%)
12.7 12.5
2006 2007 2008 2009 2010 2011
Incidence of urban core need based on the Survey of Labour and Income Dynamics (%) 12.8 12.1 12.8 13.2 13.2 13.7
Notes:■ Going forward incidence of urban core need households to be based on the Canadian
Income Survey■ Data based on the 2011 National Household Survey, previous censuses and the Survey of Labour
and Income Dynamics may not be strictly comparable due to methodological differences.
2006 2011
Incidence of households living in housing below standards on-reserve based on the Census and National Household Survey (%)
Below housing standards 52.9 49.9
■ Not meet suitability standard 11.0 10.4
■ Not meet adequacy 30.1 28.9
■ Below adequacy and suitability standard 11.9 10.5
Ultimate Outcomes
Canadians in need have access to affordable and suitable housing
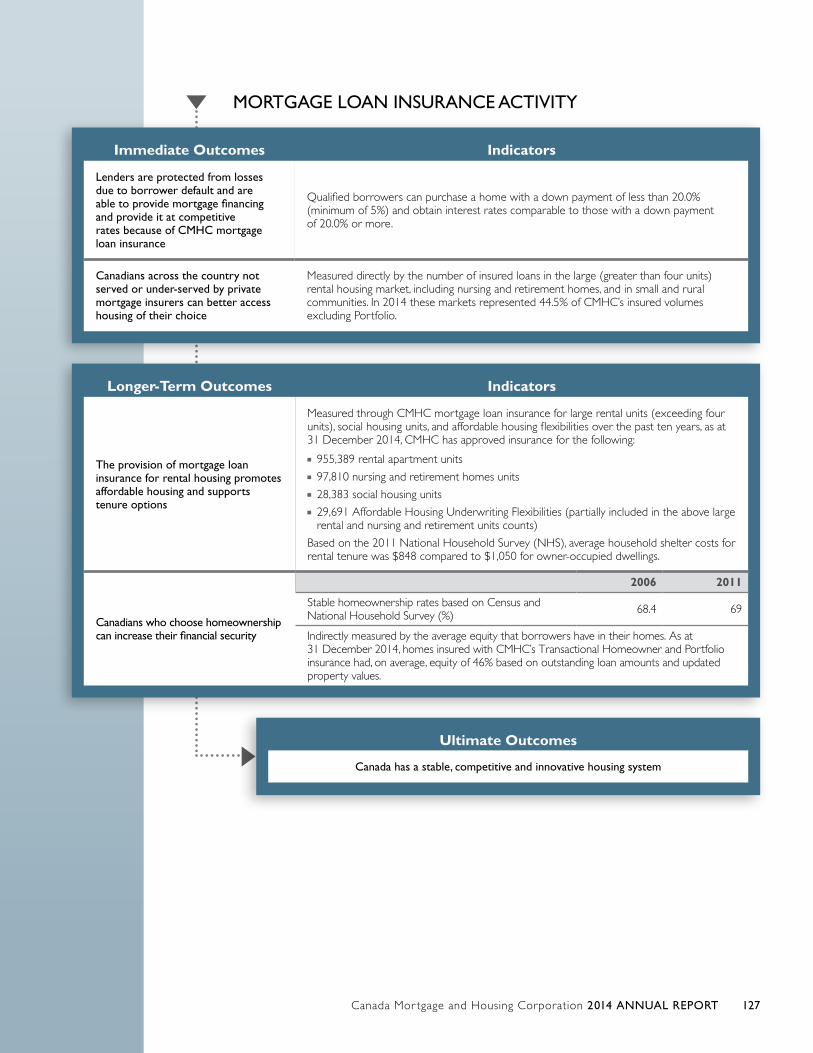
Canada Mor tgage and Housing Corporation 2014 ANNUAL REPORT 127
MORTGAGE LOAN INSURANCE ACTIVITY
Immediate Outcomes Indicators
Lenders are protected from losses due to borrower default and are able to provide mortgage financing and provide it at competitive rates because of CMHC mortgage loan insurance
Qualified borrowers can purchase a home with a down payment of less than 20.0% (minimum of 5%) and obtain interest rates comparable to those with a down payment of 20.0% or more.
Canadians across the country not served or under-served by private mortgage insurers can better access housing of their choice
Measured directly by the number of insured loans in the large (greater than four units) rental housing market, including nursing and retirement homes, and in small and rural communities. In 2014 these markets represented 44.5% of CMHC’s insured volumes excluding Portfolio.
Ultimate Outcomes
Canada has a stable, competitive and innovative housing system
Longer-Term Outcomes Indicators
The provision of mortgage loan insurance for rental housing promotes affordable housing and supports tenure options
Measured through CMHC mortgage loan insurance for large rental units (exceeding four units), social housing units, and affordable housing flexibilities over the past ten years, as at 31 December 2014, CMHC has approved insurance for the following:
■■ 955,389 rental apartment units■■ 97,810 nursing and retirement homes units■■ 28,383 social housing units■■ 29,691 Affordable Housing Underwriting Flexibilities (partially included in the above large rental and nursing and retirement units counts)
Based on the 2011 National Household Survey (NHS), average household shelter costs for rental tenure was $848 compared to $1,050 for owner-occupied dwellings.
Canadians who choose homeownership can increase their financial security
2006 2011
Stable homeownership rates based on Census and National Household Survey (%) 68.4 69
Indirectly measured by the average equity that borrowers have in their homes. As at 31 December 2014, homes insured with CMHC’s Transactional Homeowner and Portfolio insurance had, on average, equity of 46% based on outstanding loan amounts and updated property values.
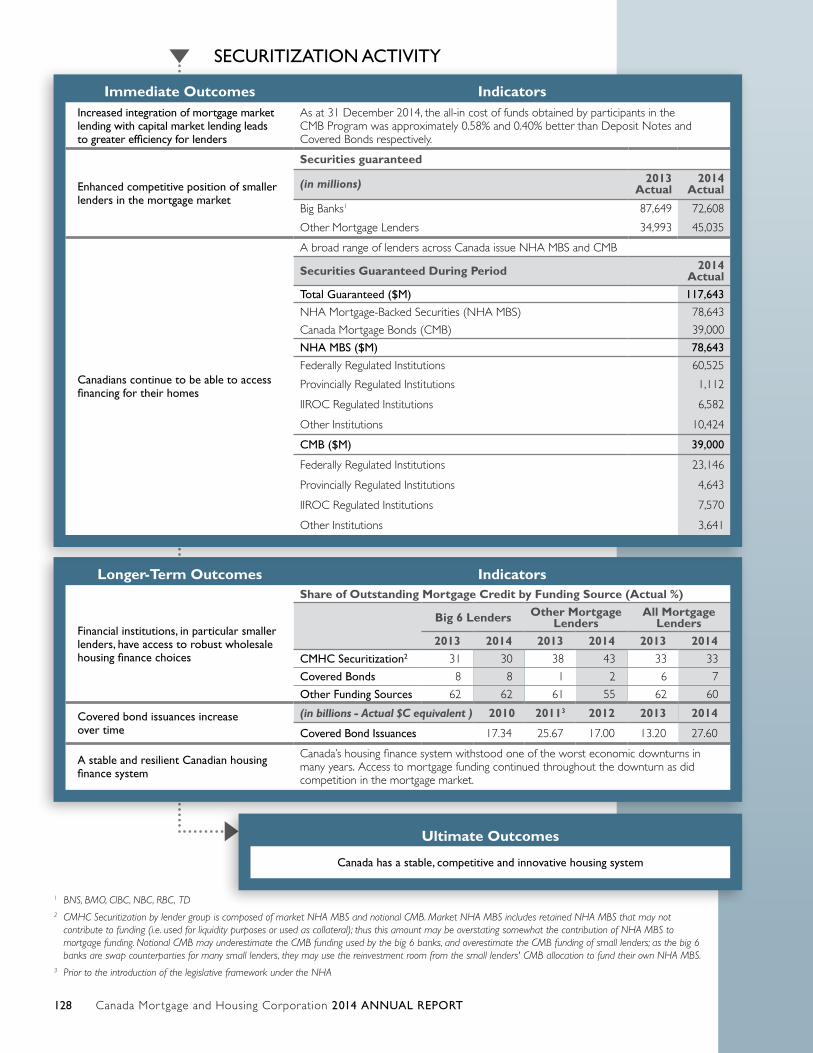
Canada Mor tgage and Housing Corporation 2014 ANNUAL REPORT128
SECURITIZATION ACTIVITY
Ultimate Outcomes
Canada has a stable, competitive and innovative housing system
Longer-Term Outcomes Indicators
Financial institutions, in particular smaller lenders, have access to robust wholesale housing finance choices
Share of Outstanding Mortgage Credit by Funding Source (Actual %)
Big 6 Lenders Other Mortgage Lenders
All Mortgage Lenders
2013 2014 2013 2014 2013 2014
CMHC Securitization2 31 30 38 43 33 33
Covered Bonds 8 8 1 2 6 7
Other Funding Sources 62 62 61 55 62 60
Covered bond issuances increase over time
(in billions - Actual $C equivalent ) 2010 20113 2012 2013 2014
Covered Bond Issuances 17.34 25.67 17.00 13.20 27.60
A stable and resilient Canadian housing finance system
Canada’s housing finance system withstood one of the worst economic downturns in many years. Access to mortgage funding continued throughout the downturn as did competition in the mortgage market.
Immediate Outcomes IndicatorsIncreased integration of mortgage market lending with capital market lending leads to greater efficiency for lenders
As at 31 December 2014, the all-in cost of funds obtained by participants in the CMB Program was approximately 0.58% and 0.40% better than Deposit Notes and Covered Bonds respectively.
Enhanced competitive position of smaller lenders in the mortgage market
Securities guaranteed
(in millions) 2013 Actual
2014 Actual
Big Banks1 87,649 72,608
Other Mortgage Lenders 34,993 45,035
Canadians continue to be able to access financing for their homes
A broad range of lenders across Canada issue NHA MBS and CMB
Securities Guaranteed During Period 2014 Actual
Total Guaranteed ($M) 117,643
NHA Mortgage-Backed Securities (NHA MBS) 78,643
Canada Mortgage Bonds (CMB) 39,000
NHA MBS ($M) 78,643
Federally Regulated Institutions 60,525
Provincially Regulated Institutions 1,112
IIROC Regulated Institutions 6,582
Other Institutions 10,424
CMB ($M) 39,000
Federally Regulated Institutions 23,146
Provincially Regulated Institutions 4,643
IIROC Regulated Institutions 7,570
Other Institutions 3,641
1 BNS, BMO, CIBC, NBC, RBC, TD2 CMHC Securitization by lender group is composed of market NHA MBS and notional CMB. Market NHA MBS includes retained NHA MBS that may not
contribute to funding (i.e. used for liquidity purposes or used as collateral); thus this amount may be overstating somewhat the contribution of NHA MBS to mortgage funding. Notional CMB may underestimate the CMB funding used by the big 6 banks, and overestimate the CMB funding of small lenders; as the big 6 banks are swap counterparties for many small lenders, they may use the reinvestment room from the small lenders' CMB allocation to fund their own NHA MBS.
3 Prior to the introduction of the legislative framework under the NHA

6831
5
cmhc.ca/annualreport
We helpCanadians
meet their housing needs