Embed Size (px)
DESCRIPTION
Â
Citation preview

Florida Realtors® 2014 Real Estate and Economic Summit
Doing Business in Florida’s Growing Markets
Sponsored by

Metro Market Trends, Inc.
MMT Info, Inc.
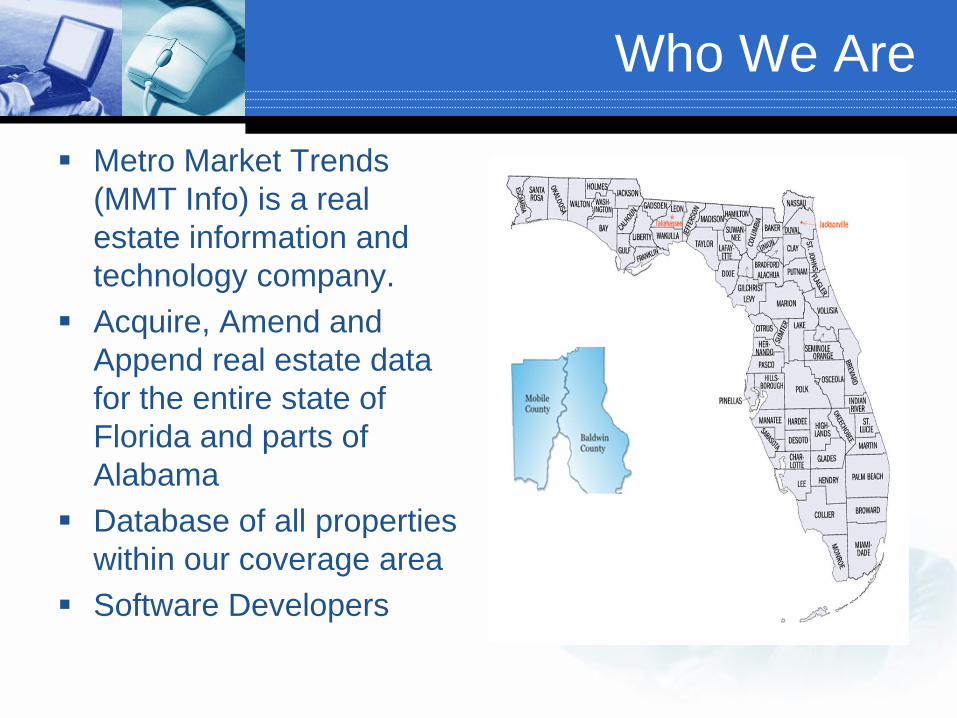
Who We Are
Metro Market Trends
(MMT Info) is a real
estate information and
technology company.
Acquire, Amend and
Append real estate data
for the entire state of
Florida and parts of
Alabama
Database of all properties
within our coverage area
Software Developers
Who Uses Our Data
Real Estate Brokerages
Realtors®
MLS Organizations
Appraisers
Banks/Lending
Institutions
Associations
Builders/Developers
County
Financial Services
Retail
Services
Title Companies
Insurance Industry
Why People Use Our Data
Locate Comparable Sales
Generate Custom Area Market Statistics
Develop a Target Marketing List
Track Pre-Foreclosures
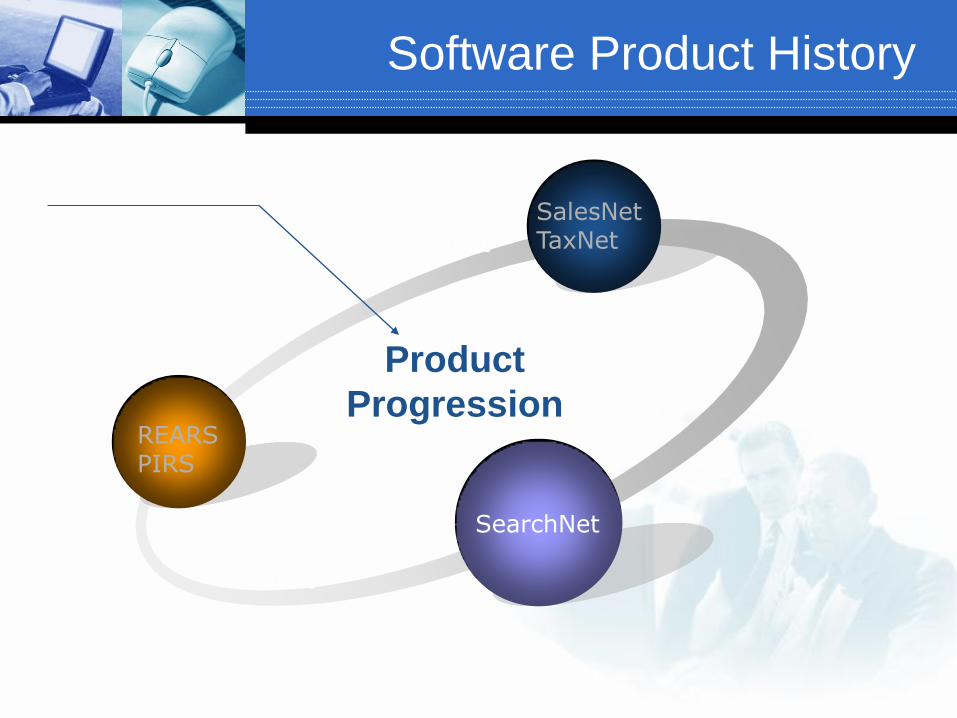
Software Product History
REARS PIRS
Text
SearchNet
Text
Product
Progression
SalesNet TaxNet
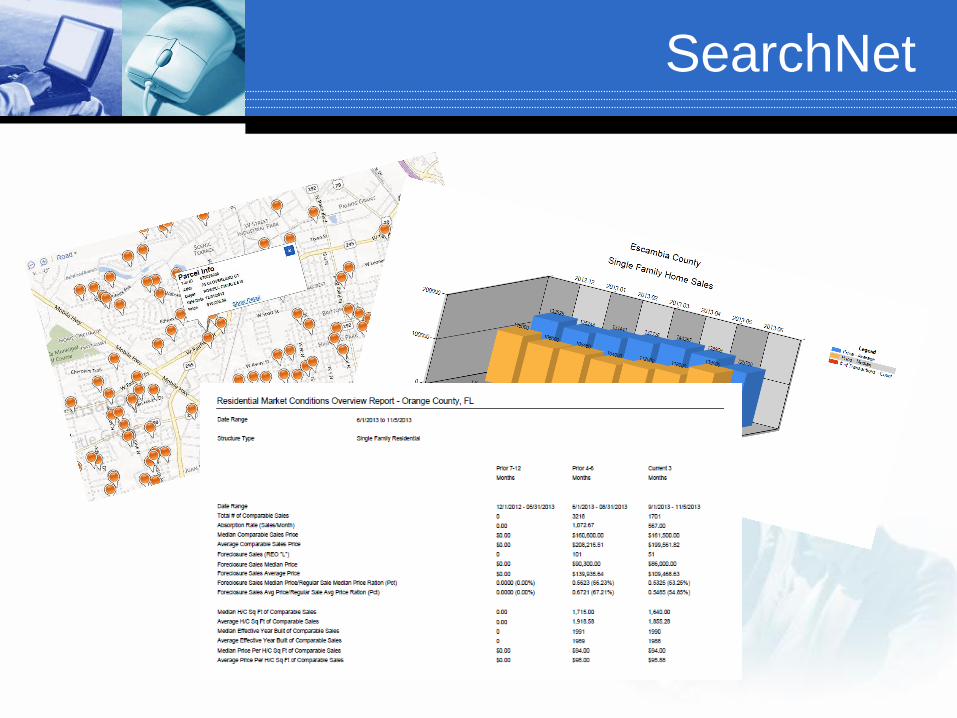
SearchNet

MMTINFO.COM
800-239-1668
CLARK LA BLOND
THANK YOU FOR THIS
OPPORTUNITY

Florida Realtors® 2014 Real Estate and Economic Summit
Doing Business in Florida’s Growing Markets
Sponsored by

Florida Realtors® 2014 Real Estate and Economic Summit
Doing Business in Florida’s Growing Markets
Sponsored by
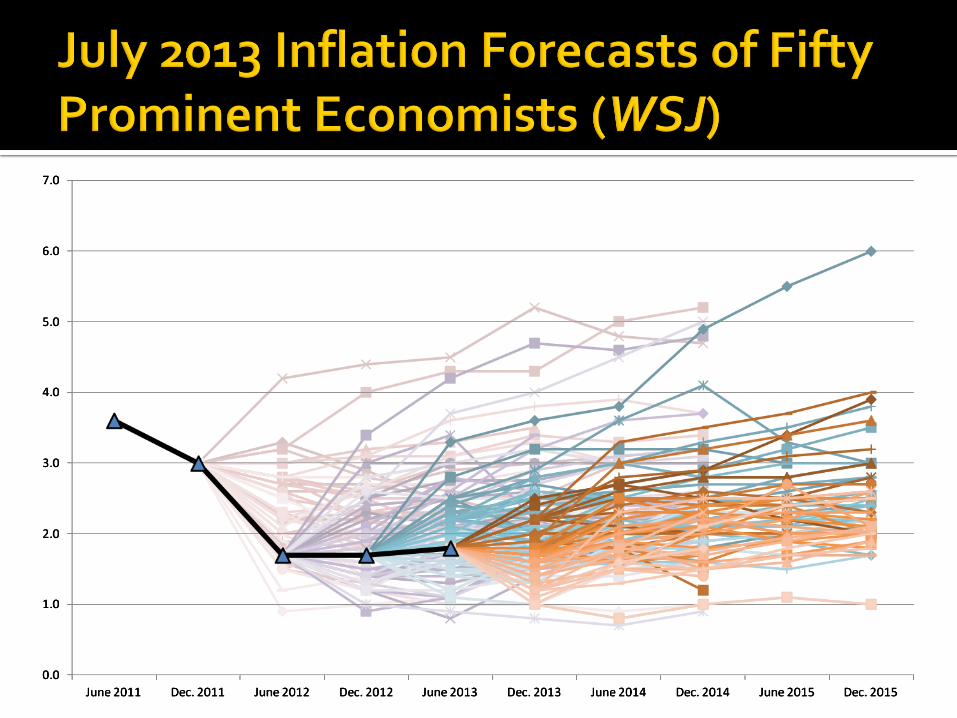
Housing and Mortgage Market
Update
Florida Realtors 2014 Economic Summit
Orlando, FL
December 10, 2013
Frank E. Nothaft
Chief Economist
18
The Emerging Purchase Market
Home sales up in U.S., driven by high affordability Up about 10%-12% in 2013, project 5%-6% gain in 2014 Most (not all) markets have high buyer affordability If 30-year FRMs rise to 5% by year-end 2014, most markets remain ‘affordable’
Lending shift to purchase-money dominated market Increase in home sales and prices drive growth in purchase-money FRM rate rise, ‘burnout’, substantially reduce refinance originations
Who’s buying homes? Return of the trade-up and first-time home-buyer Household formations and demographics will drive demand
First timers less likely to be young couples First timers more likely to be African-American or Latino
18
Office of the Chief Economist
18
Office of the Chief Economist
19
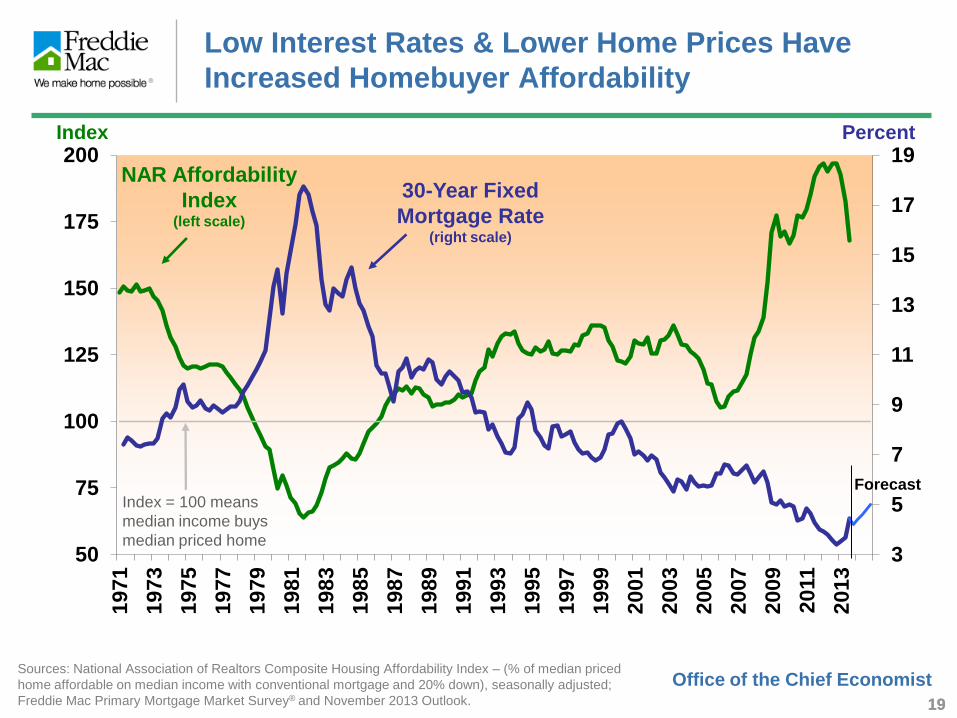
Low Interest Rates & Lower Home Prices Have
Increased Homebuyer Affordability
Office of the Chief Economist
19
Sources: National Association of Realtors Composite Housing Affordability Index – (% of median priced
home affordable on median income with conventional mortgage and 20% down), seasonally adjusted;
Freddie Mac Primary Mortgage Market Survey® and November 2013 Outlook.
3
5
7
9
11
13
15
17
19
50
75
100
125
150
175
200
1971
19
73
19
75
19
77
19
79
19
81
19
83
19
85
19
87
19
89
19
91
19
93
19
95
19
97
19
99
20
01
20
03
20
05
2007
20
09
20
11
20
13
Index Percent
NAR Affordability
Index (left scale)
30-Year Fixed
Mortgage Rate (right scale)
Index = 100 means
median income buys
median priced home
Forecast
Office of the Chief Economist
20
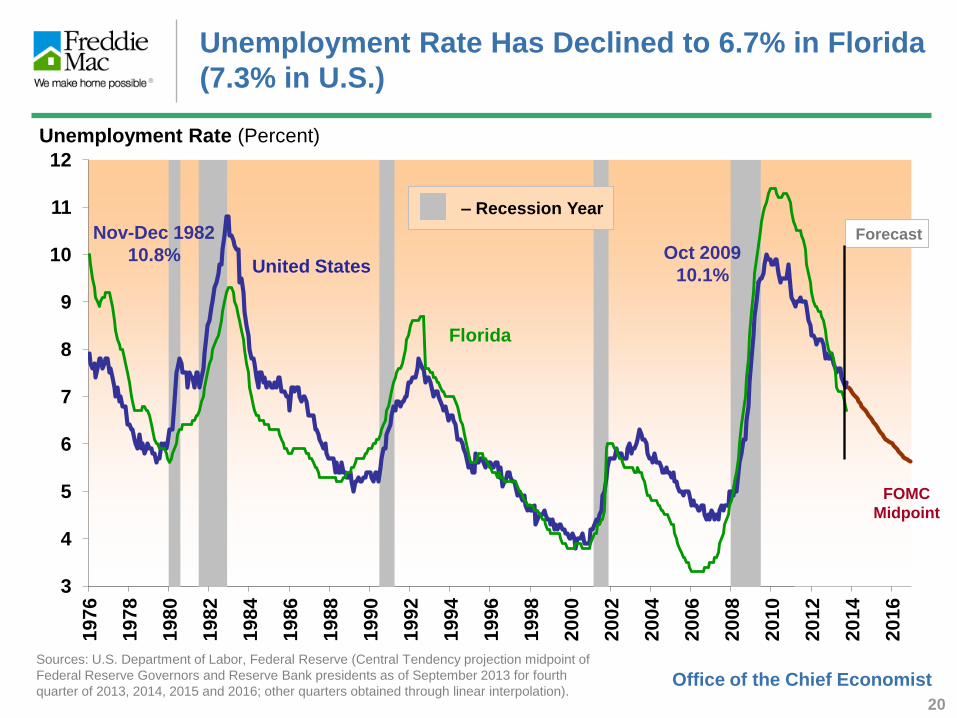
Unemployment Rate Has Declined to 6.7% in Florida
(7.3% in U.S.)
3
4
5
6
7
8
9
10
11
12
19
76
19
78
19
80
19
82
19
84
19
86
19
88
19
90
19
92
19
94
19
96
19
98
20
00
20
02
20
04
20
06
20
08
20
10
20
12
20
14
20
16
Florida
United States
Unemployment Rate (Percent)
Forecast
Sources: U.S. Department of Labor, Federal Reserve (Central Tendency projection midpoint of
Federal Reserve Governors and Reserve Bank presidents as of September 2013 for fourth
quarter of 2013, 2014, 2015 and 2016; other quarters obtained through linear interpolation).
Nov-Dec 1982
10.8% Oct 2009
10.1%
FOMC
Midpoint
– Recession Year
Office of the
Chief
Economist
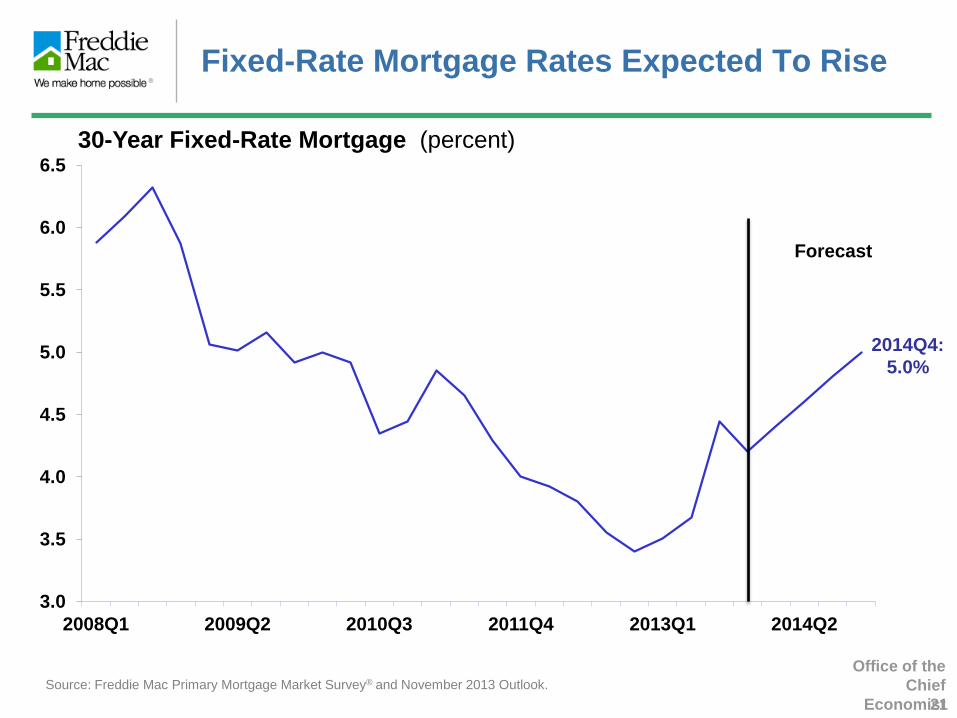
Fixed-Rate Mortgage Rates Expected To Rise
21
3.0
3.5
4.0
4.5
5.0
5.5
6.0
6.5
2008Q1 2009Q2 2010Q3 2011Q4 2013Q1 2014Q2
30-Year Fixed-Rate Mortgage (percent)
2014Q4:
5.0%
Source: Freddie Mac Primary Mortgage Market Survey® and November 2013 Outlook.
Forecast
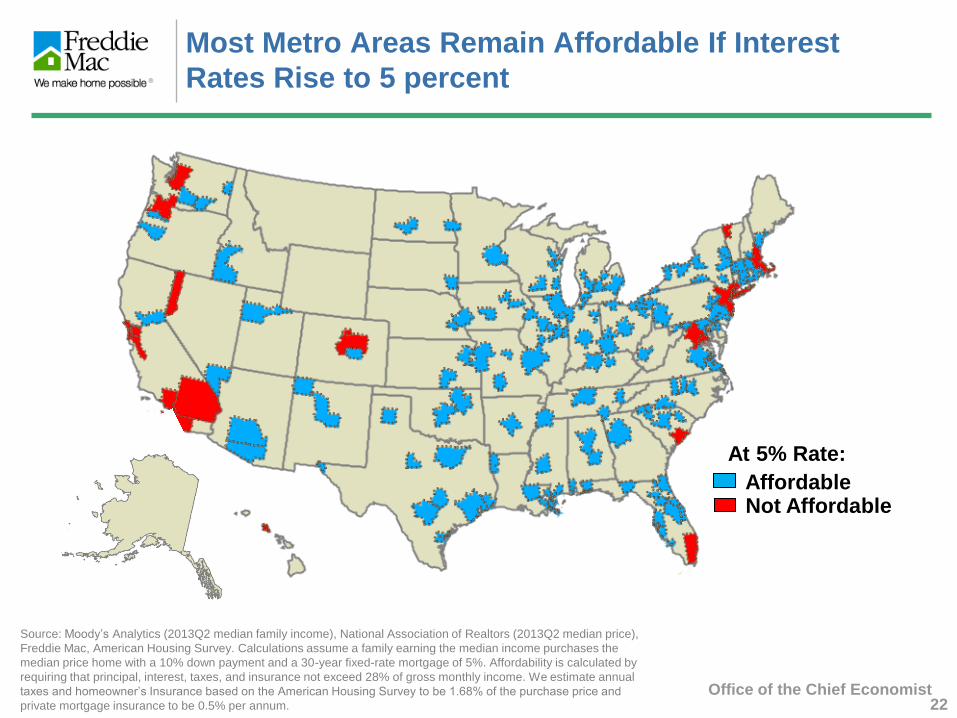
Most Metro Areas Remain Affordable If Interest
Rates Rise to 5 percent
Office of the Chief Economist 22
Source: Moody’s Analytics (2013Q2 median family income), National Association of Realtors (2013Q2 median price),
Freddie Mac, American Housing Survey. Calculations assume a family earning the median income purchases the
median price home with a 10% down payment and a 30-year fixed-rate mortgage of 5%. Affordability is calculated by
requiring that principal, interest, taxes, and insurance not exceed 28% of gross monthly income. We estimate annual
taxes and homeowner’s Insurance based on the American Housing Survey to be 1.68% of the purchase price and
private mortgage insurance to be 0.5% per annum.
Affordable Not Affordable
At 5% Rate:
Office of the Chief Economist
23
10
20
30
40
50
60
70
80
2,500
3,500
4,500
5,500
6,500
7,500
20
00
20
01
20
02
20
03
20
04
20
05
20
06
20
07
20
08
20
09
20
10
20
11
20
12
20
13
20
14
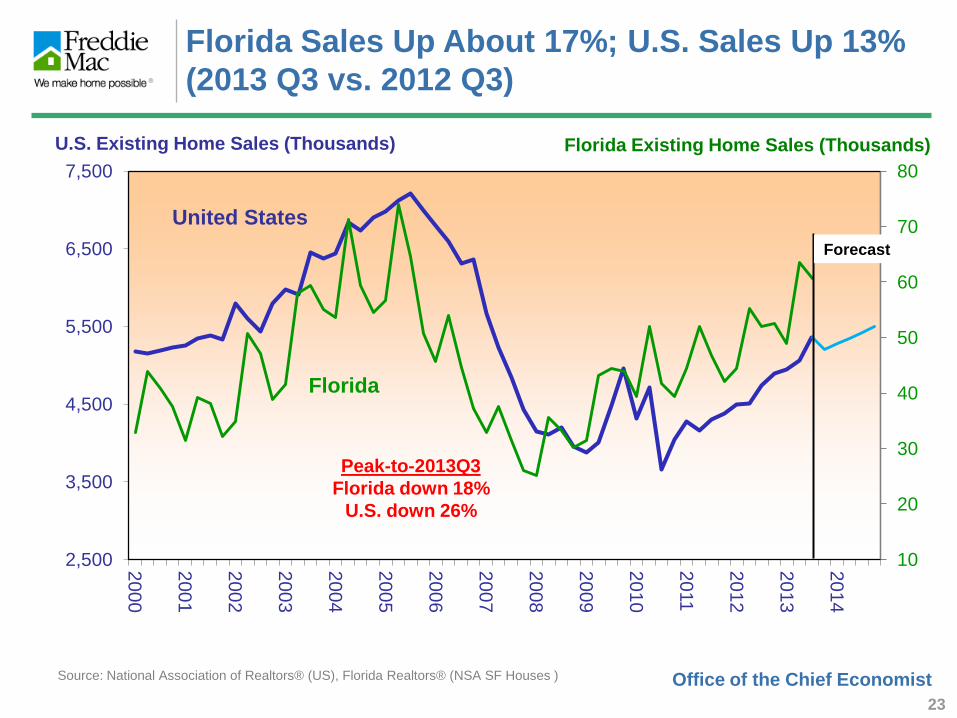
U.S. Existing Home Sales (Thousands) Florida Existing Home Sales (Thousands)
Peak-to-2013Q3
Florida down 18%
U.S. down 26%
Source: National Association of Realtors® (US), Florida Realtors® (NSA SF Houses )
Florida Sales Up About 17%; U.S. Sales Up 13%
(2013 Q3 vs. 2012 Q3)
United States
Florida
Forecast
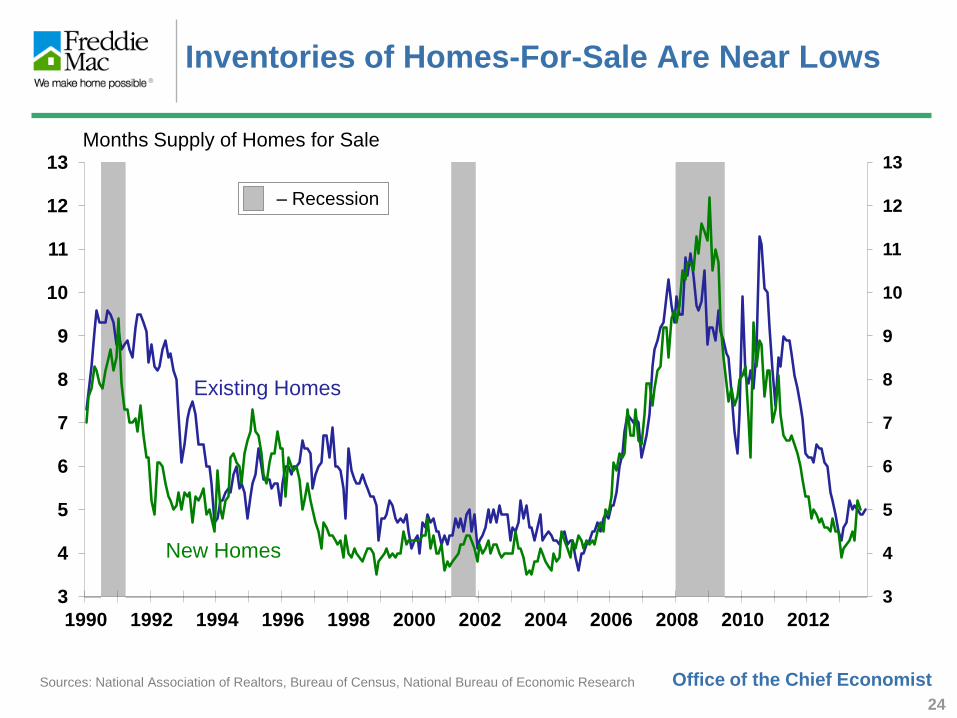
Inventories of Homes-For-Sale Are Near Lows
24
3
4
5
6
7
8
9
10
11
12
13
3
4
5
6
7
8
9
10
11
12
13
1990 1992 1994 1996 1998 2000 2002 2004 2006 2008 2010 2012
Months Supply of Homes for Sale
Sources: National Association of Realtors, Bureau of Census, National Bureau of Economic Research
New Homes
Existing Homes
– Recession
Office of the Chief Economist
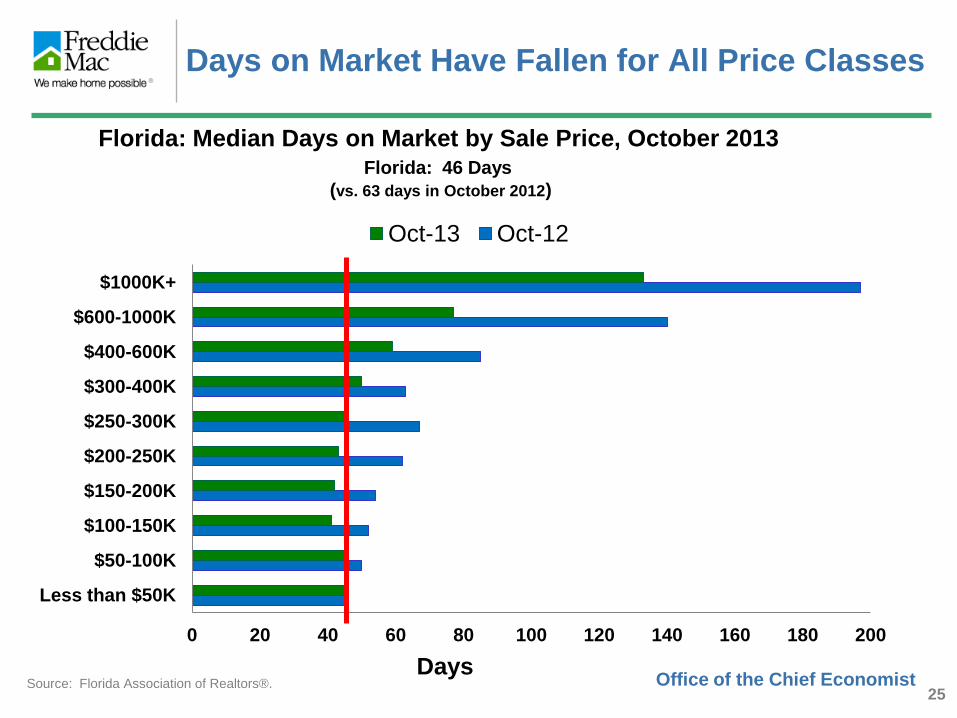
Days on Market Have Fallen for All Price Classes
0 20 40 60 80 100 120 140 160 180 200
Less than $50K
$50-100K
$100-150K
$150-200K
$200-250K
$250-300K
$300-400K
$400-600K
$600-1000K
$1000K+
Oct-13 Oct-12
Office of the Chief Economist Source: Florida Association of Realtors®.
Florida: Median Days on Market by Sale Price, October 2013 Florida: 46 Days
(vs. 63 days in October 2012)
25
Days
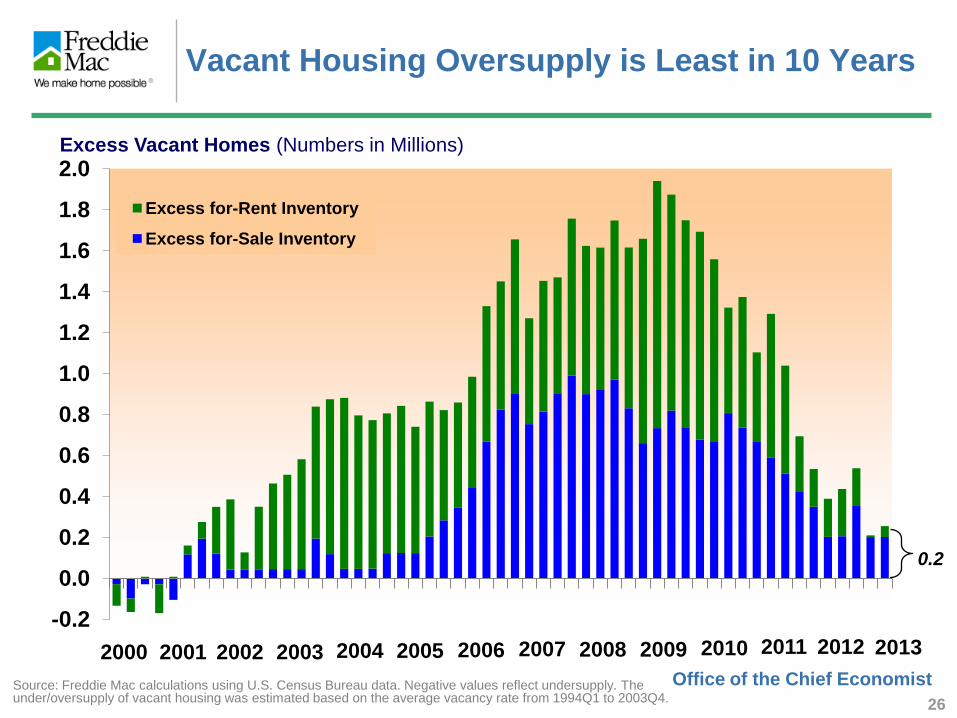
26
Vacant Housing Oversupply is Least in 10 Years
-0.2
0.0
0.2
0.4
0.6
0.8
1.0
1.2
1.4
1.6
1.8
2.0
Excess for-Rent Inventory
Excess for-Sale Inventory
Source: Freddie Mac calculations using U.S. Census Bureau data. Negative values reflect undersupply. The under/oversupply of vacant housing was estimated based on the average vacancy rate from 1994Q1 to 2003Q4.
Excess Vacant Homes (Numbers in Millions)
2003 2004 2005 2006 2007 2008 2009 2010 2000 2001 2002 2011 2012
0.2
2013
Office of the Chief Economist
Office of the Chief Economist
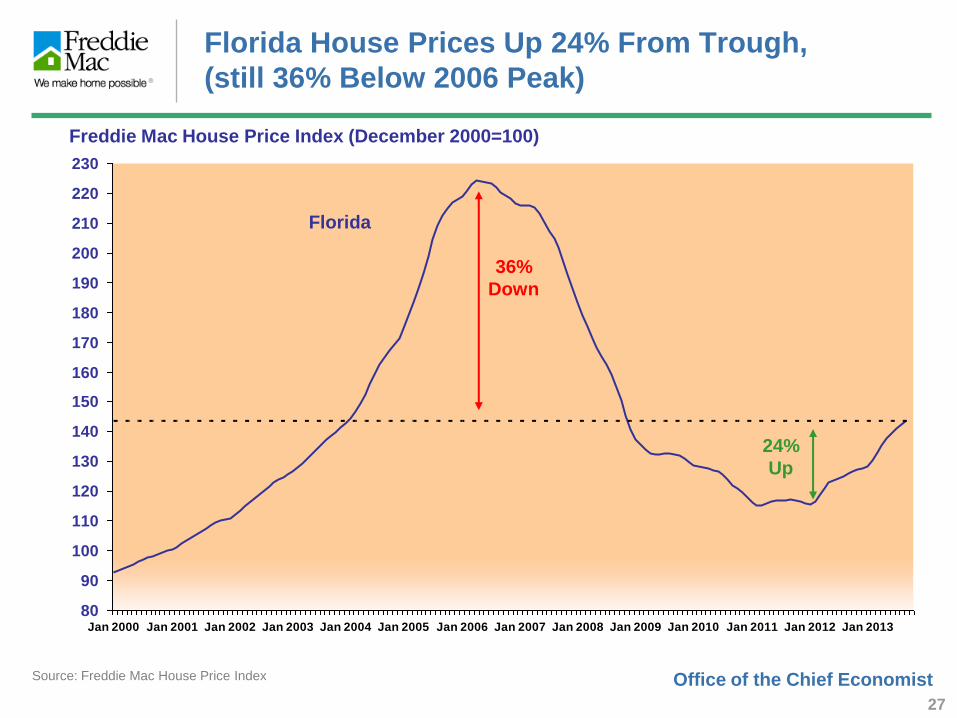
27
Florida House Prices Up 24% From Trough,
(still 36% Below 2006 Peak)
80
90
100
110
120
130
140
150
160
170
180
190
200
210
220
230
Jan 2000 Jan 2001 Jan 2002 Jan 2003 Jan 2004 Jan 2005 Jan 2006 Jan 2007 Jan 2008 Jan 2009 Jan 2010 Jan 2011 Jan 2012 Jan 2013
Source: Freddie Mac House Price Index
Florida
Freddie Mac House Price Index (December 2000=100)
36%
Down
24%
Up
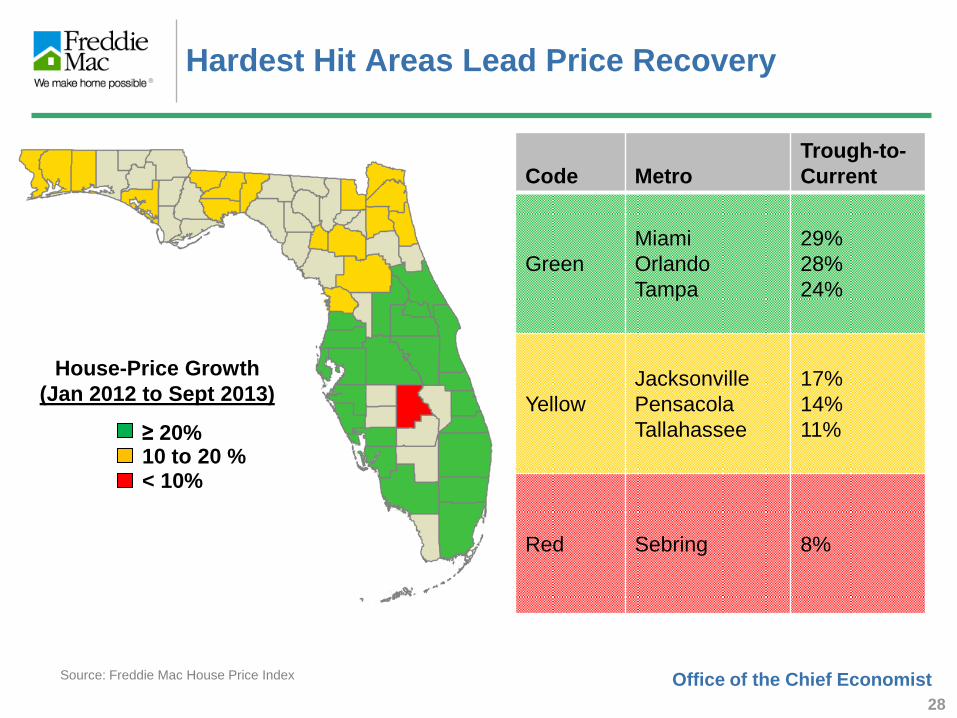
Hardest Hit Areas Lead Price Recovery
Office of the Chief Economist
28
Source: Freddie Mac House Price Index
Code
Metro
Trough-to-
Current
Green
Miami
Orlando
Tampa
29%
28%
24%
Yellow
Jacksonville
Pensacola
Tallahassee
17%
14%
11%
Red Sebring 8%
≥ 20%
< 10% 10 to 20 %
House-Price Growth
(Jan 2012 to Sept 2013)
Office of the Chief Economist
29
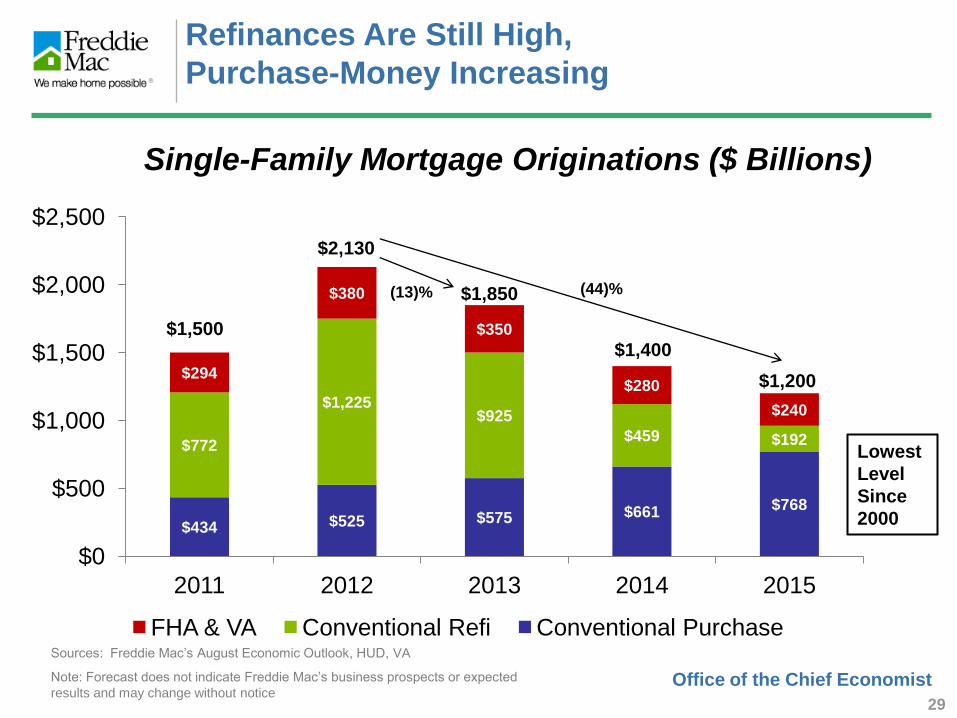
$434 $525 $575 $661 $768
$772
$1,225 $925
$459 $192
$294
$380
$350
$280
$240
$0
$500
$1,000
$1,500
$2,000
$2,500
2011 2012 2013 2014 2015
FHA & VA Conventional Refi Conventional Purchase
$1,500
$2,130
$1,850
$1,400
$1,200
(13)% (44)%
Refinances Are Still High,
Purchase-Money Increasing
Single-Family Mortgage Originations ($ Billions)
Sources: Freddie Mac’s August Economic Outlook, HUD, VA
Note: Forecast does not indicate Freddie Mac’s business prospects or expected
results and may change without notice
Lowest
Level
Since
2000
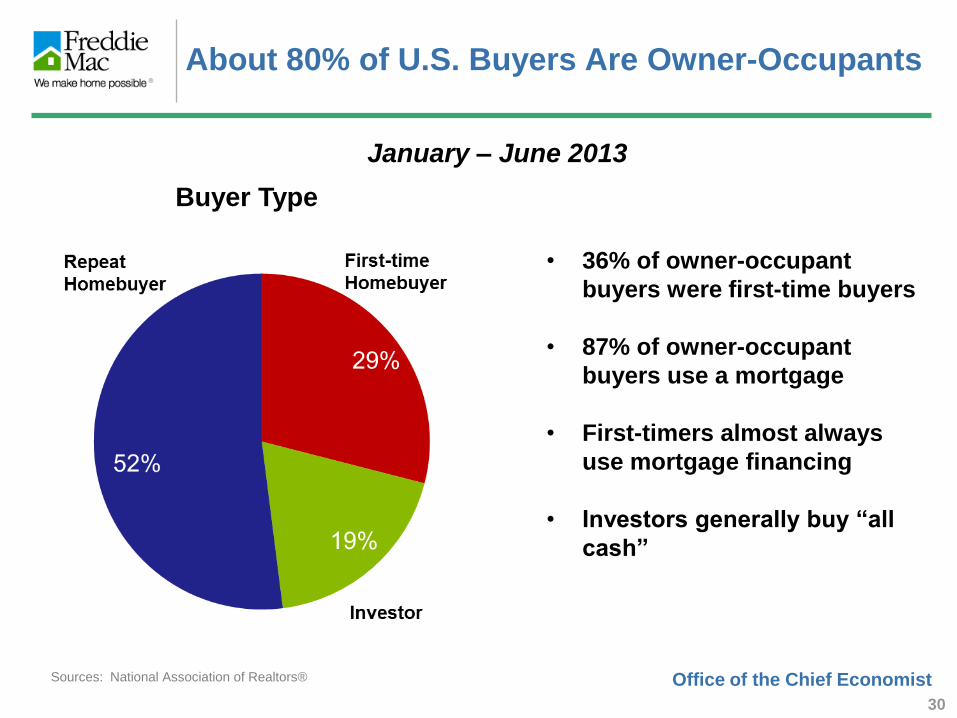
Office of the Chief Economist Sources: National Association of Realtors®
January – June 2013
About 80% of U.S. Buyers Are Owner-Occupants
Buyer Type
• 36% of owner-occupant
buyers were first-time buyers
• 87% of owner-occupant
buyers use a mortgage
• First-timers almost always
use mortgage financing
• Investors generally buy “all
cash”
30
Office of the Chief Economist
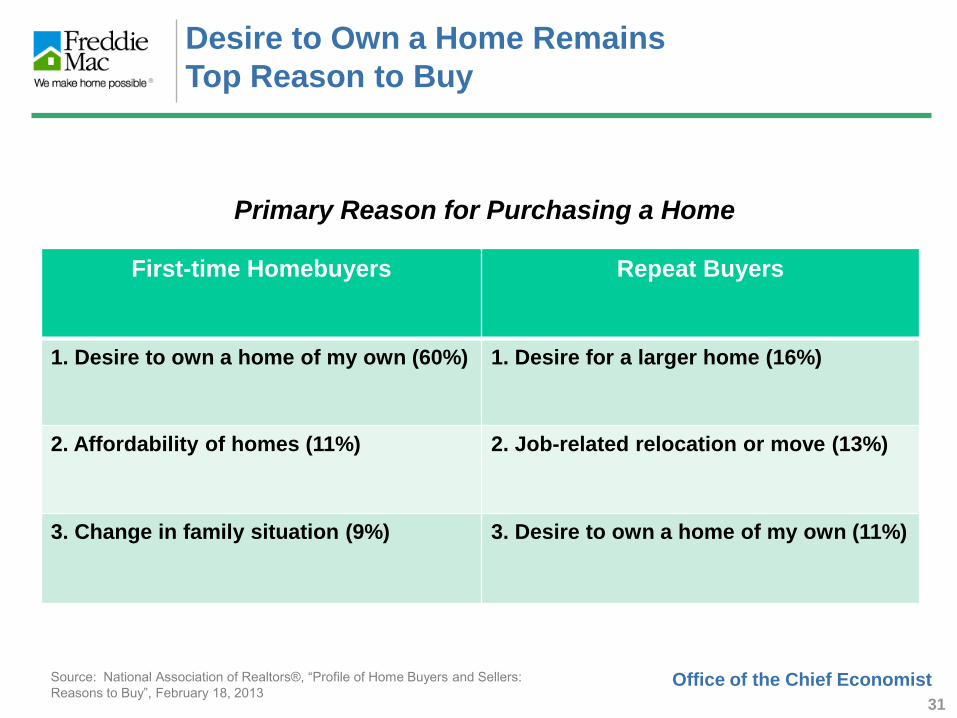
Desire to Own a Home Remains
Top Reason to Buy
Source: National Association of Realtors®, “Profile of Home Buyers and Sellers:
Reasons to Buy”, February 18, 2013
Primary Reason for Purchasing a Home
First-time Homebuyers Repeat Buyers
1. Desire to own a home of my own (60%) 1. Desire for a larger home (16%)
2. Affordability of homes (11%) 2. Job-related relocation or move (13%)
3. Change in family situation (9%) 3. Desire to own a home of my own (11%)
31
Office of the Chief Economist
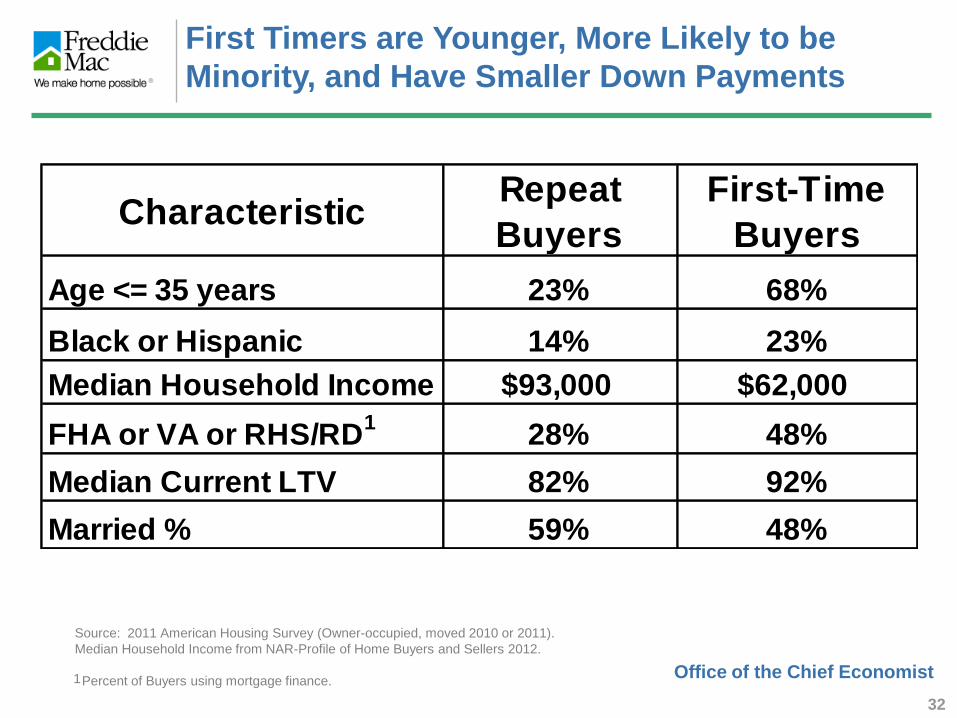
First Timers are Younger, More Likely to be
Minority, and Have Smaller Down Payments
CharacteristicRepeat
Buyers
First-Time
Buyers
Age <= 35 years 23% 68%
Black or Hispanic 14% 23%
Median Household Income $93,000 $62,000
FHA or VA or RHS/RD1
28% 48%
Median Current LTV 82% 92%
Married % 59% 48%
Source: 2011 American Housing Survey (Owner-occupied, moved 2010 or 2011).
Median Household Income from NAR-Profile of Home Buyers and Sellers 2012.
Percent of Buyers using mortgage finance. 1
32

Where to Get More Information Look for regular updates to our economic forecast, commentary and data at
www.FreddieMac.com/news/finance
Contact us at [email protected]
Opinions, estimates, forecasts and other views contained in this document are those of Freddie Mac's Office of
the Chief Economist, do not necessarily represent the views of Freddie Mac or its management, should not be
construed as indicating Freddie Mac's business prospects or expected results, and are subject to change without
notice. Although the Office of the Chief Economist attempts to provide reliable, useful information, it does not
guarantee that the information is accurate, current or suitable for any particular purpose.
Information from this document may be used with proper attribution. Alteration of this document is prohibited.
© 2013 by Freddie Mac.

Florida Realtors® 2014 Real Estate and Economic Summit
Doing Business in Florida’s Growing Markets
Sponsored by
An Economic Forecast in Uncertain Times
Orlando, FL December 10th, 2013
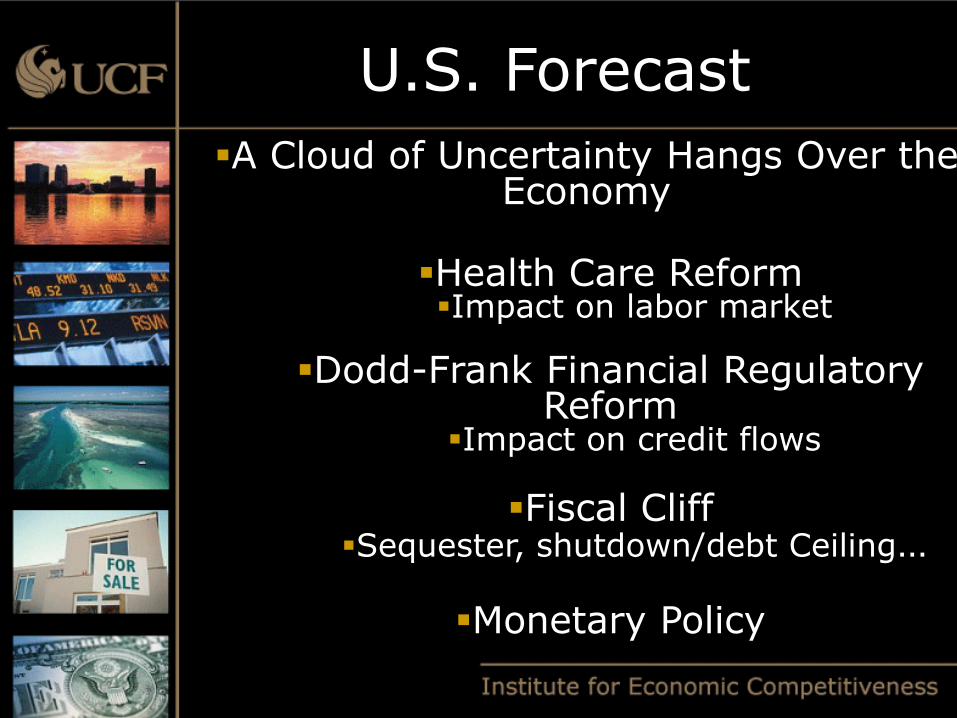
U.S. Forecast
A Cloud of Uncertainty Hangs Over the Economy
Health Care Reform Impact on labor market
Dodd-Frank Financial Regulatory
Reform Impact on credit flows
Fiscal Cliff
Sequester, shutdown/debt Ceiling…
Monetary Policy
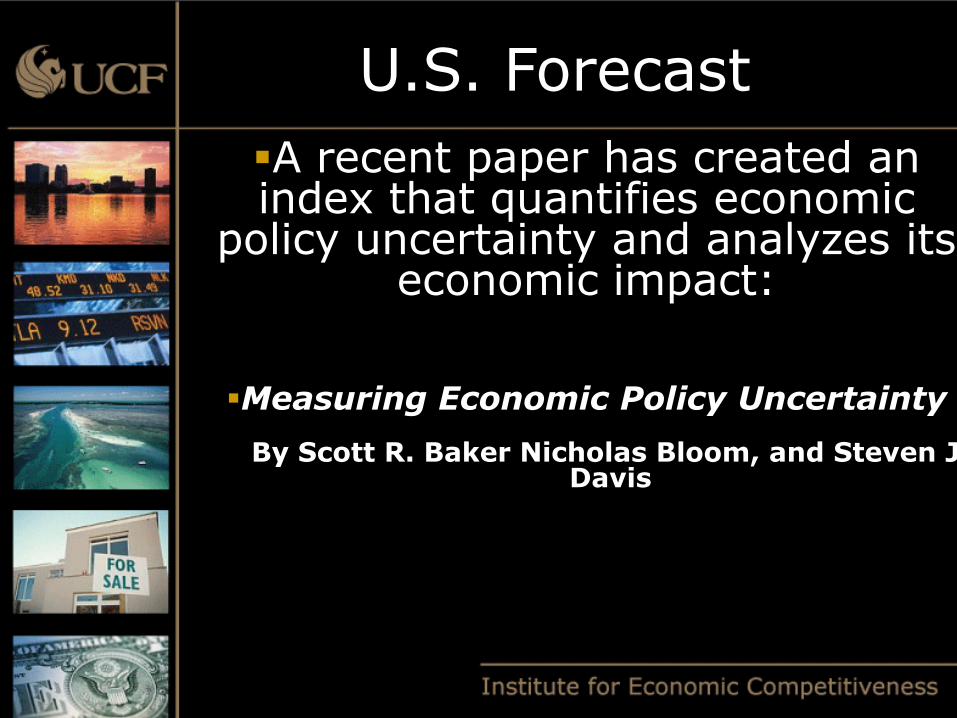
U.S. Forecast
A recent paper has created an index that quantifies economic
policy uncertainty and analyzes its economic impact:
Measuring Economic Policy Uncertainty
By Scott R. Baker Nicholas Bloom, and Steven J. Davis
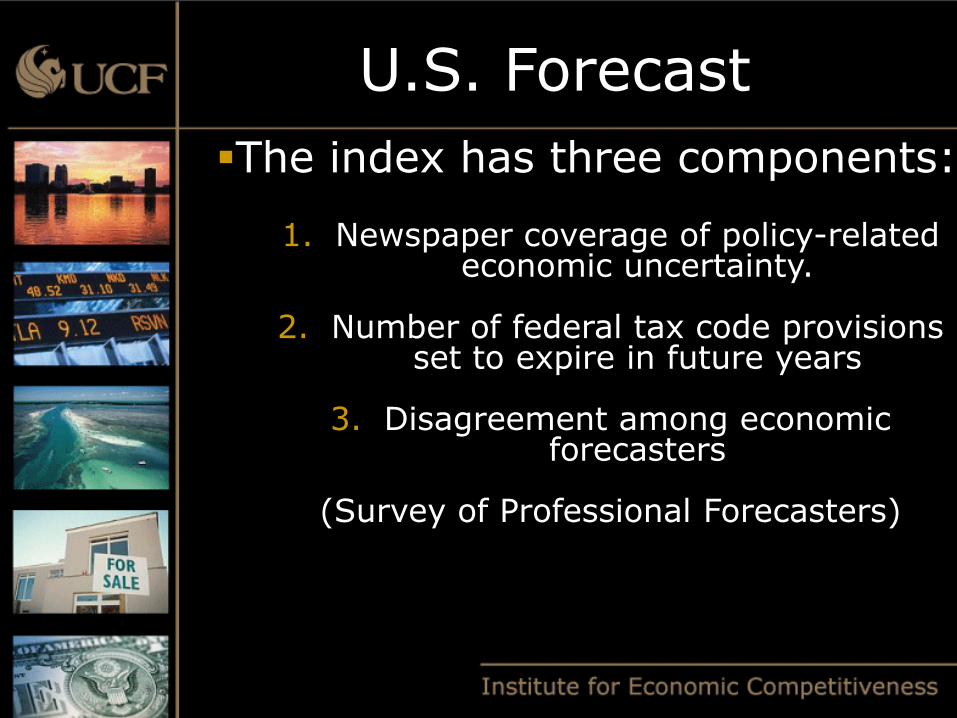
U.S. Forecast
The index has three components:
1. Newspaper coverage of policy-related economic uncertainty.
2. Number of federal tax code provisions
set to expire in future years
3. Disagreement among economic forecasters
(Survey of Professional Forecasters)
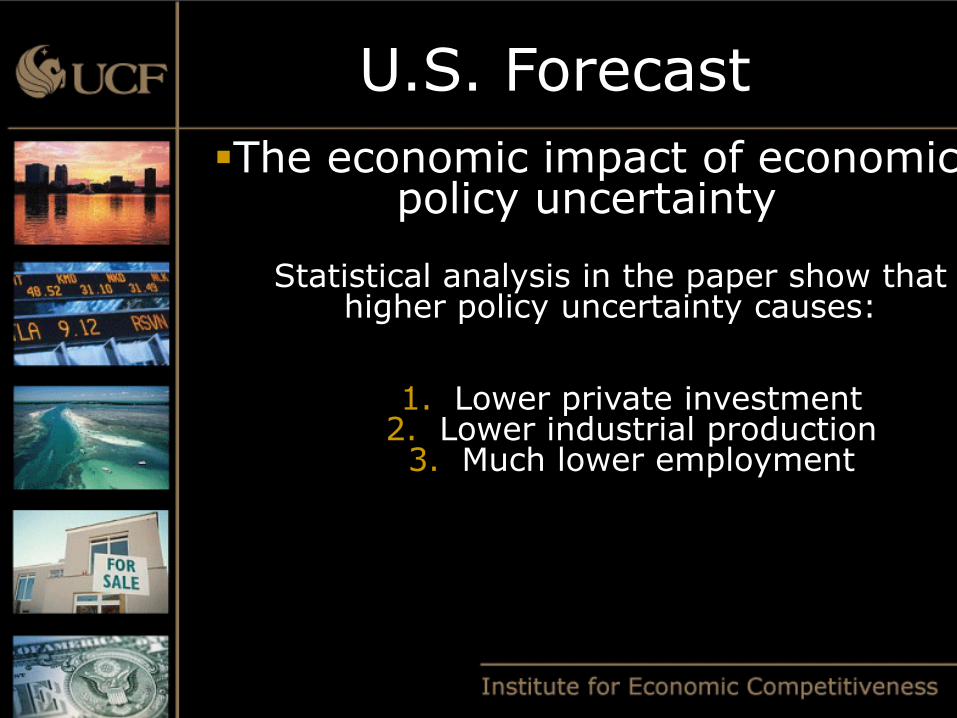
U.S. Forecast
The economic impact of economic policy uncertainty
Statistical analysis in the paper show that
higher policy uncertainty causes:
1. Lower private investment
2. Lower industrial production 3. Much lower employment
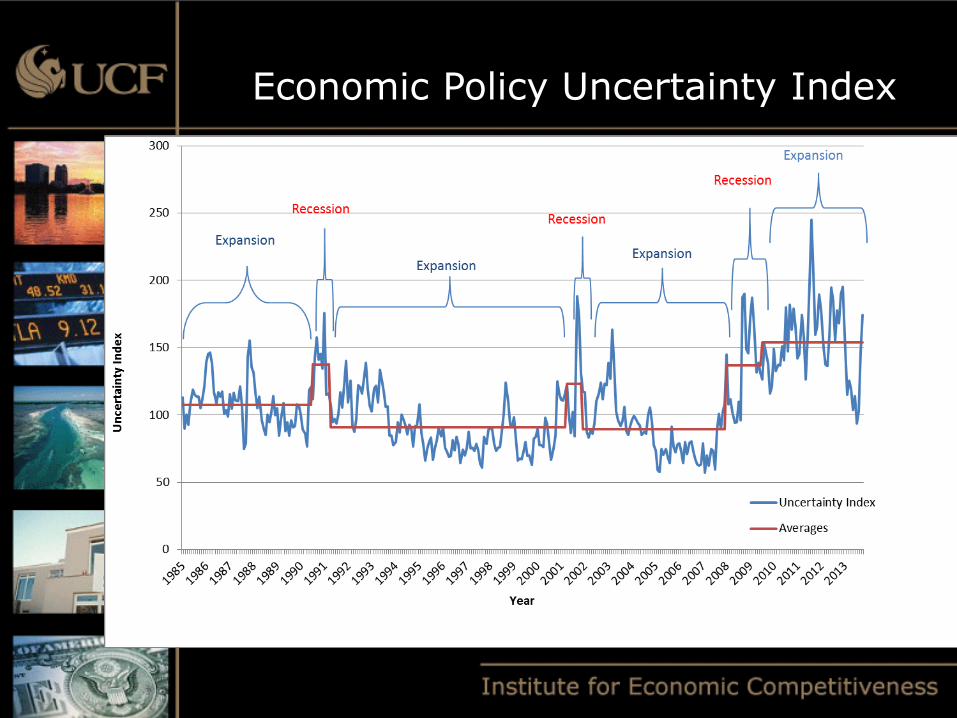
Economic Policy Uncertainty Index
U.S. Forecast
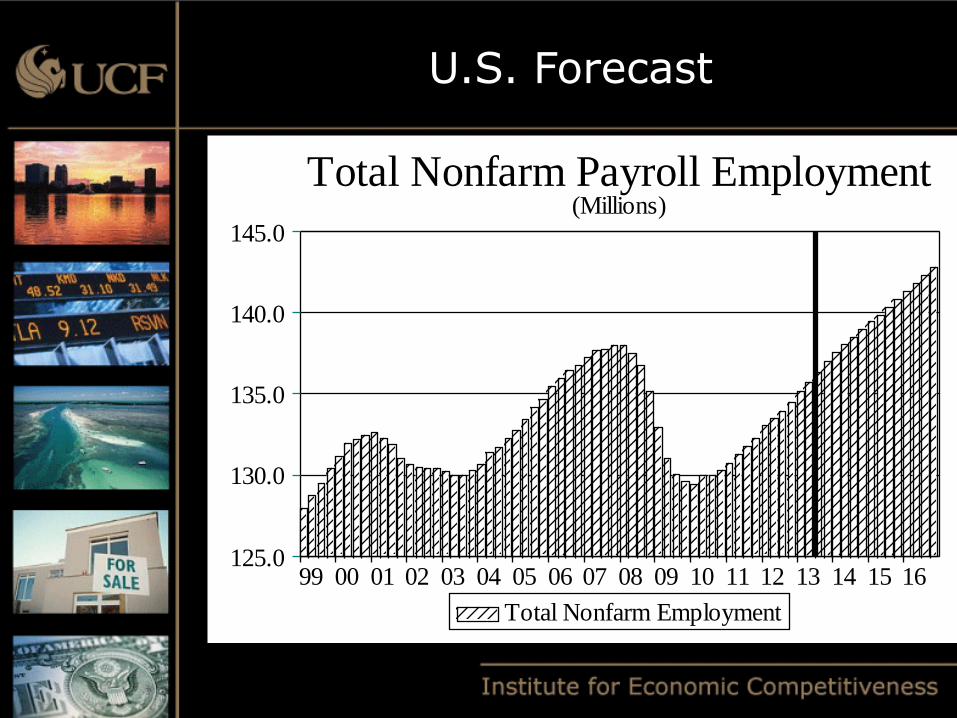
161514131211100908070605040302010099
145.0
140.0
135.0
130.0
125.0
Total Nonfarm Payroll Employment(Millions)
Total Nonfarm Employment
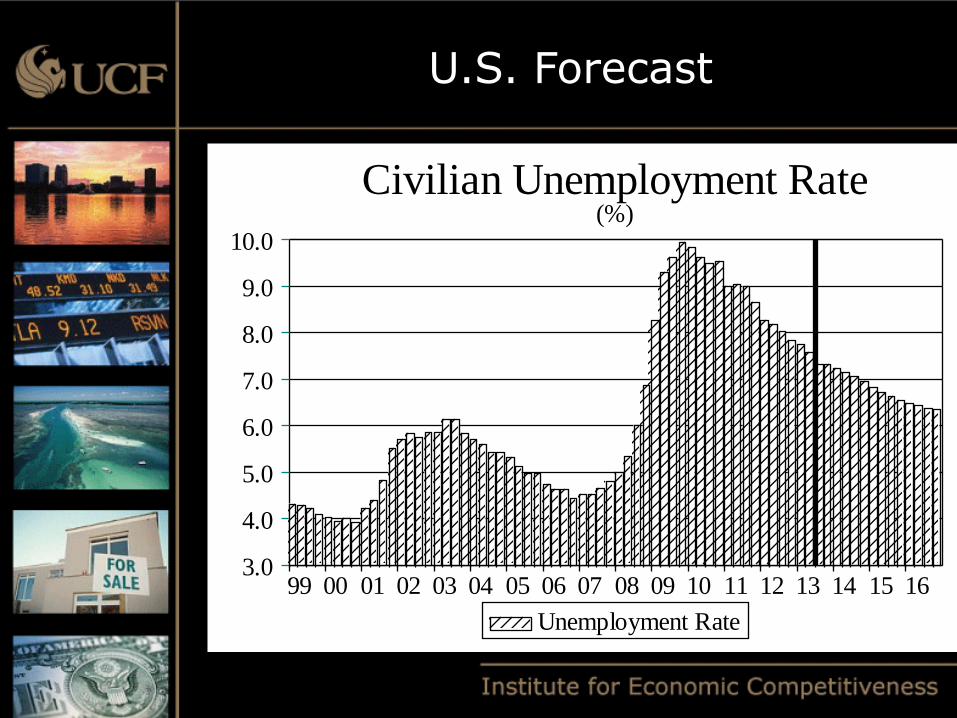
U.S. Forecast
U.S. Forecast
161514131211100908070605040302010099
10.0
9.0
8.0
7.0
6.0
5.0
4.0
3.0
Civilian Unemployment Rate(%)
Unemployment Rate
U.S. Forecast
Lost housing wealth
Weak labor market recovery
Have weighed on consumers
“Mini age of austerity”
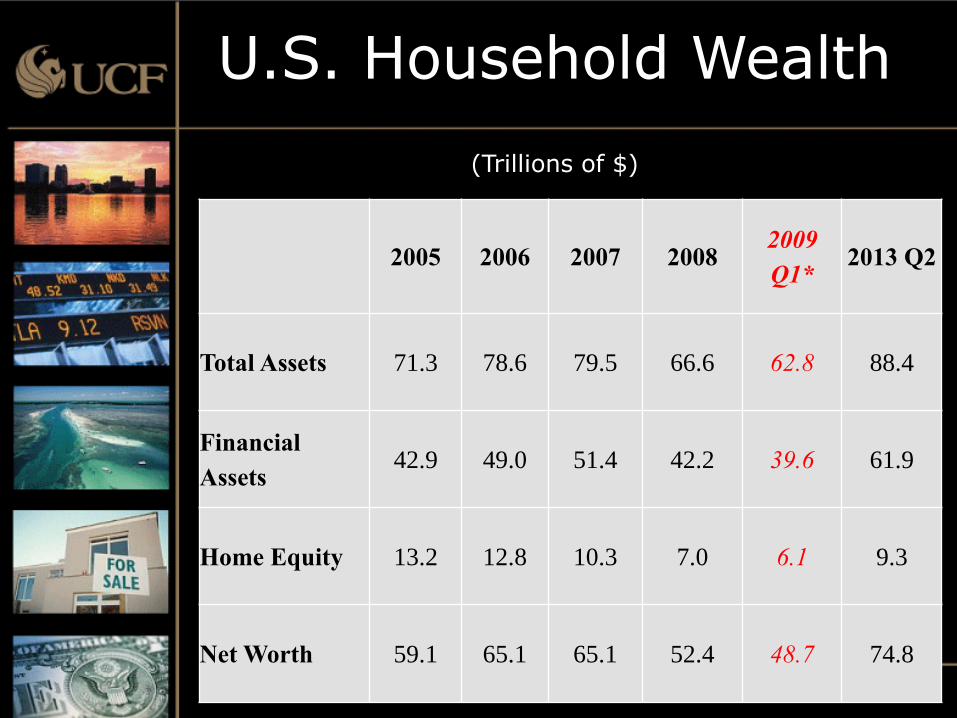
U.S. Household Wealth
(Trillions of $)
2005 2006 2007 2008 2009
Q1* 2013 Q2
Total Assets 71.3 78.6 79.5 66.6 62.8 88.4
Financial
Assets 42.9 49.0 51.4 42.2 39.6 61.9
Home Equity 13.2 12.8 10.3 7.0 6.1 9.3
Net Worth 59.1 65.1 65.1 52.4 48.7 74.8
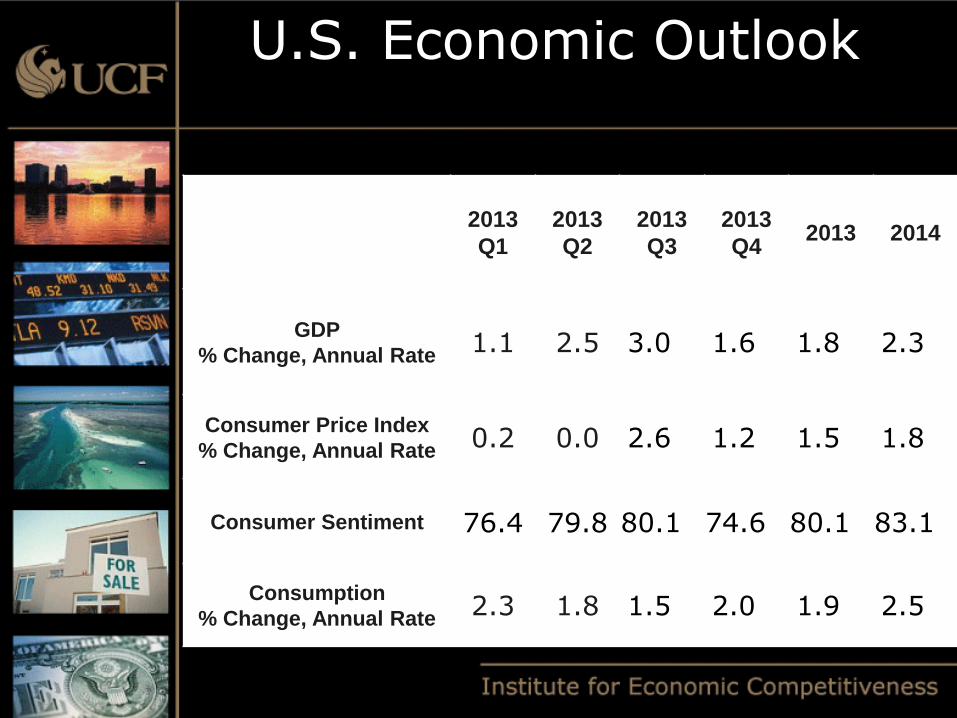
U.S. Economic Outlook
2013
Q1
2013
Q2
2013
Q3
2013
Q4 2013 2014
GDP
% Change, Annual Rate 1.1 2.5 3.0 1.6 1.8 2.3
Consumer Price Index
% Change, Annual Rate 0.2 0.0 2.6 1.2 1.5 1.8
Consumer Sentiment 76.4 79.8 80.1 74.6 80.1 83.1
Consumption
% Change, Annual Rate 2.3 1.8 1.5 2.0 1.9 2.5
Florida Housing Market
Housing market recovery continues to unfold Prices have gained traction Can the momentum be maintained?
The role of the investor
Housing finance still problematic
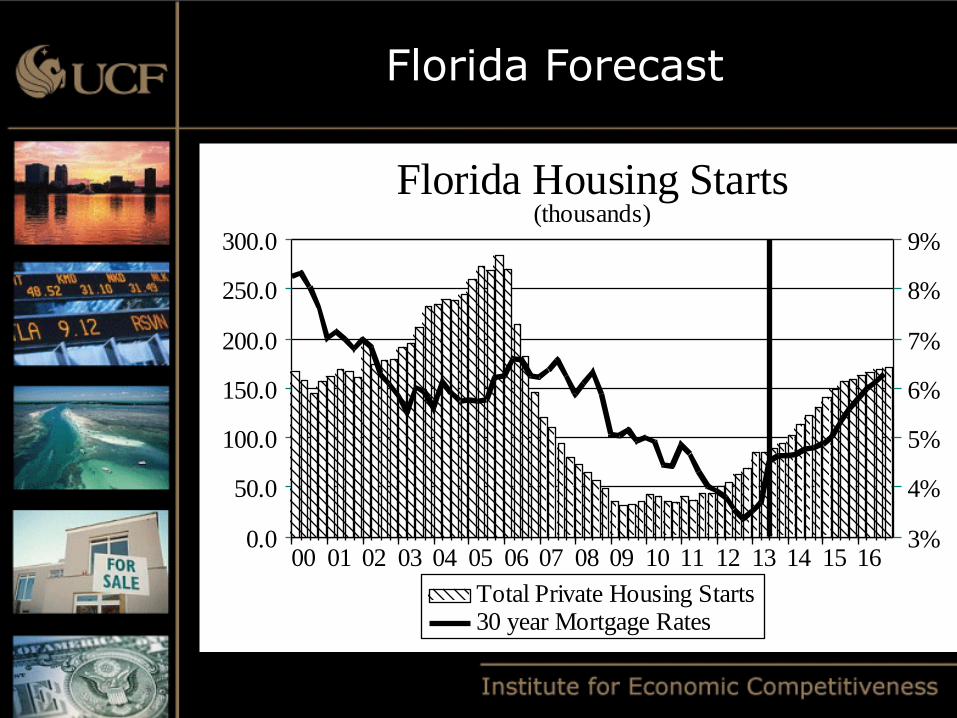
Florida Forecast
1615141312111009080706050403020100
300.0
250.0
200.0
150.0
100.0
50.0
0.0
9%
8%
7%
6%
5%
4%
3%
Florida Housing Starts(thousands)
Total Private Housing Starts30 year Mortgage Rates
Florida Housing Market
Investors are back in Florida residential real estate
Evidenced by high share of cash transactions Private equity & hedge funds
Is this a good thing or a bad thing?
Florida Housing Market
Housing Finance Unsustainably high share of cash transactions Mortgage availability has been restricted by
Dodd Frank Capital Standards Underwriting Standards Limited Private Securitization Demise of Mortgage Brokering Shell shock
Florida Forecast
In 2010 the economic recovery began
• Real GSP growth 0.3% that year
• In 2011 the economy limped further along
• .9% Real GSP growth
In 2012 we expect 2.4% growth
Job growth limped alongside the economy, but only starting late in 2010.
Florida Forecast
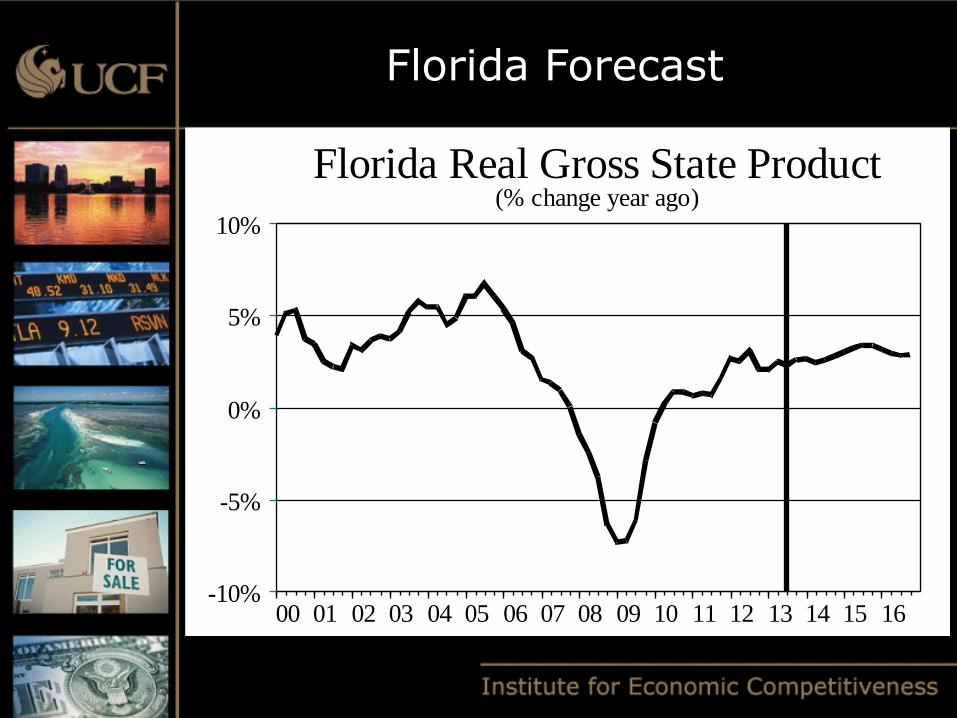
Economic growth doesn’t gain significant altitude until 2015
Real GSP growth: 2013 = 2.6% 2014 = 2.7% 2015 = 3.3%
Florida Forecast
1615141312111009080706050403020100
10%
5%
0%
-5%
-10%
Florida Real Gross State Product(% change year ago)
Florida Forecast
1615141312111009080706050403020100
14.0%
12.0%
10.0%
8.0%
6.0%
4.0%
2.0%
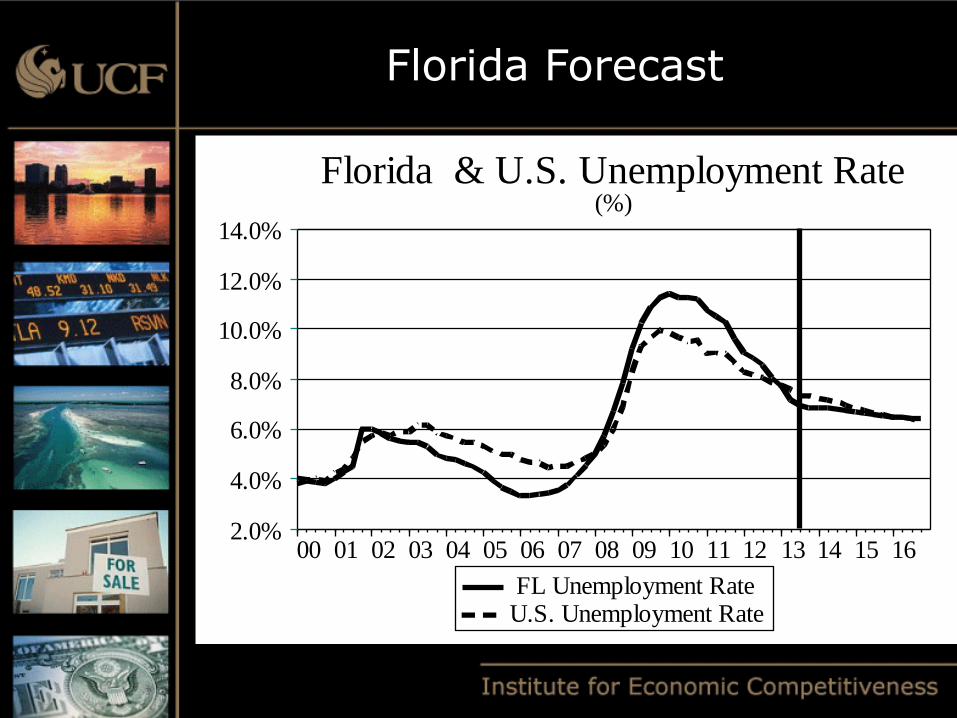
Florida & U.S. Unemployment Rate(%)
FL Unemployment RateU.S. Unemployment Rate
Florida Forecast
1615141312111009080706050403020100
8200.0
8000.0
7800.0
7600.0
7400.0
7200.0
7000.0
6800.0
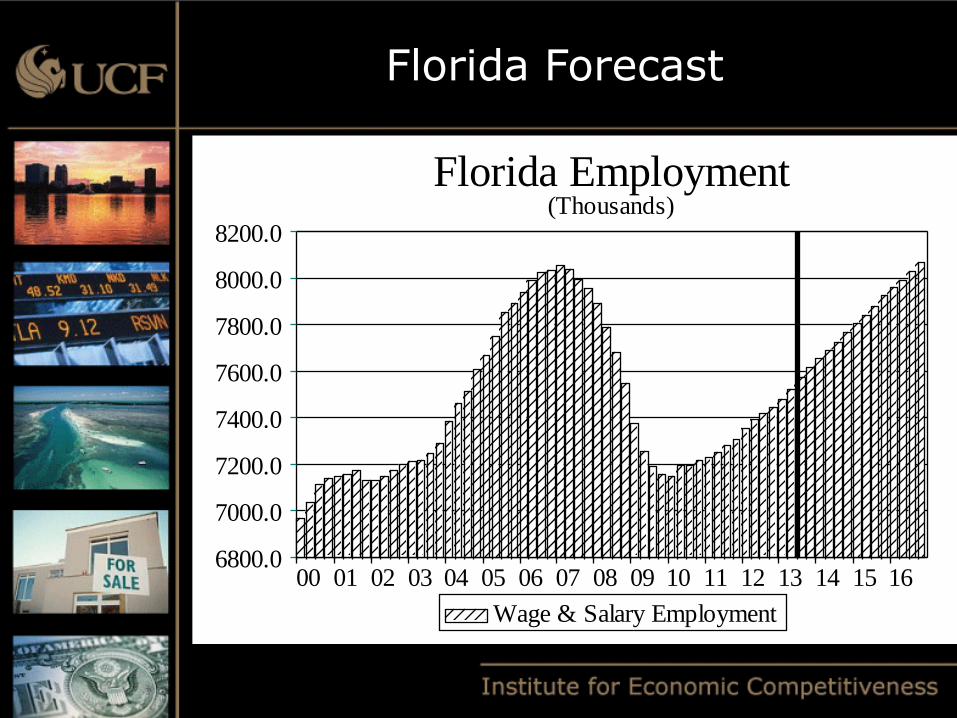
Florida Employment(Thousands)
Wage & Salary Employment
Florida Forecast
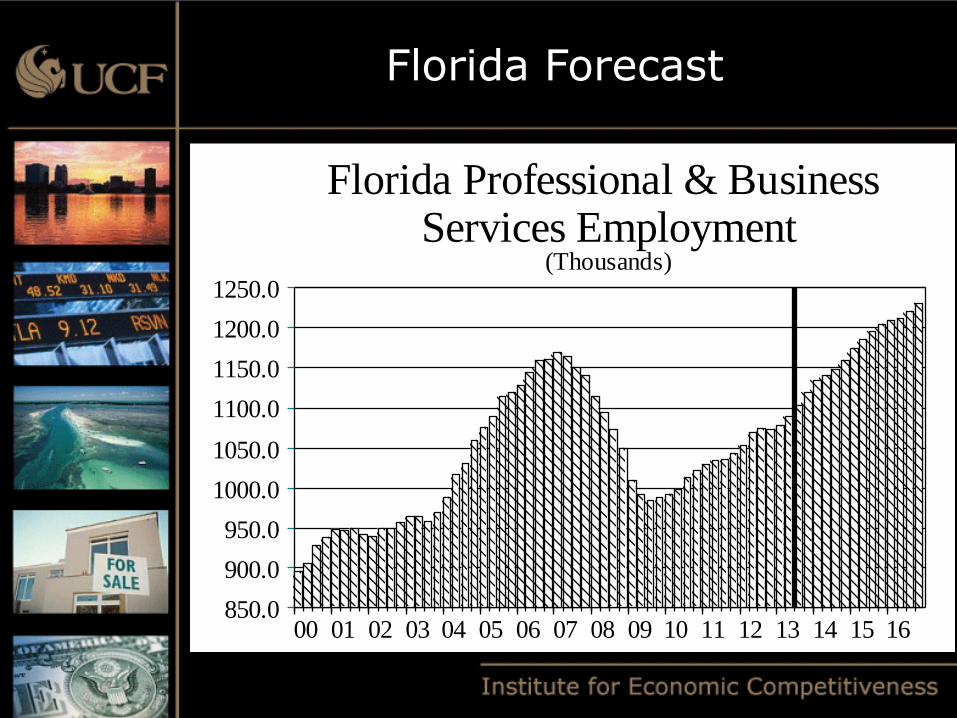
1615141312111009080706050403020100
1250.0
1200.0
1150.0
1100.0
1050.0
1000.0
950.0
900.0
850.0
Florida Professional & Business Services Employment
(Thousands)
Florida Forecast
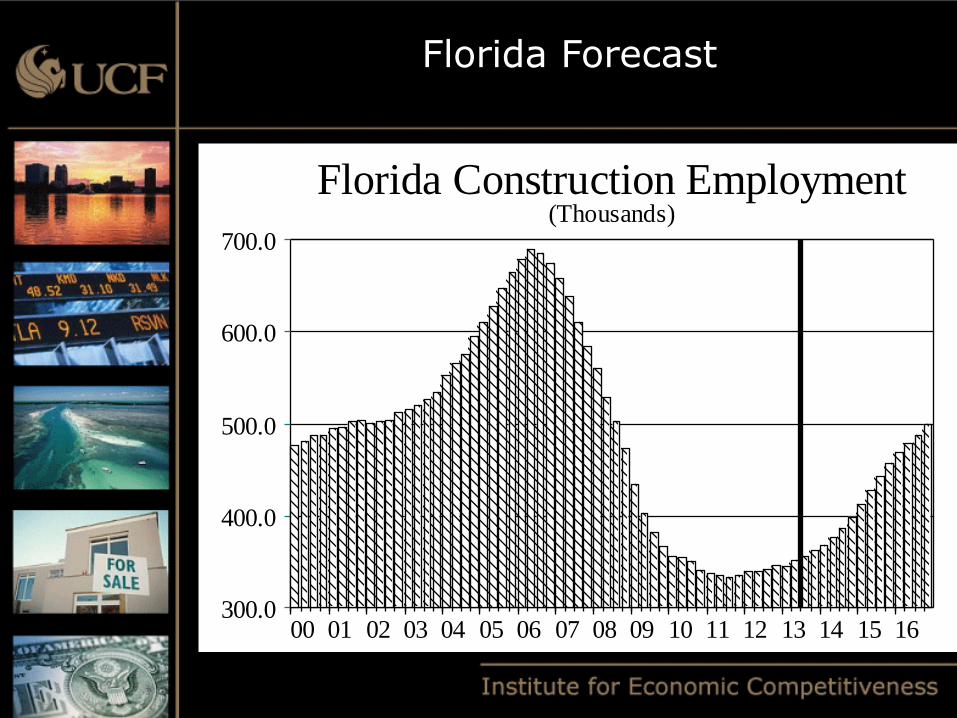
1615141312111009080706050403020100
700.0
600.0
500.0
400.0
300.0
Florida Construction Employment(Thousands)
Florida Forecast
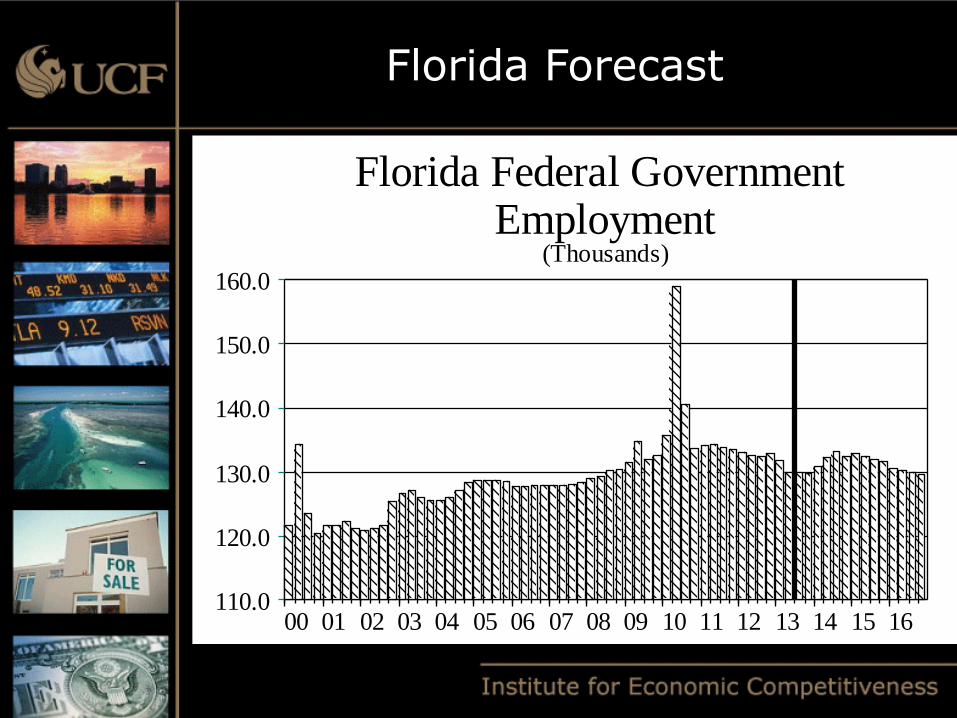
1615141312111009080706050403020100
160.0
150.0
140.0
130.0
120.0
110.0
Florida Federal Government Employment
(Thousands)
Florida Forecast
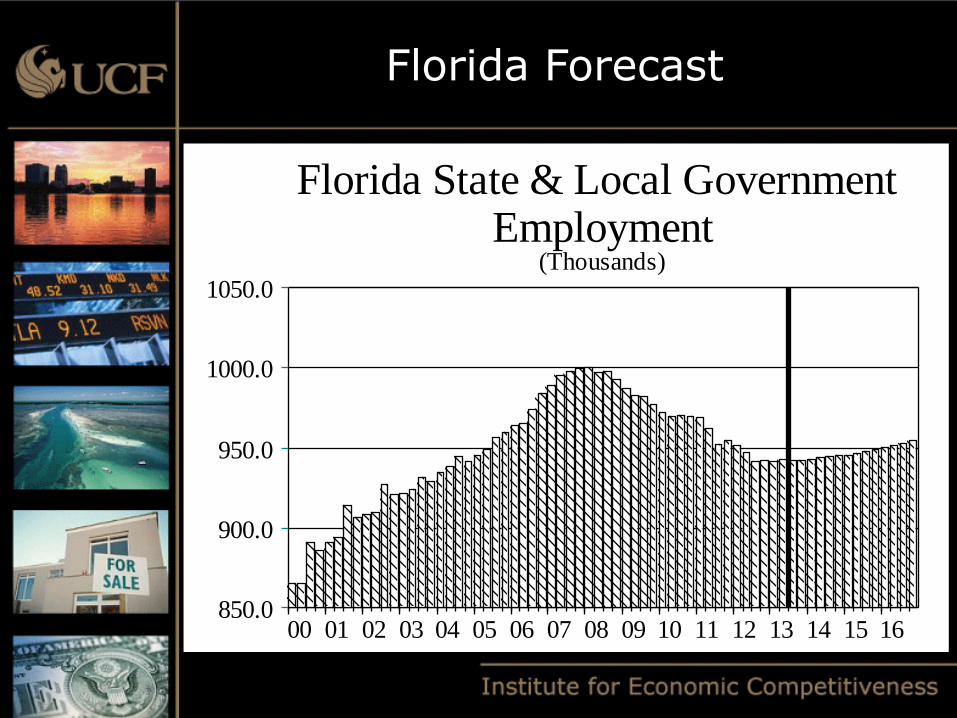
1615141312111009080706050403020100
1050.0
1000.0
950.0
900.0
850.0
Florida State & Local Government Employment
(Thousands)
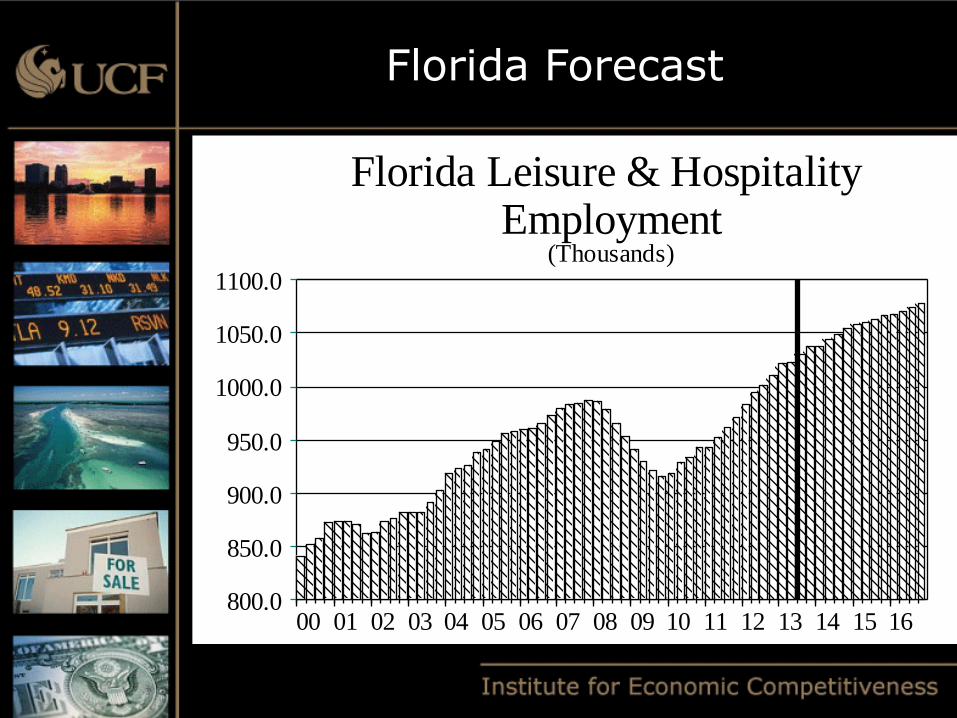
Florida Forecast
1615141312111009080706050403020100
1100.0
1050.0
1000.0
950.0
900.0
850.0
800.0
Florida Leisure & Hospitality Employment
(Thousands)
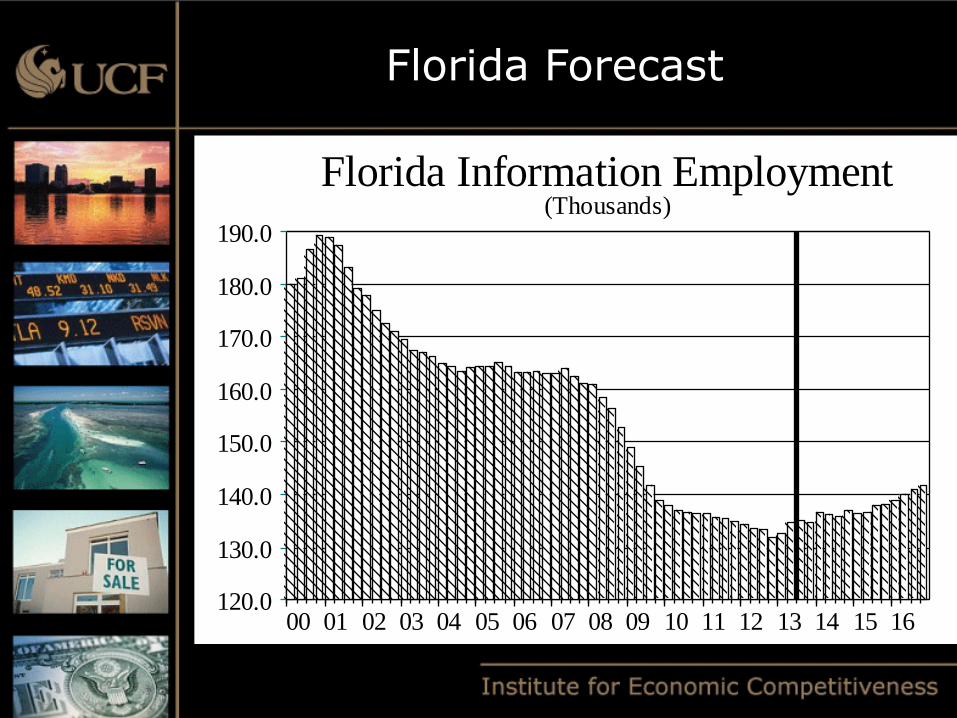
Florida Forecast
1615141312111009080706050403020100
190.0
180.0
170.0
160.0
150.0
140.0
130.0
120.0
Florida Information Employment(Thousands)
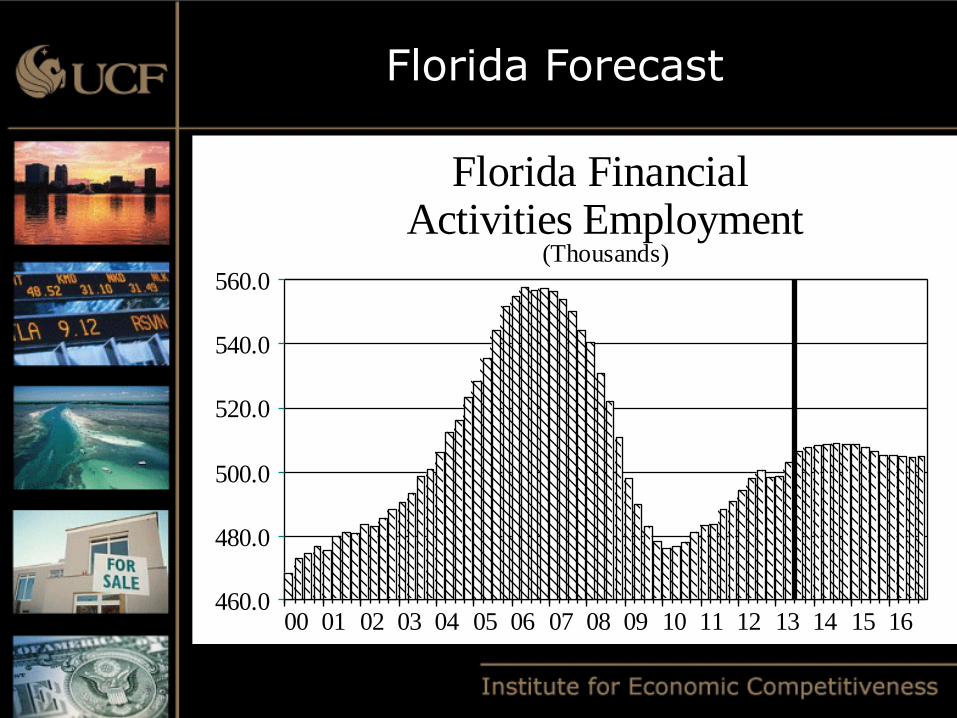
Florida Forecast
1615141312111009080706050403020100
560.0
540.0
520.0
500.0
480.0
460.0
Florida Financial Activities Employment
(Thousands)
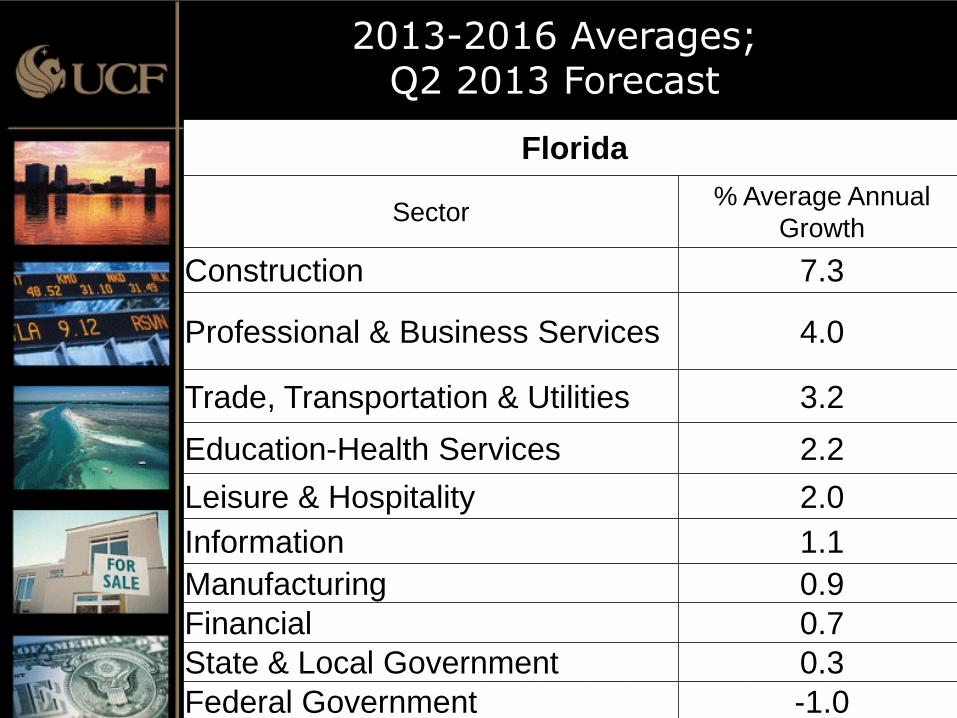
2013-2016 Averages; Q2 2013 Forecast
Florida
Sector % Average Annual
Growth
Construction 7.3
Professional & Business Services 4.0
Trade, Transportation & Utilities 3.2
Education-Health Services 2.2
Leisure & Hospitality 2.0
Information 1.1
Manufacturing 0.9
Financial 0.7
State & Local Government 0.3
Federal Government -1.0
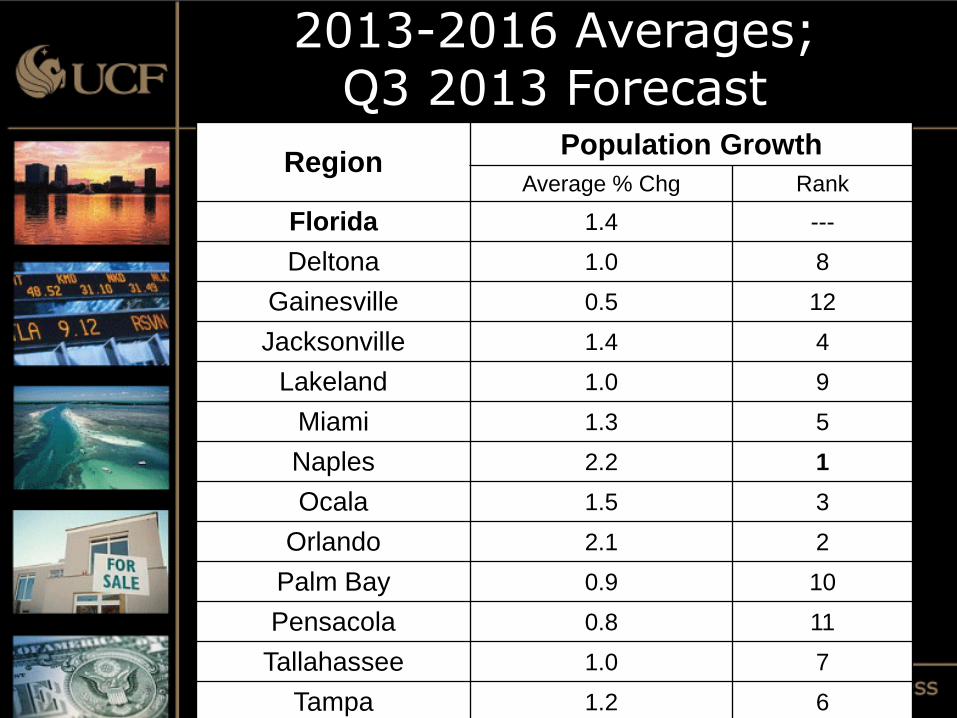
Region Population Growth
Average % Chg Rank
Florida 1.4 ---
Deltona 1.0 8
Gainesville 0.5 12
Jacksonville 1.4 4
Lakeland 1.0 9
Miami 1.3 5
Naples 2.2 1
Ocala 1.5 3
Orlando 2.1 2
Palm Bay 0.9 10
Pensacola 0.8 11
Tallahassee 1.0 7
Tampa 1.2 6
2013-2016 Averages; Q3 2013 Forecast
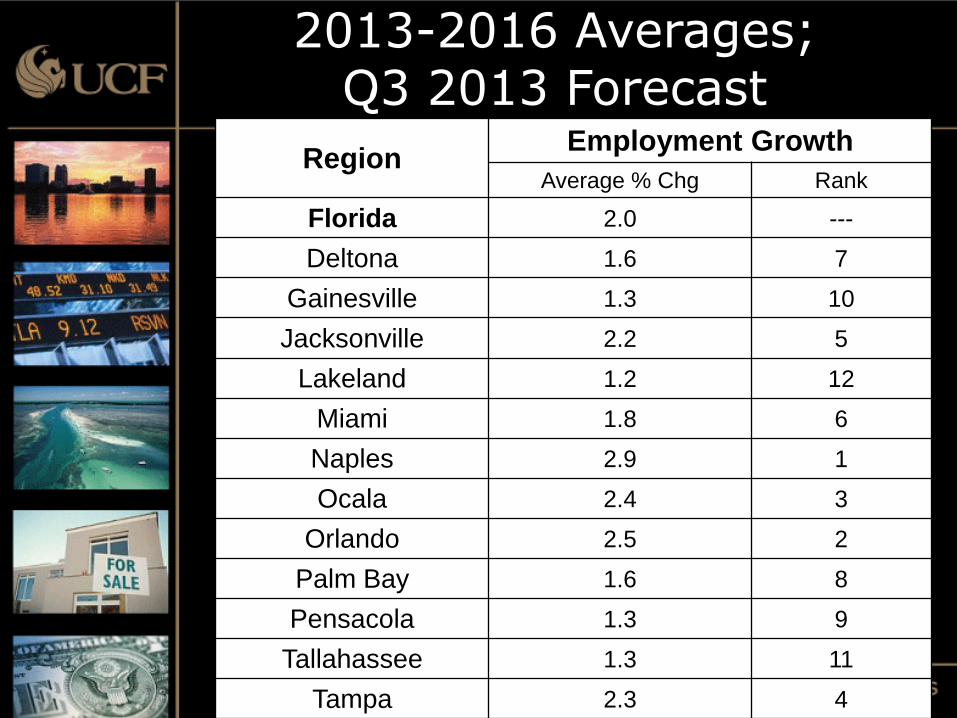
Region Employment Growth
Average % Chg Rank
Florida 2.0 ---
Deltona 1.6 7
Gainesville 1.3 10
Jacksonville 2.2 5
Lakeland 1.2 12
Miami 1.8 6
Naples 2.9 1
Ocala 2.4 3
Orlando 2.5 2
Palm Bay 1.6 8
Pensacola 1.3 9
Tallahassee 1.3 11
Tampa 2.3 4
2013-2016 Averages; Q3 2013 Forecast

Sean M. Snaith, Ph.D.
Director
Institute for Economic Competitiveness
(407) 823-1453
WWW.IEC.UCF.EDU
www.facebook.com/seansnaith
Twitter: @seansnaith
Thank you

Florida Realtors® 2014 Real Estate and Economic Summit
Doing Business in Florida’s Growing Markets
Sponsored by

Location And Consumer Behavior: Intersection For Economic Development
Grant Ian Thrall Ph.D. ,
Owner & Founder, Business Geography Advisors
Immediate Past President, American Real Estate Society
11/24/2013 6:54 AM
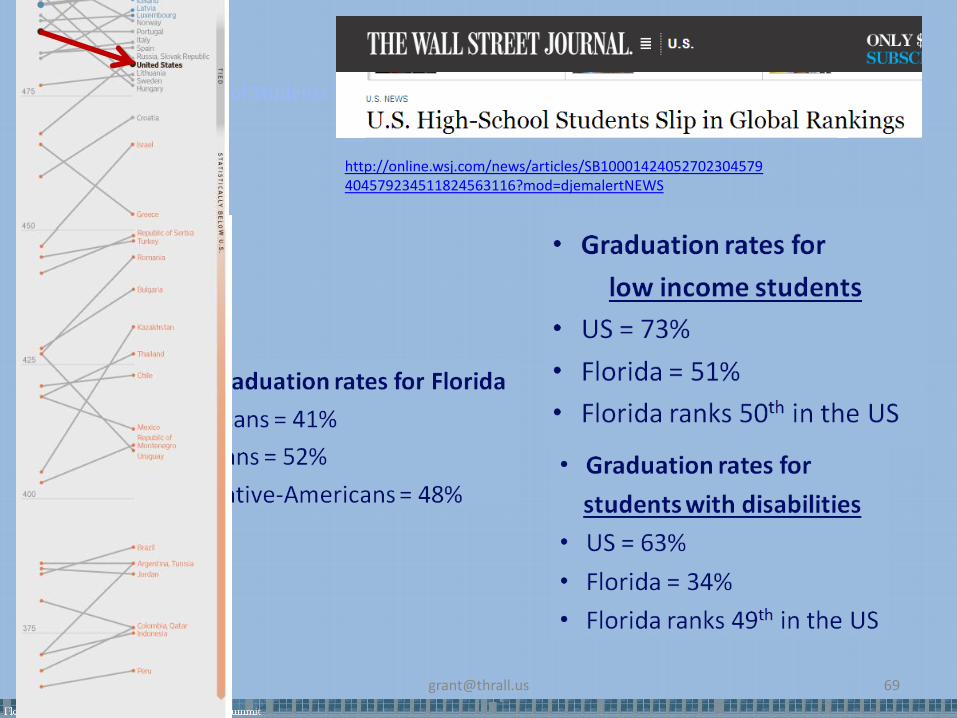
U.S. High-School Students Slip In Global Rankings
12/11/2013 [email protected] 69
http://online.wsj.com/news/articles/SB10001424052702304579404579234511824563116?mod=djemalertNEWS
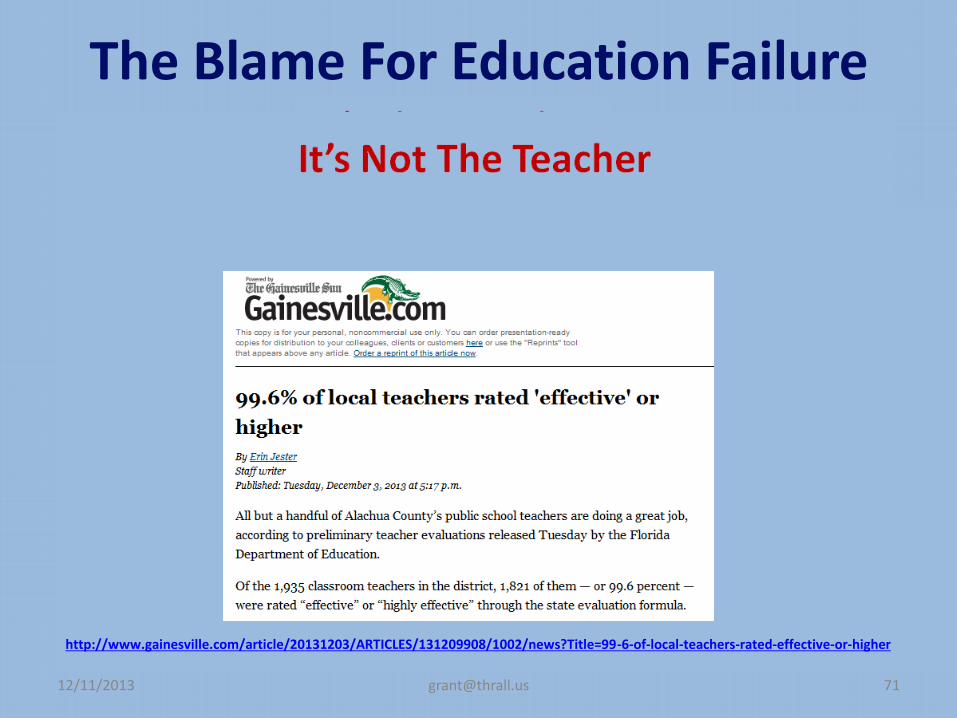
The Blame For Education Failure
12/11/2013 [email protected] 71
http://www.gainesville.com/article/20131203/ARTICLES/131209908/1002/news?Title=99-6-of-local-teachers-rated-effective-or-higher
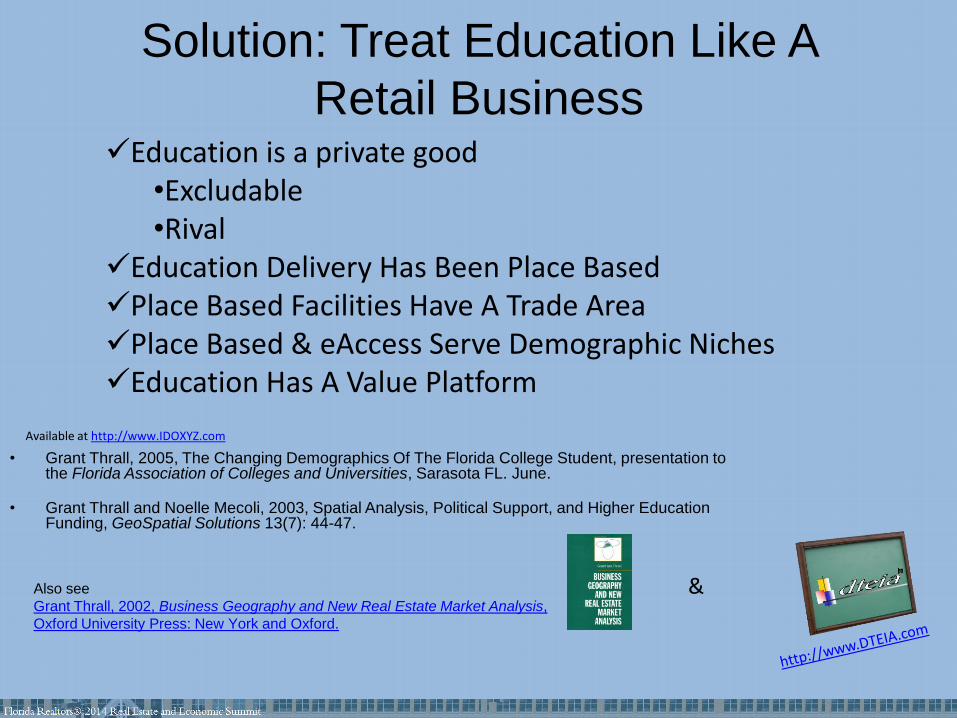
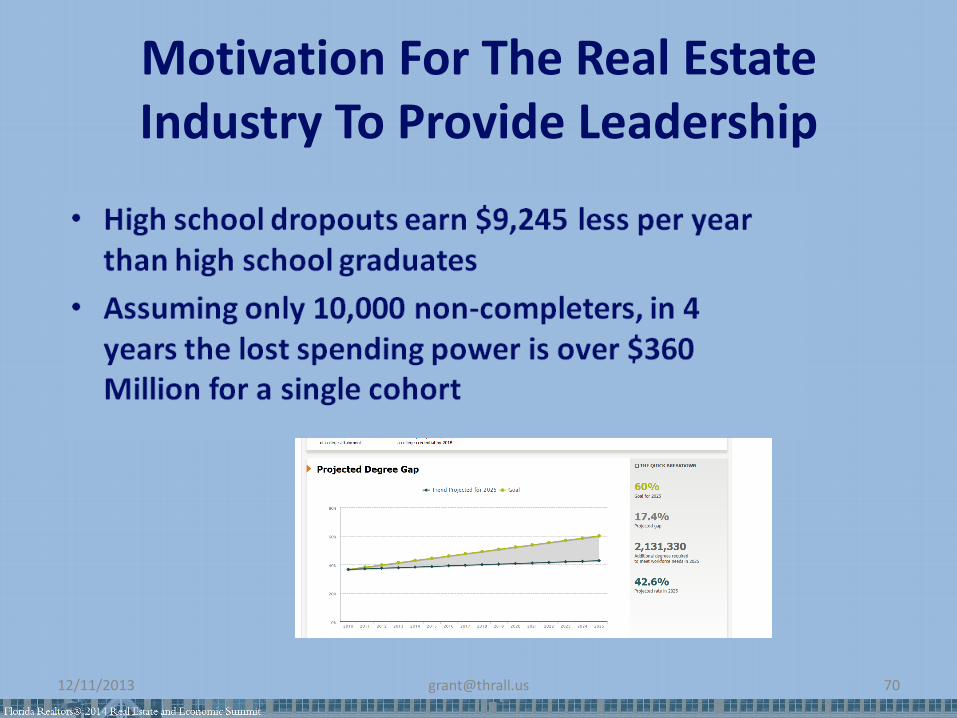
Solution: Treat Education Like A
Retail Business
• Grant Thrall, 2005, The Changing Demographics Of The Florida College Student, presentation to the Florida Association of Colleges and Universities, Sarasota FL. June.
• Grant Thrall and Noelle Mecoli, 2003, Spatial Analysis, Political Support, and Higher Education Funding, GeoSpatial Solutions 13(7): 44-47.
Available at http://www.IDOXYZ.com
Education is a private good •Excludable •Rival
Education Delivery Has Been Place Based Place Based Facilities Have A Trade Area Place Based & eAccess Serve Demographic Niches Education Has A Value Platform
Also see
Grant Thrall, 2002, Business Geography and New Real Estate Market Analysis,
Oxford University Press: New York and Oxford.
&

12/11/2013 [email protected] 73
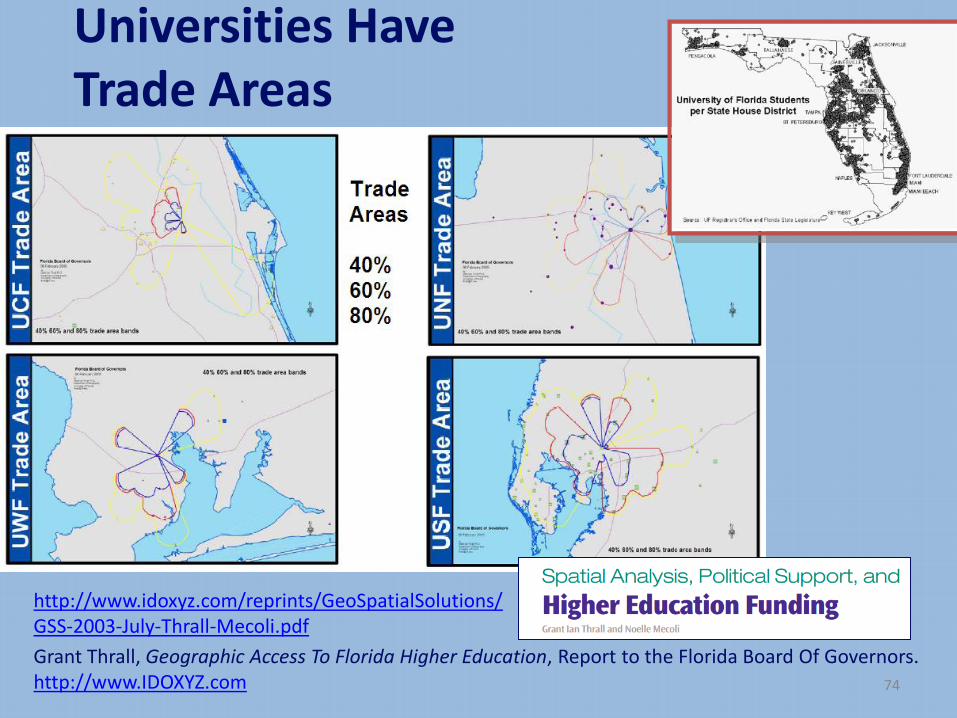
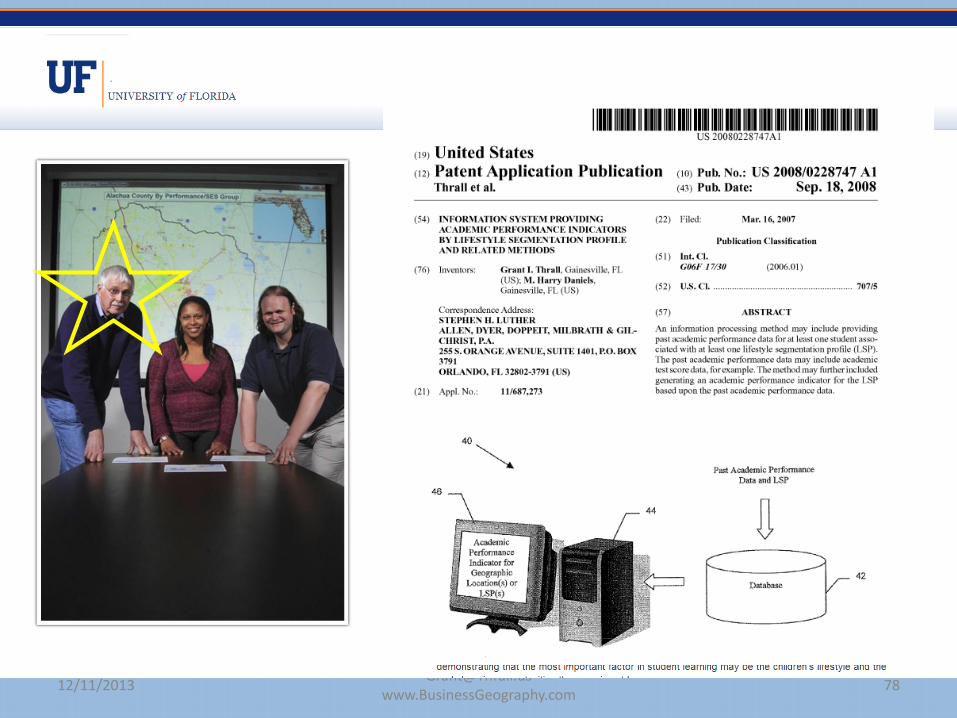
Universities Have Trade Areas
74
Grant Thrall, Geographic Access To Florida Higher Education, Report to the Florida Board Of Governors. http://www.IDOXYZ.com
http://www.idoxyz.com/reprints/GeoSpatialSolutions/GSS-2003-July-Thrall-Mecoli.pdf
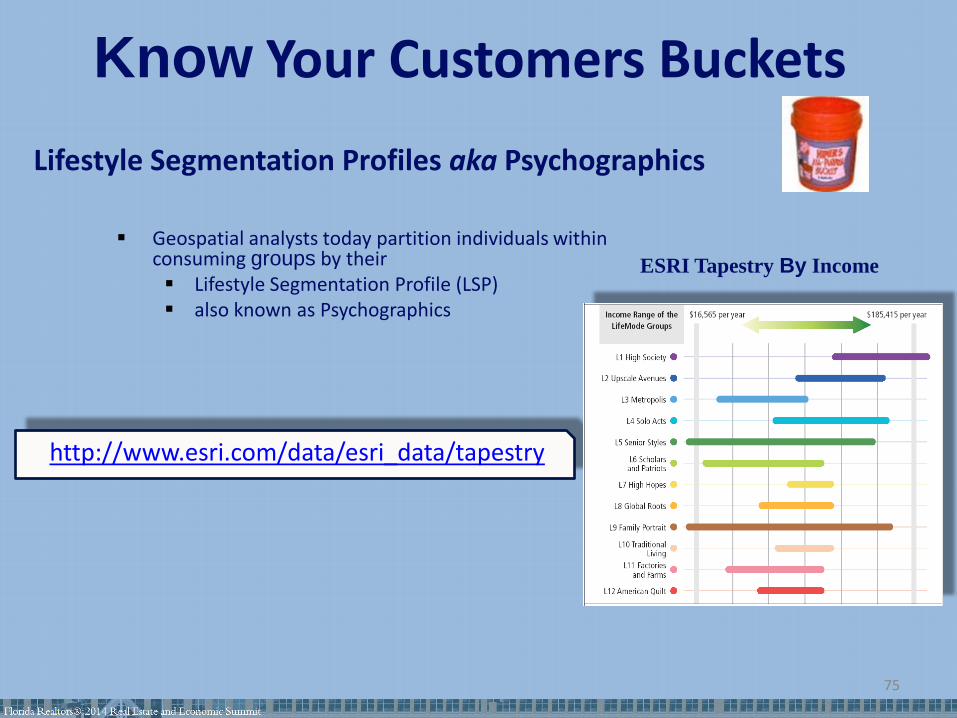
Know Your Customers Buckets
Lifestyle Segmentation Profiles aka Psychographics
75
ESRI Tapestry By Income
Geospatial analysts today partition individuals within
consuming groups by their Lifestyle Segmentation Profile (LSP) also known as Psychographics
http://www.esri.com/data/esri_data/tapestry
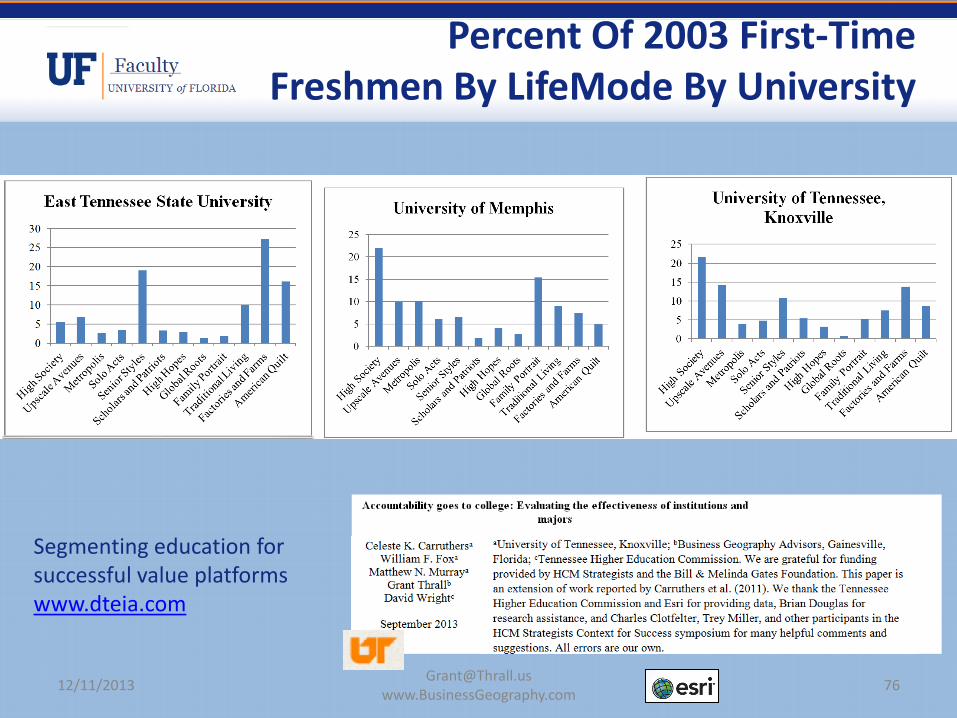
Percent Of 2003 First-Time Freshmen By LifeMode By University
12/11/2013 [email protected]
www.BusinessGeography.com 76
Segmenting education for successful value platforms www.dteia.com
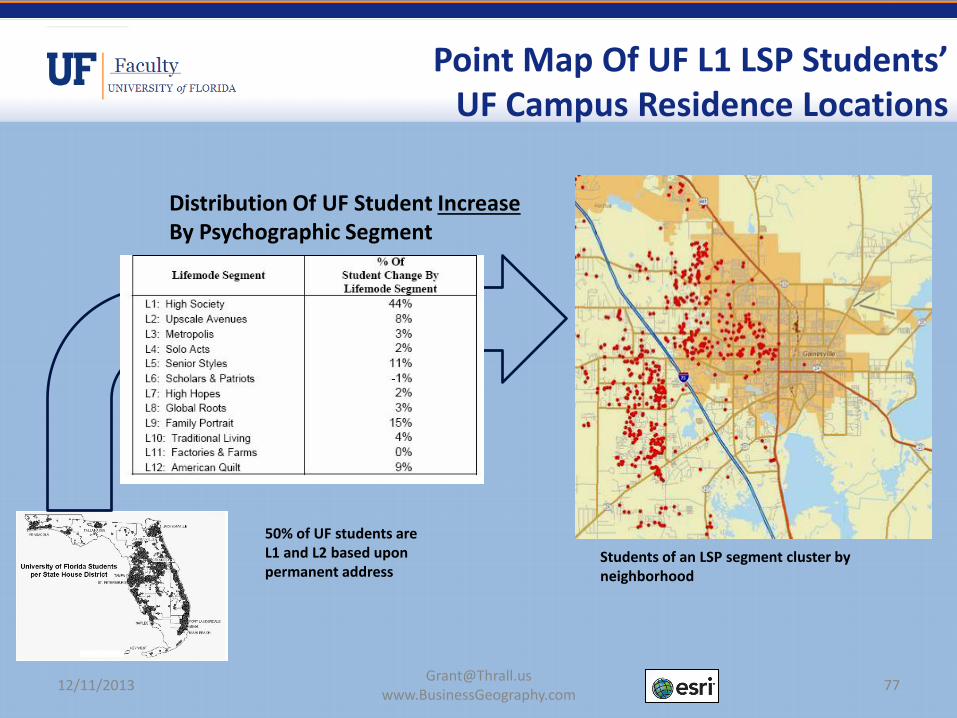
Point Map Of UF L1 LSP Students’ UF Campus Residence Locations
12/11/2013 [email protected]
www.BusinessGeography.com 77
Distribution Of UF Student Increase By Psychographic Segment
Students of an LSP segment cluster by neighborhood
50% of UF students are L1 and L2 based upon permanent address
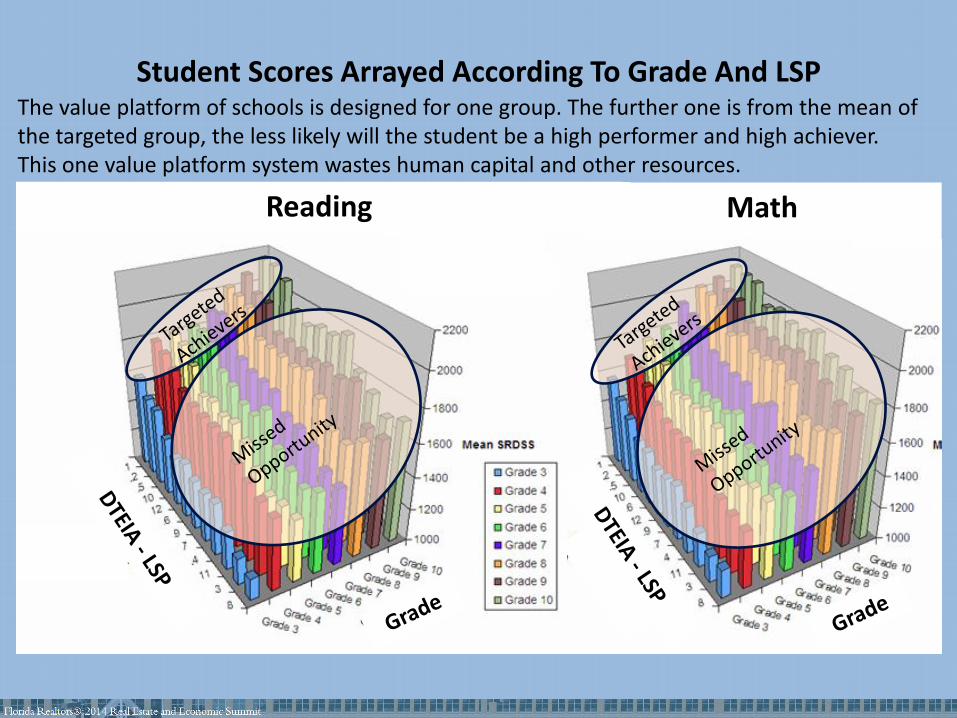
Student Scores Arrayed According To Grade And LSP
Reading Math
The value platform of schools is designed for one group. The further one is from the mean of the targeted group, the less likely will the student be a high performer and high achiever. This one value platform system wastes human capital and other resources.
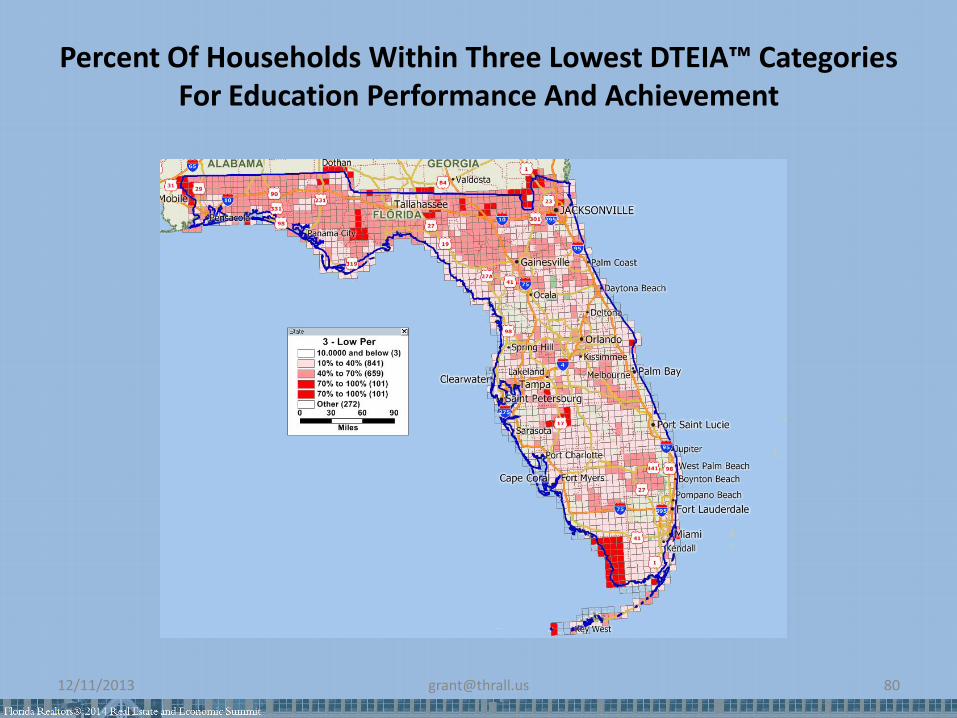
Percent Of Households Within Three Lowest DTEIA™ Categories For Education Performance And Achievement
12/11/2013 [email protected] 80
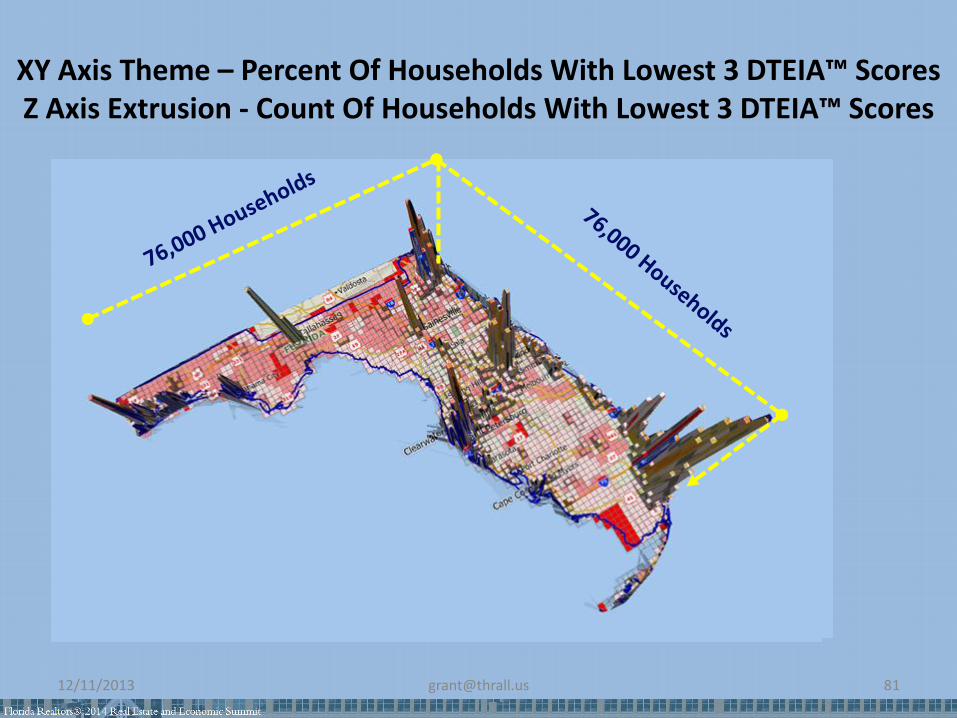
XY Axis Theme – Percent Of Households With Lowest 3 DTEIA™ Scores Z Axis Extrusion - Count Of Households With Lowest 3 DTEIA™ Scores
12/11/2013 [email protected] 81
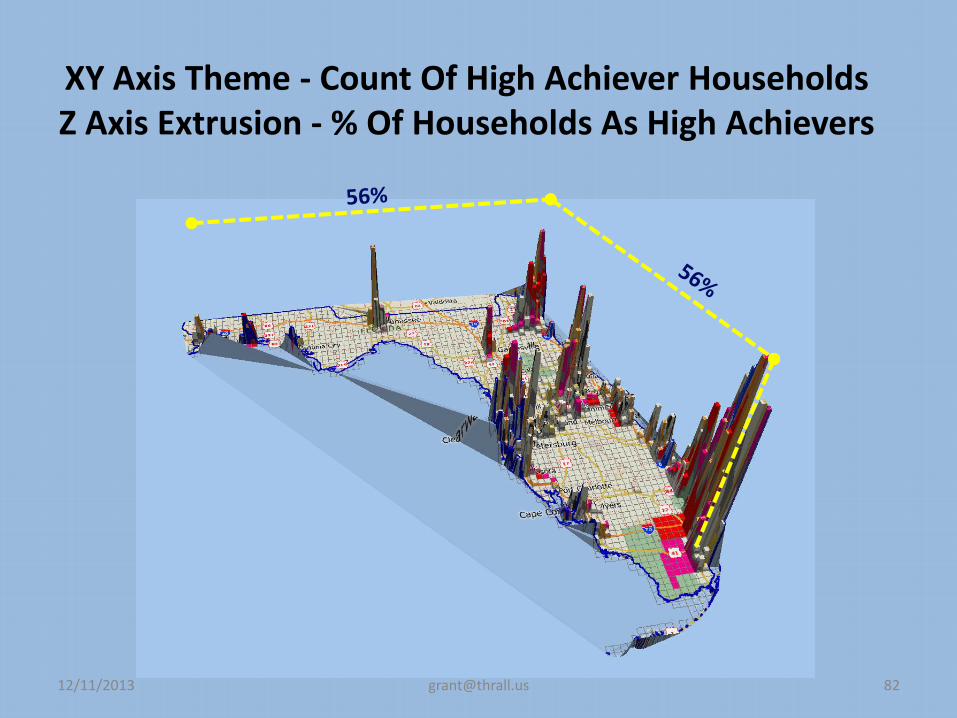
XY Axis Theme - Count Of High Achiever Households Z Axis Extrusion - % Of Households As High Achievers
12/11/2013 [email protected] 82
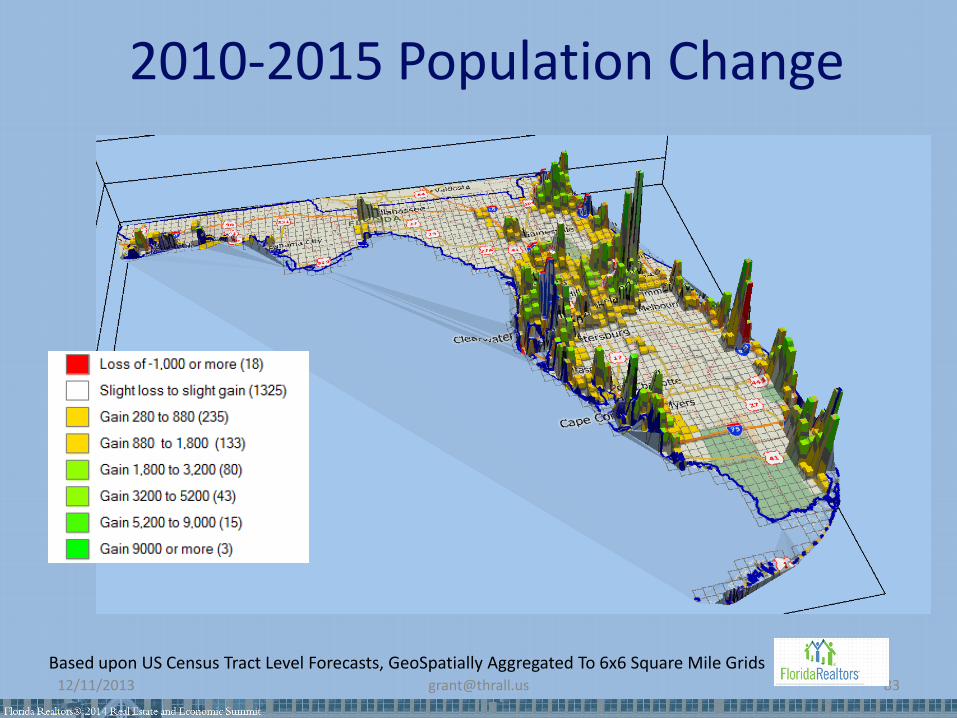
2010-2015 Population Change
12/11/2013 [email protected] 83
Based upon US Census Tract Level Forecasts, GeoSpatially Aggregated To 6x6 Square Mile Grids

Action For
• Treat education K-PhD as Retail
• Allow Florida to become innovators & entrepreneurial
12/11/2013 [email protected] 84
12/11/2013 [email protected] 85
Grant Ian Thrall Ph.D. American Real Estate Society, Immediate Past President Business Geography Advisors Manager Founder Owner 8703 SW 38th Ave., Gainesville, FL 32608 [email protected] t:352-331-0145 f:352-331-0166
| | |
Dr. Grant Ian Thrall served as elected President of the American Real Estate Society (2012-2013). ARES is a global association of real estate and land economics thought leaders. Members are university academics and high level influential practitioners. ARES is the world's largest and most prestigious publisher of real estate and land economics scholarly research. Thrall has served many of ARES' journals, including as co-editor for real estate information technology of Journal of Real Estate Literature, member of the editorial boards of Journal of Real Estate Research and Journal of Sustainable Real Estate. He has served fifteen years on the Board of Directors of the American Real Estate Society. He is on the academic board of the Appraisal Institute's Appraisal Journal. He is the only geographer to have served in these positions. Thrall has a Ph.D. in Geography and Economics, and an MA in Economics from The Ohio State University, and a BA in Business & Economics from California State University at Los Angeles. Grant Thrall has been one of the leading international contributors to the development of practice and scholarship of geospatial analysis for business - namely, "business geography" / "business location intelligence" particularly for the built environment. His book published by Oxford University Press, Business Geography and New Real Estate Market Analysis, is a synthesis of his pioneering scholarly contributions with foundations in his solid practitioner work of over a quarter century. The American Real Estate Society’s Journal of Real Estate Literature called his book “a paradigm shift” for real estate market analysis. The Wharton School of Business writes that Thrall’s book is “compelling” as it builds the bridge between urban economic and geographic sciences advancing real estate market analysis. George Mason University writes that Thrall’s book is one that every person in business needs to read. Dr. Thrall has written or edited over a dozen books, and over 150 professional articles. His ten volume Scientific Geography Series remains as the standard reference for academic scholarship and practitioner decisions on business location, and his book Land Use and Urban Form remains as the most comprehensive, while at the same time accessible, general theories of urban land use markets. Thrall is regularly quoted in the news media including an article on him in Florida Trend, and the Gainesville Sun Newspaper serving his adopted home of thirty years. Thrall receives the 2013 first annual "ARES/Marc-Louargand Award" for research written and presented by a practicing professional at the ARES Annual Meeting. Previously Thrall has been a recipient of the "ARES/Torto-Wheaton Prize for "Real Estate Market Analysis." He is recipient of the first Distinguished Scholar Award in Business Geography from the Association of American Geographers; the highest academic accolade in his geospatial field. He is elected founding Chair of the Business Geography Specialty Group of the Association of American Geographers. Dr. Thrall is Managing Director and Owner of www.BusinessGeography.com through which he has executed real estate market analysis for over $1B in sustainable infill development and redevelopment. He has been admitted as an expert in Federal and State Courts in the fields of real estate market analysis opining on location value, and Geographic Information Systems (GIS) technology opining on patents. Thrall has been an expert in over $100M in litigation. Dr. Thrall is co-founder of Direct Target Education Instruction Assessment - www.DTEIA.com. Thrall has two patents pending related to target education: 20080228747 Information System Providing Academic

12/11/2013 [email protected] 86
Performance Indicators By Lifestyle Segmentation Profile And Related Methods; and 20080227077 Geographic Information System Providing Academic Performance Indicators And Related Methods. Previously, Thrall was co-founder of the nation's leading supplier of Internet backbone GIS ready fiber-optic pathway digital maps. Thrall has been a consultant with real estate advisory firms including PriceWaterhouseCoopers LLP, and Alvarez & Marsal LLC. In Gainesville Florida he has executed market analysis for many infill developments - Butler Plaza the largest power center in the US southeast - The Continuum - University Corners - O2BKids. He has published advisory research reports for Centers for Disease Control and Prevention, FannieMae, the Appraisal Institute, the Bill and Melinda Gates Foundation, Post Secondary Analytics, and the State University System of Florida Board of Governors for which he was primary author of Geographic Access Analysis of the State University System of Florida; Thrall's analysis contributed to the elevation of most of Florida's two-year community colleges to four-year state college status, including Santa Fe College in Gainesville FL. Dr. Grant Thrall was invited keynote speaker at the September 2013 International Council of Shopping Centers 2013 Research Conference in Philadelphia, and invited keynote speaker at the November 2013 Forum On Property Valuation In China, hosted by Xiamen University. Thrall was invited by Dr. Lawrence Yun to be a presenter on his panel at the November 10, 2012, National Association of Realtors® Conference and Expo in Orlando Florida (introduction, keynote address). He has been invited to give keynote addresses to University of Pennsylvania’s Wharton School of Business and Cal Berkeley’s Haas School of Business, the annual “Golledge Geography Lecture” at UC Santa Barbara, the annual “Burns Real Estate Lecture” in the Daniels College of Business at University of Denver, the Business College at University of Tulsa, Florida Association of Colleges and Universities, National Association of Real Estate Investment Managers, Senior Management of Publix Grocery, International Council Of Shopping Centers (North Florida); and invited plenary presentations to the Association of American Geographers, and the American Real Estate Society. He organized the Memphis Conference On Sustainable Real Estate. Dr. Thrall has been on the faculty, and held the ranks and titles ranging from Assistant through Full Professor, Distinguished Professor, and Endowed Chair of Excellence at universities including McMaster University in Canada, State University of New York at Buffalo, University of Memphis, San Diego State University, and University of Florida. He has held faculty appointments in Geography, Economics, Finance, and Real Estate; his faculty appointments have been in colleges of science, business, liberal arts, and social science. He presently holds positions as Fellow of the Homer Hoyt Institute in Palm Beach Florida; Fellow, David F. Miller (JC Penny) Center for Retailing Education & Research, Warrington College of Business Administration University of Florida. He holds faculty appointments as Visiting Professor at: Newman Department of Real Estate in the Zicklin School of Business of the Baruch College of Business City University of New York; REALTOR® University (Chicago); and Homburg University (Switzerland and Canada). He is a member of the leadership and review board of REALTOR® University, and the academic advisory board of the International Council of Shopping Centers. Dr. Thrall has chaired over 25 graduate student committees at MA and Ph.D. levels.
Dr. Thrall's most recent publications include "Review of Maptitude GIS For Real Estate Market Analysis"
GeoInformatics, 2013 issue 3. And his recent co-authored publications include "Location Efficiency and Mortgage
Default", Journal of Sustainable Real Estate which was cited in The Economist, NRDC, New Geography and HUD;
"Foreclosure Contagion and REO versus non-REO Sales," Winter 2012, International Real Estate Review. "A
General Model of Mortgage Failure Tipping Point with an Example from Southern California 2006-2007",
International Journal of Housing Markets and Analysis. 2013; 6(4):438-454.
Grant Thrall resides in Gainesville Florida where he has volunteered his expertise, advice and management of redevelopment of historic downtown Gainesville, a Tax Increment Community Redevelopment District. In appreciation, the Mayor and Gainesville City Commission declared two days as "Grant Thrall Days".

Florida Realtors® 2014 Real Estate and Economic Summit
Doing Business in Florida’s Growing Markets
Sponsored by

Dr. John Tuccillo

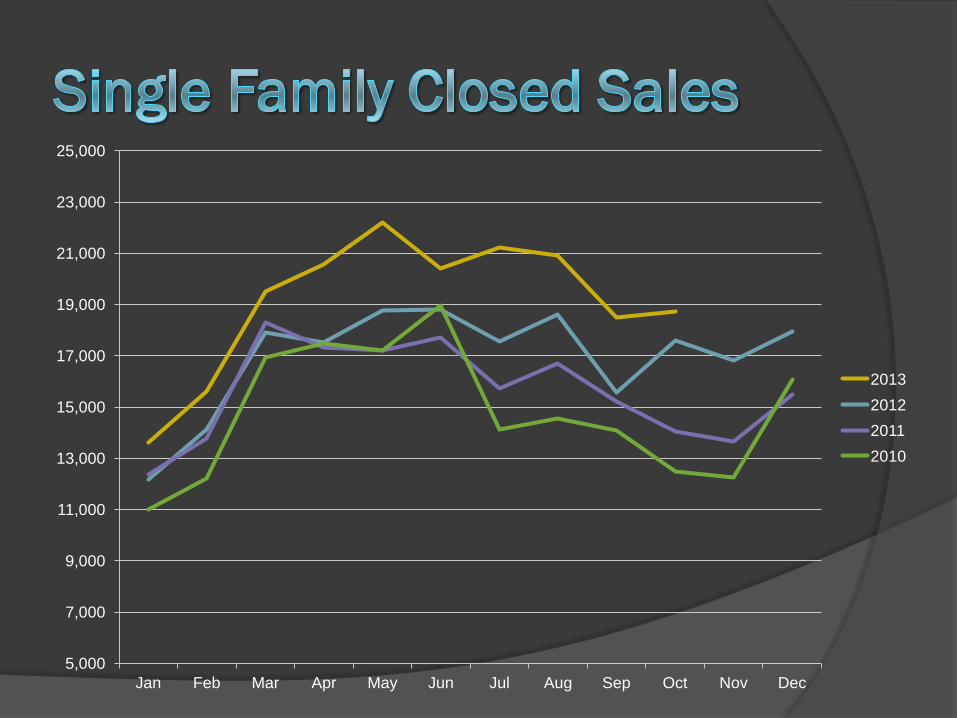
5,000
7,000
9,000
11,000
13,000
15,000
17,000
19,000
21,000
23,000
25,000
Jan Feb Mar Apr May Jun Jul Aug Sep Oct Nov Dec
2013
2012
2011
2010
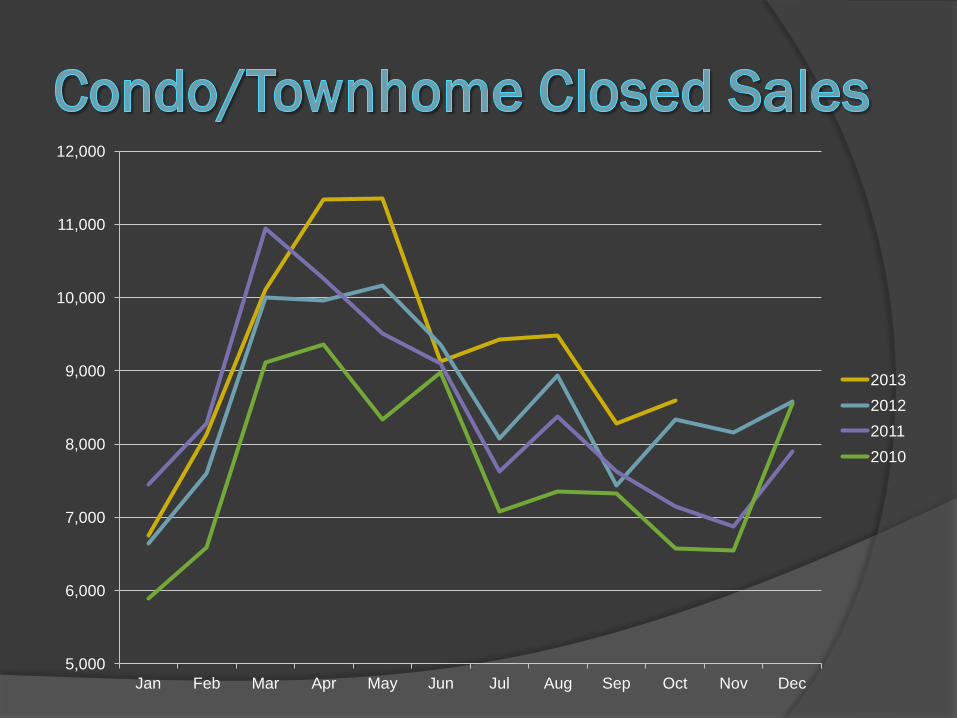
5,000
6,000
7,000
8,000
9,000
10,000
11,000
12,000
Jan Feb Mar Apr May Jun Jul Aug Sep Oct Nov Dec
2013
2012
2011
2010

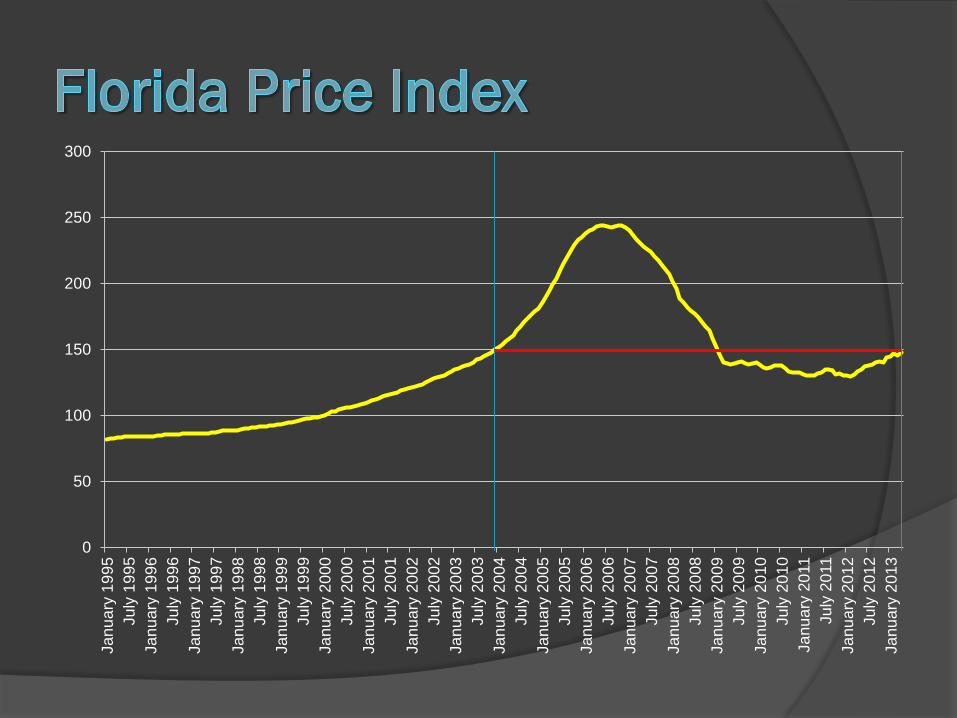
0
50
100
150
200
250
300
Ja
nu
ary
19
95
Ju
ly 1
99
5
Ja
nu
ary
19
96
Ju
ly 1
99
6
Ja
nu
ary
19
97
Ju
ly 1
99
7
Ja
nu
ary
19
98
Ju
ly 1
99
8
Ja
nu
ary
19
99
Ju
ly 1
99
9
Ja
nu
ary
20
00
Ju
ly 2
00
0
Ja
nu
ary
20
01
Ju
ly 2
00
1
Ja
nu
ary
20
02
Ju
ly 2
00
2
Ja
nu
ary
20
03
Ju
ly 2
00
3
Ja
nu
ary
20
04
Ju
ly 2
00
4
Ja
nu
ary
20
05
Ju
ly 2
00
5
Ja
nu
ary
20
06
Ju
ly 2
00
6
Ja
nu
ary
20
07
Ju
ly 2
00
7
Ja
nu
ary
20
08
Ju
ly 2
00
8
Ja
nu
ary
20
09
Ju
ly 2
00
9
Ja
nu
ary
20
10
Ju
ly 2
01
0
Ja
nu
ary
20
11
Ju
ly 2
011
Ja
nu
ary
20
12
Ju
ly 2
01
2
Ja
nu
ary
20
13


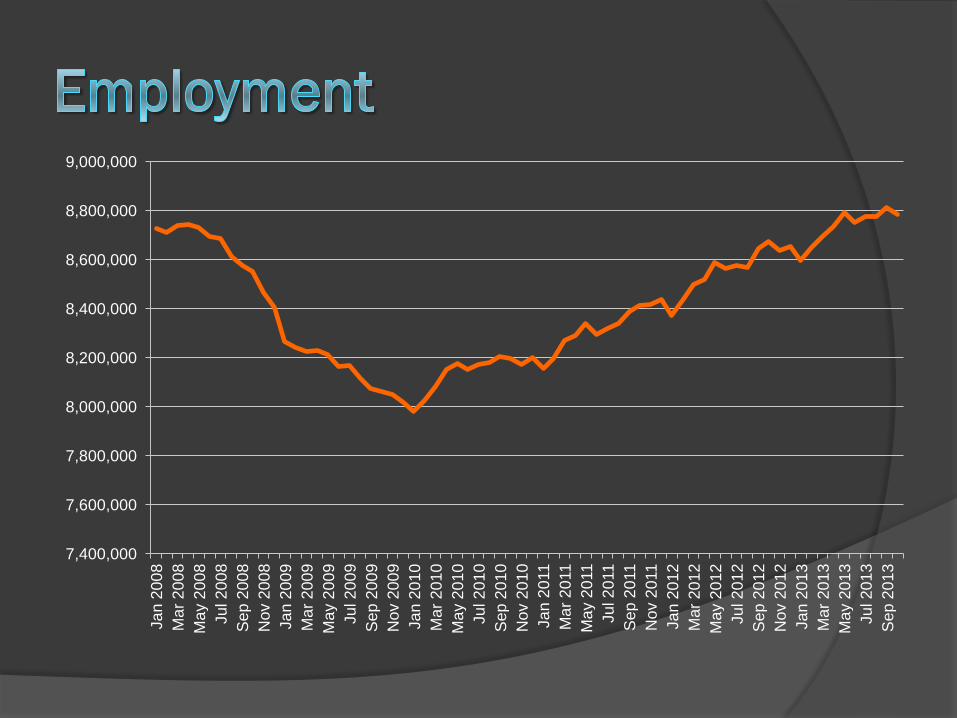
7,400,000
7,600,000
7,800,000
8,000,000
8,200,000
8,400,000
8,600,000
8,800,000
9,000,000 Ja
n 2
00
8
Ma
r 2
00
8
Ma
y 2
00
8
Ju
l 2
00
8
Se
p 2
00
8
Nov 2
00
8
Ja
n 2
00
9
Ma
r 2
00
9
Ma
y 2
00
9
Ju
l 2
00
9
Se
p 2
00
9
Nov 2
00
9
Ja
n 2
01
0
Ma
r 2
01
0
Ma
y 2
01
0
Ju
l 2
01
0
Se
p 2
01
0
No
v 2
01
0
Ja
n 2
011
Ma
r 2
011
Ma
y 2
011
Ju
l 2
011
Se
p 2
011
Nov 2
011
Ja
n 2
01
2
Ma
r 2
01
2
Ma
y 2
01
2
Ju
l 2
01
2
Se
p 2
01
2
Nov 2
01
2
Ja
n 2
01
3
Ma
r 2
01
3
Ma
y 2
01
3
Ju
l 2
01
3
Se
p 2
01
3


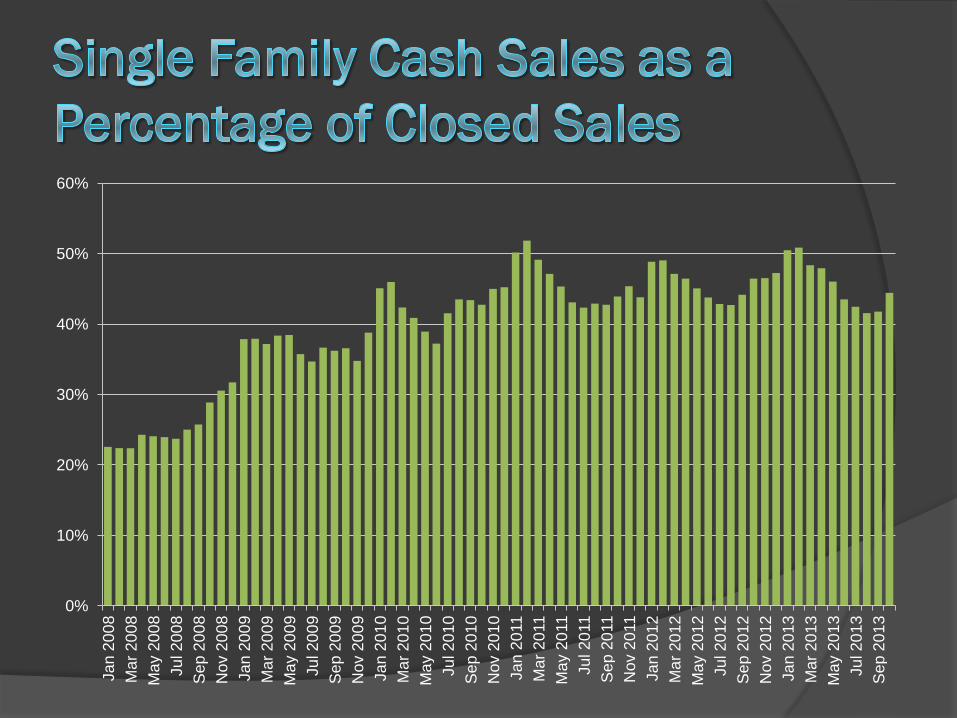
0%
10%
20%
30%
40%
50%
60%
Ja
n 2
00
8
Ma
r 2
00
8
Ma
y 2
00
8
Ju
l 2
00
8
Se
p 2
00
8
No
v 2
00
8
Ja
n 2
00
9
Ma
r 2
00
9
Ma
y 2
00
9
Ju
l 2
00
9
Se
p 2
00
9
No
v 2
00
9
Ja
n 2
01
0
Ma
r 2
01
0
Ma
y 2
01
0
Ju
l 2
01
0
Se
p 2
01
0
No
v 2
01
0
Ja
n 2
011
Ma
r 2
011
Ma
y 2
011
Ju
l 2
011
Se
p 2
011
No
v 2
011
Ja
n 2
01
2
Ma
r 2
01
2
Ma
y 2
01
2
Ju
l 2
01
2
Se
p 2
01
2
No
v 2
01
2
Ja
n 2
01
3
Ma
r 2
01
3
Ma
y 2
01
3
Ju
l 2
01
3
Se
p 2
01
3
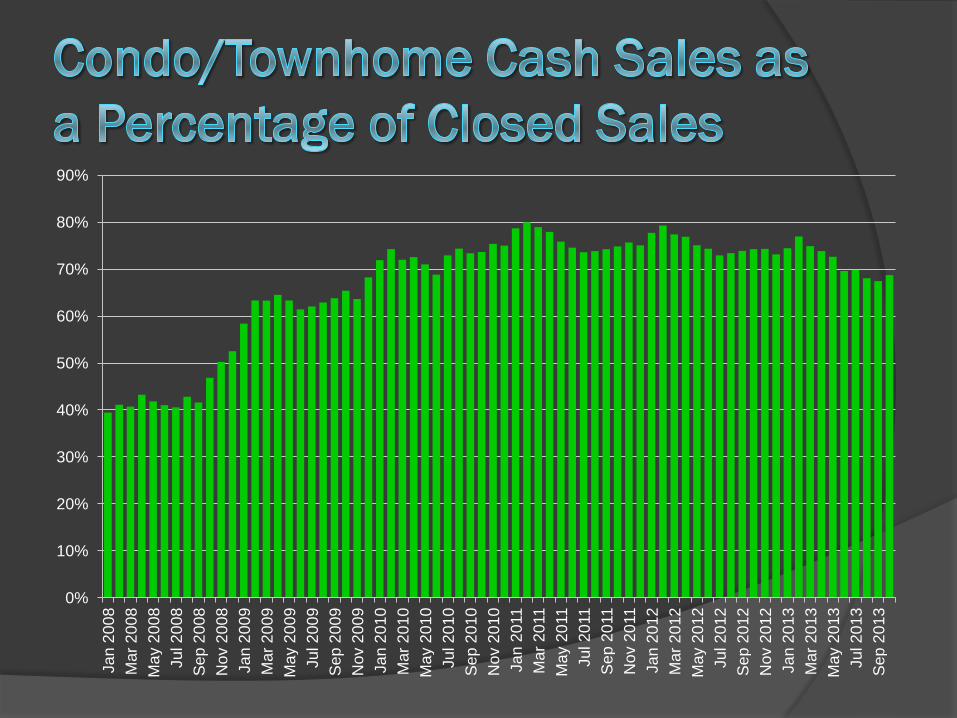
0%
10%
20%
30%
40%
50%
60%
70%
80%
90%
Ja
n 2
00
8
Ma
r 2
00
8
Ma
y 2
00
8
Ju
l 2
00
8
Se
p 2
00
8
No
v 2
00
8
Ja
n 2
00
9
Ma
r 2
00
9
Ma
y 2
00
9
Ju
l 2
00
9
Se
p 2
00
9
No
v 2
00
9
Ja
n 2
01
0
Ma
r 2
01
0
Ma
y 2
01
0
Ju
l 2
01
0
Se
p 2
01
0
No
v 2
01
0
Ja
n 2
011
Ma
r 2
011
Ma
y 2
011
Ju
l 2
011
Se
p 2
011
No
v 2
011
Ja
n 2
01
2
Ma
r 2
01
2
Ma
y 2
01
2
Ju
l 2
01
2
Se
p 2
01
2
No
v 2
01
2
Ja
n 2
01
3
Ma
r 2
01
3
Ma
y 2
01
3
Ju
l 2
01
3
Se
p 2
01
3

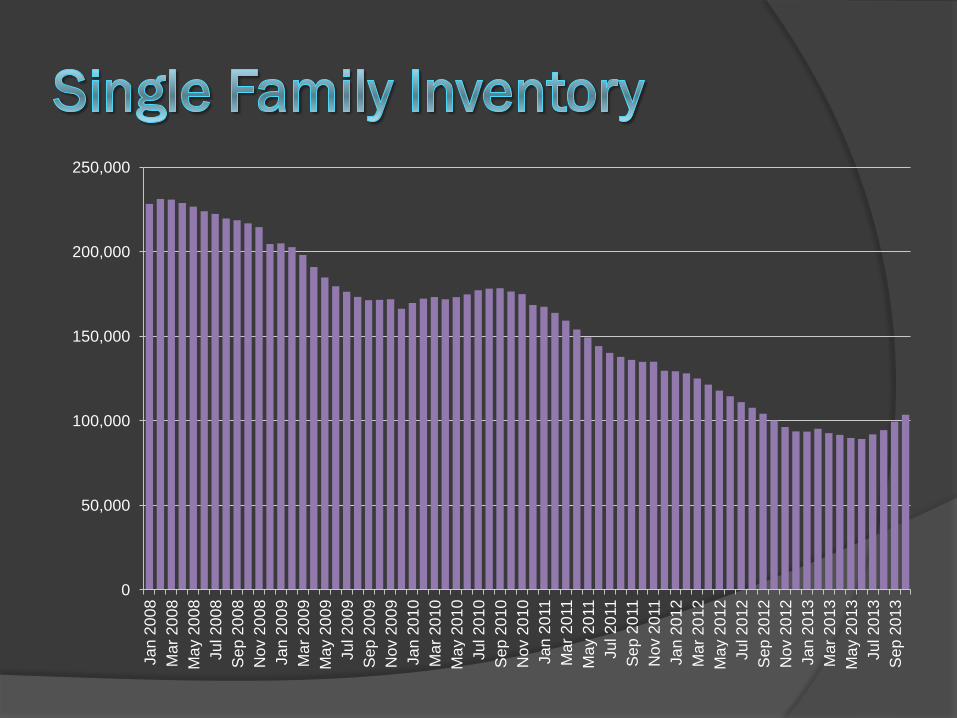
0
50,000
100,000
150,000
200,000
250,000 Ja
n 2
00
8
Ma
r 2
00
8
Ma
y 2
00
8
Ju
l 2
00
8
Se
p 2
00
8
No
v 2
00
8
Ja
n 2
00
9
Ma
r 2
00
9
Ma
y 2
00
9
Ju
l 2
00
9
Se
p 2
00
9
No
v 2
00
9
Ja
n 2
01
0
Ma
r 2
01
0
Ma
y 2
01
0
Ju
l 2
01
0
Se
p 2
01
0
No
v 2
01
0
Ja
n 2
011
Ma
r 2
011
Ma
y 2
011
Ju
l 2
011
Se
p 2
011
No
v 2
011
Ja
n 2
01
2
Ma
r 2
01
2
Ma
y 2
01
2
Ju
l 2
01
2
Se
p 2
01
2
No
v 2
01
2
Ja
n 2
01
3
Ma
r 2
01
3
Ma
y 2
01
3
Ju
l 2
01
3
Se
p 2
01
3
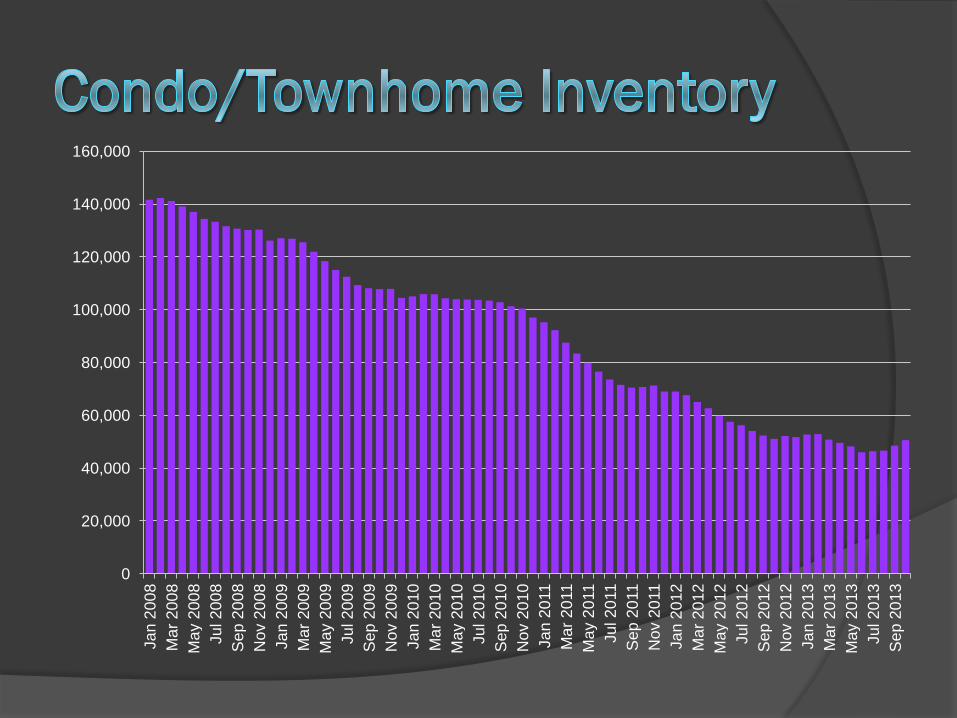
0
20,000
40,000
60,000
80,000
100,000
120,000
140,000
160,000 Ja
n 2
00
8
Ma
r 2
00
8
Ma
y 2
00
8
Ju
l 2
00
8
Se
p 2
00
8
Nov 2
00
8
Ja
n 2
00
9
Ma
r 2
00
9
Ma
y 2
00
9
Ju
l 2
00
9
Se
p 2
00
9
Nov 2
00
9
Ja
n 2
01
0
Ma
r 2
01
0
Ma
y 2
01
0
Ju
l 2
01
0
Se
p 2
01
0
Nov 2
01
0
Ja
n 2
011
Ma
r 2
011
Ma
y 2
011
Ju
l 2
011
Se
p 2
011
Nov 2
011
Ja
n 2
01
2
Ma
r 2
01
2
Ma
y 2
01
2
Ju
l 2
01
2
Se
p 2
01
2
Nov 2
01
2
Ja
n 2
01
3
Ma
r 2
01
3
Ma
y 2
01
3
Ju
l 2
01
3
Se
p 2
01
3


The real estate market will continue to
grow
Residential sales up about 10 percent
Commercial market will continue modest
recovery
Values will rise at historical rates
Accessibility to finance will be the key

Florida Realtors® 2014 Real Estate and Economic Summit
Doing Business in Florida’s Growing Markets
Sponsored by