Embed Size (px)
Citation preview
Greater Manchester Combined Authority
LAQM Annual Status Report 2016
2016 Air Quality Annual Status Report (ASR) for Greater Manchester In fulfilment of Part IV of the Environment Act 1995 Local Air Quality Management Date: 31st July 2017
Greater Manchester Combined Authority
LAQM Annual Status Report 2016
Matthew O’Neill – Lead Air Quality Officer Transport for Greater Manchester (TfGM) 2 Piccadilly Place Manchester M1 3BG Tel: 0161 2441141 [email protected]
Katherine King Bolton Metropolitan Borough Council Town Hall, Victoria Square, Bolton BL1 1RU Tel: 01204 333333 [email protected]
Chris Horth Bury Metropolitan Borough Council 3 Knowsley Place, Duke Street, Bury BL9 0EJ Tel: 0161 253 5000 [email protected]
Rebecca Twigg-Purcell Manchester City Council 1 Hammerstone Road Gorton Manchester M18 8EQ Tel: 0161 234 5004 [email protected]
Caroline Greenen Oldham Council Chadderton Town Hall Middleton Road, Chadderton Oldham OL9 6PD Tel: 0161 770 2244 [email protected]
Laura Elliott Rochdale MBC Number One Riverside, Smith Street, Rochdale, OL16 1XU Tel: 01706 924136 [email protected]
Ben Rose Salford City Council Civic Centre, Chorley Road, Swinton Salford, M27 5FJ Tel: 0161 697 6964 [email protected]
Stephen Brown Stockport MBC Stopford House Piccadilly Stockport SK1 3XE Tel: 0161 474 4284 [email protected]
Gary Mongan Tameside MBC Environmental Services Council Offices Wellington Road, Ashton-Under-Lyne Lancashire, OL6 6DL Tel: 0161 342 3941 [email protected]
Richard Pollitt Trafford Borough Council Trafford Town Hall, Talbot Road, Stretford Manchester, M32 0YJ Tel: 0161 912 4026 [email protected]
Steve Tesson-Fell Wigan Council Business Compliance & Improvement PO Box 100 Wigan WN1 3DS [email protected]
Report Reference number
GMASR2016
Date 31st July 2017
Greater Manchester Combined Authority
LAQM Annual Status Report 2016 i
Executive Summary: Air Quality in Our Area
Air Quality in Greater Manchester
Air pollution is associated with a number of adverse health impacts. It is recognised as
a contributing factor in the onset of heart disease and cancer. Additionally, air pollution
particularly affects the most vulnerable in society: children and older people, and those
with heart and lung conditions. There is also often a strong correlation with equalities
issues, because areas with poor air quality are also often the less affluent areas.
The annual health cost to society of the impacts of particulate matter alone in the UK
is estimated to be around £16 billion1.
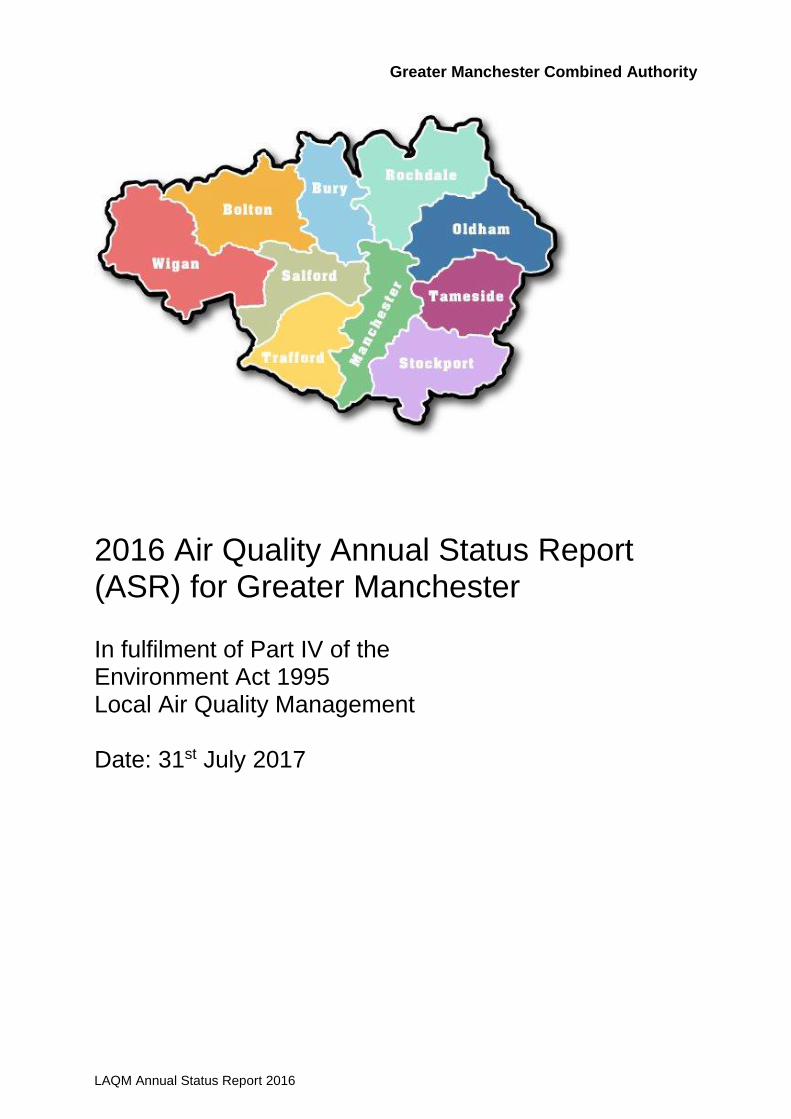
The Greater Manchester Air Quality Working Group led by Transport for Greater
Manchester (TfGM) represents the ten authorities that constitute the Greater
Manchester Combined Authority (GMCA). These authorities are Bolton, Bury,
Manchester, Oldham, Rochdale, Salford, Stockport, Tameside, Trafford, and Wigan.
These are also the main members of the Association of Greater Manchester
Authorities (AGMA). The Combined Authority, shares the same statutory powers for
Local Air Quality Management (LAQM) Sections 82 to 84 of the Environment Act 1995
as the districts.
Greater Manchester has a population of over 2.7 million residents over an area of
approximately 500 square miles. Within the conurbation there is a mix of high-density
urban areas, suburbs, semi-rural and rural locations, and the area is characterised by
the strong regional centre of Manchester, The Quays and Trafford Park.
Long term trends show that there has been an improvement in air quality but areas still
remain above the annual mean air quality objective for Nitrogen Dioxide (NO2).
The assessment of monitoring data shows that real time monitoring data for the NO2
annual mean objective broadly confirms the new Air Quality Management Area
(AQMA) boundaries declared in 2016. Exceedances were noted at several roadside
monitoring sites. Recent modelling showed that the extent of previous exceedances,
and therefore the old AQMAs, reduced in size due to falling NO2 emissions, but
measurements in some areas, particularly those close to the M60, show that
concentrations of NO2 experienced at the roadside have not gone down as expected.
1 Defra. Abatement cost guidance for valuing changes in air quality, May 2013
Greater Manchester Combined Authority
LAQM Annual Status Report 2016 ii
This is thought to be largely due to diesel cars having higher emissions ‘in the real
world’ than was anticipated and the fact that there are now more of them on the road.
The new single AQMA (http://www.gmtu.gov.uk/gam_maps/) was designated on the
1st May 2016 for the whole of Greater Manchester and reflects the location of the
motorways, major roads and urban areas. In terms of the effect on people, this is
greatest where high density residential areas coincide with major highways.
5 automatic sites out of the 17 in Greater Manchester exceeded the NO2 annual mean
objective of 40µg/m3. These 5 sites were Salford M60, Manchester Oxford Road,
Manchester Piccadilly, Bury Prestwich and Tameside Mottram Moor. One site
(Manchester Oxford Road) had more than 18 exceedances of the hourly NO2 objective
at (total of 90 exceedances).
The 2015 Greater Manchester Annual Status Report made reference to exceedances
of the hourly NO2 objective at the Manchester Oxford Road automatic monitoring site.
The national objective is for there to be no more than 18 exceedances, and there were
a total of 60 exceedances of the hourly objective at this site during that year. A
commitment was made in the report to investigate the matter and, in accordance with
Technical Guidance TG16, measurements over several years and relevant local
factors have been considered, together with Air Quality Action Plan (AQAP) measures.
The investigation concluded that the elevated number of exceedances identified in
2015 were the result of an increase in buses being stationary on Oxford Road adjacent
to the monitoring site. This situation was the result of significant roadworks and road
closures in the city centre and Mancunian Way during 2015, leading to additional buses
being diverted past the monitoring site and queuing back from traffic lights further along
Oxford Road towards the city centre. A large proportion of the city centre diversions
during 2015/16 were due to the Metrolink works, which have extended the tram
network across the city and wider Greater Manchester area. This measure was one of
the actions in the GM AQAP predicted to improve air quality in the future.
During 2016 there were 90 exceedances of the hourly objective, which were again due
to additional buses queuing close to the monitoring site as a result of diversions due
to the ongoing Metrolink works and other road closures.
During early 2017, TfGM implemented a £122m Bus Priority Package, which enables
cross-city bus services to run directly through Manchester city centre. Oxford Road
has had significant road layout alterations, and general traffic is now prohibited from
Greater Manchester Combined Authority
LAQM Annual Status Report 2016 iii
travelling through new ‘bus gates’ that restrict access between 6am and 9pm, 7 days
a-week.
As a result of the road layout changes, traffic flow has improved past the monitoring
site and the exceedances of the hourly objective have reduced; there were 4
occurrences in January 2017 (prior to the Bus Priority works), and no further
exceedances at the time of writing. Monitoring continues at this location, and a further
update will be provided in the ASR for 2017, but it has been determined that the
existing AQMA should not be amended to include exceedances of the hourly NO2
objective.
Measurements from the Greater Manchester’s diffusion tube network confirms there
are locations that continue to be above the annual mean NO2 air quality objective.
Real time monitoring data for particulate matter (less than 10 microns) shows that
annual average objectives are not exceeded and are mostly remaining stable at low
concentrations. No sites had more than 35 occurrences of the daily mean particulate
objective and therefore this objective is met.
Sulphur dioxide monitoring was carried out at 2 sites, with no exceedances of the air
quality objectives.
Air Quality monitoring and reporting of carbon monoxide and benzene has been
discontinued, as previous assessments indicated no exceedances.
The new Low Emission Strategy (LES) and AQAP was published on the 16th December
2016 after going out to public consultation and being signed off by the Greater
Manchester Combined Authority (GMCA). The LES & AQAP propose a range of
measures to improve air quality and reduce ill-health across Greater Manchester,
focusing on ‘key priority areas’ in urban centres and near major roads which currently
fail to meet UK Government and EU air quality objectives. The LES & AQAP is being
led by TfGM on behalf of the GMCA, and includes close working with Highways,
England, Public Health England, The Environment Agency, Greater Manchester
Police, and charitable organisations to ensure the best outcome can be achieved.
Greater Manchester Combined Authority
LAQM Annual Status Report 2016 iv
Actions to Improve Air Quality
The AQAP has been produced following a programme of consultation and workshops
with key stakeholders, including the Greater Manchester local authorities, Public
Health England, TfGM and Highways England, to obtain feedback on the new
measures proposed.
Policies and actions were subsequently identified and divided into the following broad
subjects, based on the area and type of effects that may be achieved:
Development management and planning regulation: including
standardisation of regulation and policy across the Greater Manchester
region.
Freight and HGVs: there are several opportunities to reduce emissions
associated with the movement of freight and goods by road.
Buses: Buses have a vital role to play in transporting the public and give
opportunities to improve air quality. New legislative developments and the
creation of the future Greater Manchester bus strategy will assist in growing
bus usage and improving vehicle standards.
Cycling: Existing strategies and initiatives encourage cycling.
Travel Choices: Encouraging the public and businesses to make
sustainable travel choices is essential in realising lasting air quality benefits.
Cars: Measures to reduce emissions from cars and reduce the number of
vehicle trips can deliver real improvements.
Information and resources: Education and the provision of information to
the public, businesses and policy makers is seen as vital in bringing air
quality improvements.
Work is currently underway on a Clean Air Zone feasibility study which has been
funded through the Defra Air Quality Grant Fund 2015, and is expected to be
completed by September 2017.
Greater Manchester Combined Authority
LAQM Annual Status Report 2016 v
Part of a Clean Air Zone (CAZ), would look to reduce the number of polluting vehicles
that can enter a specific area, as a potential tool for improving air quality. Any proposal
would require careful research to identify the positive and negative economic, social
and environmental impacts.
The study to date has looked at the scenario for business as usual for 2020, and
scoped 3 geographical areas to study the outcomes of implementing a CAZ. The next
stage has then taken 2 of these geographical areas to complete a more in depth
analysis to give a preferred area and vehicle class options.
Local Priorities and Challenges
Given the need to meet EU limits for NO2 as soon as possible, the short-term focus
will need to be on NO2. Many of the measures that will help achieve this will also be of
some benefit in reducing greenhouse gases and particulates, which will be the focus
over the longer-term. Key challenges will be obtaining funding to enable the Local
Authorities to carry out some of the actions in the plan.
How to Get Involved
www.greatairmanchester.org has information and links to air quality and how to play a
part. The main considerations would be to think about how you travel, reducing single
occupancy car use, use carpooling, changing to cleaner alternative fuels, and using
public transport, cycling and walking. Other considerations could include avoiding
excessive idling of your vehicle, or even considering where the products you buy are
coming from.
The GMCA have carried out Clean Air Days/Weeks, which raised awareness and help
people understand what they can do to improve their impact. These days were also
carried out with events at schools, hospitals and workplaces.
TfGM are also looking into improving the website to include more information which
would also include getting messages about air quality to vulnerable people by text,
email or call.
Greater Manchester Combined Authority
LAQM Annual Status Report 2016 vi
Air Quality Initiatives
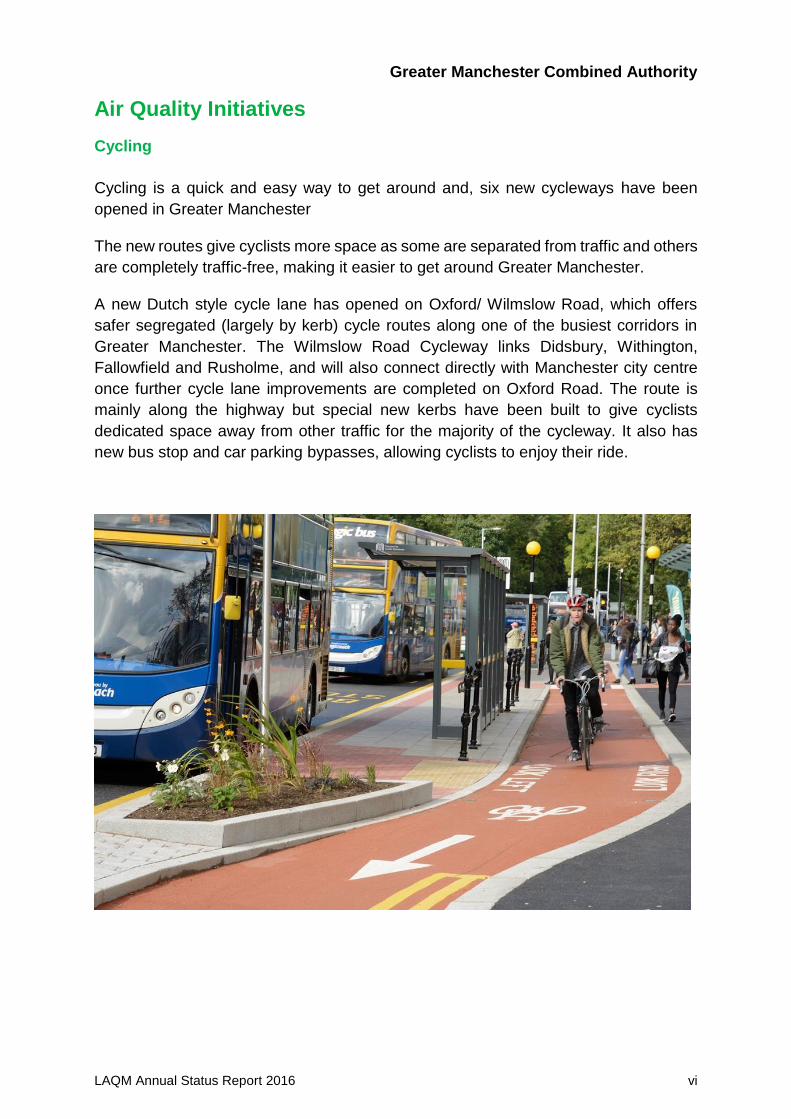
Cycling
Cycling is a quick and easy way to get around and, six new cycleways have been
opened in Greater Manchester
The new routes give cyclists more space as some are separated from traffic and others
are completely traffic-free, making it easier to get around Greater Manchester.
A new Dutch style cycle lane has opened on Oxford/ Wilmslow Road, which offers
safer segregated (largely by kerb) cycle routes along one of the busiest corridors in
Greater Manchester. The Wilmslow Road Cycleway links Didsbury, Withington,
Fallowfield and Rusholme, and will also connect directly with Manchester city centre
once further cycle lane improvements are completed on Oxford Road. The route is
mainly along the highway but special new kerbs have been built to give cyclists
dedicated space away from other traffic for the majority of the cycleway. It also has
new bus stop and car parking bypasses, allowing cyclists to enjoy their ride.
Greater Manchester Combined Authority
LAQM Annual Status Report 2016 vii
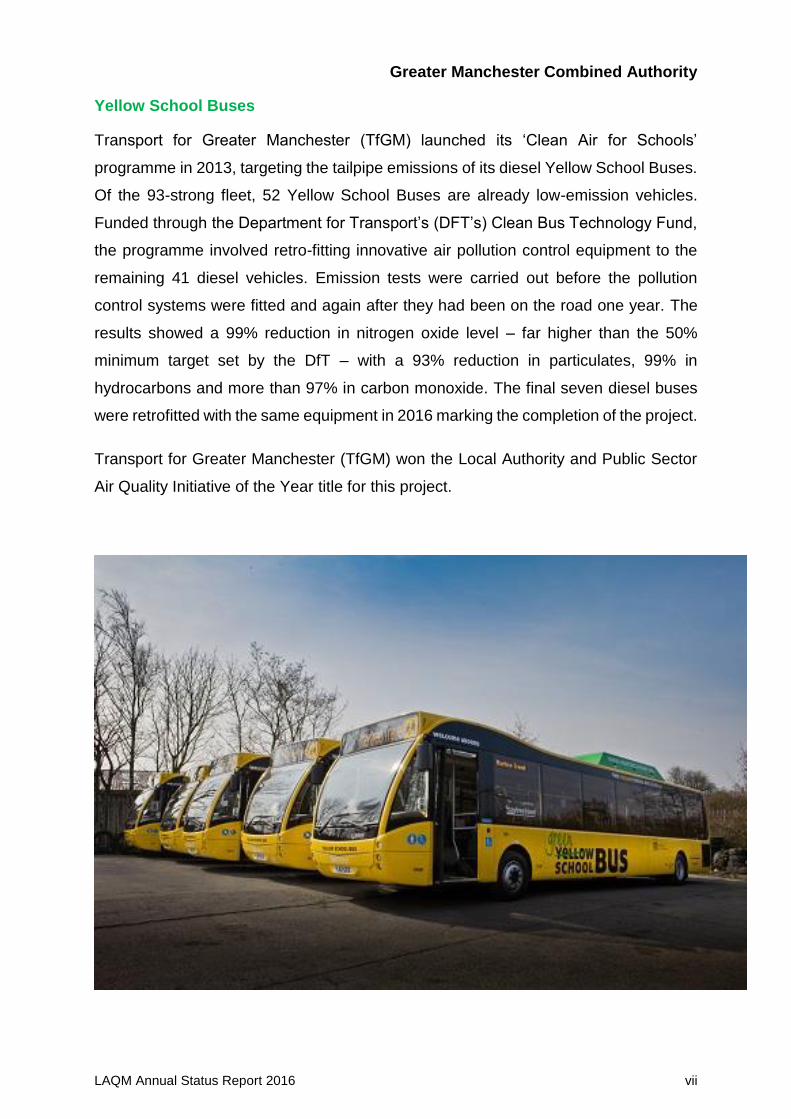
Yellow School Buses
Transport for Greater Manchester (TfGM) launched its ‘Clean Air for Schools’
programme in 2013, targeting the tailpipe emissions of its diesel Yellow School Buses.
Of the 93-strong fleet, 52 Yellow School Buses are already low-emission vehicles.
Funded through the Department for Transport’s (DFT’s) Clean Bus Technology Fund,
the programme involved retro-fitting innovative air pollution control equipment to the
remaining 41 diesel vehicles. Emission tests were carried out before the pollution
control systems were fitted and again after they had been on the road one year. The
results showed a 99% reduction in nitrogen oxide level – far higher than the 50%
minimum target set by the DfT – with a 93% reduction in particulates, 99% in
hydrocarbons and more than 97% in carbon monoxide. The final seven diesel buses
were retrofitted with the same equipment in 2016 marking the completion of the project.
Transport for Greater Manchester (TfGM) won the Local Authority and Public Sector
Air Quality Initiative of the Year title for this project.
Greater Manchester Combined Authority
LAQM Annual Status Report 2016 viii
Table of Contents
Executive Summary: Air Quality in Our Area .......................................................... i
Air Quality in Greater Manchester ....................................................................................... i
Actions to Improve Air Quality ........................................................................................... iv
Local Priorities and Challenges .......................................................................................... v
How to Get Involved........................................................................................................... v
Air Quality Initiatives ......................................................................................................... vi
1 -Local Air Quality Management ....................................................................... 1
2 Actions to Improve Air Quality ........................................................................ 2
2.1 Air Quality Management Areas .............................................................................. 2
2.2 Progress and Impact of Measures to address Air Quality in Greater
Manchester ....................................................................................................................... 3
2.3 PM2.5 – Local Authority Approach to Reducing Emissions and or
Concentrations.................................................................................................................11
3 Air Quality Monitoring Data and Comparison with Air Quality
Objectives and National Compliance .................................................................... 12
3.1 Summary of Monitoring Undertaken .....................................................................12
3.1.1 Automatic Monitoring Sites .......................................................................................... 12
3.1.2 Non-Automatic Monitoring Sites................................................................................... 13
3.2 Individual Pollutants .............................................................................................13
3.2.1 Nitrogen Dioxide (NO2)................................................................................................. 13
3.2.2 Particulate Matter (PM10) .............................................................................................. 19
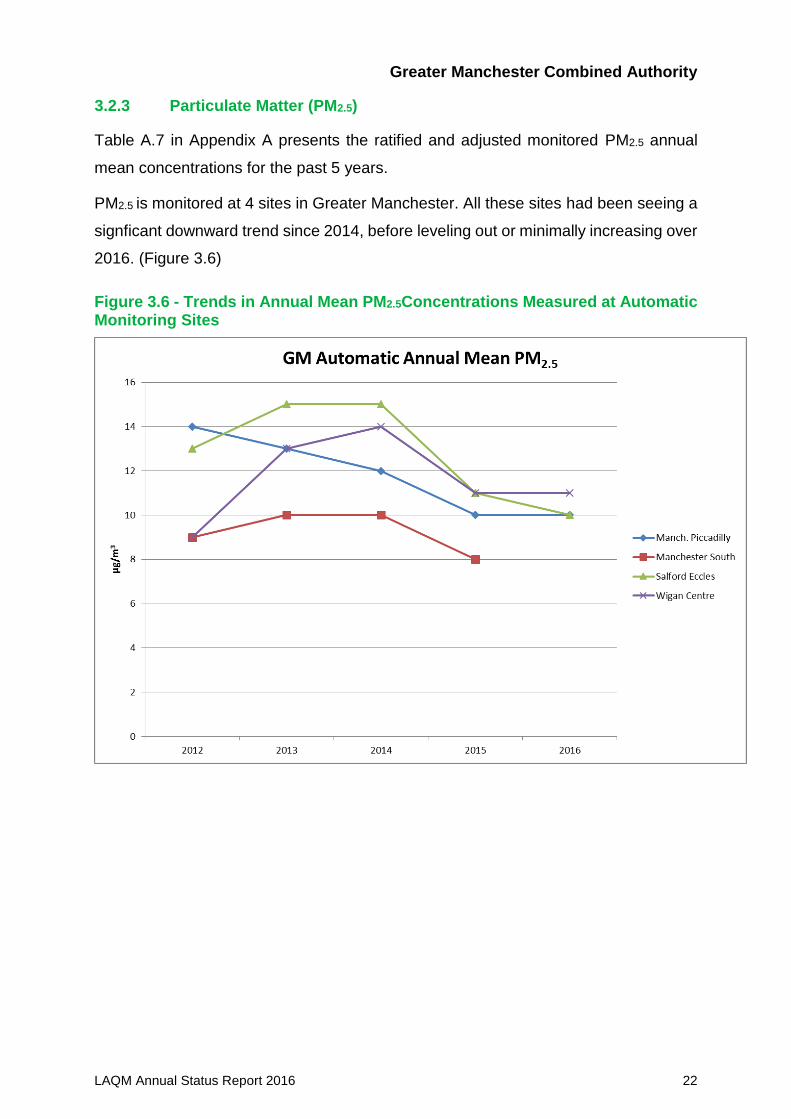
3.2.3 Particulate Matter (PM2.5) ............................................................................................. 22
3.2.4 Sulphur Dioxide (SO2) .................................................................................................. 23
Appendix A: Monitoring Results ........................................................................... 24
Appendix B: Full Monthly Diffusion Tube Results for 2016 ................................ 37
Appendix C: Supporting Technical Information / Air Quality Monitoring Data
QA/QC ...................................................................................................................... 38
Appendix D: Map(s) of Monitoring Locations ...................................................... 41
Appendix E: Summary of Air Quality Objectives in England .............................. 42
Glossary of Terms .................................................................................................. 43
References .............................................................................................................. 44
Greater Manchester Combined Authority
LAQM Annual Status Report 2016 ix
List of Tables
Table 2.1 - Declared Air Quality Management Areas .................................................. 2 Table 2.2 - Progress on Measures to Improve Air Quality ......................................... 10 Table 3.1 - Number of NO2 Diffusion Tubes over 40 μg/m3 ....................................... 18
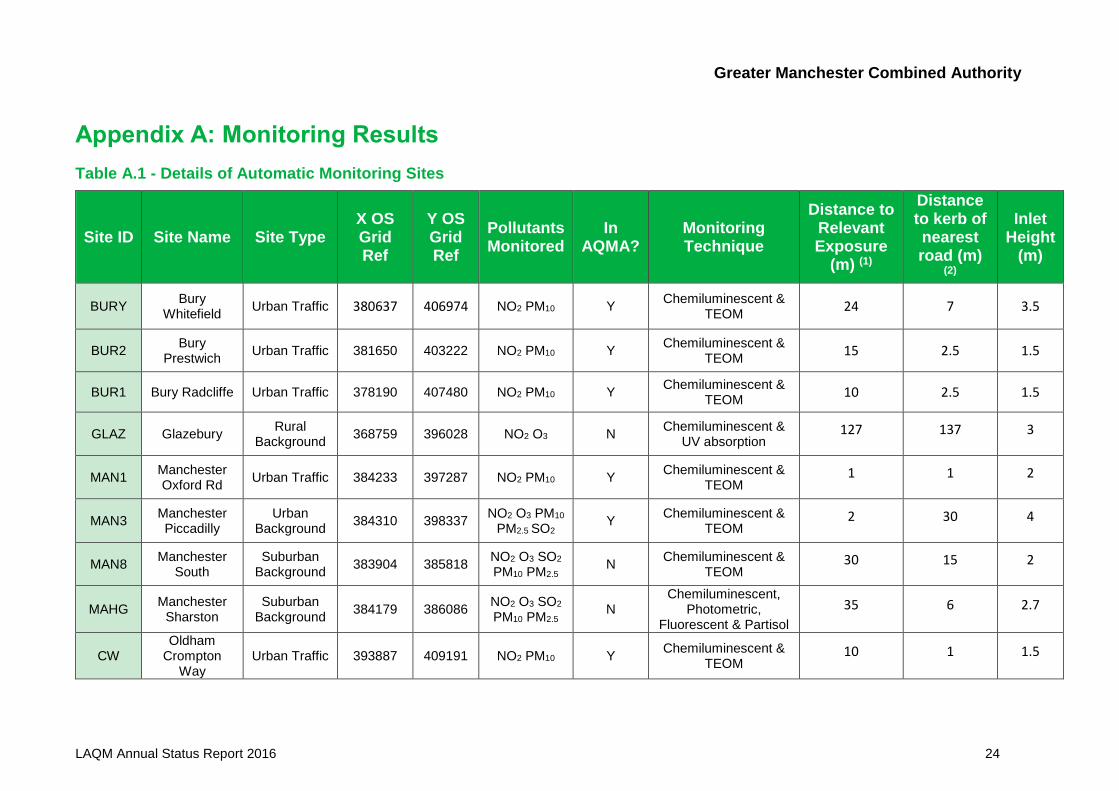
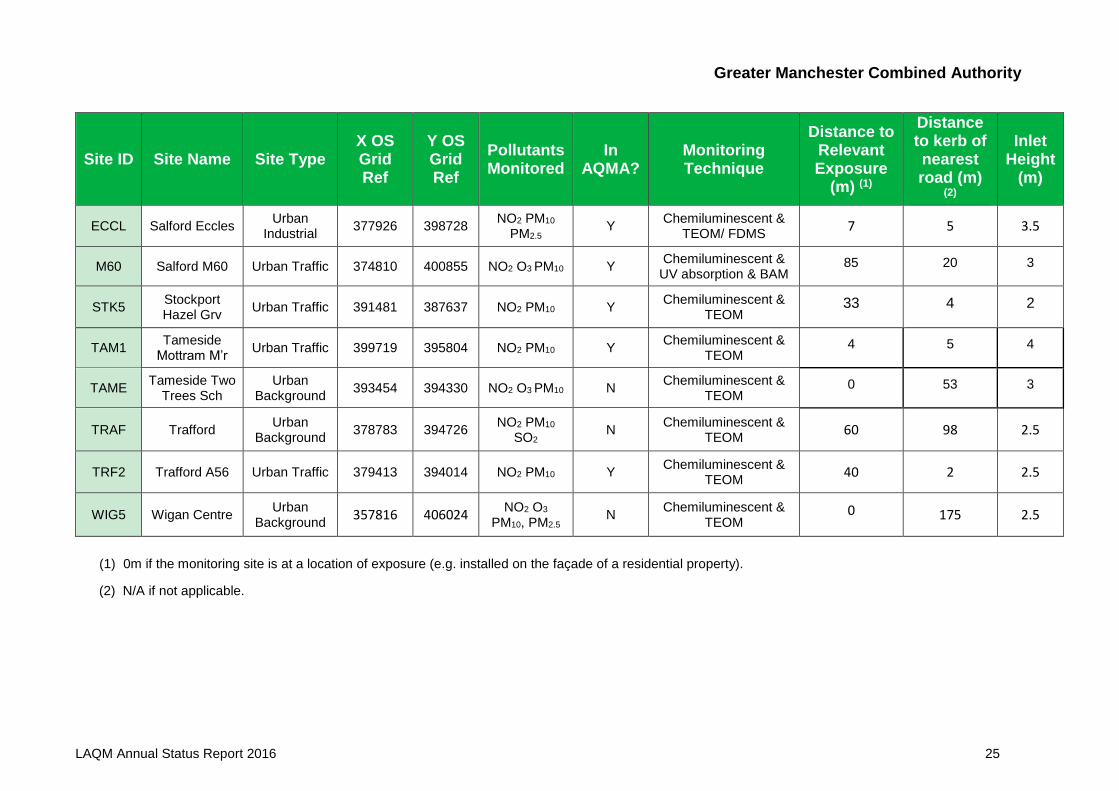
Table A.1 - Details of Automatic Monitoring Sites ...................................................... 24
Table A.2 - Details of Non-Automatic Monitoring Sites .............................................. 26 Table A.3 - Annual Mean NO2 Monitoring Results .................................................... 27 Table A.4 - 1-Hour Mean NO2 Monitoring Results ..................................................... 29 Table A.5 - Annual Mean PM10 Monitoring Results ................................................... 31 Table A.6 - 24-Hour Mean PM10 Monitoring Results .................................................. 33
Table A.7 - PM2.5 Monitoring Results ......................................................................... 35
Table A 8 - SO2 Monitoring Results ........................................................................... 36 Table B.1 - NO2 Monthly Diffusion Tube Results – 2016 ........................................... 37
Table E.1 - Air Quality Objectives in England ............................................................ 42
List of Figures
Figure 3.1 - Trends in Annual Mean NO2 Concentrations Measured at Automatic Monitoring Sites Bury – Oldham. .............................................................. 16
Figure 3.2 -Trends in Annual Mean NO2 Concentrations Measured at Automatic Monitoring Sites Salford - Wigan .............................................................. 17
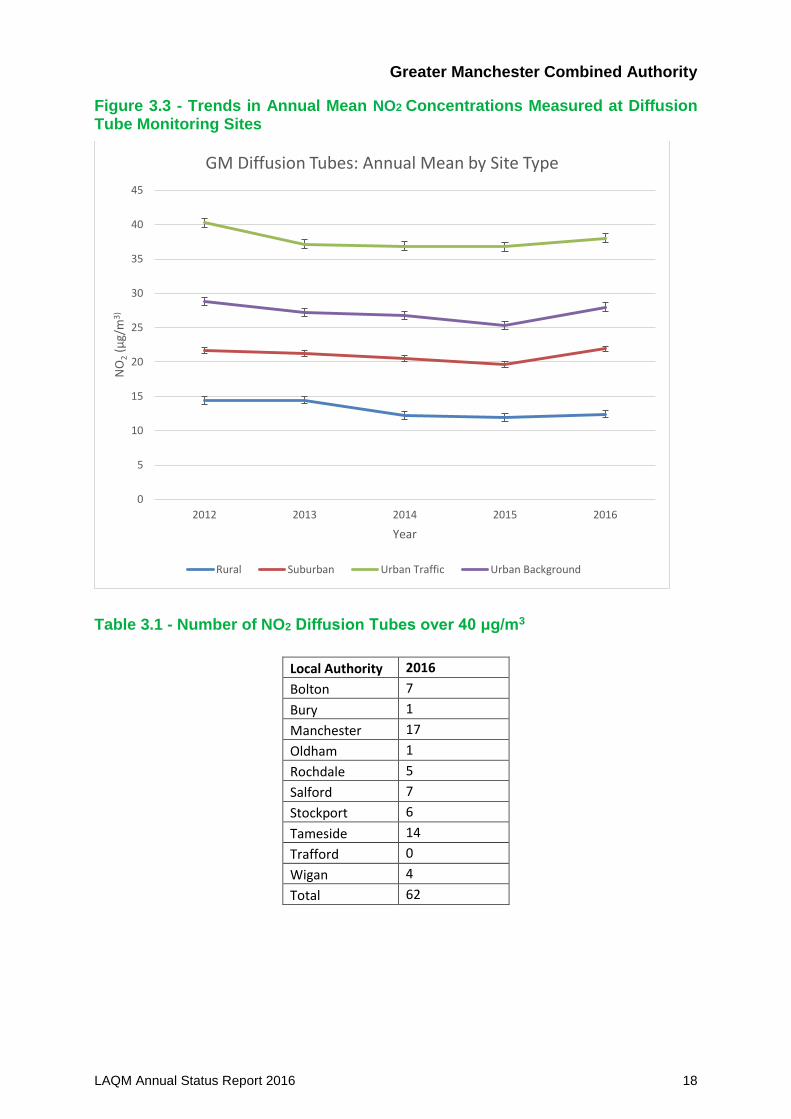
Figure 3.3 - Trends in Annual Mean NO2 Concentrations Measured at Diffusion Tube Monitoring Sites ........................................................................................ 18
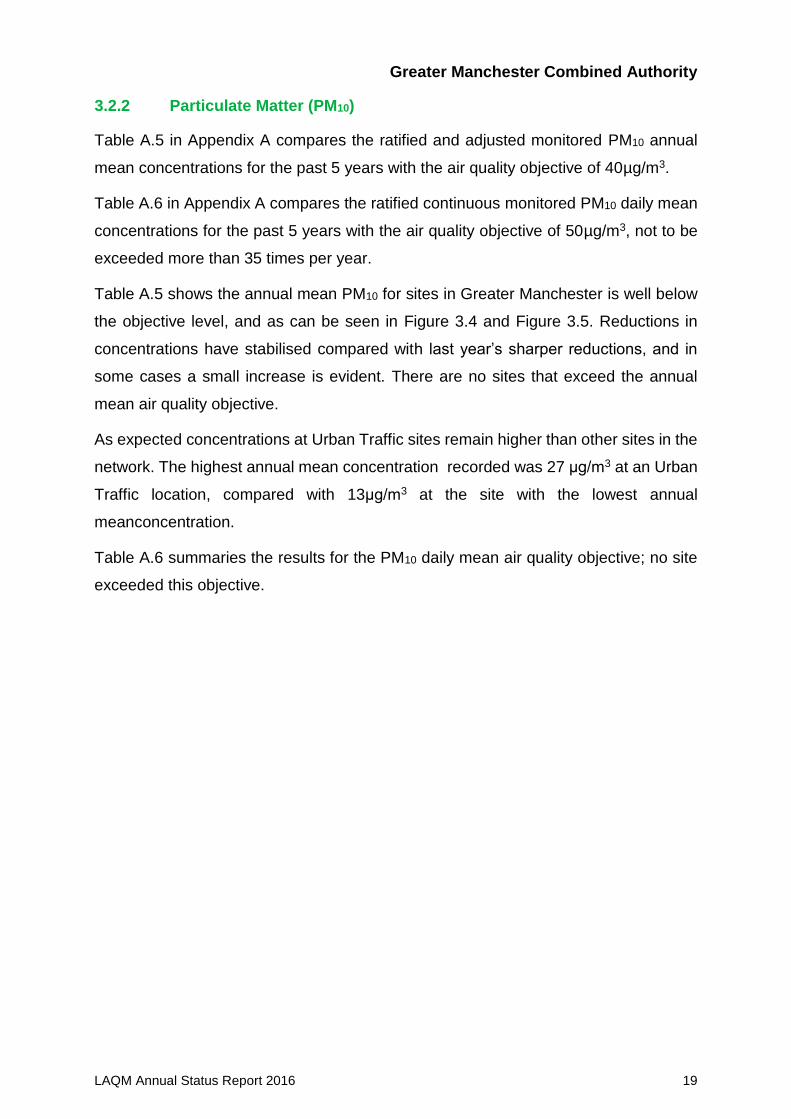
Figure 3.4- Trends in Annual Mean PM10 Concentrations Measured at Automatic Monitoring Sites – Bury - Oldham ............................................................. 20
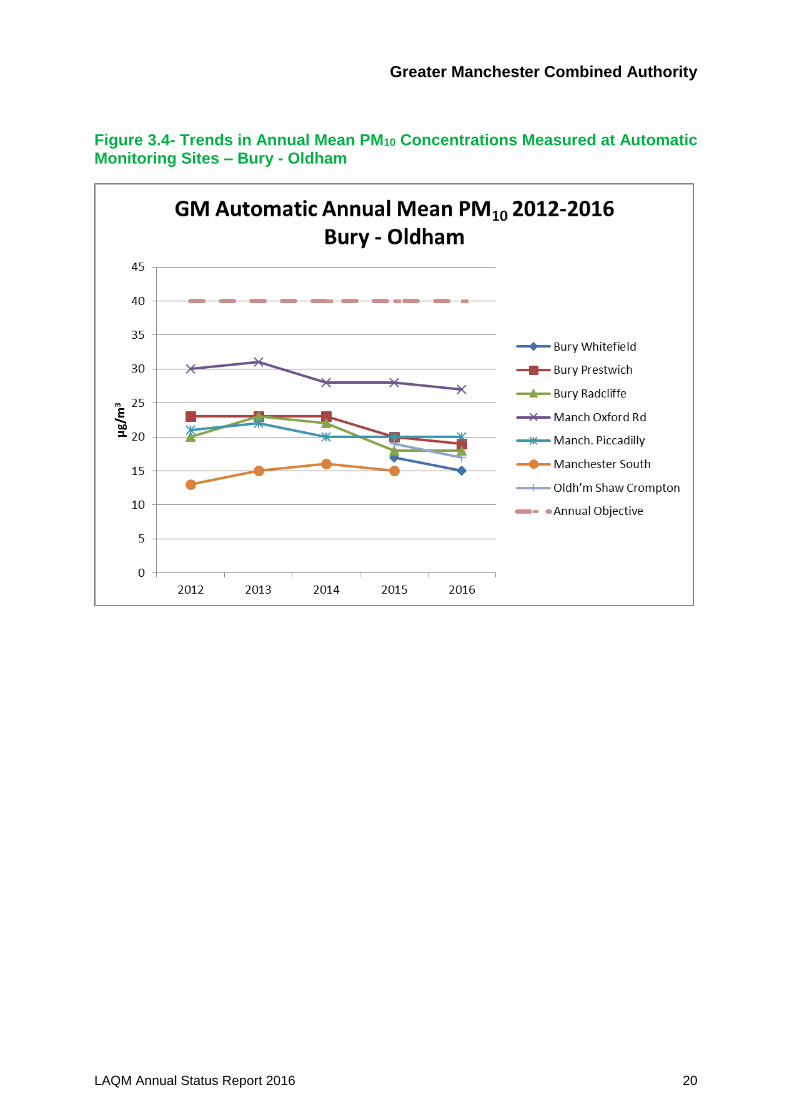
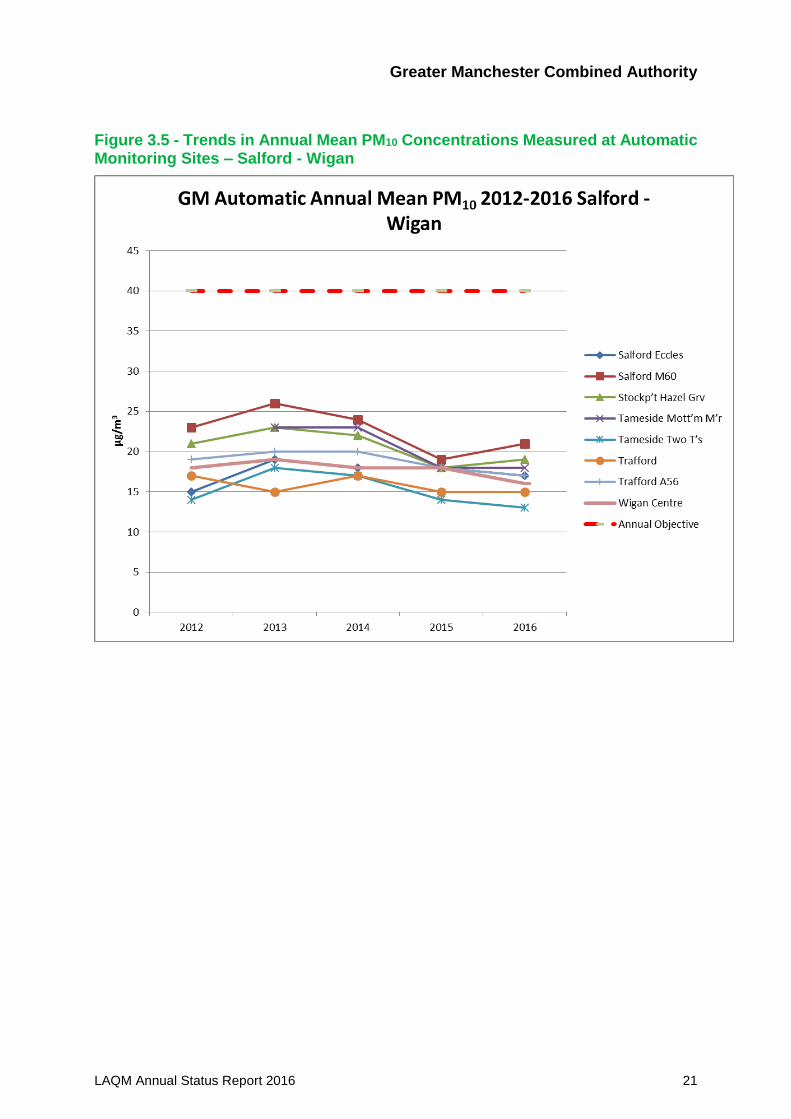
Figure 3.5 - Trends in Annual Mean PM10 Concentrations Measured at Automatic Monitoring Sites – Salford - Wigan ........................................................... 21
Figure 3.6 - Trends in Annual Mean PM2.5 Concentrations Measured at Automatic Monitoring Sites ........................................................................................ 22
Greater Manchester Combined Authority
LAQM Annual Status Report 2016 1
1 -Local Air Quality Management
This report provides an overview of air quality in Greater Manchester during 2016.
Transport for Greater Manchester (TfGM) represents the ten authorities that constitute
the Greater Manchester Combined Authority (GMCA). These authorities are Bolton,
Bury, Manchester, Oldham, Rochdale, Salford, Stockport, Tameside, Trafford, and
Wigan. It fulfils the requirements of Local Air Quality Management (LAQM) as set out
in Part IV of the Environment Act (1995) and the relevant Policy and Technical
Guidance documents.
The LAQM process places an obligation on all local authorities to regularly review and
assess air quality in their areas, and to determine whether or not the air quality
objectives are likely to be achieved. Where an exceedance is considered likely the
local authority must declare an AQMA and prepare an AQAP setting out the measures
it intends to put in place in pursuit of the objectives. This Annual Status Report (ASR)
is an annual requirement showing the strategies employed by the 10 Greater
Manchester Local Authorities to improve air quality and any progress that has been
made.
The statutory air quality objectives applicable to LAQM in England can be found in
Appendix E.
Greater Manchester Combined Authority
LAQM Annual Status Report 2016 2
2 Actions to Improve Air Quality
2.1 Air Quality Management Areas
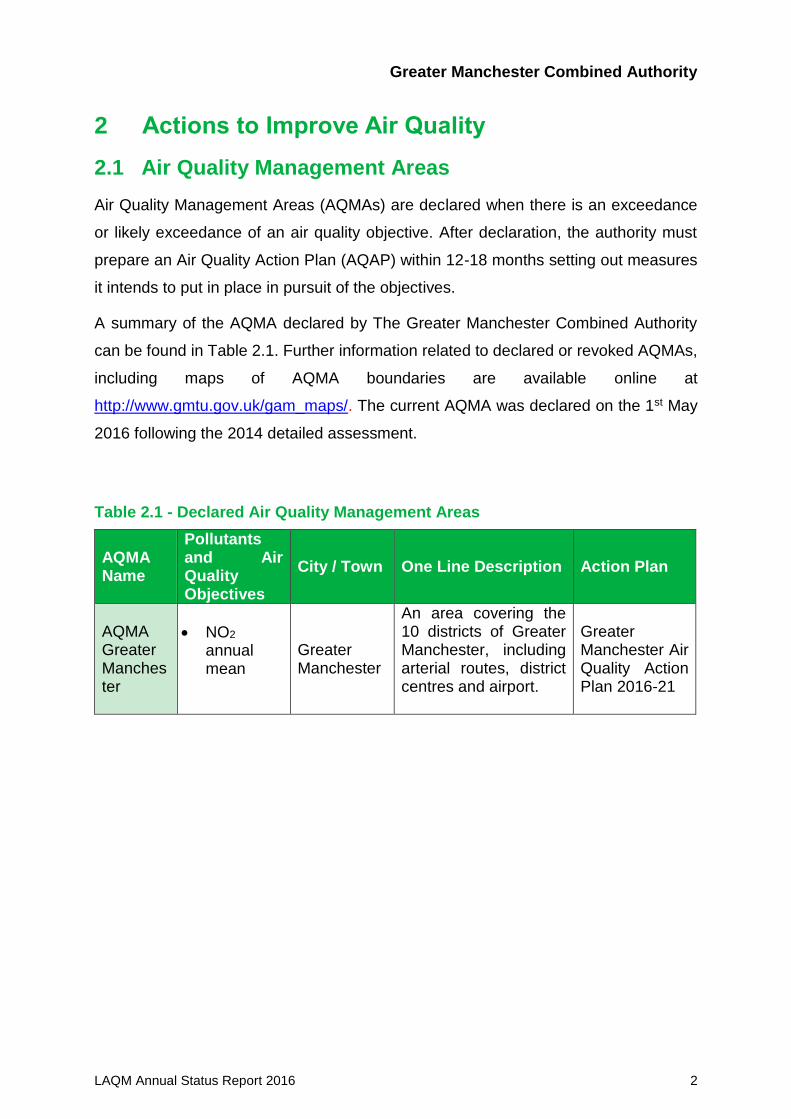
Air Quality Management Areas (AQMAs) are declared when there is an exceedance
or likely exceedance of an air quality objective. After declaration, the authority must
prepare an Air Quality Action Plan (AQAP) within 12-18 months setting out measures
it intends to put in place in pursuit of the objectives.
A summary of the AQMA declared by The Greater Manchester Combined Authority
can be found in Table 2.1. Further information related to declared or revoked AQMAs,
including maps of AQMA boundaries are available online at
http://www.gmtu.gov.uk/gam_maps/. The current AQMA was declared on the 1st May
2016 following the 2014 detailed assessment.
Table 2.1 - Declared Air Quality Management Areas
AQMA Name
Pollutants and Air Quality Objectives
City / Town One Line Description Action Plan
AQMA Greater Manchester
NO2 annual mean
Greater Manchester
An area covering the 10 districts of Greater Manchester, including arterial routes, district centres and airport.
Greater Manchester Air Quality Action Plan 2016-21
Greater Manchester Combined Authority
LAQM Annual Status Report 2016 3
2.2 Progress and Impact of Measures to address Air Quality in Greater Manchester
Greater Manchester has taken forward a number of measures during the current
reporting year of 2016 in pursuit of improving local air quality. Details of all measures
completed, in progress or planned are set out in Table 2.2.
More detail on these measures can be found in their respective Action Plans (Greater
Manchester Air Quality Action Plan 2016-21). Key completed measures are:
Bus Priority Packages
The Bus Priority Package enables cross-city bus services to run directly through
the heart of Manchester city centre – free from other traffic.
The North West’s first guided busway from Leigh to Ellenbrook opened.
New hybrid buses used on route.
Alongside the guided busway dedicated walking and cycling route which runs
the full 4.5 miles have been created, with improvements to shorter sections of
the existing shared use pedestrian and cycle route alongside the A580.
Three new park and ride sites
Electric Vehicles
13 hybrid taxis licensed in Bury. 38 hybrid taxis in Wigan (1 plug in). 1 hybrid in
Rochdale
Salford City Council currently waives licensing and testing fees for Private Hire
Drivers with an Electric Vehicle, to encourage take up of EV’s amongst the
trade.
The Salford City Council car club fleet includes 8 battery powered electric vehicles (BPEVs). Four semi rapid charging points were installed in 2016 to serve the car club fleet.
From 1/1/16 to 31/12/16 electric vehicle charging points hosted 49,182 charging
sessions which represents a 171% increase on the charging demand for the
Greater Manchester Combined Authority
LAQM Annual Status Report 2016 4
same time period in the previous year, and a 521% increase since December
2014.
Cycle works/initiatives
Our vision is to make cycling a convenient, attractive and safe travel choice for
everyone, regardless of age or ability. We’re working hard to build a bright
cycling future for Greater Manchester.
We have made a great start, building the infrastructure and providing the
support needed to encourage people to start cycling; segregated cycle lanes,
Cycle Hubs and free skills training sessions are all helping turn Greater
Manchester into a true cycle city.
The improvements so far have included:
60km of largely segregated cycle lanes built since 2013.
Around 9,000 people enjoying free adult bike training sessions.
The construction of Cycle Hubs at bus, train and Metrolink stops, with more on
the way in 2016.
Working with 11 schools and colleges to promote cycling to pupils and staff.
The next steps are:
A further 45km of new or improved cycle lanes to be completed by 2018.
Four Cycle Friendly District Centres to focus investment on cycle routes and
parking.
Build more cycle and ride facilities and transport interchanges.
Work to improve facilities in and around more schools and colleges, meaning
we’ll eventually have helped pupils and staff at more than 20 educational sites
since 2013.
The improvements have been partly funded by £42m from two Cycle City
Ambition Grants, awarded by the Government, which last until 2018, and the
Local Sustainable Transport Fund.
Greater Manchester Combined Authority
LAQM Annual Status Report 2016 5
Elizabethan Way Cycle/Pedestrian Route & Toucan – Total Scheme Cost £400,
982.05
Outputs and benefits of scheme - Within Milnrow the main barrier to active travel
is created by Elizabethan Way. An existing pedestrian crossing facility links with
existing pedestrian/ cycle routes to the Metrolink station via Harbour Lane North,
upgrading to a Toucan will supported cycle use. This crossing is available to
pedestrians and cyclist accessing the station from the west of Milnrow, which
created a formalised route to the Kingsway Business Park.
To the North of Milnrow the main direct access to the Metrolink station was
initially is along Harbour Lane North. However during the evening and night time
this route would not have natural passing/frontage observation due to the
industrial nature of the area. However Elizabethan Way is at a raised profile and
does not overlook this route. The section of Harbour Lane that bridges the
Metrolink track provides a direct link to the pedestrian crossing on Elizabethan
Way and the housing estate beyond that.
The scheme provided a mixture of shared use and off highway cycle lanes in
the vicinity of Elizabethan Way, providing a new segregated cycle and walking
link from Milnrow to Newhey, including access to Kingsway Business Park.
Burnside Road Toucan/Cycle Link – Total Scheme Cost £91, 269.83
Outputs and benefits of scheme - National Cycle route number 66 runs along
the canal towpath through the Newbold area and this can be accessed via
Burnside Road. The scheme provided a direct part segregated cycle link from
the Metrolink station to the existing Route 66 along Burnside Road via
introducing a Toucan crossing facility at this existing signalised junction.
Part of this pedestrian link required the installation of a build out to create an
extension to the existing pedestrian island to safely provide the Toucan
crossing.
Greater Manchester Combined Authority
LAQM Annual Status Report 2016 6
Campaigns
I Will If You Will Team working with TfGM on the following:-Road Rider Ready
and Learn to Ride sessions at Clarence Park, Women on Wheels (WOW)
projects including family cycling activities, Breeze led rides.
Cycle City Ambition Grant to fund: the upgrade of the canal towpath from School
Street to Farnworth and new route through the town centre from School Street
to Coney Green – and the upgrade of cycle parking at the station.
The Growth Fund active travel fund is funding Radcliffe East cycleway, which
should complete an off road/quiet road route from Bury to Bolton, partly on the
line of the former railway.
Growth Fund allocation to improve the Angouleme Way/Market Street junction
for pedestrians
I Will if You Will are operating a Walking for Health programme with groups in
Summerseat, Prestwich, Greenmount and MacMillan Cancer Support Walk,
Walk leader training course delivered March creating 9 new leaders.
55 schools registered as Eco Schools. Seven of these have achieved the
highest Green Flag standard with two gaining their second Green Flag.
2309 LED streetlights installed in Bury 2015/16
484 NIBE units (exhaust air heat pumps) have been installed in Pendleton.
Dirty Diesel Campaign:
Encouraging the public to report smoky, grossly polluting vehicles, leading to a
reduction in vehicle emissions.
The campaign began in November 2004 and is still publicised via the website:
www.cleanervehicles.org.uk.
Individual buses with excessive bus emissions can be reported via TfGM as per
their website:
http://www.tfgm.com/Corporate/environment/Pages/environment_faq.aspx.
Other commercial vehicles in addition to buses can also be reported via the
DVSA website: https://www.gov.uk/report-smoky-vehicle. Taxis can be reported
Greater Manchester Combined Authority
LAQM Annual Status Report 2016 7
to the local authority issuing the licence. Privately owned vehicles can be
reported to the local authority in whose area the vehicle was observed.
The total number of vehicles reported in Manchester between 1/04/15 to
31/03/16 was 25.
Solar panels & Electric vehicle:
Project to use an electric vehicle for MCC staff and make the vehicle effectively
‘emission free’ by offsetting emissions produced from the charging of the vehicle
using solar power.
Total CO2, NOX and PM10 emissions were reduced by 118%, 127% and 50%
respectively over the study period. This resulted in savings of 1.69 tonnes of
CO2, 2.54 kg NOX and 0.13 kg PM10.
The vehicle continues to be used by Council staff in replacement of their own
vehicles to carry out their duties.
Low emission taxi scheme:
Manchester CC - Implementation of a 12-year maximum age limit policy on all
hackney carriages, and 7-year age limit an all private hire vehicles.
Salford City Council licensing rules state that any new Private Hire registrations
need to have a vehicle of less than 4 years old.
Emissions tests carried out on all hackney carriage and private hire vehicles at
four monthly mechanical inspection tests.
Future Measures
Greater Manchester expects the following measures to be completed over the course
of the next reporting year:
TfGM along with the stated LA’s will be addressing the requirements of the
national plan, and investigating a number of mitigation options to bring Greater
Manchester into compliance with the legal levels of NO2 as soon as possible.
Clean Air Zone Feasibility Study: TfGM are undertaking an appraisal of the
effects of Clean Air Zones (CAZs), and will be reported in the Autumn 2017
Greater Manchester Combined Authority
LAQM Annual Status Report 2016 8
Plugged-in Places EV Charging Network: Continue to increase the number of
EV charging points.
Further improvements on Bus Priority Programme (Oxford Road Corridor).
Engine Idling: promotion of anti-idling policies with freight transport companies.
Alternative Fuels: Investigate the potential of alternative fuels and carry out trials
using different vehicle types.
TfGM Delivery and Servicing Plan (DSP) Toolkit: Air quality considerations will
be incorporated into the DSP toolkit to reduce HGV movements, and hence
emissions, in the Key Priority Areas.
Encouraging Travel Planning: TfGM will work with the local authorities to
encourage travel planning measures in businesses and individuals to affect a
significant modal shift.
Green Infrastructure: Investigate the potential of green infrastructure in
improving air quality.
Cycle Programmes: Improve the cycle infrastructure and provide practical
support to reduce vehicle movements in the Key Priority Areas.
Public Cycle Hire: Explore the feasibility of public cycle hire facilities.
Cycle Logistics: Encourage and promote a logistics programme to use cycle or
electrically-assisted cycles for short distance deliveries and distribution in urban
centres.
2040: Undertake further work to better understand the more innovative options
available to further promote cycling and walking, and to set out a clear delivery
plan in line with the 2040 transport strategy.
Local Authority Parking Charges: Work with local authorities to review the
introduction of parking charges at local authority offices to discourage private
car use.
School Travel: TfGM will appraise opportunities to reduce air quality impacts
from school car travel.
Greater Manchester Combined Authority
LAQM Annual Status Report 2016 9
Awareness Raising: Air quality awareness programmes to encourage people to
take action against air pollution.
Greater Manchester delivered phase 1 of the Cycle City Ambition Grant (CCAG)
programme in March 2016 to encourage a step change in cycling, and work
towards the GM cycling strategy target of a 10% cycling mode share by 2025.
Within Salford the highlight of this programme was a 2.0km light segregation
cycleway, the longest scheme of this type in the country. Early results show
that cycling in the peak commuting periods has doubled on the corridor, since
the introduction of light segregation. Several other high profile cycling projects
in Salford were completed that will encourage more cycle trips, and reduce poor
air quality. Including the final section of the Roe Green loopline, with this, the
7.5km traffic free route from Bolton to Monton Green is now open, providing an
excellent commuter route and direct traffic free access to 7 schools along the
route to encourage cycling to school and a reduction on car trips during the
‘school run’.
A study into Alternative Fuels for heavy vehicles
A trial of electric buses on standard routes
A trial of GTL fuel
Greater Manchester Combined Authority
LAQM Annual Status Report 2016 10
Table 2.2 - Progress on Measures to Improve Air Quality
Details of progress on measures is located in the attached “GM Monitoring Results 2016” file
Greater Manchester Combined Authority
LAQM Annual Status Report 2016 11
2.3 PM2.5 – Local Authority Approach to Reducing Emissions and or Concentrations
As detailed in Policy Guidance LAQM.PG16 (Chapter 7), local authorities are expected
to work towards reducing emissions and/or concentrations of PM2.5 (particulate matter
with an aerodynamic diameter of 2.5µm or less). There is clear evidence that PM2.5
has a significant impact on human health, including premature mortality, allergic
reactions, and cardiovascular diseases.
The EU has also set a target of a 20% reduction in urban background concentrations
of PM2.5 between 2010 and 2020. Greater Manchester currently has 4 sites that monitor
PM2.5. All of these sites have showed a significant downward trend over the last year.
Given the need to meet EU limits for NO2 as soon as possible, and the downward trend
of particulate matter, the short-term focus will need to be on NO2. Many of the
measures that will help achieve this will also be of some benefit in reducing greenhouse
gases and particulates, which will be the focus over the longer-term.
Air quality impacts will need to be assessed for all major development schemes where
an impact is likely, and mitigation measures implemented where necessary.
Greater Manchester Combined Authority
LAQM Annual Status Report 2016 12
3 Air Quality Monitoring Data and Comparison with Air Quality Objectives and National Compliance
3.1 Summary of Monitoring Undertaken
3.1.1 Automatic Monitoring Sites
This section sets out what monitoring has taken place and how it compares with
objectives.
Greater Manchester undertook automatic (continuous) monitoring at 17 sites during
2016. Table A.1 in Appendix A shows the details of the sites. NB. Local authorities do
not have to report annually on the following pollutants: 1, 3 butadiene, benzene, carbon
monoxide and lead, unless local circumstances indicate there is a problem.
Maps showing the location of the monitoring sites are provided in GM Monitoring
Locations. Further details on how the monitors are calibrated and how the data has
been adjusted are included in Appendix C.
Greater Manchester Combined Authority
LAQM Annual Status Report 2016 13
3.1.2 Non-Automatic Monitoring Sites
Greater Manchester undertook non-automatic (passive) monitoring of NO2 at 254 sites
during 2016 Table A.2 in Appendix A shows the details of the sites.
Maps showing the location of the monitoring sites are provided in GM Monitoring
Locations. Further details on Quality Assurance/Quality Control (QA/QC) and bias
adjustment for the diffusion tubes are included in Appendix C.
3.2 Individual Pollutants
The air quality monitoring results presented in this section are, where relevant,
adjusted for “annualisation” and bias. Further details on adjustments are provided in
Appendix C.
3.2.1 Nitrogen Dioxide (NO2)
Table A.3 in Appendix A compares the ratified and adjusted monitored NO2 annual
mean concentrations for the past 5 years with the air quality objective of 40µg/m3.
For diffusion tubes, the full 2016 dataset of monthly mean values is provided in the attached “tube results” document.
Table A.4 in Appendix A compares the ratified continuous monitored NO2 hourly mean
concentrations for the past 5 years with the air quality objective of 200µg/m3, not to be
exceeded more than 18 times per year.
In 2016 the Greater Manchester Air Quality Network (GMAQN) operated 17 NO2
chemiluminescence monitors. The annual mean NO2 results are provided in Table A.3
which details the results from 2012 to 2016 and Figure 3.1 and Figure 3.2 show the
trends.
The following stations were decommissioned during 2011/12:
Bolton College, Oldham West End, Stockport Shaw Heath in 2011
Wigan Leigh 2, Bury Roadside in 2012
The following sites were relocated in 2016:
Manchester South was relocated and named as Manchester Sharston
Greater Manchester Combined Authority
LAQM Annual Status Report 2016 14
The Bury roadside site was decommissioned by DEFRA as it did not meet EU site
criteria, and was relocated in 2014 to the A56. No sites were closed in 2013-2016. Bury
Radcliffe and Prestwich were re-commissioned in 2011. Bury Whitefield and Oldham
Crompton way were commissioned in 2015 and 2014 respectively
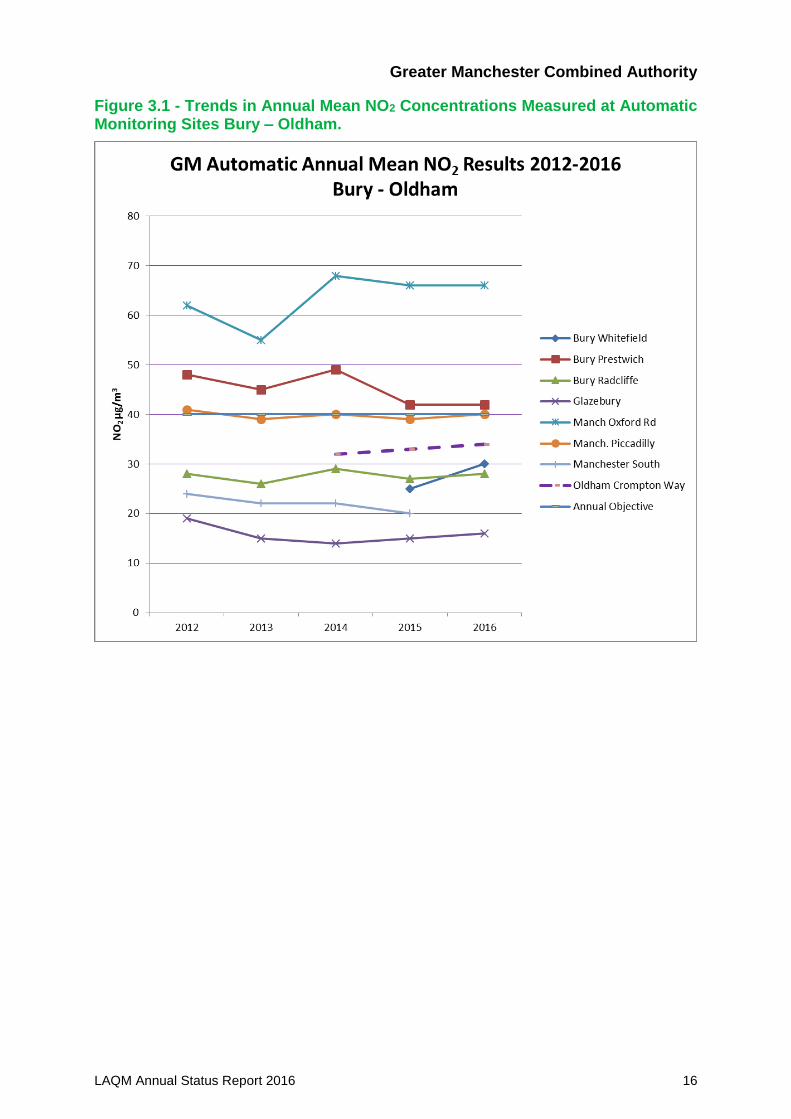
Figure 3.1 and Figure 3.2 show that two of the highest polluting sites have stabilised
over the last year, after showing slight reductions in 2015. Meanwhile, the Manchester
Piccadilly site has just breached the 40 μg/m3 threshold after falling below it last year,
bringing the total number of locations above the air quality objective in 2016 up to five,
all of which are in the AQMA. Manchester Oxford Road continued to record the highest
concentration at 66 μg/m3 (78.10% data capture). Oxford Road is one of the main
corridors from south Manchester into the city centre with two major Universities,
student accommodation and a teaching hospital making it one of the busiest commuter
routes in Europe with a high proportion of buses. There have also been a lot of
roadworks near the monitoring site to improve the network, which is believed to have
caused temorary congestion in the area. Tameside Mottram Moor is the second
highest site with 49μg/m3; compared to 2015 there has been a fall of 5 μg/m3 in the
roadside levels.
Eight other automatic sites are in the AQMA with concentrations ranging between 25
μg/m3 to 46μg/m3. For sites outside the AQMA, concentrations range from 16 μg/m3 to
22 μg/m3.
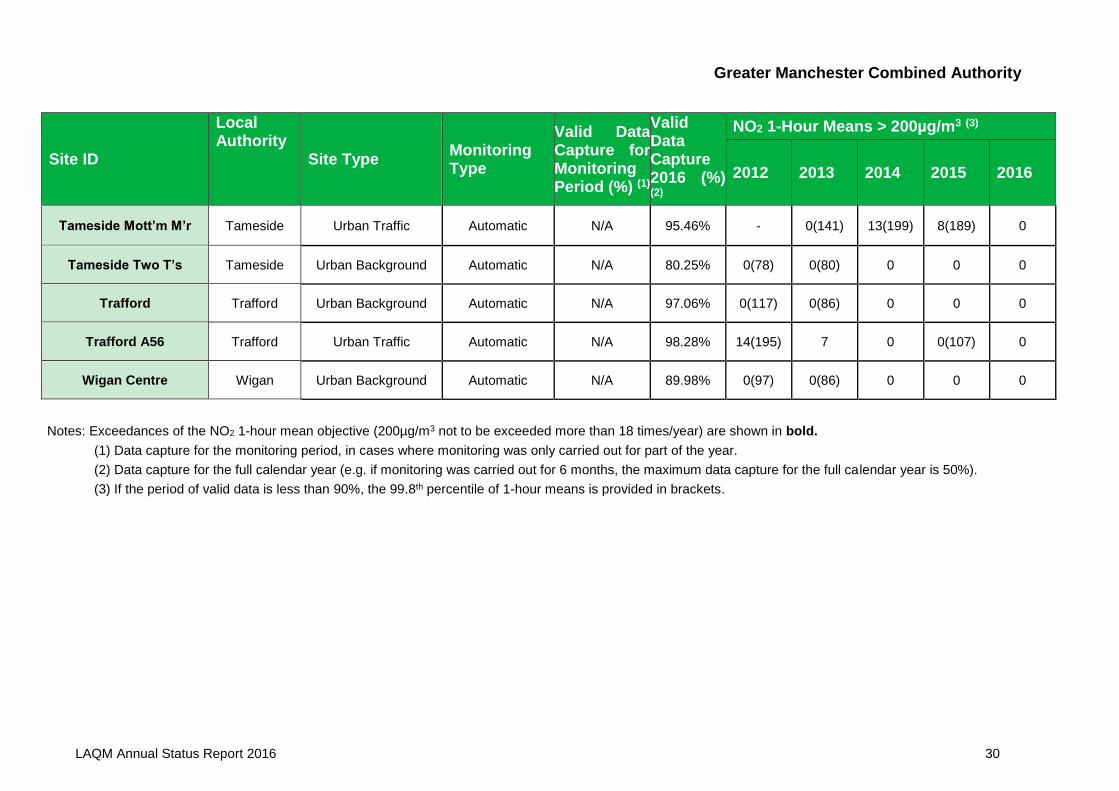
Table A.4 shows the number of hourly exceedences above 200 μg/m3 with 99.8
percentile in brackets for some years. The hourly air quality objective was exceeded
at one site (Manchester Oxford Road) with 90 exceedences.
The 99.8 percentile is a useful indicator to compare against the 200 μg/m3 for sites
with low data capture. If the 99.8 percentile is above 200 μg/m3, then the hourly
standard is likely to be exceeded. No sites have a 99.8 percentile above 200 μg/m3 in
2016 supporting the above finding that the hourly standard is only exceeded at one
site in Greater Manchester.
The investigation into the exceedence of Oxford Road concluded that the elevated
number of exceedances identified in 2015/16 was the result of an increase in buses
being stationary on Oxford Road adjacent to the monitoring site. This situation was the
result of significant roadworks and road closures in the city centre and Mancunian Way
during 2015/16, leading to additional buses being diverted past the monitoring site and
Greater Manchester Combined Authority
LAQM Annual Status Report 2016 15
queuing back from traffic lights further along Oxford Road towards the city centre. A
large proportion of the city centre diversions during 2015/16 were due to the Metrolink
works, which have extended the tram network across the city and wider Greater
Manchester area. This measure was one of the actions in the GM AQAP predicted to
improve air quality in the future.
During early 2017, TfGM implemented a £122m Bus Priority Package, which enables
cross-city bus services to run directly through Manchester city centre. Oxford Road
has had significant road layout alterations, and general traffic is now prohibited from
travelling through new ‘bus gates’ that restrict access between 6am and 9pm, 7 days
a-week.
As a result of the road layout changes, traffic flow has improved past the monitoring
site and the exceedances of the hourly objective have reduced; there were 4
occurrences in January 2017 (prior to the Bus Priority works), and no further
exceedances at the time of writing. Monitoring continues at this location, and a further
update will be provided in the ASR for 2017, but it has been determined that the
existing AQMA should not be amended to include exceedances of the hourly NO2
objective.
Measurements from the Greater Manchester’s diffusion tube network confirms there
are locations that continue to be above the annual mean NO2 air quality objective, but
there is an overall trend of declining concentrations at different site types(Figure 3.3).
Table 3.1 shows the number of tubes over the national objective of 40 μg/m3 in each
Local Authority.
Greater Manchester Combined Authority
LAQM Annual Status Report 2016 16
Figure 3.1 - Trends in Annual Mean NO2 Concentrations Measured at Automatic Monitoring Sites Bury – Oldham.
Greater Manchester Combined Authority
LAQM Annual Status Report 2016 17
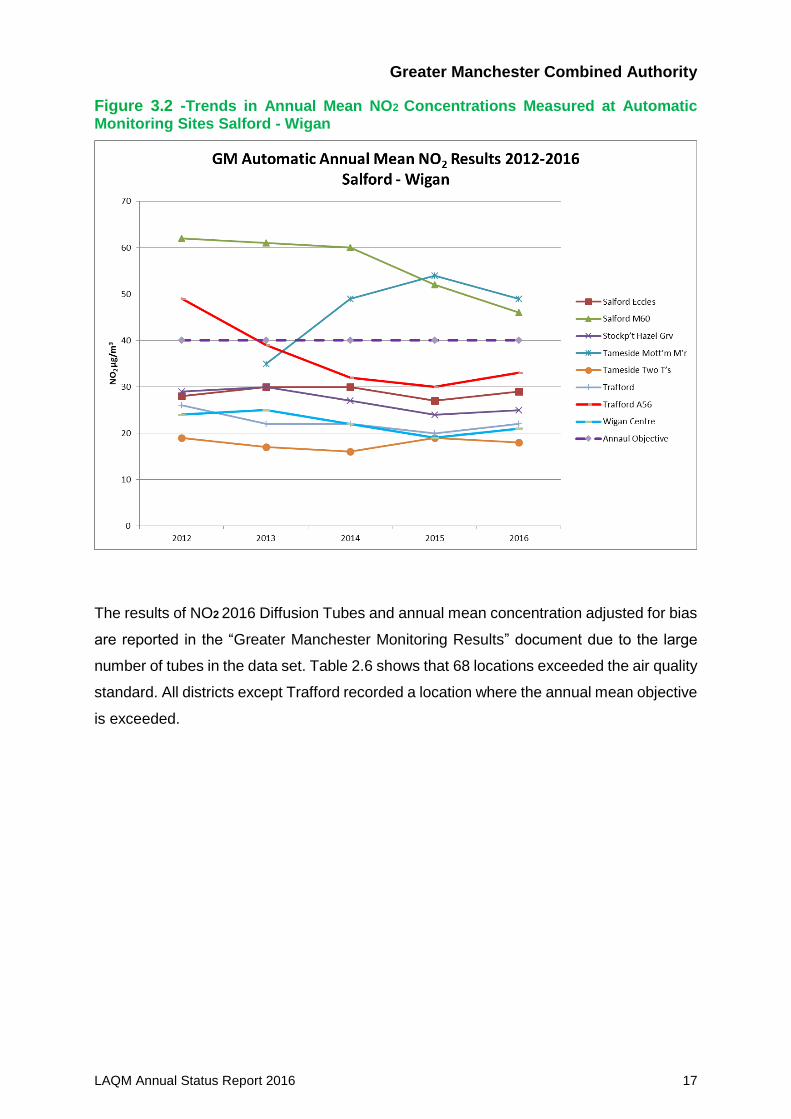
Figure 3.2 -Trends in Annual Mean NO2 Concentrations Measured at Automatic Monitoring Sites Salford - Wigan
The results of NO2 2016 Diffusion Tubes and annual mean concentration adjusted for bias
are reported in the “Greater Manchester Monitoring Results” document due to the large
number of tubes in the data set. Table 2.6 shows that 68 locations exceeded the air quality
standard. All districts except Trafford recorded a location where the annual mean objective
is exceeded.
Greater Manchester Combined Authority
LAQM Annual Status Report 2016 18
Figure 3.3 - Trends in Annual Mean NO2 Concentrations Measured at Diffusion Tube Monitoring Sites
Table 3.1 - Number of NO2 Diffusion Tubes over 40 μg/m3
Local Authority 2016
Bolton 7
Bury 1
Manchester 17
Oldham 1
Rochdale 5
Salford 7
Stockport 6
Tameside 14
Trafford 0
Wigan 4
Total 62
0
5
10
15
20
25
30
35
40
45
2012 2013 2014 2015 2016
NO
2(μg/m
3)
Year
GM Diffusion Tubes: Annual Mean by Site Type
Rural Suburban Urban Traffic Urban Background
Greater Manchester Combined Authority
LAQM Annual Status Report 2016 19
3.2.2 Particulate Matter (PM10)
Table A.5 in Appendix A compares the ratified and adjusted monitored PM10 annual
mean concentrations for the past 5 years with the air quality objective of 40µg/m3.
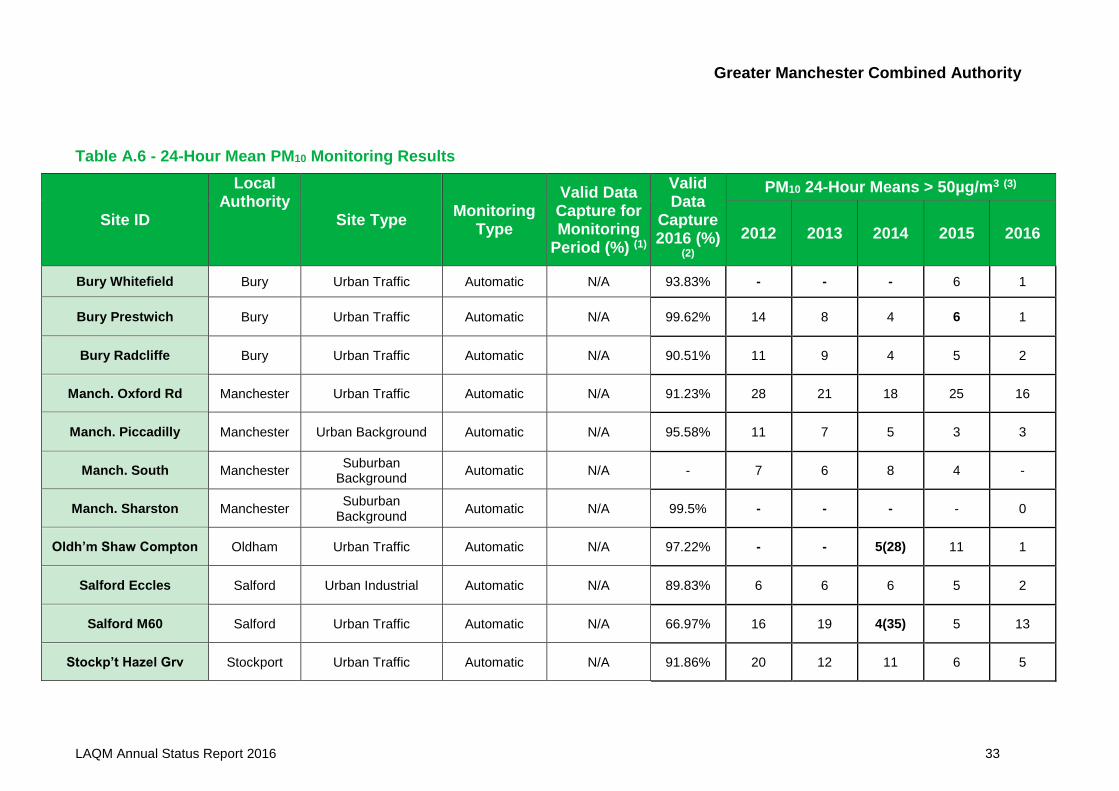
Table A.6 in Appendix A compares the ratified continuous monitored PM10 daily mean
concentrations for the past 5 years with the air quality objective of 50µg/m3, not to be
exceeded more than 35 times per year.
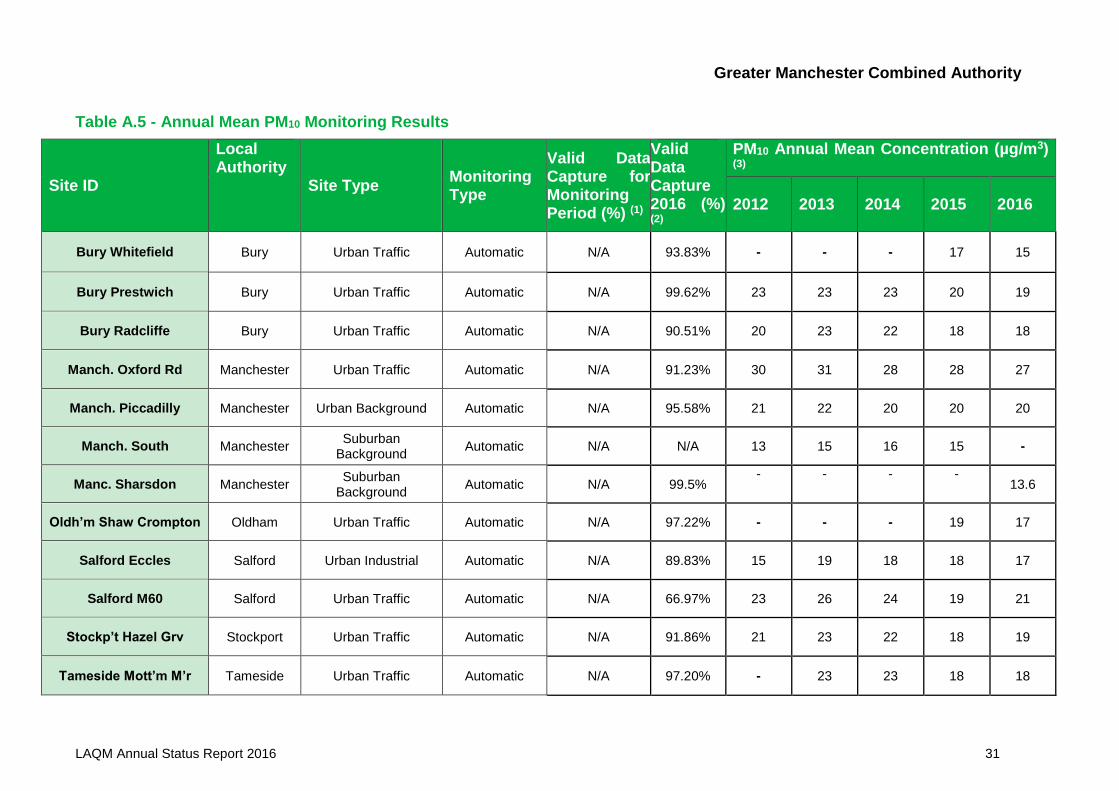
Table A.5 shows the annual mean PM10 for sites in Greater Manchester is well below
the objective level, and as can be seen in Figure 3.4 and Figure 3.5. Reductions in
concentrations have stabilised compared with last year’s sharper reductions, and in
some cases a small increase is evident. There are no sites that exceed the annual
mean air quality objective.
As expected concentrations at Urban Traffic sites remain higher than other sites in the
network. The highest annual mean concentration recorded was 27 μg/m3 at an Urban
Traffic location, compared with 13μg/m3 at the site with the lowest annual
meanconcentration.
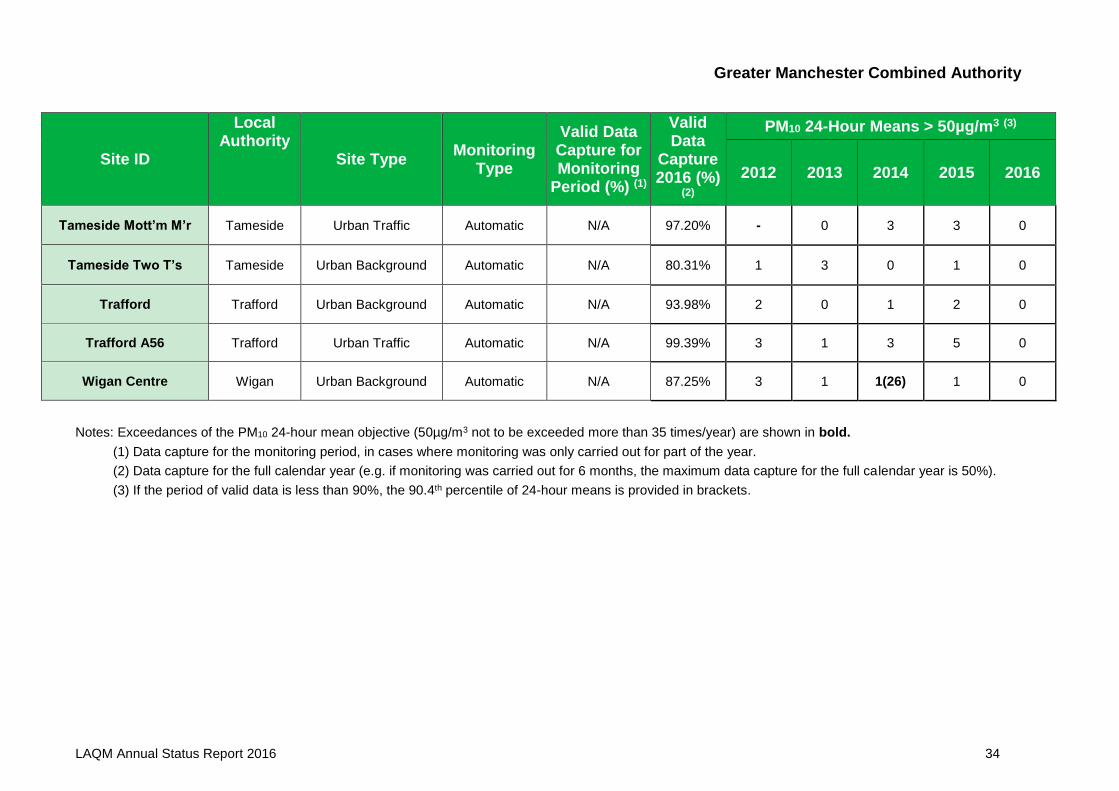
Table A.6 summaries the results for the PM10 daily mean air quality objective; no site
exceeded this objective.
Greater Manchester Combined Authority
LAQM Annual Status Report 2016 20
Figure 3.4- Trends in Annual Mean PM10 Concentrations Measured at Automatic Monitoring Sites – Bury - Oldham
Greater Manchester Combined Authority
LAQM Annual Status Report 2016 21
Figure 3.5 - Trends in Annual Mean PM10 Concentrations Measured at Automatic Monitoring Sites – Salford - Wigan
Greater Manchester Combined Authority
LAQM Annual Status Report 2016 22
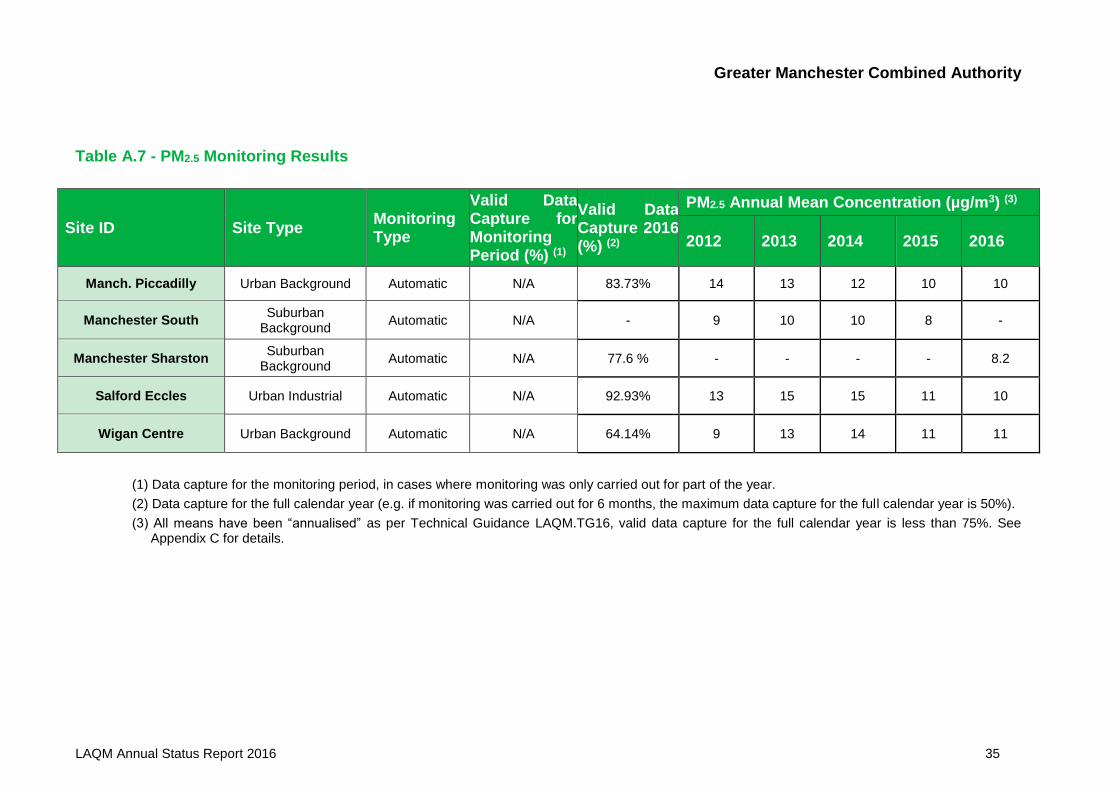
3.2.3 Particulate Matter (PM2.5)
Table A.7 in Appendix A presents the ratified and adjusted monitored PM2.5 annual
mean concentrations for the past 5 years.
PM2.5 is monitored at 4 sites in Greater Manchester. All these sites had been seeing a
signficant downward trend since 2014, before leveling out or minimally increasing over
2016. (Figure 3.6)
Figure 3.6 - Trends in Annual Mean PM2.5Concentrations Measured at Automatic Monitoring Sites
Greater Manchester Combined Authority
LAQM Annual Status Report 2016 23
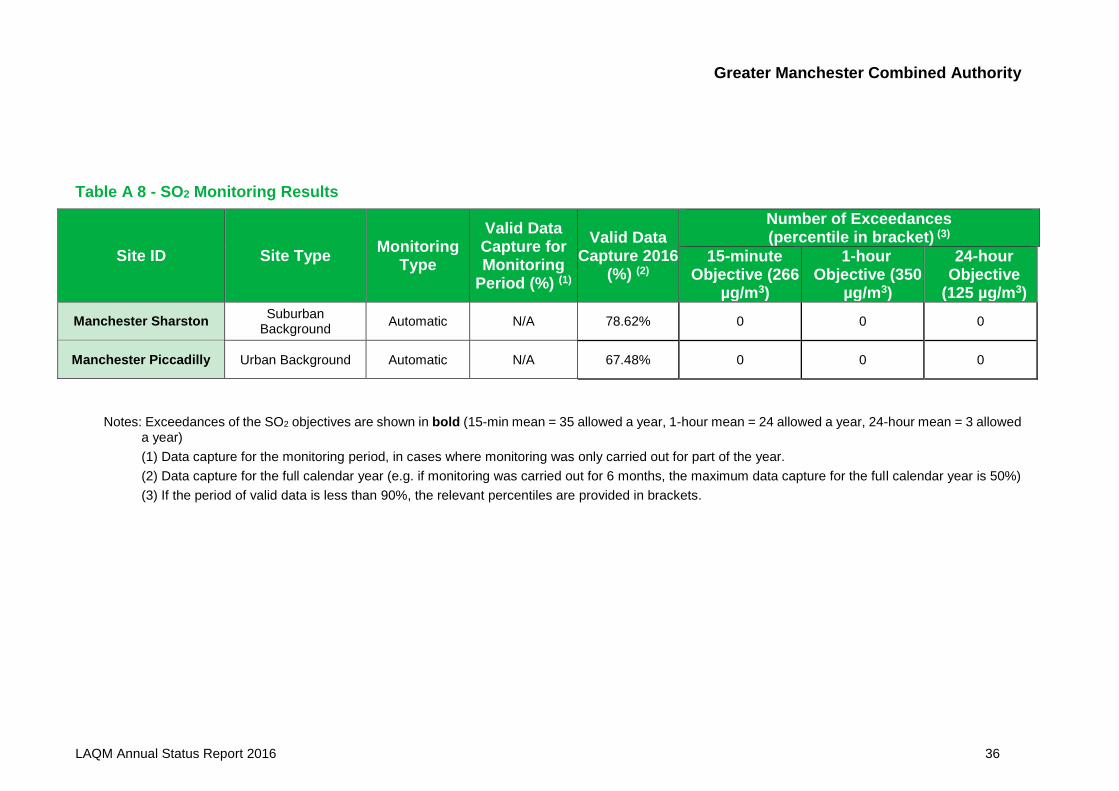
3.2.4 Sulphur Dioxide (SO2)
Table A.8 in Appendix A compares the ratified continuous monitored SO2
concentrations for year 2016 with the air quality objectives for SO2.
SO2 is monitored at 2 sites in Greater Manchester (Manchester Piccadilly and
Manchester Sharston). Neither of these sites exceeded any of the SO2 objectives.
Greater Manchester Combined Authority
LAQM Annual Status Report 2016 24
Appendix A: Monitoring Results
Table A.1 - Details of Automatic Monitoring Sites
Site ID Site Name Site Type X OS Grid Ref
Y OS Grid Ref
Pollutants Monitored
In AQMA?
Monitoring Technique
Distance to Relevant Exposure
(m) (1)
Distance to kerb of nearest road (m)
(2)
Inlet Height
(m)
BURY Bury
Whitefield Urban Traffic 380637 406974 NO2 PM10 Y
Chemiluminescent & TEOM
24 7 3.5
BUR2 Bury
Prestwich Urban Traffic 381650 403222 NO2 PM10 Y
Chemiluminescent & TEOM
15 2.5 1.5
BUR1 Bury Radcliffe Urban Traffic 378190 407480 NO2 PM10 Y Chemiluminescent &
TEOM 10 2.5 1.5
GLAZ Glazebury Rural
Background 368759 396028 NO2 O3 N
Chemiluminescent & UV absorption
127 137 3
MAN1 Manchester Oxford Rd
Urban Traffic 384233 397287 NO2 PM10 Y Chemiluminescent &
TEOM 1 1 2
MAN3 Manchester Piccadilly
Urban Background
384310 398337 NO2 O3 PM10
PM2.5 SO2 Y
Chemiluminescent & TEOM
2 30 4
MAN8 Manchester
South Suburban
Background 383904 385818
NO2 O3 SO2 PM10 PM2.5
N Chemiluminescent &
TEOM 30 15 2
MAHG Manchester
Sharston Suburban
Background 384179 386086
NO2 O3 SO2 PM10 PM2.5
N Chemiluminescent,
Photometric, Fluorescent & Partisol
35 6 2.7
CW Oldham
Crompton Way
Urban Traffic 393887 409191 NO2 PM10 Y Chemiluminescent &
TEOM 10 1 1.5
Greater Manchester Combined Authority
LAQM Annual Status Report 2016 25
Site ID Site Name Site Type X OS Grid Ref
Y OS Grid Ref
Pollutants Monitored
In AQMA?
Monitoring Technique
Distance to Relevant Exposure
(m) (1)
Distance to kerb of nearest road (m)
(2)
Inlet Height
(m)
ECCL Salford Eccles Urban
Industrial 377926 398728
NO2 PM10 PM2.5
Y Chemiluminescent &
TEOM/ FDMS 7 5 3.5
M60 Salford M60 Urban Traffic 374810 400855 NO2 O3 PM10 Y Chemiluminescent &
UV absorption & BAM 85 20 3
STK5 Stockport Hazel Grv
Urban Traffic 391481 387637 NO2 PM10 Y Chemiluminescent &
TEOM 33 4 2
TAM1 Tameside
Mottram M’r Urban Traffic 399719 395804 NO2 PM10 Y
Chemiluminescent & TEOM
4 5 4
TAME Tameside Two
Trees Sch Urban
Background 393454 394330 NO2 O3 PM10 N
Chemiluminescent & TEOM
0 53 3
TRAF Trafford Urban
Background 378783 394726
NO2 PM10 SO2
N Chemiluminescent &
TEOM 60 98 2.5
TRF2 Trafford A56 Urban Traffic 379413 394014 NO2 PM10 Y Chemiluminescent &
TEOM 40 2 2.5
WIG5 Wigan Centre Urban
Background 357816 406024
NO2 O3 PM10, PM2.5
N Chemiluminescent &
TEOM 0 175 2.5
(1) 0m if the monitoring site is at a location of exposure (e.g. installed on the façade of a residential property).
(2) N/A if not applicable.
Greater Manchester Combined Authority
LAQM Annual Status Report 2016 26
Table A.2 - Details of Non-Automatic Monitoring Sites
The full list of the 254 non-automatic monitoring sites is detailed in the attached “GM Monitoring Results 2016” file.
Greater Manchester Combined Authority
LAQM Annual Status Report 2016 27
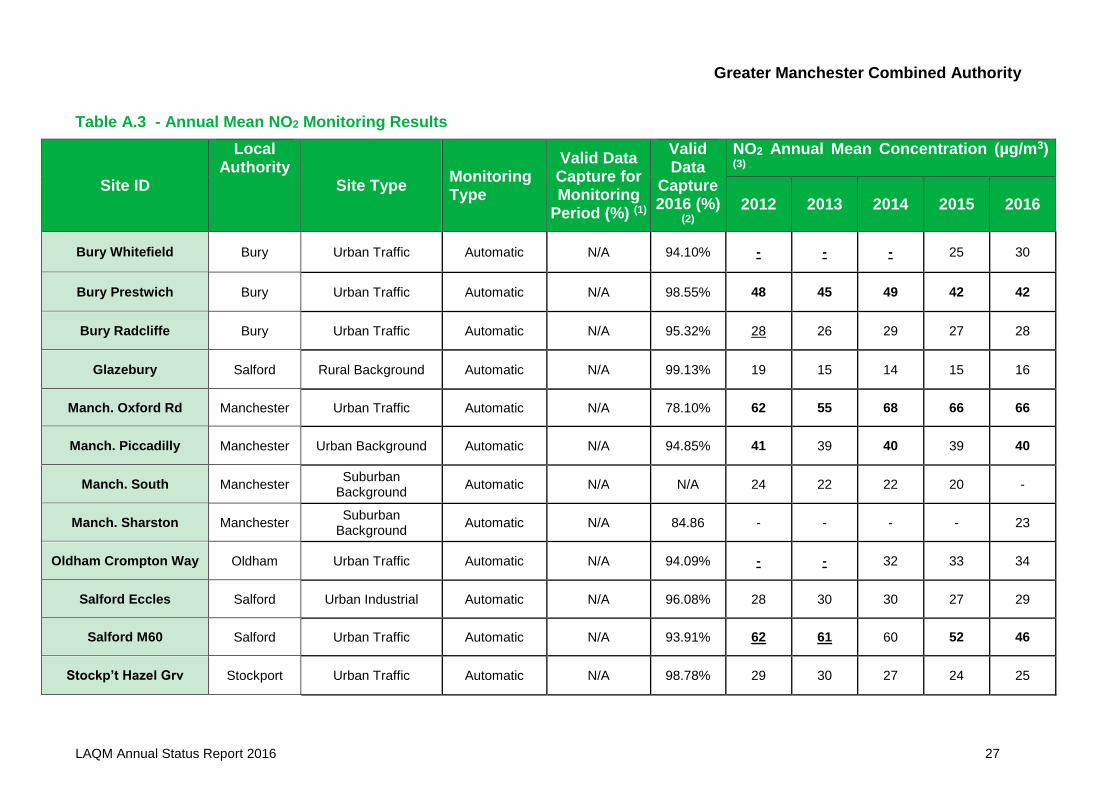
Table A.3 - Annual Mean NO2 Monitoring Results
Site ID
Local Authority
Site Type Monitoring Type
Valid Data Capture for Monitoring
Period (%) (1)
Valid Data
Capture 2016 (%)
(2)
NO2 Annual Mean Concentration (µg/m3) (3)
2012 2013 2014 2015 2016
Bury Whitefield Bury Urban Traffic Automatic N/A 94.10% - - - 25 30
Bury Prestwich Bury Urban Traffic Automatic N/A 98.55% 48 45 49 42 42
Bury Radcliffe Bury Urban Traffic Automatic N/A 95.32% 28 26 29 27 28
Glazebury Salford Rural Background Automatic N/A 99.13% 19 15 14 15 16
Manch. Oxford Rd Manchester Urban Traffic Automatic N/A 78.10% 62 55 68 66 66
Manch. Piccadilly Manchester Urban Background Automatic N/A 94.85% 41 39 40 39 40
Manch. South Manchester Suburban
Background Automatic N/A N/A 24 22 22 20 -
Manch. Sharston Manchester Suburban
Background Automatic N/A 84.86 - - - - 23
Oldham Crompton Way Oldham Urban Traffic Automatic N/A 94.09% - - 32 33 34
Salford Eccles Salford Urban Industrial Automatic N/A 96.08% 28 30 30 27 29
Salford M60 Salford Urban Traffic Automatic N/A 93.91% 62 61 60 52 46
Stockp’t Hazel Grv Stockport Urban Traffic Automatic N/A 98.78% 29 30 27 24 25
Greater Manchester Combined Authority
LAQM Annual Status Report 2016 28
Site ID
Local Authority
Site Type Monitoring Type
Valid Data Capture for Monitoring
Period (%) (1)
Valid Data
Capture 2016 (%)
(2)
NO2 Annual Mean Concentration (µg/m3) (3)
2012 2013 2014 2015 2016
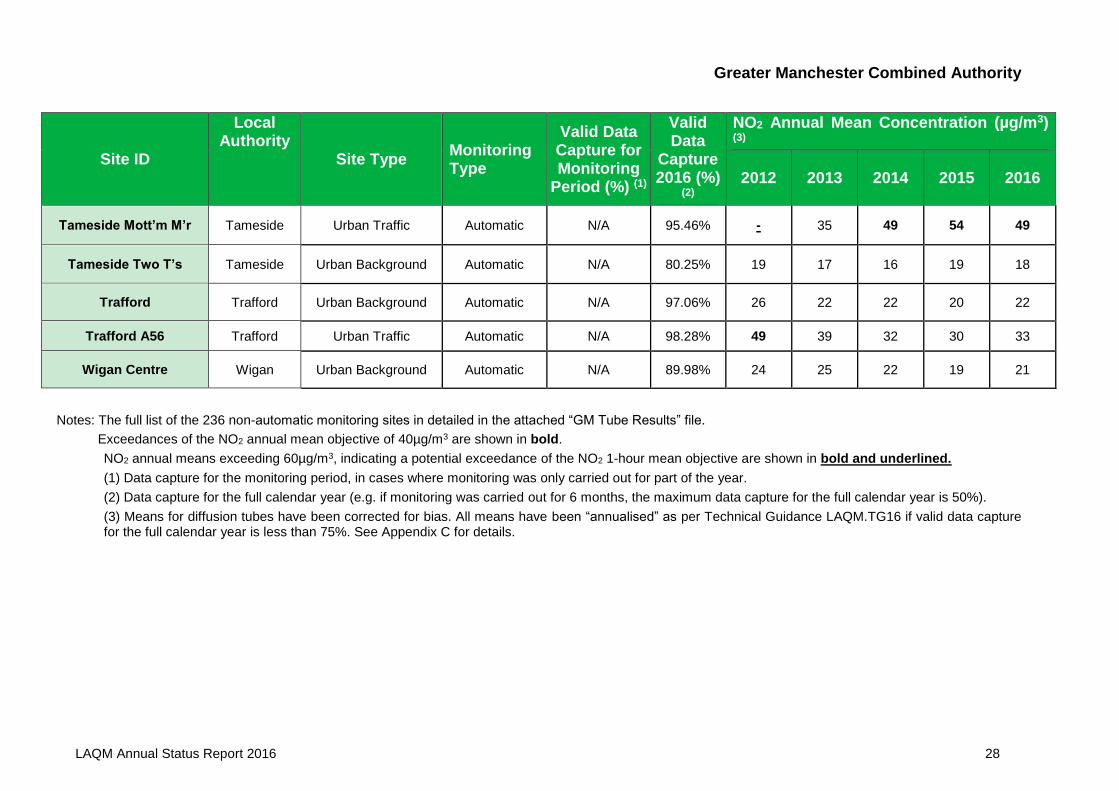
Tameside Mott’m M’r Tameside Urban Traffic Automatic N/A 95.46% - 35 49 54 49
Tameside Two T’s Tameside Urban Background Automatic N/A 80.25% 19 17 16 19 18
Trafford Trafford Urban Background Automatic N/A 97.06% 26 22 22 20 22
Trafford A56 Trafford Urban Traffic Automatic N/A 98.28% 49 39 32 30 33
Wigan Centre Wigan Urban Background Automatic N/A 89.98% 24 25 22 19 21
Notes: The full list of the 236 non-automatic monitoring sites in detailed in the attached “GM Tube Results” file.
Exceedances of the NO2 annual mean objective of 40µg/m3 are shown in bold.
NO2 annual means exceeding 60µg/m3, indicating a potential exceedance of the NO2 1-hour mean objective are shown in bold and underlined.
(1) Data capture for the monitoring period, in cases where monitoring was only carried out for part of the year.
(2) Data capture for the full calendar year (e.g. if monitoring was carried out for 6 months, the maximum data capture for the full calendar year is 50%).
(3) Means for diffusion tubes have been corrected for bias. All means have been “annualised” as per Technical Guidance LAQM.TG16 if valid data capture for the full calendar year is less than 75%. See Appendix C for details.
Greater Manchester Combined Authority
LAQM Annual Status Report 2016 29
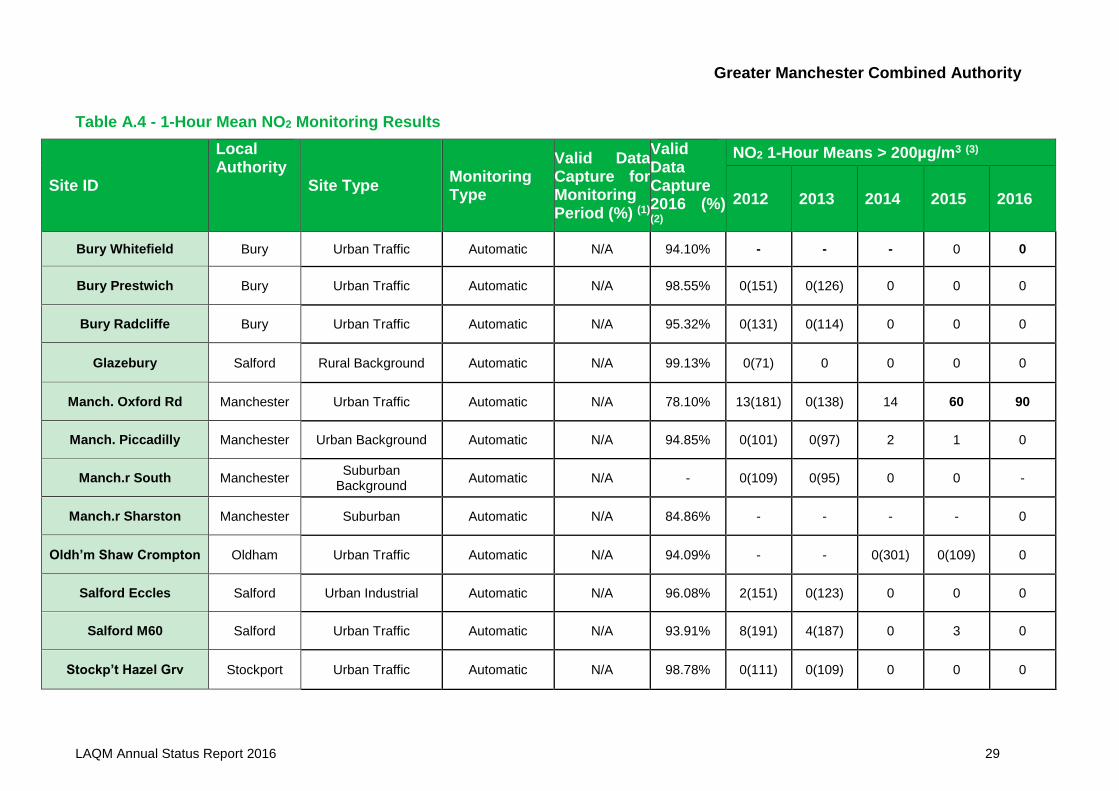
Table A.4 - 1-Hour Mean NO2 Monitoring Results
Site ID
Local Authority
Site Type Monitoring Type
Valid Data Capture for Monitoring Period (%) (1)
Valid Data Capture 2016 (%) (2)
NO2 1-Hour Means > 200µg/m3 (3)
2012 2013 2014 2015 2016
Bury Whitefield Bury Urban Traffic Automatic N/A 94.10% - - - 0 0
Bury Prestwich Bury Urban Traffic Automatic N/A 98.55% 0(151) 0(126) 0 0 0
Bury Radcliffe Bury Urban Traffic Automatic N/A 95.32% 0(131) 0(114) 0 0 0
Glazebury Salford Rural Background Automatic N/A 99.13% 0(71) 0 0 0 0
Manch. Oxford Rd Manchester Urban Traffic Automatic N/A 78.10% 13(181) 0(138) 14 60 90
Manch. Piccadilly Manchester Urban Background Automatic N/A 94.85% 0(101) 0(97) 2 1 0
Manch.r South Manchester Suburban
Background Automatic N/A - 0(109) 0(95) 0 0 -
Manch.r Sharston Manchester Suburban Automatic N/A 84.86% - - - - 0
Oldh’m Shaw Crompton Oldham Urban Traffic Automatic N/A 94.09% - - 0(301) 0(109) 0
Salford Eccles Salford Urban Industrial Automatic N/A 96.08% 2(151) 0(123) 0 0 0
Salford M60 Salford Urban Traffic Automatic N/A 93.91% 8(191) 4(187) 0 3 0
Stockp’t Hazel Grv Stockport Urban Traffic Automatic N/A 98.78% 0(111) 0(109) 0 0 0
Greater Manchester Combined Authority
LAQM Annual Status Report 2016 30
Site ID
Local Authority
Site Type Monitoring Type
Valid Data Capture for Monitoring Period (%) (1)
Valid Data Capture 2016 (%) (2)
NO2 1-Hour Means > 200µg/m3 (3)
2012 2013 2014 2015 2016
Tameside Mott’m M’r Tameside Urban Traffic Automatic N/A 95.46% - 0(141) 13(199) 8(189) 0
Tameside Two T’s Tameside Urban Background Automatic N/A 80.25% 0(78) 0(80) 0 0 0
Trafford Trafford Urban Background Automatic N/A 97.06% 0(117) 0(86) 0 0 0
Trafford A56 Trafford Urban Traffic Automatic N/A 98.28% 14(195) 7 0 0(107) 0
Wigan Centre Wigan Urban Background Automatic N/A 89.98% 0(97) 0(86) 0 0 0
Notes: Exceedances of the NO2 1-hour mean objective (200µg/m3 not to be exceeded more than 18 times/year) are shown in bold.
(1) Data capture for the monitoring period, in cases where monitoring was only carried out for part of the year.
(2) Data capture for the full calendar year (e.g. if monitoring was carried out for 6 months, the maximum data capture for the full calendar year is 50%).
(3) If the period of valid data is less than 90%, the 99.8th percentile of 1-hour means is provided in brackets.
Greater Manchester Combined Authority
LAQM Annual Status Report 2016 31
Table A.5 - Annual Mean PM10 Monitoring Results
Site ID
Local Authority
Site Type Monitoring Type
Valid Data Capture for Monitoring Period (%) (1)
Valid Data Capture 2016 (%) (2)
PM10 Annual Mean Concentration (µg/m3) (3)
2012 2013 2014 2015 2016
Bury Whitefield Bury Urban Traffic Automatic N/A 93.83% - - - 17 15
Bury Prestwich Bury Urban Traffic Automatic N/A 99.62% 23 23 23 20 19
Bury Radcliffe Bury Urban Traffic Automatic N/A 90.51% 20 23 22 18 18
Manch. Oxford Rd Manchester Urban Traffic Automatic N/A 91.23% 30 31 28 28 27
Manch. Piccadilly Manchester Urban Background Automatic N/A 95.58% 21 22 20 20 20
Manch. South Manchester Suburban
Background Automatic N/A N/A 13 15 16 15 -
Manc. Sharsdon Manchester Suburban
Background Automatic N/A 99.5%
- - - - 13.6
Oldh’m Shaw Crompton Oldham Urban Traffic Automatic N/A 97.22% - - - 19 17
Salford Eccles Salford Urban Industrial Automatic N/A 89.83% 15 19 18 18 17
Salford M60 Salford Urban Traffic Automatic N/A 66.97% 23 26 24 19 21
Stockp’t Hazel Grv Stockport Urban Traffic Automatic N/A 91.86% 21 23 22 18 19
Tameside Mott’m M’r Tameside Urban Traffic Automatic N/A 97.20% - 23 23 18 18
Greater Manchester Combined Authority
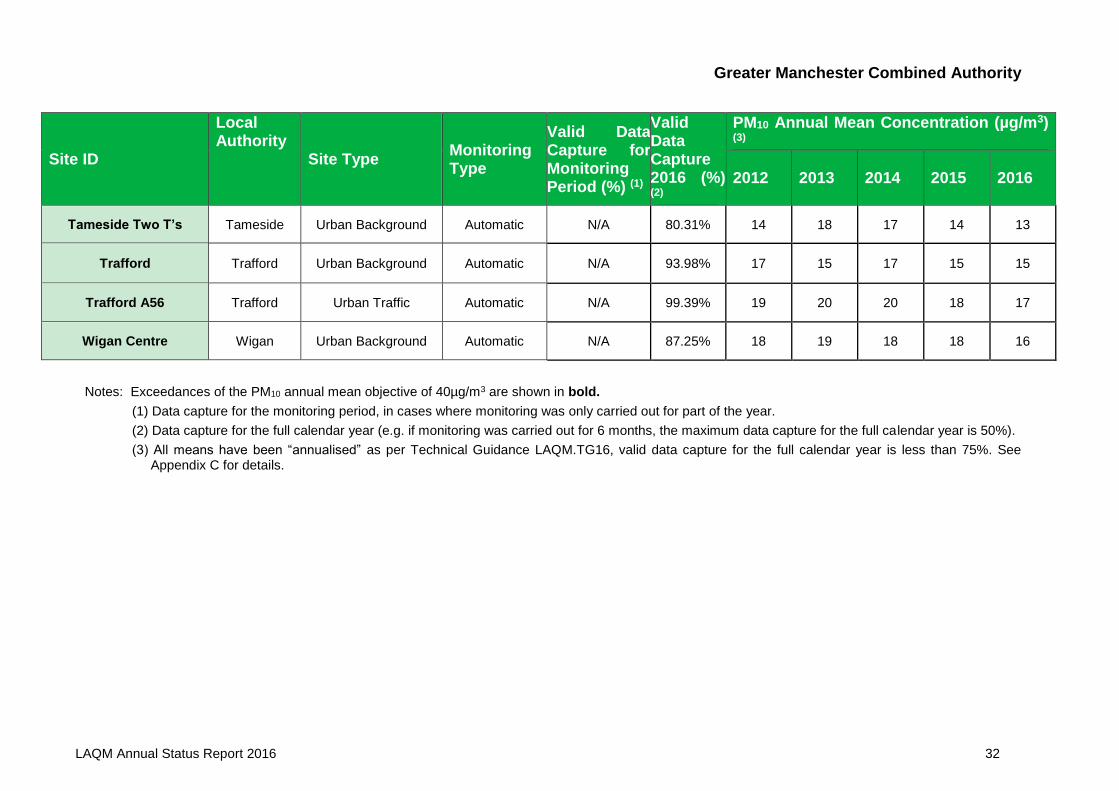
LAQM Annual Status Report 2016 32
Site ID
Local Authority
Site Type Monitoring Type
Valid Data Capture for Monitoring Period (%) (1)
Valid Data Capture 2016 (%) (2)
PM10 Annual Mean Concentration (µg/m3) (3)
2012 2013 2014 2015 2016
Tameside Two T’s Tameside Urban Background Automatic N/A 80.31% 14 18 17 14 13
Trafford Trafford Urban Background Automatic N/A 93.98% 17 15 17 15 15
Trafford A56 Trafford Urban Traffic Automatic N/A 99.39% 19 20 20 18 17
Wigan Centre Wigan Urban Background Automatic N/A 87.25% 18 19 18 18 16
Notes: Exceedances of the PM10 annual mean objective of 40µg/m3 are shown in bold.
(1) Data capture for the monitoring period, in cases where monitoring was only carried out for part of the year.
(2) Data capture for the full calendar year (e.g. if monitoring was carried out for 6 months, the maximum data capture for the full calendar year is 50%).
(3) All means have been “annualised” as per Technical Guidance LAQM.TG16, valid data capture for the full calendar year is less than 75%. See Appendix C for details.
Greater Manchester Combined Authority
LAQM Annual Status Report 2016 33
Table A.6 - 24-Hour Mean PM10 Monitoring Results
Site ID
Local Authority
Site Type Monitoring
Type
Valid Data Capture for Monitoring
Period (%) (1)
Valid Data
Capture 2016 (%)
(2)
PM10 24-Hour Means > 50µg/m3 (3)
2012 2013 2014 2015 2016
Bury Whitefield Bury Urban Traffic Automatic N/A 93.83% - - - 6 1
Bury Prestwich Bury Urban Traffic Automatic N/A 99.62% 14 8 4 6 1
Bury Radcliffe Bury Urban Traffic Automatic N/A 90.51% 11 9 4 5 2
Manch. Oxford Rd Manchester Urban Traffic Automatic N/A 91.23% 28 21 18 25 16
Manch. Piccadilly Manchester Urban Background Automatic N/A 95.58% 11 7 5 3 3
Manch. South Manchester Suburban
Background Automatic N/A - 7 6 8 4 -
Manch. Sharston Manchester Suburban
Background Automatic N/A 99.5% - - - - 0
Oldh’m Shaw Compton Oldham Urban Traffic Automatic N/A 97.22% - - 5(28) 11 1
Salford Eccles Salford Urban Industrial Automatic N/A 89.83% 6 6 6 5 2
Salford M60 Salford Urban Traffic Automatic N/A 66.97% 16 19 4(35) 5 13
Stockp’t Hazel Grv Stockport Urban Traffic Automatic N/A 91.86% 20 12 11 6 5
Greater Manchester Combined Authority
LAQM Annual Status Report 2016 34
Site ID
Local Authority
Site Type Monitoring
Type
Valid Data Capture for Monitoring
Period (%) (1)
Valid Data
Capture 2016 (%)
(2)
PM10 24-Hour Means > 50µg/m3 (3)
2012 2013 2014 2015 2016
Tameside Mott’m M’r Tameside Urban Traffic Automatic N/A 97.20% - 0 3 3 0
Tameside Two T’s Tameside Urban Background Automatic N/A 80.31% 1 3 0 1 0
Trafford Trafford Urban Background Automatic N/A 93.98% 2 0 1 2 0
Trafford A56 Trafford Urban Traffic Automatic N/A 99.39% 3 1 3 5 0
Wigan Centre Wigan Urban Background Automatic N/A 87.25% 3 1 1(26) 1 0
Notes: Exceedances of the PM10 24-hour mean objective (50µg/m3 not to be exceeded more than 35 times/year) are shown in bold.
(1) Data capture for the monitoring period, in cases where monitoring was only carried out for part of the year.
(2) Data capture for the full calendar year (e.g. if monitoring was carried out for 6 months, the maximum data capture for the full calendar year is 50%).
(3) If the period of valid data is less than 90%, the 90.4th percentile of 24-hour means is provided in brackets.
Greater Manchester Combined Authority
LAQM Annual Status Report 2016 35
Table A.7 - PM2.5 Monitoring Results
Site ID Site Type Monitoring Type
Valid Data Capture for Monitoring Period (%) (1)
Valid Data Capture 2016 (%) (2)
PM2.5 Annual Mean Concentration (µg/m3) (3)
2012 2013 2014 2015 2016
Manch. Piccadilly Urban Background Automatic N/A 83.73% 14 13 12 10 10
Manchester South Suburban
Background Automatic N/A - 9 10 10 8 -
Manchester Sharston Suburban
Background Automatic N/A 77.6 % - - - - 8.2
Salford Eccles Urban Industrial Automatic N/A 92.93% 13 15 15 11 10
Wigan Centre Urban Background Automatic N/A 64.14% 9 13 14 11 11
(1) Data capture for the monitoring period, in cases where monitoring was only carried out for part of the year.
(2) Data capture for the full calendar year (e.g. if monitoring was carried out for 6 months, the maximum data capture for the full calendar year is 50%).
(3) All means have been “annualised” as per Technical Guidance LAQM.TG16, valid data capture for the full calendar year is less than 75%. See Appendix C for details.
Greater Manchester Combined Authority
LAQM Annual Status Report 2016 36
Table A 8 - SO2 Monitoring Results
Site ID Site Type Monitoring
Type
Valid Data Capture for Monitoring
Period (%) (1)
Valid Data Capture 2016
(%) (2)
Number of Exceedances (percentile in bracket) (3)
15-minute Objective (266
µg/m3)
1-hour Objective (350
µg/m3)
24-hour Objective
(125 µg/m3)
Manchester Sharston Suburban
Background Automatic N/A 78.62% 0 0 0
Manchester Piccadilly Urban Background Automatic N/A 67.48% 0 0 0
Notes: Exceedances of the SO2 objectives are shown in bold (15-min mean = 35 allowed a year, 1-hour mean = 24 allowed a year, 24-hour mean = 3 allowed a year)
(1) Data capture for the monitoring period, in cases where monitoring was only carried out for part of the year.
(2) Data capture for the full calendar year (e.g. if monitoring was carried out for 6 months, the maximum data capture for the full calendar year is 50%)
(3) If the period of valid data is less than 90%, the relevant percentiles are provided in brackets.
Greater Manchester Combined Authority
LAQM Annual Status Report 2016 37
Appendix B: Full Monthly Diffusion Tube Results for 2016
Table B.1 - NO2 Monthly Diffusion Tube Results – 2016
The full list of the 254 non-automatic monitoring sites is detailed in the attached “GM Monitoring Results 2016” file, due to the large
number of tubes in the data set.
(1) See Appendix C for details on bias adjustment
Greater Manchester Combined Authority
LAQM Annual Status Report 2016 38
Appendix C: Supporting Technical Information / Air Quality Monitoring Data QA/QC
Each of the 10 Greater Manchester authorities committed to undertaking a detailed air
quality review and assessment in relation to road traffic. The detailed assessment was
completed in September 2015 for the base year 2014, and confirmed that a new AQMA
should be declared. It was decided to declare a single AQMA for the whole of Greater
Manchester. The dispersion modelling report was submitted alongside this. The report
describes using the Greater Manchester emissions dispersion model, referred to as
GMEDIS, to produce emissions concentrations for a 2016 model year. The work was
undertaken on behalf of the Greater Manchester Public Protection Partnership
(GMPPP) and was funded by grants from Defra and the ten Greater Manchester local
authorities. The model results will be used to support the work of the GMPPP and the
GM local authorities in the discharge of their air quality duties under the Environment
Act 1995. This report describes the modelling methodology to map the concentrations
of NO2 and particulates in Greater Manchester area. The model covers the entire of
Greater Manchester with an area of approximately 1275 km2.
Screening assessments of identified new or changed sources of pollution based on
DMRB, industrial nomograms, biomass tools, etc. have been undertaken and have
resulted in no changes to monitoring.
Diffusion Tube Bias Adjustment Factors
The tubes are prepared and analysed by Staffordshire Scientific Services using the
20% triethanolamine (TEA) in water method. The laboratory method is UKAS
accredited. Results from the quality control schemes published on the LAQM website
give the laboratory a good precision rating.
NO2 diffusion tubes are affected by several factors, which may cause them to have
bias (over-read), or negative bias (under-read) relative to the reference technique. To
compare with the AQS objectives it’s important that tubes are corrected (adjusted) by
comparing with a chemiluminescent analyser reference method for NO2.
A bias factor is calculated using a spread sheet provided by Ricardo Energy &
Environment. Bias factors are collated in a national database enabling a large number
of factors at a range of different site locations using the same laboratory and analysis
Greater Manchester Combined Authority
LAQM Annual Status Report 2016 39
method. There is a choice of using a locally derived bias factor based on local data or
using the national dataset.
The bias adjustment factor used for 2016 is 0.91
Automatic NO2 Analysers
Automatic air quality analysers in Greater Manchester area are subject to a high level
of quality assurance/ quality control. All analysers are either operated as part of the
national Automatic Urban and Rural Network (AURN) or are part of the 'Calibration
Club' scheme run by Ricardo-AEA.
The procedures are equivalent to the UK Automatic Urban and Rural Network (AURN)
the main features of the services being:-
Calibration Club
• Data screened daily for errors and final data ratified and published to same
standard as AURN sites.
• Data checked daily for errors and faults reported to Local Site operators.
• Independent audits twice per year.
• Final data set scaled and ratified to same standard as AURN.
Greater Manchester Air Quality Network (GMAQN)
Ricardo-AEA manages QA/QC and audit of the air quality stations to the same
standard as the AURN. The GMAQN officially started on 1 September 2013. Table
A1.7 list the Greater Manchester sites and their respective affiliation to the national
network or the GMAQN.
Particulate Monitoring
A number of different instruments are used in Greater Manchester for the
measurement of particles. Historically TEOM have been used, but DEFRA y replaced
a number of instruments with TEOM FDMS and some sites use the BAM or Partisol.
Greater Manchester Combined Authority
LAQM Annual Status Report 2016 40
The reference method for the UK PM10 Objectives (and EU limit values) is based upon
measurements from a gravimetric sampler. This samples over a 24 hour period and
the particulate proportion less than 10 microns (PM10) is measured by the mass
difference before and after exposure. It is labour intensive and the UK, and European
Counties have invested heavily in the TEOM (Tapered Element Oscillating
Microbalance). The TEOM measurements have been historically adjusted by a factor
of 1.3 to make them gravimetric equivalent. However to further improve the technique;
the measurement was modified by lowering the sampling temperature from 50 C to 30
C and adding a dryer to remove water vapour. This system is referred to a Filter
Dynamics Measurement System (FDMS) and is equivalent to the EU reference
method.
Due to widespread use of the TEOM, and its reliability and the need to report to the
EU using an ‘equivalent method’, The Volatile Correction Model (VCM) was developed
by Kings College London, to adjust the TEOM data. Studies have shown that FDMS
sites within 200 kilometres can be used to correct the TEOM data as it assumes that
the sample lost by the heating is the same over this geographical area. Sufficient
FDMS sites have only been available since 20088/9 for the correction to be applied.
Greater Manchester Combined Authority
LAQM Annual Status Report 2016 41
Appendix D: Map(s) of Monitoring Locations All monitoring locations are detailed at: GM Monitoring Locations.
Greater Manchester Combined Authority
LAQM Annual Status Report 2016 42
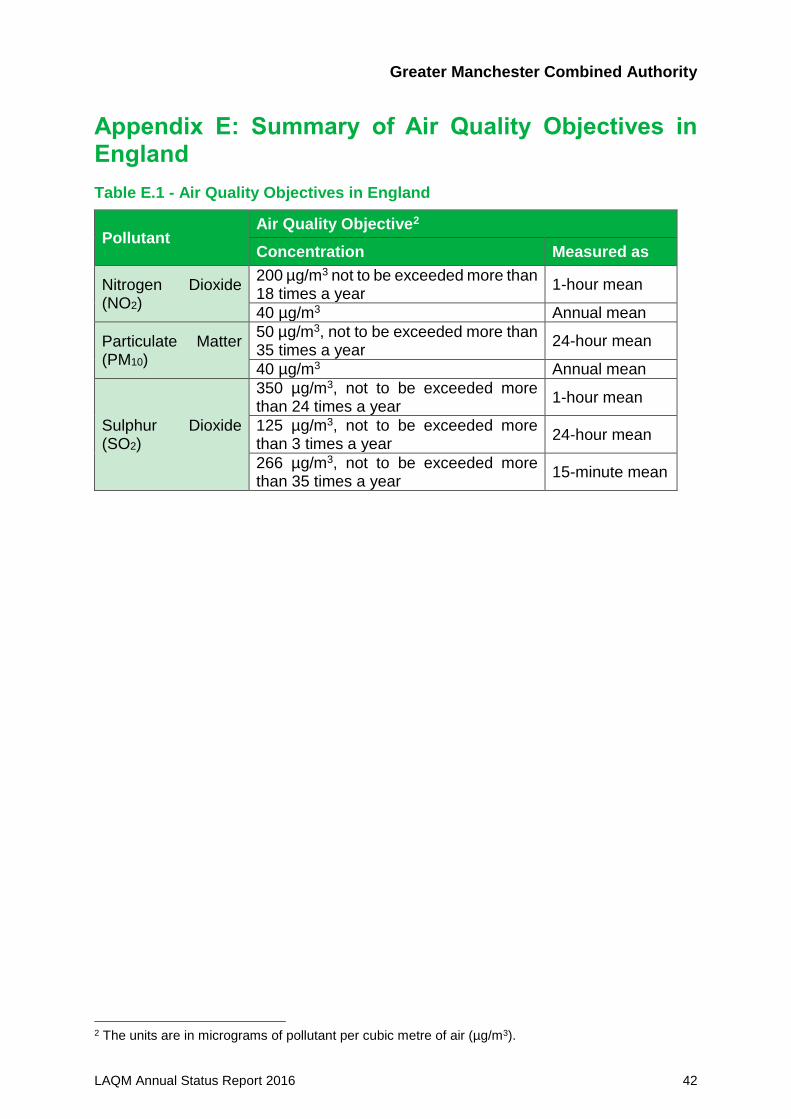
Appendix E: Summary of Air Quality Objectives in England
Table E.1 - Air Quality Objectives in England
Pollutant Air Quality Objective2
Concentration Measured as
Nitrogen Dioxide (NO2)
200 µg/m3 not to be exceeded more than 18 times a year
1-hour mean
40 µg/m3 Annual mean
Particulate Matter (PM10)
50 µg/m3, not to be exceeded more than 35 times a year
24-hour mean
40 µg/m3 Annual mean
Sulphur Dioxide (SO2)
350 µg/m3, not to be exceeded more than 24 times a year
1-hour mean
125 µg/m3, not to be exceeded more than 3 times a year
24-hour mean
266 µg/m3, not to be exceeded more than 35 times a year
15-minute mean
2 The units are in micrograms of pollutant per cubic metre of air (µg/m3).
Greater Manchester Combined Authority
LAQM Annual Status Report 2016 43
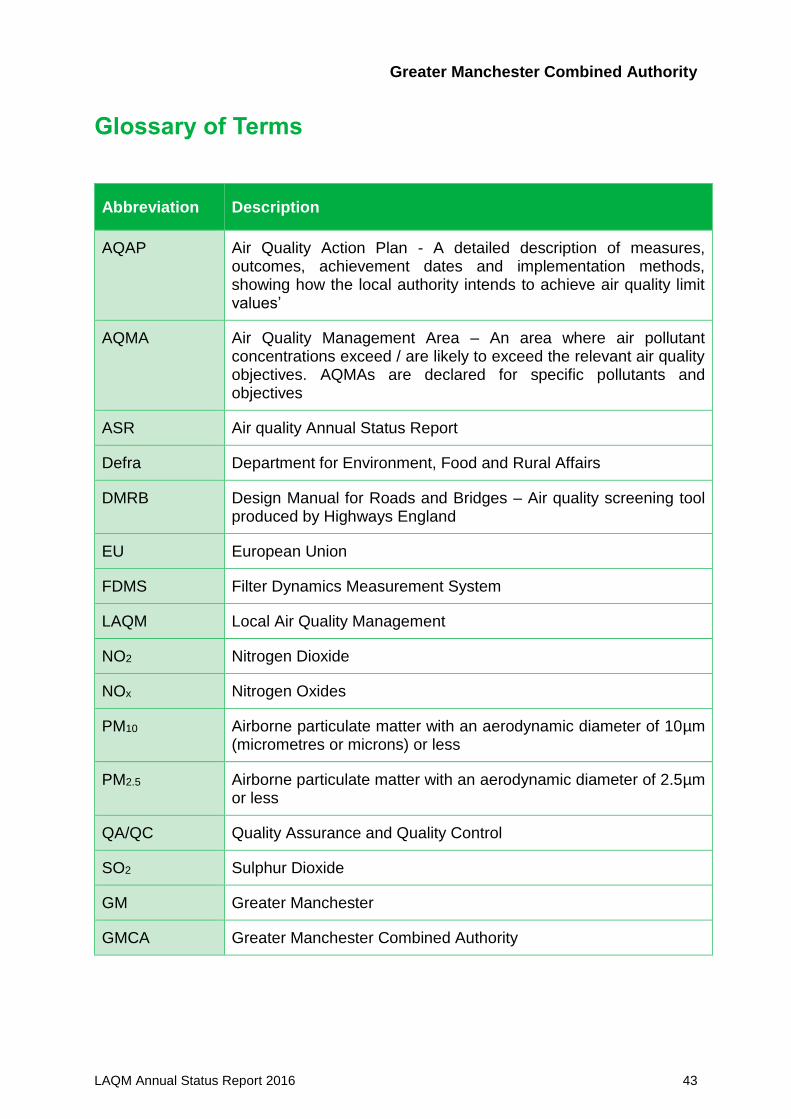
Glossary of Terms
Abbreviation Description
AQAP Air Quality Action Plan - A detailed description of measures, outcomes, achievement dates and implementation methods, showing how the local authority intends to achieve air quality limit values’
AQMA Air Quality Management Area – An area where air pollutant concentrations exceed / are likely to exceed the relevant air quality objectives. AQMAs are declared for specific pollutants and objectives
ASR Air quality Annual Status Report
Defra Department for Environment, Food and Rural Affairs
DMRB Design Manual for Roads and Bridges – Air quality screening tool produced by Highways England
EU European Union
FDMS Filter Dynamics Measurement System
LAQM Local Air Quality Management
NO2 Nitrogen Dioxide
NOx Nitrogen Oxides
PM10 Airborne particulate matter with an aerodynamic diameter of 10µm (micrometres or microns) or less
PM2.5 Airborne particulate matter with an aerodynamic diameter of 2.5µm or less
QA/QC Quality Assurance and Quality Control
SO2 Sulphur Dioxide
GM Greater Manchester
GMCA Greater Manchester Combined Authority
Greater Manchester Combined Authority
LAQM Annual Status Report 2016 44
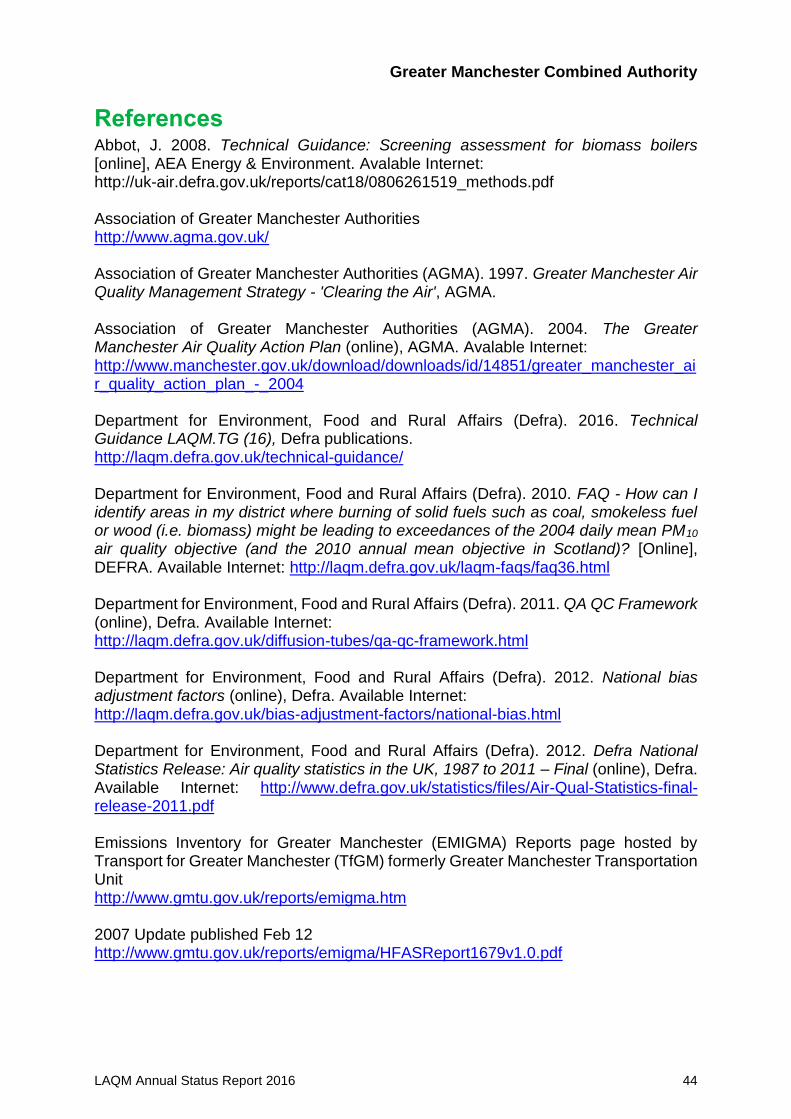
References Abbot, J. 2008. Technical Guidance: Screening assessment for biomass boilers [online], AEA Energy & Environment. Avalable Internet: http://uk-air.defra.gov.uk/reports/cat18/0806261519_methods.pdf Association of Greater Manchester Authorities http://www.agma.gov.uk/ Association of Greater Manchester Authorities (AGMA). 1997. Greater Manchester Air Quality Management Strategy - 'Clearing the Air', AGMA. Association of Greater Manchester Authorities (AGMA). 2004. The Greater Manchester Air Quality Action Plan (online), AGMA. Avalable Internet: http://www.manchester.gov.uk/download/downloads/id/14851/greater_manchester_air_quality_action_plan_-_2004 Department for Environment, Food and Rural Affairs (Defra). 2016. Technical Guidance LAQM.TG (16), Defra publications. http://laqm.defra.gov.uk/technical-guidance/ Department for Environment, Food and Rural Affairs (Defra). 2010. FAQ - How can I identify areas in my district where burning of solid fuels such as coal, smokeless fuel or wood (i.e. biomass) might be leading to exceedances of the 2004 daily mean PM10 air quality objective (and the 2010 annual mean objective in Scotland)? [Online], DEFRA. Available Internet: http://laqm.defra.gov.uk/laqm-faqs/faq36.html Department for Environment, Food and Rural Affairs (Defra). 2011. QA QC Framework (online), Defra. Available Internet: http://laqm.defra.gov.uk/diffusion-tubes/qa-qc-framework.html Department for Environment, Food and Rural Affairs (Defra). 2012. National bias adjustment factors (online), Defra. Available Internet: http://laqm.defra.gov.uk/bias-adjustment-factors/national-bias.html Department for Environment, Food and Rural Affairs (Defra). 2012. Defra National Statistics Release: Air quality statistics in the UK, 1987 to 2011 – Final (online), Defra. Available Internet: http://www.defra.gov.uk/statistics/files/Air-Qual-Statistics-final-release-2011.pdf Emissions Inventory for Greater Manchester (EMIGMA) Reports page hosted by Transport for Greater Manchester (TfGM) formerly Greater Manchester Transportation Unit http://www.gmtu.gov.uk/reports/emigma.htm 2007 Update published Feb 12 http://www.gmtu.gov.uk/reports/emigma/HFASReport1679v1.0.pdf
Greater Manchester Combined Authority
LAQM Annual Status Report 2016 45
2008 Update published March 2013 http://www.gmtu.gov.uk/reports/emigma/HFASReport1692v1.0.pdf 2010 Update published May 2014 http://www.gmtu.gov.uk/reports/emigma/HFASReport1750v1.0.pdf Greater Manchester Air Quality Action Plan (2004) http://www.manchester.gov.uk/download/downloads/id/14851/greater_manchester_air_quality_action_plan_-_2004 Greater Manchester Combined Authority and Transport for Greater Manchester. 2011. Greater Manchester’s third Local Transport Plan 2011/12 – 2015/16 (online), Transport for Greater Manchester. Available Internet: http://www.tfgm.com/ltp3/ Local Transport Plan (LTP) http://www.tfgm.com/ltp3/Pages/Local-Transport-Plan.aspx Local_ transport_Plan_Core_Strategy.pdf http://www.tfgm.com/ltp3/documents/Greater_Manchester_Local_ Local transport_Plan_Core_Strategy.pdf Local Transport Plan (Ltp3) Air Quality Strategy http://www.tfgm.com/journey_planning/LTP3/Documents/Air-Quality-Strategy-and-Action-Plan.pdf Manchester Strategy 2013-2020 Stronger Together http://www.agma.gov.uk/gmca/gms_2013/index.html Low Carbon Benefits to the Economy http://europeanclimate.org/wp-content/uploads/2014/06/EY_ECF_Macro-economic-impacts-of-the-low-carbon-transition_Report_2014-06-05.pdf http://laqm.defra.gov.uk/laqm-faqs/faq36.html http://laqm.defra.gov.uk/diffusion-tubes/qa-qc-framework.html
http://laqm.defra.gov.uk/bias-adjustment-factors/national-bias.html
The Air Quality Strategy for England, Scotland, Wales and Northern Ireland, Defra. The Air Quality (England) (Amendment) Regulations, 2002, Statutory Instrument 3043 (2002), HMSO. Defra (2007) The Air Quality Regulations, 2000, Statutory Instrument 928 (2000), HMSO, London