Embed Size (px)
Citation preview
Wakefield Metropolitan District Council
LAQM Annual Status Report 2020
2020 Air Quality Annual Status Report (ASR) In fulfilment of Part IV of the Environment Act 1995 Local Air Quality Management July 2020
Wakefield Metropolitan District Council
LAQM Annual Status Report 2020
Local Authority Officer
Roger Newman, Environmental Protection Officer
Gerard McCormack, Environmental Protection Team Leader
Department Environment and Streetscene
Address Wakefield One, Burton Street, Wakefield, WF1 2EB
Telephone 03458 506506
E-mail [email protected] [email protected]
Report Reference number
Wakefield ASR 2020
Date July 2020
Wakefield Metropolitan District Council
LAQM Annual Status Report 2020 i
Executive Summary: Air Quality in Our Area
Air Quality in the Wakefield District
Air pollution is associated with a number of adverse health impacts. It is recognised as
a contributing factor in the onset of heart disease and cancer. Additionally, air pollution
particularly affects the most vulnerable in society: children and older people, and those
with heart and lung conditions. There is also often a strong correlation with equalities
issues, because areas with poor air quality are also often the less affluent areas1,2.
The annual health cost to society of the impacts of particulate matter alone in the UK
is estimated to be around £16 billion3.
The main air quality issue in the Wakefield district is the level of Nitrogen Dioxide (NO2)
near to the busiest roads, in town and city centres and other localised hot-spots for
example where people live near busy road junctions. Ten Air Quality Management
Areas (AQMAs) have been declared in the Wakefield District under the Environment
Act 1995 which introduced the requirement on local authorities to review and assess
air quality within their district. AQMAs have been declared in some parts of the
Wakefield district where measured concentrations of NO2 have exceeded the annual
mean Air Quality Objective Level (AQOL) of 40µgm3 as set out in the Air Quality
(England) Regulations 2010 (as amended). In each case where an AQMA has been
declared, local road traffic has been the primary source of the air pollution. The
AQMAs in the district and the date of declaration are shown below:
M1 Motorway (2004) Pontefract Town Centre (2007)
M62 Motorway (2006) Knottingley Town Centre (2007)
A1 Trunk Road (2004) Featherstone Junction (2007)
Wakefield City (2006) Ackworth – Barnsley Road (2010)
Castleford Town Centre (2007) Hemsworth – Cross Hills (2013)
1 Environmental equity, air quality, socioeconomic status and respiratory health, 2010 2 Air quality and social deprivation in the UK: an environmental inequalities analysis, 2006 3 Defra. Abatement cost guidance for valuing changes in air quality, May 2013
Wakefield Metropolitan District Council
LAQM Annual Status Report 2020 ii
Air quality monitoring results over the last ten years show an overall downward
(improving) trend in the concentration of Nitrogen Dioxide in all the AQMAs with
significant improvements in results at monitoring locations throughout the district.
However, results in some monitoring locations have plateaued over the last two to
three years.
The annual mean concentration level of NO2 remains below the AQOL in nine of the
ten AQMA’s with only the exception being the Wakefield City AQMA where the level
was exceeded at 2 of the 12 monitoring locations within the AQMA – Site ID 9-R
(Doncaster Road) and 65-R (Northgate), with results showing a further point, site ID 1-
R (Leeds Road) to be on the limit of the AQOL at 40 µg/m3.
The M1, M62 and A1 AQMAs are major trunk roads under the control of Highways
England and therefore the local authority has little control of the traffic using these
roads. However, each of the major routes has been the subject of significant road
improvements and traffic management schemes, such as the implementation of the
Smart Motorway on the M1 (J39 – 42) and M62 (J25 – 30) and junction improvements,
such as the M62 / A1 interchange. Air quality monitoring has shown improvements
within these trunk road AQMAs, such that the AQOL was being achieved in all three
AQMAs up to the end of 2019. These AQMAs will be assessed for revocation in 2020.
Road infrastructure changes within the Wakefield City AQMA are being proposed at
Newton Bar and later on Ings Road where potential traffic pinch points are predicted
as a result of further development in the area together with Wakefield Eastern Relief
Road (WERR) traffic and the ‘Emerald Ring’ inner ring road developments.
The Pontefract AQMA has shown improving air quality across all but one of the
associated monitoring locations despite a significant increase in the housing stock.
A ‘Feasibility study’ has been completed to examine the viability of a South Eastern
link road that would by-pass Featherstone and Ackworth and link to the North of
Pontefract thereby relieving congestion in all three towns and ,ultimately, improving
local air quality further. Construction is not expected on this project until 2022 at the
earliest but these AQMAs will be assessed for revocation prior to that based on current
measured levels of NO2.
Despite improving monitoring results within the Castleford AQMA the approval of the
Aire River Growth Corridor Masterplan which includes major housing, retail and leisure
Wakefield Metropolitan District Council
LAQM Annual Status Report 2020 iii
development will have a potential significant impact on the local air quality and
therefore passive and continuous monitoring will continue in order to assess the impact
of the Masterplan.
Local authorities are required to consider coarse fraction particulate matter (PM10) as
part of their Local Air Quality Management duties and, as with NO2, declare an Air
Quality Management Area and prepare Air Quality Action Plans where the AQOL of
40µgm-3 (annual mean) is being exceeded. Although no monitoring of PM10 was
undertaken during 2015, the previous four years of monitoring (2011 to 2014) showed
results ranging from 20 to 25µgm-3. Continued lowering of results from that point until
2018 was reversed where the result showed an increase from the value in 2017 (an
increase from 14µgm3 to 19µgm3) which was due to major regeneration roadworks
(Kirkgate Highway Regeneration) close to the monitoring station. The annual mean for
2019, following completion of the roadworks showed a drop in PM10 towards previous
levels.
In 2016 a new requirement was introduced for local authorities to work towards
reducing air pollution from fine particulate matter (PM2.5), although no requirement was
placed on local authorities to monitor this as part of their local air quality management
functions. To help provide local information on PM2.5 levels, in addition to the data
from the national monitoring and modelling carried out by DEFRA, a PM2.5 monitor was
introduced in December 2015 at the CM3 - Park Street, Wakefield continuous air
quality monitoring station. The result for 2018 showed an increase in PM10
concentration (9µgm3 to 12µgm3), closely linked to the cause of the PM10 increase but
remaining well below the Target Value of 25µg/m3. As for the PM10 result for 2019, the
PM2.5 level declined slightly in 2019 following the conclusion of the Kirkgate roadworks.
Further monitoring of PM2.5 concentrations is proposed by the trial and deployment of
“low-cost” real time air quality sensors.
It is well established that PM2.5 exposure can have a significant impact on human health
including premature mortality and the Public Health Outcomes Framework (PHOF)
uses this parameter as an indicator of the fraction of mortality attributable to particulate
air pollution. Although levels of particulate matter (PM10 and PM2.5) are within AQOLs
it is recognised that there is no safe lower threshold for exposure and therefore action
Wakefield Metropolitan District Council
LAQM Annual Status Report 2020 iv
to reduce particulate emissions will benefit public health. The most recent PHOF
indicator4 (2017) shows a significant reduction from the previous (2015).
Particulate emissions come from human-made sources, natural sources and
secondary formation in the atmosphere.
Human-made sources include road traffic (particularly diesel exhaust emissions and
wear and tear on brakes, tyres etc.), bonfires and other combustion processes (coal,
wood, biomass, oil burning etc.), industrial sources and other sources such as
construction sites and mineral extraction processes. The use of solid fuel (coal) as a
fuel source has significantly reduced across all domestic and commercial premises
through the introduction of Smoke Control Orders, which control smoke emissions from
chimneys across the whole of the Wakefield district.
Natural sources include sea salt, and secondary formation results from a chemical
reaction in the atmosphere between other, gaseous, pollutants such as Sulphur dioxide
(SO2) and oxides of nitrogen. The release of these precursors is controlled locally
under the Environmental Permitting Regulations 2016.
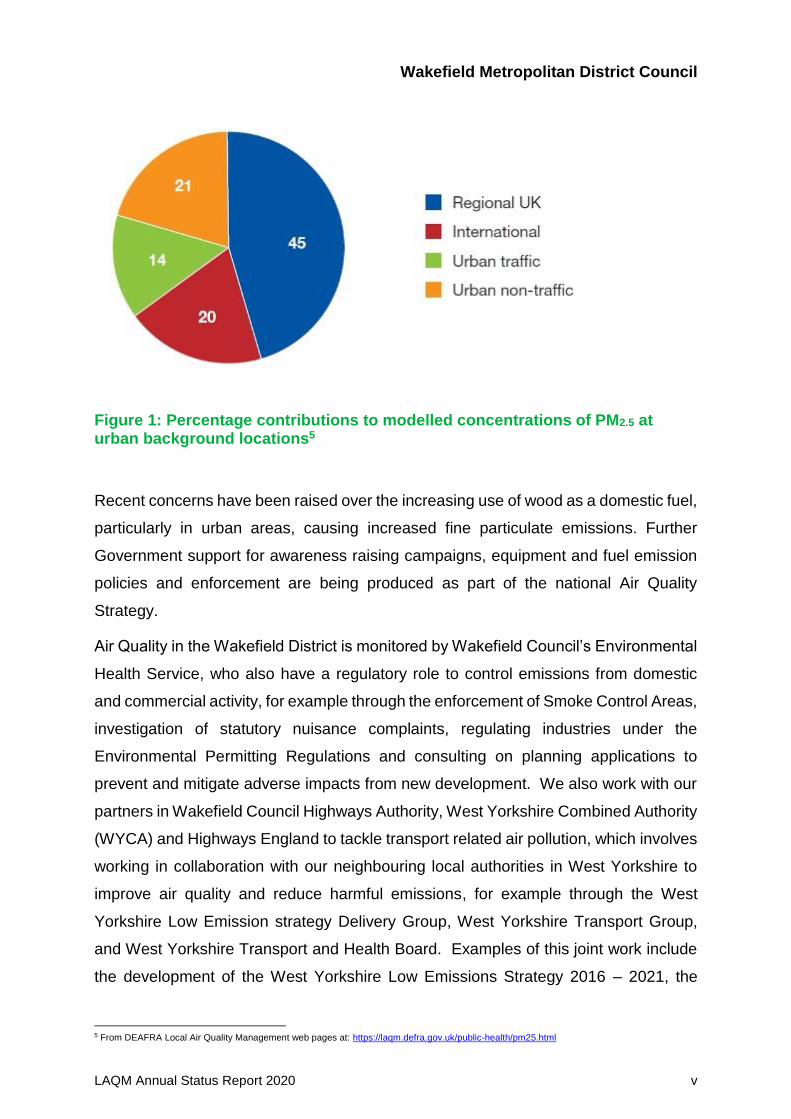
However, local sources of PM2.5 account for only approximately 35% of the total
concentration in the atmosphere as, illustrated in Figure 1, below. Therefore, while
measures to reduce emissions of PM2.5 may have some impact in urban areas, where
concentrations would be expected to be higher, rural areas will not see the same
benefit from these measures.
4 PHOF Indicator 3.01 - Deaths attributable to particulate air pollution
Wakefield Metropolitan District Council
LAQM Annual Status Report 2020 v
Figure 1: Percentage contributions to modelled concentrations of PM2.5 at urban background locations5
Recent concerns have been raised over the increasing use of wood as a domestic fuel,
particularly in urban areas, causing increased fine particulate emissions. Further
Government support for awareness raising campaigns, equipment and fuel emission
policies and enforcement are being produced as part of the national Air Quality
Strategy.
Air Quality in the Wakefield District is monitored by Wakefield Council’s Environmental
Health Service, who also have a regulatory role to control emissions from domestic
and commercial activity, for example through the enforcement of Smoke Control Areas,
investigation of statutory nuisance complaints, regulating industries under the
Environmental Permitting Regulations and consulting on planning applications to
prevent and mitigate adverse impacts from new development. We also work with our
partners in Wakefield Council Highways Authority, West Yorkshire Combined Authority
(WYCA) and Highways England to tackle transport related air pollution, which involves
working in collaboration with our neighbouring local authorities in West Yorkshire to
improve air quality and reduce harmful emissions, for example through the West
Yorkshire Low Emission strategy Delivery Group, West Yorkshire Transport Group,
and West Yorkshire Transport and Health Board. Examples of this joint work include
the development of the West Yorkshire Low Emissions Strategy 2016 – 2021, the
5 From DEAFRA Local Air Quality Management web pages at: https://laqm.defra.gov.uk/public-health/pm25.html
Wakefield Metropolitan District Council
LAQM Annual Status Report 2020 vi
development of a West Yorkshire Electric Vehicle Strategy and the submission of joint
funding bids, such as OLEV grants including the Go Ultra-low City Scheme, ULEV Taxi
Scheme and Clean Vehicle Technology Fund.
Actions to Improve Air Quality
Many of the broad measures in the current Air Quality Action Plan have been
implemented or are at a well-developed stage of contributing to improving air quality
and include:
Establish an Implementation Plan for progression of the West Yorkshire Low
Emissions Strategy.
Road Improvements:
Wakefield - Eastern Relief Road (WERR), (Started in 2015 and opened
in April 2017).
Castleford - Glasshoughton Southern Link Road (starting in 2017 and
opening in July 2020).
Newton Bar Roundabout improvement (planning stage middle 2019).
South Featherstone Link Road Feasibility Study (planning process late
2019, construction not expected until 2022).
Air quality and emissions reduction through the planning process, including a
review of the West Yorkshire Air Quality and Emissions Planning Guidance,
started in Spring 2020.
ULEV Taxi Scheme
Minimum EURO standards and age of vehicle restrictions for taxis within Wakefield –introduced in March 2018 with two-year implementation period.
New Contract for Wakefield City Bus operations incorporating minimum Euro VI
emission standard – commenced April 2018
Retrofit of emission abatement technology on buses through the Clean Bus Technology fund.
WYCA is working in tandem with the West Yorkshire Authorities to delivery around 88
rapid or fast EV charge points at strategic locations across West Yorkshire following a
£1.9m Government funding programme. 13 Charging points have been commissioned
or are being installed within the Wakefield District.
The implementation of the Eco Stars Fleet recognition scheme in 2016 established by
West Yorkshire local authorities and the West Yorkshire Combined Authority (WYCA)
to help support freight and bus/coach operators to improve the efficiency and
environmental performance of their fleets continues to show increasing numbers of
Wakefield Metropolitan District Council
LAQM Annual Status Report 2020 vii
commercial operators, including all the major bus operators signed-up to the scheme.
Expansion of the scheme to taxis and smaller commercial enterprises is being
considered.
As part of this consideration Wakefield council was successful in obtaining funding
from the 2019 Air Quality Grant to expand the Eco Stars scheme into four small
industrial estates within the Wakefield City AQMA to realise emissions reductions from
diesel commercial vehicles operating in and around the AQMA and the district as a
whole. The project identified seventeen operators of commercial vehicles across the
four estates of which, to date, 7 businesses operating a total of 54 commercial vehicles
have joined the scheme.
A further successful 2019 Air Quality Grant bid was made that was designed to test an
alternative low cost monitoring method at identified schools close to major highways in
Wakefield city. The project aimed to identify any significant exposure to children,
parents and staff from road traffic emissions as well as promoting active travel amongst
those families and establishing an education and information template for other users.
The project suffered from issues with the sensors that were selected for the trial and
the on-set of the COVID-19 pandemic which interrupted the educational package. It is
still hoped to complete the project, albeit over a longer timescale than was planned.
Conclusions and Priorities
Air Quality across the district is gradually improving but has plateaued in some
monitoring locations. Action to further improve air quality for nitrogen dioxide remains
a priority and in the next year will include:
Work with West Yorkshire partners to deliver the West Yorkshire Low Emissions
Strategy 2016 - 2021, including:
Work with West Yorkshire colleagues to ensure Clean Air Zones in Leeds
and Bradford will deliver a positive impact on air quality within the
Wakefield district.
Working with WYCA to reduce transport emissions through the West
Yorkshire Transport Strategy 2040 and Bus Strategy.
Wakefield Metropolitan District Council
LAQM Annual Status Report 2020 viii
Working with WYCA and colleagues within Transportation and Highways
to deliver the “corridor schemes” for key arterial routes into Wakefield
and Pontefract
Assessing the impact of the WY Eco Stars Fleet Recognition scheme to
determine whether further investment to improve fuel efficiency and
reduce emissions from freight and commercial operations is justified.
Supporting low emission taxi operations, including implementation of
funding through the OLEV Ultra-low Emission Taxi Scheme for rapid
charging points.
Influencing the Wakefield Local Development Plan review as a driver to
improve air quality.
Implement the revised Taxi and Private Hire operator license conditions.
Review the current Air Quality Action Plan 2010 in light of emerging evidence
and prepare a new Action Plan in line with the West Yorkshire Low Emissions
Strategy and more detailed Action Plans for specific actions relating to individual
AQMAs.
Participate in the review of the West Yorkshire Air Quality and Emissions
Planning Guidance to further influence emission reduction mitigation and
ensure developments contribute positively to air quality.
Implementation of a West Yorkshire Electric Vehicle Charging Point Strategy to
provide a strategic network of EV charging points and promoting uptake of EVs
in the district and across the region.
Castleford AQMA: Continue liaison with colleagues on the Castleford Master-
planning process, individual planning applications and install real time air
pollution sensors to monitor air quality close to housing developments along the
Glasshoughton Southern Relief Road.
Ackworth AQMA: Reviewing the Ackworth AQMA in the light of the revised
monitoring.
Review the remaining AQMAs in terms of boundary change/ revoking following
further monitoring results.
Further develop a “project pipeline” for implementation as funding becomes
available.
Work with colleagues to deliver air quality improvements on Horsefair in
Pontefract as part of the Streets for People demonstration project.
Wakefield Metropolitan District Council
LAQM Annual Status Report 2020 ix
Participate in a Green Infrastructure pilot project in partnership with Dr James
Levine of Birmingham University and West Yorkshire partners;
Collaborate with West Yorkshire partners on a WYCA-led project to create an
online hub for air quality data and information.
Particulate Matter (PM10 and PM2.5) is currently only monitored in one location, the
CM3 - Park Street, Wakefield continuous air quality monitoring station. With the UK
Government’s Air Quality Strategy, published in January 2020, placing more emphasis
on particulate matter and on PM2.5 in particular with a pledge to consider implementing
an AQOL for PM2.5 another priority must be to monitor particulate matter more widely.
To this end Wakefield Council will, as funding becomes available, be deploying several
“low-cost” sensors that will provide real-time data on particulate matter concentrations
as well as NO2.
These sensors will also begin to inform us of how levels of air pollutants vary through
the day and may help to identify locations where concentrations of pollutants peak at
times when vulnerable people are exposed to them even though the annual average
concentration meets the relevant AQOL. The first sensors are expected to be deployed
along the Glasshoughton Southern Link Road.
Local Engagement and How to get Involved
Reducing polluting emissions to the air from our everyday activities will help improve
local air quality and our health. Everyone can help to reduce air pollution:
If you can, walk or cycle particularly for short journeys, such as a trip to the local
shops or going to school, or as part of a longer journey – you can take cycles on
most trains and cycle storage facilities are increasing available at stations and
workplaces. As well as being good for your health it will help to improve air
quality.
Use public transport to get around. West Yorkshire has some of the best public
transport in the country.
Consider car-sharing options such as car clubs and car sharing, avoiding the
costs of car ownership and to do your bit for the environment at the same time.
Change your car or van for an ultra-low emission alternative such as a plug-in
electric or hybrid. More options are becoming available each year, technology
is improving and the running costs make this a very attractive alternative, which
has also great for the environment.
Make sure your place of work has a Travel Plan – if you’re an employer make
sure you have one, if you’re an employee – ask your employer about one.
Wakefield Metropolitan District Council
LAQM Annual Status Report 2020 x
Businesses, which operate fleet vehicles (lorries, vans, buses, coaches etc) can
become members of the Eco Stars Fleet recognition Scheme and get free advice
on managing their fleet to improve fuel efficiency and reduce emissions.
Find out more about local air quality by visiting the Wakefield Air Quality web-site.
Wakefield Metropolitan District Council
LAQM Annual Status Report 2020 xi
Table of Contents
Executive Summary: Air Quality in Our Area .......................................................... i
Air Quality in the Wakefield District ..................................................................................... i
Actions to Improve Air Quality ........................................................................................... vi
Conclusions and Priorities ............................................................................................... vii
Local Engagement and How to get Involved ..................................................................... ix
1 Local Air Quality Management ........................................................................ 1
2 Actions to Improve Air Quality ........................................................................ 2
2.1 Air Quality Management Areas .............................................................................. 2
2.2 Progress and Impact of Measures to address Air Quality in Wakefield District ...... 6
2.3 PM2.5 – Local Authority Approach to Reducing Emissions and/or
Concentrations.................................................................................................................13
3 Air Quality Monitoring Data and Comparison with Air Quality
Objectives and National Compliance .................................................................... 15
3.1 Summary of Monitoring Undertaken .....................................................................15
3.1.1 Automatic Monitoring Sites .......................................................................................... 15
3.1.2 Non-Automatic Monitoring Sites................................................................................... 15
3.2 Individual Pollutants .............................................................................................16
3.2.1 Nitrogen Dioxide (NO2)................................................................................................. 16
3.2.2 Particulate Matter (PM10) .............................................................................................. 43
3.2.3 Particulate Matter (PM2.5) ............................................................................................. 44
Appendix A: Monitoring Results ........................................................................... 46
Appendix B: Full Monthly Diffusion Tube Results for 2019 ................................ 59
Appendix C: Supporting Technical Information / Air Quality Monitoring
Data QA/QC ............................................................................................................. 62
Appendix D: Maps of Monitoring Locations and AQMAs ................................... 66
Appendix E: Summary of Air Quality Objectives in England .............................. 69
Glossary of Terms .................................................................................................. 70
List of Tables
Table 2.1 – Declared Air Quality Management Areas .................................................. 3 Table 2.2 – Progress on Measures to Improve Air Quality .......................................... 9 Table A.1 - Details of Automatic Monitoring Sites ...................................................... 46 Table A.2 – Details of Non-Automatic Monitoring Sites ............................................. 47 Table A.3 – Annual Mean NO2 Monitoring Results .................................................... 51
Table A.4 – 1-Hour Mean NO2 Monitoring Results .................................................... 55 Table A.5 – Annual Mean PM10 Monitoring Results................................................... 56
Wakefield Metropolitan District Council
LAQM Annual Status Report 2020 xii
Table A.6 – 24-Hour Mean PM10 Monitoring Results ................................................. 57
Table A.7 – PM2.5 Monitoring Results ........................................................................ 58 Table B.1 - NO2 Monthly Diffusion Tube Results - 2019 ............................................ 59
Table E.1 – Air Quality Objectives in England ........................................................... 69
Wakefield Metropolitan District Council
LAQM Annual Status Report 2020 1
1 Local Air Quality Management
This report provides an overview of air quality in the Wakefield Metropolitan District
during 2019. It fulfils the requirements of Local Air Quality Management (LAQM) as
set out in Part IV of the Environment Act (1995) and the relevant Policy and
Technical Guidance documents.
The LAQM process places an obligation on all local authorities to regularly review
and assess air quality in their areas, and to determine whether or not the air quality
objectives are likely to be achieved. Where an exceedance is considered likely the
local authority must declare an Air Quality Management Area (AQMA) and prepare
an Air Quality Action Plan (AQAP) setting out the measures it intends to put in place
in pursuit of the objectives. This Annual Status Report (ASR) is an annual
requirement showing the strategies employed by Wakefield Council to improve air
quality and any progress that has been made.
The statutory air quality objectives applicable to LAQM in England can be found in
Table E.1 in Appendix E.
Wakefield Metropolitan District Council
LAQM Annual Status Report 2020 2
2 Actions to Improve Air Quality
2.1 Air Quality Management Areas
Air Quality Management Areas (AQMAs) are declared when there is an exceedance
or likely exceedance of an air quality objective. After declaration, the authority must
prepare an Air Quality Action Plan (AQAP) within 12-18 months setting out measures
it intends to put in place in pursuit of compliance with the objectives.
A summary of AQMAs declared by Wakefield Council District can be found in Table 2.1.
Further information related to declared or revoked AQMAs, including maps of AQMA
boundaries are available online at Wakefield Air Quality and DEFRA Wakefield
AQMAS
Given the continuing trend of compliance with the air quality objectives and our
confidence that the levels will not be exceeded in the future we propose to revoke the
following AQMA’s (see monitoring section):
I. M62
II. Pontefract
III. Knottingley
IV. Ackworth
Wakefield Metropolitan District Council
LAQM Annual Status Report 2020 3
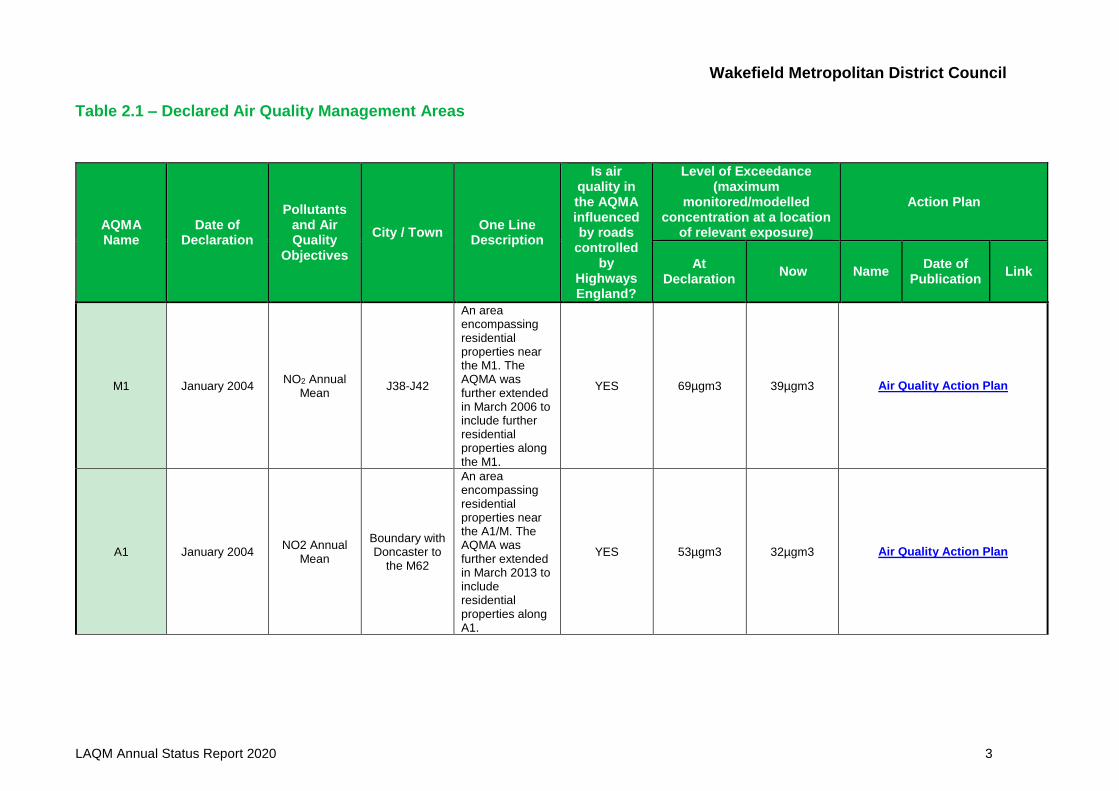
Table 2.1 – Declared Air Quality Management Areas
AQMA Name
Date of Declaration
Pollutants and Air Quality
Objectives
City / Town One Line
Description
Is air quality in the AQMA influenced by roads
controlled by
Highways England?
Level of Exceedance (maximum
monitored/modelled concentration at a location
of relevant exposure)
Action Plan
At Declaration
Now Name Date of
Publication Link
M1 January 2004 NO2 Annual
Mean J38-J42
An area encompassing residential properties near the M1. The AQMA was further extended in March 2006 to include further residential properties along the M1.
YES 69µgm3 39µgm3 Air Quality Action Plan
A1 January 2004 NO2 Annual
Mean
Boundary with Doncaster to
the M62
An area encompassing residential properties near the A1/M. The AQMA was further extended in March 2013 to include residential properties along A1.
YES 53µgm3 32µgm3 Air Quality Action Plan
Wakefield Metropolitan District Council
LAQM Annual Status Report 2020 4
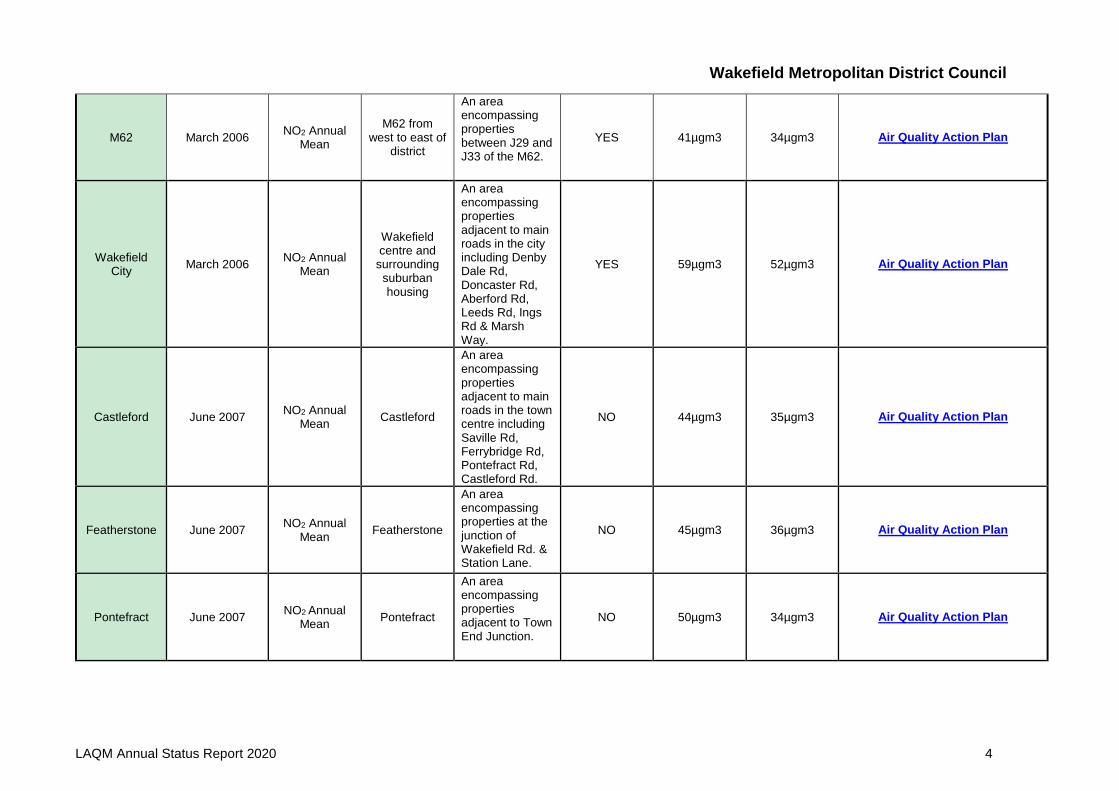
M62 March 2006 NO2 Annual
Mean
M62 from west to east of
district
An area encompassing properties between J29 and J33 of the M62.
YES 41µgm3 34µgm3 Air Quality Action Plan
Wakefield City
March 2006 NO2 Annual
Mean
Wakefield centre and
surrounding suburban housing
An area encompassing properties adjacent to main roads in the city including Denby Dale Rd, Doncaster Rd, Aberford Rd, Leeds Rd, Ings Rd & Marsh Way.
YES 59µgm3 52µgm3 Air Quality Action Plan
Castleford June 2007 NO2 Annual
Mean Castleford
An area encompassing properties adjacent to main roads in the town centre including Saville Rd, Ferrybridge Rd, Pontefract Rd, Castleford Rd.
NO 44µgm3 35µgm3 Air Quality Action Plan
Featherstone June 2007 NO2 Annual
Mean Featherstone
An area encompassing properties at the junction of Wakefield Rd. & Station Lane.
NO 45µgm3 36µgm3 Air Quality Action Plan
Pontefract June 2007 NO2 Annual
Mean Pontefract
An area encompassing properties adjacent to Town End Junction.
NO 50µgm3 34µgm3 Air Quality Action Plan
Wakefield Metropolitan District Council
LAQM Annual Status Report 2020 5
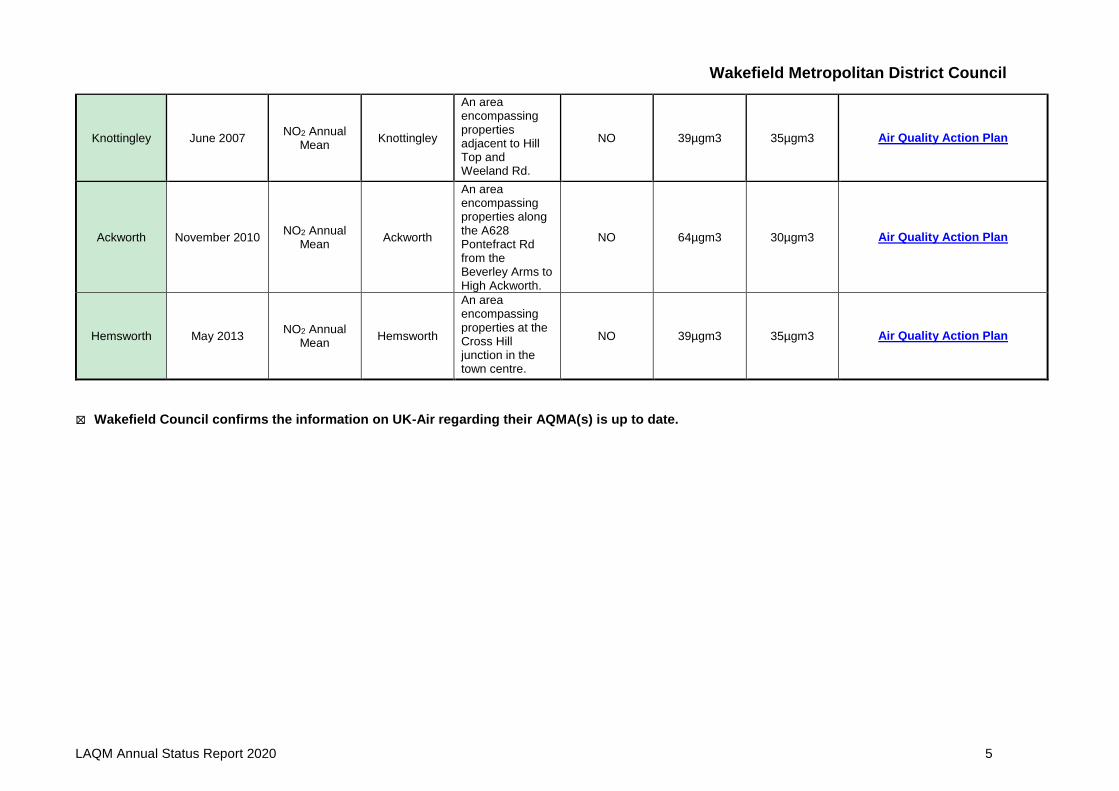
Knottingley June 2007 NO2 Annual
Mean Knottingley
An area encompassing properties adjacent to Hill Top and Weeland Rd.
NO 39µgm3 35µgm3 Air Quality Action Plan
Ackworth November 2010 NO2 Annual
Mean Ackworth
An area encompassing properties along the A628 Pontefract Rd from the Beverley Arms to High Ackworth.
NO 64µgm3
30µgm3
Air Quality Action Plan
Hemsworth May 2013 NO2 Annual
Mean Hemsworth
An area encompassing properties at the Cross Hill junction in the town centre.
NO 39µgm3 35µgm3 Air Quality Action Plan
☒ Wakefield Council confirms the information on UK-Air regarding their AQMA(s) is up to date.
Wakefield Metropolitan District Council
LAQM Annual Status Report 2020 6
2.2 Progress and Impact of Measures to address Air Quality in Wakefield District
Defra’s appraisal of last year’s ASR concluded that the report was “well structured,
detailed and provides most of the information specified in the Guidance”. There were
no specific recommendations but a number of recommendations were made in the
commentary which Wakefield Council has tried to address in this report. These related
to more detailed evidence to support the data included in the report and
recommendations with respect to the presentation of some data. A deeper discussion
of PM2.5 emissions was suggested and the proposals to revoke four AQMAs and review
the AQAP were supported.
Since the 2019 ASR, the AQ team at Wakefield Council has changed completely with
the three officers involved in LAQM retiring late summer 2019. The last 10 months
have, therefore seen a period of transition with a smaller “team” getting to grips with
the work. As a result, the review of the AQAP has not yet commenced. However, a
“project pipeline” is under development which will list all active and proposed measures
to address AQ issues. Once fully developed, the project pipeline will include projects
that are ready to implement as and when funding is secured.
Work has commenced on the revocation of those AQMAs that were proposed in the
2019 ASR. The first revocation is expected during Summer 2020 with others to follow
shortly afterwards.
Finally, as suggested in the 2018 ASR and supported in the appraisal of the 2019
report, a review of the passive monitoring network is underway. The number of NO2
diffusion tubes deployed has been reduced by approximately 50% with those tubes
repeatedly returning results way under the AQOL being withdrawn. This leaves the
Council with the capacity to investigate further potential hot-spots and respond to
concerns from members of the public about specific locations.
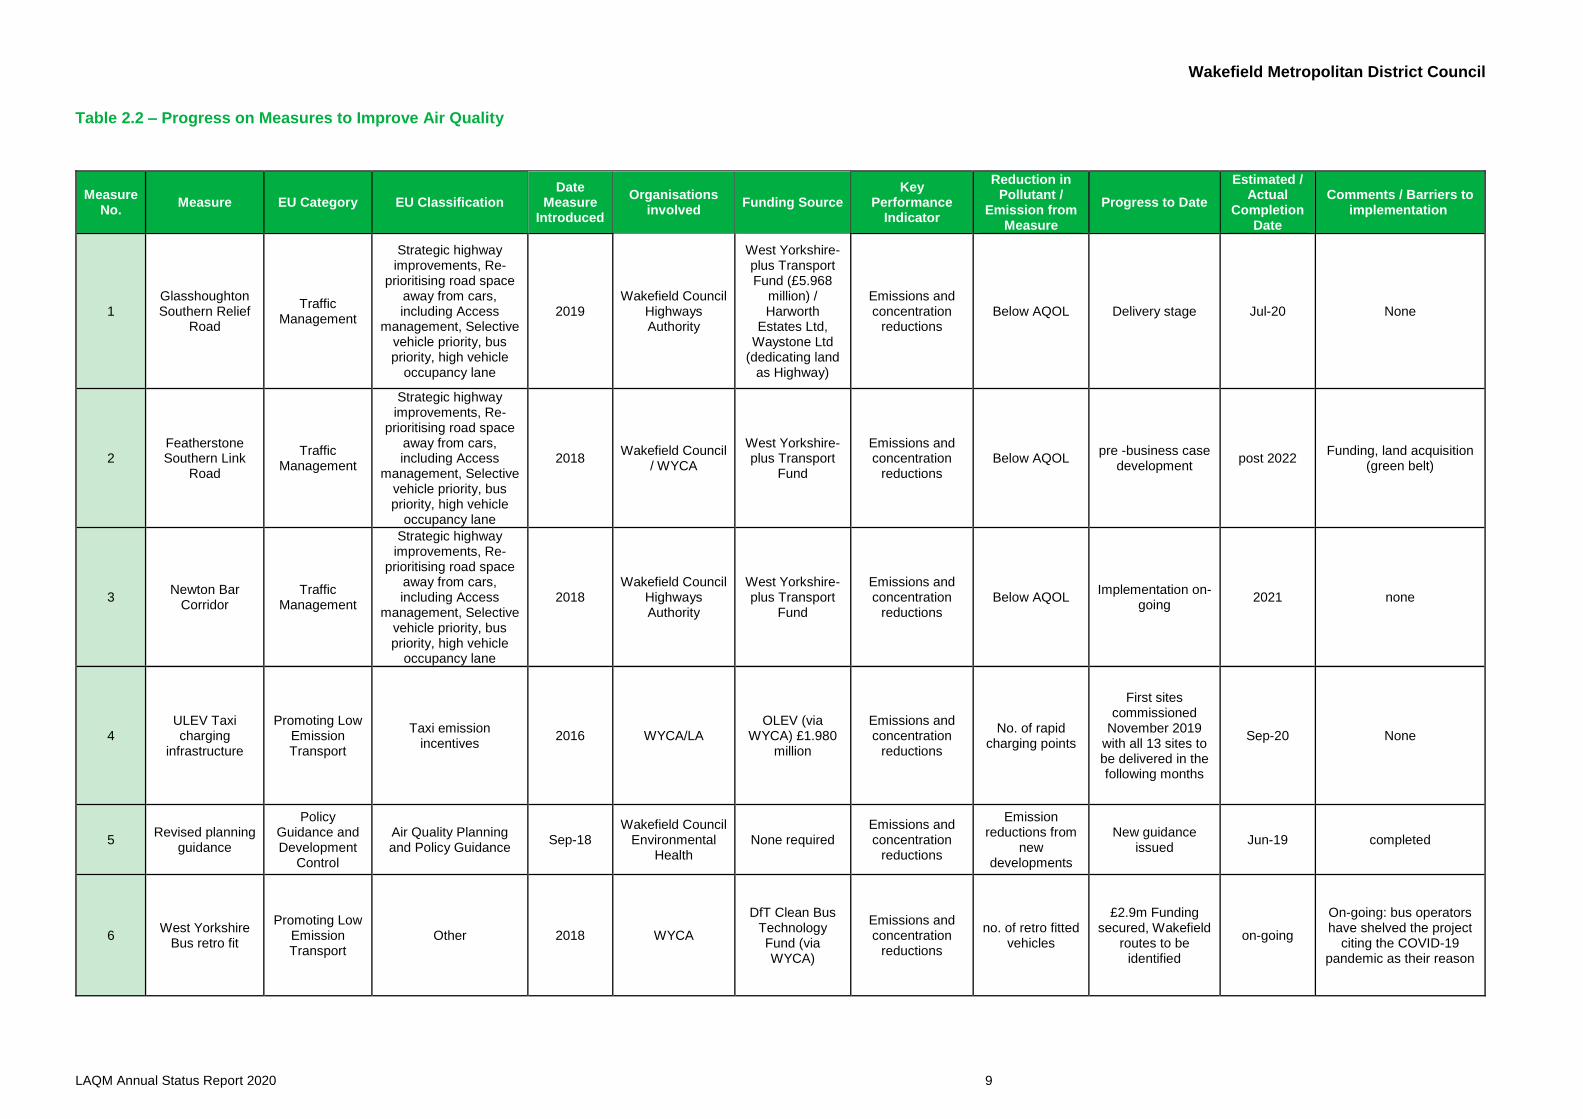
Wakefield Council has taken forward a number of direct measures during the current
reporting year of 2019 in pursuit of improving local air quality. Details of all measures
completed, in progress or planned are set out in Table 2.2.
More detail on these measures can be found in their respective Action Plans.
Key completed measures are:
Wakefield Metropolitan District Council
LAQM Annual Status Report 2020 7
Kirkgate roundabout gateway, reducing congestion in Wakefield City centre and
improving connectivity between Kirkgate rail station and the city centre;
Review of passive NO2 monitoring network;
Successful bid for AQ Grant funding for two projects within the Wakefield City
AQMA.
Wakefield Council expects the following measures to be completed over the course of
the next reporting year:
AQ Grant-funded project to promote the ECOStars (Efficient and Cleaner
Operations) Fleet Recognition Scheme among the businesses operating from
four industrial estates within the Wakefield City AQMA;
A further AQ Grant-funded project to trial low-cost real time pollution sensors at
three primary schools on or close to major arterial routes into Wakefield, with
an educational package for the schools, was undertaken;
Revocation of up to four AQMAs;
Refining of a “Project Pipeline” and review of the AQAP;
Review of the West Yorkshire Air Quality and Emissions Technical Planning
Guidance;
Commissioning of the final rapid Electric Vehicle charging point of 13 across the
district as part of the West Yorkshire Charging Programme;
Deployment of at least four further low-cost sensors;
Opening of the Glasshoughton Southern Link Road;
Wakefield Council’s priorities for the coming year are:
Deliver the two grant-funded projects;
Revoke selected AQMAs;
Review AQAP;
Review WY AQ and Emissions Technical Planning Guidance;
Wakefield Metropolitan District Council
LAQM Annual Status Report 2020 8
Expand network of low-cost sensors to provide more real time data and
wider particulate coverage;
The principal challenges and barriers to implementation that Wakefield Council
anticipates facing are human resources. Wakefield Council’s LAQM team has seen
wholesale change and depletion of numbers since the last ASR. We continue to work
with fewer full time equivalent officers and much less experience in the team which is
reducing our capacity for the time being.
Progress on the following measures has been slower than expected due to:
Two grant-funded projects have been affected by the COVID-19 pandemic;
All other work has been affected by the loss of experience and knowledge
following the retirement of the former Air Quality Officer and depletion of staff
numbers.
Whilst the measures stated above and in Table 2.2 will help to contribute towards
compliance, Wakefield Council anticipates that further additional measures not yet
prescribed will be required in subsequent years to achieve compliance and enable the
revocation of Wakefield City AQMA. Many of the measures in Table 2.2 have arisen
since the AQAP was last revised in 2010. They will be incorporated into the AQAP
when it is reviewed.
Wakefield Metropolitan District Council
LAQM Annual Status Report 2020 9
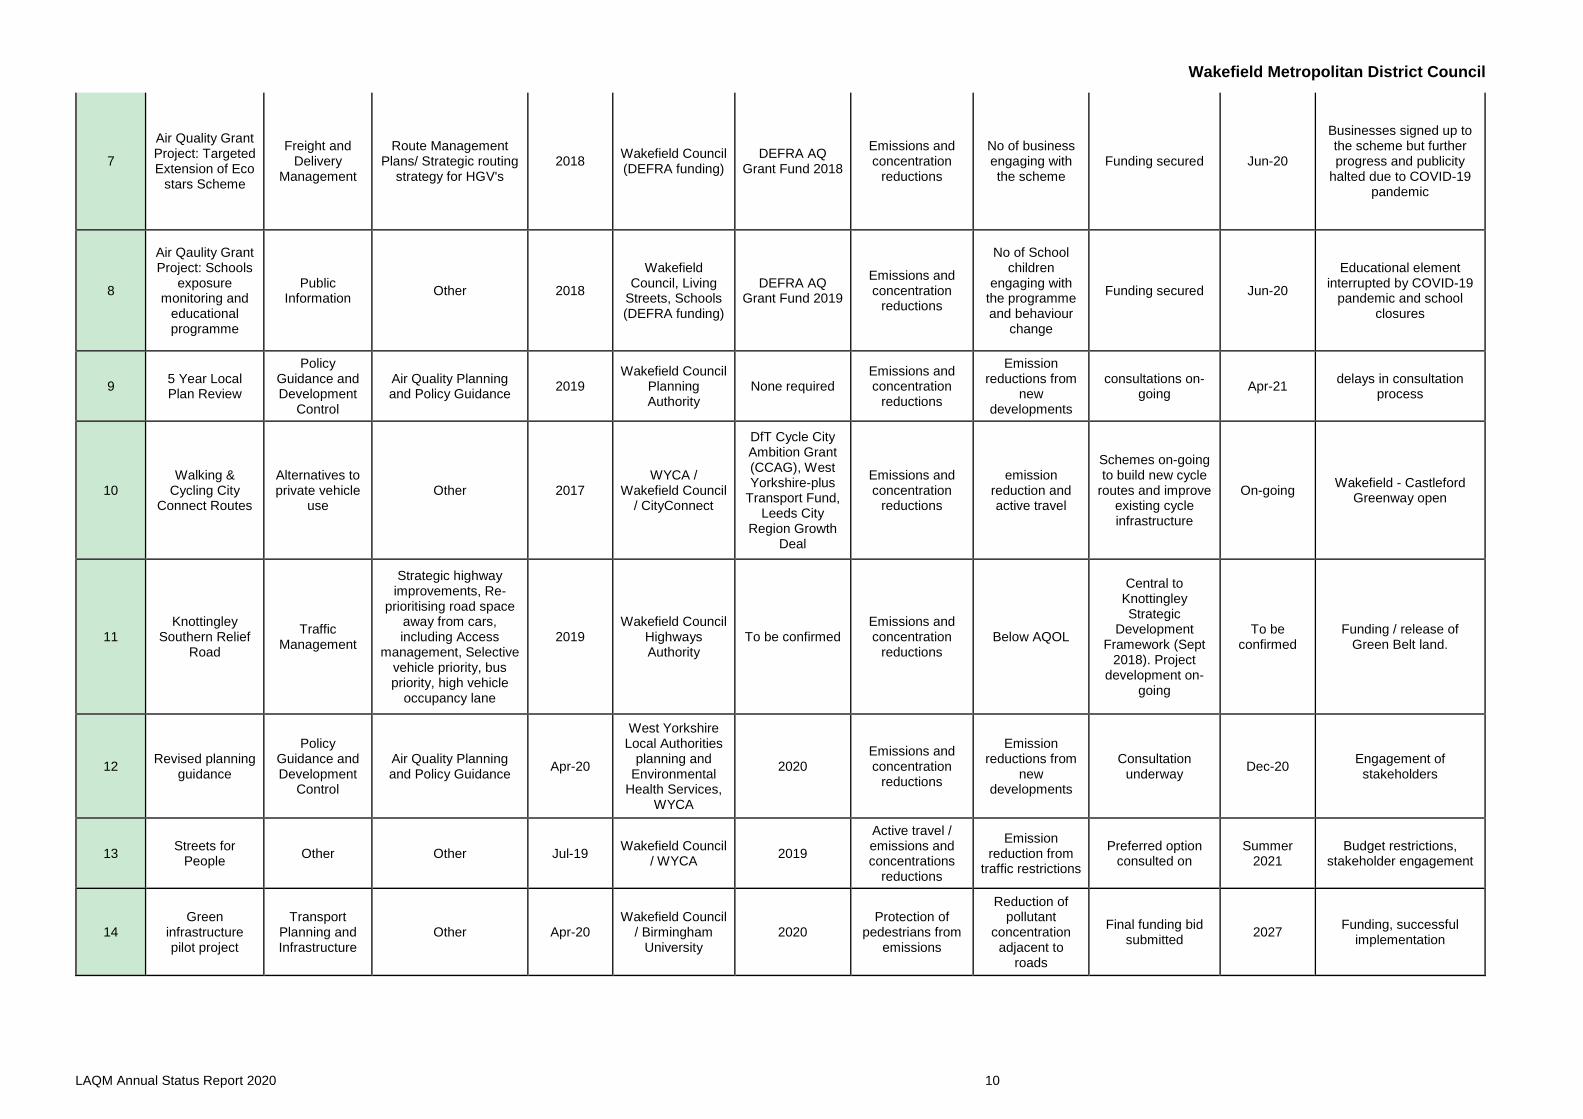
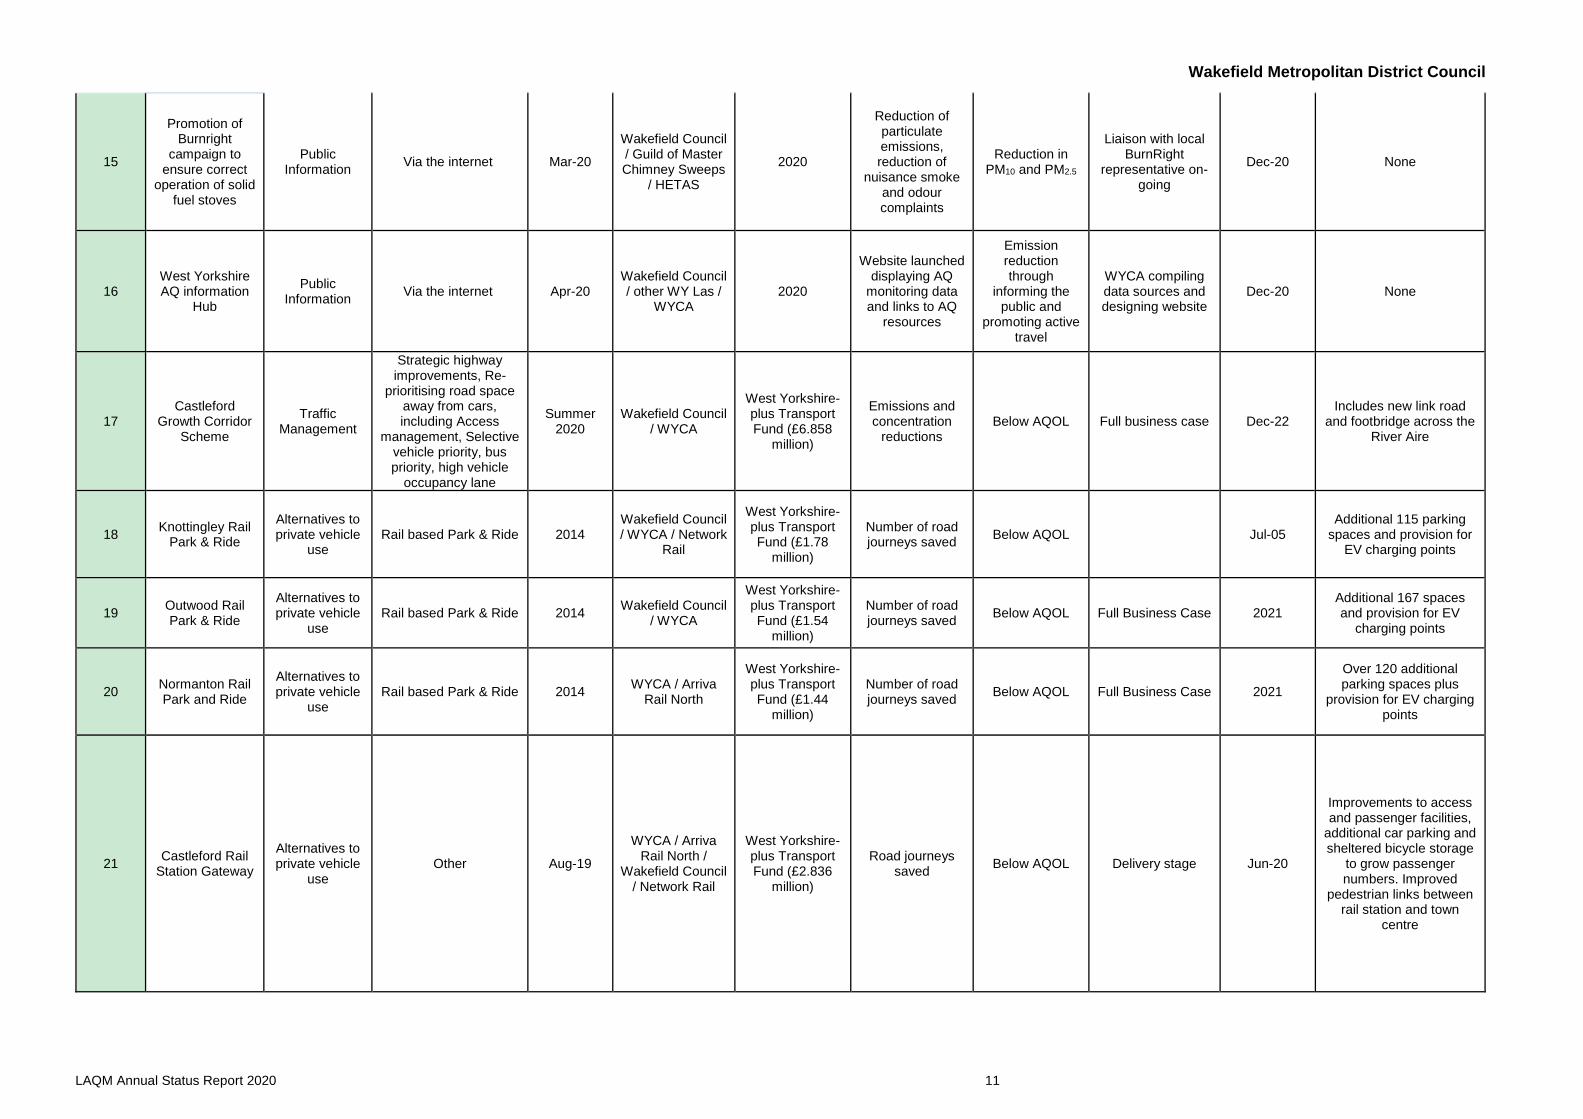
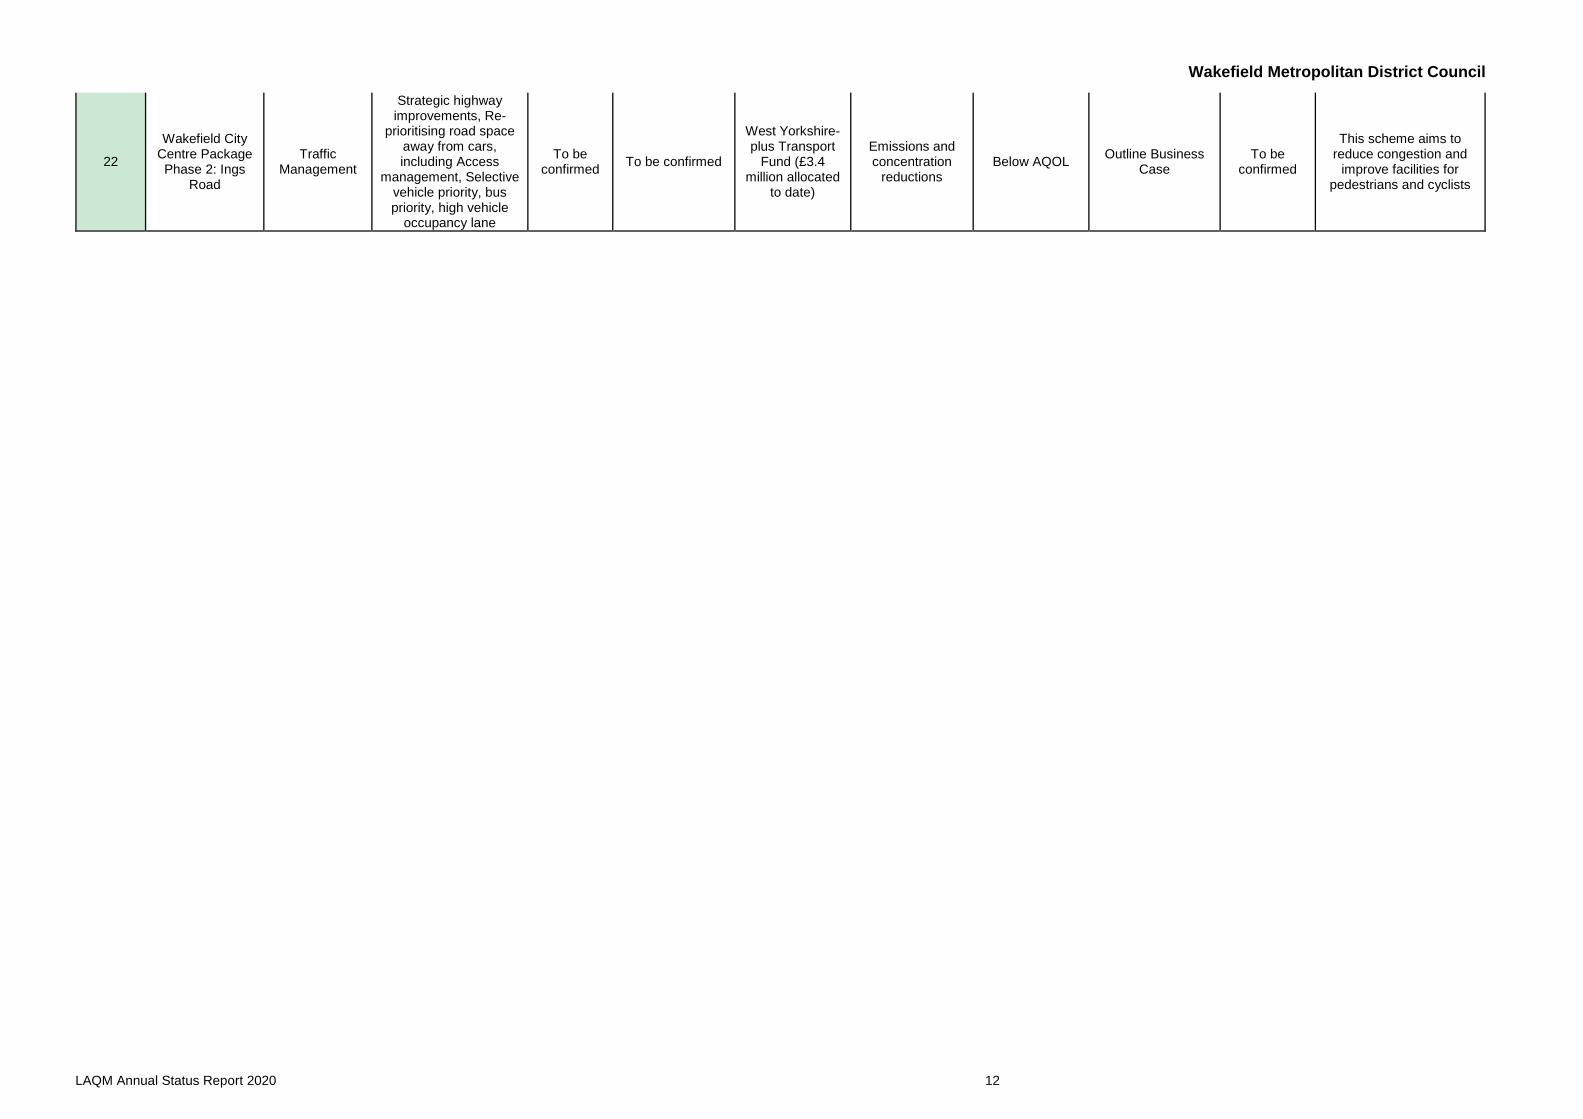
Table 2.2 – Progress on Measures to Improve Air Quality
Measure No.
Measure EU Category EU Classification Date
Measure Introduced
Organisations involved
Funding Source Key
Performance Indicator
Reduction in Pollutant /
Emission from Measure
Progress to Date
Estimated / Actual
Completion Date
Comments / Barriers to implementation
1 Glasshoughton Southern Relief
Road
Traffic Management
Strategic highway improvements, Re-
prioritising road space away from cars, including Access
management, Selective vehicle priority, bus priority, high vehicle
occupancy lane
2019 Wakefield Council
Highways Authority
West Yorkshire-plus Transport Fund (£5.968
million) / Harworth
Estates Ltd, Waystone Ltd
(dedicating land as Highway)
Emissions and concentration
reductions Below AQOL Delivery stage Jul-20 None
2 Featherstone Southern Link
Road
Traffic Management
Strategic highway improvements, Re-
prioritising road space away from cars, including Access
management, Selective vehicle priority, bus priority, high vehicle
occupancy lane
2018 Wakefield Council
/ WYCA
West Yorkshire-plus Transport
Fund
Emissions and concentration
reductions Below AQOL
pre -business case development
post 2022 Funding, land acquisition
(green belt)
3 Newton Bar
Corridor Traffic
Management
Strategic highway improvements, Re-
prioritising road space away from cars, including Access
management, Selective vehicle priority, bus priority, high vehicle
occupancy lane
2018 Wakefield Council
Highways Authority
West Yorkshire-plus Transport
Fund
Emissions and concentration
reductions Below AQOL
Implementation on-going
2021 none
4 ULEV Taxi charging
infrastructure
Promoting Low Emission Transport
Taxi emission incentives
2016 WYCA/LA OLEV (via
WYCA) £1.980 million
Emissions and concentration
reductions
No. of rapid charging points
First sites commissioned
November 2019 with all 13 sites to be delivered in the following months
Sep-20 None
5 Revised planning
guidance
Policy Guidance and Development
Control
Air Quality Planning and Policy Guidance
Sep-18 Wakefield Council
Environmental Health
None required Emissions and concentration
reductions
Emission reductions from
new developments
New guidance issued
Jun-19 completed
6 West Yorkshire
Bus retro fit
Promoting Low Emission Transport
Other 2018 WYCA
DfT Clean Bus Technology Fund (via WYCA)
Emissions and concentration
reductions
no. of retro fitted vehicles
£2.9m Funding secured, Wakefield
routes to be identified
on-going
On-going: bus operators have shelved the project
citing the COVID-19 pandemic as their reason
Wakefield Metropolitan District Council
LAQM Annual Status Report 2020 10
7
Air Quality Grant Project: Targeted Extension of Eco
stars Scheme
Freight and Delivery
Management
Route Management Plans/ Strategic routing
strategy for HGV's 2018
Wakefield Council (DEFRA funding)
DEFRA AQ Grant Fund 2018
Emissions and concentration
reductions
No of business engaging with the scheme
Funding secured Jun-20
Businesses signed up to the scheme but further progress and publicity
halted due to COVID-19 pandemic
8
Air Qaulity Grant Project: Schools
exposure monitoring and
educational programme
Public Information
Other 2018
Wakefield Council, Living
Streets, Schools (DEFRA funding)
DEFRA AQ Grant Fund 2019
Emissions and concentration
reductions
No of School children
engaging with the programme and behaviour
change
Funding secured Jun-20
Educational element interrupted by COVID-19
pandemic and school closures
9 5 Year Local Plan Review
Policy Guidance and Development
Control
Air Quality Planning and Policy Guidance
2019 Wakefield Council
Planning Authority
None required Emissions and concentration
reductions
Emission reductions from
new developments
consultations on-going
Apr-21 delays in consultation
process
10 Walking &
Cycling City Connect Routes
Alternatives to private vehicle
use Other 2017
WYCA / Wakefield Council
/ CityConnect
DfT Cycle City Ambition Grant (CCAG), West Yorkshire-plus
Transport Fund, Leeds City
Region Growth Deal
Emissions and concentration
reductions
emission reduction and active travel
Schemes on-going to build new cycle
routes and improve existing cycle infrastructure
On-going Wakefield - Castleford
Greenway open
11 Knottingley
Southern Relief Road
Traffic Management
Strategic highway improvements, Re-
prioritising road space away from cars, including Access
management, Selective vehicle priority, bus priority, high vehicle
occupancy lane
2019 Wakefield Council
Highways Authority
To be confirmed Emissions and concentration
reductions Below AQOL
Central to Knottingley Strategic
Development Framework (Sept
2018). Project development on-
going
To be confirmed
Funding / release of Green Belt land.
12 Revised planning
guidance
Policy Guidance and Development
Control
Air Quality Planning and Policy Guidance
Apr-20
West Yorkshire Local Authorities
planning and Environmental
Health Services, WYCA
2020 Emissions and concentration
reductions
Emission reductions from
new developments
Consultation underway
Dec-20 Engagement of stakeholders
13 Streets for
People Other Other Jul-19
Wakefield Council / WYCA
2019
Active travel / emissions and concentrations
reductions
Emission reduction from
traffic restrictions
Preferred option consulted on
Summer 2021
Budget restrictions, stakeholder engagement
14 Green
infrastructure pilot project
Transport Planning and Infrastructure
Other Apr-20 Wakefield Council
/ Birmingham University
2020 Protection of
pedestrians from emissions
Reduction of pollutant
concentration adjacent to
roads
Final funding bid submitted
2027 Funding, successful
implementation
Wakefield Metropolitan District Council
LAQM Annual Status Report 2020 11
15
Promotion of Burnright
campaign to ensure correct
operation of solid fuel stoves
Public Information
Via the internet Mar-20
Wakefield Council / Guild of Master Chimney Sweeps
/ HETAS
2020
Reduction of particulate emissions, reduction of
nuisance smoke and odour complaints
Reduction in PM10 and PM2.5
Liaison with local BurnRight
representative on-going
Dec-20 None
16 West Yorkshire AQ information
Hub
Public Information
Via the internet Apr-20 Wakefield Council / other WY Las /
WYCA 2020
Website launched displaying AQ
monitoring data and links to AQ
resources
Emission reduction through
informing the public and
promoting active travel
WYCA compiling data sources and designing website
Dec-20 None
17 Castleford
Growth Corridor Scheme
Traffic Management
Strategic highway improvements, Re-
prioritising road space away from cars, including Access
management, Selective vehicle priority, bus priority, high vehicle
occupancy lane
Summer 2020
Wakefield Council / WYCA
West Yorkshire-plus Transport Fund (£6.858
million)
Emissions and concentration
reductions Below AQOL Full business case Dec-22
Includes new link road and footbridge across the
River Aire
18 Knottingley Rail
Park & Ride
Alternatives to private vehicle
use Rail based Park & Ride 2014
Wakefield Council / WYCA / Network
Rail
West Yorkshire-plus Transport Fund (£1.78
million)
Number of road journeys saved
Below AQOL Jul-05 Additional 115 parking
spaces and provision for EV charging points
19 Outwood Rail Park & Ride
Alternatives to private vehicle
use Rail based Park & Ride 2014
Wakefield Council / WYCA
West Yorkshire-plus Transport Fund (£1.54
million)
Number of road journeys saved
Below AQOL Full Business Case 2021 Additional 167 spaces and provision for EV
charging points
20 Normanton Rail Park and Ride
Alternatives to private vehicle
use Rail based Park & Ride 2014
WYCA / Arriva Rail North
West Yorkshire-plus Transport Fund (£1.44
million)
Number of road journeys saved
Below AQOL Full Business Case 2021
Over 120 additional parking spaces plus
provision for EV charging points
21 Castleford Rail
Station Gateway
Alternatives to private vehicle
use Other Aug-19
WYCA / Arriva Rail North /
Wakefield Council / Network Rail
West Yorkshire-plus Transport Fund (£2.836
million)
Road journeys saved
Below AQOL Delivery stage Jun-20
Improvements to access and passenger facilities,
additional car parking and sheltered bicycle storage
to grow passenger numbers. Improved
pedestrian links between rail station and town
centre
Wakefield Metropolitan District Council
LAQM Annual Status Report 2020 12
22
Wakefield City Centre Package Phase 2: Ings
Road
Traffic Management
Strategic highway improvements, Re-
prioritising road space away from cars, including Access
management, Selective vehicle priority, bus priority, high vehicle
occupancy lane
To be confirmed
To be confirmed
West Yorkshire-plus Transport
Fund (£3.4 million allocated
to date)
Emissions and concentration
reductions Below AQOL
Outline Business Case
To be confirmed
This scheme aims to reduce congestion and
improve facilities for pedestrians and cyclists
Wakefield Metropolitan District Council
LAQM Annual Status Report 2020 13
2.3 PM2.5 – Local Authority Approach to Reducing Emissions and/or Concentrations
As detailed in Policy Guidance LAQM.PG16 (Chapter 7), local authorities are
expected to work towards reducing emissions and/or concentrations of PM2.5
(particulate matter with an aerodynamic diameter of 2.5µm or less). There is clear
evidence that PM2.5 has a significant impact on human health, including premature
mortality, allergic reactions, and cardiovascular diseases.
Wakefield Council is taking the following measures to address PM2.5:
Taxi EV charging infrastructure (measure 4 in Table 2.2). This is an existing
measure that is nearing completion;
Revised planning guidance will increase the provision of domestic and
commercial EV charging points. This is a new measure that is in the initial
stages of consultation (measure 5 in Table 2.2);
West Yorkshire bus retro-fit scheme will reduce PM2.5 from busses on key
routes into the district (measure 6 in Table 2.2). Existing measure that has
been delayed by the COVID-19 pandemic;
The ECOStars scheme extension (measure 7 in Table 2.2) has recruited
several members from industrial estates in Wakefield and will reduce diesel
fuel consumption in those commercial vehicle fleets through fleet
management and efficient driving, thus reducing emissions of PM2.5 and
other pollutants. Existing measure that was in the planning stage in the
previous ASR but has been delivered during 2019;
A number of measures from Table 2.2, including the Schools project
(measure 8), walking and cycling routes (measure 10), Streets for People
(measure 13), green infrastructure project (measure 14) and improvements
to Ings Road (measure 22) are all aimed at promoting and supporting active
travel and reducing private vehicle use. The schools project and
Wakefield Metropolitan District Council
LAQM Annual Status Report 2020 14
walking/cycling routes are existing measures, the others are new or
included for the first time in the 2019 ASR;
Likewise, the various rail park and ride projects (measures 18, 19, 20 and
21) aim to reduce the use of private vehicles. These sches are included for
the first time in the 2019 ASR;
Support for the BurnRight campaign (measure15) will help inform the public
about the correct use of solid fuel stoves such that they burn “cleanly”,
driving a reduction of PM from domestic sources. This is a new measure.
Wakefield Metropolitan District Council
LAQM Annual Status Report 2020 15
3 Air Quality Monitoring Data and Comparison with Air Quality Objectives and National Compliance
3.1 Summary of Monitoring Undertaken
3.1.1 Automatic Monitoring Sites
This section sets out what monitoring has taken place and how it compares with
objectives.
Wakefield District Council undertook automatic (continuous) monitoring at 3 sites
during 2018. Error! Reference source not found. in Appendix A shows the details
f the sites. National monitoring results are available at Air Quality England.
Maps showing the location of the monitoring sites are provided in Appendix D.
Further details on how the monitors are calibrated and how the data has been
adjusted are included in Appendix C.
3.1.2 Non-Automatic Monitoring Sites
Wakefield Council undertook non- automatic (passive) monitoring of NO2 at 39 sites
during 2019. Table A.2 in Appendix A shows the details of the sites.
Maps showing the location of the monitoring sites are provided in Appendix D.
Further details on Quality Assurance/Quality Control (QA/QC) for the diffusion
tubes, including bias adjustments and any other adjustments applied (e.g.
“annualisation” and/or distance correction), are included in Appendix C.
Wakefield Metropolitan District Council
LAQM Annual Status Report 2020 16
3.2 Individual Pollutants
The air quality monitoring results presented in this section are, where relevant,
adjusted for bias6, “annualisation” (where the data capture falls below 75%), and
distance correction7. Further details on adjustments are provided in Appendix C.
3.2.1 Nitrogen Dioxide (NO2)
Table A.3 in Appendix A compares the ratified and adjusted monitored NO2 annual
mean concentrations for the past 5 years with the air quality objective of 40µg/m3.
Note that the concentration data presented in Table A.3 represents the
concentration at the location of the monitoring site, following the application of bias
adjustment and annualisation, as required (i.e. the values are exclusive of any
consideration to fall-off with distance adjustment).
For diffusion tubes, the full 2019 dataset of monthly mean values is provided in
Appendix B. Note that the concentration data presented in Table B.1 includes
distance corrected values, only where relevant.
Table A.4 in Appendix A compares the ratified continuous monitored NO2 hourly
mean concentrations for the past 5 years with the air quality objective of 200µg/m3,
not to be exceeded more than 18 times per year.
Monitoring results for each of the AQMAs and other areas of concern in the district
are considered in further detail below. The results tell us that 37 of the 39 diffusion
tube monitoring locations in the district were under, or were equal to the annual
mean Air Quality Objective Level (AQOL) for NO2. The two locations with a result
greater than the annual mean objective were both located in the Wakefield city
AQMA (Sites 9-R and 65-R).
The annual mean NO2 level did not exceed 60µg/m3 at any location indicating that
the hourly NO2 air quality objective level was unlikely to have been exceeded in the
Wakefield district during 2019.
6 https://laqm.defra.gov.uk/bias-adjustment-factors/bias-adjustment.html 7 Fall-off with distance correction criteria is provided in paragraph 7.77, LAQM.TG(16)
Wakefield Metropolitan District Council
LAQM Annual Status Report 2020 17
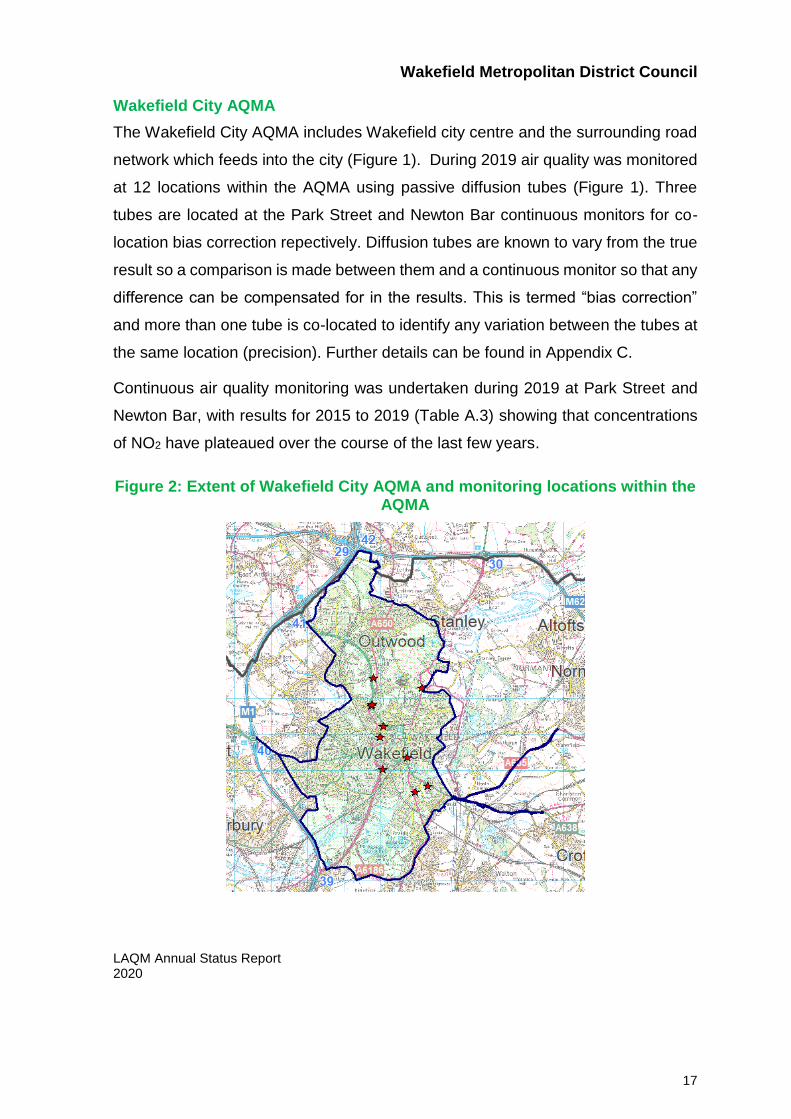
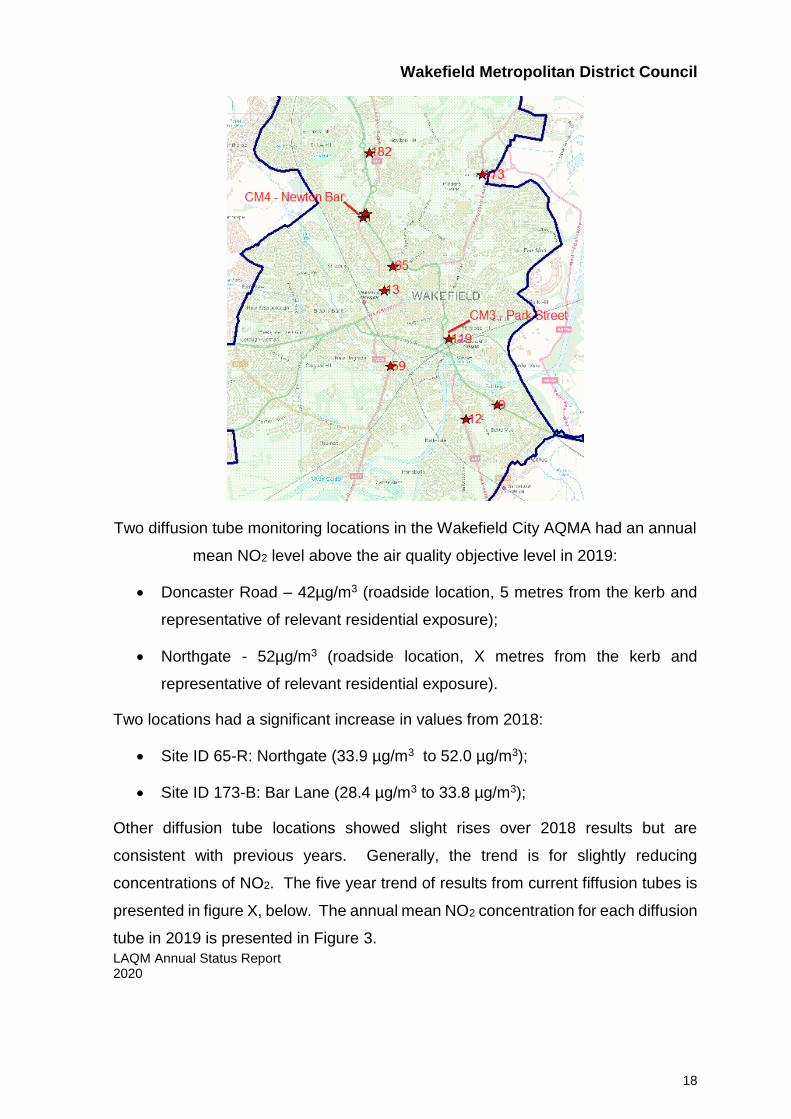
Wakefield City AQMA
The Wakefield City AQMA includes Wakefield city centre and the surrounding road
network which feeds into the city (Figure 1). During 2019 air quality was monitored
at 12 locations within the AQMA using passive diffusion tubes (Figure 1). Three
tubes are located at the Park Street and Newton Bar continuous monitors for co-
location bias correction repectively. Diffusion tubes are known to vary from the true
result so a comparison is made between them and a continuous monitor so that any
difference can be compensated for in the results. This is termed “bias correction”
and more than one tube is co-located to identify any variation between the tubes at
the same location (precision). Further details can be found in Appendix C.
Continuous air quality monitoring was undertaken during 2019 at Park Street and
Newton Bar, with results for 2015 to 2019 (Table A.3) showing that concentrations
of NO2 have plateaued over the course of the last few years.
Figure 2: Extent of Wakefield City AQMA and monitoring locations within the AQMA
Wakefield Metropolitan District Council
LAQM Annual Status Report 2020 18
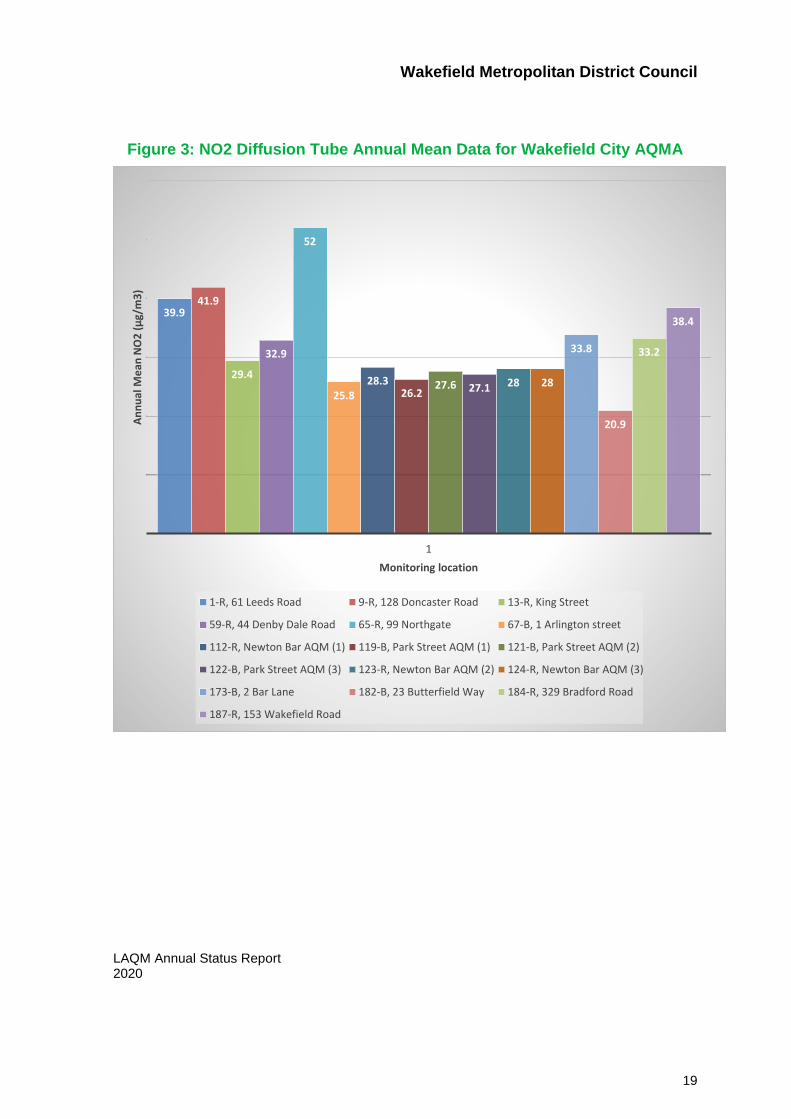
Two diffusion tube monitoring locations in the Wakefield City AQMA had an annual
mean NO2 level above the air quality objective level in 2019:
Doncaster Road – 42µg/m3 (roadside location, 5 metres from the kerb and
representative of relevant residential exposure);
Northgate - 52µg/m3 (roadside location, X metres from the kerb and
representative of relevant residential exposure).
Two locations had a significant increase in values from 2018:
Site ID 65-R: Northgate (33.9 µg/m3 to 52.0 µg/m3);
Site ID 173-B: Bar Lane (28.4 µg/m3 to 33.8 µg/m3);
Other diffusion tube locations showed slight rises over 2018 results but are
consistent with previous years. Generally, the trend is for slightly reducing
concentrations of NO2. The five year trend of results from current fiffusion tubes is
presented in figure X, below. The annual mean NO2 concentration for each diffusion
tube in 2019 is presented in Figure 3.
Wakefield Metropolitan District Council
LAQM Annual Status Report 2020 19
Figure 3: NO2 Diffusion Tube Annual Mean Data for Wakefield City AQMA
39.941.9
29.4
32.9
52
25.828.3
26.227.6 27.1 28 28
33.8
20.9
33.2
38.4
1
An
nu
al M
ean
NO
2 (
µg/
m3
)
Monitoring location
1-R, 61 Leeds Road 9-R, 128 Doncaster Road 13-R, King Street
59-R, 44 Denby Dale Road 65-R, 99 Northgate 67-B, 1 Arlington street
112-R, Newton Bar AQM (1) 119-B, Park Street AQM (1) 121-B, Park Street AQM (2)
122-B, Park Street AQM (3) 123-R, Newton Bar AQM (2) 124-R, Newton Bar AQM (3)
173-B, 2 Bar Lane 182-B, 23 Butterfield Way 184-R, 329 Bradford Road
187-R, 153 Wakefield Road
Wakefield Metropolitan District Council
LAQM Annual Status Report 2020 20
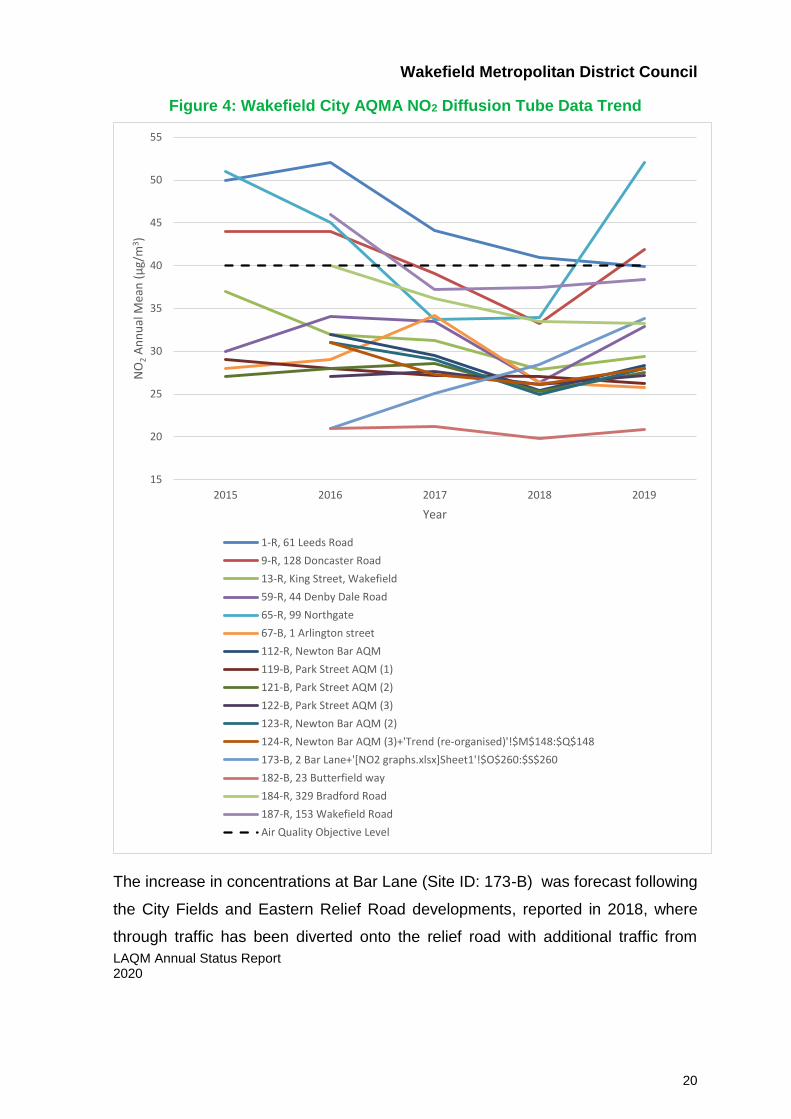
Figure 4: Wakefield City AQMA NO2 Diffusion Tube Data Trend
The increase in concentrations at Bar Lane (Site ID: 173-B) was forecast following
the City Fields and Eastern Relief Road developments, reported in 2018, where
through traffic has been diverted onto the relief road with additional traffic from
15
20
25
30
35
40
45
50
55
2015 2016 2017 2018 2019
NO
2A
nn
ual
Mea
n (
µg/
m3)
Year
1-R, 61 Leeds Road
9-R, 128 Doncaster Road
13-R, King Street, Wakefield
59-R, 44 Denby Dale Road
65-R, 99 Northgate
67-B, 1 Arlington street
112-R, Newton Bar AQM
119-B, Park Street AQM (1)
121-B, Park Street AQM (2)
122-B, Park Street AQM (3)
123-R, Newton Bar AQM (2)
124-R, Newton Bar AQM (3)+'Trend (re-organised)'!$M$148:$Q$148
173-B, 2 Bar Lane+'[NO2 graphs.xlsx]Sheet1'!$O$260:$S$260
182-B, 23 Butterfield way
184-R, 329 Bradford Road
187-R, 153 Wakefield Road
Air Quality Objective Level
Wakefield Metropolitan District Council
LAQM Annual Status Report 2020 21
progressive major housing and commercial development. Increased traffic flow is
accomodated on the existing Bar Lane leading to an increase in congestion at its
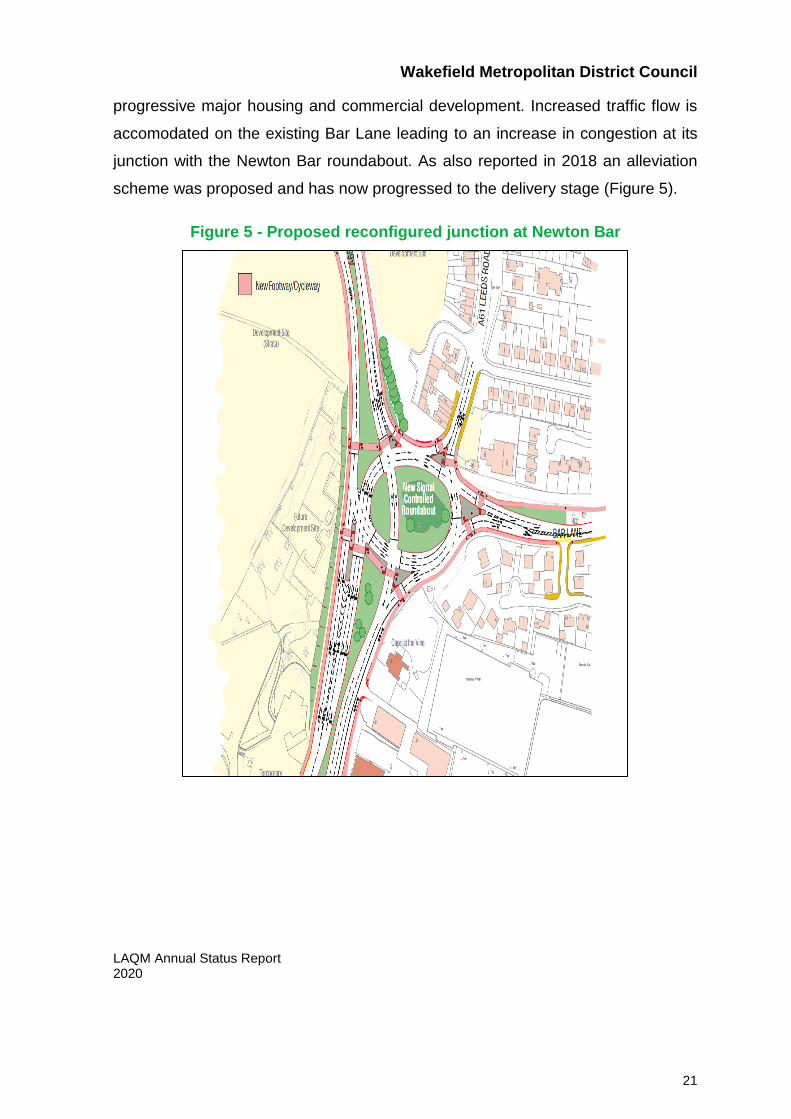
junction with the Newton Bar roundabout. As also reported in 2018 an alleviation
scheme was proposed and has now progressed to the delivery stage (Figure 5).
Figure 5 - Proposed reconfigured junction at Newton Bar
Wakefield Metropolitan District Council
LAQM Annual Status Report 2020 22
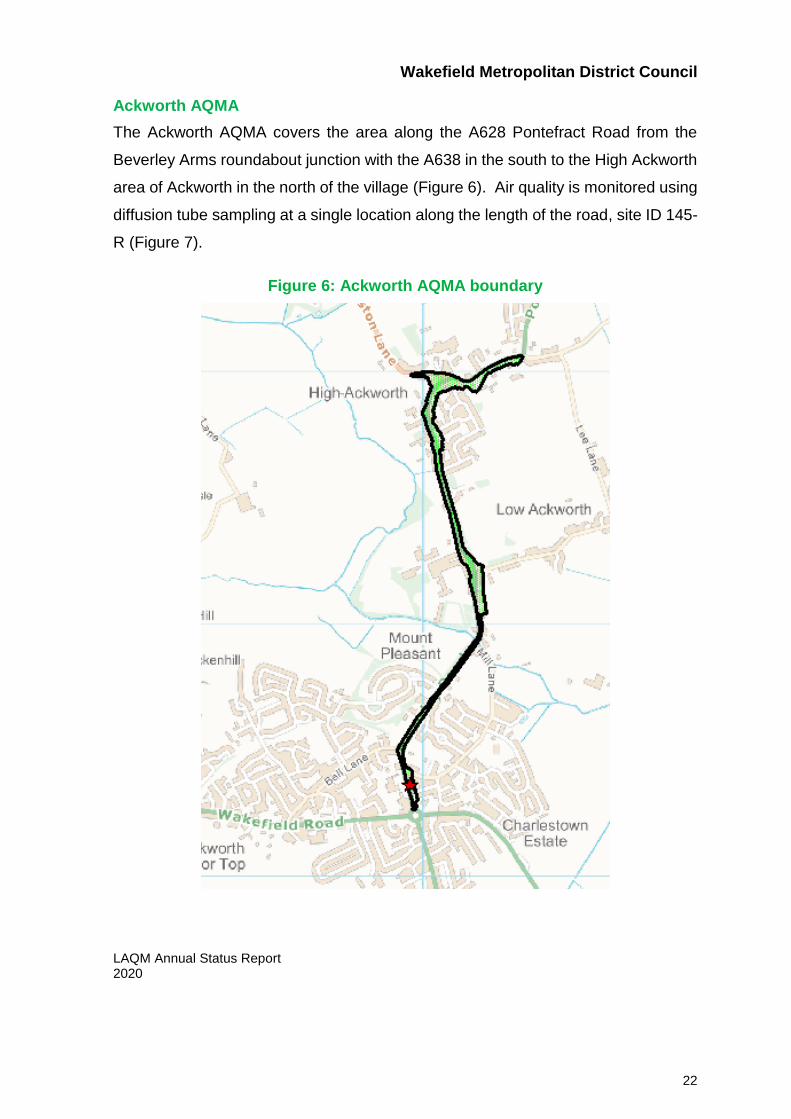
Ackworth AQMA
The Ackworth AQMA covers the area along the A628 Pontefract Road from the
Beverley Arms roundabout junction with the A638 in the south to the High Ackworth
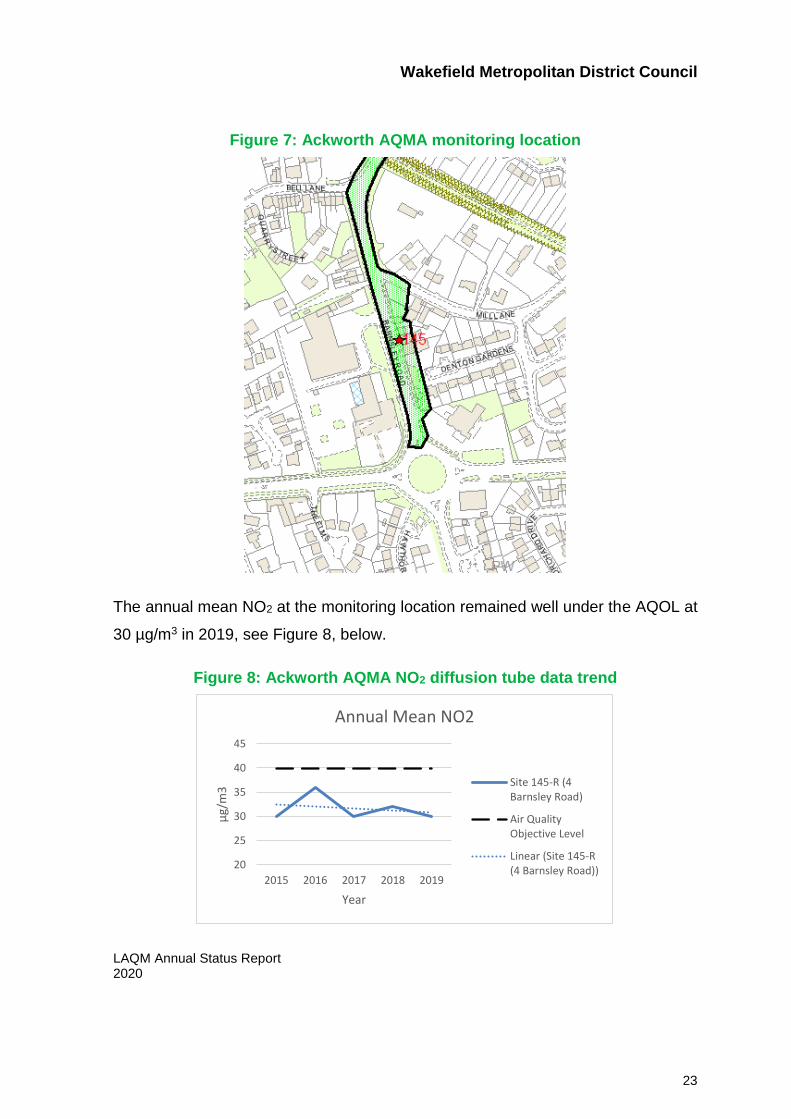
area of Ackworth in the north of the village (Figure 6). Air quality is monitored using
diffusion tube sampling at a single location along the length of the road, site ID 145-
R (Figure 7).
Figure 6: Ackworth AQMA boundary
Wakefield Metropolitan District Council
LAQM Annual Status Report 2020 23
Figure 7: Ackworth AQMA monitoring location
The annual mean NO2 at the monitoring location remained well under the AQOL at
30 µg/m3 in 2019, see Figure 8, below.
Figure 8: Ackworth AQMA NO2 diffusion tube data trend
20
25
30
35
40
45
2015 2016 2017 2018 2019
µg/
m3
Year
Annual Mean NO2
Site 145-R (4Barnsley Road)
Air QualityObjective Level
Linear (Site 145-R(4 Barnsley Road))
Wakefield Metropolitan District Council
LAQM Annual Status Report 2020 24
As reported in the 2018 Annual Status Report, a feasibility study for the construction
of a relief road (South Featherstone Link Road) has been undertaken. This relief
road would divert some through-traffic away from the Ackworth AQMA. See Table
2.2, above.
The AQMA will be considered for revocation should the outcome of the impact
assessment of the proposed link road demonstrate future continued compliance with
the AQOL.
Wakefield Metropolitan District Council
LAQM Annual Status Report 2020 25
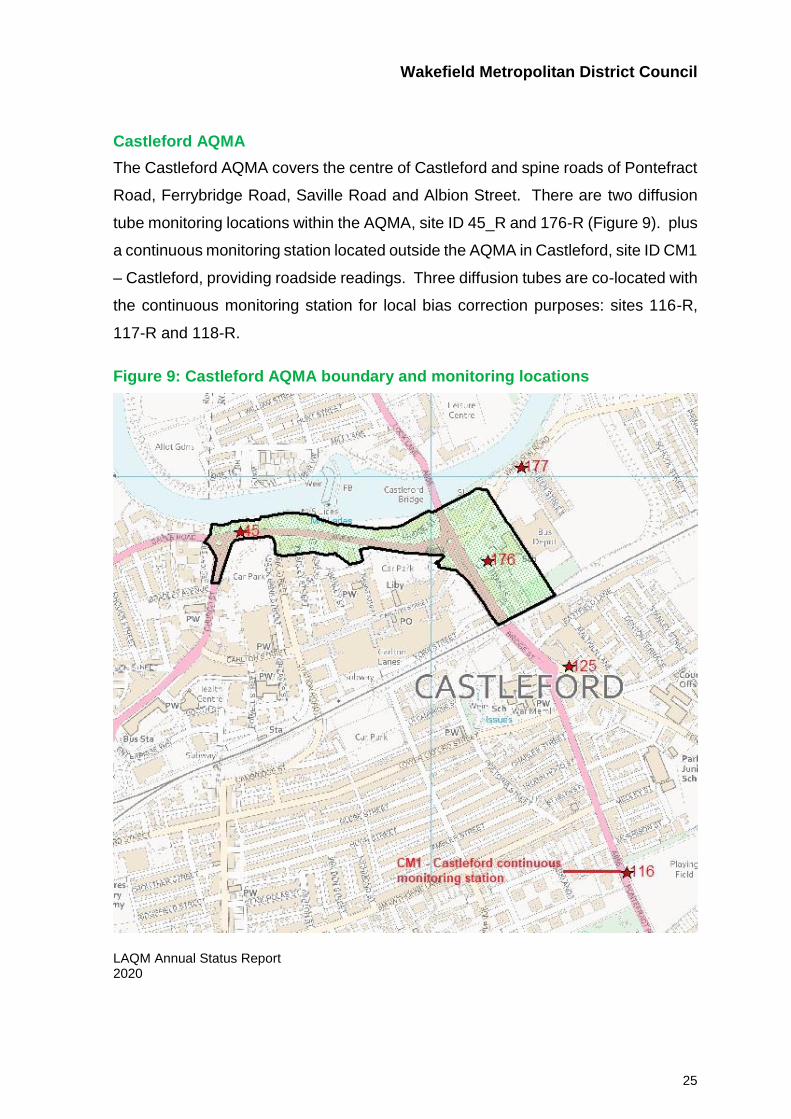
Castleford AQMA
The Castleford AQMA covers the centre of Castleford and spine roads of Pontefract
Road, Ferrybridge Road, Saville Road and Albion Street. There are two diffusion
tube monitoring locations within the AQMA, site ID 45_R and 176-R (Figure 9). plus
a continuous monitoring station located outside the AQMA in Castleford, site ID CM1
– Castleford, providing roadside readings. Three diffusion tubes are co-located with
the continuous monitoring station for local bias correction purposes: sites 116-R,
117-R and 118-R.
Figure 9: Castleford AQMA boundary and monitoring locations
Wakefield Metropolitan District Council
LAQM Annual Status Report 2020 26
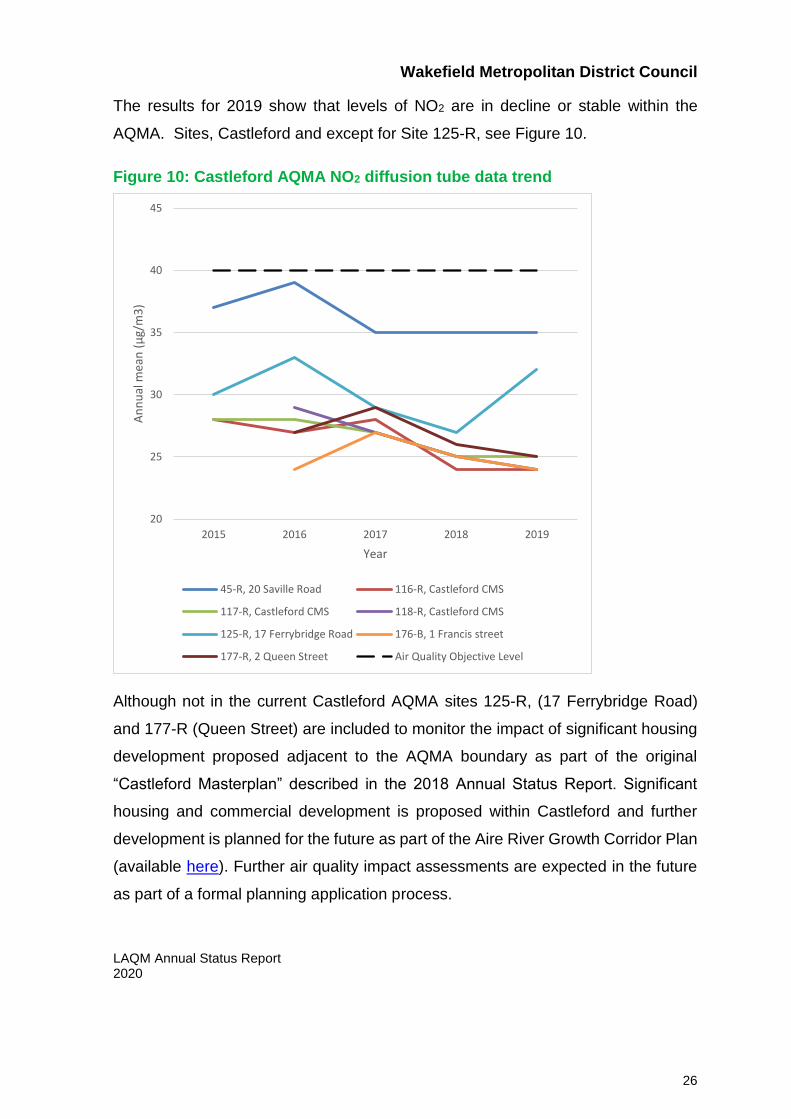
The results for 2019 show that levels of NO2 are in decline or stable within the
AQMA. Sites, Castleford and except for Site 125-R, see Figure 10.
Figure 10: Castleford AQMA NO2 diffusion tube data trend
Although not in the current Castleford AQMA sites 125-R, (17 Ferrybridge Road)
and 177-R (Queen Street) are included to monitor the impact of significant housing
development proposed adjacent to the AQMA boundary as part of the original
“Castleford Masterplan” described in the 2018 Annual Status Report. Significant
housing and commercial development is proposed within Castleford and further
development is planned for the future as part of the Aire River Growth Corridor Plan
(available here). Further air quality impact assessments are expected in the future
as part of a formal planning application process.
20
25
30
35
40
45
2015 2016 2017 2018 2019
An
nu
al m
ean
(µ
g/m
3)
Year
45-R, 20 Saville Road 116-R, Castleford CMS
117-R, Castleford CMS 118-R, Castleford CMS
125-R, 17 Ferrybridge Road 176-B, 1 Francis street
177-R, 2 Queen Street Air Quality Objective Level
Wakefield Metropolitan District Council
LAQM Annual Status Report 2020 27
Whereas all other results in Castleford showed stable or gradually declining levels
of NO2, site 125_R showed a significant rise over 2018 results (from 27 µg/m3 to 32
µg/m3). Continued monitoring will identify whether this is an upward trend or an
anomaly in 2019.
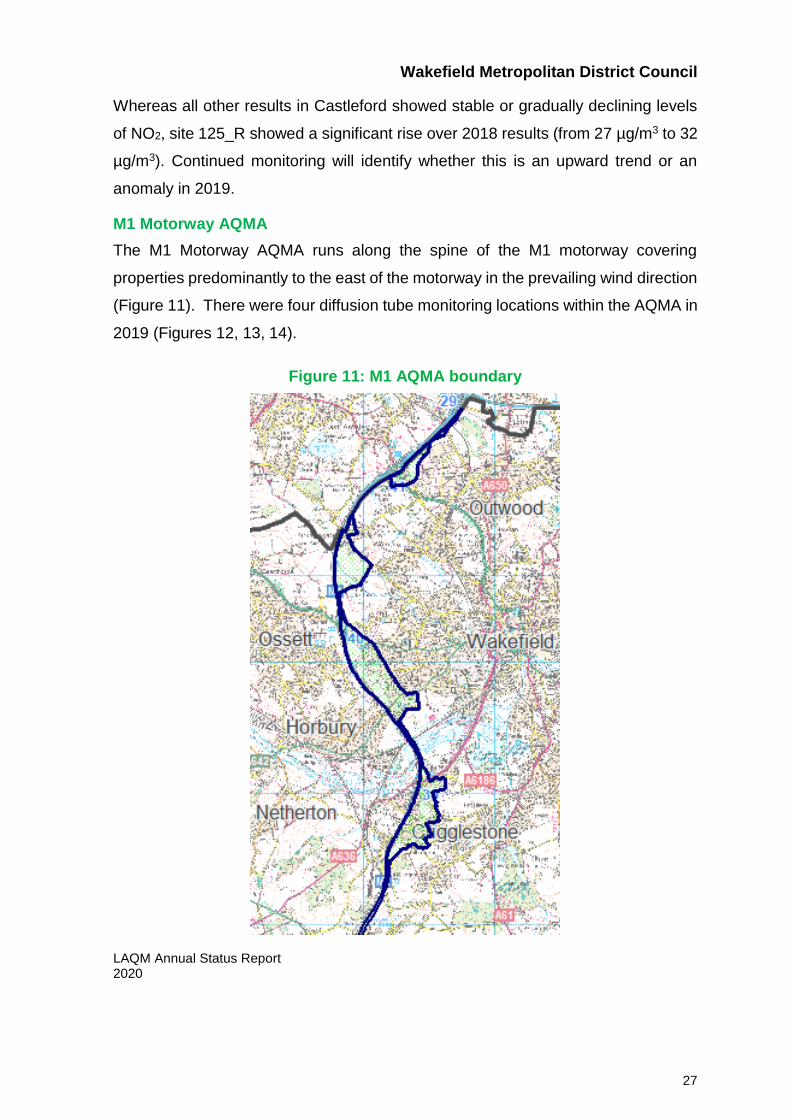
M1 Motorway AQMA
The M1 Motorway AQMA runs along the spine of the M1 motorway covering
properties predominantly to the east of the motorway in the prevailing wind direction
(Figure 11). There were four diffusion tube monitoring locations within the AQMA in
2019 (Figures 12, 13, 14).
Figure 11: M1 AQMA boundary
Wakefield Metropolitan District Council
LAQM Annual Status Report 2020 28
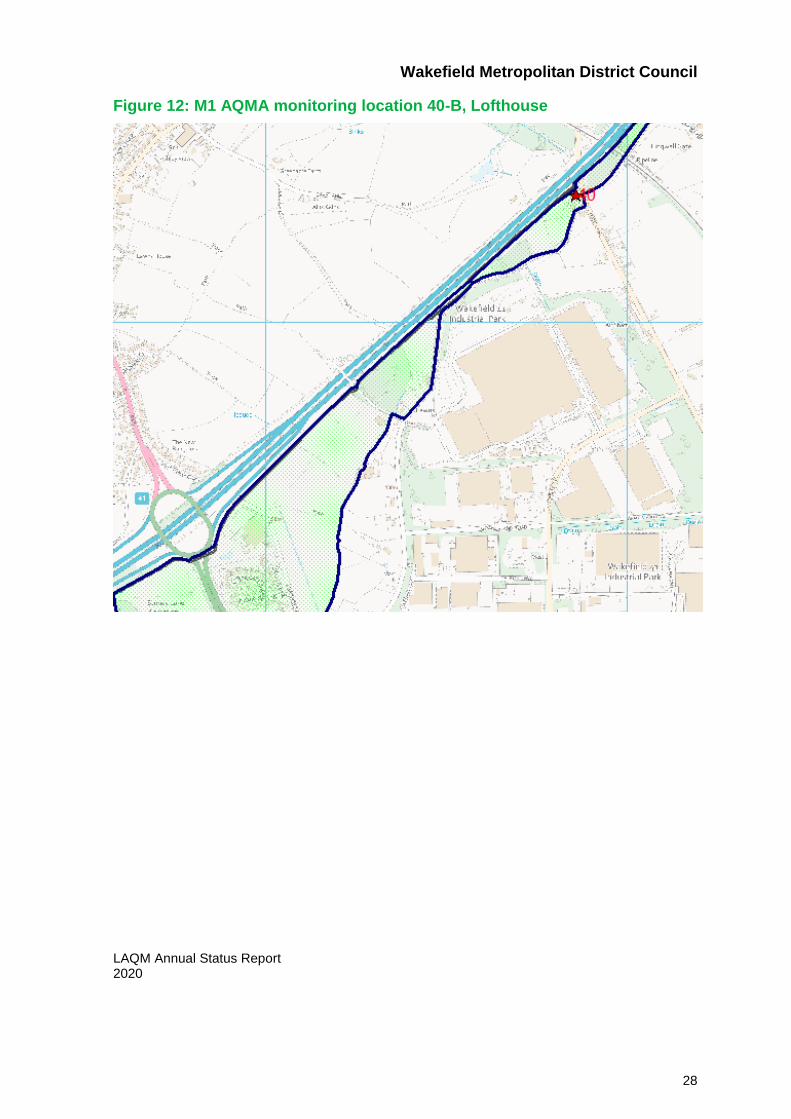
Figure 12: M1 AQMA monitoring location 40-B, Lofthouse
Wakefield Metropolitan District Council
LAQM Annual Status Report 2020 29
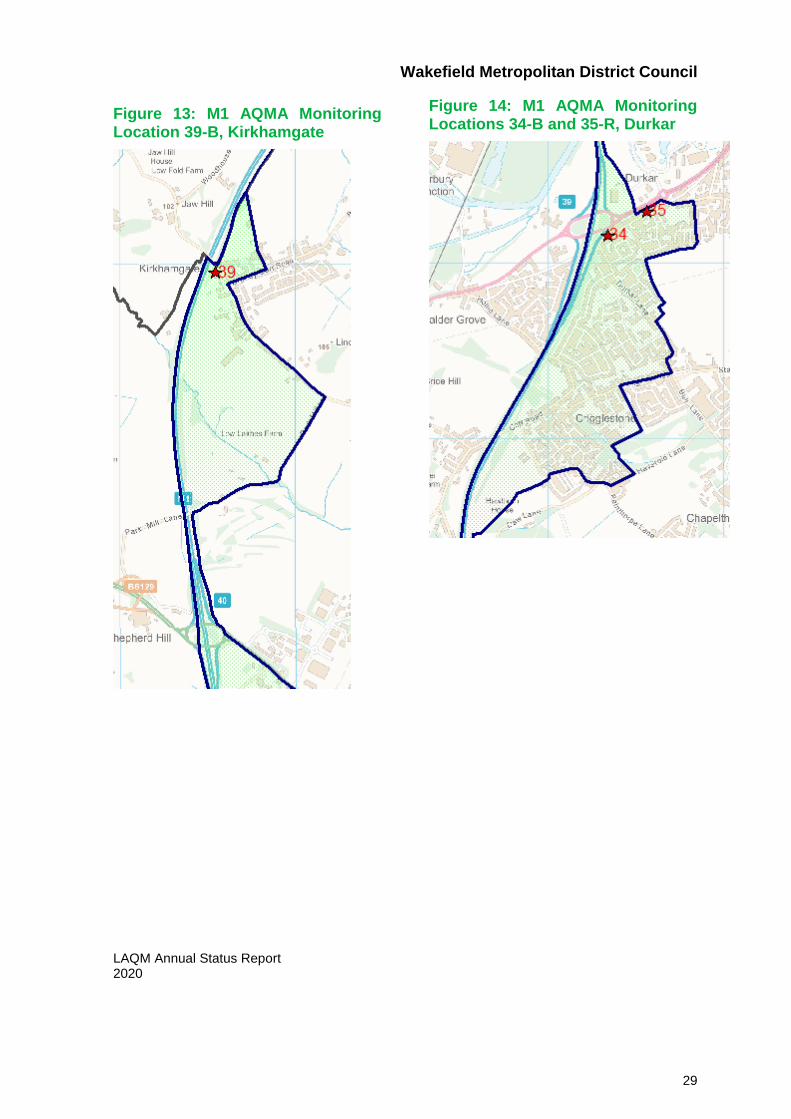
Figure 13: M1 AQMA Monitoring Location 39-B, Kirkhamgate
Figure 14: M1 AQMA Monitoring Locations 34-B and 35-R, Durkar
Wakefield Metropolitan District Council
LAQM Annual Status Report 2020 30
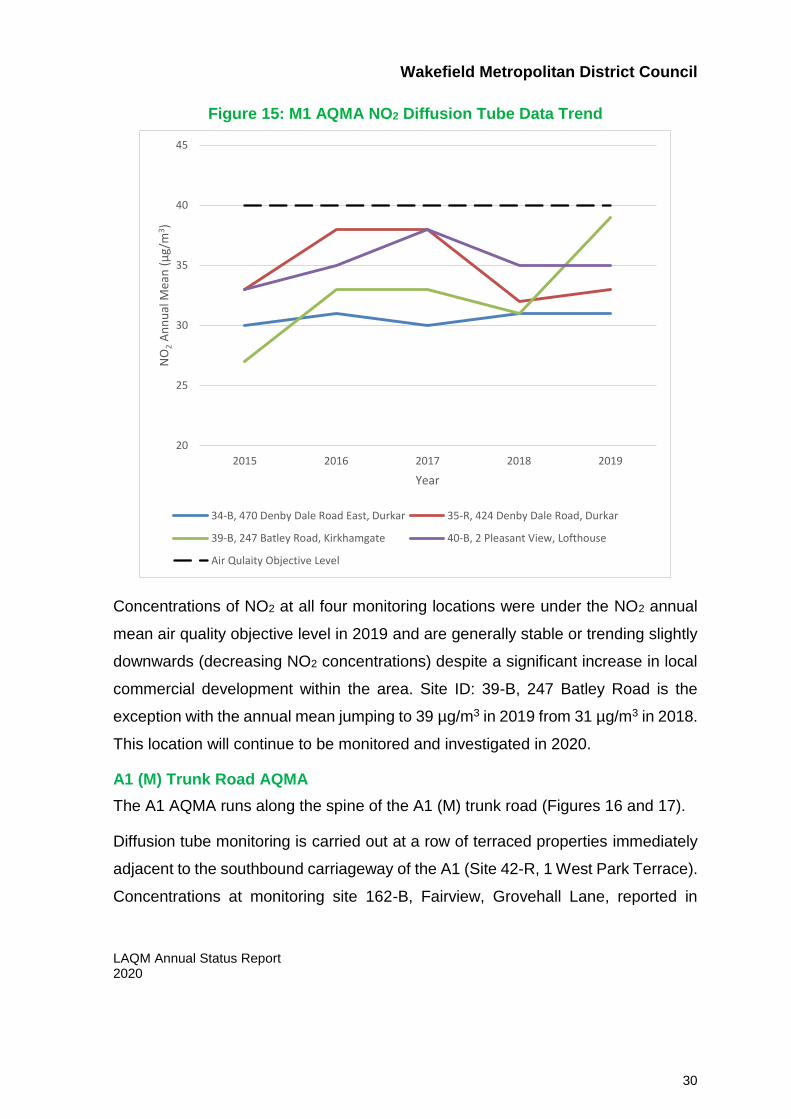
Figure 15: M1 AQMA NO2 Diffusion Tube Data Trend
Concentrations of NO2 at all four monitoring locations were under the NO2 annual
mean air quality objective level in 2019 and are generally stable or trending slightly
downwards (decreasing NO2 concentrations) despite a significant increase in local
commercial development within the area. Site ID: 39-B, 247 Batley Road is the
exception with the annual mean jumping to 39 µg/m3 in 2019 from 31 µg/m3 in 2018.
This location will continue to be monitored and investigated in 2020.
A1 (M) Trunk Road AQMA
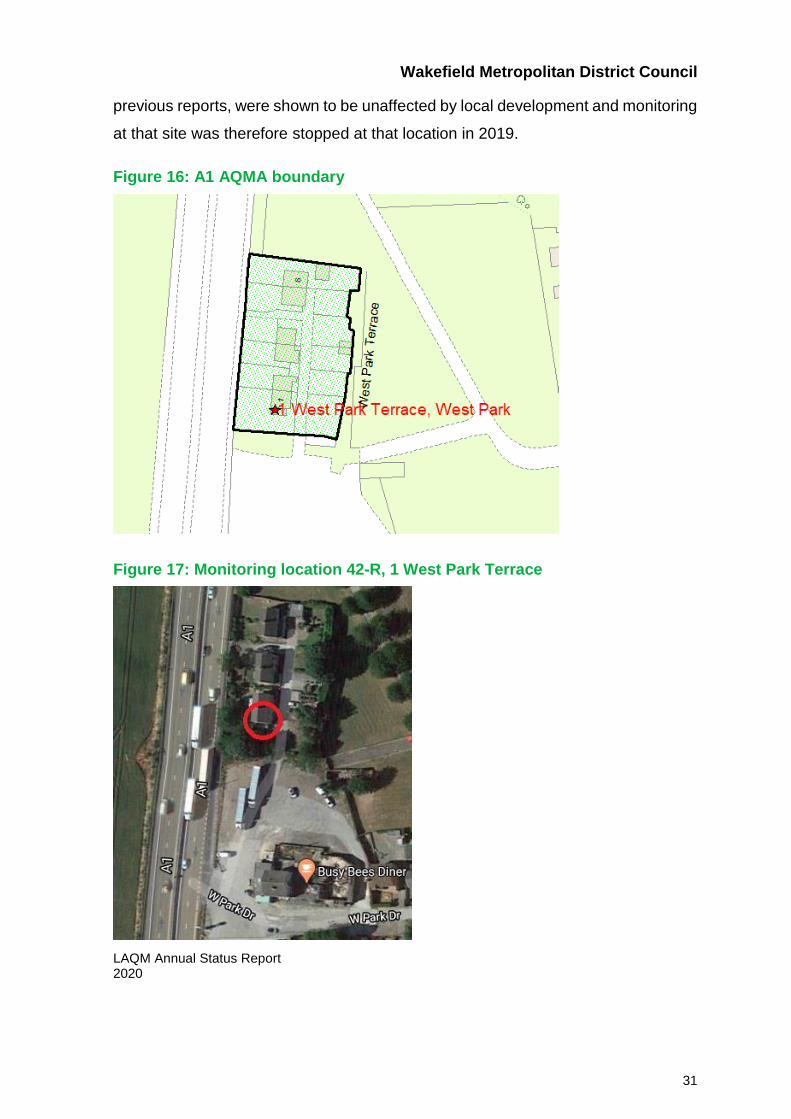
The A1 AQMA runs along the spine of the A1 (M) trunk road (Figures 16 and 17).
Diffusion tube monitoring is carried out at a row of terraced properties immediately
adjacent to the southbound carriageway of the A1 (Site 42-R, 1 West Park Terrace).
Concentrations at monitoring site 162-B, Fairview, Grovehall Lane, reported in
20
25
30
35
40
45
2015 2016 2017 2018 2019
NO
2A
nn
ual
Mea
n (
µg/
m3 )
Year
34-B, 470 Denby Dale Road East, Durkar 35-R, 424 Denby Dale Road, Durkar
39-B, 247 Batley Road, Kirkhamgate 40-B, 2 Pleasant View, Lofthouse
Air Qulaity Objective Level
Wakefield Metropolitan District Council
LAQM Annual Status Report 2020 31
previous reports, were shown to be unaffected by local development and monitoring
at that site was therefore stopped at that location in 2019.
Figure 16: A1 AQMA boundary
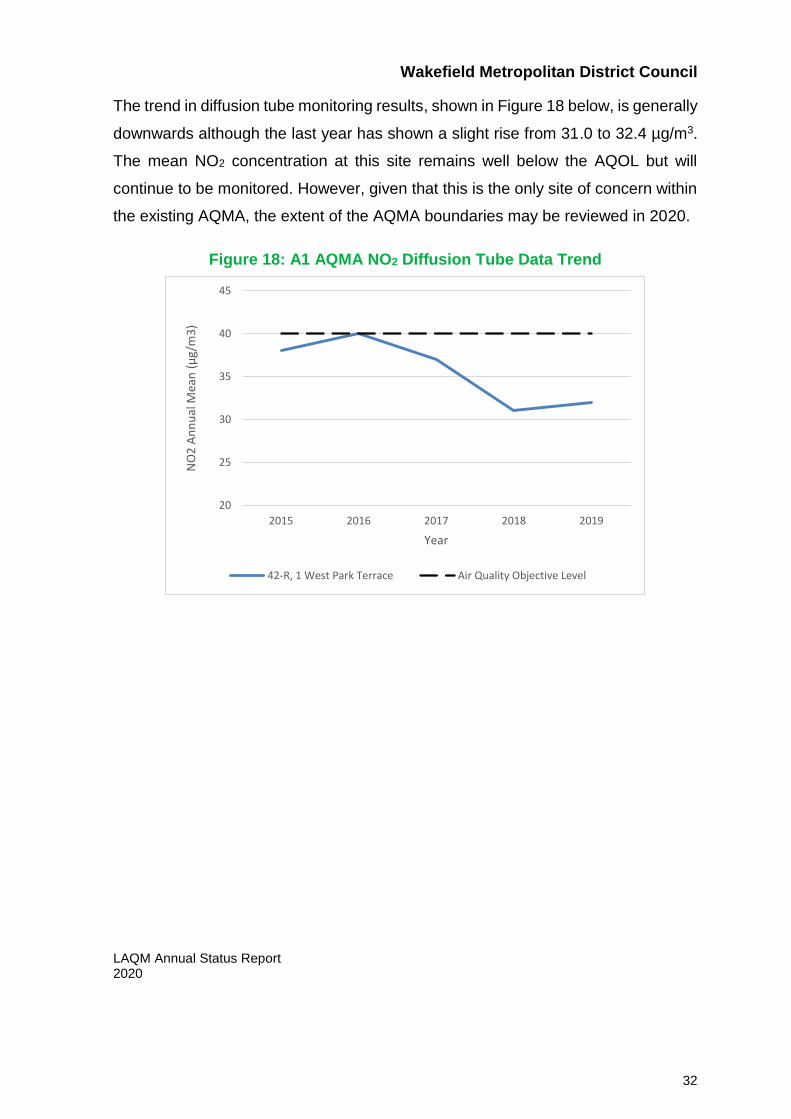
Figure 17: Monitoring location 42-R, 1 West Park Terrace
Wakefield Metropolitan District Council
LAQM Annual Status Report 2020 32
The trend in diffusion tube monitoring results, shown in Figure 18 below, is generally
downwards although the last year has shown a slight rise from 31.0 to 32.4 µg/m3.
The mean NO2 concentration at this site remains well below the AQOL but will
continue to be monitored. However, given that this is the only site of concern within
the existing AQMA, the extent of the AQMA boundaries may be reviewed in 2020.
Figure 18: A1 AQMA NO2 Diffusion Tube Data Trend
20
25
30
35
40
45
2015 2016 2017 2018 2019
NO
2 A
nn
ual
Mea
n (
µg/
m3
)
Year
42-R, 1 West Park Terrace Air Quality Objective Level
Wakefield Metropolitan District Council
LAQM Annual Status Report 2020 33
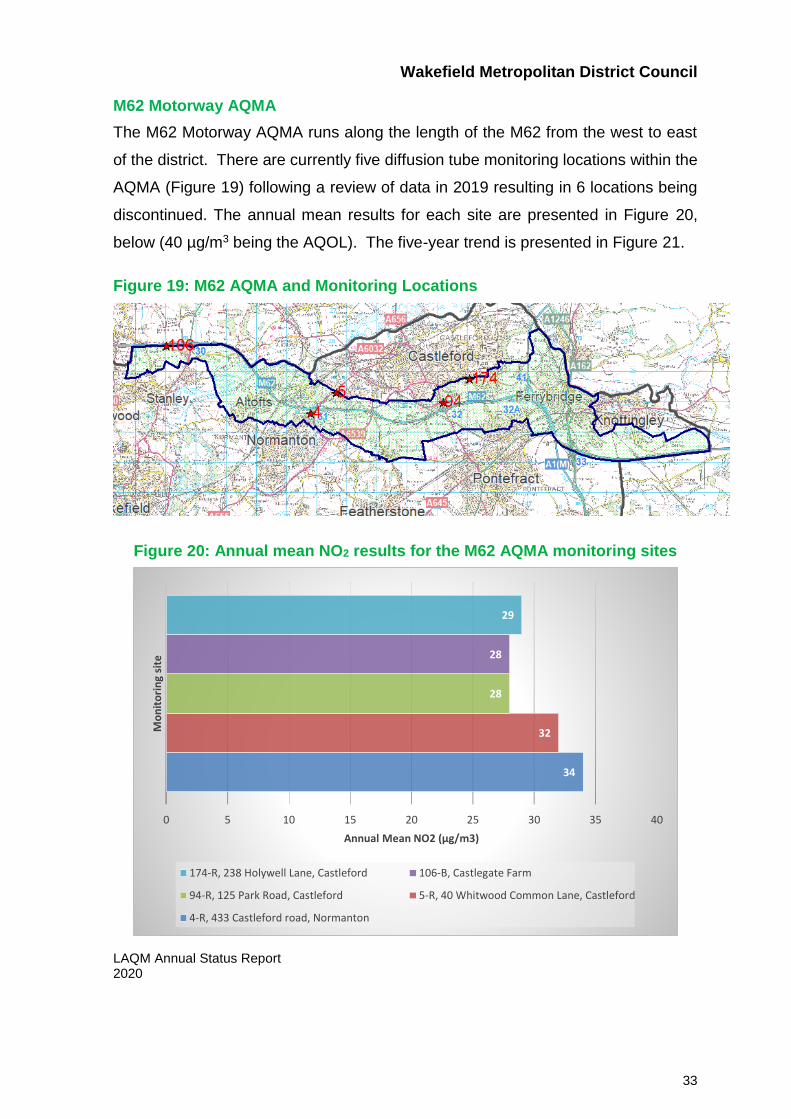
M62 Motorway AQMA
The M62 Motorway AQMA runs along the length of the M62 from the west to east
of the district. There are currently five diffusion tube monitoring locations within the
AQMA (Figure 19) following a review of data in 2019 resulting in 6 locations being
discontinued. The annual mean results for each site are presented in Figure 20,
below (40 µg/m3 being the AQOL). The five-year trend is presented in Figure 21.
Figure 19: M62 AQMA and Monitoring Locations
Figure 20: Annual mean NO2 results for the M62 AQMA monitoring sites
34
32
28
28
29
0 5 10 15 20 25 30 35 40
Annual Mean NO2 (µg/m3)
Mo
nit
ori
ng
site
174-R, 238 Holywell Lane, Castleford 106-B, Castlegate Farm
94-R, 125 Park Road, Castleford 5-R, 40 Whitwood Common Lane, Castleford
4-R, 433 Castleford road, Normanton
Wakefield Metropolitan District Council
LAQM Annual Status Report 2020 34
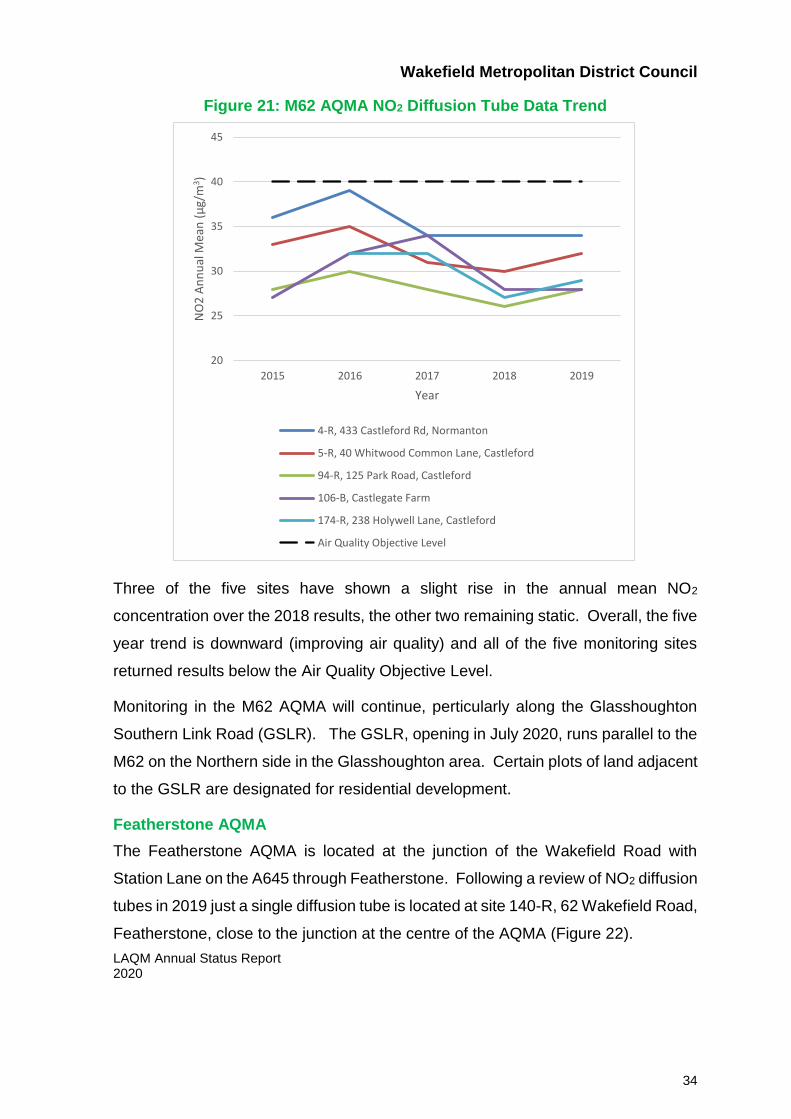
Figure 21: M62 AQMA NO2 Diffusion Tube Data Trend
Three of the five sites have shown a slight rise in the annual mean NO2
concentration over the 2018 results, the other two remaining static. Overall, the five
year trend is downward (improving air quality) and all of the five monitoring sites
returned results below the Air Quality Objective Level.
Monitoring in the M62 AQMA will continue, perticularly along the Glasshoughton
Southern Link Road (GSLR). The GSLR, opening in July 2020, runs parallel to the
M62 on the Northern side in the Glasshoughton area. Certain plots of land adjacent
to the GSLR are designated for residential development.
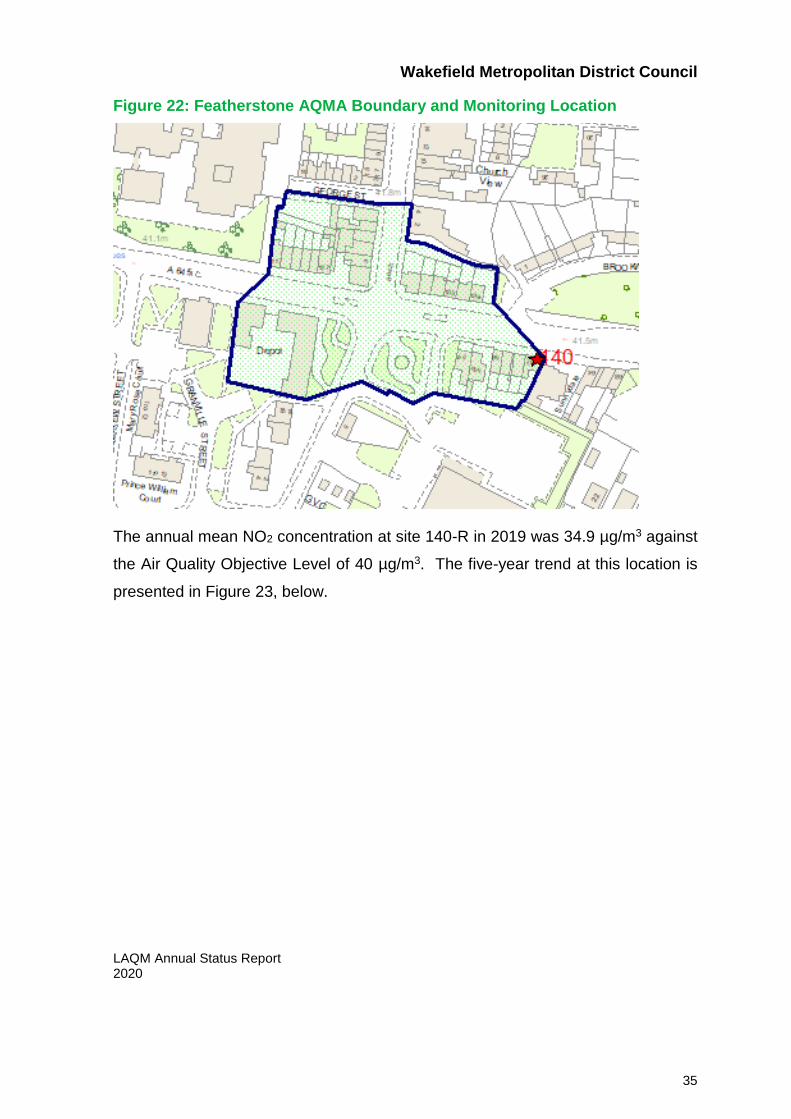
Featherstone AQMA
The Featherstone AQMA is located at the junction of the Wakefield Road with
Station Lane on the A645 through Featherstone. Following a review of NO2 diffusion
tubes in 2019 just a single diffusion tube is located at site 140-R, 62 Wakefield Road,
Featherstone, close to the junction at the centre of the AQMA (Figure 22).
20
25
30
35
40
45
2015 2016 2017 2018 2019
NO
2 A
nn
ual
Mea
n (
µg/
m3 )
Year
4-R, 433 Castleford Rd, Normanton
5-R, 40 Whitwood Common Lane, Castleford
94-R, 125 Park Road, Castleford
106-B, Castlegate Farm
174-R, 238 Holywell Lane, Castleford
Air Quality Objective Level
Wakefield Metropolitan District Council
LAQM Annual Status Report 2020 35
Figure 22: Featherstone AQMA Boundary and Monitoring Location
The annual mean NO2 concentration at site 140-R in 2019 was 34.9 µg/m3 against
the Air Quality Objective Level of 40 µg/m3. The five-year trend at this location is
presented in Figure 23, below.
Wakefield Metropolitan District Council
LAQM Annual Status Report 2020 36
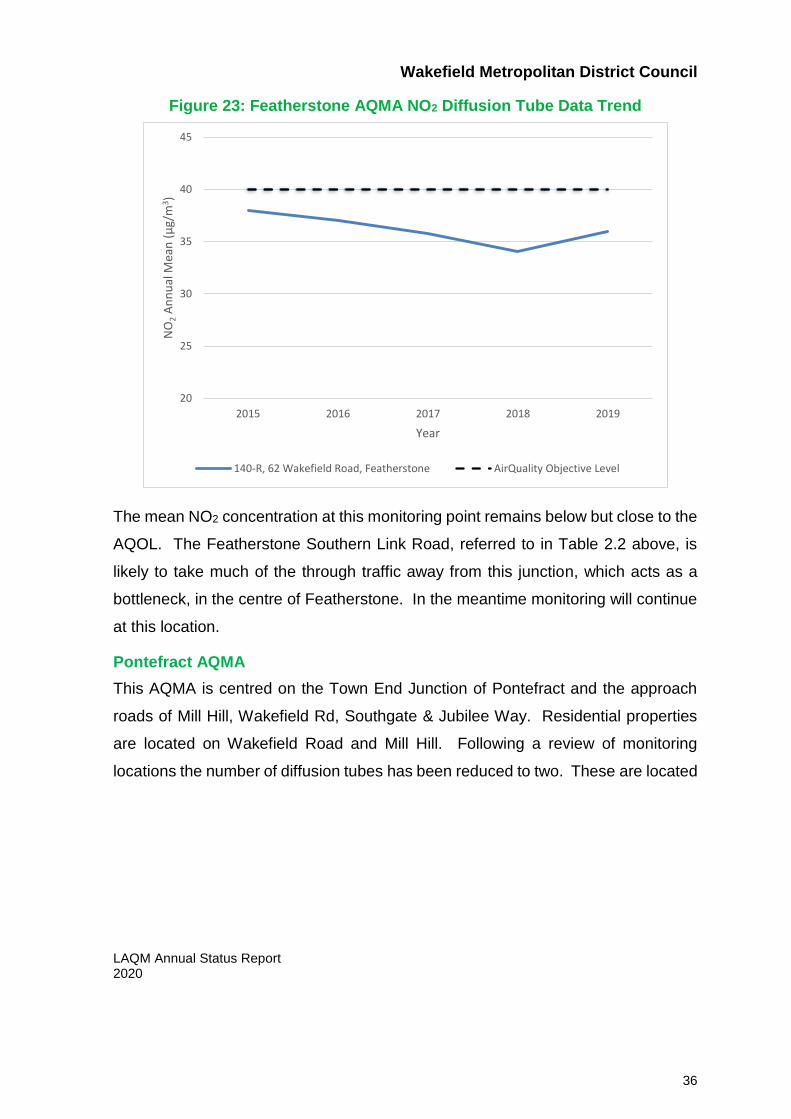
Figure 23: Featherstone AQMA NO2 Diffusion Tube Data Trend
The mean NO2 concentration at this monitoring point remains below but close to the
AQOL. The Featherstone Southern Link Road, referred to in Table 2.2 above, is
likely to take much of the through traffic away from this junction, which acts as a
bottleneck, in the centre of Featherstone. In the meantime monitoring will continue
at this location.
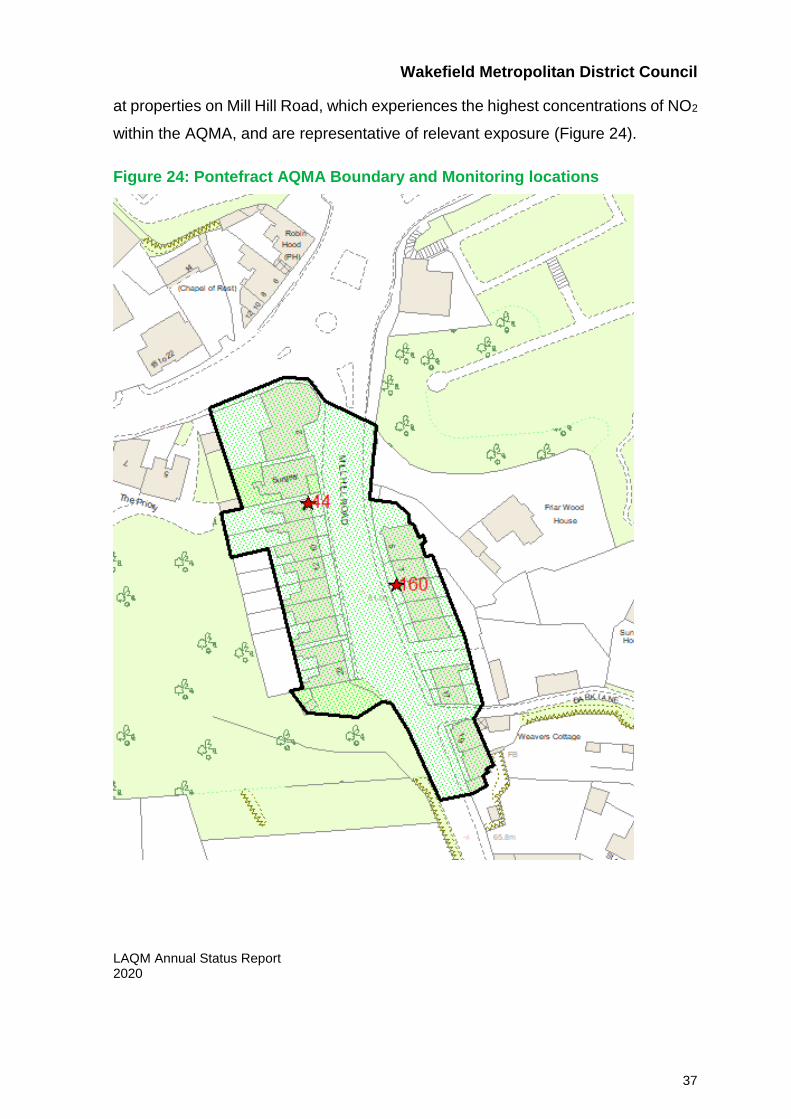
Pontefract AQMA
This AQMA is centred on the Town End Junction of Pontefract and the approach
roads of Mill Hill, Wakefield Rd, Southgate & Jubilee Way. Residential properties
are located on Wakefield Road and Mill Hill. Following a review of monitoring
locations the number of diffusion tubes has been reduced to two. These are located
20
25
30
35
40
45
2015 2016 2017 2018 2019
NO
2A
nn
ual
Mea
n (
µg/
m3)
Year
140-R, 62 Wakefield Road, Featherstone AirQuality Objective Level
Wakefield Metropolitan District Council
LAQM Annual Status Report 2020 37
at properties on Mill Hill Road, which experiences the highest concentrations of NO2
within the AQMA, and are representative of relevant exposure (Figure 24).
Figure 24: Pontefract AQMA Boundary and Monitoring locations
Wakefield Metropolitan District Council
LAQM Annual Status Report 2020 38
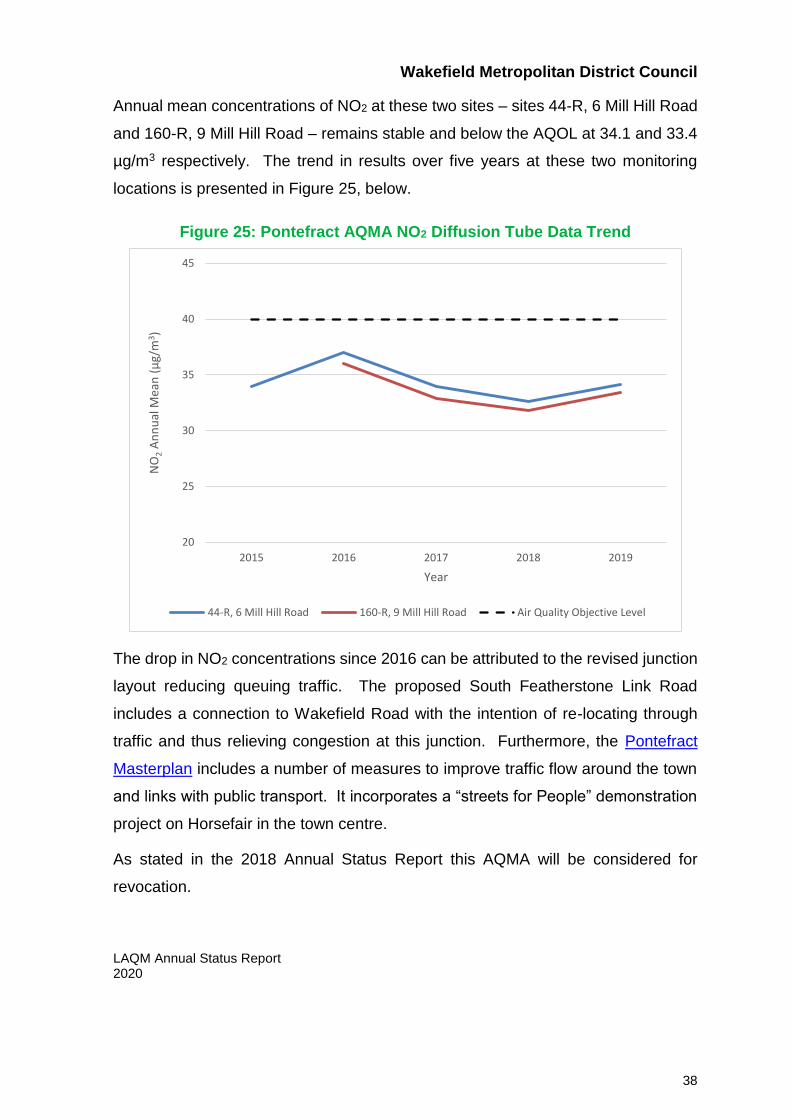
Annual mean concentrations of NO2 at these two sites – sites 44-R, 6 Mill Hill Road
and 160-R, 9 Mill Hill Road – remains stable and below the AQOL at 34.1 and 33.4
µg/m3 respectively. The trend in results over five years at these two monitoring
locations is presented in Figure 25, below.
Figure 25: Pontefract AQMA NO2 Diffusion Tube Data Trend
The drop in NO2 concentrations since 2016 can be attributed to the revised junction
layout reducing queuing traffic. The proposed South Featherstone Link Road
includes a connection to Wakefield Road with the intention of re-locating through
traffic and thus relieving congestion at this junction. Furthermore, the Pontefract
Masterplan includes a number of measures to improve traffic flow around the town
and links with public transport. It incorporates a “streets for People” demonstration
project on Horsefair in the town centre.
As stated in the 2018 Annual Status Report this AQMA will be considered for
revocation.
20
25
30
35
40
45
2015 2016 2017 2018 2019
NO
2A
nn
ual
Mea
n (
µg/
m3 )
Year
44-R, 6 Mill Hill Road 160-R, 9 Mill Hill Road Air Quality Objective Level
Wakefield Metropolitan District Council
LAQM Annual Status Report 2020 39
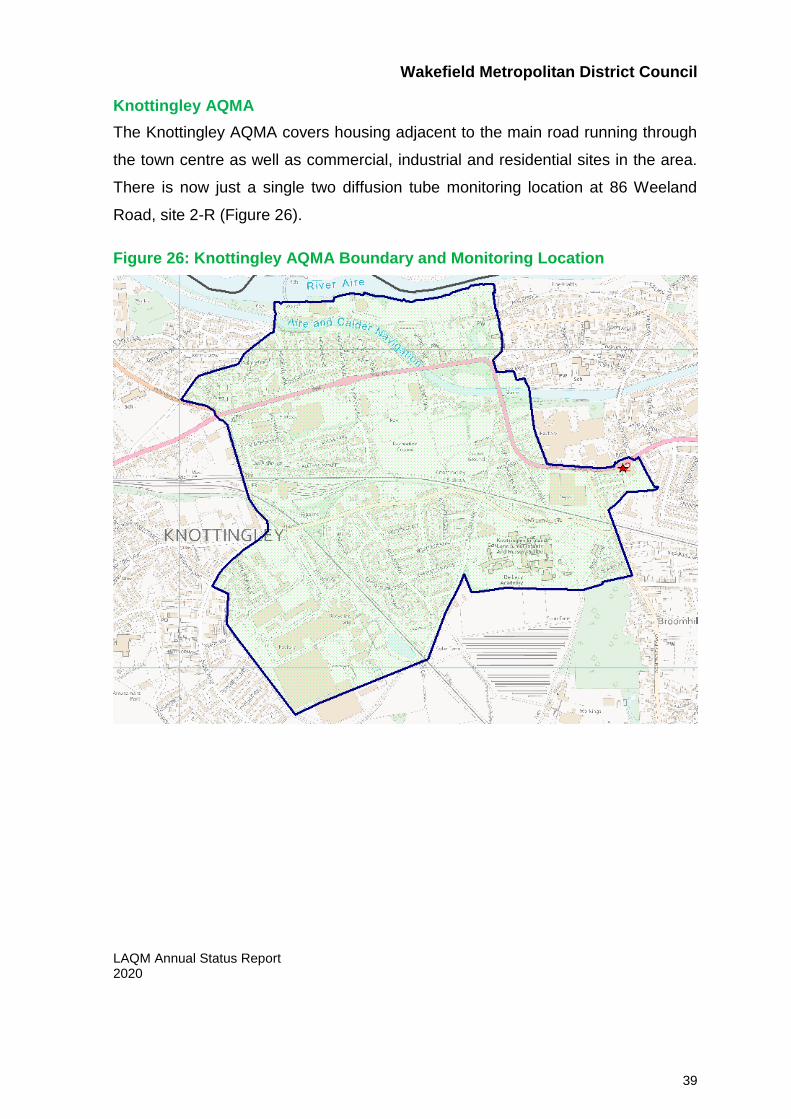
Knottingley AQMA
The Knottingley AQMA covers housing adjacent to the main road running through
the town centre as well as commercial, industrial and residential sites in the area.
There is now just a single two diffusion tube monitoring location at 86 Weeland
Road, site 2-R (Figure 26).
Figure 26: Knottingley AQMA Boundary and Monitoring Location
Wakefield Metropolitan District Council
LAQM Annual Status Report 2020 40
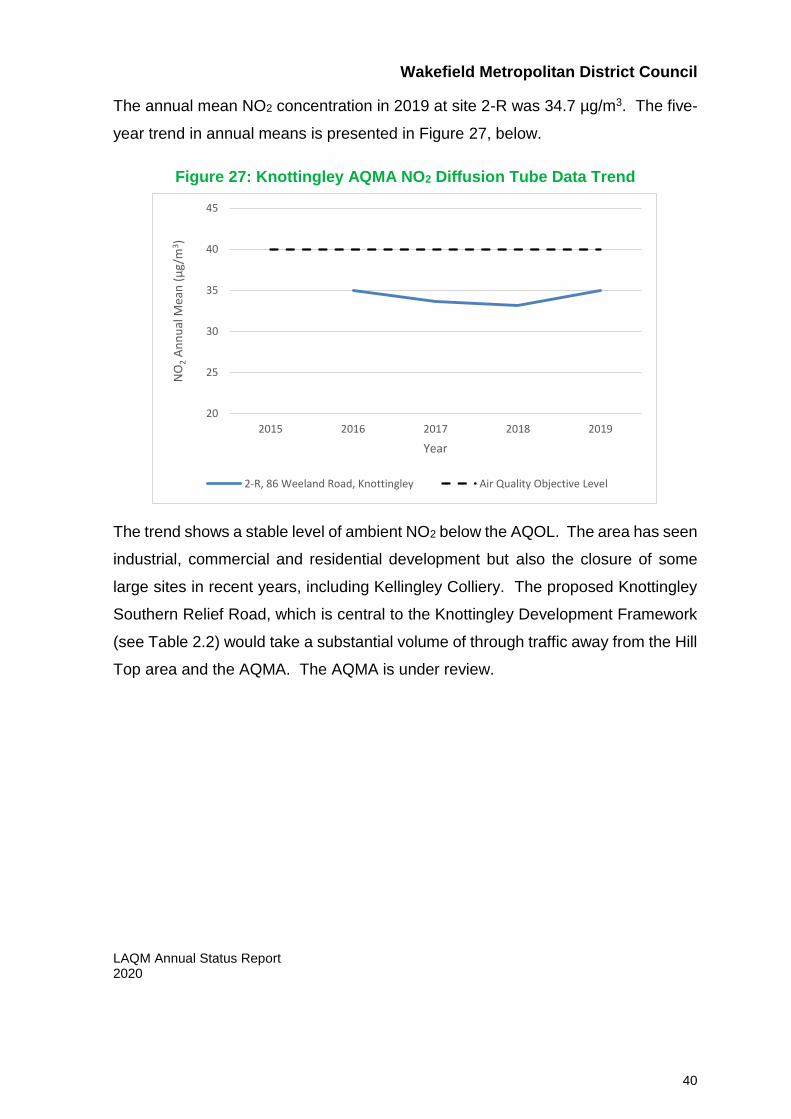
The annual mean NO2 concentration in 2019 at site 2-R was 34.7 µg/m3. The five-
year trend in annual means is presented in Figure 27, below.
Figure 27: Knottingley AQMA NO2 Diffusion Tube Data Trend
The trend shows a stable level of ambient NO2 below the AQOL. The area has seen
industrial, commercial and residential development but also the closure of some
large sites in recent years, including Kellingley Colliery. The proposed Knottingley
Southern Relief Road, which is central to the Knottingley Development Framework
(see Table 2.2) would take a substantial volume of through traffic away from the Hill
Top area and the AQMA. The AQMA is under review.
20
25
30
35
40
45
2015 2016 2017 2018 2019
NO
2A
nn
ual
Mea
n (
µg/
m3 )
Year
2-R, 86 Weeland Road, Knottingley Air Quality Objective Level
Wakefield Metropolitan District Council
LAQM Annual Status Report 2020 41
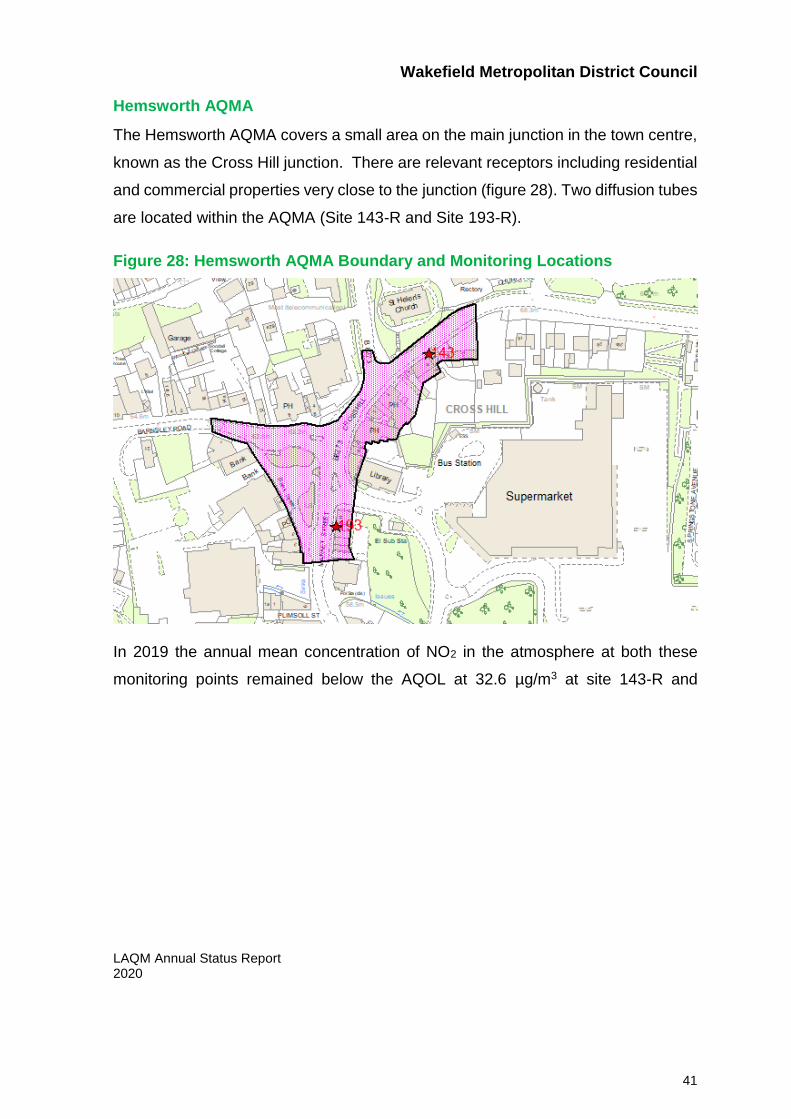
Hemsworth AQMA
The Hemsworth AQMA covers a small area on the main junction in the town centre,
known as the Cross Hill junction. There are relevant receptors including residential
and commercial properties very close to the junction (figure 28). Two diffusion tubes
are located within the AQMA (Site 143-R and Site 193-R).
Figure 28: Hemsworth AQMA Boundary and Monitoring Locations
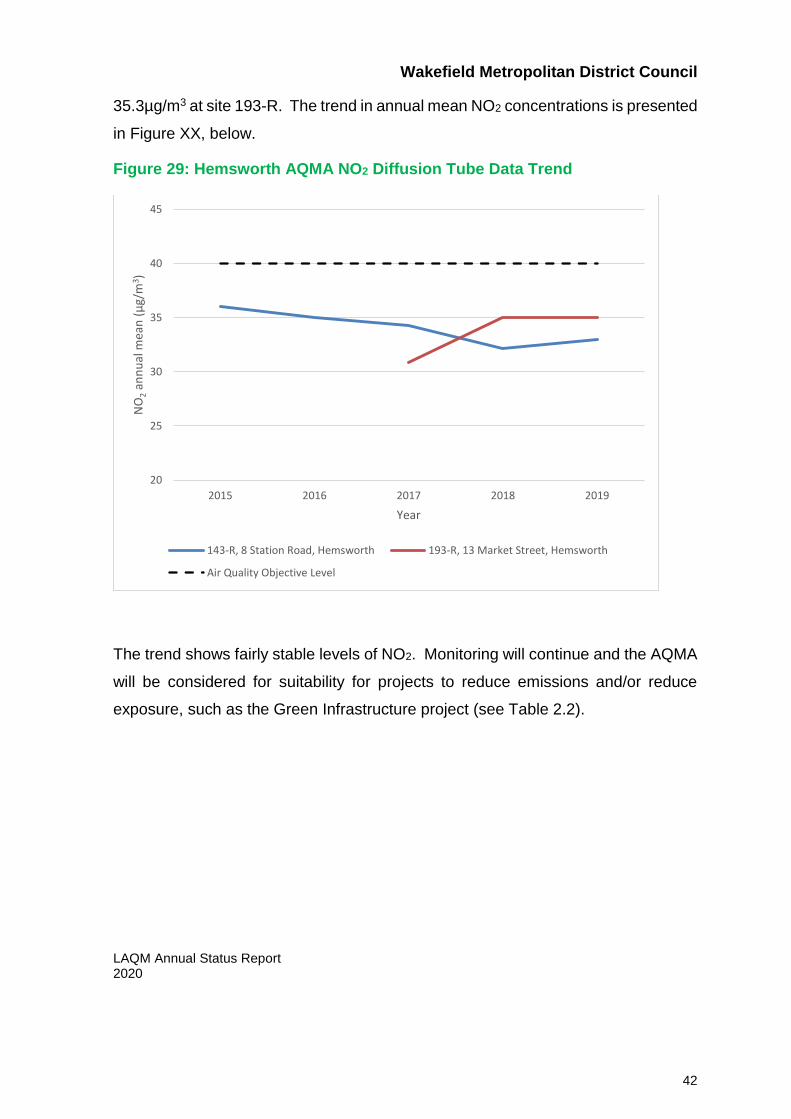
In 2019 the annual mean concentration of NO2 in the atmosphere at both these
monitoring points remained below the AQOL at 32.6 µg/m3 at site 143-R and
Wakefield Metropolitan District Council
LAQM Annual Status Report 2020 42
35.3µg/m3 at site 193-R. The trend in annual mean NO2 concentrations is presented
in Figure XX, below.
Figure 29: Hemsworth AQMA NO2 Diffusion Tube Data Trend
The trend shows fairly stable levels of NO2. Monitoring will continue and the AQMA
will be considered for suitability for projects to reduce emissions and/or reduce
exposure, such as the Green Infrastructure project (see Table 2.2).
20
25
30
35
40
45
2015 2016 2017 2018 2019
NO
2an
nu
al m
ean
(µ
g/m
3 )
Year
143-R, 8 Station Road, Hemsworth 193-R, 13 Market Street, Hemsworth
Air Quality Objective Level
Wakefield Metropolitan District Council
LAQM Annual Status Report 2020 43
3.2.2 Particulate Matter (PM10)
Continuous monitoring of PM10 has been undertaken at the CM3 - Park Street
monitoring station since 2016, giving four years’ worth of data following a break in
the monitoring of particulate matter.
The particulate monitor at CM3 - Park Street is located within the Wakefield City
AQMA at OSGB36 coordinates 433718, 420371. All data for 2019 was ratified by
Wakefield Council’s external partner, Ricardo AEA.
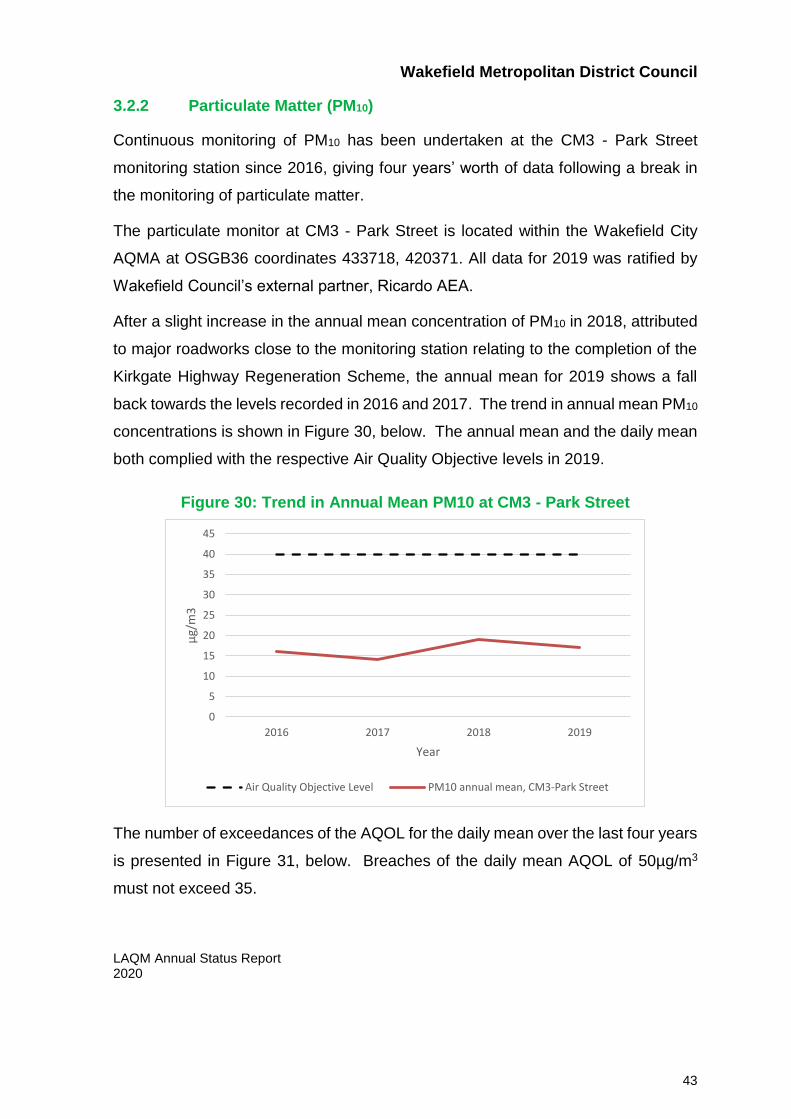
After a slight increase in the annual mean concentration of PM10 in 2018, attributed
to major roadworks close to the monitoring station relating to the completion of the
Kirkgate Highway Regeneration Scheme, the annual mean for 2019 shows a fall
back towards the levels recorded in 2016 and 2017. The trend in annual mean PM10
concentrations is shown in Figure 30, below. The annual mean and the daily mean
both complied with the respective Air Quality Objective levels in 2019.
Figure 30: Trend in Annual Mean PM10 at CM3 - Park Street
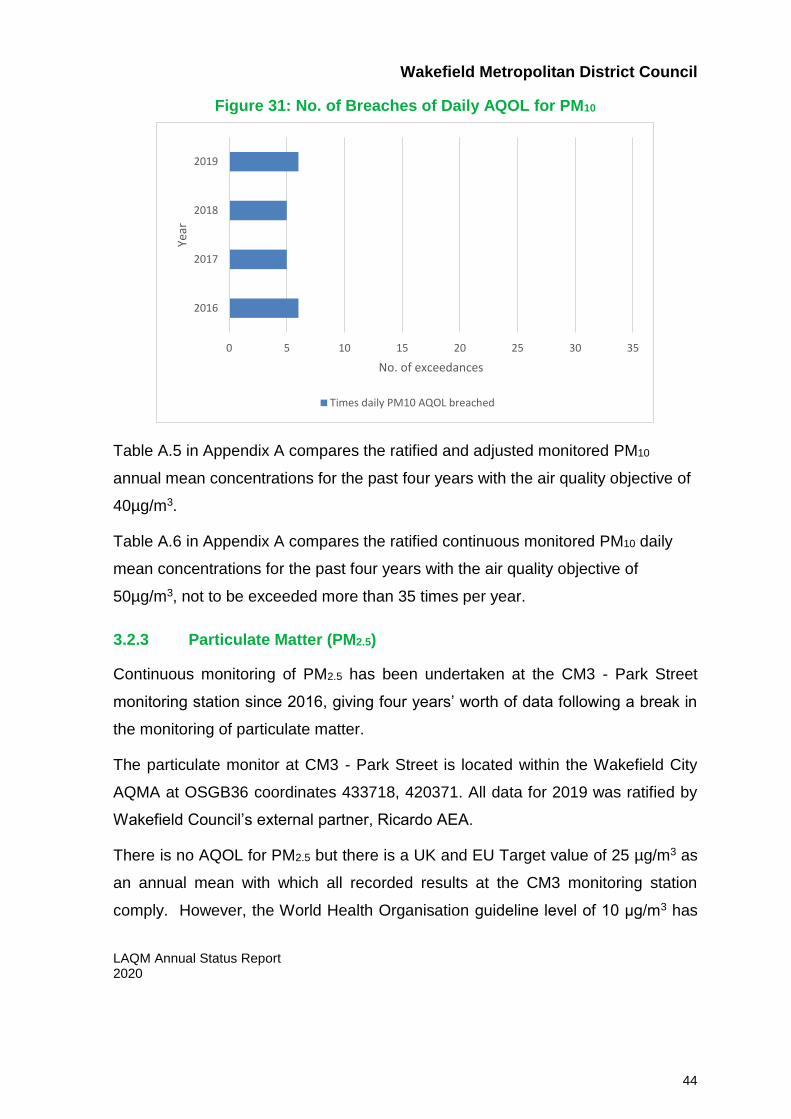
The number of exceedances of the AQOL for the daily mean over the last four years
is presented in Figure 31, below. Breaches of the daily mean AQOL of 50µg/m3
must not exceed 35.
0
5
10
15
20
25
30
35
40
45
2016 2017 2018 2019
µg/
m3
Year
Air Quality Objective Level PM10 annual mean, CM3-Park Street
Wakefield Metropolitan District Council
LAQM Annual Status Report 2020 44
Figure 31: No. of Breaches of Daily AQOL for PM10
Table A.5 in Appendix A compares the ratified and adjusted monitored PM10
annual mean concentrations for the past four years with the air quality objective of
40µg/m3.
Table A.6 in Appendix A compares the ratified continuous monitored PM10 daily
mean concentrations for the past four years with the air quality objective of
50µg/m3, not to be exceeded more than 35 times per year.
3.2.3 Particulate Matter (PM2.5)
Continuous monitoring of PM2.5 has been undertaken at the CM3 - Park Street
monitoring station since 2016, giving four years’ worth of data following a break in
the monitoring of particulate matter.
The particulate monitor at CM3 - Park Street is located within the Wakefield City
AQMA at OSGB36 coordinates 433718, 420371. All data for 2019 was ratified by
Wakefield Council’s external partner, Ricardo AEA.
There is no AQOL for PM2.5 but there is a UK and EU Target value of 25 µg/m3 as
an annual mean with which all recorded results at the CM3 monitoring station
comply. However, the World Health Organisation guideline level of 10 μg/m3 has
0 5 10 15 20 25 30 35
2016
2017
2018
2019
No. of exceedances
Year
Times daily PM10 AQOL breached
Wakefield Metropolitan District Council
LAQM Annual Status Report 2020 45
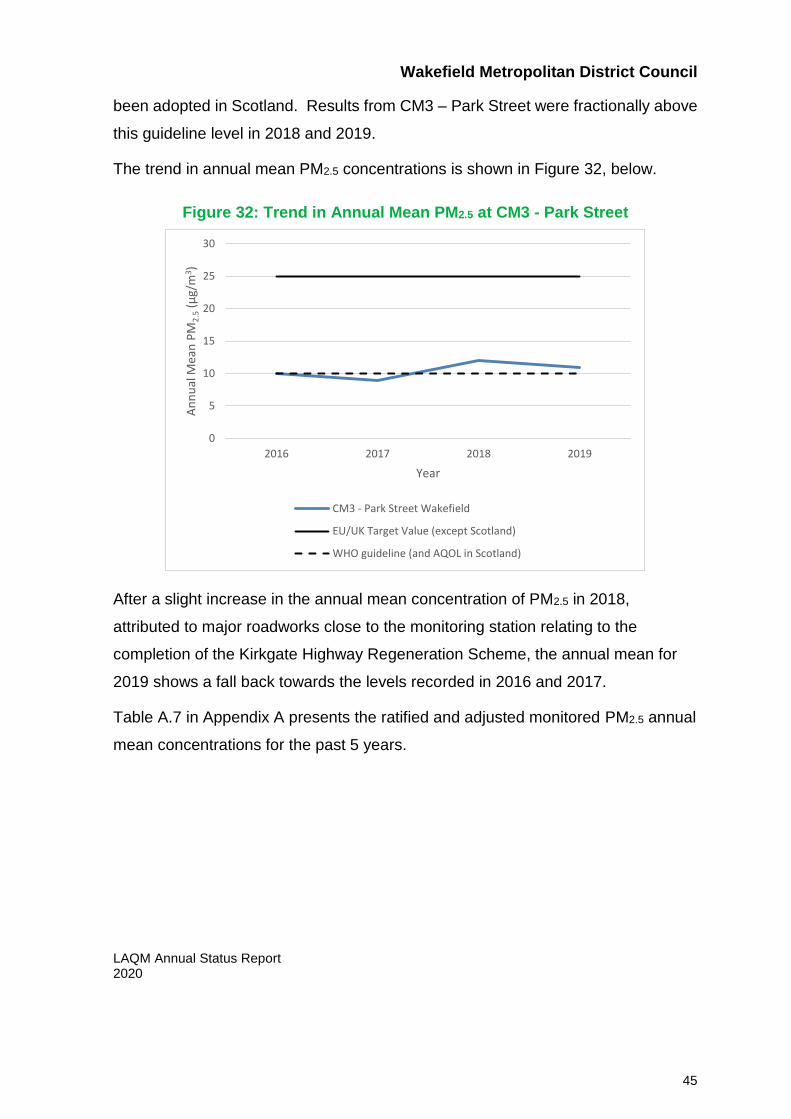
been adopted in Scotland. Results from CM3 – Park Street were fractionally above
this guideline level in 2018 and 2019.
The trend in annual mean PM2.5 concentrations is shown in Figure 32, below.
Figure 32: Trend in Annual Mean PM2.5 at CM3 - Park Street
After a slight increase in the annual mean concentration of PM2.5 in 2018,
attributed to major roadworks close to the monitoring station relating to the
completion of the Kirkgate Highway Regeneration Scheme, the annual mean for
2019 shows a fall back towards the levels recorded in 2016 and 2017.
Table A.7 in Appendix A presents the ratified and adjusted monitored PM2.5 annual
mean concentrations for the past 5 years.
0
5
10
15
20
25
30
2016 2017 2018 2019
An
nu
al M
ean
PM
2.5
(µg/
m3)
Year
CM3 - Park Street Wakefield
EU/UK Target Value (except Scotland)
WHO guideline (and AQOL in Scotland)
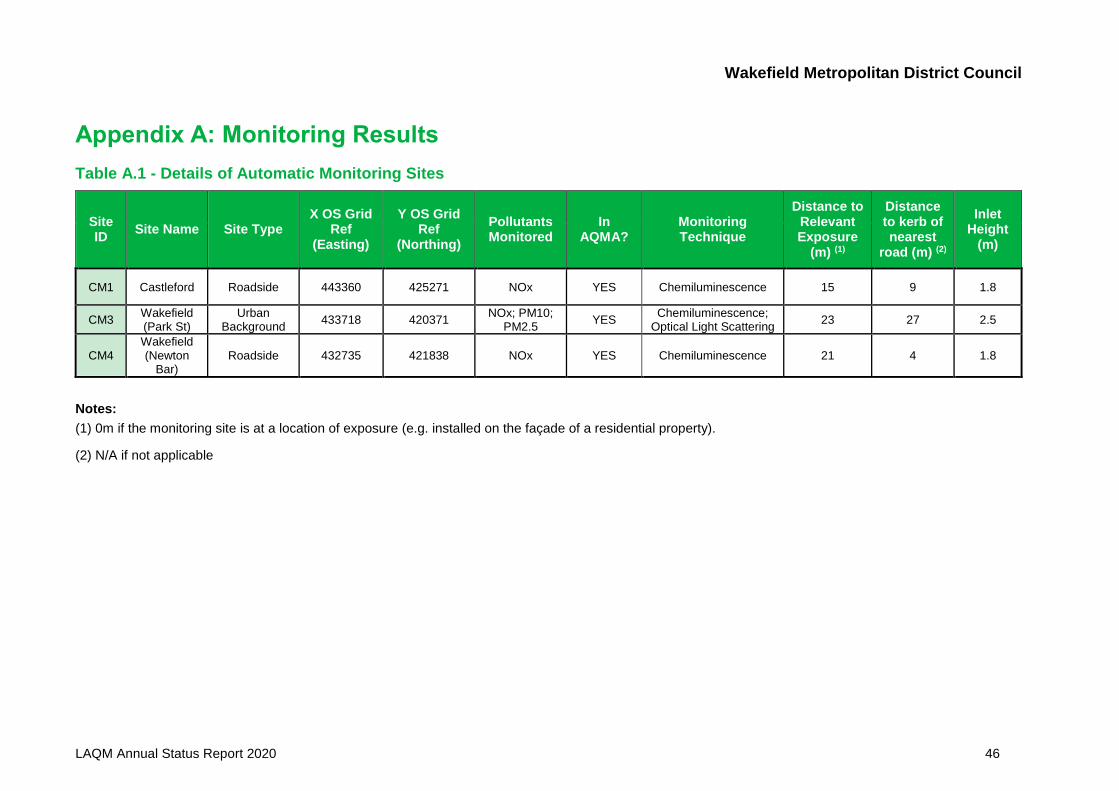
Wakefield Metropolitan District Council
LAQM Annual Status Report 2020 46
Appendix A: Monitoring Results
Table A.1 - Details of Automatic Monitoring Sites
Site ID
Site Name Site Type X OS Grid
Ref (Easting)
Y OS Grid Ref
(Northing)
Pollutants Monitored
In AQMA?
Monitoring Technique
Distance to Relevant Exposure
(m) (1)
Distance to kerb of nearest
road (m) (2)
Inlet Height
(m)
CM1 Castleford Roadside 443360 425271 NOx YES Chemiluminescence 15 9 1.8
CM3 Wakefield (Park St)
Urban Background
433718 420371 NOx; PM10;
PM2.5 YES
Chemiluminescence; Optical Light Scattering
23 27 2.5
CM4 Wakefield (Newton
Bar) Roadside 432735 421838 NOx YES Chemiluminescence 21 4 1.8
Notes:
(1) 0m if the monitoring site is at a location of exposure (e.g. installed on the façade of a residential property).
(2) N/A if not applicable
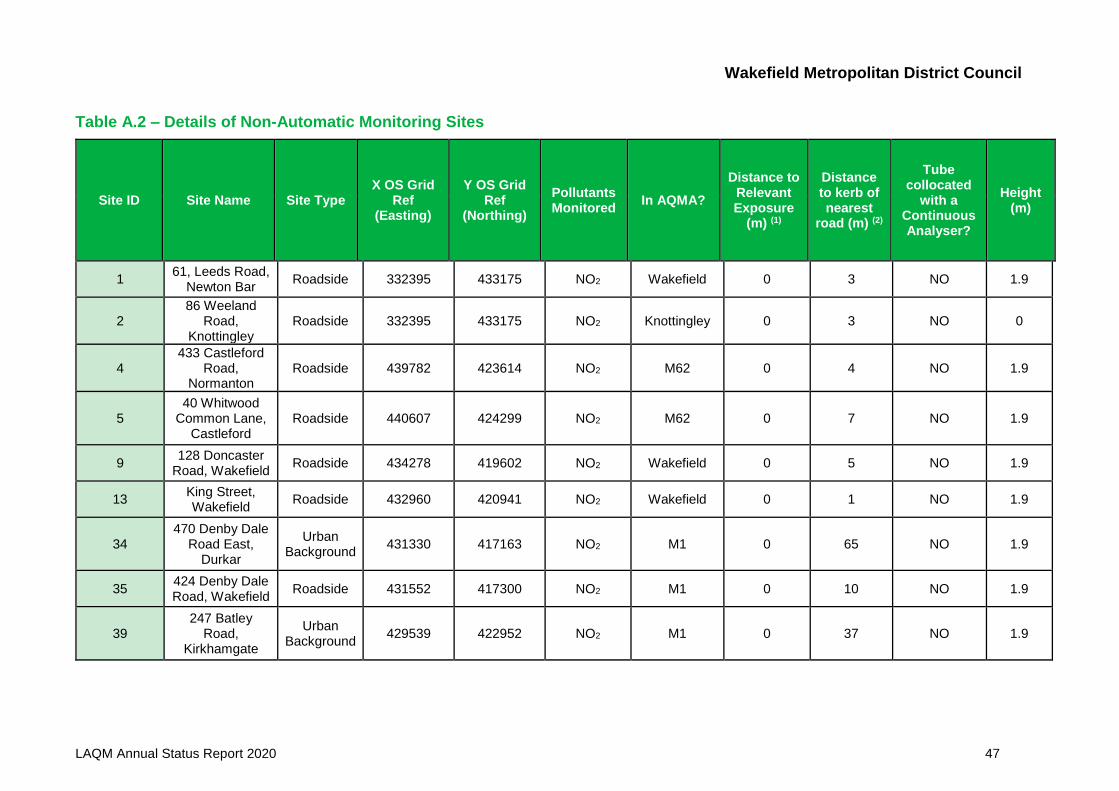
Wakefield Metropolitan District Council
LAQM Annual Status Report 2020 47
Table A.2 – Details of Non-Automatic Monitoring Sites
Site ID Site Name Site Type X OS Grid
Ref (Easting)
Y OS Grid Ref
(Northing)
Pollutants Monitored
In AQMA?
Distance to Relevant Exposure
(m) (1)
Distance to kerb of nearest
road (m) (2)
Tube collocated
with a Continuous Analyser?
Height (m)
1 61, Leeds Road,
Newton Bar Roadside 332395 433175 NO2 Wakefield 0 3 NO 1.9
2 86 Weeland
Road, Knottingley
Roadside 332395 433175 NO2 Knottingley 0 3 NO 0
4 433 Castleford
Road, Normanton
Roadside 439782 423614 NO2 M62 0 4 NO 1.9
5 40 Whitwood
Common Lane, Castleford
Roadside 440607 424299 NO2 M62 0 7 NO 1.9
9 128 Doncaster
Road, Wakefield Roadside 434278 419602 NO2 Wakefield 0 5 NO 1.9
13 King Street, Wakefield
Roadside 432960 420941 NO2 Wakefield 0 1 NO 1.9
34 470 Denby Dale
Road East, Durkar
Urban Background
431330 417163 NO2 M1 0 65 NO 1.9
35 424 Denby Dale Road, Wakefield
Roadside 431552 417300 NO2 M1 0 10 NO 1.9
39 247 Batley
Road, Kirkhamgate
Urban Background
429539 422952 NO2 M1 0 37 NO 1.9
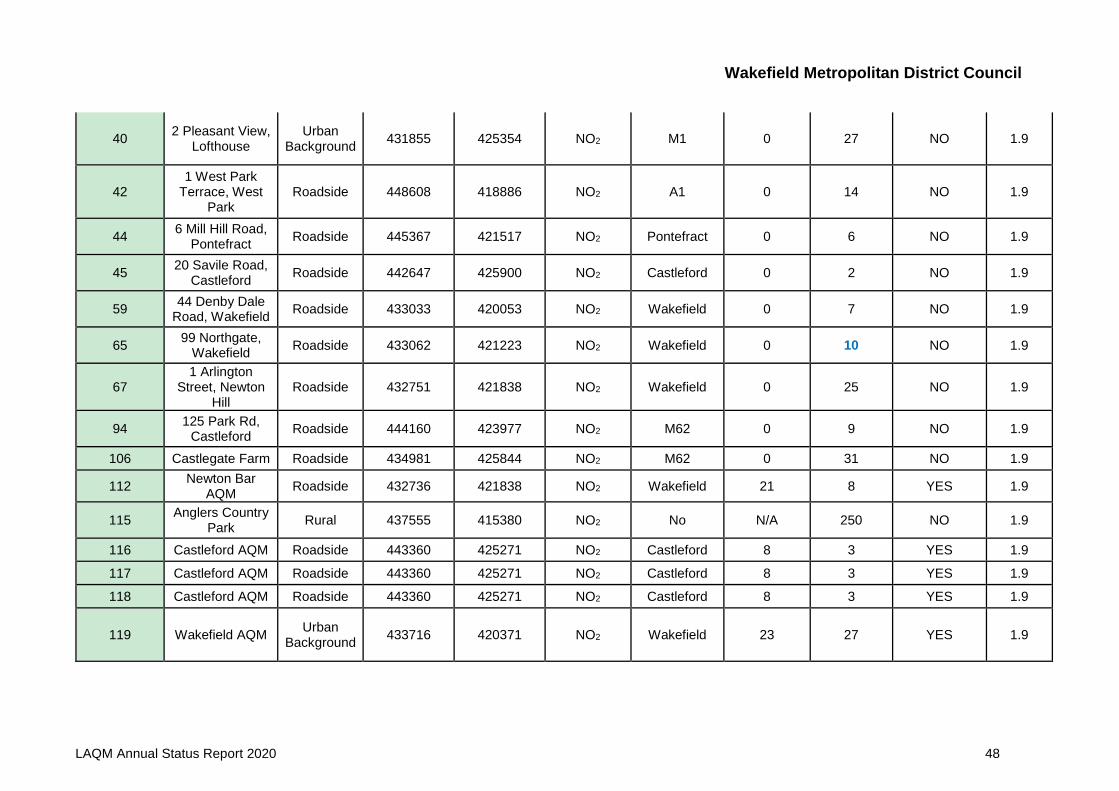
Wakefield Metropolitan District Council
LAQM Annual Status Report 2020 48
40 2 Pleasant View,
Lofthouse Urban
Background 431855 425354 NO2 M1 0 27 NO 1.9
42 1 West Park
Terrace, West Park
Roadside 448608 418886 NO2 A1 0 14 NO 1.9
44 6 Mill Hill Road,
Pontefract Roadside 445367 421517 NO2 Pontefract 0 6 NO 1.9
45 20 Savile Road,
Castleford Roadside 442647 425900 NO2 Castleford 0 2 NO 1.9
59 44 Denby Dale
Road, Wakefield Roadside 433033 420053 NO2 Wakefield 0 7 NO 1.9
65 99 Northgate,
Wakefield Roadside 433062 421223 NO2 Wakefield 0 10 NO 1.9
67 1 Arlington
Street, Newton Hill
Roadside 432751 421838 NO2 Wakefield 0 25 NO 1.9
94 125 Park Rd,
Castleford Roadside 444160 423977 NO2 M62 0 9 NO 1.9
106 Castlegate Farm Roadside 434981 425844 NO2 M62 0 31 NO 1.9
112 Newton Bar
AQM Roadside 432736 421838 NO2 Wakefield 21 8 YES 1.9
115 Anglers Country
Park Rural 437555 415380 NO2 No N/A 250 NO 1.9
116 Castleford AQM Roadside 443360 425271 NO2 Castleford 8 3 YES 1.9
117 Castleford AQM Roadside 443360 425271 NO2 Castleford 8 3 YES 1.9
118 Castleford AQM Roadside 443360 425271 NO2 Castleford 8 3 YES 1.9
119 Wakefield AQM Urban
Background 433716 420371 NO2 Wakefield 23 27 YES 1.9
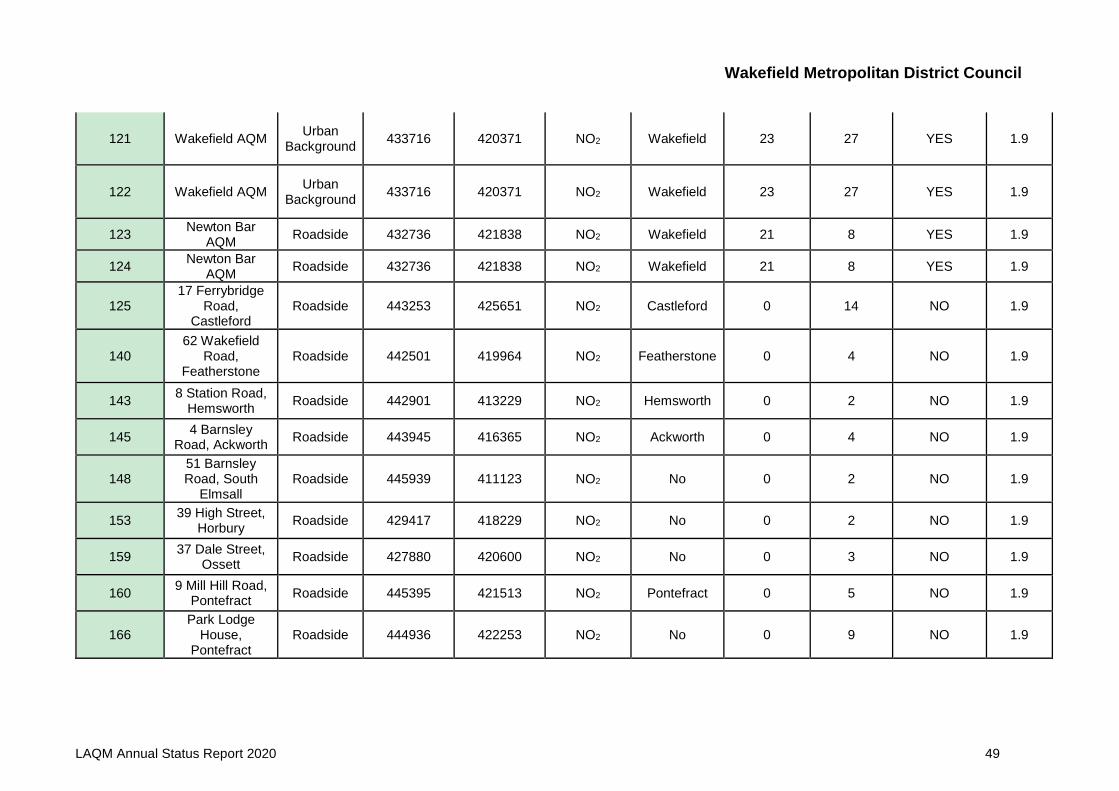
Wakefield Metropolitan District Council
LAQM Annual Status Report 2020 49
121 Wakefield AQM Urban
Background 433716 420371 NO2 Wakefield 23 27 YES 1.9
122 Wakefield AQM Urban
Background 433716 420371 NO2 Wakefield 23 27 YES 1.9
123 Newton Bar
AQM Roadside 432736 421838 NO2 Wakefield 21 8 YES 1.9
124 Newton Bar
AQM Roadside 432736 421838 NO2 Wakefield 21 8 YES 1.9
125 17 Ferrybridge
Road, Castleford
Roadside 443253 425651 NO2 Castleford 0 14 NO 1.9
140 62 Wakefield
Road, Featherstone
Roadside 442501 419964 NO2 Featherstone 0 4 NO 1.9
143 8 Station Road,
Hemsworth Roadside 442901 413229 NO2 Hemsworth 0 2 NO 1.9
145 4 Barnsley
Road, Ackworth Roadside 443945 416365 NO2 Ackworth 0 4 NO 1.9
148 51 Barnsley Road, South
Elmsall Roadside 445939 411123 NO2 No 0 2 NO 1.9
153 39 High Street,
Horbury Roadside 429417 418229 NO2 No 0 2 NO 1.9
159 37 Dale Street,
Ossett Roadside 427880 420600 NO2 No 0 3 NO 1.9
160 9 Mill Hill Road,
Pontefract Roadside 445395 421513 NO2 Pontefract 0 5 NO 1.9
166 Park Lodge
House, Pontefract
Roadside 444936 422253 NO2 No 0 9 NO 1.9
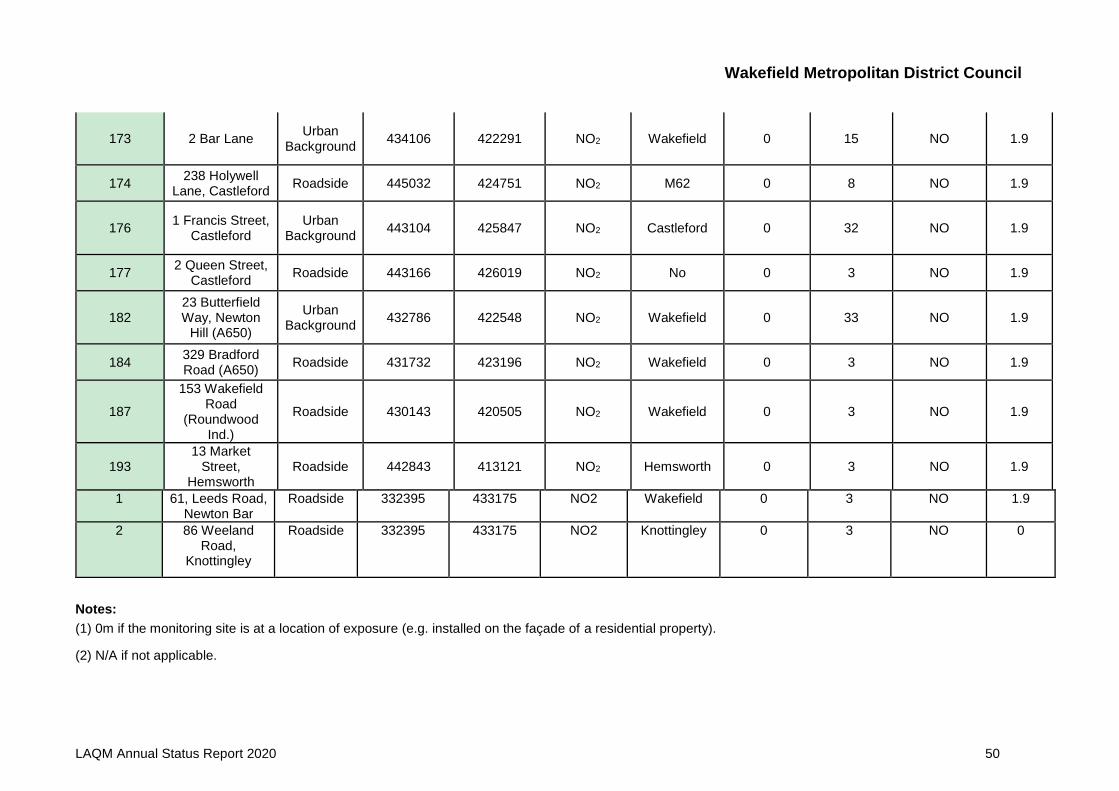
Wakefield Metropolitan District Council
LAQM Annual Status Report 2020 50
173 2 Bar Lane Urban
Background 434106 422291 NO2 Wakefield 0 15 NO 1.9
174 238 Holywell
Lane, Castleford Roadside 445032 424751 NO2 M62 0 8 NO 1.9
176 1 Francis Street,
Castleford Urban
Background 443104 425847 NO2 Castleford 0 32 NO 1.9
177 2 Queen Street,
Castleford Roadside 443166 426019 NO2 No 0 3 NO 1.9
182 23 Butterfield Way, Newton
Hill (A650)
Urban Background
432786 422548 NO2 Wakefield 0 33 NO 1.9
184 329 Bradford Road (A650)
Roadside 431732 423196 NO2 Wakefield 0 3 NO 1.9
187
153 Wakefield Road
(Roundwood Ind.)
Roadside 430143 420505 NO2 Wakefield 0 3 NO 1.9
193 13 Market
Street, Hemsworth
Roadside 442843 413121 NO2 Hemsworth 0 3 NO 1.9
1 61, Leeds Road, Newton Bar
Roadside 332395 433175 NO2 Wakefield 0 3 NO 1.9
2 86 Weeland Road,
Knottingley
Roadside 332395 433175 NO2 Knottingley 0 3 NO 0
Notes:
(1) 0m if the monitoring site is at a location of exposure (e.g. installed on the façade of a residential property).
(2) N/A if not applicable.
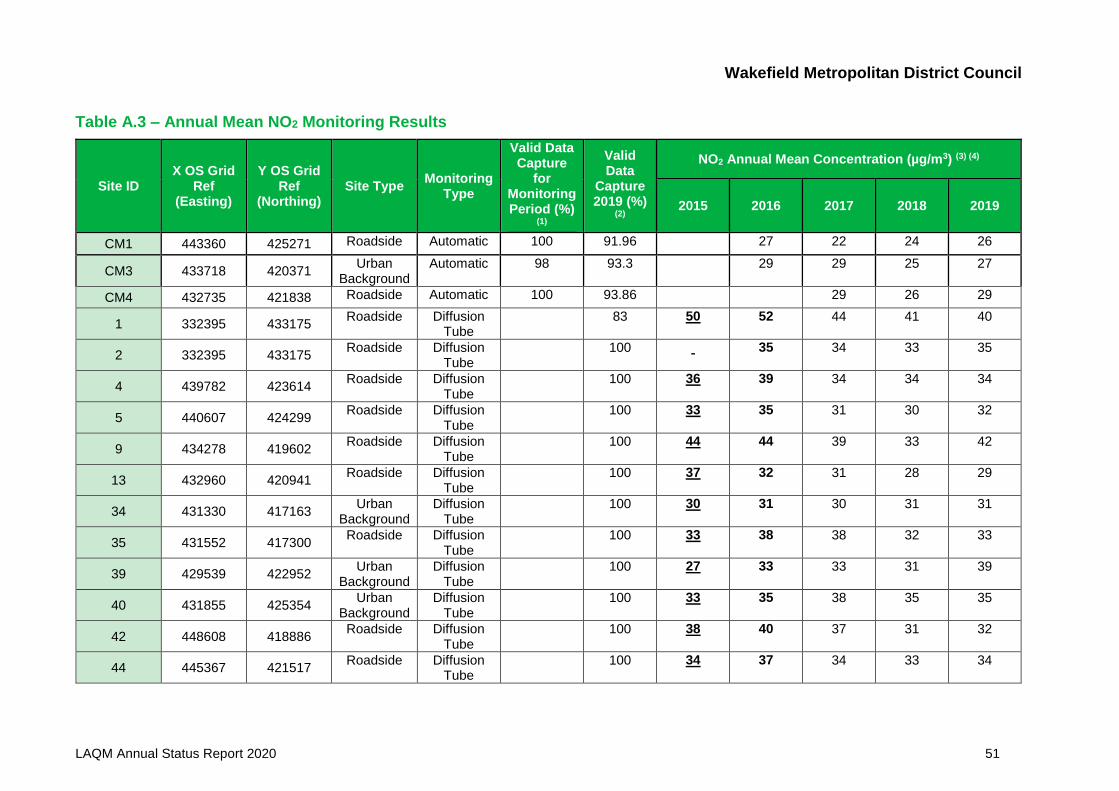
Wakefield Metropolitan District Council
LAQM Annual Status Report 2020 51
Table A.3 – Annual Mean NO2 Monitoring Results
Site ID X OS Grid
Ref (Easting)
Y OS Grid Ref
(Northing) Site Type
Monitoring Type
Valid Data Capture
for Monitoring Period (%)
(1)
Valid Data
Capture 2019 (%)
(2)
NO2 Annual Mean Concentration (µg/m3) (3) (4)
2015 2016 2017 2018 2019
CM1 443360 425271 Roadside Automatic 100 91.96
27 22 24 26
CM3 433718 420371 Urban
Background Automatic 98 93.3
29 29 25 27
CM4 432735 421838 Roadside Automatic 100 93.86
29 26 29
1 332395 433175 Roadside Diffusion
Tube 83 50 52 44 41 40
2 332395 433175 Roadside Diffusion
Tube 100 35 34 33 35
4 439782 423614 Roadside Diffusion
Tube 100 36 39 34 34 34
5 440607 424299 Roadside Diffusion
Tube 100 33 35 31 30 32
9 434278 419602 Roadside Diffusion
Tube 100 44 44 39 33 42
13 432960 420941 Roadside Diffusion
Tube 100 37 32 31 28 29
34 431330 417163 Urban
Background Diffusion
Tube 100 30 31 30 31 31
35 431552 417300 Roadside Diffusion
Tube 100 33 38 38 32 33
39 429539 422952 Urban
Background Diffusion
Tube 100 27 33 33 31 39
40 431855 425354 Urban
Background Diffusion
Tube 100 33 35 38 35 35
42 448608 418886 Roadside Diffusion
Tube 100 38 40 37 31 32
44 445367 421517 Roadside Diffusion
Tube 100 34 37 34 33 34
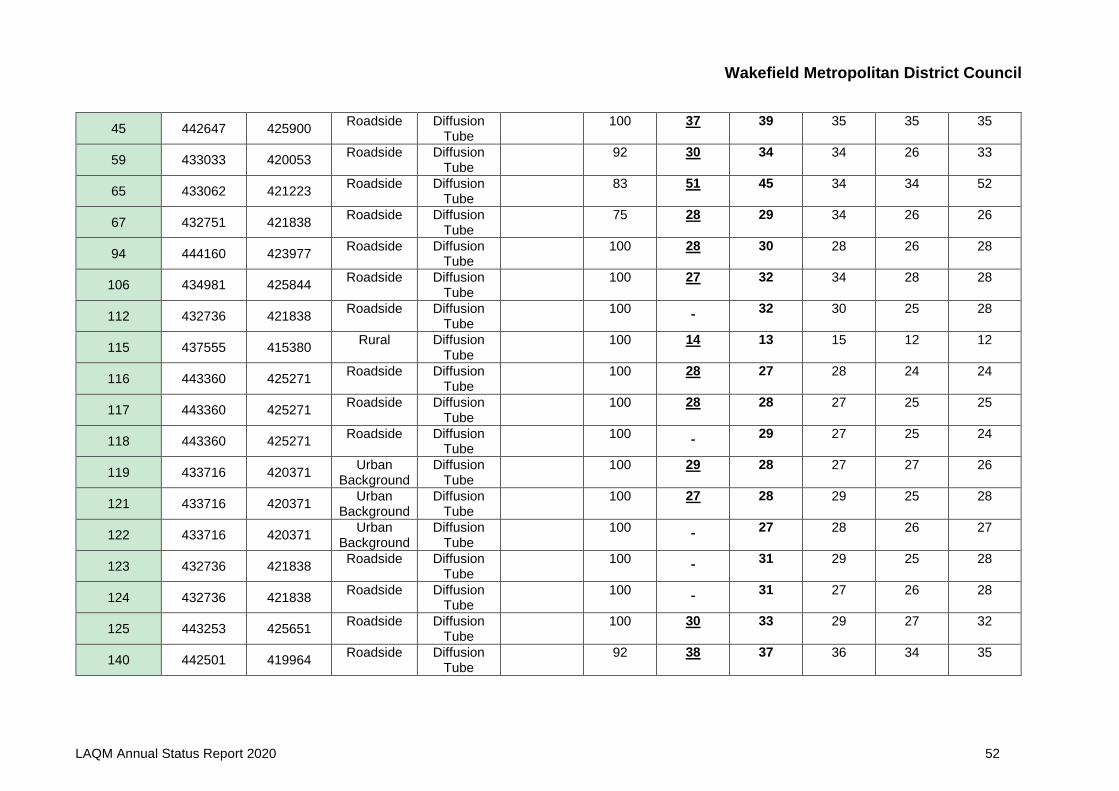
Wakefield Metropolitan District Council
LAQM Annual Status Report 2020 52
45 442647 425900 Roadside Diffusion
Tube 100 37 39 35 35 35
59 433033 420053 Roadside Diffusion
Tube 92 30 34 34 26 33
65 433062 421223 Roadside Diffusion
Tube 83 51 45 34 34 52
67 432751 421838 Roadside Diffusion
Tube 75 28 29 34 26 26
94 444160 423977 Roadside Diffusion
Tube 100 28 30 28 26 28
106 434981 425844 Roadside Diffusion
Tube 100 27 32 34 28 28
112 432736 421838 Roadside Diffusion
Tube 100 32 30 25 28
115 437555 415380 Rural Diffusion
Tube 100 14 13 15 12 12
116 443360 425271 Roadside Diffusion
Tube 100 28 27 28 24 24
117 443360 425271 Roadside Diffusion
Tube 100 28 28 27 25 25
118 443360 425271 Roadside Diffusion
Tube 100 29 27 25 24
119 433716 420371 Urban
Background Diffusion
Tube 100 29 28 27 27 26
121 433716 420371 Urban
Background Diffusion
Tube 100 27 28 29 25 28
122 433716 420371 Urban
Background Diffusion
Tube 100 27 28 26 27
123 432736 421838 Roadside Diffusion
Tube 100 31 29 25 28
124 432736 421838 Roadside Diffusion
Tube 100 31 27 26 28
125 443253 425651 Roadside Diffusion
Tube 100 30 33 29 27 32
140 442501 419964 Roadside Diffusion
Tube 92 38 37 36 34 35
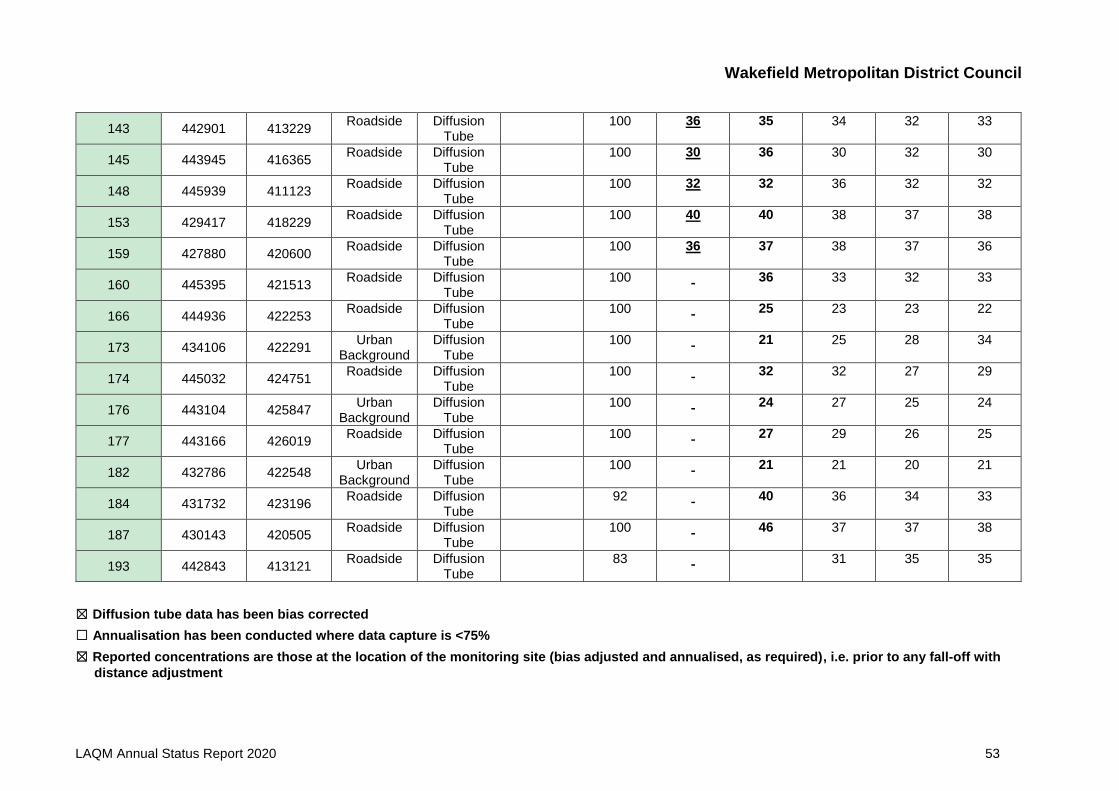
Wakefield Metropolitan District Council
LAQM Annual Status Report 2020 53
143 442901 413229 Roadside Diffusion
Tube 100 36 35 34 32 33
145 443945 416365 Roadside Diffusion
Tube 100 30 36 30 32 30
148 445939 411123 Roadside Diffusion
Tube 100 32 32 36 32 32
153 429417 418229 Roadside Diffusion
Tube 100 40 40 38 37 38
159 427880 420600 Roadside Diffusion
Tube 100 36 37 38 37 36
160 445395 421513 Roadside Diffusion
Tube 100 36 33 32 33
166 444936 422253 Roadside Diffusion
Tube 100 25 23 23 22
173 434106 422291 Urban
Background Diffusion
Tube 100 21 25 28 34
174 445032 424751 Roadside Diffusion
Tube 100 32 32 27 29
176 443104 425847 Urban
Background Diffusion
Tube 100 24 27 25 24
177 443166 426019 Roadside Diffusion
Tube 100 27 29 26 25
182 432786 422548 Urban
Background Diffusion
Tube 100 21 21 20 21
184 431732 423196 Roadside Diffusion
Tube 92 40 36 34 33
187 430143 420505 Roadside Diffusion
Tube 100 46 37 37 38
193 442843 413121 Roadside Diffusion
Tube 83 31 35 35
☒ Diffusion tube data has been bias corrected
☐ Annualisation has been conducted where data capture is <75%
☒ Reported concentrations are those at the location of the monitoring site (bias adjusted and annualised, as required), i.e. prior to any fall-off with
distance adjustment
Wakefield Metropolitan District Council
LAQM Annual Status Report 2020 54
Notes:
Exceedances of the NO2 annual mean objective of 40µg/m3 are shown in bold.
NO2 annual means exceeding 60µg/m3, indicating a potential exceedance of the NO2 1-hour mean objective are shown in bold and underlined.
(1) Data capture for the monitoring period, in cases where monitoring was only carried out for part of the year.
(2) Data capture for the full calendar year (e.g. if monitoring was carried out for 6 months, the maximum data capture for the full calendar year is 50%).
(3) Means for diffusion tubes have been corrected for bias. All means have been “annualised” as per Boxes 7.9 and 7.10 in LAQM.TG16 if valid data capture for the full calendar year is less than 75%. See Appendix C for details.
(4) Concentrations are those at the location of monitoring and not those following any fall-off with distance adjustment.
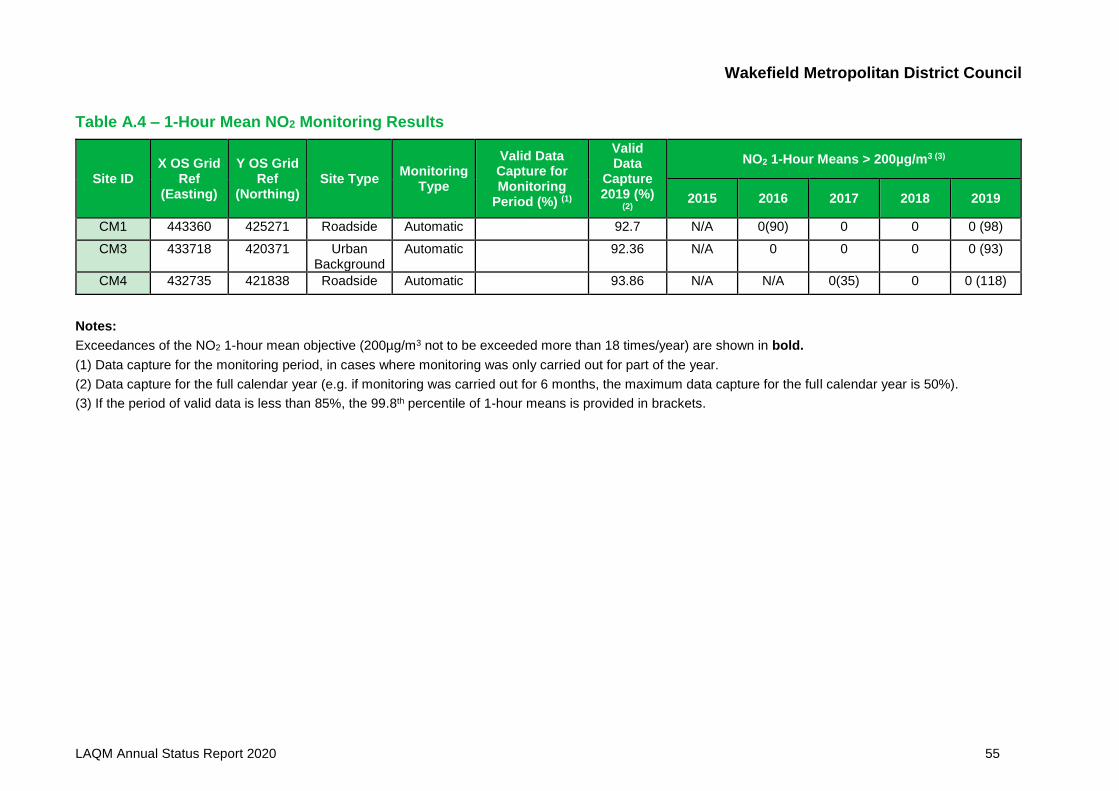
Wakefield Metropolitan District Council
LAQM Annual Status Report 2020 55
Table A.4 – 1-Hour Mean NO2 Monitoring Results
Site ID X OS Grid
Ref (Easting)
Y OS Grid Ref
(Northing) Site Type
Monitoring Type
Valid Data Capture for Monitoring
Period (%) (1)
Valid Data
Capture 2019 (%)
(2)
NO2 1-Hour Means > 200µg/m3 (3)
2015 2016 2017 2018 2019
CM1 443360 425271 Roadside Automatic
92.7 N/A 0(90) 0 0 0 (98)
CM3 433718 420371 Urban Background
Automatic
92.36 N/A 0 0 0 0 (93)
CM4 432735 421838 Roadside Automatic 93.86 N/A N/A 0(35) 0 0 (118)
Notes:
Exceedances of the NO2 1-hour mean objective (200µg/m3 not to be exceeded more than 18 times/year) are shown in bold.
(1) Data capture for the monitoring period, in cases where monitoring was only carried out for part of the year.
(2) Data capture for the full calendar year (e.g. if monitoring was carried out for 6 months, the maximum data capture for the full calendar year is 50%).
(3) If the period of valid data is less than 85%, the 99.8th percentile of 1-hour means is provided in brackets.
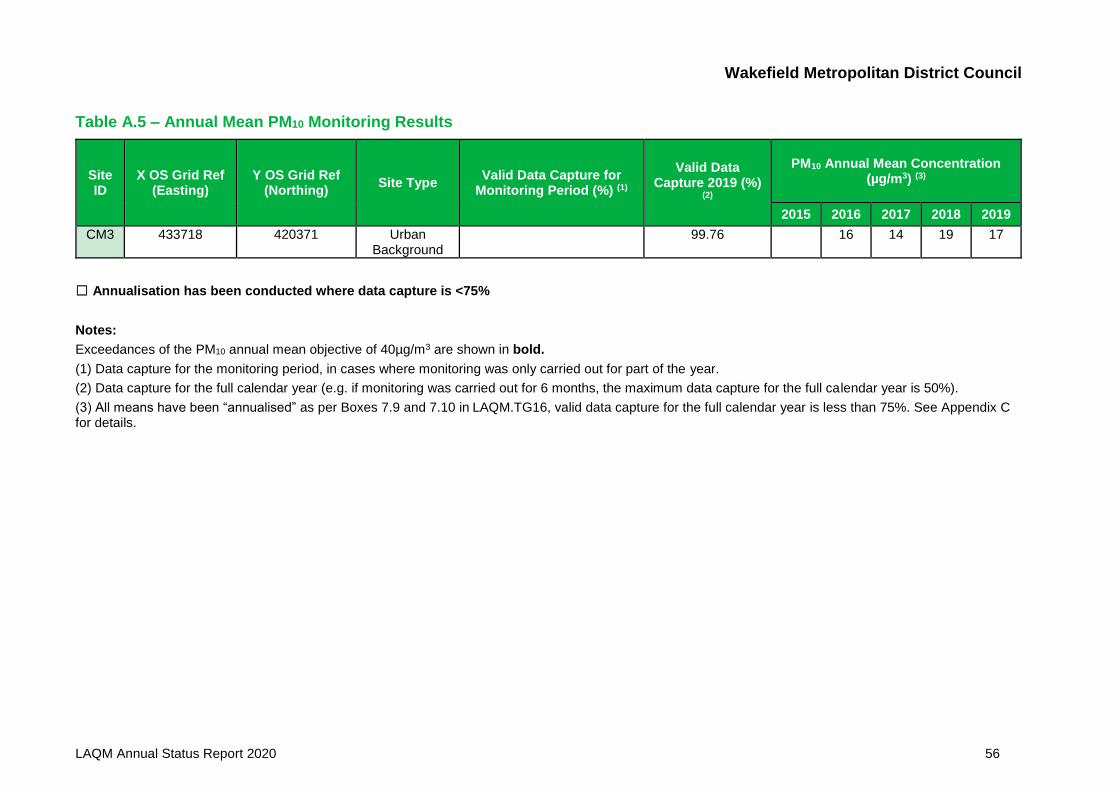
Wakefield Metropolitan District Council
LAQM Annual Status Report 2020 56
Table A.5 – Annual Mean PM10 Monitoring Results
Site ID
X OS Grid Ref (Easting)
Y OS Grid Ref (Northing)
Site Type Valid Data Capture for
Monitoring Period (%) (1)
Valid Data Capture 2019 (%)
(2)
PM10 Annual Mean Concentration (µg/m3) (3)
2015 2016 2017 2018 2019
CM3 433718 420371 Urban Background
99.76
16 14 19 17
☐ Annualisation has been conducted where data capture is <75%
Notes:
Exceedances of the PM10 annual mean objective of 40µg/m3 are shown in bold.
(1) Data capture for the monitoring period, in cases where monitoring was only carried out for part of the year.
(2) Data capture for the full calendar year (e.g. if monitoring was carried out for 6 months, the maximum data capture for the full calendar year is 50%).
(3) All means have been “annualised” as per Boxes 7.9 and 7.10 in LAQM.TG16, valid data capture for the full calendar year is less than 75%. See Appendix C for details.
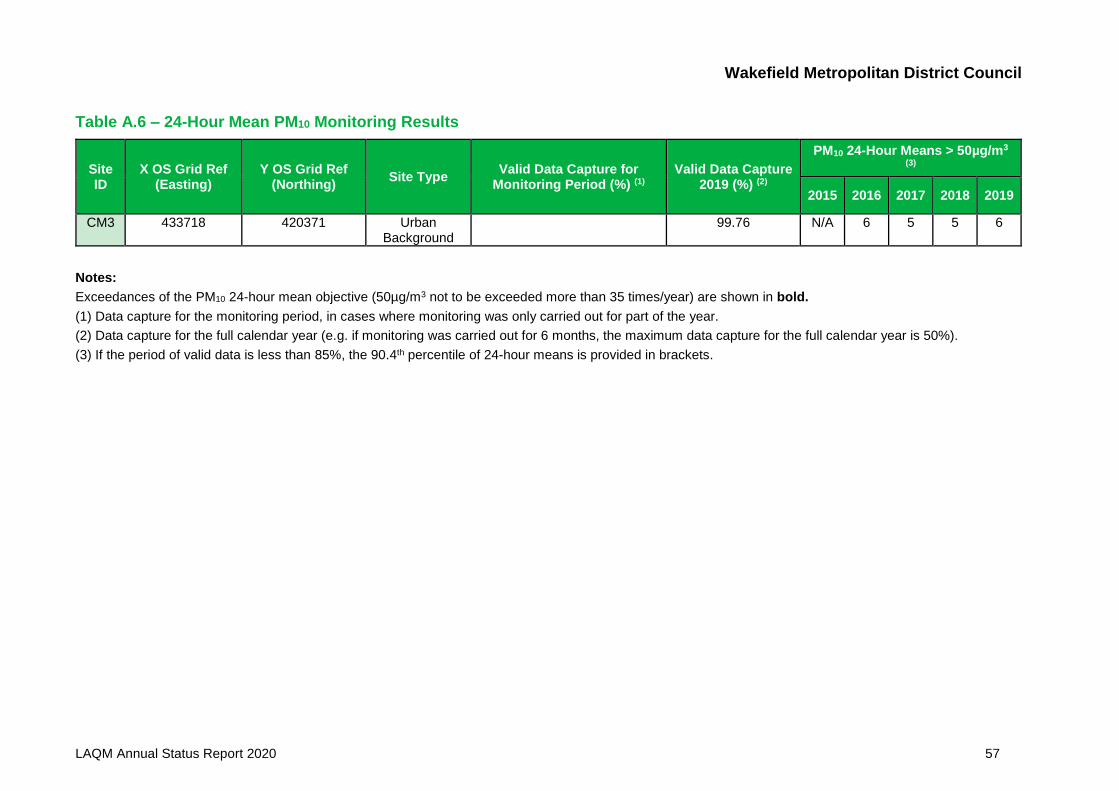
Wakefield Metropolitan District Council
LAQM Annual Status Report 2020 57
Table A.6 – 24-Hour Mean PM10 Monitoring Results
Site ID
X OS Grid Ref (Easting)
Y OS Grid Ref (Northing)
Site Type Valid Data Capture for
Monitoring Period (%) (1) Valid Data Capture
2019 (%) (2)
PM10 24-Hour Means > 50µg/m3
(3)
2015 2016 2017 2018 2019
CM3 433718 420371 Urban Background
99.76 N/A 6 5 5 6
Notes:
Exceedances of the PM10 24-hour mean objective (50µg/m3 not to be exceeded more than 35 times/year) are shown in bold.
(1) Data capture for the monitoring period, in cases where monitoring was only carried out for part of the year.
(2) Data capture for the full calendar year (e.g. if monitoring was carried out for 6 months, the maximum data capture for the full calendar year is 50%).
(3) If the period of valid data is less than 85%, the 90.4th percentile of 24-hour means is provided in brackets.
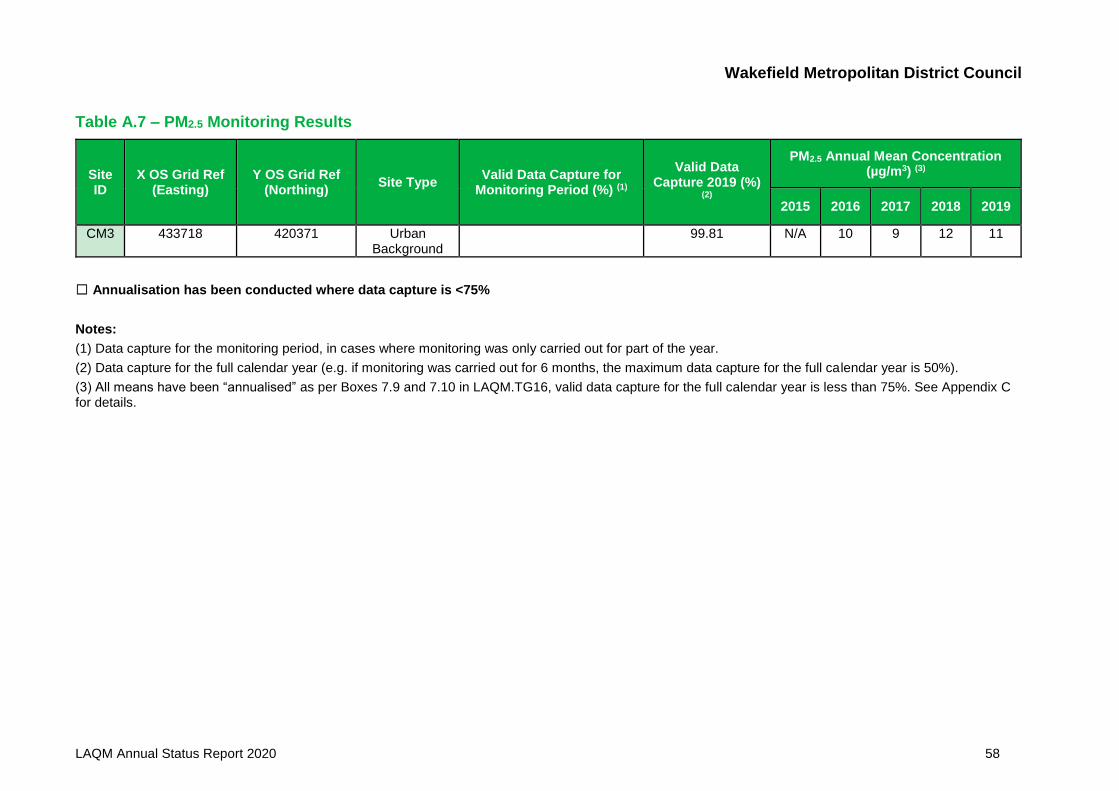
Wakefield Metropolitan District Council
LAQM Annual Status Report 2020 58
Table A.7 – PM2.5 Monitoring Results
Site ID
X OS Grid Ref (Easting)
Y OS Grid Ref (Northing)
Site Type Valid Data Capture for
Monitoring Period (%) (1)
Valid Data Capture 2019 (%)
(2)
PM2.5 Annual Mean Concentration (µg/m3) (3)
2015 2016 2017 2018 2019
CM3 433718 420371 Urban Background
99.81 N/A 10 9 12 11
☐ Annualisation has been conducted where data capture is <75%
Notes:
(1) Data capture for the monitoring period, in cases where monitoring was only carried out for part of the year.
(2) Data capture for the full calendar year (e.g. if monitoring was carried out for 6 months, the maximum data capture for the full calendar year is 50%).
(3) All means have been “annualised” as per Boxes 7.9 and 7.10 in LAQM.TG16, valid data capture for the full calendar year is less than 75%. See Appendix C for details.
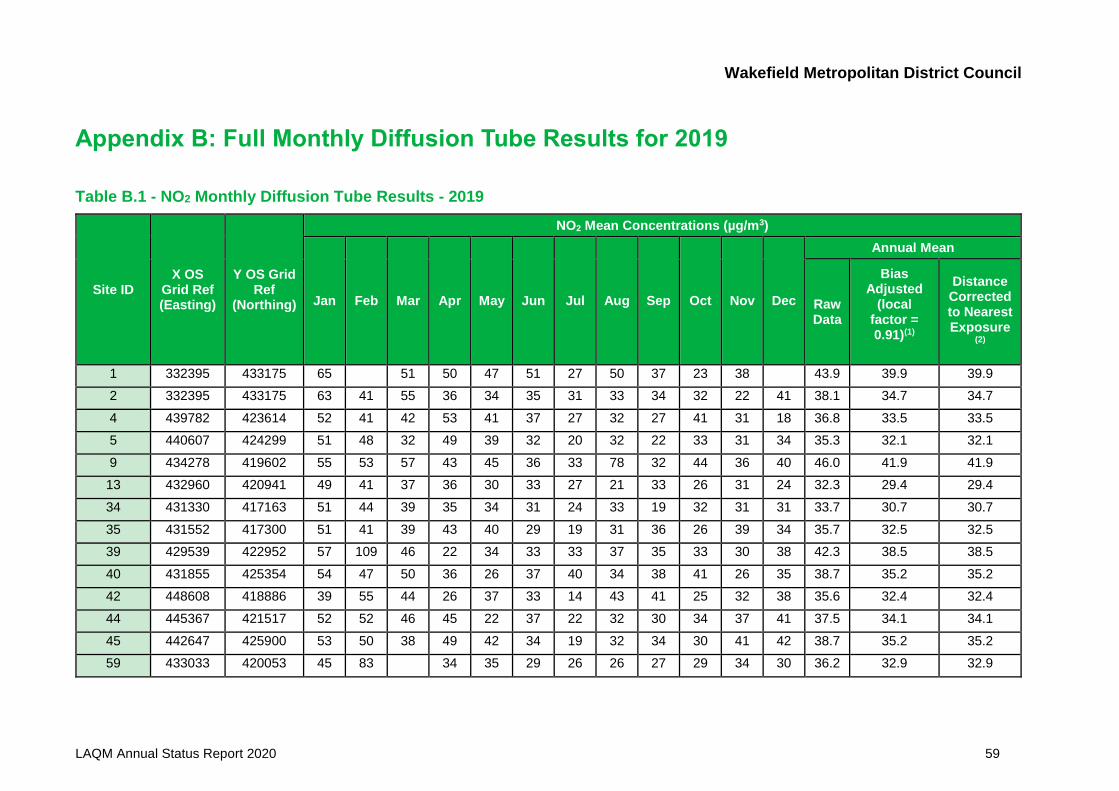
Wakefield Metropolitan District Council
LAQM Annual Status Report 2020 59
Appendix B: Full Monthly Diffusion Tube Results for 2019
Table B.1 - NO2 Monthly Diffusion Tube Results - 2019
Site ID X OS
Grid Ref (Easting)
Y OS Grid Ref
(Northing)
NO2 Mean Concentrations (µg/m3)
Jan Feb Mar Apr May Jun Jul Aug Sep Oct Nov Dec
Annual Mean
Raw Data
Bias Adjusted
(local factor = 0.91)(1)
Distance Corrected to Nearest Exposure
(2)
1 332395 433175 65
51 50 47 51 27 50 37 23 38
43.9 39.9 39.9
2 332395 433175 63 41 55 36 34 35 31 33 34 32 22 41 38.1 34.7 34.7
4 439782 423614 52 41 42 53 41 37 27 32 27 41 31 18 36.8 33.5 33.5
5 440607 424299 51 48 32 49 39 32 20 32 22 33 31 34 35.3 32.1 32.1
9 434278 419602 55 53 57 43 45 36 33 78 32 44 36 40 46.0 41.9 41.9
13 432960 420941 49 41 37 36 30 33 27 21 33 26 31 24 32.3 29.4 29.4
34 431330 417163 51 44 39 35 34 31 24 33 19 32 31 31 33.7 30.7 30.7
35 431552 417300 51 41 39 43 40 29 19 31 36 26 39 34 35.7 32.5 32.5
39 429539 422952 57 109 46 22 34 33 33 37 35 33 30 38 42.3 38.5 38.5
40 431855 425354 54 47 50 36 26 37 40 34 38 41 26 35 38.7 35.2 35.2
42 448608 418886 39 55 44 26 37 33 14 43 41 25 32 38 35.6 32.4 32.4
44 445367 421517 52 52 46 45 22 37 22 32 30 34 37 41 37.5 34.1 34.1
45 442647 425900 53 50 38 49 42 34 19 32 34 30 41 42 38.7 35.2 35.2
59 433033 420053 45 83 34 35 29 26 26 27 29 34 30 36.2 32.9 32.9
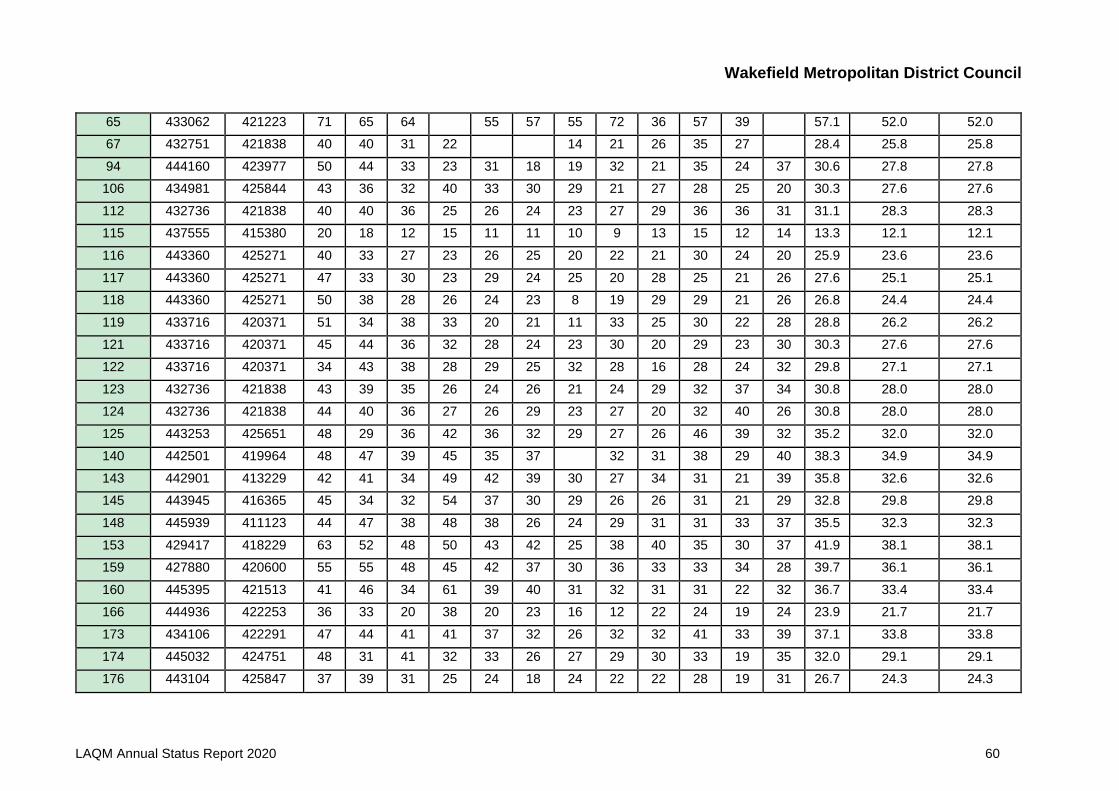
Wakefield Metropolitan District Council
LAQM Annual Status Report 2020 60
65 433062 421223 71 65 64 55 57 55 72 36 57 39 57.1 52.0 52.0
67 432751 421838 40 40 31 22 14 21 26 35 27 28.4 25.8 25.8
94 444160 423977 50 44 33 23 31 18 19 32 21 35 24 37 30.6 27.8 27.8
106 434981 425844 43 36 32 40 33 30 29 21 27 28 25 20 30.3 27.6 27.6
112 432736 421838 40 40 36 25 26 24 23 27 29 36 36 31 31.1 28.3 28.3
115 437555 415380 20 18 12 15 11 11 10 9 13 15 12 14 13.3 12.1 12.1
116 443360 425271 40 33 27 23 26 25 20 22 21 30 24 20 25.9 23.6 23.6
117 443360 425271 47 33 30 23 29 24 25 20 28 25 21 26 27.6 25.1 25.1
118 443360 425271 50 38 28 26 24 23 8 19 29 29 21 26 26.8 24.4 24.4
119 433716 420371 51 34 38 33 20 21 11 33 25 30 22 28 28.8 26.2 26.2
121 433716 420371 45 44 36 32 28 24 23 30 20 29 23 30 30.3 27.6 27.6
122 433716 420371 34 43 38 28 29 25 32 28 16 28 24 32 29.8 27.1 27.1
123 432736 421838 43 39 35 26 24 26 21 24 29 32 37 34 30.8 28.0 28.0
124 432736 421838 44 40 36 27 26 29 23 27 20 32 40 26 30.8 28.0 28.0
125 443253 425651 48 29 36 42 36 32 29 27 26 46 39 32 35.2 32.0 32.0
140 442501 419964 48 47 39 45 35 37 32 31 38 29 40 38.3 34.9 34.9
143 442901 413229 42 41 34 49 42 39 30 27 34 31 21 39 35.8 32.6 32.6
145 443945 416365 45 34 32 54 37 30 29 26 26 31 21 29 32.8 29.8 29.8
148 445939 411123 44 47 38 48 38 26 24 29 31 31 33 37 35.5 32.3 32.3
153 429417 418229 63 52 48 50 43 42 25 38 40 35 30 37 41.9 38.1 38.1
159 427880 420600 55 55 48 45 42 37 30 36 33 33 34 28 39.7 36.1 36.1
160 445395 421513 41 46 34 61 39 40 31 32 31 31 22 32 36.7 33.4 33.4
166 444936 422253 36 33 20 38 20 23 16 12 22 24 19 24 23.9 21.7 21.7
173 434106 422291 47 44 41 41 37 32 26 32 32 41 33 39 37.1 33.8 33.8
174 445032 424751 48 31 41 32 33 26 27 29 30 33 19 35 32.0 29.1 29.1
176 443104 425847 37 39 31 25 24 18 24 22 22 28 19 31 26.7 24.3 24.3
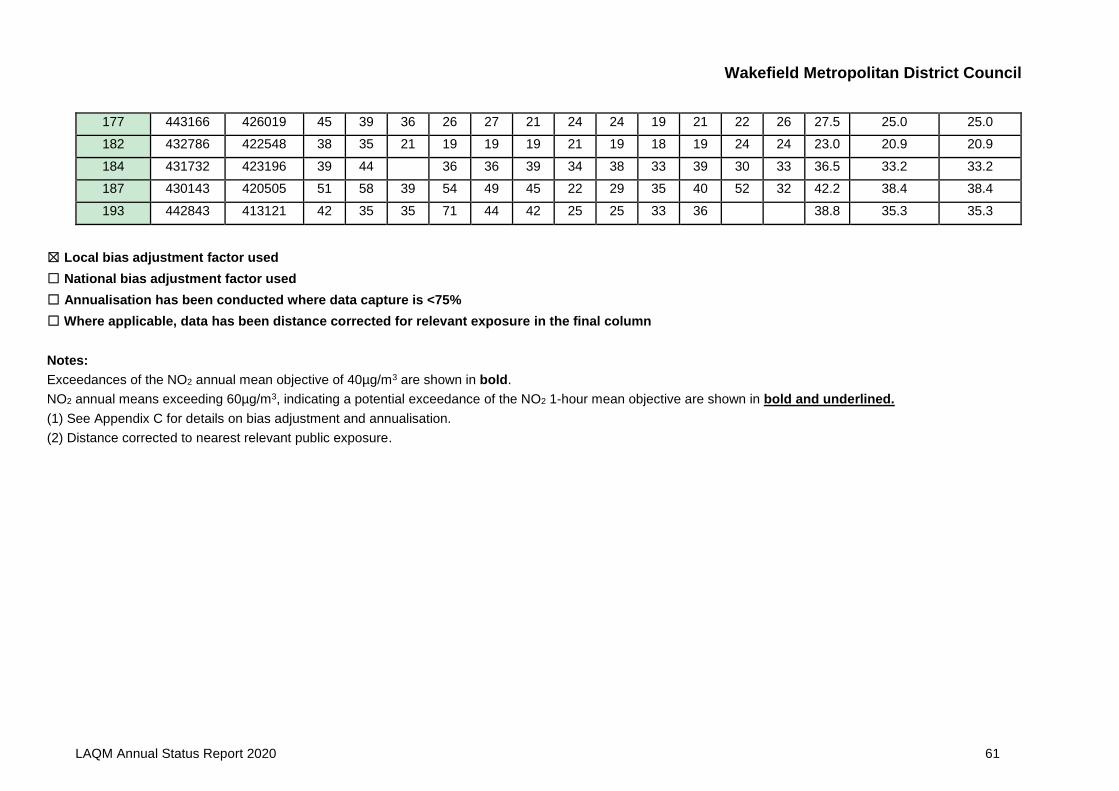
Wakefield Metropolitan District Council
LAQM Annual Status Report 2020 61
177 443166 426019 45 39 36 26 27 21 24 24 19 21 22 26 27.5 25.0 25.0
182 432786 422548 38 35 21 19 19 19 21 19 18 19 24 24 23.0 20.9 20.9
184 431732 423196 39 44 36 36 39 34 38 33 39 30 33 36.5 33.2 33.2
187 430143 420505 51 58 39 54 49 45 22 29 35 40 52 32 42.2 38.4 38.4
193 442843 413121 42 35 35 71 44 42 25 25 33 36 38.8 35.3 35.3
☒ Local bias adjustment factor used
☐ National bias adjustment factor used
☐ Annualisation has been conducted where data capture is <75%
☐ Where applicable, data has been distance corrected for relevant exposure in the final column
Notes:
Exceedances of the NO2 annual mean objective of 40µg/m3 are shown in bold.
NO2 annual means exceeding 60µg/m3, indicating a potential exceedance of the NO2 1-hour mean objective are shown in bold and underlined.
(1) See Appendix C for details on bias adjustment and annualisation.
(2) Distance corrected to nearest relevant public exposure.
Wakefield Metropolitan District Council
LAQM Annual Status Report 2020 62
Appendix C: Supporting Technical Information / Air Quality Monitoring Data QA/QC Quality Assurance and Control
Automatic Monitoring The automatic monitoring stations are covered by service and repair contracts
provided by an outside organisation. Calibration is undertaken automatically and
verified by monthly manual calibration as part of an internal monitoring quality
assurance and control procedure that follows the Automatic Urban Monitoring Network
site operator’s procedures.
PM Monitoring Adjustment
The Palas Fidas 200 measures both PM10 and PM2.5 at the same time. Data are
processed by an inbuilt algorithm, and the algorithm known as Method 11 has been
certified in the UK8. The Method 11 PM10 data has been certified for use without the
need for correction for slope and/or intercept. The Method 11 PM2.5 data has been
certified for use after correction for slope by dividing by 1.06. Thus, all PM2.5 data has
been corrected by this method.
Diffusion Tube Bias Adjustment Factors
The nitrogen dioxide passive diffusion tubes are a screening method and not as precise
or accurate as the continuous chemiluminescence method. Provided that care is taken
with the storage, handling and analysis of the tubes, and an appropriate “bias
adjustment” factor is applied, the overall uncertainty of the annual mean is expected to
be about +/-20%. The key issues to be considered are the performance of the
laboratory, the precision of the diffusion tubes, and the application of a suitable bias
adjustment factor.
8 https://uk-air.defra.gov.uk/networks/monitoring-methods?view=mcerts-scheme
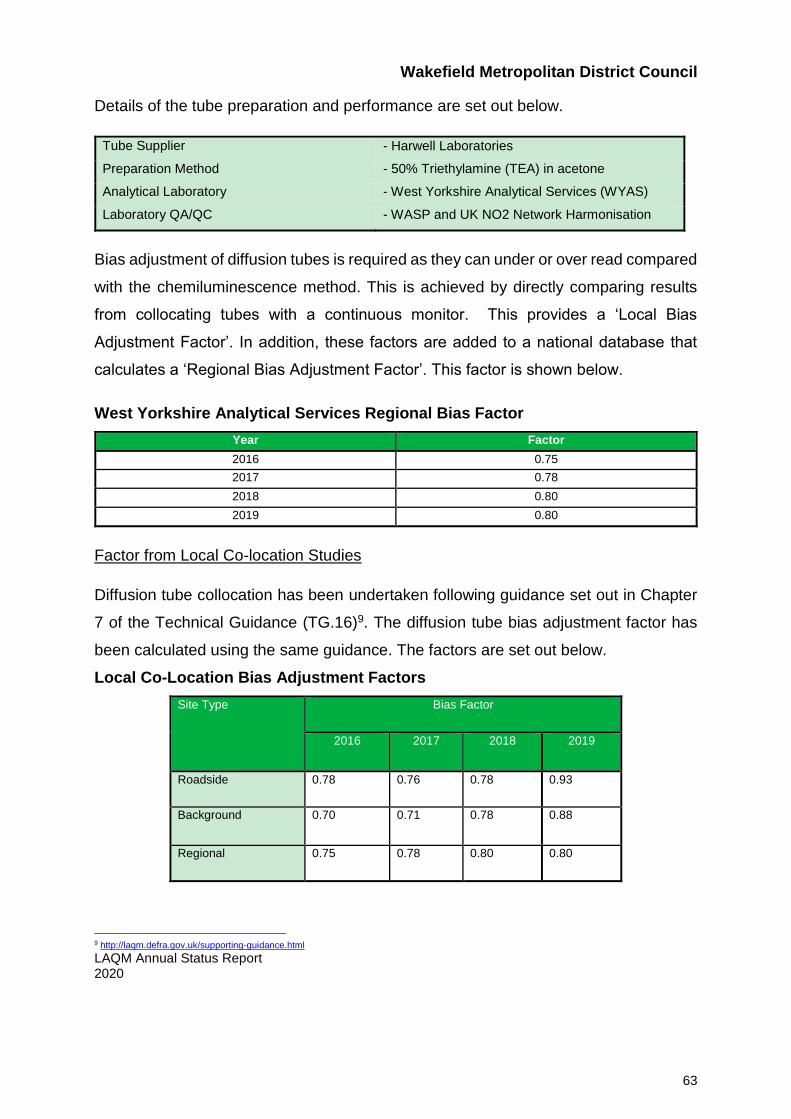
Wakefield Metropolitan District Council
LAQM Annual Status Report 2020 63
Details of the tube preparation and performance are set out below.
Tube Supplier - Harwell Laboratories
Preparation Method - 50% Triethylamine (TEA) in acetone
Analytical Laboratory - West Yorkshire Analytical Services (WYAS)
Laboratory QA/QC - WASP and UK NO2 Network Harmonisation
Bias adjustment of diffusion tubes is required as they can under or over read compared
with the chemiluminescence method. This is achieved by directly comparing results
from collocating tubes with a continuous monitor. This provides a ‘Local Bias
Adjustment Factor’. In addition, these factors are added to a national database that
calculates a ‘Regional Bias Adjustment Factor’. This factor is shown below.
West Yorkshire Analytical Services Regional Bias Factor
Year Factor
2016 0.75
2017 0.78
2018 0.80
2019 0.80
Factor from Local Co-location Studies
Diffusion tube collocation has been undertaken following guidance set out in Chapter
7 of the Technical Guidance (TG.16)9. The diffusion tube bias adjustment factor has
been calculated using the same guidance. The factors are set out below.
Local Co-Location Bias Adjustment Factors
Site Type
Bias Factor
2016 2017 2018 2019
Roadside 0.78 0.76 0.78 0.93
Background 0.70 0.71 0.78 0.88
Regional 0.75 0.78 0.80 0.80
9 http://laqm.defra.gov.uk/supporting-guidance.html
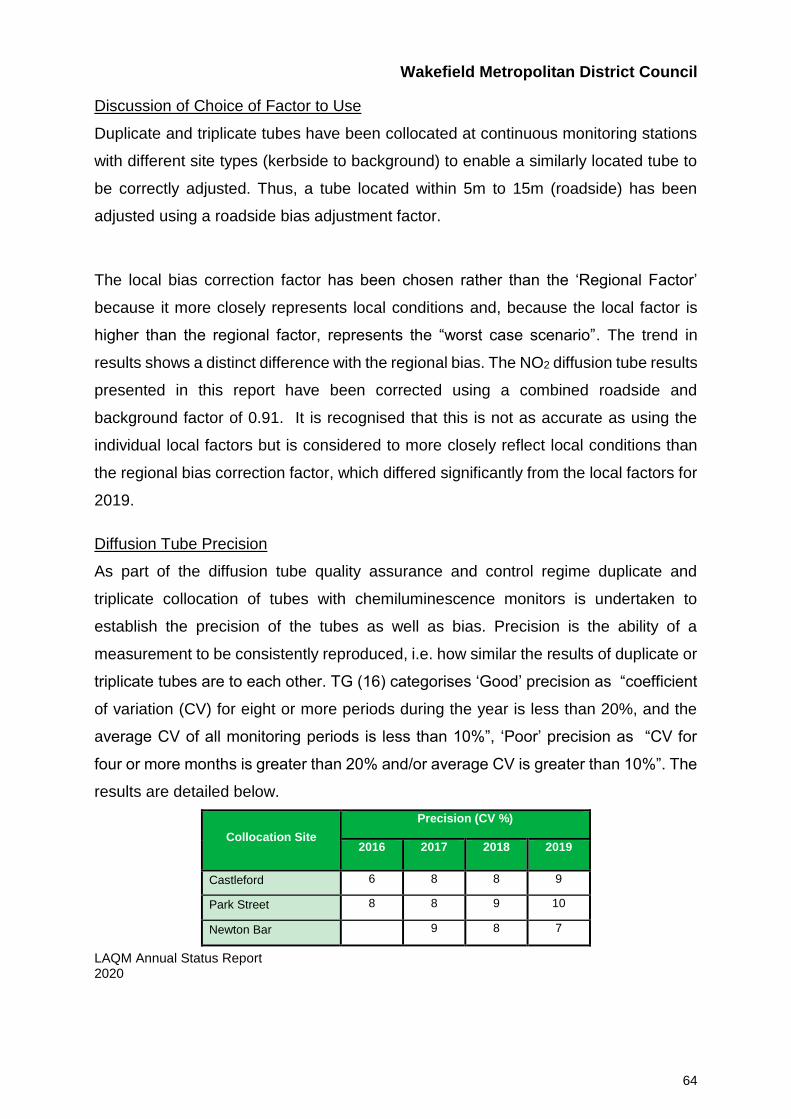
Wakefield Metropolitan District Council
LAQM Annual Status Report 2020 64
Discussion of Choice of Factor to Use
Duplicate and triplicate tubes have been collocated at continuous monitoring stations
with different site types (kerbside to background) to enable a similarly located tube to
be correctly adjusted. Thus, a tube located within 5m to 15m (roadside) has been
adjusted using a roadside bias adjustment factor.
The local bias correction factor has been chosen rather than the ‘Regional Factor’
because it more closely represents local conditions and, because the local factor is
higher than the regional factor, represents the “worst case scenario”. The trend in
results shows a distinct difference with the regional bias. The NO2 diffusion tube results
presented in this report have been corrected using a combined roadside and
background factor of 0.91. It is recognised that this is not as accurate as using the
individual local factors but is considered to more closely reflect local conditions than
the regional bias correction factor, which differed significantly from the local factors for
2019.
Diffusion Tube Precision
As part of the diffusion tube quality assurance and control regime duplicate and
triplicate collocation of tubes with chemiluminescence monitors is undertaken to
establish the precision of the tubes as well as bias. Precision is the ability of a
measurement to be consistently reproduced, i.e. how similar the results of duplicate or
triplicate tubes are to each other. TG (16) categorises ‘Good’ precision as “coefficient
of variation (CV) for eight or more periods during the year is less than 20%, and the
average CV of all monitoring periods is less than 10%”, ‘Poor’ precision as “CV for
four or more months is greater than 20% and/or average CV is greater than 10%”. The
results are detailed below.
Collocation Site
Precision (CV %)
2016 2017 2018 2019
Castleford 6 8 8 9
Park Street 8 8 9 10
Newton Bar 9 8 7
Wakefield Metropolitan District Council
LAQM Annual Status Report 2020 65
Further quality assurance and control is provided the AIR NO2 Proficiency Testing
Scheme. AIR is an independent analytical proficiency-testing (PT) scheme, operated
by LGC Standards and supported by the Health and Safety Laboratory (HSL). AIR PT
is a new scheme, started in April 2014, which combined two long running PT schemes:
LGC Standards STACKS PT scheme and HSL WASP PT scheme.
AIR offers a number of test samples designed to test the proficiency of laboratories
undertaking analysis of chemical pollutants in ambient indoor, stack and workplace air.
One such sample is the AIR NO2 test sample type that is distributed to participants in
a quarterly basis. The latest round of reporting for the West Yorkshire facility (January
to November 2019) is SATISFACTORY.
Annualisation
Annualisation is used to estimate an annual mean concentration where data is
collected for less than 75% of the monitoring period, i.e. in the case of diffusion tube
results, fewer than 9 months out of twelve. In 2019 none of the monitoring sites
returned less than 75% data. Annualisation was therefore not required for any
monitoring site.
Distance Correction
Distance correction using the NO2 fall-off as discussed in Paragraphs 7.77-7.79 of
LAQM.TG16 is used to represent the values at the nearest receptor where monitoring
is located either closer or further away. None of the diffusion tube deployed in 2019
required distance correction.
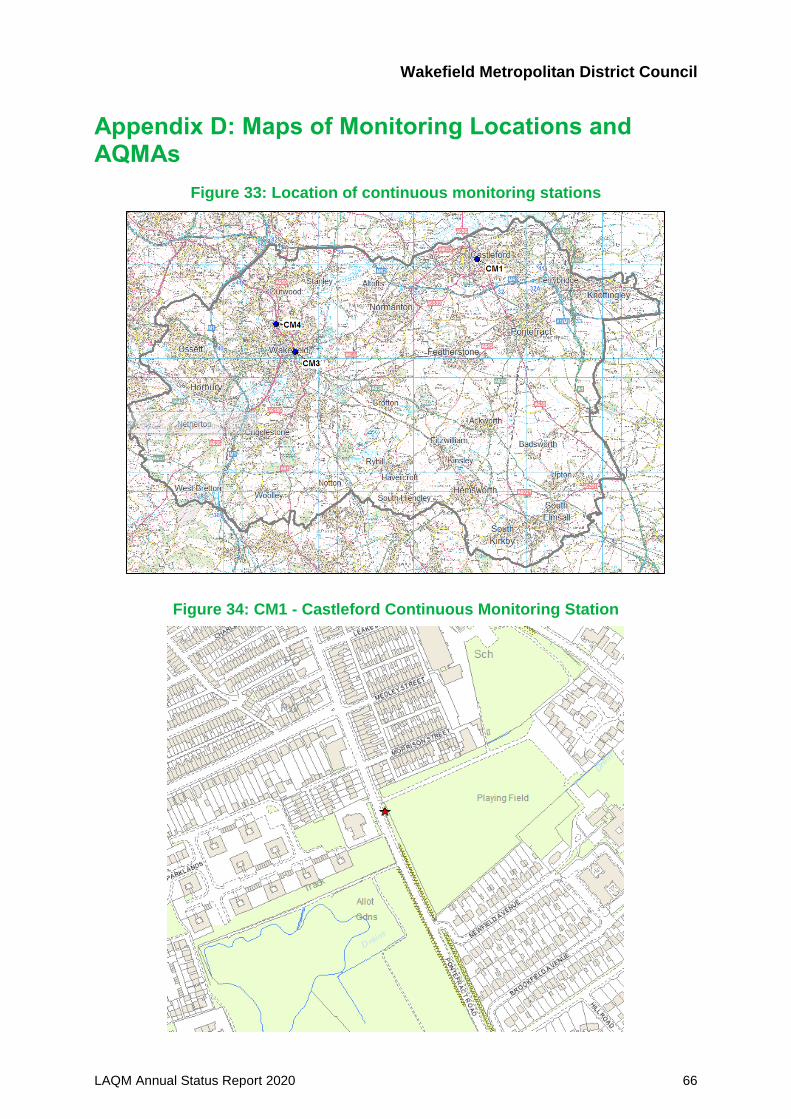
Wakefield Metropolitan District Council
LAQM Annual Status Report 2020 66
Appendix D: Maps of Monitoring Locations and AQMAs
Figure 33: Location of continuous monitoring stations
Figure 34: CM1 - Castleford Continuous Monitoring Station
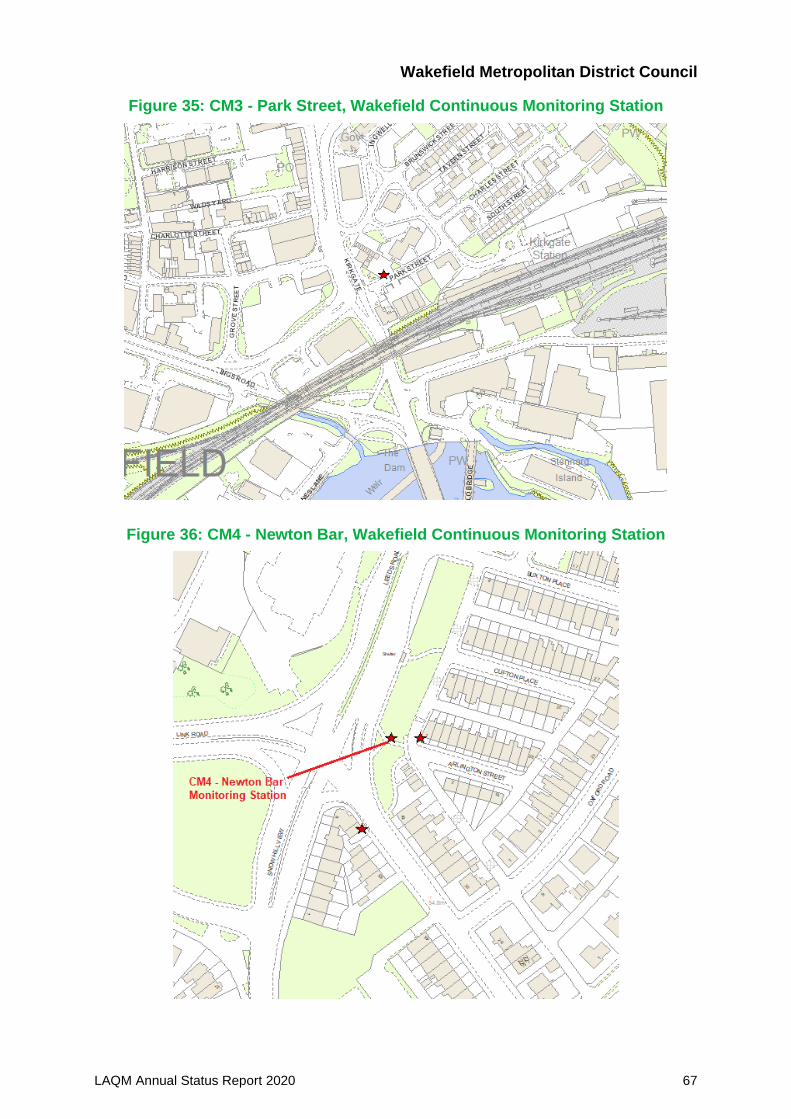
Wakefield Metropolitan District Council
LAQM Annual Status Report 2020 67
Figure 35: CM3 - Park Street, Wakefield Continuous Monitoring Station
Figure 36: CM4 - Newton Bar, Wakefield Continuous Monitoring Station
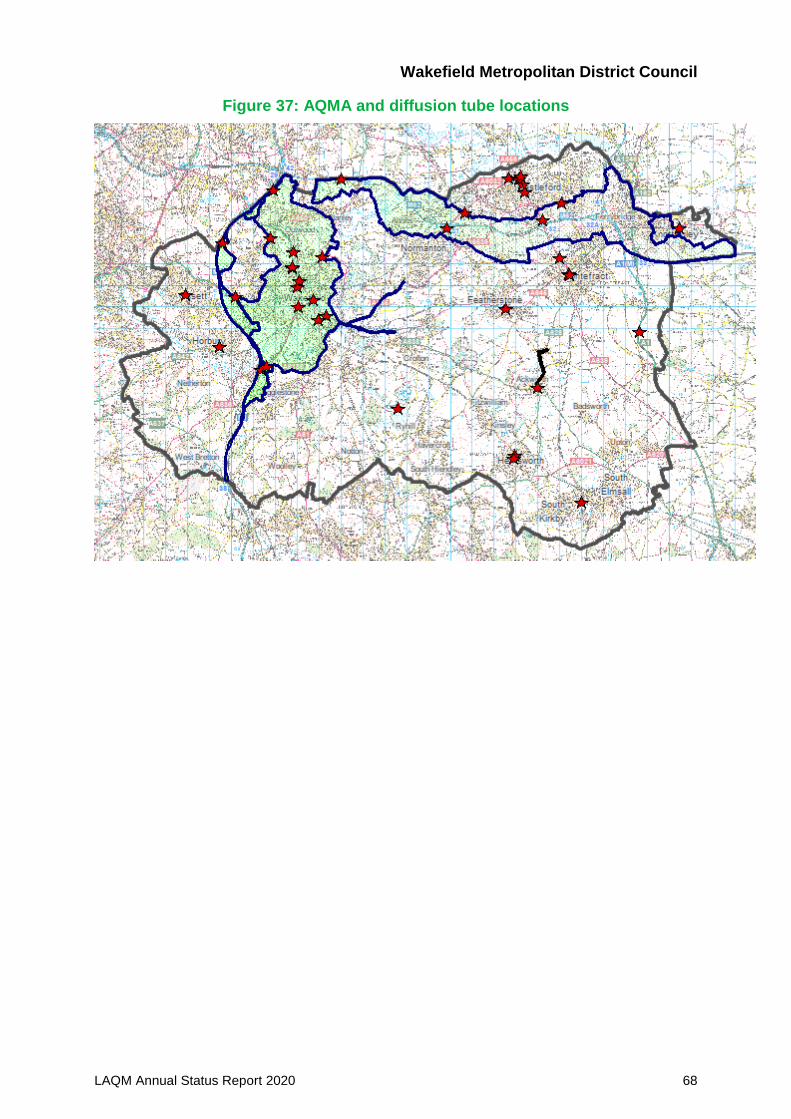
Wakefield Metropolitan District Council
LAQM Annual Status Report 2020 68
Figure 37: AQMA and diffusion tube locations
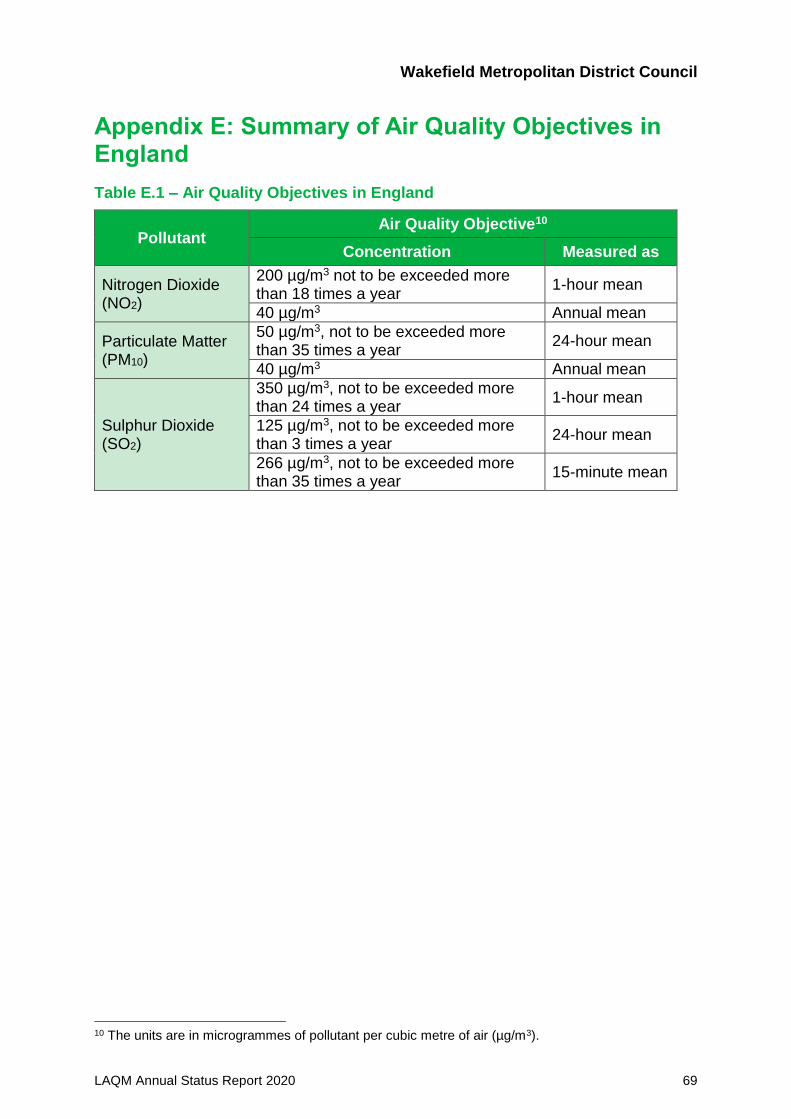
Wakefield Metropolitan District Council
LAQM Annual Status Report 2020 69
Appendix E: Summary of Air Quality Objectives in England
Table E.1 – Air Quality Objectives in England
Pollutant Air Quality Objective10
Concentration Measured as
Nitrogen Dioxide (NO2)
200 µg/m3 not to be exceeded more than 18 times a year
1-hour mean
40 µg/m3 Annual mean
Particulate Matter (PM10)
50 µg/m3, not to be exceeded more than 35 times a year
24-hour mean
40 µg/m3 Annual mean
Sulphur Dioxide (SO2)
350 µg/m3, not to be exceeded more than 24 times a year
1-hour mean
125 µg/m3, not to be exceeded more than 3 times a year
24-hour mean
266 µg/m3, not to be exceeded more than 35 times a year
15-minute mean
10 The units are in microgrammes of pollutant per cubic metre of air (µg/m3).
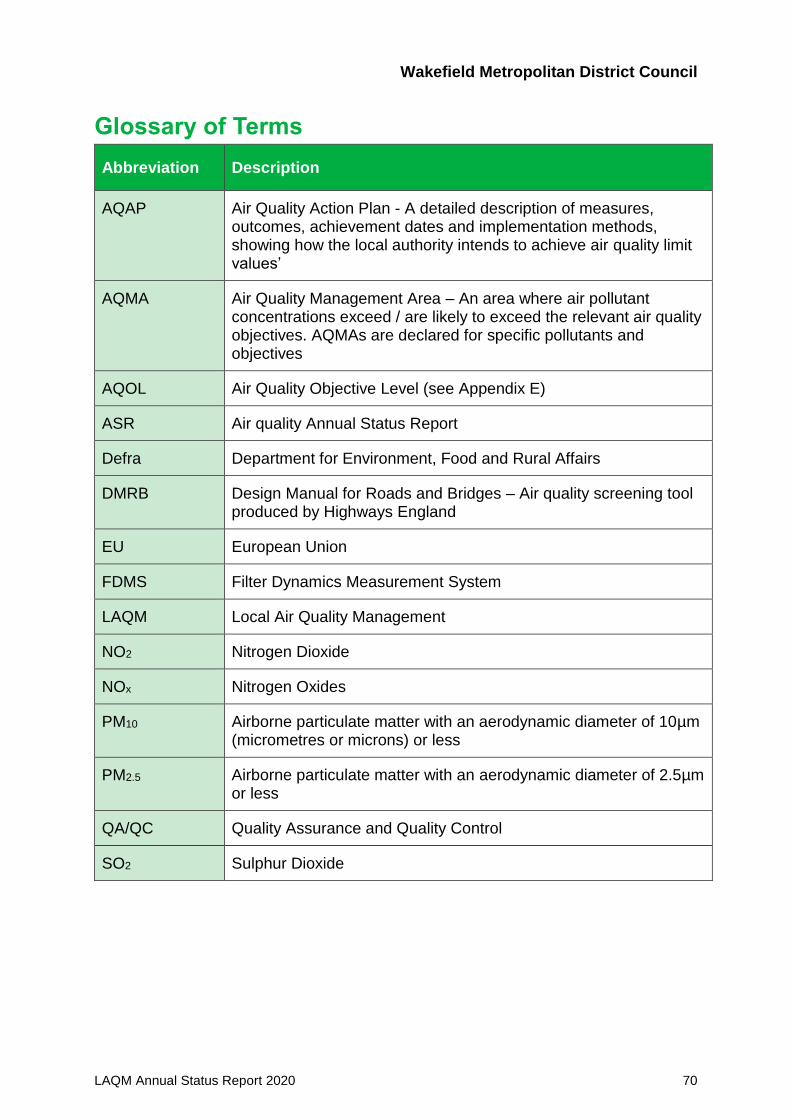
Wakefield Metropolitan District Council
LAQM Annual Status Report 2020 70
Glossary of Terms
Abbreviation Description
AQAP Air Quality Action Plan - A detailed description of measures, outcomes, achievement dates and implementation methods, showing how the local authority intends to achieve air quality limit values’
AQMA Air Quality Management Area – An area where air pollutant concentrations exceed / are likely to exceed the relevant air quality objectives. AQMAs are declared for specific pollutants and objectives
AQOL Air Quality Objective Level (see Appendix E)
ASR Air quality Annual Status Report
Defra Department for Environment, Food and Rural Affairs
DMRB Design Manual for Roads and Bridges – Air quality screening tool produced by Highways England
EU European Union
FDMS Filter Dynamics Measurement System
LAQM Local Air Quality Management
NO2 Nitrogen Dioxide
NOx Nitrogen Oxides
PM10 Airborne particulate matter with an aerodynamic diameter of 10µm (micrometres or microns) or less
PM2.5 Airborne particulate matter with an aerodynamic diameter of 2.5µm or less
QA/QC Quality Assurance and Quality Control
SO2 Sulphur Dioxide