Embed Size (px)
Citation preview

2016 FINANCIAL COMPENSATION SURVEY
FINDINGS AND RESULTS
November 2016
1
Dear Colleagues,
I am pleased to present the findings from the 2016 Financial Compensation Survey. This annual research initiative, now in its fourth year, continues to provide unique insights for a wide-range of financial and investment professionals. Our four years of survey results provide a robust dataset that we are able to turn into meaningful insight.
CFA Society Minnesota is committed to being a trusted resource for the finance industry, providing services, education and information that can assist both Charterholders and non-Charterholders alike. As part of this unwavering commitment, we are pleased to present the findings from this year’s survey. I encourage you to review these findings on the following pages and make your own interpretations of the data. Be sure to examine all the information presented — such as ranges, sample sizes and other criteria — and do not rely on just one number (such as a median or maximum) when interpreting the results.
Whether you have completed the survey all four years, or this is your first time participating, I personally want to thank you. Your willingness to take the time is what enables us to provide this indispensable resource for our entire industry. We truly appreciate your support of the Society.
Regards,
Joshua Howard, CFAPresident, CFA Society Minnesota
2016 FINANCIAL COMPENSATION REPORT
LETTER FROM THE PRESIDENT
2
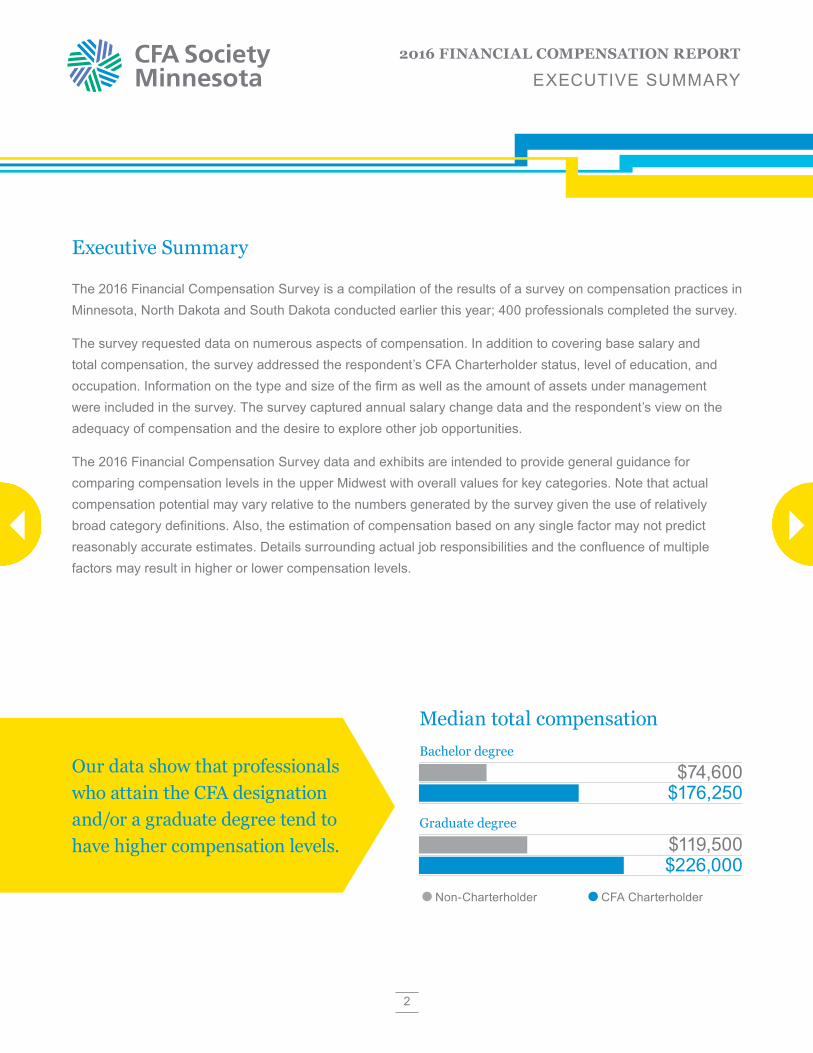
Executive Summary
The 2016 Financial Compensation Survey is a compilation of the results of a survey on compensation practices in Minnesota, North Dakota and South Dakota conducted earlier this year; 400 professionals completed the survey.
The survey requested data on numerous aspects of compensation. In addition to covering base salary and total compensation, the survey addressed the respondent’s CFA Charterholder status, level of education, and occupation. Information on the type and size of the firm as well as the amount of assets under management were included in the survey. The survey captured annual salary change data and the respondent’s view on the adequacy of compensation and the desire to explore other job opportunities.
The 2016 Financial Compensation Survey data and exhibits are intended to provide general guidance for comparing compensation levels in the upper Midwest with overall values for key categories. Note that actual compensation potential may vary relative to the numbers generated by the survey given the use of relatively broad category definitions. Also, the estimation of compensation based on any single factor may not predict reasonably accurate estimates. Details surrounding actual job responsibilities and the confluence of multiple factors may result in higher or lower compensation levels.
2016 FINANCIAL COMPENSATION REPORT
EXECUTIVE SUMMARY
Median total compensation
Non-Charterholder CFA Charterholder
Our data show that professionals who attain the CFA designation and/or a graduate degree tend to have higher compensation levels.
$74,600$176,250
$119,500$226,000
Bachelor degree
Graduate degree
3
2016 FINANCIAL COMPENSATION REPORT
RESPONDENT PROFILES
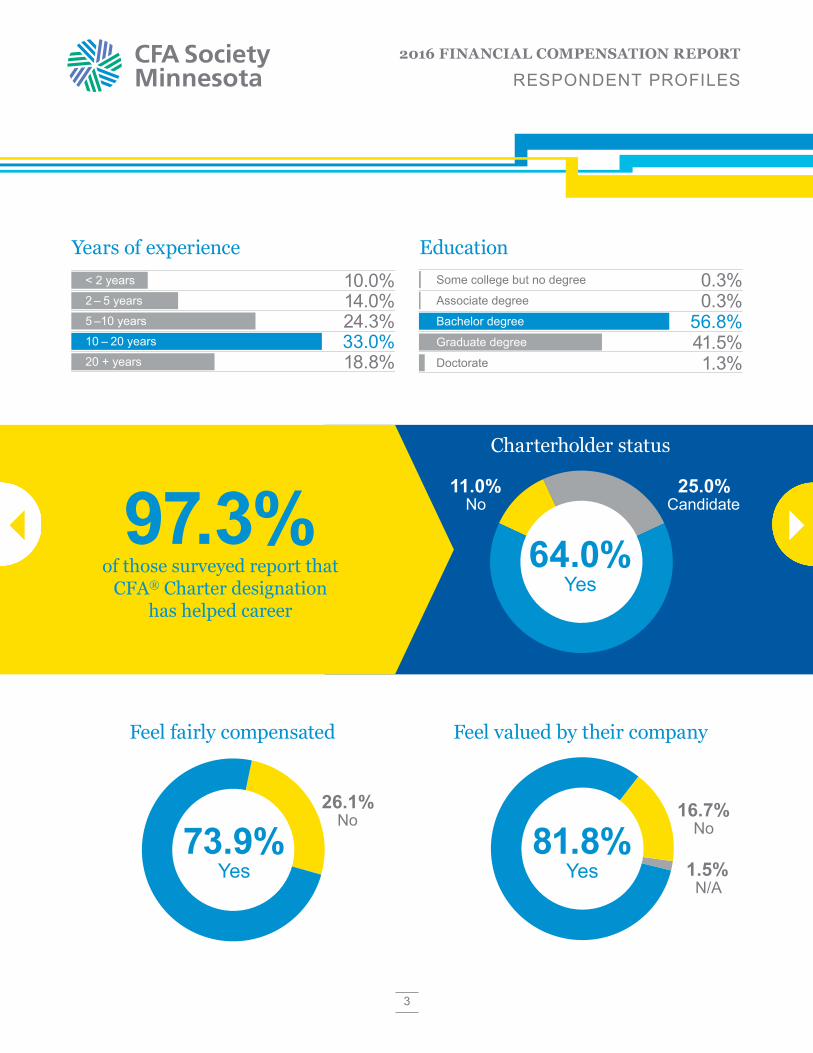
Years of experience< 2 years
2 – 5 years
5 –10 years
10 – 20 years
10.0%14.0%24.3%33.0%
20 + years 18.8%
EducationSome college but no degree
Associate degree
Bachelor degree
0.3%0.3%
56.8%Graduate degree
Doctorate41.5%1.3%
97.3%of those surveyed report that
CFA® Charter designation has helped career
Charterholder status
64.0%Yes
25.0% Candidate
11.0% No
Feel valued by their company
81.8%Yes 1.5%
N/A
16.7% No
Feel fairly compensated
73.9%Yes
26.1% No
4
2016 FINANCIAL COMPENSATION REPORT
RESPONDENT PROFILES
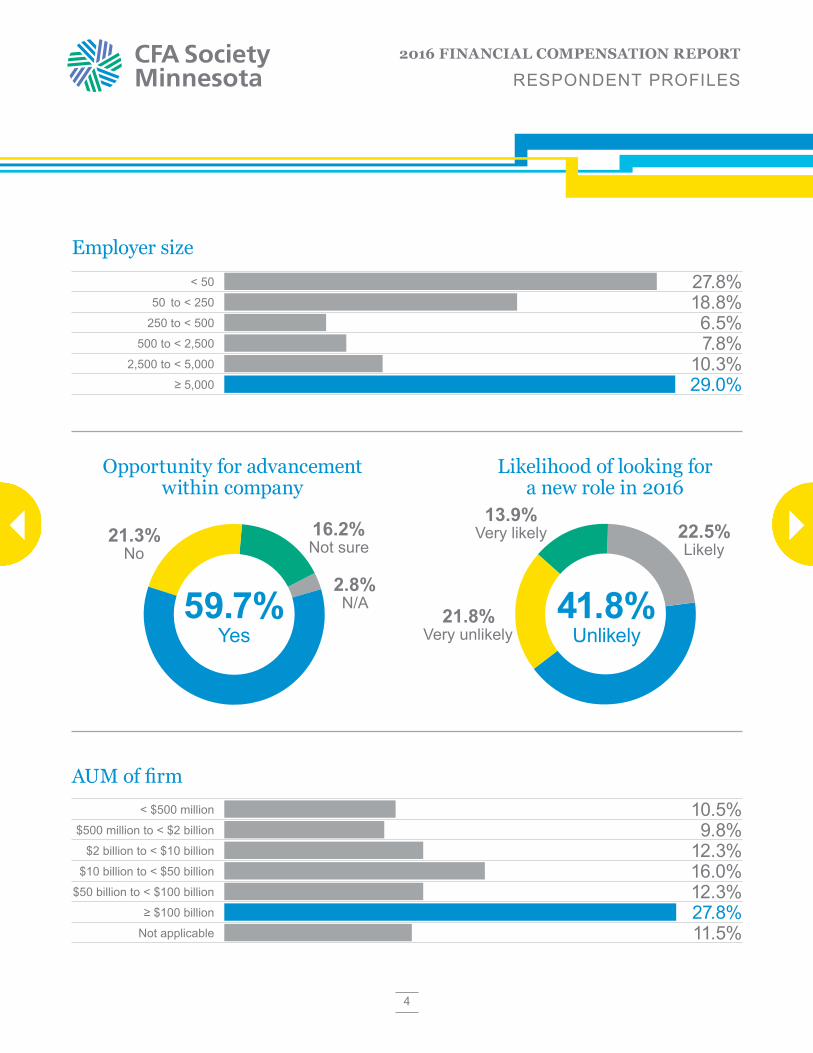
Opportunity for advancement within company
59.7%Yes
2.8% N/A
21.3% No
16.2% Not sure
Likelihood of looking for a new role in 2016
41.8%Unlikely
22.5% Likely
21.8% Very unlikely
13.9% Very likely
Employer size< 50
50 to < 250
250 to < 500
500 to < 2,500
27.8%18.8%6.5%7.8%
2,500 to < 5,000 10.3%≥ 5,000 29.0%
AUM of firm< $500 million
$500 million to < $2 billion
$2 billion to < $10 billion
$10 billion to < $50 billion
10.5%9.8%
12.3%16.0%
$50 billion to < $100 billion 12.3%≥ $100 billion 27.8%
Not applicable 11.5%
5
2016 FINANCIAL COMPENSATION REPORT
RESPONDENT PROFILES
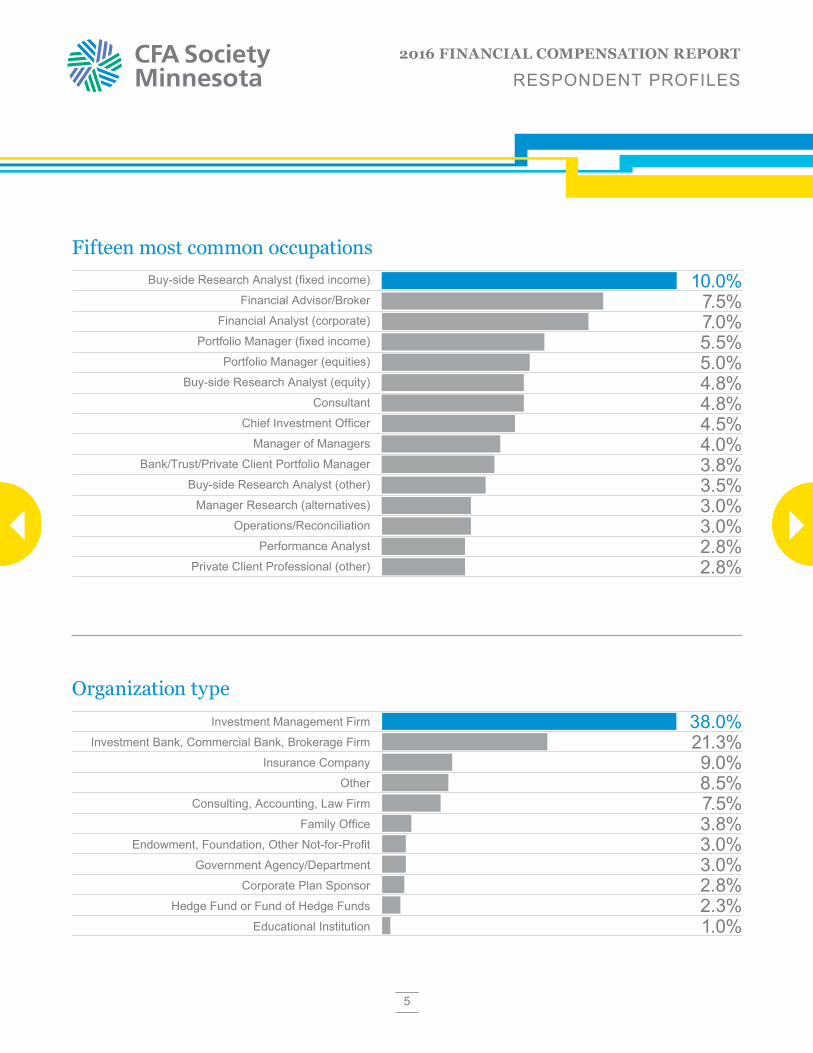
Fifteen most common occupations10.0%
7.5%7.0%5.5%5.0%4.8%4.8%4.5%4.0%3.8%3.5%3.0%3.0%2.8%2.8%
Buy-side Research Analyst (fixed income)
Financial Advisor/Broker
Financial Analyst (corporate)
Portfolio Manager (fixed income)
Portfolio Manager (equities)
Buy-side Research Analyst (equity)
Consultant
Chief Investment Officer
Manager of Managers
Bank/Trust/Private Client Portfolio Manager
Buy-side Research Analyst (other)
Manager Research (alternatives)
Operations/Reconciliation
Performance Analyst
Private Client Professional (other)
Organization type38.0%21.3%9.0%8.5%7.5%3.8%3.0%3.0%2.8%2.3%1.0%
Investment Management Firm
Investment Bank, Commercial Bank, Brokerage Firm
Insurance Company
Other
Consulting, Accounting, Law Firm
Family Office
Endowment, Foundation, Other Not-for-Profit
Government Agency/Department
Corporate Plan Sponsor
Hedge Fund or Fund of Hedge Funds
Educational Institution
6
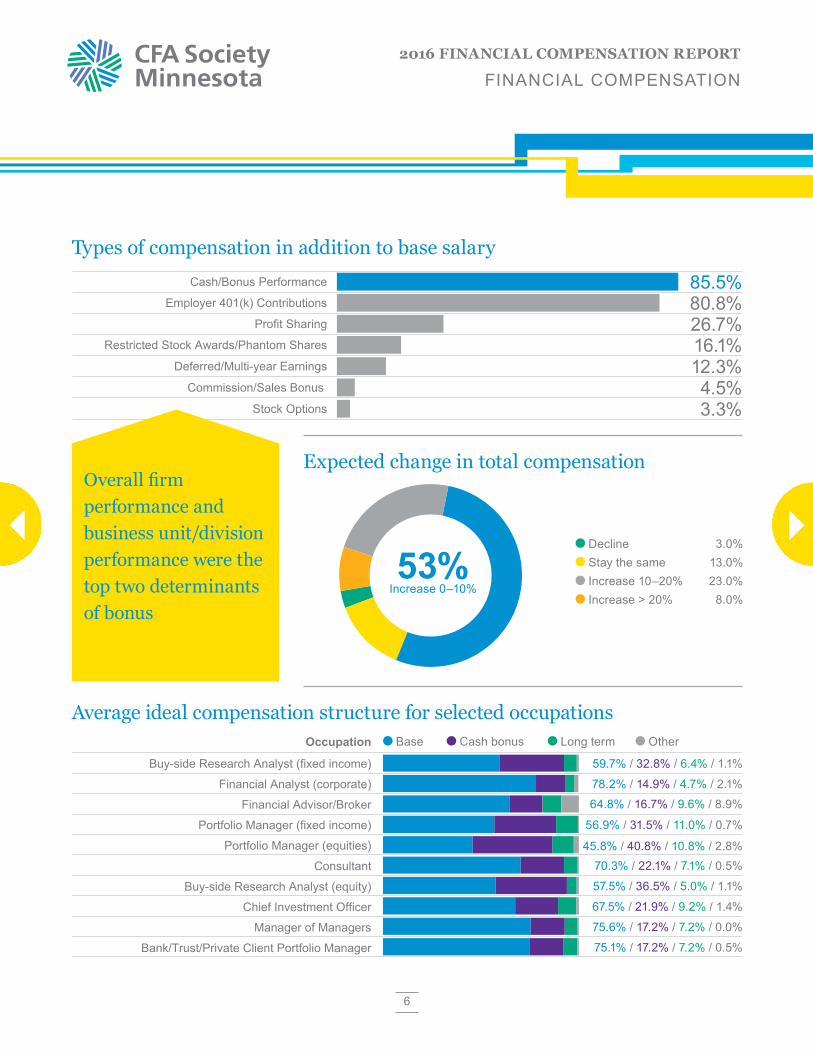
2016 FINANCIAL COMPENSATION REPORT
FINANCIAL COMPENSATION
Types of compensation in addition to base salary
85.5%80.8%26.7%16.1%12.3%4.5%
Cash/Bonus Performance
Employer 401(k) Contributions
Profit Sharing
Restricted Stock Awards/Phantom Shares
Deferred/Multi-year Earnings
Commission/Sales Bonus
Stock Options 3.3%
Average ideal compensation structure for selected occupations
59.7% / 32.8% / 6.4% / 1.1%
78.2% / 14.9% / 4.7% / 2.1%
64.8% / 16.7% / 9.6% / 8.9%
56.9% / 31.5% / 11.0% / 0.7%
45.8% / 40.8% / 10.8% / 2.8%70.3% / 22.1% / 7.1% / 0.5%
57.5% / 36.5% / 5.0% / 1.1%
67.5% / 21.9% / 9.2% / 1.4%
75.6% / 17.2% / 7.2% / 0.0%
75.1% / 17.2% / 7.2% / 0.5%
Occupation
Buy-side Research Analyst (fixed income)
Financial Analyst (corporate)
Financial Advisor/Broker
Portfolio Manager (fixed income)
Portfolio Manager (equities)
Consultant
Buy-side Research Analyst (equity)
Chief Investment Officer
Manager of Managers
Bank/Trust/Private Client Portfolio Manager
Expected change in total compensation
Decline 3.0% Stay the same 13.0% Increase 10–20% 23.0% Increase > 20% 8.0%
53%Increase 0–10%
Base Cash bonus Long term Other
Overall firm performance and business unit/division performance were the top two determinants of bonus
7
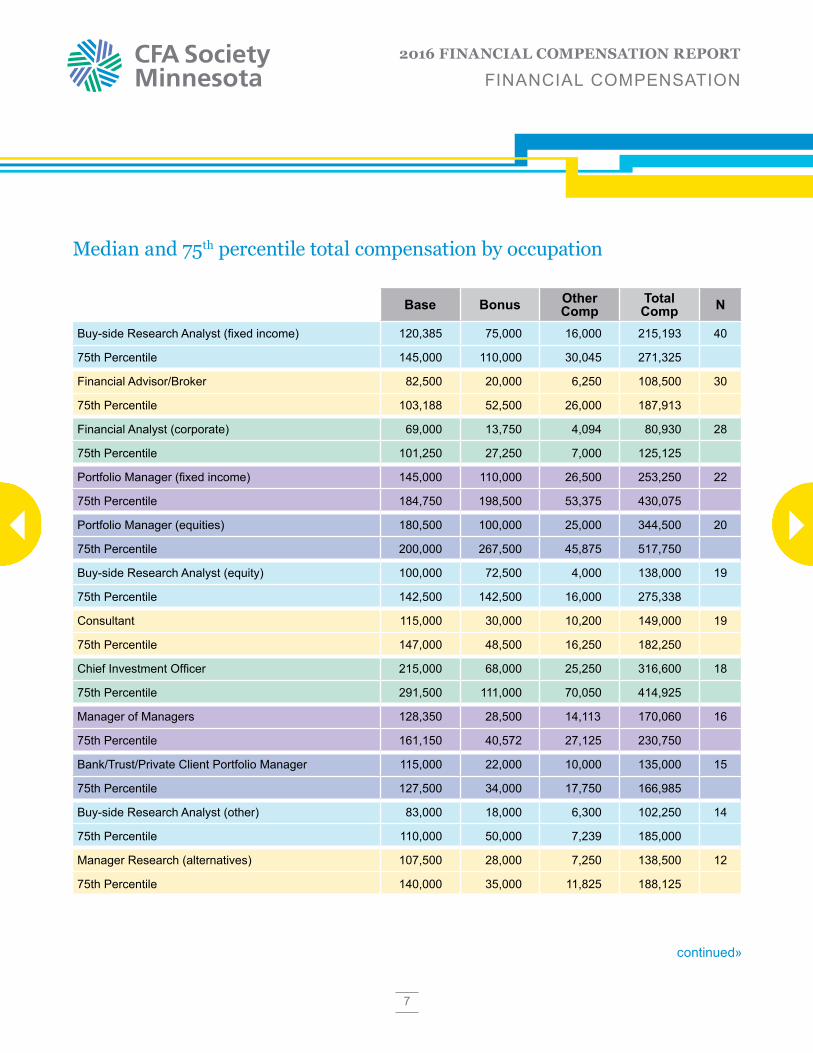
2016 FINANCIAL COMPENSATION REPORT
FINANCIAL COMPENSATION
continued»
Median and 75th percentile total compensation by occupation
Base Bonus Other Comp
Total Comp N
Buy-side Research Analyst (fixed income) 120,385 75,000 16,000 215,193 40
75th Percentile 145,000 110,000 30,045 271,325
Financial Advisor/Broker 82,500 20,000 6,250 108,500 30
75th Percentile 103,188 52,500 26,000 187,913
Financial Analyst (corporate) 69,000 13,750 4,094 80,930 28
75th Percentile 101,250 27,250 7,000 125,125
Portfolio Manager (fixed income) 145,000 110,000 26,500 253,250 22
75th Percentile 184,750 198,500 53,375 430,075
Portfolio Manager (equities) 180,500 100,000 25,000 344,500 20
75th Percentile 200,000 267,500 45,875 517,750
Buy-side Research Analyst (equity) 100,000 72,500 4,000 138,000 19
75th Percentile 142,500 142,500 16,000 275,338
Consultant 115,000 30,000 10,200 149,000 19
75th Percentile 147,000 48,500 16,250 182,250
Chief Investment Officer 215,000 68,000 25,250 316,600 18
75th Percentile 291,500 111,000 70,050 414,925
Manager of Managers 128,350 28,500 14,113 170,060 16
75th Percentile 161,150 40,572 27,125 230,750
Bank/Trust/Private Client Portfolio Manager 115,000 22,000 10,000 135,000 15
75th Percentile 127,500 34,000 17,750 166,985
Buy-side Research Analyst (other) 83,000 18,000 6,300 102,250 14
75th Percentile 110,000 50,000 7,239 185,000
Manager Research (alternatives) 107,500 28,000 7,250 138,500 12
75th Percentile 140,000 35,000 11,825 188,125
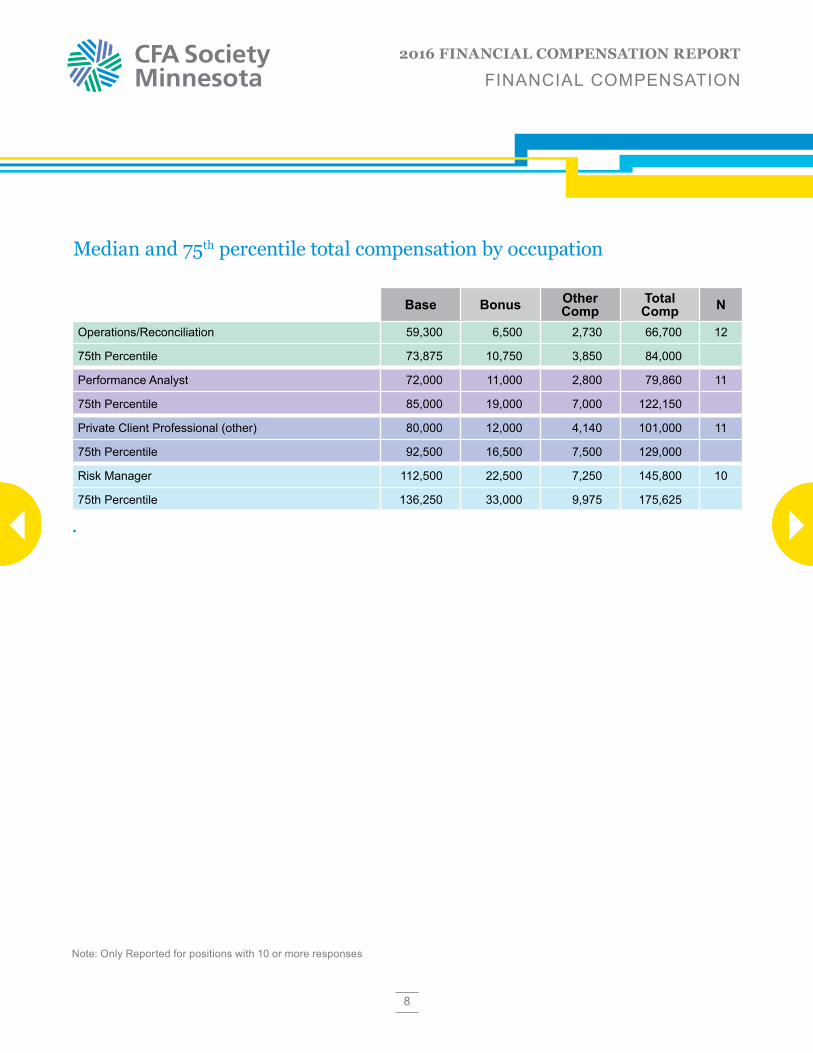
8
2016 FINANCIAL COMPENSATION REPORT
FINANCIAL COMPENSATION
Note: Only Reported for positions with 10 or more responses
Median and 75th percentile total compensation by occupation
Base Bonus Other Comp
Total Comp N
Operations/Reconciliation 59,300 6,500 2,730 66,700 12
75th Percentile 73,875 10,750 3,850 84,000
Performance Analyst 72,000 11,000 2,800 79,860 11
75th Percentile 85,000 19,000 7,000 122,150
Private Client Professional (other) 80,000 12,000 4,140 101,000 11
75th Percentile 92,500 16,500 7,500 129,000
Risk Manager 112,500 22,500 7,250 145,800 10
75th Percentile 136,250 33,000 9,975 175,625
.
9
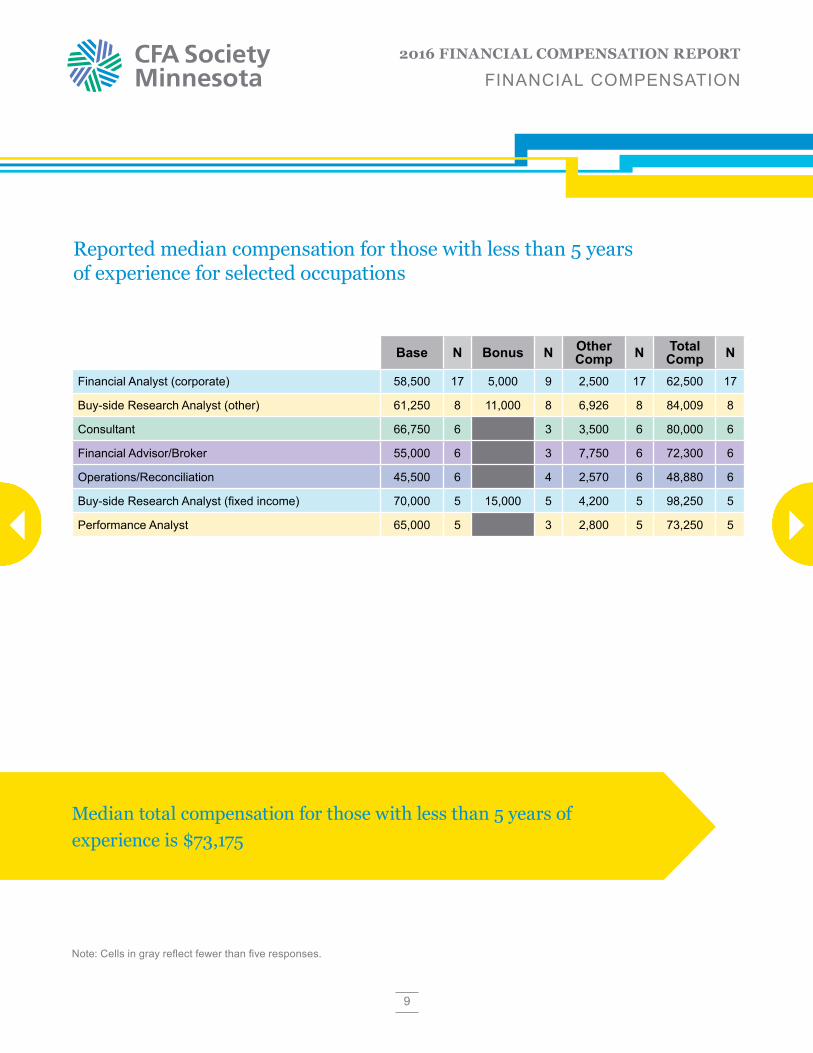
2016 FINANCIAL COMPENSATION REPORT
FINANCIAL COMPENSATION
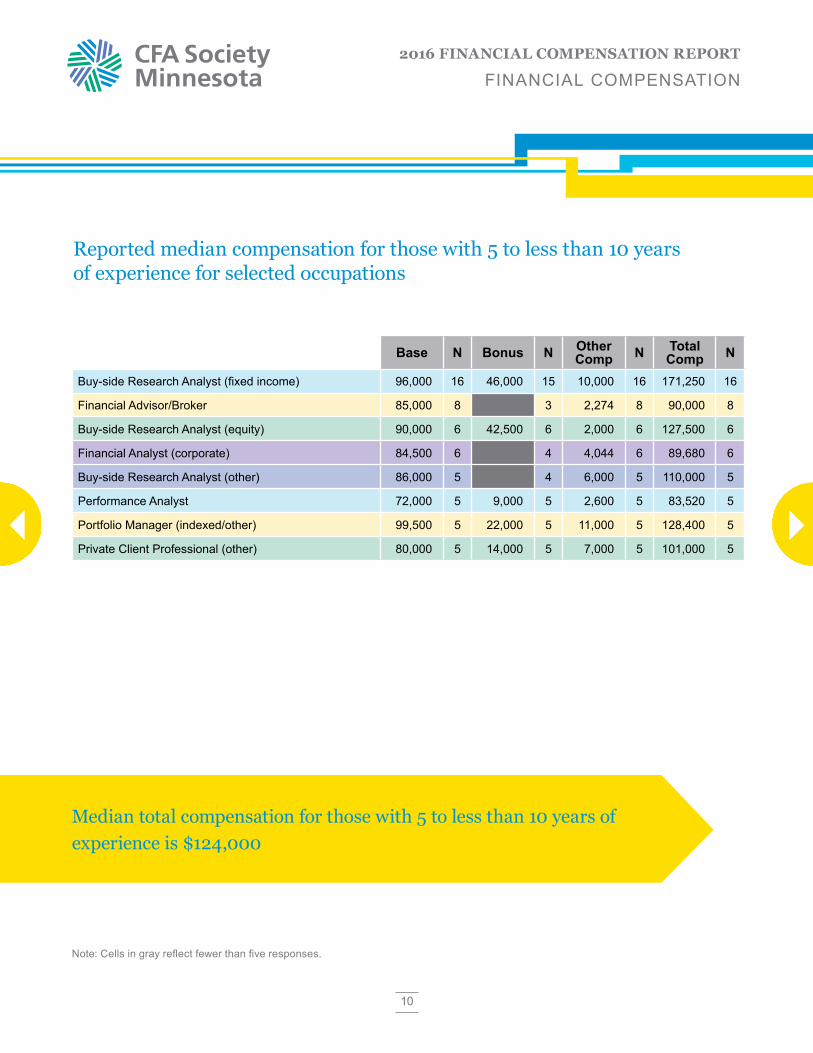
Median total compensation for those with less than 5 years of experience is $73,175
Note: Cells in gray reflect fewer than five responses.
Reported median compensation for those with less than 5 years of experience for selected occupations
Base N Bonus N Other Comp N Total
Comp N
Financial Analyst (corporate) 58,500 17 5,000 9 2,500 17 62,500 17
Buy-side Research Analyst (other) 61,250 8 11,000 8 6,926 8 84,009 8
Consultant 66,750 6 3 3,500 6 80,000 6
Financial Advisor/Broker 55,000 6 3 7,750 6 72,300 6
Operations/Reconciliation 45,500 6 4 2,570 6 48,880 6
Buy-side Research Analyst (fixed income) 70,000 5 15,000 5 4,200 5 98,250 5
Performance Analyst 65,000 5 3 2,800 5 73,250 5
10
2016 FINANCIAL COMPENSATION REPORT
FINANCIAL COMPENSATION
Median total compensation for those with 5 to less than 10 years of experience is $124,000
Note: Cells in gray reflect fewer than five responses.
Reported median compensation for those with 5 to less than 10 years of experience for selected occupations
Base N Bonus N Other Comp N Total
Comp N
Buy-side Research Analyst (fixed income) 96,000 16 46,000 15 10,000 16 171,250 16
Financial Advisor/Broker 85,000 8 3 2,274 8 90,000 8
Buy-side Research Analyst (equity) 90,000 6 42,500 6 2,000 6 127,500 6
Financial Analyst (corporate) 84,500 6 4 4,044 6 89,680 6
Buy-side Research Analyst (other) 86,000 5 4 6,000 5 110,000 5
Performance Analyst 72,000 5 9,000 5 2,600 5 83,520 5
Portfolio Manager (indexed/other) 99,500 5 22,000 5 11,000 5 128,400 5
Private Client Professional (other) 80,000 5 14,000 5 7,000 5 101,000 5
11
2016 FINANCIAL COMPENSATION REPORT
FINANCIAL COMPENSATION
Median total compensation for those with 10 to less than 20 years of experience is $204,250
Note: Cells in gray reflect fewer than five responses.
Reported median compensation for those with 10 to less than 20 years of experience for selected occupations
Base N Bonus N Other Comp N Total
Comp N
Buy-side Research Analyst (fixed-income) 145,000 15 100,000 15 18,385 15 267,100 15
Financial Advisor/Broker 94,000 7 20,500 8 28,000 11 134,000 11
Bank/Trust/Private Client Portfolio Manager 115,000 9 27,450 8 12,690 9 157,600 9
Portfolio Manager (equities) 180,000 9 100,000 9 35,000 9 280,000 9
Portfolio Manager (fixed-income) 140,000 9 78,164 8 10,000 9 215,000 9
Buy-side Research Analyst (equity) 165,000 8 125,000 8 33,500 8 330,000 8
Manager of Managers 135,750 8 25,000 8 22,250 8 182,422 8
Manager Research (alternatives) 137,500 7 32,500 6 8,000 7 174,500 7
Chief Investment Officer 156,000 6 4 15,500 6 203,383 6
Financial Analyst (corporate) 120,000 5 30,000 5 8,800 5 167,000 5
Risk Manager 110,000 5 20,000 5 7,000 5 147,700 5
12
2016 FINANCIAL COMPENSATION REPORT
FINANCIAL COMPENSATION
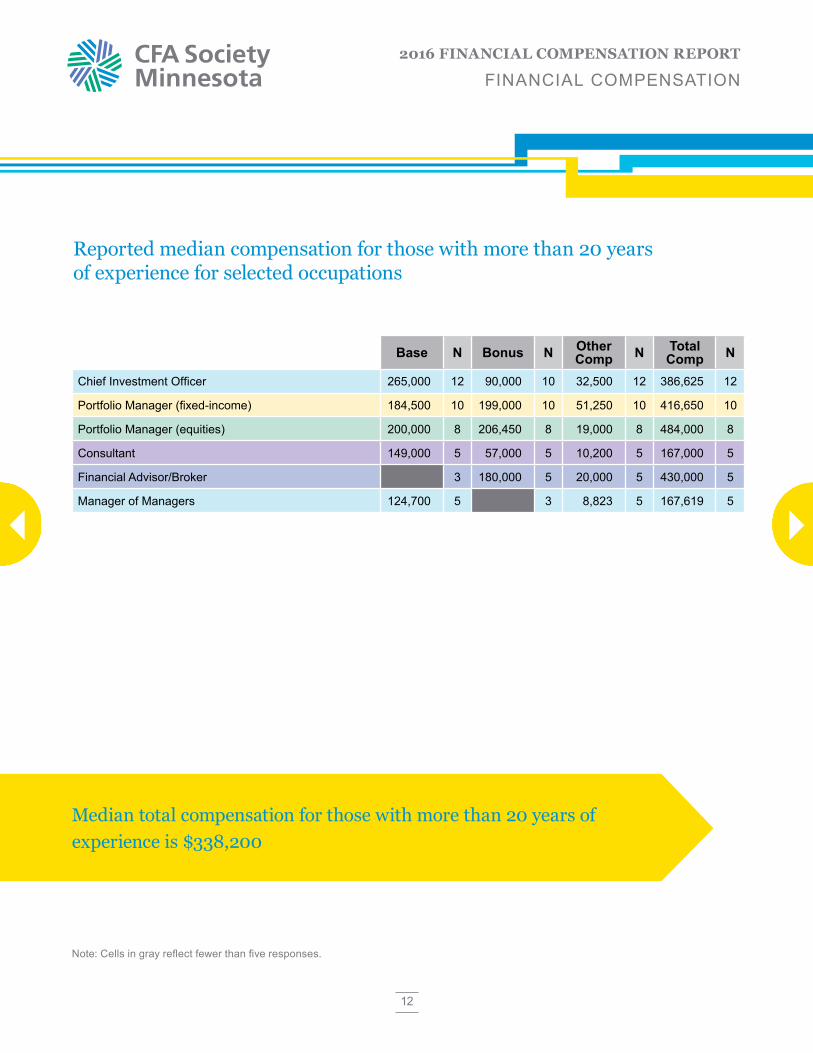
Median total compensation for those with more than 20 years of experience is $338,200
Note: Cells in gray reflect fewer than five responses.
Reported median compensation for those with more than 20 years of experience for selected occupations
Base N Bonus N Other Comp N Total
Comp N
Chief Investment Officer 265,000 12 90,000 10 32,500 12 386,625 12
Portfolio Manager (fixed-income) 184,500 10 199,000 10 51,250 10 416,650 10
Portfolio Manager (equities) 200,000 8 206,450 8 19,000 8 484,000 8
Consultant 149,000 5 57,000 5 10,200 5 167,000 5
Financial Advisor/Broker 3 180,000 5 20,000 5 430,000 5
Manager of Managers 124,700 5 3 8,823 5 167,619 5
13
2016 FINANCIAL COMPENSATION REPORT
FINANCIAL COMPENSATION
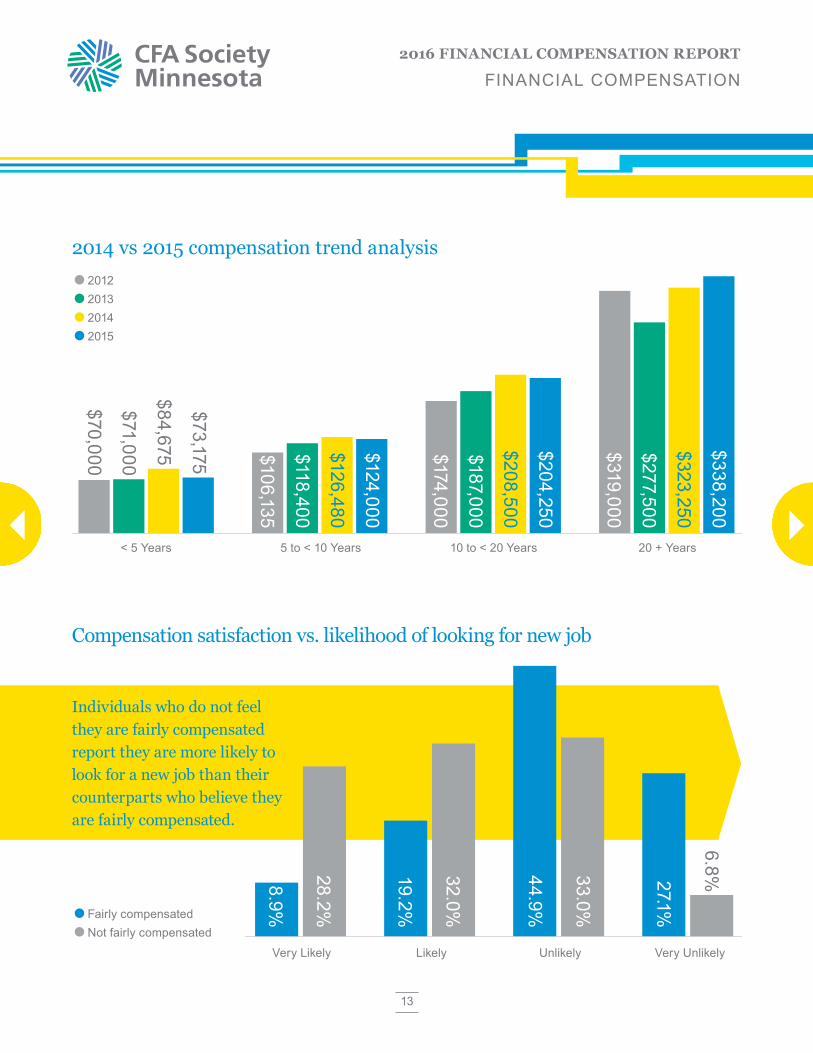
2014 vs 2015 compensation trend analysis
$70,000 $106,135
$118,400
$124,000
$126,480
$174,000
$187,000
$204,250
$208,500
$319,000
$277,500
$338,200
$323,250
$71,000
$84,675
$73,175
< 5 Years 5 to < 10 Years 10 to < 20 Years 20 + Years
2012 2013 2014 2015
Compensation satisfaction vs. likelihood of looking for new job
Individuals who do not feel they are fairly compensated report they are more likely to look for a new job than their counterparts who believe they are fairly compensated.
Fairly compensated Not fairly compensated
8.9%
28.2%
19.2%
32.0%
44.9%
33.0%
27.1%
6.8%
Very Likely Likely Unlikely Very Unlikely
14
2016 FINANCIAL COMPENSATION REPORT
SURVEY METHODOLOGY
Survey methodology
MethodCFA Society Minnesota shared an online survey with financial professionals in the region who are subscribers of CFA Society Minnesota’s online publications and LinkedIn group. The survey was structured so all data gathered were anonymous with no identifiable information requested.
RespondentsRespondents were financial and investment professionals, and totaled 400 unique and completed responses.
TimingThe survey was active from April 18 – May 13, 2016.
AssumptionsThe findings from this survey were derived from self-reported data. Because the survey used sampling methodology and broadly defined positions, survey findings are not necessarily representative of the total population. The survey is designed to provide general information about pay levels within the industry. Earning any degree or professional designation is no guarantee of employment or compensation.
15
About CFA Society Minnesota
CFA Society Minnesota is the premier professional organization for investment professionals to connect with Chartered Financial Analysts in the Twin Cities area and throughout the Upper Midwest five-state region. With members in five states and a wide variety of industries, CFA Society Minnesota strives to serve its broad membership through relevant educational programming, membership support services and opportunities for advancement such as networking events and discounts on educational materials.
If you are interested in learning more about earning your charter, or to learn more about CFA Society Minnesota, contact [email protected].
Follow us at:
2016 FINANCIAL COMPENSATION REPORT
ABOUT CFA SOCIETY MINNESOTA
Generously supported by Hirenomics, LLC
Hirenomics is an Executive Recruiting firm specialized in the financial services industry. Our firm represents investment management, private equity, and insurance companies that range from firms with over a trillion in AUM to small boutique firms across the country. What separates our firm from others is our high touch, methodical process to recruiting, along with our unparalleled approach to unearthing passive candidates. As a leader in recruiting, we are proud to say we hold some of the top return-on-investment and long-term retention stats in the industry: a 99% closing ratio and a 94% retention ratio. If you are interested in learning more about Hirenomics, go to http://hirenomics.com/.