Embed Size (px)
Citation preview

© 2016 Inmar, Inc.

© 2016 Inmar, Inc.
© 2016 Inmar, Inc.
How Medication Adherence and Outcomes Are Changing the
Business ModelTodd Sega
Manager, Payer Relations
Lari HardingVP, Strategy & Growth
Healthcare Network
Laura CranstonExecutive Director
3

© 2016 Inmar, Inc.
Come and learn about how the shift in healthcare from the fee-for-service business model to value based reimbursement is being implemented in pharmacy in 2016.
We will discuss the measures, the contracting models, the sources for quantification, the dollars at risk, and how retail pharmacy needs to respond. Specifically, pharmacies must determine how much should they invest to improve outcomes, and which initiatives are more likely to improve their ratings.
We will discuss examples of what is being tried and where the industry is seeing success. We will give you a preview of 2017.
Session Summary
4

© 2016 Inmar, Inc.
Federal healthcare spending outpaces social security for the first time in 2015
5
$936 $882
Healthcare Social Security
• Medicare• Medicaid • Affordable
Care Act subsidies
GOVERNMENT SPENDING (in billions)
Source: Congressional budget office https://www.cbo.gov/sites/default/files/114th-congress-2015-2016/reports/51129-2016Outlook_OneCol-2.pdf

© 2016 Inmar, Inc. 6
HHS has set a goal of tying 30 percent of traditional, or fee-for-service Medicare payments to quality or value through alternative payment models, such as Accountable Care Organizations (ACOs) or bundled payment arrangements by the end of 2016, and tying 50 percent of payments to these models by the end of 2018.
-- HHS Secretary Sylvia M. Burwell

© 2016 Inmar, Inc.
Fee-for-service with no link of payment to quality
Fee-for-service with a link of payment to quality
Alternative payment models built on fee-for-service architecture
Population-based payment
CATEGORY 1
CATEGORY 2
CATEGORY 3
CATEGORY 4
HHS framework for the evolution of payment models
There is MUCH evolution to come…
7
Value-based purchasing includes payments made in categories 2-4
© 2016 Inmar, Inc.
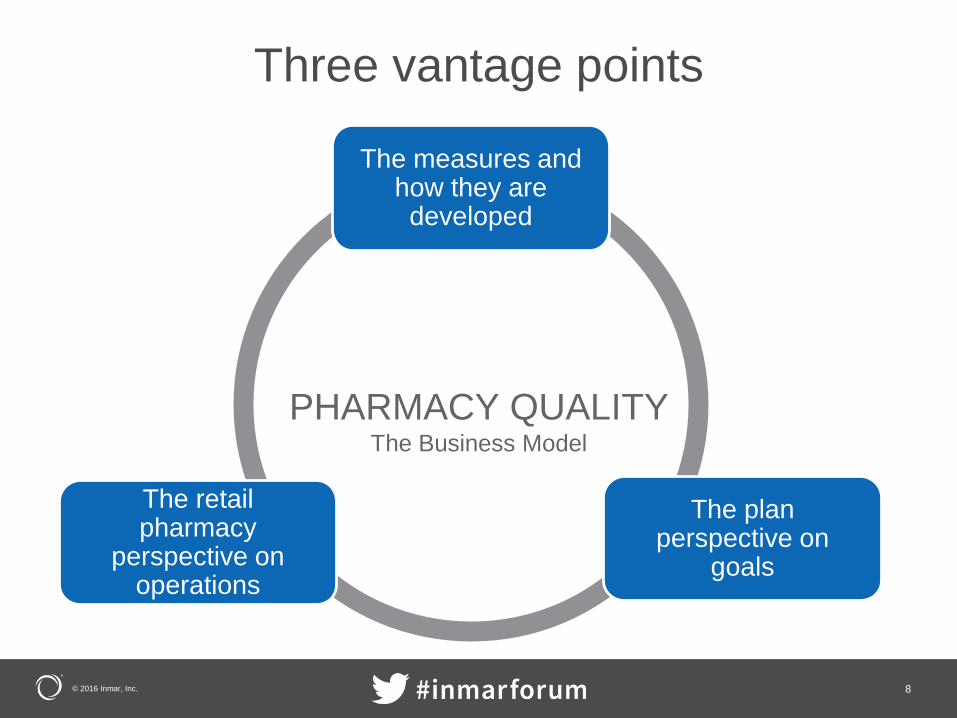
Three vantage points
8
The measures and how they are developed
The plan perspective on
goals
The retail pharmacy
perspective on operations
PHARMACY QUALITYThe Business Model

© 2016 Inmar, Inc.
The Measures
Laura Cranston Executive Director
9

© 2016 Inmar, Inc.
• Established in 2006 as a public-private partnership through leadership of CMS and operates as an independent, nonprofit 501(c)3 corporation
• Consensus-based, multi-stakeholder, transparent alliance with over 180 members and over 400 active representatives from these member organizations
• PQA develops medication use measures, that when endorsed can be incorporated into programs like the CMS Star Ratings Program, and other federal/state, or commercial programs.
What is the Pharmacy Quality Alliance?
10PQA

© 2016 Inmar, Inc.
• Annual ratings of Medicare plans that are made available on Medicare Plan Finder and CMS website; began in 2008
• Ratings are displayed as 1 to 5 stars
• Stars are calculated for each measure, as well as each domain, summary, and overall (applies to MA-PDs) level
• Part C stars include 32 measures of quality, and Part D stars include 15 measures of quality
• Two-year lag between “year of service” and reporting year for PQA measures in Star Ratings (e.g., 2014 drug claims for 2016 Ratings)
Medicare star ratings
11PQA

© 2016 Inmar, Inc.
• Medicare drug plans receive a summary rating on quality as well as four domain, and individual measure, scores (15 individual measures)
• Five measures are from PQA (2016):
• 2 measures of medication safety or MTM• High risk medications in the elderly• CMR Completion Rate [new for 2016]
• 3 measures of medication adherence • Non-insulin diabetes medications• Cholesterol medication (statins)• Blood pressure (renin-angiotensin system antagonists)
Part D stars
12
Due to the higher weighting of clinically-relevant measures, the PQA measures account for 43% of Part D summary ratings for 2016
PQA

© 2016 Inmar, Inc.
From CMS 2016 Star Ratings Technical Notes
Part D weights
13PQA

© 2016 Inmar, Inc.
• Medication Therapy Management Program Completion Rate for Comprehensive Medication Reviews (CMRs)
• Highlights:• PQA-endorsed measure • Measures the percentage of beneficiaries who met eligibility criteria
for the MTM program and who received a CMR with a written summary in the CMS standardized format.
• 2016 stars are based on 2014 measurement period• This measure is assigned a weight of “1”
*New* star ratings measure for 2016
14PQA

© 2016 Inmar, Inc.
2016 Star Thresholds
2016 National Averages
MAPD: 30.9 % 2.3 starsPDP: 15.4 % 2.3 stars
CMR completion rate
15PQA

© 2016 Inmar, Inc.
Improvement in adherence rates
Average across all contracts for each year
Part DMeasure
MA-PD PDP
2012 2013 2014 2015 2016 2012 2013 2014 2015 2016
PDC -Diabetes 73.0% 73.7% 75 % 77 % 77 % 74.4% 75.8% 77 % 79 % 80 %
PDC –RASA 72.2% 73.9% 76 % 78 % 79 % 74.3% 76.8% 78 % 81 % 82 %
PDC -Cholesterol 68.0% 69.0% 71 % 74 % 75 % 69.1% 71.0% 73 % 77 % 78 %
16PQA

© 2016 Inmar, Inc.
PQA measure synopsis
• Performance continues to improve, on average, across PQA measures for MA-PD and PDP contracts, but the rate of improvement is slowing
• Medication adherence 4/5 star thresholds have been relaxed for MA-PDs but made more stringent for PDPs
• PDPs continue to have better performance than MA-PDs on medication adherence, but worse performance on HRM
• Stars for CMR completion rate are low this year (average: 2.3 stars) with nearly two-thirds of contracts receiving 1 or 2 stars
17PQA

© 2016 Inmar, Inc.
Part D star synopsis
• MA-PD stars rose this year. Average is now 4 stars overall.• Combination of relaxed thresholds for 4/5 stars in Part D along with
actual improvement on triple-weighted measures
• PDP mean stars decreased from 3.7 stars (2015) to 3.4 stars (2016)
• PQA measures improved slightly but thresholds jumped substantially
• 71% of MA-PD enrollees are in contracts with 4 stars or better; 32% of PDP enrollees are in contracts with 4 stars or better
18PQA

© 2016 Inmar, Inc.
High stakes for part D stars
• Enrollment Implications
• Quality Bonus Payments (MA-PD)
• Poor and high performers identified by CMS• Low-performer icon• High-performer icon
• Removal from Medicare for continued poor overall performance (< 3 stars for 3 years in a row)
19PQA

© 2016 Inmar, Inc.
HRM measure to remain in the Stars for 2017 (using 2015 data) and then move to display measure in 2018
Statin Use in Persons with Diabetes will be a display measure for 2017 and 2018 included in Star Ratings in 2019 (2017 data)• CMS has expressed no plans to move these to star ratings:
• Propose reporting Opioid Overutilization measures on display page for 2019 (2017 data)
• Propose reporting Antipsychotic Use in Dementia on display page for 2018 (2016 data)
Just Released: CMS Request for Comments
CMS released Final Call L 2017 Star Ratings
20PQA

© 2016 Inmar, Inc.
• PQA developed and endorsed in 2014
• Based on ACC/AHA guidelines released in 2013
• CMS started reporting rates to Part D plans in 2015
• Denominator: Any person age 40-75 years with two or more prescription fills for any hypoglycemic medication
• Numerator: One fill of any statin medication in the measurement year
Pharmacist Opportunity
Statin use in persons with diabetes (age 40-75 years)
PQA21 21

© 2016 Inmar, Inc.
The Plan Perspective on Goals
Todd SegaManager, Payer Relations
22

© 2016 Inmar, Inc.
Why health plans invest in star ratings improvement
23
PDP Plans• Marketing opportunities• Extended open enrollment
periods• Penalty for consistent poor
performance• PDP plans are not eligible to
receive quality bonus payments
MA-PD Plans• Additional revenue in the form of
quality bonus payments provided to top performing plans
– Revenue used to support initiatives and to keep member premiums low
– Bonus payments necessary to maintain competitive stance in marketplace
• Marketing opportunities
• Extended open enrollment periods
• Penalty for consistent poor performance

© 2016 Inmar, Inc.
• CMS publishes benchmark rates (i.e. average monthly costs to care for a Medicare member)
• MA-PD Plans submit bids to CMS that they can manage their members for a lower cost than the benchmark
• CMS pays a portion of the difference between the benchmark and the bid as a rebate back to the plans
• Plans that score a 4-Star rating or above can receive additional bonus payment
• Critical task is keeping at least a 4-Star overall rating
• Calculation Example• Benchmark is $750• Bid is $700• Plan has 10,000 members and scores a 4-Star rating (provides plans with
5% bonus and 65% rebate of the difference)• Plan receives over $6.5M in rebate/bonus payment
Medicare star ratings: Quality bonus payment overview
24

© 2016 Inmar, Inc.
• Formularies, clinical strategies, network contracts, marketing/promotions, all aligning with Star Ratings measures
• Plans are making significant investments in “Drive to 5”
• Recognizing the importance of engagement strategies with pharmacy networks
• Pay for Performance (P4P) – pharmacies may be eligible for bonus payment based on star performance
• Preferred pharmacy networks based partly on star performance
How are health plans responding?
25

© 2016 Inmar, Inc.
• Inland Empire Health Plan (IEHP)• Launched in October 2013 based on Star measures plus asthma and GDR• Achieved significant improvement in performance and has extended program• Pharmacies receive bonus depending on their performance:
• 3-star attainment = small bonus • 5-star attainment = large bonus
• Healthfirst of NY• Program launched October 2014 based on PDC-adherence measures• Combination of payment for program commitment and for reaching performance
goals as measured by EQuIPP
• Caremark-SilverScript• Ongoing program based on PDC-adherence and other quality measures• Started with combination of payment for gap closures delivered through Mirixa and
bonus on reaching performance goals as measured by EQuIPP• Quality scores may affects DIR adjustment for reimbursement
• Humana• Pilot program launched in late 2015 in Texas and Florida with limited group of chain
and independent pharmacies• Could expand if pilot is successful
Pharmacy pay-for-performance programs
26
© 2016 Inmar, Inc.
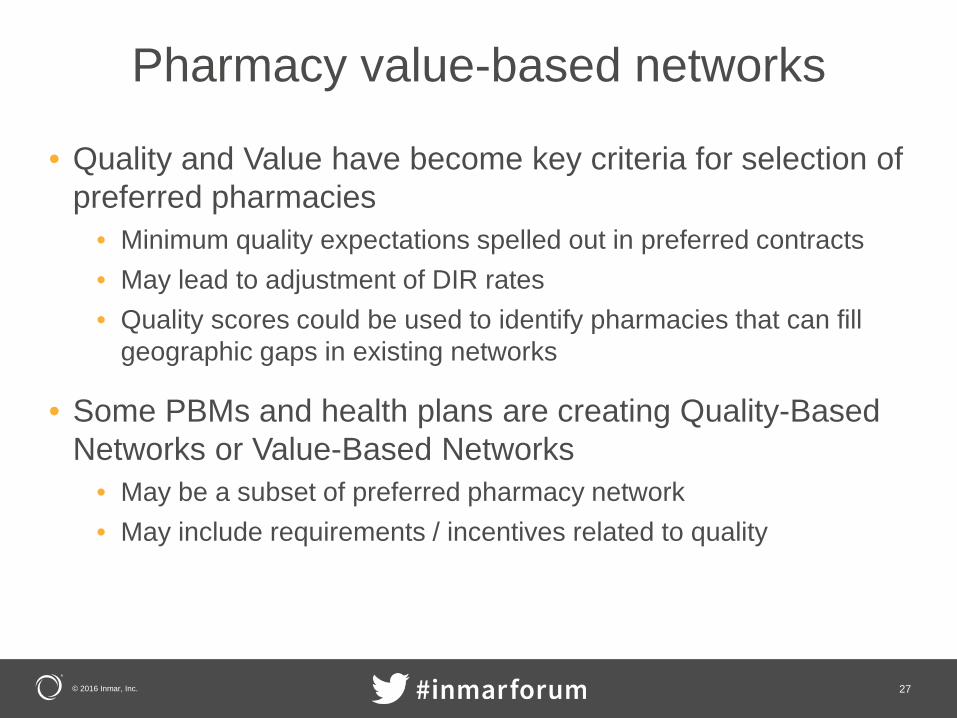
• Quality and Value have become key criteria for selection of preferred pharmacies
• Minimum quality expectations spelled out in preferred contracts• May lead to adjustment of DIR rates• Quality scores could be used to identify pharmacies that can fill
geographic gaps in existing networks
• Some PBMs and health plans are creating Quality-Based Networks or Value-Based Networks
• May be a subset of preferred pharmacy network• May include requirements / incentives related to quality
Pharmacy value-based networks
27

© 2016 Inmar, Inc.
DETAILS OF VALUE-BASED NETWORK WILL DICTATE HOW PHARMACY ORGANIZATIONS RESPOND• Quality metrics to include in network requirements
• Clinical metrics vs. non-clinical metrics
• Measurement period• 6-month rolling vs. annual assessment vs. 12-month rolling
• Evaluation method of the pharmacy network• Method for setting thresholds/goals for the quality metrics
• Pre-specified vs. percentile based goals• Focus on performance vs. improvement• Evaluation at the chain/organization level vs. at the individual store
level
Considerations in developing value-based pharmacy networks
28

© 2016 Inmar, Inc.
• Value-based network arrangements require performance assessments
• Based on performance scores determined by numerators (members/patients meeting the intent of the measure) divided by denominators (members/patients qualifying for the measures)
• Members/patients typically attributed to a single pharmacy per measure for each measurement period
• Standard attribution logic used across all pharmacies in performance programs
• For example, members are attributed to pharmacies where they filled the most Rx’s from an adherence drug class during the measurement period
• NPI-level performance can be rolled/aggregated by chain/PSAO to determine pharmacy organization performance scores
Generating performance scores per measure per pharmacy
29

© 2016 Inmar, Inc.
The Retail Pharmacy Perspective on Operations
Lari HardingVP, Strategy & Growth Healthcare Network
30

© 2016 Inmar, Inc.
Retail pharmacy revenue in fee-for-service
31
RX TYPE
AVG Rx PRICE
$54(30 days)
AVG Rx PRICE:$200-300TRADITIONAL
$600-$3,500SPECIALTY
AVG Rx PRICE:$10-40
+Patient co-pay+Payer Ingredient cost+Payer Dispensing Fee+Service/Data Fees for Specialty-Payer Adjustments-Payer Service Fee=Total Revenue
Generic88%
Branded12%
Dispensing Fees Average = $1.20

© 2016 Inmar, Inc.
Retail pharmacy profitability in fee-for-service
32
Average GROSS
Gross Profit comes from:• The spread between payer ingredient
cost and actual acquisition cost• Dispensing Fees• Service/Data Fees (specialty)• Include rebates
GENERICS 50-60%or ~ $12/Rx
BRANDS 4-8% or ~$12/Rx
Variability based on product life cycle stage
Year(s) Gross Profit
1996 – 2006 26%2007 – 2015 22-24%
Net <2%

© 2016 Inmar, Inc.
• Started in Medicare Part D
• Since overall prescription growth remains below 2%, pharmacies have been willing to accept reduced rates for a preferred or limited network
• Lower adjudicated rates• Or DIR fees per Rx after adjudication• Discounts have averaged ~8%• Larger pharmacy chains have a buying advantage which often gets
passed back to the payers/plans vs. a profit advantage
• Now evolving to Performance-Based Pharmacy Networks
Narrow networks
33

© 2016 Inmar, Inc.
• There are five flavors of value based/quality contracting in 2016
• Pure Incentive• Pay In and Earn Back• DIR Penalty Scale• Modifiers:
• HRMs are Heavily Weighted• Weighted Averages Plus MTM
• The average retail pharmacy has $50,000-$100,000 in reimbursements at risk in 2016 for quality
• Retail Pharmacy must measure themselves and implement solutions to improve quality, as the risk will continue to grow
Quality is changing the pharmacy business model
34

© 2016 Inmar, Inc.
DIR fee methods by carrier
35
PBM DIR Basis Mechanism Notes
CVS Caremark % of Ingredient Cost
DIR Penalty Scale /Weighted Average Plus MTM
• DIR is assessed by trimester based on EQuIPP data and MTM performance.
• Assessed retrospectively from July 2016 through May of 2017.
Catamaran Flat fee per Rx Pay In and Earn Back
• January remittances include DIR transactions.• Can earn back money if certain Quality based thresholds are met.
Express Scripts Sliding scale per Rx DIR Penalty Scale
• DIR is calculated and taken or rebated by lump sum retrospectively, quarter by quarter, based on Generic Dispense Rates.
EnvisionRx Flat fee per Rx Pay In and Earn Back
• January remittances include DIR transactions. • At end of the year, the plan will reconcile GDR and give rebate
back or take additional money depending on performance.
Magellan Sliding scale per Rx Pure Incentive • Amount of DIR per Rx calculated by quarter based on GDR.
• Taken as lump sum.
Prime Therapeutics
Sliding scale per Rx
DIR Penalty Scale /Weighted to High Risk Medications
• DIR amount calculated by performance matrix that includes High Risk Meds, GDR, and other indicators. Depending on scores, the DIR per Rx is assessed by quarter and collected as lump sum.
Optum Sliding scale per Rx
Pay In and Earn Back
• DIR (Contingent Medication Adherence Performance Fee) is taken by claim for the max amount allowed by contract, either on each remittance or a monthly remittance.
• At the end of the year, a refund of the fee, or a portion of it, will be based on RAS antagonist (hypertension therapy) adherence rates per your contracted schedule.
*These observations are in no way indicative of the entire scope of DIR possibilities, and individual contract terms may vary. However, this list should provide information to help you start your internal DIR research and analysis.

© 2016 Inmar, Inc.
Retail pharmacy profitability in fee-for-service with a link to quality
36
Average GROSS
Gross Profit comes from:• The spread between payer ingredient
cost and actual acquisition cost• Dispensing Fees• Service/Data Fees (specialty)• Includes rebates
GENERICS 50-60%or ~ $10.50/Rx
BRANDS 4-8% or ~$10.50/Rx
Variability based on product life cycle stage
Year(s) Gross Profit
1996 – 2006 26%2007 – 2015 22-24%
2016 19-22%Net <1%

© 2016 Inmar, Inc.
• Analyze all paid at U&C vs. industry benchmarks
• Calculating all PQA measures
• Modeling levers• Powering patient
engagement solutions
• Preferred drugs on benchmark reimbursements
• Profitability heat map across network
• 100% matching• BER reporting• Exception
workflow• Brand
benchmarks
• Outliers• MAC
benchmarks
Customersolutions
Contracting & Networking Participation
START
Continuous Improvement
Financial Modeling, Better Contracting, Improved Outcomes
MAINTAINING
• Low gross profit drugs
• PAC
• Aggregate• Sampling
• Low cost leads• Low margin
issues
• Competitive analysis
• High visibility drugs
• Internally measuring PDC
• EQUIPP
Management Tools MAC & GER
managementBrand, specialty
and BERmanagement
Purchasing & preferred drug
selections
Price optimization &
U&CManagement
Successfulvalue based
reimbursement
The evolution of managing pharmacy contracts
37
2000-2010 2016-2017

© 2016 Inmar, Inc.
WHAT SHOULD RETAIL PHARMACIES DO?
38

© 2016 Inmar, Inc.
• Measure themselves and identify opportunities• Internal, EQUIPP and Contract Management Solutions• PSAO contract obligations• Pharmacy level benchmarking within your chain and the industry
overall
• Accurately forecast DIR and account for it as a sales adjustment
• Quantify the financial value of improvement and justify the business case to invest in solutions
• Evaluate solutions, their successes & your investment ability
Action: Determine your status, goals & investment
39

© 2016 Inmar, Inc.
• Identifying the population to apply which tools to• Experiment with solutions. Start low-tech and evolve as your
needs and success grows:• Refill reminders / automated refill solutions – IVR, e-mail, mobile apps,
etc.• Med Sync• MTM in-house or through partners• Proactive phone outreach• Promotional programs / Rx coupons / Medication assistance to help
with the cost of care• Telemedicine appointments or in-person in the pharmacy
• Communication with the plan
Action: Implement the right solutions to the right patients & demonstrate your success to the plans
40

© 2016 Inmar, Inc.
Empowering your pharmacists to be partners with improving quality performance
• Prevent any disconnect between patient-facing staff at the pharmacies and the initiatives to improve quality performance for value-based program plan sponsors
• Consider development of an accountability structure for store-level pharmacists
41

© 2016 Inmar, Inc.
WHAT TO EXPECT IN 2017
42

© 2016 Inmar, Inc.
• Expansion of incorporating quality metrics in contracting
• Preferred / narrow networks will continue
• We will continue to see more accountability from those preferred partners on the medication-related quality measures & selection based on performance
• As plans are continuing to shift payments towards value with physicians and hospitals, they are now evaluating strategies to bring new reimbursement models to pharmacies as well were a pharmacy’s performance will continue to play an increasing role in their reimbursement.
• Addition of other measures, specifically CMR
• HRM measure will now be included as a Star Rating for the 2017 Stars. Will first become a display measure for 2018 which would apply to claims or PDEs in 2016
2017 Trends
43

© 2016 Inmar, Inc.
Discussion
44
How Medication Adherence Outcomes Are Changing the Business Model
Activity Code:
ACPE #0088-9999-16-029-L04-P ~ 0.75 Contact Hour
Please visit our CE webpage at https://cmetracker.net/CAMPBELL/getCertificate.html to complete the
online activity evaluation form and claim CE credit following the program. Credit not claimed within 60 days will be forfeited.
April 12, 2016
Campbell University College of Pharmacy & Health Sciences is accredited by theAccreditation Council for Pharmacy Education as a provider of continuing pharmacyeducation.
Pharmacist: BKBVDA

© 2016 Inmar, Inc.
CLICK THE SURVEY BUTTON FOUND ON THE SESSION PAGE
HOW DID WE DO?