Embed Size (px)
Citation preview

WISE M NEY2016: Issue 527, Week: 16th - 19th May
A Weekly Update from SMC(For private circulation only)
INTERNATIONAL FAMILY DAY15TH MAY
WE MAY NOT HAVE IT ALL TOGETHER,BUT TOGETHER WE HAVE IT ALL.
Bra
nd
sm
c 3
51
Contents
Equity 4-7
Derivatives 8-9
Commodity 10-13
Currency 14
IPO 15
FD Monitor 16
Insurance 17
Mutual Fund 18
SMC RESEARCH TEAMREGISTERED OFFICES:
11 / 6B, Shanti Chamber, Pusa Road, New Delhi 110005.
Tel: 91-11-30111000, Fax: 91-11-25754365
MUMBAI OFFICE:
Dheeraj Sagar, 1st Floor, Opp. Goregaon sports Club, Link Road
Malad (West), Mumbai 400064
Tel: 91-22-67341600, Fax: 91-22-28805606
KOLKATA OFFICE:
18,Rabindra Sarani, Poddar Court, Gate No-4,5th Floor, Kolkata-700001
Tel : 91-33-39847000 Fax No : 91-33-39847004
AHMEDABAD OFFICE :
10/A, 4th Floor, Kalapurnam Building, Near Municipal Market,
C G Road, Ahmedabad-380009, Gujarat
Tel : 91-79-26424801 - 05, 40049801 - 03
CHENNAI OFFICE:
Salzburg Square, Flat No.1, III rd Floor, Door No.107, Harrington Road,
Chetpet, Chennai - 600031.
Tel: 044-39109100, Fax -044- 39109111
SECUNDERABAD OFFICE:
206, 3rd Floor, above CMR Exclusive, Bhuvana Towers, S.D.Road,
Secunderabad - 500003
Tel: 91-40-30780298/99, 39109536
DUBAI OFFICE:
312, Belshalat Building, Al Karama, Dubai, P.O. Box 117210, U.A.E.
Tel: 97143963120, Mobile : 971502612483
Fax : 9714 3963122
Email ID : [email protected]
Printed and Published on behalf of
Mr. Saurabh Jain @ Publication Address
11/6B, Shanti Chamber, Pusa Road, New Delhi-110005
Website: www.smcindiaonline.com
Investor Grievance : [email protected]
Printed at: S&S MARKETING
102, Mahavirji Complex LSC-3, Rishabh Vihar, New Delhi - 110092 (India)
Ph.: +91-11- 43035012, 43035014, Email: [email protected]
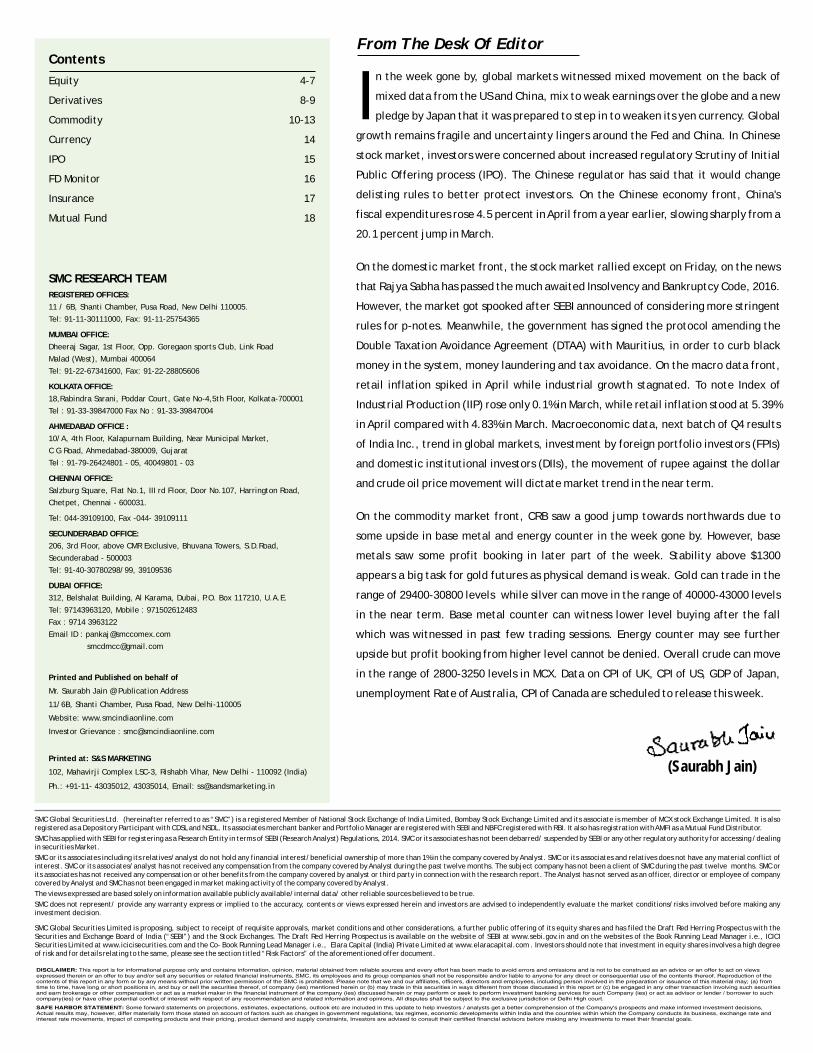
n the week gone by, global markets witnessed mixed movement on the back of
mixed data from the US and China, mix to weak earnings over the globe and a new Ipledge by Japan that it was prepared to step in to weaken its yen currency. Global
growth remains fragile and uncertainty lingers around the Fed and China. In Chinese
stock market, investors were concerned about increased regulatory Scrutiny of Initial
Public Offering process (IPO). The Chinese regulator has said that it would change
delisting rules to better protect investors. On the Chinese economy front, China's
fiscal expenditures rose 4.5 percent in April from a year earlier, slowing sharply from a
20.1 percent jump in March.
On the domestic market front, the stock market rallied except on Friday, on the news
that Rajya Sabha has passed the much awaited Insolvency and Bankruptcy Code, 2016.
However, the market got spooked after SEBI announced of considering more stringent
rules for p-notes. Meanwhile, the government has signed the protocol amending the
Double Taxation Avoidance Agreement (DTAA) with Mauritius, in order to curb black
money in the system, money laundering and tax avoidance. On the macro data front,
retail inflation spiked in April while industrial growth stagnated. To note Index of
Industrial Production (IIP) rose only 0.1% in March, while retail inflation stood at 5.39%
in April compared with 4.83% in March. Macroeconomic data, next batch of Q4 results
of India Inc., trend in global markets, investment by foreign portfolio investors (FPIs)
and domestic institutional investors (DIIs), the movement of rupee against the dollar
and crude oil price movement will dictate market trend in the near term.
On the commodity market front, CRB saw a good jump towards northwards due to
some upside in base metal and energy counter in the week gone by. However, base
metals saw some profit booking in later part of the week. Stability above $1300
appears a big task for gold futures as physical demand is weak. Gold can trade in the
range of 29400-30800 levels while silver can move in the range of 40000-43000 levels
in the near term. Base metal counter can witness lower level buying after the fall
which was witnessed in past few trading sessions. Energy counter may see further
upside but profit booking from higher level cannot be denied. Overall crude can move
in the range of 2800-3250 levels in MCX. Data on CPI of UK, CPI of US, GDP of Japan,
unemployment Rate of Australia, CPI of Canada are scheduled to release this week.
From The Desk Of Editor
(Saurabh Jain)
SMC Global Securities Limited is proposing, subject to receipt of requisite approvals, market conditions and other considerations, a further public offering of its equity shares and has filed the Draft Red Herring Prospectus with the Securities and Exchange Board of India (“SEBI”) and the Stock Exchanges. The Draft Red Herring Prospectus is available on the website of SEBI at www.sebi.gov.in and on the websites of the Book Running Lead Manager i.e., ICICI Securities Limited at www.icicisecurities.com and the Co- Book Running Lead Manager i.e., Elara Capital (India) Private Limited at www.elaracapital.com . Investors should note that investment in equity shares involves a high degree of risk and for details relating to the same, please see the section titled “Risk Factors” of the aforementioned offer document.
SMC Global Securities Ltd. (hereinafter referred to as “SMC”) is a registered Member of National Stock Exchange of India Limited, Bombay Stock Exchange Limited and its associate is member of MCX stock Exchange Limited. It is also registered as a Depository Participant with CDSL and NSDL. Its associates merchant banker and Portfolio Manager are registered with SEBI and NBFC registered with RBI. It also has registration with AMFI as a Mutual Fund Distributor.
SMC has applied with SEBI for registering as a Research Entity in terms of SEBI (Research Analyst) Regulations, 2014. SMC or its associates has not been debarred/ suspended by SEBI or any other regulatory authority for accessing /dealing in securities Market.
SMC or its associates including its relatives/analyst do not hold any financial interest/beneficial ownership of more than 1% in the company covered by Analyst. SMC or its associates and relatives does not have any material conflict of interest. SMC or its associates/analyst has not received any compensation from the company covered by Analyst during the past twelve months. The subject company has not been a client of SMC during the past twelve months. SMC or its associates has not received any compensation or other benefits from the company covered by analyst or third party in connection with the research report. The Analyst has not served as an officer, director or employee of company covered by Analyst and SMC has not been engaged in market making activity of the company covered by Analyst.
The views expressed are based solely on information available publicly available/internal data/ other reliable sources believed to be true.
SMC does not represent/ provide any warranty express or implied to the accuracy, contents or views expressed herein and investors are advised to independently evaluate the market conditions/risks involved before making any investment decision.
NEWS
DOMESTIC NEWS
Economy
• India's Retail inflation, as measured by the consumer price index (CPI) for April accelerated to 5.39% as compared to 4.83% in March, while the industrial output, measured by index of industrial production (IIP) for March, decreased sharply to 0.1% versus 2% in February. Food inflation picked up to 6.32% in April from 5.21% in the previous month.
• According to data released by the Society of Indian Automobile Manufacturers (SIAM), Domestic passenger car sales increased 1.87% to 1,62,566 units in April as against 1,59,588 units in the year-ago period. Last month, motorcycle sales rose by 16.24% to 10,24,926 units from 8,81,743 units a year earlier. Total two-wheeler sales in April rose 21.23% to 15,60,339 units. Sales of commercial vehicles rose 17.36% to 53,835 units in April. Vehicle sales across categories registered an increase of 20.04% to 19,00,879 units from 15,83,582 units in April last year.
Pharmaceutical
• Sun Pharmaceutical Industries has launched an innovative mobile app to connect doctors with asthma patients. The app has been developed for enabling doctors to track treatment progress of their patients and increase compliance to medication for better management of asthma.
Metal
• JSW Steel is in the fray to acquire Tata Steel's loss-making business in the UK. Tata Steel had said it has taken forward seven EoIs submitted for its UK business to the next stage of the sale process.
• National Aluminium Company (Nalco) has signed an memorandum of understanding (MoU) with Bhabha Atomic Research Centre (BARC), Mumbai, for Research and Development (R&D) in fields of mutual interest.
FMCG
• ITC Ltd said it is progressively resuming production of cigarettes. Earlier, following Supreme Court's interim order, asking tobacco companies to comply with the Union health ministry's directive to print tobacco packs with 85% health warnings, cigarette major ITC had shut its factories.
Automobile
• Mahindra & Mahindra launched a more powerful variant of its compact SUV TUV300 priced at Rs 8.87 lakh (ex-showroom, Mumbai). The new variant, which comes with all new mHAWK 100 engine, delivers a power of 100 BHP and will be available in the top-end variants of T8 and T8 AMT trims of the TUV300.
• Hero MotoCorp has ventured into motorcycle racing by partnering German off-road racing specialist Speedbrain.
Oil Exploration
• Cairn India Ltd has extended by two years the repayment of a controversial $1.25 billion loan it had extended to its parent group firm. The extension follows delay in merger of Cairn India with its parent Vedanta Ltd that would have led to the $1.25 billion loan being written off.
Cables
• Sterlite Technologies has won the Jaipur Smart City Phase - II Project. Jaipur, the Pink City, was selected under the Smart City Mission of the Ministry of Urban Development launched in 2015. This is Sterlite's second smart city project win.
INTERNATIONAL NEWS
• US initial jobless claims climbed to 294,000, an increase of 20,000 from the previous week's unrevised level of 274,000. Jobless claims moved higher for the third straight week. The continued increase came as a surprise to economists, who had expected jobless claims to edge down to 270,000.
• US wholesale inventories inched up by 0.1 percent in March after falling by a revised 0.6 percent in February. Economists had expected inventories to rise by about 0.3 percent compared to the 0.5 percent drop originally reported for the previous month.
• Import prices in the U.S. increased for the second straight month in April, according to a report released by the Labor Department, although the pace of growth came in below economist estimates. The Labor Department said import prices rose by 0.3 percent in April, matching the upwardly revised increase in March. Economists had expected prices to climb by 0.6 percent.
• Eurozone industrial production declined unexpectedly in March as all sectors except energy contracted from February. Industrial output dropped 0.8 percent month-on-month, slower than the revised 1.2 percent decline seen in February. Economists had forecast output to remain flat in March. Eurostat initially estimated a 0.8 percent fall for February.
• The M2 money stock in Japan was up 3.3 percent on year in April, the Bank of Japan said on Friday - coming in at 934.8 trillion yen. That exceeded expectations for 3.2 percent, which would have been unchanged from the March reading.
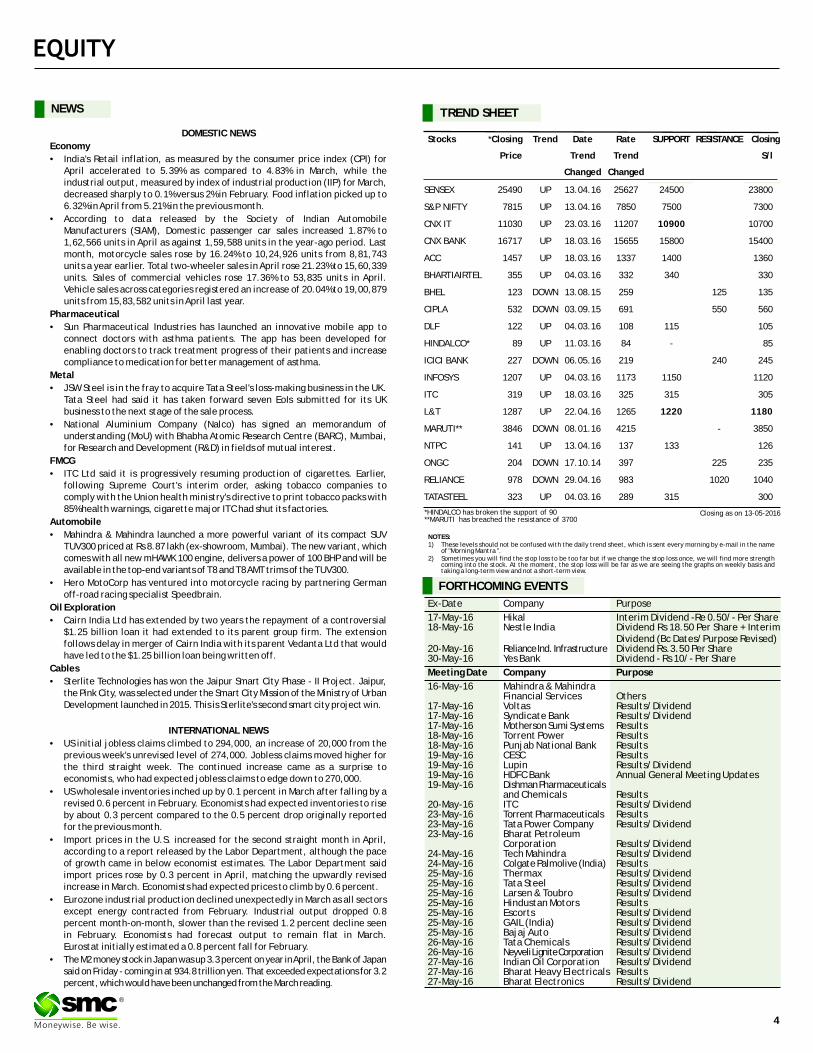
Ex-Date Company Purpose
17-May-16 Hikal Interim Dividend -Re 0.50/- Per Share18-May-16 Nestle India Dividend Rs 18.50 Per Share + Interim
Dividend (Bc Dates/Purpose Revised)20-May-16 Reliance Ind. Infrastructure Dividend Rs.3.50 Per Share30-May-16 Yes Bank Dividend - Rs 10/- Per Share
Meeting Date Company Purpose
16-May-16 Mahindra & Mahindra Financial Services Others
17-May-16 Voltas Results/Dividend17-May-16 Syndicate Bank Results/Dividend17-May-16 Motherson Sumi Systems Results18-May-16 Torrent Power Results18-May-16 Punjab National Bank Results19-May-16 CESC Results19-May-16 Lupin Results/Dividend19-May-16 HDFC Bank Annual General Meeting Updates19-May-16 Dishman Pharmaceuticals
and Chemicals Results20-May-16 ITC Results/Dividend23-May-16 Torrent Pharmaceuticals Results23-May-16 Tata Power Company Results/Dividend23-May-16 Bharat Petroleum
Corporation Results/Dividend24-May-16 Tech Mahindra Results/Dividend24-May-16 Colgate Palmolive (India) Results25-May-16 Thermax Results/Dividend25-May-16 Tata Steel Results/Dividend25-May-16 Larsen & Toubro Results/Dividend25-May-16 Hindustan Motors Results25-May-16 Escorts Results/Dividend25-May-16 GAIL (India) Results/Dividend25-May-16 Bajaj Auto Results/Dividend26-May-16 Tata Chemicals Results/Dividend26-May-16 Neyveli Lignite Corporation Results/Dividend27-May-16 Indian Oil Corporation Results/Dividend27-May-16 Bharat Heavy Electricals Results27-May-16 Bharat Electronics Results/Dividend
FORTHCOMING EVENTS
NOTES:1) These levels should not be confused with the daily trend sheet, which is sent every morning by e-mail in the name
of "Morning Mantra ".2) Sometimes you will find the stop loss to be too far but if we change the stop loss once, we will find more strength
coming into the stock. At the moment, the stop loss will be far as we are seeing the graphs on weekly basis and taking a long-term view and not a short-term view.
TREND SHEET
Stocks *Closing Trend Date Rate SUPPORT RESISTANCE Closing
Price Trend Trend
Changed Changed
SENSEX 25490 UP 13.04.16 25627 24500 23800
S&P NIFTY 7815 UP 13.04.16 7850 7500 7300
CNX IT 11030 UP 23.03.16 11207 10900 10700
CNX BANK 16717 UP 18.03.16 15655 15800 15400
ACC 1457 UP 18.03.16 1337 1400 1360
BHARTIAIRTEL 355 UP 04.03.16 332 340 330
BHEL 123 DOWN 13.08.15 259 125 135
CIPLA 532 DOWN 03.09.15 691 550 560
DLF 122 UP 04.03.16 108 115 105
HINDALCO* 89 UP 11.03.16 84 - 85
ICICI BANK 227 DOWN 06.05.16 219 240 245
INFOSYS 1207 UP 04.03.16 1173 1150 1120
ITC 319 UP 18.03.16 325 315 305
L&T 1287 UP 22.04.16 1265 1220 1180
MARUTI** 3846 DOWN 08.01.16 4215 - 3850
NTPC 141 UP 13.04.16 137 133 126
ONGC 204 DOWN 17.10.14 397 225 235
RELIANCE 978 DOWN 29.04.16 983 1020 1040
TATASTEEL 323 UP 04.03.16 289 315 300
S/l
4
®
Closing as on 13-05-2016*HINDALCO has broken the support of 90**MARUTI has breached the resistance of 3700
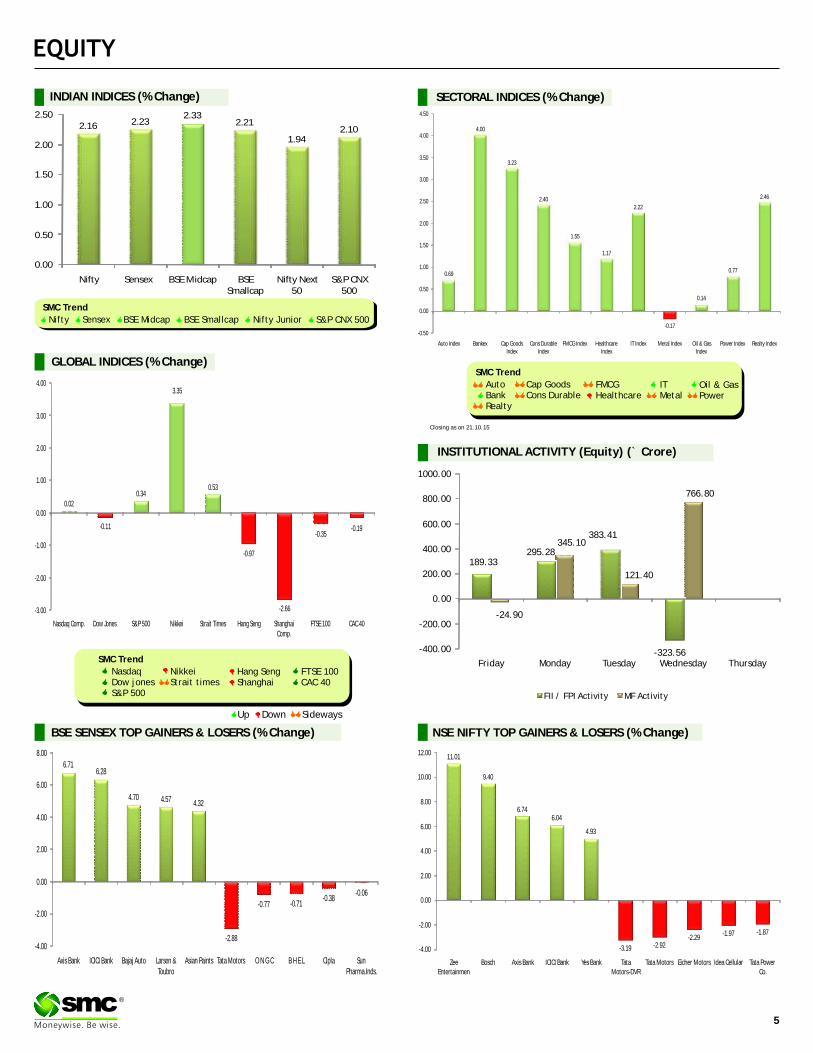
BSE SENSEX GAINERS & LOSERS TOP (% Change) NSE NIFTY GAINERS TOP & LOSERS (% Change)
SECTORAL INDICES (% Change)
SMC Trend
FMCGHealthcare
Auto BankRealty
Cap GoodsCons Durable
Oil & GasPower
ITMetal
Down SidewaysUp
GLOBAL INDICES (% Change)
INDIAN INDICES (% Change)
5
®
SMC Trend
Nifty Sensex BSE Midcap BSE Smallcap Nifty Junior S&P CNX 500
SMC Trend
FTSE 100CAC 40
NasdaqDow jonesS&P 500
NikkeiStrait times
Hang SengShanghai
189.33295.28
383.41
-323.56
-24.90
345.10
121.40
766.80
-400.00
-200.00
0.00
200.00
400.00
600.00
800.00
1000.00
Friday Monday Tuesday Wednesday Thursday
FII / FPI Activity MF Activity
11.01
9.40
6.746.04
4.93
-3.19 -2.92-2.29
-1.97 -1.87
-4.00
-2.00
0.00
2.00
4.00
6.00
8.00
10.00
12.00
Zee Entertainmen
Bosch Axis Bank ICICI Bank Yes Bank Tata Motors-DVR
Tata Motors Eicher Motors Idea Cellular Tata Power Co.
6.716.28
4.70 4.57 4.32
-2.88
-0.77 -0.71-0.38
-0.06
-4.00
-2.00
0.00
2.00
4.00
6.00
8.00
Axis Bank ICICI Bank Bajaj Auto Larsen & Toubro
Asian Paints Tata Motors O N G C B H E L Cipla Sun Pharma.Inds.
2.16 2.232.33
2.21
1.942.10
0.00
0.50
1.00
1.50
2.00
2.50
Nifty Sensex BSE Midcap BSE Smallcap
Nifty Next 50
S&P CNX 500
0.69
4.00
3.23
2.40
1.55
1.17
2.22
-0.17
0.14
0.77
2.46
-0.50
0.00
0.50
1.00
1.50
2.00
2.50
3.00
3.50
4.00
4.50
Auto Index Bankex Cap Goods Index
Cons Durable Index
FMCG Index Healthcare Index
IT Index Metal Index Oil & Gas Index
Power Index Realty Index
-0.11
0.020.34
3.35
0.53
-0.97
-2.66
-0.35-0.19
-3.00
-2.00
-1.00
0.00
1.00
2.00
3.00
4.00
Nasdaq Comp. Dow Jones S&P 500 Nikkei Strait Times Hang Seng Shanghai Comp.
FTSE 100 CAC 40
INSTITUTIONAL ACTIVITY (Equity) (` Crore)
Closing as on 21.10.15
Beat the street - Fundamental Analysis
Above calls are recommended with a time horizon of 8 to 10 months. Source: Company Website Reuters Capitaline
6
®
GIC HOUSING FINANCE LIMITED (GICHFL) CMP: 259.9 Upside: 33%Target Price: 346.00
Investment Rationale Insurance” which covers borrowers for Personal �The primary business of GIC Housing Finance Accident Insurance and Mortgaged Property
Limited (GICHFL) is granting housing loans to Insurance and also tied up with 'Kotak Mahindra individuals and to persons/entities engaged in Old Mutual Life Insurance Ltd' for getting construction of houses/flats for residential insurance cover on the life of the borrower to the purposes. It has presence in 53 branches across extent of the "Outstanding Home Loan".the country for business. It has tie-ups with Valuationbuilders to provide finance to individual The inherent nature of asset quality and the targeted borrowers. It also has tie-ups with corporate for segment (first time buyers) coupled with thrust on various housing finance needs. recoveries has helped GICHF to witness improvement
�A small market cap company but fast growing over the past few quarters. Quarter4 FY16 results housing finance entity, it has posted positive reflected the positive outcome of efforts towards Q4FY16 numbers. Both Year-on-Year (YoY) and growth visible over the past one-year. Profitability Quarter-on-Quarter (QoQ) net profit has too has improved with PAT growth at 35% y-o-y for witnessed growth in double digits. FY16. GICHF is at inflection point and drawing
�Q4FY16 results reflected the positive outcome of parallels with peer companies, thus, it is expected efforts towards growth visible over the past three that the stock will see a price target of ̀ 346 in 8 to 10 months. Profitability too has improved with PAT months time frame on a target P/BV of 2.30x and growth at 34.5% for Q4FY16. Its income rose to FY17 (BVPS) book value per share of ̀ 150.47.`233.10 crore during the January to March quarter of the current fiscal year (FY16), around 18% growth as compared to March 2016 over March 2015, It had made provision for contingencies of `3.81 crore for the March quarter, as against ̀ 3.66 crore during the same quarter a year ago.
�The management of the company has guided for above 20% growth for next coming years and government initiatives like “Housing for All”; “Smart Cities project” and “Real estate bill” would give further growth to company, which would fill the valuation gap between its peers.
�Company has tie up with the New India Assurance Company Limited for “Special Contingency
Face Value (`) 10.00
52 Week High/Low 282.00/161.00
M.Cap (`Cr.) 1399.56
EPS (`) 23.12
P/E Ratio (times) 11.24
P/B Ratio (times) 1.91
Dividend Yield (%) 1.92
Stock Exchange BSE
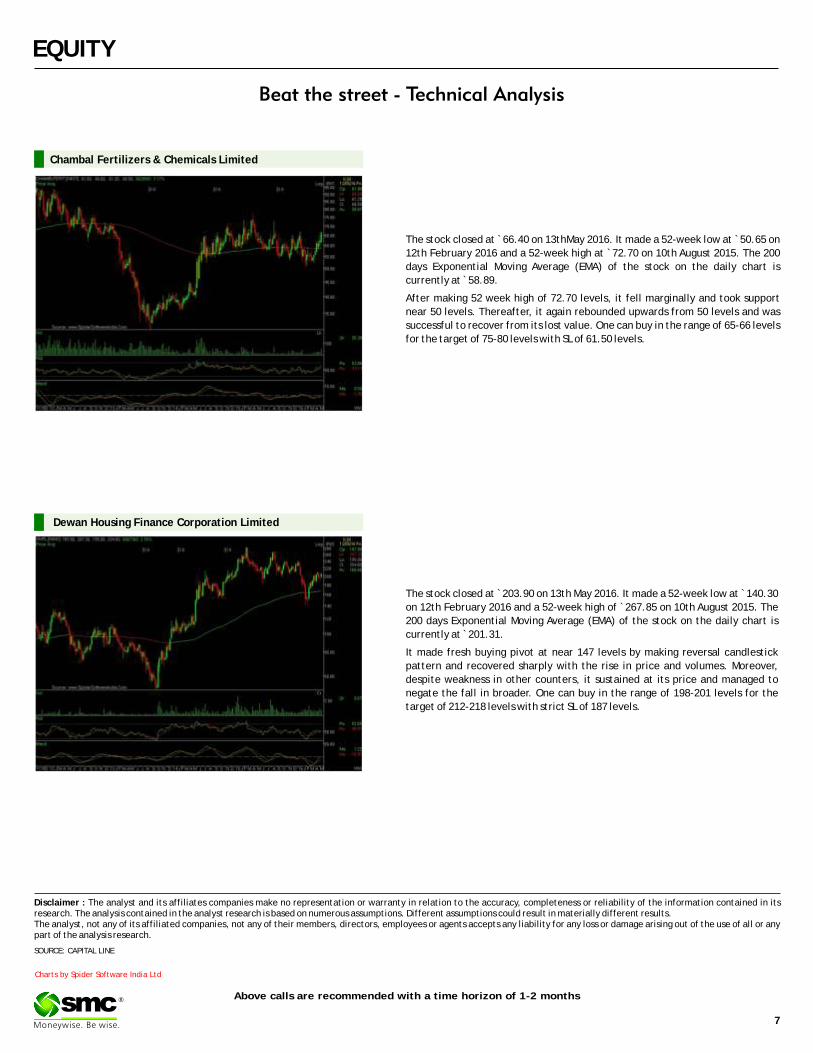
% OF SHARE HOLDING
P/B Chart
` in cr
Actual EstimateFY Mar-15 FY Mar-16 FY Mar-17
Revenue 732.70 876.40 1,011.40
EBIT 153.70 191.10 434.20
Pre-Tax Profit 153.70 191.10 204.00
Net Income 103.00 124.50 138.20
EPS 19.12 23.12 25.63
BVPS 122.63 135.89 150.47
ROE 16.20 15.98 17.70
VALUE PARAMETERS
Investment Rationale International operations majorly contribute to the revenue.•Welspun India Limited (WIL) is the leading home
fashions supplier in the USA and amongst the top 3 •In the recent past, the company unveiled its new global manufacturers of bed and bath linen. With a spinning facility at Anjar in Gujarat, which is distribution network in more than 50 countries, it is India's largest spinning facility under one roof. the largest exporter of home fashion products. With The new facility will be instrumental in doubling the State-of-the-art manufacturing facilities at its spinning capacity to over three lakh spindles, Anjar and Vapi (Gujarat). thereby fulfilling nearly 70 per cent of the
company's internal yarn requirements. It will also •The company has ambitious plans to raise its reduce WIL's dependency on external sourcing. revenue to $5 billion by 2020, with its flagship
textile business, expected to contribute half of its Valuationincome. The Company has a strong emphasis on innovation
•For FY17, the capital expenditure planned is `8 which is reflected in the number of patents and billion (`800 Cr). This includes the remaining part trademarks, which it holds and has applied for. More of the modernisation project and capacity than 30% of the total revenues of WIL comes from the enhancement in towels, sheets and rugs & innovative products developed by the company, thus carpets. By the end of the year, annual capacity is it is expected that the stock will see a price target of expected to reach 72,000 MT in Towels, 90 million `128 in 8 to 10 months time frame on a target P/E of metres in Bed Linen and 10 million sq metres in 16x and FY17 (E) earnings of ̀ 7.99.Rugs & Carpets.
•The capital expenditure during the quarter was `4.8 billion (`480 Cr.), taking the total to `11.1 billion (`1110 Cr.) during the year March 2015. Q4 capex involved capacity enhancement in towels and modernisation of the Vapi plant. The total annual capacity post expansion stands at 60,000 MT for Towels, 72 million metres in Bed Linen and 8 million sq metres in Rugs & Carpets.
•The Textiles business of the company has been growing at a CAGR of 26.2% since the inception of the Anjar Facility. Sustained growth indicates the potential of Home Textile in the world and the
P/E Chart
WELSPUN INDIA LIMITED CMP: 98.65 Upside: 30%Target Price: 128.00
Face Value (`) 1.00
52 Week High/Low 111.00/49.50
M.Cap (`Cr.) 9911.61
EPS (`) 7.00
P/E Ratio (times) 14.10
P/B Ratio (times) 4.99
Dividend Yield (%) 1.32
Stock Exchange BSE
` in cr
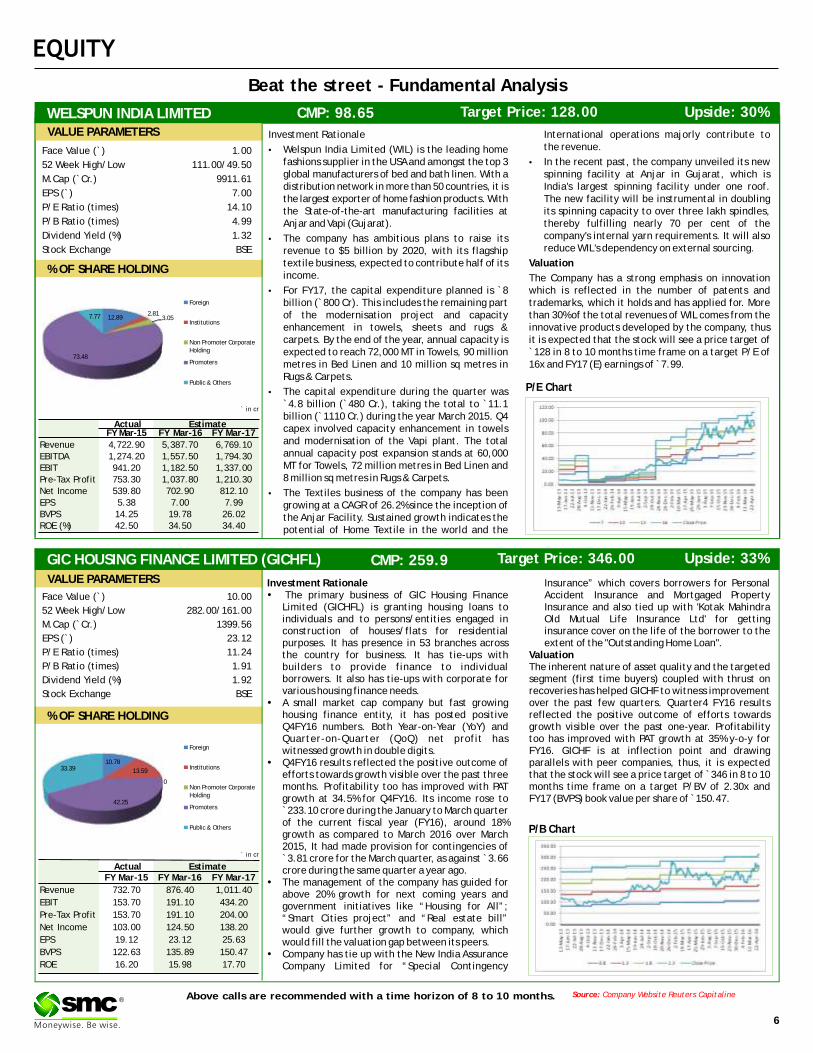
% OF SHARE HOLDING
VALUE PARAMETERS
Actual EstimateFY Mar-15 FY Mar-16 FY Mar-17
Revenue 4,722.90 5,387.70 6,769.10EBITDA 1,274.20 1,557.50 1,794.30EBIT 941.20 1,182.50 1,337.00Pre-Tax Profit 753.30 1,037.80 1,210.30Net Income 539.80 702.90 812.10EPS 5.38 7.00 7.99BVPS 14.25 19.78 26.02ROE (%) 42.50 34.50 34.40
12.892.81
3.05
73.48
7.77
Foreign
Institutions
Non Promoter Corporate Holding
Promoters
Public & Others
10.78
13.59
0
42.25
33.39
Foreign
Institutions
Non Promoter Corporate Holding
Promoters
Public & Others
Charts by Spider Software India Ltd
7
EQUITY
Above calls are recommended with a time horizon of 1-2 months
Disclaimer : research. The analysis contained in the analyst research is based on numerous assumptions. Different assumptions could result in materially different results.The analyst, not any of its affiliated companies, not any of their members, directors, employees or agents accepts any liability for any loss or damage arising out of the use of all or any part of the analysis research.
The analyst and its affiliates companies make no representation or warranty in relation to the accuracy, completeness or reliability of the information contained in its
SOURCE: CAPITAL LINE
®
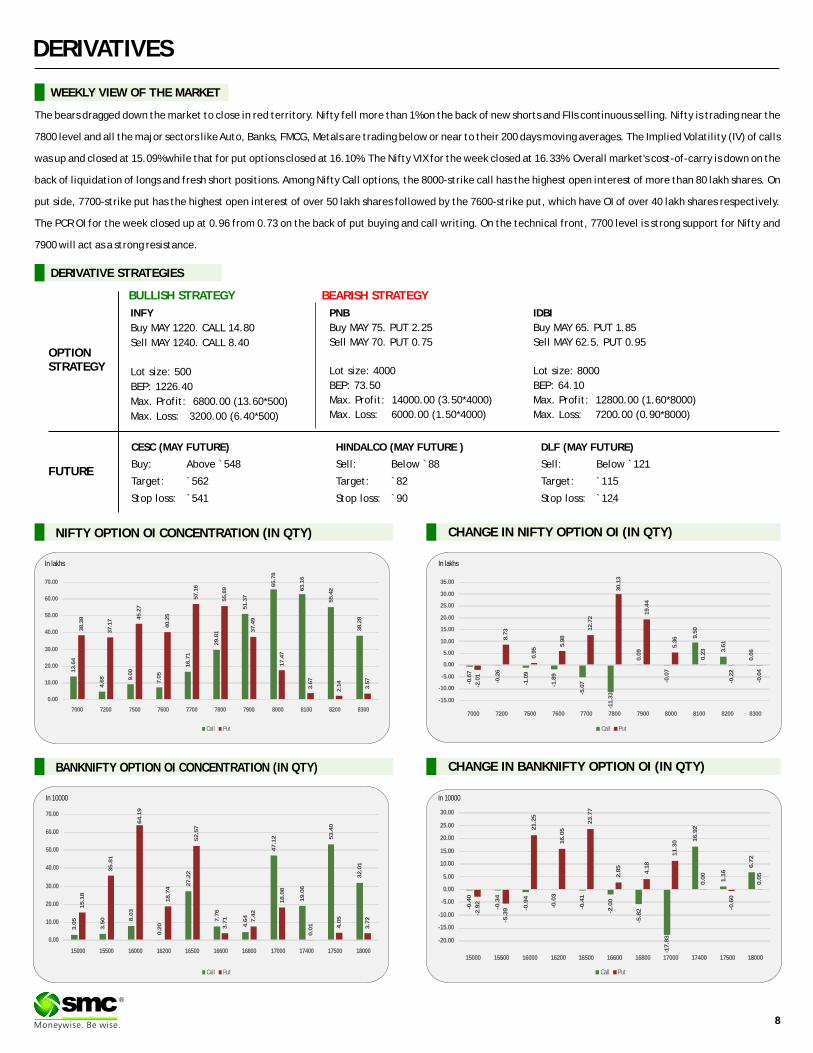
The stock closed at ̀ 66.40 on 13thMay 2016. It made a 52-week low at ̀ 50.65 on
12th February 2016 and a 52-week high at `72.70 on 10th August 2015. The 200
days Exponential Moving Average (EMA) of the stock on the daily chart is
currently at ̀ 58.89.
After making 52 week high of 72.70 levels, it fell marginally and took support
near 50 levels. Thereafter, it again rebounded upwards from 50 levels and was
successful to recover from its lost value. One can buy in the range of 65-66 levels
for the target of 75-80 levels with SL of 61.50 levels.
Chambal Fertilizers & Chemicals Limited
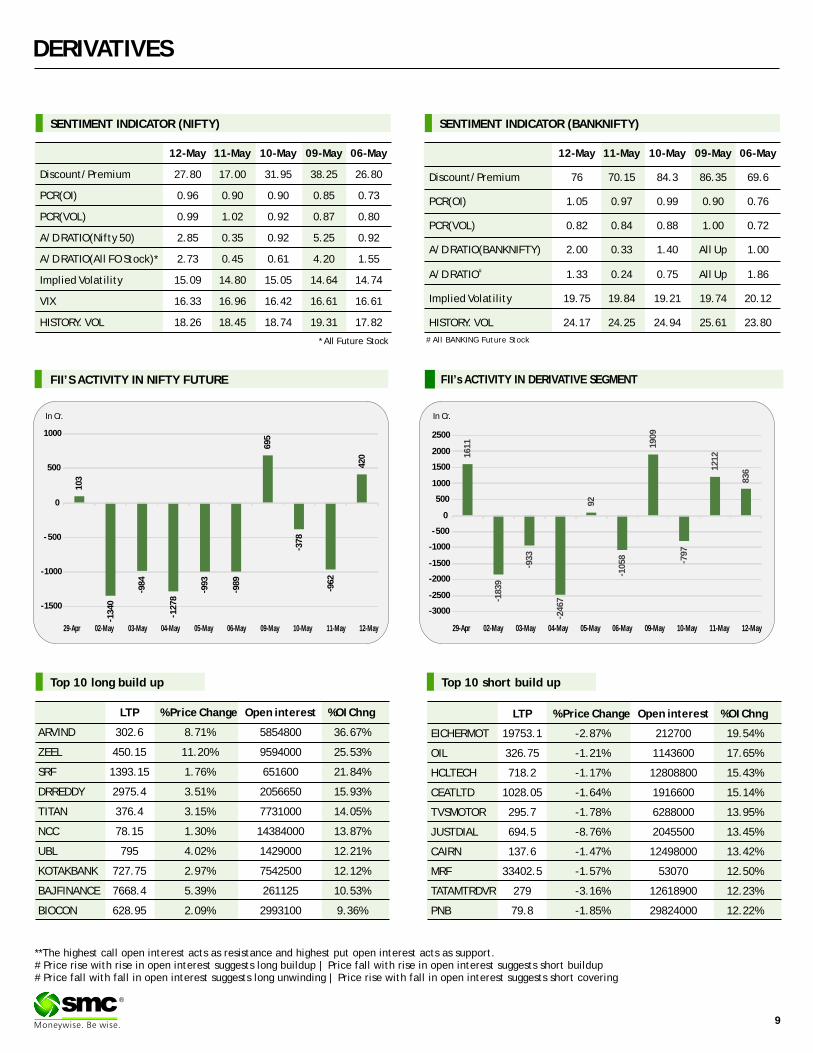
The stock closed at ̀ 203.90 on 13th May 2016. It made a 52-week low at ̀ 140.30
on 12th February 2016 and a 52-week high of ̀ 267.85 on 10th August 2015. The
200 days Exponential Moving Average (EMA) of the stock on the daily chart is
currently at ̀ 201.31.
It made fresh buying pivot at near 147 levels by making reversal candlestick
pattern and recovered sharply with the rise in price and volumes. Moreover,
despite weakness in other counters, it sustained at its price and managed to
negate the fall in broader. One can buy in the range of 198-201 levels for the
target of 212-218 levels with strict SL of 187 levels.
Dewan Housing Finance Corporation Limited
DERIVATIVES
CHANGE IN NIFTY OPTION OI (IN QTY)
WEEKLY VIEW OF THE MARKET
NIFTY OPTION OI CONCENTRATION (IN QTY)
CHANGE IN BANKNIFTY OPTION OI (IN QTY)BANKNIFTY OPTION OI CONCENTRATION (IN QTY)
®
The bears dragged down the market to close in red territory. Nifty fell more than 1% on the back of new shorts and FIIs continuous selling. Nifty is trading near the
7800 level and all the major sectors like Auto, Banks, FMCG, Metals are trading below or near to their 200 days moving averages. The Implied Volatility (IV) of calls
was up and closed at 15.09% while that for put options closed at 16.10%. The Nifty VIX for the week closed at 16.33%. Overall market's cost-of-carry is down on the
back of liquidation of longs and fresh short positions. Among Nifty Call options, the 8000-strike call has the highest open interest of more than 80 lakh shares. On
put side, 7700-strike put has the highest open interest of over 50 lakh shares followed by the 7600-strike put, which have OI of over 40 lakh shares respectively.
The PCR OI for the week closed up at 0.96 from 0.73 on the back of put buying and call writing. On the technical front, 7700 level is strong support for Nifty and
7900 will act as a strong resistance.
In lakhs
In 10000 In 10000
CESC (MAY FUTURE)
Buy: Above `548
Target: `562
Stop loss: `541
IDBI
Buy MAY 65. PUT 1.85
Sell MAY 62.5. PUT 0.95
Lot size: 8000
BEP: 64.10
Max. Profit: 12800.00 (1.60*8000)
Max. Loss: 7200.00 (0.90*8000)
OPTIONSTRATEGY
FUTURE
INFY
Buy MAY 1220. CALL 14.80
Sell MAY 1240. CALL 8.40
Lot size: 500
BEP: 1226.40
Max. Profit: 6800.00 (13.60*500)
Max. Loss: 3200.00 (6.40*500)
PNB
Buy MAY 75. PUT 2.25
Sell MAY 70. PUT 0.75
Lot size: 4000
BEP: 73.50
Max. Profit: 14000.00 (3.50*4000)
Max. Loss: 6000.00 (1.50*4000)
DERIVATIVE STRATEGIES
HINDALCO (MAY FUTURE )
Sell: Below `88
Target: `82
Stop loss: `90
DLF (MAY FUTURE)
Sell: Below `121
Target: `115
Stop loss: `124
BULLISH STRATEGY BEARISH STRATEGY
Call Put
13
.64
4.6
8 9.0
0
7.0
5
16
.71
29
.81
51
.37
65
.78
63
.16
55
.42
38
.28
38
.38
37
.17 4
5.2
7
40
.25
57
.16
55
.89
37
.49
17
.47
3.6
7
2.1
4
3.5
7
0.00
10.00
20.00
30.00
40.00
50.00
60.00
70.00
7000 7200 7500 7600 7700 7800 7900 8000 8100 8200 8300
Call Put
-0.6
7
-0.2
6
-1.0
9
-1.8
9
-5.0
7
-11
.33
0.0
9
-0.0
7
9.5
0
3.6
1
0.0
6
-2.0
1
8.7
3
0.9
5
5.9
8
12
.72
30
.13
19
.44
5.3
6
0.2
3
-0.2
2
-0.0
4
-15.00
-10.00
-5.00
0.00
5.00
10.00
15.00
20.00
25.00
30.00
35.00
7000 7200 7500 7600 7700 7800 7900 8000 8100 8200 8300
Call Put
3.0
5
3.5
0 8.0
3
0.2
0
27
.22
7.7
6
4.6
4
47
.12
19
.06
53
.40
32
.01
15
.18
35
.81
64
.19
18
.74
52
.57
3.7
1 7.4
2
18
.08
0.0
1 4.0
5
3.7
2
0.00
10.00
20.00
30.00
40.00
50.00
60.00
70.00
15000 15500 16000 16200 16500 16600 16800 17000 17400 17500 18000
Call Put
-0.4
0
-0.3
4
-0.9
4
-0.0
3
-0.4
1
-2.0
0
-5.8
2
-17
.83
16
.92
1.1
6
6.7
2
-2.9
2
-5.3
9
21
.25
16
.05
23
.77
2.8
5
4.1
8
11
.30
0.0
0
-0.6
0
0.0
5
-20.00
-15.00
-10.00
-5.00
0.00
5.00
10.00
15.00
20.00
25.00
30.00
15000 15500 16000 16200 16500 16600 16800 17000 17400 17500 18000
8
In lakhs
9
DERIVATIVES
®
FII’s ACTIVITY IN DERIVATIVE SEGMENT
SENTIMENT INDICATOR (NIFTY)
12-May 11-May 10-May 09-May 06-May
Discount/Premium 27.80 17.00 31.95 38.25 26.80
PCR(OI) 0.96 0.90 0.90 0.85 0.73
PCR(VOL) 0.99 1.02 0.92 0.87 0.80
A/D RATIO(Nifty 50) 2.85 0.35 0.92 5.25 0.92
A/D RATIO(All FO Stock)* 2.73 0.45 0.61 4.20 1.55
Implied Volatility 15.09 14.80 15.05 14.64 14.74
VIX 16.33 16.96 16.42 16.61 16.61
HISTORY. VOL 18.26 18.45 18.74 19.31 17.82
*All Future Stock
SENTIMENT INDICATOR (BANKNIFTY)
12-May 11-May 10-May 09-May 06-May
Discount/Premium 76 70.15 84.3 86.35 69.6
PCR(OI) 1.05 0.97 0.99 0.90 0.76
PCR(VOL) 0.82 0.84 0.88 1.00 0.72
A/D RATIO(BANKNIFTY) 2.00 0.33 1.40 All Up 1.00
#A/D RATIO 1.33 0.24 0.75 All Up 1.86
Implied Volatility 19.75 19.84 19.21 19.74 20.12
HISTORY. VOL 24.17 24.25 24.94 25.61 23.80
FII’S ACTIVITY IN NIFTY FUTURE
**The highest call open interest acts as resistance and highest put open interest acts as support.# Price rise with rise in open interest suggests long buildup | Price fall with rise in open interest suggests short buildup # Price fall with fall in open interest suggests long unwinding | Price rise with fall in open interest suggests short covering
# All BANKING Future Stock
Top 10 short build up
In Cr. In Cr.
Top 10 long build up
LTP % Price Change Open interest %OI Chng
ARVIND 302.6 8.71% 5854800 36.67%
ZEEL 450.15 11.20% 9594000 25.53%
SRF 1393.15 1.76% 651600 21.84%
DRREDDY 2975.4 3.51% 2056650 15.93%
TITAN 376.4 3.15% 7731000 14.05%
NCC 78.15 1.30% 14384000 13.87%
UBL 795 4.02% 1429000 12.21%
KOTAKBANK 727.75 2.97% 7542500 12.12%
BAJFINANCE 7668.4 5.39% 261125 10.53%
BIOCON 628.95 2.09% 2993100 9.36%
LTP % Price Change Open interest %OI Chng
EICHERMOT 19753.1 -2.87% 212700 19.54%
OIL 326.75 -1.21% 1143600 17.65%
HCLTECH 718.2 -1.17% 12808800 15.43%
CEATLTD 1028.05 -1.64% 1916600 15.14%
TVSMOTOR 295.7 -1.78% 6288000 13.95%
JUSTDIAL 694.5 -8.76% 2045500 13.45%
CAIRN 137.6 -1.47% 12498000 13.42%
MRF 33402.5 -1.57% 53070 12.50%
TATAMTRDVR 279 -3.16% 12618900 12.23%
PNB 79.8 -1.85% 29824000 12.22%
10
3
- 13
40
- 98
4
- 12
78
- 99
3
- 98
9
69
5
- 37
8
- 96
2
42
0
-1500
-1000
- 500
0
500
1000
29-Apr 02-May 03-May 04-May 05-May 06-May 09-May 10-May 11-May 12-May
16
11
- 18
39
- 93
3
- 24
67
92
- 10
58
19
09
- 79
7
12
12
83
6
-3000
-2500
-2000
-1500
-1000
- 500
0
500
1000
1500
2000
2500
29-Apr 02-May 03-May 04-May 05-May 06-May 09-May 10-May 11-May 12-May
10
®
Turmeric futures (June) is expected to take support near 8000 levels & remain stable in days to come. The factor that is expected to hold up is the projected lower carry over stock. The balance sheet of turmeric for 2016-17, shows that the total supply would be nearly 72 lakh bags, consumption of around 68 lakh bags & the closing stocks is likely to be merely 4 lakh bags - lowest in recent years. In the current scenario, the demand for the yellow spice is tepid due to lower-medium quality arrivals in the spot markets & for which the stockist are not enthusiastically interested in buying. Hence, the counter is likely to face resistance near 8400 levels. Cardamom futures (June) is likely to consolidate in the range of 810-860 levels. The market participants are currently cautious & keeping a watch over the cultivation process & arrival of the monsoon. It is reported that the flowering has started only in some estates which had received rains last week. The downside may remain capped as there would be a demand-supply gap, because from now it would take nearly four months for the next crop to arrive in the month. Jeera futures (June) is expected to trade sideways in the range of 16300-17400 levels. In days to come, an upside momentum can be seen as India's shipment of cumin seed is likely to rise, since the supply pipeline from the other major producing countries are empty due to lower production in Syria & Turkey. India is in dominating situation in the international market & exports of jeera are expected to cross 1 lakh tonnes during 2016-17.
SPICES
Soybean futures (June) is likely to trade with a downside bias & remain below 4120 levels. The counter is reeling under pressure of steep fall in demand for soy meal as India is currently totally out priced in the international market. Secondly, the USDA has forecasts that in 2016-17 India's soybean production will be nearly at 11.70 million tonnes, up 58% from last year. This season, the yield is projected higher at 0.97 tonnes per hectare, up nearly 50% from last year and up 5% from the 5-year average. On CBOT, the most active soybean futures (July) is expected to face resistance near $10.90 due to profit booking from higher levels. However, there are very less chances of steep downside as the counter is continuously getting support from crop damage from heavy rain in Argentina. The Buenos Aires Grains Exchange has cited that due to heavy rains in Argentina's pampas this year, another 700,000 hectares of soy crop are in danger. Mustard futures (June) is expected to witness a consolidation in the range of 4315-4500 levels. The factors such as lower than expected crop and dwindling supplies are likely to support counter & prevent it from any major downfall. The latest statistic show that at the spot market, nearly 40% of the new crop has already arrived & the balance is expected to come slowly as the producers are in no hurry to sell their crop. CPO futures (June) is expected to fall further towards 530-520 levels. The Malaysian palm oil futures is likely to remain below 2720 levels & trade with a bearish bias due to a stronger ringgit, as it makes palm oil more expensive for holders of foreign currencies.
OIL AND OILSEEDS
OTHER COMMODITIES
Sugar futures (July) is expected to witness a consolidation in the range of 3470-3600 levels. The U.S Department of Agriculture has cited that there is sufficient beginning stocks for the next season & it will augment the total sugar supply to about 35 MMT (five-year average is 37.5 MMT) and will be enough to meet the Indian sugar consumption of 27.2 MMT in MY 2016/17. Mentha oil futures (May) is likely to trade with a downside bias & even fall towards 840 levels. In days to come, the counter will face supply pressure from the fresh arrivals from next month onwards & on the demand side the buyers are now cautious & buying hefty. This season it is estimated that the production may be nearly 35,000-40,000 tonnes & the total supply would be more or less around last year's quantity. Kapas futures (April '17) may see a downfall for the fourth consecutive week as the counter can test 860-850 levels. The cotton prices in the international market are reeling under pressure of strong sales from Chinese reserve. Back at home, the sentiments are bearish as it is estimated that exports of cotton from India is expected to drop by over 10% to 6 million bales in current year ending September. The upside momentum in Chana futures (June) is likely to persist in near term, as the counter is expected to take support near 5500 levels. The gap between demand & supply will possibly rise as the 3rd advance estimates of production released by the Department of Agriculture, has highlighted that the total pulses production of 17.06 million tonnes during 2015-16 is marginally lower than the previous year's production of 17.15 million tonnes.
Bullion counter is expected to trade on mixed path as movement of greenback and global risk sentiment to give further direction to the prices. Recently safe haven buying amid tumbling global markets and increase in investment demand have supported its prices. Movement of local currency rupee will also give direction as it can move in the range of 65.50-67.50 in near term. Gold can trade in the range of 29400-30800 while silver can move in the range of 40000-43000 in near term. Holdings in gold-backed exchange-traded funds stood at 1,806.7 metric tonne, the highest in more than two years and the 11th straight gain last week. Gold demand surged by 21 percent in the first quarter of 2016, which is the fastest pace on record, according to a World Gold Council report, which said the rise came even as central bank buying dipped and demand for jewellery slowed as well. Gold is again seen not only as a store of value and inflation hedge but also as a diversification tool in an investing world where asset correlation remains strong. Indians bought a third less gold than last year during the annual Hindu and Jain holy festival of Akshaya Tritiya this year. Akshaya Tritiya is the second biggest gold-buying festival in India after Dhanteras around October-November, but jewellers failed to draw buyers despite spending heavily on print and television advertisements and offering discounts on design fees. According to World Gold Council, “India's gold demand could rise as much as 10 percent in 2016, as good monsoon rainfall and a sustained rally in gold prices could boost buying in coming quarters”.
BULLIONS
Crude oil may trade on upside path but profit booking at higher levels can be seen. Overall, it can move in the range of 2800-3250 levels in MCX. U.S. crude-oil stockpiles dropped by 3.4 million barrels in the week ended May 6, according to the Energy Information Administration. U.S. stockpiles of crude oil still stand near the highest level in more than 80 years, evidence of the global glut of crude oil that has weighed on prices since mid-2014. Crude inventories fell even though imports and production levels remained relatively steady and refineries processed less crude oil compared. In addition, the restart of oil production operations in the oil sand fields in Canada also kept the pressure on prices. In Canada, companies are preparing to restart oil production in the coming days after being affected by wildfires. The disruptions have added to a spate of outages around the globe due to political strife in Libya and a series of attacks on Nigerian oil facilities. Last week Shell announced a Nigerian pipeline closure while Canadian energy companies tried to restart closed facilities that had halted more than 1 million barrels per day (bpd) in supply after a huge wildfire in Alberta's oil sands region. Natural gas prices may move in the range of 134-150 in MCX. Natural gas can get support as cold temperatures in the next two weeks could also spur more heating demand, limiting injections into storage in the coming weeks.
ENERGY COMPLEX
Base metal counter may witness lower level buying after the recent fall being witnessed in past few weeks. Recently decline in Chinese imports and exports data and rise in supply pressurized the prices lower. Copper may move in the range of 304-328 levels. According to the International Copper Study Group” the shortfall in refined copper will reach 56,000 metric tonnes in 2016”. Meanwhile Glencore, the metal trading and mining giant stated that the structural deficits in the metals industry are returning. Glencore also stated that at the current price levels, copper has supply challenges because of the quality of the resources and their scarcity. Codelco, the world's biggest copper producer, sees prices rising toward the end of next year as investment cuts hasten are-balancing of global supply and demand. Lead can hover in the range of 113-122 while zinc can move in the range of 123-134. According to Glencore, “Demand is set to exceed supply for zinc as it has climbed 15 per cent this year”. Meanwhile International Lead and Zinc Study Group stated that refined zinc production will trail consumption by 352,000 metric tonnes this year, widening its deficit forecast from 152,000 tons in October. Nickel may move in the range of 565-630 in MCX. Aluminum can move in the range of 101-108. China's aluminium producers have previously pledged to cut production amid plunging prices for the metal. Aluminium prices on the Shanghai exchange fell for six straight years before staging a pick-up this year. China is the world's top consumer and producer of aluminium.
BASE METALS
11
TECHNICAL RECOMMENDATIONS
COMMODITY
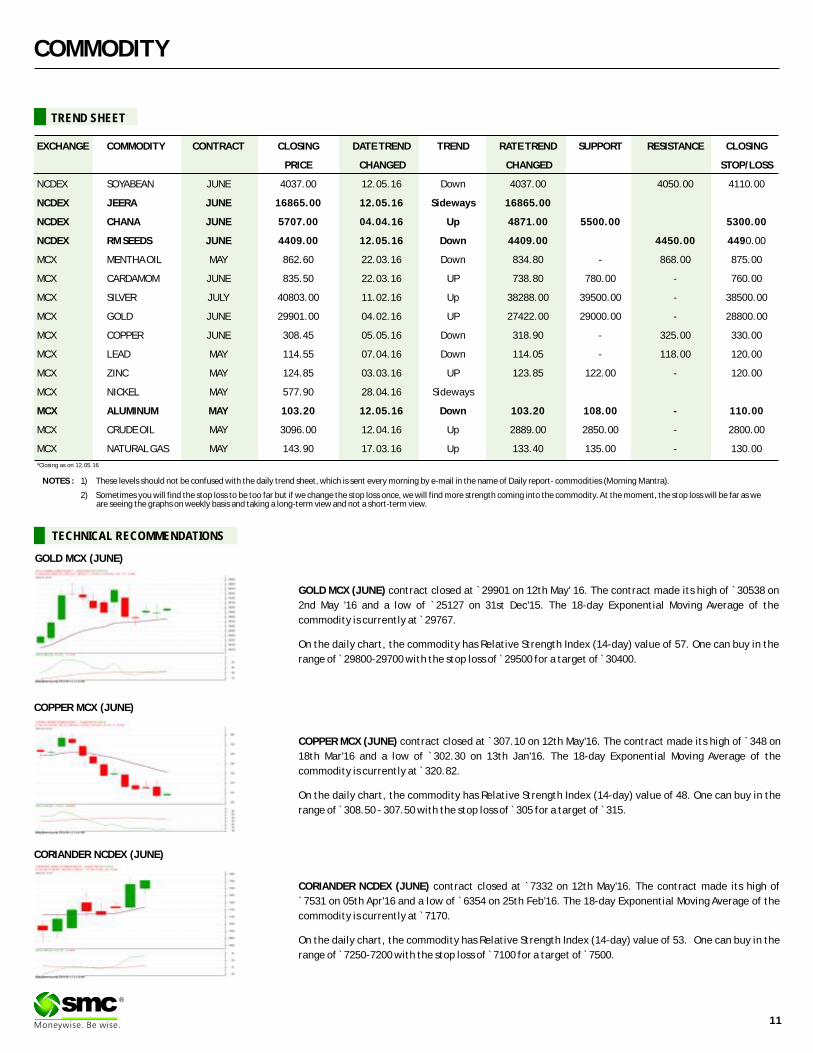
GOLD MCX (JUNE) contract closed at ̀ 29901 on 12th May' 16. The contract made its high of 30538 on
2nd May '16 and a low of `25127 on 31st Dec'15. The 18-day Exponential Moving Average of the
commodity is currently at ̀ 29767.
On the daily chart, the commodity has Relative Strength Index (14-day) value of 57. One can buy in the
range of ̀ 29800-29700 with the stop loss of ̀ 29500 for a target of ̀ 30400.
`
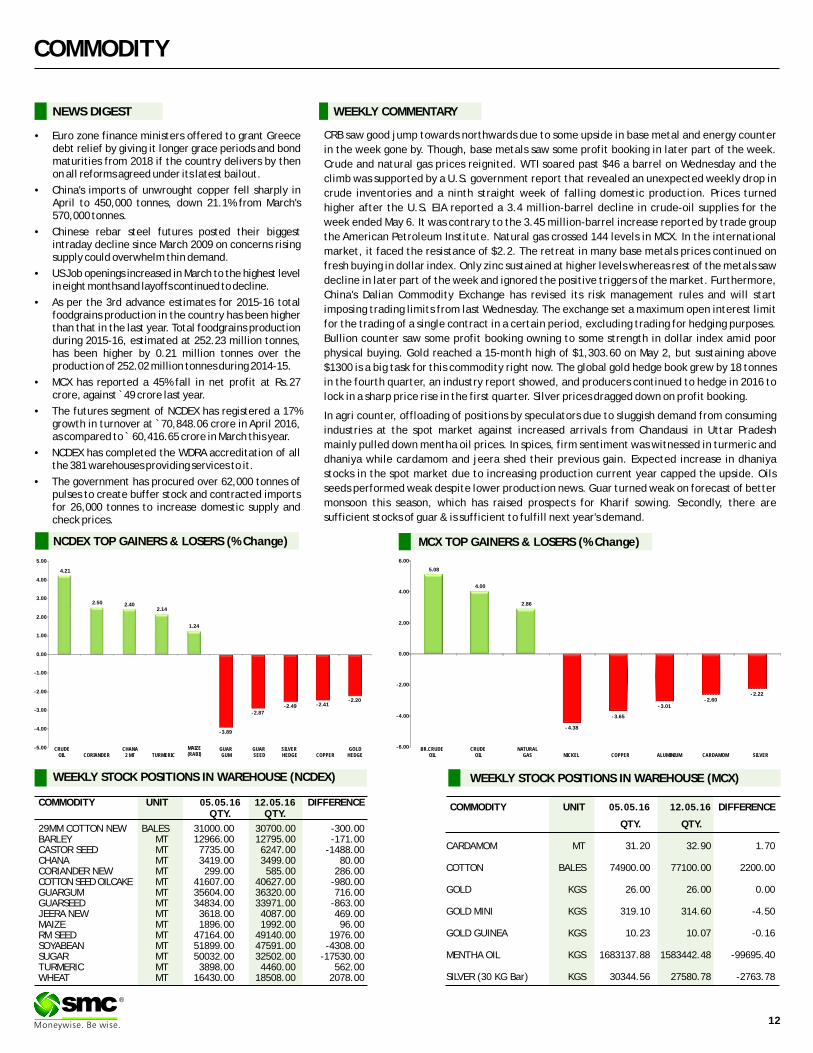
COPPER MCX (JUNE) contract closed at 307.10 on 12th May'16. The contract made its high of 348 on
18th Mar'16 and a low of `302.30 on 13th Jan'16. The 18-day Exponential Moving Average of the
commodity is currently at ̀ 320.82.
On the daily chart, the commodity has Relative Strength Index (14-day) value of 48. One can buy in the
range of ̀ 308.50 - 307.50 with the stop loss of ̀ 305 for a target of ̀ 315.
` `
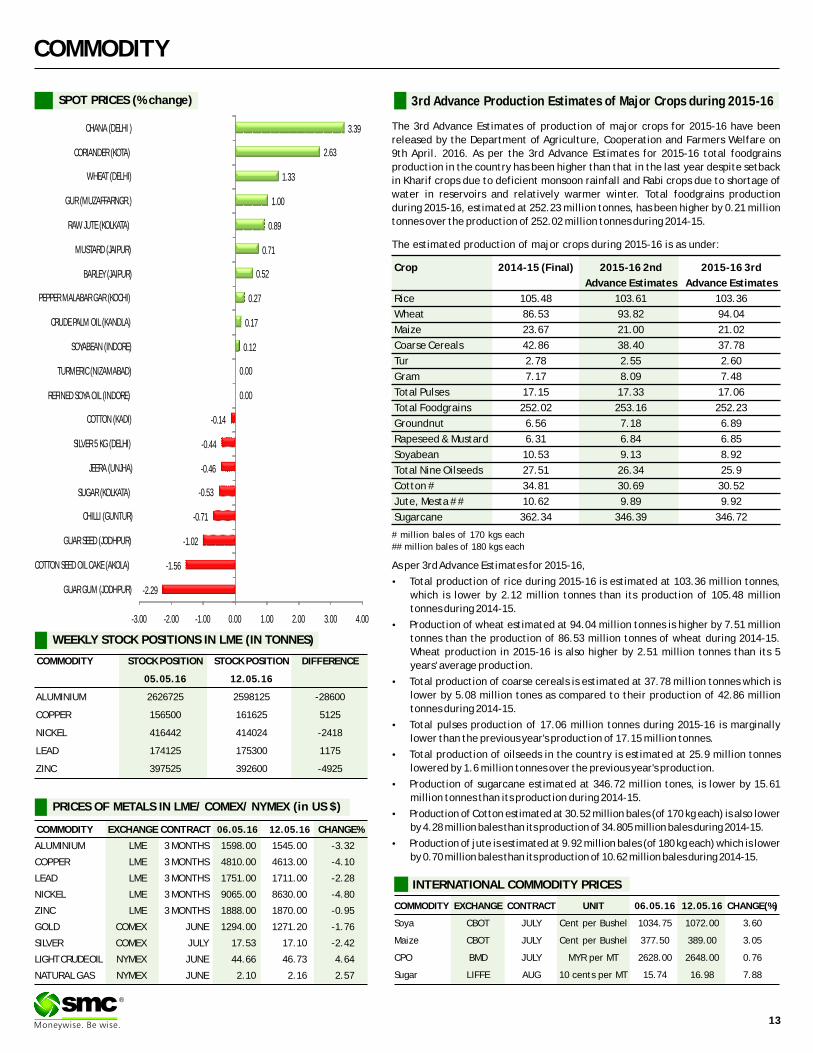
CORIANDER NCDEX (JUNE) contract closed at 7332 on 12th May'16. The contract made its high of
`7531 on 05th Apr'16 and a low of ̀ 6354 on 25th Feb'16. The 18-day Exponential Moving Average of the
commodity is currently at ̀ 7170.
On the daily chart, the commodity has Relative Strength Index (14-day) value of 53. One can buy in the
range of ̀ 7250-7200 with the stop loss of ̀ 7100 for a target of ̀ 7500.
`
®
GOLD MCX (JUNE)
COPPER MCX (JUNE)
CORIANDER NCDEX (JUNE)
NOTES : 1) These levels should not be confused with the daily trend sheet, which is sent every morning by e-mail in the name of Daily report- commodities (Morning Mantra).
2) Sometimes you will find the stop loss to be too far but if we change the stop loss once, we will find more strength coming into the commodity. At the moment, the stop loss will be far as we are seeing the graphs on weekly basis and taking a long-term view and not a short-term view.
EXCHANGE COMMODITY CONTRACT CLOSING DATE TREND TREND RATE TREND SUPPORT RESISTANCE CLOSING
PRICE CHANGED CHANGED STOP/LOSS
NCDEX SOYABEAN JUNE 4037.00 12.05.16 Down 4037.00 4050.00 4110.00
NCDEX JEERA JUNE 16865.00 12.05.16 Sideways 16865.00
NCDEX CHANA JUNE 5707.00 04.04.16 Up 4871.00 5500.00 5300.00
NCDEX RM SEEDS JUNE 4409.00 12.05.16 Down 4409.00 4450.00 4490.00
MCX MENTHA OIL MAY 862.60 22.03.16 Down 834.80 - 868.00 875.00
MCX CARDAMOM JUNE 835.50 22.03.16 UP 738.80 780.00 - 760.00
MCX SILVER JULY 40803.00 11.02.16 Up 38288.00 39500.00 - 38500.00
MCX GOLD JUNE 29901.00 04.02.16 UP 27422.00 29000.00 - 28800.00
MCX COPPER JUNE 308.45 05.05.16 Down 318.90 - 325.00 330.00
MCX LEAD MAY 114.55 07.04.16 Down 114.05 - 118.00 120.00
MCX ZINC MAY 124.85 03.03.16 UP 123.85 122.00 - 120.00
MCX NICKEL MAY 577.90 28.04.16 Sideways
MCX ALUMINUM MAY 103.20 12.05.16 Down 103.20 108.00 - 110.00
MCX CRUDE OIL MAY 3096.00 12.04.16 Up 2889.00 2850.00 - 2800.00
MCX NATURAL GAS MAY 143.90 17.03.16 Up 133.40 135.00 - 130.00
TREND SHEET
*Closing as on 12.05.16
COMMODITY
NEWS DIGEST
CRB saw good jump towards northwards due to some upside in base metal and energy counter
in the week gone by. Though, base metals saw some profit booking in later part of the week.
Crude and natural gas prices reignited. WTI soared past $46 a barrel on Wednesday and the
climb was supported by a U.S. government report that revealed an unexpected weekly drop in
crude inventories and a ninth straight week of falling domestic production. Prices turned
higher after the U.S. EIA reported a 3.4 million-barrel decline in crude-oil supplies for the
week ended May 6. It was contrary to the 3.45 million-barrel increase reported by trade group
the American Petroleum Institute. Natural gas crossed 144 levels in MCX. In the international
market, it faced the resistance of $2.2. The retreat in many base metals prices continued on
fresh buying in dollar index. Only zinc sustained at higher levels whereas rest of the metals saw
decline in later part of the week and ignored the positive triggers of the market. Furthermore,
China's Dalian Commodity Exchange has revised its risk management rules and will start
imposing trading limits from last Wednesday. The exchange set a maximum open interest limit
for the trading of a single contract in a certain period, excluding trading for hedging purposes.
Bullion counter saw some profit booking owning to some strength in dollar index amid poor
physical buying. Gold reached a 15-month high of $1,303.60 on May 2, but sustaining above
$1300 is a big task for this commodity right now. The global gold hedge book grew by 18 tonnes
in the fourth quarter, an industry report showed, and producers continued to hedge in 2016 to
lock in a sharp price rise in the first quarter. Silver prices dragged down on profit booking.
In agri counter, offloading of positions by speculators due to sluggish demand from consuming
industries at the spot market against increased arrivals from Chandausi in Uttar Pradesh
mainly pulled down mentha oil prices. In spices, firm sentiment was witnessed in turmeric and
dhaniya while cardamom and jeera shed their previous gain. Expected increase in dhaniya
stocks in the spot market due to increasing production current year capped the upside. Oils
seeds performed weak despite lower production news. Guar turned weak on forecast of better
monsoon this season, which has raised prospects for Kharif sowing. Secondly, there are
sufficient stocks of guar & is sufficient to fulfill next year's demand.
WEEKLY COMMENTARY
COMMODITY UNIT 12.05.16 DIFFERENCEQTY. QTY.
29MM COTTON NEW BALES 31000.00 30700.00 -300.00BARLEY MT 12966.00 12795.00 -171.00CASTOR SEED MT 7735.00 6247.00 -1488.00CHANA MT 3419.00 3499.00 80.00CORIANDER NEW MT 299.00 585.00 286.00COTTON SEED OILCAKE MT 41607.00 40627.00 -980.00GUARGUM MT 35604.00 36320.00 716.00GUARSEED MT 34834.00 33971.00 -863.00JEERA NEW MT 3618.00 4087.00 469.00MAIZE MT 1896.00 1992.00 96.00RM SEED MT 47164.00 49140.00 1976.00SOYABEAN MT 51899.00 47591.00 -4308.00SUGAR MT 50032.00 32502.00 -17530.00TURMERIC MT 3898.00 4460.00 562.00WHEAT MT 16430.00 18508.00 2078.00
05.05.16 COMMODITY UNIT 12.05.16 DIFFERENCE
QTY. QTY.
CARDAMOM MT 31.20 32.90 1.70
COTTON BALES 74900.00 77100.00 2200.00
GOLD KGS 26.00 26.00 0.00
GOLD MINI KGS 319.10 314.60 -4.50
GOLD GUINEA KGS 10.23 10.07 -0.16
MENTHA OIL KGS 1683137.88 1583442.48 -99695.40
SILVER (30 KG Bar) KGS 30344.56 27580.78 -2763.78
05.05.16
•Euro zone finance ministers offered to grant Greece debt relief by giving it longer grace periods and bond maturities from 2018 if the country delivers by then on all reforms agreed under its latest bailout.
•China's imports of unwrought copper fell sharply in April to 450,000 tonnes, down 21.1% from March's 570,000 tonnes.
•Chinese rebar steel futures posted their biggest intraday decline since March 2009 on concerns rising supply could overwhelm thin demand.
•US Job openings increased in March to the highest level in eight months and layoffs continued to decline.
•As per the 3rd advance estimates for 2015-16 total foodgrains production in the country has been higher than that in the last year. Total foodgrains production during 2015-16, estimated at 252.23 million tonnes, has been higher by 0.21 million tonnes over the production of 252.02 million tonnes during 2014-15.
•MCX has reported a 45% fall in net profit at Rs.27 crore, against ̀ 49 crore last year.
•The futures segment of NCDEX has registered a 17% growth in turnover at ̀ 70,848.06 crore in April 2016, as compared to ̀ 60,416.65 crore in March this year.
•NCDEX has completed the WDRA accreditation of all the 381 warehouses providing services to it.
•The government has procured over 62,000 tonnes of pulses to create buffer stock and contracted imports for 26,000 tonnes to increase domestic supply and check prices.
WEEKLY STOCK POSITIONS IN WAREHOUSE (MCX)
12
®
WEEKLY STOCK POSITIONS IN WAREHOUSE (NCDEX)
NCDEX TOP GAINERS & LOSERS (% Change) MCX TOP GAINERS & LOSERS (% Change)
5.08
4.00
2.86
- 4.38
- 3.65
- 3.01- 2.60
- 2.22
-6.00
-4.00
-2.00
0.00
2.00
4.00
6.00
BR.CRUDE OIL
CRUDE OIL
NATURAL GAS NICKEL COPPER ALUMINIUM CARDAMOM SILVER
4.21
2.50 2.402.14
1.24
-3.89
-2.87
-2.49 -2.41-2.20
-5.00
-4.00
-3.00
-2.00
-1.00
0.00
1.00
2.00
3.00
4.00
5.00
CRUDE OIL CORIANDER
CHANA 2 MT TURMERIC
MAIZE (RABI)
GUAR GUM
GUAR SEED
SILVER HEDGE COPPER
GOLD HEDGE
3rd Advance Production Estimates of Major Crops during 2015-16
The 3rd Advance Estimates of production of major crops for 2015-16 have been
released by the Department of Agriculture, Cooperation and Farmers Welfare on
9th April. 2016. As per the 3rd Advance Estimates for 2015-16 total foodgrains
production in the country has been higher than that in the last year despite setback
in Kharif crops due to deficient monsoon rainfall and Rabi crops due to shortage of
water in reservoirs and relatively warmer winter. Total foodgrains production
during 2015-16, estimated at 252.23 million tonnes, has been higher by 0.21 million
tonnes over the production of 252.02 million tonnes during 2014-15.
As per 3rd Advance Estimates for 2015-16,
�Total production of rice during 2015-16 is estimated at 103.36 million tonnes,
which is lower by 2.12 million tonnes than its production of 105.48 million
tonnes during 2014-15.
�Production of wheat estimated at 94.04 million tonnes is higher by 7.51 million
tonnes than the production of 86.53 million tonnes of wheat during 2014-15.
Wheat production in 2015-16 is also higher by 2.51 million tonnes than its 5
years' average production.
�Total production of coarse cereals is estimated at 37.78 million tonnes which is
lower by 5.08 million tones as compared to their production of 42.86 million
tonnes during 2014-15.
�Total pulses production of 17.06 million tonnes during 2015-16 is marginally
lower than the previous year's production of 17.15 million tonnes.
�Total production of oilseeds in the country is estimated at 25.9 million tonnes
lowered by 1.6 million tonnes over the previous year's production.
�Production of sugarcane estimated at 346.72 million tones, is lower by 15.61
million tonnes than its production during 2014-15.
�Production of Cotton estimated at 30.52 million bales (of 170 kg each) is also lower
by 4.28 million bales than its production of 34.805 million bales during 2014-15.
�Production of jute is estimated at 9.92 million bales (of 180 kg each) which is lower
by 0.70 million bales than its production of 10.62 million bales during 2014-15.
COMMODITY
COMMODITY EXCHANGE CONTRACT 12.05.16 CHANGE%
ALUMINIUM LME 3 MONTHS 1598.00 1545.00 -3.32
COPPER LME 3 MONTHS 4810.00 4613.00 -4.10
LEAD LME 3 MONTHS 1751.00 1711.00 -2.28
NICKEL LME 3 MONTHS 9065.00 8630.00 -4.80
ZINC LME 3 MONTHS 1888.00 1870.00 -0.95
GOLD COMEX JUNE 1294.00 1271.20 -1.76
SILVER COMEX JULY 17.53 17.10 -2.42
LIGHT CRUDE OIL NYMEX JUNE 44.66 46.73 4.64
NATURAL GAS NYMEX JUNE 2.10 2.16 2.57
06.05.16
PRICES OF METALS IN LME/ COMEX/ NYMEX (in US $)
WEEKLY STOCK POSITIONS IN LME (IN TONNES)
COMMODITY STOCK POSITION STOCK POSITION DIFFERENCE
05.05.16 12.05.16
ALUMINIUM 2626725 2598125 -28600
COPPER 156500 161625 5125
NICKEL 416442 414024 -2418
LEAD 174125 175300 1175
ZINC 397525 392600 -4925
INTERNATIONAL COMMODITY PRICES
COMMODITY EXCHANGE CONTRACT UNIT 06.05.16 12.05.16 CHANGE(%)
Soya CBOT JULY Cent per Bushel 1034.75 1072.00 3.60
Maize CBOT JULY Cent per Bushel 377.50 389.00 3.05
CPO BMD JULY MYR per MT 2628.00 2648.00 0.76
Sugar LIFFE AUG 10 cents per MT 15.74 16.98 7.88
13
®
SPOT PRICES (% change)
Crop 2014-15 (Final) 2015-16 2nd 2015-16 3rd
Advance Estimates Advance Estimates
Rice 105.48 103.61 103.36
Wheat 86.53 93.82 94.04
Maize 23.67 21.00 21.02
Coarse Cereals 42.86 38.40 37.78
Tur 2.78 2.55 2.60
Gram 7.17 8.09 7.48
Total Pulses 17.15 17.33 17.06
Total Foodgrains 252.02 253.16 252.23
Groundnut 6.56 7.18 6.89
Rapeseed & Mustard 6.31 6.84 6.85
Soyabean 10.53 9.13 8.92
Total Nine Oilseeds 27.51 26.34 25.9
Cotton # 34.81 30.69 30.52
Jute, Mesta # # 10.62 9.89 9.92
Sugarcane 362.34 346.39 346.72
# million bales of 170 kgs each
## million bales of 180 kgs each
The estimated production of major crops during 2015-16 is as under:
-2.29
-1.56
-1.02
-0.71
-0.53
-0.46
-0.44
-0.14
0.00
0.00
0.12
0.17
0.27
0.52
0.71
0.89
1.00
1.33
2.63
3.39
-3.00 -2.00 -1.00 0.00 1.00 2.00 3.00 4.00
GUAR GUM (JODHPUR)
COTTON SEED OIL CAKE (AKOLA)
GUAR SEED (JODHPUR)
CHILLI (GUNTUR)
SUGAR (KOLKATA)
JEERA (UNJHA)
SILVER 5 KG (DELHI)
COTTON (KADI)
REFINED SOYA OIL (INDORE)
TURMERIC (NIZAMABAD)
SOYABEAN (INDORE)
CRUDE PALM OIL (KANDLA)
PEPPER MALABAR GAR (KOCHI)
BARLEY (JAIPUR)
MUSTARD (JAIPUR)
RAW JUTE (KOLKATA)
GUR (MUZAFFARNGR.)
WHEAT (DELHI)
CORIANDER (KOTA)
CHANA (DELHI )
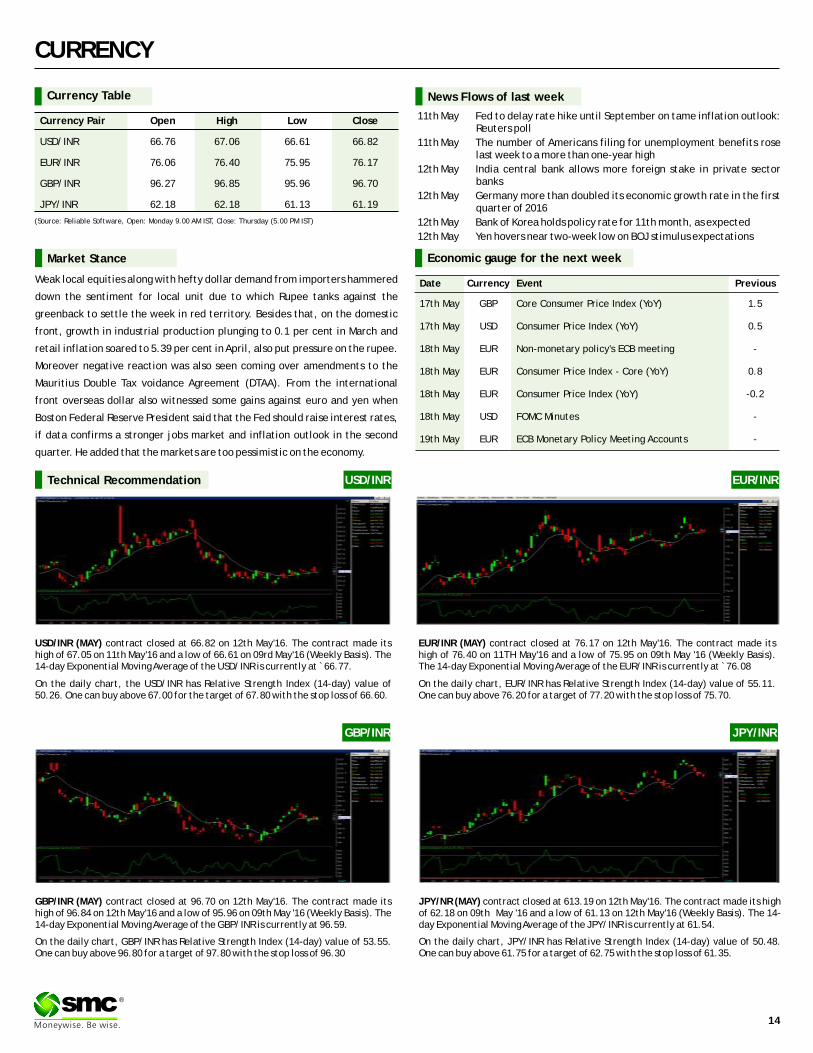
CURRENCY
Currency Table
Currency Pair Open High Low Close
USD/INR 66.76 67.06 66.61 66.82
EUR/INR 76.06 76.40 75.95 76.17
GBP/INR 96.27 96.85 95.96 96.70
JPY/INR 62.18 62.18 61.13 61.19
(Source: Reliable Software, Open: Monday 9.00 AM IST, Close: Thursday (5.00 PM IST)
News Flows of last week
11th May Fed to delay rate hike until September on tame inflation outlook: Reuters poll
11th May The number of Americans filing for unemployment benefits rose last week to a more than one-year high
12th May India central bank allows more foreign stake in private sector banks
12th May Germany more than doubled its economic growth rate in the first quarter of 2016
12th May Bank of Korea holds policy rate for 11th month, as expected
12th May Yen hovers near two-week low on BOJ stimulus expectations
EUR/INR (MAY) contract closed at 76.17 on 12th May'16. The contract made its high of 76.40 on 11TH May'16 and a low of 75.95 on 09th May '16 (Weekly Basis). The 14-day Exponential Moving Average of the EUR/INR is currently at ̀ 76.08
On the daily chart, EUR/INR has Relative Strength Index (14-day) value of 55.11. One can buy above 76.20 for a target of 77.20 with the stop loss of 75.70.
JPY/NR (MAY) contract closed at 613.19 on 12th May'16. The contract made its high of 62.18 on 09th May '16 and a low of 61.13 on 12th May'16 (Weekly Basis). The 14-day Exponential Moving Average of the JPY/INR is currently at 61.54.
On the daily chart, JPY/INR has Relative Strength Index (14-day) value of 50.48. One can buy above 61.75 for a target of 62.75 with the stop loss of 61.35.
Market Stance
Weak local equities along with hefty dollar demand from importers hammered
down the sentiment for local unit due to which Rupee tanks against the
greenback to settle the week in red territory. Besides that, on the domestic
front, growth in industrial production plunging to 0.1 per cent in March and
retail inflation soared to 5.39 per cent in April, also put pressure on the rupee.
Moreover negative reaction was also seen coming over amendments to the
Mauritius Double Tax voidance Agreement (DTAA). From the international
front overseas dollar also witnessed some gains against euro and yen when
Boston Federal Reserve President said that the Fed should raise interest rates,
if data confirms a stronger jobs market and inflation outlook in the second
quarter. He added that the markets are too pessimistic on the economy.
EUR/INR
USD/INR (MAY) contract closed at 66.82 on 12th May'16. The contract made its high of 67.05 on 11th May'16 and a low of 66.61 on 09rd May'16 (Weekly Basis). The 14-day Exponential Moving Average of the USD/INR is currently at ̀ 66.77.
On the daily chart, the USD/INR has Relative Strength Index (14-day) value of 50.26. One can buy above 67.00 for the target of 67.80 with the stop loss of 66.60.
GBP/INR (MAY) contract closed at 96.70 on 12th May'16. The contract made its high of 96.84 on 12th May'16 and a low of 95.96 on 09th May '16 (Weekly Basis). The 14-day Exponential Moving Average of the GBP/INR is currently at 96.59.
On the daily chart, GBP/INR has Relative Strength Index (14-day) value of 53.55. One can buy above 96.80 for a target of 97.80 with the stop loss of 96.30
USD/INRTechnical Recommendation
Economic gauge for the next week
Date Currency Event Previous
17th May GBP Core Consumer Price Index (YoY) 1.5
17th May USD Consumer Price Index (YoY) 0.5
18th May EUR Non-monetary policy's ECB meeting -
18th May EUR Consumer Price Index - Core (YoY) 0.8
18th May EUR Consumer Price Index (YoY) -0.2
18th May USD FOMC Minutes -
19th May EUR ECB Monetary Policy Meeting Accounts -
GBP/INR JPY/INR
14
®
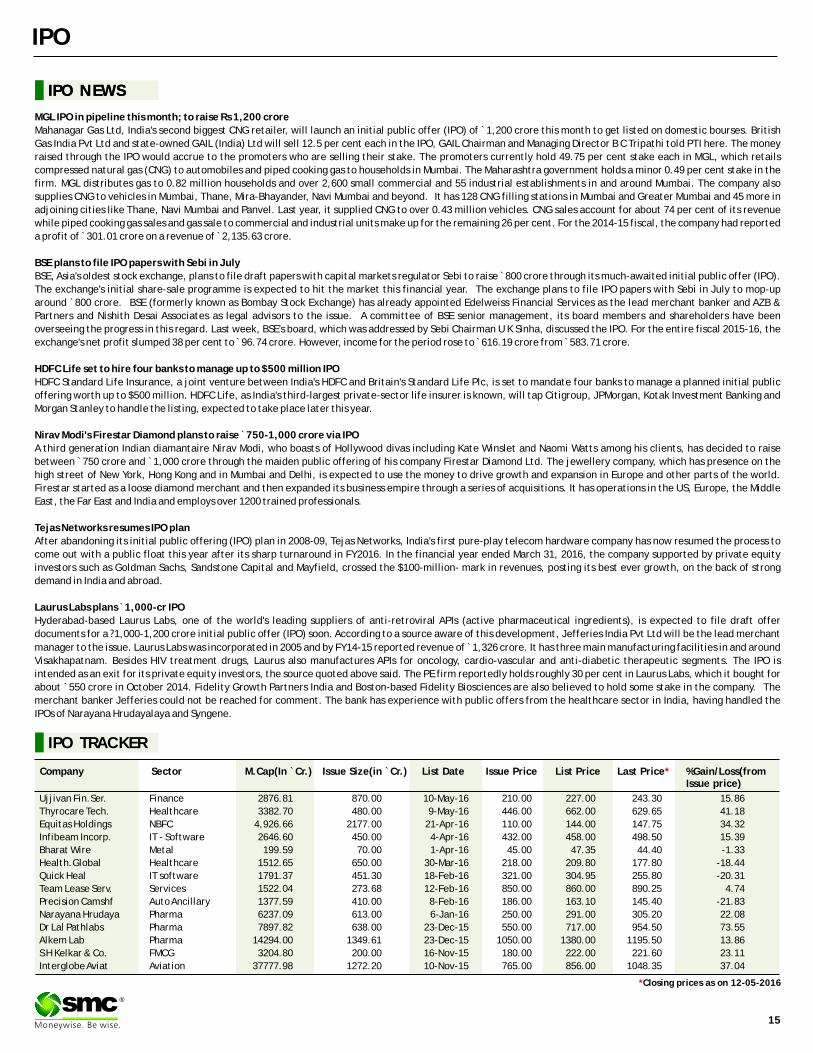
Ujjivan Fin.Ser. Finance 2876.81 870.00 10-May-16 210.00 227.00 243.30 15.86
Thyrocare Tech. Healthcare 3382.70 480.00 9-May-16 446.00 662.00 629.65 41.18
Equitas Holdings NBFC 4,926.66 2177.00 21-Apr-16 110.00 144.00 147.75 34.32
Infibeam Incorp. IT - Software 2646.60 450.00 4-Apr-16 432.00 458.00 498.50 15.39
Bharat Wire Metal 199.59 70.00 1-Apr-16 45.00 47.35 44.40 -1.33
Health.Global Healthcare 1512.65 650.00 30-Mar-16 218.00 209.80 177.80 -18.44
Quick Heal IT software 1791.37 451.30 18-Feb-16 321.00 304.95 255.80 -20.31
Team Lease Serv. Services 1522.04 273.68 12-Feb-16 850.00 860.00 890.25 4.74
Precision Camshf Auto Ancillary 1377.59 410.00 8-Feb-16 186.00 163.10 145.40 -21.83
Narayana Hrudaya Pharma 6237.09 613.00 6-Jan-16 250.00 291.00 305.20 22.08
Dr Lal Pathlabs Pharma 7897.82 638.00 23-Dec-15 550.00 717.00 954.50 73.55
Alkem Lab Pharma 14294.00 1349.61 23-Dec-15 1050.00 1380.00 1195.50 13.86
S H Kelkar & Co. FMCG 3204.80 200.00 16-Nov-15 180.00 222.00 221.60 23.11
Interglobe Aviat Aviation 37777.98 1272.20 10-Nov-15 765.00 856.00 1048.35 37.04
IPO TRACKER
Company Sector M.Cap(In `Cr.) Issue Size(in `Cr.) List Date Issue Price List Price Last Price %Gain/Loss(from Issue price)
*
*Closing prices as on 12-05-2016
IPO
IPO NEWSIPO NEWS
MGL IPO in pipeline this month; to raise Rs 1,200 crore
Mahanagar Gas Ltd, India's second biggest CNG retailer, will launch an initial public offer (IPO) of ̀ 1,200 crore this month to get listed on domestic bourses. British
Gas India Pvt Ltd and state-owned GAIL (India) Ltd will sell 12.5 per cent each in the IPO, GAIL Chairman and Managing Director B C Tripathi told PTI here. The money
raised through the IPO would accrue to the promoters who are selling their stake. The promoters currently hold 49.75 per cent stake each in MGL, which retails
compressed natural gas (CNG) to automobiles and piped cooking gas to households in Mumbai. The Maharashtra government holds a minor 0.49 per cent stake in the
firm. MGL distributes gas to 0.82 million households and over 2,600 small commercial and 55 industrial establishments in and around Mumbai. The company also
supplies CNG to vehicles in Mumbai, Thane, Mira-Bhayander, Navi Mumbai and beyond. It has 128 CNG filling stations in Mumbai and Greater Mumbai and 45 more in
adjoining cities like Thane, Navi Mumbai and Panvel. Last year, it supplied CNG to over 0.43 million vehicles. CNG sales account for about 74 per cent of its revenue
while piped cooking gas sales and gas sale to commercial and industrial units make up for the remaining 26 per cent. For the 2014-15 fiscal, the company had reported
a profit of ̀ 301.01 crore on a revenue of ̀ 2,135.63 crore.
BSE plans to file IPO papers with Sebi in July
BSE, Asia's oldest stock exchange, plans to file draft papers with capital markets regulator Sebi to raise ̀ 800 crore through its much-awaited initial public offer (IPO).
The exchange's initial share-sale programme is expected to hit the market this financial year. The exchange plans to file IPO papers with Sebi in July to mop-up
around `800 crore. BSE (formerly known as Bombay Stock Exchange) has already appointed Edelweiss Financial Services as the lead merchant banker and AZB &
Partners and Nishith Desai Associates as legal advisors to the issue. A committee of BSE senior management, its board members and shareholders have been
overseeing the progress in this regard. Last week, BSE's board, which was addressed by Sebi Chairman U K Sinha, discussed the IPO. For the entire fiscal 2015-16, the
exchange's net profit slumped 38 per cent to ̀ 96.74 crore. However, income for the period rose to ̀ 616.19 crore from ̀ 583.71 crore.
HDFC Life set to hire four banks to manage up to $500 million IPO
HDFC Standard Life Insurance, a joint venture between India's HDFC and Britain's Standard Life Plc, is set to mandate four banks to manage a planned initial public
offering worth up to $500 million. HDFC Life, as India's third-largest private-sector life insurer is known, will tap Citigroup, JPMorgan, Kotak Investment Banking and
Morgan Stanley to handle the listing, expected to take place later this year.
Nirav Modi's Firestar Diamond plans to raise ̀ 750-1,000 crore via IPO
A third generation Indian diamantaire Nirav Modi, who boasts of Hollywood divas including Kate Winslet and Naomi Watts among his clients, has decided to raise
between ̀ 750 crore and ̀ 1,000 crore through the maiden public offering of his company Firestar Diamond Ltd. The jewellery company, which has presence on the
high street of New York, Hong Kong and in Mumbai and Delhi, is expected to use the money to drive growth and expansion in Europe and other parts of the world.
Firestar started as a loose diamond merchant and then expanded its business empire through a series of acquisitions. It has operations in the US, Europe, the Middle
East, the Far East and India and employs over 1200 trained professionals.
Tejas Networks resumes IPO plan
After abandoning its initial public offering (IPO) plan in 2008-09, Tejas Networks, India's first pure-play telecom hardware company has now resumed the process to
come out with a public float this year after its sharp turnaround in FY2016. In the financial year ended March 31, 2016, the company supported by private equity
investors such as Goldman Sachs, Sandstone Capital and Mayfield, crossed the $100-million- mark in revenues, posting its best ever growth, on the back of strong
demand in India and abroad.
Laurus Labs plans ̀ 1,000-cr IPO
Hyderabad-based Laurus Labs, one of the world's leading suppliers of anti-retroviral APIs (active pharmaceutical ingredients), is expected to file draft offer
documents for a ?1,000-1,200 crore initial public offer (IPO) soon. According to a source aware of this development, Jefferies India Pvt Ltd will be the lead merchant
manager to the issue. Laurus Labs was incorporated in 2005 and by FY14-15 reported revenue of ̀ 1,326 crore. It has three main manufacturing facilities in and around
Visakhapatnam. Besides HIV treatment drugs, Laurus also manufactures APIs for oncology, cardio-vascular and anti-diabetic therapeutic segments. The IPO is
intended as an exit for its private equity investors, the source quoted above said. The PE firm reportedly holds roughly 30 per cent in Laurus Labs, which it bought for
about `550 crore in October 2014. Fidelity Growth Partners India and Boston-based Fidelity Biosciences are also believed to hold some stake in the company. The
merchant banker Jefferies could not be reached for comment. The bank has experience with public offers from the healthcare sector in India, having handled the
IPOs of Narayana Hrudayalaya and Syngene.
®
15
®
16
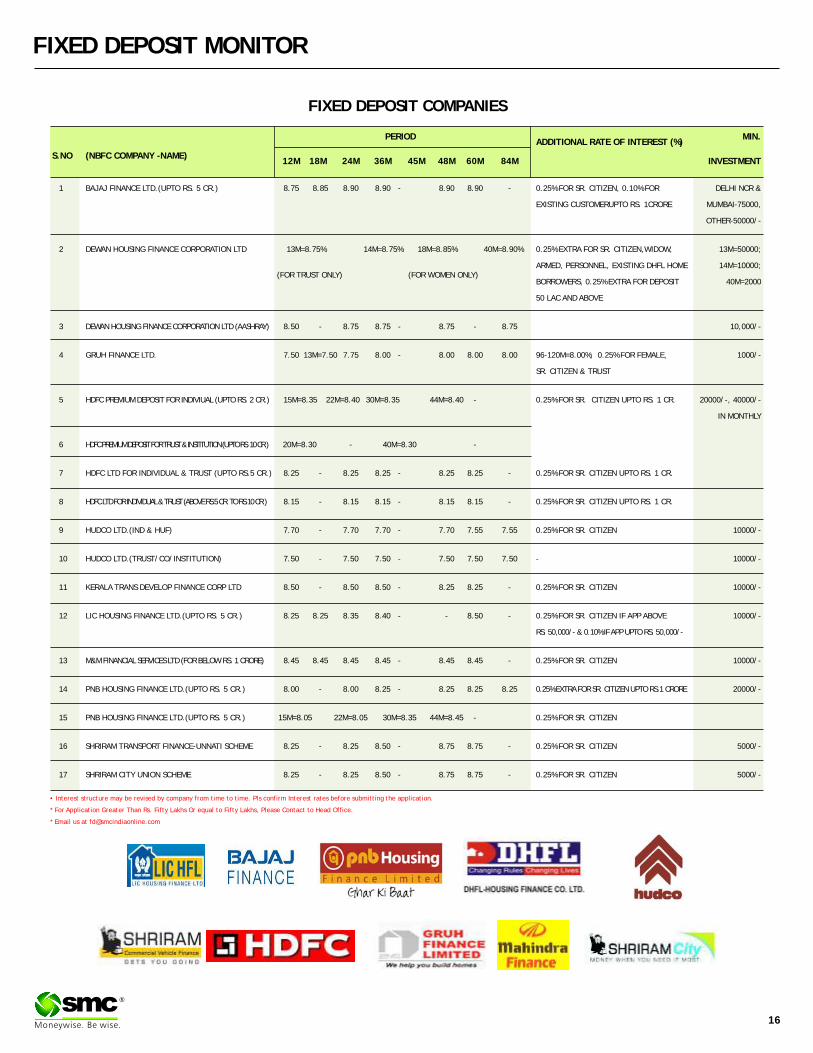
FIXED DEPOSIT MONITOR
• Interest structure may be revised by company from time to time. Pls confirm Interest rates before submitting the application.
* For Application Greater Than Rs. Fifty Lakhs Or equal to Fifty Lakhs, Please Contact to Head Office.
* Email us at [email protected]
FIXED DEPOSIT COMPANIES
PERIOD MIN.ADDITIONAL RATE OF INTEREST (%)
S.NO (NBFC COMPANY -NAME)12M 18M 24M 36M 45M 48M 60M 84M INVESTMENT
1 BAJAJ FINANCE LTD.(UPTO RS. 5 CR.) 8.75 8.85 8.90 8.90 - 8.90 8.90 - 0.25% FOR SR. CITIZEN, 0.10% FOR DELHI NCR &
EXISTING CUSTOMERUPTO RS. 1CRORE MUMBAI-75000,
OTHER-50000/-
2 DEWAN HOUSING FINANCE CORPORATION LTD 13M=8.75% 14M=8.75% 18M=8.85% 40M=8.90% 0.25% EXTRA FOR SR. CITIZEN,WIDOW, 13M=50000;
ARMED, PERSONNEL, EXISTING DHFL HOME 14M=10000;
BORROWERS, 0.25% EXTRA FOR DEPOSIT 40M=2000
50 LAC AND ABOVE
3 DEWAN HOUSING FINANCE CORPORATION LTD (AASHRAY) 8.50 - 8.75 8.75 - 8.75 - 8.75 10,000/-
4 GRUH FINANCE LTD. 7.50 13M=7.50 7.75 8.00 - 8.00 8.00 8.00 96-120M=8.00%; 0.25% FOR FEMALE, 1000/-
SR. CITIZEN & TRUST
5 HDFC PREMIUM DEPOSIT FOR INDIVIUAL (UPTO RS. 2 CR.) 15M=8.35 22M=8.40 30M=8.35 44M=8.40 - 0.25% FOR SR. CITIZEN UPTO RS. 1 CR. 20000/-, 40000/-
IN MONTHLY
6 HDFC PREMIUM DEPOSIT FOR TRUST & INSTITUTION (UPTO RS. 10 CR.) 20M=8.30 - 40M=8.30 -
7 HDFC LTD FOR INDIVIDUAL & TRUST (UPTO RS.5 CR.) 8.25 - 8.25 8.25 - 8.25 8.25 - 0.25% FOR SR. CITIZEN UPTO RS. 1 CR.
8 HDFC LTD FOR INDIVIDUAL & TRUST (ABOVE RS.5 CR. TO RS.10 CR.) 8.15 - 8.15 8.15 - 8.15 8.15 - 0.25% FOR SR. CITIZEN UPTO RS. 1 CR.
9 HUDCO LTD.(IND & HUF) 7.70 - 7.70 7.70 - 7.70 7.55 7.55 0.25% FOR SR. CITIZEN 10000/-
10 HUDCO LTD.(TRUST/CO/INSTITUTION) 7.50 - 7.50 7.50 - 7.50 7.50 7.50 - 10000/-
11 KERALA TRANS DEVELOP FINANCE CORP LTD 8.50 - 8.50 8.50 - 8.25 8.25 - 0.25% FOR SR. CITIZEN 10000/-
12 LIC HOUSING FINANCE LTD.(UPTO RS. 5 CR.) 8.25 8.25 8.35 8.40 - - 8.50 - 0.25% FOR SR. CITIZEN IF APP ABOVE 10000/-
RS. 50,000/- & 0.10% IF APP UPTO RS. 50,000/-
13 M&M FINANCIAL SERVICES LTD (FOR BELOW RS. 1 CRORE) 8.45 8.45 8.45 8.45 - 8.45 8.45 - 0.25% FOR SR. CITIZEN 10000/-
14 PNB HOUSING FINANCE LTD.(UPTO RS. 5 CR.) 8.00 - 8.00 8.25 - 8.25 8.25 8.25 0.25% EXTRA FOR SR. CITIZEN UPTO RS.1 CRORE 20000/-
15 PNB HOUSING FINANCE LTD.(UPTO RS. 5 CR.) 15M=8.05 22M=8.05 30M=8.35 44M=8.45 - 0.25% FOR SR. CITIZEN
16 SHRIRAM TRANSPORT FINANCE-UNNATI SCHEME 8.25 - 8.25 8.50 - 8.75 8.75 - 0.25% FOR SR. CITIZEN 5000/-
17 SHRIRAM CITY UNION SCHEME 8.25 - 8.25 8.50 - 8.75 8.75 - 0.25% FOR SR. CITIZEN 5000/-
(FOR TRUST ONLY) (FOR WOMEN ONLY)
®
17
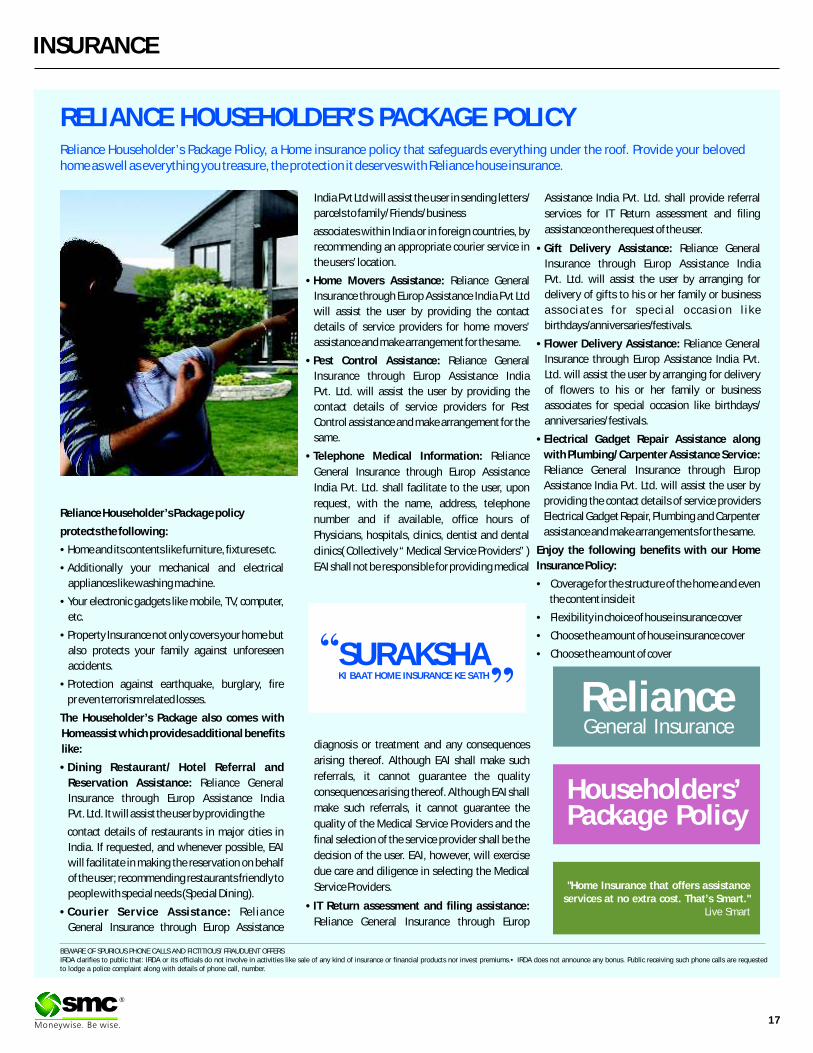
INSURANCE
RELIANCE HOUSEHOLDER’S PACKAGE POLICYReliance Householder’s Package Policy, a Home insurance policy that safeguards everything under the roof. Provide your beloved home as well as everything you treasure, the protection it deserves with Reliance house insurance.
Reliance Householder’s Package policy
protects the following:
•Home and its contents like furniture, fixtures etc.
•Additionally your mechanical and electrical
appliances like washing machine.
•Your electronic gadgets like mobile, TV, computer,
etc.
•Property Insurance not only covers your home but
also protects your family against unforeseen
accidents.
•Protection against earthquake, burglary, fire
pr even terrorism related losses.
The Householder’s Package also comes with
Homeassist which provides additional benefits
like:
•Dining Restaurant/ Hotel Referral and
Reservation Assistance: Reliance General
Insurance through Europ Assistance India
Pvt. Ltd. It will assist the user by providing the
contact details of restaurants in major cities in
India. If requested, and whenever possible, EAI
will facilitate in making the reservation on behalf
of the user; recommending restaurants friendly to
people with special needs (Special Dining).
•Courier Service Assistance: Rel iance
General Insurance through Europ Assistance
India Pvt Ltd will assist the user in sending letters/
parcels to family/ Friends/ business
associates within India or in foreign countries, by
recommending an appropriate courier service in
the users’ location.
•Home Movers Assistance: Reliance General
Insurance through Europ Assistance India Pvt Ltd
will assist the user by providing the contact
details of service providers for home movers’
assistance and make arrangement for the same.
•Pest Control Assistance: Reliance General
Insurance through Europ Assistance India
Pvt. Ltd. will assist the user by providing the
contact details of service providers for Pest
Control assistance and make arrangement for the
same.
•Telephone Medical Information: Reliance
General Insurance through Europ Assistance
India Pvt. Ltd. shall facilitate to the user, upon
request, with the name, address, telephone
number and if available, office hours of
Physicians, hospitals, clinics, dentist and dental
clinics( Collectively “ Medical Service Providers” )
EAI shall not be responsible for providing medical
diagnosis or treatment and any consequences
arising thereof. Although EAI shall make such
referrals, it cannot guarantee the quality
consequences arising thereof. Although EAI shall
make such referrals, it cannot guarantee the
quality of the Medical Service Providers and the
final selection of the service provider shall be the
decision of the user. EAI, however, will exercise
due care and diligence in selecting the Medical
Service Providers.
•IT Return assessment and filing assistance:
Reliance General Insurance through Europ
Assistance India Pvt. Ltd. shall provide referral
services for IT Return assessment and filing
assistance on the request of the user.
•Gift Delivery Assistance: Reliance General
Insurance through Europ Assistance India
Pvt. Ltd. will assist the user by arranging for
delivery of gifts to his or her family or business
a s soc i a t e s f o r spec i a l o c ca s i on l i k e
birthdays/anniversaries/festivals.
•Flower Delivery Assistance: Reliance General
Insurance through Europ Assistance India Pvt.
Ltd. will assist the user by arranging for delivery
of flowers to his or her family or business
associates for special occasion like birthdays/
anniversaries/ festivals.
•Electrical Gadget Repair Assistance along
with Plumbing/ Carpenter Assistance Service:
Reliance General Insurance through Europ
Assistance India Pvt. Ltd. will assist the user by
providing the contact details of service providers
Electrical Gadget Repair, Plumbing and Carpenter
assistance and make arrangements for the same.
Enjoy the following benefits with our Home
Insurance Policy:
• Coverage for the structure of the home and even
the content inside it
• Flexibility in choice of house insurance cover
• Choose the amount of house insurance cover
• Choose the amount of coverSURAKSHAKI BAAT HOME INSURANCE KE SATH
BEWARE OF SPURIOUS PHONE CALLS AND FICTITIOUS/ FRAUDUENT OFFERSIRDA clarifies to public that: IRDA or its officials do not involve in activities like sale of any kind of insurance or financial products nor invest premiums.• IRDA does not announce any bonus. Public receiving such phone calls are requested to lodge a police complaint along with details of phone call, number.
RelianceGeneral Insurance
Householders’ Package Policy
"Home Insurance that offers assistanceservices at no extra cost. That’s Smart."
Live Smart
Returns (%) Risk Market Cap (%)
Scheme Name NAV Launch QAAUM 3M 6M 1Y 3Y Since Std.Dev Jenson LARGE MID SMALL DEBT &
(`) Date (` Cr.) Launch CAP CAP CAP OTHER
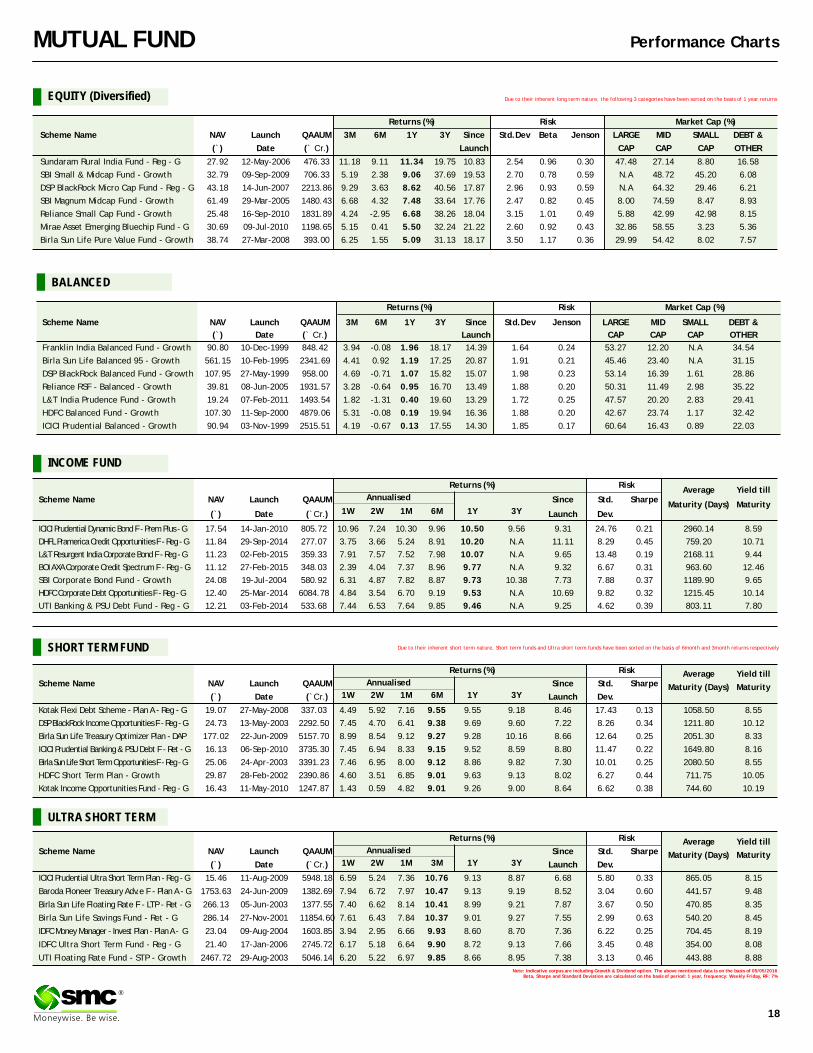
Franklin India Balanced Fund - Growth 90.80 10-Dec-1999 848.42 3.94 -0.08 1.96 18.17 14.39 1.64 0.24 53.27 12.20 N.A 34.54
Birla Sun Life Balanced 95 - Growth 561.15 10-Feb-1995 2341.69 4.41 0.92 1.19 17.25 20.87 1.91 0.21 45.46 23.40 N.A 31.15
DSP BlackRock Balanced Fund - Growth 107.95 27-May-1999 958.00 4.69 -0.71 1.07 15.82 15.07 1.98 0.23 53.14 16.39 1.61 28.86
Reliance RSF - Balanced - Growth 39.81 08-Jun-2005 1931.57 3.28 -0.64 0.95 16.70 13.49 1.88 0.20 50.31 11.49 2.98 35.22
L&T India Prudence Fund - Growth 19.24 07-Feb-2011 1493.54 1.82 -1.31 0.40 19.60 13.29 1.72 0.25 47.57 20.20 2.83 29.41
HDFC Balanced Fund - Growth 107.30 11-Sep-2000 4879.06 5.31 -0.08 0.19 19.94 16.36 1.88 0.20 42.67 23.74 1.17 32.42
ICICI Prudential Balanced - Growth 90.94 03-Nov-1999 2515.51 4.19 -0.67 0.13 17.55 14.30 1.85 0.17 60.64 16.43 0.89 22.03
Annualised
Returns (%) RiskAverage Yield till
Scheme Name NAV Launch QAAUM Since Std. SharpeMaturity (Days) Maturity
1W 2W 1M 6M 1Y 3Y(`) Date (`Cr.) Launch Dev.
ICICI Prudential Dynamic Bond F - Prem Plus - G 17.54 14-Jan-2010 805.72 10.96 7.24 10.30 9.96 10.50 9.56 9.31 24.76 0.21 2960.14 8.59
DHFL Pramerica Credit Opportunities F - Reg - G 11.84 29-Sep-2014 277.07 3.75 3.66 5.24 8.91 10.20 N.A 11.11 8.29 0.45 759.20 10.71
L&T Resurgent India Corporate Bond F - Reg - G 11.23 02-Feb-2015 359.33 7.91 7.57 7.52 7.98 10.07 N.A 9.65 13.48 0.19 2168.11 9.44
BOI AXA Corporate Credit Spectrum F - Reg - G 11.12 27-Feb-2015 348.03 2.39 4.04 7.37 8.96 9.77 N.A 9.32 6.67 0.31 963.60 12.46
SBI Corporate Bond Fund - Growth 24.08 19-Jul-2004 580.92 6.31 4.87 7.82 8.87 9.73 10.38 7.73 7.88 0.37 1189.90 9.65
HDFC Corporate Debt Opportunities F - Reg - G 12.40 25-Mar-2014 6084.78 4.84 3.54 6.70 9.19 9.53 N.A 10.69 9.82 0.32 1215.45 10.14
UTI Banking & PSU Debt Fund - Reg - G 12.21 03-Feb-2014 533.68 7.44 6.53 7.64 9.85 9.46 N.A 9.25 4.62 0.39 803.11 7.80
Returns (%) Risk Average Yield tillScheme Name NAV Launch QAAUM Since Std. Sharpe Maturity (Days) Maturity
1W 2W 1M 6M 1Y 3Y(`) Date (`Cr.) Launch Dev.
Kotak Flexi Debt Scheme - Plan A - Reg - G 19.07 27-May-2008 337.03 4.49 5.92 7.16 9.55 9.55 9.18 8.46 17.43 0.13 1058.50 8.55
DSP BlackRock Income Opportunities F - Reg - G 24.73 13-May-2003 2292.50 7.45 4.70 6.41 9.38 9.69 9.60 7.22 8.26 0.34 1211.80 10.12
Birla Sun Life Treasury Optimizer Plan - DAP 177.02 22-Jun-2009 5157.70 8.99 8.54 9.12 9.27 9.28 10.16 8.66 12.64 0.25 2051.30 8.33
ICICI Prudential Banking & PSU Debt F - Ret - G 16.13 06-Sep-2010 3735.30 7.45 6.94 8.33 9.15 9.52 8.59 8.80 11.47 0.22 1649.80 8.16
Birla Sun Life Short Term Opportunities F - Reg - G 25.06 24-Apr-2003 3391.23 7.46 6.95 8.00 9.12 8.86 9.82 7.30 10.01 0.25 2080.50 8.55
HDFC Short Term Plan - Growth 29.87 28-Feb-2002 2390.86 4.60 3.51 6.85 9.01 9.63 9.13 8.02 6.27 0.44 711.75 10.05
Kotak Income Opportunities Fund - Reg - G 16.43 11-May-2010 1247.87 1.43 0.59 4.82 9.01 9.26 9.00 8.64 6.62 0.38 744.60 10.19
Returns (%) Risk Average Yield tillScheme Name NAV Launch QAAUM Since Std. Sharpe Maturity (Days) Maturity
1W 2W 1M 3M 1Y 3Y(`) Date (`Cr.) Launch Dev.
ICICI Prudential Ultra Short Term Plan - Reg - G 15.46 11-Aug-2009 5948.18 6.59 5.24 7.36 10.76 9.13 8.87 6.68 5.80 0.33 865.05 8.15
Baroda Pioneer Treasury Adv.e F - Plan A - G 1753.63 24-Jun-2009 1382.69 7.94 6.72 7.97 10.47 9.13 9.19 8.52 3.04 0.60 441.57 9.48
Birla Sun Life Floating Rate F - LTP - Ret - G 266.13 05-Jun-2003 1377.55 7.40 6.62 8.14 10.41 8.99 9.21 7.87 3.67 0.50 470.85 8.35
Birla Sun Life Savings Fund - Ret - G 286.14 27-Nov-2001 11854.60 7.61 6.43 7.84 10.37 9.01 9.27 7.55 2.99 0.63 540.20 8.45
IDFC Money Manager - Invest Plan - Plan A - G 23.04 09-Aug-2004 1603.85 3.94 2.95 6.66 9.93 8.60 8.70 7.36 6.22 0.25 704.45 8.19
IDFC Ultra Short Term Fund - Reg - G 21.40 17-Jan-2006 2745.72 6.17 5.18 6.64 9.90 8.72 9.13 7.66 3.45 0.48 354.00 8.08
UTI Floating Rate Fund - STP - Growth 2467.72 29-Aug-2003 5046.14 6.20 5.22 6.97 9.85 8.66 8.95 7.38 3.13 0.46 443.88 8.88
Returns (%) Risk Market Cap (%)
Scheme Name NAV Launch QAAUM 3M 6M 1Y 3Y Since Std.Dev Beta Jenson LARGE MID SMALL DEBT &
(`) Date (` Cr.) Launch CAP CAP CAP OTHER
Sundaram Rural India Fund - Reg - G 27.92 12-May-2006 476.33 11.18 9.11 11.34 19.75 10.83 2.54 0.96 0.30 47.48 27.14 8.80 16.58
SBI Small & Midcap Fund - Growth 32.79 09-Sep-2009 706.33 5.19 2.38 9.06 37.69 19.53 2.70 0.78 0.59 N.A 48.72 45.20 6.08
DSP BlackRock Micro Cap Fund - Reg - G 43.18 14-Jun-2007 2213.86 9.29 3.63 8.62 40.56 17.87 2.96 0.93 0.59 N.A 64.32 29.46 6.21
SBI Magnum Midcap Fund - Growth 61.49 29-Mar-2005 1480.43 6.68 4.32 7.48 33.64 17.76 2.47 0.82 0.45 8.00 74.59 8.47 8.93
Reliance Small Cap Fund - Growth 25.48 16-Sep-2010 1831.89 4.24 -2.95 6.68 38.26 18.04 3.15 1.01 0.49 5.88 42.99 42.98 8.15
Mirae Asset Emerging Bluechip Fund - G 30.69 09-Jul-2010 1198.65 5.15 0.41 5.50 32.24 21.22 2.60 0.92 0.43 32.86 58.55 3.23 5.36
Birla Sun Life Pure Value Fund - Growth 38.74 27-Mar-2008 393.00 6.25 1.55 5.09 31.13 18.17 3.50 1.17 0.36 29.99 54.42 8.02 7.57
Note: Indicative corpus are including Growth & Dividend option. The above mentioned data is on the basis of 05/05/2016Beta, Sharpe and Standard Deviation are calculated on the basis of period: 1 year, frequency: Weekly Friday, RF: 7%
Annualised
18
MUTUAL FUND Performance Charts
EQUITY (Diversified)
INCOME FUND
ULTRA SHORT TERM
SHORT TERM FUND
Due to their inherent long term nature, the following 3 categories have been sorted on the basis of 1 year returns
Due to their inherent short term nature, Short term funds and Ultra short term funds have been sorted on the basis of 6month and 3month returns respectively
Annualised
®
BALANCED
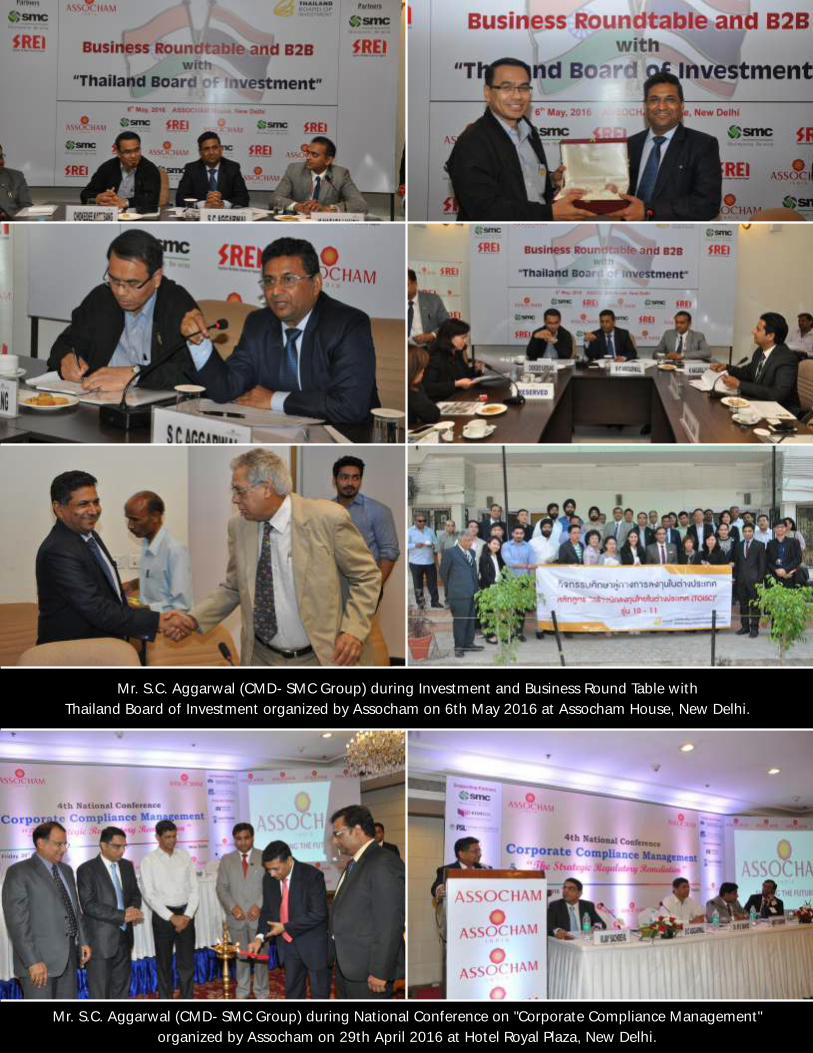
Mr. S.C. Aggarwal (CMD- SMC Group) during Investment and Business Round Table with
Thailand Board of Investment organized by Assocham on 6th May 2016 at Assocham House, New Delhi.
Mr. S.C. Aggarwal (CMD- SMC Group) during National Conference on "Corporate Compliance Management"
organized by Assocham on 29th April 2016 at Hotel Royal Plaza, New Delhi.


![[Econ] PPT by Kittycolz -- Pure Competition McConnel 16th-19th Edition](https://img.pdfslide.net/doc/110x75/58aafdc81a28abd35e8b5513/econ-ppt-by-kittycolz-pure-competition-mcconnel-16th-19th-edition.jpg)