Embed Size (px)
Citation preview
Chelmsford City Council
LAQM Annual Status Report 2017
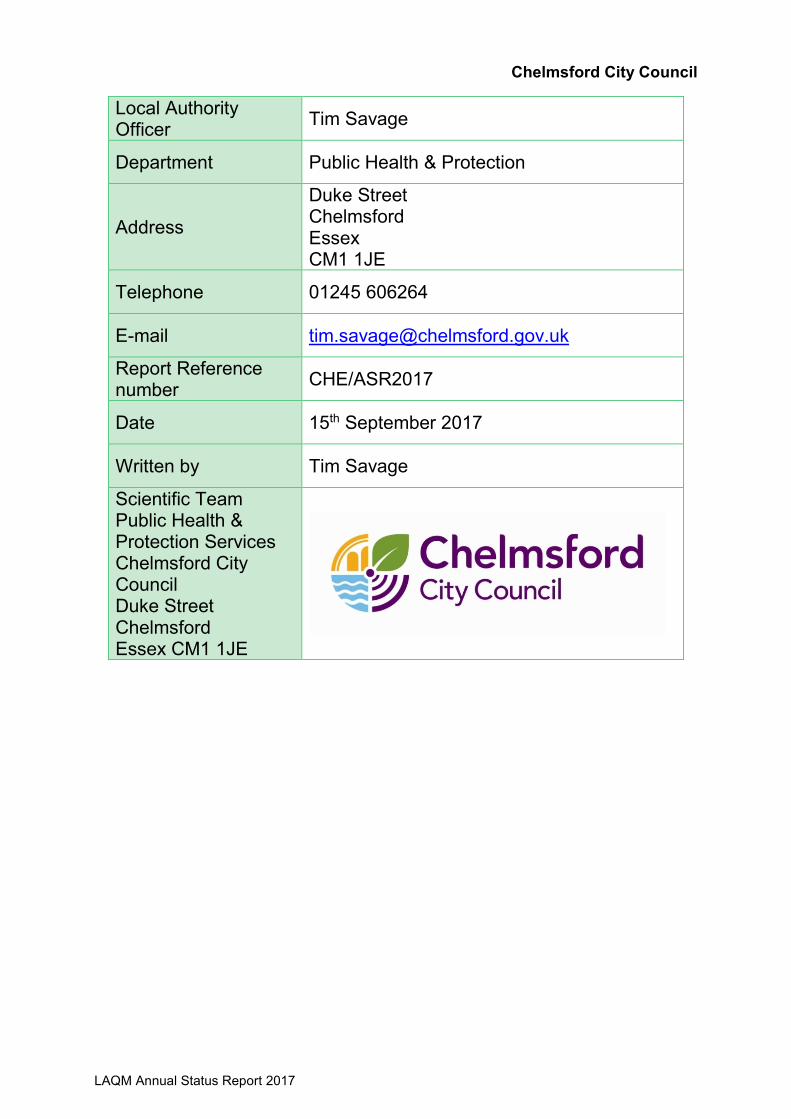
2017 Air Quality Annual Status Report (ASR) In fulfilment of Part IV of the Environment Act 1995 Local Air Quality Management September 2017
Chelmsford City Council
LAQM Annual Status Report 2017
Local Authority Officer
Tim Savage
Department Public Health & Protection
Address
Duke Street Chelmsford Essex CM1 1JE
Telephone 01245 606264
E-mail [email protected]
Report Reference number
CHE/ASR2017
Date 15th September 2017
Written by Tim Savage
Scientific Team Public Health & Protection Services Chelmsford City Council Duke Street Chelmsford Essex CM1 1JE
Chelmsford City Council
i LAQM Annual Status Report 2017
Executive Summary: Air Quality in Our Area
This 2017 Annual Status Report is designed to provide the public with information
relating to local air quality in Chelmsford, to fulfil Chelmsford City Council’s statutory
duty to review and assess air quality within its area, and to determine whether or not
the air quality objectives are likely to be achieved.
In 2017, all Air Quality Objectives were achieved in Chelmsford.
Air Quality in Chelmsford
Air pollution is associated with a number of adverse health impacts. It is recognised as
a contributing factor in the onset of heart disease and cancer. Additionally, air pollution
particularly affects the most vulnerable in society: children and older people, and those
with heart and lung conditions. There is also often a strong correlation with equality
issues, because areas with poor air quality are also often the less affluent areas1,2.
The annual health cost to society of the impacts of particulate matter alone in the UK
is estimated to be around £16 billion3.
Chelmsford is located in mid Essex, thirty-one miles from London and has a population
of over 168,310 (2011 census), largely living in the main urban areas of Chelmsford
and South Woodham Ferrers. The City of Chelmsford comprises of a number of
suburban areas surrounding the main urban areas and the larger rural villages of
Danbury, East and West Hanningfield, Great Leighs, Little Waltham and Little Baddow.
The main source of air pollution in Chelmsford is road traffic emissions from major
roads, notably the A12, A414, A138, A130 and B1016
Chelmsford City Council has declared one Air Quality Management Area (AQMA) at
the Army and Navy roundabout and surrounding roads which is detailed in Table 2.1.
In 2016, the Council measured no exceedances of the air quality objectives at relevant
exposure.
1 Environmental equity, air quality, socioeconomic status and respiratory health, 2010 2 Air quality and social deprivation in the UK: an environmental inequalities analysis, 2006 3 Defra. Abatement cost guidance for valuing changes in air quality, May 2013
Chelmsford City Council
ii LAQM Annual Status Report 2017
Actions to Improve Air Quality
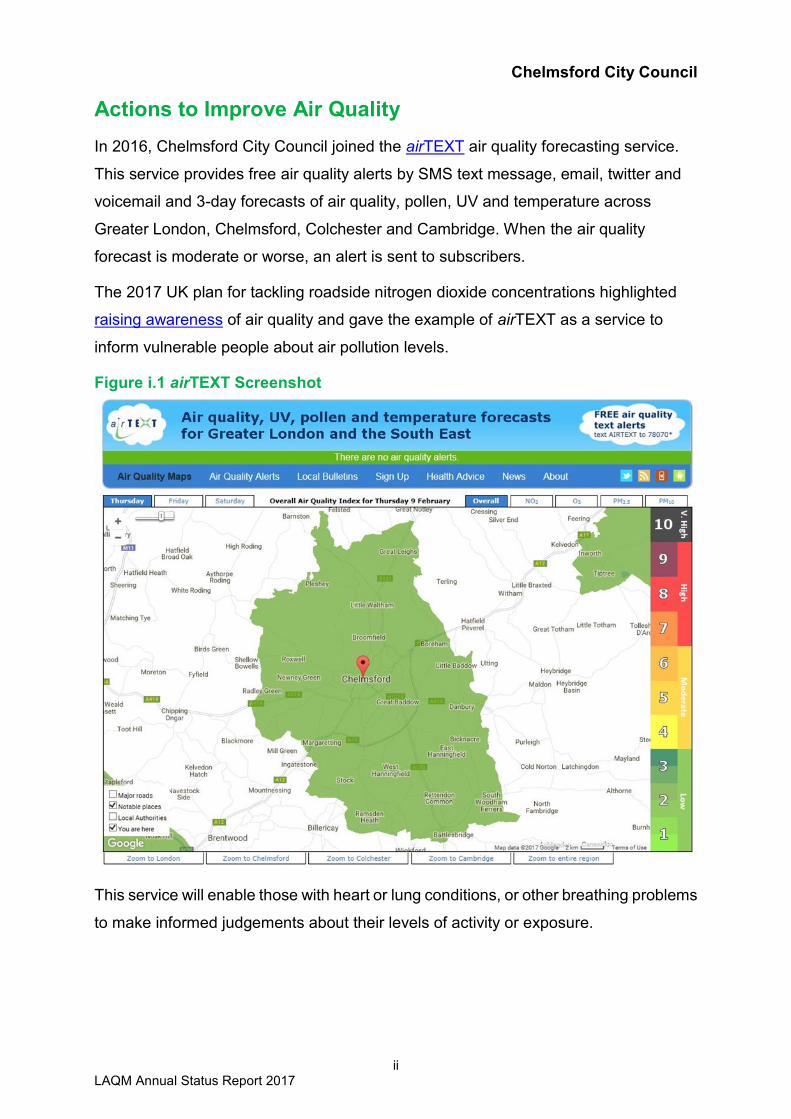
In 2016, Chelmsford City Council joined the airTEXT air quality forecasting service.
This service provides free air quality alerts by SMS text message, email, twitter and
voicemail and 3-day forecasts of air quality, pollen, UV and temperature across
Greater London, Chelmsford, Colchester and Cambridge. When the air quality
forecast is moderate or worse, an alert is sent to subscribers.
The 2017 UK plan for tackling roadside nitrogen dioxide concentrations highlighted
raising awareness of air quality and gave the example of airTEXT as a service to
inform vulnerable people about air pollution levels.
Figure i.1 airTEXT Screenshot
This service will enable those with heart or lung conditions, or other breathing problems
to make informed judgements about their levels of activity or exposure.
Chelmsford City Council
iii LAQM Annual Status Report 2017
Conclusions and Priorities
Chelmsford City Council has found that on average, measured concentrations of
Nitrogen Dioxide in 2016 increased by 5% from 2015. Monitoring data from four other
local authorities in Essex has identified similar increases of between 4 and 10%.
It is important to view air quality over the long term as meteorological variation can
influence pollutant concentrations significantly. The increases in 2016 alone do not
indicate an upwards trend.
Army and Navy AQMA
In 2016, all monitored locations within the AQMA were found to achieve the Air Quality
Objectives for Nitrogen Dioxide (NO2). It is essential that pollutant concentrations
remain below the threshold to ensure that exposure to poor air quality does not occur.
A414 Danbury Pollution Hotspot
Traffic modelling identified that congestion will increase along the A414 corridor as a
result of growth and development taking place in the neighbouring borough of Maldon.
Chelmsford City Council monitors air quality along the A414 in Danbury and there is a
small pollution hotspot where concentrations of Nitrogen Dioxide (NO2) are borderline
with the Air Quality Objectives. A scheme to improve traffic flow on the A414 through
the centre of Danbury at peak times has been completed however, it appears that a
combination of traffic management work further along the A414 and increased traffic
volumes may have contributed to the marked increase in pollution measured in 2016.
Springfield Road Pollution Hotspot
The crossroads junction of Springfield Road and Victoria Road is a congestion hotspot
and the Council monitors air quality on all four road-links entering the junction.
A small section of Springfield Road west of the junction up to Trinity Road has buildings
flanking the road creating a canyon-like environment. This ‘street canyon’ reduces the
dispersion of pollution generated by traffic. Vehicles queue down to the traffic lights
and monitoring has found that air quality in this section of road is borderline with the
Air Quality Objectives.
The Council has extended the coverage of air quality monitoring in this area and Essex
County Council plans to refurbish the junction in 2017.

Chelmsford City Council
iv LAQM Annual Status Report 2017
Local Engagement and How to get Involved
Residents and visitors to Chelmsford are encouraged to sign up to airTEXT for free air
quality alerts by SMS text message, email, @airtext_chelm on twitter and voicemail.
The service also provides 3-day forecasts of air quality, pollen, UV and temperature. It
is possible to sign up by visiting airTEXT.info/signup or by texting airTEXT to 78070.
There is also a free airTEXT smart phone app that gives users forecasts for pollution,
UV, grass pollen and temperature. This app is available for iPhones and Android
smartphones.
Chelmsford City Council is a member of the Essex Air Quality consortium. The purpose
of Essex Air is to promote improvements in air quality related issues. The Essex Air
web site provides a daily forecast of air pollution. Also, the @EssexAir twitter feed
provides localised weekly air pollution forecasts.
Figure i.2 - Essex Air Twitter Air Quality Notifications
Links to Defra recommended actions and health advice are provided when air pollution
is likely to be moderate or higher. This will enable those with heart or lung conditions,
Chelmsford City Council
v LAQM Annual Status Report 2017
or other breathing problems to make informed judgements about their levels of activity
or exposure.
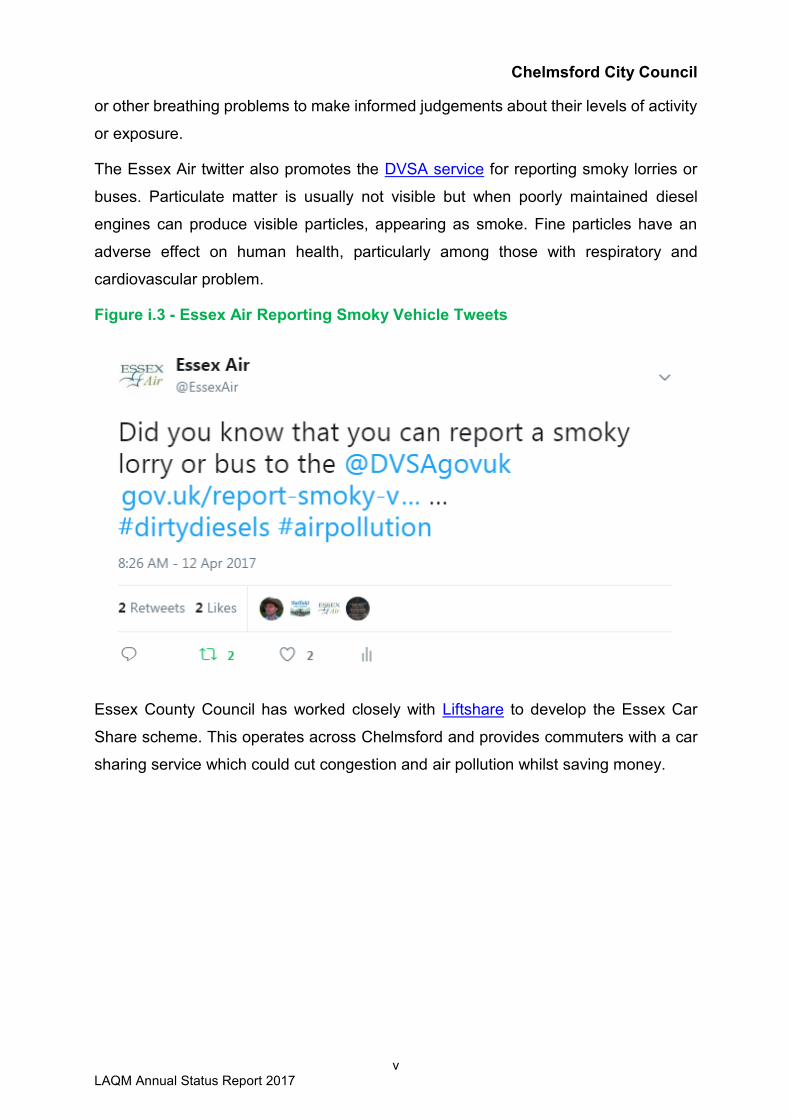
The Essex Air twitter also promotes the DVSA service for reporting smoky lorries or
buses. Particulate matter is usually not visible but when poorly maintained diesel
engines can produce visible particles, appearing as smoke. Fine particles have an
adverse effect on human health, particularly among those with respiratory and
cardiovascular problem.
Figure i.3 - Essex Air Reporting Smoky Vehicle Tweets
Essex County Council has worked closely with Liftshare to develop the Essex Car
Share scheme. This operates across Chelmsford and provides commuters with a car
sharing service which could cut congestion and air pollution whilst saving money.
Chelmsford City Council
vi LAQM Annual Status Report 2017
Table of Contents
Executive Summary: Air Quality in Our Area .......................................................... i
Air Quality in Chelmsford .................................................................................................... i
Actions to Improve Air Quality ............................................................................................ ii
Conclusions and Priorities ................................................................................................ iii
Local Engagement and How to get Involved ..................................................................... iv
1 Local Air Quality Management ........................................................................ 1
2 Actions to Improve Air Quality ........................................................................ 2
2.1 Air Quality Management Areas .............................................................................. 2
2.2 Progress and Impact of Measures to address Air Quality in Chelmsford ............... 3
2.3 PM2.5 – Local Authority Approach to Reducing Emissions and or
Concentrations.................................................................................................................. 6
3 Air Quality Monitoring Data and Comparison with Air Quality
Objectives and National Compliance ...................................................................... 7
3.1 Summary of Monitoring Undertaken ...................................................................... 7
3.1.1.1 Automatic Monitoring Sites ............................................................................................ 7
3.1.1.2 Non-Automatic Monitoring Sites..................................................................................... 7
3.2 Individual Pollutants .............................................................................................. 7
3.2.1 Nitrogen Dioxide (NO2)................................................................................................... 7
3.2.2 Particulate Matter (PM10) ................................................................................................ 8
3.2.3 Ozone (O3) ..................................................................................................................... 8
Appendix A: Monitoring Results ............................................................................. 9
Appendix B: Full Monthly Diffusion Tube Results for 2016 ................................ 20
Appendix C: Trend Data ......................................................................................... 24
Appendix D: Supporting Technical Information / Air Quality Monitoring
Data QA/QC ............................................................................................................. 27
Appendix E: Map of Monitoring Locations ........................................................... 29
Appendix F: Summary of Air Quality Objectives in England .............................. 33
Appendix G: AQMA Order ...................................................................................... 34
Glossary of Terms .................................................................................................. 36
References .............................................................................................................. 37
Chelmsford City Council
vii LAQM Annual Status Report 2017
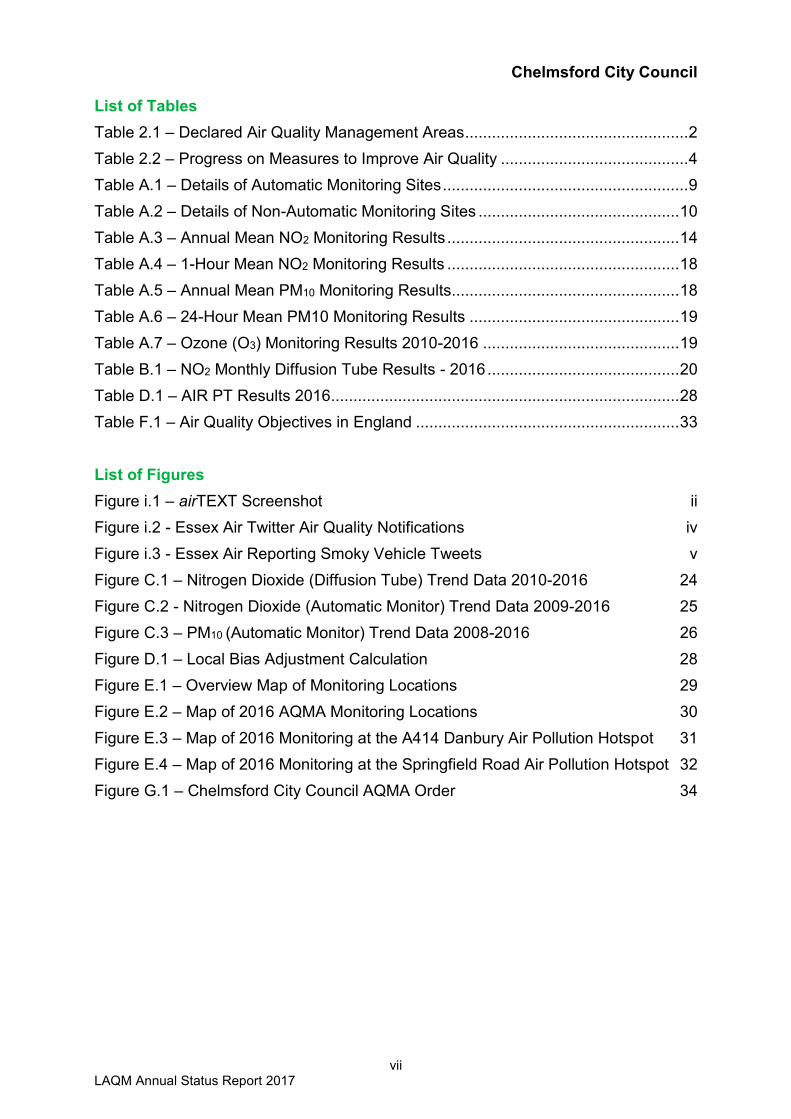
List of Tables
Table 2.1 – Declared Air Quality Management Areas .................................................. 2
Table 2.2 – Progress on Measures to Improve Air Quality .......................................... 4
Table A.1 – Details of Automatic Monitoring Sites ....................................................... 9
Table A.2 – Details of Non-Automatic Monitoring Sites ............................................. 10
Table A.3 – Annual Mean NO2 Monitoring Results .................................................... 14
Table A.4 – 1-Hour Mean NO2 Monitoring Results .................................................... 18
Table A.5 – Annual Mean PM10 Monitoring Results................................................... 18
Table A.6 – 24-Hour Mean PM10 Monitoring Results ............................................... 19
Table A.7 – Ozone (O3) Monitoring Results 2010-2016 ............................................ 19
Table B.1 – NO2 Monthly Diffusion Tube Results - 2016 ........................................... 20
Table D.1 – AIR PT Results 2016 .............................................................................. 28
Table F.1 – Air Quality Objectives in England ........................................................... 33
List of Figures
Figure i.1 – airTEXT Screenshot ii
Figure i.2 - Essex Air Twitter Air Quality Notifications iv
Figure i.3 - Essex Air Reporting Smoky Vehicle Tweets v
Figure C.1 – Nitrogen Dioxide (Diffusion Tube) Trend Data 2010-2016 24
Figure C.2 - Nitrogen Dioxide (Automatic Monitor) Trend Data 2009-2016 25
Figure C.3 – PM10 (Automatic Monitor) Trend Data 2008-2016 26
Figure D.1 – Local Bias Adjustment Calculation 28
Figure E.1 – Overview Map of Monitoring Locations 29
Figure E.2 – Map of 2016 AQMA Monitoring Locations 30
Figure E.3 – Map of 2016 Monitoring at the A414 Danbury Air Pollution Hotspot 31
Figure E.4 – Map of 2016 Monitoring at the Springfield Road Air Pollution Hotspot 32
Figure G.1 – Chelmsford City Council AQMA Order 34
Chelmsford City Council
1 LAQM Annual Status Report 2017
1 Local Air Quality Management
This report provides an overview of air quality in Chelmsford during 2016. It fulfils the
requirements of Local Air Quality Management (LAQM) as set out in Part IV of the
Environment Act (1995) and the relevant Policy and Technical Guidance documents.
The LAQM process places an obligation on all local authorities to regularly review and
assess air quality in their areas, and to determine whether or not the air quality
objectives are likely to be achieved. Where an exceedance is considered likely the
local authority must declare an Air Quality Management Area (AQMA) and prepare an
Air Quality Action Plan (AQAP) setting out the measures it intends to put in place in
pursuit of the objectives. This Annual Status Report (ASR) is an annual requirement
showing the strategies employed by Chelmsford City Council to improve air quality and
any progress that has been made.
The statutory air quality objectives applicable to LAQM in England can be found in
Table F.1 in Appendix F.

Chelmsford City Council
2 LAQM Annual Status Report 2017
2 Actions to Improve Air Quality
2.1 Air Quality Management Areas
Air Quality Management Areas (AQMAs) are declared when there is an exceedance or likely exceedance of an air quality objective.
After declaration, the authority must prepare an Air Quality Action Plan (AQAP) within 12-18 months setting out measures it intends
to put in place in pursuit of the objectives.
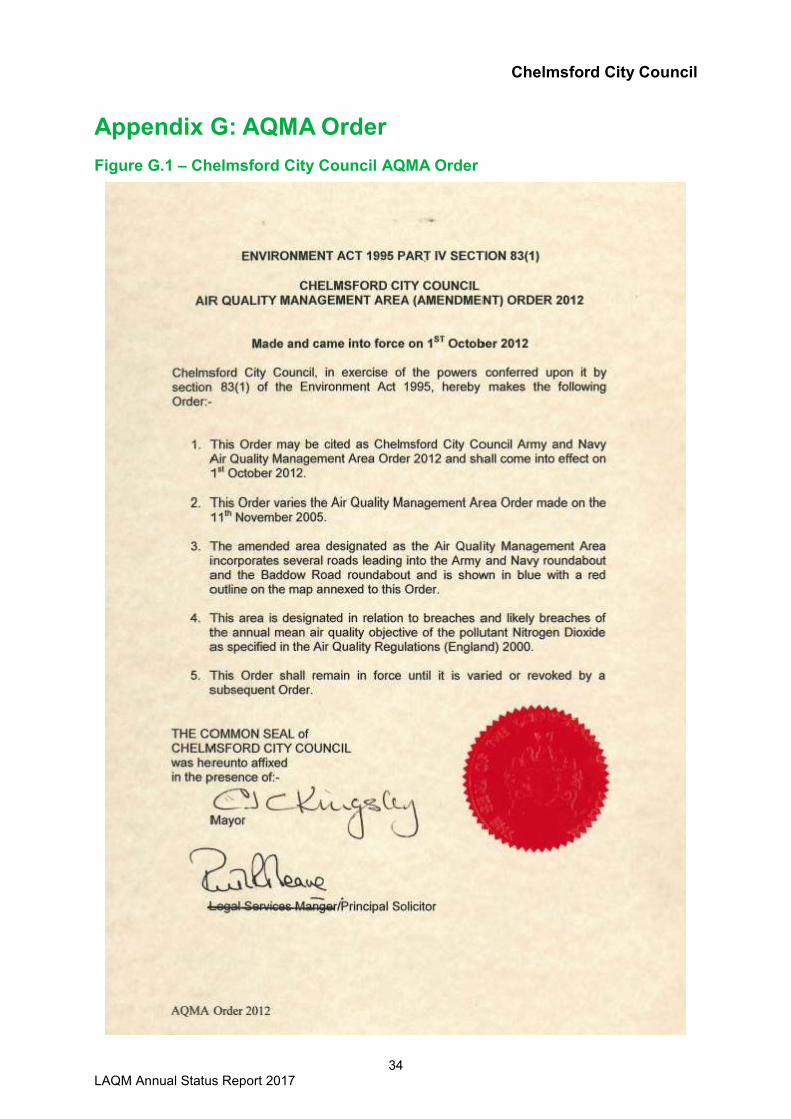
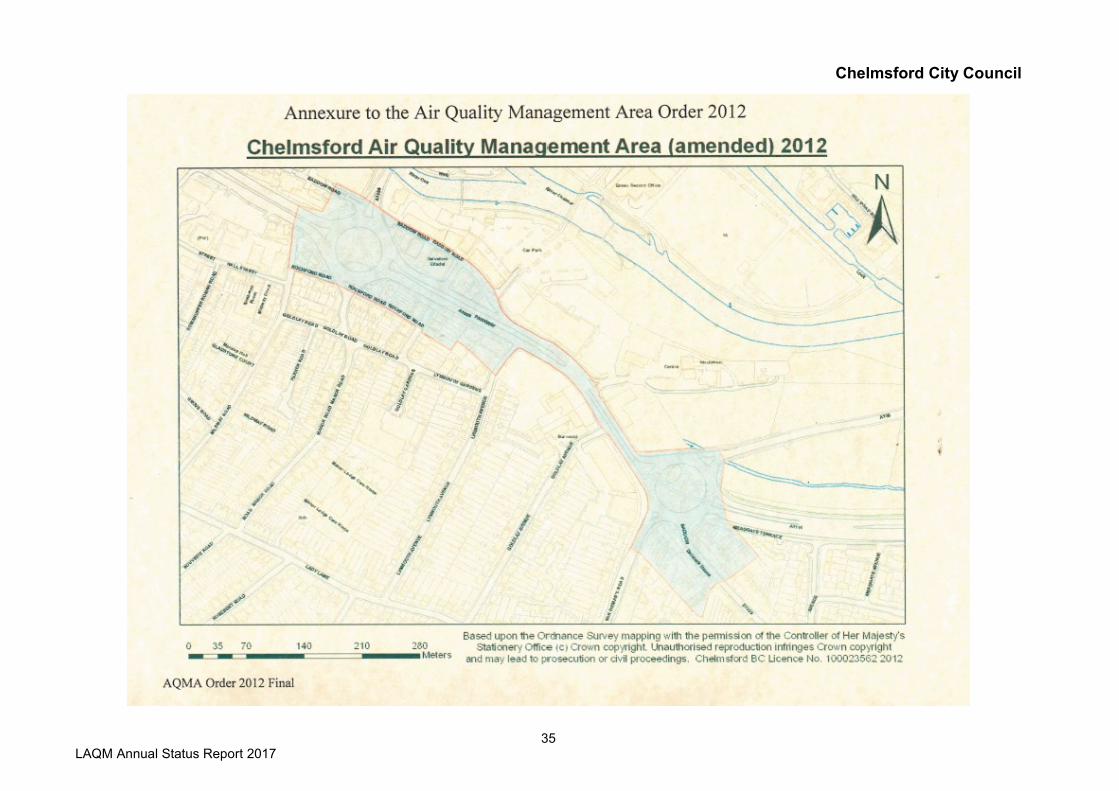
A summary of AQMAs declared by Chelmsford City Council can be found in Table 2.1 with a copy of the AQMA order in Appendix G.
Further information related to declared or revoked AQMAs are available online at: https://uk-
air.defra.gov.uk/aqma/details?aqma_id=900
Table 2.1 – Declared Air Quality Management Areas
AQMA Name
Date of Declaration
Pollutants and Air Quality
Objectives
City / Town
One Line Description
Is air quality in the AQMA
influenced by roads
controlled by Highways England?
Level of Exceedance (maximum monitored/modelled concentration at a location of relevant exposure)
Action Plan (2005)
At Declaration Now
Army &
Navy AQMA
Declared 01/12/2005, Amended 1/10/2012
NO2 Annual Mean
Chelmsford
Army & Navy
Roundabout and
surrounding roads
NO 51.3µg/m3 36.59µg/m3
Air Quality Action Plan Army & Navy AQMA (July
2008)
☒ Chelmsford City Council confirm the information on UK-Air regarding their AQMA(s) is up to date
Chelmsford City Council
3 LAQM Annual Status Report 2017
2.2 Progress and Impact of Measures to address Air Quality in Chelmsford
Chelmsford City Council has taken forward a number of measures during the current
reporting year of 2016 in pursuit of improving local air quality. Details of all measures
completed, in progress or planned are set out in Table 2.2.
Chelmsford City Council’s priorities for the coming year are:
• Increased air quality monitoring in the vicinity of the Danbury A414 air pollution
hotspot. Additional diffusion tube monitoring locations will be added in and
around the air pollution hotspot
• Assessment of a number of forthcoming planning and development proposals
that have the potential to affect the Danbury A414 air pollution hotspot
• Monitoring Air Quality in the vicinity of the Springfield Road and Victoria Road
junction
• Development and inclusion of air quality policies within the new Local Plan

Chelmsford City Council
4 LAQM Annual Status Report 2017
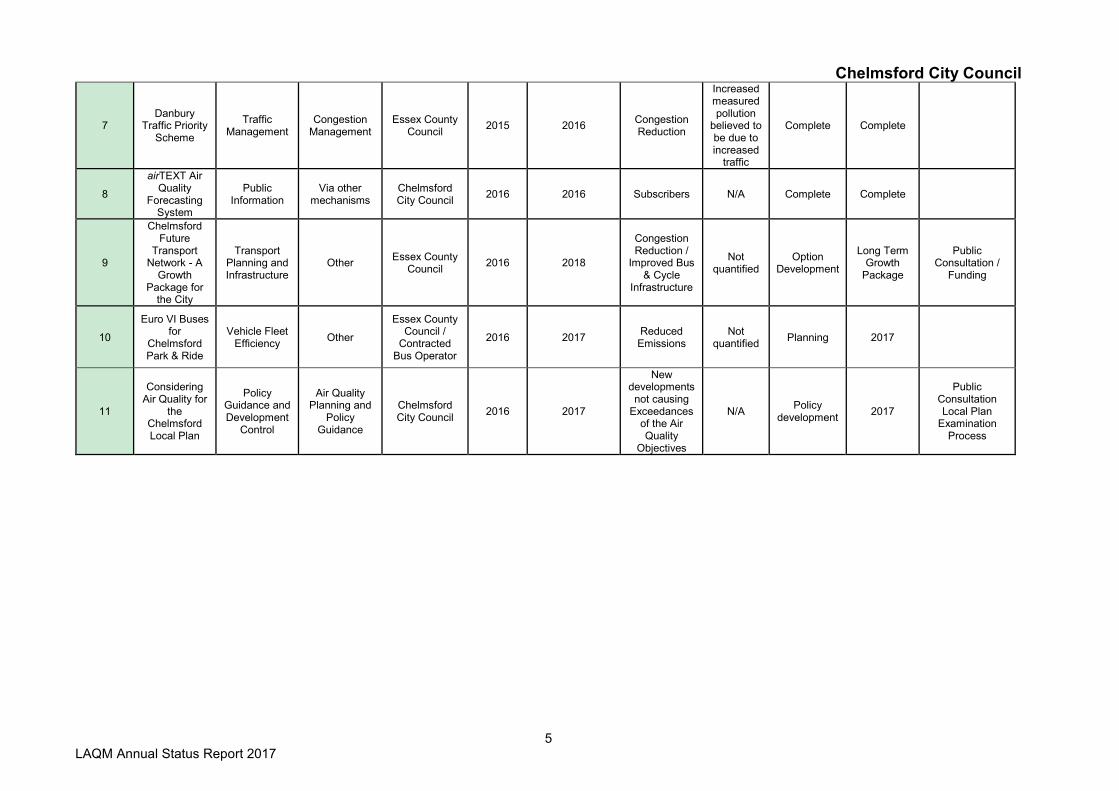
Table 2.2 – Progress on Measures to Improve Air Quality
Measure No.
Measure EU Category EU
Classification
Organisations involved and
Funding Source
Planning Phase
Implementation Phase
Key Performance
Indicator
Reduction in
Pollutant / Emission
from Measure
Progress to Date
Estimated / Actual
Completion Date
Comments / Barriers to
implementation
1 Essex
Liftshare
Alternatives to private vehicle
use
Car & lift sharing
schemes
Essex County Council
N/A 2014 Number of
Users Not
quantified Ongoing
Ongoing Measure
2 Member of Essex Air
Policy Guidance and Development
Control
Regional Groups Co-ordinating
programmes to develop Area wide
Strategies to reduce
emissions and improve air
quality
Essex Air N/A N/A N/A N/A Ongoing Ongoing Measure
3
Environmental Permit
Inspection & Enforcement
Environmental Permits
Measures to reduce
pollution through IPPC Permits going beyond BAT
Chelmsford City Council
N/A N/A
Operator compliance
with Environmental
Permit
N/A Ongoing N/A
4 Parkway
Pinch Point Removal
Traffic Management
Strategic Highway
Improvements
Essex County Council
2012 2013 Monitored Air
Quality Not
quantified Complete Complete
5
Extended left turn slip lane on Parkway / Army & Navy
Traffic Management
Strategic Highway
Improvements
Essex County Council
2012 2014 Monitored Air
Quality Not
quantified Complete Complete
6 Replacement
Chelmer Viaduct
Traffic Management
Strategic Highway
Improvements Highways England
2012 2015 Monitored Air
Quality Not
quantified Complete Complete
Transport Planning and Infrastructure
Cycle network
Chelmsford City Council
5 LAQM Annual Status Report 2017
7 Danbury
Traffic Priority Scheme
Traffic Management
Congestion Management
Essex County Council
2015 2016 Congestion Reduction
Increased measured pollution
believed to be due to increased
traffic
Complete Complete
8
airTEXT Air Quality
Forecasting System
Public Information
Via other mechanisms
Chelmsford City Council
2016 2016 Subscribers N/A Complete Complete
9
Chelmsford Future
Transport Network - A
Growth Package for
the City
Transport Planning and Infrastructure
Other Essex County
Council 2016 2018
Congestion Reduction /
Improved Bus & Cycle
Infrastructure
Not quantified
Option Development
Long Term Growth
Package
Public Consultation /
Funding
10
Euro VI Buses for
Chelmsford Park & Ride
Vehicle Fleet Efficiency
Other
Essex County Council /
Contracted Bus Operator
2016 2017 Reduced Emissions
Not quantified
Planning 2017
11
Considering Air Quality for
the Chelmsford Local Plan
Policy Guidance and Development
Control
Air Quality Planning and
Policy Guidance
Chelmsford City Council
2016 2017
New developments not causing
Exceedances of the Air Quality
Objectives
N/A Policy
development 2017
Public Consultation Local Plan
Examination Process
Chelmsford City Council
6 LAQM Annual Status Report 2017
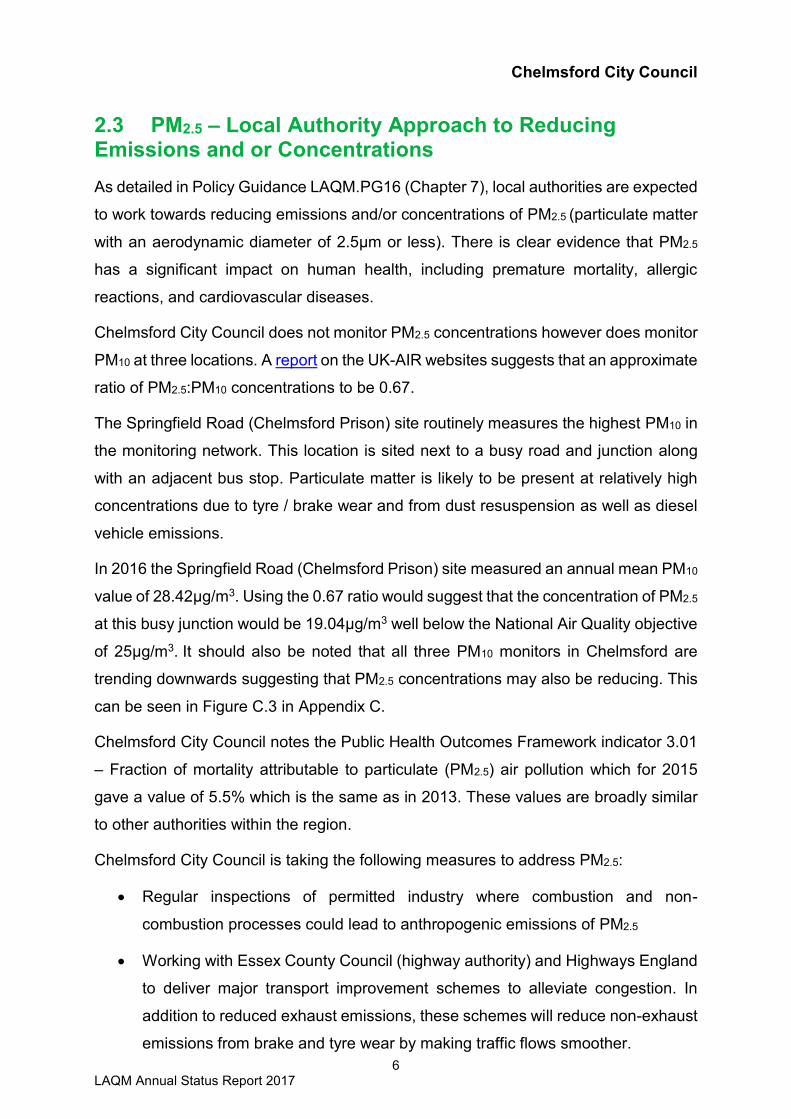
2.3 PM2.5 – Local Authority Approach to Reducing Emissions and or Concentrations
As detailed in Policy Guidance LAQM.PG16 (Chapter 7), local authorities are expected
to work towards reducing emissions and/or concentrations of PM2.5 (particulate matter
with an aerodynamic diameter of 2.5µm or less). There is clear evidence that PM2.5
has a significant impact on human health, including premature mortality, allergic
reactions, and cardiovascular diseases.
Chelmsford City Council does not monitor PM2.5 concentrations however does monitor
PM10 at three locations. A report on the UK-AIR websites suggests that an approximate
ratio of PM2.5:PM10 concentrations to be 0.67.
The Springfield Road (Chelmsford Prison) site routinely measures the highest PM10 in
the monitoring network. This location is sited next to a busy road and junction along
with an adjacent bus stop. Particulate matter is likely to be present at relatively high
concentrations due to tyre / brake wear and from dust resuspension as well as diesel
vehicle emissions.
In 2016 the Springfield Road (Chelmsford Prison) site measured an annual mean PM10
value of 28.42µg/m3. Using the 0.67 ratio would suggest that the concentration of PM2.5
at this busy junction would be 19.04µg/m3 well below the National Air Quality objective
of 25µg/m3. It should also be noted that all three PM10 monitors in Chelmsford are
trending downwards suggesting that PM2.5 concentrations may also be reducing. This
can be seen in Figure C.3 in Appendix C.
Chelmsford City Council notes the Public Health Outcomes Framework indicator 3.01
– Fraction of mortality attributable to particulate (PM2.5) air pollution which for 2015
gave a value of 5.5% which is the same as in 2013. These values are broadly similar
to other authorities within the region.
Chelmsford City Council is taking the following measures to address PM2.5:
• Regular inspections of permitted industry where combustion and non-
combustion processes could lead to anthropogenic emissions of PM2.5
• Working with Essex County Council (highway authority) and Highways England
to deliver major transport improvement schemes to alleviate congestion. In
addition to reduced exhaust emissions, these schemes will reduce non-exhaust
emissions from brake and tyre wear by making traffic flows smoother.
Chelmsford City Council
7 LAQM Annual Status Report 2017
3 Air Quality Monitoring Data and Comparison with Air Quality Objectives and National Compliance
3.1 Summary of Monitoring Undertaken
3.1.1.1 Automatic Monitoring Sites
This section sets out what monitoring has taken place and how it compares with
objectives.
Chelmsford City Council undertook automatic (continuous) monitoring at 4 sites during
2016. Table A.1 in Appendix A shows the details of the sites.
Maps showing the location of the monitoring sites are provided in Appendix E. Further
details on how the monitors are calibrated and how the data has been adjusted are
included in Appendix D.
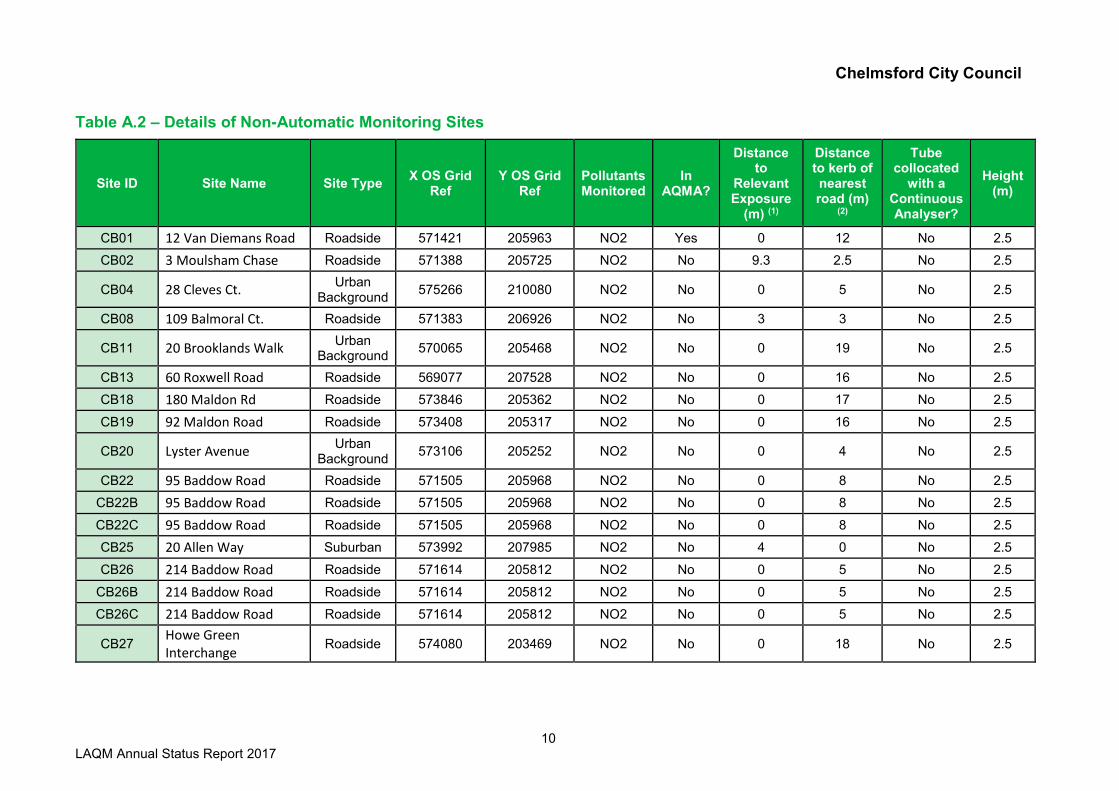
3.1.1.2 Non-Automatic Monitoring Sites
Chelmsford City Council undertook non-automatic (passive) monitoring of NO2 at 52
sites during 2016. Table A.2 in Appendix A provides detail of these sites.
Maps showing the location of the monitoring sites are provided in Appendix E. Further
details on Quality Assurance/Quality Control (QA/QC) and bias adjustment for the
diffusion tubes are included in Appendix D.
3.2 Individual Pollutants
The air quality monitoring results presented in this section are, where relevant,
adjusted for “annualisation” and bias. Further details on adjustments are provided in
Appendix D.
3.2.1 Nitrogen Dioxide (NO2)
Table A.3 in Appendix A compares the ratified and adjusted monitored NO2 annual
mean concentrations for the past 5 years with the air quality objective of 40µg/m3.
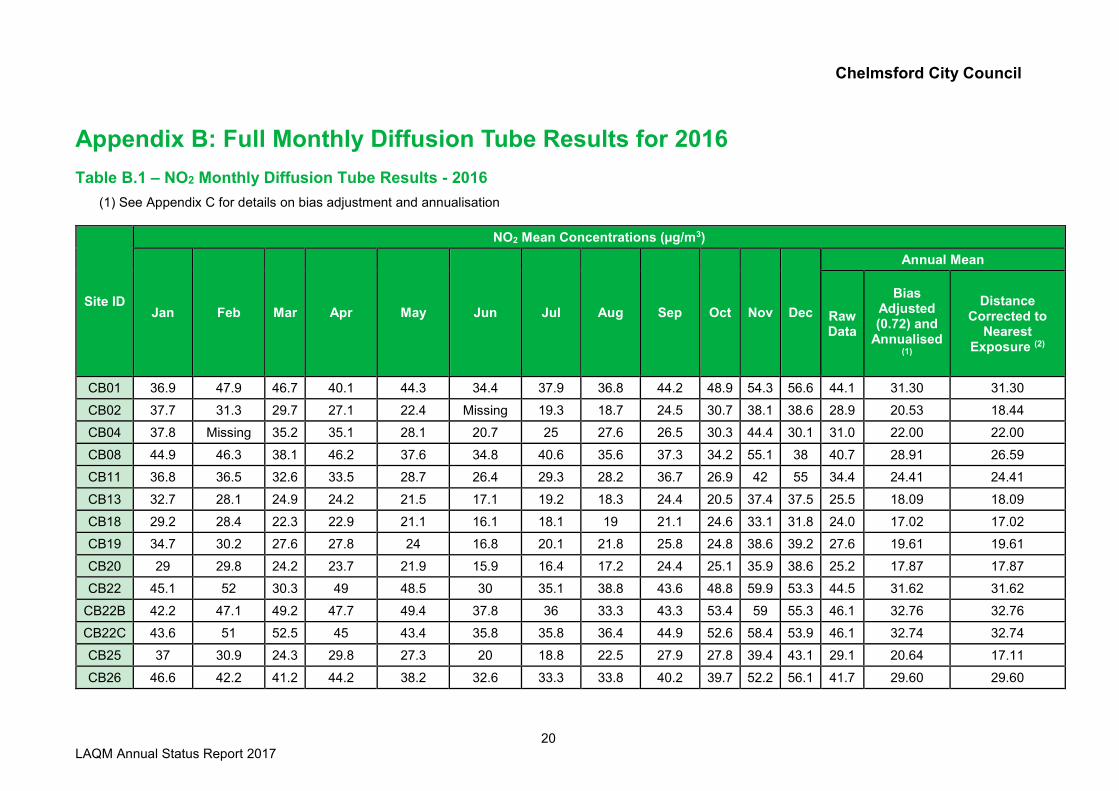
For diffusion tubes, the full 2016 dataset of monthly mean values is provided in
Appendix B. Monitoring has identified that no diffusion tube site has breached the Air
Quality Objectives.
Chelmsford City Council
8 LAQM Annual Status Report 2017
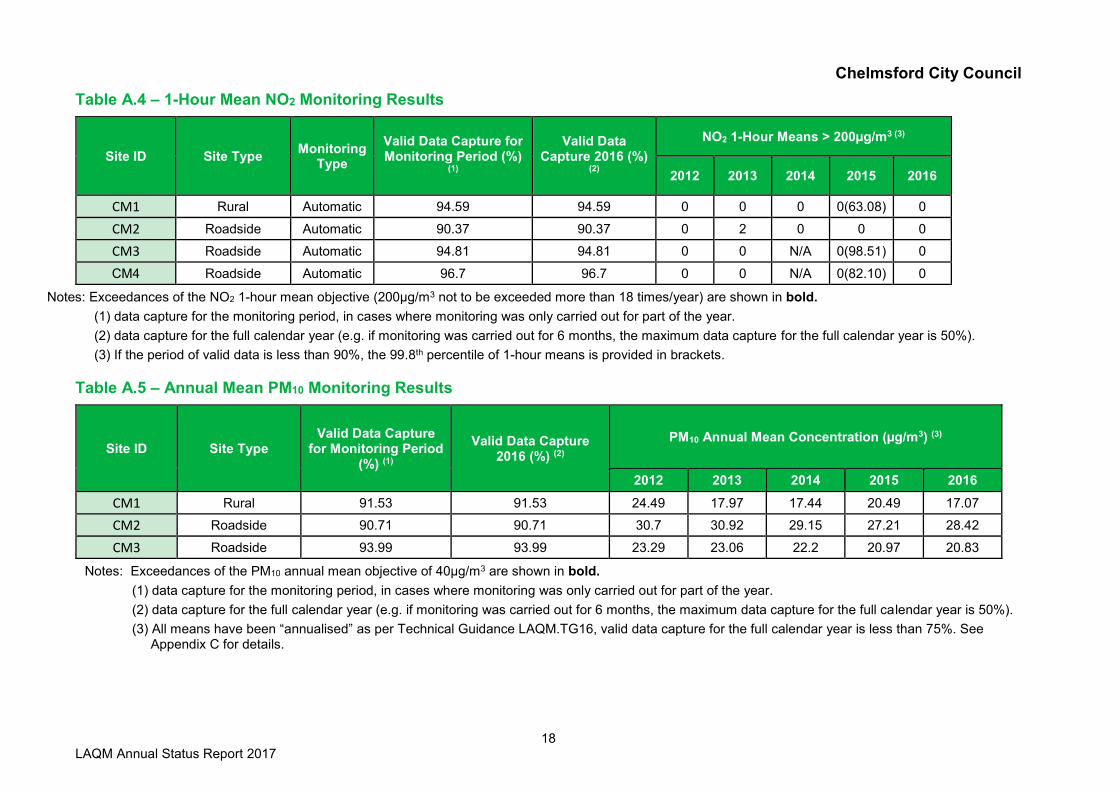
Table A.4 in Appendix A compares the ratified continuous monitored NO2 hourly mean
concentrations for the past 5 years with the Air Quality Objective of 200µg/m3, not to
be exceeded more than 18 times per year.
Chelmsford City Council has not monitored any exceedances of the 1-hour mean
objective. Also, no diffusion tubes have exceeded 60µg/m3 which indicates that there
has been no exceedance of the 1-hour mean objective at these sites either.
3.2.2 Particulate Matter (PM10)
Table A.5 in Appendix A compares the ratified and adjusted monitored PM10 annual
mean concentrations for the past 5 years with the air quality objective of 40µg/m3.
Table A.6 in Appendix A compares the ratified continuous monitored PM10 daily mean
concentrations for the past 5 years with the air quality objective of 50µg/m3, not to be
exceeded more than 35 times per year.
Chelmsford City Council have measured no exceedances of the Air Quality Objective
for PM10.
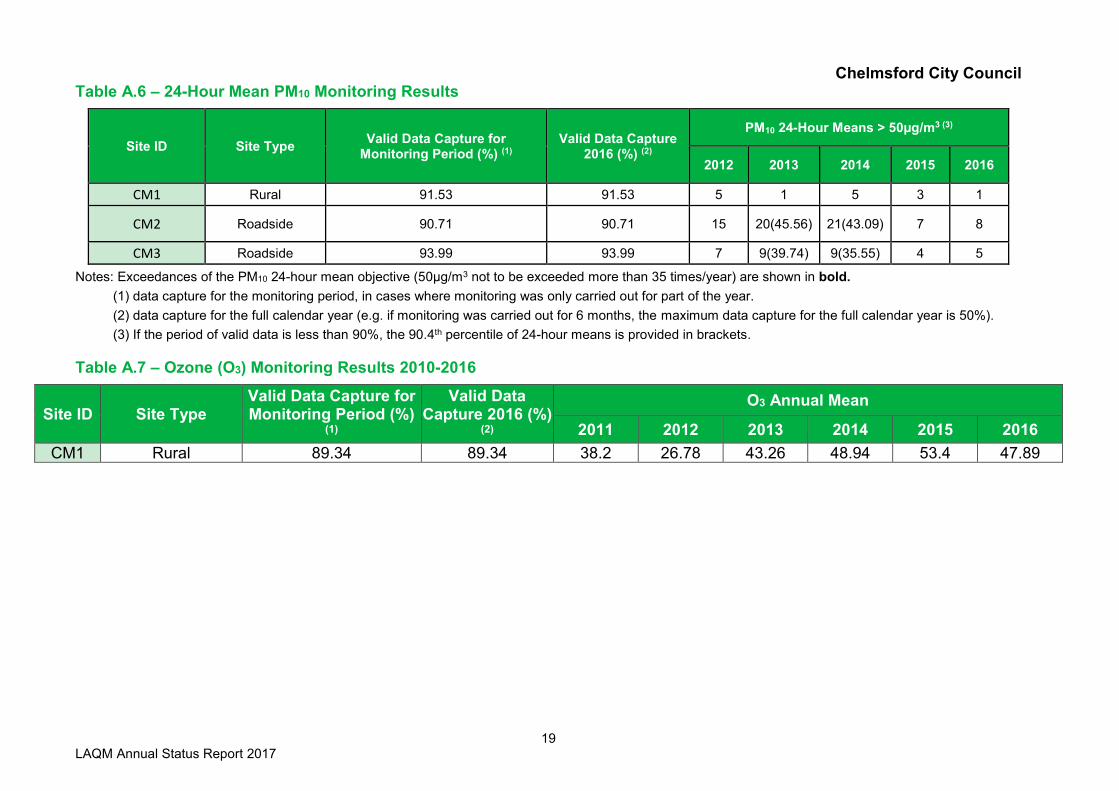
3.2.3 Ozone (O3)
Table A.7 in Appendix A identified the results of Ozone monitoring from 2010 to 2016.
Since 2010, concentrations can be seen to be gradually increasing.
Chelmsford City Council
9 LAQM Annual Status Report 2017
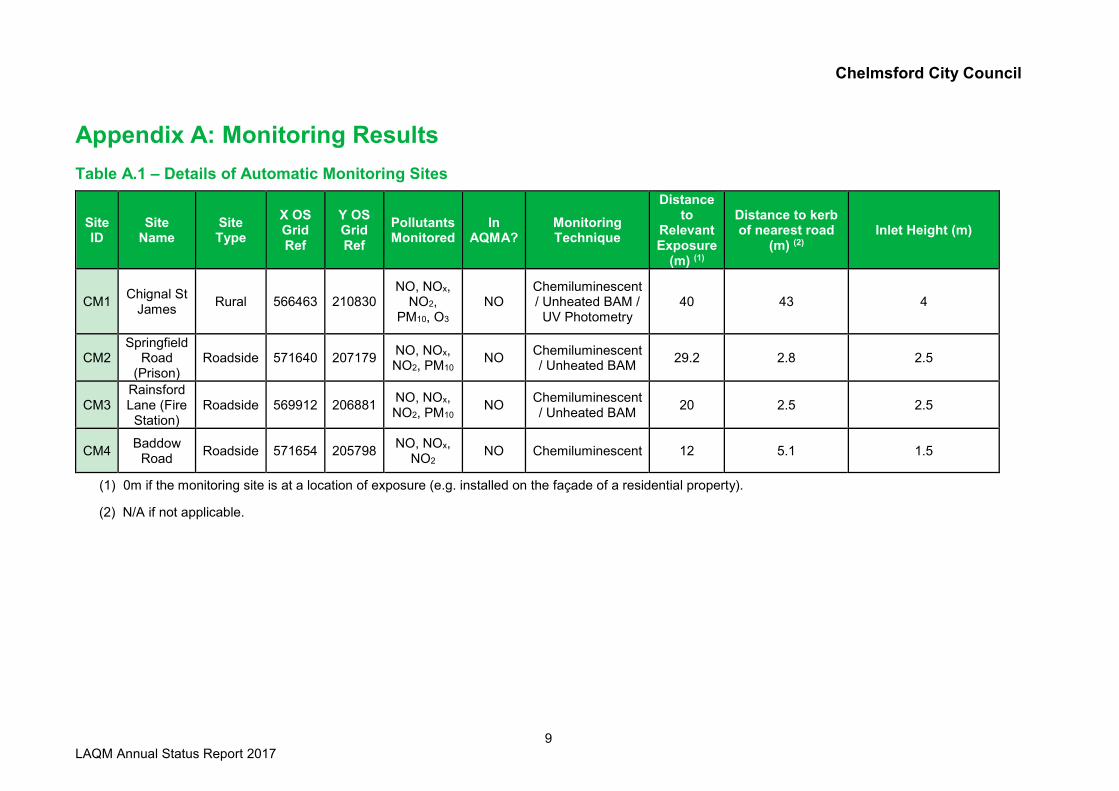
Appendix A: Monitoring Results
Table A.1 – Details of Automatic Monitoring Sites
Site ID
Site Name
Site Type
X OS Grid Ref
Y OS Grid Ref
Pollutants Monitored
In AQMA?
Monitoring Technique
Distance to
Relevant Exposure
(m) (1)
Distance to kerb of nearest road
(m) (2) Inlet Height (m)
CM1 Chignal St
James Rural 566463 210830
NO, NOx, NO2,
PM10, O3 NO
Chemiluminescent / Unheated BAM / UV Photometry
40 43 4
CM2 Springfield
Road (Prison)
Roadside 571640 207179 NO, NOx, NO2, PM10
NO Chemiluminescent / Unheated BAM
29.2 2.8 2.5
CM3 Rainsford Lane (Fire Station)
Roadside 569912 206881 NO, NOx, NO2, PM10
NO Chemiluminescent / Unheated BAM
20 2.5 2.5
CM4 Baddow
Road Roadside 571654 205798
NO, NOx, NO2
NO Chemiluminescent 12 5.1 1.5
(1) 0m if the monitoring site is at a location of exposure (e.g. installed on the façade of a residential property).
(2) N/A if not applicable.
Chelmsford City Council
10 LAQM Annual Status Report 2017
Table A.2 – Details of Non-Automatic Monitoring Sites
Site ID Site Name Site Type X OS Grid
Ref Y OS Grid
Ref Pollutants Monitored
In AQMA?
Distance to
Relevant Exposure
(m) (1)
Distance to kerb of nearest road (m)
(2)
Tube collocated
with a Continuous Analyser?
Height (m)
CB01 12 Van Diemans Road Roadside 571421 205963 NO2 Yes 0 12 No 2.5
CB02 3 Moulsham Chase Roadside 571388 205725 NO2 No 9.3 2.5 No 2.5
CB04 28 Cleves Ct. Urban
Background 575266 210080 NO2 No 0 5 No 2.5
CB08 109 Balmoral Ct. Roadside 571383 206926 NO2 No 3 3 No 2.5
CB11 20 Brooklands Walk Urban
Background 570065 205468 NO2 No 0 19 No 2.5
CB13 60 Roxwell Road Roadside 569077 207528 NO2 No 0 16 No 2.5
CB18 180 Maldon Rd Roadside 573846 205362 NO2 No 0 17 No 2.5
CB19 92 Maldon Road Roadside 573408 205317 NO2 No 0 16 No 2.5
CB20 Lyster Avenue Urban
Background 573106 205252 NO2 No 0 4 No 2.5
CB22 95 Baddow Road Roadside 571505 205968 NO2 No 0 8 No 2.5
CB22B 95 Baddow Road Roadside 571505 205968 NO2 No 0 8 No 2.5
CB22C 95 Baddow Road Roadside 571505 205968 NO2 No 0 8 No 2.5
CB25 20 Allen Way Suburban 573992 207985 NO2 No 4 0 No 2.5
CB26 214 Baddow Road Roadside 571614 205812 NO2 No 0 5 No 2.5
CB26B 214 Baddow Road Roadside 571614 205812 NO2 No 0 5 No 2.5
CB26C 214 Baddow Road Roadside 571614 205812 NO2 No 0 5 No 2.5
CB27 Howe Green Interchange
Roadside 574080 203469 NO2 No 0 18 No 2.5

Chelmsford City Council
11 LAQM Annual Status Report 2017
CB27A Howe Green Interchange
Roadside 574080 203469 NO2 No 0 18 No 2.5
CB27B Howe Green Interchange
Roadside 574080 203469 NO2 No 0 18 No 2.5
CB30 Colchester Road Roadside 573403 208650 NO2 No 0 5 No 2.5
CB31 Main Road, Boreham Roadside 575265 209975 NO2 No 0 5 No 2.5
CB32 2 Abbots Place Roadside 571581 207144 NO2 No 0 5 No 2.5
CB33 Victoria Road Roadside 570973 207160 NO2 No 3 3 No 2.5
CB35 129 Moulsham Street Roadside 570491 205979 NO2 No 4 1 No 2.5
CB36 2 Rainsford Lane Roadside 570104 207247 NO2 No 2 1 No 2.5
CB37 30 Victoria Crescent Urban
Background 570481 207469 NO2 No 0 26 No 2.5
CB38 Prison 1 Roadside 571640 207179 NO2 No 14 3 Yes 2.5
CB39 Prison 2 Roadside 571640 207179 NO2 No 14 3 Yes 2.5
CB40 Prison 3 Roadside 571640 207179 NO2 No 14 3 Yes 2.5
CB41 Hill Road South Urban
Background 571731 206292 NO2 No 17 184 No 2.5
CB42 Wharf Road(Gas Works)
Urban Background
571308 206614 NO2 No 10 1 No 2.5
CB44 Atlantic Business Centres
Roadside 570422 207352 NO2 No 0 11 No 2.5
CB45 32 Van Diemans Road Roadside 571393 205906 NO2 No 0 11 No 2.5
CB46 32 Rochford Road Roadside 571062 206281 NO2 Yes 2 3 No 2.5
CB48 1 Weight Road Roadside 571462 206950 NO2 No 3 1 No 2.5
CB49 26 Rochford Road Roadside 571109 206256 NO2 Yes 0 5 No 2.5
CB52 Penpol, Victoria Road Roadside 571377 207007 NO2 No 0 3 No 2.5
CB55 15 Cedar Avenue Roadside 570278 207309 NO2 No 0 8 No 2.5
CB56 52 Goldlay Road Roadside 571177 206222 NO2 Yes 5 1 No 2.5

Chelmsford City Council
12 LAQM Annual Status Report 2017
CB57 Goldlay House, Parkway
Roadside 571359 206124 NO2 No 0 16 No 2.5
CB58 148 Baddow Road Roadside 571476 205964 NO2 Yes 0 12 No 2.5
CB61 10 Fraser Close Suburban 571445 205631 NO2 No 0 7 No 2.5
CB62 Chignal 1 Rural 566463 210830 NO2 No 40 43 Yes 4
CB63 Chignal 2 Rural 566463 210830 NO2 No 40 43 Yes 4
CB64 Chignal 3 Rural 566463 210830 NO2 No 40 43 Yes 4
CB65 Fire Station 1 Roadside 569912 206881 NO2 No 20 2.5 Yes 2.5
CB66 Fire Station 2 Roadside 569912 206881 NO2 No 20 2.5 Yes 2.5
CB67 Fire Station 3 Roadside 569912 206881 NO2 No 20 2.5 Yes 2.5
CB68 Goldlay Avenue 1 Roadside 571382 206092 NO2 No 0 12 No 2.5
CB68B Goldlay Avenue 2 Roadside 571382 206092 NO2 No 0 12 No 2.5
CB68C Goldlay Avenue 3 Roadside 571382 206092 NO2 No 0 12 No 2.5
CB73 Chelmer Road Roadside 572130 206507 NO2 No 0 18 No 2.5
CB74 South Primrose Hill Roadside 570074 207167 NO2 No 0 4 No 2.5
CB75 Main Road, Danbury Roadside 577921 205246 NO2 No 0 2 No 2.5
CB76 Maldon Road, Danbury Roadside 578506 205122 NO2 No 0 2 No 2.5
CB77 Meadgate Avenue Suburban 571656 205949 NO2 No 0 1 No 2.5
CB79 10 Waterhouse Lane Roadside 569485 206012 NO2 No 0 3 No 2.5
CB80 208 Springfield Road Roadside 571710 207246 NO2 No 0 3 No 2.5
CB81 2/4 Arbour Lane Roadside 571674 207282 NO2 No 4 1 No 2.5
CB82 122 Springfield Road Roadside 571438 206966 NO2 No 0 4 No 2.5
CB83 134/136 Springfield Road
Roadside 571462 206999 NO2 No 0 3 No 2.5
CB83b 134/136 Springfield Road
Roadside 571462 206999 NO2 No 0 3 No 2.5

Chelmsford City Council
13 LAQM Annual Status Report 2017
CB83c 134/136 Springfield Road
Roadside 571462 206999 NO2 No 0 3 No 2.5
CB84 Baddow Road AQMS 1 Roadside 571653 205800 NO2 No 12 5.1 Yes 1.5
CB85 Baddow Road AQMS 2 Roadside 571653 205800 NO2 No 12 5.1 Yes 1.5
CB86 Baddow Road AQMS 3 Roadside 571653 205800 NO2 No 12 5.1 Yes 1.5
CB87 Bus Station Other 570444 207044 NO2 No 4 3 No 2.5
CB88 147 Baddow Road Suburban 571664 205811 NO2 No 0 22 No 2.5
CB89 135 Springfield Road Roadside 571428 206979 NO2 No 2 0.5 No 2.5
CB90 144 Springfield Road Roadside 571480 207019 NO2 No 2 2 No 2.5
(1) 0m if the monitoring site is at a location of exposure (e.g. installed on/adjacent to the façade of a residential property).
(2) N/A if not applicable.

Chelmsford City Council
14 LAQM Annual Status Report 2017
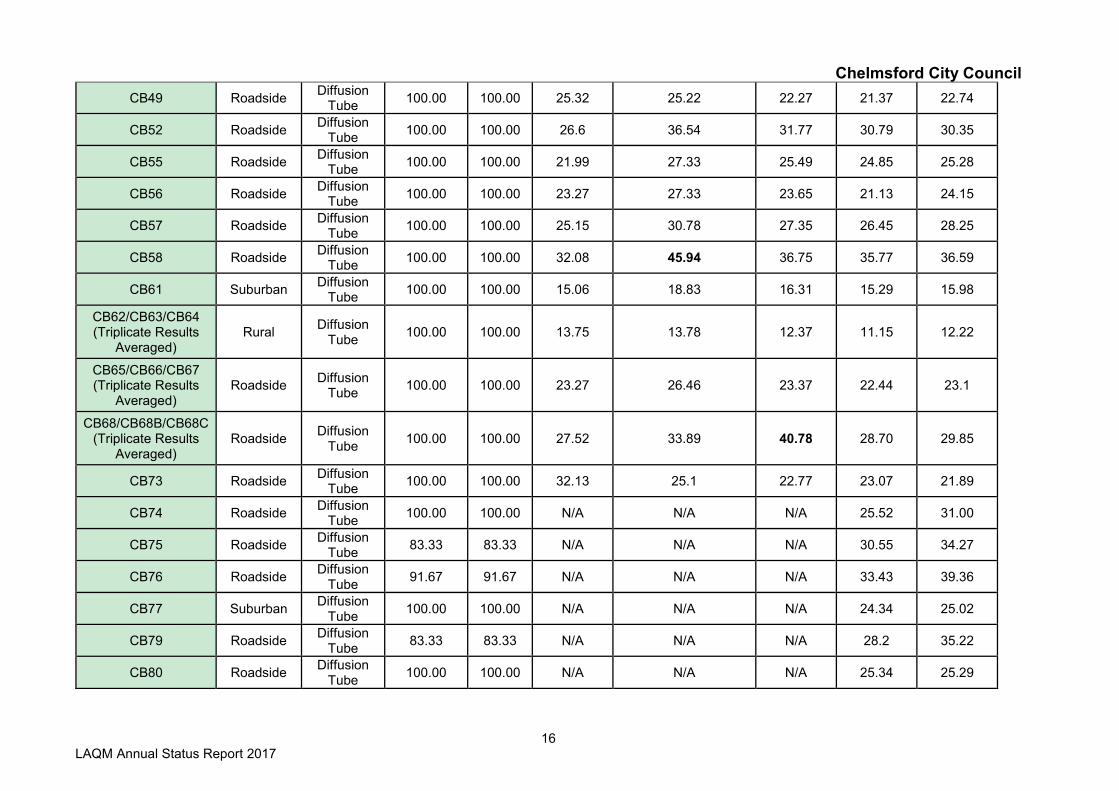
Table A.3 – Annual Mean NO2 Monitoring Results
Site ID Site Type Monitoring
Type
Valid Data Capture
for Monitoring Period (%)
(1)
Valid Data
Capture 2016 (%) (2)
NO2 Annual Mean Concentration (µg/m3) (3)
2012 2013 2014 2015 2016
CM1 Rural Automatic 94.59 94.59 16.26 13.86 14.19 12.79 14.23
CM2 Roadside Automatic 90.37 90.37 34 31.38 28.09 28.11 28.89
CM3 Roadside Automatic 94.81 94.81 25.44 29.22 N/A 27.9 25.59
CM4 Roadside Automatic 96.7 96.7 36.82
43.52 (33.8 at receptor) N/A 25.8 29.57
CB01 Roadside Diffusion
Tube 100.00 100.00 27.71 33.9 30.27 28.44 31.30
CB02 Roadside Diffusion
Tube 91.67 91.67 19.32 25.17 21.5 20.15 20.53
CB04 Urban
Background Diffusion
Tube 91.67 91.67 21.03 29.7 22.3 21.65 22.00
CB08 Roadside Diffusion
Tube 100.00 100.00 28.25 31.02 28.02 28.59 28.91
CB11 Urban
Background Diffusion
Tube 100.00 100.00 26.71 26.57 23.37 23.39 24.41
CB13 Roadside Diffusion
Tube 100.00 100.00 18.7 20.16 18.59 16.26 18.09
CB18 Roadside Diffusion
Tube 100.00 100.00 16.65 17.65 17.67 17.02 17.02
CB19 Roadside Diffusion
Tube 100.00 100.00 17.09 23.74 19.65 18.56 19.61
CB20 Urban
Background Diffusion
Tube 100.00 100.00 16.67 19.9 17.23 15.65 17.87
CB22/CB22B/CB22C (Triplicate Results
Averaged) Roadside
Diffusion Tube
100.00 100.00 26.71 36.07 32.39 30.34 32.37

Chelmsford City Council
15 LAQM Annual Status Report 2017
CB25 Suburban Diffusion
Tube 100.00 100.00 18.59 23.64 20.91 19.81 20.64
CB26/CB26B/CB26C (Triplicate Results
Averaged) Roadside
Diffusion Tube
100.00 100.00 26.81 35.78 30.7 28.07 29.29
CB27/CB27A/CB27B Roadside Diffusion
Tube 91.67 91.67 32.9 40.3 39.33 36.64 35.04
CB30 Roadside Diffusion
Tube 100.00 100.00 26.02 32.71 31.28 28.2 29.12
CB31 Roadside Diffusion
Tube 91.67 91.67 24.76 29.15 26.49 24.78 26.69
CB32 Roadside Diffusion
Tube 100.00 100.00 30.42 37.83 32.64 31.6 31.88
CB33 Roadside Diffusion
Tube 83.33 83.33 27.09 37.29 31.44 31.08 28.82
CB35 Roadside Diffusion
Tube 100.00 100.00 21.79 27.48 24.33 23.23 25.46
CB36 Roadside Diffusion
Tube 100.00 100.00 31.24 31.21 29.89 25.84 27.95
CB37 Urban
Background Diffusion
Tube 100.00 100.00 23.58 27.54 24.82 22.06 24.21
CB38/CB39/CB40 (Triplicate Results
Averaged) Roadside
Diffusion Tube
100.00 100.00 28.69 31.81 28.01 28.29 28.3
CB41 Urban
Background Diffusion
Tube 91.67 91.67 16.8 19.64 17.57 16.76 16.10
CB42 Urban
Background Diffusion
Tube 75.00 75.00 28.78 25.2 21.3 19.23 21.71
CB44 Roadside Diffusion
Tube 91.67 91.67 29.35 33.16 31.12 29.96 31.09
CB45 Roadside Diffusion
Tube 100.00 100.00 24.19 30.76 29.11 23.99 28.78
CB46 Roadside Diffusion
Tube 100.00 100.00 23.86 30.3 25.52 25.15 25.22
CB48 Roadside Diffusion
Tube 100.00 100.00 24.06 26.93 24.32 23.88 21.58
Chelmsford City Council
16 LAQM Annual Status Report 2017
CB49 Roadside Diffusion
Tube 100.00 100.00 25.32 25.22 22.27 21.37 22.74
CB52 Roadside Diffusion
Tube 100.00 100.00 26.6 36.54 31.77 30.79 30.35
CB55 Roadside Diffusion
Tube 100.00 100.00 21.99 27.33 25.49 24.85 25.28
CB56 Roadside Diffusion
Tube 100.00 100.00 23.27 27.33 23.65 21.13 24.15
CB57 Roadside Diffusion
Tube 100.00 100.00 25.15 30.78 27.35 26.45 28.25
CB58 Roadside Diffusion
Tube 100.00 100.00 32.08 45.94 36.75 35.77 36.59
CB61 Suburban Diffusion
Tube 100.00 100.00 15.06 18.83 16.31 15.29 15.98
CB62/CB63/CB64 (Triplicate Results
Averaged) Rural
Diffusion Tube
100.00 100.00 13.75 13.78 12.37 11.15 12.22
CB65/CB66/CB67 (Triplicate Results
Averaged) Roadside
Diffusion Tube
100.00 100.00 23.27 26.46 23.37 22.44 23.1
CB68/CB68B/CB68C (Triplicate Results
Averaged) Roadside
Diffusion Tube
100.00 100.00 27.52 33.89 40.78 28.70 29.85
CB73 Roadside Diffusion
Tube 100.00 100.00 32.13 25.1 22.77 23.07 21.89
CB74 Roadside Diffusion
Tube 100.00 100.00 N/A N/A N/A 25.52 31.00
CB75 Roadside Diffusion
Tube 83.33 83.33 N/A N/A N/A 30.55 34.27
CB76 Roadside Diffusion
Tube 91.67 91.67 N/A N/A N/A 33.43 39.36
CB77 Suburban Diffusion
Tube 100.00 100.00 N/A N/A N/A 24.34 25.02
CB79 Roadside Diffusion
Tube 83.33 83.33 N/A N/A N/A 28.2 35.22
CB80 Roadside Diffusion
Tube 100.00 100.00 N/A N/A N/A 25.34 25.29
Chelmsford City Council
17 LAQM Annual Status Report 2017
CB81 Roadside Diffusion
Tube 100.00 100.00 N/A N/A N/A 25.96 29.16
CB82 Roadside Diffusion
Tube 91.67 91.67 N/A N/A N/A 32.83 31.90
CB83/CB83B/CB83C (Triplicate Results
Averaged) Roadside
Diffusion Tube
100.00 100.00 N/A N/A N/A 39.05 38.02
CB84/CB85/CB86 Roadside Diffusion
Tube 100.00 100.00 N/A N/A N/A 24.28 27.48
CB87 Other Diffusion
Tube 100.00 100.00 N/A N/A N/A 39.92 35.81
CB88 Suburban Diffusion
Tube 100.00 100.00 N/A N/A N/A 19.82 21.84
CB89 Roadside Diffusion
Tube 100.00 100.00 N/A N/A N/A N/A 37.37
CB90 Roadside Diffusion
Tube 100.00 100.00 N/A N/A N/A N/A 30.48
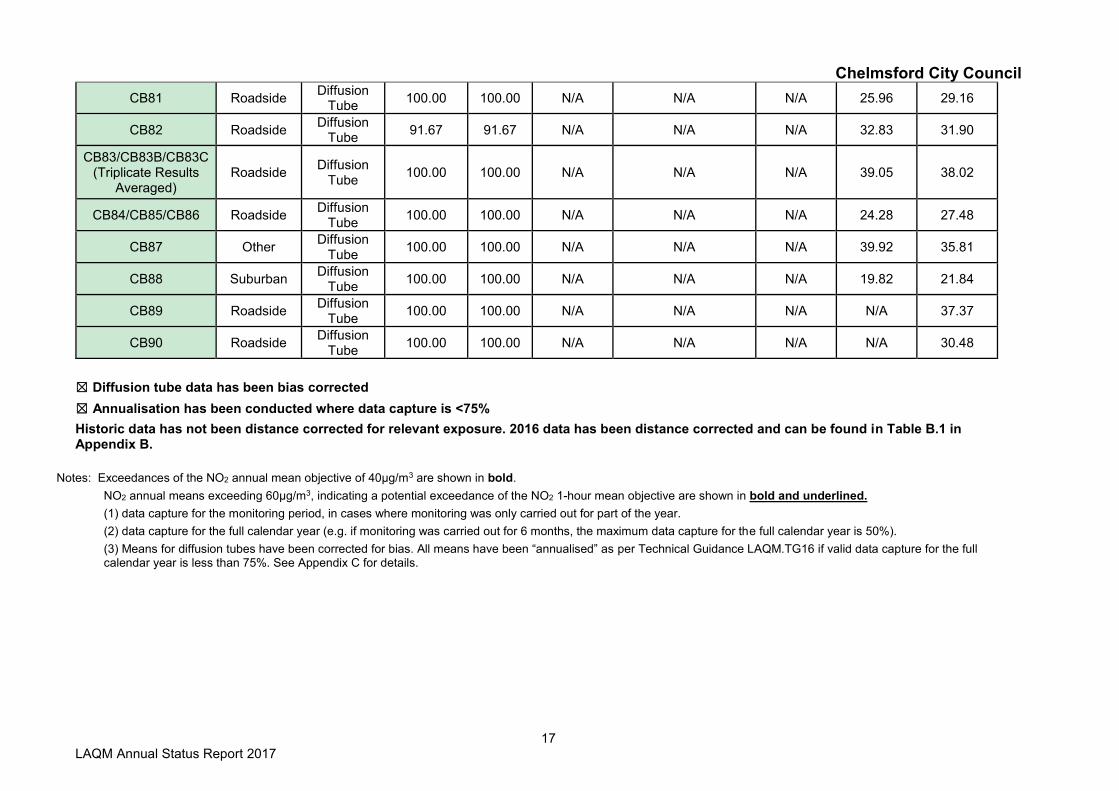
☒ Diffusion tube data has been bias corrected
☒ Annualisation has been conducted where data capture is <75%
Historic data has not been distance corrected for relevant exposure. 2016 data has been distance corrected and can be found in Table B.1 in Appendix B.
Notes: Exceedances of the NO2 annual mean objective of 40µg/m3 are shown in bold.
NO2 annual means exceeding 60µg/m3, indicating a potential exceedance of the NO2 1-hour mean objective are shown in bold and underlined.
(1) data capture for the monitoring period, in cases where monitoring was only carried out for part of the year.
(2) data capture for the full calendar year (e.g. if monitoring was carried out for 6 months, the maximum data capture for the full calendar year is 50%).
(3) Means for diffusion tubes have been corrected for bias. All means have been “annualised” as per Technical Guidance LAQM.TG16 if valid data capture for the full calendar year is less than 75%. See Appendix C for details.
Chelmsford City Council
18 LAQM Annual Status Report 2017
Table A.4 – 1-Hour Mean NO2 Monitoring Results
Site ID Site Type Monitoring
Type
Valid Data Capture for Monitoring Period (%)
(1)
Valid Data Capture 2016 (%)
(2)
NO2 1-Hour Means > 200µg/m3 (3)
2012 2013 2014 2015 2016
CM1 Rural Automatic 94.59 94.59 0 0 0 0(63.08) 0
CM2 Roadside Automatic 90.37 90.37 0 2 0 0 0
CM3 Roadside Automatic 94.81 94.81 0 0 N/A 0(98.51) 0
CM4 Roadside Automatic 96.7 96.7 0 0 N/A 0(82.10) 0
Notes: Exceedances of the NO2 1-hour mean objective (200µg/m3 not to be exceeded more than 18 times/year) are shown in bold.
(1) data capture for the monitoring period, in cases where monitoring was only carried out for part of the year.
(2) data capture for the full calendar year (e.g. if monitoring was carried out for 6 months, the maximum data capture for the full calendar year is 50%).
(3) If the period of valid data is less than 90%, the 99.8th percentile of 1-hour means is provided in brackets.
Table A.5 – Annual Mean PM10 Monitoring Results
Site ID Site Type Valid Data Capture
for Monitoring Period (%) (1)
Valid Data Capture 2016 (%) (2)
PM10 Annual Mean Concentration (µg/m3) (3)
2012 2013 2014 2015 2016
CM1 Rural 91.53 91.53 24.49 17.97 17.44 20.49 17.07
CM2 Roadside 90.71 90.71 30.7 30.92 29.15 27.21 28.42
CM3 Roadside 93.99 93.99 23.29 23.06 22.2 20.97 20.83
Notes: Exceedances of the PM10 annual mean objective of 40µg/m3 are shown in bold.
(1) data capture for the monitoring period, in cases where monitoring was only carried out for part of the year.
(2) data capture for the full calendar year (e.g. if monitoring was carried out for 6 months, the maximum data capture for the full calendar year is 50%).
(3) All means have been “annualised” as per Technical Guidance LAQM.TG16, valid data capture for the full calendar year is less than 75%. See Appendix C for details.
Chelmsford City Council
19 LAQM Annual Status Report 2017
Table A.6 – 24-Hour Mean PM10 Monitoring Results
Site ID Site Type Valid Data Capture for
Monitoring Period (%) (1) Valid Data Capture
2016 (%) (2)
PM10 24-Hour Means > 50µg/m3 (3)
2012 2013 2014 2015 2016
CM1 Rural 91.53 91.53 5 1 5 3 1
CM2 Roadside 90.71 90.71 15 20(45.56) 21(43.09) 7 8
CM3 Roadside 93.99 93.99 7 9(39.74) 9(35.55) 4 5
Notes: Exceedances of the PM10 24-hour mean objective (50µg/m3 not to be exceeded more than 35 times/year) are shown in bold.
(1) data capture for the monitoring period, in cases where monitoring was only carried out for part of the year.
(2) data capture for the full calendar year (e.g. if monitoring was carried out for 6 months, the maximum data capture for the full calendar year is 50%).
(3) If the period of valid data is less than 90%, the 90.4th percentile of 24-hour means is provided in brackets.
Table A.7 – Ozone (O3) Monitoring Results 2010-2016
Site ID Site Type Valid Data Capture for Monitoring Period (%)
(1)
Valid Data Capture 2016 (%)
(2)
O3 Annual Mean
2011 2012 2013 2014 2015 2016
CM1 Rural 89.34 89.34 38.2 26.78 43.26 48.94 53.4 47.89
Chelmsford City Council
20 LAQM Annual Status Report 2017
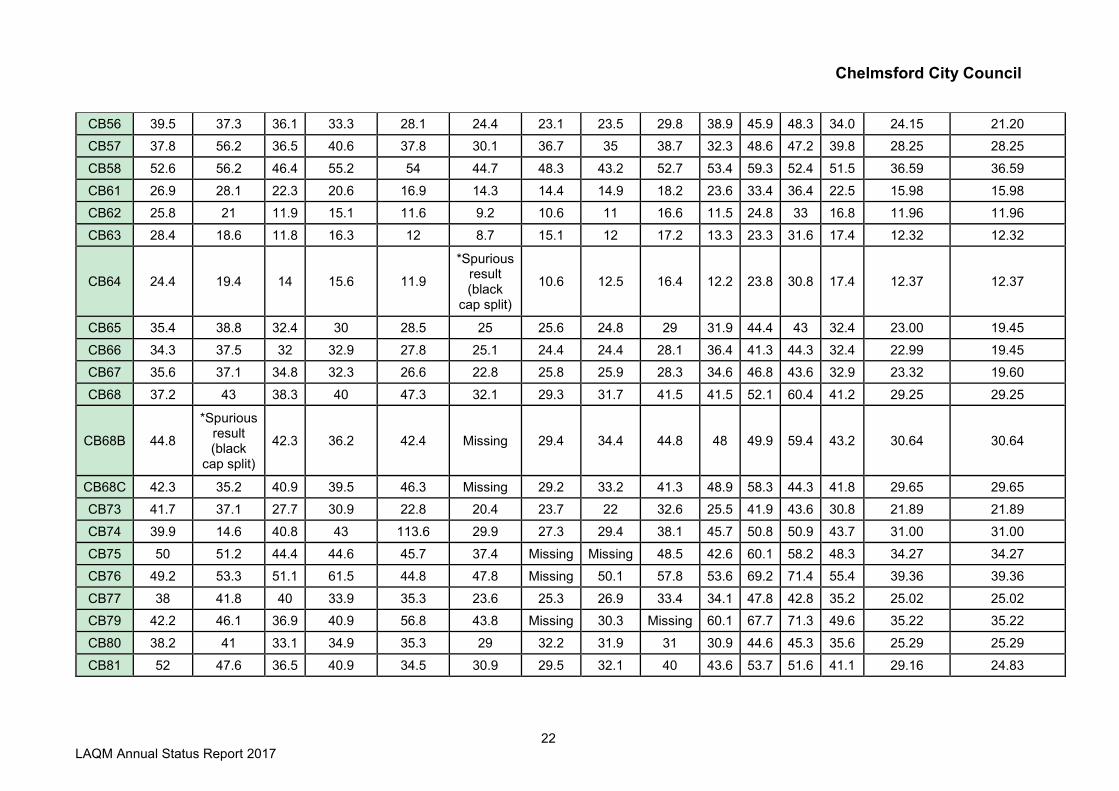
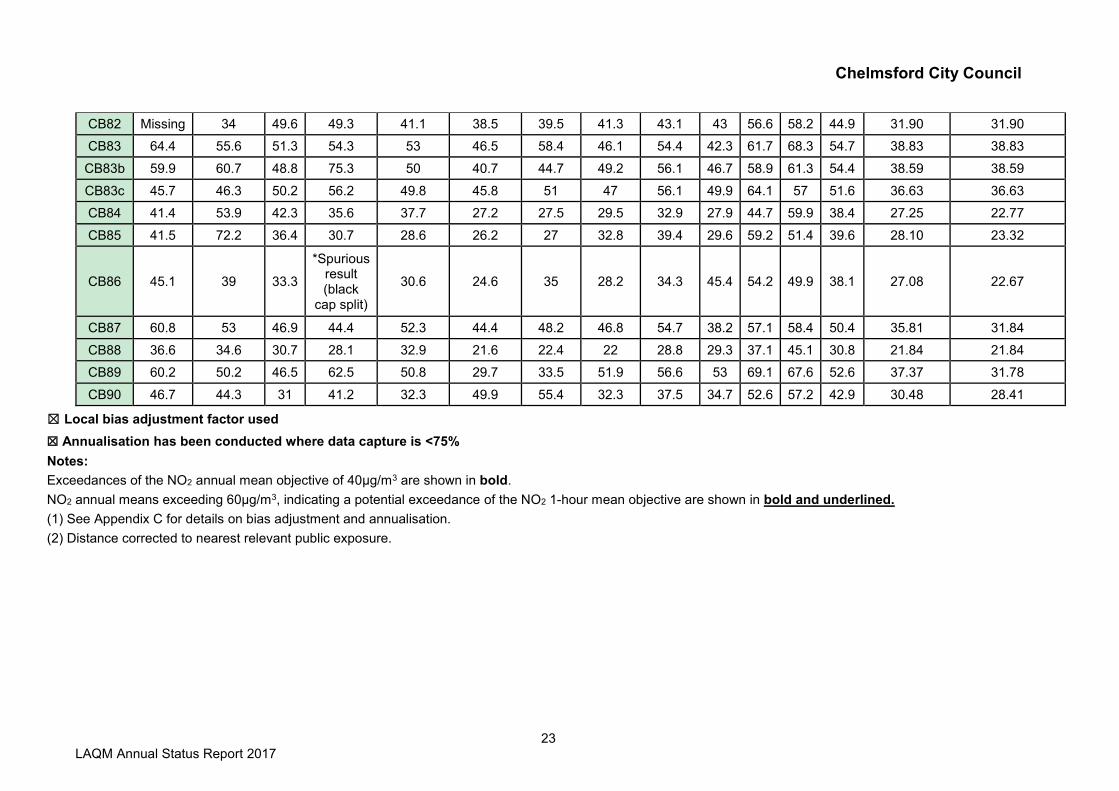
Appendix B: Full Monthly Diffusion Tube Results for 2016
Table B.1 – NO2 Monthly Diffusion Tube Results - 2016
(1) See Appendix C for details on bias adjustment and annualisation
Site ID
NO2 Mean Concentrations (µg/m3)
Jan Feb Mar Apr May Jun Jul Aug Sep Oct Nov Dec
Annual Mean
Raw Data
Bias Adjusted (0.72) and
Annualised (1)
Distance Corrected to
Nearest Exposure (2)
CB01 36.9 47.9 46.7 40.1 44.3 34.4 37.9 36.8 44.2 48.9 54.3 56.6 44.1 31.30 31.30
CB02 37.7 31.3 29.7 27.1 22.4 Missing 19.3 18.7 24.5 30.7 38.1 38.6 28.9 20.53 18.44
CB04 37.8 Missing 35.2 35.1 28.1 20.7 25 27.6 26.5 30.3 44.4 30.1 31.0 22.00 22.00
CB08 44.9 46.3 38.1 46.2 37.6 34.8 40.6 35.6 37.3 34.2 55.1 38 40.7 28.91 26.59
CB11 36.8 36.5 32.6 33.5 28.7 26.4 29.3 28.2 36.7 26.9 42 55 34.4 24.41 24.41
CB13 32.7 28.1 24.9 24.2 21.5 17.1 19.2 18.3 24.4 20.5 37.4 37.5 25.5 18.09 18.09
CB18 29.2 28.4 22.3 22.9 21.1 16.1 18.1 19 21.1 24.6 33.1 31.8 24.0 17.02 17.02
CB19 34.7 30.2 27.6 27.8 24 16.8 20.1 21.8 25.8 24.8 38.6 39.2 27.6 19.61 19.61
CB20 29 29.8 24.2 23.7 21.9 15.9 16.4 17.2 24.4 25.1 35.9 38.6 25.2 17.87 17.87
CB22 45.1 52 30.3 49 48.5 30 35.1 38.8 43.6 48.8 59.9 53.3 44.5 31.62 31.62
CB22B 42.2 47.1 49.2 47.7 49.4 37.8 36 33.3 43.3 53.4 59 55.3 46.1 32.76 32.76
CB22C 43.6 51 52.5 45 43.4 35.8 35.8 36.4 44.9 52.6 58.4 53.9 46.1 32.74 32.74
CB25 37 30.9 24.3 29.8 27.3 20 18.8 22.5 27.9 27.8 39.4 43.1 29.1 20.64 17.11
CB26 46.6 42.2 41.2 44.2 38.2 32.6 33.3 33.8 40.2 39.7 52.2 56.1 41.7 29.60 29.60

Chelmsford City Council
21 LAQM Annual Status Report 2017
CB26B 48.4 44.9 36.2 41.7 39.6 32.7 34 32 44.1 38.5 49.6 36 39.8 28.26 28.26
CB26C 50.1 46 42.4 40.4 40.7 32.9 33.8 33.2 42.4 41.4 48.3 55.4 42.3 30.00 30.00
CB27 63.1 55.2 37.7 52.2 43.9 40.8 44.7 Missing 53.8 30.2 56.8 58.3 48.8 34.64 34.64
CB27A 70.3 57.4 43.8 49.5 40.5 43.6 46.7 Missing 53.1 31 57.5 58.9 50.2 35.65 35.65
CB27B 67.9 55.1 47 49.7 42 40.6 46.1 Missing 55 35.8 60.2 40.1 49.0 34.82 34.82
CB30 51.1 43.3 37.4 40.2 32.9 32.2 37 32 44.9 39.4 51.1 50.7 41.0 29.12 29.12
CB31 46.6 45.5 40.2 31.3 35.7 24.9 Missing 28.3 28.6 34.3 53.7 44.4 37.6 26.69 26.69
CB32 57.3 49.5 48.5 47.6 37.1 36 36.9 35.7 43.7 41.4 57.8 47.4 44.9 31.88 31.88
CB33 43.7 Missing 37.8 38.2 Missing 35.6 34.3 34.9 41.4 31.1 57.1 51.8 40.6 28.82 26.70
CB35 43.8 39.7 34.7 33.2 30.1 25.4 28.6 26.6 33.1 34.7 49 51.4 35.9 25.46 22.09
CB36 50.5 41.9 34.2 41.8 36 28.4 28.3 29.5 38.4 42.9 52.5 48 39.4 27.95 25.53
CB37 40.4 39.1 31.5 34.2 27.4 23.6 27.9 28.5 34.6 33.8 43.6 44.6 34.1 24.21 24.21
CB38 53.8 41.4 36.9 39.4 35 28.8 33 30.7 34.4 33.2 51.6 52.6 39.2 27.86 22.44
CB39 44.8 48.2 39.1 38.1
*Spurious result (black
cap split)
28 32.9 28.2 38.4 38 49.8 55.4 40.1 28.46 22.78
CB40 51 46.4 41.2 40.5 34.7 30.3 29.6 29.6 33.3 38.3 52.8 55.4 40.3 28.58 22.85
CB41 Missing 32 23.8 24.1 16.8 15.3 18 19.7 24.5 24.1 39.9 11.3 22.7 16.10 16.15
CB42 36.6 Missing 31.1 31.5 Missing 22.9 22.2 21.5 Missing 31.7 41.8 35.9 30.6 21.71 18.94
CB44 50.3 43.7 39.5 41.9 40 32.2 35.4 Missing 46.2 43.2 55.1 54.1 43.8 31.09 31.09
CB45 33.8 44.4 41.5 44.9 38.4 31.3 45.9 32.4 36.7 36.9 47.8 52.4 40.5 28.78 28.78
CB46 34.7 42.7 35.4 36.9 34.6 22.1 24.2 27.8 26.9 43 52.6 45.3 35.5 25.22 23.99
CB48 13.2 45.4 17.7 35.3 29.6 24.4 27 27.1 31.8 27.7 46.6 38.9 30.4 21.58 20.50
CB49 33.5 36.3 30.5 31.4 30.2 28.8 20.7 21 36 35.3 38.7 41.9 32.0 22.74 22.74
CB52 53.3 42.1 39.1 47.5 38.5 35.2 39.3 34.4 39.5 41 59 44.1 42.8 30.35 30.35
CB55 45.5 35.1 35.3 35 28.5 24.6 28.9 28.4 31.6 34.1 49.3 50.9 35.6 25.28 25.28
Chelmsford City Council
22 LAQM Annual Status Report 2017
CB56 39.5 37.3 36.1 33.3 28.1 24.4 23.1 23.5 29.8 38.9 45.9 48.3 34.0 24.15 21.20
CB57 37.8 56.2 36.5 40.6 37.8 30.1 36.7 35 38.7 32.3 48.6 47.2 39.8 28.25 28.25
CB58 52.6 56.2 46.4 55.2 54 44.7 48.3 43.2 52.7 53.4 59.3 52.4 51.5 36.59 36.59
CB61 26.9 28.1 22.3 20.6 16.9 14.3 14.4 14.9 18.2 23.6 33.4 36.4 22.5 15.98 15.98
CB62 25.8 21 11.9 15.1 11.6 9.2 10.6 11 16.6 11.5 24.8 33 16.8 11.96 11.96
CB63 28.4 18.6 11.8 16.3 12 8.7 15.1 12 17.2 13.3 23.3 31.6 17.4 12.32 12.32
CB64 24.4 19.4 14 15.6 11.9
*Spurious result (black
cap split)
10.6 12.5 16.4 12.2 23.8 30.8 17.4 12.37 12.37
CB65 35.4 38.8 32.4 30 28.5 25 25.6 24.8 29 31.9 44.4 43 32.4 23.00 19.45
CB66 34.3 37.5 32 32.9 27.8 25.1 24.4 24.4 28.1 36.4 41.3 44.3 32.4 22.99 19.45
CB67 35.6 37.1 34.8 32.3 26.6 22.8 25.8 25.9 28.3 34.6 46.8 43.6 32.9 23.32 19.60
CB68 37.2 43 38.3 40 47.3 32.1 29.3 31.7 41.5 41.5 52.1 60.4 41.2 29.25 29.25
CB68B 44.8
*Spurious result (black
cap split)
42.3 36.2 42.4 Missing 29.4 34.4 44.8 48 49.9 59.4 43.2 30.64 30.64
CB68C 42.3 35.2 40.9 39.5 46.3 Missing 29.2 33.2 41.3 48.9 58.3 44.3 41.8 29.65 29.65
CB73 41.7 37.1 27.7 30.9 22.8 20.4 23.7 22 32.6 25.5 41.9 43.6 30.8 21.89 21.89
CB74 39.9 14.6 40.8 43 113.6 29.9 27.3 29.4 38.1 45.7 50.8 50.9 43.7 31.00 31.00
CB75 50 51.2 44.4 44.6 45.7 37.4 Missing Missing 48.5 42.6 60.1 58.2 48.3 34.27 34.27
CB76 49.2 53.3 51.1 61.5 44.8 47.8 Missing 50.1 57.8 53.6 69.2 71.4 55.4 39.36 39.36
CB77 38 41.8 40 33.9 35.3 23.6 25.3 26.9 33.4 34.1 47.8 42.8 35.2 25.02 25.02
CB79 42.2 46.1 36.9 40.9 56.8 43.8 Missing 30.3 Missing 60.1 67.7 71.3 49.6 35.22 35.22
CB80 38.2 41 33.1 34.9 35.3 29 32.2 31.9 31 30.9 44.6 45.3 35.6 25.29 25.29
CB81 52 47.6 36.5 40.9 34.5 30.9 29.5 32.1 40 43.6 53.7 51.6 41.1 29.16 24.83
Chelmsford City Council
23 LAQM Annual Status Report 2017
CB82 Missing 34 49.6 49.3 41.1 38.5 39.5 41.3 43.1 43 56.6 58.2 44.9 31.90 31.90
CB83 64.4 55.6 51.3 54.3 53 46.5 58.4 46.1 54.4 42.3 61.7 68.3 54.7 38.83 38.83
CB83b 59.9 60.7 48.8 75.3 50 40.7 44.7 49.2 56.1 46.7 58.9 61.3 54.4 38.59 38.59
CB83c 45.7 46.3 50.2 56.2 49.8 45.8 51 47 56.1 49.9 64.1 57 51.6 36.63 36.63
CB84 41.4 53.9 42.3 35.6 37.7 27.2 27.5 29.5 32.9 27.9 44.7 59.9 38.4 27.25 22.77
CB85 41.5 72.2 36.4 30.7 28.6 26.2 27 32.8 39.4 29.6 59.2 51.4 39.6 28.10 23.32
CB86 45.1 39 33.3
*Spurious result (black
cap split)
30.6 24.6 35 28.2 34.3 45.4 54.2 49.9 38.1 27.08 22.67
CB87 60.8 53 46.9 44.4 52.3 44.4 48.2 46.8 54.7 38.2 57.1 58.4 50.4 35.81 31.84
CB88 36.6 34.6 30.7 28.1 32.9 21.6 22.4 22 28.8 29.3 37.1 45.1 30.8 21.84 21.84
CB89 60.2 50.2 46.5 62.5 50.8 29.7 33.5 51.9 56.6 53 69.1 67.6 52.6 37.37 31.78
CB90 46.7 44.3 31 41.2 32.3 49.9 55.4 32.3 37.5 34.7 52.6 57.2 42.9 30.48 28.41
☒ Local bias adjustment factor used
☒ Annualisation has been conducted where data capture is <75%
Notes:
Exceedances of the NO2 annual mean objective of 40µg/m3 are shown in bold.
NO2 annual means exceeding 60µg/m3, indicating a potential exceedance of the NO2 1-hour mean objective are shown in bold and underlined.
(1) See Appendix C for details on bias adjustment and annualisation.
(2) Distance corrected to nearest relevant public exposure.
Chelmsford City Council
24 LAQM Annual Status Report 2017
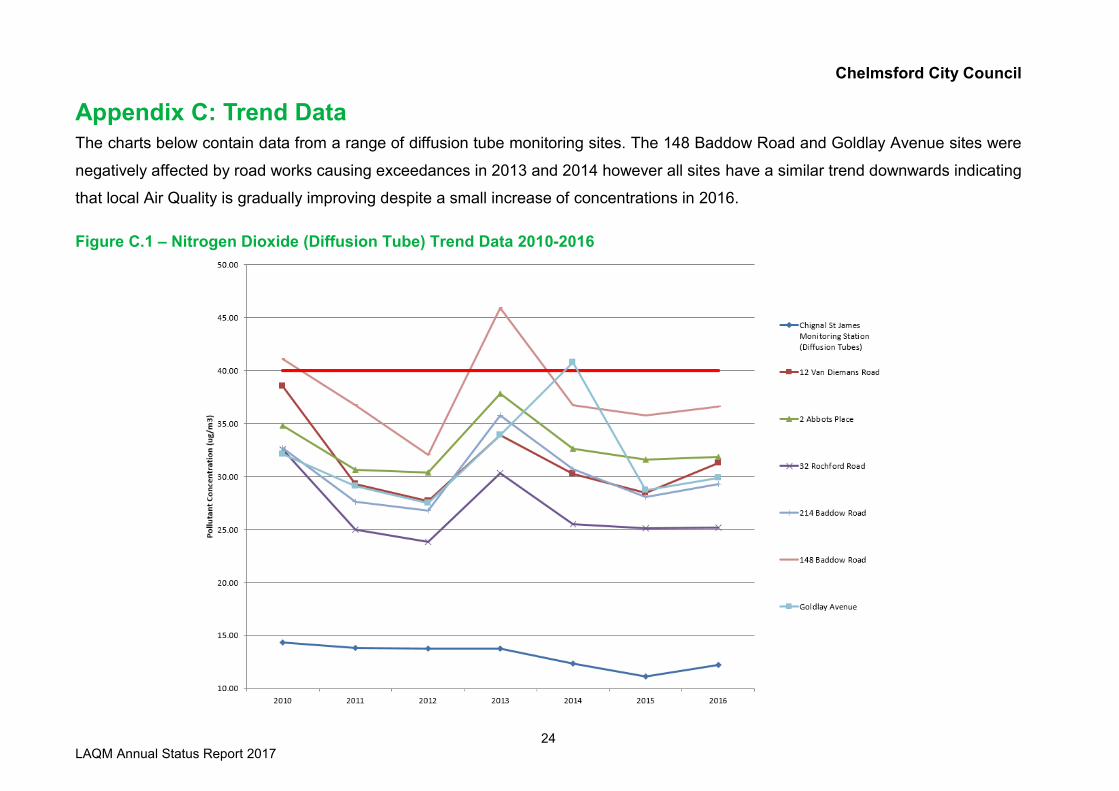
Appendix C: Trend Data The charts below contain data from a range of diffusion tube monitoring sites. The 148 Baddow Road and Goldlay Avenue sites were
negatively affected by road works causing exceedances in 2013 and 2014 however all sites have a similar trend downwards indicating
that local Air Quality is gradually improving despite a small increase of concentrations in 2016.
Figure C.1 – Nitrogen Dioxide (Diffusion Tube) Trend Data 2010-2016
Chelmsford City Council
25 LAQM Annual Status Report 2017
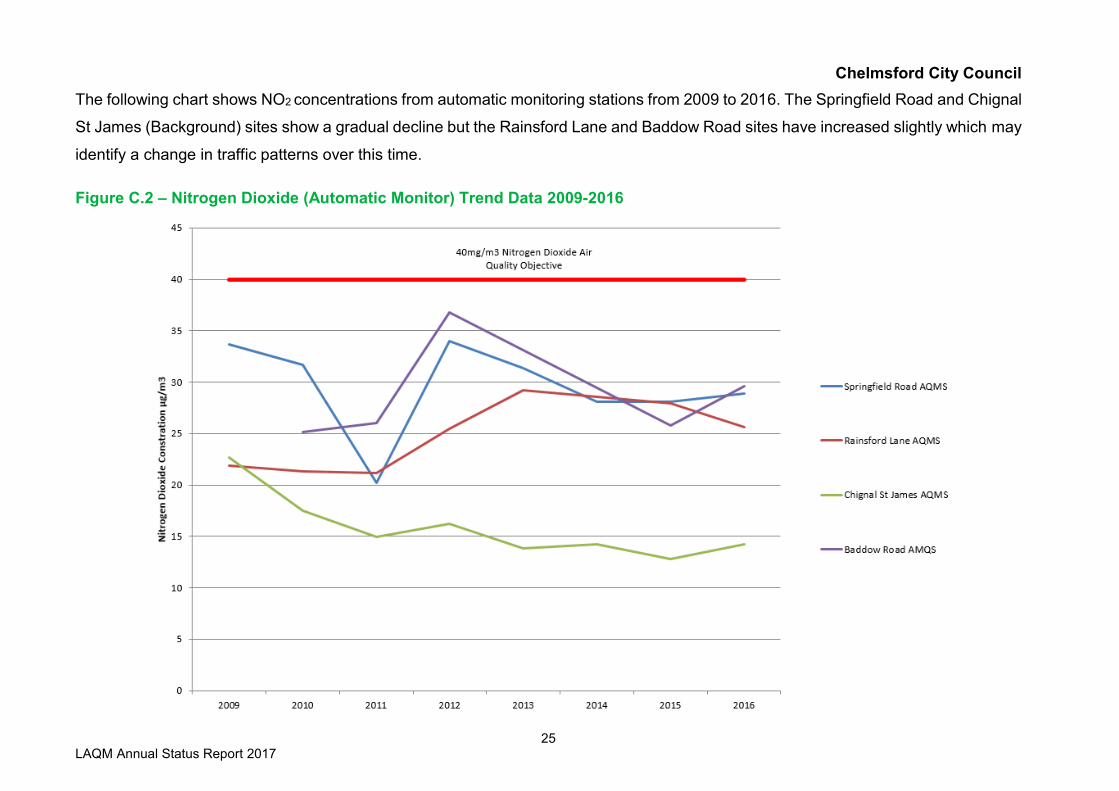
The following chart shows NO2 concentrations from automatic monitoring stations from 2009 to 2016. The Springfield Road and Chignal
St James (Background) sites show a gradual decline but the Rainsford Lane and Baddow Road sites have increased slightly which may
identify a change in traffic patterns over this time.
Figure C.2 – Nitrogen Dioxide (Automatic Monitor) Trend Data 2009-2016
Chelmsford City Council
26 LAQM Annual Status Report 2017
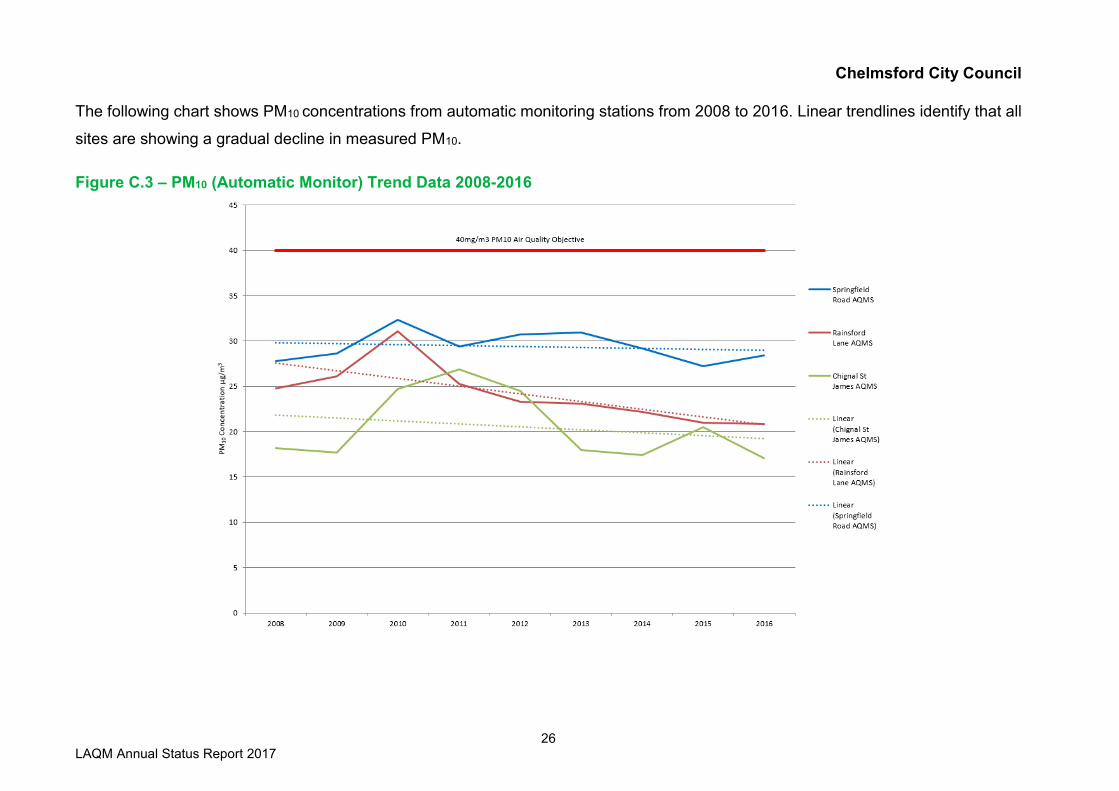
The following chart shows PM10 concentrations from automatic monitoring stations from 2008 to 2016. Linear trendlines identify that all
sites are showing a gradual decline in measured PM10.
Figure C.3 – PM10 (Automatic Monitor) Trend Data 2008-2016
Chelmsford City Council
27 LAQM Annual Status Report 2017
Appendix D: Supporting Technical Information / Air Quality Monitoring Data QA/QC
Automatic Monitoring QA/QC
Chelmsford City Council operates four automatic monitoring sites measuring NO2,
PM10 and O3. Data from these sites is collected by a contractor and forwarded to the
Councils server.
Daily data validation checks are made to ensure the analysers are working correctly
and to identify any abnormal readings that may occur.
The automatic monitoring station equipment is serviced every six months by a
contractor who also carries out maintenance callouts when faults are identified.
The analysers are calibrated fortnightly with a certified reference gas by Council
officers. All sites also have triplicate NO2 diffusion tubes and the Springfield Road
(Prison) site is used to calculate a local bias adjustment.
Data ratification for the analyser contains following processes;
• Applying the scaling factors derived from calibrations, maintenance visits and
servicing
• Checking for equipment drift with adjustments made where detected
• Comparison of data with other pollutants and other appropriate Essex Air
monitoring sites
• Checking for and deletion of erroneous data that can be linked to analyser
failure or unrepresentative periods of operation
Diffusion Tubes QA/QC
Chelmsford City Council undertook monitoring using 70 nitrogen dioxide diffusion
tubes at 52 sites in 2016.
The diffusion tubes were supplied by Environmental Scientifics Group (ESG Didcot)
(UKAS Testing Laboratory number 1015) with a preparation method of 50%
triethanolamine (TEA) in Acetone.
The AIR NO2 proficiency testing scheme found that the laboratory achieved the
following percentage of results determined as satisfactory for 2016:

Chelmsford City Council
28 LAQM Annual Status Report 2017
Table D.1 – AIR PT Results 2016
AIR PT
Round
AIR PT
AR006
AIR PT AR007 AIR PT AR009 AIR PT AR010
Round
conducted
in the period
January –
February
2016
April – May
2016
July – August
2016
September –
October 2016
ESG Didcot 100% 75% 75% 100%
Diffusion Tube Bias Adjustment Factors
Chelmsford City Council acknowledges the National Bias Adjustment data that is
available however chooses to use a Local Bias Adjustment figure.
Figure D.1 - Local Bias Adjustment Calculation
A bias adjustment factor of 0.71 using data captured from the Springfield Road AQMS
which being a roadside site is representative of exposure at the high traffic locations in
Chelmsford.
Point Sources
No significant new point sources of emissions have been identified.
Chelmsford City Council
29 LAQM Annual Status Report 2017
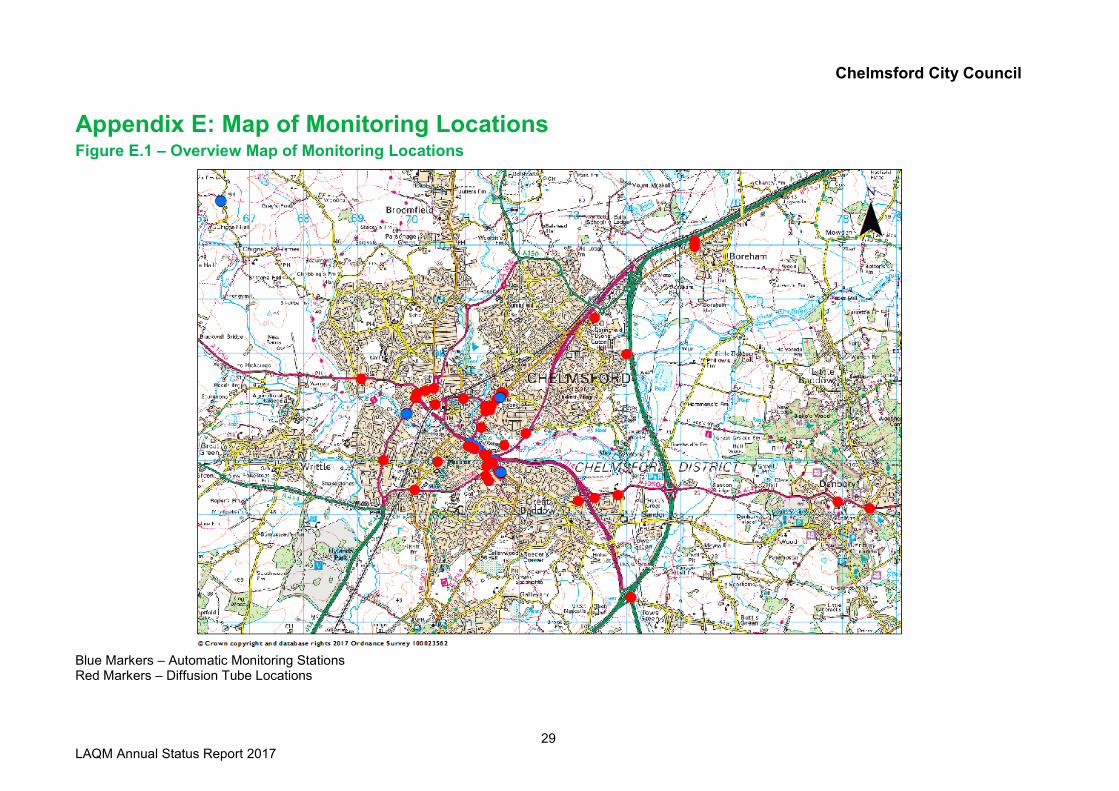
Appendix E: Map of Monitoring Locations Figure E.1 – Overview Map of Monitoring Locations
Blue Markers – Automatic Monitoring Stations Red Markers – Diffusion Tube Locations
Chelmsford City Council
30 LAQM Annual Status Report 2017
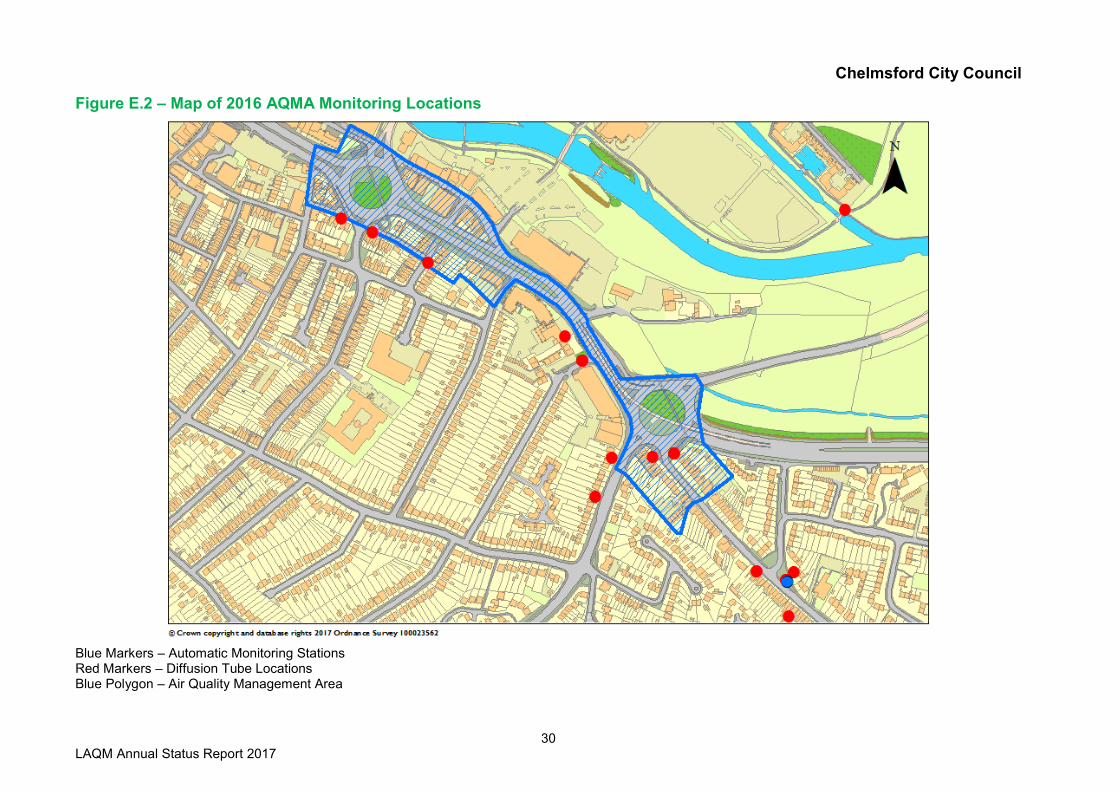
Figure E.2 – Map of 2016 AQMA Monitoring Locations
Blue Markers – Automatic Monitoring Stations Red Markers – Diffusion Tube Locations Blue Polygon – Air Quality Management Area
Chelmsford City Council
31 LAQM Annual Status Report 2017
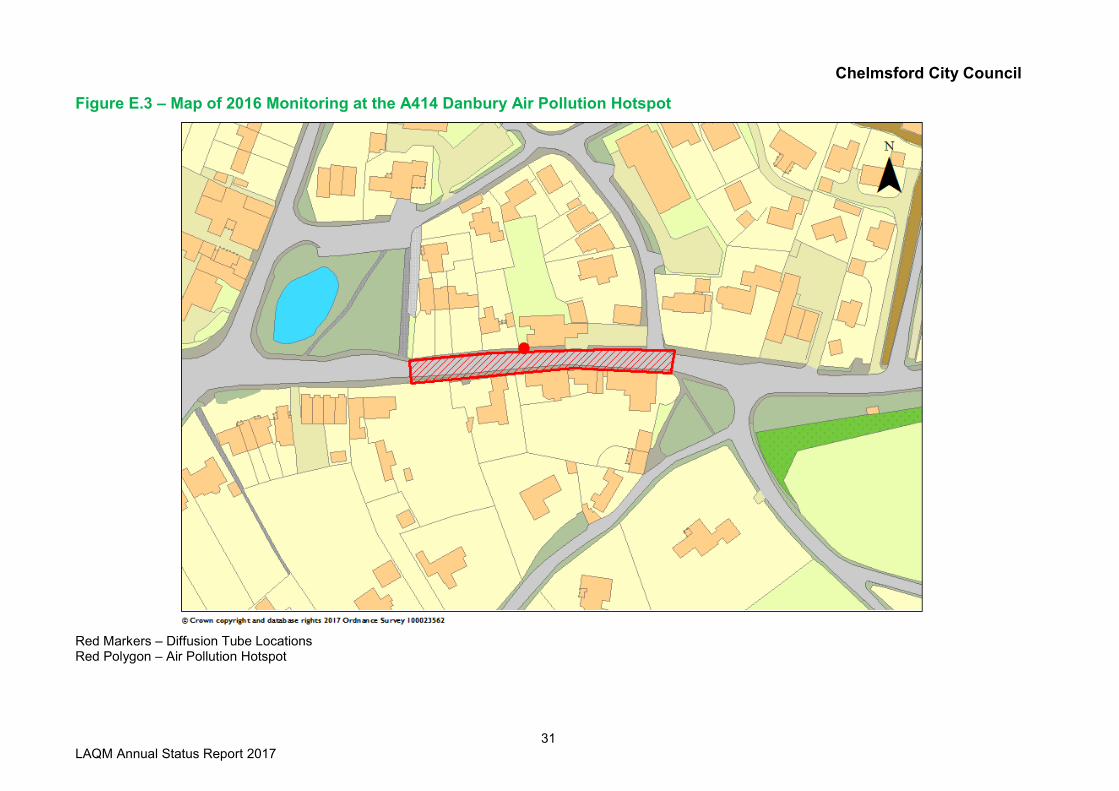
Figure E.3 – Map of 2016 Monitoring at the A414 Danbury Air Pollution Hotspot
Red Markers – Diffusion Tube Locations Red Polygon – Air Pollution Hotspot

Chelmsford City Council
32 LAQM Annual Status Report 2017
Figure E.4 – Map of 2016 Monitoring at the Springfield Road Air Pollution Hotspot
Red Markers – Diffusion Tube Locations Red Polygon – Air Pollution Hotspot
Chelmsford City Council
33 LAQM Annual Status Report 2017
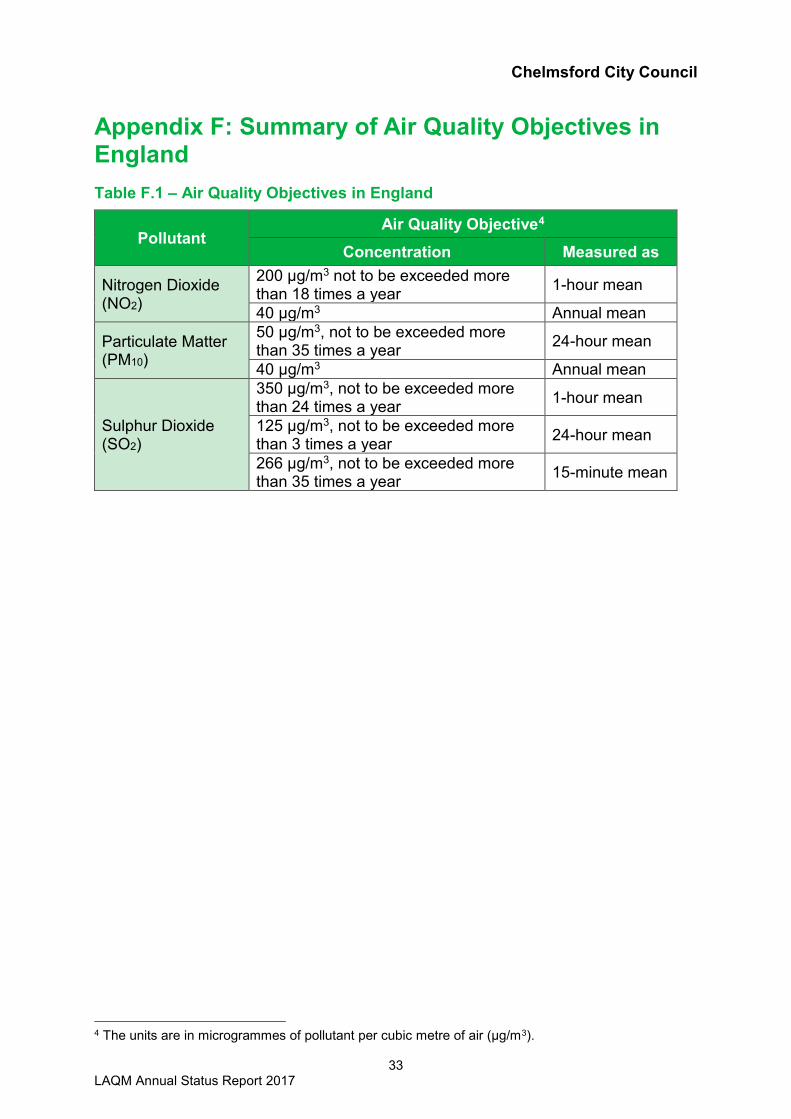
Appendix F: Summary of Air Quality Objectives in England
Table F.1 – Air Quality Objectives in England
Pollutant Air Quality Objective4
Concentration Measured as
Nitrogen Dioxide (NO2)
200 µg/m3 not to be exceeded more than 18 times a year
1-hour mean
40 µg/m3 Annual mean
Particulate Matter (PM10)
50 µg/m3, not to be exceeded more than 35 times a year
24-hour mean
40 µg/m3 Annual mean
Sulphur Dioxide (SO2)
350 µg/m3, not to be exceeded more than 24 times a year
1-hour mean
125 µg/m3, not to be exceeded more than 3 times a year
24-hour mean
266 µg/m3, not to be exceeded more than 35 times a year
15-minute mean
4 The units are in microgrammes of pollutant per cubic metre of air (µg/m3).
Chelmsford City Council
34 LAQM Annual Status Report 2017
Appendix G: AQMA Order
Figure G.1 – Chelmsford City Council AQMA Order
Chelmsford City Council
35 LAQM Annual Status Report 2017
Chelmsford City Council
36 LAQM Annual Status Report 2017
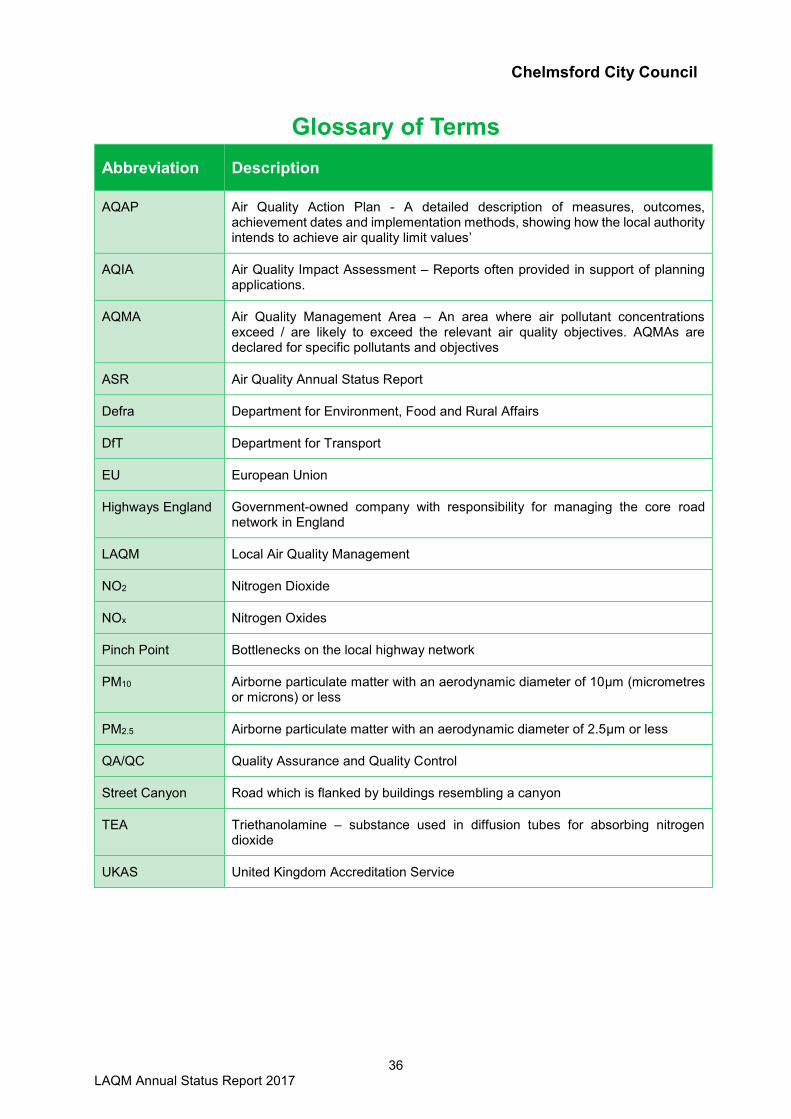
Glossary of Terms
Abbreviation Description
AQAP Air Quality Action Plan - A detailed description of measures, outcomes, achievement dates and implementation methods, showing how the local authority intends to achieve air quality limit values’
AQIA Air Quality Impact Assessment – Reports often provided in support of planning applications.
AQMA Air Quality Management Area – An area where air pollutant concentrations exceed / are likely to exceed the relevant air quality objectives. AQMAs are declared for specific pollutants and objectives
ASR Air Quality Annual Status Report
Defra Department for Environment, Food and Rural Affairs
DfT Department for Transport
EU European Union
Highways England Government-owned company with responsibility for managing the core road network in England
LAQM Local Air Quality Management
NO2 Nitrogen Dioxide
NOx Nitrogen Oxides
Pinch Point Bottlenecks on the local highway network
PM10 Airborne particulate matter with an aerodynamic diameter of 10µm (micrometres or microns) or less
PM2.5 Airborne particulate matter with an aerodynamic diameter of 2.5µm or less
QA/QC Quality Assurance and Quality Control
Street Canyon Road which is flanked by buildings resembling a canyon
TEA Triethanolamine – substance used in diffusion tubes for absorbing nitrogen dioxide
UKAS United Kingdom Accreditation Service
Chelmsford City Council
37 LAQM Annual Status Report 2017
References
airTEXT air quality, UV, pollen and temperature forecasts available at;
http://www.airtext.info/
AEA Energy & Environment – Checking Precision & Accuracy of Triplicate Tubes
available at; http://laqm.defra.gov.uk/documents/AEA_DifTPAB_v04.xls
Chelmsford New Local Plan available at; https://www.chelmsford.gov.uk/planning-and-
building-control/planning-policy-and-new-local-plan/new-local-plan/
Chelmsford Statutory Air Quality Reports available at;
http://www.essexair.org.uk/AQInEssex/LA/Chelmsford.aspx?View=reports&ReportTy
pe=CHELMSFORD
Defra Air Quality web pages available at; http://uk-air.defra.gov.uk.
Defra Diffusion Tube Bias Adjustment Factors Spreadsheet available at;
http://laqm.defra.gov.uk/documents/Database_Diffusion_Tube_Bias_Factors_v06_16
-Final.xls
Defra LAQM Summary of Laboratory Performance in AIR NO2 PT Scheme available
at; http://laqm.defra.gov.uk/documents/LAQM-AIR-PT-Rounds-1-12-(April-2014-
February-2016)-NO2-report.pdf
Defra LAQM Policy Guidance LAQM.PG16 available at;
http://laqm.defra.gov.uk/documents/LAQM-PG16-April-16-v1.pdf
Defra LAQM Technical Guidance LAQM.TG16 available at;
http://laqm.defra.gov.uk/documents/LAQM-TG16-April-16-v1.pdf
Defra Nitrogen Dioxide Fall-Off with Distance Calculator available at;
http://laqm.defra.gov.uk/tools-monitoring-data/no2-falloff.html
Essex Air Quality Consortium available at;
http://www.essexair.org.uk/AQInEssex/LA/Chelmsford.aspx
Essex Air Twitter Feed available at; https://twitter.com/essexair
EssexCarShare.com available at; https://essex.liftshare.com/
Essex County Council Major Schemes website available at;
http://www.essexhighways.org/Transport-and-Roads/Highway-Schemes-and-
Developments/Major-Schemes.aspx
Chelmsford City Council
38 LAQM Annual Status Report 2017
Essex County Council Pinch Point Fund available at;
http://www.essexhighways.org/Transport-and-Roads/Highway-Schemes-and-
Developments/Major-Schemes/Pinch-Point-Fund.aspx
Fine (PM2.5) and Coarse (PM2.5-10) Particulate Matter on a heavily trafficked London
Highway: Sources and Processes available at; https://uk-
air.defra.gov.uk/assets/documents/reports/cat05/0506061415_Fine_PM25_and_Coa
rse4.pdf
Highways England A138 – Replacement of Chelmer Viaduct available at;
http://www.highways.gov.uk/roads/road-projects/a138-chelmsford-replacement-of-
chelmer-viaduct/
Public Health Outcomes Framework available at; http://www.phoutcomes.info/