Embed Size (px)
Citation preview

2017 Holiday Shoe Sales Survey
A nation-wide survey of footwear consumerson their purchasing habits this holiday season
National Holiday Shoe Sales Survey ECPS 11/5-‐8, 2017 1
This survey was commissioned by
The footwear industry’s business and trade association
At over 80% of the entire industry, the Footwear Distributors and Retailers of America (FDRA) is the largest and most respected footwear trade association in the U.S. It represents and serves the entire footwear industry from small family owned footwear businesses to global footwear companies, as well as domestic manufactures, importers, and retailers. In all, it supports more than 130 companies and over 200 brands designing, producing, and selling great footwear to consumers all over the globe.
This survey was conducted by
The Emerson College Polling Society (ECPS) is a research center at Emerson College in Boston, Massachusetts whose focus is on economics, politics, sports, and entertainment public opinion . ECPS surveys and polls are internationally recognized and in 2016 Bloomberg News ranked ECPS as the most accurate collegiate pollster for the Presidential Primaries. Over the last year, ECPS surveys and polls outperformed CNN, Fox News, WSJ, and PPP in terms of overall accuracy. ECPS is a charter member of the Transparency Initiative of the American Association of Public Opinion Research (AAPOR).
Questions about this survey should be directed to [email protected] Any portion of this survey used for any purpose without written consent of FDRA is strictly prohibited.

National Holiday Shoe Sales Survey ECPS 11/5-‐8, 2017 2
Contents Methodology ..................................................................................................................... 3 Executive Summary ......................................................................................................... 4 Results ............................................................................................................................. 6 Demographics ................................................................................................................ 13
Looking for more information on the footwear industry?
Visit the new FDRA.org to find a range of stats, data and analysis and subscribe to Shoe-‐in Show to hear industry leaders discuss business insights and trends!
National Holiday Shoe Sales Survey ECPS 11/5-‐8, 2017 3
Methodology The Emerson College Polling Society, under the supervision of Professor Spencer Kimball is pleased to present the Footwear Distributors and Retailers of America (FDRA) with the findings from a survey of likely holiday footwear shoppers. All respondents interviewed in this study were part of a fully representative sample using an area probabilistic sampling method of N= 800 (sample size). The margin of error for the sample is +/-‐ 3.4% in 19 of 20 cases.
The survey was administered using both landline, cellphones and online via Survey Sampling International (SSI) and IVR, and was conducted between November 5-‐8, 2017.
A screening question was used to gauge if respondents intended to shop for footwear this holiday season.
The results presented in this report include univariate and bivariate analysis of the data. Frequency distributions for each item included on the questionnaire are shown in the tables. In all cases, cross-‐tabulation results are also shown. This type of bivariate analysis examines differences between sub-‐groups of the overall population.
In the cases where cross tabulation results are presented, a chi-‐square test, an independent t-‐test for means, or a Z-‐test for independent percentages is shown. A chi-‐square test is used in cases where comparisons are made for categorical variables. A t-‐test is used in cases where comparisons are made for measurement variables. A Z-‐test is used in cases where comparisons are made between independent population percentages.
The purpose of these statistical tests is to determine whether or not the observed difference between sub-‐groups in the sample is due to sampling error or whether it is due to a real difference in the population. When the results are statistically significant, it strongly suggests that the observed difference between sub-‐groups found in the sample is due to a real difference in the population, and not due to sampling error.
A chi-‐square significance level of.05 indicates significance at the 95 percent level. In other words, it is 95 percent likely that the results are due to a real difference between comparison groups. A chi-‐square significance level of .01 indicates significance at the 99 percent level. When a t-‐test or a Z-‐test is shown, lower-‐ and upper-‐case letters indicate significance at the 90 and 95 percent levels respectively.
Data was not weighted.
National Holiday Shoe Sales Survey ECPS 11/5-‐8, 2017 4
Executive Summary
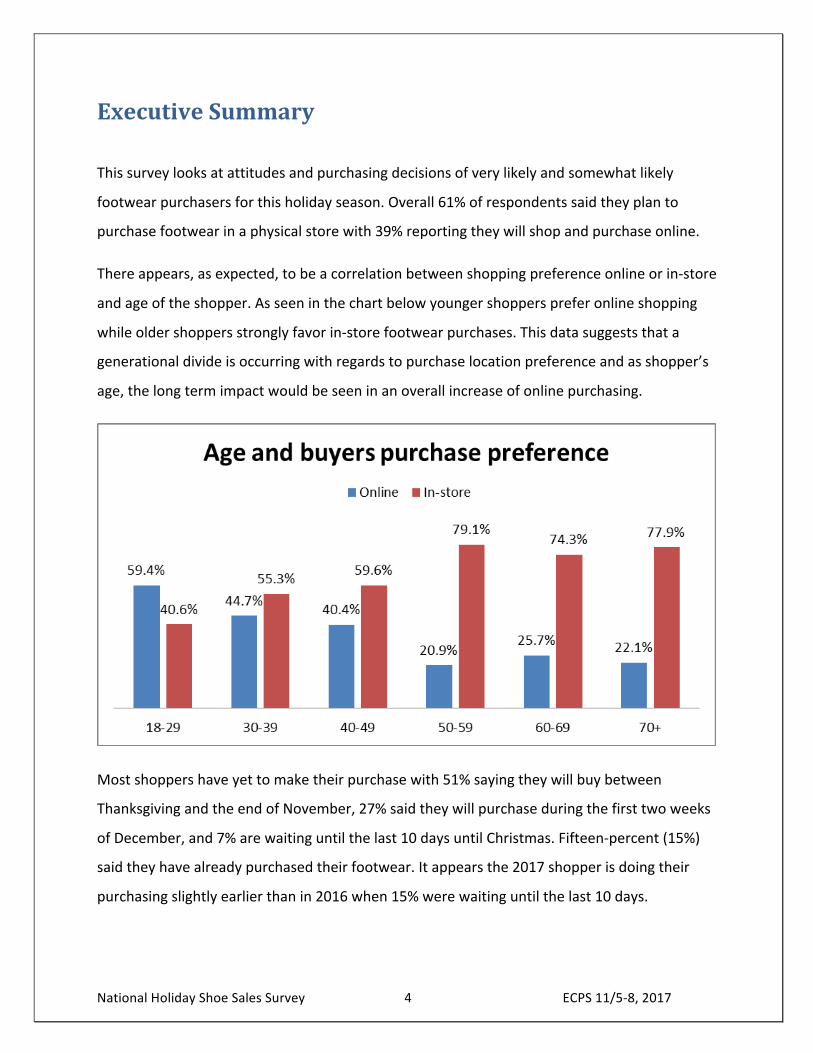
This survey looks at attitudes and purchasing decisions of very likely and somewhat likely
footwear purchasers for this holiday season. Overall 61% of respondents said they plan to
purchase footwear in a physical store with 39% reporting they will shop and purchase online.
There appears, as expected, to be a correlation between shopping preference online or in-‐store
and age of the shopper. As seen in the chart below younger shoppers prefer online shopping
while older shoppers strongly favor in-‐store footwear purchases. This data suggests that a
generational divide is occurring with regards to purchase location preference and as shopper’s
age, the long term impact would be seen in an overall increase of online purchasing.
Most shoppers have yet to make their purchase with 51% saying they will buy between
Thanksgiving and the end of November, 27% said they will purchase during the first two weeks
of December, and 7% are waiting until the last 10 days until Christmas. Fifteen-‐percent (15%)
said they have already purchased their footwear. It appears the 2017 shopper is doing their
purchasing slightly earlier than in 2016 when 15% were waiting until the last 10 days.

National Holiday Shoe Sales Survey ECPS 11/5-‐8, 2017 5
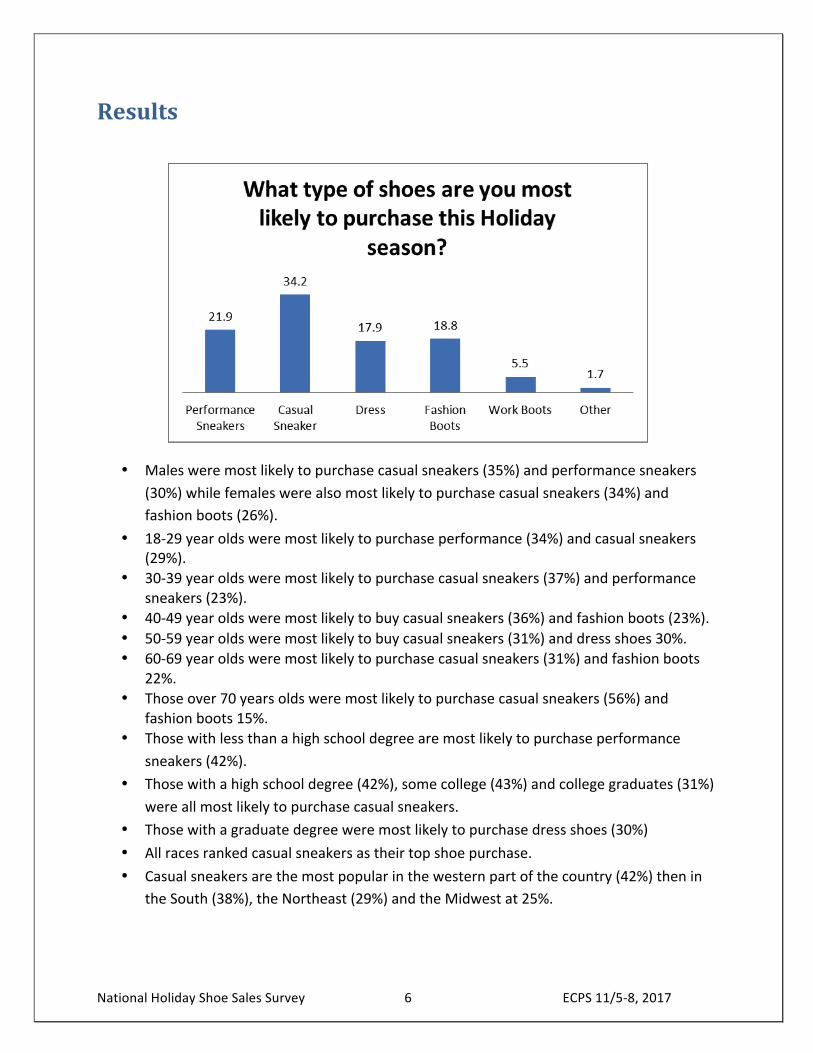
Comfort/casual sneakers/leisure footwear is the most popular footwear item for this survey’s
second year with 34% reporting likely to purchase. Similar to 2016 numbers, performance
sneakers for the gym or sports were ranked second at 22% and in a statistical tie with fashion or
winter boots at 19% and dress shoes like heels, flats, or men’s oxfords at 18%. Work boots were
the choice of 6% and 2% reported they were purchasing something else.
Online Shoppers are going to Amazon 48% of the time for their footwear purchases up slightly
from last year where 44% reported using Amazon. For in-‐store purchases chain stores are the
preferred choice of 49%.
A plurality of shoppers (45%) are conducting their shoe research while shopping in stores, 32%
are using retailer websites only 3% are currently using social media like Facebook.
The most important factor for purchasing shoes this holiday season was split between the cost
(34%) and the need (32%), which was significantly different than last year when cost was rated
most important at 41% and need was much less a factor at 15%. This suggests pocketbooks are
tightening this season.
Ensuring proper fit and comfort is what 45% of shoppers said was what they most liked about
in-‐store shopping. For online shopping, convenience was ranked as most important (33%)
whiles prices were ranked second at 24%. In 2016, better pricing was the top choice at 33% for
online shoppers.
Shoppers are planning on spending less money this year than they did last year (39% to 29%),
while in 2016, 36% said they plan on spending more money and 33% said less. However, in a
separate question about how much shoppers plan to spend, 61% said over $100 which is up
from 49% in 2016. Those planning to spend over $250 also saw an increase from 10% to 17%
this holiday season.
This year’s footwear holiday shoppers are more likely to be female than male (62% to 38%),
younger with 45% being under 40 and slightly higher educated with 50% having a college
degree or better. This is a similar profile that was seen in 2016 with 57% being female, 54%
being under 40 and 57% having a college degree or better.
National Holiday Shoe Sales Survey ECPS 11/5-‐8, 2017 6
Results
• Males were most likely to purchase casual sneakers (35%) and performance sneakers (30%) while females were also most likely to purchase casual sneakers (34%) and fashion boots (26%).
• 18-‐29 year olds were most likely to purchase performance (34%) and casual sneakers (29%).
• 30-‐39 year olds were most likely to purchase casual sneakers (37%) and performance sneakers (23%).
• 40-‐49 year olds were most likely to buy casual sneakers (36%) and fashion boots (23%). • 50-‐59 year olds were most likely to buy casual sneakers (31%) and dress shoes 30%. • 60-‐69 year olds were most likely to purchase casual sneakers (31%) and fashion boots
22%. • Those over 70 years olds were most likely to purchase casual sneakers (56%) and
fashion boots 15%. • Those with less than a high school degree are most likely to purchase performance
sneakers (42%). • Those with a high school degree (42%), some college (43%) and college graduates (31%)
were all most likely to purchase casual sneakers. • Those with a graduate degree were most likely to purchase dress shoes (30%) • All races ranked casual sneakers as their top shoe purchase. • Casual sneakers are the most popular in the western part of the country (42%) then in
the South (38%), the Northeast (29%) and the Midwest at 25%.

National Holiday Shoe Sales Survey ECPS 11/5-‐8, 2017 7
• No gender difference on when they will make their holiday footwear purchase. • Nearly 25% of those over 60 have already purchased their footwear product while 62%
of those 18-‐39 are looking to make their purchase between Black Friday and the end of November.
• Those with less than a high school degree were significantly different than all other educational cohorts with 42% already made their footwear purchase compared to 13% of those with a high school degree or more.
• Men were slightly more likely to purchase online (42%) than women 37%. • The younger age group is significantly more willing to purchase online than those older. • Only Asians (54%) were more likely to purchase online than in a store. Caucasians 41%
online, African Americans, 34% online, Hispanics 37% online.

National Holiday Shoe Sales Survey ECPS 11/5-‐8, 2017 8
• Males are more likely to go to Amazon (58%) than females (42%). Females are more likely to shop at retailers’ sites (18%) than males (8%).
• Amazon is the preferred choice with all age groups, however 55% of those under 50 reported using Amazon while those over 50, 32% reported Amazon, 23% reported retailers.
• Those with less than a high school degree were significantly more likely to shop at Amazon (85%) than all other respondents.
• Respondents with a post graduate degree differed from the overall population with 28% shopping at Amazon, 26% at the brand’s own site, 23% at an online sales site, and 22% as a retailer’s site.
• African Americans were significantly different with other ethnic groups with 30% reporting their shopping at retailer’s sites and 30% at Amazon.
National Holiday Shoe Sales Survey ECPS 11/5-‐8, 2017 9
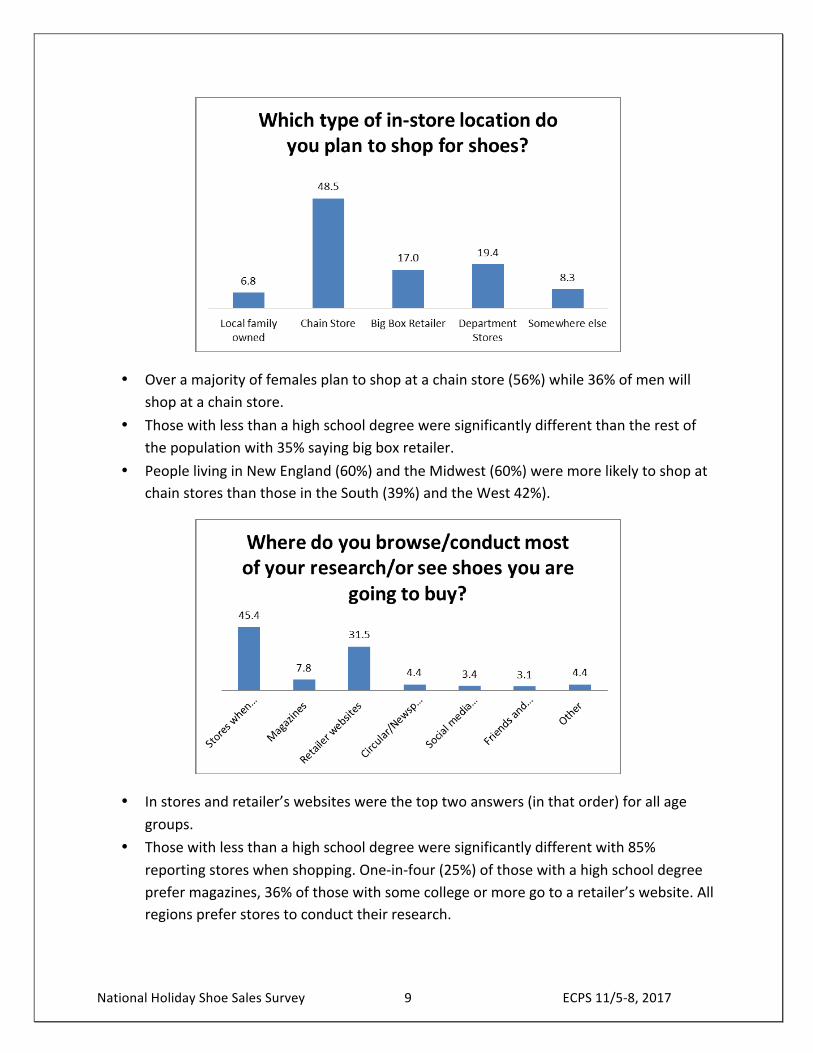
• Over a majority of females plan to shop at a chain store (56%) while 36% of men will shop at a chain store.
• Those with less than a high school degree were significantly different than the rest of the population with 35% saying big box retailer.
• People living in New England (60%) and the Midwest (60%) were more likely to shop at chain stores than those in the South (39%) and the West 42%).
• In stores and retailer’s websites were the top two answers (in that order) for all age groups.
• Those with less than a high school degree were significantly different with 85% reporting stores when shopping. One-‐in-‐four (25%) of those with a high school degree prefer magazines, 36% of those with some college or more go to a retailer’s website. All regions prefer stores to conduct their research.

National Holiday Shoe Sales Survey ECPS 11/5-‐8, 2017 10
• Those under 50 reported cost as their most important factor at 41% while those over 50 reported need as the most important factor at 42%.
• Those with less than a high school degree differed with 53% reporting cost while high school through college were split with 33% reporting cost and 31% reporting need. Those with a post graduate degree reported need (46%) over cost (29%).
• New Englanders reported need over cost 40% to 28%, Midwesterners (41% to 25%) and Southerners (38% to 31%) reported cost over need while those in the Western states were split at 30% between need and cost.
• Those with a high school degree liked customer service (47%) and Convenience (22%). • Those with a high school degree liked customer service (32%), ensuring proper fit and
comfort (31%), and convenience 27%. • A majority (51%) of those with some college or more reporting they shop in-‐store to
ensure proper fit and comfort.
National Holiday Shoe Sales Survey ECPS 11/5-‐8, 2017 11
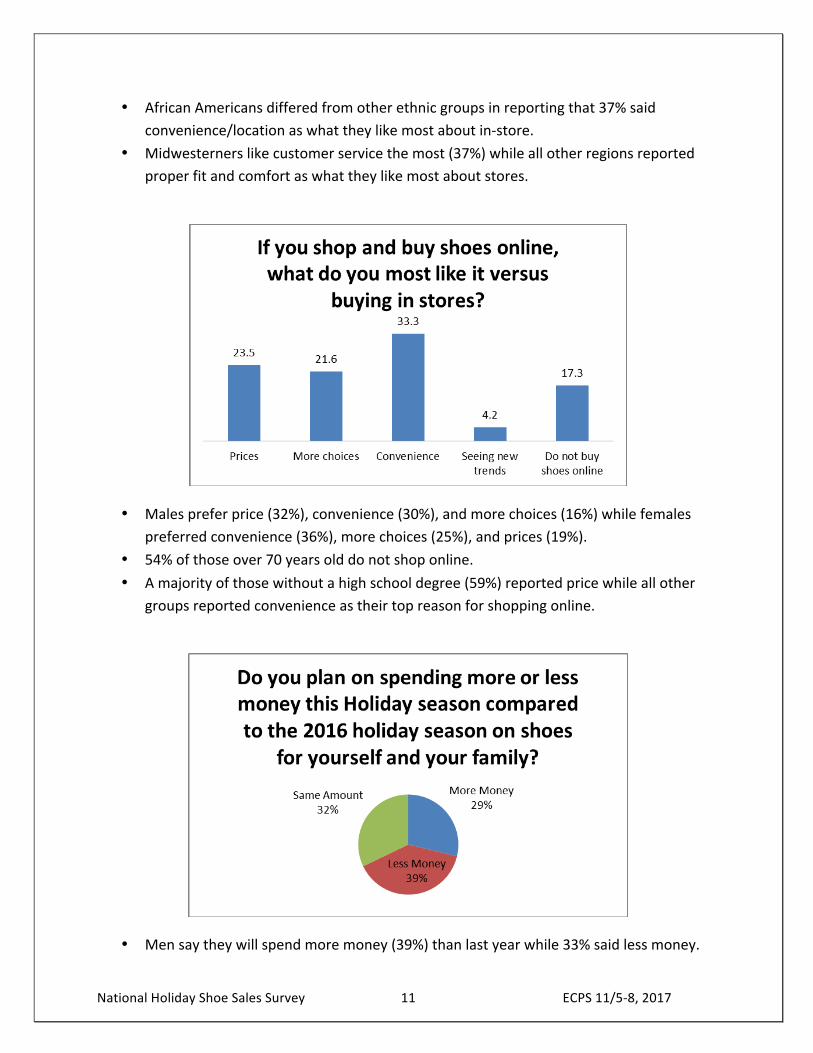
• African Americans differed from other ethnic groups in reporting that 37% said convenience/location as what they like most about in-‐store.
• Midwesterners like customer service the most (37%) while all other regions reported proper fit and comfort as what they like most about stores.
• Males prefer price (32%), convenience (30%), and more choices (16%) while females preferred convenience (36%), more choices (25%), and prices (19%).
• 54% of those over 70 years old do not shop online. • A majority of those without a high school degree (59%) reported price while all other
groups reported convenience as their top reason for shopping online.
• Men say they will spend more money (39%) than last year while 33% said less money.

National Holiday Shoe Sales Survey ECPS 11/5-‐8, 2017 12
• Females say they will spend less money (43%) than last year while 23% said more money.
• 18-‐29 year olds were the only age cohort to say they will be spending more money (45%) this year, all other age groups reported spending less.
• African Americans (50%) and Hispanics (48%) said they would be spending less this year. • Asians were the only ethnic group to report spending more this year that last (38%).

National Holiday Shoe Sales Survey ECPS 11/5-‐8, 2017 13
Demographics

1319 F Street, NW, Suite 700Washington, DC 20004
the footwear industry’s business and trade association


![Online Holiday Sales Season [Tips]](https://img.pdfslide.net/doc/110x75/58e5f9a21a28ab09478b552b/online-holiday-sales-season-tips.jpg)