Embed Size (px)
Citation preview

2017ANNUAL REPORT
20
17 A
NN
UA
L RE
PO
RT
ST
ELLA
-JON
ES

2007 2012 2017
NET INCOME GROWTH SINCE 2007
$1,886.1 MIN TOTAL SALES
$207.4 MOF OPERATING INCOME
$167.9 MOF NET INCOME
25.7
73.1
167.9

Stella-Jones Inc.2017 Annual Report
1
Building On Our ExpertiseA ofQuarter Century
Railway Ties
Stella-Jones is a principal supplier
of the more than twenty million ties
purchased annually by the railroad
industry in North America.
$651.5 M 2017SALES SALES GROWTH SINCE 2007
34.5%OF SALES
2007 2012 2017
94.4
404.5
651.5
Utility Poles
Offering an unparalleled security of
supply, Stella-Jones is one of the
continent’s largest producers of
pressure-treated poles.
$654.0 M 2017SALES SALES GROWTH SINCE 2007
34.7%OF SALES
2007 2012 2017
129.8
218.5
654.0

Stella-Jones Inc.2017 Annual Report
2
19.4%OF SALES
Residential Lumber
Diversifying within its core
competence, Stella-Jones has made
residential lumber a rapidly growing
component of its core product
offering.
$366.2 M 2017SALES SALES GROWTH SINCE 2007
2007 2012 2017
29.6 35.5
366.2
5.0%OF SALES
Industrial Products
Stella-Jones generates additional
revenues by pre-plating ties for railway
clients, and by manufac tu ring marine
pilings, bridge timbers, highway guardrail
posts and panelized railway crossings.
$94.5 M 2017SALES SALES GROWTH SINCE 2007
2007 2012 2017
15.9
59.0
94.5
Logs and Lumber
Untreated lumber, as well as logs unsuitable
for use as poles, are marketed by Stella-
Jones as significant sources of ancillary
revenue and key to ensuring reliability and
minimizing costs for our poles and lumber.
$119.9 M 2017SALES SALES GROWTH SINCE 2007
2007 2012 2017
N/A N/A
119.9
6.4%OF SALES

Stella-Jones Inc.2017 Annual Report
3
5-Year Financial
For the years ended December 31 2017 2016 2015 2014 2013
(millions of dollars, except per share data and ratios) $ $ $ $ $
OPERATING RESULTS
Sales 1,886.1 1,838.4 1,559.3 1,249.5 1,011.3
Operating income 1 207.4 233.2 220.1 155.7 138.7
Net income 167.9 153.9 141.4 103.8 92.5
FINANCIAL POSITION
Working capital 779.4 928.0 854.4 615.1 517.0
Total assets 1,786.0 1,960.9 1,778.9 1,289.0 1,071.9
Total debt 2 455.6 694.0 669.9 444.6 372.9
Shareholders’ equity 1,115.5 1,026.4 913.5 692.3 572.2
PER SHARE DATA
Basic earnings per common share 2.42 2.22 2.05 1.51 1.35
Diluted earnings per common share 2.42 2.22 2.04 1.50 1.34
Book value 16.09 14.81 13.21 10.04 8.33
Dividend per share 0.44 0.40 0.32 0.28 0.20
Average number of shares outstanding (000’s) 69,324 69,215 69,018 68,802 68,681
Average number of diluted shares outstanding (000’s) 69,333 69,231 69,153 69,027 69,053
Shares outstanding at year end (000’s) 69,342 69,303 69,137 68,949 68,697
FINANCIAL RATIOS
Operating margin 11.0% 12.7% 14.1% 12.5% 13.7%
Return on average equity 15.7% 15.9% 17.6% 16.4% 17.8%
Total debt 2 to total capitalization 0.29:1 0.40:1 0.42:1 0.39:1 0.39:1
Total debt 2 to trailing 12-month EBITDA 1 1.89 2.62 2.75 2.52 2.41
Working capital 7.04 8.58 6.36 8.33 8.97
1 These items are financial measures not prescribed by International Financial Reporting Standards (“IFRS”) as issued by the International Accounting Standards Board and Chartered Professional Accountant Canada Handbook Part 1 and are not likely to be comparable to similar measures presented by other issuers. Please refer to the Non-IFRS financial measures section in the management’s discussion and analysis.
2 Including the current portion of long-term debt.
Performance

Stella-Jones Inc.2017 Annual Report
4
ContinuedStrength
As we mark the 25th anniversary of Stella-Jones’ founding, and in line with the pattern of decades of success, we remain singularly devoted to the pressure treatment of wood, and the manufacture of high-quality railway ties, utility poles, residential lumber and ancillary treated wood products. Following that same historic pattern, the efficiency of our Company’s network in 2017 once again improved, and our market reach and sales also grew. These are the effects of our disciplined approach of adhering strictly to our core competence – and increasingly leveraging that specialized expertise to benefit our clients and shareholders.
For Stella-Jones, 2017 was a year of Company-wide integration, with
negotiations leading to the smaller-scale, yet synergistic, early 2018
acquisition of the operations of Prairie Forest Products, a treated lumber and
pole producer. This purchase also represented the extension of our treating
facility network into the province of Manitoba for the first time. It was also a
year during which we faced strong commercial headwinds, particularly in the
railway tie sector which I referred to in my report last year.

Stella-Jones Inc.2017 Annual Report
5
High inventory levels, which started to build across the industry in the fourth
quarter of 2016, put pressure on prices and margins. These inventories only
reached more normal historical levels during the latter part of 2017. Margins
also came under pressure in the utility pole product category, although this
situation mainly reflects our greater reach in the U.S. southeast, where the
predominant wood species gives rise to a different sales and margin mix for
the Company. Finally, our residential lumber activities had to cope with steep
rises in lumber prices in Canada and the United States, but the strength of
Stella-Jones’ network still produced solid growth.
Despite these challenges and without any boost from large-scale acquisitions,
Stella-Jones achieved a 17th consecutive year of sales and net income
growth. Consolidated sales and net income in 2017 reached $1.89 billion and
$168.0 million, respectively, compared with $1.84 billion and $154.0 million
in the previous year. Once again, the Company’s overall financial strength was
demonstrated by a net reduction in total debt of more than $200.0 million.
As Stella-Jones begins its second quarter century, we are optimistic about
the prospects for 2018 in all sectors of our business. The essential need
both in Canada and the United States to upgrade the infrastructure of the rail
and utility networks will underpin demand for our ties and poles, and strong
economic growth in both countries will provide support for our residential
lumber sales.
On behalf of the Board, I thank our shareholders for their continued support,
and all our employees for their excellent and productive contribution in a year
that tested our proven strengths.
Tom A. Bruce Jones, CBE
Chairman of the Board
The Stella-JonesAdvantage
Our Team: Stronger Together
Numerous strategic acquisitions have
brought assets, systems, market intelligence
and seasoned personnel to Stella-Jones.
With the resulting economies of scale,
leveraged network efficiencies, and ever-
increasing reliability as a supplier, our
continent-wide team has consistently
expanded the Company’s market reach.
Well-Positioned Network
The network of Stella-Jones facilities
spread across Canada and the U.S. reflect
a methodical expansion strategy that has
achieved unrivalled continental coverage in
the wood-treating industry.
Expanding Possibilities with Our Expertise
Adhering to its core competence,
Stella-Jones progressively strengthens its
expertise and the reliability of its products.
The Company thereby enhances the
confidence of its customers while
widening its client base.

Stella-Jones Inc.2017 Annual Report
6
Buildingon Success
In 2017, for the seventeenth consecutive year, Stella-Jones generated increased revenues and higher net income. This record of sustained growth and increasing profitability has been achieved by virtue of a tightly focused strategy that combines strategic acquisitions, core product offerings and steadily improved network efficiency. Year after year, these principal characteristics of the Stella-Jones business model have enhanced the Company’s market scope, steadily enlarged its potential, and made it a consistent, deeply entrenched and highly trusted force in the North American wood treating industry. The result has been, and continues to be, progressively heightened shareholder value.

Stella-Jones Inc.2017 Annual Report
7
New milestones in revenue and net income were reached by Stella-Jones in 2017. These
achievements were driven by the continental reach of our network, the productivity of our people
and the confidence of our clients.
Annual sales amounted to $1.89 billion. Excluding the conversion effect caused by fluctuations
in the value of the Canadian dollar vis-à-vis the U.S. dollar and full-year contribution from 2016
acquisitions, sales rose by approximately 1.1%.
Net income totaled $167.9 million, or $2.42 per diluted share, compared with $153.9 million, or
$2.22 per diluted share, the previous year. The increase, which includes the gains from a one-time
non-cash deferred tax remeasurement for our U.S. subsidiaries from recent changes in the U.S.
Federal corporate income tax laws, represents the seventeenth straight year in which net income
has improved.
Throughout the year, demand remained generally healthy for our treated wood railway ties, utility
poles and residential lumber. Our margins were negatively affected by pricing pressures in the
railway tie category and by overall product mix. Still, the Company’s year-over-year larger presence
in the utility pole and residential lumber markets helped partially offset the effect of lower year-
over-year pricing in the tie category.
How would you describe market
demand for the Company’s
products in 2017, and its impact
upon Stella-Jones’ performance?
How did Stella-Jones perform in
2017, and what were the main
factors contributing to its results?
Q
Q

Stella-Jones Inc.2017 Annual Report
8
ASSURED CONTINUITY OF SUPPLY, MADE POSSIBLE BY A NETWORK OF THIRTY-
EIGHT PRODUCTION FACILITIES, TWELVE POLE PEELING FACILITIES AND A COAL
TAR DISTILLERY WHICH SPAN SIX PROVINCES AND NINETEEN STATES, IS A
DISTINGUISHING FEATURE OF STELLA-JONES’ SERVICE TO ITS CUSTOMERS.

Stella-Jones Inc.2017 Annual Report
9
While Stella-Jones paused its acquisition program in 2017, the Company used its strong cash
flow to reduce debt. The excellent financial condition of the Company also allowed for an increase
in dividend payments to shareholders. Dividend payments have now increased for thirteen
consecutive years.
With our ratio of long-term debt to equity substantially improved, and with a strong working capital
position, the key aspects that signal a solid, well-grounded, forward-looking and growing company
are precisely the same aspects that characterize the financial position of Stella-Jones.
A critical and enduring part of North America’s freight and passenger transportation system
consists of hundreds of thousands of miles of railway track. These tracks are held together by
millions of crossties which must be replaced as they age. Stella-Jones is one of the continent’s
foremost suppliers of this vital product.
In 2017, given generally positive economic conditions, railway operators continued to invest in
new track and track upgrades. Although year-over-year pricing pressures affected revenues, as
the market needed to orderly dispose of high tie inventories and pass through lower untreated tie
costs, our sales volume for the year remained relatively healthy. Railway ties accounted for 34.5%
of total revenues.
Stella-Jones has always played a role in supplying this basic element of North America’s industrial
infrastructure. The pressure-treated utility pole has long remained a key component for the
transmission and distribution of electricity and telecommunications. Over the last few decades,
Stella-Jones has grown substantially, such that today our Company is one of the continent’s
largest suppliers of poles, providing them in any required size, from a range of diverse wood
species and with a variety of preservative options.
In the utility pole category in 2017, we saw a gradual return to historical levels of maintenance
demand across the continent. In addition, our higher profile in the southeastern United States
improved our sales in that region. If we exclude the sales from acquisitions and the currency
conversion effect, the Company’s revenue from utility poles increased organically by 6.9%. The
category accounted for 34.7% of total sales.
Yes. Our growing participation in the residential lumber market over the last few years reflects
both our core expertise and strict business model. On the one hand, we are widely acknowledged
experts in the pressure treatment of wood, and on the other hand, our model prescribes that
our diversification initiatives should align with our established competence. Accordingly, the
manufacture of pressure treated lumber for outdoor renovation projects has proven a perfect fit
for expanding our business.
As we look back on 2017 and
forward to 2018 and beyond,
how would you characterize the
Company’s financial position?
How did the railway tie category
perform in 2017?
What results were achieved in the
utility pole category?
During the past year, did the
Company see continued growth in
its sales of residential lumber?
Q
Q
Q
Q

Stella-Jones Inc.2017 Annual Report
10
In 2017, we saw continued growth in residential lumber sales. With production capacity in both
Canada and the United States, and as the reputation of our brand strengthened, sales reached
$366.2 million, up approximately 6.0% over 2016. This increase also resulted from passing on higher
untreated lumber costs. Residential lumber accounted for 19.4% of total sales during the year.
Yes, and significantly so. As we have done for many years, we supplied wood-treated products
for niche markets, and specialized services for our railway clients. In the category which we call
Industrial Products, demand remained stable with revenue amounting to $94.5 million.
Finally, in our fifth category which we call Logs and Lumber and which involves the marketing of
untreated lumber as well as logs unsuitable for use as poles, sales were also important, totalling
$119.9 million.
In regards to our network, we focused on applying the extensive experience we have gained
over many years in integrating acquisitions and unlocking synergies. Contributing to the goal of
optimizing our efficiencies, the plants and other assets which the Company purchased in 2016 in
Texas, Louisiana and Canada have now been successfully integrated into our network.
Subsequent to year end, our acquisition of Prairie Forest Products, a treated lumber and wood
pole manufacturing facility in Manitoba, further reinforced the reliability of our production network
and distribution capabilities.
Moreover, our new state-of-the-art pole peeling and treating facility in Wisconsin, which became
fully operational in 2017, has made Stella-Jones a stronger supplier to our existing customers in
the utility pole market – and an increasingly attractive option for new customers.
One Step Further with Stella-Jones
Stella-Jones is powerfully demonstrating that adherence to core
competence does not preclude expansive diversification. In recent years,
the Company’s expertise in the pressure treatment of utility poles and
railway ties has enabled the Company to become a major supplier of
pressure-treated residential lumber used for outdoor applications such
as decks and fences. Thanks to the Company’s reputation for quality,
competitive pricing and reliable supply, Stella-Jones has continued to
grow this product category.
Apart from the three main
product categories for which
Stella-Jones is well known, did
the Company generate revenue
from ancillary activities?
What additions or improvements
were made to Stella-Jones’
network in 2017?
Q
Q
Stella-Jones Inc.2017 Annual Report
11
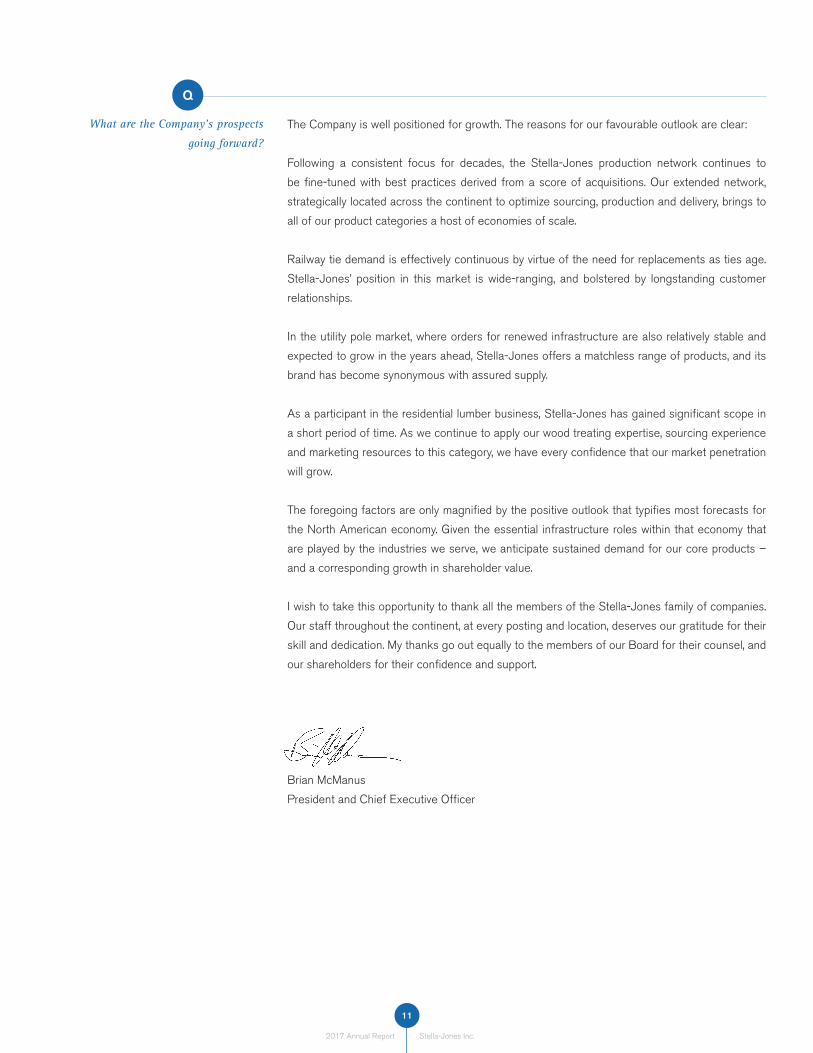
The Company is well positioned for growth. The reasons for our favourable outlook are clear:
Following a consistent focus for decades, the Stella-Jones production network continues to
be fine-tuned with best practices derived from a score of acquisitions. Our extended network,
strategically located across the continent to optimize sourcing, production and delivery, brings to
all of our product categories a host of economies of scale.
Railway tie demand is effectively continuous by virtue of the need for replacements as ties age.
Stella-Jones’ position in this market is wide-ranging, and bolstered by longstanding customer
relationships.
In the utility pole market, where orders for renewed infrastructure are also relatively stable and
expected to grow in the years ahead, Stella-Jones offers a matchless range of products, and its
brand has become synonymous with assured supply.
As a participant in the residential lumber business, Stella-Jones has gained significant scope in
a short period of time. As we continue to apply our wood treating expertise, sourcing experience
and marketing resources to this category, we have every confidence that our market penetration
will grow.
The foregoing factors are only magnified by the positive outlook that typifies most forecasts for
the North American economy. Given the essential infrastructure roles within that economy that
are played by the industries we serve, we anticipate sustained demand for our core products –
and a corresponding growth in shareholder value.
I wish to take this opportunity to thank all the members of the Stella-Jones family of companies.
Our staff throughout the continent, at every posting and location, deserves our gratitude for their
skill and dedication. My thanks go out equally to the members of our Board for their counsel, and
our shareholders for their confidence and support.
Brian McManus
President and Chief Executive Officer
What are the Company’s prospects
going forward?
Q

Stella-Jones Inc.2017 Annual Report
12
2
3 41
10 1213
14
1516
17
18
19
2023
26
30
29
27
31
32
33
35
37
7
3839
34
89
22
24
21
36
6
5
11
28
25
1 New Westminster, BC
2 Prince George, BC
3 Galloway, BC
4 Carseland, AB
5 Neepawa, MB
6 South River, ON
7 Guelph, ON
8 Stouffville, ON
9 Peterborough, ON
10 Gatineau, QC
11 Rivière-Rouge, QC
12 Delson, QC
13 Sorel-Tracy, QC
14 Truro, NS
15 Arlington, WA
16 Tacoma, WA
17 Sheridan, OR
18 Eugene, OR
19 Silver Springs, NV
20 Eloy, AZ
21 Lufkin, TX
22 Russellville, AR
23 Rison, AR
24 Converse, LA
25 Pineville, LA
26 Alexandria, LA
27 Bangor, WI
28 Cameron, WI
29 Memphis, TN
30 Scooba, MS
31 Fulton, KY
32 Winslow, IN
33 Montevallo, AL
34 Clanton, AL
35 Cordele, GA
36 Whitmire, SC
37 Goshen, VA
38 Dubois, PA
39 McAllisterville, PA
Treating Facilities
Coal Tar Distillery

2017 Annual Report
13MANAGEMENT’S DISCUSSION AND ANALYSIS
MANAGEMENT’S DISCUSSION AND ANALYSIS
CONSOLIDATED FINANCIAL STATEMENTS
FOR THE YEARS ENDED
DECEMBER 31, 2017 AND 2016
Stella-Jones Inc.
MANAGEMENT’S DISCUSSION AND ANALYSIS14
MANAGEMENT’S DISCUSSION & ANALYSIS
The following is Stella-Jones Inc.’s management discussion and analysis (“MD&A”). Throughout this MD&A, the terms “Company” and “Stella-Jones” shall mean Stella-Jones Inc., and shall include its independent operating subsidiaries.
This MD&A and the Company’s audited consolidated financial statements were approved by the Board of Directors on March 13, 2018. The MD&A provides a review of the significant developments and results of operations of the Company during the fiscal year ended December 31, 2017 compared with the fiscal year ended December 31, 2016. The MD&A should be read in conjunction with the Company’s audited consolidated financial statements for the years ended December 31, 2017 and 2016 and the notes thereto.
The MD&A contains statements that are forward-looking in nature. Such statements involve known and unknown risks and uncertainties that may cause the actual results of the Company to be materially different from those expressed or implied by such forward-looking statements. Such items include, among others: general economic and business conditions, product selling prices, raw material and operating costs, changes in foreign currency rates and other factors referenced herein and in the Company’s continuous disclosure filings. Unless required to do so under applicable securities legislation, the Company’s management does not assume any obligation to update or revise forward-looking statements to reflect new information, future events or other changes.
The Company’s audited consolidated financial statements are reported in Canadian dollars and are prepared in accordance with International Financial Reporting Standards (“IFRS”) as issued by the International Accounting Standards Board (“IASB”) and Chartered Professional Accountant (“CPA”) Canada Handbook Part I. All amounts in this MD&A are in Canadian dollars unless otherwise indicated.
Additional information, including the Company’s annual information form, quarterly and annual reports, and supplementary information is available on the SEDAR web site at www.sedar.com. Press releases and other information are also available in the Investor/Media Centre section of the Company’s web site at www.stella-jones.com.
OUR BUSINESSStella-Jones Inc. is a leading producer and marketer of pressure treated wood products. The Company supplies North America’s railroad operators with railway ties and timbers, and the continent’s electrical utilities and telecommunication companies with utility poles. Stella-Jones also manufactures and distributes residential lumber and accessories to retailers for outdoor applications, as well as industrial products which include marine and foundation pilings, construction timbers, wood for bridges and coal tar based products. The Company’s common shares are listed on the Toronto Stock Exchange (TSX: SJ).
As at March 13, 2018, the Company operated thirty-eight wood treating plants, twelve pole peeling facilities and a coal tar distillery. These facilities are located in six Canadian provinces and nineteen
American states and are complemented by an extensive distribution network across North America. As at December 31, 2017, Stella-Jones’ workforce numbered approximately 1,880 employees.
Stella-Jones enjoys a number of key attributes which should further enhance the Company’s strategic positioning and competitive advantage in the wood treating industry. Among these are the ability to service clients from multiple plants, a solid financial position that allows the Company to stockpile and air-season green wood for major long-term contracts, a long-standing stable source of wood supply, and a registration to produce and sell the wood preservative, creosote.
OUR MISSIONStella-Jones’ objective is to be the performance leader in the wood preserving industry and a model corporate citizen, exercising environmental responsibility and integrity.
Stella-Jones will achieve these goals by focusing on customer satisfaction, core products, key markets, innovative work practices and the optimal use of its resources.
Stella-Jones is committed to providing a safe, respectful and productive environment for its employees, where problem solving, initiative and high standards of performance are rewarded.
NON-IFRS FINANCIAL MEASURESThis MD&A contains financial measures not prescribed by IFRS and not likely to be comparable to similar measures presented by other issuers. These measures are as follows:• Operating income before depreciation of property, plant and
equipment and amortization of intangible assets (also referred to as earnings before interest, taxes, depreciation and amortization [“EBITDA”]).
• Operating income.• Cash flow from operating activities before changes in non-cash
working capital components and interest and income taxes paid.• Operating margin: Operating income divided by sales.• Return on average equity: Net income divided by the mathematical
average of current year’s shareholders’ equity and the previous year’s shareholders’ equity.
• Working capital ratio: Total current assets divided by total current liabilities.
• Total debt to total capitalization: Long-term debt (including the current portion) divided by the sum of shareholders’ equity and long-term debt (including the current portion).
• Total debt to EBITDA: Long-term debt (including the current portion) divided by EBITDA.
Management considers these non-IFRS measures to be useful information to assist knowledgeable investors regarding the Company’s financial condition and operating results as they provide additional measures of its performance.
2017 Annual Report
15MANAGEMENT’S DISCUSSION AND ANALYSIS
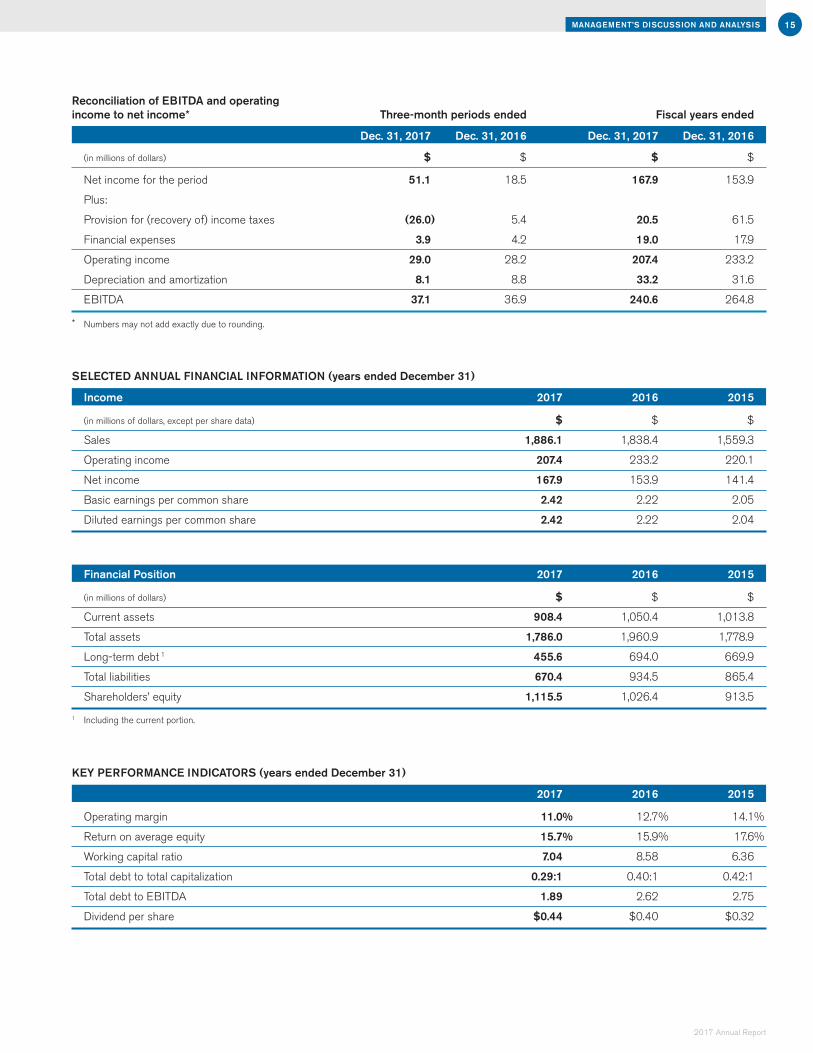
Reconciliation of EBITDA and operatingincome to net income* Three-month periods ended Fiscal years ended
Dec. 31, 2017 Dec. 31, 2016 Dec. 31, 2017 Dec. 31, 2016
(in millions of dollars) $ $ $ $
Net income for the period 51.1 18.5 167.9 153.9
Plus:
Provision for (recovery of) income taxes (26.0) 5.4 20.5 61.5
Financial expenses 3.9 4.2 19.0 17.9
Operating income 29.0 28.2 207.4 233.2
Depreciation and amortization 8.1 8.8 33.2 31.6
EBITDA 37.1 36.9 240.6 264.8
* Numbers may not add exactly due to rounding.
SELECTED ANNUAL FINANCIAL INFORMATION (years ended December 31)
Income 2017 2016 2015
(in millions of dollars, except per share data) $ $ $
Sales 1,886.1 1,838.4 1,559.3
Operating income 207.4 233.2 220.1
Net income 167.9 153.9 141.4
Basic earnings per common share 2.42 2.22 2.05
Diluted earnings per common share 2.42 2.22 2.04
Financial Position 2017 2016 2015
(in millions of dollars) $ $ $
Current assets 908.4 1,050.4 1,013.8
Total assets 1,786.0 1,960.9 1,778.9
Long-term debt 1 455.6 694.0 669.9
Total liabilities 670.4 934.5 865.4
Shareholders’ equity 1,115.5 1,026.4 913.5
1 Including the current portion.
KEY PERFORMANCE INDICATORS (years ended December 31)
2017 2016 2015
Operating margin 11.0% 12.7% 14.1%
Return on average equity 15.7% 15.9% 17.6%
Working capital ratio 7.04 8.58 6.36
Total debt to total capitalization 0.29:1 0.40:1 0.42:1
Total debt to EBITDA 1.89 2.62 2.75
Dividend per share $0.44 $0.40 $0.32
Stella-Jones Inc.
MANAGEMENT’S DISCUSSION AND ANALYSIS16
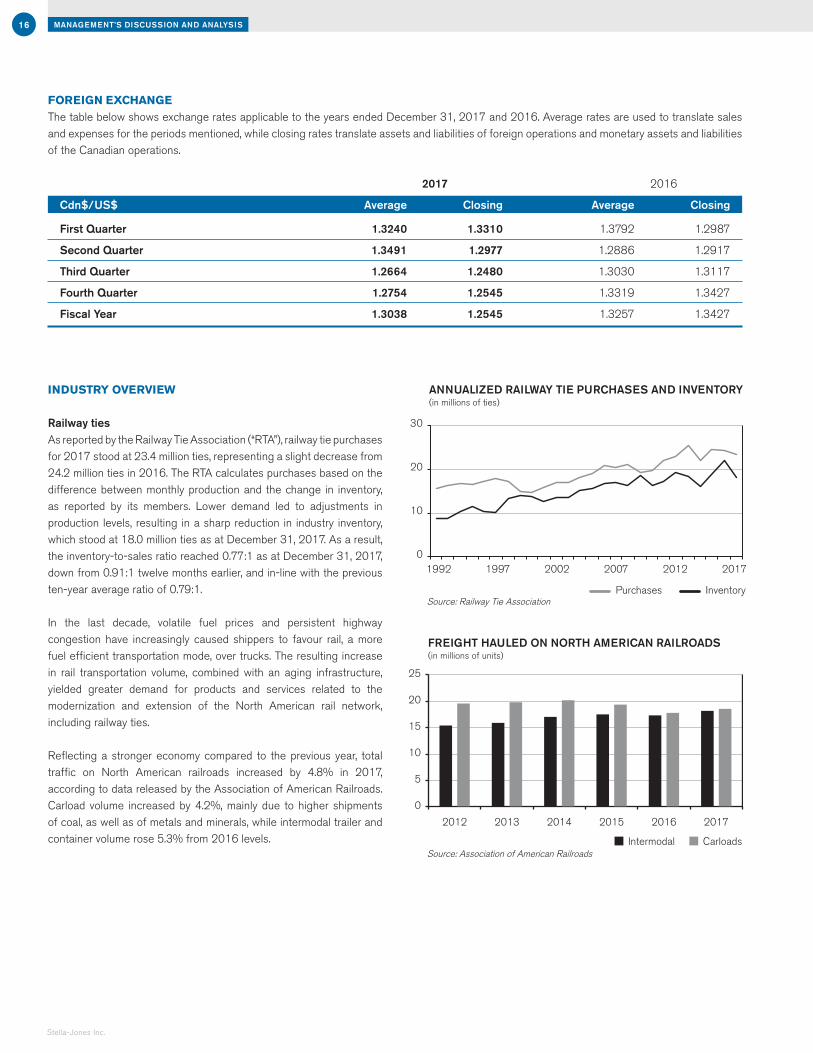
FOREIGN EXCHANGEThe table below shows exchange rates applicable to the years ended December 31, 2017 and 2016. Average rates are used to translate sales and expenses for the periods mentioned, while closing rates translate assets and liabilities of foreign operations and monetary assets and liabilities of the Canadian operations.
2017 2016
Cdn$/US$ Average Closing Average Closing
First Quarter 1.3240 1.3310 1.3792 1.2987
Second Quarter 1.3491 1.2977 1.2886 1.2917
Third Quarter 1.2664 1.2480 1.3030 1.3117
Fourth Quarter 1.2754 1.2545 1.3319 1.3427
Fiscal Year 1.3038 1.2545 1.3257 1.3427
INDUSTRY OVERVIEW
Railway tiesAs reported by the Railway Tie Association (“RTA”), railway tie purchases for 2017 stood at 23.4 million ties, representing a slight decrease from 24.2 million ties in 2016. The RTA calculates purchases based on the difference between monthly production and the change in inventory, as reported by its members. Lower demand led to adjustments in production levels, resulting in a sharp reduction in industry inventory, which stood at 18.0 million ties as at December 31, 2017. As a result, the inventory-to-sales ratio reached 0.77:1 as at December 31, 2017, down from 0.91:1 twelve months earlier, and in-line with the previous ten-year average ratio of 0.79:1.
In the last decade, volatile fuel prices and persistent highway congestion have increasingly caused shippers to favour rail, a more fuel efficient transportation mode, over trucks. The resulting increase in rail transportation volume, combined with an aging infrastructure, yielded greater demand for products and services related to the modernization and extension of the North American rail network, including railway ties.
Reflecting a stronger economy compared to the previous year, total traffic on North American railroads increased by 4.8% in 2017, according to data released by the Association of American Railroads. Carload volume increased by 4.2%, mainly due to higher shipments of coal, as well as of metals and minerals, while intermodal trailer and container volume rose 5.3% from 2016 levels.
Purchases InventorySource: Railway Tie Association
ANNUALIZED RAILWAY TIE PURCHASES AND INVENTORY(in millions of ties)
0
10
20
30
1992 1997 2002 2007 2012 2017
0
5
10
15
20
25
FREIGHT HAULED ON NORTH AMERICAN RAILROADS(in millions of units)
IntermodalSource: Association of American Railroads
2012 2013 2014 2015 2016 2017
Carloads

2017 Annual Report
17MANAGEMENT’S DISCUSSION AND ANALYSIS
OPERATING RESULTS
SalesSales for the year ended December 31, 2017 reached $1,886.1 million, up 2.6% from last year’s sales of $1,838.4 million. Acquisitions completed in 2016 contributed additional sales of $44.0 million throughout 2017, while the conversion effect from fluctuations in the value of the Canadian dollar, Stella-Jones’ reporting currency, versus the U.S. dollar, decreased the value of U.S. dollar denominated sales by about $17.0 million when compared with the previous year. Excluding these factors, sales increased approximately $20.8 million, or 1.1%.
SALES BY PRODUCT CATEGORY(% of sales)
RAILWAY TIES
34.5%UTILITY POLES
34.7%
INDUSTRIALPRODUCTS
5.0%
RESIDENTIAL LUMBER
19.4%
LOGS ANDLUMBER
6.4%
2017$1,886.1 M
RAILWAY TIES
39.0%UTILITY POLES
31.5%
INDUSTRIALPRODUCTS
5.2%
RESIDENTIAL LUMBER
18.8%
LOGS ANDLUMBER
5.5%
2016$1,838.4 M
Railway ties
Railway tie sales for 2017 amounted to $651.5 million, versus sales of $716.3 million in 2016. Excluding the conversion effect from fluctuations in the value of the Canadian dollar against the U.S. currency, railway tie sales decreased approximately $58.0 million, or 8.1%, mainly due to lower year-over-year pricing. Railway tie sales accounted for 34.5% of the Company’s total sales in 2017.
Utility poles
Utility pole sales reached $654.0 million in 2017, representing an increase of $74.7 million, or 12.9%, from sales of $579.2 million in 2016. Excluding the additional contribution from acquisitions completed in 2016 and the currency conversion effect, sales increased approximately $40.0 million, or 6.9%. This improvement essentially reflects organic sales growth in the southeastern United States and a return to historical maintenance demand in 2017. Utility pole sales accounted for 34.7% of the Company’s total sales in 2017.
651.5
2017
RAILWAY TIE SALES (in millions of $)
716.3
2016
654.0
2017
UTILITY POLE SALES (in millions of $)
579.2
2016
366.2
2017
RESIDENTIAL LUMBER SALES (in millions of $)
345.7
2016
94.5
2017
INDUSTRIAL PRODUCT SALES (in millions of $)
96.3
2016
LOGS AND LUMBER SALES (in millions of $)
100.8
20162017
119.9

Stella-Jones Inc.
MANAGEMENT’S DISCUSSION AND ANALYSIS18
Residential lumber
Sales in the residential lumber category totalled $366.2 million in 2017, up from $345.7 million in 2016. Excluding the currency conversion effect, sales increased $21.5 million, or 6.2%, mainly reflecting higher year-over-year selling prices explained by untreated lumber cost increases. Residential lumber accounted for 19.4% of Stella-Jones’ sales in 2017.
Industrial products
Industrial product sales were $94.5 million in 2017, compared with $96.3 million in 2016. Excluding the additional contribution from acquisitions completed in 2016 and the currency conversion effect, sales decreased 2.3%, mainly due to lower sales of marine pilings in Canada. Industrial products represented 5.0% of sales in 2017.
Logs and lumber
Logs and lumber sales amounted to $119.9 million in 2017, up from $100.8 million in 2016. This increase reflects the timing of lumber purchase and resale activities, the timing of timber harvesting, as well as higher selling prices due to increased lumber costs. Logs and lumber represented 6.4% of sales in 2017.
651.5
2017
RAILWAY TIE SALES (in millions of $)
716.3
2016
654.0
2017
UTILITY POLE SALES (in millions of $)
579.2
2016
366.2
2017
RESIDENTIAL LUMBER SALES (in millions of $)
345.7
2016
94.5
2017
INDUSTRIAL PRODUCT SALES (in millions of $)
96.3
2016
LOGS AND LUMBER SALES (in millions of $)
100.8
20162017
119.9

2017 Annual Report
19MANAGEMENT’S DISCUSSION AND ANALYSIS
SALES BY GEOGRAPHIC REGION(% of sales)
2017
70.2%UNITED STATES
29.8%CANADA
$ 1,324.2 M $ 561.9 M
2016
70.9%UNITED STATES
29.1%CANADA
$ 1,302.6 M $ 535.8 M
Sales in the United States amounted to $1,324.2 million, or 70.2% of sales in 2017, representing an increase of $21.6 million, or 1.7%, over 2016. The year-over-year rise mainly stems from higher sales in the utility pole and residential lumber product categories, as well as from the additional contribution from acquisitions completed in 2016. These factors were partially offset by lower railway tie sales and a lower conversion rate on U.S. dollar denominated sales.
Sales in Canada increased by $26.1 million, or 4.9% in 2017 to reach $561.9 million, representing 29.8% of Stella-Jones’ total sales. The variation is attributable to higher sales in the residential lumber and logs and lumber product categories mainly arising from higher year-over-year selling prices due to increased lumber costs.
Cost of sales Cost of sales, including depreciation of property, plant and equipment, as well as amortization of intangible assets, was $1,586.3 million, or 84.1% of sales, in 2017. This compares with $1,504.6 million, or 81.8% of sales, in 2016. The increase in absolute dollars essentially reflects a higher business volume for the year and increased untreated lumber costs in the residential lumber category, partially offset by a lower average rate applied to convert U.S. dollar denominated costs. As a percentage of sales, the increase is mainly attributable to lower selling prices for railway ties and a less favourable geographical mix in the utility pole category.
Depreciation and amortization charges totalled $33.2 million for the year ended December 31, 2017, versus $31.6 million a year earlier. The year-over-year increase is mainly due to the depreciation and amortization charges related to the tangible and intangible assets of the 2016 acquisitions for the full year, as well as to higher depreciation charges related to the completion of construction of a new wood treating facility in Cameron, Wisconsin.
As a result, gross profit reached $299.9 million or 15.9% of sales in 2017, versus $333.7 million or 18.2% of sales in 2016.
Selling and administrativeSelling and administrative expenses for 2017 were $93.8 million, or 5.0% of sales, compared with expenses of $95.0 million, or 5.2% of sales, in 2016. The variation in monetary terms mainly results from a decrease of $2.1 million in profit sharing expenses, a $1.1 million reduction in stock-based compensation, as well as the effect of currency translation on U.S.-based selling and administrative expenses. Last year’s expenses also included approximately $2.9 million in acquisition costs directly related to business acquisitions completed in 2016.
Other losses (gains), netStella-Jones’ other net gains of $1.3 million for the year ended December 31, 2017 mainly consisted of a $4.1 million foreign exchange gain and a $2.1 million reversal of a provision for site remediation, partially offset by a $3.2 million expense on freight and distribution accruals and a $1.3 million loss on asset disposal. In 2016, other net losses of $5.5 million were mostly related to final site remediation provisions of $5.2 million related to a non-operating site.
The Company’s exposure to foreign exchange gains or losses from currency fluctuations is related to its sales and purchases in U.S. dollars by its Canadian-based operations and to U.S. dollar denominated long-term debt held by its Canadian company. Stella-Jones U.S. Holding Corporation, the Company’s wholly-owned U.S. subsidiary, is a foreign operation that has a different functional currency from that of the Company and foreign exchange gains and losses on translating its financial statements are deferred in shareholders’ equity. The Company monitors its transactions in U.S. dollars generated by Canadian-based operations. Its basic hedging activity for economic purposes consists of entering into foreign exchange forward contracts for the sale of U.S. dollars and purchasing certain goods and services in U.S. dollars. The Company will also consider foreign exchange forward contracts for the purchase of U.S. dollars for significant purchases of goods and services that are not covered by natural hedges.

Stella-Jones Inc.
MANAGEMENT’S DISCUSSION AND ANALYSIS20
Financial expensesFinancial expenses reached $19.0 million in 2017, up from $17.9 million in 2016. This increase is attributable to a higher fixed interest rate applicable to the senior notes issued through a private placement on January 17, 2017, partially offset by the effect of local currency conversion on financial expenses related to the Company’s U.S. dollar denominated borrowings.
Income before income taxes and income tax expensesStella-Jones generated income before income taxes of $188.4 million, or 10.0% of sales, in 2017, versus $215.4 million, or 11.7% of sales, in 2016. The year-over-year decrease in income before income taxes is attributable to lower gross profit, as detailed above.
Stella-Jones’ provision for income taxes totaled $20.5 million in 2017, representing an effective tax rate of 10.9%. In 2016, income tax expenses stood at $61.5 million, equivalent to an effective rate of 28.5%. The lower effective tax rate for 2017 reflects changes to the U.S. Federal Corporate income tax rate following the enactment of the Tax Cuts and Jobs Act (the “Act”) on December 22, 2017. The Act will favourably affect the Company’s U.S. subsidiaries, specifically by reducing the top federal corporate income tax rate from 35.0% to 21.0%, effective January 1, 2018. Although the Act only comes into effect on January 1, 2018, changes to the tax rates required the remeasurement of the deferred income tax liability as at December 31, 2017. As a result of the reduction in tax rates, a one-off non-cash deferred tax benefit of $30.0 million was recognized in the statement of income for the fourth quarter ended December 31, 2017 which explains the lower effective tax rate for 2017. Management expects the Company’s overall effective tax rate for 2018 to be approximately 26.0%.
Net incomeNet income for the year ended December 31, 2017 reached $167.9 million, or $2.42 per diluted share, compared with $153.9 million, or $2.22 per diluted share, in 2016. This represents a year-over-year increase in net income of 9.1%.
BUSINESS ACQUISITION
On December 19, 2017, the Company completed the acquisition of substantially all the operating assets employed in the business of Wood Products Industries Inc. (“WPI”) located in South River, Ontario. The Company plans on using these assets to treat residential lumber.
Total cash outlay associated with the acquisition was approximately $4.2 million, excluding acquisition costs of approximately $234,000, recognized in the consolidated statement of income under selling and administrative expenses. The Company financed the acquisition through its existing syndicated credit facilities.
SUBSEQUENT EVENT
On February 9, 2018, the Company completed the acquisition of substantially all the operating assets employed in the business of Prairie Forest Products (“PFP”), a division of Prendiville Industries Ltd. located at its wood treating facility in Neepawa, Manitoba, as well as at its peeling facility in Birch River, Manitoba. PFP manufactures, sells and distributes utility poles and residential lumber and sales for the twelve-month period ending October 31, 2017 were approximately $35.1 million.
Total cash outlay associated with the acquisition was $26.5 million, excluding acquisition costs of approximately $326,000 of which $159,000 was recognized in the 2017 consolidated statement of income under selling and administrative expenses. The Company financed the transaction through its existing syndicated credit facilities.
At the time of preparing the MD&A, Management did not have on hand all the required information to determine the fair value of assets acquired and liabilities assumed. Preliminary information indicates that property plant and equipment and inventory represent approximately $7.8 million and $9.5 million respectively from the total purchase price of $26.5 million.

2017 Annual Report
21MANAGEMENT’S DISCUSSION AND ANALYSIS
QUARTERLY RESULTS
The Company’s sales follow a seasonal pattern, with railway tie, utility pole and industrial product shipments strongest in the second and third quarters to provide industrial end users with product for their summer maintenance projects. Residential lumber sales also follow a similar seasonal pattern. In the fall and winter seasons, there tends to be less activity; thus the first and fourth quarters are typically characterized by relatively lower sales levels.
The table below sets forth selected financial information for the Company’s last eight quarters, ending with the most recently completed financial year:
2017
For the quarters ended March 31 June 30 Sept. 30 Dec. 31 Total
(in millions of dollars, except per share data) $ $ $ $ $
Sales 396.9 594.2 517.6 377.4 1,886.1
Operating income before depreciation of property, plant and equipment and amortization of intangible assets 1 49.1 83.1 71.3 37.1 240.6
Operating income 1 40.8 74.5 63.1 29.0 207.4
Net income for the period 25.9 48.9 42.0 51.1 167.9
Earnings per common share
Basic and diluted 0.37 0.71 0.61 0.74 2.42
2016
For the quarters ended March 31 June 30 Sept. 30 Dec. 31 Total
(in millions of dollars, except per share data) $ $ $ $ $
Sales 421.0 563.1 512.6 341.7 1,838.4
Operating income before depreciation of property, plant and equipment and amortization of intangible assets 1 61.7 89.9 76.3 36.9 264.8
Operating income 1 54.6 83.2 67.3 28.2 233.2
Net income for the period 35.0 54.7 45.7 18.5 153.9
Earnings per common share
Basic and diluted 0.51 0.79 0.66 0.27 2.22
1 Operating income before depreciation of property, plant and equipment and amortization of intangible assets and operating income are financial measures not prescribed by IFRS and are not likely to be comparable to similar measures presented by other issuers. Management considers they represent useful information for comparison with other similar operations in the industry, as they present financial results related to industry practice, not affected by non-cash charges or capital structure. Operating income before depreciation of property, plant and equipment and amortization of intangible assets and operating income are readily reconcilable to net income presented in the consolidated financial statements, as there are no adjustments for unusual or non-recurring items.
Note: due to rounding, the sum of results for the quarters may differ slightly from the total shown for the full year.
Stella-Jones Inc.
MANAGEMENT’S DISCUSSION AND ANALYSIS22
Fourth Quarter ResultsSales for the fourth quarter of 2017 amounted to $377.4 million, up 10.4% from sales of $341.7 million for the same period in 2016. Excluding the conversion effect from fluctuations in the value of the Canadian dollar, versus the U.S. dollar, sales increased approximately $48.3 million, or 14.1%.
Sales of railway ties reached $118.0 million, versus $113.1 million last year. Excluding the currency conversion effect, railway tie sales rose 8.7% driven by higher year-over-year volume. Utility pole sales amounted to $162.9 million, up 12.7% from $144.6 million last year. Excluding the contribution from acquisitions and the currency conversion effect, sales grew 14.5% as a result of organic sales growth in the southeastern United States and healthy maintenance demand. Residential lumber sales reached $48.6 million, up from $44.5 million last year, reflecting solid market demand. Industrial product sales amounted to $20.0 million, up from $15.0 million a year ago, as a result of higher sales of rail related products. Finally, logs and lumber sales stood at $27.9 million, versus $24.5 million last year, driven in most part by the passthrough of higher lumber cost to customers.
Gross profit amounted to $53.5 million, or 14.2% of sales, in the fourth quarter of 2017, versus $52.0 million, or 15.2% of sales, in the fourth quarter of 2016. The decrease as a percentage of sales mainly reflects the sales mix within each product category and softer pricing in certain regions. Operating income totalled $29.0 million, or 7.7% of sales, in the fourth quarter of 2017, versus $28.2 million, or 8.2% of sales, last year.
Net income for the period reached $51.1 million, or $0.74 per diluted share, compared with $18.5 million, or $0.27 per diluted share, in the prior year. The year-over-year increase is attributable to a one-off non-cash tax benefit stemming from the remeasurement of deferred tax liabilities following a reduction in the U.S. top federal corporate income tax rate.
STATEMENT OF FINANCIAL POSITION
As a majority of the Company’s assets and liabilities are denominated in U.S. dollars, exchange rate variations may significantly affect their value. As such, the depreciation of the U.S. dollar relative to the Canadian dollar as at December 31, 2017, compared to December 31, 2016 (see Foreign Exchange on page 16), results in a lower value of assets and liabilities denominated in U.S. dollars, when expressed in Canadian dollars.
AssetsAs at December 31, 2017, total assets and current assets reached $1.79 billion and $908.4 million, respectively, down from $1.96 billion and $1.05 billion, respectively, as at December 31, 2016. These decreases are mainly attributable to a reduction in inventories and to the effect of local currency translation on U.S.-based assets.
The value of accounts receivable stood at $163.5 million as at December 31, 2017, up from $160.8 million as at December 31, 2016. The variation results from higher business activity in the fourth quarter of 2017 compared to last year, partially offset by the effect of local currency translation on U.S. dollar denominated accounts receivable.
The value of inventories reached $718.5 million as at December 31, 2017, versus $854.6 million as at December 31, 2016. This decrease essentially stems from lower untreated railway tie prices and volumes as well as the effect of local currency translation on U.S. inventories.
Because of the long periods required to air season wood, which can occasionally exceed nine months before a sale is concluded, inventories are a significant component of working capital. In addition, important raw material and finished goods inventory are required at certain times of the year to support the residential lumber product category. However, solid relationships and long-term contracts with certain customers enable the Company to better ascertain inventory requirements. The Company believes that its cash flows from operations and available credit facilities are adequate to meet its working capital requirements for the foreseeable future.
Property, plant and equipment amounted to $472.0 million as at December 31, 2017, compared with $463.7 million as at December 31, 2016. This increase is essentially related to purchases of property, plant and equipment for the year ($52.2 million), partially offset by a depreciation charge of $17.9 million and the effect of local currency translation on U.S.-based property, plant and equipment.
The value of intangible assets reached $124.4 million as at December 31, 2017. Intangible assets include customer relationships, the discounted value of the non-compete agreements, a creosote registration, cutting rights, standing timber and a favourable land lease agreement. As at December 31, 2016, intangible assets were $147.3 million. The year-over-year decrease is mainly explained by an amortization charge of $15.3 million for 2017 and the effect of local currency translation on U.S. dollar denominated intangible assets.
As at December 31, 2017, the value of goodwill stood at $270.3 million, down from $287.4 million a year earlier. This decrease in goodwill mostly reflects the effect of local currency translation on U.S. dollar denominated goodwill.
2017 Annual Report
23MANAGEMENT’S DISCUSSION AND ANALYSIS
LiabilitiesAs at December 31, 2017, Stella-Jones’ total liabilities stood at $670.4 million, down from $934.5 million as at December 31, 2016. This variation mainly reflects the decrease in total long-term debt, as explained below, and the effect of local currency translation on U.S. dollar denominated liabilities.
The value of current liabilities was $129.0 million as at December 31, 2017, up from $122.4 million a year earlier. This variation is essentially due to a $10.1 million increase in accounts payable and accrued liabilities related to higher business activity in the fourth quarter of 2017 compared to last year.
The Company’s long-term debt, including the current portion, amounted to $455.6 million as at December 31, 2017, versus $694.0 million as at December 31, 2016. The decrease essentially reflects a solid operating cash flow generation during the year, as well as the effect of local currency translation on U.S. dollar denominated long-term debt. As at December 31, 2017, an amount of $354.5 million was available against the Company’s syndicated credit facilities of $595.9 million (US$475.0 million).
Shareholders’ equityShareholders’ equity was $1.12 billion as at December 31, 2017 compared with $1.03 billion as at December 31, 2016. This increase is attributable to net income of $167.9 million for the year, partially offset by dividends on common shares totalling $30.5 million and a $48.7 million unfavourable variation in the value of accumulated other comprehensive income resulting from the effect of currency fluctuations.
LIQUIDITY AND CAPITAL RESOURCES
The following table sets forth summarized cash flow components for the periods indicated:
Summary of cash flows (years ended December 31)
2017 2016
(in millions of dollars) $ $
Operating activities 301.1 181.8
Financing activities (239.9) (9.5)
Investing activities (58.5) (175.6)
Net change in cash and cash equivalents 2.7 (3.3)
Cash and cash equivalents – beginning 3.7 7.0
Cash and cash equivalents – end 6.4 3.7
The Company’s activities, acquisitions and purchases of property, plant and equipment are primarily financed by cash flows from operating activities, available cash, long-term debt, and the issuance of common shares. The Company plans on spending between $30.0 million to $40.0 million on property, plant and equipment in the upcoming year, half of which is related to efficiency improvements with the balance dedicated to sustaining operations. The Company’s syndicated credit facilities are made available for a five-year term and are thus considered long-term debt.
Cash flow from operating activities before changes in non-cash working capital components and interest and income taxes paid was $245.7 million for the year ended December 31, 2017, versus $268.9 million in 2016. This variation mostly reflects a lower operating income for the year.
Changes in non-cash working capital components increased liquidity by $105.7 million in 2017. The main element of this variation was a decrease of $103.2 million in inventories related to lower untreated railway tie prices and volumes. In 2016, changes in non-cash working capital components had reduced liquidity by $30.1 million, mainly due to a $39.9 million increase in inventories.
Interest and income taxes paid further reduced liquidity by $15.8 million and $34.5 million, respectively, in 2017, versus $18.6 million and $38.3 million, respectively, a year earlier. The decrease in interest paid mainly stems from lower year-over-year borrowings, while the decrease in income taxes paid reflects a lower balance of taxes receivable as at December 31, 2017.
As a result, cash flows provided by operating activities were $301.1 million in 2017, up significantly in comparison with $181.8 million in 2016.
Financing activities for the year ended December 31, 2017 reduced liquidity by $239.9 million. The main factor explaining this cash usage was a net decrease of $391.8 million in the syndicated credit facilities resulting from a solid operating cash flow generation and the payment of dividends on common shares totalling $30.5 million. These factors were partially offset by a $184.4 million net increase in long-term debt mainly resulting from the January 17, 2017 private placement for which proceeds were used to pay down a portion of the Company’s syndicated credit facilities. For the year ended December 31, 2016, financing activities had required liquidity of $9.5 million.
Investing activities required $58.5 million in cash during 2017. Purchases of property, plant and equipment required an investment of $52.2 million, including $4.1 million to finalize the construction of a new pole peeling and pole treating facility in Cameron, Wisconsin, while business acquisitions resulted in a cash outlay of $5.8 million. In 2016, cash flows from investing activities had decreased liquidity by $175.6 million due to business acquisitions ($107.3 million) and purchases of property, plant and equipment ($63.2 million).

Stella-Jones Inc.
MANAGEMENT’S DISCUSSION AND ANALYSIS24
FINANCIAL OBLIGATIONS
The following table details the maturities of the financial obligations as at December 31, 2017:
Carrying Contractual Less than 1 – 3 4 – 5 More than Amount Cash flow 1 year years years 5 years
(in millions of dollars) $ $ $ $ $ $
Accounts payable and accrued liabilities 111.2 111.2 111.2 — — —
Long-term debt obligations 455.6 538.4 20.1 42.3 265.2 210.8
Minimum payments under operating lease obligations — 80.1 22.7 30.7 14.1 12.6
Non-compete agreements 5.5 5.8 1.7 2.9 1.2 —
Total 572.3 735.5 155.7 75.9 280.5 223.4
Note: due to rounding, the sum of results may differ slightly from totals.
SHARE AND STOCK OPTION INFORMATION
As at December 31, 2017, the capital stock issued and outstanding consisted of 69,342,095 common shares (69,303,307 as at December 31, 2016). The following table presents the outstanding capital stock activity for the year ended December 31, 2017:
Year Ended Dec. 31, 2017 Number of shares (in ‘000s)
Balance – Beginning of year 69,303
Stock option plan 10
Employee share purchase plans 29
Balance – End of year 69,342
As at March 13, 2018, the capital stock issued and outstanding consisted of 69,342,095 common shares.
As at December 31, 2017, the number of outstanding options to acquire common shares issued under the Company’s Stock Option Plan was 45,000 (December 31, 2016 – 55,000) of which 33,000 (December 31, 2016 – 31,000) were exercisable. As at March 13, 2018, the number of outstanding options was 45,000 of which 33,000 were exercisable.
DIVIDENDS
In 2017, the Board of Directors of Stella-Jones declared the following quarterly dividends:
• $0.11 per common share payable on April 28, 2017 to shareholders of record at the close of business on April 3, 2017.
• $0.11 per common share payable on June 27, 2017 to shareholders of record at the close of business on June 5, 2017.
• $0.11 per common share payable on September 22, 2017 to shareholders of record at the close of business on September 1, 2017.
• $0.11 per common share payable on December 21, 2017 to shareholders of record at the close of business on December 4, 2017.
Subsequent to the end of the year, on March 13, 2018, the Board declared a quarterly dividend of $0.12 per common share payable on April 27, 2018 to shareholders of record at the close of business on April 6, 2018.
The declaration, amount and date of any future dividends will continue to be considered by the Board of Directors of the Company based upon and subject to the Company’s covenants in its loan documentation as well as its financial performance and cash requirements. There can be no assurance as to the amount or timing of such dividends in the future.

2017 Annual Report
25MANAGEMENT’S DISCUSSION AND ANALYSIS
COMMITMENTS AND CONTINGENCIES
The Company is from time to time involved in various claims and legal proceedings arising in the ordinary course of business. It is the opinion of Management that a final determination of these proceedings cannot be made at this time but should not materially affect the Company’s financial position or results of operations.
The Company has issued guarantees amounting to $19.0 million (2016 – $28.9 million) under letters of credit and various bid and performance bonds. The Company’s management does not believe these guarantees are likely to be called on and, as such, no provisions have been recorded in the consolidated financial statements.
The Company’s operations are subject to Canadian federal and provincial as well as U.S. federal and state environmental laws and regulations governing, among other matters, air emissions, waste management and wastewater effluent discharges. The Company takes measures to comply with such laws and regulations. However, the measures taken are subject to the uncertainties of changing legal requirements, enforcement practices and developing technological processes.
CURRENT ECONOMIC CONDITIONS
OperationsThe Company’s core railway tie and utility pole product categories are integral to the North American basic transportation and utility infrastructure. Such infrastructure needs to be regularly maintained which provides Stella-Jones with relatively steady demand for its core products. In periods of economic growth, the Company may also benefit from additional demand stemming from expansions to the railway and telecommunication networks.
Based on current market conditions, and assuming stable currencies, Stella-Jones’ total sales and operating margins are expected to improve progressively in 2018 when compared to 2017. Operating margins will remain softer in the first half of 2018.
In the railway tie product category, North American railroads will continue to maintain their continental rail network, as operators constantly seek optimal line efficiency. The Company is anticipating that 2018 annual railway tie sales should be relatively stable when compared to 2017. Meanwhile, softer pricing is expected to continue to negatively impact operating margins in the first half of the year, which should gradually return to historical levels by the end of 2018.
In the utility pole product category, demand for regular maintenance projects has historically been relatively steady. Following a return to normal demand patterns in 2017, the Company expects a better sales mix within the product category in 2018. However, these factors should be offset by slight cost increases for certain wood species and the timing of price adjustments.
In the residential lumber product category, the Company expects to further benefit from continued demand for new construction and outdoor renovation projects in the North American residential and commercial markets. Sales for 2018 are also expected to increase as a result of higher wood cost.
LiquidityAs at December 31, 2017, the Company was in full compliance with its debt covenants and contractual obligations. In addition, as at December 31, 2017 an amount of $354.5 million was available against the Company’s syndicated credit facilities of $595.9 million (US$475.0 million).
Accounts receivable increased slightly in 2017, as the impact of higher business activity in the fourth quarter of 2017 compared to last year more than offset the effect of local currency translation on U.S. dollar denominated accounts receivable. Management considers that all recorded accounts receivable are fully collectible as major customers, mainly Class 1 railroad operators, large retailers and large-scale utility service providers, have good credit standing and limited history of default.
Inventories decreased in 2017 due to lower untreated railway tie prices and volume as well as the effect of local currency translation on U.S. inventories. To ensure efficient treating operations, given that air-dried wood reduces treatment cycles, inventory turnover has historically been relatively low. Nevertheless, Management continuously monitors the levels of inventory and market demand for its products. Production is adjusted accordingly to optimize efficiency and capacity utilization.
RISKS AND UNCERTAINTIES
Economic ConditionsThe difficulties in certain global credit markets, softening economies and an apprehension among customers may negatively impact the markets the Company serves in all of its operating categories. Additionally, certain negative economic conditions may affect most or all of the markets it serves at the same time, reducing demand for its products and adversely affecting its operating results. These economic conditions may also impact the financial condition of one or more of the Company’s key suppliers, which could affect its ability to secure raw materials and components to meet its customers’ demand for its products.
Dependence on Major CustomersThe Company is dependent on major customers for a significant portion of its sales, and the loss of one or more of its major customers could result in a significant reduction in its profitability. For the year ended December 31, 2017, the Company’s top ten customers accounted for approximately 46.4% of its sales. During this same period, the Company’s two largest customers accounted for approximately 15.6% and 10.0%, respectively, of its total sales.

Stella-Jones Inc.
MANAGEMENT’S DISCUSSION AND ANALYSIS26
Availability and Cost of Raw MaterialsManagement considers that the Company may be affected by potential fluctuations in wood prices. While the Company has entered into long-term cutting licenses and benefits from long-standing relationships with private woodland owners and other suppliers, there can be no assurance that such licenses will be respected or renewed on expiry, or that its suppliers will continue to provide adequate timber to the Company.
In addition, there are a limited number of suppliers for certain preservatives that the Company employs in its production process, which lessens the availability of alternate sources of supply in the event of unforeseen shortages or disruptions of production. While the Company is mitigating this risk by researching and identifying alternate suppliers outside of its traditional sources of supply, there can be no assurance that it will be able to secure the supply of all materials required to manufacture its products.
Environmental RiskThe Company is subject to a variety of environmental laws and regulations, including those relating to emissions to the air, discharges into water, releases of hazardous and toxic substances, and remediation of contaminated sites. These environmental laws and regulations require the Company to obtain various environmental registrations, licenses, permits and other approvals, as well as carry out inspections, compliance testing and meet timely reporting requirements in order to operate its manufacturing and operating facilities.
Compliance with these environmental laws and regulations will continue to affect the Company’s operations by imposing operating and maintenance costs and capital expenditures. Failure to comply could result in civil or criminal enforcement actions, which could result, among others, in the payment of substantial fines, often calculated on a daily basis, or in extreme cases, the disruption or suspension of operations at the affected facility.
Under various federal, provincial, state and local laws and regulations, the Company could, as the owner, lessor or operator, be liable for the costs of removal or remediation of contamination at its sites. The remediation costs and other costs required to clean up or treat contaminated sites could be substantial. However, in certain cases, the Company benefits from indemnities from the former owners of its sites. Contamination on and from the Company’s sites may subject it to liability to third parties or governmental authorities for injuries to persons, property or the environment and could adversely affect the Company’s ability to sell or rent its properties or to borrow money using such properties as collateral.
The possibility of major changes in environmental laws and regulations is another risk faced by the Company. While it is not possible to predict the outcome and nature of these changes, they could substantially increase the Company’s capital expenditures and compliance costs at the facilities affected.
While the Company has been party to environmental litigation in the past, which have included, among others, claims for adverse physical effects and diminution of property value, the outcomes and associated costs have not been material. There is, however, no guarantee that this will continue to be the case in the future, as the result of disputes regarding environmental matters and conclusions of environmental litigation cannot be predicted.
The Company’s business has grown and its image strengthened, in large part by its consistent production and delivery of high quality products, while maintaining as well, a high level of environmental responsibility. Claims of environmentally irresponsible practices by regulatory authorities or local communities could harm the reputation of the Company. Adverse publicity resulting from actual or perceived violations of environmental laws and regulations could negatively impact customer loyalty, reduce demand, lead to a weakening of confidence in the marketplace and ultimately, a reduction in the Company’s share price. These effects could result even if the allegations are not valid and the Company is not found liable.
Risks Related to AcquisitionsAs part of its growth strategy, the Company intends to acquire additional complementary businesses where such transactions are economically and strategically justified. There can be no assurance that the Company will succeed in effectively managing the integration of other businesses which it might acquire. If the expected synergies do not materialize, or if the Company fails to successfully integrate such new businesses into its existing operations, this could have a material adverse effect on the Company’s business, operating results, profitability and financial position. The Company may also incur costs and direct Management’s attention to potential acquisitions which may never be consummated.
In addition, although the Company performs due diligence investigations in connection with its acquisitions, an acquired business could have liabilities that the Company fails or is unable to uncover prior to acquisition and for which the Company may be responsible. Such liabilities could have a material adverse effect on the Company’s business operating results, profitability and financial position.
Litigation RiskThe Company is subject to the risk of litigation in the ordinary course of business by employees, customers, suppliers, competitors, shareholders, government agencies, or others, through private actions, class actions, administrative proceedings, regulatory actions or other litigation. The outcome of litigation is difficult to assess or quantify. Claimants in these types of lawsuits or claims may seek recovery of very large or indeterminate amounts, and the magnitude of the potential loss relating to these lawsuits or claims may remain unknown for substantial periods of time. Regardless of outcome, litigation could result in substantial costs to the Company. In addition, litigation could divert Management’s attention and resources away from the day-to-day operations of the Company’s business.

2017 Annual Report
27MANAGEMENT’S DISCUSSION AND ANALYSIS
Insurance CoverageThe Company maintains property, casualty, general liability and workers’ compensation insurance, but such insurance may not cover all risks associated with the hazards of its business and is subject to limitations, including deductibles and maximum liabilities covered. The Company may incur losses beyond the limits, or outside the coverage, of its insurance policies, including liabilities for environmental compliance and remediation. In addition, from time to time, various types of insurance for companies in the Company’s industry have not been available on commercially acceptable terms or, in some cases, have not been available at all. In the future, the Company may not be able to obtain coverage at current levels, and its premiums may increase significantly on coverage that it maintains.
Currency RiskThe Company is exposed to currency risks due to its export of goods manufactured in Canada. The Company strives to mitigate such risks by purchases of goods and services denominated in U.S. dollars. The Company may also use foreign exchange forward contracts to hedge contracted net cash inflows and outflows of U.S. dollars. The use of such currency hedges involves specific risks including the possible default by the other party to the transaction or illiquidity. Given these risks, there is a possibility that the use of hedges may result in losses greater than if hedging had not been used.
Interest Rate FluctuationsAs at December 31, 2017, all of the Company’s long-term debt was at fixed interest rates, therefore reducing the Company’s exposure to interest rate risk. The Company enters into interest rate swap agreements in order to reduce the impact of fluctuating interest rates on its long-term debt. These swap agreements require the periodic exchange of payments without the exchange of the notional principal amount on which the payments are based. The Company designates its interest rate hedge agreements as cash flow hedges of the underlying debt. Interest expense on the debt is adjusted to include the payments made or received under the interest rate swap agreements. However, if interest rates increase, the debt service obligations on the variable rate indebtedness of the Company would increase even though the amount borrowed remained the same, and this could have adverse effect on the Company’s business operating results, profitability and financial position.
Customers’ Credit RiskThe Company carries a substantial level of trade accounts receivable on its statement of financial position. This value is spread amongst numerous contracts and clients. Trade accounts receivable include an element of credit risk should the counterparty be unable to meet its obligations. Although the Company reduces this risk by dealing primarily with Class 1 railways, as well as with utility and telecommunication companies and other major corporations, there can be no assurance that outstanding accounts receivable will be paid on a timely basis or at all.
Influence by Stella Jones International S.A.As at December 31, 2017, Stella Jones International S.A. (“SJ International”) owned or controlled 26,572,836 common shares of the Company, which represented approximately 38.3% of the outstanding common shares. On February 21, 2018, SJ International sold 5,000,000 shares as part of a secondary offering and reduced its ownership to 31.1%. Under this current share ownership, SJ International maintains the ability to influence all matters submitted to the shareholders for approval, including without limitation, the election and removal of directors, amendments to the articles of incorporation and by-laws and the approval of any business combination. The interests of SJ International may not in all cases be aligned with interests of the other shareholders.
Cyber RiskThe Company relies on information technology to process, transmit and store electronic data in its daily business activities. Despite its security design and controls, and those of third-party providers, the Company’s information technology and infrastructure may be vulnerable to cyber-attacks by hackers or breach due to employee error, malfeasance or other disruptions. Any such breach could result in operational disruption and increased costs or the misappropriation of sensitive data that could disrupt operations, subject the Company to litigation and have a negative impact on its reputation. To limit exposure to incidents that may affect confidentiality, integrity and availability of information, the Company has invested in data privacy controls, threat protections as well as detection and mitigation policies, procedures and controls.
Corporate Tax RiskIn estimating the Company’s income tax payable, Management uses accounting principles to determine income tax positions that are likely to be sustained by applicable tax authorities. However, there is no assurance that tax benefits or tax liability will not materially differ from estimates or expectations. The tax legislation, regulation and interpretation that apply to the Company’s operations are continually changing. In addition, future tax benefits and liabilities are dependent on factors that are inherently uncertain and subject to change, including future earnings, future tax rates, and anticipated business in the various jurisdictions in which Stella-Jones operates. Moreover, the Company’s tax returns are continually subject to review by applicable tax authorities. These tax authorities determine the actual amounts of taxes payable or receivable, any future tax benefits or liabilities and the income tax expense that Stella-Jones may ultimately recognize. Such determinations may become final and binding on the Company. Any of the above factors could have a material adverse effect on net income or cash flow.

Stella-Jones Inc.
MANAGEMENT’S DISCUSSION AND ANALYSIS28
FINANCIAL INSTRUMENTS AND RISK MANAGEMENT
The Company uses derivative instruments to provide economic hedges to mitigate various risks. The fair values of these instruments represent the amount of the consideration that could be exchanged in an arm’s length transaction between willing parties who are under no compulsion to act. The fair value of these derivatives is determined using prices in active markets, where available. When no such market is available, valuation techniques are applied such as discounted cash flow analysis. The valuation technique incorporates all factors that would be considered in setting a price, including the Company’s own credit risk, as well as the credit risk of the counterparty.
Interest Rate Risk Management Interest rate risk is the risk that the fair value or future cash flows of a financial instrument will fluctuate because of changes in market interest rates. The Company enters into both fixed and floating rate debt. The risk management objective is to minimize the potential for changes in interest rates to cause adverse changes in cash flows to the Company. The Company enters into interest rate swap agreements in order to reduce the impact of fluctuating interest rates on its short- and long-term debt. As at December 31, 2017, the Company had several interest rate swap agreements hedging $232.1 million in debts and having maturity dates ranging from April 2021 to December 2021. These instruments are presented at fair value and designated as cash flow hedges. The ratio as at December 31, 2017, of fixed and floating debt was 100.0% and 0.0%, respectively, including the effects of interest rate swap positions (66.25% and 33.75%, respectively, as at December 31, 2016).
Foreign Exchange Risk Management The Company’s financial results are reported in Canadian dollars, while a portion of its Canadian-based operations are in U.S. dollars. Foreign exchange risk is the risk that fluctuations in foreign exchange rates may have on operating results and cash flows. The Company’s risk management objective is to reduce cash flow risk related to foreign denominated cash flows. When the natural hedge of sales and purchases does not match, the Company considers foreign exchange forward contracts to hedge contracted net cash inflows and outflows of U.S. dollars. As at December 31, 2017, the Company had no foreign exchange forward contract agreements in place.
Diesel and Petroleum Price Risk Management Diesel and petroleum price risk is the risk that future cash flows will fluctuate because of changes in price of diesel and petroleum. In order to manage its exposure to diesel and petroleum prices and to help mitigate volatility in operating cash flow, the Company uses derivative commodity contracts based on the New York Harbor Ultra Low Sulfur Diesel Heating Oil to reduce the risk of fluctuating prices on these commodities. As at December 31, 2017, the Company had commodity hedges for 1.2 million gallons of diesel and petroleum. These instruments are presented at fair value and were not designated for hedge accounting purposes.
SIGNIFICANT ACCOUNTING POLICIES
The Company’s significant accounting policies are described in Note 2 to the December 31, 2017 and 2016 audited consolidated financial statements.
The Company prepares its consolidated financial statements in accordance with IFRS as issued by the IASB and CPA Canada Handbook Part I.
The preparation of financial statements in conformity with IFRS requires Management to make estimates and assumptions that affect the reported amounts of assets and liabilities and disclosure of contingent assets and liabilities at the date of the financial statements and the reported amounts of revenue and expenses during the reporting period. Significant items subject to estimates and assumptions include the estimated useful life of assets, impairment of goodwill, determination of the fair value of the assets acquired and liabilities assumed in the context of an acquisition and impairment of long-lived assets. It is possible that actual results could differ from those estimates, and such differences could be material. Estimates are reviewed periodically and, as adjustments become necessary, they are reported in the consolidated statement of income in the period in which they become known.
CHANGES IN ACCOUNTING POLICIES
The Company has adopted the following revised standard along with any consequential amendments, effective January 1, 2017. This change was made in accordance with the applicable transitional provisions.
IAS 7 - Statement of Cash Flows On January 29, 2016, the IASB published amendments to IAS 7, Statement of Cash Flows. The amendments are intended to clarify IAS 7 to improve information provided to users of financial statements about an entity’s financing activities. The adoption of this revised standard requires the Company to provide incremental disclosure in its annual consolidated financial statements.
Impact of accounting pronouncements not yet implemented
IFRS 9 - Financial Instruments The final version of IFRS 9, Financial Instruments (“IFRS 9”), was issued by the IASB in July 2014 and will replace IAS 39 Financial Instruments: Recognition and Measurement. IFRS 9 introduces a model for classification and measurement, a single, forward-looking expected loss impairment model and a substantially reformed approach to hedge accounting. The new single, principle-based approach for determining the classification of financial assets is driven by cash flow characteristics and the business model in which an asset is held. The new model also results in a single impairment model being applied to all financial instruments, which will require more timely recognition
2017 Annual Report
29MANAGEMENT’S DISCUSSION AND ANALYSIS
of expected credit losses. It also includes changes in respect of an entity’s own credit risk in measuring liabilities elected to be measured at fair value, so that gains caused by the deterioration of an entity’s own credit risk on such liabilities are no longer recognized in profit or loss. IFRS 9, which is to be applied retrospectively, is effective for annual periods beginning on or after January 1, 2018. In addition, an entity’s own credit risk changes can be applied early in isolation without otherwise changing the accounting for financial instruments. Management has not identified any material impacts resulting from the transition to IFRS 9.
IFRS 15 - Revenue from Contracts with CustomersIn May 2014, the IASB issued IFRS 15, Revenue from Contracts with Customers, to specify how and when to recognize revenue as well as requiring the provision of more informative and relevant disclosures. IFRS 15 supersedes IAS 18, Revenue, IAS 11, Construction Contracts, and other revenue related interpretations. In September 2015, the IASB issued an amendment to IFRS 15 to defer the effective date by one year to 2018. Management has not identified any material impacts resulting from the transition to IFRS 15.
IFRS 16 - Leases In January 2016, the IASB released IFRS 16, Leases, which supersedes IAS 17, Leases, and the related interpretations on leases: IFRIC 4, Determining whether an arrangement contains a lease, SIC 15, Operating Leases – Incentives and SIC 27, Evaluating the substance of transactions in the legal form of a lease. The standard is effective for annual periods beginning on or after January 1, 2019, with earlier application permitted for companies that also apply IFRS 15, Revenue from Contracts with Customers. The Company is currently evaluating the impact of the standard on its consolidated financial statements. The Company’s future minimum payments under operating leases amount to $80.1 million. Under the new standard the Company will recognize, in the statement of financial position, an asset (the right to use the leased items), equivalent to the actualized cash flows of the future minimum payments, and a corresponding financial liability.
DISCLOSURE CONTROLS AND PROCEDURES
The Company maintains appropriate information systems, procedures and controls to ensure that information used internally and disclosed externally is complete, accurate, reliable and timely. The disclosure controls and procedures (“DC&P”) are designed to provide reasonable assurance that information required to be disclosed in the annual filings, interim filings or other reports filed under securities legislation is recorded, processed, summarized and reported within the time periods specified in the securities legislation and include controls and procedures designed to ensure that information required to be disclosed is accumulated and communicated to Management, including its certifying officers, as appropriate to allow timely decisions regarding required disclosure.
The President and Chief Executive Officer and the Senior Vice-President and Chief Financial Officer of the Company have evaluated, or caused the evaluation of, under their direct supervision, the design and operating effectiveness of the Company’s DC&P (as defined in Regulation 52-109 - Certification of Disclosure in Issuer’s Annual and Interim Filings) as at December 31, 2017, and have concluded that such DC&P were designed and operating effectively.
INTERNAL CONTROL OVER FINANCIAL REPORTING
Management is responsible for establishing and maintaining adequate internal controls over financial reporting (“ICFR”) to provide reasonable assurance regarding the reliability of financial reporting and the preparation of financial statements for external purposes in accordance with IFRS.
Management has evaluated the design and operating effectiveness of its ICFR as defined in Regulation 52-109 – Certification of Disclosure in Issuer’s Annual and Interim Filings. The evaluation was based on the criteria established in the “Internal Control-Integrated Framework” issued by the Committee of Sponsoring Organizations of the Treadway Commission (“COSO”). This evaluation was performed by the President and Chief Executive Officer and the Senior Vice-President and Chief Financial Officer of the Company with the assistance of other Company Management and staff to the extent deemed necessary. Based on this evaluation, the President and Chief Executive Officer and the Senior Vice-President and Chief Financial Officer concluded that the ICFR were appropriately designed and operating effectively, as at December 31, 2017.
In spite of its evaluation, Management does recognize that any controls and procedures, no matter how well designed and operated, can only provide reasonable assurance and not absolute assurance of achieving the desired control objectives.
CHANGES IN INTERNAL CONTROL OVER FINANCIAL REPORTING
No changes were made to the design of ICFR during the period from October 1, 2017 to December 31, 2017 that have materially affected or are reasonably likely to materially affect the Company’s ICFR.

Stella-Jones Inc.
MANAGEMENT’S DISCUSSION AND ANALYSIS30
OUTLOOK
The Company’s railway tie and utility pole product categories are essential components of the North American basic transportation and utility infrastructure. Such infrastructure needs to be regularly maintained which provides Stella-Jones with relatively steady demand for these products. In periods of economic growth, the Company may also benefit from additional demand stemming from expansions to the railway and telecommunication networks.
Based on current market conditions, and assuming stable currencies, Stella-Jones’ total sales and operating margins are expected to improve progressively in 2018 when compared to 2017. Operating margins will remain softer in the first half of 2018. The Company’s overall effective tax rate for 2018 is expected to be approximately 26.0%.
In the railway tie product category, North American railroads will continue to maintain their continental rail network, as operators constantly seek optimal line efficiency. The Company is anticipating that 2018 annual railway tie sales should be relatively stable when compared to 2017. Meanwhile, softer pricing may continue to negatively impact operating margins in the first half of the year, which should gradually return to historical levels by the end of 2018.
In the utility pole product category, demand for regular maintenance projects has historically been relatively steady. Following a return to normal demand patterns in 2017, the Company expects a better sales mix within the product category in 2018. However, these factors should be offset by slight cost increases for certain wood species and the timing of price adjustments.
In the residential lumber product category, the Company expects to further benefit from continued demand for new construction and outdoor renovation projects in the North American residential and commercial markets. Sales for 2018 are also expected to increase as pricing will reflect the higher wood cost.
As one of the largest North American providers of industrial treated wood products, Stella-Jones will leverage the strength of its continental network to capture more of its existing clients’ business in its core railway tie and utility pole markets, while diligently seeking market opportunities in all product categories. The Company will also remain focused on improving operating efficiencies throughout the organization.
In the short-term, the Company will focus on integrating the PFP acquisition as well as optimizing operating capacity and minimizing costs throughout the organization. Cash generation and maintaining a prudent use of leverage remain priorities for Management. The solid cash flows provided by operating activities will be used to reduce debt, invest in working capital as well as in property, plant and equipment and in maintaining an optimal dividend policy to the benefit of shareholders.
Over the long-term, the Company’s strategic vision, focused on continental expansion, remains intact, as Management believes that the fundamentals of each product category will remain strong. A solid financial position will allow Stella-Jones to continue to seek opportunities to further expand its presence in its core markets. These opportunities must meet its stringent investment requirements, provide synergistic opportunities, and add value for shareholders.
March 13, 2018
2017 Annual Report
December 31, 2017 and 2016
Management’s Statement of Responsibility for Financial Information
The consolidated financial statements contained in this Annual Report are the responsibility of Management, and have been prepared in accordance with International Financial Reporting Standards. Where necessary, Management has made judgments and estimates of the outcome of events and transactions, with due consideration given to materiality. Management is also responsible for all other information in the Annual Report and for ensuring that this information is consistent, where appropriate, with the information and data included in the consolidated financial statements.
The Company maintains a system of internal controls to provide reasonable assurance as to the reliability of the financial records and safeguarding of its assets. The consolidated financial statements have been examined by the Company’s independent auditors, PricewaterhouseCoopers LLP, and they have issued their report thereon.
The Board of Directors is responsible for overseeing Management in the performance of its responsibilities for financial reporting. The Board of Directors exercises its responsibilities through the Audit Committee, which is comprised of five independent directors. The Audit Committee meets from time to time with Management and the Company’s independent auditors to review the financial statements and matters relating to the audit. The Company’s independent auditors have full and free access to the Audit Committee. The consolidated financial statements have been reviewed by the Audit Committee, who recommended their approval by the Board of Directors.
Brian McManus Éric Vachon, CPA, CAPresident and Chief Executive Officer Senior Vice-President and Chief Financial Officer
Saint-Laurent, QuébecMarch 13, 2018
CONSOLIDATED FINANCIAL STATEMENTS31

Stella-Jones Inc.
To the Shareholders of Stella-Jones Inc.
We have audited the accompanying consolidated financial statements of Stella-Jones Inc. and its subsidiaries, which comprise the consolidated statement of financial position as at December 31, 2017 and 2016 and the consolidated statements of change in shareholders’ equity, income, comprehensive income and cash flow for the years then ended, and the related notes, which comprise a summary of significant accounting policies and other explanatory information.
Management’s responsibility for the consolidated financial statementsManagement is responsible for the preparation and fair presentation of these consolidated financial statements in accordance with International Financial Reporting Standards, and for such internal control as management determines is necessary to enable the preparation of consolidated financial statements that are free from material misstatement, whether due to fraud or error.
Auditor’s responsibilityOur responsibility is to express an opinion on these consolidated financial statements based on our audits. We conducted our audits in accordance with Canadian generally accepted auditing standards. Those standards require that we comply with ethical requirements and plan and perform the audit to obtain reasonable assurance about whether the consolidated financial statements are free from material misstatement.
An audit involves performing procedures to obtain audit evidence about the amounts and disclosures in the consolidated financial statements. The procedures selected depend on the auditor’s judgment, including the assessment of the risks of material misstatement of the consolidated financial statements, whether due to fraud or error. In making those risk assessments, the auditor considers internal control relevant to the entity’s preparation and fair presentation of the consolidated financial statements in order to design audit procedures that are appropriate in the circumstances, but not for the purpose of expressing an opinion on the effectiveness of the entity’s internal control. An audit also includes evaluating the appropriateness of accounting policies used and the reasonableness of accounting estimates made by management, as well as evaluating the overall presentation of the consolidated financial statements.
We believe that the audit evidence we have obtained in our audits is sufficient and appropriate to provide a basis for our audit opinion.
OpinionIn our opinion, the consolidated financial statements present fairly, in all material respects, the financial position of Stella-Jones Inc. and its subsidiaries as at December 31, 2017 and 2016 and their financial performance and their cash flows for the years then ended in accordance with International Financial Reporting Standards.
Montréal, QuébecMarch 13, 2018
1 FCPA auditor, FCA, public accountancy permit No. A116853
INDEPENDENT AUDITOR’S REPORT32
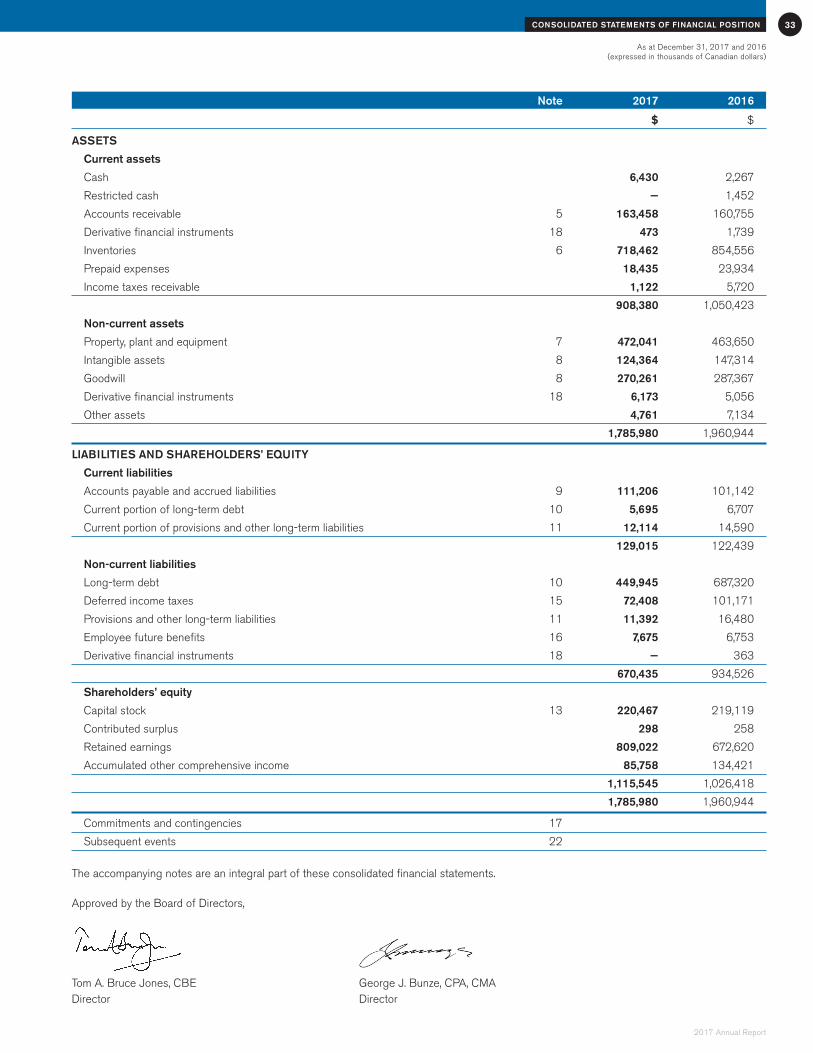
2017 Annual Report
Note 2017 2016
$ $
ASSETS
Current assets
Cash 6,430 2,267
Restricted cash — 1,452
Accounts receivable 5 163,458 160,755
Derivative financial instruments 18 473 1,739
Inventories 6 718,462 854,556
Prepaid expenses 18,435 23,934
Income taxes receivable 1,122 5,720
908,380 1,050,423
Non-current assets
Property, plant and equipment 7 472,041 463,650
Intangible assets 8 124,364 147,314
Goodwill 8 270,261 287,367
Derivative financial instruments 18 6,173 5,056
Other assets 4,761 7,134
1,785,980 1,960,944
LIABILITIES AND SHAREHOLDERS’ EQUITY
Current liabilities
Accounts payable and accrued liabilities 9 111,206 101,142
Current portion of long-term debt 10 5,695 6,707
Current portion of provisions and other long-term liabilities 11 12,114 14,590
129,015 122,439
Non-current liabilities
Long-term debt 10 449,945 687,320
Deferred income taxes 15 72,408 101,171
Provisions and other long-term liabilities 11 11,392 16,480
Employee future benefits 16 7,675 6,753
Derivative financial instruments 18 — 363
670,435 934,526
Shareholders’ equity
Capital stock 13 220,467 219,119
Contributed surplus 298 258
Retained earnings 809,022 672,620
Accumulated other comprehensive income 85,758 134,421
1,115,545 1,026,418
1,785,980 1,960,944
Commitments and contingencies 17
Subsequent events 22
The accompanying notes are an integral part of these consolidated financial statements.
Approved by the Board of Directors,
Tom A. Bruce Jones, CBE George J. Bunze, CPA, CMADirector Director
As at December 31, 2017 and 2016 (expressed in thousands of Canadian dollars)
CONSOLIDATED STATEMENTS OF FINANCIAL POSITION 33

Stella-Jones Inc.
Accumulated other comprehensive income
Translation of long-term
debts Foreign designated Unrealized currency as net gains on Total Capital Contributed Retained translation investment cash flow shareholders’ stock surplus earnings adjustment hedges hedges Total equity
$ $ $ $ $ $ $ $
Balance – January 1, 2016 216,474 503 546,402 247,092 (97,184) 215 150,123 913,502
Comprehensive income (loss)
Net income for the year — — 153,898 — — — — 153,898
Other comprehensive income (loss) — — 9 (23,968) 4,652 3,614 (15,702) (15,693)
Comprehensive income (loss) for the year — — 153,907 (23,968) 4,652 3,614 (15,702) 138,205
Dividends on common shares — — (27,689) — — — — (27,689)
Exercise of stock options 1,479 (401) — — — — — 1,078
Employee share purchase plans 1,166 — — — — — — 1,166
Stock-based compensation (note 13) — 156 — — — — — 156
2,645 (245) (27,689) — — — — (25,289)
Balance – December 31, 2016 219,119 258 672,620 223,124 (92,532) 3,829 134,421 1,026,418
Balance – January 1, 2017 219,119 258 672,620 223,124 (92,532) 3,829 134,421 1,026,418
Comprehensive income (loss)
Net income for the year — — 167,889 — — — — 167,889
Other comprehensive income (loss) — — (983) (72,504) 23,111 730 (48,663) (49,646)
Comprehensive income (loss) for the year — — 166,906 (72,504) 23,111 730 (48,663) 118,243
Dividends on common shares — — (30,504) — — — — (30,504)
Exercise of stock options 146 (47) — — — — — 99
Employee share purchase plans 1,202 — — — — — — 1,202
Stock-based compensation (note 13) — 87 — — — — — 87
1,348 40 (30,504) — — — — (29,116)
Balance – December 31, 2017 220,467 298 809,022 150,620 (69,421) 4,559 85,758 1,115,545
The accompanying notes are an integral part of these consolidated financial statements.
For the years ended December 31, 2017 and 2016 (expressed in thousands of Canadian dollars)
CONSOLIDATED STATEMENTS OF CHANGE IN SHAREHOLDERS’ EQUITY34

2017 Annual Report
Note 2017 2016
$ $
Sales 1,886,142 1,838,353
Expenses
Cost of sales 1,586,263 1,504,639
Selling and administrative 93,828 94,962
Other losses (gains), net (1,337) 5,509
14 1,678,754 1,605,110
Operating income 207,388 233,243
Financial expenses 14 19,009 17,859
Income before income taxes 188,379 215,384
Provision for (recovery of) income taxes
Current 15 41,566 47,526
Deferred 15 (21,076) 13,960
20,490 61,486
Net income for the year 167,889 153,898
Basic earnings per common share 13 2.42 2.22
Diluted earnings per common share 13 2.42 2.22
The accompanying notes are an integral part of these consolidated financial statements.
For the years ended December 31, 2017 and 2016 (expressed in thousands of Canadian dollars, except earnings per common share)
35 CONSOLIDATED STATEMENTS OF INCOME

Stella-Jones Inc.
2017 2016
$ $
Net income for the year 167,889 153,898
Other comprehensive income
Items that may subsequently be reclassified to net income
Net change in losses on translation of financial statements of foreign operations (81,920) (26,863)
Income taxes on change in losses on translation of financial statements of foreign operations 9,416 2,895
Change in gains on translation of long-term debts designated as hedges of net investment in foreign operations 29,332 7,291
Income taxes on change in gains on translation of long-term debts designated as hedges of net investment in foreign operations (6,221) (2,639)
Change in gains on fair value of derivatives designated as cash flow hedges 1,026 4,897
Income taxes on change in gains on fair value of derivatives designated as cash flow hedges (296) (1,283)
Items that will not subsequently be reclassified to net income
Remeasurements of post-retirement benefit obligations (737) 40
Income taxes on remeasurements of post-retirement benefit obligations (246) (31)
(49,646) (15,693)
Comprehensive income for the year 118,243 138,205
The accompanying notes are an integral part of these consolidated financial statements.
For the years ended December 31, 2017 and 2016 (expressed in thousands of Canadian dollars)
CONSOLIDATED STATEMENTS OF COMPREHENSIVE INCOME36
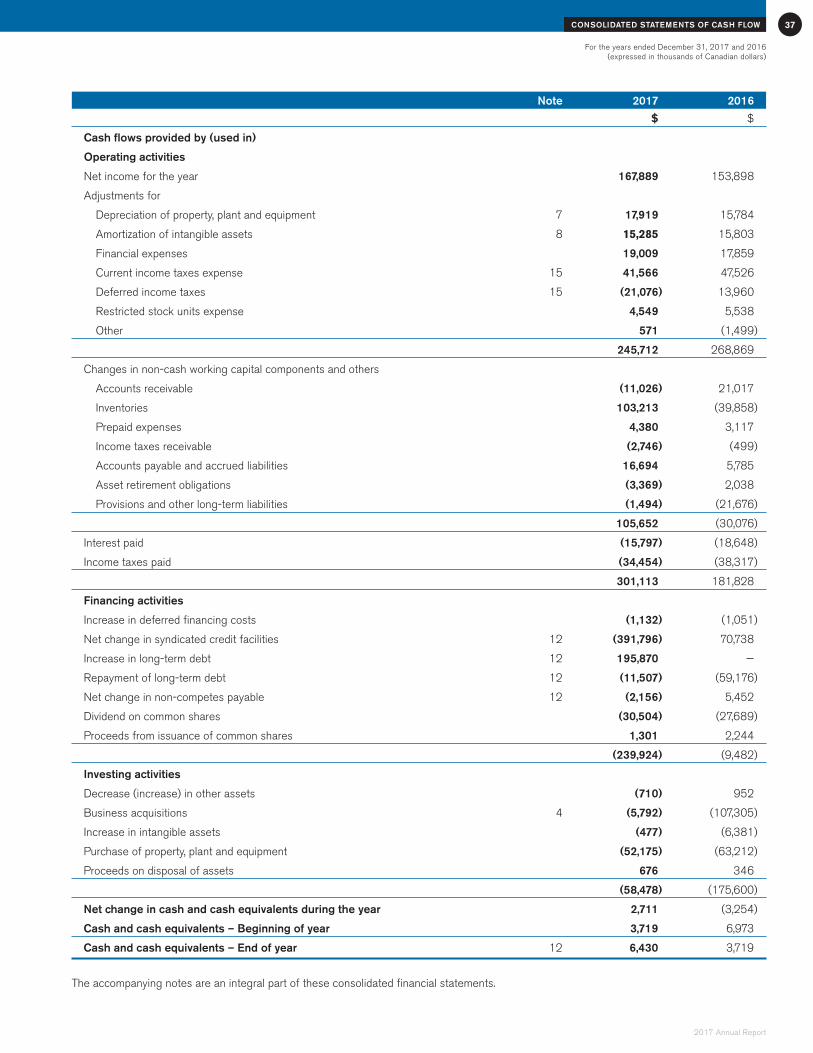
2017 Annual Report
Note 2017 2016
$ $
Cash flows provided by (used in)
Operating activities
Net income for the year 167,889 153,898
Adjustments for
Depreciation of property, plant and equipment 7 17,919 15,784
Amortization of intangible assets 8 15,285 15,803
Financial expenses 19,009 17,859
Current income taxes expense 15 41,566 47,526
Deferred income taxes 15 (21,076) 13,960
Restricted stock units expense 4,549 5,538
Other 571 (1,499)
245,712 268,869
Changes in non-cash working capital components and others
Accounts receivable (11,026) 21,017
Inventories 103,213 (39,858)
Prepaid expenses 4,380 3,117
Income taxes receivable (2,746) (499)
Accounts payable and accrued liabilities 16,694 5,785
Asset retirement obligations (3,369) 2,038
Provisions and other long-term liabilities (1,494) (21,676)
105,652 (30,076)
Interest paid (15,797) (18,648)
Income taxes paid (34,454) (38,317)
301,113 181,828
Financing activities
Increase in deferred financing costs (1,132) (1,051)
Net change in syndicated credit facilities 12 (391,796) 70,738
Increase in long-term debt 12 195,870 —
Repayment of long-term debt 12 (11,507) (59,176)
Net change in non-competes payable 12 (2,156) 5,452
Dividend on common shares (30,504) (27,689)
Proceeds from issuance of common shares 1,301 2,244
(239,924) (9,482)
Investing activities
Decrease (increase) in other assets (710) 952
Business acquisitions 4 (5,792) (107,305)
Increase in intangible assets (477) (6,381)
Purchase of property, plant and equipment (52,175) (63,212)
Proceeds on disposal of assets 676 346
(58,478) (175,600)
Net change in cash and cash equivalents during the year 2,711 (3,254)
Cash and cash equivalents – Beginning of year 3,719 6,973
Cash and cash equivalents – End of year 12 6,430 3,719
The accompanying notes are an integral part of these consolidated financial statements.
For the years ended December 31, 2017 and 2016 (expressed in thousands of Canadian dollars)
37 CONSOLIDATED STATEMENTS OF CASH FLOW
December 31, 2017 and 2016 (amounts expressed in thousands of Canadian dollars, except as otherwise indicated)
NOTES TO CONSOLIDATED FINANCIAL STATEMENTS38
Stella-Jones Inc.
1 DESCRIPTION OF THE BUSINESS
Stella-Jones Inc. (the “Company”) is a leading producer and marketer of pressure treated wood products. The Company supplies North America’s railroad operators with railway ties and timbers, and the continent’s electrical utilities and telecommunication companies with utility poles. Stella-Jones Inc. also manufactures and distributes residential lumber and accessories to retailers for outdoor applications, as well as industrial products which include marine and foundation pilings, construction timbers, wood for bridges and coal tar based products. The Company has treating and pole peeling facilities across Canada and the United States and sells its products primarily in these two countries. The Company’s headquarters are located at 3100 de la Côte-Vertu Blvd., in Saint-Laurent, Quebec, Canada. The Company is incorporated under the Canada Business Corporations Act, and its common shares are listed on the Toronto Stock Exchange (“TSX”) under the stock symbol SJ.
2 SIGNIFICANT ACCOUNTING POLICIES
Basis of presentation The Company prepares its consolidated financial statements in accordance with International Financial Reporting Standards (“IFRS”) as issued by the International Accounting Standards Board (“IASB”) and Chartered Professional Accountants Canada Handbook Part I.
These consolidated financial statements were approved by the Board of Directors on March 13, 2018.
Basis of measurementThe consolidated financial statements have been prepared under the historical cost convention, except for derivative financial instruments and certain long-term liabilities which are measured at fair value. The Company has consistently applied the same accounting policies for all periods presented, except for the newly adopted standards.
Principles of consolidationSubsidiariesThe consolidated financial statements include the accounts of the Company and its wholly owned subsidiaries. The Company owns 100% of the equity interests of its subsidiaries. The significant subsidiaries are as follows:
Country of Subsidiary Parent incorporation
Stella-Jones U.S. Holding Corporation (“SJ Holding”) Stella-Jones Inc. United States
Stella-Jones Corporation Stella-Jones U.S. Holding Corporation United States
McFarland Cascade Holdings, Inc. (“McFarland”) Stella-Jones Corporation United States
Cascade Pole and Lumber Company McFarland Cascade Holdings, Inc. United States
McFarland Cascade Pole & Lumber Company McFarland Cascade Holdings, Inc. United States
Stella-Jones CDN Finance Inc. Stella-Jones Inc. Canada
Stella-Jones U.S. Finance II Corporation Stella-Jones U.S. Holding Corporation United States
Stella-Jones U.S. II LLC Stella-Jones U.S. Holding Corporation United States
Stella-Jones U.S. Finance III Corporation Stella-Jones U.S. Holding Corporation United States
Stella-Jones U.S. III L.L.C. Stella-Jones U.S. Holding Corporation United States
Kisatchie Midnight Express, LLC McFarland Cascade Holdings, Inc. United States
Lufkin Creosoting Co., Inc. McFarland Cascade Holdings, Inc. United States

December 31, 2017 and 2016(amounts expressed in thousands of Canadian dollars, except as otherwise indicated)
39NOTES TO CONSOLIDATED FINANCIAL STATEMENTS
2017 Annual Report
2 SIGNIFICANT ACCOUNTING POLICIES (CONTINUED)
Principles of consolidation (continued)
Subsidiaries (continued)On October 24, 2017, SJ Holding incorporated Stella-Jones U.S. III L.L.C., a wholly-owned Limited Liability Company, and Stella-Jones U.S. Finance III Corporation, a wholly owned corporation, both under the laws of Delaware.
On November 29, 2017, Stella-Jones Inc. disposed of its participation in SJ Holding in favor of Canadalux S.à.r.l. Shortly after on the same day, Canadalux S.à.r.l. was liquidated into Stella-Jones Inc.
The Company controls an entity when it is exposed to, or has rights to, variable returns from its involvement with the entity and has the ability to affect those returns through its power over the entity. The existence and effect of potential voting rights that are currently exercisable or convertible are considered when assessing whether the Company controls another entity. Subsidiaries are fully consolidated from the date on which control is transferred to the Company. They are de-consolidated from the date that control ceases.
Business combinationsThe acquisition method of accounting is used to account for the acquisition of subsidiaries by the Company. The consideration transferred for the acquisition of a subsidiary is the fair value of the assets transferred, the liabilities incurred and the equity interests issued by the group. The consideration transferred also includes the fair value of any asset or liability resulting from a contingent consideration arrangement. Acquisition-related costs are expensed as incurred. Identifiable assets acquired and liabilities and contingent liabilities assumed in a business combination are measured initially at their fair values at the acquisition date.
The excess of the aggregate of the consideration transferred, the fair value of any non-controlling interest in the acquiree and the acquisition-date fair value of any previous equity interest in the acquiree over the fair value of the group’s share of the net identifiable assets acquired and liabilities assumed is recorded as goodwill. If the cost of acquisition is less than the fair value of the net assets of the subsidiary acquired, the difference is recognized directly in the consolidated statement of income. Accounting policies of the subsidiaries have been changed where necessary to ensure consistency with the policies adopted by the Company.
Foreign currency translation
a) Functional and presentation currencyItems included in the financial statements of each of the Company’s entities are measured using the currency of the primary economic environment in which the entity operates (the “functional currency”). The consolidated financial statements are presented in Canadian dollars, which is the Company’s presentation currency.
b) Foreign currency transactionsForeign currency transactions are translated into the functional currency using the exchange rates prevailing at the dates of the transactions. Revenue and expenses denominated in a foreign currency are translated by applying the monthly average exchange rates. Monetary assets and liabilities denominated in foreign currencies are translated at the rate in effect at the statement of financial position date. Foreign exchange gains and losses resulting from the settlement of such transactions and from the translation of monetary assets and liabilities not denominated in the functional currency are recognized in the consolidated statement of income within other losses (gains), net, except for qualifying cash flow hedges which are recognized in other comprehensive income and deferred in accumulated other comprehensive income in shareholders’ equity.
Non-monetary assets and liabilities denominated in foreign currencies that are measured at fair value are translated to the functional currency at the exchange rate at the date that the fair value was determined. Foreign currency differences arising on translation are recognized in the consolidated statement of income, except for differences arising on the translation of available-for-sale (equity) investments and foreign currency differences arising on the translation of a financial liability designated as a hedge of a net investment, which are recognized in other comprehensive income.
Non-monetary assets and liabilities denominated in foreign currencies that are measured at cost remain translated in the functional currency at historical exchange rates.

December 31, 2017 and 2016 (amounts expressed in thousands of Canadian dollars, except as otherwise indicated)
NOTES TO CONSOLIDATED FINANCIAL STATEMENTS40
Stella-Jones Inc.
2 SIGNIFICANT ACCOUNTING POLICIES (CONTINUED)
Foreign currency translation (continued)
c) Foreign operationsThe financial statements of entities that have a functional currency different from that of the Company are translated using the rate in effect at the statement of financial position date for assets and liabilities, and the monthly average exchange rates during the year for revenues and expenses. Adjustments arising from this translation are recorded in accumulated other comprehensive income in shareholders’ equity.
d) Hedges of net investments in foreign operationsForeign currency differences arising on the translation of a financial liability designated as a hedge of net investment in foreign operations are recognized in other comprehensive income to the extent that the hedge is effective, and are presented within equity. To the extent that the hedge is ineffective, such differences are recognized in the consolidated statement of income. When the hedged portion of a net investment (the subsidiary) is disposed of, the relevant amount in equity is transferred to the consolidated statement of income as part of the gain or loss on disposal.
Revenue recognitionRevenue from the sale of products is recognized when the entity has transferred to the buyer the significant risks and rewards of ownership of the goods, the entity does not retain either continuing managerial involvement to the degree usually associated with ownership or effective control over the goods sold, the amount of revenue can be measured reliably, it is probable that the economic benefits associated with the transaction will flow to the entity, and the costs incurred or to be incurred in respect of the sale, can be measured reliably. Revenue is net of trade or volume discounts, returns and allowances and claims for damaged goods.
The Company also offers to treat wood products owned by third parties. Revenue from these treating services are recognized when the service is rendered.
Cash and cash equivalentsCash and cash equivalents include cash on hand, bank balances and short-term liquid investments with initial maturities of three months or less.
Restricted cashRestricted cash consists of an amount deposited in an escrow account and intended for capital improvements to be realized in the short-term.
Accounts receivableAccounts receivable are amounts due from customers from the sale of products or services rendered in the ordinary course of business. Accounts receivable are classified as current assets if payment is due within one year or less. Accounts receivable are recognized initially at fair value and subsequently measured at amortized cost, less provision for doubtful accounts.
InventoriesInventories of raw materials are valued at the lower of weighted average cost and net realizable value. Finished goods are valued at the lower of weighted average cost and net realizable value and include the cost of raw materials, direct labour and manufacturing overhead expenses. Net realizable value is the estimated selling price less cost necessary to make the sale.

December 31, 2017 and 2016(amounts expressed in thousands of Canadian dollars, except as otherwise indicated)
41NOTES TO CONSOLIDATED FINANCIAL STATEMENTS
2017 Annual Report
2 SIGNIFICANT ACCOUNTING POLICIES (CONTINUED)
Property, plant and equipmentProperty, plant and equipment are recorded at cost, including borrowing costs incurred during the construction period, less accumulated depreciation. The Company allocates the amount initially recognized in respect of an item of property, plant and equipment to its significant parts, and depreciates separately each such part. Depreciation is calculated on a straight-line basis using rates based on the estimated useful lives of the assets.
Useful life
Buildings 7 to 60 years
Production equipment 5 to 60 years
Rolling stock 3 to 20 years
Office equipment 2 to 10 years
The assets’ residual values and useful lives are reviewed and adjusted, if appropriate, at the end of each reporting period.
Financial expensesBorrowing costs are recognized as financial expenses in the consolidated statement of income in the period in which they are incurred. Borrowing costs attributable to the acquisition, construction or production of qualifying assets are added to the cost of those assets, until such time as the assets are substantially ready for their intended use.
Intangible assetsIntangible assets with finite useful lives are recorded at cost and are amortized over their useful lives. Intangible assets with indefinite useful lives are recorded at cost and are not amortized. The amortization method and estimate of the useful life of an intangible asset are reviewed on an annual basis.
Method Useful life
Customer relationships Straight-line 3 to 12 years
Customer relationships Declining balance 6% to 20%
Non-compete agreements Straight-line 3 to 5 years
Creosote registration – Indefinite
Standing timber costs are recorded at cost less accumulated amortization, which is provided on the basis of timber volumes harvested. In Canada, the Company has perpetual cutting rights where planning and site preparation costs for specific geographical areas are capitalized until the harvest process can begin. Amortization amounts are charged to operations based on a pro rata calculation of timber volumes harvested over the estimated volumes to be harvested in the specific area.
Cutting rights are recorded at cost less accumulated amortization, which is provided on the basis of timber volumes harvested. Amortization amounts are charged to operations based on a pro rata calculation of timber volumes harvested over the estimated volumes to be harvested during a forty-year period, and are applied against the historical cost.
The amortization expense is included in cost of sales in the consolidated statements of income.
The creosote registration is subject to an annual impairment test or more frequently if events or changes in circumstances indicate that it might be impaired.

December 31, 2017 and 2016 (amounts expressed in thousands of Canadian dollars, except as otherwise indicated)
NOTES TO CONSOLIDATED FINANCIAL STATEMENTS42
Stella-Jones Inc.
2 SIGNIFICANT ACCOUNTING POLICIES (CONTINUED)
GoodwillIn the context of an acquisition, goodwill represents the excess of the consideration transferred over the fair value of the Company’s share of the net identifiable assets, liabilities and contingent liabilities of the acquiree and the fair value of the non controlling interest in the acquiree at the date of acquisition. Goodwill is tested annually for impairment and carried at cost less accumulated impairment losses. Impairment losses on goodwill are not reversed. For the purpose of impairment testing, goodwill is allocated to cash-generating units (“CGUs”) or groups of CGUs that are expected to benefit from the business combination in which the goodwill arose. The Company defines CGUs as either plants specialized in the treatment of utility poles and residential lumber or plants specialized in the treatment of railway ties.
ImpairmentImpairments are recorded when the recoverable amounts of assets are less than their carrying amounts. The recoverable amount is the higher of an asset’s fair value less cost of disposal and its value in use. Impairment losses are evaluated for potential reversals when events or changes in circumstances warrant such consideration, except goodwill.
Non-financial assetsThe carrying values of non-financial assets with finite lives, such as property, plant and equipment and intangible assets with finite useful lives, are assessed for impairment whenever events or changes in circumstances indicate that their carrying amounts may not be recoverable. Long-lived assets that are not amortized are subject to an annual impairment test. The recoverable amount is the higher of an asset’s fair value less costs of disposal and its value in use (being the present value of the expected future cash flows of the relevant asset or CGU). An impairment loss is recognized for the amount by which the asset’s carrying amount exceeds its recoverable amount. For the purpose of assessing impairment, assets are grouped at the lowest levels for which there are separately identifiable cash flows (CGUs). Non-financial assets other than goodwill that have suffered impairment are reviewed for possible reversal of the impairment at each reporting date.
LeasesThe Company leases certain property, plant and equipment.
Leases in which a significant portion of the risks and rewards of ownership are retained by the lessor are classified as operating leases. Payments made under operating leases, net of any incentives received from the lessor, are charged to the consolidated statement of income on a straight-line basis over the term of the lease.
Leases of property, plant and equipment where the Company assumes substantially all the risks and rewards of ownership are classified as finance leases. Finance leases are capitalized at the lease’s commencement at the lower of the fair value of the leased property and the present value of the minimum lease payments.
Each finance lease payment is allocated between the liability and finance charges so as to achieve a constant rate on the finance balance outstanding. The corresponding rental obligations, net of finance charges, are included in long-term debt. The interest element of the finance cost is charged to the consolidated statement of income over the lease term so as to produce a constant periodic rate of interest on the remaining balance of the liability for each period.
The depreciable amount of a leased asset is allocated to each accounting period during the period of expected use on a systematic basis consistent with the depreciation policy the Company adopts for depreciable assets that are owned. If there is reasonable certainty that the Company will obtain ownership by the end of the lease term, the period of expected use is the useful life of the asset; otherwise, the asset is depreciated over the shorter of the lease term and its useful life.
Non-current assets held for saleNon-current assets are classified as assets held for sale when their carrying amount is to be recovered principally through a sales transaction and a sale is considered highly probable. They are stated at the lower of carrying amount and fair value less cost of disposal if their carrying amount is to be recovered principally through a sales transaction rather than through continuing use.

December 31, 2017 and 2016(amounts expressed in thousands of Canadian dollars, except as otherwise indicated)
43NOTES TO CONSOLIDATED FINANCIAL STATEMENTS
2017 Annual Report
2 SIGNIFICANT ACCOUNTING POLICIES (CONTINUED)
ProvisionsProvisions for site remediation and other provisions are recognized when the Company has a legal or constructive obligation as a result of past events, when it is probable that an outflow of resources will be required to settle the obligation and when a reliable estimate can be made of the amount of the obligation. If some or all of the expenditure required to settle a provision is expected to be reimbursed by another party, the reimbursement is recorded in the consolidated statement of financial position as a separate asset, but only if it is virtually certain that reimbursement will be received.
Provisions are measured at the present value of the expenditures expected to be required to settle the obligation using a pre-tax rate that reflects current market assessments of the time value of money and the risks specific to the obligation. The increase in the provision due to passage of time is recognized as a financial expense.
The Company considers the current portion of the provision to be an obligation whose settlement is expected to occur within the next twelve months.
Site remediation obligationsSite remediation obligations relate to the discounted present value of estimated future expenditures associated with the obligations of restoring the environmental integrity of certain properties. The Company reviews estimates of future site remediation expenditures on an ongoing basis and records any revisions, along with the accretion expense on existing obligations, in other losses (gains), net in the consolidated statement of income.
At each reporting date, the liability is remeasured for changes in discount rates and in the estimate of the amount, timing and cost of the work to be carried out.
Income taxesThe tax expense comprises current and deferred tax. Tax expense is recognized in the consolidated statement of income, except to the extent that it relates to items recognized in other comprehensive income or directly to shareholders’ equity.
Current taxThe current income tax charge is based on the results for the period as adjusted for items that are not taxable or not deductible. Tax adjustments from prior years are also recorded in current tax. Current tax is calculated using tax rates and laws that were enacted or substantively enacted at the end of the reporting period. Management periodically evaluates positions taken in tax returns with respect to situations in which applicable tax regulation is subject to interpretation. Provisions are established where appropriate on the basis of amounts expected to be paid to the tax authorities. During the year, the tax provision calculation is based on an estimate of the annual tax rate.
Deferred taxDeferred tax is recognized, using the liability method, on temporary differences arising between the tax bases of assets and liabilities and their carrying amounts in the consolidated financial statements. Deferred income tax is determined on a non-discounted basis using tax rates and laws that have been enacted or substantively enacted at the consolidated statement of financial position date and are expected to apply when the deferred tax asset or liability is settled. Deferred tax assets are recognized to the extent that it is probable that the assets can be recovered.
Deferred income tax assets and liabilities are presented as non-current.
Deferred income tax assets and liabilities are offset when there is a legally enforceable right to offset current tax assets against current tax liabilities and when the deferred income tax assets and liabilities relate to income taxes levied by the same taxation authority on either the same taxable entity or different taxable entities where there is an intention to settle the balances on a net basis.
Deferred tax assets and liabilities are not recognized in respect of temporary differences that arise on initial recognition of assets and liabilities acquired other than in a business combination.

December 31, 2017 and 2016 (amounts expressed in thousands of Canadian dollars, except as otherwise indicated)
NOTES TO CONSOLIDATED FINANCIAL STATEMENTS44
Stella-Jones Inc.
2 SIGNIFICANT ACCOUNTING POLICIES (CONTINUED)
Employee future benefitsOther post-retirement benefit programsThe Company provides other post-retirement healthcare benefits to certain retirees. The entitlement to these benefits is usually conditional on the employee remaining in service up to retirement age and the completion of a minimum service period. The expected costs of these benefits are attributed from the date when service by the employee first leads to benefits under the plan, until the date when further service by the employee will lead to no material amount of further benefits. Actuarial gains and losses arising from experience adjustments and changes in actuarial assumptions are charged or credited to other comprehensive income in the period in which they arise.
The cost of future benefits earned by employees is established by actuarial calculations using the projected benefit method pro-rated on years of service based on Management’s best estimate of economic and demographic assumptions.
Defined benefit pension planThe Company accrues obligations and related costs under defined benefit pension plans, net of plan assets. The cost of pensions earned by employees is actuarially determined using the projected unit credit method and Management’s best estimate of expected plan investment performance, salary escalation, retirement ages of employees and discount rates on obligations. Past service costs from plan amendments are recognized in net income when incurred.
Remeasurements consisting of actuarial gains and losses, the actual return on plan assets (excluding the net interest component) and any change in the asset ceiling are recognized in other comprehensive income. The amounts recognized in other comprehensive income are recognized immediately in retained earnings without recycling to the consolidated statements of income in subsequent periods.
Stock-based compensation and other stock-based paymentsThe Company operates a number of equity-settled and cash-settled share-based compensation plans under which it receives services from employees as consideration for equity instruments of the Company or cash payments.
Equity-settled planThe Company accounts for stock options granted to employees using the fair value method. Under this method, compensation expense for stock options granted is measured at fair value at the grant date using the Black-Scholes valuation model and is charged to operations over the vesting period of the options granted, with a corresponding credit to contributed surplus. For grants of share-based awards with graded vesting, each tranche is considered a separate grant with a different vesting date and fair value. Any consideration paid on the exercise of stock options is credited to capital stock together with any related stock-based compensation expense included in contributed surplus.
Cash-settled planThe Company has restricted stock units (“RSUs”) and measures the liability incurred and the compensation expenses at fair value by applying the Black-Scholes valuation model. The compensation expenses are recognized in the consolidated statements of income over the vesting periods. Until the liability is settled, the fair value of that liability is remeasured at each reporting date, with changes in fair value recognized in the consolidated statements of income.
December 31, 2017 and 2016(amounts expressed in thousands of Canadian dollars, except as otherwise indicated)
45NOTES TO CONSOLIDATED FINANCIAL STATEMENTS
2017 Annual Report
2 SIGNIFICANT ACCOUNTING POLICIES (CONTINUED)
Financial instruments Financial assets and financial liabilities are recognized when the Company becomes a party to the contractual provisions of the instrument. Financial assets are derecognized when the rights to receive cash flows from the assets have expired or have been transferred and the Company has transferred substantially all risks and rewards of ownership. Financial liabilities are derecognized when the obligation specified in the contract is discharged, cancelled or expires.
Financial assets and financial liabilities are offset and the net amount is reported in the consolidated statement of financial position when there is a legally enforceable right to offset the recognized amounts and there is an intention to settle on a net basis, or realize the asset and settle the liability simultaneously.
At initial recognition, the Company classifies its financial instruments in the following categories depending on the purpose for which the instruments were acquired:
a) Financial assets and financial liabilities at fair value through profit or loss: A financial asset or financial liability is classified in this category if acquired principally for the purpose of selling or repurchasing in the short term. Derivatives are also included in this category unless they are designated as hedges. Interest rate swap agreements, foreign exchange forward contracts and derivative commodity contracts are considered by the Company as derivative financial instruments and, if required, are designated as cash flow hedges (see (e) below).
Financial instruments in this category are recognized initially and subsequently at fair value. Transaction costs are expensed in the consolidated statement of income. Gains and losses arising from changes in fair value are presented in the consolidated statement of income as part of other gains and losses in the period in which they arise. Financial assets and financial liabilities at fair value through profit or loss are classified as current except for the portion expected to be realized or paid beyond twelve months of the consolidated statement of financial position date, which is classified as non-current.
b) Available-for-sale investments: Available-for-sale investments are non-derivatives that are either designated in this category or not classified in any of the other categories.
Available-for-sale investments are recognized initially at fair value plus transaction costs and are subsequently carried at fair value. Gains or losses arising from changes in fair value are recognized in other comprehensive income. Available-for-sale investments are classified as non-current unless they mature within twelve months, or Management expects to dispose of them within twelve months.
Interest on available-for-sale investments, calculated using the effective interest method, is recognized in the consolidated statement of income as part of interest income. Dividends on available-for-sale equity instruments are recognized in the consolidated statement of income as part of other gains and losses when the Company’s right to receive payment is established. When an available-for-sale investment is sold or impaired, the accumulated gains or losses are moved from accumulated other comprehensive income to the consolidated statement of income and are included in other gains and losses.
c) Loans and receivables: Loans and receivables are non-derivative financial assets with fixed or determinable payments that are not quoted in an active market. The Company’s loans and receivables comprise accounts receivable and cash and cash equivalents, and are included in current assets due to their short-term nature.
Loans and receivables are initially recognized at the amount expected to be received, less, when material, a discount to reduce the loans and receivables to fair value. Subsequently, loans and receivables are measured at amortized cost using the effective interest method less a provision for impairment, if any.

December 31, 2017 and 2016 (amounts expressed in thousands of Canadian dollars, except as otherwise indicated)
NOTES TO CONSOLIDATED FINANCIAL STATEMENTS46
Stella-Jones Inc.
2 SIGNIFICANT ACCOUNTING POLICIES (CONTINUED)
Financial instruments (continued)
d) Financial liabilities at amortized cost: Financial liabilities at amortized cost include accounts payable and accrued liabilities, bank indebtedness and long-term debt. Accounts payable and accrued liabilities are initially recognized at the amount required to be paid, less, when material, a discount to reduce the payables to fair value. Subsequently, accounts payable and accrued liabilities are measured at amortized cost using the effective interest method. Bank indebtedness and long-term debt are recognized initially at fair value, net of any transaction costs incurred, and subsequently at amortized cost using the effective interest method.
Financial liabilities are classified as current liabilities if payment is due within twelve months. Otherwise, they are presented as non-current liabilities.
e) Derivative financial instruments: The Company uses derivatives in the form of interest rate swap agreements to manage risks related to its variable rate debt, foreign exchange forward contracts to limit its exposure to the fluctuations of the U.S. dollar and derivative commodity contracts to limit its exposure to the fluctuation of diesel and petroleum prices. All derivatives classified as held-for-trading are included in the consolidated statement of financial position and are classified as current or non-current based on the contractual terms specific to the instrument, with gains and losses on remeasurement recorded in income. All derivatives qualifying for hedge accounting are included in the consolidated statement of financial position and are classified as current or non-current based on the contractual terms specific to the instruments, with gains and losses on remeasurement included in other comprehensive income.
Hedging transactionsAs part of its hedging strategy, the Company considers foreign exchange forward contracts to limit its exposure under contracted cash inflows of sales denominated in U.S. dollars from its Canadian-based operations. The Company also considers interest rate swap agreements in order to reduce the impact of fluctuating interest rates on its short-term and long-term debt. These contracts are treated as cash flow hedges for accounting purposes and are not fair-valued through profit and loss.
Effective derivative financial instruments held for cash flow hedging purposes are recognized at fair value, and the changes in fair value related to the effective portion of the hedge are recognized in other comprehensive income. The changes in fair value related to the ineffective portion of the hedge are immediately recorded in the consolidated statement of income. The changes in fair value of foreign exchange forward contracts and interest rate swap agreements recognized in other comprehensive income are reclassified in the consolidated statement of income under sales and financial expenses respectively in the periods during which the cash flows constituting the hedged item affect income.
When the derivative financial instrument no longer qualifies as an effective hedge, or when the hedging instrument is sold or terminated prior to maturity, hedge accounting, if applicable, is discontinued prospectively. Accumulated other comprehensive income related to a foreign exchange forward contract or interest swap hedges that cease to be effective is reclassified in the consolidated statement of income under other losses (gains), net and financial expenses respectively in the periods during which the cash flows constituting the hedged item affect income. Furthermore, if the hedged item is sold or terminated prior to maturity, hedge accounting is discontinued, and the related accumulated other comprehensive income is then reclassified in the consolidated statement of income.
The Company designated a portion of its U.S. dollar-denominated long-term debt as a hedge of its net investment in foreign operations. For such debt designated as a hedge of the net investment in foreign operations, exchange gains and losses are recognized in accumulated other comprehensive income.
December 31, 2017 and 2016(amounts expressed in thousands of Canadian dollars, except as otherwise indicated)
47NOTES TO CONSOLIDATED FINANCIAL STATEMENTS
2017 Annual Report
2 SIGNIFICANT ACCOUNTING POLICIES (CONTINUED)
Earnings per shareBasic earnings per share is calculated by dividing the net income for the period attributable to equity owners of the Company by the weighted average number of common shares outstanding during the year.
Diluted earnings per share is calculated using the treasury stock method. Under this method, earnings per share data are computed as if the options were exercised at the beginning of the year (or at the time of issuance, if later) and as if the funds obtained from exercise were used to purchase common shares of the Company at the average market price during the period.
Segment reportingOperating segments are reported in a manner consistent with the internal reporting provided to the chief operating decision maker. The chief operating decision maker, who is responsible for allocating resources and assessing performance of the operating segments, has been identified as the senior management team, which makes strategic and operational decisions.
Change in accounting policiesThe Company has adopted the following revised standard, along with any consequential amendments, effective January 1, 2017. This change was made in accordance with the applicable transitional provisions.
IAS 7 - Statement of Cash Flows On January 29, 2016, the IASB published amendments to IAS 7, Statement of Cash Flows. The amendments are intended to clarify IAS 7 to improve information provided to users of financial statements about an entity’s financing activities. The incremental disclosures can be found in Note 12.
Impact of accounting pronouncements not yet implemented
IFRS 15 – Revenue from Contracts with CustomersIn May 2014, the IASB issued IFRS 15, Revenue from Contracts with Customers, to specify how and when to recognize revenue as well as requiring the provision of more informative and relevant disclosures. IFRS 15 supersedes IAS 18, Revenue, IAS 11, Construction Contracts, and other revenue related interpretations. In September 2015, the IASB issued an amendment to IFRS 15 to defer the effective date by one year to 2018. Management has not identified any material impacts resulting from the transition to IFRS 15.
IFRS 16 - Leases In January 2016, the IASB released IFRS 16, Leases, which supersedes IAS 17, Leases, and the related interpretations on leases: IFRIC 4, Determining whether an arrangement contains a lease, SIC 15, Operating Leases – Incentives and SIC 27, Evaluating the substance of transactions in the legal form of a lease. The standard is effective for annual periods beginning on or after January 1, 2019, with earlier application permitted for companies that also apply IFRS 15, Revenue from Contracts with Customers. The Company is currently evaluating the impact of the standard on its consolidated financial statements. The Company’s future minimum payments under operating leases amount to $80,134. Under the new standard the Company will recognize, in the statement of financial position, an asset (the right to use the leased items), equivalent to the actualized cash flows of the future minimum payments, and a corresponding financial liability.
IFRS 9 – Financial Instruments The final version of IFRS 9, Financial instruments (“IFRS 9”), was issued by the IASB in July 2014 and will replace IAS 39 Financial Instruments: Recognition and Measurement. IFRS 9 introduces a model for classification and measurement, a single, forward-looking expected loss impairment model and a substantially reformed approach to hedge accounting. The new single, principle-based approach for determining the classification of financial assets is driven by cash flow characteristics and the business model in which an asset is held. The new model also results in a single impairment model being applied to all financial instruments, which will require more timely recognition of expected credit losses. It also includes changes in respect of an entity’s own credit risk in measuring liabilities elected to be measured at fair value, so that gains caused by the deterioration of an entity’s own credit risk on such liabilities are no longer recognized in profit or loss. IFRS 9, which is to be applied retrospectively, is effective for annual periods beginning on or after January 1, 2018. In addition, an entity’s own credit risk changes can be applied early in isolation without otherwise changing the accounting for financial instruments. Management has not identified any material impacts resulting from the transition to IFRS 9.

December 31, 2017 and 2016 (amounts expressed in thousands of Canadian dollars, except as otherwise indicated)
NOTES TO CONSOLIDATED FINANCIAL STATEMENTS48
Stella-Jones Inc.
3 CRITICAL ACCOUNTING ESTIMATES AND JUDGMENTS
The preparation of financial statements in conformity with IFRS requires Management to make estimates and assumptions that affect the reported amounts of assets and liabilities and disclosure of contingent assets and liabilities at the date of the financial statements and the reported amounts of revenue and expenses during the reporting period. Significant items subject to estimates and assumptions include the estimated useful life of assets, impairment of goodwill, determination of the fair value of the assets acquired and liabilities assumed in the context of an acquisition and impairment of long-lived assets. Management also makes estimates and assumptions in the context of business combination mainly with sale forecast, margin forecast, income tax rate and discount rate. It is possible that actual results could differ from those estimates, and such differences could be material. Estimates are reviewed periodically and, as adjustments become necessary, they are reported in the consolidated statement of income in the period in which they become known.
4 BUSINESS ACQUISITIONS
a) On December 19, 2017, the Company completed the acquisition of substantially all the operating assets employed in the businesses of Wood Products Industries Inc. (“WPI”) located in South River, Ontario. The Company plans on using these assets to treat residential lumber.
Total cash outlay associated with the acquisition was approximately $4,245, excluding acquisition costs of approximately $234, recognized in the consolidated statement of income under selling and administrative expenses. The Company financed the acquisition through its existing syndicated credit facilities.
b) On December 21, 2016, the Company completed the acquisition of substantially all the operating assets employed in the businesses of Bois KMS (GMI) Ltée (“KMS”) and Northern Pressure Treated Wood (N.P.T.W.) Ltd (“NPTW”). KMS and NPTW manufacture treated wood utility poles in their facilities located in Rivière-Rouge, Québec and Kirkland Lake, Ontario, respectively, and were acquired for synergistic reasons.
Total cash outlay associated with the acquisition was $19,249, excluding acquisition costs of approximately $1,048, recognized in the 2016 consolidated statement of income under selling and administrative expenses. The Company financed the acquisition through its existing syndicated credit facilities.
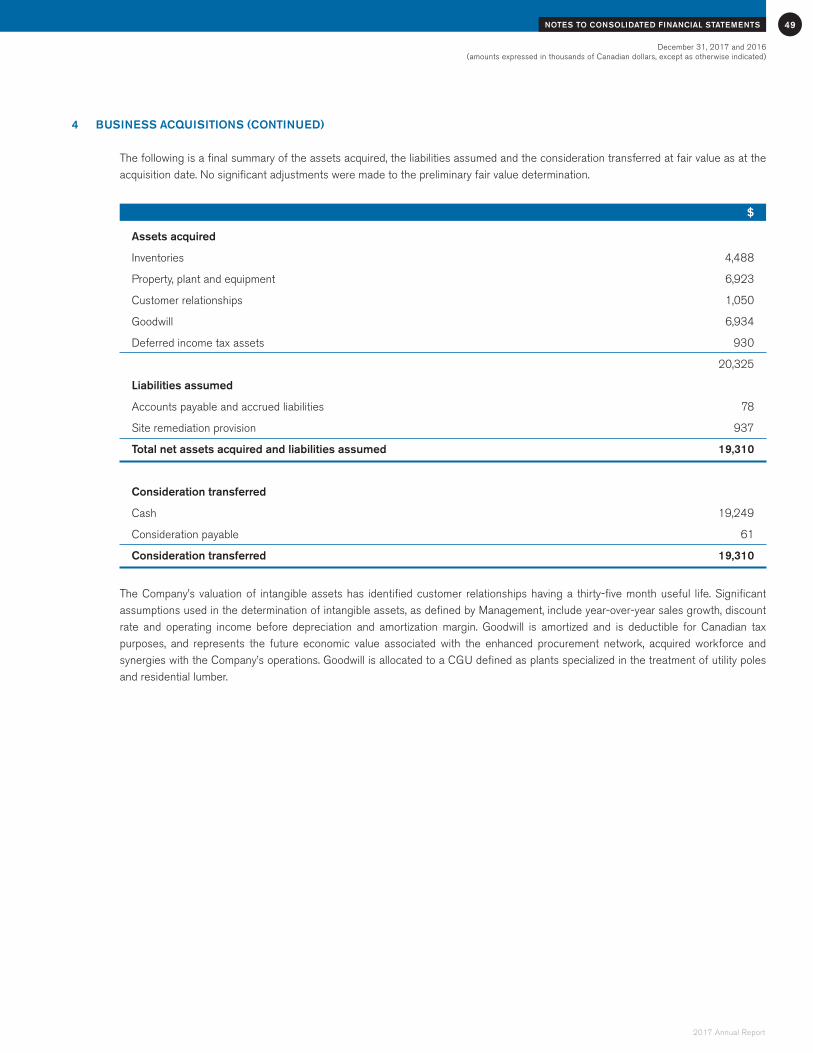
December 31, 2017 and 2016(amounts expressed in thousands of Canadian dollars, except as otherwise indicated)
49NOTES TO CONSOLIDATED FINANCIAL STATEMENTS
2017 Annual Report
4 BUSINESS ACQUISITIONS (CONTINUED)
The following is a final summary of the assets acquired, the liabilities assumed and the consideration transferred at fair value as at the acquisition date. No significant adjustments were made to the preliminary fair value determination.
$
Assets acquired
Inventories 4,488
Property, plant and equipment 6,923
Customer relationships 1,050
Goodwill 6,934
Deferred income tax assets 930
20,325
Liabilities assumed
Accounts payable and accrued liabilities 78
Site remediation provision 937
Total net assets acquired and liabilities assumed 19,310
Consideration transferred
Cash 19,249
Consideration payable 61
Consideration transferred 19,310
The Company’s valuation of intangible assets has identified customer relationships having a thirty-five month useful life. Significant assumptions used in the determination of intangible assets, as defined by Management, include year-over-year sales growth, discount rate and operating income before depreciation and amortization margin. Goodwill is amortized and is deductible for Canadian tax purposes, and represents the future economic value associated with the enhanced procurement network, acquired workforce and synergies with the Company’s operations. Goodwill is allocated to a CGU defined as plants specialized in the treatment of utility poles and residential lumber.

December 31, 2017 and 2016 (amounts expressed in thousands of Canadian dollars, except as otherwise indicated)
NOTES TO CONSOLIDATED FINANCIAL STATEMENTS50
Stella-Jones Inc.
4 BUSINESS ACQUISITIONS (CONTINUED)
c) On June 3, 2016, the Company completed, through a wholly-owned U.S. subsidiary, the acquisition of the equity interests of 440 Investments, LLC, the parent company of Kisatchie Treating, L.L.C., Kisatchie Pole & Piling, L.L.C., Kisatchie Trucking, LLC and Kisatchie Midnight Express, LLC (collectively, “Kisatchie”). Kisatchie produces treated poles, pilings and timbers, with two wood treating facilities in Converse and Pineville, Louisiana and was acquired for synergistic reasons.
Total cash outlay associated with the acquisition was $46,153 (US$35,659), excluding acquisition costs of approximately $873, recognized in the 2016 consolidated statement of income under selling and administrative expenses.
The following is a final summary of the assets acquired, the liabilities assumed and the consideration transferred at fair value as at the acquisition date. No significant adjustments were made to the preliminary fair value determination. The original transaction was made in U.S. dollars and converted into Canadian dollars as at the acquisition date.
$
Assets acquired
Cash acquired 2,628
Accounts receivable 5,312
Inventories 12,930
Prepaids 150
Property, plant and equipment 21,217
Customer relationships 6,860
Goodwill 17,523
66,620
Liabilities assumed
Accounts payable and accrued liabilities 1,680
Long-term debt 8,775
Deferred income tax liabilities 63
Site remediation provision 1,195
Total net assets acquired and liabilities assumed 54,907
Consideration transferred
Cash 46,153
Unsecured promissory note 7,838
Consideration payable 916
Consideration transferred 54,907
The Company’s valuation of intangible assets has identified customer relationships amortized at a declining rate of 20.00%. Significant assumptions used in the determination of intangible assets, as defined by Management, include year-over-year sales growth, discount rate and operating income before depreciation and amortization margin. Goodwill is amortized and deductible for U.S. tax purposes, and represents the future economic value associated with the enhanced procurement network, acquired workforce and synergies with the Company’s operations. Goodwill is allocated to a CGU defined as plants specialized in the treatment of utility poles and residential lumber.

December 31, 2017 and 2016(amounts expressed in thousands of Canadian dollars, except as otherwise indicated)
51NOTES TO CONSOLIDATED FINANCIAL STATEMENTS
2017 Annual Report
4 BUSINESS ACQUISITIONS (CONTINUED)
The Company financed the acquisition through a combination of its existing syndicated credit facilities, an unsecured promissory note of $9,128 (US$7,052) and assumed a promissory note secured by the land of the Pineville facility having a balance of US$5,685. The unsecured promissory note bears interest at 1.41%, is payable in three installments, including interest, of US$1,500 in June 2019 and 2020 and US$4,500 in June 2021. This unsecured promissory note was recorded at a fair value of $7,838 (US$6,056), using an effective interest rate of 5.00%. The secured promissory note bears interest of 5.76%, is payable in quarterly installments of US$162 up to July 2028 and was recorded at a fair value of $8,775 (US$6,780) using an effective interest rate of 4.00%.
d) On June 3, 2016, the Company completed, through a wholly-owned U.S. subsidiary, the acquisition of the shares of Lufkin Creosoting Co., Inc. (“Lufkin Creosoting”). Lufkin Creosoting produces treated poles and timbers at its wood treating facility in Lufkin, Texas and was acquired for synergistic reasons.
Total cash outlay associated with the acquisition was $46,503 (US$35,929), excluding acquisition costs of approximately $978, recognized in the 2016 consolidated statement of income under selling and administrative expenses.
The following is a final summary of the assets acquired, the liabilities assumed and the consideration transferred at fair value as at the acquisition date. No significant adjustments were made to the preliminary fair value determination. The original transaction was made in U.S. dollars and converted into Canadian dollars as at the acquisition date.
$
Assets acquired
Cash acquired 1,074
Accounts receivable 19,734
Inventories 5,261
Property, plant and equipment 16,244
Customer relationships 10,290
Goodwill 23,701
76,304
Liabilities assumed
Accounts payable and accrued liabilities 13,777
Deferred income tax liabilities 9,421
Site remediation provision 842
Total net assets acquired and liabilities assumed 52,264
Consideration transferred
Cash 46,503
Unsecured promissory note 7,838
Consideration receivable (2,077)
Consideration transferred 52,264

December 31, 2017 and 2016 (amounts expressed in thousands of Canadian dollars, except as otherwise indicated)
NOTES TO CONSOLIDATED FINANCIAL STATEMENTS52
Stella-Jones Inc.
4 BUSINESS ACQUISITIONS (CONTINUED)
The Company’s valuation of intangible assets has identified customer relationships amortized at a declining rate of 20.00%. Significant assumptions used in the determination of intangible assets, as defined by Management, include year-over-year sales growth, discount rate and operating income before depreciation and amortization margin. Goodwill is not amortized and not deductible for U.S. tax purposes, and represents the future economic value associated with the enhanced procurement network, acquired workforce and synergies with the Company’s operations. Goodwill is allocated to a CGU defined as plants specialized in the treatment of utility poles and residential lumber.
The Company financed the acquisition through a combination of its existing syndicated credit facilities and an unsecured promissory note of $9,128 (US$7,052), bearing interest at 1.41%. The note is payable in three installments, including interest, of US$1,500 in June 2019 and 2020 and US$4,500 in June 2021.The promissory note was fair valued at $7,838 (US$6,056) using an effective interest rate of 5.00%.
5 ACCOUNTS RECEIVABLE
2017 2016
$ $
Trade receivables 159,964 142,801
Less: Provision for doubtful accounts (991) (268)
Trade receivables – net 158,973 142,533
Other receivables 4,485 18,222
163,458 160,755
As at December 31, 2017, trade receivables of $60,618 (2016 – $58,557) were past due but not impaired.
The aging of gross trade receivables at each reporting date was as follows:
2017 2016
$ $
Current 98,355 83,976
Past due 1-30 days 43,416 40,129
Past due 31-60 days 9,230 6,311
Past due more than 60 days 8,963 12,385
159,964 142,801
6 INVENTORIES
2017 2016
$ $
Raw materials 423,312 554,142
Finished goods 295,150 300,414
718,462 854,556

December 31, 2017 and 2016(amounts expressed in thousands of Canadian dollars, except as otherwise indicated)
53NOTES TO CONSOLIDATED FINANCIAL STATEMENTS
2017 Annual Report
7 PROPERTY, PLANT AND EQUIPMENT
Production Rolling Land Buildings equipment stock Others Total
$ $ $ $ $ $
As at January 1, 2016
Cost 42,607 88,980 298,481 18,167 14,461 462,696
Accumulated depreciation — (14,036) (56,289) (9,982) (6,855) (87,162)
Net book amount 42,607 74,944 242,192 8,185 7,606 375,534
Year ended December 31, 2016
Opening net book amount 42,607 74,944 242,192 8,185 7,606 375,534
Business acquisitions 3,788 7,623 21,986 10,677 283 44,357
Additions 270 18,740 42,001 2,456 5,031 68,498
Disposals — — (83) (576) — (659)
Depreciation — (2,541) (8,584) (3,511) (1,148) (15,784)
Depreciation included in inventory — (193) (544) (455) (523) (1,715)
Exchange differences (684) (1,347) (4,678) 138 (10) (6,581)
Closing net book amount 45,981 97,226 292,290 16,914 11,239 463,650
As at December 31, 2016
Cost 45,981 113,768 356,892 29,815 19,724 566,180
Accumulated depreciation — (16,542) (64,602) (12,901) (8,485) (102,530)
Net book amount 45,981 97,226 292,290 16,914 11,239 463,650
Year ended December 31, 2017
Opening net book amount 45,981 97,226 292,290 16,914 11,239 463,650
Business acquisitions 204 941 3,353 301 9 4,808
Additions 4,384 4,250 35,337 1,130 4,266 49,367
Disposals (143) (235) (998) (629) (4) (2,009)
Depreciation — (2,879) (9,705) (3,798) (1,537) (17,919)
Depreciation included in inventory — (187) (526) (478) (644) (1,835)
Exchange differences (1,974) (5,516) (15,343) (884) (304) (24,021)
Closing net book amount 48,452 93,600 304,408 12,556 13,025 472,041
As at December 31, 2017
Cost 48,452 112,272 376,203 27,944 23,505 588,376
Accumulated depreciation — (18,672) (71,795) (15,388) (10,480) (116,335)
Net book amount 48,452 93,600 304,408 12,556 13,025 472,041

December 31, 2017 and 2016 (amounts expressed in thousands of Canadian dollars, except as otherwise indicated)
NOTES TO CONSOLIDATED FINANCIAL STATEMENTS54
Stella-Jones Inc.
8 INTANGIBLE ASSETS AND GOODWILL
The intangible assets include customer relationships, non-compete agreements, cutting rights, standing timber, a favourable land lease agreement and a creosote registration.
Customer relationships comprise long-term agreements with certain customers and ongoing business relationships. The acquisition cost was established based on future benefits associated with these relationships.
The acquisition cost of the non-compete agreements was established based on the discounted value of future payments using a discount rate ranging from 2.90% to 3.00%.
Impairment tests for goodwillGoodwill is allocated for impairment testing purposes to CGUs which reflect how it is monitored for internal management purposes.
The recoverable amount of a CGU is determined based on fair value less cost to dispose (“FVLCTD”) calculations. FVLCTD calculations use cash flow projections based on financial budgets covering a five-year period that are based on the latest budgets for revenue and cost as approved by senior management. Cash flow projections beyond five years are based on Management’s forecasts and assume a growth rate not exceeding gross domestic product for the respective countries. Post-tax cash flow projections are discounted using a real post-tax discount rate of 8.00%. One percent real growth rates are assumed in perpetuity for most of the businesses given the commodity nature of the majority of the products (i.e. volume growth is assumed to be offset by real price declines). The assumptions used in calculating FVLCTD have considered the current economic environment.
The carrying value of goodwill is allocated to the following CGUs:
CGUs 2017 2016
$ $
Plants specialized in the treatment of utility poles and residential lumber 128,898 136,066
Plants specialized in the treatment of railway ties 141,363 151,301
270,261 287,367
Impairment tests for intangible assets with indefinite useful lifeThe only intangible asset with indefinite useful life is the creosote registration. This registration provides the Company with the right to produce and import creosote out of its Memphis, Tennessee facility. The Company’s approach to creosote supply is to produce a portion of its requirements and to buy the remainder on the open market. As a result, the creosote registration procures the advantage of being able to produce, which is less expensive than buying on the market. Moreover, when procuring creosote on the market, the import feature of the registration enables the Company to negotiate better pricing.
The recoverable amount of the creosote registration is determined based on value-in-use calculations. Value-in-use calculations use cash flow projections based on financial budgets covering a five-year period that are based on the latest forecasts for cost savings as approved by senior management. Cash flow projections beyond five years are based on internal management forecasts and assume a growth rate not exceeding domestic product for the respective countries. Pre-tax cash flow projections are discounted using a real pre-tax discount rate of 8.00%. One percent real growth rates are assumed in perpetuity for most of the business given the commodity nature of the majority of the products (i.e. volume growth is assumed to be offset by real price declines).

December 31, 2017 and 2016(amounts expressed in thousands of Canadian dollars, except as otherwise indicated)
55NOTES TO CONSOLIDATED FINANCIAL STATEMENTS
2017 Annual Report
8 INTANGIBLE ASSETS AND GOODWILL (CONTINUED)
The net book amount of these intangible assets was as follows:
Intangible assets
Cutting Customer Non-compete Creosoterights relationships agreements Others registration Total Goodwill
$ $ $ $ $ $ $
As at January 1, 2016
Cost 6,821 141,262 11,601 7,606 43,222 210,512 245,696
Accumulated amortization (1,242) (53,276) (9,576) (5,482) — (69,576) —
Net book amount 5,579 87,986 2,025 2,124 43,222 140,936 245,696
Year ended December 31, 2016
Opening net book balance 5,579 87,986 2,025 2,124 43,222 140,936 245,696
Business acquistions — 19,294 — — — 19,294 47,251
Additions — — 6,051 330 — 6,381 —
Amortization — (14,349) (1,454) — — (15,803) —
Amortization included in inventory (213) — — (473) — (686) —
Exchange differences — (1,513) 27 (33) (1,289) (2,808) (5,580)
Closing net book amount 5,366 91,418 6,649 1,948 41,933 147,314 287,367
As at December 31, 2016
Cost 6,821 157,626 17,413 7,903 41,933 231,696 287,367
Accumulated amortization (1,455) (66,208) (10,764) (5,955) — (84,382) —
Net book amount 5,366 91,418 6,649 1,948 41,933 147,314 287,367
Year ended December 31, 2017
Opening net book balance 5,366 91,418 6,649 1,948 41,933 147,314 287,367
Business acquisitions — — — — — — 844
Additions — — — 477 — 477 —
Amortization — (13,445) (1,840) — — (15,285) —
Amortization included in inventory (176) — — (519) — (695) —
Exchange differences — (4,255) (367) (70) (2,755) (7,447) (17,950)
Closing net book amount 5,190 73,718 4,442 1,836 39,178 124,364 270,261
As at December 31, 2017
Cost 6,821 148,740 16,270 8,310 39,178 219,319 270,261
Accumulated amortization (1,631) (75,022) (11,828) (6,474) — (94,955) —
Net book amount 5,190 73,718 4,442 1,836 39,178 124,364 270,261
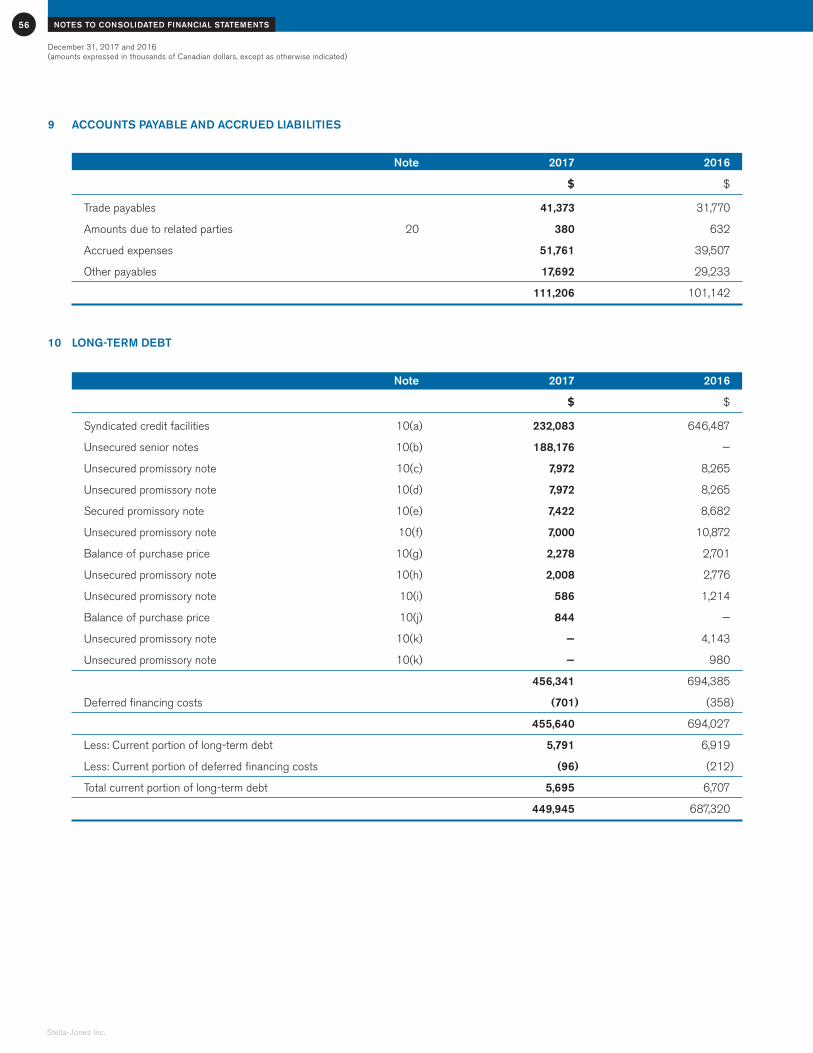
December 31, 2017 and 2016 (amounts expressed in thousands of Canadian dollars, except as otherwise indicated)
NOTES TO CONSOLIDATED FINANCIAL STATEMENTS56
Stella-Jones Inc.
9 ACCOUNTS PAYABLE AND ACCRUED LIABILITIES
Note 2017 2016
$ $
Trade payables 41,373 31,770
Amounts due to related parties 20 380 632
Accrued expenses 51,761 39,507
Other payables 17,692 29,233
111,206 101,142
10 LONG-TERM DEBT
Note 2017 2016
$ $
Syndicated credit facilities 10(a) 232,083 646,487
Unsecured senior notes 10(b) 188,176 —
Unsecured promissory note 10(c) 7,972 8,265
Unsecured promissory note 10(d) 7,972 8,265
Secured promissory note 10(e) 7,422 8,682
Unsecured promissory note 10(f) 7,000 10,872
Balance of purchase price 10(g) 2,278 2,701
Unsecured promissory note 10(h) 2,008 2,776
Unsecured promissory note 10(i) 586 1,214
Balance of purchase price 10(j) 844 —
Unsecured promissory note 10(k) — 4,143
Unsecured promissory note 10(k) — 980
456,341 694,385
Deferred financing costs (701) (358)
455,640 694,027
Less: Current portion of long-term debt 5,791 6,919
Less: Current portion of deferred financing costs (96) (212)
Total current portion of long-term debt 5,695 6,707
449,945 687,320

December 31, 2017 and 2016(amounts expressed in thousands of Canadian dollars, except as otherwise indicated)
57NOTES TO CONSOLIDATED FINANCIAL STATEMENTS
2017 Annual Report
10 LONG-TERM DEBT (CONTINUED)
a) The Company’s syndicated credit facilities consist of an unsecured revolving facility in the amount of US$325,000 available until February 26, 2022, an unsecured term facility in the amount of US$50,000 available until February 26, 2018 and an unsecured term facility in the amount of US$100,000 available until February 26, 2019 made available to the Company and SJ Holding (the “Borrowers”), a wholly-owned subsidiary of the Company, by a syndicate of lenders under a fifth amended and restated credit agreement (the “Credit Agreement”) dated as of February 26, 2016, and amended on May 18, 2016. As at December 31, 2017 the syndicated credit facilities provided financing up to US$475,000 of which US$282,574 was available. Additionally, the Credit Agreement makes available an accordion option whereas upon request, the Company could increase the revolving facility by US$125,000.
During 2017, the Company made certain amendments to the Credit Agreement and changes to the revolving facility. On February 3, 2017, the Borrowers obtained a one-year extension to February 26, 2022 of the revolving facility. On July 5, 2017, the Borrowers requested a reduction of the revolving facility from US$425,000 to $US325,000.
Borrowings under the syndicated credit facilities may be obtained in the form of Canadian prime rate loans, bankers’ acceptances (“BAs”), U.S. base rate loans, LIBOR loans in U.S. dollars and letters of credit. The interest rate margin with respect to Canadian prime rate loans and U.S. base rate loans will range from 0.00% to 1.25% based on the Credit Agreement’s pricing grid. The interest rate margin with respect to BAs, LIBOR loans and fees for letters of credit will range from 1.00% to 2.25% based on the Credit Agreement’s pricing grid.
The Company enters into interest rate swap agreements in order to reduce the impact of fluctuating interest rates on its debt. Details of the outstanding interest rate swap agreements as at December 31, 2017 are provided in Note 18, Financial instruments. As at December 31, 2017, borrowings by Canadian entities denominated in U.S. dollars represented $232,083 (US$185,000) and the total amount was designated as a hedge of net investment in foreign operations.
The Company has demand loan agreements, with two banks participating in the syndicated credit facilities, providing financing up to US$50,000 under terms and conditions similar to those under the Credit Agreement. This indebtedness, if required by the Company, will be presented under short term liabilities as the banks have the option to request reimbursement of their loans at any time. As at December 31, 2017 no amounts were drawn under the demand loan agreements.
In order to maintain the syndicated credit facilities and the demand loans in place, the Company needs to comply with affirmative covenants, negative covenants, reporting requirements and financial ratios consisting of a total debt to EBITDA ratio of no more than 3.50:1 and an interest coverage ratio equal to or greater than 3.00:1. As at December 31, 2017, the Company was in full compliance with these covenants, requirements and ratios. Additionally, the Credit Agreement prohibits the Company from paying dividends aggregating in any one year in excess of 50.00% of the Company’s consolidated net income for the preceding year if the total debt to EBITDA ratio is greater than 3.25:1. In the case where the total debt to EBITDA ratio is equal or lower than 3.25:1, there are no restrictions to the payment of dividends, so long as the Company is otherwise in compliance with the terms of its Credit Agreement.
b) On January 17, 2017, the Company concluded a US$150,000 private placement with certain U.S. investors. Pursuant to the private placement, the Company entered into a note purchase agreement providing for the issuance by Stella-Jones Inc. of senior notes - series A in the aggregate amount of US$75,000 bearing interest at 3.54% payable in a single instalment at maturity on January 17, 2024 and senior notes - series B in the aggregate amount of US$75,000 bearing interest at 3.81%, payable in a single instalment at maturity on January 17, 2027. Such notes are unsecured and proceeds were used to reimburse a portion of the revolving credit facility. The notes were designated as hedges of net investment in foreign operations.
In order to maintain the senior notes in place, the Company needs to comply with affirmative covenants, negative covenants, reporting requirements and financial ratios comprised of the total debt to EBITDA ratio of not more than 3.50:1, the interest coverage ratio equal to or greater than 2.50:1 and a priority debt to equity ratio not more than 15%. As at December 31, 2017, the Company was in full compliance with these covenants, requirements and ratios.
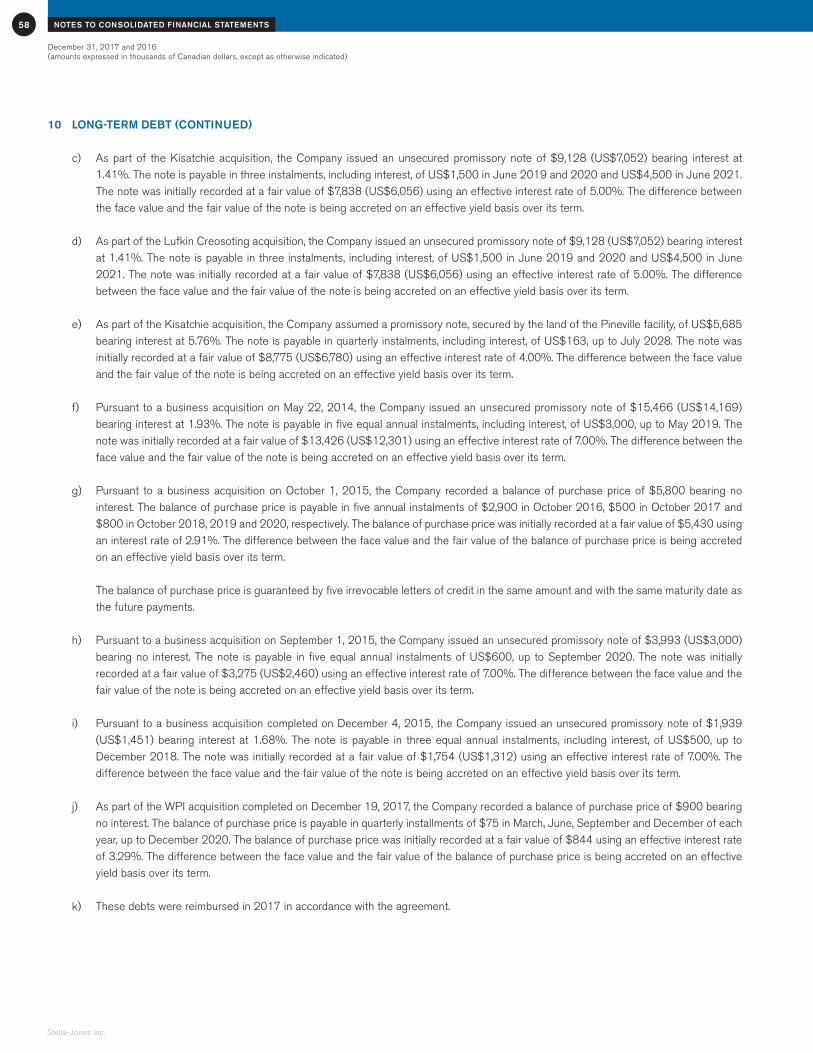
December 31, 2017 and 2016 (amounts expressed in thousands of Canadian dollars, except as otherwise indicated)
NOTES TO CONSOLIDATED FINANCIAL STATEMENTS58
Stella-Jones Inc.
10 LONG-TERM DEBT (CONTINUED)
c) As part of the Kisatchie acquisition, the Company issued an unsecured promissory note of $9,128 (US$7,052) bearing interest at 1.41%. The note is payable in three instalments, including interest, of US$1,500 in June 2019 and 2020 and US$4,500 in June 2021. The note was initially recorded at a fair value of $7,838 (US$6,056) using an effective interest rate of 5.00%. The difference between the face value and the fair value of the note is being accreted on an effective yield basis over its term.
d) As part of the Lufkin Creosoting acquisition, the Company issued an unsecured promissory note of $9,128 (US$7,052) bearing interest at 1.41%. The note is payable in three instalments, including interest, of US$1,500 in June 2019 and 2020 and US$4,500 in June 2021. The note was initially recorded at a fair value of $7,838 (US$6,056) using an effective interest rate of 5.00%. The difference between the face value and the fair value of the note is being accreted on an effective yield basis over its term.
e) As part of the Kisatchie acquisition, the Company assumed a promissory note, secured by the land of the Pineville facility, of US$5,685 bearing interest at 5.76%. The note is payable in quarterly instalments, including interest, of US$163, up to July 2028. The note was initially recorded at a fair value of $8,775 (US$6,780) using an effective interest rate of 4.00%. The difference between the face value and the fair value of the note is being accreted on an effective yield basis over its term.
f) Pursuant to a business acquisition on May 22, 2014, the Company issued an unsecured promissory note of $15,466 (US$14,169) bearing interest at 1.93%. The note is payable in five equal annual instalments, including interest, of US$3,000, up to May 2019. The note was initially recorded at a fair value of $13,426 (US$12,301) using an effective interest rate of 7.00%. The difference between the face value and the fair value of the note is being accreted on an effective yield basis over its term.
g) Pursuant to a business acquisition on October 1, 2015, the Company recorded a balance of purchase price of $5,800 bearing no interest. The balance of purchase price is payable in five annual instalments of $2,900 in October 2016, $500 in October 2017 and $800 in October 2018, 2019 and 2020, respectively. The balance of purchase price was initially recorded at a fair value of $5,430 using an interest rate of 2.91%. The difference between the face value and the fair value of the balance of purchase price is being accreted on an effective yield basis over its term.
The balance of purchase price is guaranteed by five irrevocable letters of credit in the same amount and with the same maturity date as the future payments.
h) Pursuant to a business acquisition on September 1, 2015, the Company issued an unsecured promissory note of $3,993 (US$3,000) bearing no interest. The note is payable in five equal annual instalments of US$600, up to September 2020. The note was initially recorded at a fair value of $3,275 (US$2,460) using an effective interest rate of 7.00%. The difference between the face value and the fair value of the note is being accreted on an effective yield basis over its term.
i) Pursuant to a business acquisition completed on December 4, 2015, the Company issued an unsecured promissory note of $1,939 (US$1,451) bearing interest at 1.68%. The note is payable in three equal annual instalments, including interest, of US$500, up to December 2018. The note was initially recorded at a fair value of $1,754 (US$1,312) using an effective interest rate of 7.00%. The difference between the face value and the fair value of the note is being accreted on an effective yield basis over its term.
j) As part of the WPI acquisition completed on December 19, 2017, the Company recorded a balance of purchase price of $900 bearing no interest. The balance of purchase price is payable in quarterly installments of $75 in March, June, September and December of each year, up to December 2020. The balance of purchase price was initially recorded at a fair value of $844 using an effective interest rate of 3.29%. The difference between the face value and the fair value of the balance of purchase price is being accreted on an effective yield basis over its term.
k) These debts were reimbursed in 2017 in accordance with the agreement.

December 31, 2017 and 2016(amounts expressed in thousands of Canadian dollars, except as otherwise indicated)
59NOTES TO CONSOLIDATED FINANCIAL STATEMENTS
2017 Annual Report
10 LONG-TERM DEBT (CONTINUED)
l) The repayment requirements on the long-term debt during the next five years and thereafter are as follows:
Principal
$
2018 6,543
2019 9,631
2020 5,916
2021 11,062
2022 232,649
Thereafter 192,142
457,943
Fair value adjustment (1,602)
456,341
m) The aggregate fair value of the Company’s long-term debt was estimated at $453,478 as at December 31, 2017 (2016 – $694,385) based on discounted future cash flows, using interest rates available to the Company for issues with similar terms and average maturities.
11 PROVISIONS AND OTHER LONG-TERM LIABILITIES
Provisions Other long-term liabilities
Non- Site competes Grand
remediation Others Total RSUs payable Total total
$ $ $ $ $ $ $
Balance as at January 1, 2016 11,641 4,280 15,921 13,219 2,355 15,574 31,495
Additions 5,121 785 5,906 10,951 5,936 16,887 22,793
Business acquisitions 2,974 — 2,974 — — — 2,974
Provision reversal (62) (858) (920) — — — (920)
Payments (2,954) (455) (3,409) (21,214) (598) (21,812) (25,221)
Interest accretion — — — — 127 127 127
Exchange differences (233) (88) (321) — 143 143 (178)
Balance as at December 31, 2016 16,487 3,664 20,151 2,956 7,963 10,919 31,070
Additions 911 1,786 2,697 727 — 727 3,424
Business acquisitions 58 — 58 — — — 58
Provision reversal (2,331) (106) (2,437) — — — (2,437)
Payments (2,183) (1,504) (3,687) (1,435) (2,156) (3,591) (7,278)
Interest accretion — — — — 155 155 155
Exchange differences (898) (134) (1,032) — (454) (454) (1,486)
Balance as at December 31, 2017 12,044 3,706 15,750 2,248 5,508 7,756 23,506

December 31, 2017 and 2016 (amounts expressed in thousands of Canadian dollars, except as otherwise indicated)
NOTES TO CONSOLIDATED FINANCIAL STATEMENTS60
Stella-Jones Inc.
11 PROVISIONS AND OTHER LONG-TERM LIABILITIES (CONTINUED)
Analysis of provisions and other long-term liabilities:
2017 2016
$ $
Current
Provisions 9,141 10,785
Other long-term liabilities 2,973 3,805
Total current 12,114 14,590
Non-current
Provisions 6,609 9,366
Other long-term liabilities 4,783 7,114
Total non-current 11,392 16,480
23,506 31,070
ProvisionsSite remediationSite remediation obligations represent discounted cash flow estimates relating to future environmental remediation costs of current and former treating sites for a period ranging from one to fifteen years. These discounted cash flow have been estimated using a pre-tax rate of 3.63% that reflect current market assessment of the time value of money and the risk specific to the obligation.
As of December 31, 2017, a total site remediation provision of $12,044 ($16,487 as of December 31, 2016) was recorded to support the ongoing compliance efforts.
Other long-term liabilitiesRestricted stock unitsThe Company has a long-term incentive plan, for certain executives and key employees, under which grants of RSUs are permitted upon the Company attaining a minimum 12.50% return on capital employed. When this condition is met, the number of RSUs granted is based on a percentage of the individual’s salary, divided by the average trading price of the Company’s common shares on the TSX for the five days immediately preceding the grant date.
The RSUs are full-value phantom shares payable in cash on the third anniversary of their date of grant, provided the individual is still employed by the Company. The amount to be paid is determined by multiplying the number of RSUs by the six-month average trading price of the Company’s common shares on the TSX immediately preceding the anniversary.
The RSUs granted on March 17, 2014 reached their third year anniversary on March 17, 2017 and were fully paid.
On March 16, 2015 and March 21, 2016 the Company granted a total of 63,336 RSUs to certain executives and key employees as part of the long-term incentive plan.
On May 6, 2013, as part of a five-year incentive agreement and pursuant to the Stella-Jones Inc. long-term incentive plan, the Company granted 400,000 RSUs to the President and Chief Executive Officer (the “President”), with a vesting date of May 6, 2016. As part of the agreement, in the event that the President voluntarily leaves the employment of the Company prior to the fifth anniversary of the incentive agreement, any amounts paid to him will be reimbursed to the Company. In the event that the President is required to cease his functions prior to the fifth anniversary of the incentive agreement due to long-term disability or death, he shall be entitled to a prorated payment. The compensation expense related to the five-year agreement will be recognized in the consolidated statement of income over a five-year period. On May 6, 2016, the full amount of $19,106 was paid under these RSUs. The difference between the amount paid and the expense recognized in the consolidated statement of income has been recorded as a prepaid expense and will be amortized over the remaining two-year period. As of December 31, 2017, the prepaid balance was $1,592 ($5,413 as of December 31, 2016).

December 31, 2017 and 2016(amounts expressed in thousands of Canadian dollars, except as otherwise indicated)
61NOTES TO CONSOLIDATED FINANCIAL STATEMENTS
2017 Annual Report
12 CASH FLOW INFORMATION
a) Liabilities from financing activitiesThe following table presents the movements in the liabilities from financing activities for the twelve-month period ended December 31, 2017:
Liabilities from financing activities
Syndicated Long-term credit Non-competes
debt facilities payable Total
$ $ $ $
Balance as at December 31, 2016 (47,898) (646,487) (7,963) (702,348)
Cash flows provided by (used in) (184,363) 391,796 2,156 209,589
Foreign exchange adjustments 8,704 22,608 454 31,766
Other non-cash movements — — (155) (155)
Balance as at December 31, 2017 (223,557) (232,083) (5,508) (461,148)
b) Cash and cash equivalents
The following table presents the reconciliation of the amount of cash and cash equivalents:
2017 2016
$ $
Cash 6,430 2,267
Restricted cash — 1,452
Balance per statement of cash flows 6,430 3,719
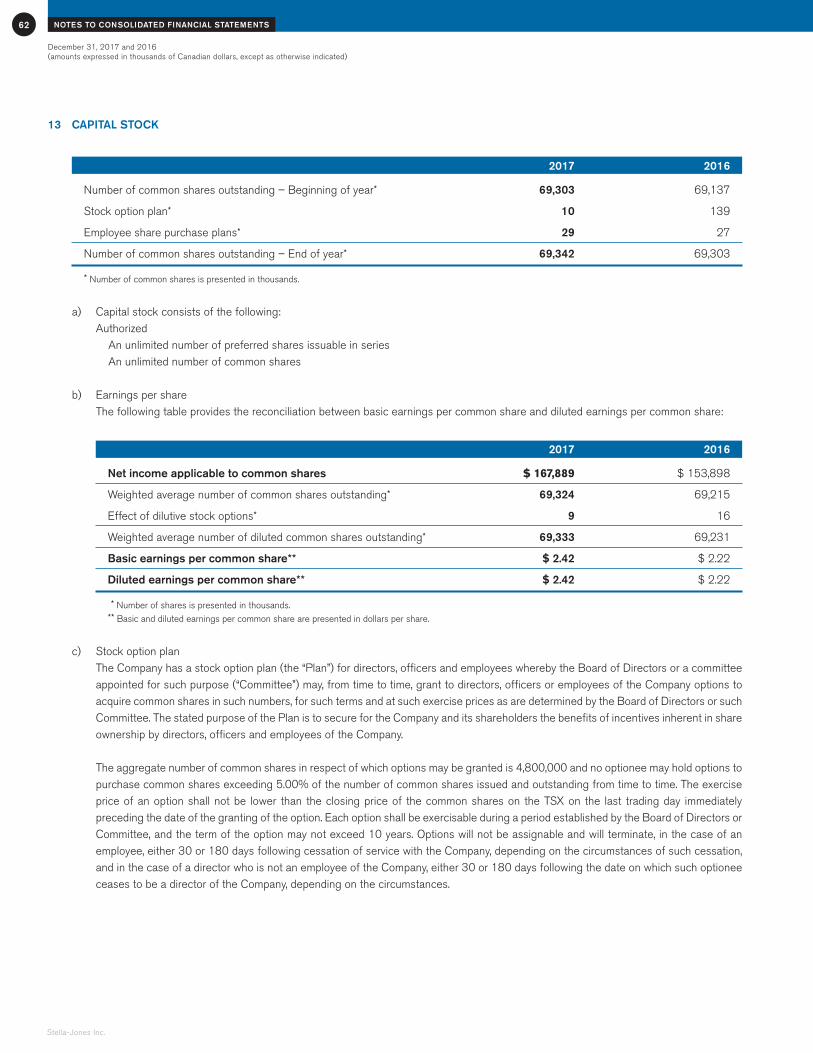
December 31, 2017 and 2016 (amounts expressed in thousands of Canadian dollars, except as otherwise indicated)
NOTES TO CONSOLIDATED FINANCIAL STATEMENTS62
Stella-Jones Inc.
13 CAPITAL STOCK
2017 2016
Number of common shares outstanding – Beginning of year* 69,303 69,137
Stock option plan* 10 139
Employee share purchase plans* 29 27
Number of common shares outstanding – End of year* 69,342 69,303
* Number of common shares is presented in thousands.
a) Capital stock consists of the following:Authorized An unlimited number of preferred shares issuable in series An unlimited number of common shares
b) Earnings per shareThe following table provides the reconciliation between basic earnings per common share and diluted earnings per common share:
2017 2016
Net income applicable to common shares $ 167,889 $ 153,898
Weighted average number of common shares outstanding* 69,324 69,215
Effect of dilutive stock options* 9 16
Weighted average number of diluted common shares outstanding* 69,333 69,231
Basic earnings per common share** $ 2.42 $ 2.22
Diluted earnings per common share** $ 2.42 $ 2.22
* Number of shares is presented in thousands.
** Basic and diluted earnings per common share are presented in dollars per share.
c) Stock option planThe Company has a stock option plan (the “Plan”) for directors, officers and employees whereby the Board of Directors or a committee appointed for such purpose (“Committee”) may, from time to time, grant to directors, officers or employees of the Company options to acquire common shares in such numbers, for such terms and at such exercise prices as are determined by the Board of Directors or such Committee. The stated purpose of the Plan is to secure for the Company and its shareholders the benefits of incentives inherent in share ownership by directors, officers and employees of the Company.
The aggregate number of common shares in respect of which options may be granted is 4,800,000 and no optionee may hold options to purchase common shares exceeding 5.00% of the number of common shares issued and outstanding from time to time. The exercise price of an option shall not be lower than the closing price of the common shares on the TSX on the last trading day immediately preceding the date of the granting of the option. Each option shall be exercisable during a period established by the Board of Directors or Committee, and the term of the option may not exceed 10 years. Options will not be assignable and will terminate, in the case of an employee, either 30 or 180 days following cessation of service with the Company, depending on the circumstances of such cessation, and in the case of a director who is not an employee of the Company, either 30 or 180 days following the date on which such optionee ceases to be a director of the Company, depending on the circumstances.

December 31, 2017 and 2016(amounts expressed in thousands of Canadian dollars, except as otherwise indicated)
63NOTES TO CONSOLIDATED FINANCIAL STATEMENTS
2017 Annual Report
13 CAPITAL STOCK (CONTINUED)
Changes in the number of options outstanding under the Plan were as follows:
2017 2016
Weighted Weighted average average
Number exercise Number exerciseof options* price** of options* price**
$ $
Outstanding – Beginning of year 55 34.57 194 15.35
Exercised (10) 9.90 (139) 7.75
Granted — — — —
Outstanding – End of year 45 40.05 55 34.57
Options exercisable – End of year 33 36.79 31 28.59
The following options were outstanding under the Plan as at December 31, 2017:
Options outstanding Options exercisable
Number Exercise Number Exercise ExpirationDate granted of options* price** of options* price** date
$ $
May 2013 15 22.13 15 22.13 May 2023
November 2015 30 49.01 18 49.01 November 2025
45 33
* Number of options is presented in thousands. ** Exercise price is presented in dollars per option.
d) Stock-based compensationThe Company records expenses related to the fair value of the stock options granted under the Plan using the Black Scholes option pricing model. This model determines the fair value of stock options granted and amortizes it to income over the vesting period. No options were granted during 2017. The 2017 expense recorded for stock-based compensation amortized to earnings was $87 (2016 – $156).
e) Employee share purchase plansThe aggregate number of common shares reserved for issuance under the Company’s two employee share purchase plans is 1,000,000.
Under the first plan, Company employees who are Canadian residents are eligible to purchase common shares from the Company at an amount equal to 90.00% of the market price. Employees who hold common shares in the employee share purchase plan for eighteen months following the date of acquisition of such shares receive additional common shares of the Company equivalent to 10.00% of the amount of their contributions made on the date of acquisition. In 2017, 15,621 common shares (2016 – 13,271) were issued to Canadian resident employees at an average price of $39.52 per share (2016 – $39.50).

December 31, 2017 and 2016 (amounts expressed in thousands of Canadian dollars, except as otherwise indicated)
NOTES TO CONSOLIDATED FINANCIAL STATEMENTS64
Stella-Jones Inc.
13 CAPITAL STOCK (CONTINUED)
e) Employee share purchase plans (continued)
Under the second plan, Company employees who are U.S. residents are eligible to purchase common shares from the Company at market price. Employees who hold common shares in the employee share purchase plan for eighteen months following the date of acquisition of such shares receive additional common shares of the Company equivalent to 10.00% of the amount of their contributions made on the date of acquisition. In 2017, 13,167 common shares (2016 – 13,680) were issued to U.S. resident employees at an average price of $41.65 per share (2016 – $43.11).
As at December 31, 2017, the total number of common shares issued under these plans is 885,975 (2016 – 857,187), having a market value of $44,742, using the Company’s TSX closing share price on December 29, 2017 of $50,50, which was the last day of trading in 2017.
14 EXPENSES BY NATURE
2017 2016
$ $
Raw materials and consumables 1,324,289 1,252,578
Employee benefit expenses 135,302 141,839
Depreciation and amortization 33,204 31,587
Other expenses incurred in manufacturing process 56,678 44,767
Freight 91,430 91,141
Other expenses 37,851 43,198
1,678,754 1,605,110
2017 2016
$ $
Employee benefit expenses
Salaries, wages and benefits 123,355 128,841
Share options granted to directors and employees 87 156
RSUs 4,549 5,538
Pension costs 1,990 1,993
Group registered retirement savings plans 5,321 5,311
135,302 141,839
Employee benefit expenses are included in cost of sales and selling and administrative expenses.
2017 2016
$ $
Financial expenses
Interest on syndicated credit facilities 9,596 14,760
Interest on promissory notes and non-compete agreements 2,613 2,278
Interest on unsecured senior notes 6,800 —
Interest on debentures — 821
19,009 17,859
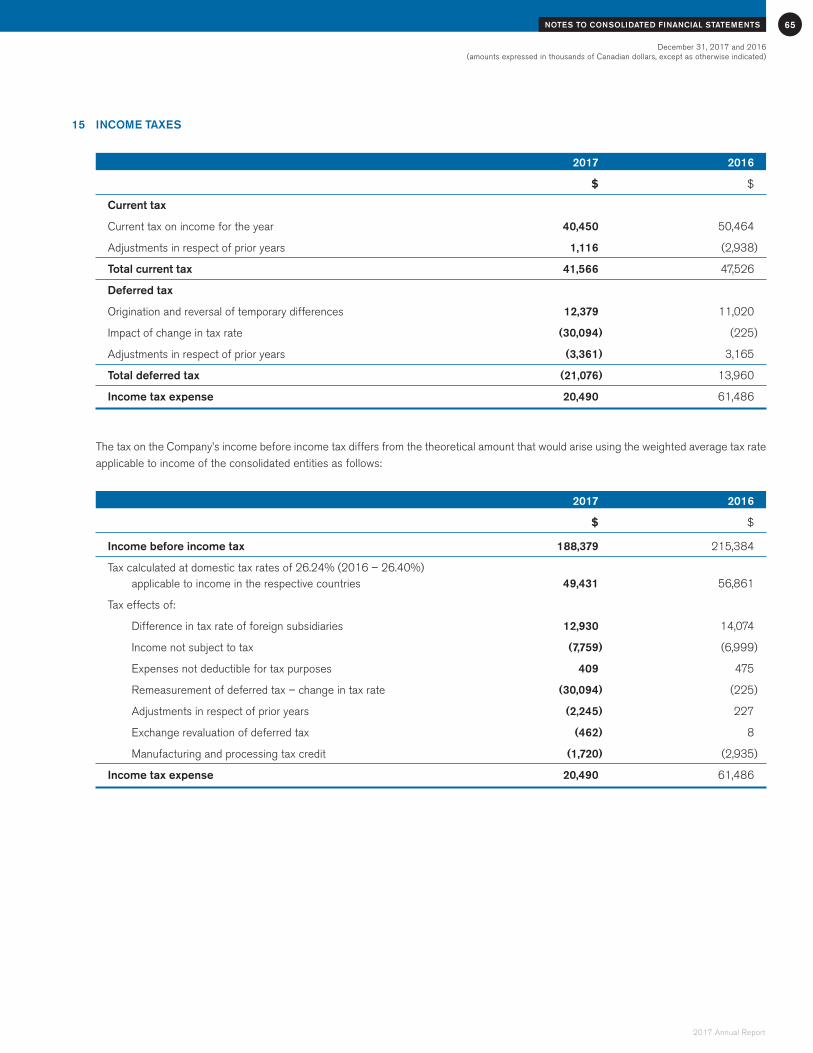
December 31, 2017 and 2016(amounts expressed in thousands of Canadian dollars, except as otherwise indicated)
65NOTES TO CONSOLIDATED FINANCIAL STATEMENTS
2017 Annual Report
15 INCOME TAXES
2017 2016
$ $
Current tax
Current tax on income for the year 40,450 50,464
Adjustments in respect of prior years 1,116 (2,938)
Total current tax 41,566 47,526
Deferred tax
Origination and reversal of temporary differences 12,379 11,020
Impact of change in tax rate (30,094) (225)
Adjustments in respect of prior years (3,361) 3,165
Total deferred tax (21,076) 13,960
Income tax expense 20,490 61,486
The tax on the Company’s income before income tax differs from the theoretical amount that would arise using the weighted average tax rate applicable to income of the consolidated entities as follows:
2017 2016
$ $
Income before income tax 188,379 215,384
Tax calculated at domestic tax rates of 26.24% (2016 – 26.40%) applicable to income in the respective countries 49,431 56,861
Tax effects of:
Difference in tax rate of foreign subsidiaries 12,930 14,074
Income not subject to tax (7,759) (6,999)
Expenses not deductible for tax purposes 409 475
Remeasurement of deferred tax – change in tax rate (30,094) (225)
Adjustments in respect of prior years (2,245) 227
Exchange revaluation of deferred tax (462) 8
Manufacturing and processing tax credit (1,720) (2,935)
Income tax expense 20,490 61,486
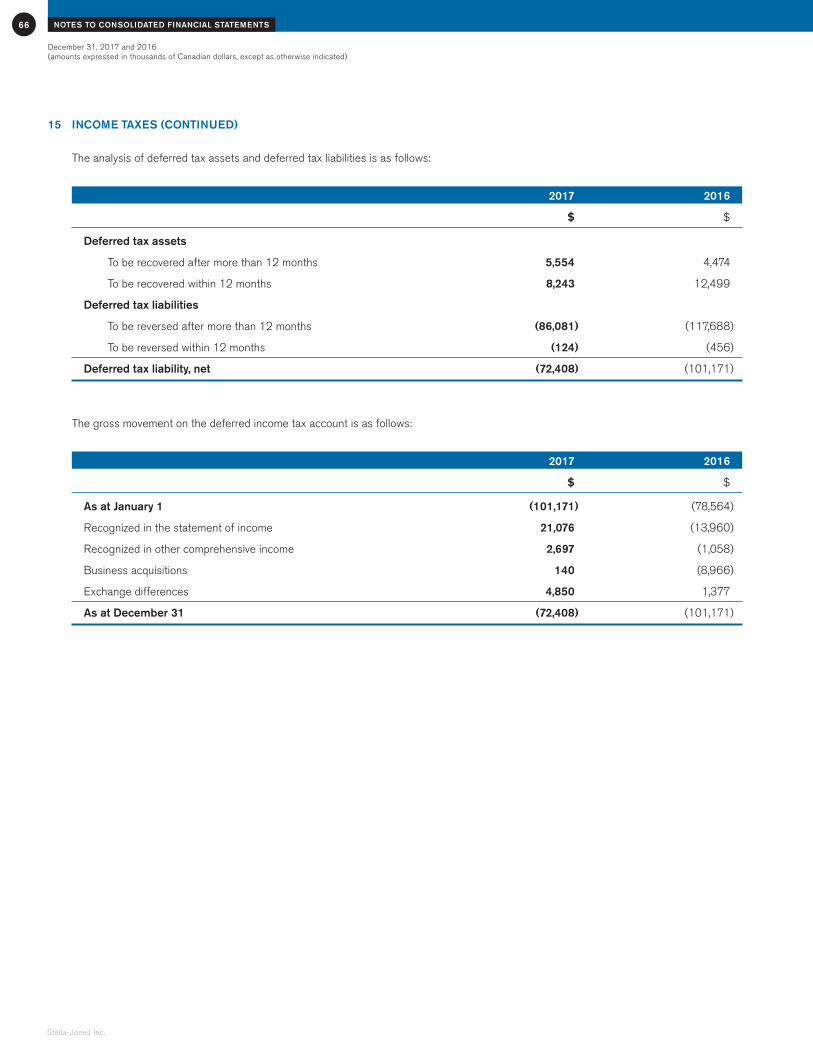
December 31, 2017 and 2016 (amounts expressed in thousands of Canadian dollars, except as otherwise indicated)
NOTES TO CONSOLIDATED FINANCIAL STATEMENTS66
Stella-Jones Inc.
15 INCOME TAXES (CONTINUED)
The analysis of deferred tax assets and deferred tax liabilities is as follows:
2017 2016
$ $
Deferred tax assets
To be recovered after more than 12 months 5,554 4,474
To be recovered within 12 months 8,243 12,499
Deferred tax liabilities
To be reversed after more than 12 months (86,081) (117,688)
To be reversed within 12 months (124) (456)
Deferred tax liability, net (72,408) (101,171)
The gross movement on the deferred income tax account is as follows:
2017 2016
$ $
As at January 1 (101,171) (78,564)
Recognized in the statement of income 21,076 (13,960)
Recognized in other comprehensive income 2,697 (1,058)
Business acquisitions 140 (8,966)
Exchange differences 4,850 1,377
As at December 31 (72,408) (101,171)
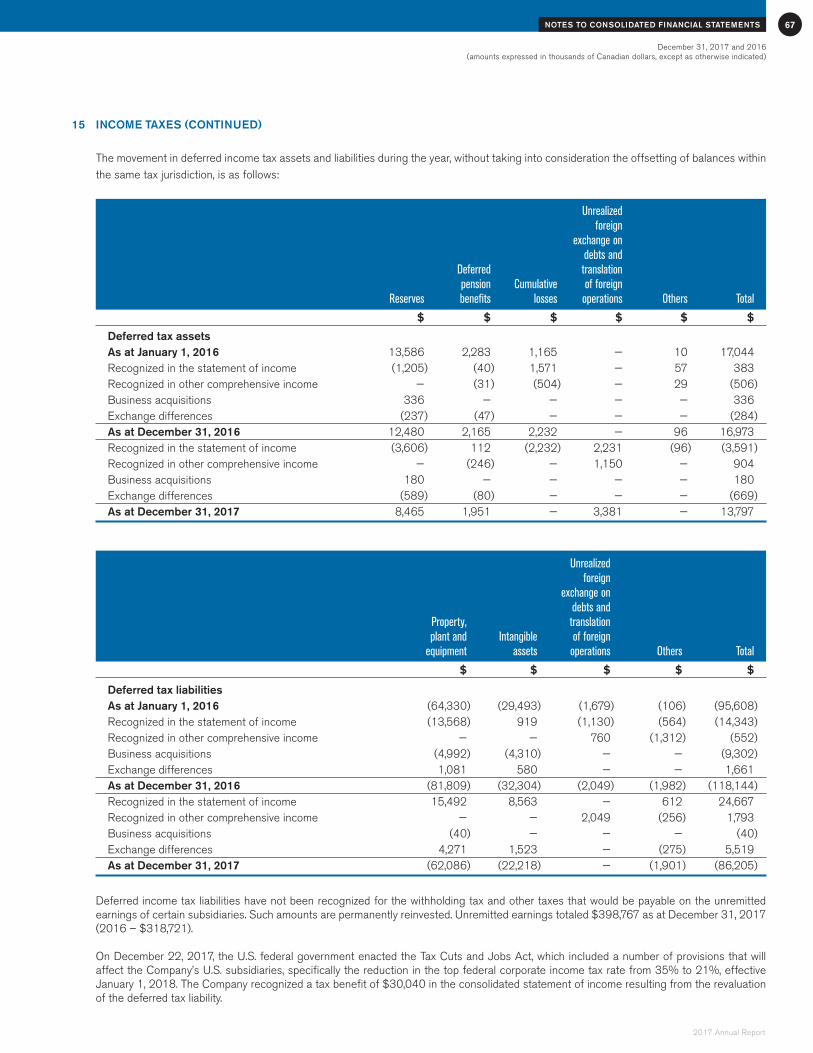
December 31, 2017 and 2016(amounts expressed in thousands of Canadian dollars, except as otherwise indicated)
67NOTES TO CONSOLIDATED FINANCIAL STATEMENTS
2017 Annual Report
15 INCOME TAXES (CONTINUED)
The movement in deferred income tax assets and liabilities during the year, without taking into consideration the offsetting of balances within the same tax jurisdiction, is as follows:
Unrealized foreign exchange on debts and
Deferred translation pension Cumulative of foreign Reserves benefits losses operations Others Total
$ $ $ $ $ $
Deferred tax assets As at January 1, 2016 13,586 2,283 1,165 — 10 17,044Recognized in the statement of income (1,205) (40) 1,571 — 57 383Recognized in other comprehensive income — (31) (504) — 29 (506)Business acquisitions 336 — — — — 336
Exchange differences (237) (47) — — — (284) As at December 31, 2016 12,480 2,165 2,232 — 96 16,973 Recognized in the statement of income (3,606) 112 (2,232) 2,231 (96) (3,591)
Recognized in other comprehensive income — (246) — 1,150 — 904Business acquisitions 180 — — — — 180
Exchange differences (589) (80) — — — (669) As at December 31, 2017 8,465 1,951 — 3,381 — 13,797
Unrealized foreign exchange on debts and
Property, translation plant and Intangible of foreign
equipment assets operations Others Total
$ $ $ $ $
Deferred tax liabilities As at January 1, 2016 (64,330) (29,493) (1,679) (106) (95,608) Recognized in the statement of income (13,568) 919 (1,130) (564) (14,343)Recognized in other comprehensive income — — 760 (1,312) (552)Business acquisitions (4,992) (4,310) — — (9,302)Exchange differences 1,081 580 — — 1,661 As at December 31, 2016 (81,809) (32,304) (2,049) (1,982) (118,144) Recognized in the statement of income 15,492 8,563 — 612 24,667Recognized in other comprehensive income — — 2,049 (256) 1,793Business acquisitions (40) — — — (40)Exchange differences 4,271 1,523 — (275) 5,519 As at December 31, 2017 (62,086) (22,218) — (1,901) (86,205)
Deferred income tax liabilities have not been recognized for the withholding tax and other taxes that would be payable on the unremitted earnings of certain subsidiaries. Such amounts are permanently reinvested. Unremitted earnings totaled $398,767 as at December 31, 2017 (2016 – $318,721).
On December 22, 2017, the U.S. federal government enacted the Tax Cuts and Jobs Act, which included a number of provisions that will affect the Company’s U.S. subsidiaries, specifically the reduction in the top federal corporate income tax rate from 35% to 21%, effective January 1, 2018. The Company recognized a tax benefit of $30,040 in the consolidated statement of income resulting from the revaluation of the deferred tax liability.

December 31, 2017 and 2016 (amounts expressed in thousands of Canadian dollars, except as otherwise indicated)
NOTES TO CONSOLIDATED FINANCIAL STATEMENTS68
Stella-Jones Inc.
16 EMPLOYEE FUTURE BENEFITS
For its Canadian operations, the Company recognizes costs for several types of employee future benefits. Post-employment benefits are offered to certain retired employees and consist of group health and dental care, life insurance and complementary retirement benefits. The Company contributes to a multi-employer plan for certain hourly employees and to three defined benefit pension plans for salaried and certain non-union hourly wage employees.
For its U.S. operations, the Company’s wholly-owned subsidiary, McFarland, contributes to two defined benefit pension plans.
All other active employees are entitled to a group registered retirement savings plan to which the Company matches one and a half times the employee contribution. The Company’s contribution cannot exceed 6.00% of the employee’s annual base salary. The recognized costs for employee future benefits were as follows:
2017 2016
$ $
Post-retirement benefits 156 166
Defined benefit pension plans 1,411 1,392
Contributions to multi-employer plan 423 435
Contributions to group registered retirement savings plans 5,321 5,311
The net amount recognized on the consolidated statement of financial position is detailed as follows:
2017 2016
$ $
Liabilities
Accrued benefit liability included in employee future benefits (5,174) (4,534)
Accrued benefit obligation, included in employee future benefits (2,501) (2,219)
(7,675) (6,753)
a) The post-retirement benefits program is not funded and, since June 1, 2011, this program is closed to new participants. For this program, the Company measures its accrued benefit obligations for accounting purposes as at December 31 of each year. The most recent actuarial valuation of this plan was as at July 1, 2015, and the next required valuation will be as at July 1, 2018.

December 31, 2017 and 2016(amounts expressed in thousands of Canadian dollars, except as otherwise indicated)
69NOTES TO CONSOLIDATED FINANCIAL STATEMENTS
2017 Annual Report
16 EMPLOYEE FUTURE BENEFITS (CONTINUED)
The following information as established by independent actuaries pertains to the Company’s post-retirement benefits program:
2017 2016
$ $
Accrued benefit obligation
Balance – Beginning of year 2,219 2,327
Current service cost 68 71
Interest cost 88 95
Benefits payments (62) (66)
Remeasurement adjustments
Plan experience — (124)
Changes in demographic assumptions — (114)
Changes in financial assumptions 188 30
Balance – End of year 2,501 2,219
Plan assets
Employer’s contributions 62 66
Benefits paid (62) (66)
Fair value – End of year — —
Accrued benefit obligation 2,501 2,219
The significant assumptions used are as follows:
2017 2016
% %
Accrued benefit obligation as at December 31
Discount rate 3.40 3.90
Benefit costs for the year ended December 31
Discount rate 3.90 4.00
For measurement purposes, a 6.50% annual rate of increase in the per capita cost of covered health care benefits was assumed starting in 2015. This rate is assumed to decrease gradually by 0.38% per year, to reach 5.00% in 2020. An increase or decrease of 1.00% in this rate would have the following impact:
Increase of 1% Decrease of 1%
$ $
Impact on accrued benefit obligation 86 (73)
Impact on benefit costs 2 (2)

December 31, 2017 and 2016 (amounts expressed in thousands of Canadian dollars, except as otherwise indicated)
NOTES TO CONSOLIDATED FINANCIAL STATEMENTS70
Stella-Jones Inc.
16 EMPLOYEE FUTURE BENEFITS (CONTINUED)
The items of the Company’s post-retirement benefits program costs recognized during the year are as follows:
2017 2016
$ $
Current service cost 68 71
Interest cost 88 95
Post-retirement benefits program costs recognized 156 166
Consolidated statement of comprehensive income 2017 2016
$ $
Year ended December 31
Actuarial gains (losses) (188) 208
Total recognized in other comprehensive income before income tax (188) 208
Accumulated actuarial (losses) gains recognized in other comprehensive income 2017 2016
$ $
Balance of actuarial losses as at January 1 (228) (351)
Net actuarial gains (losses) recognized in the year, net of tax (124) 123
Balance of actuarial losses as at December 31 (352) (228)
b) The Company’s Canadian defined benefit pension plans base the benefits on the length of service and final average earnings. The McFarland defined benefit pension plans base the benefits on the length of service and flat dollar amounts payable monthly. The Company measures its accrued benefit obligations and the fair value of plan assets for accounting purposes as at December 31 of each year.
Actuarial valuations are updated every three years, and the latest valuations performed for the five existing pension plans are as follows:
Date of last actuarial valuation
Plan 1 Canadian pension plan – Closed to new participants December 31, 2016
Plan 2 Canadian pension plan – Closed to new participants December 31, 2014
Plan 3 Canadian pension plan – Closed to new participants December 31, 2015
Plan 4 U.S. pension plan – Closed to new participants December 31, 2015
Plan 5 U.S. pension plan December 31, 2015

December 31, 2017 and 2016(amounts expressed in thousands of Canadian dollars, except as otherwise indicated)
71NOTES TO CONSOLIDATED FINANCIAL STATEMENTS
2017 Annual Report
16 EMPLOYEE FUTURE BENEFITS (CONTINUED)
Information about the Company’s defined benefit pension plans other than the multi-employer defined benefit plan, in aggregate, is as follows:
2017 2016
$ $
Accrued benefit obligation
Balance – Beginning of year 27,440 27,545
Current service cost 1,025 1,009
Interest cost 1,076 1,099
Benefits payments (821) (2,730)
Remeasurement adjustments
Plan experience (947) 778
Changes in demographic assumptions 330 (172)
Changes in financial assumptions 1,949 443
Exchange difference (650) (532)
Balance – End of year 29,402 27,440
Plan assets
Fair value – Beginning of year 22,906 22,719
Interest income on plan assets 665 680
Return on plan asset excluding interest income 513 1,133
Employer’s contributions 1,102 1,468
Employee’s contributions 35 36
Effect of asset ceiling 263 (263)
Benefits paid (821) (2,730)
Exchange difference (435) (137)
Fair value – End of year 24,228 22,906
Accrued benefit liability (5,174) (4,534)
Included in the above accrued benefit obligation and fair value of plan assets at year-end are the following amounts in respect of benefit plans that are not fully funded:
2017 2016
$ $
Accrued benefit obligation (13,309) (12,716)
Fair value of plan assets 7,652 7,340
Funded status – Plan deficit (5,657) (5,376)

December 31, 2017 and 2016 (amounts expressed in thousands of Canadian dollars, except as otherwise indicated)
NOTES TO CONSOLIDATED FINANCIAL STATEMENTS72
Stella-Jones Inc.
16 EMPLOYEE FUTURE BENEFITS (CONTINUED)
The percentage of plan assets consists of the following for the year ended December 31:
2017 2016
% %
Listed equity securities 31.00 40.00
Listed debt securities 42.00 31.00
Guaranteed insurance contracts 26.00 27.00
Short-term investments and cash 1.00 2.00
100.00 100.00
The significant weighted average assumptions used are as follows:
2017 2016
% %
Accrued benefit obligation as at December 31
Discount rate 3.50 3.90
Rate of compensation increase 3.25 3.25
Benefit costs for the year ended December 31
Discount rate 3.90 4.00
The items of the Company’s defined benefit plan costs recognized during the year are as follows:
2017 2016
$ $
Current service cost, net of employee’s contributions 1,000 973
Interest cost 1,076 1,099
Interest income on plan assets (665) (680)
Defined benefit plan expense 1,411 1,392
Expected contributions to the defined benefit pension plans for the year ending December 31, 2018 are $996.

December 31, 2017 and 2016(amounts expressed in thousands of Canadian dollars, except as otherwise indicated)
73NOTES TO CONSOLIDATED FINANCIAL STATEMENTS
2017 Annual Report
16 EMPLOYEE FUTURE BENEFITS (CONTINUED)
Consolidated statement of comprehensive income 2017 2016
$ $
Year ended December 31
Actuarial losses (549) (168)
Total recognized in other comprehensive income before income tax (549) (168)
Accumulated actuarial losses recognized in other comprehensive income 2017 2016
$ $
Balance of actuarial losses as at January 1 (3,153) (3,039)
Net actuarial losses recognized in the year, net of tax (859) (114)
Balance of actuarial losses as at December 31 (4,012) (3,153)
17 COMMITMENTS AND CONTINGENCIES
a) The Company has issued guarantees amounting to $19,036 (2016 – $28,880) under letters of credit and various bid and performance bonds. The Company’s management does not believe these guarantees are likely to be called on. As a result, no provisions have been recorded in the consolidated financial statements.
b) Future minimum payments under operating leases related to land, equipment and rolling stock are as follows:
$
2018 22,747
2019 17,672
2020 13,042
2021 8,747
2022 5,334
Thereafter 12,592
80,134
c) The Company’s operations are subject to Canadian federal and provincial as well as U.S. federal and state environmental laws and regulations governing, among other matters, air emissions, waste management and wastewater effluent discharges. The Company takes measures to comply with such laws and regulations. However, the measures taken are subject to the uncertainties of changing legal requirements, enforcement practices and developing technological processes.
d) The Company has contracts whereby third party licensees that harvest certain areas assume the responsibility for reforestation. Should the third party licensees fail to perform, the Company is responsible for these additional future reforestation costs, which are currently estimated to be $410 (2016 – $281). Payments, if any, required as a result of this contingency will be expensed in the period in which they are determined and are not included in the provision for reforestation.
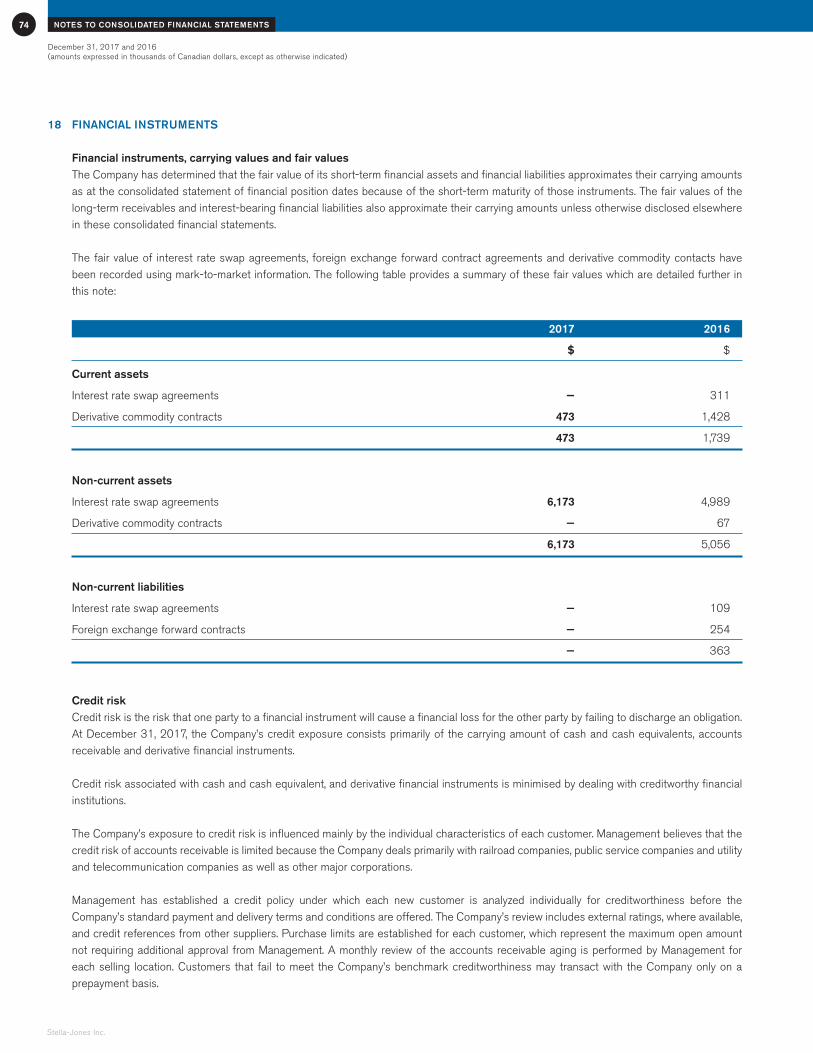
December 31, 2017 and 2016 (amounts expressed in thousands of Canadian dollars, except as otherwise indicated)
NOTES TO CONSOLIDATED FINANCIAL STATEMENTS74
Stella-Jones Inc.
18 FINANCIAL INSTRUMENTS
Financial instruments, carrying values and fair valuesThe Company has determined that the fair value of its short-term financial assets and financial liabilities approximates their carrying amounts as at the consolidated statement of financial position dates because of the short-term maturity of those instruments. The fair values of the long-term receivables and interest-bearing financial liabilities also approximate their carrying amounts unless otherwise disclosed elsewhere in these consolidated financial statements.
The fair value of interest rate swap agreements, foreign exchange forward contract agreements and derivative commodity contacts have been recorded using mark-to-market information. The following table provides a summary of these fair values which are detailed further in this note:
2017 2016
$ $
Current assets
Interest rate swap agreements — 311
Derivative commodity contracts 473 1,428
473 1,739
Non-current assets
Interest rate swap agreements 6,173 4,989
Derivative commodity contracts — 67
6,173 5,056
Non-current liabilities
Interest rate swap agreements — 109
Foreign exchange forward contracts — 254
— 363
Credit riskCredit risk is the risk that one party to a financial instrument will cause a financial loss for the other party by failing to discharge an obligation. At December 31, 2017, the Company’s credit exposure consists primarily of the carrying amount of cash and cash equivalents, accounts receivable and derivative financial instruments.
Credit risk associated with cash and cash equivalent, and derivative financial instruments is minimised by dealing with creditworthy financial institutions.
The Company’s exposure to credit risk is influenced mainly by the individual characteristics of each customer. Management believes that the credit risk of accounts receivable is limited because the Company deals primarily with railroad companies, public service companies and utility and telecommunication companies as well as other major corporations.
Management has established a credit policy under which each new customer is analyzed individually for creditworthiness before the Company’s standard payment and delivery terms and conditions are offered. The Company’s review includes external ratings, where available, and credit references from other suppliers. Purchase limits are established for each customer, which represent the maximum open amount not requiring additional approval from Management. A monthly review of the accounts receivable aging is performed by Management for each selling location. Customers that fail to meet the Company’s benchmark creditworthiness may transact with the Company only on a prepayment basis.

December 31, 2017 and 2016(amounts expressed in thousands of Canadian dollars, except as otherwise indicated)
75NOTES TO CONSOLIDATED FINANCIAL STATEMENTS
2017 Annual Report
18 FINANCIAL INSTRUMENTS (CONTINUED)
Credit risk (continued)
Note 5 provides details on the receivable aging as well as on the provision for doubtful accounts for the years ended December 31, 2017 and 2016. The Company’s largest customer had sales representing 15.60% of the total sales for the twelve-month period ending December 31, 2017 (2016 – 15.30%) and an account receivable balance of $6,152 as at December 31, 2017 (2016 – $4,127).
Price riskThe Company is exposed to commodity price risk on diesel and petroleum. The Company uses derivative commodity contracts based on the New York Harbor Ultra Low Sulfur Diesel Heating Oil to help manage its cash flows with regards to these commodities. The Company does not designate these derivatives as cash flow hedges of anticipated purchases of diesel and petroleum. Gains or losses from these derivative financial instruments are recorded in the consolidated statements of income under other losses (gain), net. The following table summarizes the derivative commodity contracts as at December 31, 2017 and 2016:
2017
Hedged item Gallons Effective date Maturity date Fixed rate
Diesel and petroleum 600,000* January 2018 December 2018 US$1.72
Diesel and petroleum 600,000* January 2018 December 2018 US$1.61
2016
Hedged item Gallons Effective date Maturity date Fixed rate
Diesel and petroleum 3,000,000* January 2017 December 2017 US$1.50
Diesel and petroleum 1,680,000* January 2017 December 2017 US$1.65
Diesel and petroleum 600,000* January 2018 December 2018 US$1.72
* Represents a volume evenly split throughout the year.
The fair value of the above derivative commodity hedges based on cash settlement requirements as at December 31, 2017 is an asset of $473 recorded under current assets (2016 – a total asset of $1,495 of which $67 was recorded under non-current assets) in the consolidated statement of financial position. The fair value of these hedge agreements have been determined by obtaining mark-to-market values as at December 31, 2017 and 2016 from a third party. This type of measurement falls under Level 2 in the fair value hierarchy as per IFRS 7, Financial Instruments: Disclosures. A description of each level of the hierarchy is as follows:
Level 1: Quoted prices (unadjusted) in active markets for identical assets or liabilities.
Level 2: Inputs other than quoted prices included within Level 1 that are observable for these assets or liabilities, either directly (i.e. as prices) or indirectly (i.e. derived from prices).
Level 3: Inputs for the assets or liabilities that are not based on observable market data (unobservable inputs).
Liquidity riskLiquidity risk is the risk that the Company will not be able to meet its financial obligations as they fall due. The Company’s approach to managing liquidity is to ensure, on a long-term basis, that it will always have sufficient liquidity to meet its liabilities when due, under both normal and stressed conditions, without incurring losses or risking damage to its reputation.
The Company ensures that it has sufficient credit facilities to support working capital, meet expected operational expenses and service financial obligations. Inventories are a significant component of working capital because of the long periods required to air-season wood, which can occasionally exceed nine months before a sale is made.
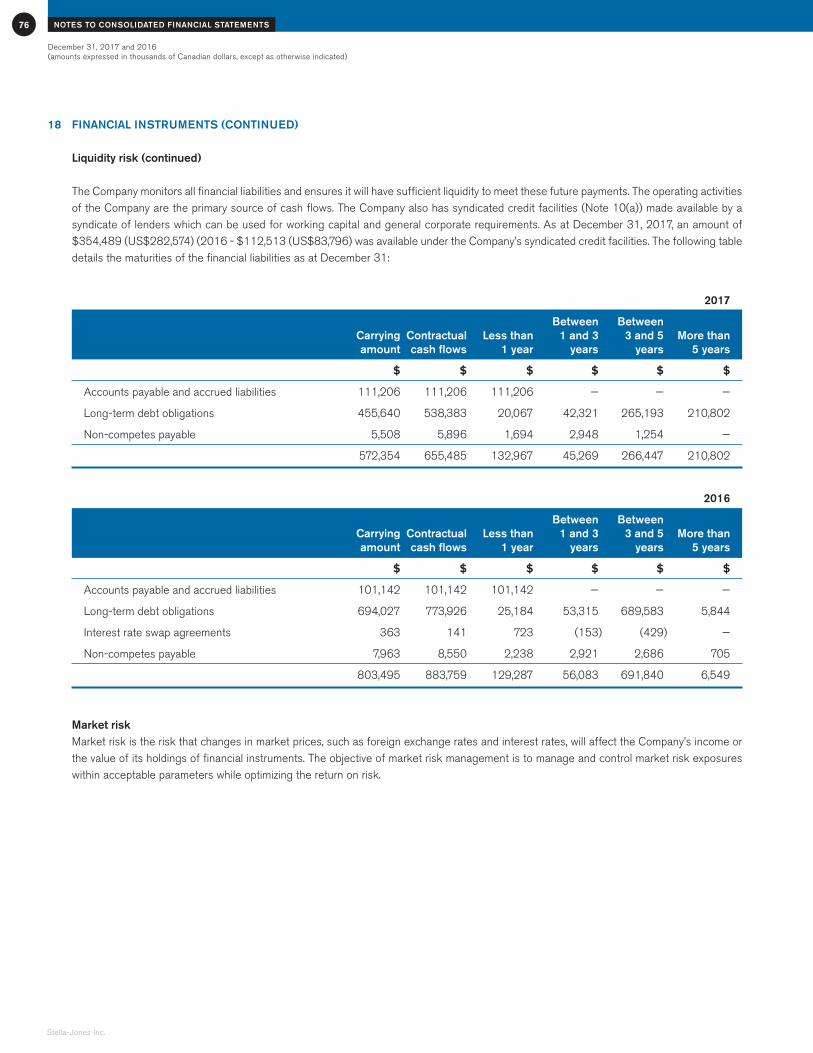
December 31, 2017 and 2016 (amounts expressed in thousands of Canadian dollars, except as otherwise indicated)
NOTES TO CONSOLIDATED FINANCIAL STATEMENTS76
Stella-Jones Inc.
18 FINANCIAL INSTRUMENTS (CONTINUED)
Liquidity risk (continued)
The Company monitors all financial liabilities and ensures it will have sufficient liquidity to meet these future payments. The operating activities of the Company are the primary source of cash flows. The Company also has syndicated credit facilities (Note 10(a)) made available by a syndicate of lenders which can be used for working capital and general corporate requirements. As at December 31, 2017, an amount of $354,489 (US$282,574) (2016 - $112,513 (US$83,796) was available under the Company’s syndicated credit facilities. The following table details the maturities of the financial liabilities as at December 31:
2017
Between Between Carrying Contractual Less than 1 and 3 3 and 5 More than amount cash flows 1 year years years 5 years
$ $ $ $ $ $
Accounts payable and accrued liabilities 111,206 111,206 111,206 — — —
Long-term debt obligations 455,640 538,383 20,067 42,321 265,193 210,802
Non-competes payable 5,508 5,896 1,694 2,948 1,254 —
572,354 655,485 132,967 45,269 266,447 210,802
2016
Between Between Carrying Contractual Less than 1 and 3 3 and 5 More than amount cash flows 1 year years years 5 years
$ $ $ $ $ $
Accounts payable and accrued liabilities 101,142 101,142 101,142 — — —
Long-term debt obligations 694,027 773,926 25,184 53,315 689,583 5,844
Interest rate swap agreements 363 141 723 (153) (429) —
Non-competes payable 7,963 8,550 2,238 2,921 2,686 705
803,495 883,759 129,287 56,083 691,840 6,549
Market risk Market risk is the risk that changes in market prices, such as foreign exchange rates and interest rates, will affect the Company’s income or the value of its holdings of financial instruments. The objective of market risk management is to manage and control market risk exposures within acceptable parameters while optimizing the return on risk.

December 31, 2017 and 2016(amounts expressed in thousands of Canadian dollars, except as otherwise indicated)
77NOTES TO CONSOLIDATED FINANCIAL STATEMENTS
2017 Annual Report
18 FINANCIAL INSTRUMENTS (CONTINUED)
Currency riskThe Company’s exposure to foreign exchange gains or losses from currency fluctuations is related to sales and purchases in U.S. dollars by its Canadian-based operations and to U.S. dollar-denominated long-term debt held by its Canadian company. The Company monitors its transactions in U.S. dollars generated by Canadian-based operations and enters into hedging transactions to mitigate its currency risk. The Company’s basic hedging activity consists of entering into foreign exchange forward contracts for the sale of U.S. dollars and the purchase of certain goods and services in U.S. dollars. The Company also considers foreign exchange forward contracts for the purchase of U.S. dollars for significant purchases of goods and services that were not covered by natural hedges.
On November 1, 2016, the Company entered into a sixty-month foreign exchange forward contract agreement, selling US$500 per-month at a strike rate of 1.385 and a fade-in rate of 1.178. The Company will obtain the strike rate as long as the spot exchange rate on the transaction date is greater than or equal to the fade-in rate. If the spot exchange rate is lower than the fade-in rate, the transaction will not occur. On July 28, 2017, the Company terminated these contracts and received a cash settlement of $1,087. The fair value of this hedge agreement was determined by obtaining mark-to-market values as at December 31, 2016 from a third party. This type of measurement falls under Level 2 in the fair value hierarchy as per IFRS 7, Financial Instruments: Disclosures. These foreign exchange forward contract agreements did not qualify for hedge accounting and the fair value based on cash settlement requirements as at December 31, 2016 was a $254 liability recorded under non-current liabilities.
The following table provides information on the impact of a 10.00% strengthening of the U.S. dollar against the Canadian dollar on net income and equity for the years ended December 31, 2017 and 2016. For a 10.00% weakening of the U.S. dollar against the Canadian dollar, there would be an equal and opposite impact on net income, comprehensive income and equity:
2017 2016
$ $
Decrease (increase) of net income (806) 107
Increase of equity 37,352 51,425
This analysis considers the impact of foreign exchange variance on financial assets and financial liabilities denominated in U.S. dollars which are on the consolidated statement of financial position of the Canadian entities:
2017 2016
$ $
Assets
Cash 11,484 —
Accounts receivable 2,545 3,506
14,029 3,506
Liabilities
Accounts payable and accrued liabilities 5,968 2,624
Long-term debt — 1,952
5,968 4,576
The foreign exchange impact for the U.S. dollar-denominated long-term debt, in the Canadian entities, has been excluded for the most part from the sensitivity analysis for other comprehensive income, as the long-term debt is designated as a hedge of net investment in foreign operations (Note 10).

December 31, 2017 and 2016 (amounts expressed in thousands of Canadian dollars, except as otherwise indicated)
NOTES TO CONSOLIDATED FINANCIAL STATEMENTS78
Stella-Jones Inc.
18 FINANCIAL INSTRUMENTS (CONTINUED)
Interest rate riskAs at December 31, 2017, the Company has mitigated its exposure to interest rate risk on long-term debt after giving effect to its interest rate swap agreements; 100.00% (2016 – 66.25%) of the Company’s long-term debt is at fixed rates.
The Company enters into interest rate swap agreements in order to reduce the impact of fluctuating interest rates on its short- and long-term debt. These swap agreements require the periodic exchange of payments without the exchange of the notional principal amount on which the payments are based. The Company designates its interest rate hedge agreements as cash flow hedges of the underlying debt. Interest expense on the debt is adjusted to include the payments made or received under the interest rate swap agreements.
The syndicated credit facilities defined in Note 10(a) is made available by a syndicate of bank lenders. The financing of these loans is tied to the Canadian bank’s prime rate, the BA rate, the U.S. bank’s base rate or LIBOR. The Company has minimized its exposure to interest rate fluctuations by entering into interest rate swaps as detailed below. The impact of a 10.00% increase in these rates on the closing annual balance of the syndicated credit facilities, for borrowings that have not been swapped, would have increased interest expense by $146 for the year ended December 31, 2017 (2016 – $684).
The following tables summarize the Company’s interest rate swap agreements as at December 31:
2017
Notional Fixed Notional amount Related debt instrument rate Effective date Maturity date equivalent
% CA$
US$85,000 Syndicated credit facilities 1.68* December 2015 April 2021 106,633
US$100,000 Syndicated credit facilities 1.06* December 2017 December 2021 125,450
2016
Notional Fixed Notional amount Related debt instrument rate Effective date Maturity date equivalent
% CA$
CA$63,000 Syndicated credit facilities 0.70* February 2016 February 2018 63,000
US$75,000 Syndicated credit facilities 0.97* June 2014 June 2017 100,702
US$25,000 Syndicated credit facilities 0.71* December 2012 December 2017 33,567
US$25,000 Syndicated credit facilities 0.69* December 2012 December 2017 33,567
US$25,000 Syndicated credit facilities 0.71* December 2012 December 2017 33,567
US$25,000 Syndicated credit facilities 0.70* December 2012 December 2017 33,567
US$85,000 Syndicated credit facilities 1.68* December 2015 April 2021 114,129
US$100,000 Syndicated credit facilities 1.06* December 2017 December 2021 134,270
* Plus applicable spread of 1.00% to 2.25% based on pricing grid included in the Credit Agreement.

December 31, 2017 and 2016(amounts expressed in thousands of Canadian dollars, except as otherwise indicated)
79NOTES TO CONSOLIDATED FINANCIAL STATEMENTS
2017 Annual Report
18 FINANCIAL INSTRUMENTS (CONTINUED)
Interest rate risk (continued)
The Company’s interest rate swap agreements are designated as cash flow hedges. The cash flow hedge documentation allows the Company to substitute the underlying debt as long as the hedge effectiveness is demonstrated. As at December 31, 2017, all cash flow hedges were effective.
The fair value of these financial instruments has been determined by obtaining mark-to-market values as at December 31, 2017 from different third parties. This type of measurement falls under Level 2 in the fair value hierarchy as per IFRS 7, Financial Instruments: Disclosures. The fair value of the interest rate swap agreements based on cash settlement requirements as at December 31, 2017 is a non-current asset of $6,173 recorded in the consolidated statement of financial position (2016 – a net asset of $5,191 of which an asset of $311 is recorded in current assets, an asset of 4,989 is recorded in non-current assets and a liability of $109 is recorded in non-current liabilities). A 10.00% decrease in interest rates as at December 31, 2017 would have reduced the net gain recognized in other comprehensive income by approximately $617 (2016 – $519). For a 10.00% increase in the interest rates, there would be an equal and opposite impact on the net gain.
19 CAPITAL DISCLOSURES
The Company’s objective in managing capital is to ensure sufficient liquidity to pursue its organic growth strategy and undertake selective acquisitions, while at the same time taking a conservative approach to financial leverage and management of financial risk. The Company manages its capital structure and makes adjustments to it in light of changes in economic conditions and the risk characteristics of the underlying assets. In order to maintain or adjust the capital structure, the Company may adjust the amount of dividends paid to shareholders, return capital to shareholders, issue new shares, or acquire or sell assets to improve its financial performance and flexibility.
The Company’s capital is composed of total debt, which includes bank indebtedness, and shareholders’ equity, which includes capital stock.
2017 2016
$ $
Total debt 455,640 694,027
Shareholders’ equity 1,115,545 1,026,418
Total capital 1,571,185 1,720,445
Total debt to total capitalization ratio 0.29:1 0.40:1
The Company’s primary uses of capital are to finance non-cash working capital and capital expenditures for capacity expansion as well as acquisitions. The Company currently funds these requirements out of its internally generated cash flows and its syndicated credit facilities. However, future corporate acquisitions may require new sources of financing.
The primary measure used by the Company to monitor its financial leverage is the total debt to total capitalization ratio, which it aims to maintain within a range of 0.20:1 to 0.50:1. The total debt to total capitalization ratio is defined as total debt divided by total capital.

December 31, 2017 and 2016 (amounts expressed in thousands of Canadian dollars, except as otherwise indicated)
NOTES TO CONSOLIDATED FINANCIAL STATEMENTS80
Stella-Jones Inc.
20 RELATED PARTY TRANSACTIONS
a) Transactions The Company had the following transactions with related parties:
2017 2016
$ $
Stella Jones International S.A.*
Marketing and technical service fees paid 200 200
Stella International S.A. and James Jones & Sons Limited**
Marketing and technical service fees paid 100 100
Other
Legal fees charged by a firm in which a director of the Company is a partner 838 1,202
* As of December 31, 2017, Stella Jones International S.A. holds, directly or indirectly, approximately 38.30% of the outstanding common shares of the Company. Pursuant to the secondary offering closed on February 21, 2018, the percentage of outstanding common shares held by Stella International S.A. was reduced to 31.10%.
** Stella International S.A. and James Jones & Sons Limited hold 51.00% and 49.00% of all voting shares of Stella Jones International S.A., respectively.
These transactions occurred in the normal course of operations and have been measured at fair value.
As at December 31, the consolidated statement of financial position includes the following amounts with related parties:
2017 2016
$ $
Accounts payable to Stella International S.A. and James Jones & Sons Limited 25 25
Accounts payable to Stella Jones International S.A. 50 50
Accounts payable to a firm in which a director of the Company is a partner 305 557
380 632
b) Key management compensation Key management includes certain directors (executive and non-executive), and certain senior management. The compensation paid or
payable to key management for employee services is as follows:
2017 2016
$ $
Salaries, compensation and benefits 4,728 5,494
Share-based expenses 4,063 4,435
8,791 9,929

December 31, 2017 and 2016(amounts expressed in thousands of Canadian dollars, except as otherwise indicated)
81NOTES TO CONSOLIDATED FINANCIAL STATEMENTS
2017 Annual Report
21 SEGMENT INFORMATION
The Company operates within two business segments which are the production and sale of pressure-treated wood and the procurement and sales of logs and lumber.
The pressure-treated wood segment includes railway ties, utility poles, residential lumber and industrial products.
The logs and lumber segment comprises of the sales of logs harvested in the course of the Company’s procurement process that are determined to be unsuitable for use as utility poles. Also included in this segment is the sale of excess lumber to local home-building markets. Assets and net income related to the logs and lumber segment are nominal.
Operating plants are located in five Canadian provinces and nineteen American states. The Company also operates a large distribution network across North America.
Sales attributed to countries based on location of customer are as follows:
2017 2016
$ $
Canada 561,905 535,800
U.S. 1,324,237 1,302,553
1,886,142 1,838,353
Sales by product as at December 31 are as follows:
2017 2016
$ $
Pressure-treated wood
Railway ties 651,549 716,292
Utility poles 653,946 579,208
Residential lumber 366,225 345,749
Industrial products 94,516 96,310
Logs and lumber 119,906 100,794
1,886,142 1,838,353

December 31, 2017 and 2016 (amounts expressed in thousands of Canadian dollars, except as otherwise indicated)
NOTES TO CONSOLIDATED FINANCIAL STATEMENTS82
Stella-Jones Inc.
21 SEGMENT INFORMATION (CONTINUED)
Property, plant and equipment, intangible assets and goodwill attributed to the countries based on location are as follows:
2017 2016
$ $
Property, plant and equipment
Canada 120,804 104,835
U.S. 351,237 358,815
472,041 463,650
Intangible assets
Canada 23,989 26,374
U.S. 100,375 120,940
124,364 147,314
Goodwill
Canada 14,864 14,164
U.S. 255,397 273,203
270,261 287,367
22 SUBSEQUENT EVENTS
a) On February 9, 2018, the Company completed the acquisition of substantially all the operating assets employed in the business of Prairie Forest Products (“PFP”), a division of Prendiville Industries Ltd., located at its wood treating facility in Neepawa, Manitoba as well as at its peeling facility in Birch River, Manitoba. PFP manufactures, sells and distributes utility poles and residential lumber and was acquired for synergistic reasons. Sales for the twelve-month period ended October 31, 2017 were approximately $35,100.
Total cash outlay associated with the acquisition was $26,494 excluding acquisition costs of approximately $326 of which $159 was recognized in the 2017 consolidated statement of income under selling and administrative expenses. The Company financed the acquisition through its existing syndicated credit facilities.
At the time of preparing these consolidated financial statements, Management did not have on hand all the required information to determine the fair value of assets acquired and liabilities assumed. Preliminary information indicates that property plant and equipment and inventory represent approximately $7,763 and $9,500 respectively from the total purchase price of $26,494.
b) On March 13, 2018, the Board of Directors declared a quarterly dividend of $0.12 per common share payable on April 27, 2018 to shareholders of record at the close of business on April 6, 2018.
23 COMPARATIVE FIGURES
Certain comparative figures have been reclassified in order to comply with the basis of presentation adopted in the current year.

2017 Annual Report
DIRECTORS AND OFFICERS
Tom A. Bruce Jones, CBE (1)
Chairman of the Board,Stella-Jones Inc.Chairman of the Board,James Jones & Sons Limited(Forest products company)Larbert, ScotlandDirector since July 1993
George J. Bunze, CPA, CMA (2) (3)
Vice-Chairman and Director,Kruger Inc.(Manufacturer of paper, tissue,wood products, energy (hydro/wind) and wine and spiritsproducts)Montréal, QuébecDirector since May 2001
Gianni Chiarva (3)
Vice-Chairman of the Board,Stella-Jones Inc.Chairman,Stella Jones International S.A.Milan, ItalyDirector since July 1993
Katherine A. Lehman (2)
Managing Partner, HilltopPrivate Capital LLCNew York, NY, USADirector since October 2016
Brian McManusPresident andChief Executive Officer,Stella-Jones Inc.Montréal, QuébecDirector since June 2001
Nycol Pageau-Goyette (1) (2) (3)
President, Pageau Goyetteet associés limitée(Management services firm)Montréal, QuébecDirector since July 1993
James A. Manzi, Jr. (2)
Corporate DirectorTampa, FL, USADirector since April 2015
Simon Pelletier (2) (4)
Senior Vice-President,North American Sales and Operations,Metso (Manufacturer of mineralprocessing equipment and service provider to mining and construction industries)Senneville, QuébecDirector since May 2012
Daniel Picotte (1)
Partner, Fasken MartineauDuMoulin LLP (Law firm)Montréal, QuébecDirector since July 1993
Mary Webster (1)
Corporate DirectorWayzata, MN, USADirector since May 2007
(1) Member of the Environmental,Health and Safety Committee
(2) Member of the Audit Committee(3) Member of the Remuneration
Committee(4) Lead Director
A full report of Stella-Jones’ corporate governance practices is set out in the Management Proxy Circular for the May 3, 2018 Annual Meeting of Shareholders.
Tom A. Bruce Jones, CBEChairman of the Board
Gianni ChiarvaVice-Chairman of the Board
Brian McManusPresident and Chief Executive Officer
Éric Vachon, CPA, CASenior Vice-President andChief Financial Officer
Marla EichenbaumVice-President, General Counsel and Secretary
Ian JonesSenior Vice-President
Gordon MurrayVice-President, Environment andTechnology and General Manager,Atlantic Region
André DaigleVice-President,Central Region
Shane CampbellVice-President, OperationsMcFarland Cascade Holdings, Inc.
George CaricVice-President, MarketingStella-Jones Corporation
Kevin ComerfordVice-President, Polesand Residential SalesMcFarland CascadeHoldings, Inc.
W.G. Downey, Jr.Vice-President, U.S. Tie ProcurementStella-Jones Corporation
Marcell DriessenVice-President, Human ResourcesStella-Jones Corporation/McFarland Cascade Holdings, Inc.
Ian JonesSenior Vice-PresidentMcFarland CascadeHoldings, Inc.
James KennerVice-President andGeneral Counsel, U.S. OperationsStella-Jones Corporation
Patrick KirkhamVice-President, OperationsStella-Jones Corporation
Jim RainesVice-President, SalesStella-Jones Corporation
Michael SylvesterSenior Vice-President,Stella-Jones Corporation
David WhittedVice-President, Sales OperationsStella-Jones Corporation
Jon YounceVice-President, U.S. Fibre and Transportation/LogisticsMcFarland Cascade Holdings, Inc.
Ron ZeegersVice-President, Operations, Western CanadaStella-Jones Inc.
BOARD OF DIRECTORS
OFFICERS
SUBSIDIARIES – SENIOR MANAGEMENT
83

Stella-Jones Inc.
OPERATING NETWORK – CANADA
Stella Jones Inc.3100 de la Côte-Vertu Blvd.Suite 300Saint-Laurent, QuébecH4R 2J8T: (514) 934-8666F: (514) [email protected]
Plant39 miles SE of CalgaryHwy. 24Carseland, AlbertaT0J 0M0T: (403) 934-4600F: (403) [email protected]
Plant and Sales Office25 Braid StreetNew WestminsterBritish ColumbiaV3L 3P2T: (604) 521-4385F: (604) [email protected]
Plant and Sales Office278 Park StreetTruro, Nova ScotiaB2N 5C1T: (902) 893-9456F: (902) [email protected]
Plant and Sales OfficeGuelph Utility Pole7818 Wellington Road 22R.R. #5Guelph, OntarioN1H 6J2T: (519) 822-3901F: (519) [email protected]
Plant and Sales Office1 Ram Forest RoadStouffville, OntarioL4A 2G7 T: (905) 727-1164F: (905) [email protected]
Plant and Sales Office321 Lansdowne Street EastPeterborough, OntarioK9J 7X6T: (705) 745-3223F: (705) [email protected]
Plant7400 Galloway Mill RoadGallowayBritish ColumbiaV0B 1T2T: (250) 429-3493F: (250) [email protected]
Plant and Sales Office7177 Pacific StreetPrince GeorgeBritish ColumbiaV2N 5S4T: (250) 561-1161F: (250) [email protected]
Fibre & Woodlands Dept.4661 60th Street SESalmon ArmBritish ColumbiaV1E 1X2T: (250) 832-1180F: (250) [email protected]
Plant205 Hwy. 16 WestNeepawa, ManitobaR0J 1H0T: (204) 476-7700F: (204) [email protected]
Plant11045 Hwy. 124South River, OntarioP0A 1X0T: (705) 386-2371F: (705) [email protected]
Plant and Sales Office41 Rodier StreetDelson, QuébecJ5B 2H8T: (450) 632-2011T: 1 (800) 387-5027F: (450) [email protected]
Plant and Sales Office426 chemin deMontréal EastGatineau, QuébecJ8M 1V6T: (819) 986-8998F: (819) [email protected]
Plant2210 chemin St-RochSorel-Tracy, QuébecJ3R 3L2T: (450) 742-5977F: (450) [email protected]
Plant2549 Chemin FranciscoRivière-Rouge, QuébecJ0T 1T0T: (819) 275-3353F: (819) [email protected]
CORPORATE HEAD OFFICE ALBERTA BRITISH COLUMBIA
NOVA SCOTIA ONTARIO
BRITISH COLUMBIA MANITOBA
ONTARIO QUÉBEC
QUÉBEC
84

2017 Annual Report
OPERATING NETWORK – UNITED STATES
Stella-Jones CorporationPark West One1000 Cliff Mine Road Suite 500Pittsburgh, PA 15275 U.S.AT: (412) 325-0202F: (412) [email protected]
Stella-Jones Corporation15700 College Blvd.,Suite 300Lenexa, KS66219 U.S.A.T: (913) 948-9478F: (913) [email protected]
PlantStella-Jones Corporation100 McKinney DriveClanton, AL35045 U.S.A.T: (205) 280-3950F: (205) [email protected]
PlantStella-Jones Corporation1051 Highway 25 SouthMontevallo, AL35115 U.S.A.T: (205) 679-4005F: (205) [email protected]
PlantMcFarland Cascade850 West Chambers St.Eloy, AZ85231 U.S.A.T: (520) 466-7801F: (520) 466-3607info@mcfarland cascade.com
PlantStella-Jones Corporation4260 SouthArkansas Ave.Russellville, AR72802 U.S.A.T: (479) 968-5085F: (479) [email protected]
PlantMcFarland Cascade6040 Highway 79NRison, AR71665 U.S.A.T: (870) 325-7070F: (870) 325-7050info@mcfarland cascade.com
PlantStella-Jones Corporation3500 Pateville RoadCordele, GA31015 U.S.A.T: (229) 273-8012F: (229) [email protected]
PlantStella-Jones Corporation3818 S. County Road50 EWinslow, IN47598 U.S.A.T: (812) 789-5331F: (812) [email protected]
PlantStella-Jones Corporation3855 Highway 51 NorthFulton, KY42041 U.S.A.T: (270) 472-5557F: (270) [email protected]
PlantStella-Jones Corporation3600 Koppers RoadAlexandria, LA71302 U.S.A.T: (318) 442-5733F: (318) [email protected]
PlantMcFarland Cascade10020 Highway 483Converse, LA71419 U.S.A.T: (318) 645-7525F: (318) [email protected]
PlantMcFarland Cascade74 Wadley StreetPineville, LA 71360 U.S.A.T: (318) 442-4414F: (318) [email protected]
PlantMcFarland Cascade13539 Highway 45Scooba, MS39358-7611 U.S.A.T: (662) 476-8000F: (601) [email protected]
PlantMcFarland Cascade1680 E Spruce AvenueSilver Springs, NV89429 U.S.A.T: (775) 577-2000F: (775) [email protected]
Plant and Office McFarland Cascade90049 Highway 99N.Eugene, OR97402 U.S.A.T: (541) 689-1278F: (541) [email protected]
PlantMcFarland Cascade22125 SWRock Creek RoadSheridan, OR97378 U.S.A.T: (503) 843-2122F: (503) [email protected]
PlantStella-Jones Corporation5865 Route 235McAlisterville, PA17049 U.S.A.T: (717) 463-2131F: (717) [email protected]
PlantStella-Jones Corporation392 Larkeytown RoadDubois, PA15801 U.S.A.T: (814) 371-7331F: (814) [email protected]
ARIZONA ARKANSAS GEORGIA INDIANA
CORPORATE OFFICE LEGAL AND COMPLIANCE ALABAMA
KENTUCKY LOUISIANA MISSISSIPPI
NEVADA OREGON PENNSYLVANIA
85

Stella-Jones Inc.
OPERATING NETWORK – UNITED STATES
PlantMcFarland Cascade6520 - 188th NEArlington, WA98223 U.S.A.T: (360) 435-2146F: (360) [email protected]
PlantStella-Jones CorporationW1038 County Road UBangor, WI54614 U.S.A.T: (608) 486-2700F: (608) [email protected]
PlantMcFarland Cascade1014 S. 1st StreetCameron, WI 54822 U.S.A.T: (715) 458-2018F: (715) [email protected]
WASHINGTON WISCONSIN
PlantMcFarland Cascade1121 Delta RoadWhitmire, SC29178 U.S.A.T: (803) 694-3668F: (803) [email protected]
Coal Tar DistillationFacilityStella-Jones Corporation1471 Channel AvenueMemphis, TN38109 U.S.A.T: (901) 942-3326F: (901) [email protected]
PlantMcFarland Cascade5865 US Highway 69Lufkin, TX 75901 U.S.A.T: (936) 824-2297F: (936) [email protected]
PlantStella-Jones Corporation9223 Maury River RoadGoshen, VA24439 U.S.A.T: (540) 997-9251F: (540) [email protected]
Plant and Corporate OfficeMcFarland Cascade1640 East Marc St.Tacoma, WA98421 U.S.A.T: (253) 572-3033F: (253) [email protected]
SOUTH CAROLINA TENNESSEE TEXAS VIRGINIA WASHINGTON
86
Annual Meeting of ShareholdersMay 3, 201810:00 a.m.Hotel Omni Mont-RoyalSalon Pierre De Coubertin1050 Sherbrooke Street WestMontréal, Québec
Stock InformationShares listed: Toronto Stock ExchangeTicker symbol: SJInitial public offering: 199452-week high/low (Jan. 1 – Dec. 31, 2017): $51.41 / $38.30Share price at March 13, 2018: $47.30Common shares outstanding as at December 31, 2017: 69.34 million
Dividend PolicyThe Board of Directors considers a dividend on a quarterly basis, subjectto the Company’s financial covenants and conditional upon its financialperformance and cash requirements.
On March 13, 2018, the Board of Directors declared a quarterlydividend of $0.12 per common share.
Transfer Agent and RegistrarComputershare Investor Services Inc.
AuditorsPricewaterhouseCoopers LLP
Legal CounselFasken Martineau Dumoulin LLPCohen & Grigsby, P.C. Foley & Lardner LLP
CorporateInformation

20
17 A
NN
UA
L RE
PO
RT
ST
ELLA
-JON
ES
WWW.STELLA-JONES.COM
Railway operators recognize Stella-Jones as one of North America’s
foremost producers of railway ties. Similarly, the providers of electricity
and telecommunications throughout the continent know Stella-Jones
as a principal producer of utility poles. This level of accomplishment,
authority and identity in the treated wood industry has consistently
positioned the Company to grow its business among both existing and
new customers.