Embed Size (px)
Citation preview
33 North Stone, Suite 700
Tucson, Arizona 85701 AQ 402
2018 Ambient Air Monitoring
Network Plan
2
2018 Ambient Air Monitoring Network Plan
Pima County Board of Supervisors
Ally Miller Ramón Valadez Sharon Bronson
Steve Christy Richard Elías
Pima County Administrator Charles H. Huckelberry
Pima County Department of Environmental Quality Ursula Nelson
Director
Richard Grimaldi Deputy Director
Air Program Rupesh Patel
Air Program Manager
Data Collection Mike Draper, Data Collection Supervisor
Victor Malkin, Program Specialist Dale Eaton, Senior Principal Instrument & Control Specialist
Data Management
Deborah Jentoft, Data Manager
Quality Assurance Trinidad Alvarez, Quality Assurance Coordinator
Pima County 2018 Ambient Air Monitoring Network Plan
3
TABLE OF CONTENTS I. INTRODUCTION 5
Network Improvements and Anticipated Modifications 6 II. BACKGROUND 8
Regional Evaluation 8 Average Daily Traffic (ADT) 8 Local Geography and Meteorology 9 Definition Of Monitoring Objective, Site Types And Spatial Scales 10 Eastern Pima County, Tucson Air Planning Area Map 12
III. MONITORING SITES SUMMARY AND MAP 13
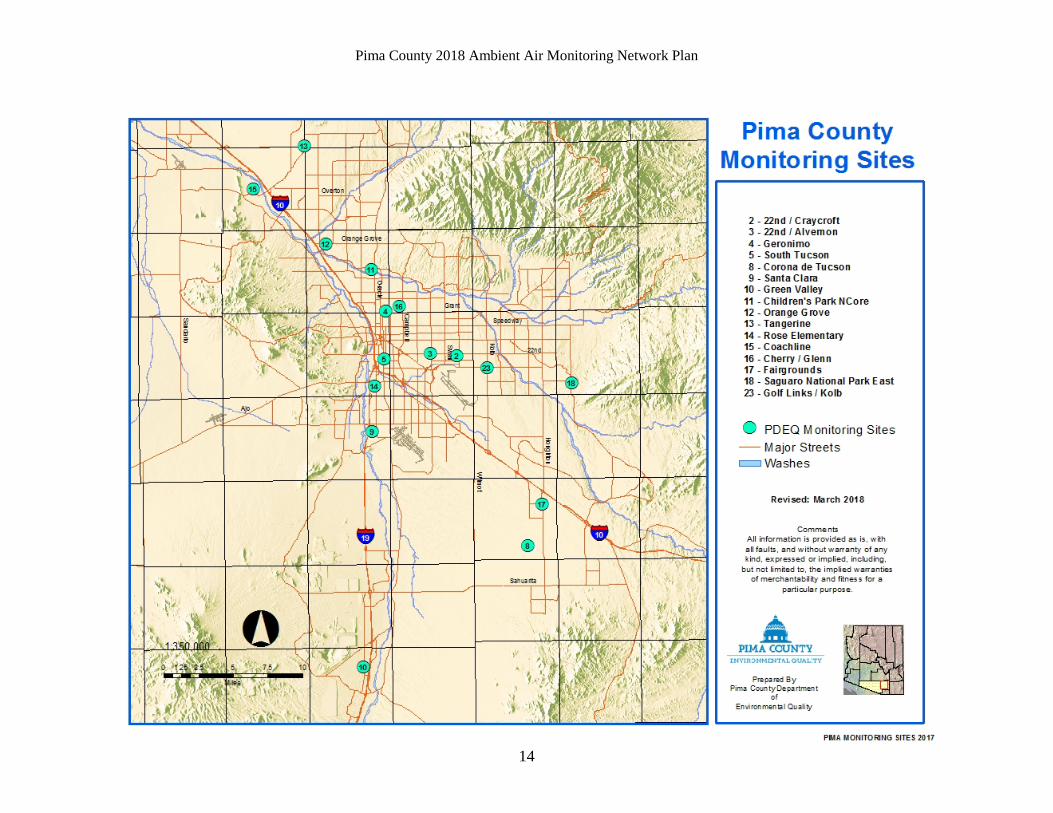
Active Particulate Monitoring Sites for 2018 13 Active Gaseous Monitoring Sites for 2018 13 PDEQ Ambient Air Monitoring Site Location Map 14 Ambient Air Monitoring Network Summary Tables 2018 15 Key to Summary Tables 19
IV. CURRENT MONITORING NETWORK EVALUATIONS 20
PM10 Monitoring Network Requirements 20 PM2.5 Monitoring Network Requirements 23 PM10-PM2.5 Monitoring Network Requirements 26 O3 Monitoring Network Requirements 27 CO Monitoring Network Requirements 29 NO2 Monitoring Network Requirements 32 NOy Monitoring Network Requirements 34 SO2 Monitoring Network Requirements 35
Pb Monitoring Network Requirements 37 V. DETAILED SITE AND MONITOR INFORMATION 39 ATTACHMENT A: EPA Approval of PDEQ 2017 Ambient Air Monitoring Network Plan ATTACHMENT B: EPA Approval of PDEQ Network Modifications ATTACHMENT C: EPA approval of PDEQ PAMS site location
Pima County 2018 Ambient Air Monitoring Network Plan
4
LIST OF FIGURES / TABLES FIGURES
1. Eastern Pima County, Tucson Air Planning Area map 12 2. PDEQ Ambient Air monitoring site location map 14
TABLES
1. Relationship Between Monitoring Site Type And Spatial Scale Represented 11 2. Active particulate monitoring sites for 2018 13 3. Active gaseous monitoring sites for 2018 13 4. Monitoring Network Descriptive Summary Tables 15 5. 2018 PM10 Design Criteria 20 6. PM10 Precision and Accuracy Summary Table 21 7. Collocated PM10 Monitors 21 8. PM10 Annual Summary Statistics 22 9. 2018 PM2.5 Design Criteria 23 10. Collocated PM2.5 Monitors 23 11. PM2.5 Precision and Accuracy Summary Table 25 12. PM2.5 Annual Summary Statistics 26 13. PM10 - PM2.5 Annual Summary Statistics 26 14. 2018 Ozone Design Criteria 27 15. Ozone Audit Dates 2018 28 16. Ozone Annual Summary Statistics 28 17. 2018 Carbon Monoxide Design Criteria 29 18. CO Audit Dates 2018 30 19. CO Annual Summary Statistics 31 20. 2018 Nitrogen Dioxide Design Criteria 32 21. Nitrogen Dioxide Audit Dates 2018 33 22. NO2 Annual Summary Statistics 33 23. NOy Audit Dates 2018 34 24. NOy Annual Summary Statistics 34 25. 2018 Sulfur Dioxide Design Criteria 35 26. Sulfur Dioxide Audit Dates 2018 36 27. SO2 Annual Summary Statistics 36 28. Lead Design Criteria…………………………………………………………………... 37
Pima County 2018 Ambient Air Monitoring Network Plan
5
I. INTRODUCTION This document constitutes the 2018 Ambient Air Monitoring Network Plan for the Pima County air monitoring network. The Pima County Department of Environmental Quality (PDEQ) has prepared this document to be submitted to the U.S. Environmental Protection Agency (USEPA), Region IX. The purpose of the Ambient Air Monitoring Network Plan is to determine if the network is achieving the air monitoring objectives specified in 40 CFR Part 58 Appendix D, which mandate adherence to certain number, type and location requirements of monitoring sites and specific site criteria such as monitoring inlet height. The plan should also determine if modifications should be made to the network (e.g. through the termination or relocation of unnecessary stations or addition of new stations). In addition, the plan is necessary in order to ensure that the residents of Pima County are provided adequate, representative and useful air quality data, and to provide adequate protection to public health. The designated ambient air pollutants monitored and reported by PDEQ are carbon monoxide (CO), ozone (O3), nitrogen dioxide (NO2), sulfur dioxide (SO2), particulate matter with an aerodynamic diameter of 10 micrometers or less in size (PM10) and particulate matter with aerodynamic diameter of 2.5 micrometers or less in size (PM2.5). This pollutant data is submitted to the EPA Air Quality System (AQS) database for determination of compliance with National Ambient Air Quality Standards (NAAQS). This report contains statistical data summaries for the 2018 calendar year and provides a site by site assessment of the monitoring network with respect to EPA site criteria. The Pima County monitoring network includes both State or Local Air Monitoring Stations (SLAMS) and OTHER monitors. SLAMS monitors comprise the required network monitors that are used for NAAQS comparisons and follow the monitoring objectives listed on page 7. OTHER monitors are used to enhance the network coverage of air quality monitoring data. Pima County has a designated National Core (NCore) site at the Children’s Park location, which also monitors for reactive oxides of nitrogen (NOY), particulate matter, coarse fraction (PM10-2.5) and speciated PM2.5 particulate matter. Pima County does not share monitoring responsibilities with Arizona Department of Environmental Quality at this time. Attachment A contains the response letter from EPA for the 2017 Ambient Air Monitoring Plan submitted by PDEQ.
Pima County 2018 Ambient Air Monitoring Network Plan
6
PDEQ’s anticipated network modifications in 2018:
1. Pima County Department of Environmental Quality closed its filter weigh lab. All gravimetric analysis of filters is now performed by an outside contracted laboratory.
2. Closure of CO monitoring at the Cherry/Glenn, Golf Links and Kolb and 22nd/Craycroft
monitoring sites. Attachment B contains the acceptance letter from EPA for this change.
3. Removal of the tree obstruction at the Coachline monitoring site.
4. Parameter Code change for PM2.5 at the Geronimo, Green Valley, Rose Elementary and Coachline monitoring sites from 88501 to 88502 per EPA’s request in the 2016 Annual Network Plan Check List response number 70.
5. Continue impact analysis of development near the Tangerine ozone and PM10 monitoring station, and if necessary change the station spatial scale and site type to correspond with changes to area development.
PDEQ’s anticipated network modifications in 2019:
1. Replace the FRM PM10 sampler at the Santa Clara monitoring station with a continuous FEM PM10 sampler. Also install a digital data logger to achieve near real-time data.
2. The 22nd & Craycroft site has been designated as a new Photochemical Assessment
Monitoring Station (PAMS). Attachment C contains the approval from EPA for this location. Based on 40 CFR part 58, Appendix D, State air monitoring agencies are required to begin making PAMS measurements at their location(s) by June 1, 2019. The equipment needed to measure PAMS parameters were to be purchased by EPA using a nationally negotiated contract and delivered to the monitoring agencies. EPA has announced that due to contract delays, the necessary equipment will not be delivered in time to begin making PAMS measurements by June 1, 2019. EPA has indicated that it is working on a proposed rule to extend the start date of PAMS measurements and expects that this proposed rule change will be signed by June 1, 2019. As a result of the delay, PDEQ will not begin making PAMS measurements at the 22nd & Craycroft site in 2019, and will work with EPA to begin measurements on or before the final revised start date for this network.
Pima County 2018 Ambient Air Monitoring Network Plan
7
Near-Road Monitoring EPA developed new rules for minimum monitoring requirements for nitrogen dioxide (NO2) in February, 2010. Under these new rules, state and local air monitoring agencies are required to install near-road NO2 monitoring stations at locations where peak hourly NO2 concentrations are expected to occur within the near-road environment in larger urban areas. Implementation of this requirement involves a three-phased approach, with initial installations in areas with populations greater than 1,000,000 to be completed by January 1, 2014. The second phase requires areas with 1) populations greater than 2,500,000 or, 2) populations greater than 500,000 with one or more roadway segments having 250,000 or greater Average Daily Traffic count to have a second near road monitor installed by January 1, 2015. The third phase requires areas with populations greater than 500,000 but less than 1,000,000 to complete installations by January 1, 2017. With most installations of phase one and two monitoring stations complete, and sufficient NO2 data reported to ascertain with some certainty the concentration levels of NO2 in the near-road environment, it has been determined that measured NO2 levels are lower than expected, and in some cases, lower than neighborhood locations in the same urban areas. Based on the results of the lower than expected NO2 monitoring for phase one and two, EPA has proposed to not require phase three monitoring. EPA formally finalized this approach in December 2016. When EPA developed the near road monitoring requirements, Pima County was identified as a phase three county. With EPA proposing to remove near road requirements for phase three areas, Pima County has not developed a proposed near road-monitoring plan. Recently, population estimates place Tucson’s Core Base Statistical Area (CBSA) over one million, which triggers the requirement for a near-road monitor as required under a phase one area. PDEQ has been working with EPA regarding the necessity and basis for an original phase three area being reclassified as a phase one area based on new population estimates. EPA has not developed guidance, implementation strategies, or funding for new phase one areas in the country. PDEQ and EPA continue to work on this issue. General comment regarding monitoring station siting criteria: The locations of monitoring stations in the PDEQ network require considerable planning to conform to all of the siting requirements specified in 40 CFR 58 Appendix E. Locations are chosen only after carefully considering the intent and installation logistics of each station. Some stations remain static, and easily maintain all siting criteria, and others fall victim to urban evolution and nature. Development happens and trees grow, modifying the original circumstances. Development can change those circumstances to the point that relocation or designation change of a station is required. Tree growth is more forgivable in that it can be modified by removal or trimming, but sometimes this is not possible for a number of reasons. Going to the effort of relocating a station because of tree growth is not generally practical. Modifying the station information to categorize trees as an obstruction is preferable, as long as siting criteria still meets the minimum requirements for obstructions. Most of the trees near PDEQ monitoring stations are typical of Sonoran Desert indigenous species, namely mesquite and palo verde, both of which have small, relatively sparse leaves, and in most cases do not totally block airflow, or provide large surfaces for particulate deposition. However, PDEQ has several stations that have been compromised by substantial tree growth, and in each section for those stations, the category for degrees of unrestricted airflow will reflect the reality of tree growth at those stations, and the obstructed airflow will be identified by direction in degrees.
Pima County 2018 Ambient Air Monitoring Network Plan
8
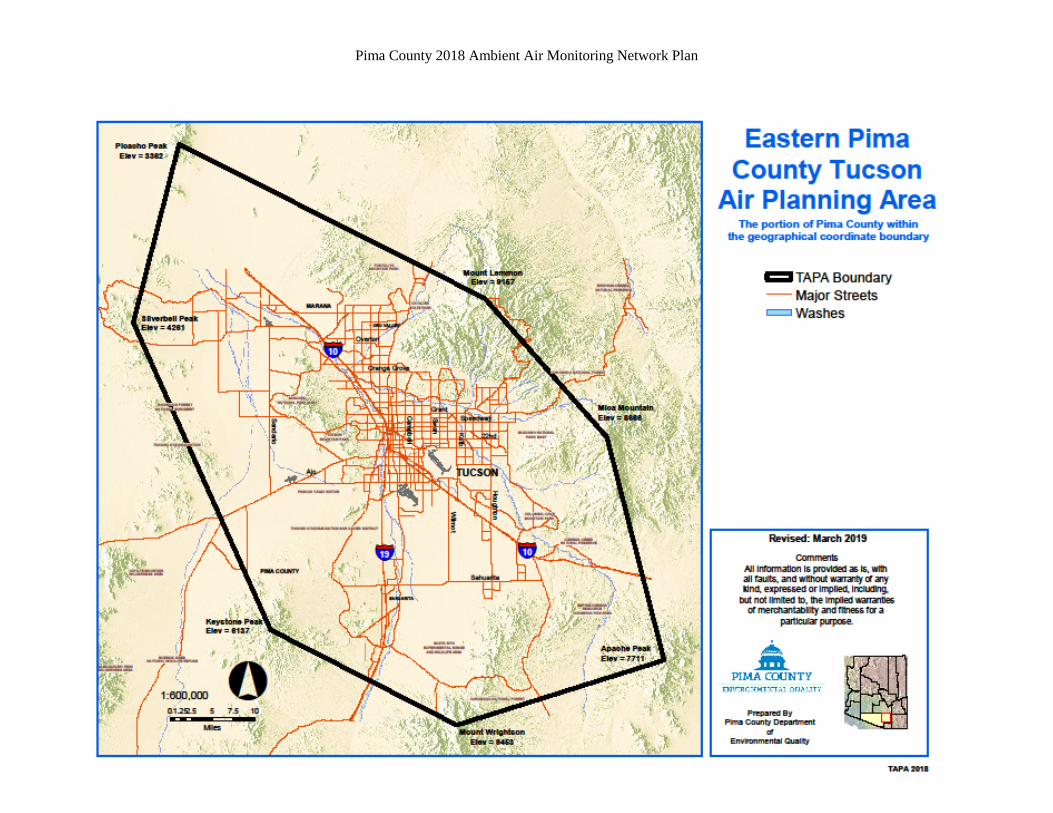
II. BACKGROUND Pima County Air Quality Control District met most of the National Ambient Air Quality Standards (NAAQS) in 2018. Ozone was the only pollutant that did not meet the NAAQS. The form of the ozone standard is the annual fourth highest daily maximum eight hour average, when averaged over three years is met when the concentration is equal to or less than 0.070 ppm. Pima County DEQ’s monitor at Saguaro Park East exceeded this level with the three year average concentration of 0.071 ppm. The other criteria pollutant that is a concern for Pima County is particulate matter (PM10). Particulate matter (PM10) levels are elevated during drought conditions and high winds which have caused exceedances of the NAAQS. There were no exceedances of PM10 in 2018. Regional Evaluation In order to evaluate existing and proposed monitoring stations and their stated objectives, regional information is used. The regional information consists of the most current values for population, major urban developments and directions of growth, traffic and highway data, major industries and aerial photographs showing topography. Population (census tract) data can act as a guide in evaluation of the representativeness of a site for determining population exposure. The 2010 census shows Pima County population at 980,263 and the city of Tucson population at 520,116. Figure 1 on page 12 illustrates the Eastern Pima County Tucson Air Planning Area (TAPA). The various incorporated areas and other agency lands are shown, as well as the named mountain peaks that define the planning area for Eastern Pima County, which includes the Tucson Metropolitan area. The Tucson Metropolitan Statistical Area (MSA) has incurred a population increase of approximately 4.1% since the 2010 census, based on 2017 estimates by the US Census Bureau. 2018 estimates were not available at the time of this publication. Average Daily Traffic (ADT) Traffic data is necessary for site evaluations since a large portion of air pollutants in the Tucson basin are caused by vehicular traffic. Traffic volumes and density maps are used in evaluating the monitoring network. This data is routinely compiled and used by local transportation and planning agencies. An analysis of the most current traffic data indicates that the network continues to meet the requirements for the monitoring site type and corresponding spatial scales as initially established. The Average Daily Traffic (ADT) numbers are 24 - hour, two - way volume of average weekday traffic. Latitude and Longitude Latitude and Longitude data is also provided for the monitoring sites using Datum WGS84 AZ Central in Decimal.Degrees.
Pima County 2018 Ambient Air Monitoring Network Plan
9
Local Geography and Meteorology Tucson, Arizona is a major metropolitan area situated in the Santa Cruz river valley, which is encompassed by the Sonoran Desert at an elevation between 2300 and 2800 feet. Basin and range topography characterizes the region with rugged mountain ranges encircling the valley floor with mountain peak elevations in excess of 9000 feet, thus delineating the Tucson Air Planning Area. The flat or gently rolling valley terrain slopes from the higher south and southeast toward the lower northwest following the Santa Cruz river drainage. The climate of Tucson is characterized by a hot season normally starting in April and ending in October, and a generally mild winter. Maximum daily temperatures from May through September are usually above 90 degrees Fahrenheit. The average rainfall is around eleven inches per year. Tucson International Airport records show an average of 240 clear days a year (days with less than 50% total cloud cover). The remaining periods include the winter prefrontal situations more common in the north and the prolonged seasons of convective summer storms. Wind velocity and direction changes, associated with the large scale pressure systems, frequently result in localized dust storms. The mountain-valley circulation, along with surface heating during the day and radiational cooling at night, create a predominantly southeast to northwest wind path in the basin. Airflows generally tend to be downvalley (from the southeast) at night and early morning hours, reversing to the upvalley direction (from the northwest) during the day. These downvalley / upvalley flows are strongly influenced by localized upslope / downslope terrain. The normal upvalley airflow is from the northwest, and parallels the Santa Cruz River, but decays well before sunset. This is followed by an hour of light, erratic flows which turn into the downvalley flow from the southeast, and reach their maximum and stabilized speed in four to six hours. The air temperature drops steadily during this interval until the sun rises. The downvalley direction continues for two to five hours past sunrise and then transforms into a short calm period prior to the change to upvalley flows. The southeasterly “monsoon” regime that occurs primarily in the months of July and August is a large scale synoptic feature with considerable yearly variation both in intensity and timing. At the Tucson International Airport, the winds become strong, gusty and southeasterly with high relative humidity, cloud cover and frequent thunderstorms. The mountain - valley circulation tends to be suppressed during this time period. Atmospheric temperature inversions occur almost daily in the Tucson air basin. During the winter months these inversions may become severe with particulate and other pollutants becoming concentrated, remaining near the ground level causing haze. When the sun sets, the ground and surface air cools faster than the air several hundred feet above the surface. Since air temperature normally decreases with increasing altitude, the warm and cool layers are reversed or “inverted”, hence the name ‘temperature inversion’. These temperature inversions are usually strongest on cold, clear winter nights, where there is an absence of cloud cover. Consequently, the inversions “lock” the pollutants near the surface. As the sun causes the cool air layer close to the ground to warm up, vertical mixing and horizontal transport disperse the air pollutants. In the early evening, the low level air inversion begins to form again and often coincides with the evening traffic rush hour.
Pima County 2018 Ambient Air Monitoring Network Plan
10
Definition of Monitoring Objectives, Site Types and Spatial Scales The Pima County ambient air monitoring network is designed to meet three basic monitoring objectives. These objectives listed in Appendix D, 1.1 of 40 CFR Part 58 are:
1. To provide air pollution data to the general public in a timely manner; 2. To comply with ambient air quality protocols and standards in order for data to be used for
comparison to the NAAQS; 3. To support research studies.
The monitoring stations which comprise the Pima County network are designed to meet at least one of six basic monitoring site types. As listed in Appendix D, 1.1.1 of 40 CFR Part 58, the site types:
1. Determine the area of highest concentrations expected to occur in the network; 2. Determine representative concentrations in areas of high population density; 3. Determine the impact on ambient pollution levels of significant sources or source categories; 4. Determine general background concentration levels; 5. Determine the extent of regional pollution transport among populated areas; 6. Determine the welfare – related impact in more rural and remote areas.
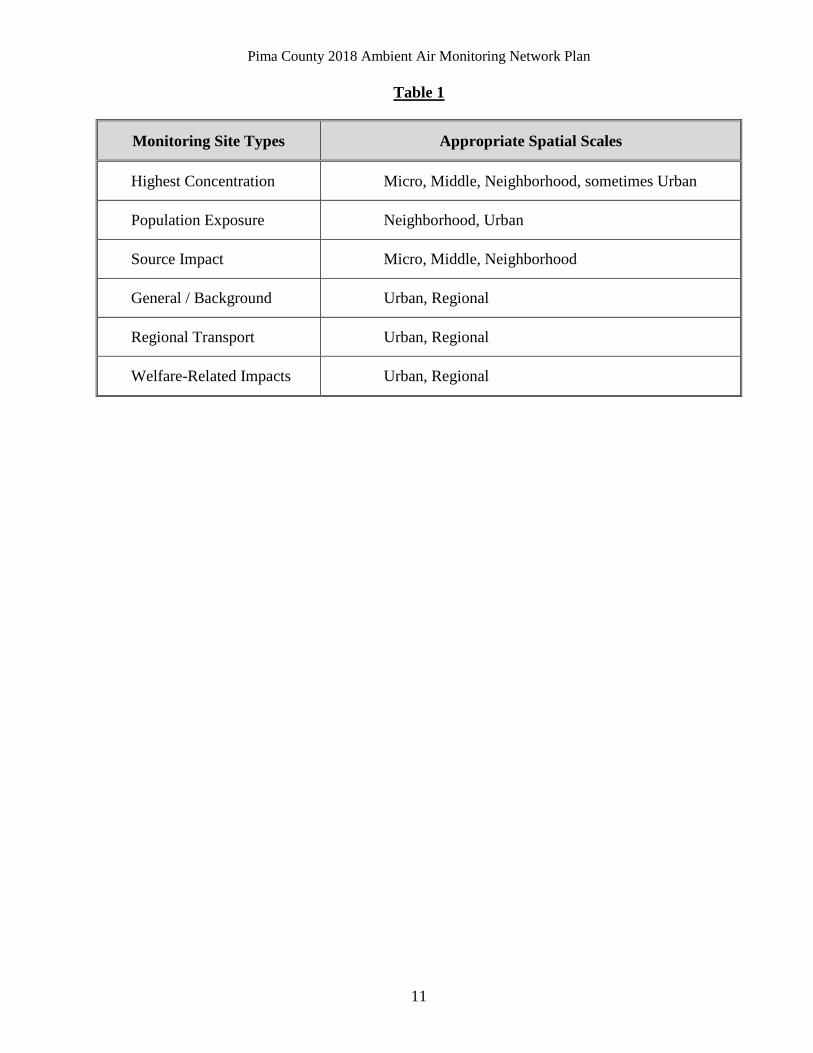
The link between general monitoring objectives, site types and the geographical location of a monitoring station is defined as the spatial scale of representativeness, and the relationship is indicated in Table 1 (next page). The goal of each station is to represent a specific air parcel throughout which actual pollution concentrations are reasonably homogeneous. The spatial scales are defined in Appendix D, 1.2 of 40 CFR Part 58 as follows:
1. Microscale defines concentrations in air volumes associated with area dimensions from 1
meter to 100 meters; 2. Middle Scale defines concentrations typical of areas from 100 meters to 500 meters; 3. Neighborhood Scale defines concentrations typical of areas with dimensions in the 0.5 to 4.0
kilometer range; 4. Urban Scale defines the overall, city – wide conditions with dimensions in the 4 to 50
kilometer range; 5. Regional Scale usually defines a rural area with dimensions as much as hundreds of
kilometers; 6. National and Global Scales represent concentrations which characterize nations and the
globe as a whole (Pima County does not employ stations under this category).
Pima County 2018 Ambient Air Monitoring Network Plan
11
Table 1
Monitoring Site Types Appropriate Spatial Scales
Highest Concentration Micro, Middle, Neighborhood, sometimes Urban
Population Exposure Neighborhood, Urban
Source Impact Micro, Middle, Neighborhood
General / Background Urban, Regional
Regional Transport Urban, Regional
Welfare-Related Impacts Urban, Regional
Pima County 2018 Ambient Air Monitoring Network Plan
12
Pima County 2018 Ambient Air Monitoring Network Plan
13
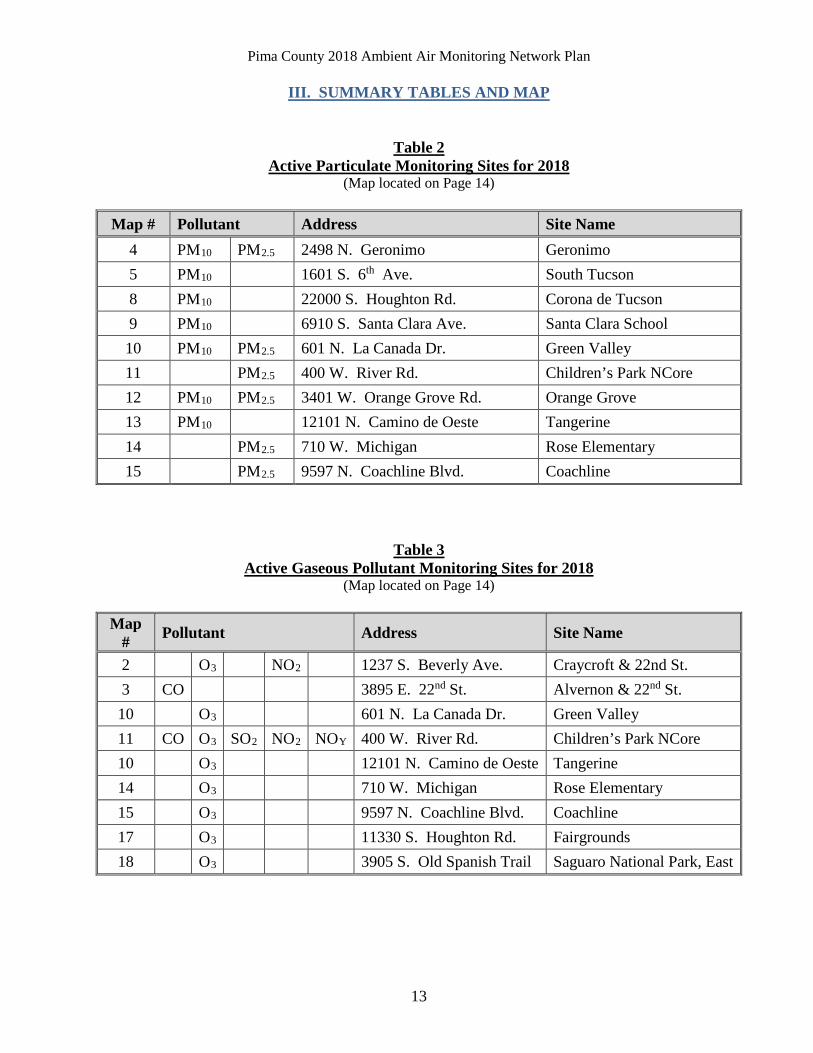
III. SUMMARY TABLES AND MAP
Table 2 Active Particulate Monitoring Sites for 2018
(Map located on Page 14)
Map # Pollutant Address Site Name 4 PM10 PM2.5 2498 N. Geronimo Geronimo 5 PM10 1601 S. 6th Ave. South Tucson 8 PM10 22000 S. Houghton Rd. Corona de Tucson 9 PM10 6910 S. Santa Clara Ave. Santa Clara School 10 PM10 PM2.5 601 N. La Canada Dr. Green Valley 11 PM2.5 400 W. River Rd. Children’s Park NCore 12 PM10 PM2.5 3401 W. Orange Grove Rd. Orange Grove 13 PM10 12101 N. Camino de Oeste Tangerine 14 PM2.5 710 W. Michigan Rose Elementary 15 PM2.5 9597 N. Coachline Blvd. Coachline
Table 3 Active Gaseous Pollutant Monitoring Sites for 2018
(Map located on Page 14)
Map # Pollutant Address Site Name
2 O3 NO2 1237 S. Beverly Ave. Craycroft & 22nd St. 3 CO 3895 E. 22nd St. Alvernon & 22nd St. 10 O3 601 N. La Canada Dr. Green Valley 11 CO O3 SO2 NO2 NOY 400 W. River Rd. Children’s Park NCore 10 O3 12101 N. Camino de Oeste Tangerine 14 O3 710 W. Michigan Rose Elementary 15 O3 9597 N. Coachline Blvd. Coachline 17 O3 11330 S. Houghton Rd. Fairgrounds 18 O3 3905 S. Old Spanish Trail Saguaro National Park, East
Pima County 2018 Ambient Air Monitoring Network Plan
14
Pima County 2018 Ambient Air Monitoring Network Plan
15
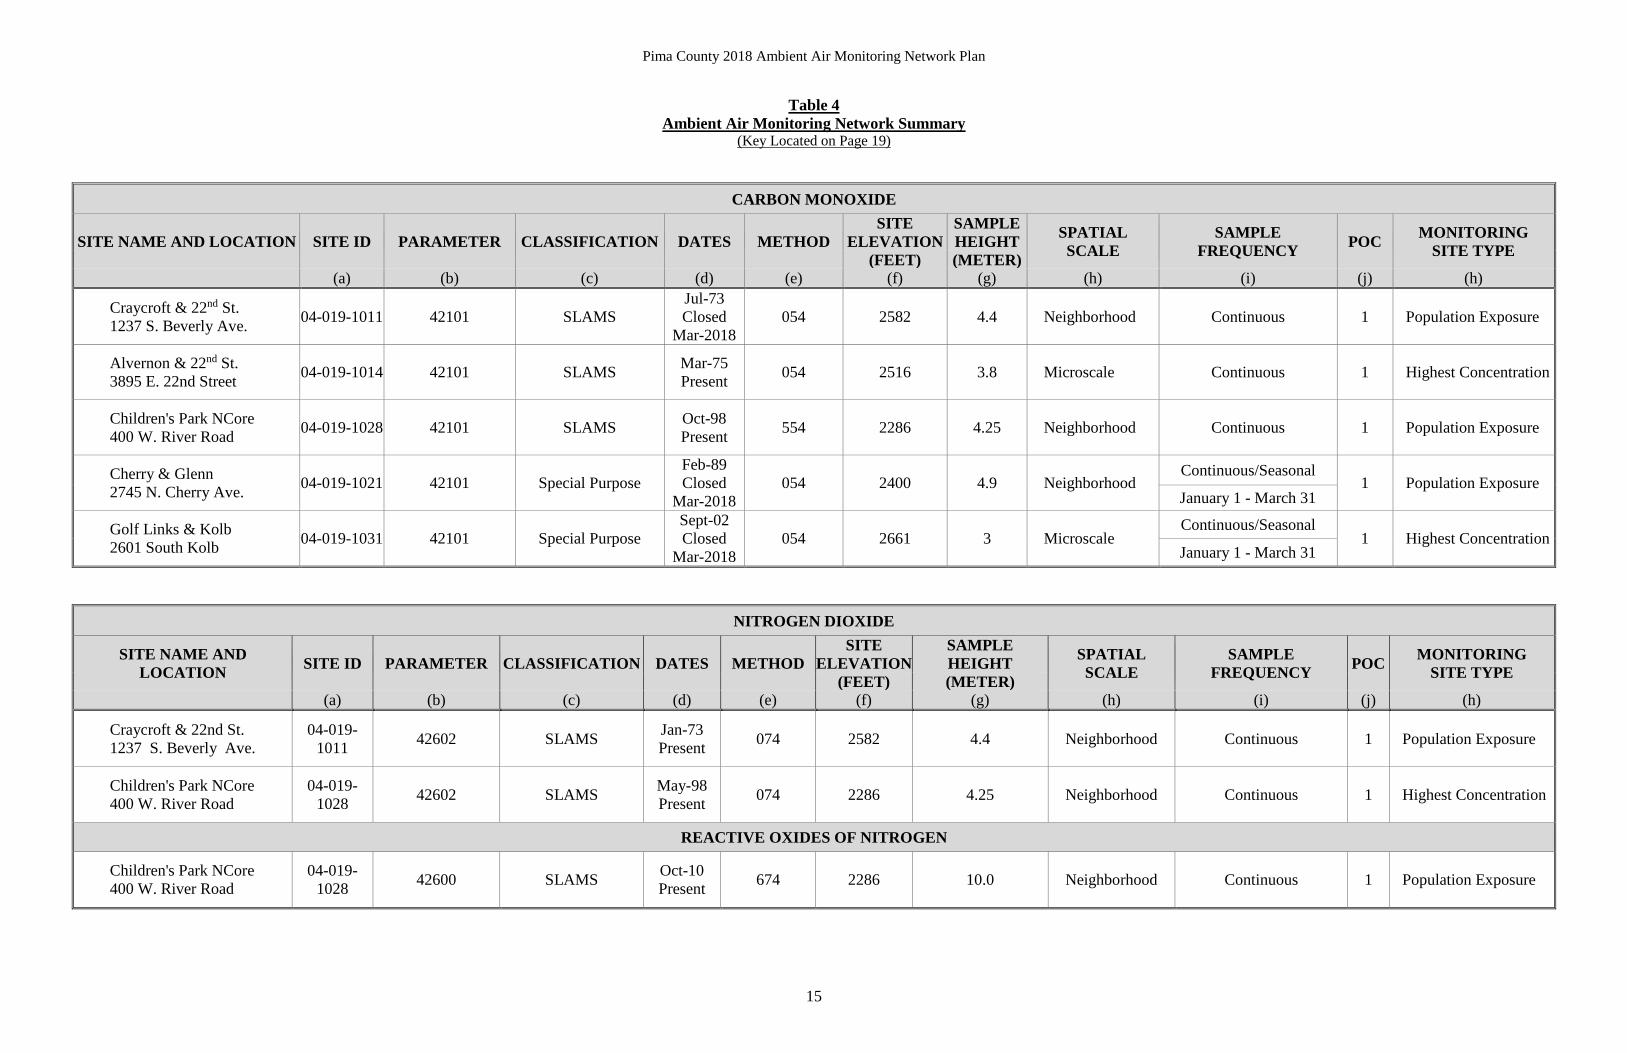
Table 4 Ambient Air Monitoring Network Summary
(Key Located on Page 19)
CARBON MONOXIDE
SITE NAME AND LOCATION SITE ID PARAMETER CLASSIFICATION DATES METHOD SITE
ELEVATION SAMPLE HEIGHT SPATIAL
SCALE SAMPLE
FREQUENCY POC MONITORING SITE TYPE (FEET) (METER)
(a) (b) (c) (d) (e) (f) (g) (h) (i) (j) (h)
Craycroft & 22nd St. 1237 S. Beverly Ave. 04-019-1011 42101 SLAMS
Jul-73 Closed
Mar-2018 054 2582 4.4 Neighborhood Continuous 1 Population Exposure
Alvernon & 22nd St. 3895 E. 22nd Street 04-019-1014 42101 SLAMS Mar-75
Present 054 2516 3.8 Microscale Continuous 1 Highest Concentration
Children's Park NCore 400 W. River Road 04-019-1028 42101 SLAMS Oct-98
Present 554 2286 4.25 Neighborhood Continuous 1 Population Exposure
Cherry & Glenn 2745 N. Cherry Ave. 04-019-1021 42101 Special Purpose
Feb-89 Closed
Mar-2018 054 2400 4.9 Neighborhood
Continuous/Seasonal 1 Population Exposure
January 1 - March 31
Golf Links & Kolb 2601 South Kolb 04-019-1031 42101 Special Purpose
Sept-02 Closed
Mar-2018 054 2661 3 Microscale
Continuous/Seasonal 1 Highest Concentration
January 1 - March 31
NITROGEN DIOXIDE
SITE NAME AND LOCATION SITE ID PARAMETER CLASSIFICATION DATES METHOD
SITE ELEVATION
SAMPLE HEIGHT SPATIAL
SCALE SAMPLE
FREQUENCY POC MONITORING SITE TYPE (FEET) (METER)
(a) (b) (c) (d) (e) (f) (g) (h) (i) (j) (h)
Craycroft & 22nd St. 1237 S. Beverly Ave.
04-019-1011 42602 SLAMS Jan-73
Present 074 2582 4.4 Neighborhood Continuous 1 Population Exposure
Children's Park NCore 400 W. River Road
04-019-1028 42602 SLAMS May-98
Present 074 2286 4.25 Neighborhood Continuous 1 Highest Concentration
REACTIVE OXIDES OF NITROGEN
Children's Park NCore 400 W. River Road
04-019-1028 42600 SLAMS Oct-10
Present 674 2286 10.0 Neighborhood Continuous 1 Population Exposure
Pima County 2018 Ambient Air Monitoring Network Plan
16
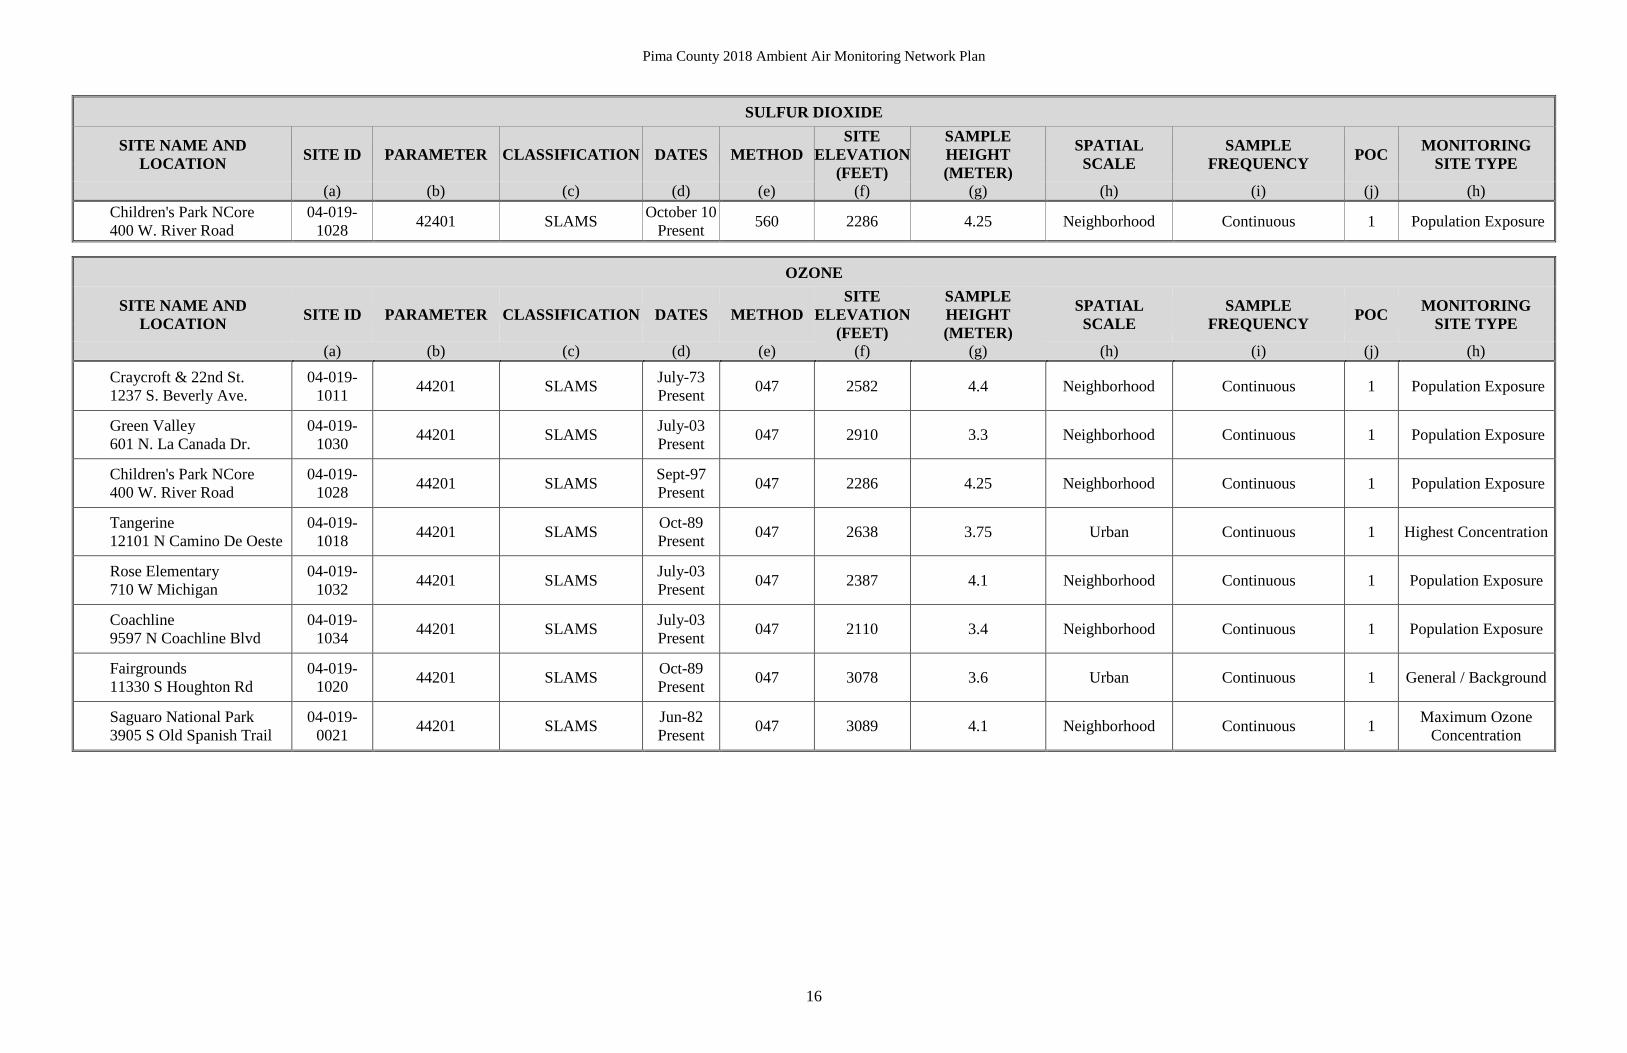
SULFUR DIOXIDE
SITE NAME AND LOCATION SITE ID PARAMETER CLASSIFICATION DATES METHOD
SITE ELEVATION
SAMPLE HEIGHT SPATIAL
SCALE SAMPLE
FREQUENCY POC MONITORING SITE TYPE (FEET) (METER)
(a) (b) (c) (d) (e) (f) (g) (h) (i) (j) (h) Children's Park NCore 400 W. River Road
04-019-1028 42401 SLAMS October 10
Present 560 2286 4.25 Neighborhood Continuous 1 Population Exposure
OZONE
SITE NAME AND LOCATION SITE ID PARAMETER CLASSIFICATION DATES METHOD
SITE ELEVATION
SAMPLE HEIGHT SPATIAL
SCALE SAMPLE
FREQUENCY POC MONITORING SITE TYPE (FEET) (METER)
(a) (b) (c) (d) (e) (f) (g) (h) (i) (j) (h) Craycroft & 22nd St. 1237 S. Beverly Ave.
04-019-1011 44201 SLAMS July-73
Present 047 2582 4.4 Neighborhood Continuous 1 Population Exposure
Green Valley 601 N. La Canada Dr.
04-019-1030 44201 SLAMS July-03
Present 047 2910 3.3 Neighborhood Continuous 1 Population Exposure
Children's Park NCore 400 W. River Road
04-019-1028 44201 SLAMS Sept-97
Present 047 2286 4.25 Neighborhood Continuous 1 Population Exposure
Tangerine 12101 N Camino De Oeste
04-019-1018 44201 SLAMS Oct-89
Present 047 2638 3.75 Urban Continuous 1 Highest Concentration
Rose Elementary 710 W Michigan
04-019-1032 44201 SLAMS July-03
Present 047 2387 4.1 Neighborhood Continuous 1 Population Exposure
Coachline 9597 N Coachline Blvd
04-019-1034 44201 SLAMS July-03
Present 047 2110 3.4 Neighborhood Continuous 1 Population Exposure
Fairgrounds 11330 S Houghton Rd
04-019-1020 44201 SLAMS Oct-89
Present 047 3078 3.6 Urban Continuous 1 General / Background
Saguaro National Park 3905 S Old Spanish Trail
04-019-0021 44201 SLAMS Jun-82
Present 047 3089 4.1 Neighborhood Continuous 1 Maximum Ozone Concentration
Pima County 2018 Ambient Air Monitoring Network Plan
17
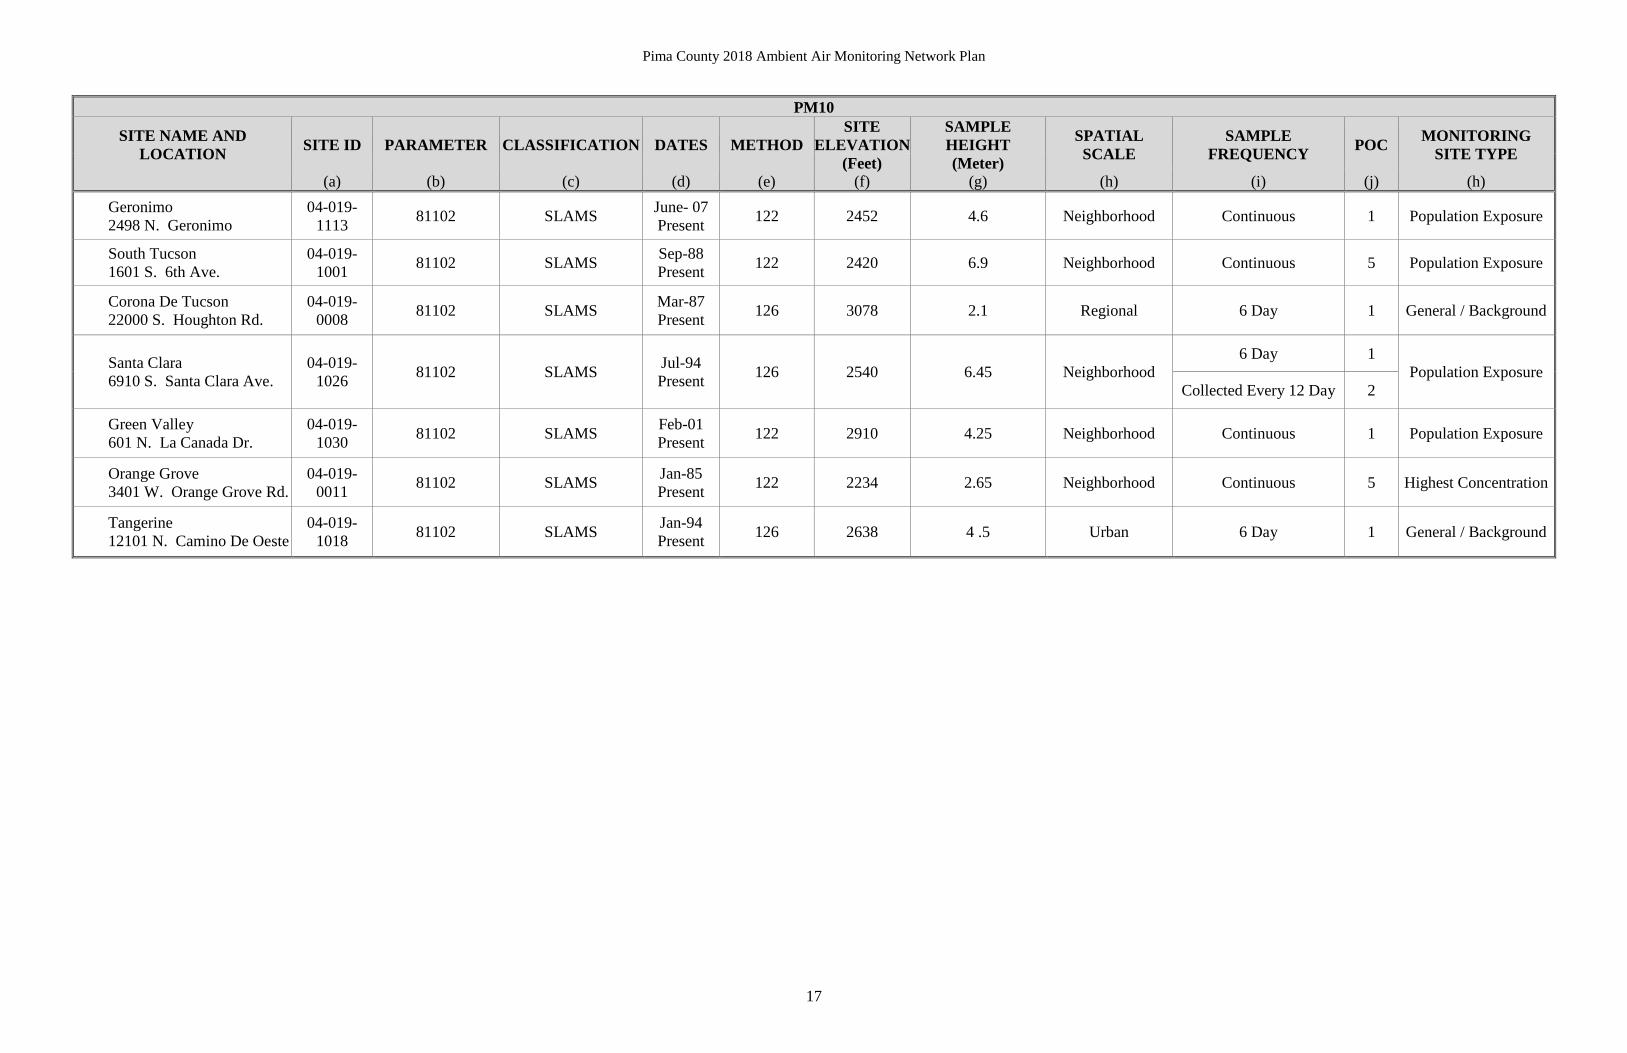
PM10
SITE NAME AND LOCATION SITE ID PARAMETER CLASSIFICATION DATES METHOD
SITE ELEVATION
SAMPLE HEIGHT SPATIAL
SCALE SAMPLE
FREQUENCY POC MONITORING SITE TYPE (Feet) (Meter)
(a) (b) (c) (d) (e) (f) (g) (h) (i) (j) (h) Geronimo 2498 N. Geronimo
04-019-1113 81102 SLAMS June- 07
Present 122 2452 4.6 Neighborhood Continuous 1 Population Exposure
South Tucson 1601 S. 6th Ave.
04-019-1001 81102 SLAMS Sep-88
Present 122 2420 6.9 Neighborhood Continuous 5 Population Exposure
Corona De Tucson 22000 S. Houghton Rd.
04-019-0008 81102 SLAMS Mar-87
Present 126 3078 2.1 Regional 6 Day 1 General / Background
Santa Clara 6910 S. Santa Clara Ave.
04-019-1026 81102 SLAMS Jul-94
Present 126 2540 6.45 Neighborhood 6 Day 1
Population Exposure Collected Every 12 Day 2
Green Valley 601 N. La Canada Dr.
04-019-1030 81102 SLAMS Feb-01
Present 122 2910 4.25 Neighborhood Continuous 1 Population Exposure
Orange Grove 3401 W. Orange Grove Rd.
04-019-0011 81102 SLAMS Jan-85
Present 122 2234 2.65 Neighborhood Continuous 5 Highest Concentration
Tangerine 12101 N. Camino De Oeste
04-019-1018 81102 SLAMS Jan-94
Present 126 2638 4 .5 Urban 6 Day 1 General / Background
Pima County 2018 Ambient Air Monitoring Network Plan
18
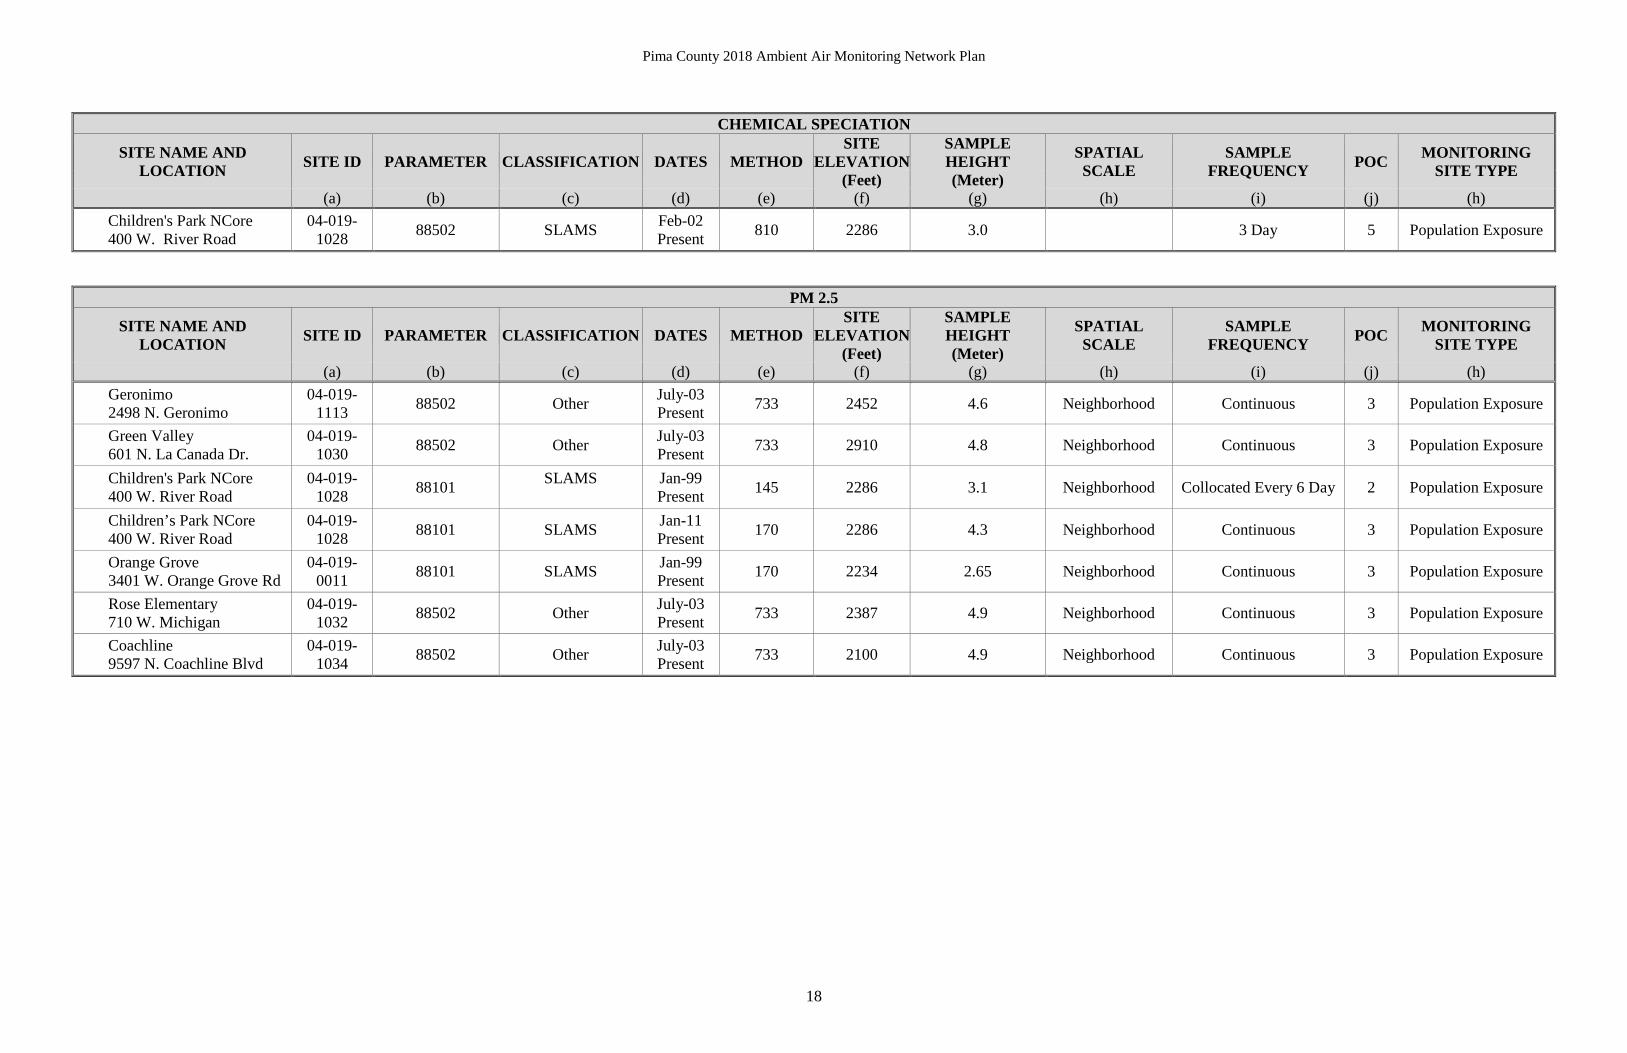
CHEMICAL SPECIATION
SITE NAME AND LOCATION SITE ID PARAMETER CLASSIFICATION DATES METHOD
SITE ELEVATION
SAMPLE HEIGHT SPATIAL
SCALE SAMPLE
FREQUENCY POC MONITORING SITE TYPE (Feet) (Meter)
(a) (b) (c) (d) (e) (f) (g) (h) (i) (j) (h) Children's Park NCore 400 W. River Road
04-019-1028 88502 SLAMS Feb-02
Present 810 2286 3.0 3 Day 5 Population Exposure
PM 2.5
SITE NAME AND LOCATION SITE ID PARAMETER CLASSIFICATION DATES METHOD
SITE ELEVATION
SAMPLE HEIGHT SPATIAL
SCALE SAMPLE
FREQUENCY POC MONITORING SITE TYPE (Feet) (Meter)
(a) (b) (c) (d) (e) (f) (g) (h) (i) (j) (h) Geronimo 2498 N. Geronimo
04-019-1113 88502 Other July-03
Present 733 2452 4.6 Neighborhood Continuous 3 Population Exposure
Green Valley 601 N. La Canada Dr.
04-019-1030 88502 Other July-03
Present 733 2910 4.8 Neighborhood Continuous 3 Population Exposure
Children's Park NCore 400 W. River Road
04-019-1028 88101 SLAMS
Jan-99 Present 145 2286 3.1 Neighborhood Collocated Every 6 Day 2 Population Exposure
Children’s Park NCore 400 W. River Road
04-019-1028 88101 SLAMS Jan-11
Present 170 2286 4.3 Neighborhood Continuous 3 Population Exposure
Orange Grove 3401 W. Orange Grove Rd
04-019-0011 88101 SLAMS Jan-99
Present 170 2234 2.65 Neighborhood Continuous 3 Population Exposure
Rose Elementary 710 W. Michigan
04-019-1032 88502 Other July-03
Present 733 2387 4.9 Neighborhood Continuous 3 Population Exposure
Coachline 9597 N. Coachline Blvd
04-019-1034 88502 Other July-03
Present 733 2100 4.9 Neighborhood Continuous 3 Population Exposure
Pima County 2018 Ambient Air Monitoring Network Plan
19
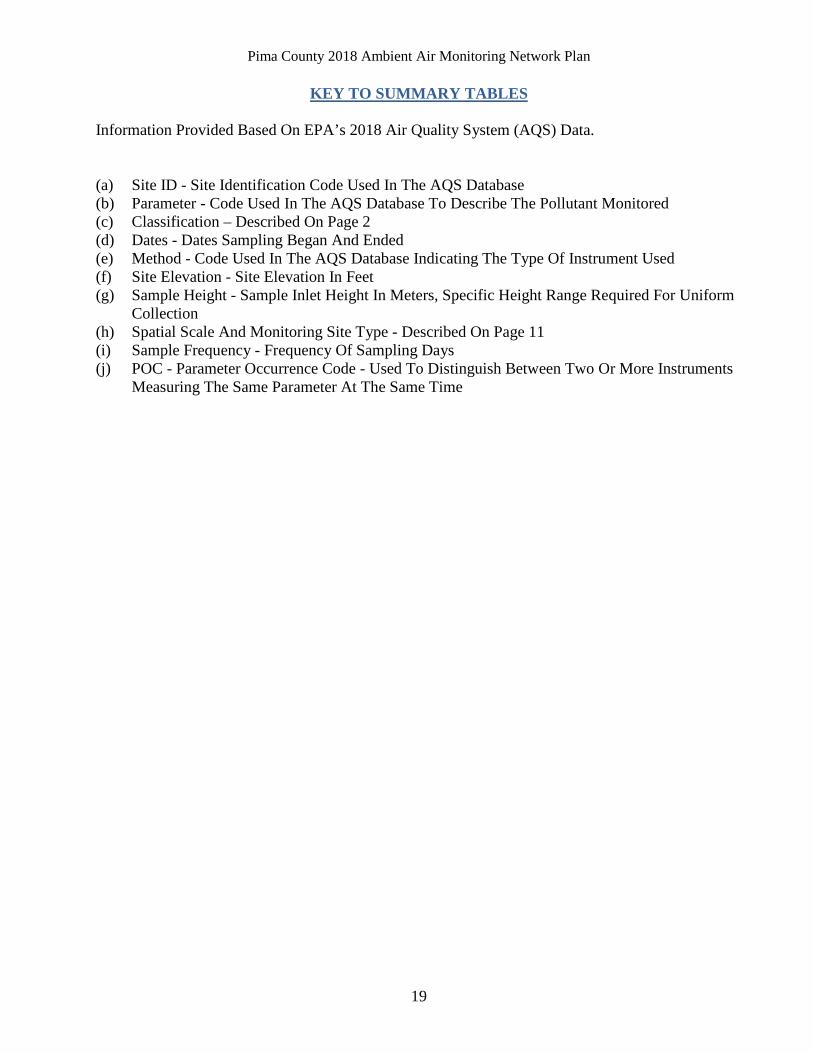
KEY TO SUMMARY TABLES Information Provided Based On EPA’s 2018 Air Quality System (AQS) Data. (a) Site ID - Site Identification Code Used In The AQS Database (b) Parameter - Code Used In The AQS Database To Describe The Pollutant Monitored (c) Classification – Described On Page 2 (d) Dates - Dates Sampling Began And Ended (e) Method - Code Used In The AQS Database Indicating The Type Of Instrument Used (f) Site Elevation - Site Elevation In Feet (g) Sample Height - Sample Inlet Height In Meters, Specific Height Range Required For Uniform
Collection (h) Spatial Scale And Monitoring Site Type - Described On Page 11 (i) Sample Frequency - Frequency Of Sampling Days (j) POC - Parameter Occurrence Code - Used To Distinguish Between Two Or More Instruments
Measuring The Same Parameter At The Same Time
Pima County 2018 Ambient Air Monitoring Network Plan
20
IV. CURRENT MONITORING NETWORK EVALUATIONS
PM10 MONITORING NETWORK REQUIREMENTS
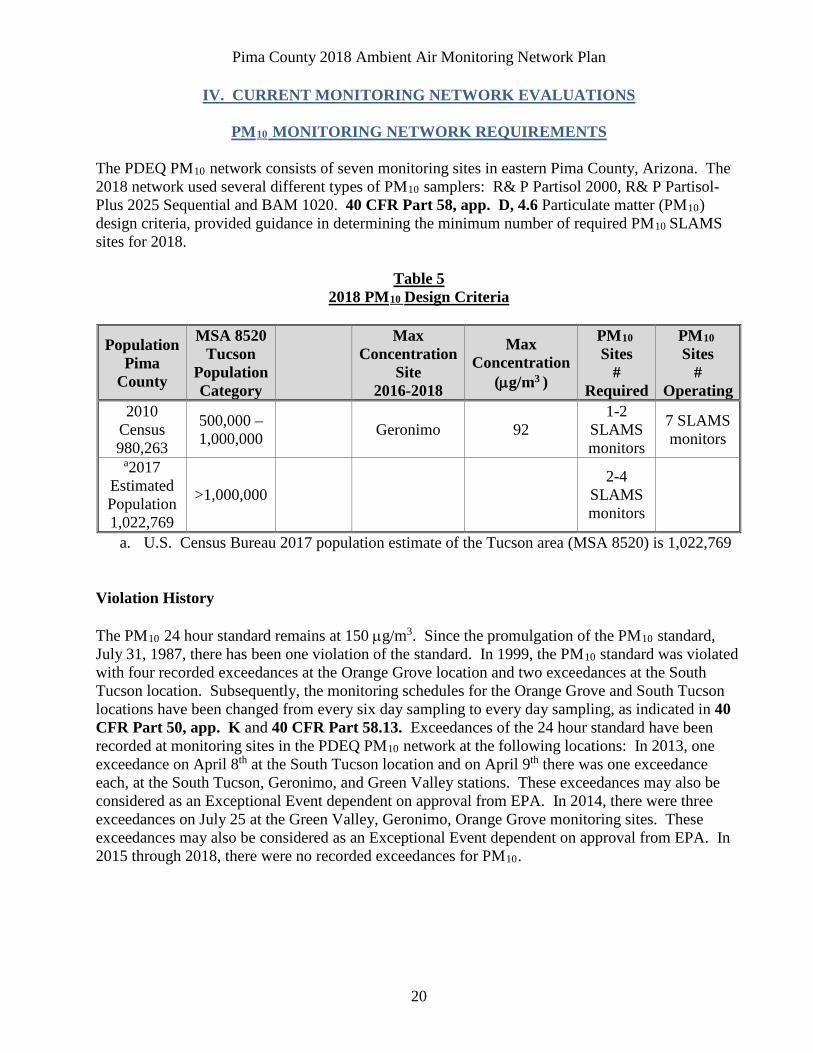
The PDEQ PM10 network consists of seven monitoring sites in eastern Pima County, Arizona. The 2018 network used several different types of PM10 samplers: R& P Partisol 2000, R& P Partisol-Plus 2025 Sequential and BAM 1020. 40 CFR Part 58, app. D, 4.6 Particulate matter (PM10) design criteria, provided guidance in determining the minimum number of required PM10 SLAMS sites for 2018.
Table 5
2018 PM10 Design Criteria
Population Pima
County
MSA 8520 Tucson
Population Category
Max Concentration
Site 2016-2018
Max Concentration
(µg/m3 )
PM10 Sites
# Required
PM10 Sites
# Operating
2010 Census 980,263
500,000 – 1,000,000
Geronimo 92
1-2 SLAMS monitors
7 SLAMS monitors
a2017 Estimated Population 1,022,769
>1,000,000
2-4
SLAMS monitors
a. U.S. Census Bureau 2017 population estimate of the Tucson area (MSA 8520) is 1,022,769 Violation History The PM10 24 hour standard remains at 150 µg/m3. Since the promulgation of the PM10 standard, July 31, 1987, there has been one violation of the standard. In 1999, the PM10 standard was violated with four recorded exceedances at the Orange Grove location and two exceedances at the South Tucson location. Subsequently, the monitoring schedules for the Orange Grove and South Tucson locations have been changed from every six day sampling to every day sampling, as indicated in 40 CFR Part 50, app. K and 40 CFR Part 58.13. Exceedances of the 24 hour standard have been recorded at monitoring sites in the PDEQ PM10 network at the following locations: In 2013, one exceedance on April 8th at the South Tucson location and on April 9th there was one exceedance each, at the South Tucson, Geronimo, and Green Valley stations. These exceedances may also be considered as an Exceptional Event dependent on approval from EPA. In 2014, there were three exceedances on July 25 at the Green Valley, Geronimo, Orange Grove monitoring sites. These exceedances may also be considered as an Exceptional Event dependent on approval from EPA. In 2015 through 2018, there were no recorded exceedances for PM10.
Pima County 2018 Ambient Air Monitoring Network Plan
21
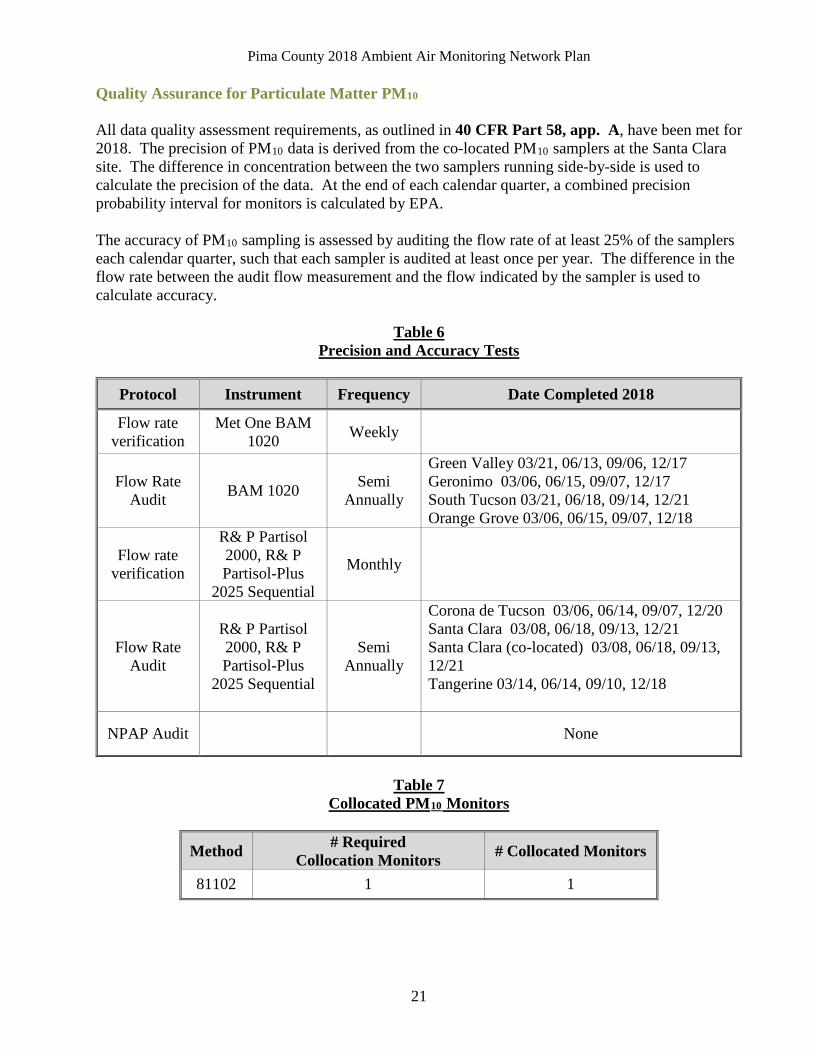
Quality Assurance for Particulate Matter PM10 All data quality assessment requirements, as outlined in 40 CFR Part 58, app. A, have been met for 2018. The precision of PM10 data is derived from the co-located PM10 samplers at the Santa Clara site. The difference in concentration between the two samplers running side-by-side is used to calculate the precision of the data. At the end of each calendar quarter, a combined precision probability interval for monitors is calculated by EPA. The accuracy of PM10 sampling is assessed by auditing the flow rate of at least 25% of the samplers each calendar quarter, such that each sampler is audited at least once per year. The difference in the flow rate between the audit flow measurement and the flow indicated by the sampler is used to calculate accuracy.
Table 6 Precision and Accuracy Tests
Protocol Instrument Frequency Date Completed 2018
Flow rate verification
Met One BAM 1020 Weekly
Flow Rate Audit BAM 1020 Semi
Annually
Green Valley 03/21, 06/13, 09/06, 12/17 Geronimo 03/06, 06/15, 09/07, 12/17 South Tucson 03/21, 06/18, 09/14, 12/21 Orange Grove 03/06, 06/15, 09/07, 12/18
Flow rate verification
R& P Partisol 2000, R& P Partisol-Plus
2025 Sequential
Monthly
Flow Rate Audit
R& P Partisol 2000, R& P Partisol-Plus
2025 Sequential
Semi Annually
Corona de Tucson 03/06, 06/14, 09/07, 12/20 Santa Clara 03/08, 06/18, 09/13, 12/21 Santa Clara (co-located) 03/08, 06/18, 09/13, 12/21 Tangerine 03/14, 06/14, 09/10, 12/18
NPAP Audit None
Table 7
Collocated PM10 Monitors
Method # Required Collocation Monitors # Collocated Monitors
81102 1 1
Pima County 2018 Ambient Air Monitoring Network Plan
22
Table 8 2018 Annual Summary Statistics
(NAAQS: 150 µg/m3 24- Hour Average)
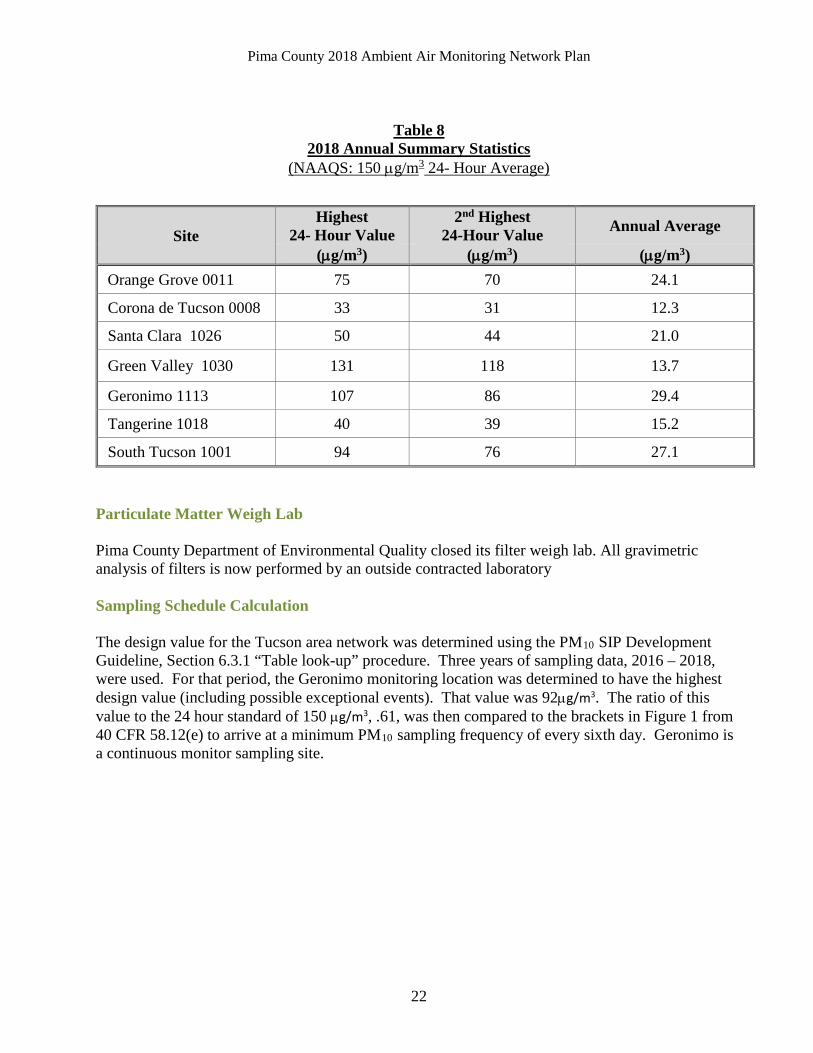
Particulate Matter Weigh Lab Pima County Department of Environmental Quality closed its filter weigh lab. All gravimetric analysis of filters is now performed by an outside contracted laboratory Sampling Schedule Calculation The design value for the Tucson area network was determined using the PM10 SIP Development Guideline, Section 6.3.1 “Table look-up” procedure. Three years of sampling data, 2016 – 2018, were used. For that period, the Geronimo monitoring location was determined to have the highest design value (including possible exceptional events). That value was 92µg/m3. The ratio of this value to the 24 hour standard of 150 µg/m3, .61, was then compared to the brackets in Figure 1 from 40 CFR 58.12(e) to arrive at a minimum PM10 sampling frequency of every sixth day. Geronimo is a continuous monitor sampling site.
Site Highest
24- Hour Value 2nd Highest
24-Hour Value Annual Average
(µg/m3) (µg/m3) (µg/m3) Orange Grove 0011 75 70 24.1
Corona de Tucson 0008 33 31 12.3
Santa Clara 1026 50 44 21.0
Green Valley 1030 131 118 13.7
Geronimo 1113 107 86 29.4
Tangerine 1018 40 39 15.2
South Tucson 1001 94 76 27.1
Pima County 2018 Ambient Air Monitoring Network Plan
23
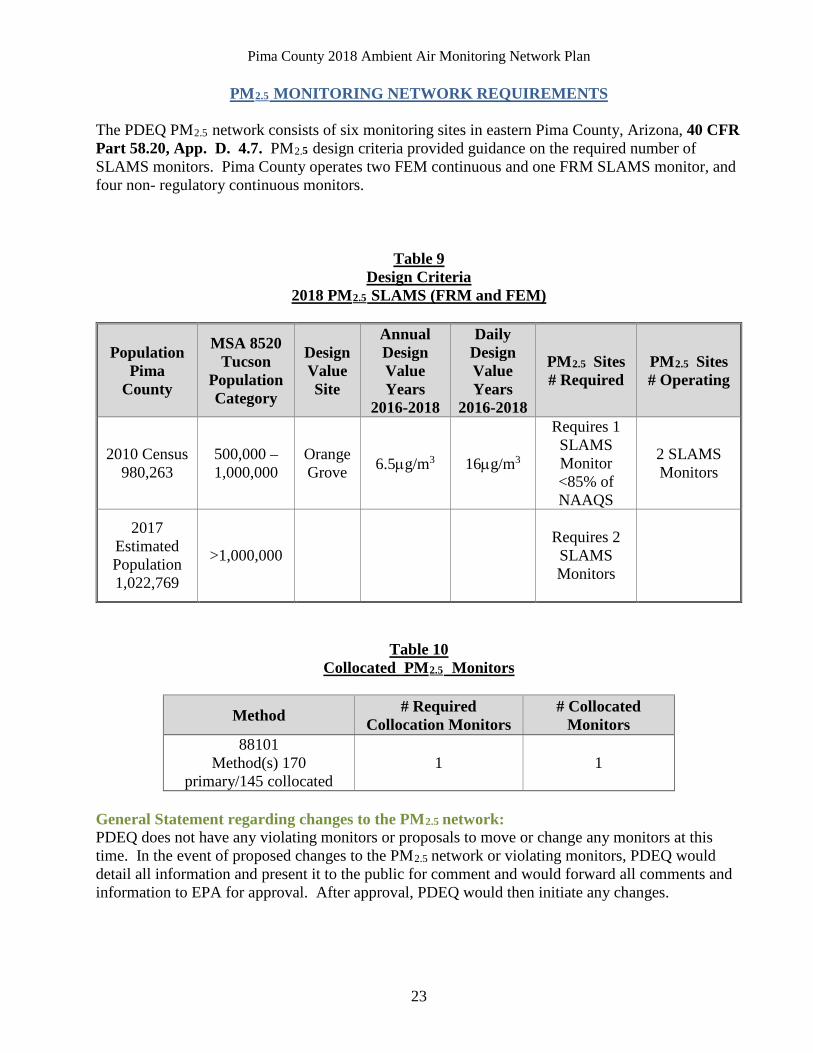
PM2.5 MONITORING NETWORK REQUIREMENTS The PDEQ PM2.5 network consists of six monitoring sites in eastern Pima County, Arizona, 40 CFR Part 58.20, App. D. 4.7. PM2.5 design criteria provided guidance on the required number of SLAMS monitors. Pima County operates two FEM continuous and one FRM SLAMS monitor, and four non- regulatory continuous monitors.
Table 9
Design Criteria 2018 PM2.5 SLAMS (FRM and FEM)
Population Pima
County
MSA 8520 Tucson
Population Category
Design Value Site
Annual Design Value Years
2016-2018
Daily Design Value Years
2016-2018
PM2.5 Sites # Required
PM2.5 Sites # Operating
2010 Census 980,263
500,000 – 1,000,000
Orange Grove 6.5µg/m3 16µg/m3
Requires 1 SLAMS Monitor <85% of NAAQS
2 SLAMS Monitors
2017 Estimated Population 1,022,769
>1,000,000 Requires 2 SLAMS Monitors
Table 10 Collocated PM2.5 Monitors
Method # Required Collocation Monitors
# Collocated Monitors
88101 Method(s) 170
primary/145 collocated 1 1
General Statement regarding changes to the PM2.5 network: PDEQ does not have any violating monitors or proposals to move or change any monitors at this time. In the event of proposed changes to the PM2.5 network or violating monitors, PDEQ would detail all information and present it to the public for comment and would forward all comments and information to EPA for approval. After approval, PDEQ would then initiate any changes.
Pima County 2018 Ambient Air Monitoring Network Plan
24
Regional Transport or Background: ADEQ operates an FEM monitor at their Alamo Lake site for regional background, and an FEM monitor at their Yuma Supersite for regional transport. The PDEQ SLAMS FRM monitor is a filter-based low-volume sampler located at the Children’s Park NCore site that collects a sample for 24 hours on a 1 in 6 day cycle for precision assessment. The PDEQ SLAMS FEM monitors at the Orange Grove an Children’s park locations collect samples on a continuous hourly basis. Continuous PM2.5 monitoring was initiated in May, 2000 at the Green Valley site using Beta Mass Attenuation (Met One BAM 1020) and a sharp-cut cyclone. This installation was a pilot project and was followed by similar installations at the Rose Elementary and Coachline monitoring sites. All three sites were a part of the EMPACT project (Environmental Monitoring for Public Access and Community Tracking), designed to provide near real-time data to the public via the internet and PDEQ web pages. A fourth monitor was added at the Geronimo site to provide fine particulate data for AQI reporting. These monitors provide automatic concentration measurement on an hourly basis, and output the reading to the site data logger, which is then polled every hour, and the data posted on the PDEQ website. The PM2.5 monitors at these four sites are operated as non-regulatory, intended only to provide information to the public. They are operated under the same Quality Control and Quality Assurance protocols as regulatory monitors to assure meaningful data are provided, but they are operated using alternative instrument settings (50 minute sample, 4 minute count time) that do not conform to FEM designation parameters for PM2.5. This setting does not compromise the accuracy of the readings, and is inherent in the original design and designation of all FEM PM10 BAM 1020 monitors. The data obtained by FRM, continuous, FEM and non-regulatory monitors in Tucson are submitted quarterly to the EPA’s Air Quality System (AQS) database. Pima County Department of Environmental Quality closed its filter weigh lab. All gravimetric analysis of filters is now performed by an outside contracted laboratory The PM2.5 Chemical Speciation Trends Network was established by EPA in 1999 to determine the chemical speciation of fine particulates. PM2.5 speciation monitoring began in Pima County at the Children’s Park NCore location in February, 2002. The samples are analyzed for forty eight elements, cations, nitrate, sulfate, organic and elemental carbon. Analysis and reporting are completed by University of California at Davis and Sonoma Technology Inc. Violation History The PM2.5 standard (December 14, 2012): the annual PM2.5 standard is met when the three year average of the spatially averaged annual mean is less than or equal to 12ug/m3 and the 24 hour standard is met when the three year average of the 98th percentile value at each site is less than or equal to 35ug/m3. No exceedances of the annual or 24 - hour NAAQS were recorded in Tucson in 2018.
Pima County 2018 Ambient Air Monitoring Network Plan
25
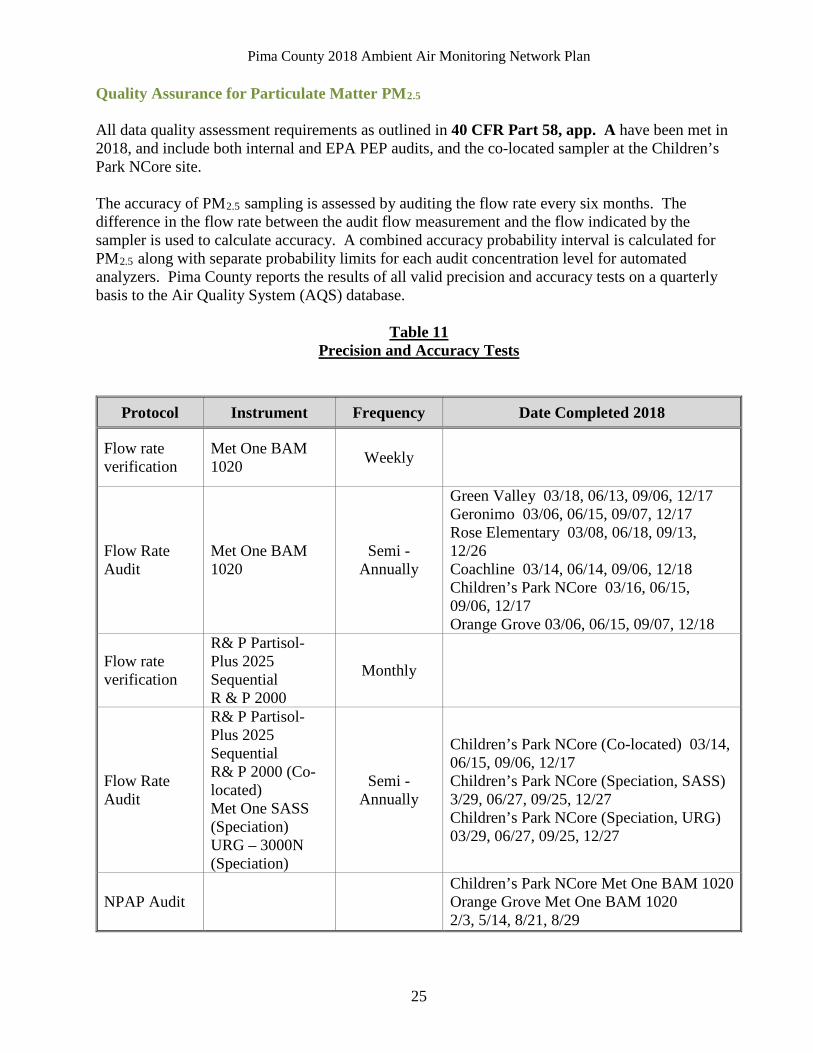
Quality Assurance for Particulate Matter PM2.5 All data quality assessment requirements as outlined in 40 CFR Part 58, app. A have been met in 2018, and include both internal and EPA PEP audits, and the co-located sampler at the Children’s Park NCore site. The accuracy of PM2.5 sampling is assessed by auditing the flow rate every six months. The difference in the flow rate between the audit flow measurement and the flow indicated by the sampler is used to calculate accuracy. A combined accuracy probability interval is calculated for PM2.5 along with separate probability limits for each audit concentration level for automated analyzers. Pima County reports the results of all valid precision and accuracy tests on a quarterly basis to the Air Quality System (AQS) database.
Table 11 Precision and Accuracy Tests
Protocol Instrument Frequency Date Completed 2018
Flow rate verification
Met One BAM 1020 Weekly
Flow Rate Audit
Met One BAM 1020
Semi - Annually
Green Valley 03/18, 06/13, 09/06, 12/17 Geronimo 03/06, 06/15, 09/07, 12/17 Rose Elementary 03/08, 06/18, 09/13, 12/26 Coachline 03/14, 06/14, 09/06, 12/18 Children’s Park NCore 03/16, 06/15, 09/06, 12/17 Orange Grove 03/06, 06/15, 09/07, 12/18
Flow rate verification
R& P Partisol-Plus 2025 Sequential R & P 2000
Monthly
Flow Rate Audit
R& P Partisol-Plus 2025 Sequential R& P 2000 (Co- located) Met One SASS (Speciation) URG – 3000N (Speciation)
Semi - Annually
Children’s Park NCore (Co-located) 03/14, 06/15, 09/06, 12/17 Children’s Park NCore (Speciation, SASS) 3/29, 06/27, 09/25, 12/27 Children’s Park NCore (Speciation, URG) 03/29, 06/27, 09/25, 12/27
NPAP Audit Children’s Park NCore Met One BAM 1020 Orange Grove Met One BAM 1020 2/3, 5/14, 8/21, 8/29
Pima County 2018 Ambient Air Monitoring Network Plan
26
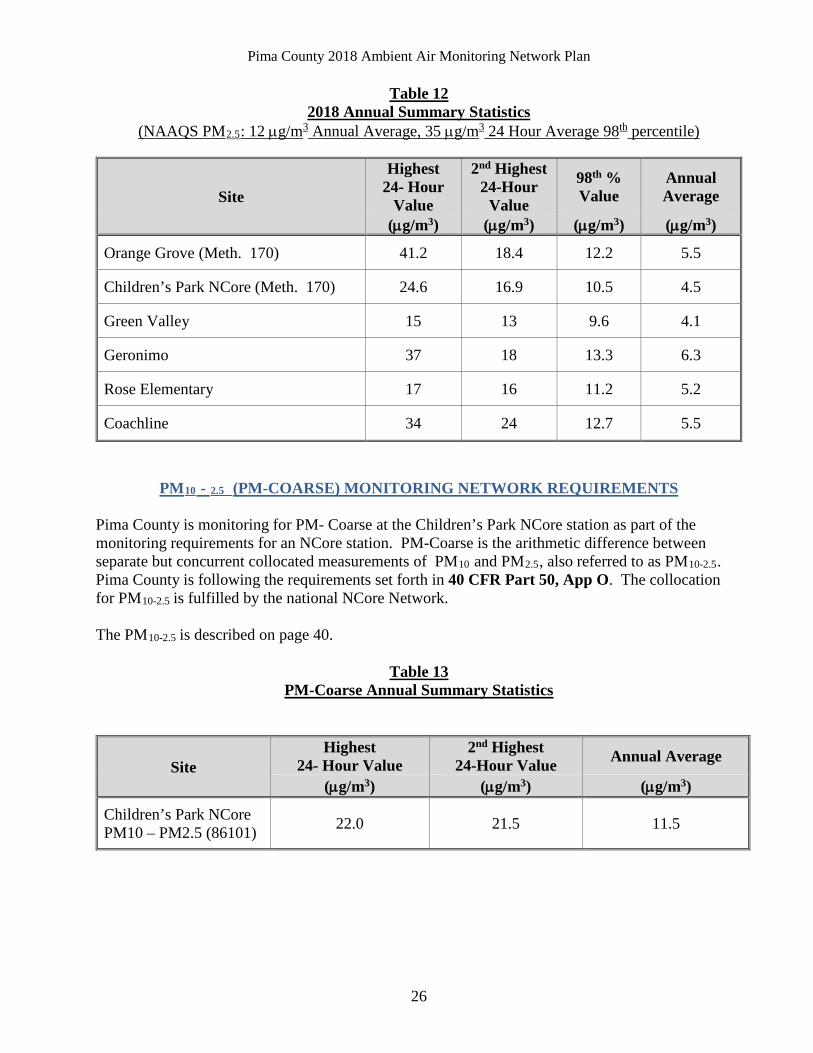
Table 12 2018 Annual Summary Statistics
(NAAQS PM2.5: 12 µg/m3 Annual Average, 35 µg/m3 24 Hour Average 98th percentile)
Site
Highest 24- Hour
Value
2nd Highest 24-Hour
Value
98th % Value
Annual Average
(µg/m3) (µg/m3) (µg/m3) (µg/m3)
Orange Grove (Meth. 170) 41.2 18.4 12.2 5.5
Children’s Park NCore (Meth. 170) 24.6 16.9 10.5 4.5
Green Valley 15 13 9.6 4.1
Geronimo 37 18 13.3 6.3
Rose Elementary 17 16 11.2 5.2
Coachline 34 24 12.7 5.5
PM10 - 2.5 (PM-COARSE) MONITORING NETWORK REQUIREMENTS Pima County is monitoring for PM- Coarse at the Children’s Park NCore station as part of the monitoring requirements for an NCore station. PM-Coarse is the arithmetic difference between separate but concurrent collocated measurements of PM10 and PM2.5, also referred to as PM10-2.5. Pima County is following the requirements set forth in 40 CFR Part 50, App O. The collocation for PM10-2.5 is fulfilled by the national NCore Network. The PM10-2.5 is described on page 40.
Table 13 PM-Coarse Annual Summary Statistics
Site Highest
24- Hour Value 2nd Highest
24-Hour Value Annual Average
(µg/m3) (µg/m3) (µg/m3)
Children’s Park NCore PM10 – PM2.5 (86101) 22.0 21.5 11.5
Pima County 2018 Ambient Air Monitoring Network Plan
27
OZONE (O3) MONITORING NETWORK REQUIREMENTS
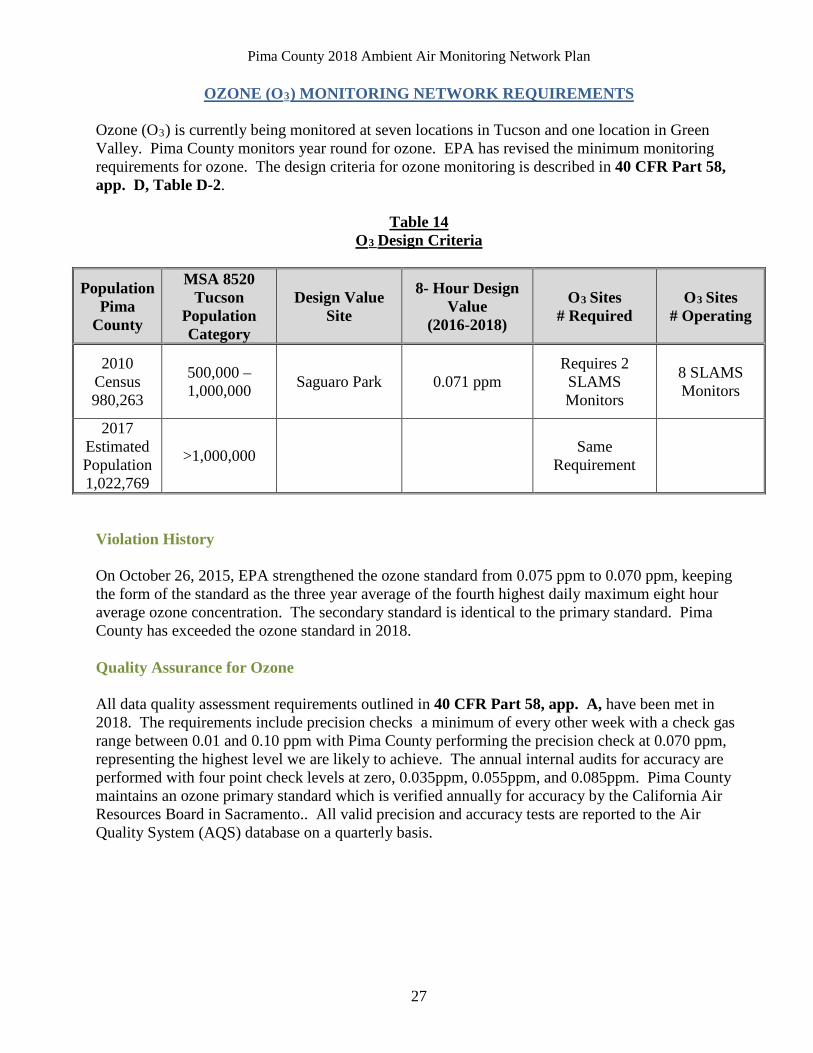
Ozone (O3) is currently being monitored at seven locations in Tucson and one location in Green Valley. Pima County monitors year round for ozone. EPA has revised the minimum monitoring requirements for ozone. The design criteria for ozone monitoring is described in 40 CFR Part 58, app. D, Table D-2.
Table 14 O3 Design Criteria
Population Pima
County
MSA 8520 Tucson
Population Category
Design Value Site
8- Hour Design Value
(2016-2018)
O3 Sites # Required
O3 Sites # Operating
2010 Census 980,263
500,000 – 1,000,000 Saguaro Park 0.071 ppm
Requires 2 SLAMS Monitors
8 SLAMS Monitors
2017 Estimated Population 1,022,769
>1,000,000 Same Requirement
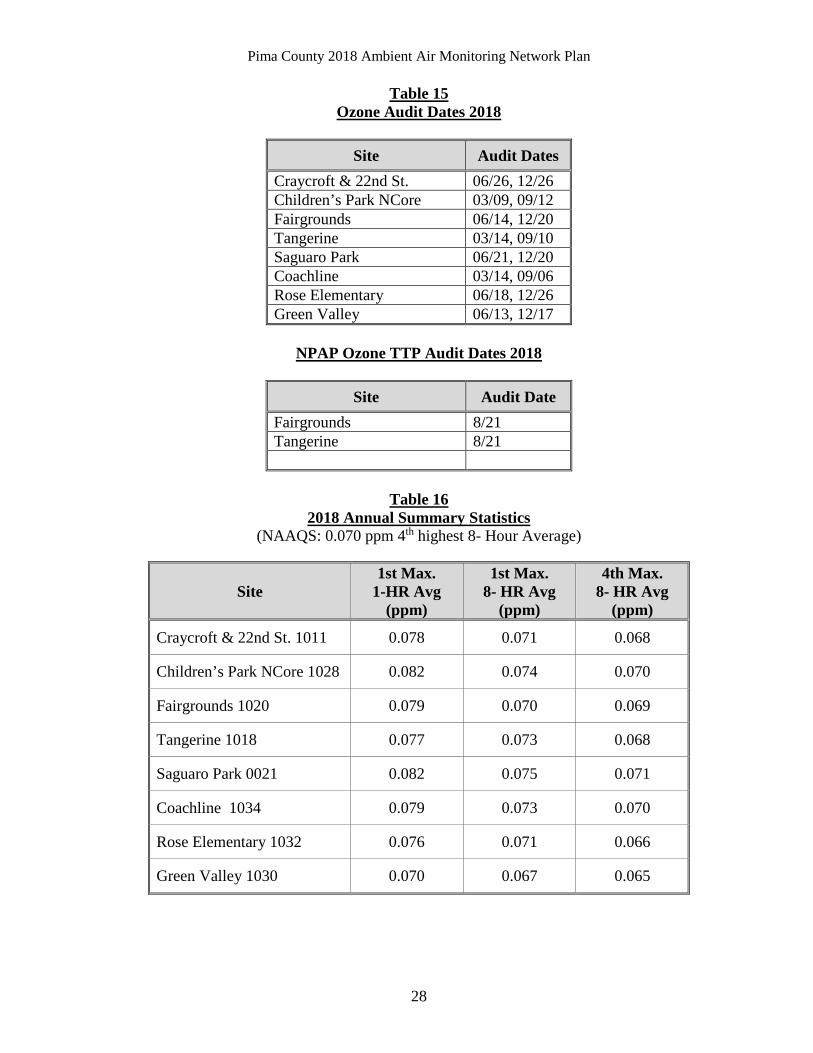
Violation History On October 26, 2015, EPA strengthened the ozone standard from 0.075 ppm to 0.070 ppm, keeping the form of the standard as the three year average of the fourth highest daily maximum eight hour average ozone concentration. The secondary standard is identical to the primary standard. Pima County has exceeded the ozone standard in 2018. Quality Assurance for Ozone All data quality assessment requirements outlined in 40 CFR Part 58, app. A, have been met in 2018. The requirements include precision checks a minimum of every other week with a check gas range between 0.01 and 0.10 ppm with Pima County performing the precision check at 0.070 ppm, representing the highest level we are likely to achieve. The annual internal audits for accuracy are performed with four point check levels at zero, 0.035ppm, 0.055ppm, and 0.085ppm. Pima County maintains an ozone primary standard which is verified annually for accuracy by the California Air Resources Board in Sacramento.. All valid precision and accuracy tests are reported to the Air Quality System (AQS) database on a quarterly basis.
Pima County 2018 Ambient Air Monitoring Network Plan
28
Table 15 Ozone Audit Dates 2018
Site Audit Dates
Craycroft & 22nd St. 06/26, 12/26 Children’s Park NCore 03/09, 09/12 Fairgrounds 06/14, 12/20 Tangerine 03/14, 09/10 Saguaro Park 06/21, 12/20 Coachline 03/14, 09/06 Rose Elementary 06/18, 12/26 Green Valley 06/13, 12/17
NPAP Ozone TTP Audit Dates 2018
Site Audit Date
Fairgrounds 8/21 Tangerine 8/21
Table 16
2018 Annual Summary Statistics (NAAQS: 0.070 ppm 4th highest 8- Hour Average)
Site 1st Max.
1-HR Avg (ppm)
1st Max. 8- HR Avg
(ppm)
4th Max. 8- HR Avg
(ppm)
Craycroft & 22nd St. 1011 0.078 0.071 0.068
Children’s Park NCore 1028 0.082 0.074 0.070
Fairgrounds 1020 0.079 0.070 0.069
Tangerine 1018 0.077 0.073 0.068
Saguaro Park 0021 0.082 0.075 0.071
Coachline 1034 0.079 0.073 0.070
Rose Elementary 1032 0.076 0.071 0.066
Green Valley 1030 0.070 0.067 0.065
Pima County 2018 Ambient Air Monitoring Network Plan
29
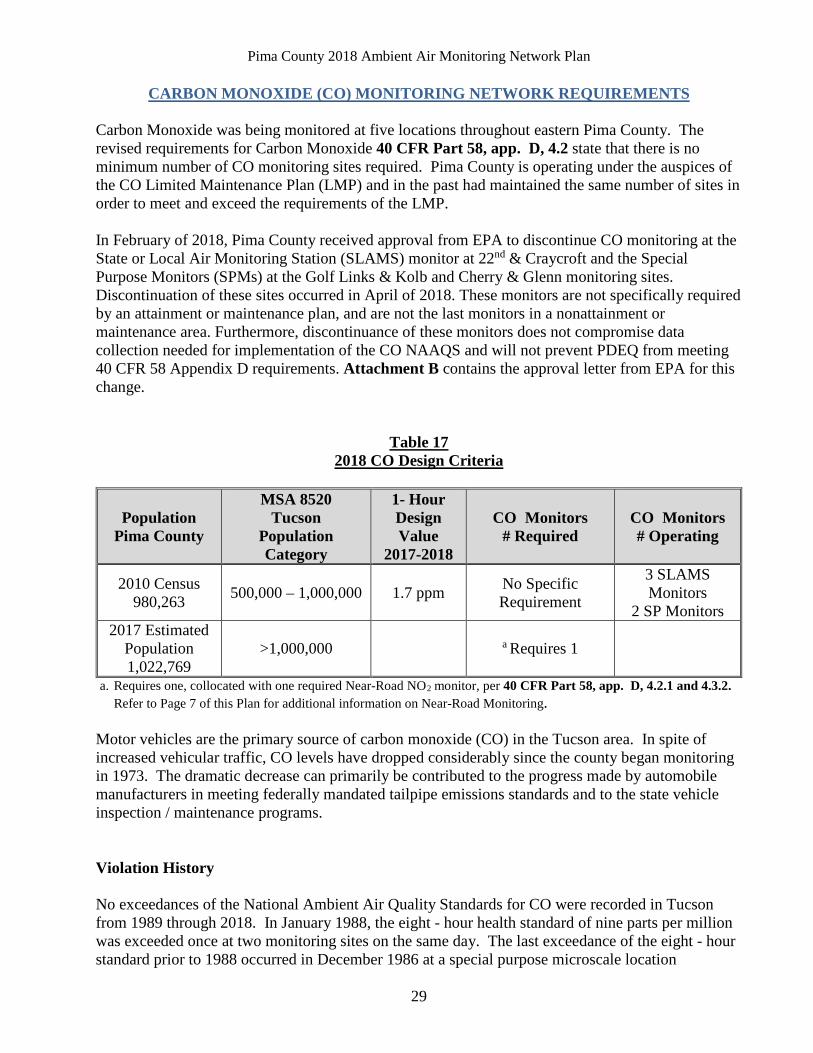
CARBON MONOXIDE (CO) MONITORING NETWORK REQUIREMENTS Carbon Monoxide was being monitored at five locations throughout eastern Pima County. The revised requirements for Carbon Monoxide 40 CFR Part 58, app. D, 4.2 state that there is no minimum number of CO monitoring sites required. Pima County is operating under the auspices of the CO Limited Maintenance Plan (LMP) and in the past had maintained the same number of sites in order to meet and exceed the requirements of the LMP. In February of 2018, Pima County received approval from EPA to discontinue CO monitoring at the State or Local Air Monitoring Station (SLAMS) monitor at 22nd & Craycroft and the Special Purpose Monitors (SPMs) at the Golf Links & Kolb and Cherry & Glenn monitoring sites. Discontinuation of these sites occurred in April of 2018. These monitors are not specifically required by an attainment or maintenance plan, and are not the last monitors in a nonattainment or maintenance area. Furthermore, discontinuance of these monitors does not compromise data collection needed for implementation of the CO NAAQS and will not prevent PDEQ from meeting 40 CFR 58 Appendix D requirements. Attachment B contains the approval letter from EPA for this change.
Table 17 2018 CO Design Criteria
Population Pima County
MSA 8520 Tucson
Population Category
1- Hour Design Value
2017-2018
CO Monitors # Required
CO Monitors # Operating
2010 Census 980,263 500,000 – 1,000,000 1.7 ppm No Specific
Requirement
3 SLAMS Monitors
2 SP Monitors 2017 Estimated
Population 1,022,769
>1,000,000 a Requires 1
a. Requires one, collocated with one required Near-Road NO2 monitor, per 40 CFR Part 58, app. D, 4.2.1 and 4.3.2. Refer to Page 7 of this Plan for additional information on Near-Road Monitoring.
Motor vehicles are the primary source of carbon monoxide (CO) in the Tucson area. In spite of increased vehicular traffic, CO levels have dropped considerably since the county began monitoring in 1973. The dramatic decrease can primarily be contributed to the progress made by automobile manufacturers in meeting federally mandated tailpipe emissions standards and to the state vehicle inspection / maintenance programs. Violation History No exceedances of the National Ambient Air Quality Standards for CO were recorded in Tucson from 1989 through 2018. In January 1988, the eight - hour health standard of nine parts per million was exceeded once at two monitoring sites on the same day. The last exceedance of the eight - hour standard prior to 1988 occurred in December 1986 at a special purpose microscale location
Pima County 2018 Ambient Air Monitoring Network Plan
30
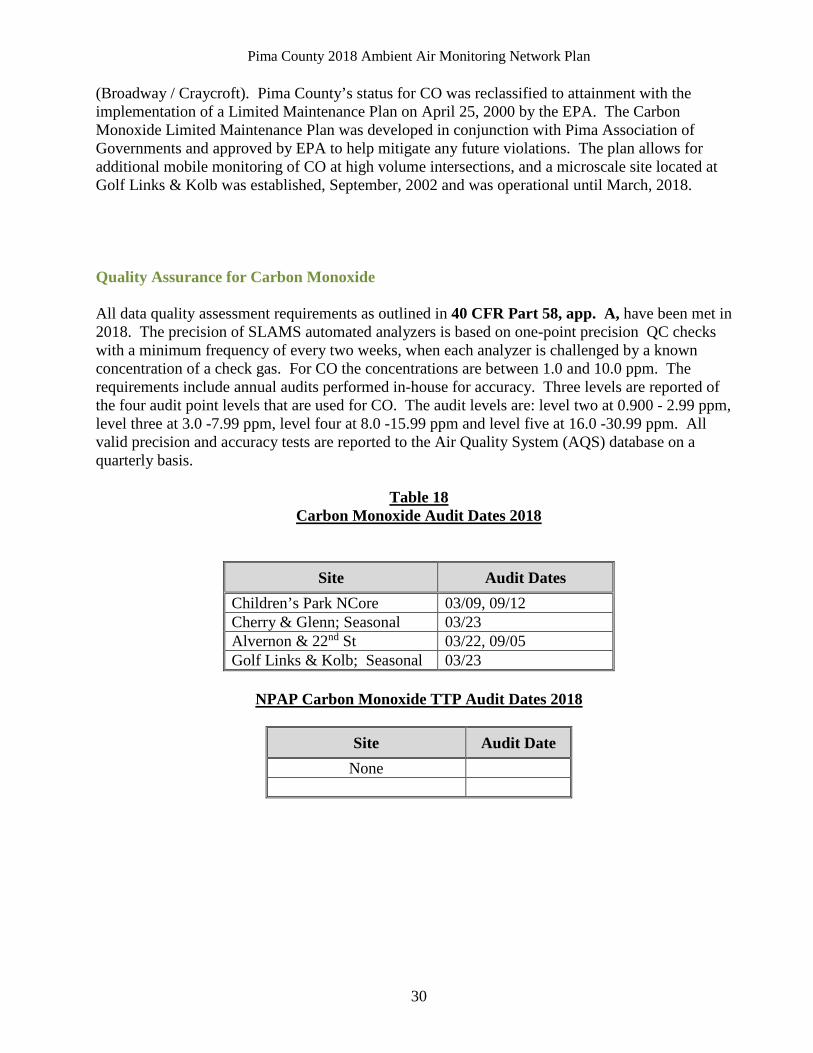
(Broadway / Craycroft). Pima County’s status for CO was reclassified to attainment with the implementation of a Limited Maintenance Plan on April 25, 2000 by the EPA. The Carbon Monoxide Limited Maintenance Plan was developed in conjunction with Pima Association of Governments and approved by EPA to help mitigate any future violations. The plan allows for additional mobile monitoring of CO at high volume intersections, and a microscale site located at Golf Links & Kolb was established, September, 2002 and was operational until March, 2018. Quality Assurance for Carbon Monoxide All data quality assessment requirements as outlined in 40 CFR Part 58, app. A, have been met in 2018. The precision of SLAMS automated analyzers is based on one-point precision QC checks with a minimum frequency of every two weeks, when each analyzer is challenged by a known concentration of a check gas. For CO the concentrations are between 1.0 and 10.0 ppm. The requirements include annual audits performed in-house for accuracy. Three levels are reported of the four audit point levels that are used for CO. The audit levels are: level two at 0.900 - 2.99 ppm, level three at 3.0 -7.99 ppm, level four at 8.0 -15.99 ppm and level five at 16.0 -30.99 ppm. All valid precision and accuracy tests are reported to the Air Quality System (AQS) database on a quarterly basis.
Table 18 Carbon Monoxide Audit Dates 2018
Site Audit Dates Children’s Park NCore 03/09, 09/12 Cherry & Glenn; Seasonal 03/23 Alvernon & 22nd St 03/22, 09/05 Golf Links & Kolb; Seasonal 03/23
NPAP Carbon Monoxide TTP Audit Dates 2018
Site Audit Date
None
Pima County 2018 Ambient Air Monitoring Network Plan
31
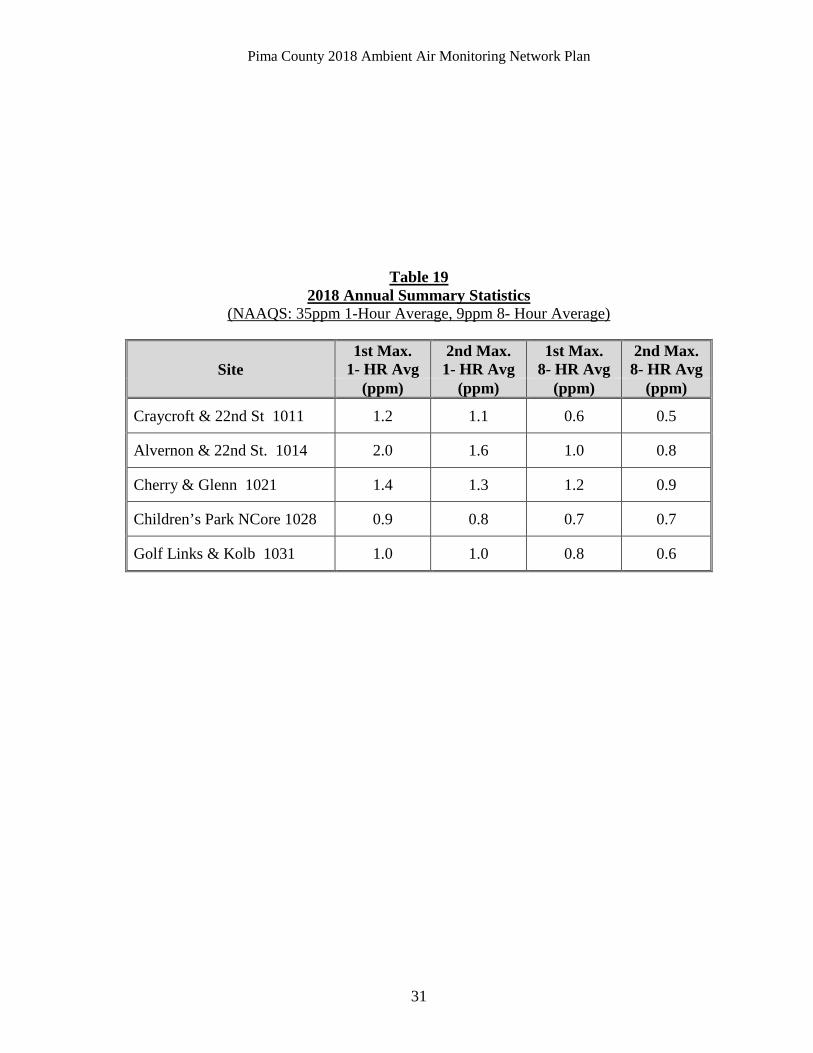
Table 19 2018 Annual Summary Statistics
(NAAQS: 35ppm 1-Hour Average, 9ppm 8- Hour Average)
Site 1st Max.
1- HR Avg 2nd Max. 1- HR Avg
1st Max. 8- HR Avg
2nd Max. 8- HR Avg
(ppm) (ppm) (ppm) (ppm)
Craycroft & 22nd St 1011 1.2 1.1 0.6 0.5
Alvernon & 22nd St. 1014 2.0 1.6 1.0 0.8
Cherry & Glenn 1021 1.4 1.3 1.2 0.9
Children’s Park NCore 1028 0.9 0.8 0.7 0.7
Golf Links & Kolb 1031 1.0 1.0 0.8 0.6

Pima County 2018 Ambient Air Monitoring Network Plan
32
NITROGEN DIOXIDE (NO2) MONITORING NETWORK REQUIREMENTS Nitrogen dioxide (NO2) is currently measured at two locations in Tucson. The Environmental Protection Agency has revised the NO2 requirements. The 40 CFR Part 58, app. D, 4.3, design criteria document states that there are no minimum requirements for the number of NO2 monitoring sites in Pima County.
Table 20
2018 NO2 Design Criteria
Population Pima County
MSA 8520 Tucson
Population Category
Annual Design Value
1- Hour 98th Percentile
Design Value
# of Required NO2 Monitors
# of NO2 Monitors
2010 Census 980,263
500,000 – 1,000,000 8.36 ppb 37 ppb No
Requirement 2 SLAMS monitors
2017 Estimated Population 1,022,769
>1,000,000
a Require 1 microscale
1 SLAMS microscale
monitor b Requires 1 area-wide
1 SLAMS area-wide monitor
a. Requires one microscale near-road NO2 monitor for populations over 1,000,000 per 40 CFR Part 58, app. D, 4.3.2.
b. Requires one area-wide NO2 monitor for populations greater than 1,000,000 per 40 CFR Part 58, app. D, 4.3.3(a). Historical Nitrogen Dioxide Monitoring Nitrogen dioxide (NO2) levels remain well below federal standards. The Craycroft and 22nd St. monitor has been operational since 1973, measuring typical neighborhood NO2 concentrations. Much of the data has been used in studies measuring the effects of NO2 as a precursor to ozone formation. A NO2 analyzer was operating at the Pomona site from 1988 until 1996, when the site was closed. The site was re-established at the Children’s Park location in May, 1998, one mile east of the original Pomona Site, and allows for continued monitoring on the north side of Tucson and in the lower valley area. A NO2 analyzer was operating at the Downtown site until early 1989. From 1995 to December 2001, NO2 monitoring was conducted at Saguaro National Park East to establish baseline conditions in a Class I Wilderness Area.
Pima County 2018 Ambient Air Monitoring Network Plan
33
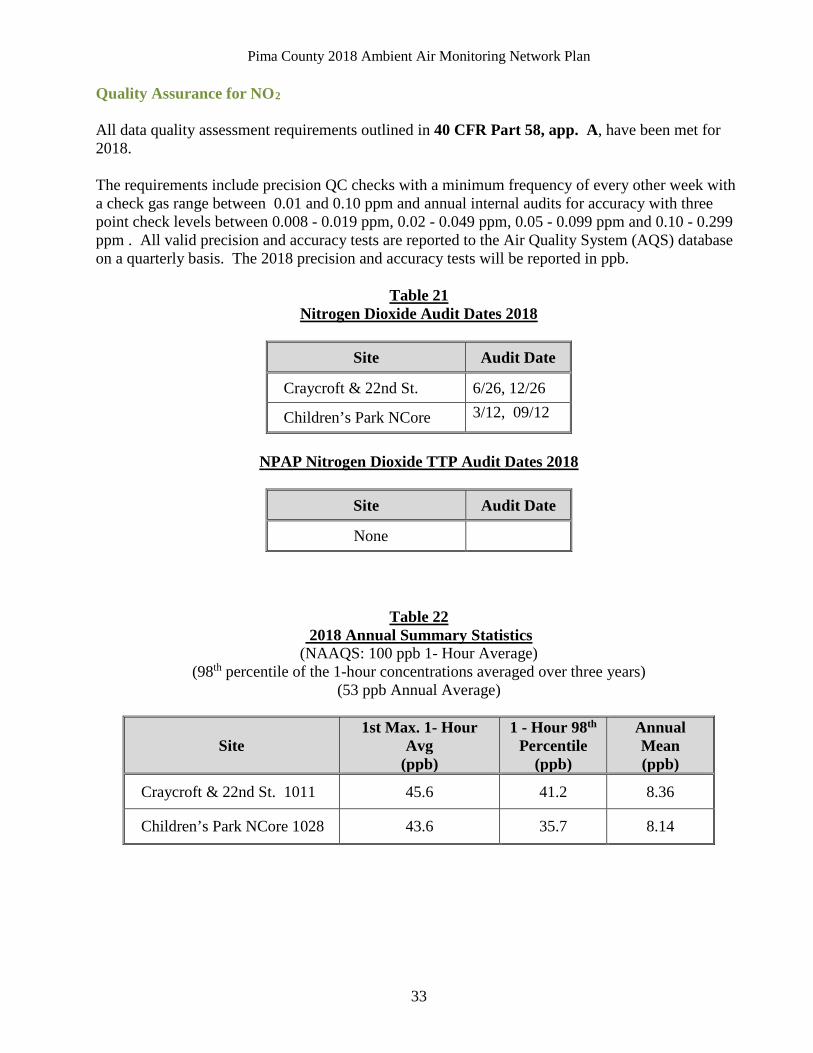
Quality Assurance for NO2 All data quality assessment requirements outlined in 40 CFR Part 58, app. A, have been met for 2018. The requirements include precision QC checks with a minimum frequency of every other week with a check gas range between 0.01 and 0.10 ppm and annual internal audits for accuracy with three point check levels between 0.008 - 0.019 ppm, 0.02 - 0.049 ppm, 0.05 - 0.099 ppm and 0.10 - 0.299 ppm . All valid precision and accuracy tests are reported to the Air Quality System (AQS) database on a quarterly basis. The 2018 precision and accuracy tests will be reported in ppb.
Table 21 Nitrogen Dioxide Audit Dates 2018
Site Audit Date
Craycroft & 22nd St. 6/26, 12/26
Children’s Park NCore 3/12, 09/12
NPAP Nitrogen Dioxide TTP Audit Dates 2018
Site Audit Date
None
Table 22 2018 Annual Summary Statistics
(NAAQS: 100 ppb 1- Hour Average) (98th percentile of the 1-hour concentrations averaged over three years)
(53 ppb Annual Average)
Site 1st Max. 1- Hour
Avg (ppb)
1 - Hour 98th
Percentile (ppb)
Annual Mean (ppb)
Craycroft & 22nd St. 1011 45.6 41.2 8.36
Children’s Park NCore 1028 43.6 35.7 8.14
Pima County 2018 Ambient Air Monitoring Network Plan
34
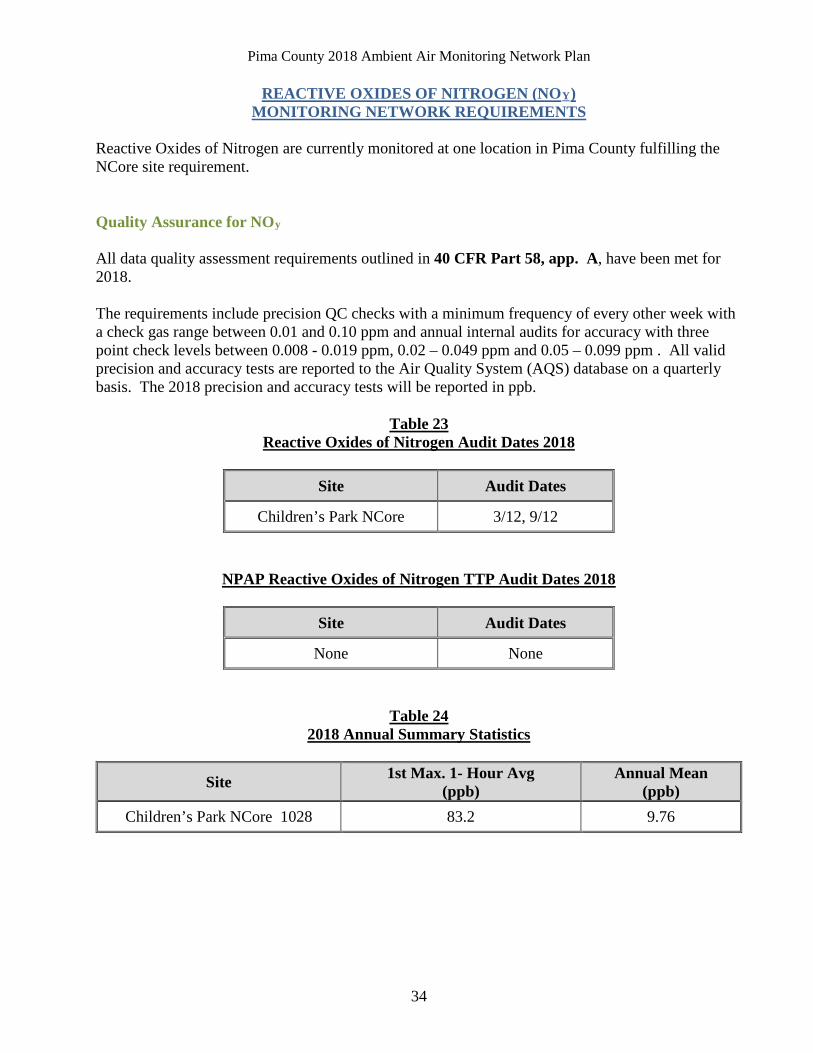
REACTIVE OXIDES OF NITROGEN (NOY) MONITORING NETWORK REQUIREMENTS
Reactive Oxides of Nitrogen are currently monitored at one location in Pima County fulfilling the NCore site requirement. Quality Assurance for NOy All data quality assessment requirements outlined in 40 CFR Part 58, app. A, have been met for 2018. The requirements include precision QC checks with a minimum frequency of every other week with a check gas range between 0.01 and 0.10 ppm and annual internal audits for accuracy with three point check levels between 0.008 - 0.019 ppm, 0.02 – 0.049 ppm and 0.05 – 0.099 ppm . All valid precision and accuracy tests are reported to the Air Quality System (AQS) database on a quarterly basis. The 2018 precision and accuracy tests will be reported in ppb.
Table 23 Reactive Oxides of Nitrogen Audit Dates 2018
Site Audit Dates
Children’s Park NCore 3/12, 9/12
NPAP Reactive Oxides of Nitrogen TTP Audit Dates 2018
Site Audit Dates
None None
Table 24 2018 Annual Summary Statistics
Site 1st Max. 1- Hour Avg (ppb)
Annual Mean (ppb)
Children’s Park NCore 1028 83.2 9.76
Pima County 2018 Ambient Air Monitoring Network Plan
35
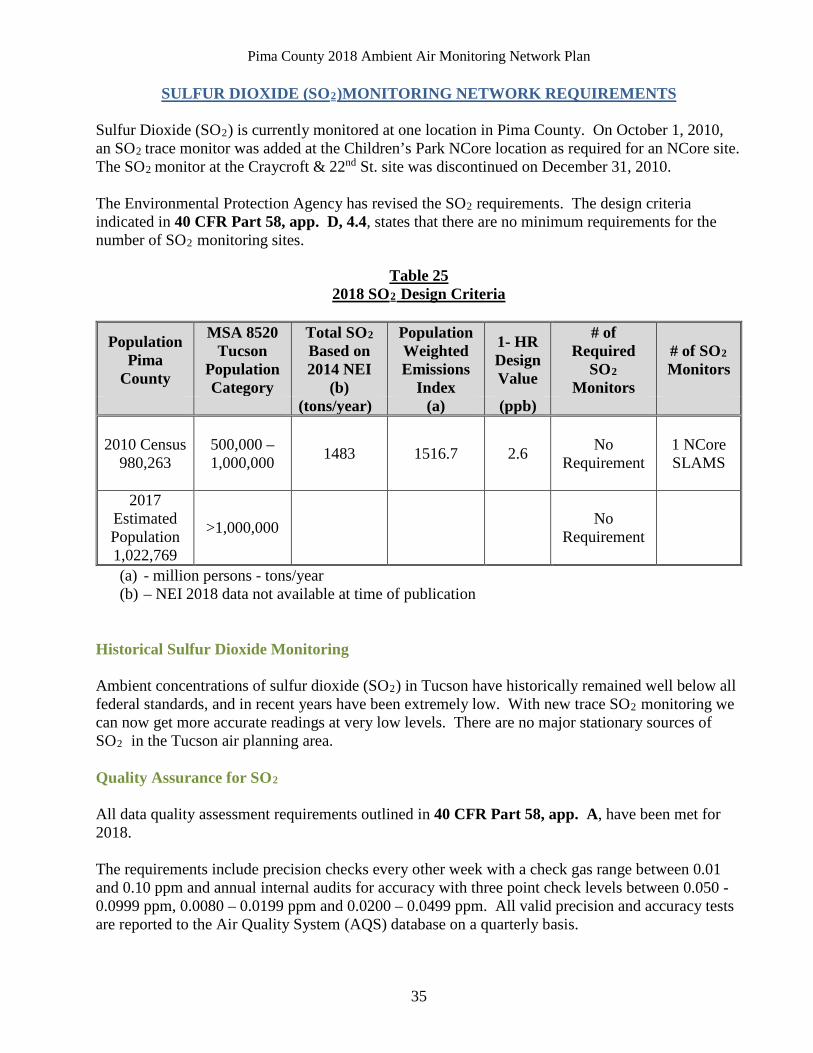
SULFUR DIOXIDE (SO2)MONITORING NETWORK REQUIREMENTS Sulfur Dioxide (SO2) is currently monitored at one location in Pima County. On October 1, 2010, an SO2 trace monitor was added at the Children’s Park NCore location as required for an NCore site. The SO2 monitor at the Craycroft & 22nd St. site was discontinued on December 31, 2010. The Environmental Protection Agency has revised the SO2 requirements. The design criteria indicated in 40 CFR Part 58, app. D, 4.4, states that there are no minimum requirements for the number of SO2 monitoring sites.
Table 25 2018 SO2 Design Criteria
Population Pima
County
MSA 8520 Tucson
Population Category
Total SO2 Based on 2014 NEI
(b)
Population Weighted Emissions
Index
1- HR Design Value
# of Required
SO2 Monitors
# of SO2 Monitors
(tons/year) (a) (ppb)
2010 Census 980,263
500,000 – 1,000,000 1483 1516.7 2.6 No
Requirement 1 NCore SLAMS
2017 Estimated Population 1,022,769
>1,000,000 No Requirement
(a) - million persons - tons/year (b) – NEI 2018 data not available at time of publication
Historical Sulfur Dioxide Monitoring Ambient concentrations of sulfur dioxide (SO2) in Tucson have historically remained well below all federal standards, and in recent years have been extremely low. With new trace SO2 monitoring we can now get more accurate readings at very low levels. There are no major stationary sources of SO2 in the Tucson air planning area. Quality Assurance for SO2 All data quality assessment requirements outlined in 40 CFR Part 58, app. A, have been met for 2018. The requirements include precision checks every other week with a check gas range between 0.01 and 0.10 ppm and annual internal audits for accuracy with three point check levels between 0.050 - 0.0999 ppm, 0.0080 – 0.0199 ppm and 0.0200 – 0.0499 ppm. All valid precision and accuracy tests are reported to the Air Quality System (AQS) database on a quarterly basis.
Pima County 2018 Ambient Air Monitoring Network Plan
36
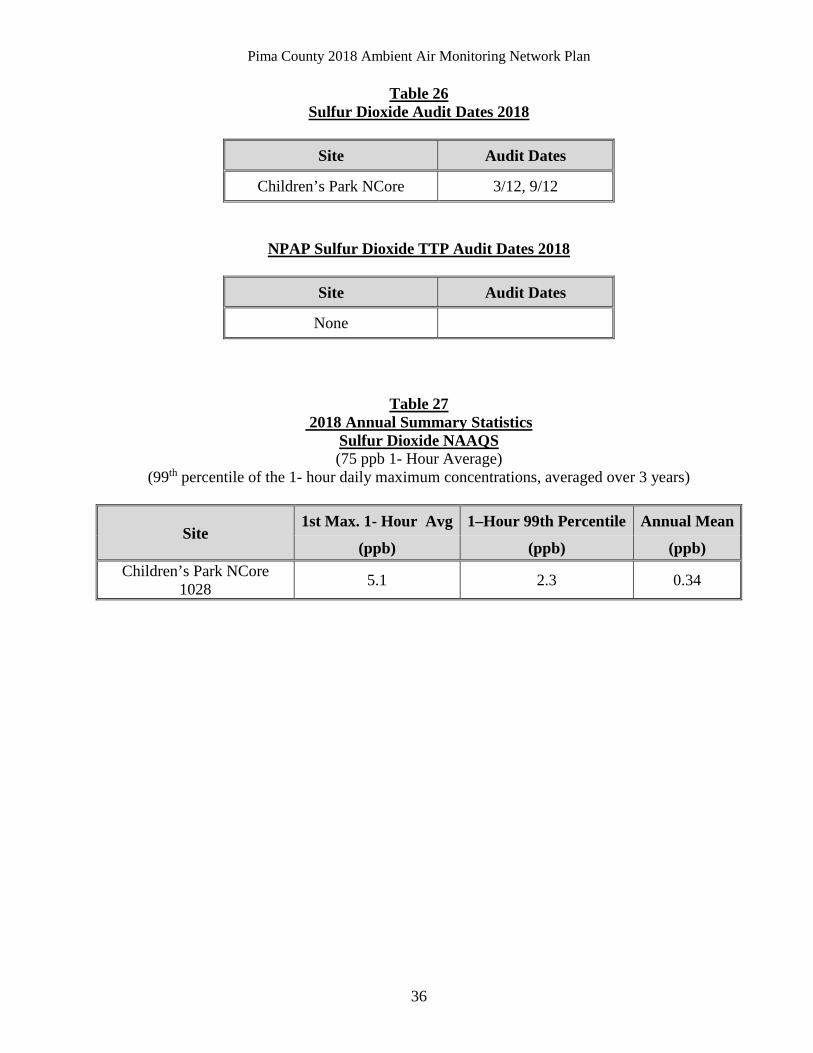
Table 26 Sulfur Dioxide Audit Dates 2018
Site Audit Dates
Children’s Park NCore 3/12, 9/12
NPAP Sulfur Dioxide TTP Audit Dates 2018
Site Audit Dates
None
Table 27 2018 Annual Summary Statistics
Sulfur Dioxide NAAQS (75 ppb 1- Hour Average)
(99th percentile of the 1- hour daily maximum concentrations, averaged over 3 years)
Site 1st Max. 1- Hour Avg 1–Hour 99th Percentile Annual Mean
(ppb) (ppb) (ppb) Children’s Park NCore
1028 5.1 2.3 0.34
Pima County 2018 Ambient Air Monitoring Network Plan
37
LEAD )MONITORING NETWORK REQUIREMENTS
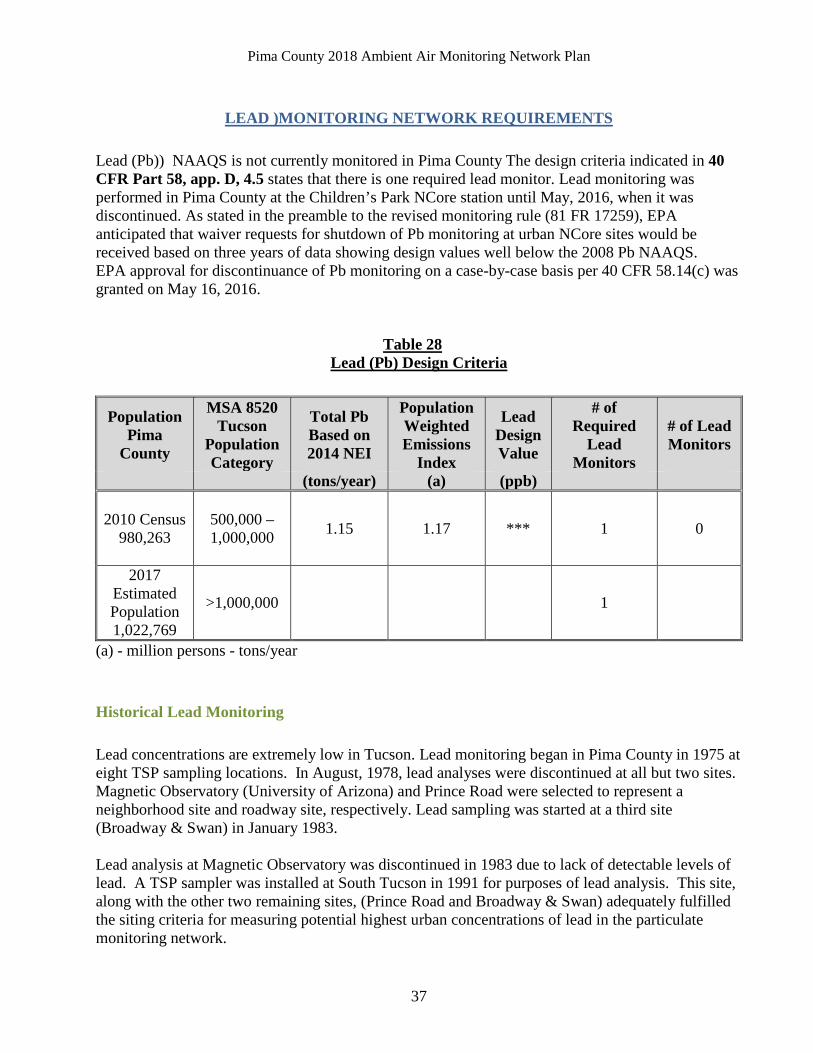
Lead (Pb)) NAAQS is not currently monitored in Pima County The design criteria indicated in 40 CFR Part 58, app. D, 4.5 states that there is one required lead monitor. Lead monitoring was performed in Pima County at the Children’s Park NCore station until May, 2016, when it was discontinued. As stated in the preamble to the revised monitoring rule (81 FR 17259), EPA anticipated that waiver requests for shutdown of Pb monitoring at urban NCore sites would be received based on three years of data showing design values well below the 2008 Pb NAAQS. EPA approval for discontinuance of Pb monitoring on a case-by-case basis per 40 CFR 58.14(c) was granted on May 16, 2016.
Table 28 Lead (Pb) Design Criteria
Population
Pima County
MSA 8520 Tucson
Population Category
Total Pb Based on 2014 NEI
Population Weighted Emissions
Index
Lead Design Value
# of Required
Lead Monitors
# of Lead Monitors
(tons/year) (a) (ppb)
2010 Census 980,263
500,000 – 1,000,000 1.15 1.17 *** 1 0
2017 Estimated Population 1,022,769
>1,000,000 1
(a) - million persons - tons/year Historical Lead Monitoring Lead concentrations are extremely low in Tucson. Lead monitoring began in Pima County in 1975 at eight TSP sampling locations. In August, 1978, lead analyses were discontinued at all but two sites. Magnetic Observatory (University of Arizona) and Prince Road were selected to represent a neighborhood site and roadway site, respectively. Lead sampling was started at a third site (Broadway & Swan) in January 1983. Lead analysis at Magnetic Observatory was discontinued in 1983 due to lack of detectable levels of lead. A TSP sampler was installed at South Tucson in 1991 for purposes of lead analysis. This site, along with the other two remaining sites, (Prince Road and Broadway & Swan) adequately fulfilled the siting criteria for measuring potential highest urban concentrations of lead in the particulate monitoring network.
Pima County 2018 Ambient Air Monitoring Network Plan
38
In March of 1992 the Broadway & Swan lead analysis was discontinued and the TSP samplers from the South Tucson and the Magnetic Observatory sites were moved to the 22nd & Craycroft site. 22nd & Craycroft and Prince Road sites remained until March of 1997, when lead monitoring was discontinued due to non- detectable concentrations. On October 15, 2008 EPA strengthened the lead standard. The primary standard of 1.5 ug/m3 was lowered to 0.15ug/m3, measured as total suspended particles (TSP).The secondary standard is identical to the primary standard. According to the 2005 National Air Emissions Inventory (NEI) from EPA, Pima County had no sources of lead of one ton or more. That meant that Pima County was required to perform area monitoring only, which was done at the Children’s Park NCore location. Monitoring and reporting began on February 27, 2012, and was discontinued May 2016 per approval by EPA.
Pima County 2018 Ambient Air Monitoring Network Plan
39
V. DETAILED SITE AND MONITOR INFORMATION
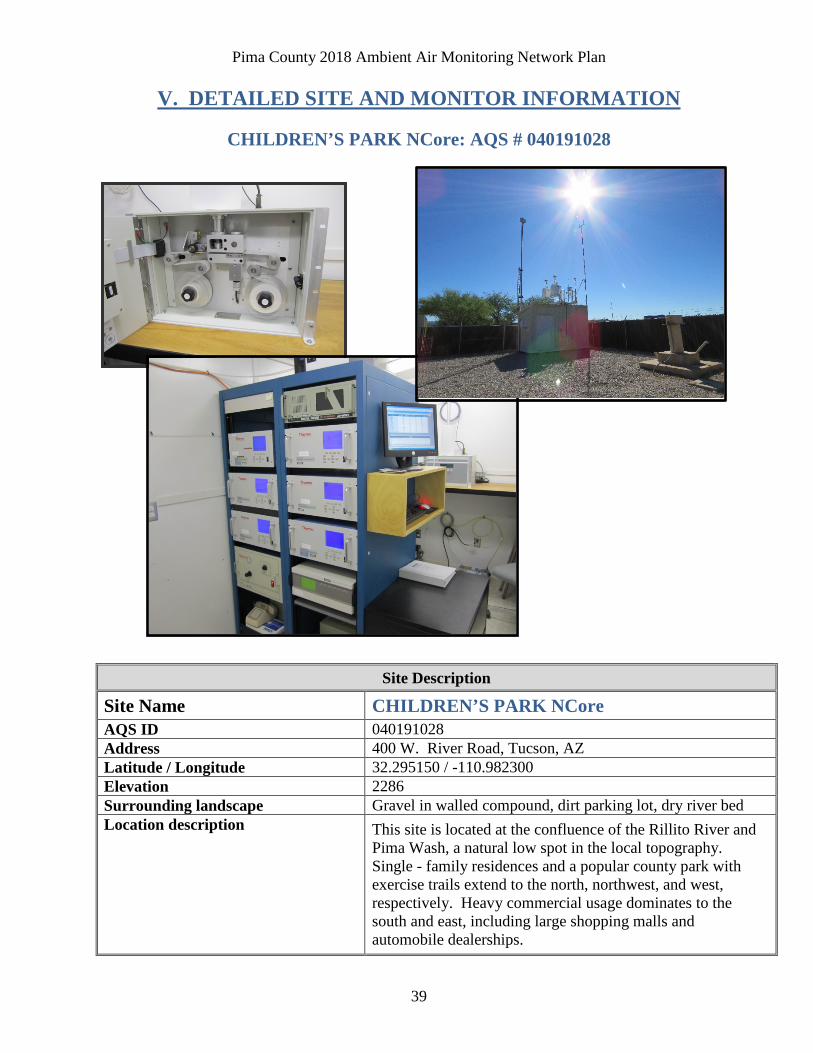
CHILDREN’S PARK NCore: AQS # 040191028
Site Description
Site Name CHILDREN’S PARK NCore AQS ID 040191028 Address 400 W. River Road, Tucson, AZ Latitude / Longitude 32.295150 / -110.982300 Elevation 2286 Surrounding landscape Gravel in walled compound, dirt parking lot, dry river bed Location description This site is located at the confluence of the Rillito River and
Pima Wash, a natural low spot in the local topography. Single - family residences and a popular county park with exercise trails extend to the north, northwest, and west, respectively. Heavy commercial usage dominates to the south and east, including large shopping malls and automobile dealerships.
Pima County 2018 Ambient Air Monitoring Network Plan
40
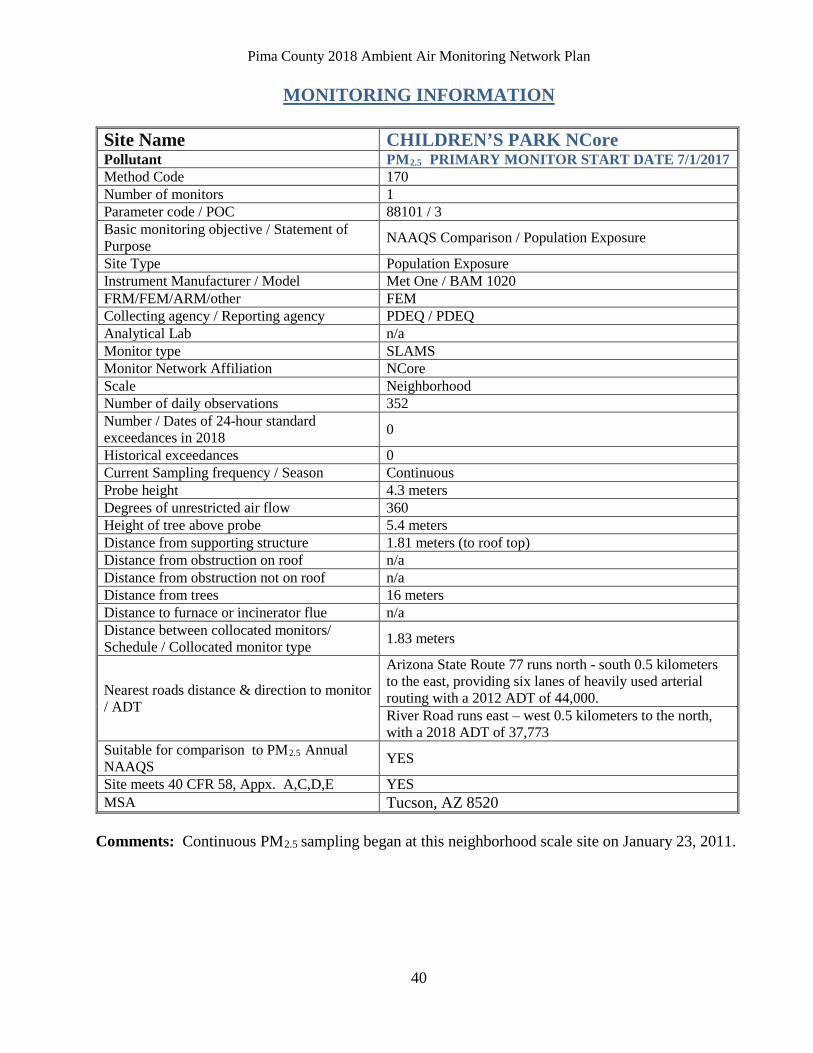
MONITORING INFORMATION Site Name CHILDREN’S PARK NCore Pollutant PM2.5 PRIMARY MONITOR START DATE 7/1/2017 Method Code 170 Number of monitors 1 Parameter code / POC 88101 / 3 Basic monitoring objective / Statement of Purpose NAAQS Comparison / Population Exposure
Site Type Population Exposure Instrument Manufacturer / Model Met One / BAM 1020 FRM/FEM/ARM/other FEM Collecting agency / Reporting agency PDEQ / PDEQ Analytical Lab n/a Monitor type SLAMS Monitor Network Affiliation NCore Scale Neighborhood Number of daily observations 352 Number / Dates of 24-hour standard exceedances in 2018 0
Historical exceedances 0 Current Sampling frequency / Season Continuous Probe height 4.3 meters Degrees of unrestricted air flow 360 Height of tree above probe 5.4 meters Distance from supporting structure 1.81 meters (to roof top) Distance from obstruction on roof n/a Distance from obstruction not on roof n/a Distance from trees 16 meters Distance to furnace or incinerator flue n/a Distance between collocated monitors/ Schedule / Collocated monitor type 1.83 meters
Nearest roads distance & direction to monitor / ADT
Arizona State Route 77 runs north - south 0.5 kilometers to the east, providing six lanes of heavily used arterial routing with a 2012 ADT of 44,000. River Road runs east – west 0.5 kilometers to the north, with a 2018 ADT of 37,773
Suitable for comparison to PM2.5 Annual NAAQS YES
Site meets 40 CFR 58, Appx. A,C,D,E YES MSA Tucson, AZ 8520
Comments: Continuous PM2.5 sampling began at this neighborhood scale site on January 23, 2011.
Pima County 2018 Ambient Air Monitoring Network Plan
41
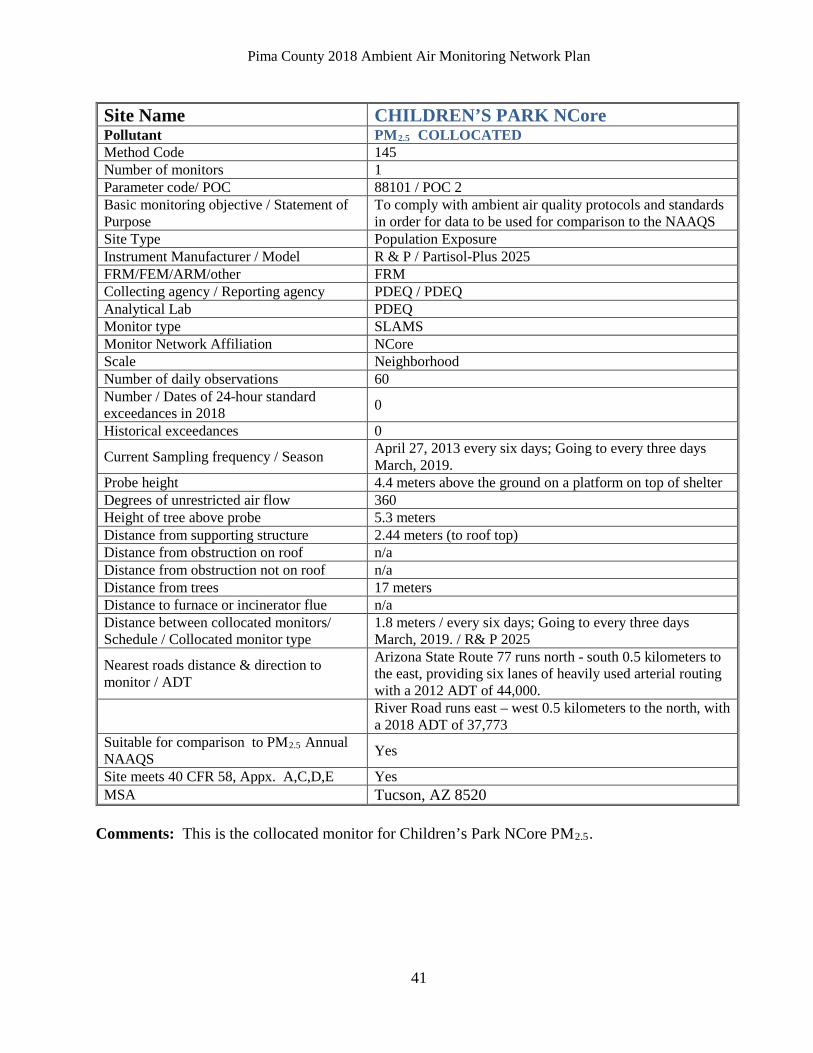
Site Name CHILDREN’S PARK NCore Pollutant PM2.5 COLLOCATED Method Code 145 Number of monitors 1 Parameter code/ POC 88101 / POC 2 Basic monitoring objective / Statement of Purpose
To comply with ambient air quality protocols and standards in order for data to be used for comparison to the NAAQS
Site Type Population Exposure Instrument Manufacturer / Model R & P / Partisol-Plus 2025 FRM/FEM/ARM/other FRM Collecting agency / Reporting agency PDEQ / PDEQ Analytical Lab PDEQ Monitor type SLAMS Monitor Network Affiliation NCore Scale Neighborhood Number of daily observations 60 Number / Dates of 24-hour standard exceedances in 2018 0
Historical exceedances 0
Current Sampling frequency / Season April 27, 2013 every six days; Going to every three days March, 2019.
Probe height 4.4 meters above the ground on a platform on top of shelter Degrees of unrestricted air flow 360 Height of tree above probe 5.3 meters Distance from supporting structure 2.44 meters (to roof top) Distance from obstruction on roof n/a Distance from obstruction not on roof n/a Distance from trees 17 meters Distance to furnace or incinerator flue n/a Distance between collocated monitors/ Schedule / Collocated monitor type
1.8 meters / every six days; Going to every three days March, 2019. / R& P 2025
Nearest roads distance & direction to monitor / ADT
Arizona State Route 77 runs north - south 0.5 kilometers to the east, providing six lanes of heavily used arterial routing with a 2012 ADT of 44,000.
River Road runs east – west 0.5 kilometers to the north, with a 2018 ADT of 37,773
Suitable for comparison to PM2.5 Annual NAAQS Yes
Site meets 40 CFR 58, Appx. A,C,D,E Yes MSA Tucson, AZ 8520
Comments: This is the collocated monitor for Children’s Park NCore PM2.5.
Pima County 2018 Ambient Air Monitoring Network Plan
42
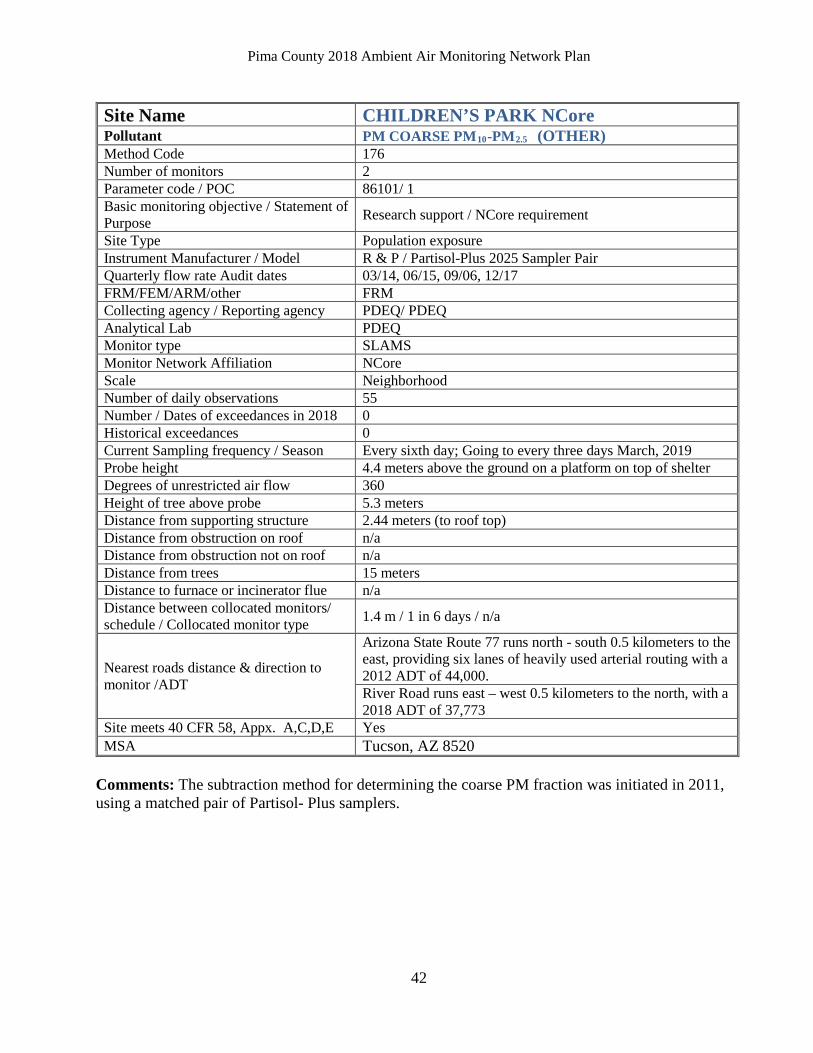
Site Name CHILDREN’S PARK NCore Pollutant PM COARSE PM10-PM2.5 (OTHER) Method Code 176 Number of monitors 2 Parameter code / POC 86101/ 1 Basic monitoring objective / Statement of Purpose Research support / NCore requirement
Site Type Population exposure Instrument Manufacturer / Model R & P / Partisol-Plus 2025 Sampler Pair Quarterly flow rate Audit dates 03/14, 06/15, 09/06, 12/17 FRM/FEM/ARM/other FRM Collecting agency / Reporting agency PDEQ/ PDEQ Analytical Lab PDEQ Monitor type SLAMS Monitor Network Affiliation NCore Scale Neighborhood Number of daily observations 55 Number / Dates of exceedances in 2018 0 Historical exceedances 0 Current Sampling frequency / Season Every sixth day; Going to every three days March, 2019 Probe height 4.4 meters above the ground on a platform on top of shelter Degrees of unrestricted air flow 360 Height of tree above probe 5.3 meters Distance from supporting structure 2.44 meters (to roof top) Distance from obstruction on roof n/a Distance from obstruction not on roof n/a Distance from trees 15 meters Distance to furnace or incinerator flue n/a Distance between collocated monitors/ schedule / Collocated monitor type 1.4 m / 1 in 6 days / n/a
Nearest roads distance & direction to monitor /ADT
Arizona State Route 77 runs north - south 0.5 kilometers to the east, providing six lanes of heavily used arterial routing with a 2012 ADT of 44,000. River Road runs east – west 0.5 kilometers to the north, with a 2018 ADT of 37,773
Site meets 40 CFR 58, Appx. A,C,D,E Yes MSA Tucson, AZ 8520
Comments: The subtraction method for determining the coarse PM fraction was initiated in 2011, using a matched pair of Partisol- Plus samplers.
Pima County 2018 Ambient Air Monitoring Network Plan
43
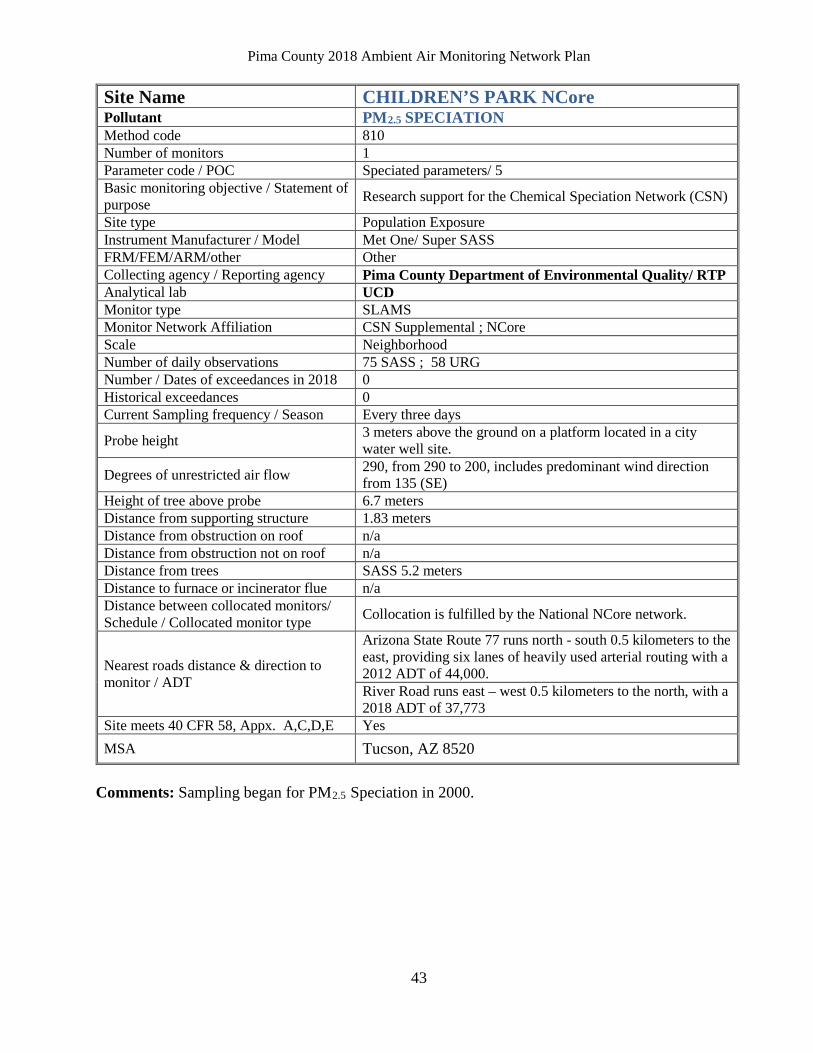
Site Name CHILDREN’S PARK NCore Pollutant PM2.5 SPECIATION Method code 810 Number of monitors 1 Parameter code / POC Speciated parameters/ 5 Basic monitoring objective / Statement of purpose Research support for the Chemical Speciation Network (CSN)
Site type Population Exposure Instrument Manufacturer / Model Met One/ Super SASS FRM/FEM/ARM/other Other Collecting agency / Reporting agency Pima County Department of Environmental Quality/ RTP Analytical lab UCD Monitor type SLAMS Monitor Network Affiliation CSN Supplemental ; NCore Scale Neighborhood Number of daily observations 75 SASS ; 58 URG Number / Dates of exceedances in 2018 0 Historical exceedances 0 Current Sampling frequency / Season Every three days
Probe height 3 meters above the ground on a platform located in a city water well site.
Degrees of unrestricted air flow 290, from 290 to 200, includes predominant wind direction from 135 (SE)
Height of tree above probe 6.7 meters Distance from supporting structure 1.83 meters Distance from obstruction on roof n/a Distance from obstruction not on roof n/a Distance from trees SASS 5.2 meters Distance to furnace or incinerator flue n/a Distance between collocated monitors/ Schedule / Collocated monitor type Collocation is fulfilled by the National NCore network.
Nearest roads distance & direction to monitor / ADT
Arizona State Route 77 runs north - south 0.5 kilometers to the east, providing six lanes of heavily used arterial routing with a 2012 ADT of 44,000. River Road runs east – west 0.5 kilometers to the north, with a 2018 ADT of 37,773
Site meets 40 CFR 58, Appx. A,C,D,E Yes MSA Tucson, AZ 8520
Comments: Sampling began for PM2.5 Speciation in 2000.
Pima County 2018 Ambient Air Monitoring Network Plan
44
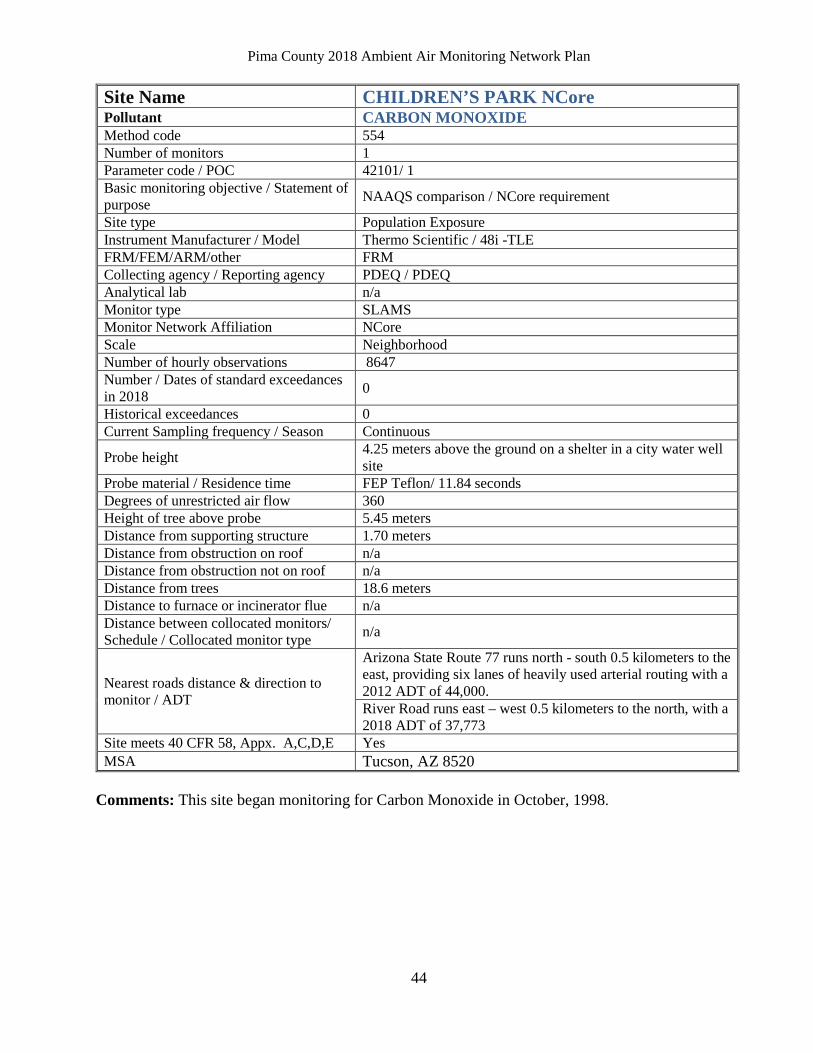
Site Name CHILDREN’S PARK NCore Pollutant CARBON MONOXIDE Method code 554 Number of monitors 1 Parameter code / POC 42101/ 1 Basic monitoring objective / Statement of purpose NAAQS comparison / NCore requirement
Site type Population Exposure Instrument Manufacturer / Model Thermo Scientific / 48i -TLE FRM/FEM/ARM/other FRM Collecting agency / Reporting agency PDEQ / PDEQ Analytical lab n/a Monitor type SLAMS Monitor Network Affiliation NCore Scale Neighborhood Number of hourly observations 8647 Number / Dates of standard exceedances in 2018 0
Historical exceedances 0 Current Sampling frequency / Season Continuous
Probe height 4.25 meters above the ground on a shelter in a city water well site
Probe material / Residence time FEP Teflon/ 11.84 seconds Degrees of unrestricted air flow 360 Height of tree above probe 5.45 meters Distance from supporting structure 1.70 meters Distance from obstruction on roof n/a Distance from obstruction not on roof n/a Distance from trees 18.6 meters Distance to furnace or incinerator flue n/a Distance between collocated monitors/ Schedule / Collocated monitor type n/a
Nearest roads distance & direction to monitor / ADT
Arizona State Route 77 runs north - south 0.5 kilometers to the east, providing six lanes of heavily used arterial routing with a 2012 ADT of 44,000. River Road runs east – west 0.5 kilometers to the north, with a 2018 ADT of 37,773
Site meets 40 CFR 58, Appx. A,C,D,E Yes MSA Tucson, AZ 8520
Comments: This site began monitoring for Carbon Monoxide in October, 1998.
Pima County 2018 Ambient Air Monitoring Network Plan
45
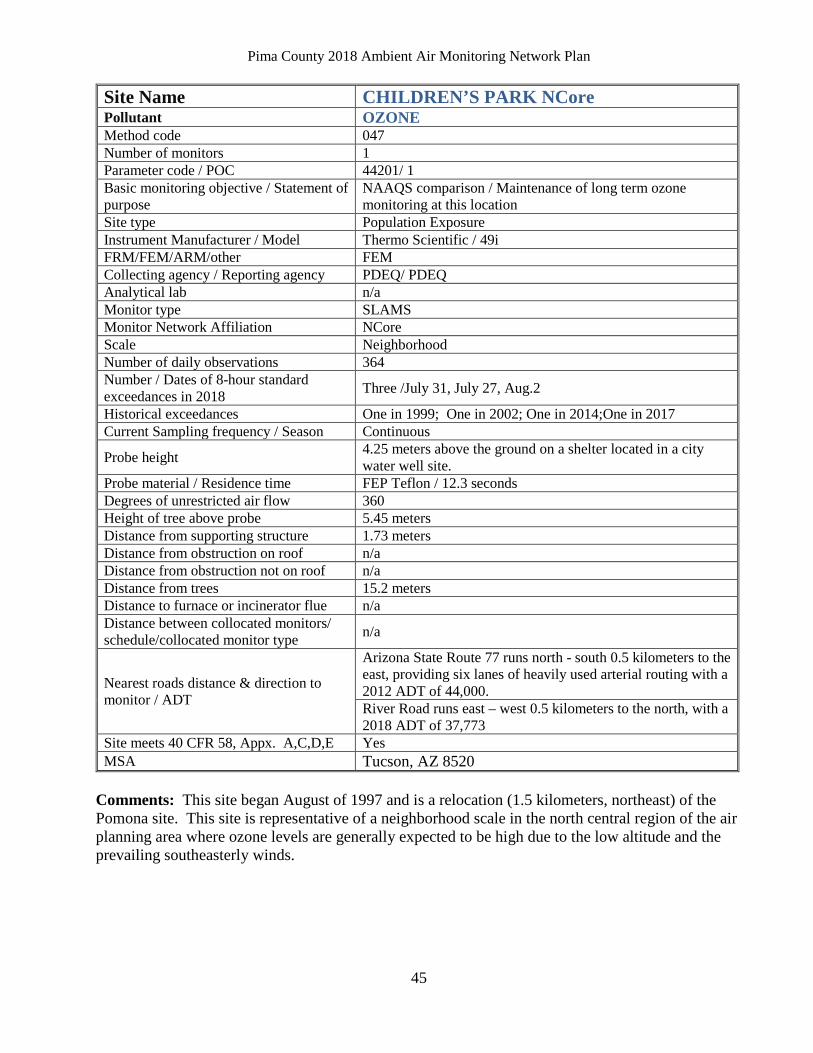
Site Name CHILDREN’S PARK NCore Pollutant OZONE Method code 047 Number of monitors 1 Parameter code / POC 44201/ 1 Basic monitoring objective / Statement of purpose
NAAQS comparison / Maintenance of long term ozone monitoring at this location
Site type Population Exposure Instrument Manufacturer / Model Thermo Scientific / 49i FRM/FEM/ARM/other FEM Collecting agency / Reporting agency PDEQ/ PDEQ Analytical lab n/a Monitor type SLAMS Monitor Network Affiliation NCore Scale Neighborhood Number of daily observations 364 Number / Dates of 8-hour standard exceedances in 2018 Three /July 31, July 27, Aug.2
Historical exceedances One in 1999; One in 2002; One in 2014;One in 2017 Current Sampling frequency / Season Continuous
Probe height 4.25 meters above the ground on a shelter located in a city water well site.
Probe material / Residence time FEP Teflon / 12.3 seconds Degrees of unrestricted air flow 360 Height of tree above probe 5.45 meters Distance from supporting structure 1.73 meters Distance from obstruction on roof n/a Distance from obstruction not on roof n/a Distance from trees 15.2 meters Distance to furnace or incinerator flue n/a Distance between collocated monitors/ schedule/collocated monitor type n/a
Nearest roads distance & direction to monitor / ADT
Arizona State Route 77 runs north - south 0.5 kilometers to the east, providing six lanes of heavily used arterial routing with a 2012 ADT of 44,000. River Road runs east – west 0.5 kilometers to the north, with a 2018 ADT of 37,773
Site meets 40 CFR 58, Appx. A,C,D,E Yes MSA Tucson, AZ 8520
Comments: This site began August of 1997 and is a relocation (1.5 kilometers, northeast) of the Pomona site. This site is representative of a neighborhood scale in the north central region of the air planning area where ozone levels are generally expected to be high due to the low altitude and the prevailing southeasterly winds.
Pima County 2018 Ambient Air Monitoring Network Plan
46
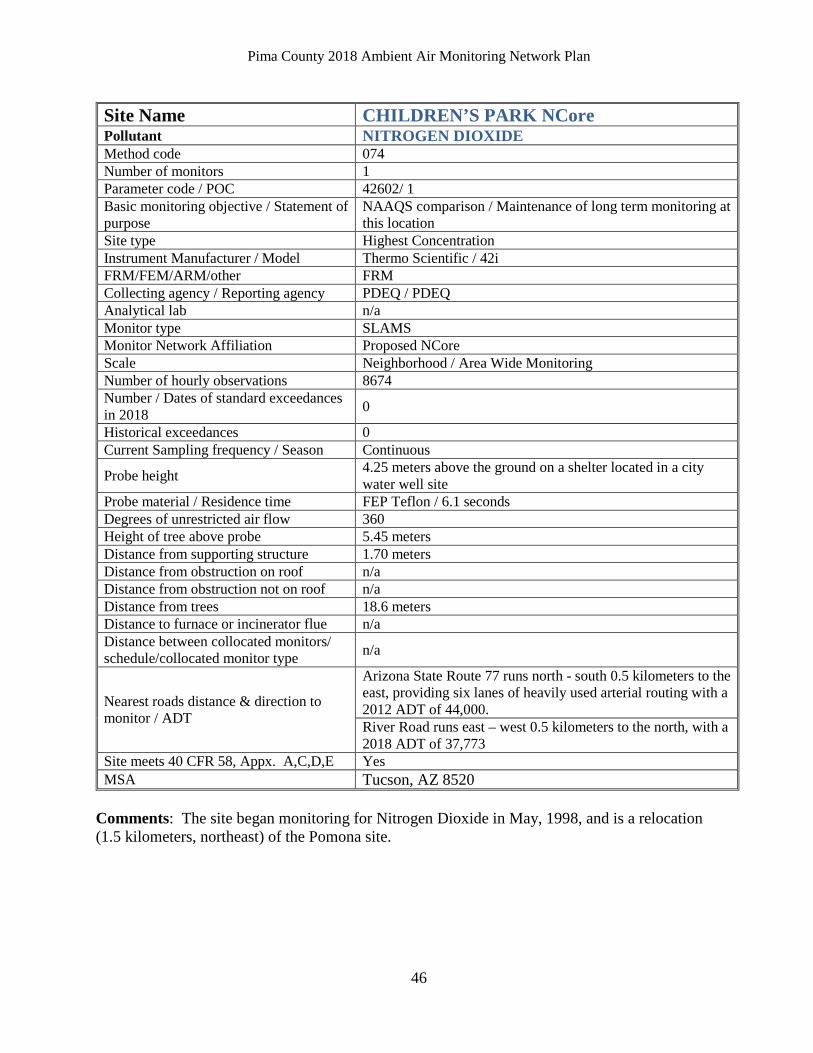
Site Name CHILDREN’S PARK NCore Pollutant NITROGEN DIOXIDE Method code 074 Number of monitors 1 Parameter code / POC 42602/ 1 Basic monitoring objective / Statement of purpose
NAAQS comparison / Maintenance of long term monitoring at this location
Site type Highest Concentration Instrument Manufacturer / Model Thermo Scientific / 42i FRM/FEM/ARM/other FRM Collecting agency / Reporting agency PDEQ / PDEQ Analytical lab n/a Monitor type SLAMS Monitor Network Affiliation Proposed NCore Scale Neighborhood / Area Wide Monitoring Number of hourly observations 8674 Number / Dates of standard exceedances in 2018 0
Historical exceedances 0 Current Sampling frequency / Season Continuous
Probe height 4.25 meters above the ground on a shelter located in a city water well site
Probe material / Residence time FEP Teflon / 6.1 seconds Degrees of unrestricted air flow 360 Height of tree above probe 5.45 meters Distance from supporting structure 1.70 meters Distance from obstruction on roof n/a Distance from obstruction not on roof n/a Distance from trees 18.6 meters Distance to furnace or incinerator flue n/a Distance between collocated monitors/ schedule/collocated monitor type n/a
Nearest roads distance & direction to monitor / ADT
Arizona State Route 77 runs north - south 0.5 kilometers to the east, providing six lanes of heavily used arterial routing with a 2012 ADT of 44,000. River Road runs east – west 0.5 kilometers to the north, with a 2018 ADT of 37,773
Site meets 40 CFR 58, Appx. A,C,D,E Yes MSA Tucson, AZ 8520
Comments: The site began monitoring for Nitrogen Dioxide in May, 1998, and is a relocation (1.5 kilometers, northeast) of the Pomona site.
Pima County 2018 Ambient Air Monitoring Network Plan
47
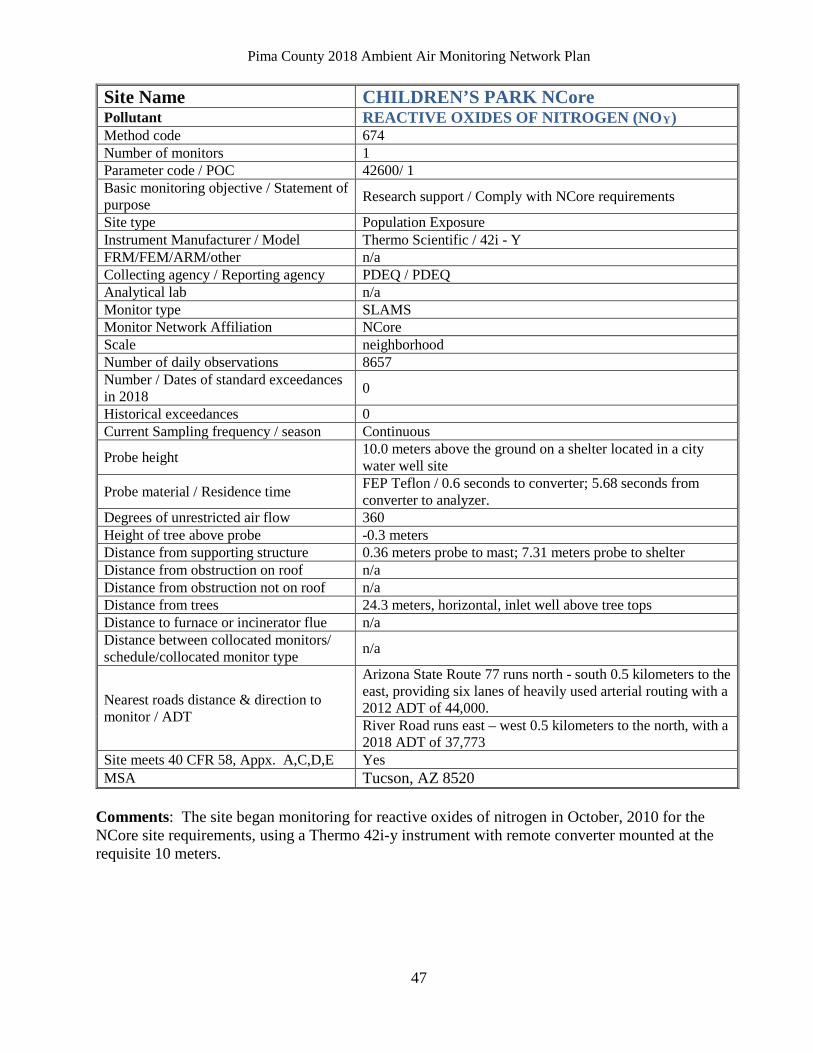
Site Name CHILDREN’S PARK NCore Pollutant REACTIVE OXIDES OF NITROGEN (NOY) Method code 674 Number of monitors 1 Parameter code / POC 42600/ 1 Basic monitoring objective / Statement of purpose Research support / Comply with NCore requirements
Site type Population Exposure Instrument Manufacturer / Model Thermo Scientific / 42i - Y FRM/FEM/ARM/other n/a Collecting agency / Reporting agency PDEQ / PDEQ Analytical lab n/a Monitor type SLAMS Monitor Network Affiliation NCore Scale neighborhood Number of daily observations 8657 Number / Dates of standard exceedances in 2018 0
Historical exceedances 0 Current Sampling frequency / season Continuous
Probe height 10.0 meters above the ground on a shelter located in a city water well site
Probe material / Residence time FEP Teflon / 0.6 seconds to converter; 5.68 seconds from converter to analyzer.
Degrees of unrestricted air flow 360 Height of tree above probe -0.3 meters Distance from supporting structure 0.36 meters probe to mast; 7.31 meters probe to shelter Distance from obstruction on roof n/a Distance from obstruction not on roof n/a Distance from trees 24.3 meters, horizontal, inlet well above tree tops Distance to furnace or incinerator flue n/a Distance between collocated monitors/ schedule/collocated monitor type n/a
Nearest roads distance & direction to monitor / ADT
Arizona State Route 77 runs north - south 0.5 kilometers to the east, providing six lanes of heavily used arterial routing with a 2012 ADT of 44,000. River Road runs east – west 0.5 kilometers to the north, with a 2018 ADT of 37,773
Site meets 40 CFR 58, Appx. A,C,D,E Yes MSA Tucson, AZ 8520
Comments: The site began monitoring for reactive oxides of nitrogen in October, 2010 for the NCore site requirements, using a Thermo 42i-y instrument with remote converter mounted at the requisite 10 meters.
Pima County 2018 Ambient Air Monitoring Network Plan
48
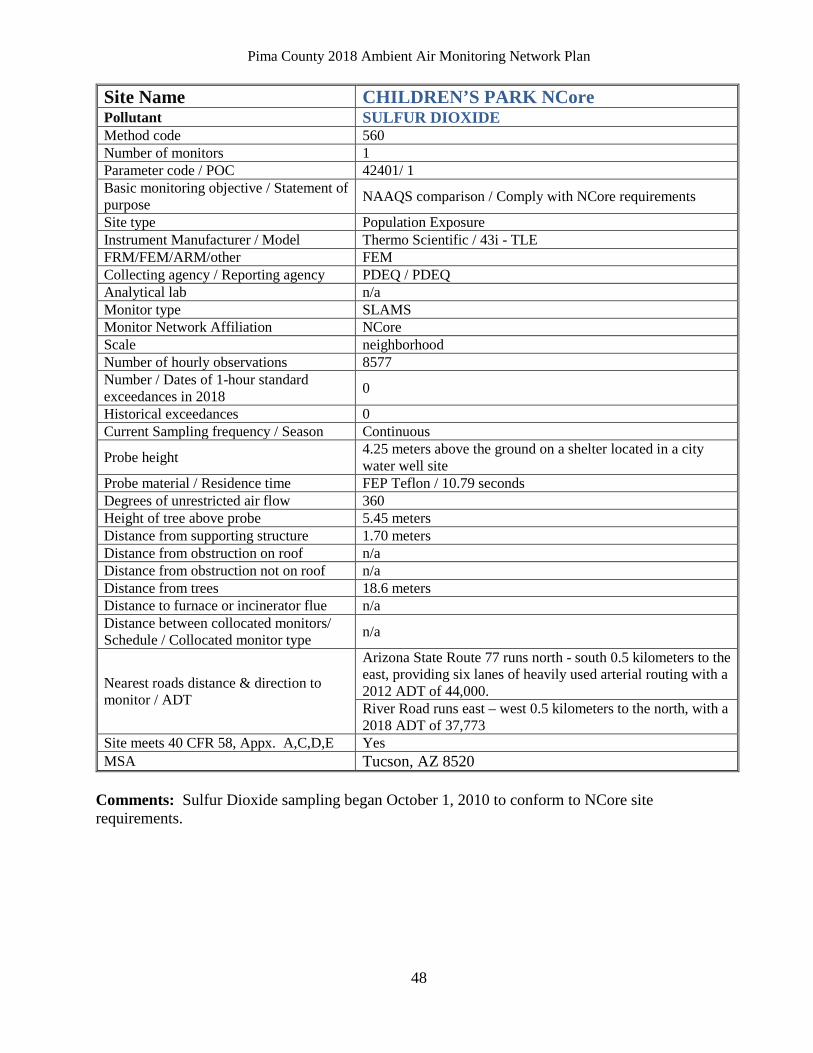
Site Name CHILDREN’S PARK NCore Pollutant SULFUR DIOXIDE Method code 560 Number of monitors 1 Parameter code / POC 42401/ 1 Basic monitoring objective / Statement of purpose NAAQS comparison / Comply with NCore requirements
Site type Population Exposure Instrument Manufacturer / Model Thermo Scientific / 43i - TLE FRM/FEM/ARM/other FEM Collecting agency / Reporting agency PDEQ / PDEQ Analytical lab n/a Monitor type SLAMS Monitor Network Affiliation NCore Scale neighborhood Number of hourly observations 8577 Number / Dates of 1-hour standard exceedances in 2018 0
Historical exceedances 0 Current Sampling frequency / Season Continuous
Probe height 4.25 meters above the ground on a shelter located in a city water well site
Probe material / Residence time FEP Teflon / 10.79 seconds Degrees of unrestricted air flow 360 Height of tree above probe 5.45 meters Distance from supporting structure 1.70 meters Distance from obstruction on roof n/a Distance from obstruction not on roof n/a Distance from trees 18.6 meters Distance to furnace or incinerator flue n/a Distance between collocated monitors/ Schedule / Collocated monitor type n/a
Nearest roads distance & direction to monitor / ADT
Arizona State Route 77 runs north - south 0.5 kilometers to the east, providing six lanes of heavily used arterial routing with a 2012 ADT of 44,000. River Road runs east – west 0.5 kilometers to the north, with a 2018 ADT of 37,773
Site meets 40 CFR 58, Appx. A,C,D,E Yes MSA Tucson, AZ 8520
Comments: Sulfur Dioxide sampling began October 1, 2010 to conform to NCore site requirements.
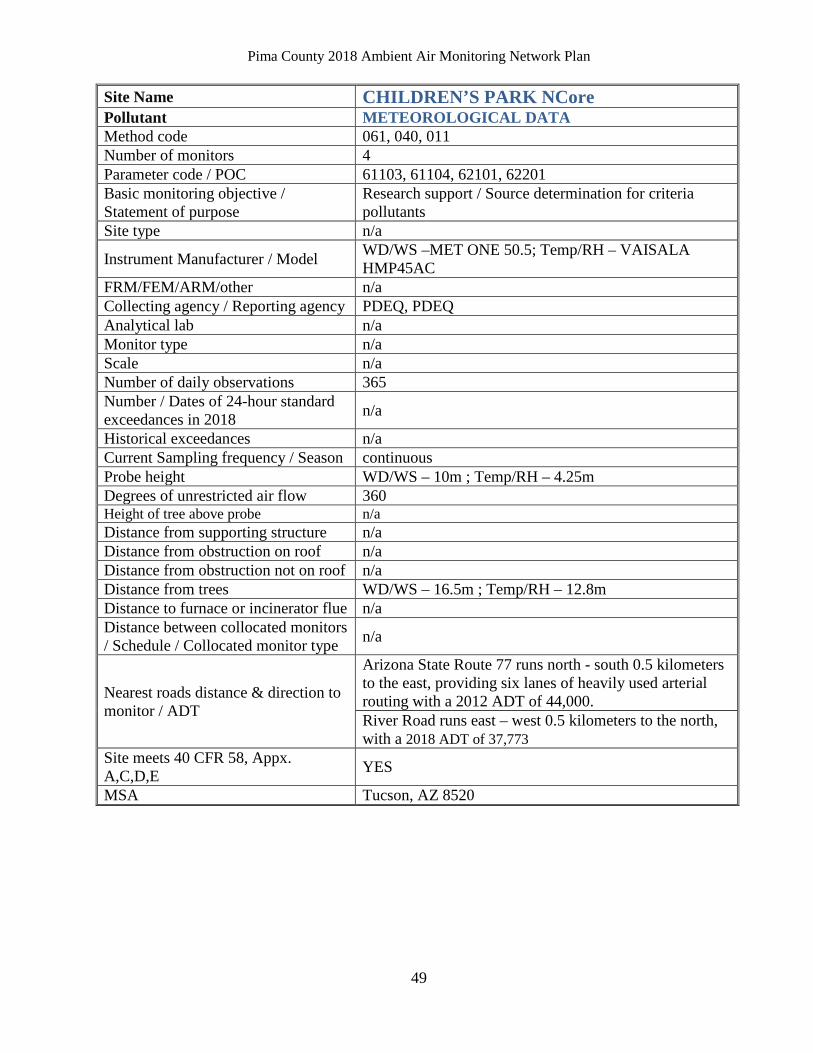
Pima County 2018 Ambient Air Monitoring Network Plan
49
Site Name CHILDREN’S PARK NCore Pollutant METEOROLOGICAL DATA Method code 061, 040, 011 Number of monitors 4 Parameter code / POC 61103, 61104, 62101, 62201 Basic monitoring objective / Statement of purpose
Research support / Source determination for criteria pollutants
Site type n/a
Instrument Manufacturer / Model WD/WS –MET ONE 50.5; Temp/RH – VAISALA HMP45AC
FRM/FEM/ARM/other n/a Collecting agency / Reporting agency PDEQ, PDEQ Analytical lab n/a Monitor type n/a Scale n/a Number of daily observations 365 Number / Dates of 24-hour standard exceedances in 2018 n/a
Historical exceedances n/a Current Sampling frequency / Season continuous Probe height WD/WS – 10m ; Temp/RH – 4.25m Degrees of unrestricted air flow 360 Height of tree above probe n/a Distance from supporting structure n/a Distance from obstruction on roof n/a Distance from obstruction not on roof n/a Distance from trees WD/WS – 16.5m ; Temp/RH – 12.8m Distance to furnace or incinerator flue n/a Distance between collocated monitors / Schedule / Collocated monitor type n/a
Nearest roads distance & direction to monitor / ADT
Arizona State Route 77 runs north - south 0.5 kilometers to the east, providing six lanes of heavily used arterial routing with a 2012 ADT of 44,000. River Road runs east – west 0.5 kilometers to the north, with a 2018 ADT of 37,773
Site meets 40 CFR 58, Appx. A,C,D,E YES
MSA Tucson, AZ 8520
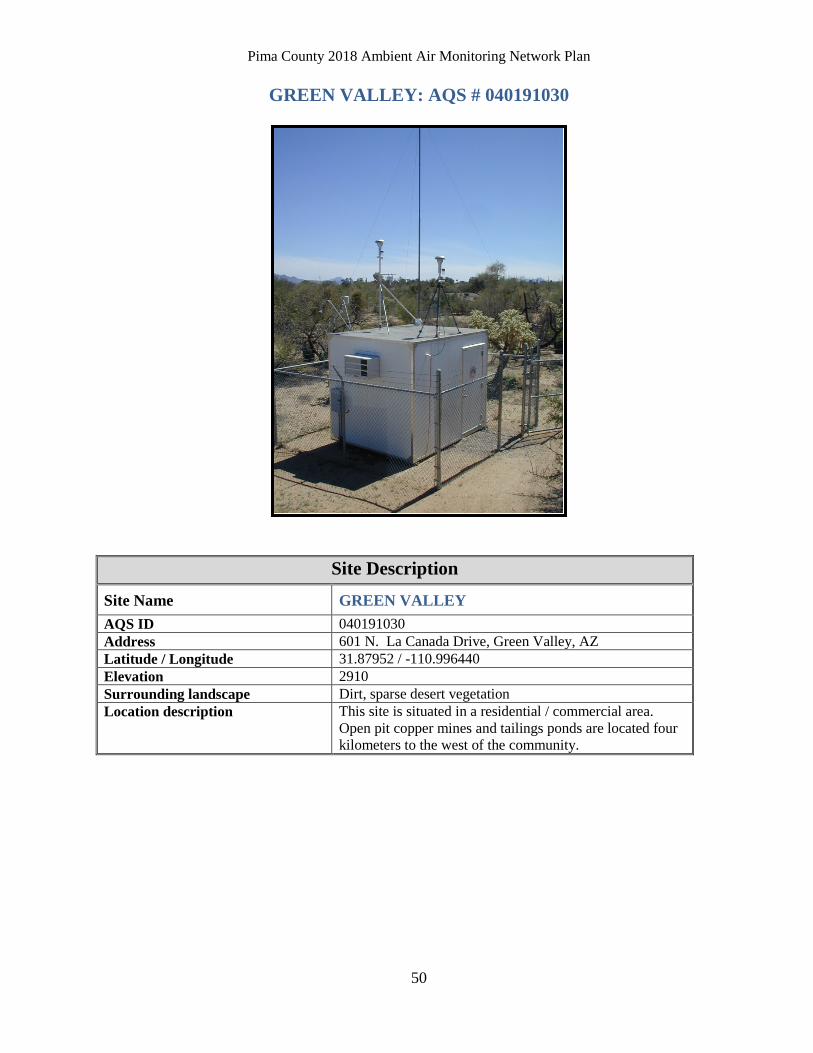
Pima County 2018 Ambient Air Monitoring Network Plan
50
GREEN VALLEY: AQS # 040191030
Site Description
Site Name GREEN VALLEY AQS ID 040191030 Address 601 N. La Canada Drive, Green Valley, AZ Latitude / Longitude 31.87952 / -110.996440 Elevation 2910 Surrounding landscape Dirt, sparse desert vegetation Location description This site is situated in a residential / commercial area.
Open pit copper mines and tailings ponds are located four kilometers to the west of the community.
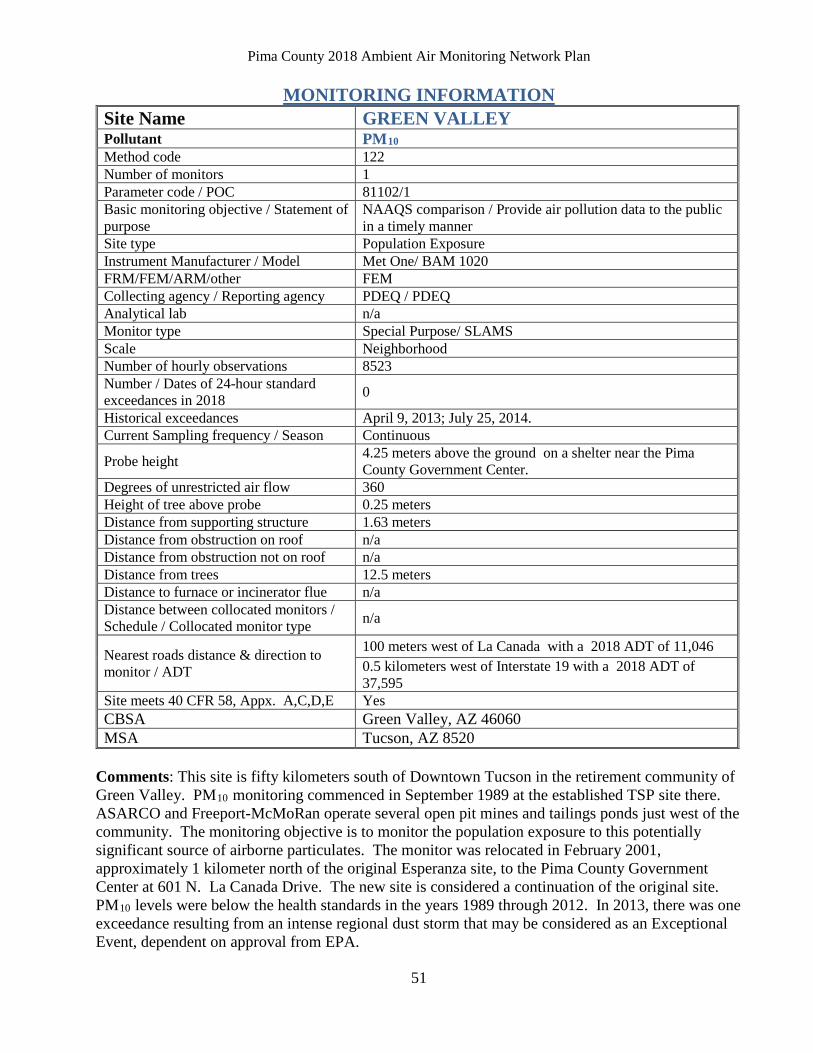
Pima County 2018 Ambient Air Monitoring Network Plan
51
MONITORING INFORMATION Site Name GREEN VALLEY Pollutant PM10 Method code 122 Number of monitors 1 Parameter code / POC 81102/1 Basic monitoring objective / Statement of purpose
NAAQS comparison / Provide air pollution data to the public in a timely manner
Site type Population Exposure Instrument Manufacturer / Model Met One/ BAM 1020 FRM/FEM/ARM/other FEM Collecting agency / Reporting agency PDEQ / PDEQ Analytical lab n/a Monitor type Special Purpose/ SLAMS Scale Neighborhood Number of hourly observations 8523 Number / Dates of 24-hour standard exceedances in 2018 0
Historical exceedances April 9, 2013; July 25, 2014. Current Sampling frequency / Season Continuous
Probe height 4.25 meters above the ground on a shelter near the Pima County Government Center.
Degrees of unrestricted air flow 360 Height of tree above probe 0.25 meters Distance from supporting structure 1.63 meters Distance from obstruction on roof n/a Distance from obstruction not on roof n/a Distance from trees 12.5 meters Distance to furnace or incinerator flue n/a Distance between collocated monitors / Schedule / Collocated monitor type n/a
Nearest roads distance & direction to monitor / ADT
100 meters west of La Canada with a 2018 ADT of 11,046 0.5 kilometers west of Interstate 19 with a 2018 ADT of 37,595
Site meets 40 CFR 58, Appx. A,C,D,E Yes CBSA Green Valley, AZ 46060 MSA Tucson, AZ 8520
Comments: This site is fifty kilometers south of Downtown Tucson in the retirement community of Green Valley. PM10 monitoring commenced in September 1989 at the established TSP site there. ASARCO and Freeport-McMoRan operate several open pit mines and tailings ponds just west of the community. The monitoring objective is to monitor the population exposure to this potentially significant source of airborne particulates. The monitor was relocated in February 2001, approximately 1 kilometer north of the original Esperanza site, to the Pima County Government Center at 601 N. La Canada Drive. The new site is considered a continuation of the original site. PM10 levels were below the health standards in the years 1989 through 2012. In 2013, there was one exceedance resulting from an intense regional dust storm that may be considered as an Exceptional Event, dependent on approval from EPA.
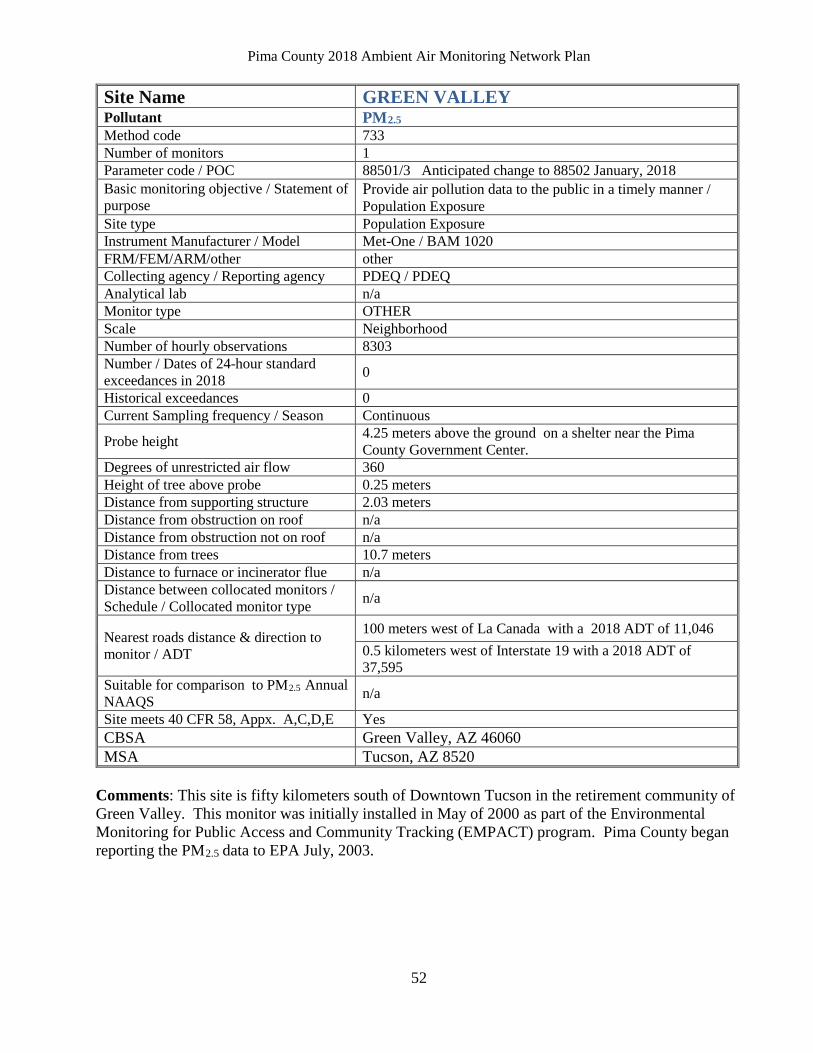
Pima County 2018 Ambient Air Monitoring Network Plan
52
Site Name GREEN VALLEY Pollutant PM2.5 Method code 733 Number of monitors 1 Parameter code / POC 88501/3 Anticipated change to 88502 January, 2018 Basic monitoring objective / Statement of purpose
Provide air pollution data to the public in a timely manner / Population Exposure
Site type Population Exposure Instrument Manufacturer / Model Met-One / BAM 1020 FRM/FEM/ARM/other other Collecting agency / Reporting agency PDEQ / PDEQ Analytical lab n/a Monitor type OTHER Scale Neighborhood Number of hourly observations 8303 Number / Dates of 24-hour standard exceedances in 2018 0
Historical exceedances 0 Current Sampling frequency / Season Continuous
Probe height 4.25 meters above the ground on a shelter near the Pima County Government Center.
Degrees of unrestricted air flow 360 Height of tree above probe 0.25 meters Distance from supporting structure 2.03 meters Distance from obstruction on roof n/a Distance from obstruction not on roof n/a Distance from trees 10.7 meters Distance to furnace or incinerator flue n/a Distance between collocated monitors / Schedule / Collocated monitor type n/a
Nearest roads distance & direction to monitor / ADT
100 meters west of La Canada with a 2018 ADT of 11,046 0.5 kilometers west of Interstate 19 with a 2018 ADT of 37,595
Suitable for comparison to PM2.5 Annual NAAQS n/a
Site meets 40 CFR 58, Appx. A,C,D,E Yes CBSA Green Valley, AZ 46060 MSA Tucson, AZ 8520
Comments: This site is fifty kilometers south of Downtown Tucson in the retirement community of Green Valley. This monitor was initially installed in May of 2000 as part of the Environmental Monitoring for Public Access and Community Tracking (EMPACT) program. Pima County began reporting the PM2.5 data to EPA July, 2003.
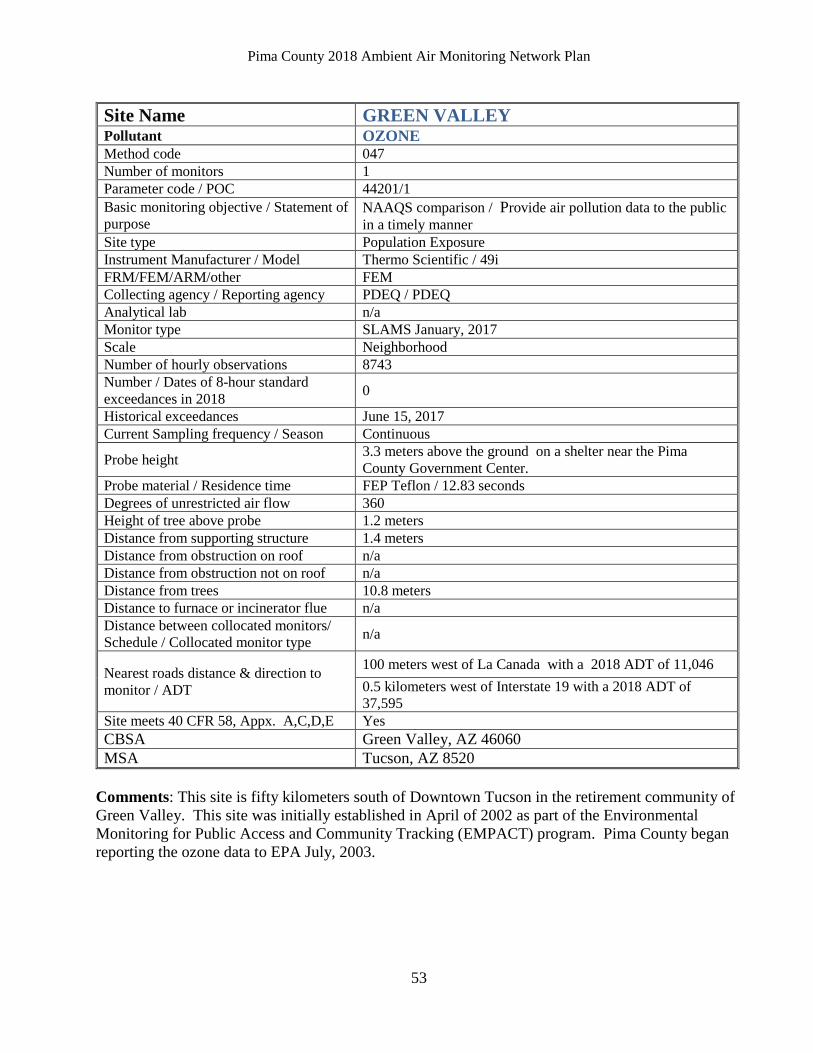
Pima County 2018 Ambient Air Monitoring Network Plan
53
Site Name GREEN VALLEY Pollutant OZONE Method code 047 Number of monitors 1 Parameter code / POC 44201/1 Basic monitoring objective / Statement of purpose
NAAQS comparison / Provide air pollution data to the public in a timely manner
Site type Population Exposure Instrument Manufacturer / Model Thermo Scientific / 49i FRM/FEM/ARM/other FEM Collecting agency / Reporting agency PDEQ / PDEQ Analytical lab n/a Monitor type SLAMS January, 2017 Scale Neighborhood Number of hourly observations 8743 Number / Dates of 8-hour standard exceedances in 2018 0
Historical exceedances June 15, 2017 Current Sampling frequency / Season Continuous
Probe height 3.3 meters above the ground on a shelter near the Pima County Government Center.
Probe material / Residence time FEP Teflon / 12.83 seconds Degrees of unrestricted air flow 360 Height of tree above probe 1.2 meters Distance from supporting structure 1.4 meters Distance from obstruction on roof n/a Distance from obstruction not on roof n/a Distance from trees 10.8 meters Distance to furnace or incinerator flue n/a Distance between collocated monitors/ Schedule / Collocated monitor type n/a
Nearest roads distance & direction to monitor / ADT
100 meters west of La Canada with a 2018 ADT of 11,046 0.5 kilometers west of Interstate 19 with a 2018 ADT of 37,595
Site meets 40 CFR 58, Appx. A,C,D,E Yes CBSA Green Valley, AZ 46060 MSA Tucson, AZ 8520
Comments: This site is fifty kilometers south of Downtown Tucson in the retirement community of Green Valley. This site was initially established in April of 2002 as part of the Environmental Monitoring for Public Access and Community Tracking (EMPACT) program. Pima County began reporting the ozone data to EPA July, 2003.
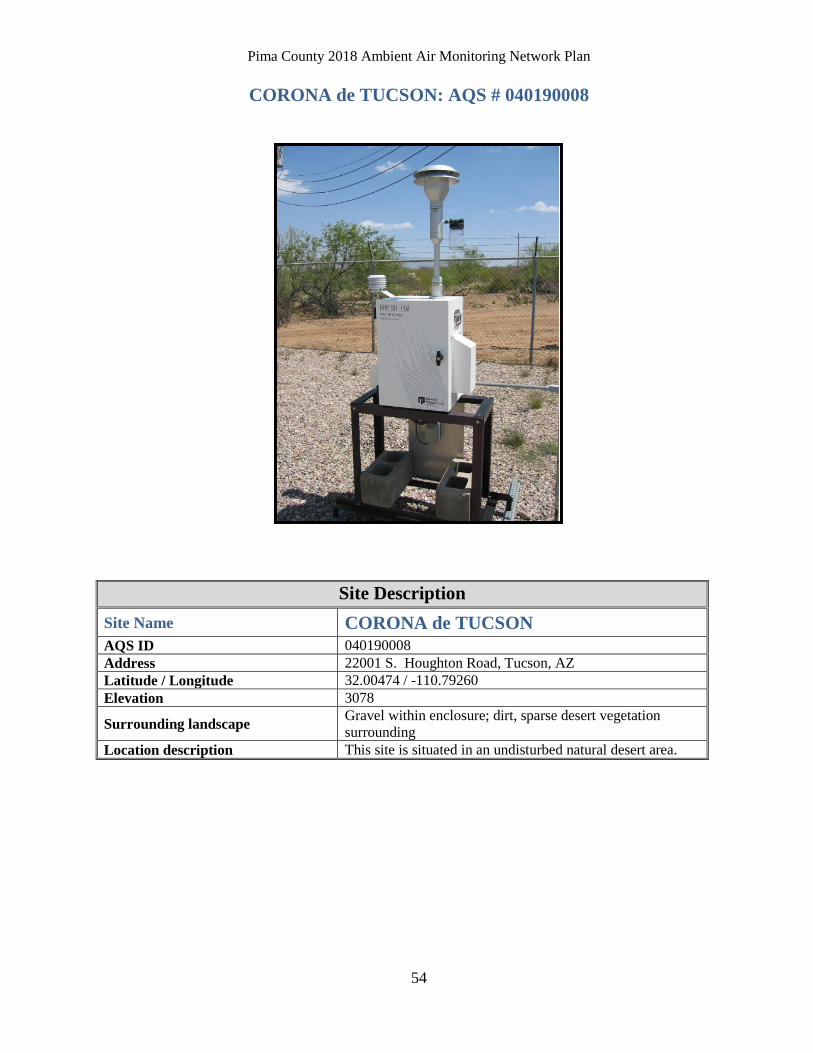
Pima County 2018 Ambient Air Monitoring Network Plan
54
CORONA de TUCSON: AQS # 040190008
Site Description Site Name CORONA de TUCSON AQS ID 040190008 Address 22001 S. Houghton Road, Tucson, AZ Latitude / Longitude 32.00474 / -110.79260 Elevation 3078
Surrounding landscape Gravel within enclosure; dirt, sparse desert vegetation surrounding
Location description This site is situated in an undisturbed natural desert area.
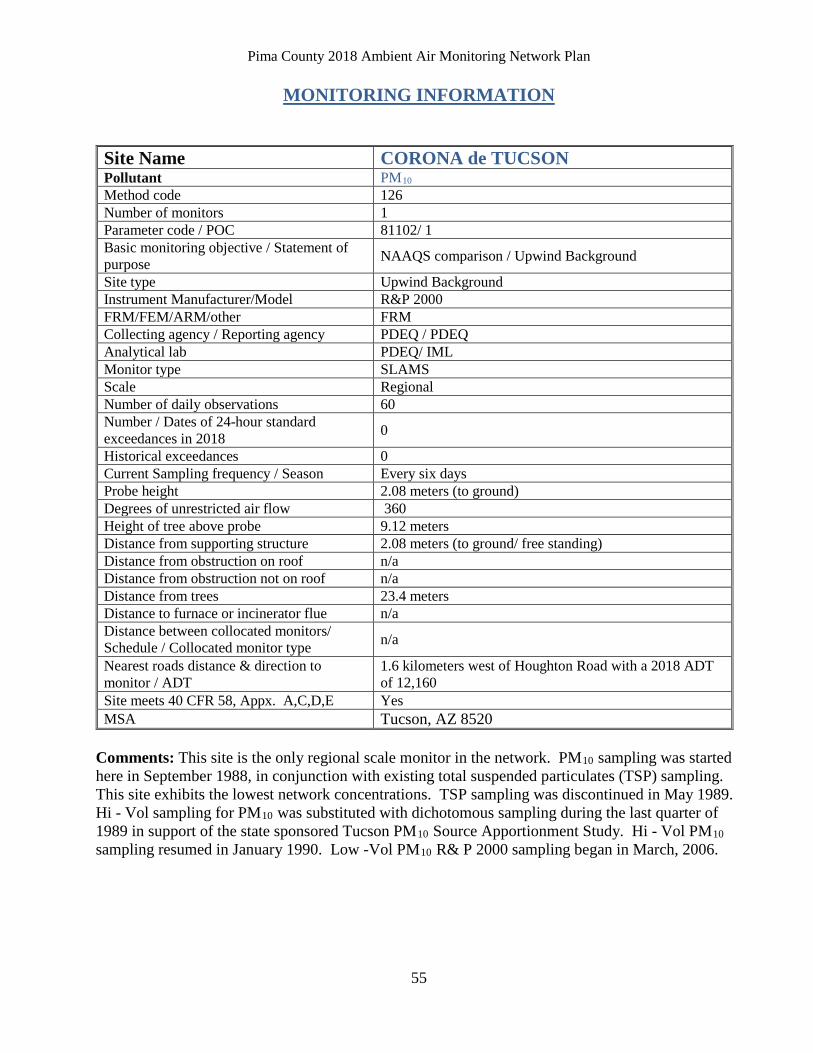
Pima County 2018 Ambient Air Monitoring Network Plan
55
MONITORING INFORMATION Site Name CORONA de TUCSON Pollutant PM10 Method code 126 Number of monitors 1 Parameter code / POC 81102/ 1 Basic monitoring objective / Statement of purpose NAAQS comparison / Upwind Background
Site type Upwind Background Instrument Manufacturer/Model R&P 2000 FRM/FEM/ARM/other FRM Collecting agency / Reporting agency PDEQ / PDEQ Analytical lab PDEQ/ IML Monitor type SLAMS Scale Regional Number of daily observations 60 Number / Dates of 24-hour standard exceedances in 2018 0
Historical exceedances 0 Current Sampling frequency / Season Every six days Probe height 2.08 meters (to ground) Degrees of unrestricted air flow 360 Height of tree above probe 9.12 meters Distance from supporting structure 2.08 meters (to ground/ free standing) Distance from obstruction on roof n/a Distance from obstruction not on roof n/a Distance from trees 23.4 meters Distance to furnace or incinerator flue n/a Distance between collocated monitors/ Schedule / Collocated monitor type n/a
Nearest roads distance & direction to monitor / ADT
1.6 kilometers west of Houghton Road with a 2018 ADT of 12,160
Site meets 40 CFR 58, Appx. A,C,D,E Yes MSA Tucson, AZ 8520
Comments: This site is the only regional scale monitor in the network. PM10 sampling was started here in September 1988, in conjunction with existing total suspended particulates (TSP) sampling. This site exhibits the lowest network concentrations. TSP sampling was discontinued in May 1989. Hi - Vol sampling for PM10 was substituted with dichotomous sampling during the last quarter of 1989 in support of the state sponsored Tucson PM10 Source Apportionment Study. Hi - Vol PM10 sampling resumed in January 1990. Low -Vol PM10 R& P 2000 sampling began in March, 2006.
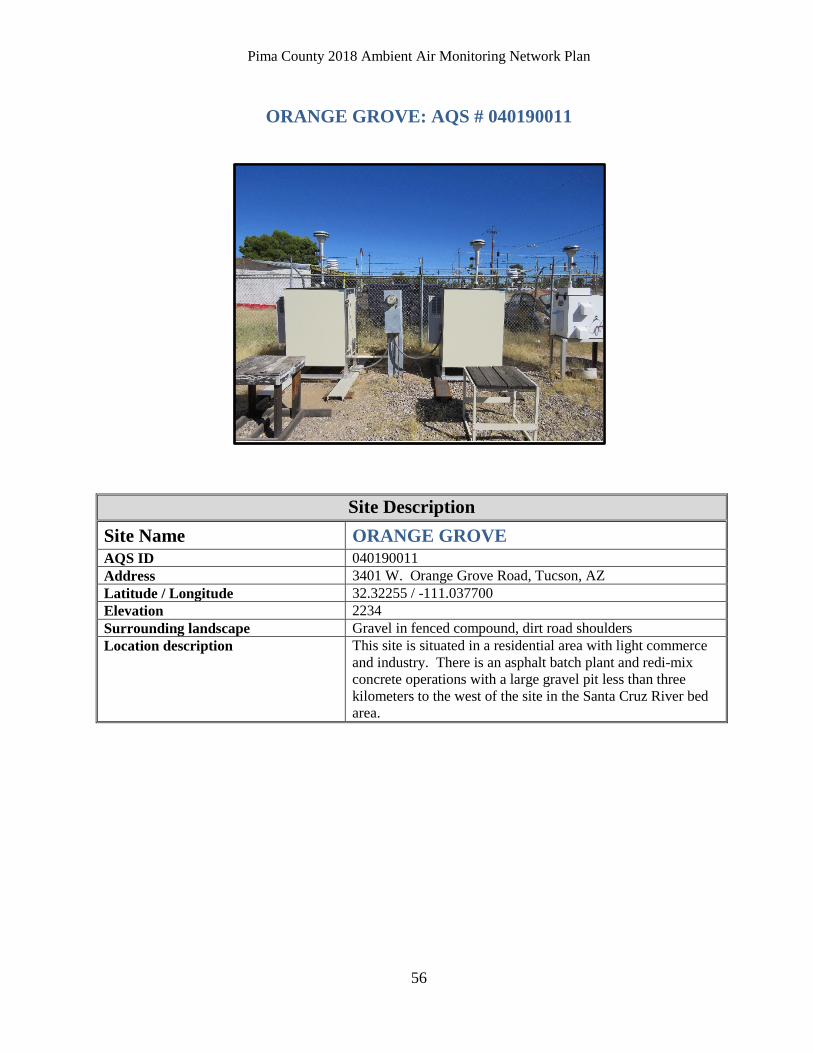
Pima County 2018 Ambient Air Monitoring Network Plan
56
ORANGE GROVE: AQS # 040190011
Site Description Site Name ORANGE GROVE AQS ID 040190011 Address 3401 W. Orange Grove Road, Tucson, AZ Latitude / Longitude 32.32255 / -111.037700 Elevation 2234 Surrounding landscape Gravel in fenced compound, dirt road shoulders Location description This site is situated in a residential area with light commerce
and industry. There is an asphalt batch plant and redi-mix concrete operations with a large gravel pit less than three kilometers to the west of the site in the Santa Cruz River bed area.
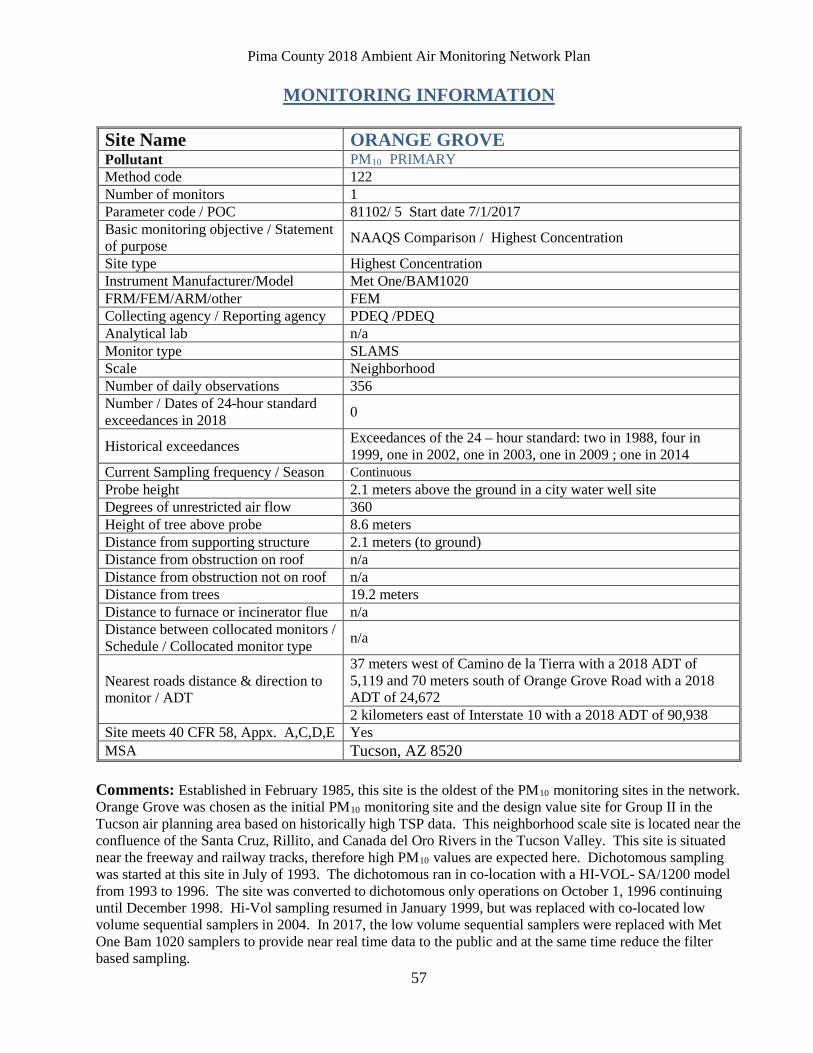
Pima County 2018 Ambient Air Monitoring Network Plan
57
MONITORING INFORMATION
Site Name ORANGE GROVE Pollutant PM10 PRIMARY Method code 122 Number of monitors 1 Parameter code / POC 81102/ 5 Start date 7/1/2017 Basic monitoring objective / Statement of purpose NAAQS Comparison / Highest Concentration
Site type Highest Concentration Instrument Manufacturer/Model Met One/BAM1020 FRM/FEM/ARM/other FEM Collecting agency / Reporting agency PDEQ /PDEQ Analytical lab n/a Monitor type SLAMS Scale Neighborhood Number of daily observations 356 Number / Dates of 24-hour standard exceedances in 2018 0
Historical exceedances Exceedances of the 24 – hour standard: two in 1988, four in 1999, one in 2002, one in 2003, one in 2009 ; one in 2014
Current Sampling frequency / Season Continuous Probe height 2.1 meters above the ground in a city water well site Degrees of unrestricted air flow 360 Height of tree above probe 8.6 meters Distance from supporting structure 2.1 meters (to ground) Distance from obstruction on roof n/a Distance from obstruction not on roof n/a Distance from trees 19.2 meters Distance to furnace or incinerator flue n/a Distance between collocated monitors / Schedule / Collocated monitor type n/a
Nearest roads distance & direction to monitor / ADT
37 meters west of Camino de la Tierra with a 2018 ADT of 5,119 and 70 meters south of Orange Grove Road with a 2018 ADT of 24,672 2 kilometers east of Interstate 10 with a 2018 ADT of 90,938
Site meets 40 CFR 58, Appx. A,C,D,E Yes MSA Tucson, AZ 8520
Comments: Established in February 1985, this site is the oldest of the PM10 monitoring sites in the network. Orange Grove was chosen as the initial PM10 monitoring site and the design value site for Group II in the Tucson air planning area based on historically high TSP data. This neighborhood scale site is located near the confluence of the Santa Cruz, Rillito, and Canada del Oro Rivers in the Tucson Valley. This site is situated near the freeway and railway tracks, therefore high PM10 values are expected here. Dichotomous sampling was started at this site in July of 1993. The dichotomous ran in co-location with a HI-VOL- SA/1200 model from 1993 to 1996. The site was converted to dichotomous only operations on October 1, 1996 continuing until December 1998. Hi-Vol sampling resumed in January 1999, but was replaced with co-located low volume sequential samplers in 2004. In 2017, the low volume sequential samplers were replaced with Met One Bam 1020 samplers to provide near real time data to the public and at the same time reduce the filter based sampling.
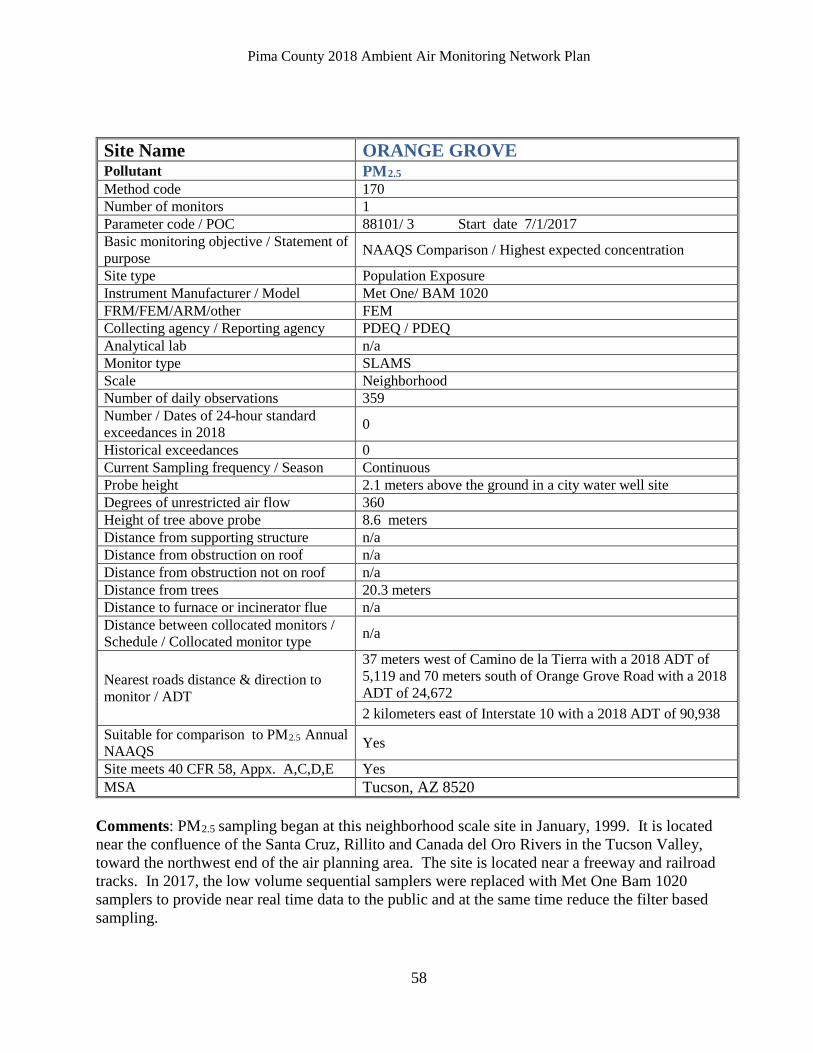
Pima County 2018 Ambient Air Monitoring Network Plan
58
Site Name ORANGE GROVE Pollutant PM2.5 Method code 170 Number of monitors 1 Parameter code / POC 88101/ 3 Start date 7/1/2017 Basic monitoring objective / Statement of purpose NAAQS Comparison / Highest expected concentration
Site type Population Exposure Instrument Manufacturer / Model Met One/ BAM 1020 FRM/FEM/ARM/other FEM Collecting agency / Reporting agency PDEQ / PDEQ Analytical lab n/a Monitor type SLAMS Scale Neighborhood Number of daily observations 359 Number / Dates of 24-hour standard exceedances in 2018 0
Historical exceedances 0 Current Sampling frequency / Season Continuous Probe height 2.1 meters above the ground in a city water well site Degrees of unrestricted air flow 360 Height of tree above probe 8.6 meters Distance from supporting structure n/a Distance from obstruction on roof n/a Distance from obstruction not on roof n/a Distance from trees 20.3 meters Distance to furnace or incinerator flue n/a Distance between collocated monitors / Schedule / Collocated monitor type n/a
Nearest roads distance & direction to monitor / ADT
37 meters west of Camino de la Tierra with a 2018 ADT of 5,119 and 70 meters south of Orange Grove Road with a 2018 ADT of 24,672 2 kilometers east of Interstate 10 with a 2018 ADT of 90,938
Suitable for comparison to PM2.5 Annual NAAQS Yes
Site meets 40 CFR 58, Appx. A,C,D,E Yes MSA Tucson, AZ 8520
Comments: PM2.5 sampling began at this neighborhood scale site in January, 1999. It is located near the confluence of the Santa Cruz, Rillito and Canada del Oro Rivers in the Tucson Valley, toward the northwest end of the air planning area. The site is located near a freeway and railroad tracks. In 2017, the low volume sequential samplers were replaced with Met One Bam 1020 samplers to provide near real time data to the public and at the same time reduce the filter based sampling.
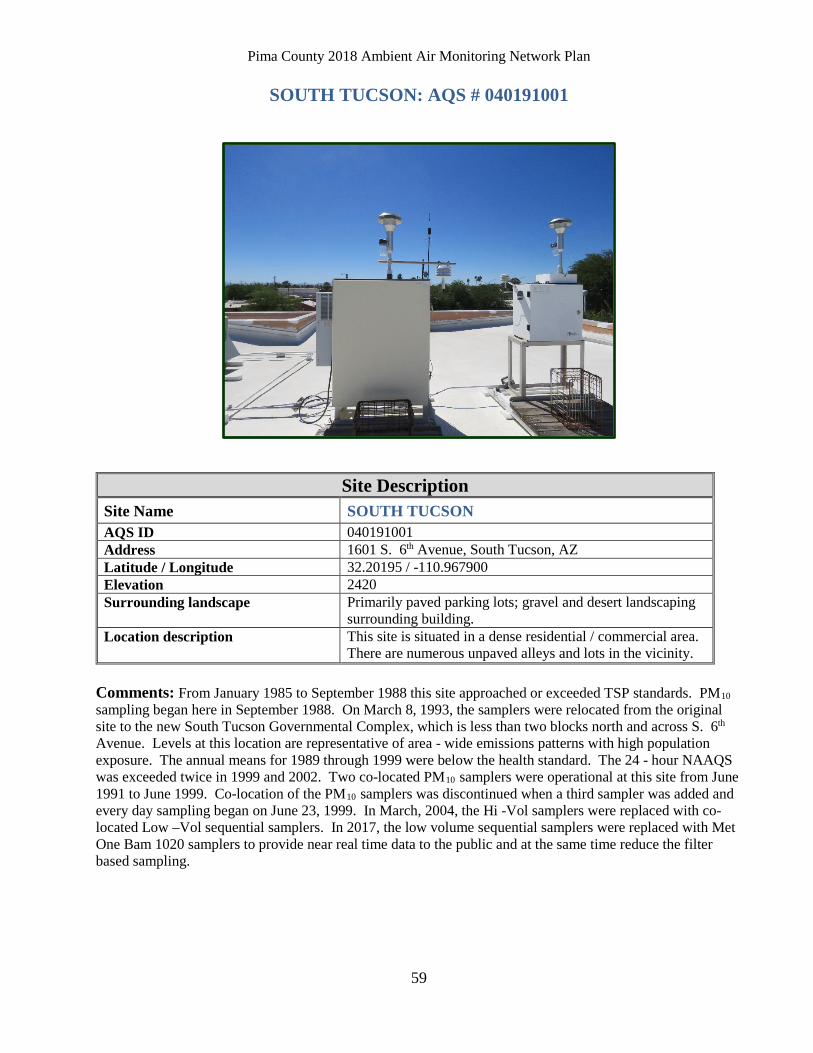
Pima County 2018 Ambient Air Monitoring Network Plan
59
SOUTH TUCSON: AQS # 040191001
Site Description Site Name SOUTH TUCSON AQS ID 040191001 Address 1601 S. 6th Avenue, South Tucson, AZ Latitude / Longitude 32.20195 / -110.967900 Elevation 2420 Surrounding landscape Primarily paved parking lots; gravel and desert landscaping
surrounding building. Location description This site is situated in a dense residential / commercial area.
There are numerous unpaved alleys and lots in the vicinity. Comments: From January 1985 to September 1988 this site approached or exceeded TSP standards. PM10 sampling began here in September 1988. On March 8, 1993, the samplers were relocated from the original site to the new South Tucson Governmental Complex, which is less than two blocks north and across S. 6th Avenue. Levels at this location are representative of area - wide emissions patterns with high population exposure. The annual means for 1989 through 1999 were below the health standard. The 24 - hour NAAQS was exceeded twice in 1999 and 2002. Two co-located PM10 samplers were operational at this site from June 1991 to June 1999. Co-location of the PM10 samplers was discontinued when a third sampler was added and every day sampling began on June 23, 1999. In March, 2004, the Hi -Vol samplers were replaced with co-located Low –Vol sequential samplers. In 2017, the low volume sequential samplers were replaced with Met One Bam 1020 samplers to provide near real time data to the public and at the same time reduce the filter based sampling.
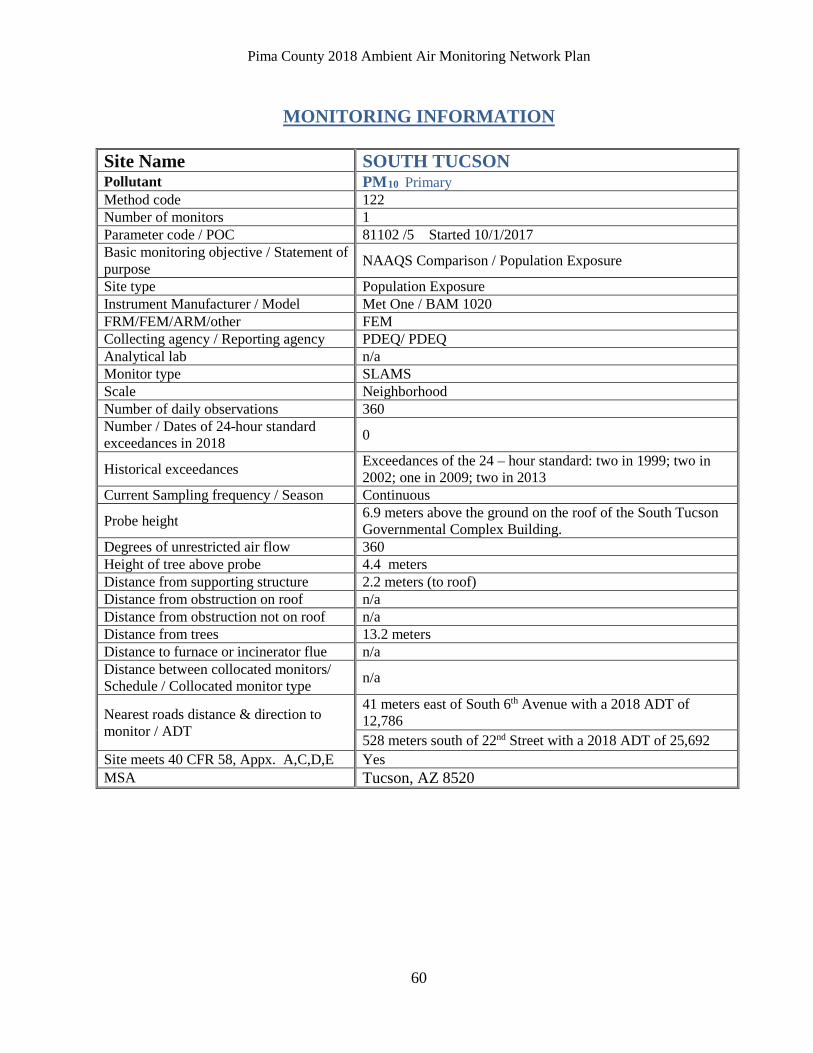
Pima County 2018 Ambient Air Monitoring Network Plan
60
MONITORING INFORMATION
Site Name SOUTH TUCSON Pollutant PM10 Primary Method code 122 Number of monitors 1 Parameter code / POC 81102 /5 Started 10/1/2017 Basic monitoring objective / Statement of purpose NAAQS Comparison / Population Exposure
Site type Population Exposure Instrument Manufacturer / Model Met One / BAM 1020 FRM/FEM/ARM/other FEM Collecting agency / Reporting agency PDEQ/ PDEQ Analytical lab n/a Monitor type SLAMS Scale Neighborhood Number of daily observations 360 Number / Dates of 24-hour standard exceedances in 2018 0
Historical exceedances Exceedances of the 24 – hour standard: two in 1999; two in 2002; one in 2009; two in 2013
Current Sampling frequency / Season Continuous
Probe height 6.9 meters above the ground on the roof of the South Tucson Governmental Complex Building.
Degrees of unrestricted air flow 360 Height of tree above probe 4.4 meters Distance from supporting structure 2.2 meters (to roof) Distance from obstruction on roof n/a Distance from obstruction not on roof n/a Distance from trees 13.2 meters Distance to furnace or incinerator flue n/a Distance between collocated monitors/ Schedule / Collocated monitor type n/a
Nearest roads distance & direction to monitor / ADT
41 meters east of South 6th Avenue with a 2018 ADT of 12,786 528 meters south of 22nd Street with a 2018 ADT of 25,692
Site meets 40 CFR 58, Appx. A,C,D,E Yes MSA Tucson, AZ 8520
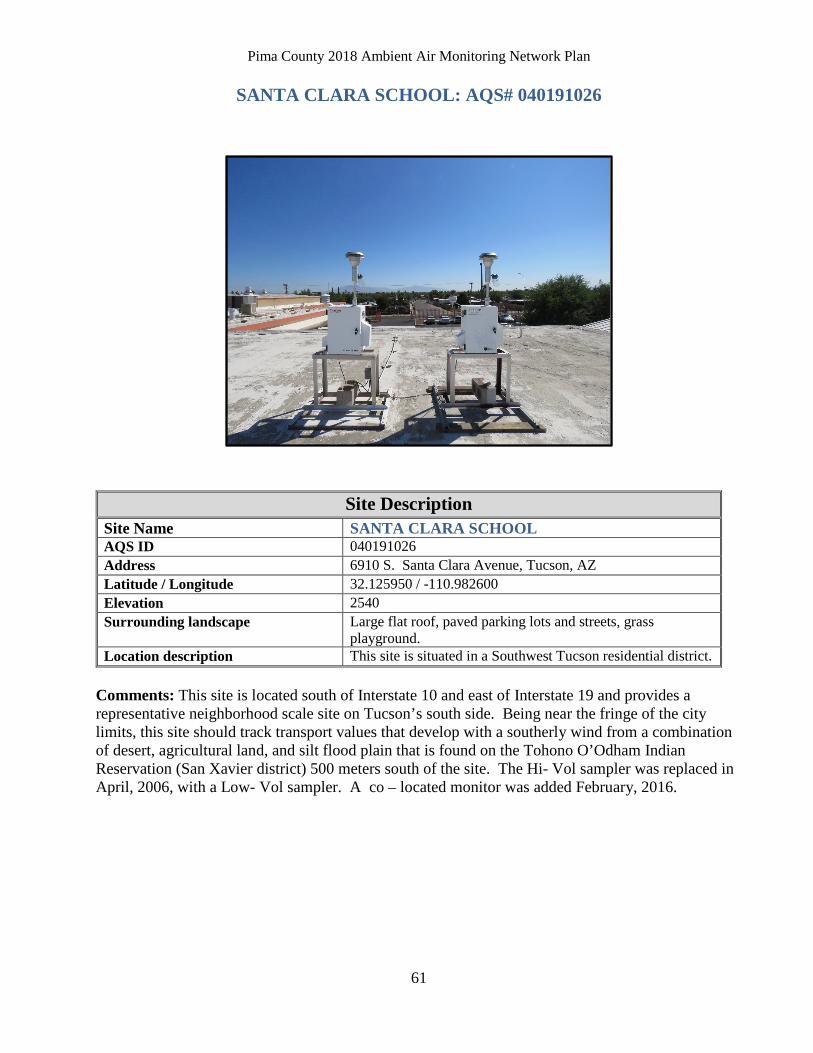
Pima County 2018 Ambient Air Monitoring Network Plan
61
SANTA CLARA SCHOOL: AQS# 040191026
Site Description Site Name SANTA CLARA SCHOOL AQS ID 040191026 Address 6910 S. Santa Clara Avenue, Tucson, AZ Latitude / Longitude 32.125950 / -110.982600 Elevation 2540 Surrounding landscape Large flat roof, paved parking lots and streets, grass
playground. Location description This site is situated in a Southwest Tucson residential district.
Comments: This site is located south of Interstate 10 and east of Interstate 19 and provides a representative neighborhood scale site on Tucson’s south side. Being near the fringe of the city limits, this site should track transport values that develop with a southerly wind from a combination of desert, agricultural land, and silt flood plain that is found on the Tohono O’Odham Indian Reservation (San Xavier district) 500 meters south of the site. The Hi- Vol sampler was replaced in April, 2006, with a Low- Vol sampler. A co – located monitor was added February, 2016.
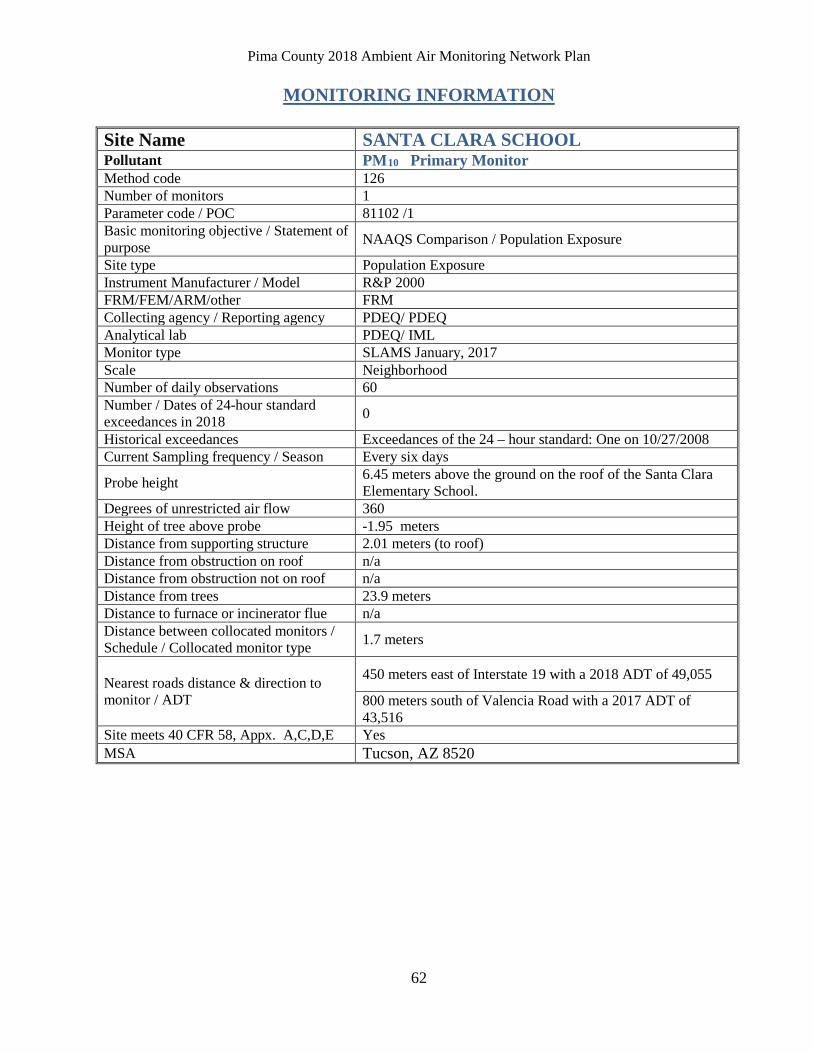
Pima County 2018 Ambient Air Monitoring Network Plan
62
MONITORING INFORMATION Site Name SANTA CLARA SCHOOL Pollutant PM10 Primary Monitor Method code 126 Number of monitors 1 Parameter code / POC 81102 /1 Basic monitoring objective / Statement of purpose NAAQS Comparison / Population Exposure
Site type Population Exposure Instrument Manufacturer / Model R&P 2000 FRM/FEM/ARM/other FRM Collecting agency / Reporting agency PDEQ/ PDEQ Analytical lab PDEQ/ IML Monitor type SLAMS January, 2017 Scale Neighborhood Number of daily observations 60 Number / Dates of 24-hour standard exceedances in 2018 0
Historical exceedances Exceedances of the 24 – hour standard: One on 10/27/2008 Current Sampling frequency / Season Every six days
Probe height 6.45 meters above the ground on the roof of the Santa Clara Elementary School.
Degrees of unrestricted air flow 360 Height of tree above probe -1.95 meters Distance from supporting structure 2.01 meters (to roof) Distance from obstruction on roof n/a Distance from obstruction not on roof n/a Distance from trees 23.9 meters Distance to furnace or incinerator flue n/a Distance between collocated monitors / Schedule / Collocated monitor type 1.7 meters
Nearest roads distance & direction to monitor / ADT
450 meters east of Interstate 19 with a 2018 ADT of 49,055
800 meters south of Valencia Road with a 2017 ADT of 43,516
Site meets 40 CFR 58, Appx. A,C,D,E Yes MSA Tucson, AZ 8520
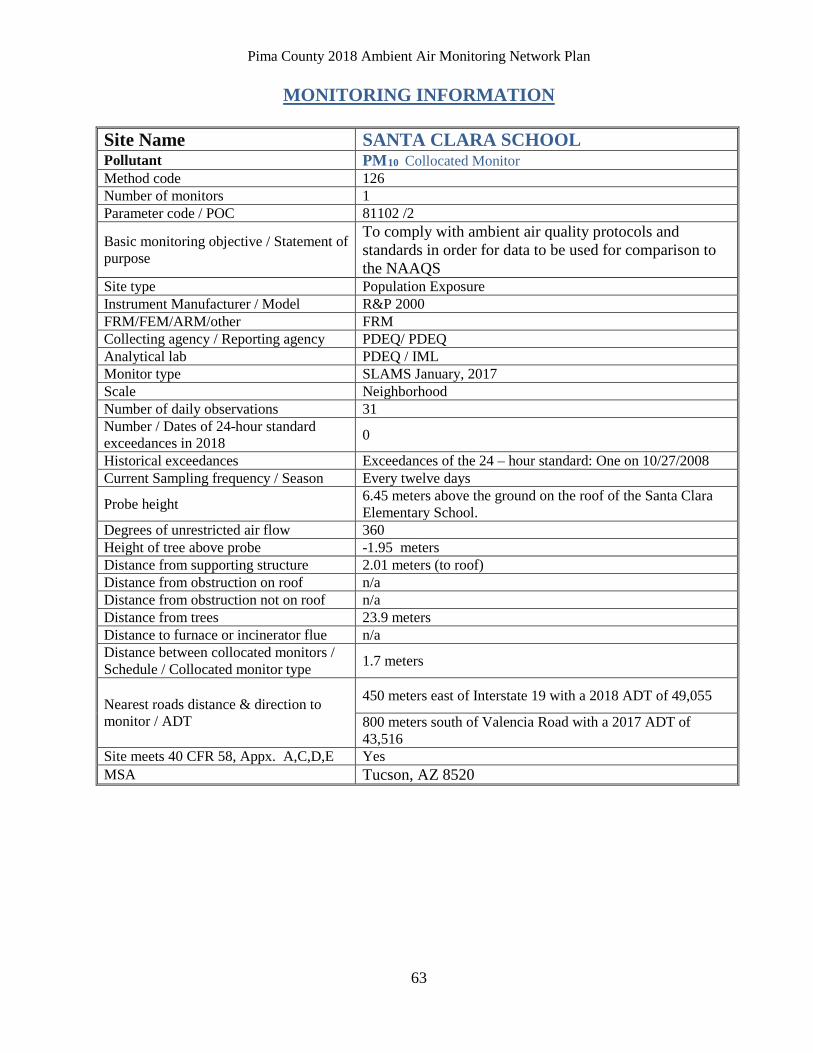
Pima County 2018 Ambient Air Monitoring Network Plan
63
MONITORING INFORMATION Site Name SANTA CLARA SCHOOL Pollutant PM10 Collocated Monitor Method code 126 Number of monitors 1 Parameter code / POC 81102 /2
Basic monitoring objective / Statement of purpose
To comply with ambient air quality protocols and standards in order for data to be used for comparison to the NAAQS
Site type Population Exposure Instrument Manufacturer / Model R&P 2000 FRM/FEM/ARM/other FRM Collecting agency / Reporting agency PDEQ/ PDEQ Analytical lab PDEQ / IML Monitor type SLAMS January, 2017 Scale Neighborhood Number of daily observations 31 Number / Dates of 24-hour standard exceedances in 2018 0
Historical exceedances Exceedances of the 24 – hour standard: One on 10/27/2008 Current Sampling frequency / Season Every twelve days
Probe height 6.45 meters above the ground on the roof of the Santa Clara Elementary School.
Degrees of unrestricted air flow 360 Height of tree above probe -1.95 meters Distance from supporting structure 2.01 meters (to roof) Distance from obstruction on roof n/a Distance from obstruction not on roof n/a Distance from trees 23.9 meters Distance to furnace or incinerator flue n/a Distance between collocated monitors / Schedule / Collocated monitor type 1.7 meters
Nearest roads distance & direction to monitor / ADT
450 meters east of Interstate 19 with a 2018 ADT of 49,055
800 meters south of Valencia Road with a 2017 ADT of 43,516
Site meets 40 CFR 58, Appx. A,C,D,E Yes MSA Tucson, AZ 8520
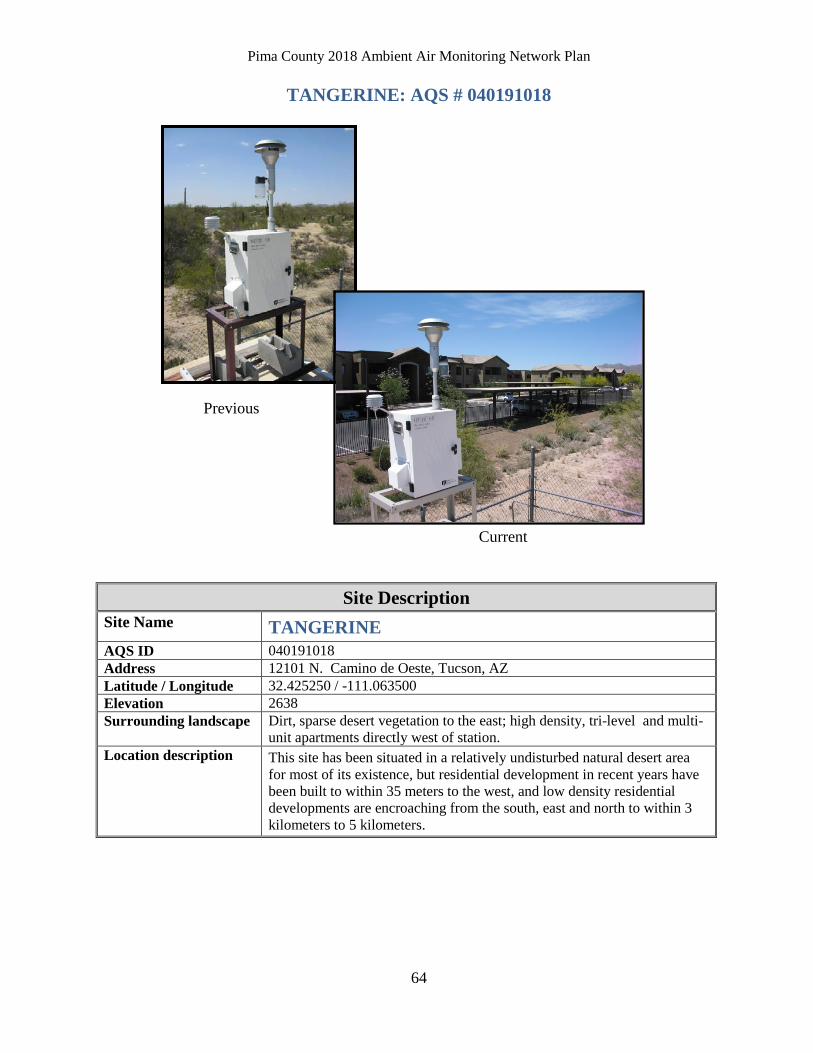
Pima County 2018 Ambient Air Monitoring Network Plan
64
TANGERINE: AQS # 040191018
Previous
Current
Site Description
Site Name TANGERINE AQS ID 040191018 Address 12101 N. Camino de Oeste, Tucson, AZ Latitude / Longitude 32.425250 / -111.063500 Elevation 2638 Surrounding landscape Dirt, sparse desert vegetation to the east; high density, tri-level and multi-
unit apartments directly west of station. Location description This site has been situated in a relatively undisturbed natural desert area
for most of its existence, but residential development in recent years have been built to within 35 meters to the west, and low density residential developments are encroaching from the south, east and north to within 3 kilometers to 5 kilometers.
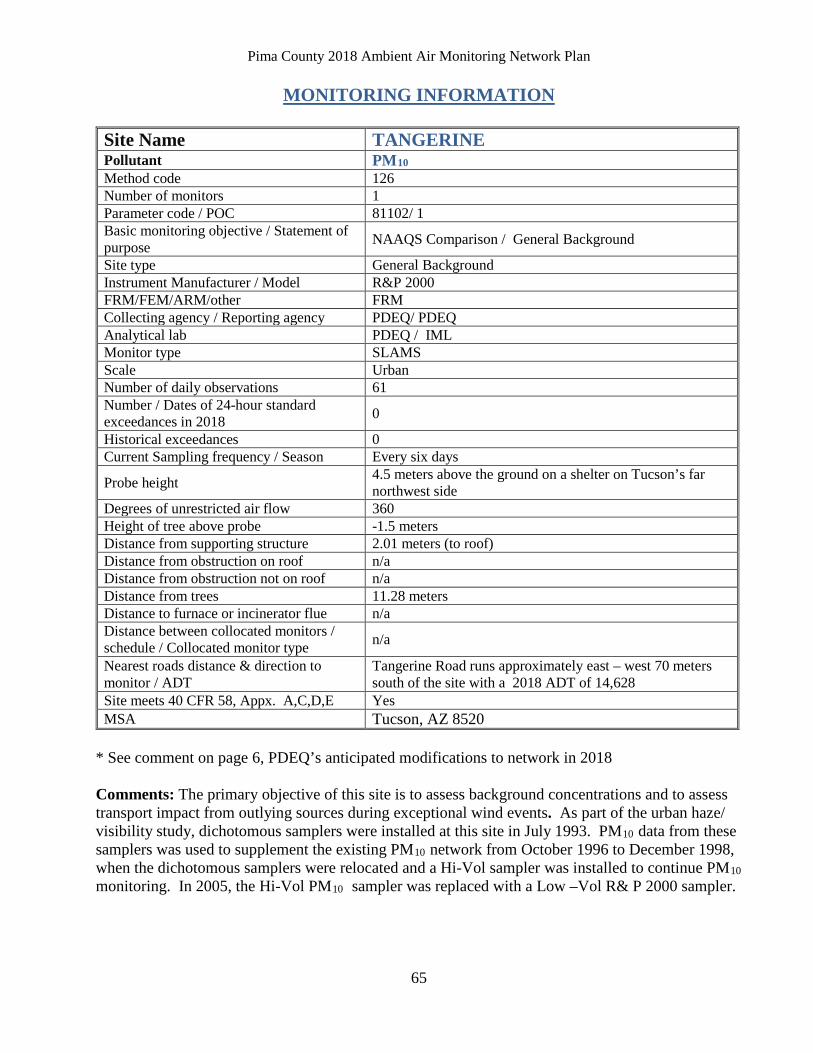
Pima County 2018 Ambient Air Monitoring Network Plan
65
MONITORING INFORMATION
Site Name TANGERINE Pollutant PM10 Method code 126 Number of monitors 1 Parameter code / POC 81102/ 1 Basic monitoring objective / Statement of purpose NAAQS Comparison / General Background
Site type General Background Instrument Manufacturer / Model R&P 2000 FRM/FEM/ARM/other FRM Collecting agency / Reporting agency PDEQ/ PDEQ Analytical lab PDEQ / IML Monitor type SLAMS Scale Urban Number of daily observations 61 Number / Dates of 24-hour standard exceedances in 2018 0
Historical exceedances 0 Current Sampling frequency / Season Every six days
Probe height 4.5 meters above the ground on a shelter on Tucson’s far northwest side
Degrees of unrestricted air flow 360 Height of tree above probe -1.5 meters Distance from supporting structure 2.01 meters (to roof) Distance from obstruction on roof n/a Distance from obstruction not on roof n/a Distance from trees 11.28 meters Distance to furnace or incinerator flue n/a Distance between collocated monitors / schedule / Collocated monitor type n/a
Nearest roads distance & direction to monitor / ADT
Tangerine Road runs approximately east – west 70 meters south of the site with a 2018 ADT of 14,628
Site meets 40 CFR 58, Appx. A,C,D,E Yes MSA Tucson, AZ 8520
* See comment on page 6, PDEQ’s anticipated modifications to network in 2018 Comments: The primary objective of this site is to assess background concentrations and to assess transport impact from outlying sources during exceptional wind events. As part of the urban haze/ visibility study, dichotomous samplers were installed at this site in July 1993. PM10 data from these samplers was used to supplement the existing PM10 network from October 1996 to December 1998, when the dichotomous samplers were relocated and a Hi-Vol sampler was installed to continue PM10 monitoring. In 2005, the Hi-Vol PM10 sampler was replaced with a Low –Vol R& P 2000 sampler.
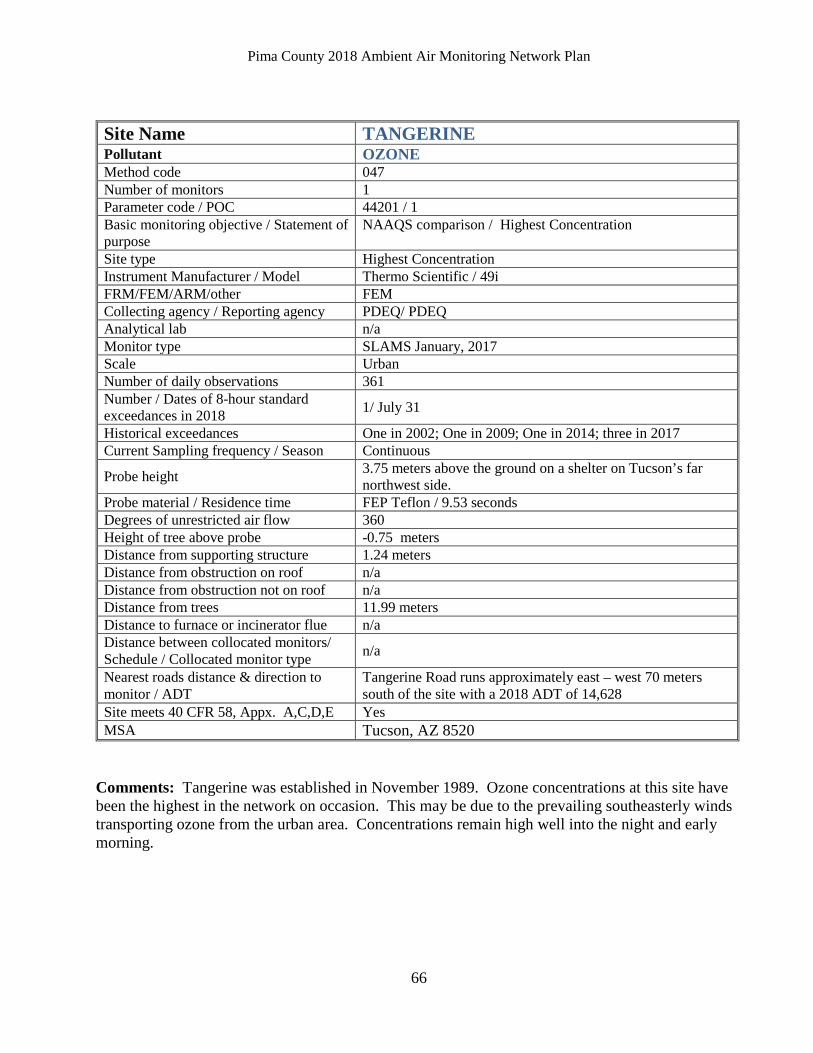
Pima County 2018 Ambient Air Monitoring Network Plan
66
Site Name TANGERINE Pollutant OZONE Method code 047 Number of monitors 1 Parameter code / POC 44201 / 1 Basic monitoring objective / Statement of purpose
NAAQS comparison / Highest Concentration
Site type Highest Concentration Instrument Manufacturer / Model Thermo Scientific / 49i FRM/FEM/ARM/other FEM Collecting agency / Reporting agency PDEQ/ PDEQ Analytical lab n/a Monitor type SLAMS January, 2017 Scale Urban Number of daily observations 361 Number / Dates of 8-hour standard exceedances in 2018 1/ July 31
Historical exceedances One in 2002; One in 2009; One in 2014; three in 2017 Current Sampling frequency / Season Continuous
Probe height 3.75 meters above the ground on a shelter on Tucson’s far northwest side.
Probe material / Residence time FEP Teflon / 9.53 seconds Degrees of unrestricted air flow 360 Height of tree above probe -0.75 meters Distance from supporting structure 1.24 meters Distance from obstruction on roof n/a Distance from obstruction not on roof n/a Distance from trees 11.99 meters Distance to furnace or incinerator flue n/a Distance between collocated monitors/ Schedule / Collocated monitor type n/a
Nearest roads distance & direction to monitor / ADT
Tangerine Road runs approximately east – west 70 meters south of the site with a 2018 ADT of 14,628
Site meets 40 CFR 58, Appx. A,C,D,E Yes MSA Tucson, AZ 8520
Comments: Tangerine was established in November 1989. Ozone concentrations at this site have been the highest in the network on occasion. This may be due to the prevailing southeasterly winds transporting ozone from the urban area. Concentrations remain high well into the night and early morning.
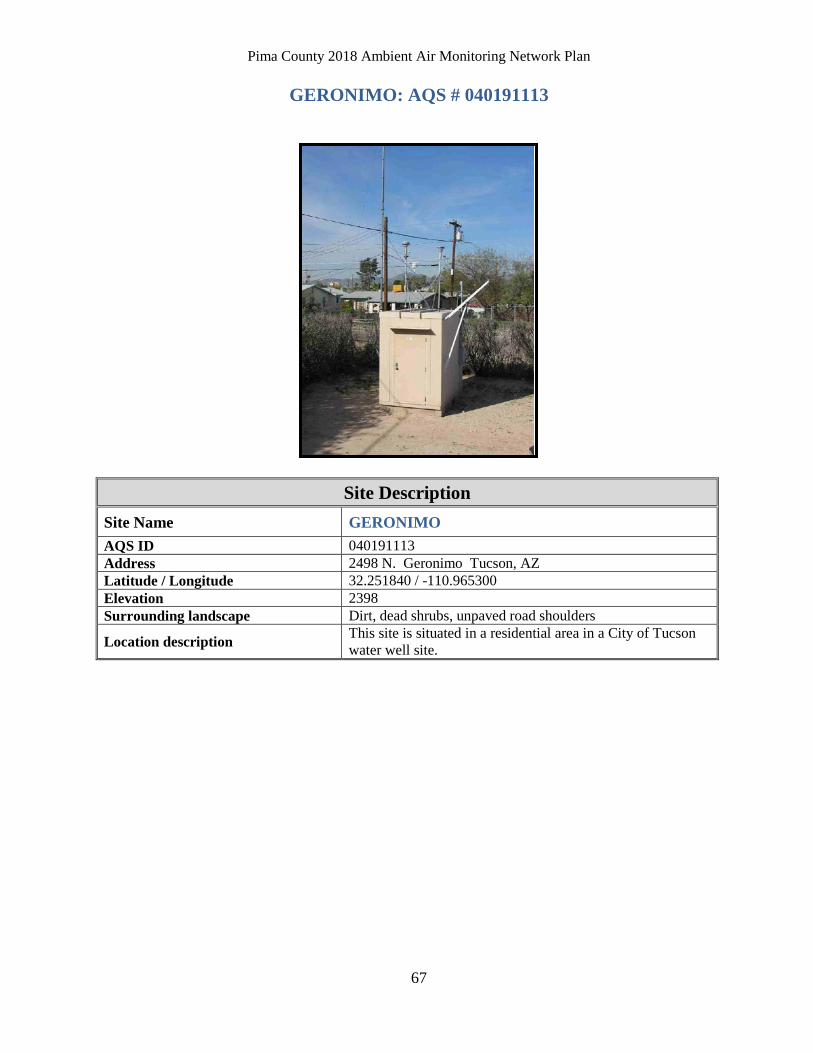
Pima County 2018 Ambient Air Monitoring Network Plan
67
GERONIMO: AQS # 040191113
Site Description Site Name GERONIMO AQS ID 040191113 Address 2498 N. Geronimo Tucson, AZ Latitude / Longitude 32.251840 / -110.965300 Elevation 2398 Surrounding landscape Dirt, dead shrubs, unpaved road shoulders
Location description This site is situated in a residential area in a City of Tucson water well site.
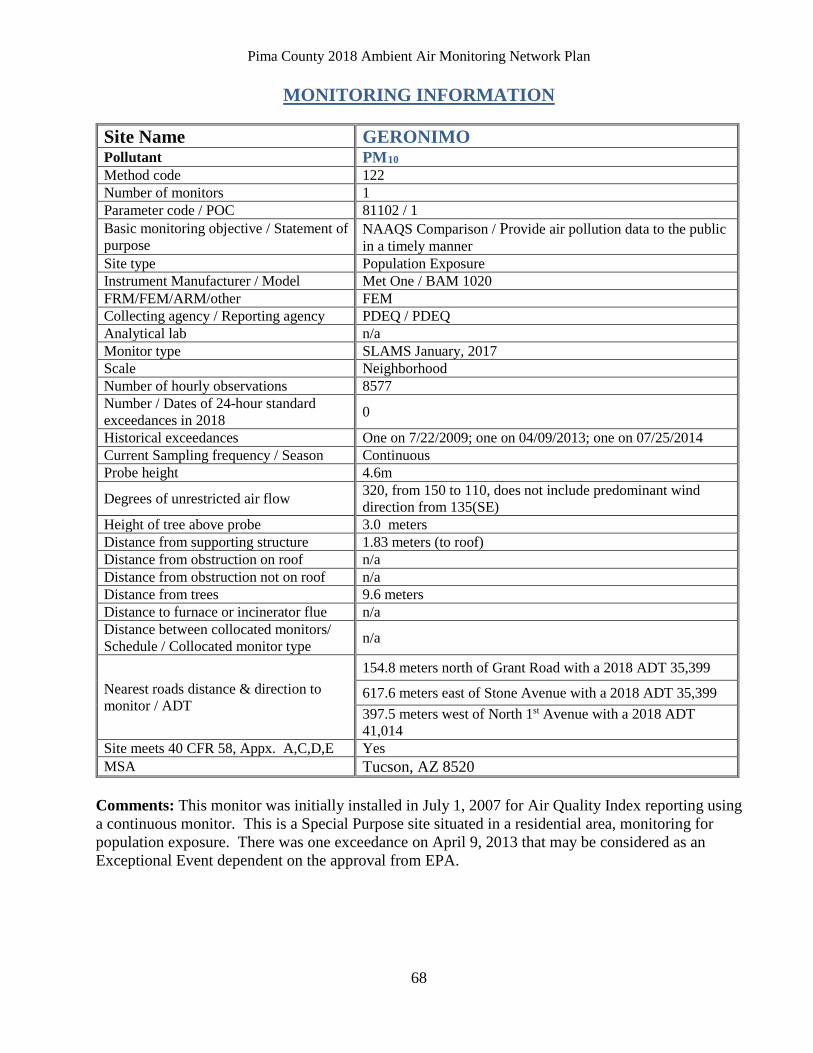
Pima County 2018 Ambient Air Monitoring Network Plan
68
MONITORING INFORMATION Site Name GERONIMO Pollutant PM10 Method code 122 Number of monitors 1 Parameter code / POC 81102 / 1 Basic monitoring objective / Statement of purpose
NAAQS Comparison / Provide air pollution data to the public in a timely manner
Site type Population Exposure Instrument Manufacturer / Model Met One / BAM 1020 FRM/FEM/ARM/other FEM Collecting agency / Reporting agency PDEQ / PDEQ Analytical lab n/a Monitor type SLAMS January, 2017 Scale Neighborhood Number of hourly observations 8577 Number / Dates of 24-hour standard exceedances in 2018 0
Historical exceedances One on 7/22/2009; one on 04/09/2013; one on 07/25/2014 Current Sampling frequency / Season Continuous Probe height 4.6m
Degrees of unrestricted air flow 320, from 150 to 110, does not include predominant wind direction from 135(SE)
Height of tree above probe 3.0 meters Distance from supporting structure 1.83 meters (to roof) Distance from obstruction on roof n/a Distance from obstruction not on roof n/a Distance from trees 9.6 meters Distance to furnace or incinerator flue n/a Distance between collocated monitors/ Schedule / Collocated monitor type n/a
Nearest roads distance & direction to monitor / ADT
154.8 meters north of Grant Road with a 2018 ADT 35,399
617.6 meters east of Stone Avenue with a 2018 ADT 35,399 397.5 meters west of North 1st Avenue with a 2018 ADT 41,014
Site meets 40 CFR 58, Appx. A,C,D,E Yes MSA Tucson, AZ 8520
Comments: This monitor was initially installed in July 1, 2007 for Air Quality Index reporting using a continuous monitor. This is a Special Purpose site situated in a residential area, monitoring for population exposure. There was one exceedance on April 9, 2013 that may be considered as an Exceptional Event dependent on the approval from EPA.
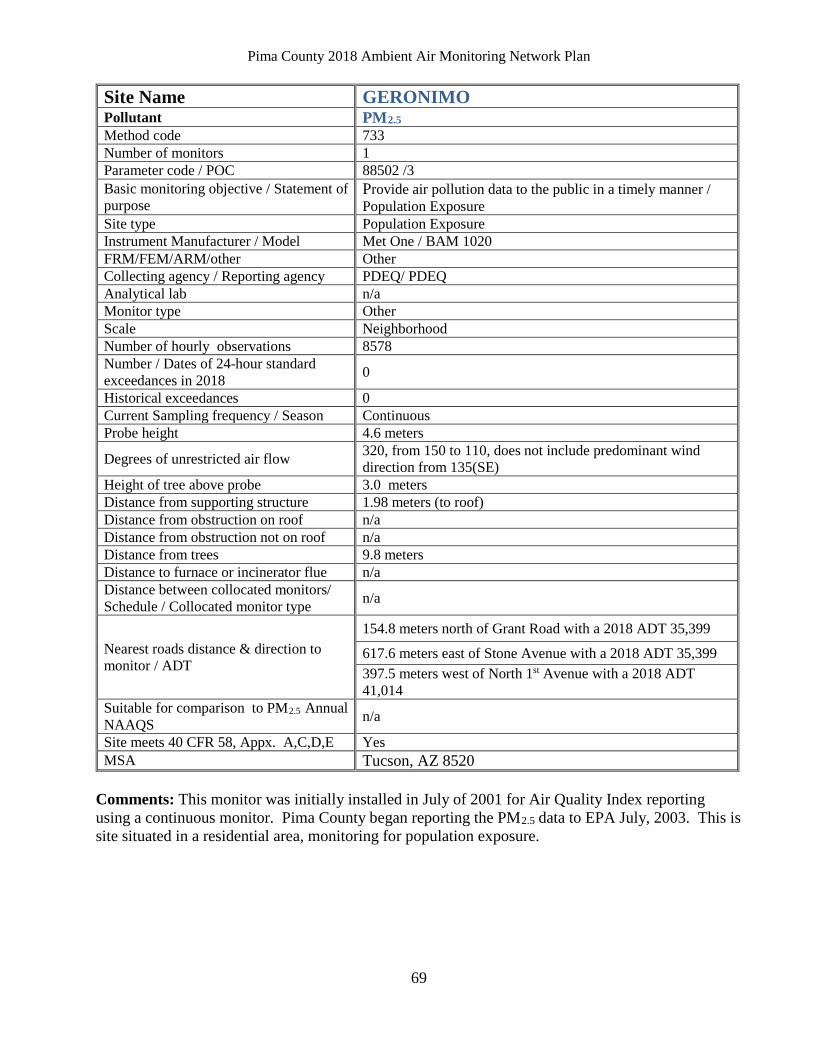
Pima County 2018 Ambient Air Monitoring Network Plan
69
Site Name GERONIMO Pollutant PM2.5 Method code 733 Number of monitors 1 Parameter code / POC 88502 /3 Basic monitoring objective / Statement of purpose
Provide air pollution data to the public in a timely manner / Population Exposure
Site type Population Exposure Instrument Manufacturer / Model Met One / BAM 1020 FRM/FEM/ARM/other Other Collecting agency / Reporting agency PDEQ/ PDEQ Analytical lab n/a Monitor type Other Scale Neighborhood Number of hourly observations 8578 Number / Dates of 24-hour standard exceedances in 2018 0
Historical exceedances 0 Current Sampling frequency / Season Continuous Probe height 4.6 meters
Degrees of unrestricted air flow 320, from 150 to 110, does not include predominant wind direction from 135(SE)
Height of tree above probe 3.0 meters Distance from supporting structure 1.98 meters (to roof) Distance from obstruction on roof n/a Distance from obstruction not on roof n/a Distance from trees 9.8 meters Distance to furnace or incinerator flue n/a Distance between collocated monitors/ Schedule / Collocated monitor type n/a
Nearest roads distance & direction to monitor / ADT
154.8 meters north of Grant Road with a 2018 ADT 35,399
617.6 meters east of Stone Avenue with a 2018 ADT 35,399 397.5 meters west of North 1st Avenue with a 2018 ADT 41,014
Suitable for comparison to PM2.5 Annual NAAQS n/a
Site meets 40 CFR 58, Appx. A,C,D,E Yes MSA Tucson, AZ 8520
Comments: This monitor was initially installed in July of 2001 for Air Quality Index reporting using a continuous monitor. Pima County began reporting the PM2.5 data to EPA July, 2003. This is site situated in a residential area, monitoring for population exposure.
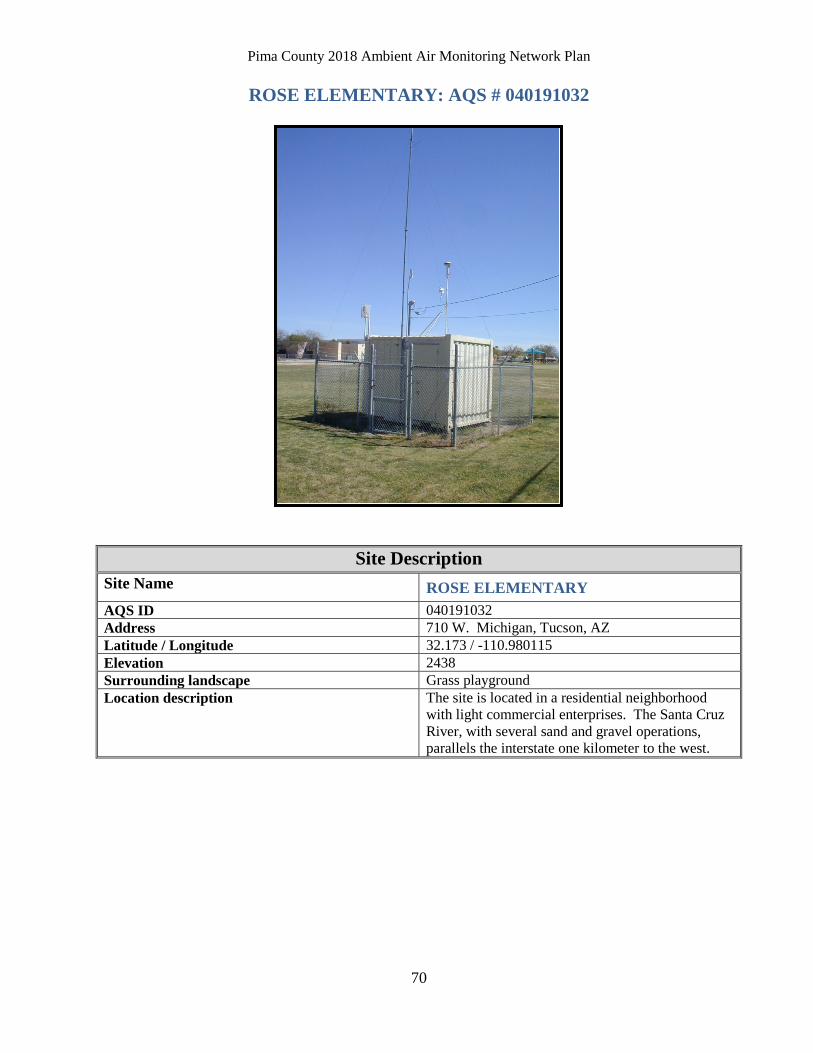
Pima County 2018 Ambient Air Monitoring Network Plan
70
ROSE ELEMENTARY: AQS # 040191032
Site Description Site Name ROSE ELEMENTARY AQS ID 040191032 Address 710 W. Michigan, Tucson, AZ Latitude / Longitude 32.173 / -110.980115 Elevation 2438 Surrounding landscape Grass playground Location description The site is located in a residential neighborhood
with light commercial enterprises. The Santa Cruz River, with several sand and gravel operations, parallels the interstate one kilometer to the west.
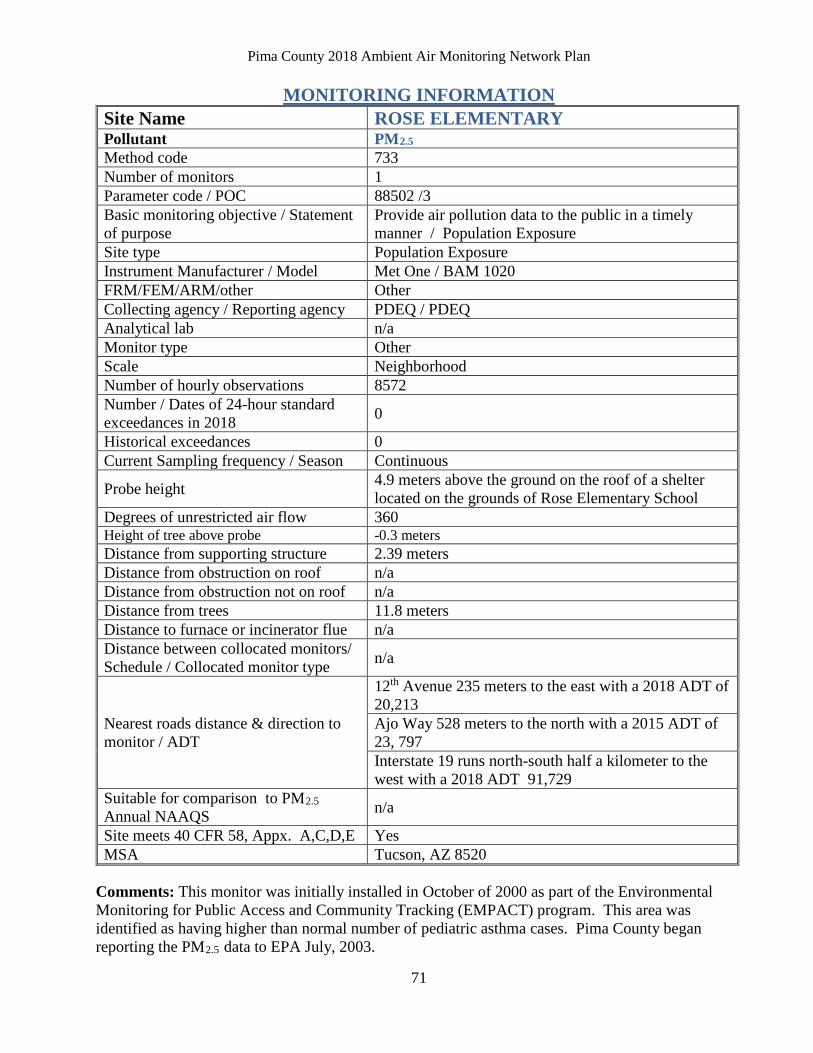
Pima County 2018 Ambient Air Monitoring Network Plan
71
MONITORING INFORMATION Site Name ROSE ELEMENTARY Pollutant PM2.5 Method code 733 Number of monitors 1 Parameter code / POC 88502 /3 Basic monitoring objective / Statement of purpose
Provide air pollution data to the public in a timely manner / Population Exposure
Site type Population Exposure Instrument Manufacturer / Model Met One / BAM 1020 FRM/FEM/ARM/other Other Collecting agency / Reporting agency PDEQ / PDEQ Analytical lab n/a Monitor type Other Scale Neighborhood Number of hourly observations 8572 Number / Dates of 24-hour standard exceedances in 2018 0
Historical exceedances 0 Current Sampling frequency / Season Continuous
Probe height 4.9 meters above the ground on the roof of a shelter located on the grounds of Rose Elementary School
Degrees of unrestricted air flow 360 Height of tree above probe -0.3 meters Distance from supporting structure 2.39 meters Distance from obstruction on roof n/a Distance from obstruction not on roof n/a Distance from trees 11.8 meters Distance to furnace or incinerator flue n/a Distance between collocated monitors/ Schedule / Collocated monitor type n/a
Nearest roads distance & direction to monitor / ADT
12th Avenue 235 meters to the east with a 2018 ADT of 20,213 Ajo Way 528 meters to the north with a 2015 ADT of 23, 797 Interstate 19 runs north-south half a kilometer to the west with a 2018 ADT 91,729
Suitable for comparison to PM2.5 Annual NAAQS n/a
Site meets 40 CFR 58, Appx. A,C,D,E Yes MSA Tucson, AZ 8520
Comments: This monitor was initially installed in October of 2000 as part of the Environmental Monitoring for Public Access and Community Tracking (EMPACT) program. This area was identified as having higher than normal number of pediatric asthma cases. Pima County began reporting the PM2.5 data to EPA July, 2003.
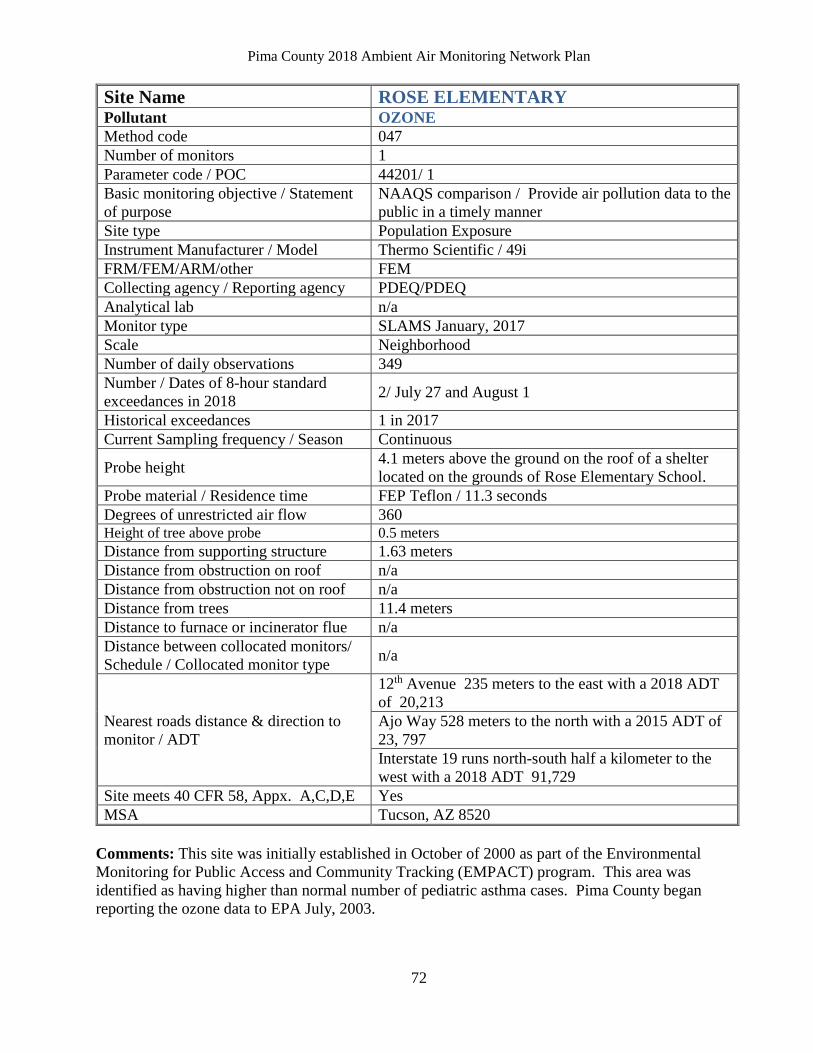
Pima County 2018 Ambient Air Monitoring Network Plan
72
Site Name ROSE ELEMENTARY Pollutant OZONE Method code 047 Number of monitors 1 Parameter code / POC 44201/ 1 Basic monitoring objective / Statement of purpose
NAAQS comparison / Provide air pollution data to the public in a timely manner
Site type Population Exposure Instrument Manufacturer / Model Thermo Scientific / 49i FRM/FEM/ARM/other FEM Collecting agency / Reporting agency PDEQ/PDEQ Analytical lab n/a Monitor type SLAMS January, 2017 Scale Neighborhood Number of daily observations 349 Number / Dates of 8-hour standard exceedances in 2018 2/ July 27 and August 1
Historical exceedances 1 in 2017 Current Sampling frequency / Season Continuous
Probe height 4.1 meters above the ground on the roof of a shelter located on the grounds of Rose Elementary School.
Probe material / Residence time FEP Teflon / 11.3 seconds Degrees of unrestricted air flow 360 Height of tree above probe 0.5 meters Distance from supporting structure 1.63 meters Distance from obstruction on roof n/a Distance from obstruction not on roof n/a Distance from trees 11.4 meters Distance to furnace or incinerator flue n/a Distance between collocated monitors/ Schedule / Collocated monitor type n/a
Nearest roads distance & direction to monitor / ADT
12th Avenue 235 meters to the east with a 2018 ADT of 20,213 Ajo Way 528 meters to the north with a 2015 ADT of 23, 797 Interstate 19 runs north-south half a kilometer to the west with a 2018 ADT 91,729
Site meets 40 CFR 58, Appx. A,C,D,E Yes MSA Tucson, AZ 8520
Comments: This site was initially established in October of 2000 as part of the Environmental Monitoring for Public Access and Community Tracking (EMPACT) program. This area was identified as having higher than normal number of pediatric asthma cases. Pima County began reporting the ozone data to EPA July, 2003.
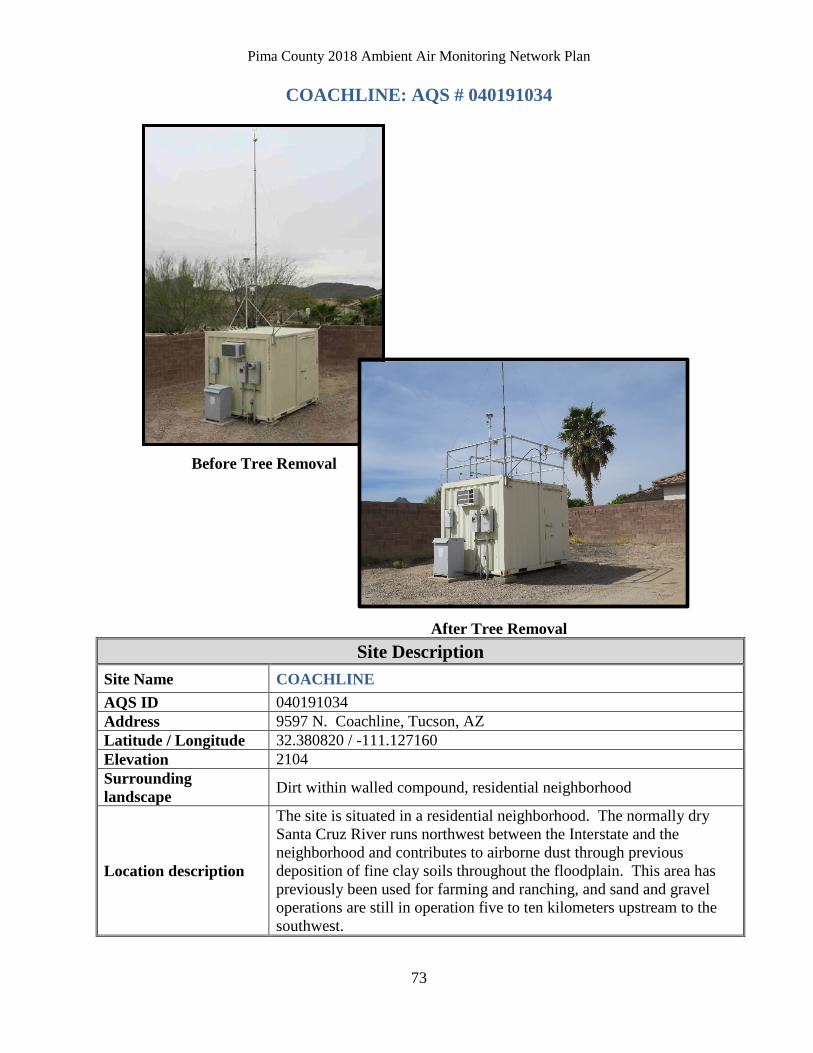
Pima County 2018 Ambient Air Monitoring Network Plan
73
COACHLINE: AQS # 040191034
Before Tree Removal
After Tree Removal Site Description
Site Name COACHLINE AQS ID 040191034 Address 9597 N. Coachline, Tucson, AZ Latitude / Longitude 32.380820 / -111.127160 Elevation 2104 Surrounding landscape Dirt within walled compound, residential neighborhood
Location description
The site is situated in a residential neighborhood. The normally dry Santa Cruz River runs northwest between the Interstate and the neighborhood and contributes to airborne dust through previous deposition of fine clay soils throughout the floodplain. This area has previously been used for farming and ranching, and sand and gravel operations are still in operation five to ten kilometers upstream to the southwest.
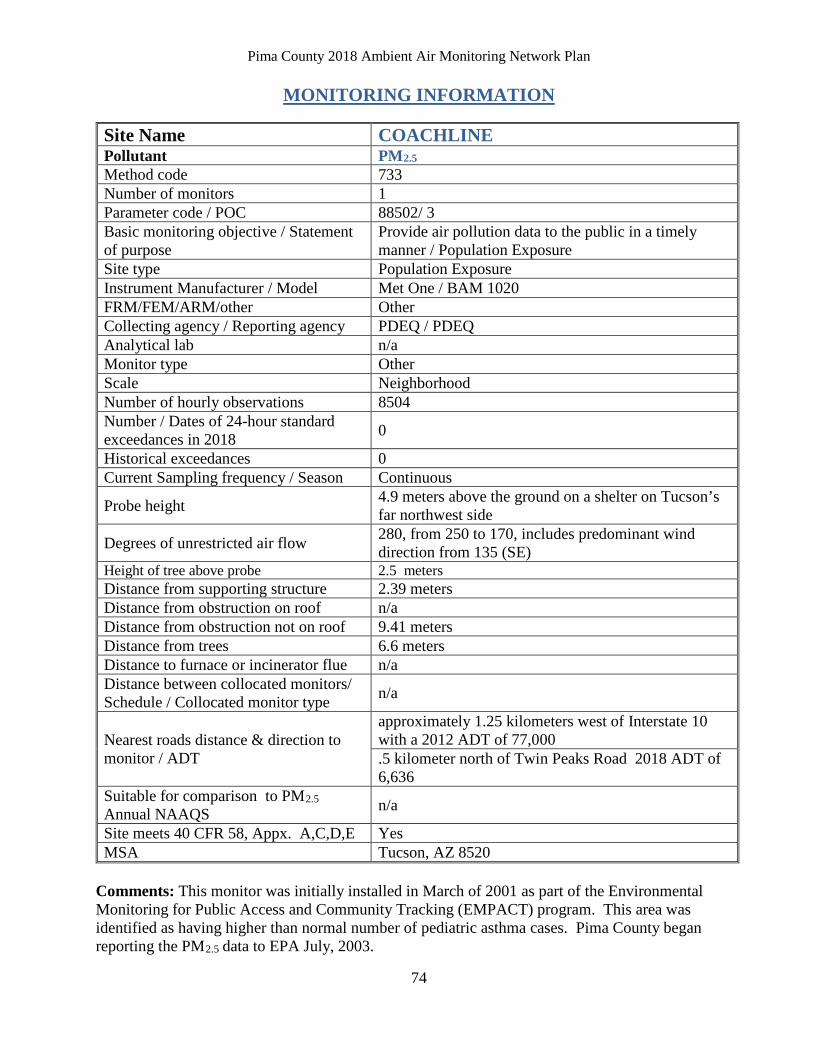
Pima County 2018 Ambient Air Monitoring Network Plan
74
MONITORING INFORMATION Site Name COACHLINE Pollutant PM2.5 Method code 733 Number of monitors 1 Parameter code / POC 88502/ 3 Basic monitoring objective / Statement of purpose
Provide air pollution data to the public in a timely manner / Population Exposure
Site type Population Exposure Instrument Manufacturer / Model Met One / BAM 1020 FRM/FEM/ARM/other Other Collecting agency / Reporting agency PDEQ / PDEQ Analytical lab n/a Monitor type Other Scale Neighborhood Number of hourly observations 8504 Number / Dates of 24-hour standard exceedances in 2018 0
Historical exceedances 0 Current Sampling frequency / Season Continuous
Probe height 4.9 meters above the ground on a shelter on Tucson’s far northwest side
Degrees of unrestricted air flow 280, from 250 to 170, includes predominant wind direction from 135 (SE)
Height of tree above probe 2.5 meters Distance from supporting structure 2.39 meters Distance from obstruction on roof n/a Distance from obstruction not on roof 9.41 meters Distance from trees 6.6 meters Distance to furnace or incinerator flue n/a Distance between collocated monitors/ Schedule / Collocated monitor type n/a
Nearest roads distance & direction to monitor / ADT
approximately 1.25 kilometers west of Interstate 10 with a 2012 ADT of 77,000 .5 kilometer north of Twin Peaks Road 2018 ADT of 6,636
Suitable for comparison to PM2.5 Annual NAAQS n/a
Site meets 40 CFR 58, Appx. A,C,D,E Yes MSA Tucson, AZ 8520
Comments: This monitor was initially installed in March of 2001 as part of the Environmental Monitoring for Public Access and Community Tracking (EMPACT) program. This area was identified as having higher than normal number of pediatric asthma cases. Pima County began reporting the PM2.5 data to EPA July, 2003.
Pima County 2018 Ambient Air Monitoring Network Plan
75
Site Name COACHLINE Pollutant OZONE Method code 047 Number of monitors 1 Parameter code / POC 44201 / 1 Basic monitoring objective / Statement of purpose
NAAQS comparison / Provide air pollution data to the public in a timely manner
Site type Population Exposure Instrument Manufacturer/Model Thermo Scientific / 49i FRM/FEM/ARM/other FEM Collecting agency / Reporting agency PDEQ / PDEQ Analytical lab n/a Monitor type SLAMS January, 2017 Scale Neighborhood Number of daily observations 356 Number / Dates of 8-hour standard exceedances in 2018 2/ July 31 and August 1
Historical exceedances 2 in 2017 Current Sampling frequency / Season Continuous
Probe height 3.4 meters above the ground on a shelter on Tucson’s far northwest side
Probe material / Residence time FEP Teflon / 11.41 seconds
Degrees of unrestricted air flow 310, from 230 to 180, includes predominant wind direction from 135 (SE)
Height of tree above probe 4.0 meters Distance from supporting structure 1.3 meters Distance from obstruction on roof n/a Distance from obstruction not on roof n/a Distance from trees 7 meters Distance to furnace or incinerator flue n/a Distance between collocated monitors/ Schedule / Collocated monitor type n/a
Nearest roads distance & direction to monitor / ADT
approximately 1.25 kilometers west of Interstate 10 with a 2012 ADT of 77,000
.5 kilometer north of Twin Peaks Road 2018 ADT of 6,636 Site meets 40 CFR 58, Appx. A,C,D,E Yes MSA Tucson, AZ 8520
Comments: This site was initially established in April of 2001 as part of the Environmental Monitoring for Public Access and Community Tracking (EMPACT) program. This area was identified as having higher than normal number of pediatric asthma cases. Pima County began reporting the ozone data to EPA July, 2003.
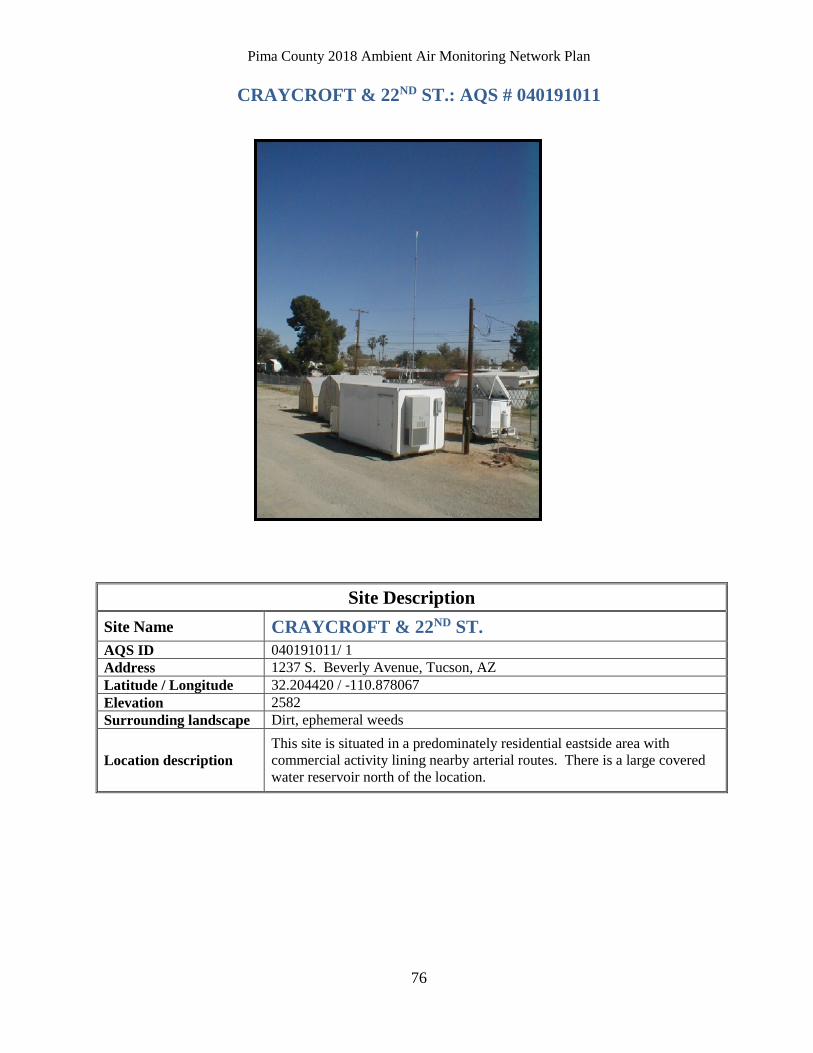
Pima County 2018 Ambient Air Monitoring Network Plan
76
CRAYCROFT & 22ND ST.: AQS # 040191011
Site Description Site Name CRAYCROFT & 22ND ST. AQS ID 040191011/ 1 Address 1237 S. Beverly Avenue, Tucson, AZ Latitude / Longitude 32.204420 / -110.878067 Elevation 2582 Surrounding landscape Dirt, ephemeral weeds
Location description This site is situated in a predominately residential eastside area with commercial activity lining nearby arterial routes. There is a large covered water reservoir north of the location.
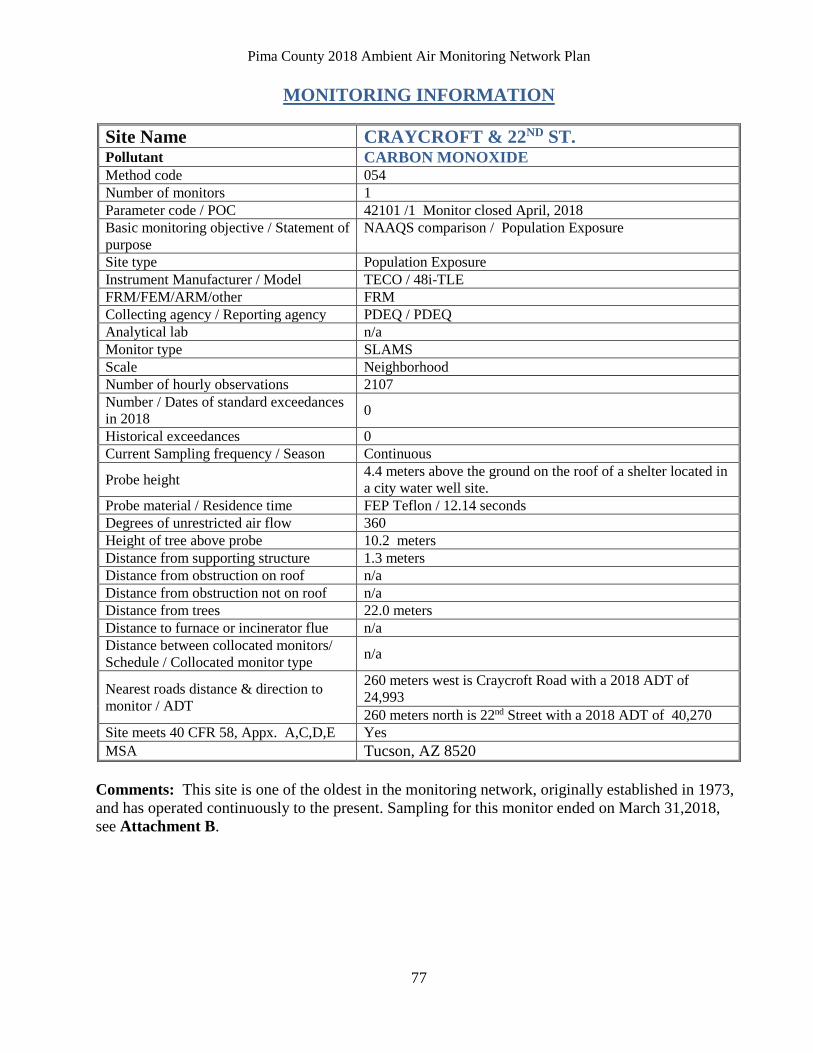
Pima County 2018 Ambient Air Monitoring Network Plan
77
MONITORING INFORMATION
Site Name CRAYCROFT & 22ND ST. Pollutant CARBON MONOXIDE Method code 054 Number of monitors 1 Parameter code / POC 42101 /1 Monitor closed April, 2018 Basic monitoring objective / Statement of purpose
NAAQS comparison / Population Exposure
Site type Population Exposure Instrument Manufacturer / Model TECO / 48i-TLE FRM/FEM/ARM/other FRM Collecting agency / Reporting agency PDEQ / PDEQ Analytical lab n/a Monitor type SLAMS Scale Neighborhood Number of hourly observations 2107 Number / Dates of standard exceedances in 2018 0
Historical exceedances 0 Current Sampling frequency / Season Continuous
Probe height 4.4 meters above the ground on the roof of a shelter located in a city water well site.
Probe material / Residence time FEP Teflon / 12.14 seconds Degrees of unrestricted air flow 360 Height of tree above probe 10.2 meters Distance from supporting structure 1.3 meters Distance from obstruction on roof n/a Distance from obstruction not on roof n/a Distance from trees 22.0 meters Distance to furnace or incinerator flue n/a Distance between collocated monitors/ Schedule / Collocated monitor type n/a
Nearest roads distance & direction to monitor / ADT
260 meters west is Craycroft Road with a 2018 ADT of 24,993 260 meters north is 22nd Street with a 2018 ADT of 40,270
Site meets 40 CFR 58, Appx. A,C,D,E Yes MSA Tucson, AZ 8520
Comments: This site is one of the oldest in the monitoring network, originally established in 1973, and has operated continuously to the present. Sampling for this monitor ended on March 31,2018, see Attachment B.
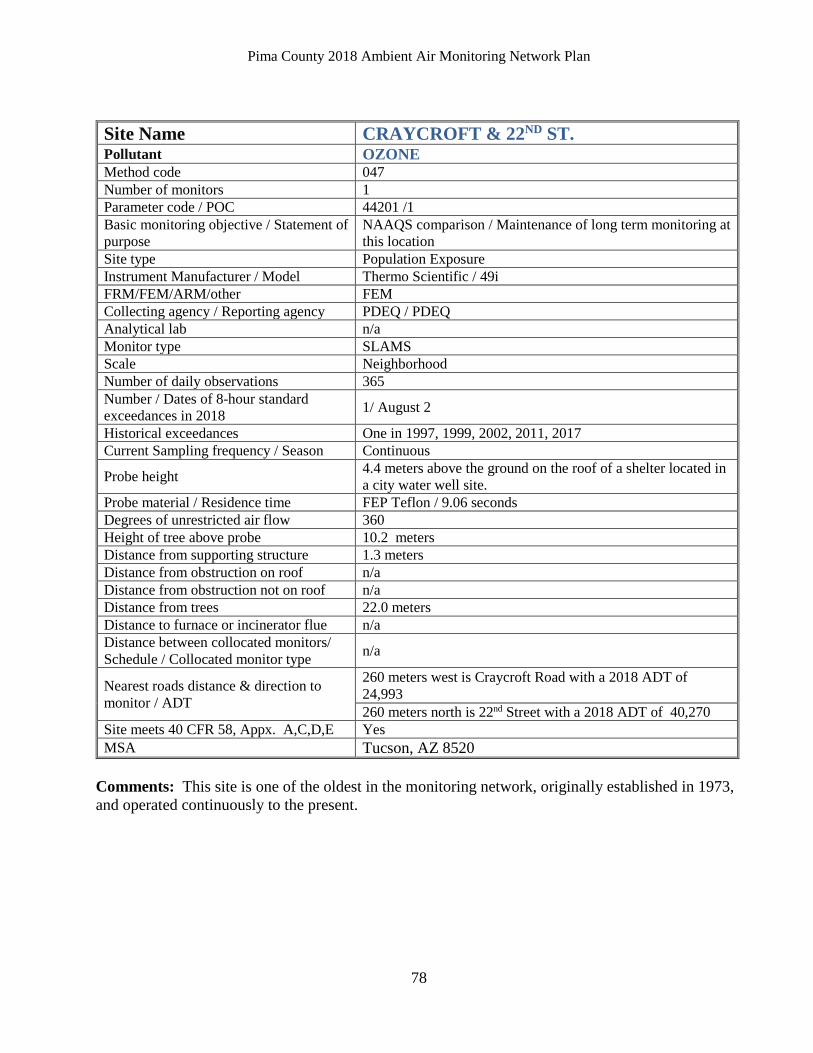
Pima County 2018 Ambient Air Monitoring Network Plan
78
Site Name CRAYCROFT & 22ND ST. Pollutant OZONE Method code 047 Number of monitors 1 Parameter code / POC 44201 /1 Basic monitoring objective / Statement of purpose
NAAQS comparison / Maintenance of long term monitoring at this location
Site type Population Exposure Instrument Manufacturer / Model Thermo Scientific / 49i FRM/FEM/ARM/other FEM Collecting agency / Reporting agency PDEQ / PDEQ Analytical lab n/a Monitor type SLAMS Scale Neighborhood Number of daily observations 365 Number / Dates of 8-hour standard exceedances in 2018 1/ August 2
Historical exceedances One in 1997, 1999, 2002, 2011, 2017 Current Sampling frequency / Season Continuous
Probe height 4.4 meters above the ground on the roof of a shelter located in a city water well site.
Probe material / Residence time FEP Teflon / 9.06 seconds Degrees of unrestricted air flow 360 Height of tree above probe 10.2 meters Distance from supporting structure 1.3 meters Distance from obstruction on roof n/a Distance from obstruction not on roof n/a Distance from trees 22.0 meters Distance to furnace or incinerator flue n/a Distance between collocated monitors/ Schedule / Collocated monitor type n/a
Nearest roads distance & direction to monitor / ADT
260 meters west is Craycroft Road with a 2018 ADT of 24,993 260 meters north is 22nd Street with a 2018 ADT of 40,270
Site meets 40 CFR 58, Appx. A,C,D,E Yes MSA Tucson, AZ 8520
Comments: This site is one of the oldest in the monitoring network, originally established in 1973, and operated continuously to the present.
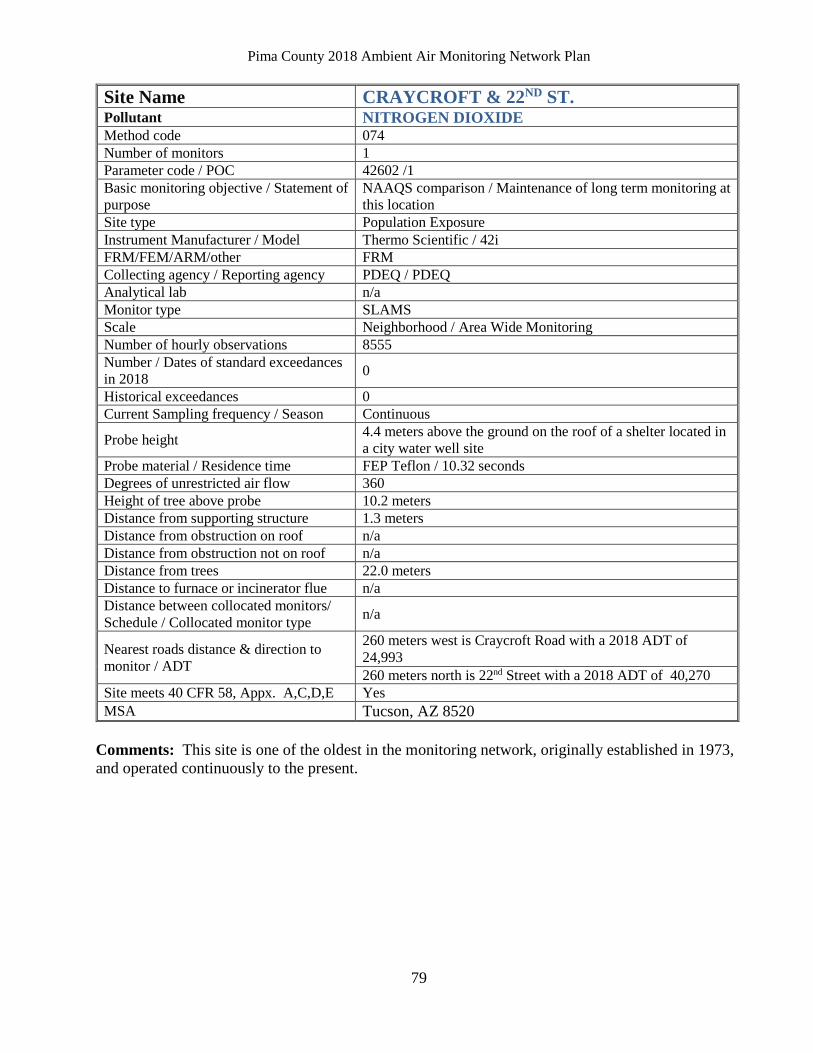
Pima County 2018 Ambient Air Monitoring Network Plan
79
Site Name CRAYCROFT & 22ND ST. Pollutant NITROGEN DIOXIDE Method code 074 Number of monitors 1 Parameter code / POC 42602 /1 Basic monitoring objective / Statement of purpose
NAAQS comparison / Maintenance of long term monitoring at this location
Site type Population Exposure Instrument Manufacturer / Model Thermo Scientific / 42i FRM/FEM/ARM/other FRM Collecting agency / Reporting agency PDEQ / PDEQ Analytical lab n/a Monitor type SLAMS Scale Neighborhood / Area Wide Monitoring Number of hourly observations 8555 Number / Dates of standard exceedances in 2018 0
Historical exceedances 0 Current Sampling frequency / Season Continuous
Probe height 4.4 meters above the ground on the roof of a shelter located in a city water well site
Probe material / Residence time FEP Teflon / 10.32 seconds Degrees of unrestricted air flow 360 Height of tree above probe 10.2 meters Distance from supporting structure 1.3 meters Distance from obstruction on roof n/a Distance from obstruction not on roof n/a Distance from trees 22.0 meters Distance to furnace or incinerator flue n/a Distance between collocated monitors/ Schedule / Collocated monitor type n/a
Nearest roads distance & direction to monitor / ADT
260 meters west is Craycroft Road with a 2018 ADT of 24,993 260 meters north is 22nd Street with a 2018 ADT of 40,270
Site meets 40 CFR 58, Appx. A,C,D,E Yes MSA Tucson, AZ 8520
Comments: This site is one of the oldest in the monitoring network, originally established in 1973, and operated continuously to the present.
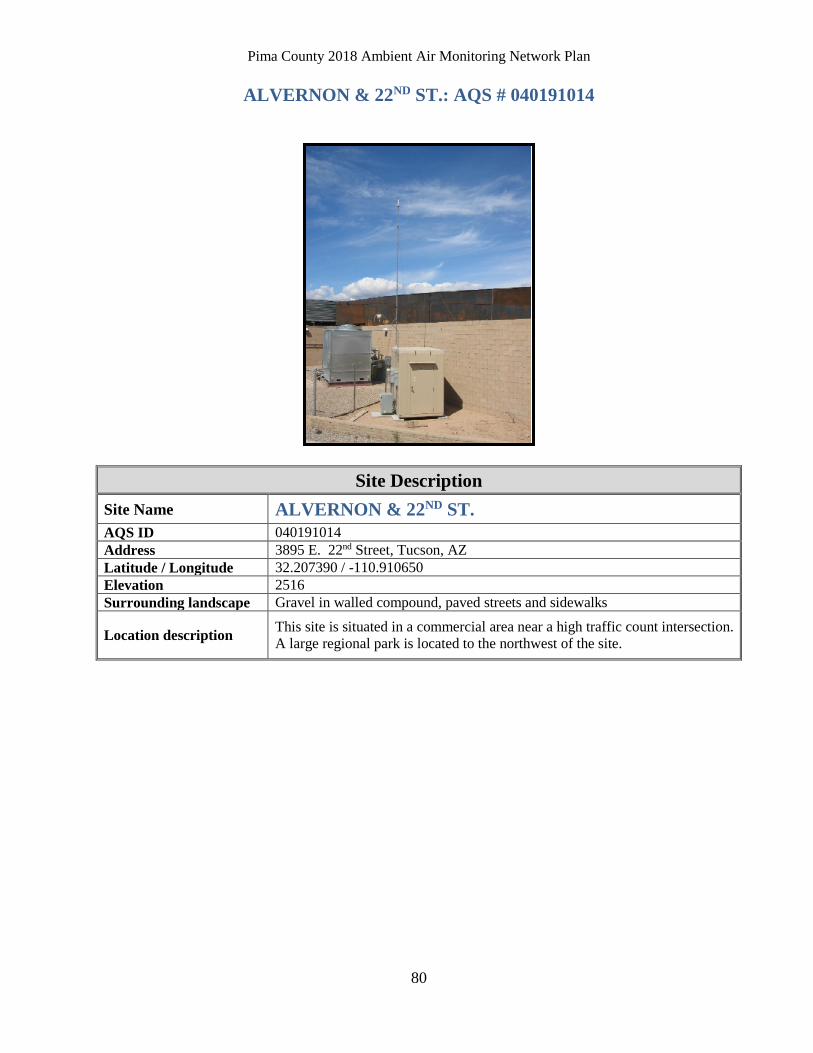
Pima County 2018 Ambient Air Monitoring Network Plan
80
ALVERNON & 22ND ST.: AQS # 040191014
Site Description Site Name ALVERNON & 22ND ST. AQS ID 040191014 Address 3895 E. 22nd Street, Tucson, AZ Latitude / Longitude 32.207390 / -110.910650 Elevation 2516 Surrounding landscape Gravel in walled compound, paved streets and sidewalks
Location description This site is situated in a commercial area near a high traffic count intersection. A large regional park is located to the northwest of the site.
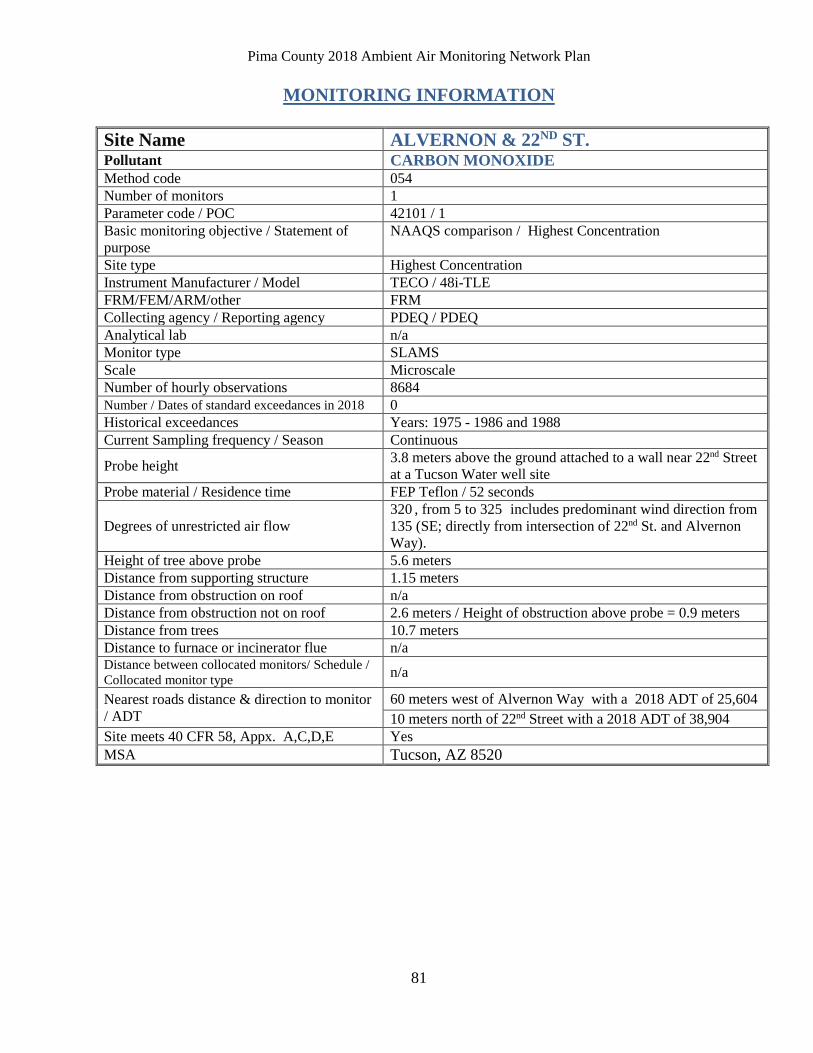
Pima County 2018 Ambient Air Monitoring Network Plan
81
MONITORING INFORMATION
Site Name ALVERNON & 22ND ST. Pollutant CARBON MONOXIDE Method code 054 Number of monitors 1 Parameter code / POC 42101 / 1 Basic monitoring objective / Statement of purpose
NAAQS comparison / Highest Concentration
Site type Highest Concentration Instrument Manufacturer / Model TECO / 48i-TLE FRM/FEM/ARM/other FRM Collecting agency / Reporting agency PDEQ / PDEQ Analytical lab n/a Monitor type SLAMS Scale Microscale Number of hourly observations 8684 Number / Dates of standard exceedances in 2018 0 Historical exceedances Years: 1975 - 1986 and 1988 Current Sampling frequency / Season Continuous
Probe height 3.8 meters above the ground attached to a wall near 22nd Street at a Tucson Water well site
Probe material / Residence time FEP Teflon / 52 seconds
Degrees of unrestricted air flow 320 , from 5 to 325 includes predominant wind direction from 135 (SE; directly from intersection of 22nd St. and Alvernon Way).
Height of tree above probe 5.6 meters Distance from supporting structure 1.15 meters Distance from obstruction on roof n/a Distance from obstruction not on roof 2.6 meters / Height of obstruction above probe = 0.9 meters Distance from trees 10.7 meters Distance to furnace or incinerator flue n/a Distance between collocated monitors/ Schedule / Collocated monitor type n/a
Nearest roads distance & direction to monitor / ADT
60 meters west of Alvernon Way with a 2018 ADT of 25,604 10 meters north of 22nd Street with a 2018 ADT of 38,904
Site meets 40 CFR 58, Appx. A,C,D,E Yes MSA Tucson, AZ 8520
Pima County 2018 Ambient Air Monitoring Network Plan
82
Comments: The site was relocated in October, 2001 to a Tucson Water well site 50 meters west of the original location. The move was necessitated by an intersection improvement project and anticipated construction on the northwest corner. The shelter was moved again in January, 2004, to a different corner within the well site, and the probe was attached to a wall in virtually the same location as before the shelter was moved, so airflow from the intersection would remain unrestricted. Alvernon and 22nd St. continues to measure the highest CO concentrations in the network. The prevailing morning- hour southeasterly winds usually disperse CO generated in the intersection. During stagnant conditions, especially during the winter inversion formation, CO generated in the intersection has a longer residence time. Although population exposure is limited at this location, Alvernon & 22nd St. is representative of worst-case intersections in Tucson. This site has been operating continuously since 1975. No exceedances of the eight-hour health standard were recorded in 1989 through 2018.
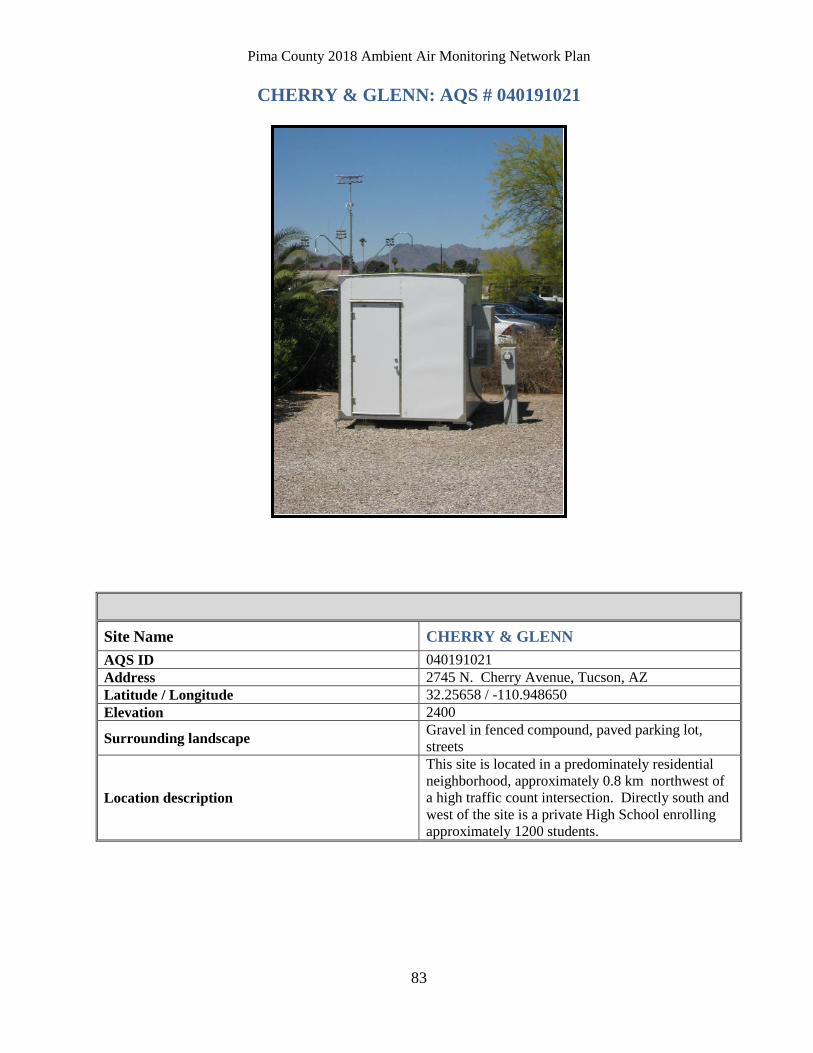
Pima County 2018 Ambient Air Monitoring Network Plan
83
CHERRY & GLENN: AQS # 040191021
Site Name CHERRY & GLENN AQS ID 040191021 Address 2745 N. Cherry Avenue, Tucson, AZ Latitude / Longitude 32.25658 / -110.948650 Elevation 2400
Surrounding landscape Gravel in fenced compound, paved parking lot, streets
Location description
This site is located in a predominately residential neighborhood, approximately 0.8 km northwest of a high traffic count intersection. Directly south and west of the site is a private High School enrolling approximately 1200 students.
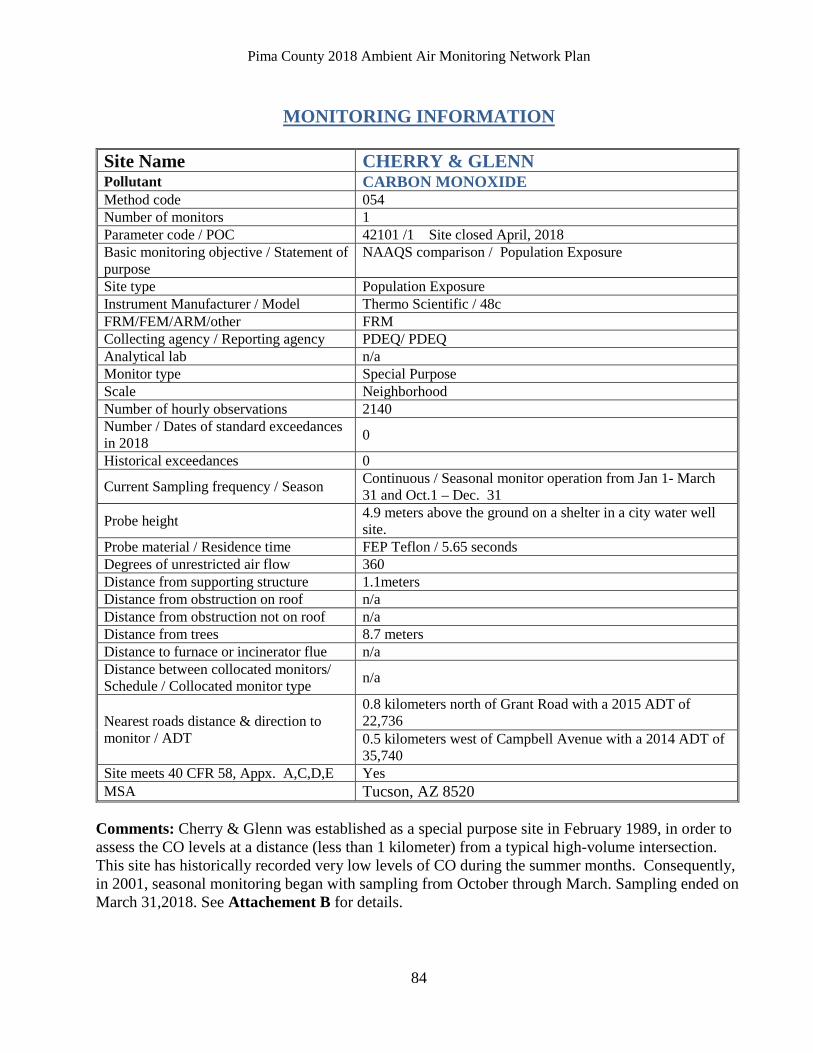
Pima County 2018 Ambient Air Monitoring Network Plan
84
MONITORING INFORMATION
Site Name CHERRY & GLENN Pollutant CARBON MONOXIDE Method code 054 Number of monitors 1 Parameter code / POC 42101 /1 Site closed April, 2018 Basic monitoring objective / Statement of purpose
NAAQS comparison / Population Exposure
Site type Population Exposure Instrument Manufacturer / Model Thermo Scientific / 48c FRM/FEM/ARM/other FRM Collecting agency / Reporting agency PDEQ/ PDEQ Analytical lab n/a Monitor type Special Purpose Scale Neighborhood Number of hourly observations 2140 Number / Dates of standard exceedances in 2018 0
Historical exceedances 0
Current Sampling frequency / Season Continuous / Seasonal monitor operation from Jan 1- March 31 and Oct.1 – Dec. 31
Probe height 4.9 meters above the ground on a shelter in a city water well site.
Probe material / Residence time FEP Teflon / 5.65 seconds Degrees of unrestricted air flow 360 Distance from supporting structure 1.1meters Distance from obstruction on roof n/a Distance from obstruction not on roof n/a Distance from trees 8.7 meters Distance to furnace or incinerator flue n/a Distance between collocated monitors/ Schedule / Collocated monitor type n/a
Nearest roads distance & direction to monitor / ADT
0.8 kilometers north of Grant Road with a 2015 ADT of 22,736 0.5 kilometers west of Campbell Avenue with a 2014 ADT of 35,740
Site meets 40 CFR 58, Appx. A,C,D,E Yes MSA Tucson, AZ 8520
Comments: Cherry & Glenn was established as a special purpose site in February 1989, in order to assess the CO levels at a distance (less than 1 kilometer) from a typical high-volume intersection. This site has historically recorded very low levels of CO during the summer months. Consequently, in 2001, seasonal monitoring began with sampling from October through March. Sampling ended on March 31,2018. See Attachement B for details.
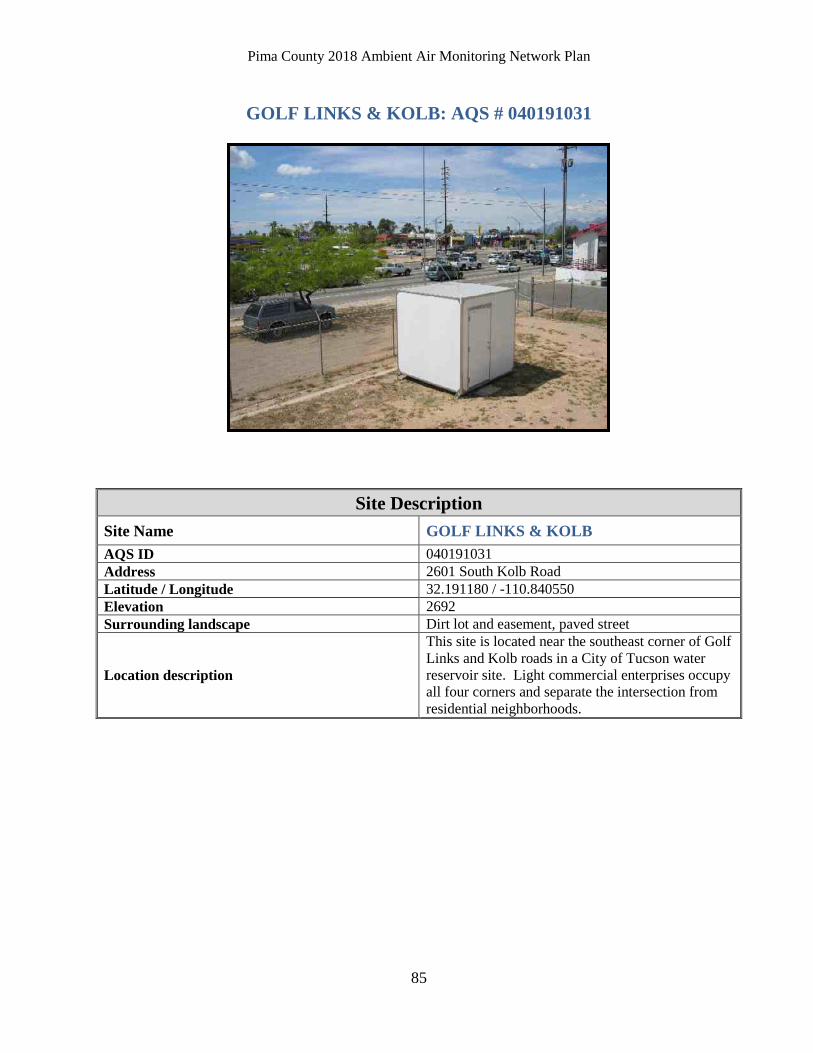
Pima County 2018 Ambient Air Monitoring Network Plan
85
GOLF LINKS & KOLB: AQS # 040191031
Site Description Site Name GOLF LINKS & KOLB AQS ID 040191031 Address 2601 South Kolb Road Latitude / Longitude 32.191180 / -110.840550 Elevation 2692 Surrounding landscape Dirt lot and easement, paved street
Location description
This site is located near the southeast corner of Golf Links and Kolb roads in a City of Tucson water reservoir site. Light commercial enterprises occupy all four corners and separate the intersection from residential neighborhoods.
Pima County 2018 Ambient Air Monitoring Network Plan
86
MONITORING INFORMATION Site Name GOLF LINKS & KOLB Pollutant CARBON MONOXIDE Method code 054 Number of monitors 1 Parameter code / POC 42101 / 1 Site closed April, 2018 Basic monitoring objective / Statement of purpose
NAAQS comparison / Highest Concentration
Site type Highest Concentration Instrument Manufacturer / Model Thermo Scientific/ 48C FRM/FEM/ARM/other FRM Collecting agency / Reporting agency PDEQ/ PDEQ Analytical lab n/a Monitor type Special Purpose Scale Microscale Number of hourly observations 2140 Number / Dates of standard exceedances in 2018 0
Historical exceedances 0
Current Sampling frequency / Season Continuous / Seasonal Monitor operating Jan. 1- March 31 and Oct. 1 – Dec. 31
Probe height 3.0 meters above the ground on a pole located next to Kolb road
Probe material / Residence time FEP Teflon / 39.62 seconds Degrees of unrestricted air flow 360 Distance from supporting structure 2.97 meters (to ground) Distance from obstruction on roof n/a Distance from obstruction not on roof n/a Distance from trees 2.7 meters Distance to furnace or incinerator flue n/a Distance between collocated monitors/ Schedule / Collocated monitor type n/a
Nearest roads distance & direction to monitor / ADT
100 meters south of Golf Links, with a 2017 ADT of 30,581
2 meters east of Kolb Road, with a 2015 ADT of 40,034 Site meets 40 CFR 58, Appx. A,C,D,E Yes MSA Tucson, AZ 8520
Comments: Golf Links & Kolb was established as a special purpose site in September 2002, as part of the Carbon Monoxide Limited Maintenance Plan. Inlet placement qualifies it as a microscale site, and sighting it on the southeastern quarter of the intersection provides an opposite wind direction compliment to the Alvernon & 22nd St. site. This site is operated seasonally, from October through March. Sampling ended on March 31,2018. See Attachment B.
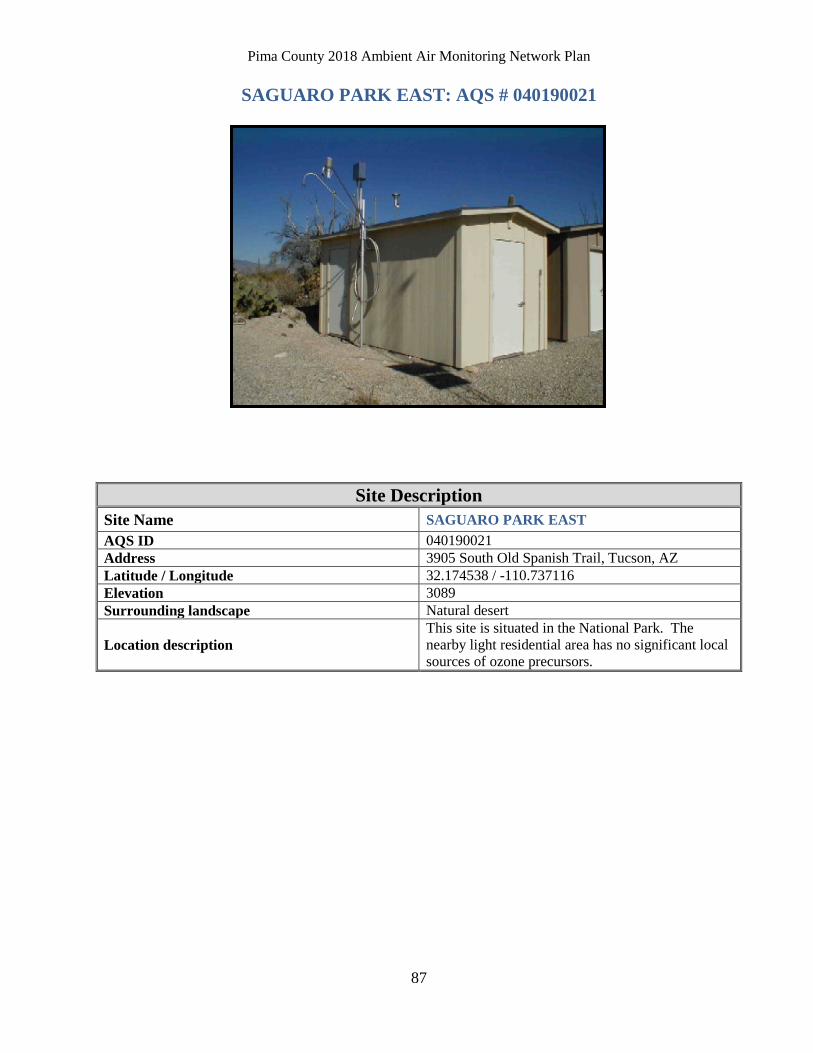
Pima County 2018 Ambient Air Monitoring Network Plan
87
SAGUARO PARK EAST: AQS # 040190021
Site Description Site Name SAGUARO PARK EAST AQS ID 040190021 Address 3905 South Old Spanish Trail, Tucson, AZ Latitude / Longitude 32.174538 / -110.737116 Elevation 3089 Surrounding landscape Natural desert
Location description This site is situated in the National Park. The nearby light residential area has no significant local sources of ozone precursors.
Pima County 2018 Ambient Air Monitoring Network Plan
88
MONITORING INFORMATION Site Name SAGUARO PARK EAST Pollutant OZONE Method code 047 Number of monitors 1 Parameter code / POC 44201 /1 Basic monitoring objective / Statement of purpose
NAAQS comparison / Highest Concentration
Site type Maximum ozone concentration Instrument Manufacturer / Model Thermo Scientific / 49i FRM/FEM/ARM/other FEM Collecting agency / Reporting agency PDEQ/ PDEQ Analytical lab n/a Monitor type SLAMS Scale Neighborhood Number of daily observations 365 Number / Dates of 8-hour standard exceedances in 2018 4/ May 29, June 20 & 21, August 2
Historical exceedances one in 1999, 2003, 2005, 2008; three in 2011; one in 2014; five in 2017
Current Sampling frequency / Season Continuous
Probe height 4.1 meters above the ground in Saguaro National Park East on the roof of a shelter that is one kilometer south of the administration building.
Probe material / Residence time FEP Teflon / 8.78 seconds Degrees of unrestricted air flow 360 Height of tree above probe 0.4 meters Distance from supporting structure 1.22 meters Distance from obstruction on roof n/a Distance from obstruction not on roof n/a – (trailer was removed) Distance from trees 9.14 meters Distance to furnace or incinerator flue n/a Distance between collocated monitors/ Schedule / Collocated monitor type n/a
Nearest roads distance & direction to monitor / ADT
80 meters east to Old Spanish Trail with a 2018 ADT of 4,478 105 meters south of Escalante with a 2018 ADT of 4,327
Site meets 40 CFR 58, Appx. A,C,D,E Yes MSA Tucson, AZ 8520
Comments: The Saguaro National Park site has been active since 1982. The operation of the site was taken over by the National Park Service in 1987. The Park Service returned operation of the site to Pima County in 1993. Geographically, Saguaro National Park is on the eastern edge of the Tucson metropolitan area. Ozone data from this site has been used to study how the levels of ozone affect natural vegetation.
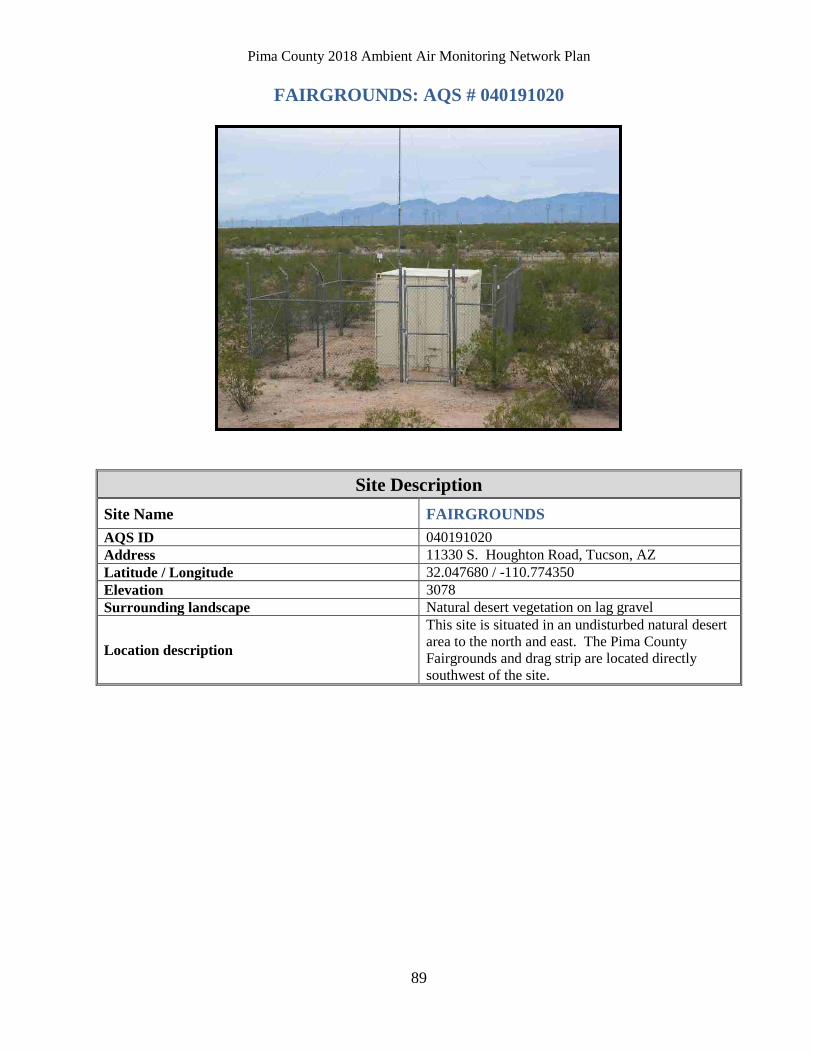
Pima County 2018 Ambient Air Monitoring Network Plan
89
FAIRGROUNDS: AQS # 040191020
Site Description Site Name FAIRGROUNDS AQS ID 040191020 Address 11330 S. Houghton Road, Tucson, AZ Latitude / Longitude 32.047680 / -110.774350 Elevation 3078 Surrounding landscape Natural desert vegetation on lag gravel
Location description
This site is situated in an undisturbed natural desert area to the north and east. The Pima County Fairgrounds and drag strip are located directly southwest of the site.
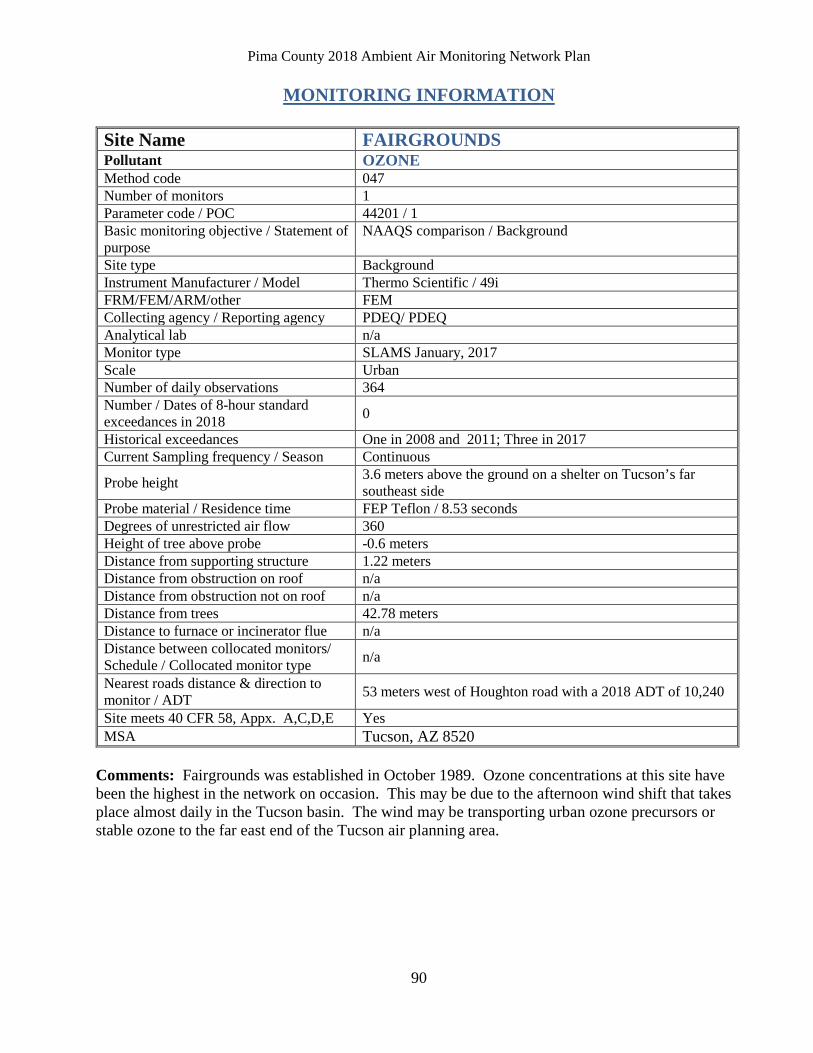
Pima County 2018 Ambient Air Monitoring Network Plan
90
MONITORING INFORMATION Site Name FAIRGROUNDS Pollutant OZONE Method code 047 Number of monitors 1 Parameter code / POC 44201 / 1 Basic monitoring objective / Statement of purpose
NAAQS comparison / Background
Site type Background Instrument Manufacturer / Model Thermo Scientific / 49i FRM/FEM/ARM/other FEM Collecting agency / Reporting agency PDEQ/ PDEQ Analytical lab n/a Monitor type SLAMS January, 2017 Scale Urban Number of daily observations 364 Number / Dates of 8-hour standard exceedances in 2018 0
Historical exceedances One in 2008 and 2011; Three in 2017 Current Sampling frequency / Season Continuous
Probe height 3.6 meters above the ground on a shelter on Tucson’s far southeast side
Probe material / Residence time FEP Teflon / 8.53 seconds Degrees of unrestricted air flow 360 Height of tree above probe -0.6 meters Distance from supporting structure 1.22 meters Distance from obstruction on roof n/a Distance from obstruction not on roof n/a Distance from trees 42.78 meters Distance to furnace or incinerator flue n/a Distance between collocated monitors/ Schedule / Collocated monitor type n/a
Nearest roads distance & direction to monitor / ADT 53 meters west of Houghton road with a 2018 ADT of 10,240
Site meets 40 CFR 58, Appx. A,C,D,E Yes MSA Tucson, AZ 8520
Comments: Fairgrounds was established in October 1989. Ozone concentrations at this site have been the highest in the network on occasion. This may be due to the afternoon wind shift that takes place almost daily in the Tucson basin. The wind may be transporting urban ozone precursors or stable ozone to the far east end of the Tucson air planning area.
Pima County 2018 Ambient Air Monitoring Network Plan
91
ATTACHMENT A
EPA Approval of Pima County Department of Environmental Quality 2017 Ambient Air Monitoring Network Plan
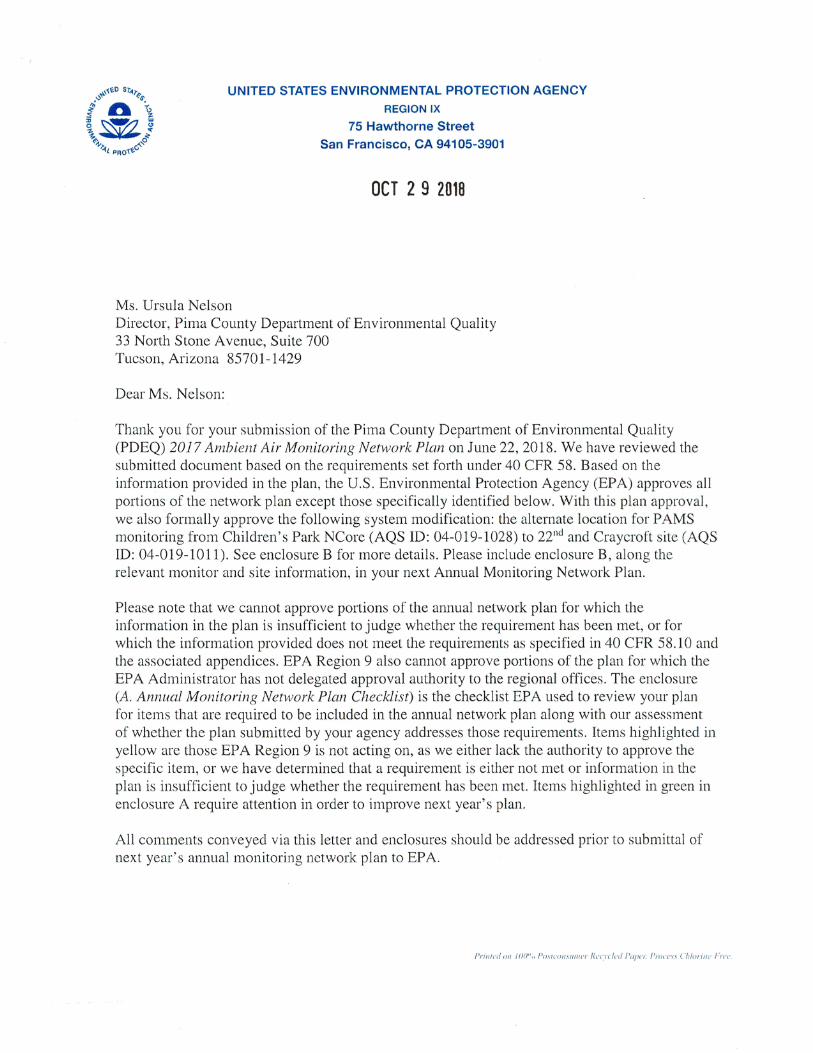
Pima County 2018 Ambient Air Monitoring Network Plan
ATTACHMENT B
EPA Approval of Pima County Department of Environmental Quality Network Modifications
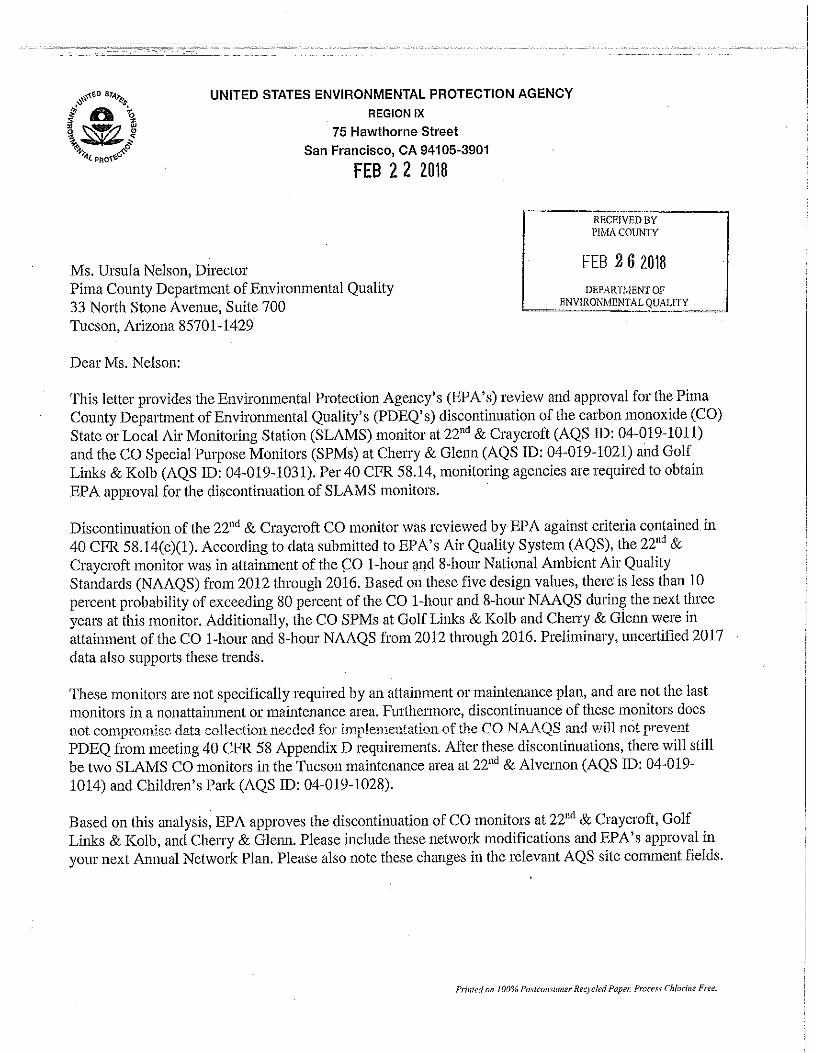
Pima County 2018 Ambient Air Monitoring Network Plan
ATTACHMENT C
EPA approval Letter for Photochemical Assessment Monitoring Stations (PAMS) Site Location
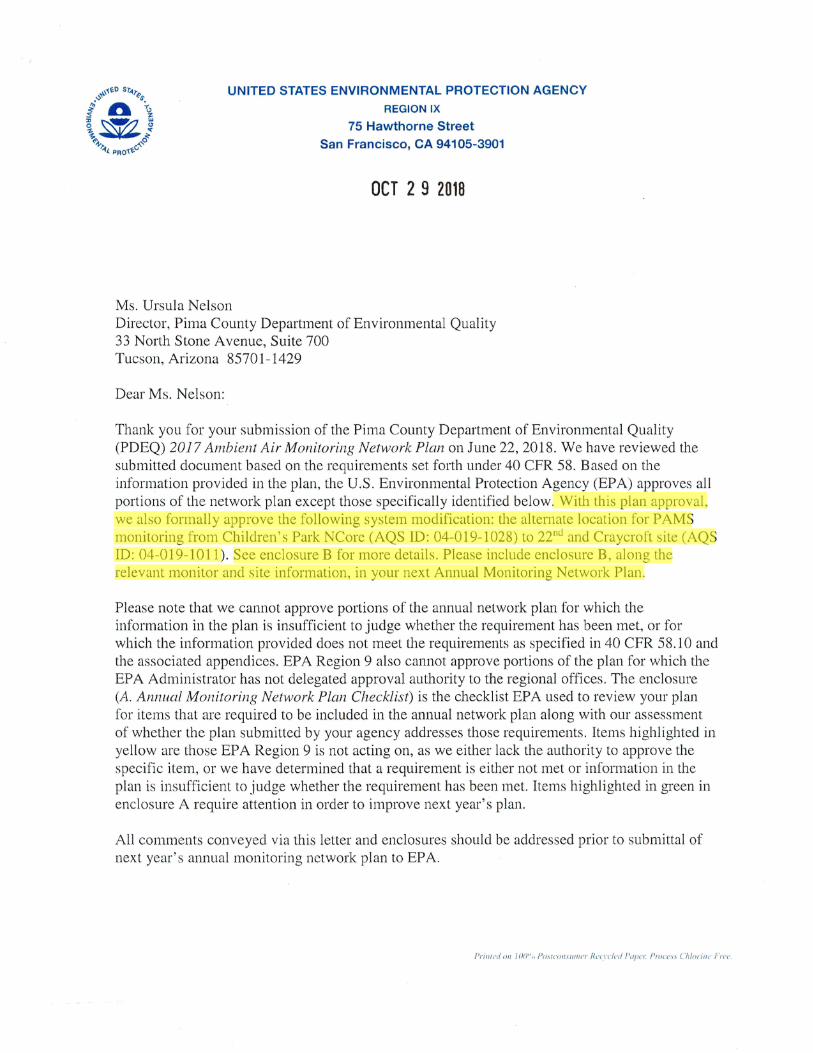
UNITED STATES ENVIRONMENTAL PROTECTION AGENCY REGION IX
75 Hawthorne Street San Francisco, CA 94105-3901
OCT 2 9 2018
Ms. Ursula Nelson Director, Pima County Department of Environmental Quality 33 North Stone A venue, Suite 700 Tucson, Arizona 85701-1429
Dear Ms. Nelson:
Thank you for your submission of the Pima County Department of Environmental Quality (PDEQ) 2017 Ambient Air Monitoring Network Plan on June 22, 2018. We have reviewed the submitted document based on the requirements set forth under 40 CFR 58. Based on the information provided in the plan, the U.S. Environmental Protection Agency (EPA) approves all portions of the network plan except those specifically identified below. With this plan approval, we also formally approve the following system modification: the alternate location for PAMS monitoring from Children's Park NCore (AQS ID: 04-019-1028) to 2211d and Craycraft site (AQS ID: 04-019-1011). See enclosure B for more details. Please include enclosure B, along the relevant monitor and site information, in your next Annual Monitoring Network Plan.
Please note that we cannot approve portions of the annual network plan for which the information in the plan is insufficient to judge whether the requirement has been met, or for which the information provided does not meet the requirements as specified in 40 CFR 58.10 and the associated appendices. EPA Region 9 also cannot approve portions of the plan for which the EPA Administrator has not delegated approval authority to the regional offices. The enclosure (A. Annual Monitoring Network Plan Checklist) is the checklist EPA used to review your plan for items that are required to be included in the annual network plan along with our assessment of whether the plan submitted by your agency addresses those requirements. Items highlighted in yellow are those EPA Region 9 is not acting on, as we either lack the authority to approve the specific item, or we have determined that a requirement is either not met or information in the plan is insufficient to judge whether the requirement has been met. Items highlighted in green in enclosure A require attention in order to improve next year's plan.
All comments conveyed via this letter and enclosures should be addressed prior to submittal of next year' s annual monitoring network plan to EPA.
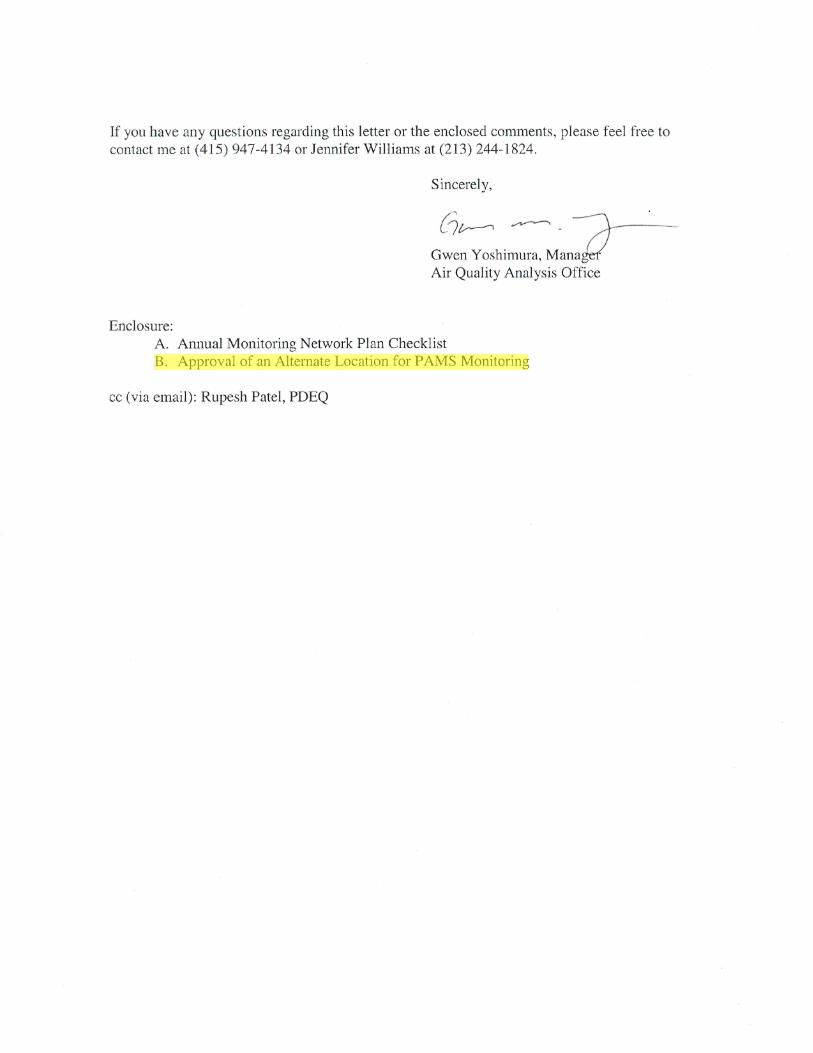
If you have any questions regarding this letter or the enclosed comments, please feel free to contact me at (415) 947-4134 or Jennifer Williams at (213) 244-1824.
Enclosure:
Sincerely,
{~v--o ~ -~-Gwen Yoshimura, ManaW Air Quality Analysis Office
A. Annual Monitoring Network Plan Checklist B. Approval of an Alternate Location for PAMS Monitoring
cc (via email): Rupesh Patel, PDEQ
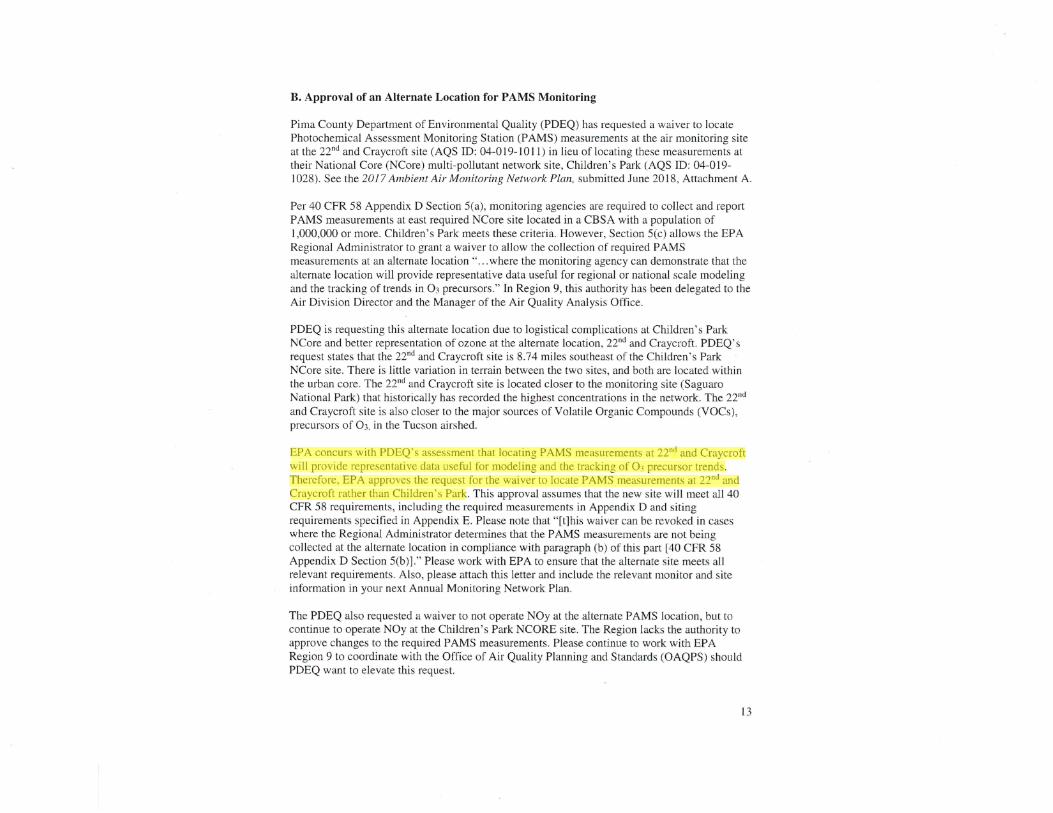
B. Approval of an Alternate Location for PAMS Monitoring
Pima County Department of Environmental Quality (PDEQ) has requested a waiver to locate Photochemical Assessment Monitoring Station (PAMS) measurements at the air monitoring site at the 22nd and Craycraft site (AQS ID: 04-019-1011) in lieu of locating these measurements at their National Core (NCore) multi-pollutant network site, Children's Park (AQS ID: 04-019-1028). See the 2017 Ambient Air Monitoring Network Plan. submitted June 2018 , Attachment A.
Per 40 CFR 58 Appendix D Section 5(a), monitoring agencies are required to collect and report PAMS measurements at east required NCore site located in a CBSA with a population of 1,000,000 or more. Children ' s Park meets these criteria. However, Section 5(c) allows the EPA Regional Administrator to grant a waiver to allow the collection of required PAMS measurements at an alternate location " ... where the monitoring agency can demonstrate that the alternate location will provide representative data useful for regional or national scale modeling and the tracking of trends in 0 3 precursors." In Region 9, this authority has been delegated to the Air Division Director and the Manager of the Air Quality Analysis Office.
PDEQ is requesting this alternate location due to logistical complications at Children ' s Park NCore and better representation of ozone at the alternate location, 22nd and Craycraft. PDEQ' s request states that the 22nd and Craycraft site is 8.74 m.iles southeast of the Children's Park NCore site. There is little variation in terrain between the two sites, and both are located within the urban core. The 22nd and Craycraft site is located closer to the monitoring site (Saguaro National Park) that historically has recorded the highest concentrations in the network. The 22nd and Craycraft site is also closer to the major sources of Volatile Organic Compounds (VOCs), precursors of 03. in the Tucson airshed.
EPA concurs with PDEQ' s assessment that locating PAMS measurements at 2211<1 and Craycraft will provide representative data useful for modeling and the tracking of 0 3 precursor trends. Therefore, EPA approves the request for the waiver to locate PAMS measurements at 22nd and Craycraft rather than Children's Park. This approval assumes that the new site will. meet all 40 CFR 58 requirements, including the required measurements in Appendix D and siting requirements specified in Appendix E. Please note that "[t)his wa.iver can be revoked in cases where the Regional Administrator determines that the P AMS measurements are not being collected at the alternate location in compliance with paragraph (b) of this part [ 40 CFR 58 Appendix D Section 5(b)]." Please work with EPA to ensure that the alternate site meets all relevant requirements. Also, please attach this letter and include the relevant monitor and site information in your next Annual Monitoring Network Plan.
The PDEQ also requested a waiver to not operate NOy at the alternate PAMS location , but to continue to operate NOy at the Children 's Park NCORE site. The Region lacks the authority to approve changes to the required PAMS measurements. Please continue to work with EPA Region 9 to coordinate with the Office of AiJ Quality Planning and Standards (OAQPS) should PDEQ want to elevate this reqLtest.
13