Embed Size (px)
Citation preview
2018 to witness
stronger demand Surabhi Arora | Senior Associate Director | India
The Indian economy recovered sharply with 7.2%
YOY growth in Q4 2017, echoing a positive outlook.
Most economic forecasters have maintained their
projections of growth of above 7% over the next two
years. In our opinion, the commercial real estate
market is likely to remain robust with increased
investor activity, sustained demand from technology
companies and growing interest from various
industry occupiers like manufacturing, flexible
workspace, logistics and warehousing.
Forecast at a glance
Demand Demand from technology and finance sectors should remain consistent; flexible workspaces should gain prominence across cities.
Supply Nearly 117.0 million sq ft (10.9 million sq m) of Grade A office supply is scheduled for completion over 2018-2020; 46% of the upcoming supply is sited in multi-tenanted Special Economic Zones (SEZs).
Vacancy rate Grade A vacancy rates in key micromarkets of Bangalore, Pune, Chennai likely to remain low at 6-9% over 2018-2020
Rent We expect 3-5% YOY increase in average rents over the next three years; Premium buildings in strategic locations should contribute to the bulk of these rent increases.
Price Active investments in commercial office market should support prices with a 2-3% YOY increase over 2018-2020.
Limited Grade A vacancy to drive flexible workspace demand
The first quarter of 2018 has started on a positive note
with a 23% YOY increase in the gross office take-up in
India. We recorded approximately 11.4 million sq ft (1.02
million sq m) of gross absorption in Q1 2018.
Representing 34% of total leasing volume, Bengaluru
(Bangalore) continued to account for the highest share of
absorption followed by the National Capital Region
(NCR) on 26%, Pune on 16%, Mumbai on 10%, Chennai
on 9%, Hyderabad on 4% and Kolkata on 1%.
The technology and finance sectors remained the major
contributors to office demand across Indian cities with
36% and 17% shares respectively of the total office take-
up in Q1 2018. In line with our earlier forecasts, demand
from flexible workspace operators and the manufacturing
sector has started gaining momentum in 2018,
accounting for 13% and 12% respectively of pan-Indian
leasing volume.
In our opinion, demand for flexible workspace should
further increase over the coming years. For building
owners targeting the smaller occupiers, this could mean
more competition as occupiers may prefer these flexible,
strategically located sites.
We also expect demand from manufacturing and
logistics companies to grow in the coming years. The
recent award of infrastructure status to the logistics
sector that includes industrial parks, cold chains and
warehousing facilities should boost private investments
in these sectors.
Although more than 30.0 million sq ft (2.7 million sq m) of
Grade A supply is scheduled for completion in 2018; in
our opinion, developers should adhere to the planned
timelines to maximise the benefit of the present supply
crunch in technology-driven cities. Developers should
gear up to build future-proof buildings with up-to-date
amenities and maximum technology intervention to
command premium rents. We advise large occupiers
looking for state-of-the-art buildings with modern
amenities and facilities for their employees to pre-commit
in advance, especially in low vacancy markets such as
Bengaluru, Pune and Hyderabad.
Colliers Quarterly Q1 2018
INDIA | OFFICE 30 April 2018
[Type here]
Contents Executive Summary | India | 2018 to witness stronger demand .................. 2
Mumbai | Infrastructure needs to improve .............................................. 4
Delhi | Constrained activity due to narrowing space ................................ 6
Gurugram (Gurgaon) | Demand for Grade A buildings .............................. 8
NOIDA | Q1 absorption sets record .. 10
Bengaluru | New projects to aid supply issues ............................................... 12
Chennai | New supply to drive demand ............................................ 14
Hyderabad | Flexible workspace to gain popularity in 2018 ..................... 16
Pune | New SEZ supply to drive demand ............................................ 18
Kolkata | New investments to drive demand ........................................... 20
Infrastructure
needs to improve Surabhi Arora Senior Associate Director | India
We expect demand to solidify in the long term. The
massive outlays for infrastructure projects in the
Union and state budget should ensure Mumbai's
appeal among occupiers, however timely completion
of these projects is key. We strongly recommend all
involved stakeholders to push the state government
for faster completion of these projects.
Forecast at a glance
Demand Likely to improve with several occupiers looking for new space primarily in technology and financial sector
Supply We project a supply pipeline of 9-10 million sq ft (0.8-0.9 million sq m) over 2018-2020. Of this total, we project 2.1 million sq ft (0.2 million sq m) to materialise by end- 2018
Vacancy rate We expect the vacancy level to drop from the current 13% to 9-10% by end-2020
Rent We expect rents to rise by 4-5% over 2018-2020 in preferred micromarkets such as BKC, Andheri and Lower Parel
Price We expect capital values to edge up due to increased interest from occupiers to buy offices
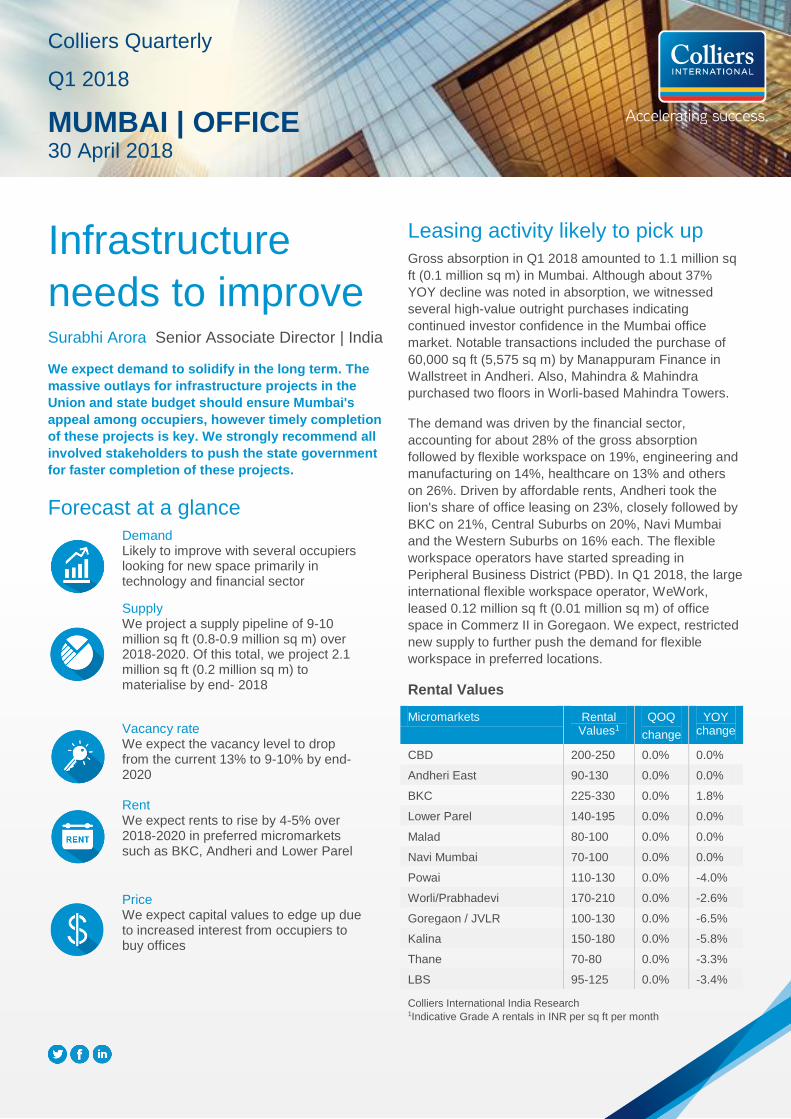
Leasing activity likely to pick up
Gross absorption in Q1 2018 amounted to 1.1 million sq
ft (0.1 million sq m) in Mumbai. Although about 37%
YOY decline was noted in absorption, we witnessed
several high-value outright purchases indicating
continued investor confidence in the Mumbai office
market. Notable transactions included the purchase of
60,000 sq ft (5,575 sq m) by Manappuram Finance in
Wallstreet in Andheri. Also, Mahindra & Mahindra
purchased two floors in Worli-based Mahindra Towers.
The demand was driven by the financial sector,
accounting for about 28% of the gross absorption
followed by flexible workspace on 19%, engineering and
manufacturing on 14%, healthcare on 13% and others
on 26%. Driven by affordable rents, Andheri took the
lion's share of office leasing on 23%, closely followed by
BKC on 21%, Central Suburbs on 20%, Navi Mumbai
and the Western Suburbs on 16% each. The flexible
workspace operators have started spreading in
Peripheral Business District (PBD). In Q1 2018, the large
international flexible workspace operator, WeWork,
leased 0.12 million sq ft (0.01 million sq m) of office
space in Commerz II in Goregaon. We expect, restricted
new supply to further push the demand for flexible
workspace in preferred locations.
Rental Values
Micromarkets Rental Values1
QOQ
change
YOY change
CBD 200-250 0.0% 0.0%
Andheri East 90-130 0.0% 0.0%
BKC 225-330 0.0% 1.8%
Lower Parel 140-195 0.0% 0.0%
Malad 80-100 0.0% 0.0%
Navi Mumbai 70-100 0.0% 0.0%
Powai 110-130 0.0% -4.0%
Worli/Prabhadevi 170-210 0.0% -2.6%
Goregaon / JVLR 100-130 0.0% -6.5%
Kalina 150-180 0.0% -5.8%
Thane 70-80 0.0% -3.3%
LBS 95-125 0.0% -3.4%
Colliers International India Research 1Indicative Grade A rentals in INR per sq ft per month
Colliers Quarterly
Q1 2018
MUMBAI | OFFICE 30 April 2018
2 Q1 2018 | 30 April 2018 | Mumbai | Office | Colliers International
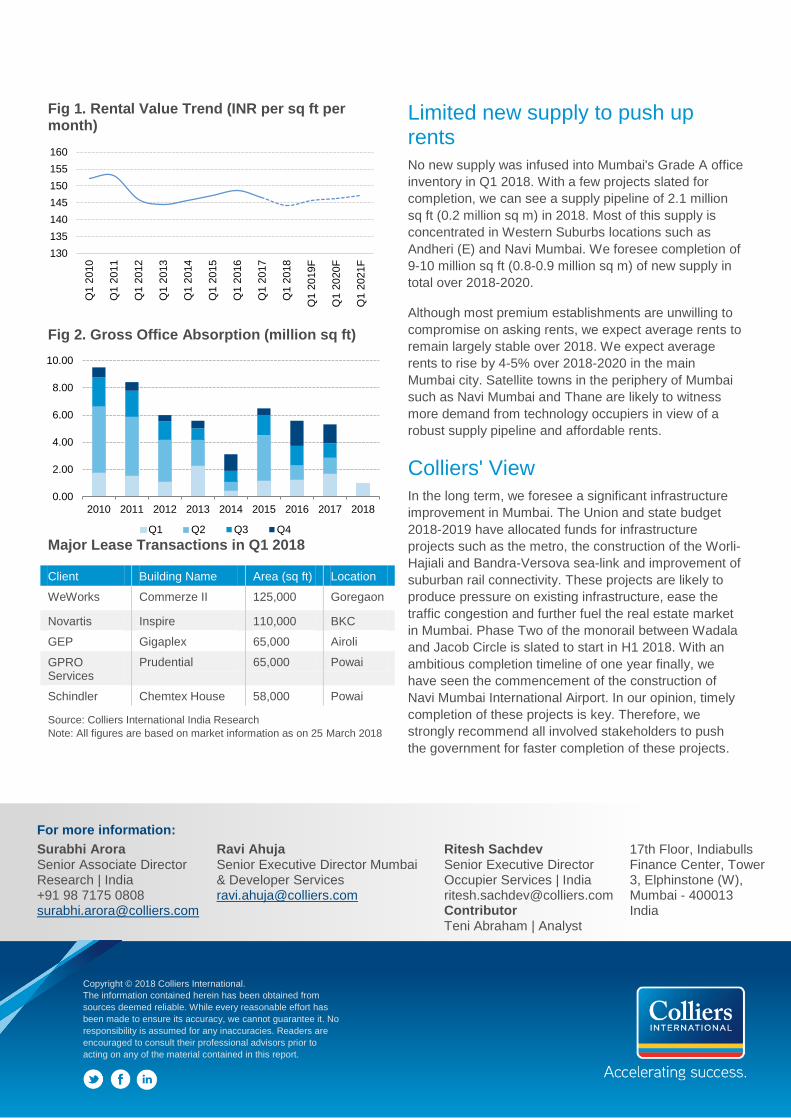
Fig 1. Rental Value Trend (INR per sq ft per month)
Fig 2. Gross Office Absorption (million sq ft)
Major Lease Transactions in Q1 2018
Source: Colliers International India Research
Note: All figures are based on market information as on 25 March 2018
Limited new supply to push up rents
No new supply was infused into Mumbai's Grade A office
inventory in Q1 2018. With a few projects slated for
completion, we can see a supply pipeline of 2.1 million
sq ft (0.2 million sq m) in 2018. Most of this supply is
concentrated in Western Suburbs locations such as
Andheri (E) and Navi Mumbai. We foresee completion of
9-10 million sq ft (0.8-0.9 million sq m) of new supply in
total over 2018-2020.
Although most premium establishments are unwilling to
compromise on asking rents, we expect average rents to
remain largely stable over 2018. We expect average
rents to rise by 4-5% over 2018-2020 in the main
Mumbai city. Satellite towns in the periphery of Mumbai
such as Navi Mumbai and Thane are likely to witness
more demand from technology occupiers in view of a
robust supply pipeline and affordable rents.
Colliers' View
In the long term, we foresee a significant infrastructure
improvement in Mumbai. The Union and state budget
2018-2019 have allocated funds for infrastructure
projects such as the metro, the construction of the Worli-
Hajiali and Bandra-Versova sea-link and improvement of
suburban rail connectivity. These projects are likely to
produce pressure on existing infrastructure, ease the
traffic congestion and further fuel the real estate market
in Mumbai. Phase Two of the monorail between Wadala
and Jacob Circle is slated to start in H1 2018. With an
ambitious completion timeline of one year finally, we
have seen the commencement of the construction of
Navi Mumbai International Airport. In our opinion, timely
completion of these projects is key. Therefore, we
strongly recommend all involved stakeholders to push
the government for faster completion of these projects.
130
135
140
145
150
155
160
Q1 2
010
Q1 2
011
Q1 2
012
Q1 2
013
Q1 2
014
Q1 2
015
Q1 2
016
Q1 2
017
Q1 2
018
Q1 2
019F
Q1 2
020F
Q1 2
021F
Chart Title - One Line
Source: Colliers International
Client Building Name Area (sq ft) Location
WeWorks Commerze II 125,000 Goregaon
Novartis Inspire 110,000 BKC
GEP Gigaplex 65,000 Airoli
GPRO Services
Prudential 65,000 Powai
Schindler Chemtex House 58,000 Powai
Copyright © 2018 Colliers International.
The information contained herein has been obtained from
sources deemed reliable. While every reasonable effort has
been made to ensure its accuracy, we cannot guarantee it. No
responsibility is assumed for any inaccuracies. Readers are
encouraged to consult their professional advisors prior to
acting on any of the material contained in this report.
For more information:
Surabhi Arora Senior Associate Director Research | India +91 98 7175 0808 [email protected]
Ravi Ahuja Senior Executive Director Mumbai & Developer Services [email protected]
Ritesh Sachdev Senior Executive Director Occupier Services | India [email protected] Contributor Teni Abraham | Analyst
17th Floor, Indiabulls Finance Center, Tower 3, Elphinstone (W), Mumbai - 400013 India
0.00
2.00
4.00
6.00
8.00
10.00
2010 2011 2012 2013 2014 2015 2016 2017 2018
Q1 Q2 Q3 Q4
Constrained
activity due to
narrowing space Saif Lari Assistant Manager | NCR
Delhi witnessed a gross absorption of only 0.26
million sq ft (0.02 million sq m) with no new supply
addition in Q1 2018. Amid low vacancy and higher
rents, we advise occupiers to hasten their deal
closure to secure space at their preferred assets in
the Central Business District (CBD) and Aerocity.
Developers should understand the pulse of the
market and subsequently redevelop their obsolete
office spaces in prime micromarkets to take
advantage of the high demand for such assets.
Forecast at a glance
Demand Absorption likely to be remain stable due to dearth of large floorplates.
Supply
With little supply in the sight in the short term, we predict an inventory influx of about 3 million sq ft (0.3 million sq m) over 2018-2020
Vacancy rate
Vacancy rate likely to remain in the range of 10-11% over 2018-2020
Rent
Rents of premium building to increase by 5% annually over the next three years. However, average rents are likely to remain stable over 2018-2020
Price
Capital values look set to remain stable as there is hardly any retail and instituition investment sales activity
Demand remains concentrated in CBD and Aerocity
Leasing activity remained subdued during Q1 2018, as
only 0.26 million sq ft (0.02 million sq m) of gross
absorption was recorded marking a 21% decline YOY.
The reduction in the absorption levels can be attributed
to the limited Grade A space in key micromarkets like the
CBD and Aerocity as well as higher rents in Grade A and
well-located buildings.
Breaking the conventional trend, the Engineering &
Manufacturing Sector took up most of the office space,
accounting for a 38% share of the total leasing volume,
wheras the traditional office demand driver, Banking,
Financial Services and Insurance (BFSI), became the
second highest source of leased office space with a 28%
share. Finance was followed by IT-ITeS on 9%, and the
rest was represented by various other sectors. The
premium office space market of Delhi relies highly on the
CBD and Aerocity micromarkets, which cumulatively
gathered a share of about 40% in the total office
transactions. Most of the deals in Q1 were a mix of small
to mid-sized transactions, with an average transaction
size of 12,000 sq ft (1,100 sq m).
We foresee that the vacancy levels in the preferred
developed micromarkets will go down further due to
consistent demand and limited new supply for Grade A
office space. The continued interest from occupiers may
allow rents of premium building to increase by 5%
annually over the next three years. However, average
rents are likely to remain stable over 2018-2020.
Rental Values
Micromarkets Rental Values1
QOQ Change
YOY
Change
Connaught Place (CBD)
140 - 425 0% 10.8%
Nehru Place 150 - 200 0% -2.8%
Saket 110 - 180 0% -6.5%
Jasola 80 - 115 0% 2.6%
Okhla 40 - 87 1.6% 10.4%
Aerocity 180 - 200 9% 11.8% Source Colliers International India Research 1Indicative Grade A rentals in INR per sq ft per month (non IT-ITeS)
Colliers Quarterly
Q1 2018
DELHI | OFFICE 30 April 2018
2 Q1 2018 | 30 April 2018 | delhi | office | Colliers International
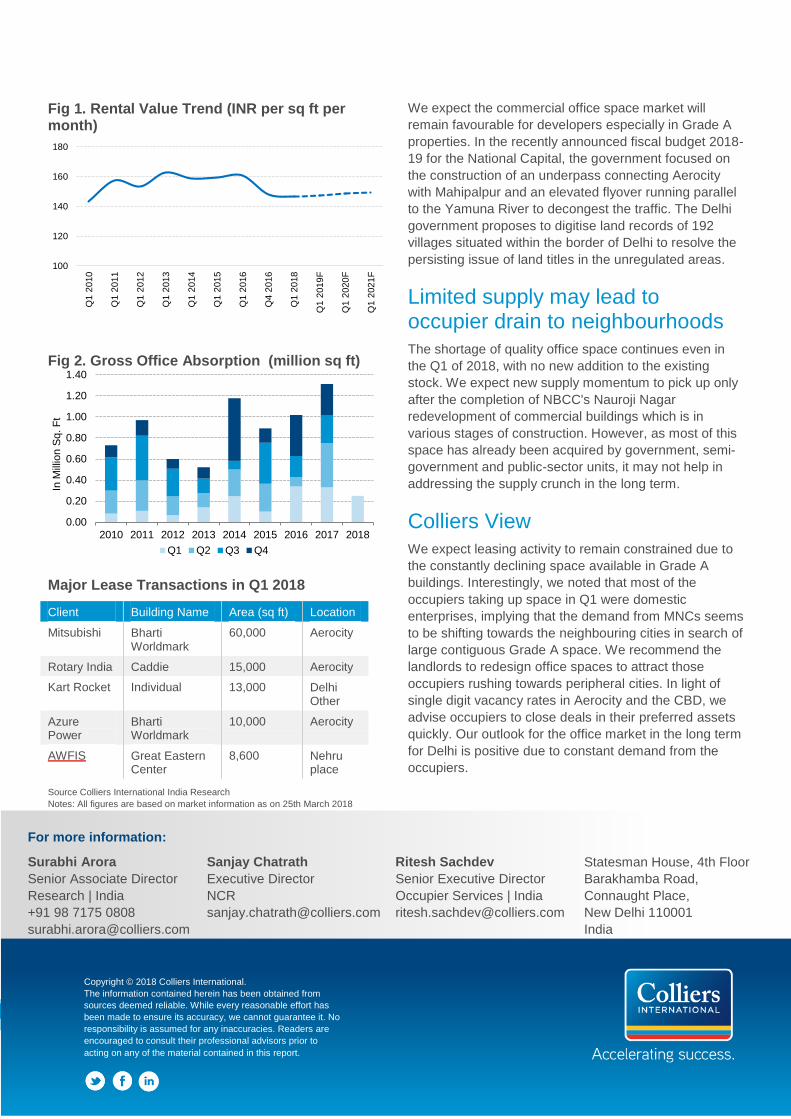
Fig 1. Rental Value Trend (INR per sq ft per month)
Fig 2. Gross Office Absorption (million sq ft)
Major Lease Transactions in Q1 2018
Client Building Name Area (sq ft) Location
Mitsubishi Bharti Worldmark
60,000 Aerocity
Rotary India Caddie 15,000 Aerocity
Kart Rocket Individual 13,000 Delhi Other
Azure Power
Bharti Worldmark
10,000 Aerocity
AWFIS Great Eastern Center
8,600 Nehru place
Source Colliers International India Research
Notes: All figures are based on market information as on 25th March 2018
We expect the commercial office space market will
remain favourable for developers especially in Grade A
properties. In the recently announced fiscal budget 2018-
19 for the National Capital, the government focused on
the construction of an underpass connecting Aerocity
with Mahipalpur and an elevated flyover running parallel
to the Yamuna River to decongest the traffic. The Delhi
government proposes to digitise land records of 192
villages situated within the border of Delhi to resolve the
persisting issue of land titles in the unregulated areas.
Limited supply may lead to occupier drain to neighbourhoods
The shortage of quality office space continues even in
the Q1 of 2018, with no new addition to the existing
stock. We expect new supply momentum to pick up only
after the completion of NBCC's Nauroji Nagar
redevelopment of commercial buildings which is in
various stages of construction. However, as most of this
space has already been acquired by government, semi-
government and public-sector units, it may not help in
addressing the supply crunch in the long term.
Colliers View
We expect leasing activity to remain constrained due to
the constantly declining space available in Grade A
buildings. Interestingly, we noted that most of the
occupiers taking up space in Q1 were domestic
enterprises, implying that the demand from MNCs seems
to be shifting towards the neighbouring cities in search of
large contiguous Grade A space. We recommend the
landlords to redesign office spaces to attract those
occupiers rushing towards peripheral cities. In light of
single digit vacancy rates in Aerocity and the CBD, we
advise occupiers to close deals in their preferred assets
quickly. Our outlook for the office market in the long term
for Delhi is positive due to constant demand from the
occupiers.
100
120
140
160
180
Q1
2010
Q1
2011
Q1
2012
Q1
2013
Q1
2014
Q1
2015
Q1
2016
Q4
2016
Q1
2018
Q1
2019
F
Q1
2020
F
Q1
2021
F
0.00
0.20
0.40
0.60
0.80
1.00
1.20
1.40
2010 2011 2012 2013 2014 2015 2016 2017 2018
In M
illio
n S
q. F
t
Q1 Q2 Q3 Q4
For more information:
Surabhi Arora
Senior Associate Director
Research | India
+91 98 7175 0808
Sanjay Chatrath
Executive Director
NCR
Ritesh Sachdev
Senior Executive Director
Occupier Services | India
Statesman House, 4th Floor
Barakhamba Road,
Connaught Place,
New Delhi 110001
India
Copyright © 2018 Colliers International.
The information contained herein has been obtained from
sources deemed reliable. While every reasonable effort has
been made to ensure its accuracy, we cannot guarantee it. No
responsibility is assumed for any inaccuracies. Readers are
encouraged to consult their professional advisors prior to
acting on any of the material contained in this report.
Demand for
Grade A buildings Surabhi Arora Senior Associate Director | India
Tenants whose lease expiry is underway are
exploring grade A premium buildings in
decentralised locations for relocation and
consolidation to hedge against the increase in
market rents. With substantial new supply
scheduled for completion along Golf Course
Extension Road over 2018-2020, we expect this
corridor to become the next hotspot for Information
Technology and Information Technology enabled
Service (IT-ITeS) occupiers. We recommend big
occupiers looking for large floor plates in Special
Economic Zones (SEZs) to consider this
micromarket for future expansion.
Forecast at a glance
Demand Demand set to remain firm with several occupiers looking for new space primarily in the technology sector
Supply
11 million sq ft (1 million sq m) of office space should be added to Grade A inventory over 2018-2020 representing a 14% increase in the total grade A stock
Vacancy rate Vacancy likely to remain high above 25% with significant supply pipeline in peripheral micromarkets over 2018-2020
Rent Rents likely to remain under pressure in decentralised locations, while premium locations may see 4-5% increase over 2018 to 2020
Price Capital Values may go up slightly 4-5% over 2018-2020 due to increased interest from Institutional Investors
Robust absorption in Q1 indicates healthy market outlook Demand for office space has regained momentum and
the overall gross office uptake stood at 1.72 million sq ft
(0.16 million sq m) in Q1 2018. Expansionary office
space requirements primarily drove the leasing demand.
Occupiers' interest remained tilted towards Grade A
buildings. However, occupiers were exploring options in
Off-CBD micromarkets such as Sohna Road and Golf
Course Extension Road to consolidate and optimise their
real estate portfolio. In our opinion, more tenants started
to feel the pressure from increasing rents in the CBD and
other preferred locations. We expect the relocation trend
across Gurugram to continue in 2018. The Golf Course
Extension Road is becoming more widely accepted due
to factors such as the significant cost savings from the
huge rental gap 25%-35%, and limited availability for
expansion space in preferred micromarkets.
In Q1 2018, Gurugram witnessed one of the largest land
deals when DLF bought an 11.76-acre plot for INR15
billion (USD235 million). The land parcel is strategically
located near Cyber City, one of the preferred business
destinations in Gurugram. (Source: ET Realty | 27, Feb
2018). Once developed, this project should entice
occupiers looking for prime office space in this low
vacancy micromarket.
Rental Values
Micromarkets Rental Values1
QOQ Change
YOY Change
MG Road 105 - 140 0.0% 6.5%
Golf Course Road 110-200 0.0% 10.7%
Institutional Sectors (Sectors 44, 32 and 18)
60 - 90 0.0% 0%
Golf Course Extension/Sohna Road
45 - 75 0.0% -7.7%
National Highway 8 40 - 130 0.0% 5.6%
Udyog Vihar and Industrial Sectors
50 - 70 0.0% 5.9%
Manesar 25 - 35 0.0% -8.7%
DLF Cyber City (IT) 118 - 120 2.6% 5.8%
Source Colliers International India Research 1Indicative Grade A rentals in INR per sq ft per month
Colliers Quarterly
Q1 2018
GURUGRAM | OFFICE 30 April 2018
2 Q1 2018 | 30 April 2018 | gurugram | OFFICE | Colliers International
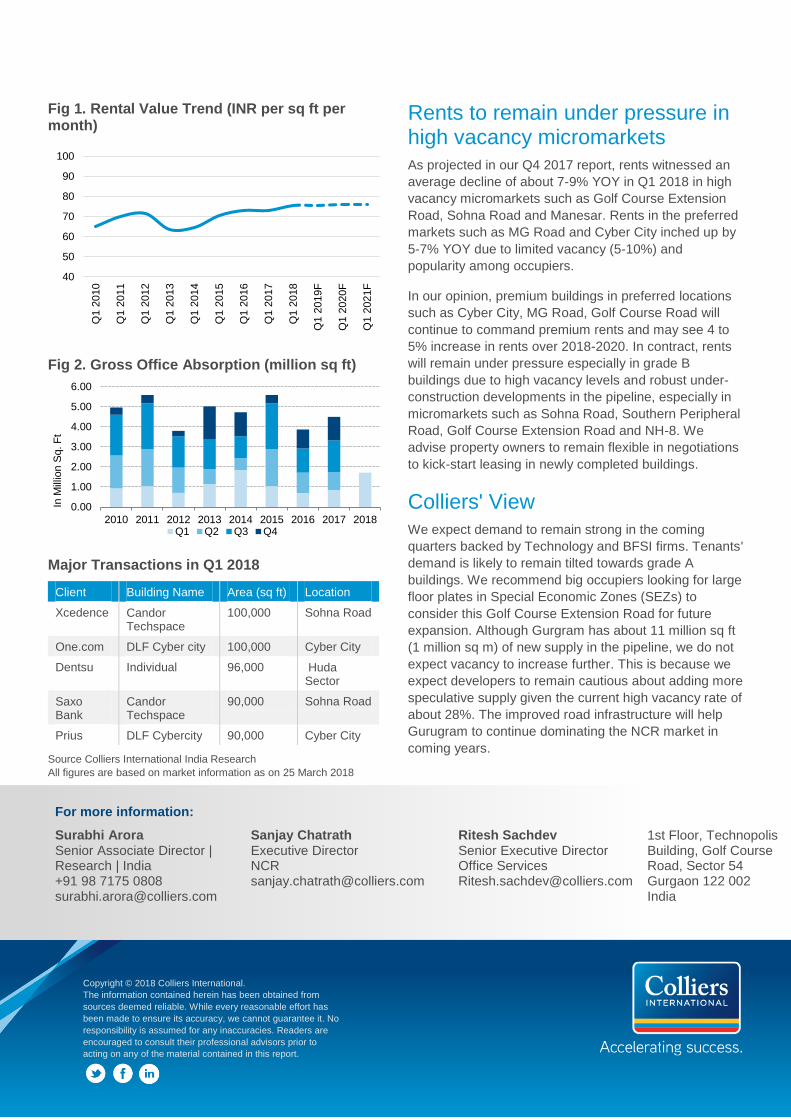
Fig 1. Rental Value Trend (INR per sq ft per month)
Fig 2. Gross Office Absorption (million sq ft)
Major Transactions in Q1 2018
Client Building Name Area (sq ft) Location
Xcedence Candor Techspace
100,000 Sohna Road
One.com DLF Cyber city 100,000 Cyber City
Dentsu Individual 96,000 Huda Sector
Saxo Bank
Candor Techspace
90,000 Sohna Road
Prius DLF Cybercity 90,000 Cyber City
Source Colliers International India Research
All figures are based on market information as on 25 March 2018
Rents to remain under pressure in high vacancy micromarkets
As projected in our Q4 2017 report, rents witnessed an
average decline of about 7-9% YOY in Q1 2018 in high
vacancy micromarkets such as Golf Course Extension
Road, Sohna Road and Manesar. Rents in the preferred
markets such as MG Road and Cyber City inched up by
5-7% YOY due to limited vacancy (5-10%) and
popularity among occupiers.
In our opinion, premium buildings in preferred locations
such as Cyber City, MG Road, Golf Course Road will
continue to command premium rents and may see 4 to
5% increase in rents over 2018-2020. In contract, rents
will remain under pressure especially in grade B
buildings due to high vacancy levels and robust under-
construction developments in the pipeline, especially in
micromarkets such as Sohna Road, Southern Peripheral
Road, Golf Course Extension Road and NH-8. We
advise property owners to remain flexible in negotiations
to kick-start leasing in newly completed buildings.
Colliers' View
We expect demand to remain strong in the coming
quarters backed by Technology and BFSI firms. Tenants'
demand is likely to remain tilted towards grade A
buildings. We recommend big occupiers looking for large
floor plates in Special Economic Zones (SEZs) to
consider this Golf Course Extension Road for future
expansion. Although Gurgram has about 11 million sq ft
(1 million sq m) of new supply in the pipeline, we do not
expect vacancy to increase further. This is because we
expect developers to remain cautious about adding more
speculative supply given the current high vacancy rate of
about 28%. The improved road infrastructure will help
Gurugram to continue dominating the NCR market in
coming years.
40
50
60
70
80
90
100
Q1 2
010
Q1 2
011
Q1 2
012
Q1 2
013
Q1 2
014
Q1 2
015
Q1 2
016
Q1 2
017
Q1 2
018
Q1 2
019F
Q1 2
020F
Q1 2
021F
0.00
1.00
2.00
3.00
4.00
5.00
6.00
2010 2011 2012 2013 2014 2015 2016 2017 2018
In M
illio
n S
q. F
t
Q1 Q2 Q3 Q4
For more information:
Surabhi Arora Senior Associate Director | Research | India +91 98 7175 0808 [email protected]
Sanjay Chatrath Executive Director NCR [email protected]
Ritesh Sachdev Senior Executive Director Office Services [email protected]
1st Floor, Technopolis Building, Golf Course Road, Sector 54 Gurgaon 122 002 India
Copyright © 2018 Colliers International.
The information contained herein has been obtained from
sources deemed reliable. While every reasonable effort has
been made to ensure its accuracy, we cannot guarantee it. No
responsibility is assumed for any inaccuracies. Readers are
encouraged to consult their professional advisors prior to
acting on any of the material contained in this report.
Q1 absorption
sets record Saif Lari Assistant Manager | NCR
We expect demand for prime office space to remain
upbeat, with occupiers' interest remaining inclined
towards Grade A developments. Improving
Infrastructure is catching the eye of both investors
and occupiers. We advise developers to proceed
with their Grade A buildings quickly to harness the
demand from cost-conscious large occupiers.
Forecast at a glance
Demand NOIDA Expressway micromarket to increase its share of overall city-level absorption. Institutional sector (Sector 62) to remain a fore-runner.
Supply About 13 million sq ft (1.2 million sq m) to come online over the next three years representing up 44% increase in the total stock
Vacancy rate To decrease in the year to come with increased office uptake but average vacancy rate to remain high at above 25% over 2018-2020 due to a robust supply pipeline
Rent Grade A office spaces are expected to command premium rents; City level average rents to remain static due to huge upcoming supply and high vacancy levels over 2018-2020
Price Capital values to remain stable over the next three years
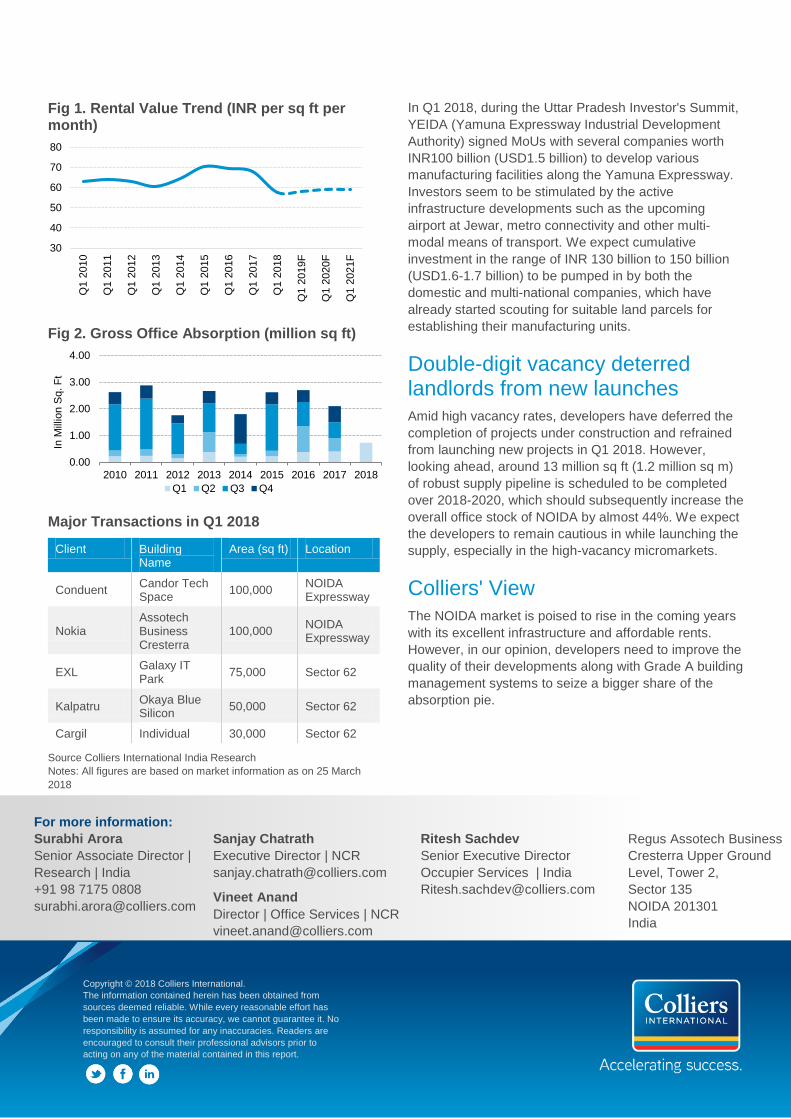
Great start for the year, improved infrastructure driving the demand
In line with our expectations, the NOIDA commercial
market witnessed a spike in occupier interest during Q1
2018. The market recorded about 1.01 million sq ft (0.09
million sq m) of gross absorption which was almost
double then the Q1 2017 absorption levels. We also
witnessed a couple of pre-commitments in the market
which is an indication of healthy demand in coming years
NOIDA continues to be a favoured destination amongst
technology occupiers which accounted for 25% of total
absorption, followed by Financial sector which accounted
for 20% of the take-up followed by the Engineering and
Manufacturing sector with 19% of take-up and the
Healthcare & Pharma sector accounting for 8%.
The Sector 62 to 65 along with NH24 recorded for more
than half of the total absorption in Q1 2018. The
completion of the civil works of metro rail construction
(NOIDA city center to Sector 62 stretch) and the opening
of several underpasses have drastically improved traffic
conditions. The NOIDA expressway micromarket
accounted for about 32% of the total demand. We expect
the NOIDA expressway micromarket to gain prominence
in the long term due to the huge supply pipeline and
upcoming metro connectivity. In Q1 2018, the trail-run of
the NOIDA - Greater NOIDA metro rail corridor
commenced, the total length of which is 29 km with 21
metro stations between Sector 71 and the Delta Depot
station in Greater NOIDA. This is seen as a continued
endeavour from the authorities to improve inter-city
connectivity.
Rental Values
Micromarkets Rental Values1
QOQ Change
YOY Change
Commercial Sectors 65 - 90 0.0% - 13.6%
Institutional Sectors (Non IT)
75 - 95 0.0% - 5.6%
Industrial Area (IT) 35 - 45 0.0% -5.9%
NOIDA Expressway 55 - 60 0.0% 0.0%
Source Colliers International India Research
1Indicative Grade A rentals in INR per sq ft per month
Colliers Quarterly
Q1 2018
NOIDA | OFFICE 30 April 2018
2 Q1 2018 | 30 April 2018 | NOIDA | OFFICE | Colliers International
Fig 1. Rental Value Trend (INR per sq ft per month)
Fig 2. Gross Office Absorption (million sq ft)
Major Transactions in Q1 2018
Client Building Name
Area (sq ft) Location
Conduent Candor Tech Space
100,000 NOIDA Expressway
Nokia Assotech Business Cresterra
100,000 NOIDA Expressway
EXL Galaxy IT Park
75,000 Sector 62
Kalpatru Okaya Blue Silicon
50,000 Sector 62
Cargil Individual 30,000 Sector 62
In Q1 2018, during the Uttar Pradesh Investor's Summit,
YEIDA (Yamuna Expressway Industrial Development
Authority) signed MoUs with several companies worth
INR100 billion (USD1.5 billion) to develop various
manufacturing facilities along the Yamuna Expressway.
Investors seem to be stimulated by the active
infrastructure developments such as the upcoming
airport at Jewar, metro connectivity and other multi-
modal means of transport. We expect cumulative
investment in the range of INR 130 billion to 150 billion
(USD1.6-1.7 billion) to be pumped in by both the
domestic and multi-national companies, which have
already started scouting for suitable land parcels for
establishing their manufacturing units.
Double-digit vacancy deterred landlords from new launches
Amid high vacancy rates, developers have deferred the
completion of projects under construction and refrained
from launching new projects in Q1 2018. However,
looking ahead, around 13 million sq ft (1.2 million sq m)
of robust supply pipeline is scheduled to be completed
over 2018-2020, which should subsequently increase the
overall office stock of NOIDA by almost 44%. We expect
the developers to remain cautious in while launching the
supply, especially in the high-vacancy micromarkets.
Colliers' View
The NOIDA market is poised to rise in the coming years
with its excellent infrastructure and affordable rents.
However, in our opinion, developers need to improve the
quality of their developments along with Grade A building
management systems to seize a bigger share of the
absorption pie.
30
40
50
60
70
80
Q1 2
010
Q1 2
011
Q1 2
012
Q1 2
013
Q1 2
014
Q1 2
015
Q1 2
016
Q1 2
017
Q1 2
018
Q1 2
019F
Q1 2
020F
Q1 2
021F
0.00
1.00
2.00
3.00
4.00
2010 2011 2012 2013 2014 2015 2016 2017 2018
In M
illio
n S
q. F
t
Q1 Q2 Q3 Q4
Source Colliers International India Research
Notes: All figures are based on market information as on 25 March
2018
For more information:
Surabhi Arora
Senior Associate Director |
Research | India
+91 98 7175 0808
Sanjay Chatrath
Executive Director | NCR
Vineet Anand
Director | Office Services | NCR
Ritesh Sachdev
Senior Executive Director
Occupier Services | India
Regus Assotech Business
Cresterra Upper Ground
Level, Tower 2,
Sector 135
NOIDA 201301
India
Copyright © 2018 Colliers International.
The information contained herein has been obtained from
sources deemed reliable. While every reasonable effort has
been made to ensure its accuracy, we cannot guarantee it. No
responsibility is assumed for any inaccuracies. Readers are
encouraged to consult their professional advisors prior to
acting on any of the material contained in this report.
New projects to
aid supply issues Teni Alice Abraham Analyst | Bengaluru
Office leasing momentum in Q1 2018 remained
robust driven by primarily by expansions. We advise
occupiers looking for large floorplates to act fast
and firm up their real estate requirements to expand
operations in the prime IT corridors as most new
supply is either pre-committed or quickly taken up
by occupiers. In our opinion, flexible workspace will
gain popularity, as more occupiers are exploring
these strategically located office spaces.
Forecast at a glance
Demand Demand set to outstrip supply over 2018-2020. We forecast gross absorption of 14 million sq ft (1.3 million sq m) in 2018
Supply Q1 witnessed the addition of 3.7 million sq ft (0.3 million sq m) of new supply. Considering new launches, we have revised our new supply forecast over 2018-2020 to 23.7 million sq ft (2.2 million sq m), representing a 16% increase in total stock
Vacancy rate We expect vacancy to inch down to 9% by end-2018 from the current 9.4% and to 7% by end-2020
Rent Rents should go up in 2018 by 4-5%; We forecast them to increase by 10-12% over 2018-2020
Price We forecast that capital values will remain stable in 2018. However, we expect them to increase by 8-10% over 2018-2020.
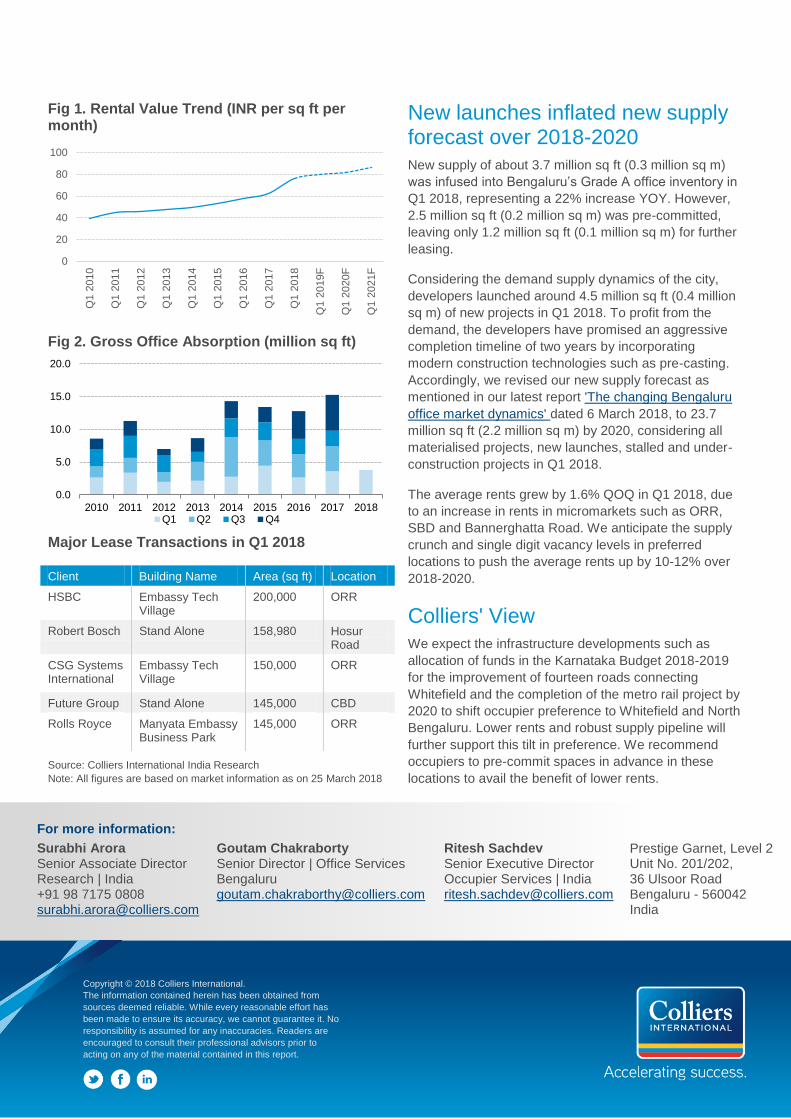
Expansion by technology occupiers to continue driving demand
Bengaluru's total absorption in Q1 2018 stood at 3.9
million sq ft (0.35 million sq m), up by 7% YOY. We
expect the absorption to pick up pace in the coming
quarters as various medium to large sized transactions
should be concluded in 2018. Demand should remain
robust in the long-term, driven by the availability of a
huge talent pool. We forecast about 35-40 million sq ft
(3.2-3.7 million sq m) of gross absorption over 2018-
2020.
ORR remained the epicentre of the office market with a
44% share of total office leasing volume followed by the
Secondary Business District (SBD) on 12%, Whitefield
on 11%, the Central Business District (CBD) on 11%,
North Bengaluru on 10% and other locations (12%).
Rapid expansion by technology occupiers drove the
demand in Q1 2018 with a 49% share of total gross
absorption, followed by flexible workspace on 13%,
finance on 12%, engineering and manufacturing on 9%
and other sectors on 17%. In line with our earlier
prediction, flexible workspace continued to flourish due
to high demand in the CBD and Off-CBD areas. We
expect the trend to pick up due to lower vacancy levels
in strategic locations such as the CBD, Off-CBD and
SBD areas.
Rental Values
Micromarkets Rental Values1
QOQ
change
YOY change
CBD 110 - 190 0.0% 25.0%
SBD (Indiranagr-Koramangala)
90 - 150 4.3% 14.3%
Outer Ring Road (Sarjapur - Marathahalli)
80 - 90 0.0% 6.3%
Outter Ring Road (K.R. Puram - Hebbal)
75 - 85 3.2% 12.7%
Bannerghatta Road 65 - 90 6.9% 26.0%
Hosur Road 32 - 42 0.0% 5.7%
EPIP Zone/Whitefield 35 - 45 0.0% 11.1%
Electronic City 35 - 45 0.0% 17.6%
North (Hebbal - Yelahanka) 45 - 72 0.0% 3.5%
Colliers International India Research 1Indicative Grade A rentals in INR per sq ft per month
Colliers Quarterly
Q1 2018
BENGALURU | OFFICE 30 April 2018
2 Q1 2018 | 30 April 2018 | Bengaluru | Office | Colliers International
Fig 1. Rental Value Trend (INR per sq ft per month)
Fig 2. Gross Office Absorption (million sq ft)
Major Lease Transactions in Q1 2018
Source: Colliers International India Research
Note: All figures are based on market information as on 25 March 2018
New launches inflated new supply forecast over 2018-2020
New supply of about 3.7 million sq ft (0.3 million sq m)
was infused into Bengaluru’s Grade A office inventory in
Q1 2018, representing a 22% increase YOY. However,
2.5 million sq ft (0.2 million sq m) was pre-committed,
leaving only 1.2 million sq ft (0.1 million sq m) for further
leasing.
Considering the demand supply dynamics of the city,
developers launched around 4.5 million sq ft (0.4 million
sq m) of new projects in Q1 2018. To profit from the
demand, the developers have promised an aggressive
completion timeline of two years by incorporating
modern construction technologies such as pre-casting.
Accordingly, we revised our new supply forecast as
mentioned in our latest report 'The changing Bengaluru
office market dynamics' dated 6 March 2018, to 23.7
million sq ft (2.2 million sq m) by 2020, considering all
materialised projects, new launches, stalled and under-
construction projects in Q1 2018.
The average rents grew by 1.6% QOQ in Q1 2018, due
to an increase in rents in micromarkets such as ORR,
SBD and Bannerghatta Road. We anticipate the supply
crunch and single digit vacancy levels in preferred
locations to push the average rents up by 10-12% over
2018-2020.
Colliers' View
We expect the infrastructure developments such as
allocation of funds in the Karnataka Budget 2018-2019
for the improvement of fourteen roads connecting
Whitefield and the completion of the metro rail project by
2020 to shift occupier preference to Whitefield and North
Bengaluru. Lower rents and robust supply pipeline will
further support this tilt in preference. We recommend
occupiers to pre-commit spaces in advance in these
locations to avail the benefit of lower rents.
0
20
40
60
80
100
Q1 2
010
Q1 2
011
Q1 2
012
Q1 2
013
Q1 2
014
Q1 2
015
Q1 2
016
Q1 2
017
Q1 2
018
Q1 2
019F
Q1 2
020F
Q1 2
021F
Chart Title - One Line
Source: Colliers International
Client Building Name Area (sq ft) Location
HSBC Embassy Tech Village
200,000 ORR
Robert Bosch Stand Alone 158,980 Hosur Road
CSG Systems International
Embassy Tech Village
150,000
ORR
Future Group Stand Alone 145,000 CBD
Rolls Royce Manyata Embassy Business Park
145,000
ORR
Copyright © 2018 Colliers International.
The information contained herein has been obtained from
sources deemed reliable. While every reasonable effort has
been made to ensure its accuracy, we cannot guarantee it. No
responsibility is assumed for any inaccuracies. Readers are
encouraged to consult their professional advisors prior to
acting on any of the material contained in this report.
For more information:
Surabhi Arora Senior Associate Director Research | India +91 98 7175 0808 [email protected]
Goutam Chakraborty Senior Director | Office Services Bengaluru [email protected]
Ritesh Sachdev Senior Executive Director Occupier Services | India [email protected]
Prestige Garnet, Level 2 Unit No. 201/202, 36 Ulsoor Road Bengaluru - 560042 India
0.0
5.0
10.0
15.0
20.0
2010 2011 2012 2013 2014 2015 2016 2017 2018Q1 Q2 Q3 Q4
New supply to
drive demand Karthiga Ravindran Analyst | Chennai
In line with our forecasts in 2017, the Old
Mahabalipuram Road (OMR) post-toll micromarket
has started enticing occupiers' interest in 2018.
Considering the upcoming new supply and its
advantageous location, Mount Poonamalle High
(MPH) Road is also likely to emerge as another key
growth corridor over the next three years. We
recommend that occupiers looking for large floor
plates start engaging with developers in these
emerging micromarkets.
Forecast at a glance
Demand Likely to shift to alternative micromarkets like OMR post-toll including Pallavaram Thoraipakkam Road (PTR), MPH Road and Off CBD
Supply About 13 million sq ft (1.2 million sq m) of Grade A supply to see completion over 2018-2020, representing a 24% increase in total stock; however, some projects may get deferred due to the sand crisis
Vacancy rate Overall city vacancy rate to remain about 10% in 2018. OMR pre-toll likely to see the lowest vacancy rate of less than 4% due to a lack of new supply until Q4 2019.
Rent Overall average annual rent likely to increase 3-4% over the next three years
Price Capital Values should see steady increase in line with rents and consistent demand
Low vacancy levels likely to hold down the demand for OMR pre-toll
In Q1 2018, Chennai recorded about 1 million sq ft (0.09
million sq m) of gross office leasing, a similar trend to
that seen in Q1 2017. While office demand in Chennai
was driven by relocations and expansion in 2017, Q1
2018 witnessed an increase in the number of new
entrants from the IT-ITeS, BFSI and automobile sectors.
Many market entrants have taken space in new Grade A
buildings in micromarkets such as OMR post-toll, MPH
Road and Off CBD. Special Economic Zones (SEZs) in
the city's south and west precincts retained consistent
traction due to high demand.
In line with our earlier forecasts, occupiers started
shifting their focus towards OMR post-toll owing to the
rising rents and limited space availability in the OMR pre-
toll micromarket. In Q1 2018, OMR post-toll contributed
to the highest share (23%) of total office leasing followed
by OMR pre-toll accounting for 19%, Off CBD 16%, GST
Road 15%, CBD 13%, MPH Road 12% and Ambattur
2%.
In our opinion, OMR pre-toll is likely to witness limited
transaction volume in 2018 due to absence of any
immediate new supply and the lower vacancy levels.
Guindy in Off CBD should entice occupiers looking for
small to medium floor plates. OMR post-toll and MPH
Road to remain in preference for occupiers looking for
large office spaces due to the upcoming new supply
scheduled for completions.
Rental Value Trends
Micromarkets Rental Values1
QOQ Change
YOY Change
CBD 70 - 90 0.0% 0.0%
Off-CBD 60 - 75 0.0% 0.0%
GST Road 35 - 45 0.0% 0.0%
MPH Road 50 - 65 0.0% 0.0%
OMR Pre-Toll 55 - 80 1.5% 5.5%
OMR Post-Toll 30 - 42 2.9% 2.9%
Ambattur 30 - 45 0.0% 0.0% Source: Colliers International India Research 1Indicative Grade A (non SEZ) rentals in INR per sq ft per month
Colliers Quarterly Q1 2018
CHENNAI | OFFICE 30 April 2018
2 Q1 2018 | 30 April 2018 | Chennai | Office | Colliers International
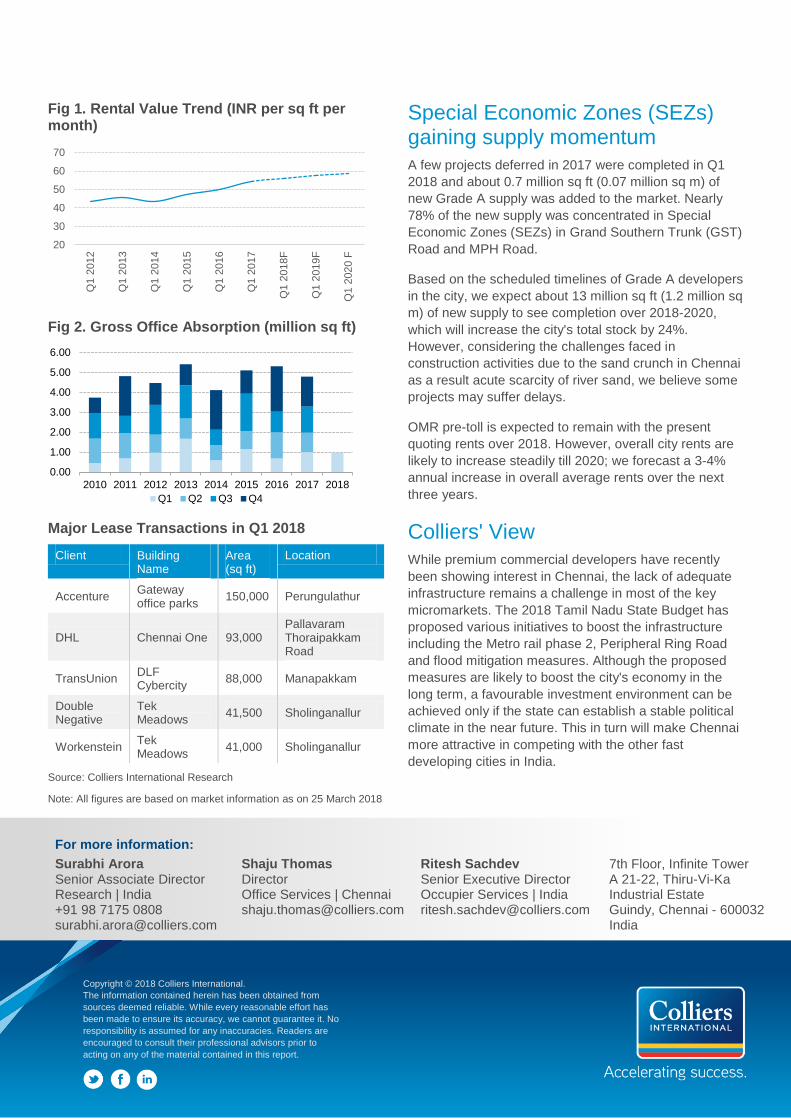
Fig 1. Rental Value Trend (INR per sq ft per month)
Fig 2. Gross Office Absorption (million sq ft)
Major Lease Transactions in Q1 2018
Client Building Name
Area (sq ft)
Location
Accenture Gateway office parks
150,000 Perungulathur
DHL Chennai One 93,000 Pallavaram Thoraipakkam Road
TransUnion DLF Cybercity
88,000 Manapakkam
Double Negative
Tek Meadows
41,500 Sholinganallur
Workenstein Tek Meadows
41,000 Sholinganallur
Source: Colliers International Research
Note: All figures are based on market information as on 25 March 2018
Special Economic Zones (SEZs) gaining supply momentum
A few projects deferred in 2017 were completed in Q1
2018 and about 0.7 million sq ft (0.07 million sq m) of
new Grade A supply was added to the market. Nearly
78% of the new supply was concentrated in Special
Economic Zones (SEZs) in Grand Southern Trunk (GST)
Road and MPH Road.
Based on the scheduled timelines of Grade A developers
in the city, we expect about 13 million sq ft (1.2 million sq
m) of new supply to see completion over 2018-2020,
which will increase the city's total stock by 24%.
However, considering the challenges faced in
construction activities due to the sand crunch in Chennai
as a result acute scarcity of river sand, we believe some
projects may suffer delays.
OMR pre-toll is expected to remain with the present
quoting rents over 2018. However, overall city rents are
likely to increase steadily till 2020; we forecast a 3-4%
annual increase in overall average rents over the next
three years.
Colliers' View
While premium commercial developers have recently
been showing interest in Chennai, the lack of adequate
infrastructure remains a challenge in most of the key
micromarkets. The 2018 Tamil Nadu State Budget has
proposed various initiatives to boost the infrastructure
including the Metro rail phase 2, Peripheral Ring Road
and flood mitigation measures. Although the proposed
measures are likely to boost the city's economy in the
long term, a favourable investment environment can be
achieved only if the state can establish a stable political
climate in the near future. This in turn will make Chennai
more attractive in competing with the other fast
developing cities in India.
20
30
40
50
60
70
Q1 2
012
Q1 2
013
Q1 2
014
Q1 2
015
Q1 2
016
Q1 2
017
Q1 2
018F
Q1 2
019F
Q1 2
020 F
0.00
1.00
2.00
3.00
4.00
5.00
6.00
2010 2011 2012 2013 2014 2015 2016 2017 2018
Q1 Q2 Q3 Q4
For more information:
Surabhi Arora Senior Associate Director Research | India +91 98 7175 0808 [email protected]
Shaju Thomas Director Office Services | Chennai [email protected]
Ritesh Sachdev Senior Executive Director Occupier Services | India [email protected]
7th Floor, Infinite Tower A 21-22, Thiru-Vi-Ka Industrial Estate Guindy, Chennai - 600032 India
Copyright © 2018 Colliers International.
The information contained herein has been obtained from
sources deemed reliable. While every reasonable effort has
been made to ensure its accuracy, we cannot guarantee it. No
responsibility is assumed for any inaccuracies. Readers are
encouraged to consult their professional advisors prior to
acting on any of the material contained in this report.
Flexible
workspace to gain
popularity in 2018 Karthiga Ravindran Analyst
Although the Hyderabad office market continued to
witness positive demand, low vacancy levels in
Grade A office space remained a challenge. We
noted high demand for flexible office space due to
the space crunch in preferred micromarkets. With
deferment expected in a few projects, we expect
about 7 million sq ft (0.6 million sq m) of new supply
to see completion over 2018. We advise developers
to track occupiers' changing needs and keep to
planned timelines. As flexible workspace is gaining
traction, developers should lead the way in adopting
new strategies in flexible offices and provide
premium amenities to guard against the competition
in future.
Forecast at a glance
Demand Cheaper rents, occupier-friendly state government policies and robust supply pipeline are likely to invite cost-conscious occupiers to Hyderabad
Supply Scheduled completions of 33 million sq ft (3.1 million sq m) over 2018-2020 looks hard to achieve
Vacancy rate Overall vacancy rate is at an all-time low at 6% in Q1 2018. The vacancy rate is likely to increase sharply to 15% over the next three years.
Rent Looking the robust upcoming supply, average rents are likely see only a marginal 2-3% rise over 2018-2020
Price Falling strata sales volume in commercial buildings likely to keep capital values stable across micromarkets
Space crunch leads to demand for flexible workspace
In Q1 2018, the gross absorption was recorded as 0.5
million sq ft (0.05 million sq m), almost the same as in
Q1 2017. The SBD micromarket remained the preferred
location among occupiers and grabbed the maximum
share of about 91% in total office leasing in Q1 2018.
Other micromarkets such as the Central Business
District (CBD) and Off-CBD accounted for a 5% and a
3% share of total leasing respectively.
Due to continuous expansion by Information Technology
and Information Technology Enabled Services (IT-ITeS)
companies, the sector contributed about 62% of the total
office demand in Q1 2018. Flexible workspace operators
such as Table Space, Isprout and Workafella accounted
for about 35% of total office absorption.
In our opinion, the increasing footprint of the flexible
workspace sector is likely to persist in Hyderabad over
2018. This reflects the lack of readily available Grade A
office space for immediate occupancy. We have seen
limited transactions of large floor plates above 50,000 sq
ft (4600 sq m) in Q1 2018 primarily due to low vacancy
levels. The average deal size came down to 22,000 sq ft
(2000 sq m) in Q1 2018 compared to the annual average
of 40,000 sq ft (3,700 sq m) in 2017.
We expect occupiers to be proactive in 2018 as a few IT-
ITeS companies are already planning to pre-commit
large office spaces in key upcoming new projects.
Therefore, we advise developers to expedite
construction of ongoing projects, in order to gain
maximum benefit from present low vacancy levels.
Rental Value Trends
Micromarkets Rental Values1
QOQ Change
YOY Change
CBD 45 - 50 0.0% 0.0%
Off-CBD 45 - 50 0.0% 0.0%
SBD 58 - 65 2.5% 10.8%
PBD 25 - 30 0.0% 0.0%
Source: Colliers International India Research
1Indicative Grade A rentals in INR per sq ft per month
Colliers Quarterly Q1 2018
HYDERABAD | OFFICE 30 April 2018
2 Q1 2018 | 30 April 2018 | Hyderabad | Office | Colliers International
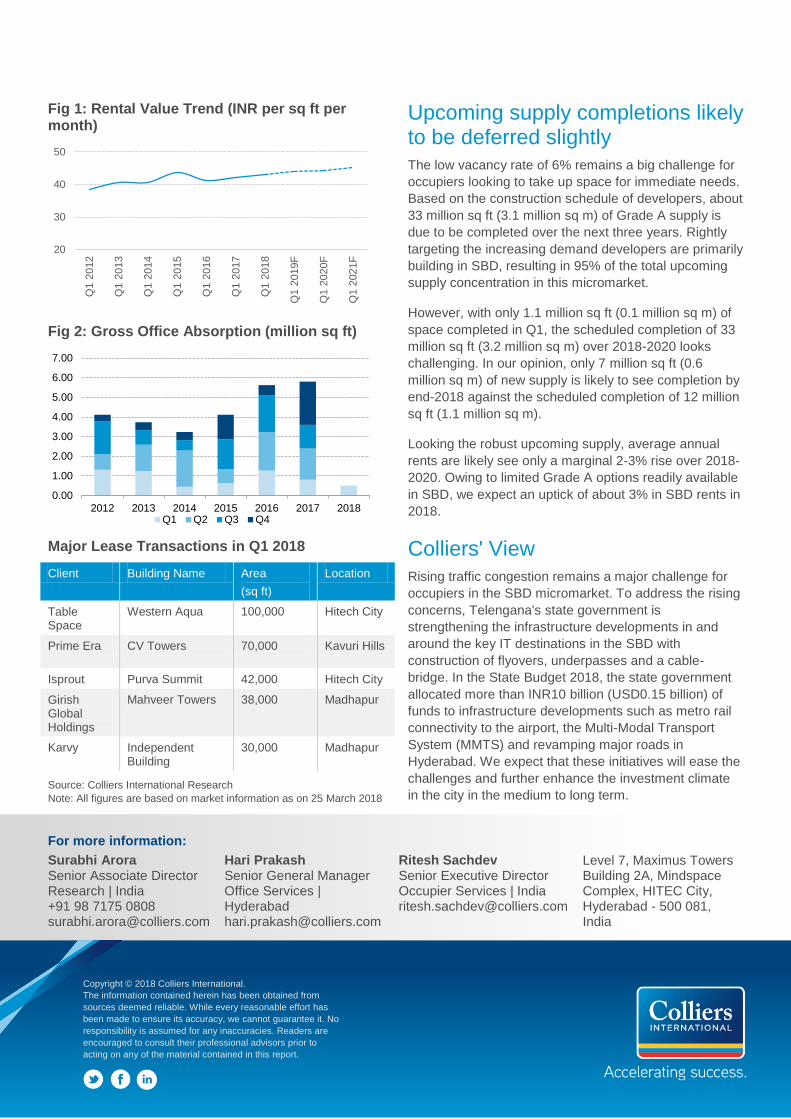
Fig 1: Rental Value Trend (INR per sq ft per month)
Fig 2: Gross Office Absorption (million sq ft)
Major Lease Transactions in Q1 2018
Client Building Name Area
(sq ft)
Location
Table Space
Western Aqua 100,000 Hitech City
Prime Era CV Towers 70,000 Kavuri Hills
Isprout Purva Summit 42,000 Hitech City
Girish Global Holdings
Mahveer Towers 38,000 Madhapur
Karvy Independent Building
30,000 Madhapur
Source: Colliers International Research
Note: All figures are based on market information as on 25 March 2018
Upcoming supply completions likely to be deferred slightly
The low vacancy rate of 6% remains a big challenge for
occupiers looking to take up space for immediate needs.
Based on the construction schedule of developers, about
33 million sq ft (3.1 million sq m) of Grade A supply is
due to be completed over the next three years. Rightly
targeting the increasing demand developers are primarily
building in SBD, resulting in 95% of the total upcoming
supply concentration in this micromarket.
However, with only 1.1 million sq ft (0.1 million sq m) of
space completed in Q1, the scheduled completion of 33
million sq ft (3.2 million sq m) over 2018-2020 looks
challenging. In our opinion, only 7 million sq ft (0.6
million sq m) of new supply is likely to see completion by
end-2018 against the scheduled completion of 12 million
sq ft (1.1 million sq m).
Looking the robust upcoming supply, average annual
rents are likely see only a marginal 2-3% rise over 2018-
2020. Owing to limited Grade A options readily available
in SBD, we expect an uptick of about 3% in SBD rents in
2018.
Colliers' View
Rising traffic congestion remains a major challenge for
occupiers in the SBD micromarket. To address the rising
concerns, Telengana's state government is
strengthening the infrastructure developments in and
around the key IT destinations in the SBD with
construction of flyovers, underpasses and a cable-
bridge. In the State Budget 2018, the state government
allocated more than INR10 billion (USD0.15 billion) of
funds to infrastructure developments such as metro rail
connectivity to the airport, the Multi-Modal Transport
System (MMTS) and revamping major roads in
Hyderabad. We expect that these initiatives will ease the
challenges and further enhance the investment climate
in the city in the medium to long term.
20
30
40
50
Q1 2
012
Q1 2
013
Q1 2
014
Q1 2
015
Q1 2
016
Q1 2
017
Q1 2
018
Q1 2
019F
Q1 2
020F
Q1 2
021F
0.00
1.00
2.00
3.00
4.00
5.00
6.00
7.00
2012 2013 2014 2015 2016 2017 2018Q1 Q2 Q3 Q4
For more information:
Surabhi Arora Senior Associate Director Research | India +91 98 7175 0808 [email protected]
Hari Prakash Senior General Manager Office Services | Hyderabad [email protected]
Ritesh Sachdev Senior Executive Director Occupier Services | India [email protected]
Level 7, Maximus Towers Building 2A, Mindspace Complex, HITEC City, Hyderabad - 500 081, India
Copyright © 2018 Colliers International.
The information contained herein has been obtained from
sources deemed reliable. While every reasonable effort has
been made to ensure its accuracy, we cannot guarantee it. No
responsibility is assumed for any inaccuracies. Readers are
encouraged to consult their professional advisors prior to
acting on any of the material contained in this report.
New SEZ supply
to drive demand Surabhi Arora Senior Associate Director | India
The Special Economic Zones (SEZs) in Pune are
gaining renewed interest among occupiers as new
supply comes onstream, especially in locations like
Kharadi and Hinjewadi. A few developers have
converted earlier launched residential projects into
commercial developments. Large occupiers in Pune
are looking for pre-commitments in state-of-the-art
buildings with modern amenities and facilities for
their employees. Hence, we advise developers to
collaborate with such occupiers to try to
accommodate their requirements in the planning
stages, gaining long-term benefits.
Forecast at a glance
Demand Demand to remain upbeat, pre-commitments are likely to continue in upcoming projects due to the low vacancy
Supply The city is slated for completion of 9.0 million sq ft (0.8 million sq m) of new Grade A supply over 2018-2020; 30% of new supply will be concentrated in SEZs
Vacancy rate Vacancy likely to remain low at 5-6% over next three years due to consistent demand and the level of pre-committed future supply
Rent After a double digit increase in rents over last two years, rents are likely to stabilise over 2018; however we expect 8-10% increase in rents over 2018-2020.
Price Likely to see upward trend with rising investor interests in the city. We forecast 5-7% increase in prices over 2018-2020
Kharadi and Hinjewadi to remain preferred among occupiers
Although the Pune office market has seen low vacancy
since 2017, the city recorded about 1.8 million sq ft (0.17
million sq m) of gross office absorption in Q1 2018. This
is an increase of about 131% in gross absorption YOY.
About 57% of total leasing was concentrated in SEZs,
driven by a couple of transactions larger than 100,000 sq
ft (9290 sq m).
Office demand continued to be driven by technology
occupiers with the sector accounting for about 87% of
the total leasing volume in the city. Companies like
Credit Suisse Services, Tata Consultancy Services
(TCS), Deutsche Bank and Bajaj Finserve leased large
office spaces for expansion purposes in Q1 2018. We
expect the leasing momentum to continue with the influx
of new supply.
We expect Kharadi and Hinjewadi to remain the most
popular locations among occupiers. In our opinion, new
supply should continue to entice technology occupiers'
focus towards micromarkets such as Kharadi and
Hinjewadi in the next three years.
Rental Value Trends
Micromarkets Rental Values1
QOQ
Change
YOY Change
Baner 57-65 0.0% 4.3%
Bund Garden 55-70 0.0% 0.8%
Airport Rd/Pune Station 65-90 0.0% 3.3%
Aundh 60-65 0.0% 9.6%
Senapati Bapat Road 65-125 0.0% 2.7%
Bavdhan 45-50 0.0% 3.3%
Kalyani Nagar 55-65 0.0% 2.6%
Nagar Road 55-65 0.0% 2.6%
Hinjewadi 45-55 0.0% 1.0%
Hadapsar/Fursungi 68-75 0.0% 2.1%
Kharadi 55-105 -3.0% 5.3%
Source Colliers International India Research
Indicative Grade A rentals in INR per sq ft per month
Colliers Quarterly Q1 2018
PUNE | OFFICE 30 April 2018
2 Colliers Quarterly
Q1 2018 | 30 April 2018 | Pune | office | Colliers International
Fig 1. Rental Value Trend (INR per sq ft per month)
Fig 2. Gross Office Absorption (million sq ft)
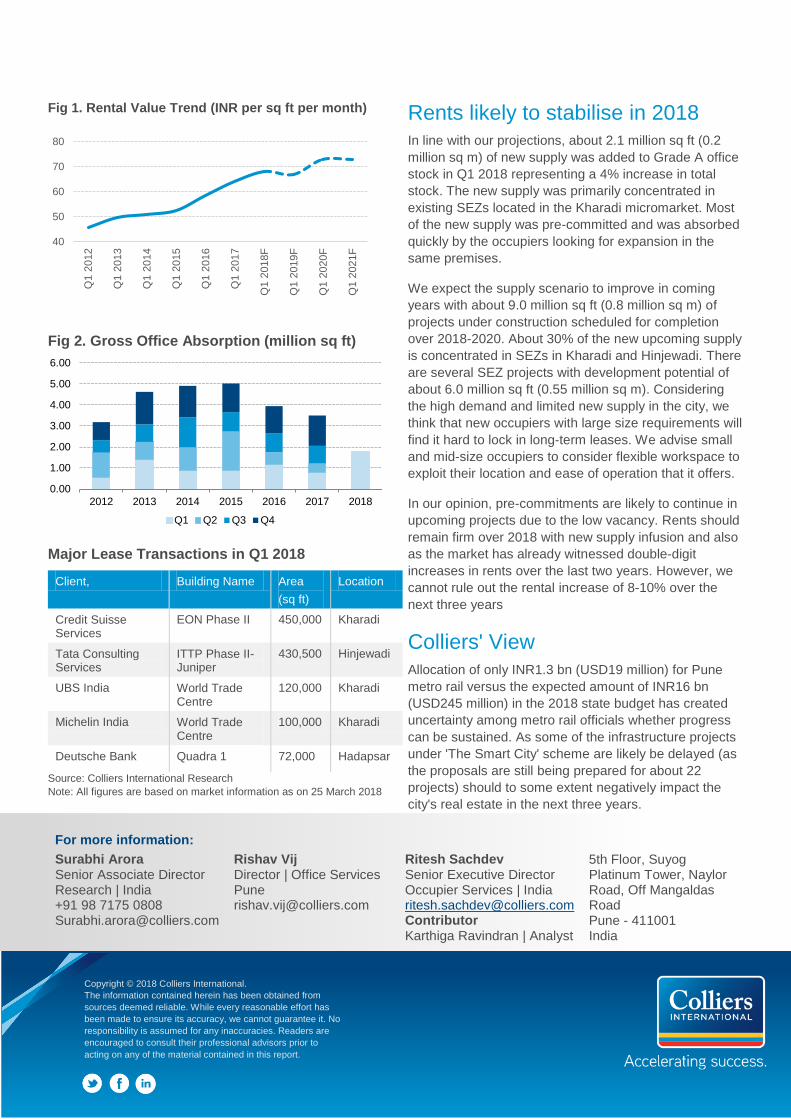
Major Lease Transactions in Q1 2018
Client, Building Name Area
(sq ft)
Location
Credit Suisse Services
EON Phase II 450,000 Kharadi
Tata Consulting Services
ITTP Phase II-Juniper
430,500 Hinjewadi
UBS India World Trade Centre
120,000 Kharadi
Michelin India World Trade Centre
100,000 Kharadi
Deutsche Bank Quadra 1 72,000 Hadapsar
Source: Colliers International Research
Note: All figures are based on market information as on 25 March 2018
Rents likely to stabilise in 2018
In line with our projections, about 2.1 million sq ft (0.2
million sq m) of new supply was added to Grade A office
stock in Q1 2018 representing a 4% increase in total
stock. The new supply was primarily concentrated in
existing SEZs located in the Kharadi micromarket. Most
of the new supply was pre-committed and was absorbed
quickly by the occupiers looking for expansion in the
same premises.
We expect the supply scenario to improve in coming
years with about 9.0 million sq ft (0.8 million sq m) of
projects under construction scheduled for completion
over 2018-2020. About 30% of the new upcoming supply
is concentrated in SEZs in Kharadi and Hinjewadi. There
are several SEZ projects with development potential of
about 6.0 million sq ft (0.55 million sq m). Considering
the high demand and limited new supply in the city, we
think that new occupiers with large size requirements will
find it hard to lock in long-term leases. We advise small
and mid-size occupiers to consider flexible workspace to
exploit their location and ease of operation that it offers.
In our opinion, pre-commitments are likely to continue in
upcoming projects due to the low vacancy. Rents should
remain firm over 2018 with new supply infusion and also
as the market has already witnessed double-digit
increases in rents over the last two years. However, we
cannot rule out the rental increase of 8-10% over the
next three years
Colliers' View
Allocation of only INR1.3 bn (USD19 million) for Pune
metro rail versus the expected amount of INR16 bn
(USD245 million) in the 2018 state budget has created
uncertainty among metro rail officials whether progress
can be sustained. As some of the infrastructure projects
under 'The Smart City' scheme are likely be delayed (as
the proposals are still being prepared for about 22
projects) should to some extent negatively impact the
city's real estate in the next three years.
40
50
60
70
80
Q1 2
012
Q1 2
013
Q1 2
014
Q1 2
015
Q1 2
016
Q1 2
017
Q1 2
018F
Q1 2
019F
Q1 2
020F
Q1 2
021F
0.00
1.00
2.00
3.00
4.00
5.00
6.00
2012 2013 2014 2015 2016 2017 2018
Q1 Q2 Q3 Q4
Copyright © 2018 Colliers International.
The information contained herein has been obtained from
sources deemed reliable. While every reasonable effort has
been made to ensure its accuracy, we cannot guarantee it. No
responsibility is assumed for any inaccuracies. Readers are
encouraged to consult their professional advisors prior to
acting on any of the material contained in this report.
For more information:
Surabhi Arora Senior Associate Director Research | India +91 98 7175 0808 [email protected]
Rishav Vij Director | Office Services Pune [email protected]
Ritesh Sachdev Senior Executive Director Occupier Services | India [email protected] Contributor Karthiga Ravindran | Analyst
5th Floor, Suyog Platinum Tower, Naylor Road, Off Mangaldas Road Pune - 411001 India
New investments
to drive demand Saif Lari Assistant Manager
We expect the office market to gain momentum in
the next 3-5 years majorly driven my government's
policies. The ease of doing business, increased
focus on infrastructure development and renewed
private investment are likely to boost the expansion
of the commercial office market in the city. Due to
the high vacancy levels in peripheral locations, we
advise developers to remain flexible in rents and
leasing terms to retain and attract new occupiers.
Forecast at a glance
Demand Demand looks promising over the next 3-5 years due to an expected increase in investments driven by proactive government policies
Supply We project a supply pipeline of 2.2 million sq ft (0.2 million sq m) over 2018-2020
Vacancy rate Average city-level vacancy rate set to remain high in the range of 25%-28% over the next 3 years.
Rent High vacancy rates to keep rents stable in most micromarkets except the CBD which is likely see annual average increase of 2-3% over 2018-2020
Price
Capital values likely to see a 4-5% increase over 2018-2020 due to renewed interest from the domestic investors
Despite restricted supply in coming quarters, rents to remain stable
In Q1 2018, Kolkata's office market maintained the
status quo with 0.2 million sq ft (18,000 sq m) of gross
absorption, similar to absorption in Q4 2017. We
observed a marginal improvement in enquiries mostly by
domestic occupiers for their expansion requirements.
Occupier demand was largely driven by relocations and
expansion in the peripheral areas. The bulk of leasing
volume, 60%, was concentrated in Sector V while New
Town and Rajarhat accounted for a 36% share. The
remaining 4% of the transaction volume was observed in
CBD locations. In Q1 2018, Banking, Finance and
Insurance Services (BFSI) dominated the overall leasing
market, accounting for 44%. The Information Technology
sector accounted for a 26% share followed by
Engineering and Manufacturing (17%), Healthcare and
Pharmaceutical (12%) sectors.
In the recently held Bengal Investment Summit 2018, the
state of West Bengal received a huge INR2,200 billion
(USD33.8 billion) worth of overall investment proposals
from various industries. Prominent companies including
Reliance Industries and Adani Group promised to invest
INR 50 billion (USD764 million) and INR15 billion
(USD230 million) respectively. These future investments
are expected to positively impact the office market over
the next 3-5 years.
Rental Values
Micromarkets Rental Values1
q-o-q Change
y-o-y Change
CBD2 80 - 110 0% -5%
SBD3 60 - 70 0% 0%
Sector V 40 - 45 6% 14%
PBD4 28 - 32 0% 1%
Source Colliers International India Research
1Indicative Grade A rentals in INR per sq ft per month
2Park Street, Camac Street, Chowranghee Road, AJC Bose Road
3EM Bypass, Topsia, Ruby
4Salt Lake, New Town, Rajarhat
Colliers Quarterly
Q1 2018
KOLKATA | SECTOR 30 April 2018
2 Q1 2018 | | kolkata | Sector | Colliers International
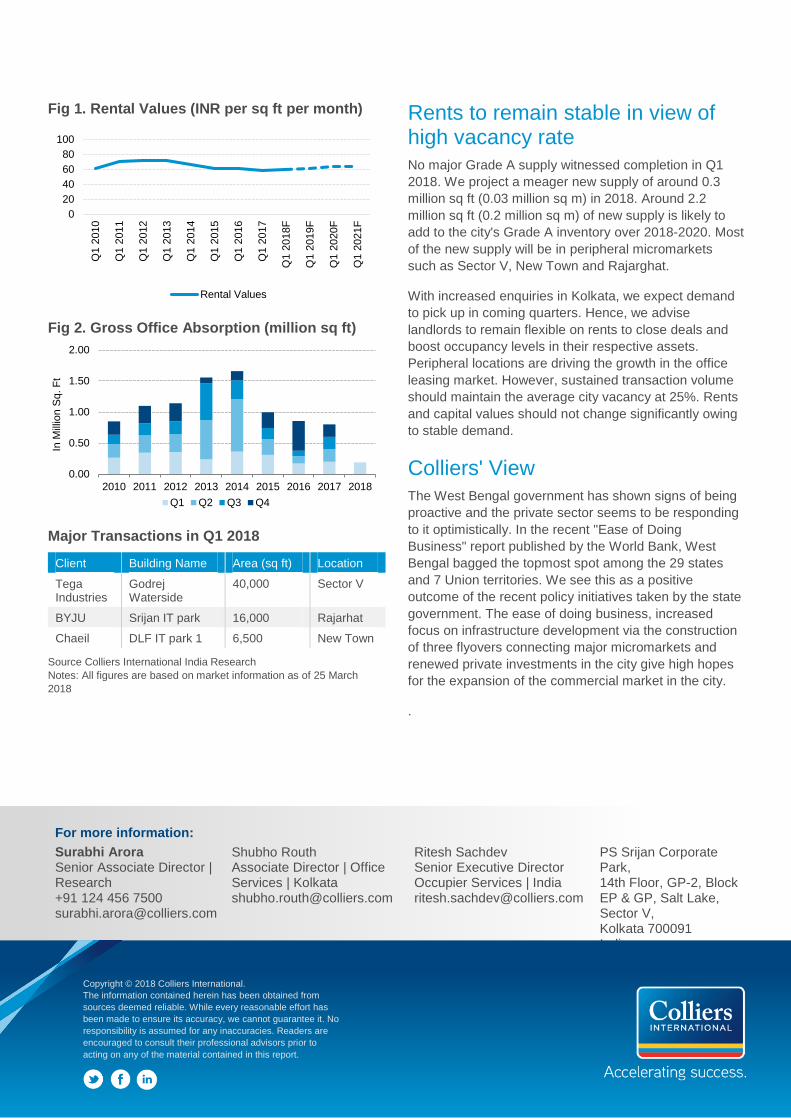
Fig 1. Rental Values (INR per sq ft per month)
Fig 2. Gross Office Absorption (million sq ft)
Major Transactions in Q1 2018
Client Building Name Area (sq ft) Location
Tega Industries
Godrej Waterside
40,000 Sector V
BYJU Srijan IT park 16,000 Rajarhat
Chaeil DLF IT park 1 6,500 New Town
Source Colliers International India Research
Notes: All figures are based on market information as of 25 March
2018
Rents to remain stable in view of high vacancy rate
No major Grade A supply witnessed completion in Q1
2018. We project a meager new supply of around 0.3
million sq ft (0.03 million sq m) in 2018. Around 2.2
million sq ft (0.2 million sq m) of new supply is likely to
add to the city's Grade A inventory over 2018-2020. Most
of the new supply will be in peripheral micromarkets
such as Sector V, New Town and Rajarghat.
With increased enquiries in Kolkata, we expect demand
to pick up in coming quarters. Hence, we advise
landlords to remain flexible on rents to close deals and
boost occupancy levels in their respective assets.
Peripheral locations are driving the growth in the office
leasing market. However, sustained transaction volume
should maintain the average city vacancy at 25%. Rents
and capital values should not change significantly owing
to stable demand.
Colliers' View
The West Bengal government has shown signs of being
proactive and the private sector seems to be responding
to it optimistically. In the recent "Ease of Doing
Business" report published by the World Bank, West
Bengal bagged the topmost spot among the 29 states
and 7 Union territories. We see this as a positive
outcome of the recent policy initiatives taken by the state
government. The ease of doing business, increased
focus on infrastructure development via the construction
of three flyovers connecting major micromarkets and
renewed private investments in the city give high hopes
for the expansion of the commercial market in the city.
.
0
20
40
60
80
100
Q1 2
010
Q1 2
011
Q1 2
012
Q1 2
013
Q1 2
014
Q1 2
015
Q1 2
016
Q1 2
017
Q1 2
018F
Q1 2
019F
Q1 2
020F
Q1 2
021F
Rental Values
0.00
0.50
1.00
1.50
2.00
2010 2011 2012 2013 2014 2015 2016 2017 2018
In M
illio
n S
q. F
t
Q1 Q2 Q3 Q4
For more information:
Surabhi Arora Senior Associate Director | Research +91 124 456 7500 [email protected]
Shubho Routh Associate Director | Office Services | Kolkata [email protected]
Ritesh Sachdev Senior Executive Director Occupier Services | India [email protected]
PS Srijan Corporate Park, 14th Floor, GP-2, Block EP & GP, Salt Lake, Sector V, Kolkata 700091 India
Copyright © 2018 Colliers International.
The information contained herein has been obtained from
sources deemed reliable. While every reasonable effort has
been made to ensure its accuracy, we cannot guarantee it. No
responsibility is assumed for any inaccuracies. Readers are
encouraged to consult their professional advisors prior to
acting on any of the material contained in this report.

Copyright © 2018 Colliers International.
The information contained herein has been obtained from sources deemed reliable. While every reasonable effort has been made to ensure its accuracy, we cannot guarantee it. No responsibility is assumed for any inaccuracies. Readers are encouraged to consult their professional advisors prior to acting on any of the material contained in this report.
413 offices in
69 countries on
6 continents United States: 145
Canada: 28
Latin America: 23
Asia Pacific: 86
EMEA: 131
$2.7 billion in annual revenue
2 billion square feet under management
15,400 professionals and staff
Primary Author:
Surabhi Arora
Senior Associate Director | Research | India
+91 98 7175 0808 | [email protected]
Regional Authors:
Saif Lari | Assistant Manager
Teni Abraham | Analyst
Karthiga Ravindran | Analyst
Contributors:
Andrew Haskins | Executive Director
Research | Asia | [email protected]
For more information:
Ritesh Sachdev
Sr.Executive Director | Occupier Services | India
Colliers International | India
Indiabulls Finance Center, 17th Floor,
Unit No. 1707, Tower 3, Senapati Bapat Marg,
Elphinstone(W), Mumbai 400 013, Maharashtra | India
+91 022 49249780
About Colliers International Group Inc.
Colliers International Group Inc. (NASDAQ & TSX: CIGI) is an industry-leading real estate services
company with a global brand operating in 69 countries and a workforce of more than 12,000 skilled
professionals serving clients in the world’s most important markets. Colliers is the fastest-growing
publicly listed global real estate services company, with 2017 corporate revenues of $2.3 billion ($2.7
billion including affiliates). With an enterprising culture and significant employee ownership and
control, Colliers professionals provide a full range of services to real estate occupiers, owners and
investors worldwide. Services include strategic advice and execution for property sales, leasing and
finance; global corporate solutions; property, facility and project management; workplace solutions;
appraisal, valuation and tax consulting; customized research; and thought leadership consulting.
Colliers professionals think differently, share great ideas and offer thoughtful and innovative advice
that help clients accelerate their success. Colliers has been ranked among the top 100 global
outsourcing firms by the International Association of Outsourcing Professionals for 13 consecutive
years, more than any other real estate services firm. Colliers has also been ranked the number one
property manager in the world by Commercial Property Executive for two years in a row.
For the latest news from Colliers, visit Colliers.com or follow us on Twitter: @Colliers and LinkedIn.