Embed Size (px)
Citation preview

2019 – 2020 Reflections on Who We Are
Our Story for Student Success Excellence in Education for the 21st Century

El Dorado County Office of Education 2019-2020
REFLECTIONS ON WHO WE ARE
HOW WE STARTED
Early on, Native Americans populated El Dorado County. The exploration of the area by Europeans and Mexicans followed as trappers and adventurers traversed the rivers up from San Francisco Bay.
Much of our culture was born out of the gold rush, which was launched by the discovery of gold in 1848 at Sutter’s Mill in Coloma. Our county’s name, El Dorado, is Spanish for “the gilded one”. El Dorado County is the site that historian’s state most changed the direction of the United States with its promises of riches. The flow of miners and immigrants into this county in search of wealth in the gold fields helped produce a diverse and
entrepreneurial culture, which continues today. After the gold rush subsided, the other natural riches of lumber, agricultural lands and an abundant water supply continued to draw people to the county. Highways, railroads and community services were developed to support the continued growth, which brings us to today.
CURRENT COUNTY GEOGRAPHY AND DEMOGRAPHICSGeography and demographic trends are the foundation upon which other community indicators are built. The geographic area served covers all of El Dorado County in the State of California. It is a diverse county, covering metropolitan suburbs of Sacramento to rural foothill communities up the western slope of the Sierra Nevada Mountains to beautiful Lake Tahoe. Country roads off Highway 50 can lead you through urban suburbs, rich agricultural or recreational land. The developing wine country draws visitors
and awards for its wines. Visits to Apple Hill’s orchards, craft fairs and Christmas tree farms are popular harvest traditions. The western slope of the Sierras is home to the El Dorado National Forest, famous for the off-road vehicle Rubicon Trail. This mountain area provides skiing, hiking, camping, boating and fishing as well as supports the logging industry.
El Dorado County's total land area is 1,711 square miles. El Dorado County's population density has steadily risen over time. As of 2013, El Dorado County had 106 residents per square mile compared to the State’s density of 239 people per square mile. It is projected that by 2020, the population density in El Dorado County will reach 132 people per square mile.
EL DORADO COUNTY’S LOCATION
Historic Placerville is the seat of government for El Dorado County. Placerville sits at an elevation of 2,000 feet and transitions the foothills to mountains.
Population: 190,678 (U.S. Census Quick Facts v2018)
Per Capita personal income: $38,156 (U.S. Census Quick Facts v2018)
1

El Dorado County Office of Education 2019-2020
EL DORADO COUNTY AGE DISTRIBUTION Age distribution impacts an area's economy, public services, and school systems. The largest age group in El Dorado County in 2010 was the 50-59 year-old range; representing about 17.6 percent of the county population. Since 2000, the number of people age of 50 and above has steadily increased while the ages of 30-39 have decreased.
AGE DISTRIBUTION
Source: California Department of Finance, Demographic Research Unit and US Census 2010
Year 0-9 10-19 20-29 30-39 40-49 50-59 60-69 70-79 80+
2000 20,471 24,817 13,312 21,933 30,080 21,472 12,847 9,210 4,479
2001 20,012 26,175 12,986 21,722 31,017 23,018 13,452 9,362 4,819
2002 19,538 27,365 13,243 21,091 31,697 24,441 14,132 9,540 5,107
2003 19,234 27,551 13,846 20,408 32,045 25,808 15,013 9,753 5,370
2004 18,973 27,936 14,717 19,667 32,324 27,269 15,838 9,976 5,620
2005 18,866 28,153 15,671 19,158 32,418 28,717 16,667 10,155 5,814
2006 18,640 27,990 16,949 18,303 32,058 29,875 17,494 10,353 5,985
2007 18,649 27,739 18,291 17,829 31,630 30,716 18,922 10,588 6,147
2008 18,758 27,361 19,740 17,330 31,099 31,709 20,158 10,967 6,277
2009 19,035 26,904 21,195 16,742 30,725 32,577 21,430 11,314 6,414
2010 19,458 26,245 22,714 16,113 30,351 33,377 22,790 11,692 6,568
2

El Dorado County Office of Education 2019-2020
EL DORADO COUNTY ETHNIC DIVERSITY
While it is sometimes difficult to classify, race and ethnicity of a population is self-determined. The categories included in the census generally reflect a social definition of race recognized in this country and is not an attempt to define race biologically, anthropologically or genetically. These classifications are those used by the U.S. Census Bureau and have been modified over time. People may choose to report more than one race to indicate their racial mixture and people who identify their origin as Hispanic, Latino, or Spanish may be of any race.
EL DORADO COUNTY POPULATION BY RACE/ETHNICITY BY CENSUS YEAR
Source: California Department of Finance, Demographic Research Unit and US Census 2000
Source: US Census 2010, California Dept. of Finance
Census Year
Total* White Hispanic Asian Black/ African
American
American Indian
Other
2000 158,621 135,355 14,787 3,340 776 1,306 3,057
Census Year
Total* White Hispanic Asian Black/ African
American
American Indian/ Alaska Native
Other
2010 181,308 158,918 21,116 3,717 836 1,355 3,366
2020(p) 225,439 174,965 33,483 11,133 3,378 2,480 n/a
2030(p) 267,535 197,336 47,742 15,119 4,324 3,014 n/a
*Current Federal standardsmandate that race and Hispanicorigin (ethnicity) are separate anddistinct concepts when collectingthese data via self-identification.The identified categories may addto more than the total populationbecause individuals may reportmore than one race or race andorigin.
3

El Dorado County Office of Education 2019-2020
EL DORADO POPULATION BY EDUCATIONAL ATTAINMENT
The largest educational group in the county has some college education with no degree. High school graduates and residents holding bachelor’s degrees followed shortly behind. El Dorado County is above the statewide averages for residents having some higher education.
Source: U.S. Census Bureau; 2010 Selected Social Characteristics in the United States
4

El Dorado County Office of Education 2019-2020
Education’s Story in El Dorado County
“There was no school for 33 years, no records, no building, but local people felt a need for educating the youngsters…they put it all together about 1929. Barton’s horse barn, after a thorough scrubbing, became a school. Al Lampson was building a warehouse at the “Y”, and he made tables and benches of surfaced, unpainted lumber. With hardly any of the things we think of as necessary for a school, we who were accustomed to running free all summer were closed into a classroom. The poor teacher must have had her hands full but the parents were very happy.”
Remembering the first school at Tahoe, Clara Butler Neilsen, 1989, Mother Lode of Learning, One Room Schools of El Dorado County, Retired Teacher’s Association, Edna Miller, copyright 1990.
OUR BEGINNINGS
“The arrival of children to the gold county in the 1850s created a need for schools throughout El Dorado County. Although the new state’s Constitution provided for public schools, it took a few more years before such funding arrived. As early as 1852, private schools began to take in pupils. Teachers, predominantly women, typically instructed students in the parlors of the homes. However, it cost money to send children to these private schools. Many parents could not afford the expense so not all children attended school.”
“By 1854, Placerville began establishing its own school district. By 1860 the following school districts had been established:”
Placerville Placerville City
Upper Placerville
Greenwood
Johnson’s French Creek Buckeye Flat Mountain
Green Valley Mount Aukum Flat
Coloma Indian Diggings
Gold Hill Smith’s Flat Cold Springs Georgetown
Uniontown Diamond Springs
Diamond Pilot Hill
Newtown El Dorado Coyoteville Dry Creek
Kelsey Mount Gregory
Clarksville Cedarville
Consumes Grove Deer Creek Negro Hill
Spanish Dry Diggings Jaywalk Salmon Falls
Public School Districts that were added later included:
Cave Valley Latrobe Mosquito Mud Springs
Pleasant Valley
From The Heritage Association of El Dorado County, Preserving the Past for the Future, One Room School Houses Display, 2006
5

El Dorado County Office of Education 2019-2020
TODAY- WE’RE BIG BUSINESS Education in El Dorado County is really big business!
We serve a total student population of 28,221. Our story of diversity continues to be seen with Silver Fork Elementary District having only 13 students to El Dorado Union High School with 6,739 students. We serve 19,192 students in grades K-8 and 9,029 in grades 9-12
SCHOOL DISTRICTS IN EL DORADO COUNTY
SIZE OF SCHOOL DISTRICTS IN STUDENTS
Under 1,000 8 1,000 to 1,999 32,000 to 3,999 2 4,000 or more 2 Total 15
NUMBER OF SCHOOLS
Elementary 29 Middle/Junior High 12 High School 6 Continuation 5 Charter 9 Alternative 5 Total 66
STUDENT BREAKDOWN
Grades K-8 19,192 Grades 9-12 9,029 Total 28,221
CDE Dataquest 2018-2019 Elementary 12 High School 1 Unified 2 Total 15
El Dorado High School
6

El Dorado County Office of Education 2019-2020
CHANGE AND GROWTH
As the 20th century progressed, the school districts evolved into the structure we have today with just a few exceptions. We have fewer but larger districts to take advantage of economy of scale. The need for quality education available to all children has not changed and the individual story of each child still drives our commitment to educational excellence.
STUDENT COUNT BY DISTRICT
Silver Fork Elementary 13
Indian Diggings Elementary 18
Latrobe Elementary 145
Pioneer Elementary 287
Gold Oak Elementary 482
Camino Elementary 474
Gold Trail Elementary 661
Pollock Pines Elementary 663
Mother Lode Elementary 1030
Placerville Elementary 1304
Black Oak Mine Unified 1249
Lake Tahoe Unified 3872
Rescue Elementary 3632
Buckeye Elementary 6168
El Dorado Union High School 6739
El Dorado County Office of Education 1484
CDE Dataquest 2017-2018 Total 28,221 Courtesy The Heritage Association of El Dorado County, Mother Lode of Learning, One Room Schools in El Dorado County Retired Teachers’ Association, Edna
7
*
*Charters included: California Montessori Project, Clarsksville Charter, Mandarin Immersion Charter, Rising Sun Montessori and Valley View Montessori.

El Dorado County Office of Education 2019-2020
8
DISTRICT ENROLLMENT CHANGES- OVER DECADE District 2009 2019 Change % Change
Black Oak Mine Unified 1644 1249 -395 -32%
Buckeye Elementary* 5075 6168 1093 18%
Camino Elementary 426 474 48 10%
El Dorado Union High School 7061 6739 -322 -5%
Gold Oak Elementary 589 482 -107 -22%
Gold Trail Elementary 542 661 119 18%
Indian Diggings Elementary 23 18 -5 -28%
Lake Tahoe Unified 3965 3872 -93 -2%
Latrobe Elementary 178 145 -33 -23%
Mother Lode Elementary 1343 1030 -313 -30%
Pioneer Elementary 403 287 -116 -40%
Placerville Elementary 1211 1304 93 7%
Pollock Pines Elementary 721 663 -58 -9%
Rescue Elementary 4116 3632 -484 -13%
Silver Fork Elementary 16 13 -3 -23%
El Dorado County Office of Education 1054 1484 427 29%
Total 28,367 28,221 -146 -1%* includes students enrolled in a Charter California Montessori (CDE Dataquest, County Enrollment by Year by Grade with District Data 2009-10, 2018-19)
El Dorado County Office of Education 2019-2020
9
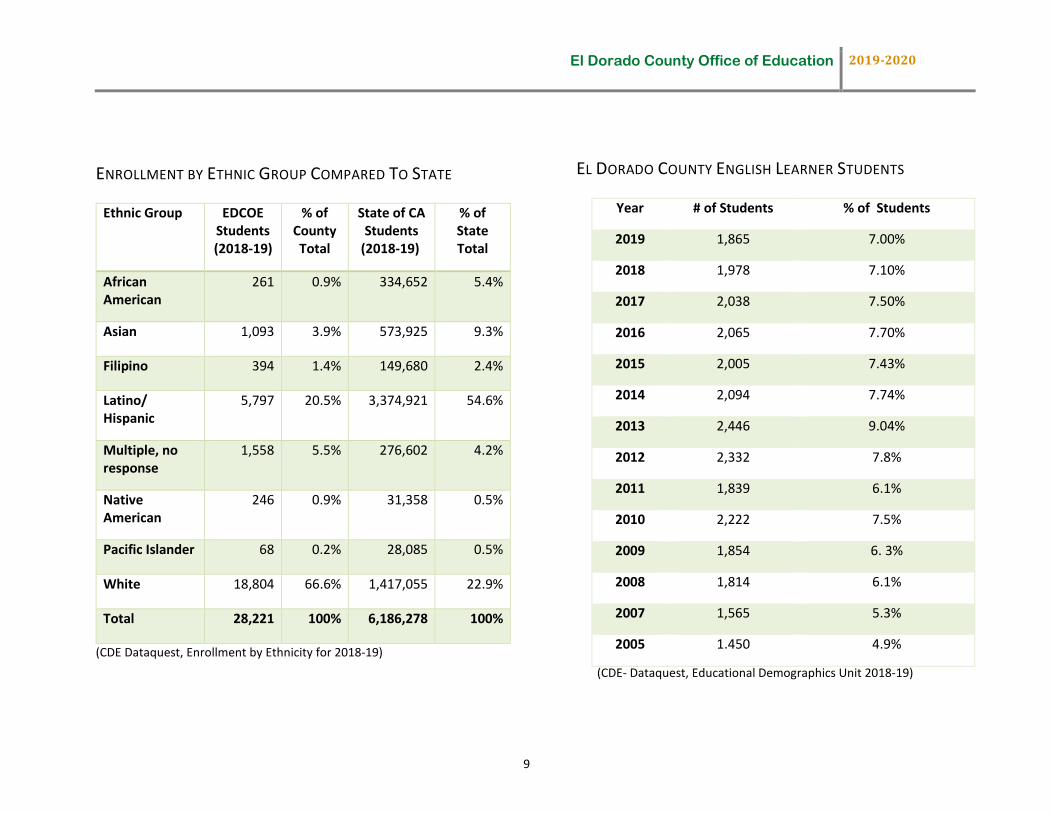
ENROLLMENT BY ETHNIC GROUP COMPARED TO STATE
Ethnic Group EDCOE Students (2018-19)
% of County Total
State of CA Students
(2018-19)
% of State Total
African American
261 0.9% 334,652 5.4%
Asian 1,093 3.9% 573,925 9.3%
Filipino 394 1.4% 149,680 2.4%
Latino/ Hispanic
5,797 20.5% 3,374,921 54.6%
Multiple, no response
1,558 5.5% 276,602 4.2%
Native American
246 0.9% 31,358 0.5%
Pacific Islander 68 0.2% 28,085 0.5%
White 18,804 66.6% 1,417,055 22.9%
Total 28,221 100% 6,186,278 100%
(CDE Dataquest, Enrollment by Ethnicity for 2018-19)
EL DORADO COUNTY ENGLISH LEARNER STUDENTS
(CDE- Dataquest, Educational Demographics Unit 2018-19)
Year # of Students % of Students
2019 1,865 7.00%
2018 1,978 7.10%
2017 2,038 7.50%
2016 2,065 7.70%
2015 2,005 7.43%
2014 2,094 7.74%
2013 2,446 9.04%
2012 2,332 7.8%
2011 1,839 6.1%
2010 2,222 7.5%
2009 1,854 6. 3%
2008 1,814 6.1%
2007 1,565 5.3%
2005 1.450 4.9%
El Dorado County Office of Education 2019-2020
10
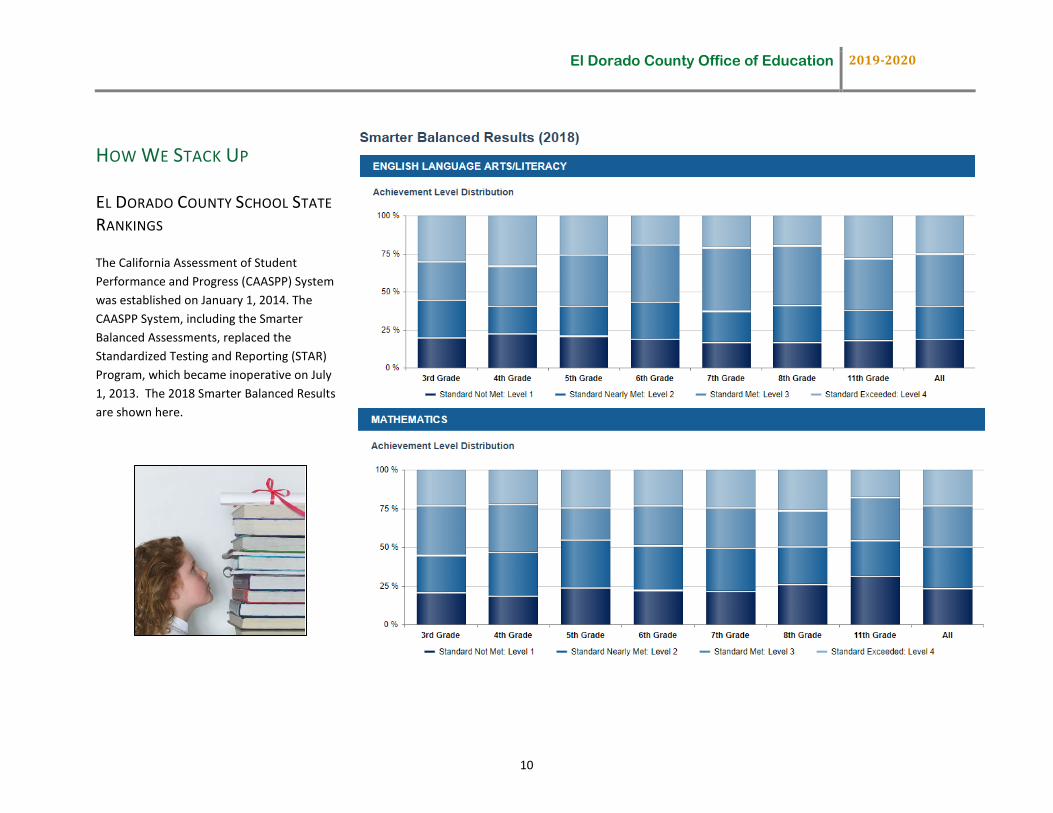
HOW WE STACK UP
EL DORADO COUNTY SCHOOL STATERANKINGS
The California Assessment of Student Performance and Progress (CAASPP) System was established on January 1, 2014. The CAASPP System, including the Smarter Balanced Assessments, replaced the Standardized Testing and Reporting (STAR) Program, which became inoperative on July 1, 2013. The 2018 Smarter Balanced Results are shown here.

El Dorado County Office of Education 2019-2020
11
FITNESS TESTS
Body composition results provide an estimate of the percent of a student’s weight that is fat in contrast to the “fat-free” body mass that comes from muscles, bones, and organs.
73.9 73.378.1
59.5 61 62.7
0
10
20
30
40
50
60
70
80
90
5th Grade 7th Grade 9th Grade
% of Students in the Healthy Fitness Zone (HFZ) for Body Composition 2017-2018
EDC State

El Dorado County Office of Education 2019-2020
12
OUR ROLE WITH TEACHER CREDENTIALINGFOR SCHOOLS IN EL DORADO COUNTY
EL DORADO COUNTY OFFICE OF EDUCATION PROVIDESTEACHER CREDENTIAL APPLICATION PROCESSING AND MONITORING OF CREDENTIALS FOR ALL PUBLIC SCHOOLS IN THE COUNTY
EL DORADO COUNTY’S RECOGNIZED SCHOOLS
2019 California Distinguished Schools California recognized outstanding education programs and practices in elementary schools in 2019.
National Blue Ribbon School Awards 2000- 2017
2017- William Brooks Elementary School (Buckeye Union School District) 2015- Oak Meadows Elementary School (Buckeye Union School District)
2009- Sierra Elementary (Placerville Union Elementary) 2008- Oak Ridge High School (El Dorado Union High School District) 2005- Lake Forest School (Rescue USD)
2001- Rolling Hills Middle School (Buckeye USD)
District Schools Rescue Union School District
Marina Village Middle School
171 Credential Applications were processed in 2017-2018
One quarter of Certificated Employee Assignments are monitored each year.
At this point in time 100% of Teachers/Administrators were properly assigned (Commission on Teacher Credentialing)