Embed Size (px)
Citation preview
2018-19 School Accountability Report Card for Summit Intermediate School Page 1 of 13
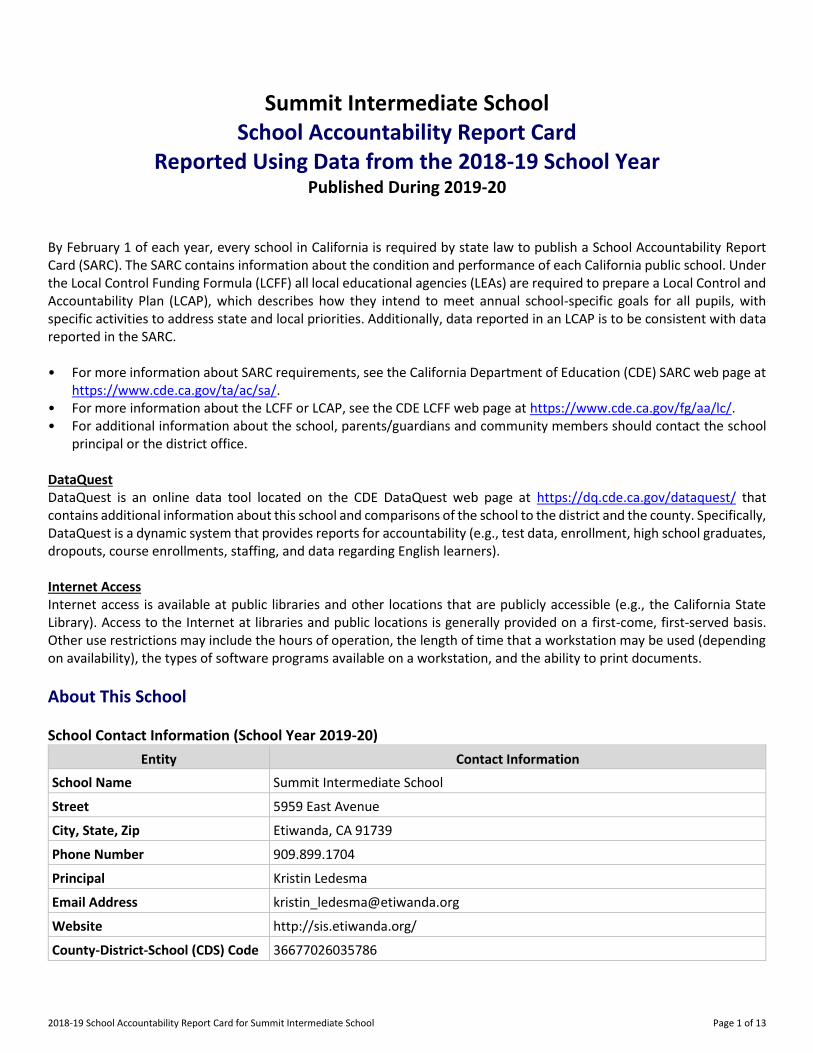
Summit Intermediate School
School Accountability Report Card
Reported Using Data from the 2018-19 School Year
Published During 2019-20
By February 1 of each year, every school in California is required by state law to publish a School Accountability Report Card (SARC). The SARC contains information about the condition and performance of each California public school. Under the Local Control Funding Formula (LCFF) all local educational agencies (LEAs) are required to prepare a Local Control and Accountability Plan (LCAP), which describes how they intend to meet annual school-specific goals for all pupils, with specific activities to address state and local priorities. Additionally, data reported in an LCAP is to be consistent with data reported in the SARC. • For more information about SARC requirements, see the California Department of Education (CDE) SARC web page at
https://www.cde.ca.gov/ta/ac/sa/. • For more information about the LCFF or LCAP, see the CDE LCFF web page at https://www.cde.ca.gov/fg/aa/lc/. • For additional information about the school, parents/guardians and community members should contact the school
principal or the district office. DataQuest DataQuest is an online data tool located on the CDE DataQuest web page at https://dq.cde.ca.gov/dataquest/ that contains additional information about this school and comparisons of the school to the district and the county. Specifically, DataQuest is a dynamic system that provides reports for accountability (e.g., test data, enrollment, high school graduates, dropouts, course enrollments, staffing, and data regarding English learners). Internet Access Internet access is available at public libraries and other locations that are publicly accessible (e.g., the California State Library). Access to the Internet at libraries and public locations is generally provided on a first-come, first-served basis. Other use restrictions may include the hours of operation, the length of time that a workstation may be used (depending on availability), the types of software programs available on a workstation, and the ability to print documents.
About This School
School Contact Information (School Year 2019-20)
Entity Contact Information
School Name Summit Intermediate School
Street 5959 East Avenue
City, State, Zip Etiwanda, CA 91739
Phone Number 909.899.1704
Principal Kristin Ledesma
Email Address [email protected]
Website http://sis.etiwanda.org/
County-District-School (CDS) Code 36677026035786
2018-19 School Accountability Report Card for Summit Intermediate School Page 2 of 13
Entity Contact Information
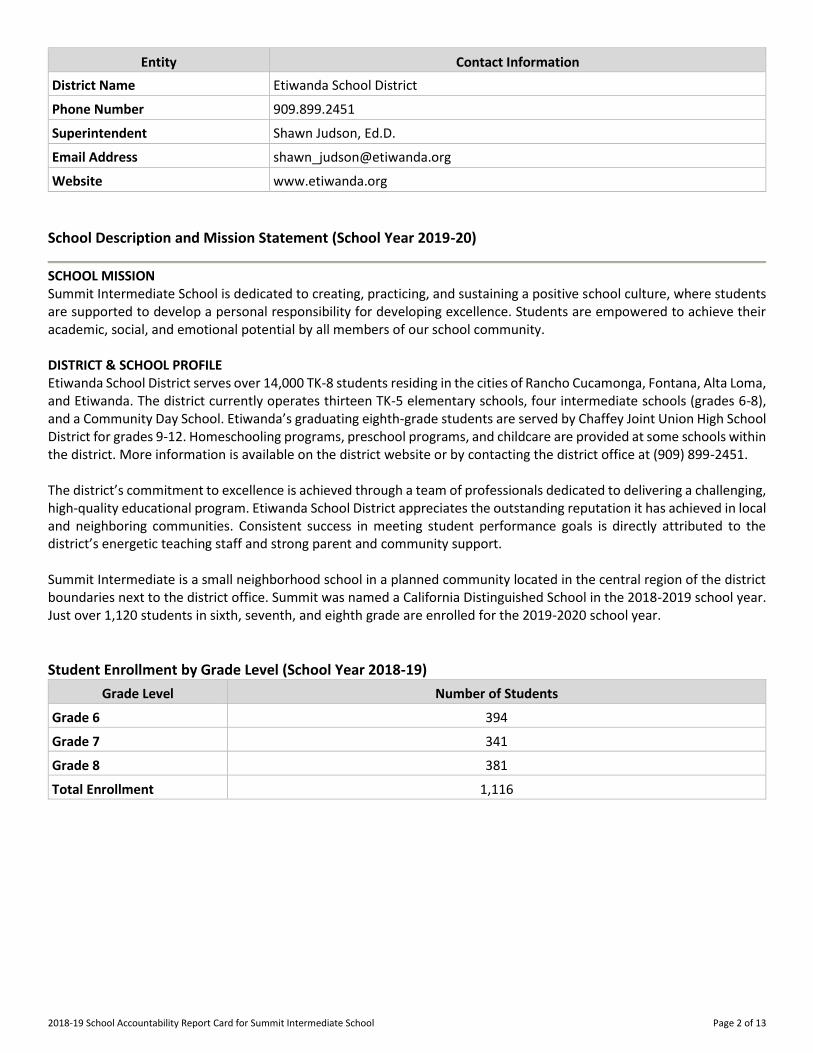
District Name Etiwanda School District
Phone Number 909.899.2451
Superintendent Shawn Judson, Ed.D.
Email Address [email protected]
Website www.etiwanda.org
School Description and Mission Statement (School Year 2019-20)
SCHOOL MISSION Summit Intermediate School is dedicated to creating, practicing, and sustaining a positive school culture, where students are supported to develop a personal responsibility for developing excellence. Students are empowered to achieve their academic, social, and emotional potential by all members of our school community. DISTRICT & SCHOOL PROFILE Etiwanda School District serves over 14,000 TK-8 students residing in the cities of Rancho Cucamonga, Fontana, Alta Loma, and Etiwanda. The district currently operates thirteen TK-5 elementary schools, four intermediate schools (grades 6-8), and a Community Day School. Etiwanda’s graduating eighth-grade students are served by Chaffey Joint Union High School District for grades 9-12. Homeschooling programs, preschool programs, and childcare are provided at some schools within the district. More information is available on the district website or by contacting the district office at (909) 899-2451. The district’s commitment to excellence is achieved through a team of professionals dedicated to delivering a challenging, high-quality educational program. Etiwanda School District appreciates the outstanding reputation it has achieved in local and neighboring communities. Consistent success in meeting student performance goals is directly attributed to the district’s energetic teaching staff and strong parent and community support. Summit Intermediate is a small neighborhood school in a planned community located in the central region of the district boundaries next to the district office. Summit was named a California Distinguished School in the 2018-2019 school year. Just over 1,120 students in sixth, seventh, and eighth grade are enrolled for the 2019-2020 school year.
Student Enrollment by Grade Level (School Year 2018-19)
Grade Level Number of Students
Grade 6 394
Grade 7 341
Grade 8 381
Total Enrollment 1,116

2018-19 School Accountability Report Card for Summit Intermediate School Page 3 of 13
Student Enrollment by Group (School Year 2018-19)
Student Group Percent of Total Enrollment
Black or African American 11.1
American Indian or Alaska Native 0.4
Asian 7.5
Filipino 4.5
Hispanic or Latino 45.1
Native Hawaiian or Pacific Islander 0.2
White 26.4
Two or More Races 4.4
Socioeconomically Disadvantaged 35.8
English Learners 2.9
Students with Disabilities 15.1
Foster Youth 0.3
Homeless 6.5
A. Conditions of Learning
State Priority: Basic The SARC provides the following information relevant to the State priority: Basic (Priority 1): • Degree to which teachers are appropriately assigned and fully credentialed in the subject area and for the pupils they
are teaching; • Pupils have access to standards-aligned instructional materials; and • School facilities are maintained in good repair
Teacher Credentials
Teachers School
2017-18 School
2018-19 School
2019-20 District 2019-20
With Full Credential 52 52 250
Without Full Credential 1 2 12
Teaching Outside Subject Area of Competence (with full credential) 0 0 0
Teacher Misassignments and Vacant Teacher Positions
Indicator 2017-18 2018-19 2019-20
Misassignments of Teachers of English Learners 0 0 0
Total Teacher Misassignments* 0 0 0
Vacant Teacher Positions 0 0 Note: “Misassignments” refers to the number of positions filled by teachers who lack legal authorization to teach that grade level, subject area, student group, etc. *Total Teacher Misassignments includes the number of Misassignments of Teachers of English Learners.
2018-19 School Accountability Report Card for Summit Intermediate School Page 4 of 13
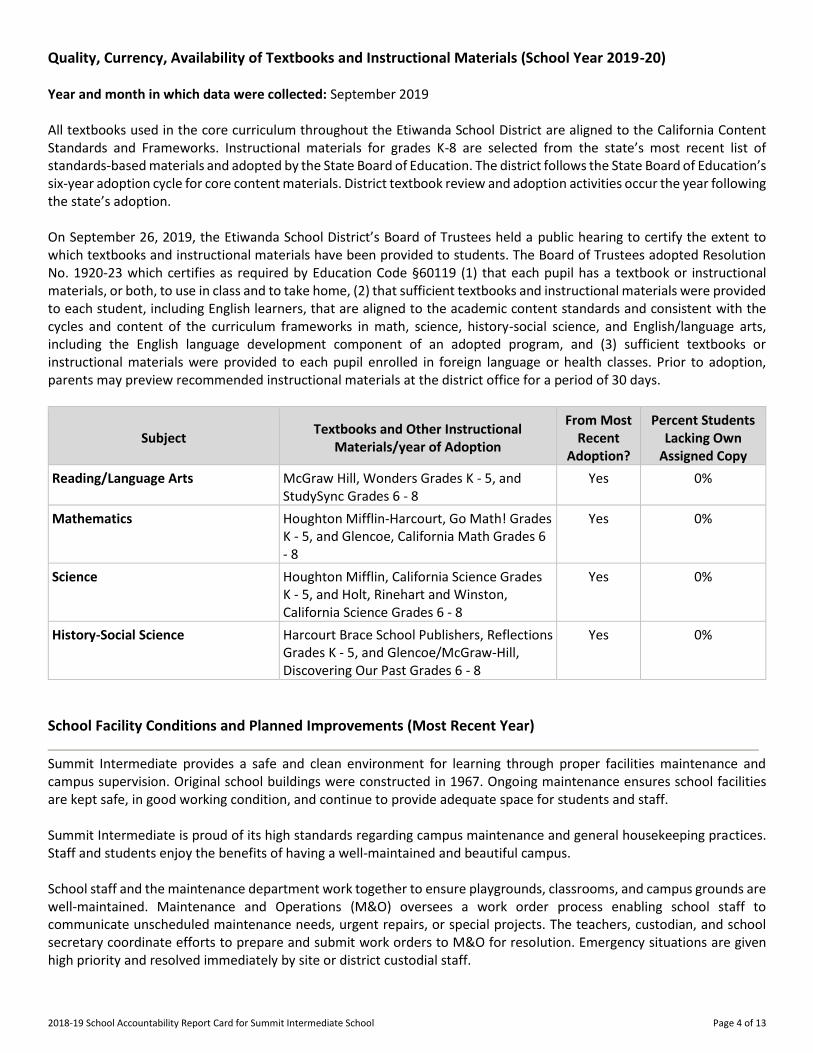
Quality, Currency, Availability of Textbooks and Instructional Materials (School Year 2019-20) Year and month in which data were collected: September 2019 All textbooks used in the core curriculum throughout the Etiwanda School District are aligned to the California Content Standards and Frameworks. Instructional materials for grades K-8 are selected from the state’s most recent list of standards-based materials and adopted by the State Board of Education. The district follows the State Board of Education’s six-year adoption cycle for core content materials. District textbook review and adoption activities occur the year following the state’s adoption. On September 26, 2019, the Etiwanda School District’s Board of Trustees held a public hearing to certify the extent to which textbooks and instructional materials have been provided to students. The Board of Trustees adopted Resolution No. 1920-23 which certifies as required by Education Code §60119 (1) that each pupil has a textbook or instructional materials, or both, to use in class and to take home, (2) that sufficient textbooks and instructional materials were provided to each student, including English learners, that are aligned to the academic content standards and consistent with the cycles and content of the curriculum frameworks in math, science, history-social science, and English/language arts, including the English language development component of an adopted program, and (3) sufficient textbooks or instructional materials were provided to each pupil enrolled in foreign language or health classes. Prior to adoption, parents may preview recommended instructional materials at the district office for a period of 30 days.
Subject Textbooks and Other Instructional
Materials/year of Adoption
From Most Recent
Adoption?
Percent Students Lacking Own
Assigned Copy
Reading/Language Arts McGraw Hill, Wonders Grades K - 5, and StudySync Grades 6 - 8
Yes 0%
Mathematics Houghton Mifflin-Harcourt, Go Math! Grades K - 5, and Glencoe, California Math Grades 6 - 8
Yes 0%
Science Houghton Mifflin, California Science Grades K - 5, and Holt, Rinehart and Winston, California Science Grades 6 - 8
Yes 0%
History-Social Science Harcourt Brace School Publishers, Reflections Grades K - 5, and Glencoe/McGraw-Hill, Discovering Our Past Grades 6 - 8
Yes 0%
School Facility Conditions and Planned Improvements (Most Recent Year)
Summit Intermediate provides a safe and clean environment for learning through proper facilities maintenance and campus supervision. Original school buildings were constructed in 1967. Ongoing maintenance ensures school facilities are kept safe, in good working condition, and continue to provide adequate space for students and staff. Summit Intermediate is proud of its high standards regarding campus maintenance and general housekeeping practices. Staff and students enjoy the benefits of having a well-maintained and beautiful campus. School staff and the maintenance department work together to ensure playgrounds, classrooms, and campus grounds are well-maintained. Maintenance and Operations (M&O) oversees a work order process enabling school staff to communicate unscheduled maintenance needs, urgent repairs, or special projects. The teachers, custodian, and school secretary coordinate efforts to prepare and submit work orders to M&O for resolution. Emergency situations are given high priority and resolved immediately by site or district custodial staff.

2018-19 School Accountability Report Card for Summit Intermediate School Page 5 of 13
The principal and day custodian meet informally on a daily basis to discuss campus maintenance and safety concerns. The director of maintenance and operations (M&O) meets with the principal once a month to discuss maintenance-related issues associated with campus upkeep, safety, classroom space, equipment, upcoming events, work orders (submitted and outstanding), and special requests. The director of M&O then meets with the custodian to conduct a comprehensive inspection of the school site, and a summary of the inspection findings is forwarded to the principal. Schools are required by state law to conduct a formal inspection annually of designated areas and systems and then prepare a report of the current condition of facilities. The School Site Inspection table illustrated in this report identifies the state-required inspection areas and discloses the operational status in each of those areas. Summit Intermediate’s custodial staff are qualified and equipped to handle routine cleaning needs, general maintenance, and minor repairs. M&O provides formal training twice a year on the proper use of equipment, cleaning procedures, and chemical usage. One full-time day custodian is responsible for keeping the campus clean and fully operational. The custodian’s daily routine includes cleaning the staff lounge, stocking student restrooms, and cleaning the cafeteria after meals are served. Every morning before school begins, the day custodian inspects school facilities for safety hazards and maintenance issues that require attention before staff and students arrive on campus. Any graffiti or signs of vandalism are removed immediately. Restrooms are checked every hour by campus aides, proctors, the custodian, and administrators as a shared, proactive measure to keep facilities stocked, safe, and sanitary. A professional janitorial service is responsible for thoroughly cleaning classrooms and restrooms during the evenings. The district office dispatches a team of groundskeepers each week to maintain Summit Intermediate’s landscaping and irrigation systems. Etiwanda School District participates in the State School Deferred Maintenance Program which provides dollar-for-dollar matching funds to assist school districts with major repairs or replacement of existing school building components. These repairs typically include roofing, plumbing, heating, air conditioning, electrical systems, interior/exterior painting, and floor systems.
School Facility Good Repair Status (Most Recent Year) Using the most recently collected FIT data (or equivalent), provide the following:
• Determination of repair status for systems listed • Description of any needed maintenance to ensure good repair • The year and month in which the data were collected • The overall rating
Year and month of the most recent FIT report: February 2019
System Inspected Rating Repair Needed and Action Taken or Planned
Systems: Gas Leaks, Mechanical/HVAC, Sewer
XGood
Interior: Interior Surfaces XGood
Put new VCT tiles and baseboards-M15, Mirror bracket was removed and caulked the oles in the tile-M wing restrooms
Cleanliness: Overall Cleanliness, Pest/ Vermin Infestation
XGood
Electrical: Electrical XGood
Restrooms/Fountains: Restrooms, Sinks/ Fountains
XGood
Safety: Fire Safety, Hazardous Materials
XGood
2018-19 School Accountability Report Card for Summit Intermediate School Page 6 of 13
System Inspected Rating Repair Needed and Action Taken or Planned
Structural: Structural Damage, Roofs
XGood
External: Playground/School Grounds, Windows/ Doors/Gates/Fences
XGood
Vendor repaired concrete, removed exposed rebar-Lunch area
Overall Rating
B. Pupil Outcomes
State Priority: Pupil Achievement The SARC provides the following information relevant to the State priority: Pupil Achievement (Priority 4): • Statewide assessments (i.e., California Assessment of Student Performance and Progress [CAASPP] System, which
includes the Smarter Balanced Summative Assessments for students in the general education population and the California Alternate Assessments [CAAs] for English language arts/literacy [ELA] and mathematics given in grades three through eight and grade eleven. Only eligible students may participate in the administration of the CAAs. CAAs items are aligned with alternate achievement standards, which are linked with the Common Core State Standards [CCSS] for students with the most significant cognitive disabilities); and
• The percentage of students who have successfully completed courses that satisfy the requirements for entrance to the University of California and the California State University, or career technical education sequences or programs of study.
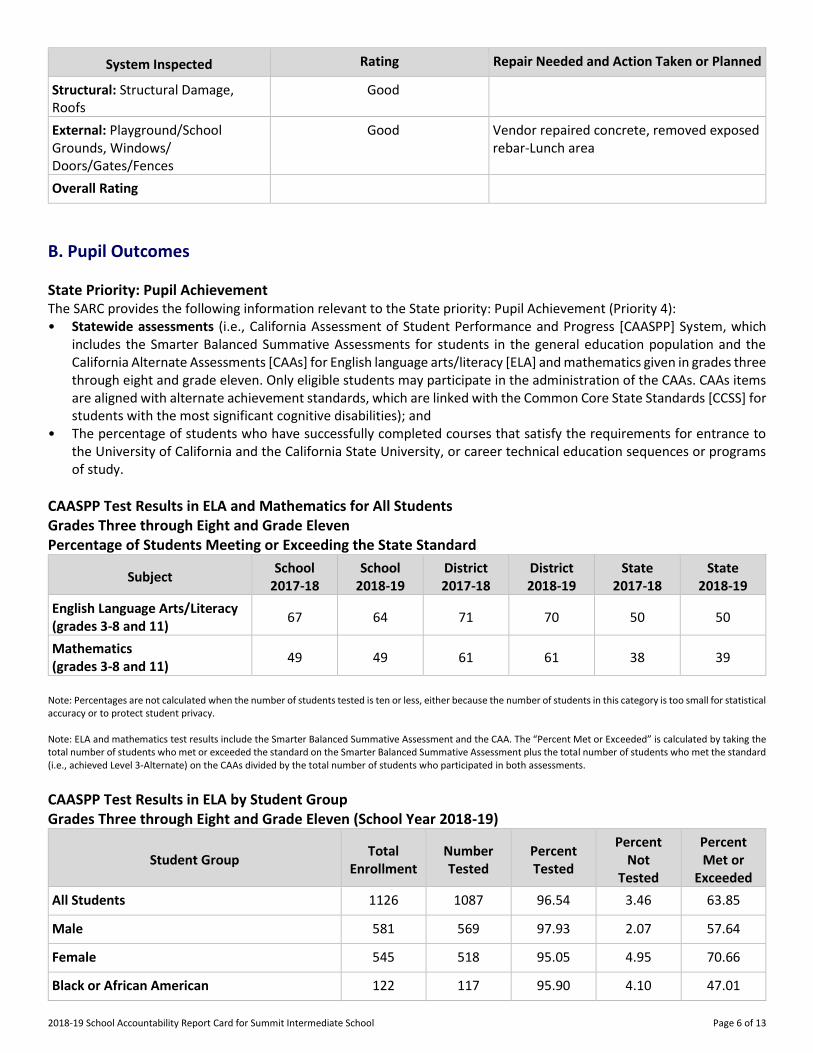
CAASPP Test Results in ELA and Mathematics for All Students Grades Three through Eight and Grade Eleven Percentage of Students Meeting or Exceeding the State Standard
Subject School
2017-18 School
2018-19 District 2017-18
District 2018-19
State 2017-18
State 2018-19
English Language Arts/Literacy (grades 3-8 and 11)
67 64 71 70 50 50
Mathematics (grades 3-8 and 11)
49 49 61 61 38 39
Note: Percentages are not calculated when the number of students tested is ten or less, either because the number of students in this category is too small for statistical accuracy or to protect student privacy. Note: ELA and mathematics test results include the Smarter Balanced Summative Assessment and the CAA. The “Percent Met or Exceeded” is calculated by taking the total number of students who met or exceeded the standard on the Smarter Balanced Summative Assessment plus the total number of students who met the standard (i.e., achieved Level 3-Alternate) on the CAAs divided by the total number of students who participated in both assessments.
CAASPP Test Results in ELA by Student Group Grades Three through Eight and Grade Eleven (School Year 2018-19)
Student Group Total
Enrollment Number Tested
Percent Tested
Percent Not
Tested
Percent Met or
Exceeded
All Students 1126 1087 96.54 3.46 63.85
Male 581 569 97.93 2.07 57.64
Female 545 518 95.05 4.95 70.66
Black or African American 122 117 95.90 4.10 47.01

2018-19 School Accountability Report Card for Summit Intermediate School Page 7 of 13
Student Group Total
Enrollment Number Tested
Percent Tested
Percent Not
Tested
Percent Met or
Exceeded
American Indian or Alaska Native -- -- -- -- --
Asian 86 84 97.67 2.33 77.38
Filipino 45 45 100.00 0.00 82.22
Hispanic or Latino 519 510 98.27 1.73 56.67
Native Hawaiian or Pacific Islander -- -- -- -- --
White 288 268 93.06 6.94 76.12
Two or More Races 55 52 94.55 5.45 71.15
Socioeconomically Disadvantaged 428 410 95.79 4.21 51.22
English Learners 107 102 95.33 4.67 47.06
Students with Disabilities 170 164 96.47 3.53 20.12
Students Receiving Migrant Education Services
Foster Youth -- -- -- -- --
Homeless 92 90 97.83 2.17 46.67
Note: ELA test results include the Smarter Balanced Summative Assessment and the CAA. The “Percent Met or Exceeded” is calculated by taking the total number of students who met or exceeded the standard on the Smarter Balanced Summative Assessment plus the total number of students who met the standard (i.e., achieved Level 3-Alternate) on the CAAs divided by the total number of students who participated in both assessments. Note: Double dashes (--) appear in the table when the number of students is ten or less, either because the number of students in this category is too small for statistical accuracy or to protect student privacy. Note: The number of students tested includes all students who participated in the test whether they received a score or not; however, the number of students tested is not the number that was used to calculate the achievement level percentages. The achievement level percentages are calculated using only students who received scores.
CAASPP Test Results in Mathematics by Student Group Grades Three through Eight and Grade Eleven (School Year 2018-19)
Student Group Total
Enrollment Number Tested
Percent Tested
Percent Not
Tested
Percent Met or
Exceeded
All Students 1126 1088 96.63 3.37 49.36
Male 581 570 98.11 1.89 47.54
Female 545 518 95.05 4.95 51.35
Black or African American 122 117 95.90 4.10 29.91
American Indian or Alaska Native -- -- -- -- --
Asian 86 86 100.00 0.00 70.93
Filipino 45 45 100.00 0.00 73.33
Hispanic or Latino 519 509 98.07 1.93 40.67
Native Hawaiian or Pacific Islander -- -- -- -- --

2018-19 School Accountability Report Card for Summit Intermediate School Page 8 of 13
Student Group Total
Enrollment Number Tested
Percent Tested
Percent Not
Tested
Percent Met or
Exceeded
White 288 268 93.06 6.94 61.94
Two or More Races 55 52 94.55 5.45 57.69
Socioeconomically Disadvantaged 428 411 96.03 3.97 35.77
English Learners 107 105 98.13 1.87 35.24
Students with Disabilities 170 164 96.47 3.53 14.02
Students Receiving Migrant Education Services
Foster Youth -- -- -- -- --
Homeless 92 89 96.74 3.26 34.83
Note: Mathematics test results include the Smarter Balanced Summative Assessment and the CAA. The “Percent Met or Exceeded” is calculated by taking the total number of students who met or exceeded the standard on the Smarter Balanced Summative Assessment plus the total number of students who met the standard (i.e., achieved Level 3-Alternate) on the CAAs divided by the total number of students who participated in both assessments.
Note: Double dashes (--) appear in the table when the number of students is ten or less, either because the number of students in this category is too small for statistical accuracy or to protect student privacy.
Note: The number of students tested includes all students who participated in the test whether they received a score or not; however, the number of students tested is not the number that was used to calculate the achievement level percentages. The achievement level percentages are calculated using only students who received scores.
CAASPP Test Results in Science for All Students Grades Five, Eight, and Ten Percentage of Students Meeting or Exceeding the State Standard
Subject School
2017-18 School
2018-19 District 2017-18
District 2018-19
State 2017-18
State 2018-19
Science (grades 5, 8 and high school) N/A N/A N/A N/A N/A N/A
Note: Cells with N/A values do not require data. Note: This is a placeholder for the California Science Test (CAST) which was administered operationally during the 2018-19 school year. However, these data are not available for inclusion in the 2018-19 SARC posting due February 1, 2020. These data will be included in the 2019-20 SARC posting due February 1, 2021.
State Priority: Other Pupil Outcomes The SARC provides the following information relevant to the State priority: Other Pupil Outcomes (Priority 8): • Pupil outcomes in the subject areas of physical education.
California Physical Fitness Test Results (School Year 2018-19)
Grade Level Percentage of Students
Meeting Four of Six Fitness Standards
Percentage of Students Meeting Five of Six Fitness Standards
Percentage of Students Meeting Six of Six Fitness Standards
5 0 0 0
7 27.6 37.6 2.6
9 0 0 0 Note: Percentages are not calculated and double dashes (--) appear in the table when the number of students tested is ten or less, either because the number of students in this category is too small for statistical accuracy or to protect student privacy.
2018-19 School Accountability Report Card for Summit Intermediate School Page 9 of 13
C. Engagement
State Priority: Parental Involvement The SARC provides the following information relevant to the State priority: Parental Involvement (Priority 3): • Efforts the school district makes to seek parent input in making decisions for the school district and each school site.
Opportunities for Parental Involvement (School Year 2019-20)
Parents are encouraged to be involved in their child’s learning process by attending school events, serving on a school committee, and volunteering at the school. The staff welcomes parent assistance in the school office, with school productions, organizing activities for the Renaissance program, and other student recognition programs. Back to School Night, Open House, LCAP Community Forums, Parent Education/Engagement Events, Family Nights, Family Fitness Events, Watch D.O.G.S., Battle of the Books, student performances, parent conferences, and sixth-grade camp meetings provide opportunities for parents to interact with school staff while supporting their child’s efforts. The School Site Council (SSC), Parent Teacher Student Association (PTSA), and African American Parent and Educator Advisory Committee (AAPEAC) enable parents to provide oversight and input on the school budget, activities, and educational programs. Parents who would like to become more involved or volunteer their time may contact the school office at (909) 899-1704. School-to-home communication takes place in a variety of formats. The school website is updated regularly and features general information about the school, staff, schedules, activities, and other resources for parents. School Messenger is used to notify families about school-wide and district events. Social media accounts such as Facebook and Instagram are utilized to keep families apprised of current events at Summit Intermediate. Bulletins, flyers, and letters are also distributed for special announcements and reminders. In addition, Summit's teachers prepare and maintain individual class websites with assignments and other supports. Parents and students may access the AERIES Parent Portal to view current student progress.
State Priority: School Climate The SARC provides the following information relevant to the State priority: School Climate (Priority 6): • Pupil suspension rates; • Pupil expulsion rates; and • Other local measures on the sense of safety.
Suspensions and Expulsions
Rate School
2016-17 School
2017-18 School
2018-19 District 2016-17
District 2017-18
District 2018-19
State 2016-17
State 2017-18
State 2018-19
Suspensions 0.6 0.8 1.3 0.7 0.5 0.8 3.6 3.5 3.5
Expulsions 0.2 0.0 0.1 0.0 0.0 0.1 0.1 0.1 0.1
School Safety Plan (School Year 2019-20)
The Comprehensive School Site Safety Plan was originally developed for Summit Intermediate in collaboration with local agencies and district administration to fulfill Senate Bill 187 requirements. Components of this plan include child abuse reporting procedures, teacher notification of dangerous pupil procedures, disaster response procedures, procedures for safe arrival and departure from school, sexual harassment policy, and dress code policy. The School Safety Plan is updated and approved annually at our School Site Council Meetings.

2018-19 School Accountability Report Card for Summit Intermediate School Page 10 of 13
D. Other SARC Information
The information in this section is required to be in the SARC but is not included in the state priorities for LCFF.
Average Class Size and Class Size Distribution (Elementary)
Grade Level
2016-17 Average
Class Size
2016-17 # of
Classes* Size 1-20
2016-17 # of
Classes* Size
21-32
2016-17 # of
Classes* Size 33+
2017-18 Average
Class Size
2017-18 # of
Classes* Size 1-20
2017-18 # of
Classes* Size
21-32
2017-18 # of
Classes* Size 33+
2018-19 Average
Class Size
2018-19 # of
Classes* Size 1-20
2018-19 # of
Classes* Size
21-32
2018-19 # of
Classes* Size 33+
K
19 2 5
5
32 5
6
32 4 44 13 29 9 36 18 33 4 16 42
Other**
*Number of classes indicates how many classes fall into each size category (a range of total students per class). ** “Other” category is for multi-grade level classes.
Ratio of Academic Counselors to Pupils (School Year 2018-19)
Title Ratio
Academic Counselors* .0 *One Full Time Equivalent (FTE) equals one staff member working full time; one FTE could also represent two staff members who each work 50 percent of full time.
Student Support Services Staff (School Year 2018-19)
Title Number of FTE*
Assigned to School
Counselor (Academic, Social/Behavioral or Career Development)
Library Media Teacher (Librarian)
Library Media Services Staff (Paraprofessional)
Psychologist 1.0
Social Worker
Speech/Language/Hearing Specialist .8
Resource Specialist (non-teaching) 2.2 *One Full Time Equivalent (FTE) equals one staff member working full time; one FTE could also represent two staff members who each work 50 percent of full time.
Expenditures Per Pupil and School Site Teacher Salaries (Fiscal Year 2017-18)
Level Total
Expenditures Per Pupil
Expenditures Per Pupil
(Restricted)
Expenditures Per Pupil
(Unrestricted)
Average Teacher Salary
School Site $5,469.79 $154.23 $5,315.57 $80,330.26
District N/A N/A $5,299.63 $81,495.00
Percent Difference - School Site and District N/A N/A 0.3 1.1
State N/A N/A $7,506.64 $82,663.00
Percent Difference - School Site and State N/A N/A -29.1 -0.7

2018-19 School Accountability Report Card for Summit Intermediate School Page 11 of 13
Note: Cells with N/A values do not require data. The California Department of Education issued guidance to LEAs on August 1, 2018, regarding how to calculate school-level per-pupil expenditures that will be reported on 2018-19 report cards.
Types of Services Funded (Fiscal Year 2018-19)
In addition to general fund state funding, Etiwanda School District receives state and federal categorical funding for special programs. For the 2018-2019 school year, the district received approximately $726.00 per student in federal, state, and local aid for the following categorical, special education, and support programs:
• Special Education • Title I, Title II, Title III, and Title IV
Teacher and Administrative Salaries (Fiscal Year 2017-18)
Category District Amount
State Average For Districts
In Same Category
Beginning Teacher Salary $50,447 $45,741
Mid-Range Teacher Salary $78,510 $81,840
Highest Teacher Salary $107,668 $102,065
Average Principal Salary (Elementary) $129,065 $129,221
Average Principal Salary (Middle) $118,953 $132,874
Average Principal Salary (High) $0 $128,660
Superintendent Salary $194,105 $224,581
Percent of Budget for Teacher Salaries 40% 36%
Percent of Budget for Administrative Salaries 5% 5%
For detailed information on salaries, see the CDE Certificated Salaries & Benefits web page at https://www.cde.ca.gov/ds/fd/cs/.
Professional Development (Most Recent Three Years)
Measure 2017-18 2018-19 2019-20
Number of school days dedicated to Staff Development and Continuous Improvement 153 110 117
All training and curriculum development at the Etiwanda School District are aligned to student assessment results, federal and state accountability requirements, our LCAP, and state content standards. During the school year, our staff participate in two to three district-sponsored professional development and planning days. Follow-up support within the classroom or as a campus staff occurs as requested by teachers, administrators, or other identified needs. Training sessions offered throughout the school year include:

2018-19 School Accountability Report Card for Summit Intermediate School Page 12 of 13
Content Areas/Standards: • i-Ready Diagnostic Assessments (administration, accommodations, reports usage, data analysis) • English Language Arts and English Language Development (ELA/ELD) program training for whole/small group
ELA instruction and integrated/designated ELD instruction • Writing to Communicate • Mathematical Concepts and Problem Solving • Project Read • Step Up to Writing • Next Generation Science Standards and Framework
Engagement: • Kagan Cooperative Learning • Classroom Management and Effective Environments (New Teachers and Induction)
Universal Access: • Planning for a Range of Learners • Positive Behavior Intervention and Support (PBIS) • Behavior Management • Crisis Prevention Intervention and Intensive Behavior Techniques (Special Education) • Special Education Accountability • Effective IEP Writing • Special Populations (Induction) • English Language Acquisition
Cultural Proficiency: • Towards Equity (Induction) • Culturally Responsive Teaching and Learning
CAASSP System and Tools: • CAA Instruction and Assessment • ELA and Math SBAC/Scope & Sequence • Smarter Balanced Administration, Item Specs, Accommodations and Supports
Technology: • Chromebook and iPad Use • Online Program Resources • Google Applications for Educators • Learning.com, Illuminate, other district technology platforms
Site Administrators: • LCFF/LCAP, MTSS/RtI, Cultural Proficiency
Other:
• Substitute Teacher Training • Classified Staff Training (Instructional Aides
All teachers are supported through multiple district-sponsored professional development opportunities such as district professional development sessions, grade level collaboration, and site staff meetings. In addition to the above, teachers may seek in-class support from professional development providers. All staff members are encouraged to attend additional, non-district sponsored workshops and conferences. New teachers, experienced teachers, TOSAs, teacher leaders, administrators, and support staff are encouraged to participate in workshops sponsored by the San Bernardino County Superintendent of Schools.

2018-19 School Accountability Report Card for Summit Intermediate School Page 13 of 13
New teachers are enrolled in the ESD Induction Program, a state-sponsored program designed for first- and second-year preliminary credentialed teachers. Comprehensive skills enhancement training is provided over two years. Candidates attend specific sessions related to the implementation of district technologies, assessments, and scope and sequences. In addition, new teachers attend (prior to the start of the school year) sessions on equity, special populations, classroom management, and pedagogical approaches and practices. Targeted professional development is also provided based on a candidate's individual learning plan. Monthly Induction support meetings focus on implementation and growth within the California Standards for the Teaching Profession. Teachers who experience difficulty or are in need of improvement may voluntarily select or be required to participate in the Peer Assistance and Review process. A consulting support teacher is assigned to the teacher. The support teacher collaborates regularly with the teacher, observes the classroom, and provides feedback for staff development. Etiwanda’s Professional Development Providers/Teachers on Special Assignment (TOSA) further develop their capacity to instruct and support teachers through professional reading, outside vendor conference attendance, meta-coaching opportunities, and professional collaborative workshops on supporting teachers, pedagogy, and student achievement. Paraprofessionals or classified employees are prepared to work in their role through yearly staff notification sessions (online and in-person) as well as trained to work with colleagues and students through staff development sessions and meetings. They may also receive additional job-related training form vendors, department supervisors, and district representatives. In addition, there are selected workshops offered through West End SELPA for both certificated and classified personnel. Noninstructional support staff is prepared to work in their role through yearly staff notification sessions (online and in-person) and ongoing staff development during the day meetings/sessions around topics related to state and local policies, procedures, and practices.