Embed Size (px)
Citation preview

State of Customer Service Experience Report Copyright © 2020 The Northridge Group |
The State of Customer Service Experience
2020 Business and Customer Service Trends
Copyright © 2020 The Northridge Group 1
State of Customer Service Experience Report Copyright © 2020 The Northridge Group |
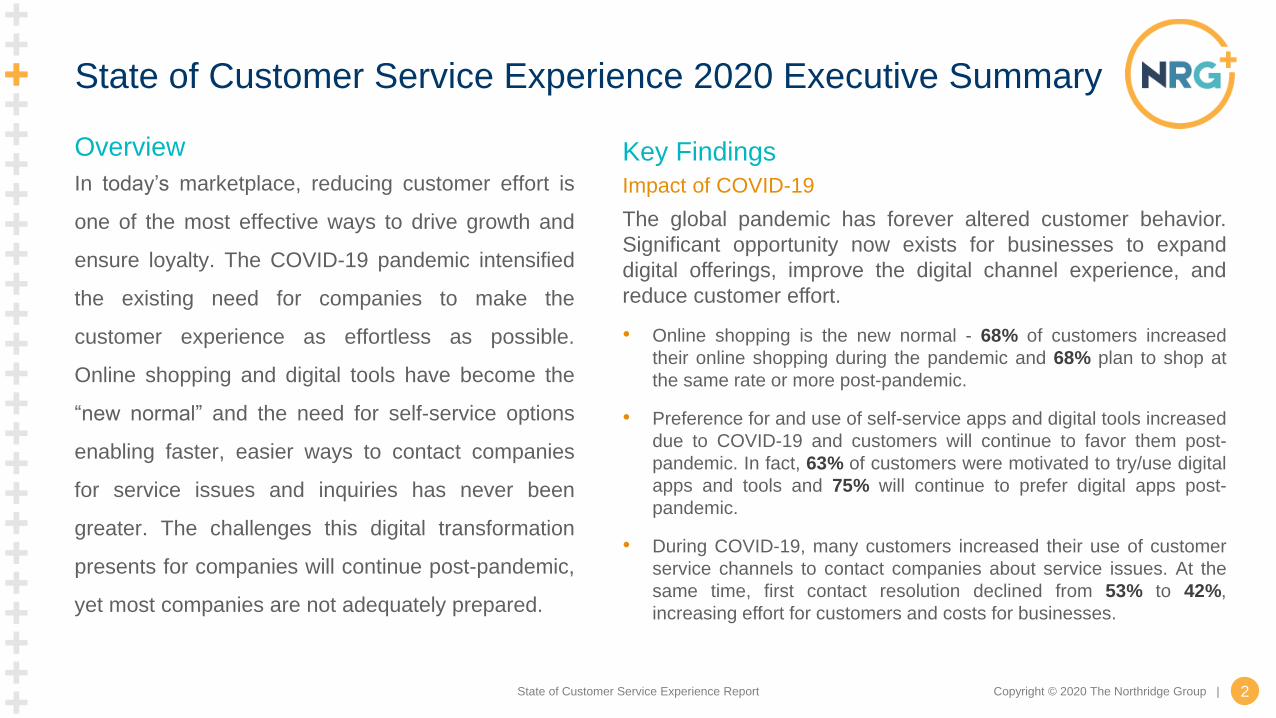
Overview
In today’s marketplace, reducing customer effort is
one of the most effective ways to drive growth and
ensure loyalty. The COVID-19 pandemic intensified
the existing need for companies to make the
customer experience as effortless as possible.
Online shopping and digital tools have become the
“new normal” and the need for self-service options
enabling faster, easier ways to contact companies
for service issues and inquiries has never been
greater. The challenges this digital transformation
presents for companies will continue post-pandemic,
yet most companies are not adequately prepared.
Key Findings
Impact of COVID-19
The global pandemic has forever altered customer behavior.
Significant opportunity now exists for businesses to expand
digital offerings, improve the digital channel experience, and
reduce customer effort.
• Online shopping is the new normal - 68% of customers increased
their online shopping during the pandemic and 68% plan to shop at
the same rate or more post-pandemic.
• Preference for and use of self-service apps and digital tools increased
due to COVID-19 and customers will continue to favor them post-
pandemic. In fact, 63% of customers were motivated to try/use digital
apps and tools and 75% will continue to prefer digital apps post-
pandemic.
• During COVID-19, many customers increased their use of customer
service channels to contact companies about service issues. At the
same time, first contact resolution declined from 53% to 42%,
increasing effort for customers and costs for businesses.
State of Customer Service Experience 2020 Executive Summary
2

State of Customer Service Experience Report Copyright © 2020 The Northridge Group |
Customer Service Realities
• Phone remains customers’ preferred channel for service because it is the fastest and most effective for issue
resolution. However, customers frequently have negative experiences with this channel.
– 67% of customers have difficulty navigating the phone system or are unable to reach a live person
– 73% of customers experience a long wait time to reach an agent
– 60% of customers are asked to repeat information over and over again
• Customers’ preference for digital customer service channels has increased from 24% to 38% when compared to
2015. As businesses improve their digital channel experiences, customers’ preference for and use of these
channels will continue to increase.
• Speed matters for customer issue resolution with 55% of customers waiting an hour or less to switch to a
different channel if their issue is not resolved, driving up customer effort and cost. Business leaders think that
customers will wait at least a day before making a second contact.
Business Leader Perspective
• Low customer effort drives brand loyalty and reduces cost. However, the number of businesses measuring
customer effort is low and has increased only slightly from 25% to 29%.
• The top investment priorities for businesses are not aligned with customer priorities. Customers are most
interested in speed to issue resolution, accessibility of service and knowledgeable service teams. Businesses
are focused on a consistent omni-channel experience, personalized service and 24/7 customer service.
State of Customer Service Experience 2020 Executive Summary
3

State of Customer Service Experience Report Copyright © 2020 The Northridge Group |
Report Overview
The State of Customer Service Experience 2020
05
Customer Service Realities10
Business Leader CX Perspective18
Impact of the COVID-19 Pandemic on Customer Experience/Future Outlook
4

Impact of the COVID-19 Pandemic on
Customer Experience/Future Outlook
Section Outline
Impact of the COVID-19 pandemic on:
+ Online shopping
+ Post-pandemic shopping behavior
+ Trial and usage of digital and self-service tools
+ Channel preference
5State of Customer Service Experience Report Copyright © 2020 The Northridge Group | 5

State of Customer Service Experience Report Copyright © 2020 The Northridge Group |
Online Shopping
60%
8%
Customers who
increased their online
shopping during the
pandemic
During the COVID-19 Pandemic, 68% of Customers Increased
Online Shopping or Tried It for the First Time
Customers who shopped online for the
first time during the pandemic
32%Customers who didn’t
change or decreased
their online shopping
during the pandemic
6

State of Customer Service Experience Report Copyright © 2020 The Northridge Group |
68%plan to shop online at
the same rate or more
post-pandemic.
of Customers
Customers and Business Leaders Agree: Shopping Online is
the New Normal
68%believe customers plan
to shop online at the
same rate or more
post-pandemic.
of Business Leaders
State of Customer Service Experience Report 7

State of Customer Service Experience Report Copyright © 2020 The Northridge Group |
* Examples of “Digital Apps” are Grocery Delivery and Banking apps
The COVID-19 Pandemic Motivated Customers to Try and Use
Digital Apps*
81%of business leaders think
their customers will try
and use digital apps.
63%of customers
actually did.
Customers want to use digital apps and self-service channels. In fact, 77% of customers report
they’ll continue to favor self-service tools post-pandemic. It’s imperative they’re easy to use and
effectively provide complete issue and inquiry resolution.
8
NORTHRIDGE INSIGHT

State of Customer Service Experience Report Copyright © 2020 The Northridge Group |
37%increased use of
30%increased use of
Online Chat
34%increased use of
Social Media
Many Customers Increased Their Use of Primary Channels for
Service Inquiries During the COVID-19 Pandemic
34%increased use of
Phone Calls
NORTHRIDGE INSIGHT
With increased demand, having a robust forecasting and resource planning process to effectively manage and
staff the contact center is critical.
9

State of Customer Service Experience Report Copyright © 2020 The Northridge Group |
Customer Service Realities
+ Response speed by channel
+ Preferred channels for resolving customer issues
+ Speed of customer service issue resolution
+ Ease of contacting a business
+ First contact resolution rate
+ Impact of poor customer service experiences
+ Customer tolerance for slow service
Section Outline
10

State of Customer Service Experience Report Copyright © 2020 The Northridge Group |
Phone and Online Chat Provide the Fastest Response to Service
Inquiries
Which Channel Provides the Fastest Response to a
Customer's Inquiry?
Live agent assisted channels
are a critical engagement
channel for customers,
providing the fastest response
to service inquiries.
Phone Call
No LiveAssistance
Online & Video Chat
11
*No live assistance = social media, email, web
self-service, mobile app and text
50%27%
23%
73%Live Agent Assisted
Phone Call
Online & Video Chat
No LiveAssistance

State of Customer Service Experience Report Copyright © 2020 The Northridge Group |
50%
27%24%
42%
20%
38%
0%
10%
20%
30%
40%
50%
60%
Phone Call Email Digital Channels*
2015
2020
Preference for Digital Channels to Resolve Service Issues
is Increasing
What Channel Provides the Fastest Issue
Resolution?
* Digital Channels defined as social media, online chat, text, mobile app,
web self-service and live video chat
Phone remains customers’ preferred channel
because it’s the fastest and most effective
for issue resolution. However, when
compared to 2015, preference for phone and
email has declined while digital channels
have increased.
12
NORTHRIDGE INSIGHT
As businesses improve the digital
channel experience, customers’
preference for and use of those
channels will continue to grow.

State of Customer Service Experience Report Copyright © 2020 The Northridge Group |
14%
21%
22%
25%
28%
33%
42%
43%
17%
26%
28%
29%
29%
32%
30%
31%
69%
53%
50%
46%
43%
35%
28%
26%
Social Media
Text Message
Web Self-Service
Mobile App
Live Video Chat
Online Chat
Phone Call
Within Minutes Within an hour A day or more
Speed of Issue Resolution
Phone and Online Chat are the Fastest Channels to Resolve
Issues, Mostly Within an Hour
Customers have the highest expectations of
channels that provide human support. The
number of customers reporting phone and
online chat as the fastest channels for issue
resolution increased 5-7% points since 2019.
NORTHRIDGE INSIGHT
The speed of online chat offers the
opportunity to shift volume to channels
that provide businesses higher
productivity at a lower cost to serve.
13
*Percentage is based on the customers who use each given channel.

State of Customer Service Experience Report Copyright © 2020 The Northridge Group |
NORTHRIDGE INSIGHT
Many service issues could be mitigated if companies made it easier to self-serve. Companies should evaluate the
service experience through their customers’ lens, develop a targeted action plan and measure results.
47%
49%
55%
57%
58%
63%
64%
64%
Social Media
Live Video Chat
Text Message
Mobile App
Web Self-Service
Online Chat
Phone Call
Top Negative Customer Service Experiences
66%
Customers Find It Difficult to Contact a Brand and are Frustrated
by Negative Customer Service Experiences
Difficulty accessing
live/human customer support
60%Asked to repeat
information over
and over again
67%Difficulty navigating
the phone system
or unable to get a
live person
69%Trouble finding answers
on the company website
73%Long wait time to
reach an agent
14
Customer Ease of Contact by Channel
% of customers who find the channel easy/very to use

State of Customer Service Experience Report Copyright © 2020 The Northridge Group |
First Contact Resolution Is Declining, Driving Customer Effort Up
15
2019
53%
2020
42%% of customers reporting a first contact
resolution.
2019
With more than half of customers having to make multiple
contacts to resolve issues, customer effort increases as
satisfaction and loyalty decline.

State of Customer Service Experience Report Copyright © 2020 The Northridge Group |
Every Customer Service Experience Counts!
of customers will consider
switching to a competitor
after one negative customer
service experience.
73%
Even ONE poor service experience can adversely impact brand loyalty, creating a ripple effect
of challenges for a business.
NORTHRIDGE INSIGHT
16

State of Customer Service Experience Report Copyright © 2020 The Northridge Group |
An hour or less
A day
A week
or more
Would not use
another channel
How Long Customers Wait Before Trying Another
Channel
55%
6%
10%
29%
For Customer Service and Issue Resolution, Speed Matters
of customers will wait an hour or less
to switch to a different channel if their
issue is unresolved, driving up customer
effort and unnecessary costs to the
business.
Business leaders expect most
customers will wait at least a day
before making a second contact.
Big Disconnect: Reality vs. Expectation
55%
17

State of Customer Service Experience Report Copyright © 2020 The Northridge Group |
+ Ease of contacting a company
+ Ease of use by channel
+ Social media’s impact on brand reputation
+ Measuring customer effort
+ Investment Priorities
Business Leader CX Perspective
Section Outline
18

State of Customer Service Experience Report Copyright © 2020 The Northridge Group |
88%
75%
9%
14%
3%
11%
BusinessLeaders
Customers
Easy or Very Easy Neither Easy nor Difficult Difficult or Very Difficult
Businesses Believe They’re Making it Easier to Resolve Issues
Than Customer Feedback Suggests
Businesses must evaluate their Customer Experience through the customers’ lens to understand
their stated and unstated needs, identify and resolve their current pain points and focus on key
Moments of Truth.
NORTHRIDGE INSIGHT
How Easy is it for Customers to get Their Issues Handled Efficiently?
19

State of Customer Service Experience Report Copyright © 2020 The Northridge Group |
71%
72%
71%
78%
78%
90%
80%
88%
47%
49%
55%
57%
58%
63%
64%
64%
Social Media
Live Video Chat
Text Message
Mobile App
Web Self-Service
Online Chat
Phone Call
Customers Business Leaders
Business Leaders Rate Their Channel Ease of Use Much Higher
Than Their Customers Do
Percent Rating Channel “Very Easy” or “Easy” to use
20

State of Customer Service Experience Report Copyright © 2020 The Northridge Group |
Social media is the channel of choice for sharing negative customer experiences. Companies must
protect their reputations by monitoring their social media platforms regularly and responding quickly.
NORTHRIDGE INSIGHT
96%of business leaders believe
customers tell others about poor
customer service experiences.
A Brand’s Reputation is Only as Good as Recent Social Media
Posts Say It is
29% of business
leaders report that
social media is the
channel their
customers are most
likely to use to tell
others.
21

State of Customer Service Experience Report Copyright © 2020 The Northridge Group |
27% 27% 26% 25%34%
39%
56%
67%
23% 23% 25% 29% 30%36%
56% 59%
0%
10%
20%
30%
40%
50%
60%
70%
80%
2019 2020
Low Customer Effort Drives Brand Loyalty and Reduces Costs
How Do Businesses Measure Their Customer Service Effectiveness?
Share of
Wallet/Customer
Spend
Net Promoter
Score (NPS)
Customer
Churn Rate
Customer
Effort
Customer Lifetime
Value (CLV)
Likelihood to
Recommend
Customer
Loyalty
Customer
Satisfaction
The number of businesses measuring Customer Effort has increased slightly since 2019, but it’s still
only 29%. Evaluating Customer Effort is critical to drive brand loyalty, streamline processes and
reduce operational costs.
NORTHRIDGE INSIGHT
22

State of Customer Service Experience Report Copyright © 2020 The Northridge Group |
Businesses and customers are misaligned on investment priorities. Companies should focus on getting the
basics right before investing in more advanced levels of service.
Customers Prioritize Fast and Easy Service, While Businesses
are Focused on Differentiation
Top Investment Priorities
Consistent Omni-Channel
Experience
Personalized Service
24/7 Customer Service,
Reducing Wait Times
Speed to Issue Resolution
Accessibility of Service
Knowledgeable
Service Teams
Businesses Customers
1
2
3
23
NORTHRIDGE INSIGHT

State of Customer Service Experience Report Copyright © 2020 The Northridge Group |
N = 1,000 U.S. Consumers over the age of 18
Consumers were surveyed on on the impact of COVID-19
on customer experience; their channel preferences; their
expectations and experiences with response times, issue
resolution by channel and customer effort; and the
importance of customer service experience in purchasing
decisions.
N = 250 U.S. Business Leaders at companies with revenue of
250MM+
Business leaders were surveyed on their opinions regarding
the impact of COVID-19 on the customer experience at their
companies, customer channel preferences, channel effort and
speed, customer service metrics, and investments for
improving the customer experience.
Survey Methodology
Consumers Business Leaders
24
This is the sixth consecutive year the The Northridge Group has conducted the “State of Customer Service Experience 2020” study and the third
consecutive year we have surveyed business leaders. By surveying consumers and business leaders in parallel, it allowed us to identify critical gaps
between customers’ expectations and companies’ abilities to deliver a seamless and effortless omni-channel customer service experience.
To learn more about the customer experience trends we have tracked over the years, download our previous Customer Service Experience reports.

Start Improving Your Customer Service Experience Today
Contact Us For A Consultation with
One of Our Experts!
The Northridge Group is a leading management
consulting firm specializing in Business
Transformation Initiatives, Customer Experience
Solutions, Contact Center Effectiveness, and Quality
Monitoring Services.
We lead with advanced data analytics and utilize
business process redesign to deliver measurable
outcomes for our clients. Northridge provides
professional services for mid-market and large
enterprises as well as key government agencies.
www.northridgegroup.com
847.692.2288
25State of Customer Service Experience Report Copyright © 2020 The Northridge Group | 25