Embed Size (px)
Citation preview
2020 CA Compensation Policy & Practices Survey National Report
welcome to brighterSample
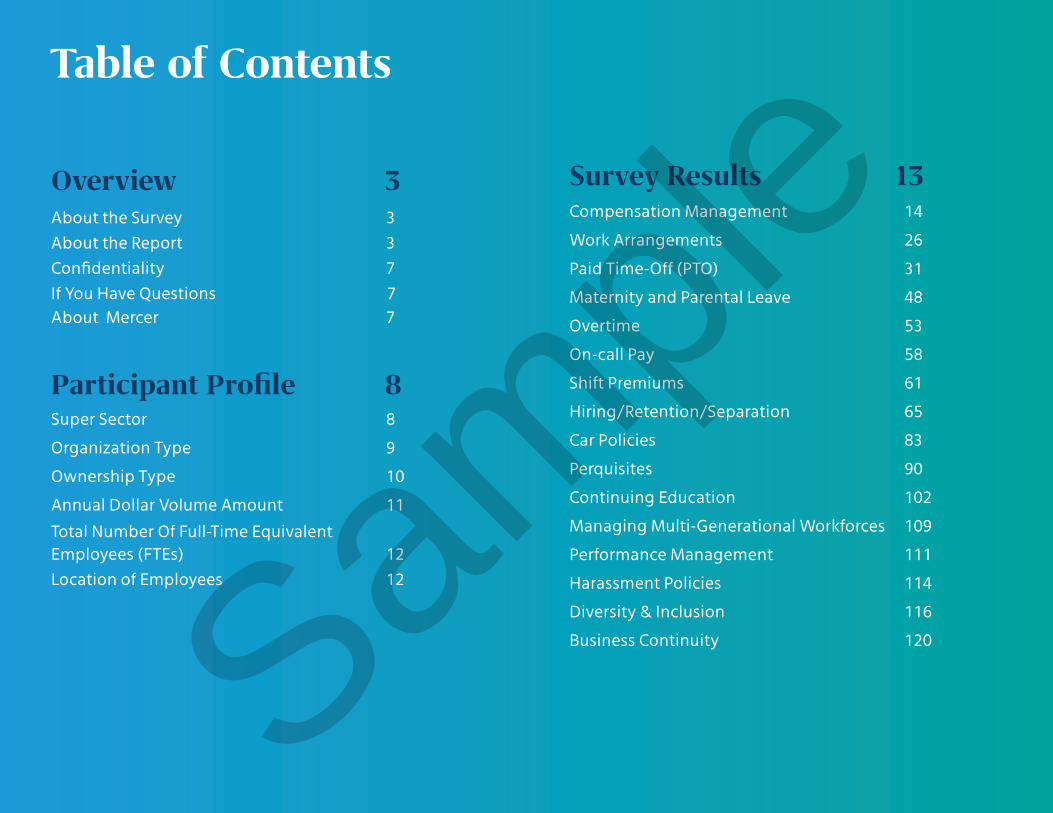
Table of Contents
Overview 3 About the Survey 3 About the Report 3 Confidentiality 7 If You Have Questions 7
About Mercer 7
Participant Profile 8 Super Sector 8
Organization Type 9
Ownership Type 10
Annual Dollar Volume Amount 11
Total Number Of Full-Time Equivalent Employees (FTEs) 12 Location of Employees 12
Survey Results 13 Compensation Management 14
Work Arrangements 26
Paid Time-Off (PTO) 31
Maternity and Parental Leave 48
Overtime 53
On-call Pay 58
Shift Premiums 61
Hiring/Retention/Separation 65
Car Policies 83
Perquisites 90
Continuing Education 102
Managing Multi-Generational Workforces 109
Performance Management 111
Harassment Policies 114
Diversity & Inclusion 116
Business Continuity 120Sample
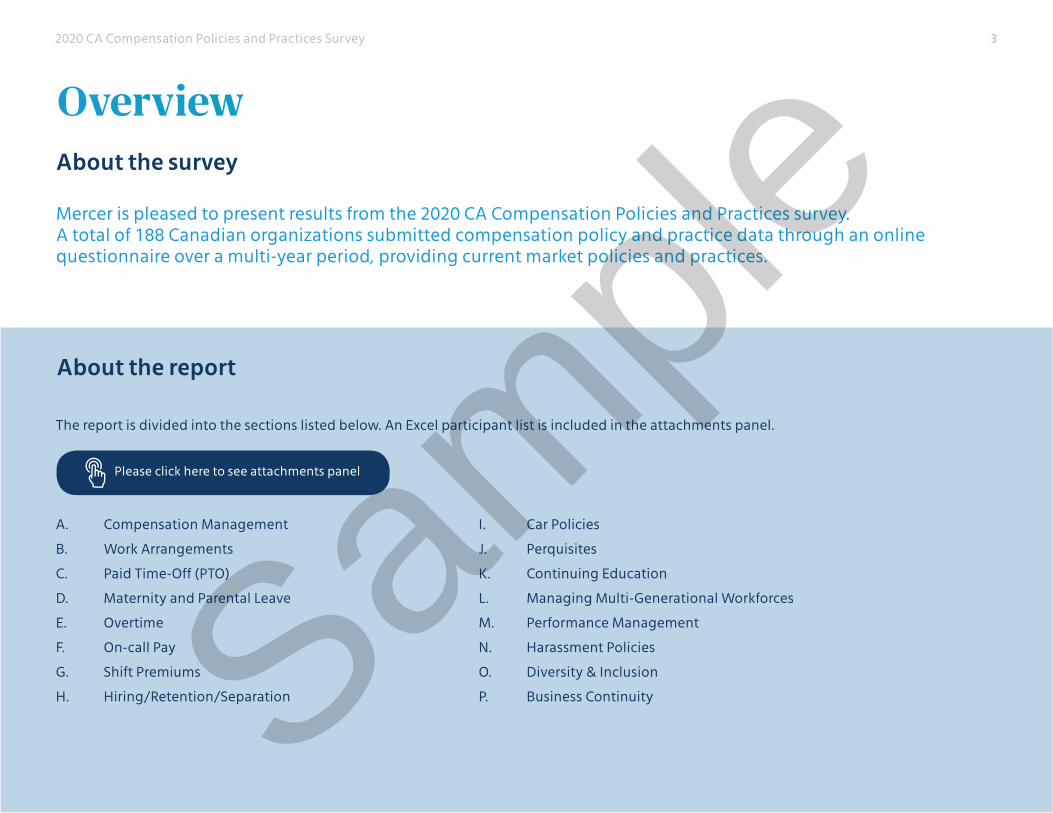
About the survey
Mercer is pleased to present results from the 2020 CA Compensation Policies and Practices survey. A total of 188 Canadian organizations submitted compensation policy and practice data through an online questionnaire over a multi-year period, providing current market policies and practices.
Overview
About the report
The report is divided into the sections listed below. An Excel participant list is included in the attachments panel.
A. Compensation Management
B. Work Arrangements
C. Paid Time-Off (PTO)
D. Maternity and Parental Leave
E. Overtime
F. On-call Pay
G. Shift Premiums
H. Hiring/Retention/Separation
I. Car Policies
J. Perquisites
K. Continuing Education
L. Managing Multi-Generational Workforces
M. Performance Management
N. Harassment Policies
O. Diversity & Inclusion
P. Business Continuity
Please click here to see attachments panel
2020 CA Compensation Policies and Practices Survey 3
Sample

Overview
This is the National report; all results within this report represent national data. Additional data cuts are available in the detailed report. The data cuts included are as follows:
By Net Sale Revenue amount (CAD)
Under 100 million
100 million < 500 million
500 million < 1 billion
1 billion < 5 billion
5 billion or More
By Ownership
Publicly Traded on a Stock Exchange
Privately Owned Organization
Government and Broader Public Sector
(including Crown Corporations)
Joint Venture
Not-for-Profit
By industry
Banking/Financial Services
Consumer Goods
Energy
High Tech
Insurance/Reinsurance
Life Sciences
Mining & Metals
Other Manufacturing
Other Non-Manufacturing
Retail & Wholesale
Services (Non-Financial)
2020 CA Compensation Policies and Practices Survey 4
Sample
A few survey reporting notes:
• Percentages may not sum to 100% due to rounding.
• Percentages may not sum to 100% when organizations are given the option to provide more than one response to a specific question. Those responses are valid and are further explained after each table.
• Unless otherwise specified, percentages included in this report represent the percentage of responding organizations.
• In the data tables displaying survey results, the term “N” refers to the number of respondents answering for the given item. Because every question does not pertain to every organization, and every organization did not answer every question, the “N” varies from question to question.
• All dollar amounts in this report are provided in CAD.
• Results to questions with insufficient data were removed.
• There was insufficient data to show results for the Health Care Services, Transportation Equipment, Logistics and Chemicals industries in the detailed report.
• Mercer reminds participants to exercise caution in drawing definitive conclusions on data where sample sizes are small (e.g., less than 10 organizations). This could potentially represent an insufficient sample size and not be an accurate reflection of the marketplace.
Data definitions:
• 25th Percentile — The data point that is higher than 25% of all other data in the sample when ranked from low to high. Also known as the first quartile.
• 75th Percentile — The data point that is higher than 75% of all other data in the sample when ranked from low to high. Also known as the third quartile.
• Average — The sum of all data reported divided by the number of observations in the sample. Also called the mean.
• Median — The data point that is higher than 50% of all other data in the sample when ranked from low to high. Also known as the 50th percentile.
Overview
2020 CA Compensation Policies and Practices Survey 5
Sample
Overview
Employee group definitions:
• CEO – Head of your organization.
• Executive – Top or senior management, typically CEO/COO through the EVP or VP level.
• Management – Employees who can have a significant impact on the direction and profitability of a division or business unit. Typically includes corporate directors, department managers, line-of-business managers, and managers reporting directly to an executive.
• Individual Professional – Individual contributors with no supervisory responsibility in a technical function or professional role. Typically has a degree, full trade qualification, or equivalent. May coach or instruct less experienced staff.
• Para-professional/Support – Employees in skilled, semi-skilled, or unskilled roles without supervisory responsibility. Does not require a university degree. May require some formal professional training and/or certification. May be paid on an hourly or salaried basis.
Both National and Detailed reports are available for participants and non-participants to purchase.
If you wish to purchase the Detailed report, please contact Mercer customer service at 800 333 3070.
2020 CA Compensation Policies and Practices Survey 6
Sample
Overview
2020 CA Compensation Policies and Practices Survey 7
ConfidentialityTo ensure confidentiality, results of the survey are summarized. Individual company data are never identified.
Where values are provided in the response (e.g., number of days or dollar amounts), the average and median values are reported only if five or more organizations provided data; and the 25th and 75th percentiles only if a minimum of seven organizations provided data. A double hyphen i.e., “--” has been indicated where there are insufficient data for analysis.
The information and data contained in this report are for informational purposes only and are not intended nor implied to be a substitute for professional advice. In no event will Mercer be liable to you or to any third party for any decision made or action taken in reliance of the results obtained through the use of the information and/or data contained or provided herein.
About MercerMercer is a leading global provider of consulting, outsourcing and investment services, with more than 25,000 clients worldwide. Mercer consultants help clients design and manage health, retirement and other benefits and optimize human capital. The firm also provides customized administration, technology and total benefit outsourcing solutions. Mercer’s investment services include global leadership in investment consulting and multimanager investment management.
Mercer’s global network of more than 20,000 employees, based in over 40 countries, helps ensure integrated, worldwide solutions. Our consultants work with clients to develop solutions that address global and country-specific challenges and opportunities. Mercer is experienced in assisting both major and growing, midsize companies.
The company is a wholly owned subsidiary of Marsh & McLennan Companies, Inc., which lists its stock (ticker symbol: MMC) on the New York, Chicago and London stock exchanges.
If you have questions regarding the survey or the report, call us or email us at:
Telephone: 800 333 3070
Email: [email protected]
Sample
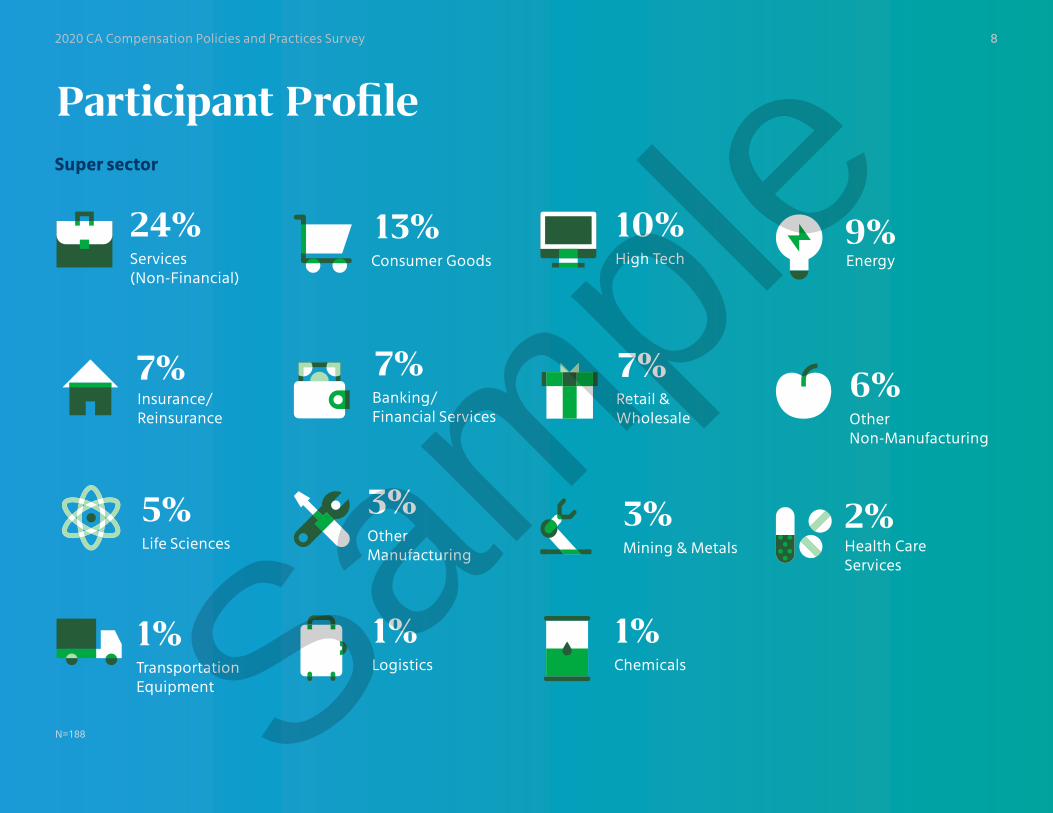
9%High TechServices
(Non-Financial)
10%24%
Insurance/ Reinsurance
7%Retail & Wholesale
Energy
7%
Life Sciences
5%Health Care Services
2%
Consumer Goods
Banking/ Financial Services
Chemicals
13%
7%
1%
Other Manufacturing
3%
Other Non-Manufacturing
6%
Transportation Equipment
1%
Mining & Metals
3%
Participant ProfileSuper sector
Logistics
1%
N=188
2020 CA Compensation Policies and Practices Survey 8
Sample
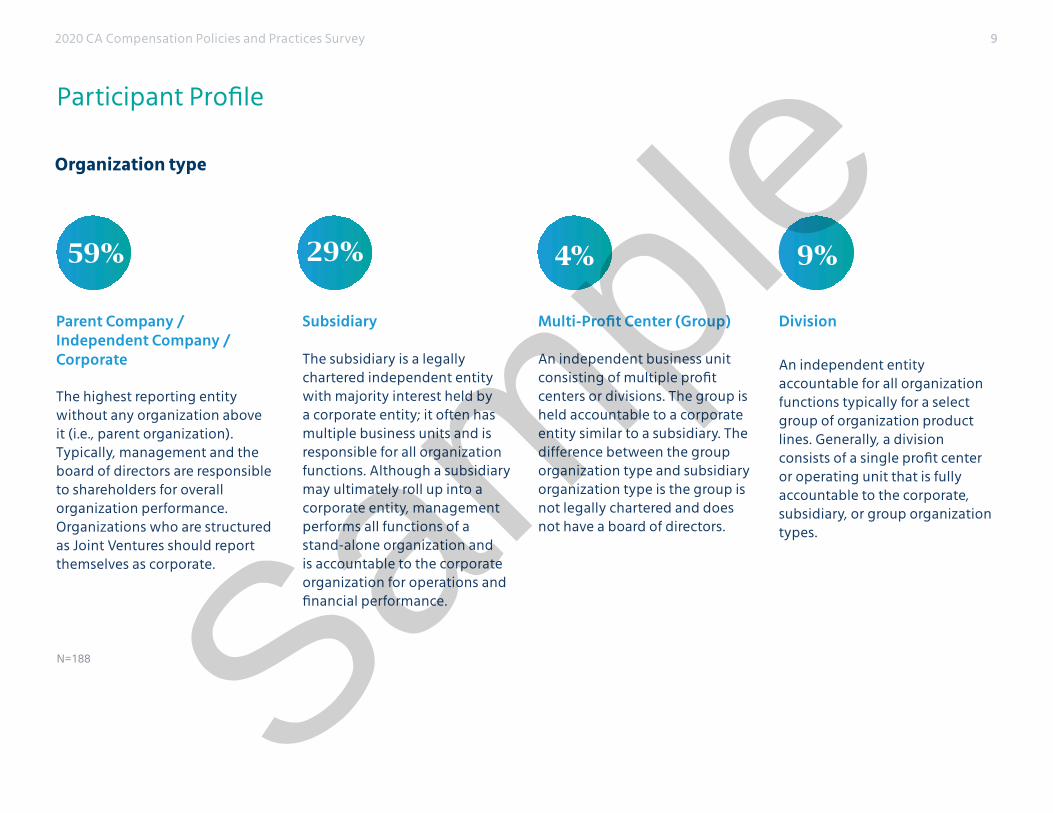
Organization type
Participant Profile
N=188
9%29% 4%59%
2020 CA Compensation Policies and Practices Survey 9
Parent Company / Independent Company / Corporate
The highest reporting entity without any organization above it (i.e., parent organization). Typically, management and the board of directors are responsible to shareholders for overall organization performance. Organizations who are structured as Joint Ventures should report themselves as corporate.
Subsidiary The subsidiary is a legally chartered independent entity with majority interest held by a corporate entity; it often has multiple business units and is responsible for all organization functions. Although a subsidiary may ultimately roll up into a corporate entity, management performs all functions of a stand-alone organization and is accountable to the corporate organization for operations and financial performance.
Multi-Profit Center (Group) An independent business unit consisting of multiple profit centers or divisions. The group is held accountable to a corporate entity similar to a subsidiary. The difference between the group organization type and subsidiary organization type is the group is not legally chartered and does not have a board of directors.
Division
An independent entity accountable for all organization functions typically for a select group of organization product lines. Generally, a division consists of a single profit center or operating unit that is fully accountable to the corporate, subsidiary, or group organization types.
Sample

Joint Venture
N=188
Publicly Traded on a Stock Exchange
Privately Owned Organization
Government and Broader Public Sector (including Crown Corporations)
Not-for-Profit
48%
3%
28%
12%
10%
Ownership type
Participant Profile
2020 CA Compensation Policies and Practices Survey 10
Publicly Traded on a Stock Exchange – A company that has issued securities through an initial public offering and which are traded in at least one stock exchange or over-the-counter market.
Note: This category may include publicly traded for-profit higher education institutions (corporations that have schools or learning centers) and publicly traded for-profit healthcare organizations.
Privately Owned Organization – Sole Proprietorship or the company’s stock is owned by a relatively small number of holders who do not trade the stock publicly on a stock exchange/market.
Note: This category may include member-owned cooperatives, mutual companies, privately owned for-profit higher education institutions (corporations that have schools or learning centers) and for-profit healthcare organizations.
Not-for-Profit – An organization operating on a not-for-profit basis, including not-for-profit tax status, which is primarily funded through charitable donations, member dues, or government transfers.
Note: This category may include charities and religious organizations in addition to other not-for-profits such as associations (For e.g., Ontario Medical Association).
Joint Venture – A joint venture exists when two or more companies enter into an agreement to contribute resources to a common business venture. Resources might include capital, skills or services. A joint venture is not a separate legal entity.
Note: There are no formal regulations governing joint ventures. Generally, contractual obligations govern joint ventures.
Government and Broader Public Sector (including Crown Corporations) – Taxpayer-funded or levy-receiving organizations primarily operating in the public’s interest. Boards typically include government representatives, or some members are chosen by elected officials.
Note: This category may include crown corporations, government-funded educational institutions, school districts, hospitals, and health organizations.Sample
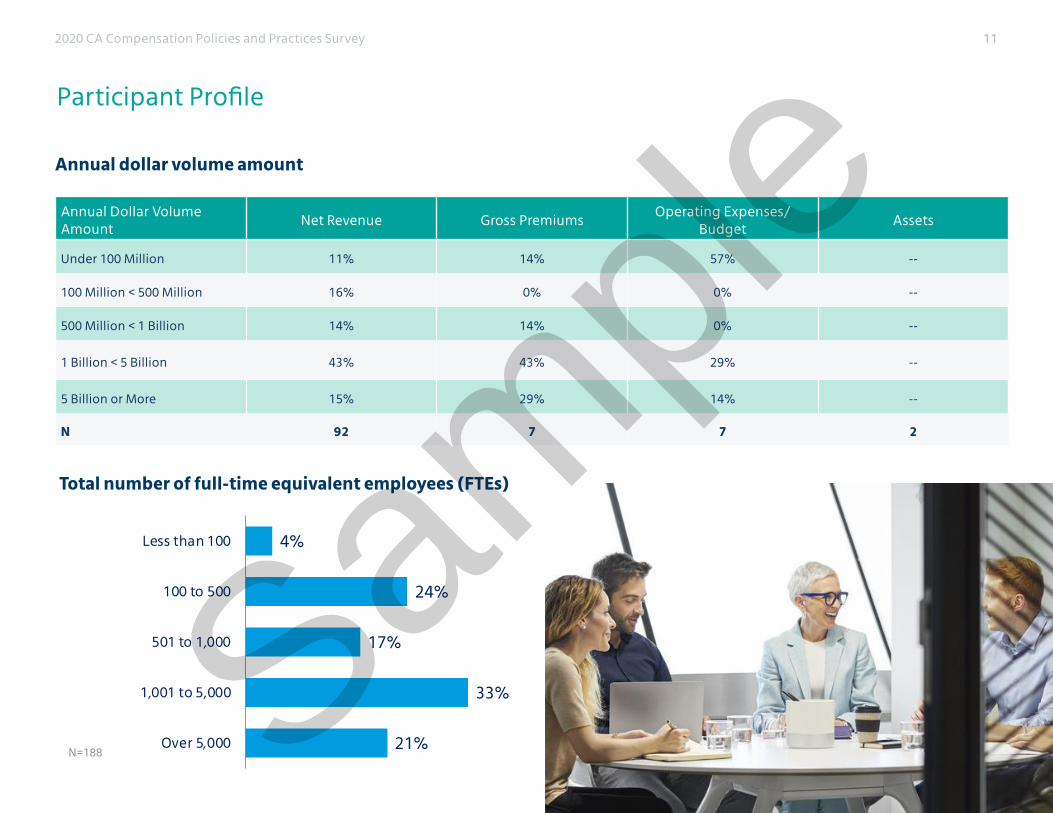
Annual dollar volume amount
Participant Profile
Annual Dollar Volume Amount
Net Revenue Gross PremiumsOperating Expenses/
BudgetAssets
Under 100 Million 11% 14% 57% --
100 Million < 500 Million 16% 0% 0% --
500 Million < 1 Billion 14% 14% 0% --
1 Billion < 5 Billion 43% 43% 29% --
5 Billion or More 15% 29% 14% --
N 92 7 7 2
Total number of full-time equivalent employees (FTEs)
N=188
4%
24%
17%
33%
21%
Less than 100
100 to 500
501 to 1,000
1,001 to 5,000
Over 5,000
2020 CA Compensation Policies and Practices Survey 11
Sample

Location of employees
Participant Profile
Region Executive Management Individual Professional Para-Professional/Support
Atlantic Canada 12% 30% 38% 28%
Greater Montreal 26% 49% 49% 45%
Other Qubec 10% 28% 35% 30%
National Capital Region 16% 29% 33% 28%
Greater Toronto 62% 69% 69% 63%
Other Ontario 16% 39% 47% 43%
Manitoba 9% 28% 36% 27%
Saskatchewan 9% 27% 35% 28%
Greater Calgary 22% 45% 51% 42%
Greater Edmonton 13% 33% 41% 34%
Other Alberta 10% 27% 36% 31%
Greater Vancouver 21% 39% 47% 37%
Other British Columbia 8% 27% 37% 30%
Territories 1% 5% 9% 8%
N 183 188 188 186
Multiple responses were allowed; therefore, the total may exceed 100%.
2020 CA Compensation Policies and Practices Survey 12
Sample
Survey results
2020 CA Compensation Policies and Practices Survey 13
Sample

Sample
Sample