Embed Size (px)
Citation preview

2 0 2 1
Compensation and Benefits Study
U.S. and Canada
Members of the Association of Fundraising Professionals

2021 AFP Compensation and Benefits StudyKevin J. Foyle, MBA, CFRE, Chair, AFP Global Board of Directors and Member, AFP Greater Houston Chapter
Ken Mayhew, Chair, AFP Canada and Member, AFP Greater Toronto Chapter
Birgit S. Burton, AFP Global Chair-Elect and Member, AFP Atlanta Chapter
Marco A. Corona, AFP Vice Chair, Membership Engagement and Member, AFP SC Lowcountry Chapter
Mike Geiger, MBA, CPA, President and CEO
Michael Nilsen, Vice President, Marketing, Communications & Public Policy
Cathlene Williams, Ph.D., Consultant, Research
Melissa S. Brown, LLC (Vancouver, WA), project management and writing; Chamberlin/Dunn (Indianapolis), data analysis; Fogus Stone, J.D. Stanley & Associates (both of Indianapolis), and Timothy+Sinclair (Columbia, SC) provided editorial assistance.
© 2021 by the Association of Fundraising Professionals (AFP) 4300 Wilson Blvd., Suite 300, Arlington, VA 22203 USA
All rights reserved. No part of this publication may be reproduced, stored in a retrieval system, or transmitted, in any form or by any means, electronic, mechanical, photocopying, recording, scanning, or otherwise without the prior written permission of the Association of Fundraising Professionals, International Headquarters.
Requests for permissions should be addressed to AFP International Headquarters, Center for Fundraising Innovation (CFI), 4300 Wilson Blvd., Suite 300, Arlington, VA 22203, USA. AFP may choose to grant permission for photocopying for limited personal or internal use. This consent will not necessarily extend to other kinds of copying, such as copying for either general public or select distribution, such as in the classroom, for advertising or promotional purposes, for creating new published works, or for resale.
This document is prepared using open-source fonts. Lato is used for the headings and Inter for text. These fonts were selected for ease of use when reading online.

Association of Fundraising Professionals
Vision and Mission
Vision
To stimulate a world of generosity and positive social change through fundraising best practice.
Mission
The Association of Fundraising Professionals empowers individuals and organizations to practice ethical fundraising through professional education, networking, research, and advocacy.

AcknowledgmentsThis is the twenty-second annual report of findings from the AFP Survey of Compensation and Benefits. This report extends the research begun in the last two decades and encompasses separate surveys of members in the United States and Canada.
AFP wishes to thank those who made this research possible. First and foremost, we are grateful to the more than 3,800 AFP members in Canada and the United States who took the time to complete and return the survey form. Melissa Brown, an AFP member, and her colleagues Molly Chamberlin and Nicole Dunn, served as statistical consultants to the project and were responsible for the compilation of all data tables.
The study was directed by Dr. Cathlene Williams in consultation with the AFP Research Council.
We welcome comments and suggestions for improving this study and this report. Please address all comments to Dr. Cathlene Williams at (703) 794-2178 or [email protected].

Contents1 Introduction
1 Organization of the Report
1 Highlights of the findings.
1 Methodology
3 Study Highlights
3 COVID-19 and Compensation
3 Participant Demographics
4 Organizations Where Fundraisers Work
4 Compensation
5 Compensation Differences Related to Gender
6 Benefits
7 Conclusion to Study Highlights
8 Section 1: COVID-19 and Compensation
8 Summary of Findings Related to COVID-19
9 Payroll Protection Plan — U.S.
10 Actual Changes in Employment and Compensation
14 Expected Changes in 2021
18 Section 2: Who Are Fundraisers?
18 Women Predominate in AFP and in Survey Participation
18 Fewer Than 15 Percent of Fundraisers Identify as Black, Indigenous, Asian, Hispanic, or a “Person of Color”
18 Demographics by Responsibilities
18 Demographics by Experience and Training
20 Certification is More Common in Canada Than in the U.S.
20 Seeking Opportunity and Higher Pay Dominate Job Seeker Motives
22 Section 3: Where do Fundraisers Work?
22 Leadership at the Board Level
23 In U.S., Organizations Founded for Empowering Under-Represented Groups No More Likely to Include Board Members From Under-Represented Groups
24 Supervisors in Fundraising
24 Size of Fundraising Staff and Volunteer Ratios
28 Section 4: Fundraiser’s Compensation
28 Section 4.a: Overview of Compensation
30 Determining Initial Compensation
31 Section 4.b: Compensation by Fundraisers’ Characteristics — U.S.
35 Section 4.c: Compensation Based on Fundraisers’ Characteristics — Canada

39 Section 4.d: Compensation Varies by Organizational Traits
45 Amount Raised and Compensation — Canada
46 Section 5: Benefits
46 Section 5.a: Medical/Health Benefits — U.S.
47 Section 5.b: Medical/Health Benefits — Canada
47 Section 5.c: Retirement Benefits — U.S.
48 Section 5.d: Retirement Benefits — Canada
49 Section 5.e: Other Benefits — U.S.
50 Section 5.f: Other Benefits — Canada
51 Appendix 1: Definition of Retirement Benefits Terminology
53 Appendix 2: Information About Participants
59 Appendix 3: Organizations Where Fundraisers Work
63 Appendix 4: Compensation – U.S.
69 Appendix 5: Compensation – Canada
73 Appendix 6: Benefits Offered By Position – U.S.
77 Appendix 7: Benefits Offered By Position – C.A.
81 Appendix 8: Salary By Position – U.S.
130 Appendix 9: Salary Statistics By Position, By Professional Track and Demographic Traits of Participants – Canada
161 Appendix 10: Survey Questions

Contents: Figures9 Figure 1: Status of PPP funding at your employer organization, 2020 — U.S.
11 Figure 2: Percentage of employers by number of fundraising FTEs, 2020
11 Figure 3: Changes in earnings by subsector, March 1, 2020 to December 31, 2020 — U.S
12 Figure 4: Average salary increase and average salary decrease by subsector, between March 1 and December 31, 2020 — U.S.
13 Figure 5: Changes in earnings by subsector, March 1, 2020 to December 31, 2020 – Canada
13 Figure 6: Average salary increase and average salary decrease by subsector, between March 1 and December 31, 2020 — Canada
19 Figure 7: 81% of study participants identified as women
19 Figure 8: 47% have four-year degree and 43% have post-graduate diploma or specialization
19 Figure 9: 84% identified as white only
20 Figure 10: Current average age is 45 with median at 46. Distribution is even from 25 through 64.
21 Figure 11: Reasons identified for thinking about changing jobs — U.S. and Canada combined
25 Figure 12: Low, median, and high fundraising staff per $1 million raised by organizational mission — U.S.*
26 Figure 13: Low, median, and high fundraising staff per $1 million raised by organizational mission — Canada.*
27 Figure 14: Average number of volunteers* assisting with fundraising by amount raised (includes board members) — U.S. and Canada combined
27 Figure 15: Average number of volunteers assisting with fundraising by number of fundraising FTEs — U.S. and Canada
28 Figure 16: Share of study participants in each of five salary ranges, as of March 1, 2020 — U.S. and Canada
29 Figure 17: Half saw no change in salary from the end of 2019 to March 2020.
39 Figure 18: Compensation by selected subsector where n > 100 — U.S.
40 Figure 19: Average salaries by U.S. Census regions
42 Figure 20: Average Salary by province in Canada.
44 Figure 21: Very strong relationship between the organization’s overall budget and average fundraising professional compensation — U.S.
49 Figure 22: Other benefits organized by those that benefit the family or individual and those that have a clear connection to work and being available for work
50 Figure 23: Other benefits organized by those that benefit the family or individual and those that have a clear connection to work and being available for work

Contents: Tables5 Table 1: 2019 and 2020 mean (average) and median salaries — U.S. and Canada
10 Table 2: Percentage of fundraising FTEs furloughed or laid off between March and December
14 Table 3: Direction of change anticipated for salary in 2021
14 Table 4: Share of employers by planned cuts to benefits in 2021 as reported early 2021 — U.S.
15 Table 5: Share of employers by planned cuts to benefits in 2021 as reported early 2021 — Canada
15 Table 6: Anticipated direction of change in FTEs in fundraising, March 2020 to mid-2021
16 Table 7: 2021 Employment plans by gender
16 Table 8: 2021 Employment intentions by race/ethnicity — U.S. and Canada
17 Table 9: Career plans, beyond 2021 by gender – U.S. and Canada
17 Table 10: Career plans beyond 2021 by ethnicity or race — U.S. and Canada
22 Table 11: What percentage of your organization’s board identifies as female?
23 Table 12: What percentage of your organization’s board identifies as a member of a minority or from a group under-represented in leadership positions?
24 Table 13: To whom do you report?
29 Table 14: Changes in mean and median salaries, 2019 to 2020, as of March 1, 2020 — U.S. and Canada, all participants
29 Table 15: Changes in mean and median salaries, 2019 to 2020, as of March 1, 2020 — U.S. and Canada, excluding top 5%
30 Table 16: Majority* feel that they negotiated effectively for current salary
31 Table 17: Men have higher average compensation before considering hours worked, education, experience, or institution budget
32 Table 18: Average compensation by race or ethnic heritage — U.S.
32 v9: Compensation for part-time and full-time fundraising professionals by education level — U.S
33 Table 20: Fundraising experience correlates with income, age, and employment tenure
33 Table 21: CFRE holders earn more, on average, than peers with similar levels of experience
33 Table 22: Certification is associated with higher income
34 Table 23: Potential negative earnings effects — U.S.
35 Table 24: Men have higher average compensation before considering hours worked, education, and experience — Canada
36 Table 25: Average compensation by race or ethnic heritage — Canada
36 Table 26: Education, compensation, and hours worked — Canada
37 Table 27: Fundraising experience correlates with age and employment tenure — Canada
37 Table 28: With more years of experience, CFRE holders earn more on average than peers without CFRE
38 Table 29: Potential negative earnings effects — Canada

41 Table 30: Regional salary averages and medians, 2020, pre-COVID-19 — U.S.
43 Table 31: Regional salary averages and medians, pre-COVID-19 — Canada
43 Table 32: Salaries by geographic scope of the organization, pre-COVID-19 — U.S.
44 Table 33: Salaries by geographic scope of the organization, pre-COVID-19 — Canada
45 Table 34: Relationship between the organization’s overall budget and average fundraising professional compensation — Canada
47 Table 35: Retirement plans offered, pre-COVID-19 — U.S.
48 Table 36: Retirement plans offered, pre-COVID-19 — Canada
53 Table 37: Demographics of Study Participants
54 Table 38: Fundraising Role(s) of Study Participants
55 Table 39: Fundraising Careers of Participants
58 Table 40: Career Trajectory
59 Table 41: Organizations where professional fundraisers work
63 Table 42: I feel I negotiated effectively for my salary and benefits when I accepted my current position.
63 Table 43: Change in income due to COVID-19
64 Table 44: Compensation by position – U.S.
65 Table 45: Compensation by subsector– U.S.
66 Table 46: Compensation by organizational region – U.S.
66 Table 47: Compensation by organizational scope – U.S.
67 Table 48: Size of metropolitan area where the survey participant’s office is located – U.S.
67 Table 49: Compensation by organizational total expenditures (budget) – U.S.
68 Table 50: Compensation by Amount Raised – U.S.
69 Table 51: Compensation by Position – Canada
70 Table 52: Compensation by Subsector– Canada
71 Table 53: Compensation by organizational region – Canada
71 Table 54: Compensation by organizational scope – Canada
71 Table 55: Size of metropolitan area where the survey participant’s office is located – Canada
72 Table 56: Compensation by organizational total expenditures (budget) – Canada
72 Table 57: Compensation by Amount Raised – Canada
74 Table 58: Health Insurance Offered by Position - U.S.
75 Table 59: Retirement Benefits Available by Position – U.S.
76 Table 60: Other Benefits Available by Position – U.S.
78 Table 61: Health Benefits Offered by Position – Canada
79 Table 62: Retirement Benefits Offered by Position – Canada
80 Table 63: Other Benefits Offered by Position – Canada
81 Table 64: Salary Data for CEO/ED – U.S.
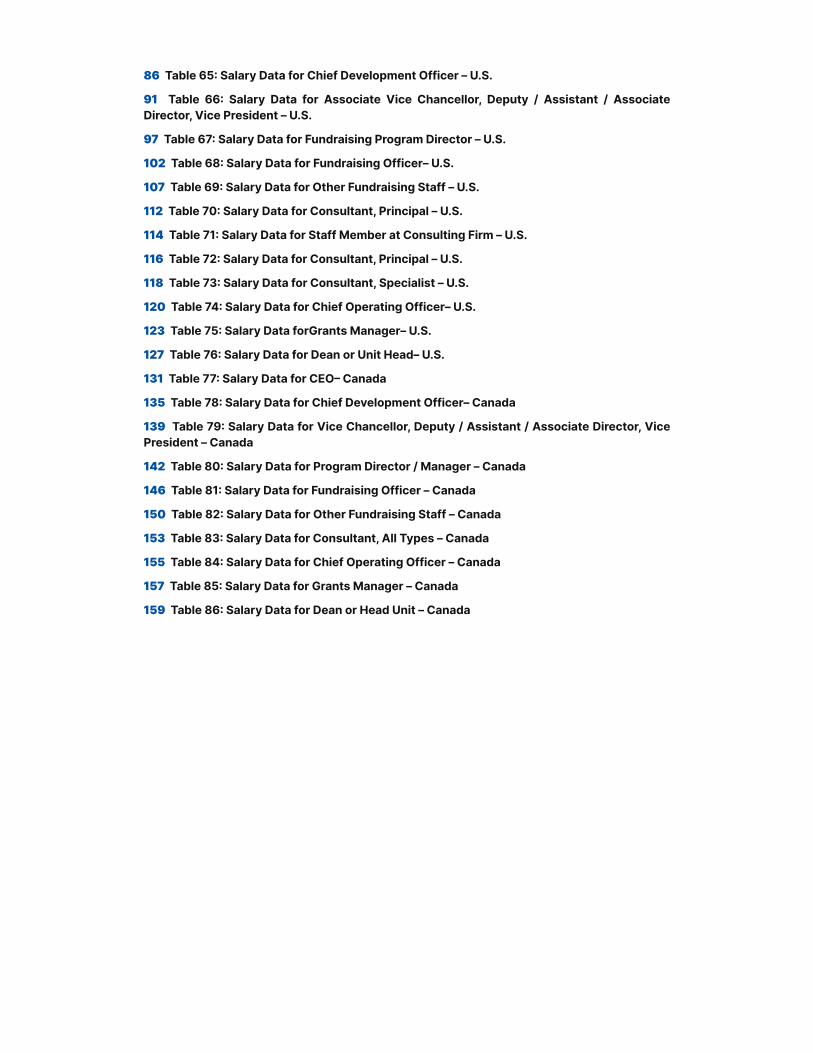
86 Table 65: Salary Data for Chief Development Officer – U.S.
91 Table 66: Salary Data for Associate Vice Chancellor, Deputy / Assistant / Associate Director, Vice President – U.S.
97 Table 67: Salary Data for Fundraising Program Director – U.S.
102 Table 68: Salary Data for Fundraising Officer– U.S.
107 Table 69: Salary Data for Other Fundraising Staff – U.S.
112 Table 70: Salary Data for Consultant, Principal – U.S.
114 Table 71: Salary Data for Staff Member at Consulting Firm – U.S.
116 Table 72: Salary Data for Consultant, Principal – U.S.
118 Table 73: Salary Data for Consultant, Specialist – U.S.
120 Table 74: Salary Data for Chief Operating Officer– U.S.
123 Table 75: Salary Data forGrants Manager– U.S.
127 Table 76: Salary Data for Dean or Unit Head– U.S.
131 Table 77: Salary Data for CEO– Canada
135 Table 78: Salary Data for Chief Development Officer– Canada
139 Table 79: Salary Data for Vice Chancellor, Deputy / Assistant / Associate Director, Vice President – Canada
142 Table 80: Salary Data for Program Director / Manager – Canada
146 Table 81: Salary Data for Fundraising Officer – Canada
150 Table 82: Salary Data for Other Fundraising Staff – Canada
153 Table 83: Salary Data for Consultant, All Types – Canada
155 Table 84: Salary Data for Chief Operating Officer – Canada
157 Table 85: Salary Data for Grants Manager – Canada
159 Table 86: Salary Data for Dean or Head Unit – Canada

1 | ©2021 AFP Compensation & Benefits Report
IntroductionQuestions related to fundraiser compensation are among the most frequently asked of AFP Global staff. This AFP Compensation and Benefits Study is intended to answer those questions. This study also dovetails with and supports the goals of the Women’s Impact Initiative launched by AFP in March 2019 and continues to collect data related to the IDEA Program of AFP (Inclusion, Diversity, Equity, and Access).
Organization of the ReportIn this study, we have attempted to capture overall organizational profiles, position descriptions, salaries, and benefits, including health/medical, retirement, and general perquisites or “perks.” This report is organized as follows:
Highlights of the findings. • SECTION 1: COVID-19 and the impact on employment and compensation for AFP
members
• SECTION 2: WHO ARE FUNDRAISERS? This includes demographic information, attitudes toward the job and challenges identified, career trajectories, plans for changing jobs, and certifications held and sought.
• SECTION 3: WHERE DO FUNDRAISERS WORK? This section presents data about the organizations that employ fundraisers: subsectors, budget/size, numbers of fundraising staff, and volunteers. This year, we introduce a new feature: an estimate of the number of fundraising personnel associated with raising $1 million.
• SECTION 4: FUNDRAISERS’ COMPENSATION This section has two subsections: U.S. and Canada. Within each subsection, text and tables present findings by fundraiser traits such as certification, education level, and more. The section then looks at compensation by organizational characteristics (budget, amount raised, location, scope, etc.).
• SECTION 5: Benefits, including health, retirement, and other benefits.
• APPENDICES 2 through 10, which present data for compensation and benefits including by job title within each country.
We welcome your response to what we believe will prove an increasingly useful tool for all fundraising professionals.
Methodology
The Survey InstrumentThe survey instrument was developed by the AFP Research staff with input from the AFP Research Council and reviewed by a volunteer panel of experienced researchers. The questionnaire was designed to be answered via a web-based survey tool. A copy of the survey instrument is found in APPENDIX 10 .
Sampling FrameThe sampling frame for the study was AFP membership in the U.S. and Canada as of December 31, 2020. At that time there were approximately 21,300 active (not retired, allowing email contact)

2 | ©2021 AFP Compensation & Benefits Report
members in those countries. A total of 18,598 members in the U.S. and 2,695 members in Canada successfully received the emailed survey. (Note: There is some chance of bias in that those with no email address were not surveyed. The decision to limit the survey to those with email addresses was based on cost effectiveness and efficiency in data collection.)
Monetary ValuesMonetary values are reported in U.S. dollars for U.S. participants and in Canadian dollars for Canadian participants.
Confidence LevelSample size was computed to yield a confidence level of .05 and a confidence interval of plus or minus 5 percent. For example, the average salary pre-COVID-19 in 2020 was $88,420 for the U.S. and $90,511 in Canada. Applying the standard error for the study suggests that there is a 95 in 100 chance that the average salary for all U.S. fundraisers in the AFP U.S. membership will fall between $86,168 and $90,675. In Canada, the mean compensation was $90,511, which suggests a mean salary for Canadian AFP members between $85,967 and $95,378.
However, after adjustments for reductions made, or lower-salary jobs accepted, due to COVID-19, salaries in the U.S. and Canada were lower at the end of the year. In the U.S., the average end-of-year U.S. salary was $85,567. In Canada, it was $89,440.
Response RateA total of 3,818 AFP members (3,261 U. S. and 557 Canadian) submitted responses by the time the survey closed, a response rate of 20.5 percent for the U.S. based on those who received the invitation and 20.7 percent for Canada. Overall response rate was 20.5 percent.
Other ConsiderationsAll data are current as of February 28, 2021, when participants completed the survey. Participants were asked to report on their salary and benefits for the 2020 calendar year, both as of March 1, 2020 and again as of December 31, 2020. Participants were the source of all information reported, and no data checking was conducted with individual participants.
During analysis, outliers were identified and removed, such as values of $1 and $1,600,000 for salary (U.S.); or 4800 full-time equivalents (FTEs) for fundraising professionals on staff.
Data are reported by regions. For the U.S., the highest mean was reported in New England, and the highest median in the West. The lowest mean was in the Mountain states and the lowest median in the states around the Great Lakes. For detail, see FIGURE 20 on PAGE 40.
For Canada, the highest mean was in Ontario. For detail by province, see FIGURE 21 on PAGE 42. However, the reader should be cautious of any data with a cell frequency of less than 30 participants.
Descriptive statistics in the tables in the appendix focus on mean, median, and the 25th and 75th percentile.
Analysts used correlation analysis for salary with age, education, and years of experience.

3 | ©2021 AFP Compensation & Benefits Report
Study HighlightsAFP members in the U.S. and Canada answered an online survey for the 2021 AFP Compensation and Benefits Study in January and February 2021. The survey invitation reached 18,598 AFP members in the U.S. and 2,695 AFP members in Canada. A total of 3,818 members returned survey responses by the cut-off date, for an overall response rate of 17.9 percent after adjusting for bounced email invitations.
COVID-19 and CompensationThe pandemic of 2020 and resulting economic uncertainty led some organizations to reduce their fundraising staff, some to retain staff but with furlough (unpaid) days, and some to lower compensation. Layoffs or furloughs for at least some fundraising personnel (not always the individual taking the survey) occurred at about 20 percent of the organizations represented in this survey.
The net result when looking at all survey responses was a decline in compensation between March and December 2020 of 3 percent in the U.S. and 2 percent in Canada, compared with pre-COVID-19 salaries reported. This aggregate result, though, conceals vast differences. In the U.S., for example, 18.5 percent of study participants reported a drop in compensation, and that decline averaged $20,769. Another 14.5 percent reported an increase in pay, and that averaged $7,885.
Salaries changed because of:
• Layoff and then a new job, reported by 3 percent of participants;
• Unpaid days, reported by 5 percent;
• Accepting lower pay (at the same employer or elsewhere) to remain employed, reported by 10 percent; or
• Increased compensation at some employers, or a new job with higher pay.
Study respondents projected salary increases in 2021 at more than half of the organizations. Just over one-third anticipated growth in employment in fundraising staff at their employer by mid-2021.
In addition to compensation changes, some employers shifted more of the cost of health insurance to employees in 2021: 15 percent in the U.S. and 9 percent in Canada reported this change.
When asked about plans for 2021, more than 80 percent of AFP members in this study intended to remain in the job they held early in the year. The remaining study participants were about evenly split between seeking another job with the same employer and looking for work elsewhere. People in the U.S. who identify as Black, Indigenous, Hispanic, Asian, or Multi-racial were slightly more likely (18 percent vs 12 percent for white-only non-Hispanic) to say that they anticipate leaving fundraising in 2021. This difference was not found in Canada, where race or ethnic heritage was not associated with plans to seek work in another field in 2021.
In contemplating their employment beyond 2021, most AFP members (76 percent) wanted to remain in the profession. Some were planning retirement earlier than they might have intended before COVID-19 (13 percent) and nearly as many (11 percent) intended to work longer than they envisioned before COVID-19. The results are very similar in Canada and the U.S.
Participant DemographicsText and illustrations related to demographics begin on PAGE 18. Data tables related to demographics appear in APPENDIX 2 .

4 | ©2021 AFP Compensation & Benefits Report
In the U.S., study participants were more likely to be women than what is found in the membership data. In the study, 80.7 percent identified as women and 18.1 percent as men, with 1.2 percent identifying as another option, including “prefer not to answer.” In Canada, the percentages by gender were similar to the U.S.: 80.8 percent women, 18.2 percent men, and 0.9 percent selecting another option, including “prefer not to answer.” Overall AFP membership is 69 percent women, 22 percent men, and 9 percent unknown.
In the study, of those who provided ethnicity, 84.9 percent reported white/Caucasian and non-Hispanic in the U.S, and 15.1 percent identified differently, down slightly from 16 percent in 2020. In Canada, 77.5 percent selected white/European, and 22.5 percent identified differently, up from 21 percent in 2020.
In the U.S. 4.4 percent identified as Hispanic/Latinx/Latin American, compared with 0.9 percent who selected that identity in Canada. Overall AFP membership is 86 percent white/Caucasian.
Participants who were 45 years old or older jumped to 55.4 percent (up from 51 percent in 2020) of respondents; 24 percent were 35 to 44 years old; and 19.3 percent were 25 to 34 years old. This is a marked decline (from 25 percent) for this age group. Only 1 percent were under 25.
Among participants from the U.S., 40.1 percent were chief development officers, compared with 21.6 percent of Canadian participants. In the U.S., 14.9 percent of participants said they were CEO or executive director and in Canada, 17.3 percent did. In the U.S., 14.3 percent identified themselves as gift officers (major gifts, corporate/foundation gifts, planned gifts, etc.). In Canada 22.5 percent identified that as their role.
The average U.S. participant worked for 3.4 employers as a fundraiser. In Canada, the average is similar, at 3.5 employers. In the U.S., the average longest time worked in the same job was 6.7 years. In Canada, the average time in the same job was slightly lower, at 6.2 years.
Organizations Where Fundraisers WorkMore detailed discussion of organizations begins on PAGE 22. Data tables related to questions about the organizations where fundraisers work appear in APPENDIX 3.
High percentages of AFP members, and therefore of survey participants, work in human development/social services organizations, health services, higher education, or arts/cultural organizations. Together, these four subsectors account for 70 percent of participants in the U.S. and 76 percent in Canada. The survey asked about 25 different organizational focuses.
In the U.S., 4 percent of participants worked for local organizations and 34 percent worked for organizations operating at a state level. Among Canadian participants, 25 percent worked for provincial organizations and 48 percent for local charities. Data for membership based on regions served are not available.
Most fundraising professionals (68 percent in the U.S. and 62 percent in Canada) worked in organizations with 1 to 5 fundraising professionals with direct fundraising responsibility. Less than 1 percent of U.S. and Canadian participants said their organizations have no professional staff with direct fundraising responsibility. The others have 6 or more fundraisers. The mid-point (median) is 3 professionals in the U.S. and 4 in Canada. The averages are skewed by very large programs and are not useful points of comparison.
CompensationMore detailed discussion of compensation begins on PAGE 28. Data tables related to compensation are in APPENDIX 4 (U.S.) and 5 (CANADA).
In the U.S., the pre-COVID-19 average salary of survey participants increased by 4 percent, to $88,421 in 2020 from $85,060 in 2019. In Canada, the average salary increased by 4.2 percent, to

5 | ©2021 AFP Compensation & Benefits Report
$90,511 in 2020 from $86,876 in 2019. This question asked about annual earnings expected as of March 1, 2020, not including fringes or incentive compensation.
The median salary in the U.S. pre-COVID-19 was $75,000, and in Canada, it was $78,000. The U.S. median was $75,000 in 2019, and in Canada, the median was $75,000.
By the end of the year, some participants had accepted lower pay in order to maintain employment while others switched jobs. The average salary for a fundraising professional in the U.S. by year-end was $85,567, very nearly the same as in 2019. The median remained $75,000. In Canada, the average salary as of year-end was $89,440, still representing a 3 percent increase over 2019 earnings. The median, however, dropped slightly to $76,394.
Table 1: 2019 and 2020 mean (average) and median salaries — U.S. and Canada
Of those reporting their compensation as of March 1st and December 31st, 2020, 18 percent reported lower compensation by year-end and 15 percent reported an increase, possibly due to a job change. The balance, 67 percent, reported no change in compensation between the start of the COVID-19 epidemic and related economic crisis and the end of the year.
Compensation Differences Related to GenderLooking at simple averages, women’s compensation in the U.S. averaged $85,967 compared with men’s pay of $103,175, for a gap of $17,208, or 20 percent. In Canada, the gap is $21,044 based on compensation of $85,894 for women compared with $114,770 for men. Canadian women in this study, on average, earned 34 percent less than men in Canada. Just over 1 percent in the U.S. selected a gender other than male or female. Within that small group, salaries averaged $110,217, or higher than U.S. men’s average by 7 percent and higher than the U.S. women’s average by 28 percent. The median, at $90,000, equaled the median for men in the U.S. There were too few Canadian respondents selecting an identity other than man or women to analyze. See PAGES 32 and 36 for more detail.
Compensation Differences by Racial or Ethnic HeritageThis is the third year of examining salary based on broad groups of racial or ethnic heritage. For salaries in 2018 and 2019, in both the U.S. and Canada, the average salary of fundraisers who selected an identity grouped within the cluster Black, Indigenous, People of Color (BIPOC) was nearly equal to salaries of people who identified as non-Hispanic, white/Caucasian, or European ancestry only. For analysis purposes, this group included people who identified as Jewish.
In this wave of the Compensation and Benefits Study, people whose ethnic or racial heritage was grouped into the cluster of BIPOC earned 10 percent less, on average, than those who were grouped as “white only” in the U.S. The gap was 5 percent less for people who identified in the BIPOC cluster in Canada. See TABLE 21 and TABLE 22 for more detail.
Nothing in the study data explains why there was a drop in 2020 after two years of near-equal
U.S. 2019 Mean 2020 Mean 2019 Median 2020 Median
March 1, 2020 $85,060 $88,421 $75,000 $75,000
December 31, 2020 - $85,657 - $75,000
Canada 2019 Mean 2020 Mean 2019 Median 2020 Median
March 1, 2020 $86,976 $90,511 $75,000 $78,000
December 31, 2020 - $89,440 - $76,394

6 | ©2021 AFP Compensation & Benefits Report
compensation. AFP will continue to collect data and conduct a longitudinal analysis to explore hypotheses about the relationships between compensation and race or ethnicity.
Compensation Related to CertificationThe average salary of CFRE certified fundraisers who work 30 hours or more a week has consistently been higher than the average for someone who has the same number of years of experience and does not have a CFRE. The differences range from 10 percent to 25 percent more, depending on years of experience. There is a very weak correlation between holding a CFRE and the size of the organization where the individual works, insufficient to account for the salary difference. See PAGE 33 and PAGE 33 for more detail.
Lower Compensation Related to Life Events
In the U.S. just over one-quarter (26 percent) of study participants indicated they experienced an event in the past two years that they believe has had a negative effect on their salary. These events included taking time off in the past two years to care for children, other family members, or the AFP member’s own health. The potentially disruptive events also included career moves such as relocation to a new community (e.g., to follow a spouse) or resigning before having a new position. In addition, for 2020, the study asked about the impact of layoffs prior to and during 2020, as well as unpaid days due to COVID-19 and accepting lower wages in 2020 in order to remain employed.
• Nearly one in five (17 percent) study participants reported direct loss of salary in 2020 due to layoff, furlough (unpaid days), or accepting lower pay in order to remain employed. This is also reflected in finding that 18 percent reported lower compensation by year-end.
• Ten percent said their pay was lower than peers’ compensation because of time taken in the past two years to care for themselves or a family member, including working part-time to care for children.
• Six percent reported lower earnings because of career shifts, including moving to another community or taking time off to further their education.
See PAGE 34 and PAGE 38 for more details.
BenefitsHealthcare insurance is the most common employment benefit, followed by retirement plan contributions by an employer. About half of fundraising professionals receive employer-paid professional dues. At the lower end of the spectrum, just 3 percent receive relocation expenses.
More detailed discussion of benefits begins on PAGE 46. Data related to benefits are in APPENDIX 6 for the U.S. and APPENDIX 7 for Canada.
HealthcareNearly all fundraisers in this survey had access to some form of healthcare through their employer. Ninety-three percent of U.S. participants and 94 percent of Canadian participants indicated their organization provides some level of healthcare insurance or cost reimbursement, either for care itself or for healthcare premiums.
In the U.S.:
• 90 percent of U.S. participants received at least some employer contributions toward medical insurance or funding for medical expenses.
• 58 percent are offered a health savings account or medical spending account.

7 | ©2021 AFP Compensation & Benefits Report
• More U.S. participants received prescription coverage (49 percent) compared with 2019 (41 percent).
• About the same share received dental insurance (67 percent in 2020 and 64 percent in 2019).
• More had vision benefits (62 percent in 2020, up from 56 percent in 2019).
In Canada:
• 65 percent reported receiving basic hospitalization/major medical coverage.
• 49 percent had major medical coverage.
• More in 2020 had prescription coverage at 71 percent for 2020 compared with 64 percent in 2019.
• Seven in 10 (70 percent) had dental insurance, which is about the same as the 66 percent reported for 2019.
• Six in ten (60 percent) had vision insurance, up from 50 percent reported for 2019.
RetirementA majority of organizations offer retirement plans: 71 percent in the U.S. and 84 percent in Canada.
• Salary deferral plans are the most common, with 45 percent in the U.S. having a 401(k) account and 48 percent having a 403(b) plan.
• In Canada, defined benefit pension plans (34 percent) and Group Retirement Savings Plan (34 percent) are the most common.
Other BenefitsIn the U.S., 54 percent of the employers of surveyed AFP members offered flexible spending accounts for childcare or healthcare or both. In Canada, such accounts were offered at 31 percent of the employers of surveyed members.
Fairly common pre-tax benefits included professional dues (80 percent U.S. and 83 percent Canada); group life insurance (70 percent U.S. and 70 percent Canada), long-term disability (70 percent U.S. and 73 percent Canada); short-term disability (71 percent U.S. and 63 percent Canada); and cell phone or cell phone plan allowance (49 percent U.S. and 72 percent Canada).
Conclusion to Study HighlightsPrior to the pandemic and resulting economic crisis, fundraisers in the U.S. and Canada reported an increase in average compensation and expansion of benefits at levels comparable to – and even slightly above – prior years.
By the end of 2020, after considering layoffs, furloughs (unpaid days), and job changes, total compensation was back to 2019 levels, erasing any gains seen early in 2020. However, the results were not evenly distributed, as more reported declines in pay averaging nearly $21,000 than reported increases averaging just under $8,000. Two-thirds reported no change in compensation during 2020.
A majority of fundraisers hoped for increased compensation in 2021 and a return to near-normal staffing levels, or even more full-time equivalents (FTE) in their organizations working on fundraising. High majorities (75 percent or so) plan to remain in fundraising for 2021 and beyond, although in the U.S., people of color are slightly more likely than “white only” to indicate a desire to leave the profession – either seeking work in a different field or retiring earlier than previously anticipated.

8 | ©2021 AFP Compensation & Benefits Report
Section 1: COVID-19 and CompensationThe global pandemic began in March 2020 and continued to affect revenue at nonprofit organizations into 2021. This study asked participants for their salary as of March 1, 2020 and again for their salary as of December 31, 2020. It also asked participants to report whether their organization received Payroll Protection Plan funding from the U.S. government, and about changes in benefits, if any, and changes in full-time equivalents (FTE) in their fundraising team. People who had been laid off during 2020 and who had not returned to work in fundraising by year-end were offered an option to take a slightly different version of the survey.
Summary of Findings Related to COVID-19The Payroll Protection Plan in the U.S. appears to have been utilized by a high majority of organizations represented in the response group, with nearly all of the organizations receiving PPP funding having already fulfilled terms for forgiveness (as of early 2021).
Even with PPP in the U.S., salaries changed for about one-third of survey participants. Slightly more people saw a decline in wages than saw an increase. Averaged out across both increases and decreases, salaries declined on average by 3 percent in the U.S. and by less than 2 percent in Canada. This average, though, conceals steep declines of more than $20,000 among the nearly 20 percent who lost income; and gains in the range of $5,000 to $10,000 among those who saw an increase in earnings.
The most frequent change in benefits reported by study participants was an increase in health insurance premiums to be paid by employees. This was more frequent at the largest employers, both in the U.S. and Canada.
In the near-term, for 2021, nearly 8 in 10 of survey participants hoped to remain employed where they were at the beginning of the year. About 10 percent intended to seek employment outside of fundraising within the year.
After 2021, about three-quarters of survey participants intended to continue in their careers. However, the balance was roughly evenly split between retiring/leaving fundraising earlier than they had originally intended or staying longer in the profession.

9 | ©2021 AFP Compensation & Benefits Report
Payroll Protection Plan — U.S.The smallest organizations, those with an annual budget of less than $500,000, and the very largest (budgets over $10 million) were less likely to have received funding through the Payroll Protection Plan. In organizations with budgets of $500,000 up to $99.9 million, a high majority received PPP funding. Among the very largest organizations, those with budgets of $100 million or more, one-third received PPP funding.
Figure 1: Status of PPP funding at your employer organization, 2020 — U.S.
n = 2,092
12%
Received PPP Funding
No Yes
27% 18% 13%25%
67%
33%
73% 82% 87% 88%75%
6% 6% 4% 5% 0%3%
43% 43%45% 47% 55%
17%
48% 53% 48% 42%
83%
51%
<$500,000 $500k-$999k $1M-$2.9M $3M-$9.9M $10M-$99.9M $100M+
Of those with PPP, Amount ForgivenAs of March 1, 2021 (n=1,121)
Yes Pending Not Yet
Operating Budget Range of Employer
Among those with PPP funding in the U.S., around half had obtained loan forgiveness as of February 2021, with more of the largest organizations (83 percent) completing the requirements. A very small percentage had not yet made arrangements to qualify.

10 | ©2021 AFP Compensation & Benefits Report
Actual Changes in Employment and CompensationThis study asked participants about their pre-COVID-19 salary and their earnings from work by year-end. It also asked about employment in fundraising in three different ways: for the individual; a report of the actual number of people laid off; and a request for the number of fundraising professionals at the individual’s employer at two points in time. The approaches yield nearly identical results: complete layoffs were somewhat uncommon.
Employment The Payroll Protection Plan was intended to prevent extensive layoffs. However, with revenue affected from fees for service, government contracts, and funds raised, some organizations still reduced their staff or furloughed staff. Another portion of individuals accepted lower wages in order to remain employed.
Among fundraisers in this study,
• Three percent reported a layoff in 2020;
• Five percent reported furlough days; and
• Ten percent reported they accepted a lower wage in 2020 in order to remain employed.
Among 3,315 U.S. responses, 54 had been laid off and not rehired in fundraising. This is less than 2 percent. In Canada, nine of 550 selected that option at the beginning of the survey, which is also less than 2 percent.
We asked the question another way, as well, by requesting participants to enter the number of FTEs in fundraising laid off in their organization. In both countries about eight in 10 participants said no one. For those who entered values, the change in the number of FTEs was calculated as a percentage of the number employed in fundraising in March. Only about 5 percent of organizations laid off or furloughed 75 percent or more of their fundraising staff. Another 5 percent laid off or furloughed between one-quarter and one-half of the FTEs.
Table 2: Percentage of fundraising FTEs furloughed or laid off between March and
December
Based on # of FTEs in March
Percentage of March FTEs laid off or furloughedUS (n=2,196) Canada (n=372)
n= % n= %
None, 0% 1,781 81.1% 289 77.7%
0.1%-9.9% 32 1.5% 12 3.2%
10%-24.9% 95 4.3% 25 6.7%
25%-49.9% 114 5.2% 17 4.6%
50%-74.9% 63 2.9% 12 3.2%
75% or more 111 5.1% 17 4.6%
This finding is supported by the results when comparing the number of FTEs in fundraising as of March with the number employed at the end of the year. There is very little change between the two periods.

11 | ©2021 AFP Compensation & Benefits Report
Salaries — U.S.Overall, when averaging all responses, salaries changed little between March 1, 2020 and December 31, 2020; dropping an average of 3 percent. The overall change in the average salary was a drop of $2,292, but this average takes into account INCREASES in earnings reported, as well.
Drops in salaries were unevenly distributed. Among all responses in the U.S., 18.5 percent reported a decline in earnings during 2020. In addition to these declines, growth in earnings were report by 14.9 percent of study participants.
People working in arts organizations were much more likely to see a drop (reported by 35 percent) than those in any other type of organization.
Figure 3: Changes in earnings by subsector, March 1, 2020 to December 31, 2020 —
U.S
25%
25%
29%
30%
0% 40%20% 60% 80% 100%
40% 13% 29%
39% 12%
38%
37% 15% 24%
19%
14% 23%December, Canada
March, Canada
December, U.S.
March, U.S.
<2 2-5 6-10 11+
Figure 2: Percentage of employers by number of fundraising FTEs, 2020
U.S. (n=2,196); Canada (n=372)
“Civil Society” includes community and economic development, human rights, civil rights, and voting rights. “Fundraising” includes Donor-Advised Funds and organizations such as United Way.
19% 19%
11%
65%
21%
13%
68%
15%
23%
62%
20%
14%
68%
15% 12%
67%
15% 15%
14%
75%
35%
53%
18%
19%
65%
9%
15%
69%
12%
69%
Total
n=2,373
Animals
n=72
Arts
n=304
Civil Society
n=173
Education
n=570
Environment
n=113
Fundraising
n=72
Health
n=353
Human
Services
n=680
Religion
n=74
Decrease No Change Increase

12 | ©2021 AFP Compensation & Benefits Report
On average, when someone’s salary declined, the difference was a drop of $20,769 from March to December. This includes declines because of furloughs, reduced wages, and people who were laid off and found new work in fundraising at a lower salary. Across subsectors, the drop in earnings (before any workers’ compensation benefits) averaged between $13,500 (civil society and environment) and $26,400 (education).
Salary increases were, on average, of smaller magnitude than the drops, averaging $7,885. Two subsectors saw an average increase above $10,000: health at $10,053 on average where salaries did increase (reported by 18 percent of health respondents) and fundraising entities, where increasing salaries rose by an average of $18,145 (reported by 15 percent of respondents in that subsector).
Figure 4: Average salary increase and average salary decrease by subsector, between
March 1 and December 31, 2020 — U.S.
Excludes salaries where there was no change.
Tota
ln=
2,37
3
$7,885
-$20,769 -$21,794 -$20,177
-$13,509
-$26,392
-$13,521-$18,464 -$19,071
-$23,383
-$14,378
$4,457$5,640 $5,491 $5,862 $6,725
$18,145
$10,053$7,051
$9,817
Relig
ion
n=74
Civ
il So
ciet
yn=
173
Fund
rais
ing
n=72
Anim
als
n=72
Educ
atio
nn=
570
Hea
lth
n=35
3
Arts
n=30
4
Envi
ronm
ent
n=72
Hum
an S
ervi
ces
n=68
0
Average Increase Average Decrease
Benefits — U.S.A small minority (10 percent) of participants reported that retirement plan offerings changed in 2020. At 8 percent of employers, the retirement plan (a 401(k) or 403(b) plan) continued but with reduced contributions in 2020. One percent of employers stopped making contributions entirely in 2020.
The survey did not ask about changes mid-2020 in healthcare benefits or other benefits.
Salaries — CanadaChanges in salaries among fundraisers in Canada between March and December 31 were very small, with a net average loss of 1.6 percent, or just over $1,000 less by year-end. As in the U.S., some study participants reported a decline in earnings, a high majority reported no change, and about one in six reported growth in earnings (14.1 percent).

13 | ©2021 AFP Compensation & Benefits Report
26%
13%
61%
25%
10%
65%
67%
67%
67%
18%
69%
13%
14%
70%
16%
Figure 5: Changes in earnings by subsector, March 1, 2020 to December 31, 2020 –
Canada
Excludes subsectors with fewer than 20 responses.
Across subsectors, average increases, where people reported earning more than year-end, were in the range of $2,500 to $5,000 except for health, where the average increase was more than $21,000 more by year-end.
Figure 6: Average salary increase and average salary decrease by subsector, between
March 1 and December 31, 2020 — Canada
Excludes salaries where there was no change and subsectors with fewer than 30 responses.
Total
n=404
Animals or
Environment
n=23
Arts
n=40
Education
n=81
Health
n=114
Human Services
n=78
Decrease No Change Increase
9%
79%
12%
Tota
ln=
2,37
3
Anim
als
or
Envi
ronm
ent
n=23
Arts
n=40
Educ
atio
n n=
81
Hea
lthn=
114
Hum
an S
ervi
ces
n=78
$2,917$4,457
$2,206$5,727
$21,076
$5,231
Average Increase Average Decrease
-$14,780
-$21,794
-$16,542-$12,786
-$9,617
-$20,120
Benefits — CanadaThe survey did not ask about changes mid-2020 in benefits in Canadian organizations.

14 | ©2021 AFP Compensation & Benefits Report
There were no statistically significant differences in expectations by ethnicity or race in either country. Between 50 and 60 percent anticipated an increase among both groupings of race used (white/Caucasian/European ancestry and what has been called BIPOC and visible minorities). Around 40 percent anticipated no change, and four to six percent projected a decrease in earnings.
Employee Cost of Health Insurance Likely to RiseParticipants were asked what benefits were PLANNED to be cut in 2021. In more than three-quarters of organizations, no benefits were known to be cut at U.S. participating organizations. However, among organizations with budgets of $3 million or more, about one in five were likely to be increasing employee contributions to health insurance.
Table 4: Share of employers by planned cuts to benefits in 2021 as reported early 2021
— U.S.
U.S. Canada
Men n=416
Women n=1,868
Men n=71
Women n=330
Increase 60% 53% 59% 52%
No Change 36% 42% 37% 42%
Decrease 4% 5% 4% 6%
Expected Changes in 2021
Fundraisers Remain Optimistic Salaries Will RiseSixty percent of men and just over half of women surveyed anticipated their salary as fundraising professionals will increase in 2021. While visibly different, these are not different with statistical significance. Around four in 10 anticipate no change.
Table 3: Direction of change anticipated for salary in 2021
Total $100M+$10M-
$99.9M$3M- $9.9M
$1M- $2.9M
$500,000-$999,999
<$500,000
n=1,792 n=118 n=438 n=401 n=425 n=195 n=215
None 78% 64% 72% 78% 84% 83% 86%
Increased health insurance premiums
15% 21% 20% 17% 11% 13% 12%
Eliminated or reduced other benefits
5% 9% 6% 4% 5% 7% 3%
Reduced contribution for retirement
4% 11% 6% 4% 4% 1% 2%
Eliminated other insurance plans
1% 1% 1% 1% 0% 1% 0%
15 | ©2021 AFP Compensation & Benefits Report
Total $100M+$10M-
$99.9M$3M- $9.9M
$1M- $2.9M
$500,000-$999,999
<$500,000
n=263 n=20 n=64 n=57 n=52 n=33 n=37
None 88% 55% 92% 88% 87% 97% 95%
Increased health insurance premiums
9% 40% 6% 9% 10% 3% 3%
Eliminated or reduced other benefits
3% 15% 2% 2% 4% 0% 0%
Reduced contribution for retirement
3% 5% 2% 5% 4% 0% 3%
Eliminated other insurance plans
2% 10% 3% 0% 2% 0% 0%
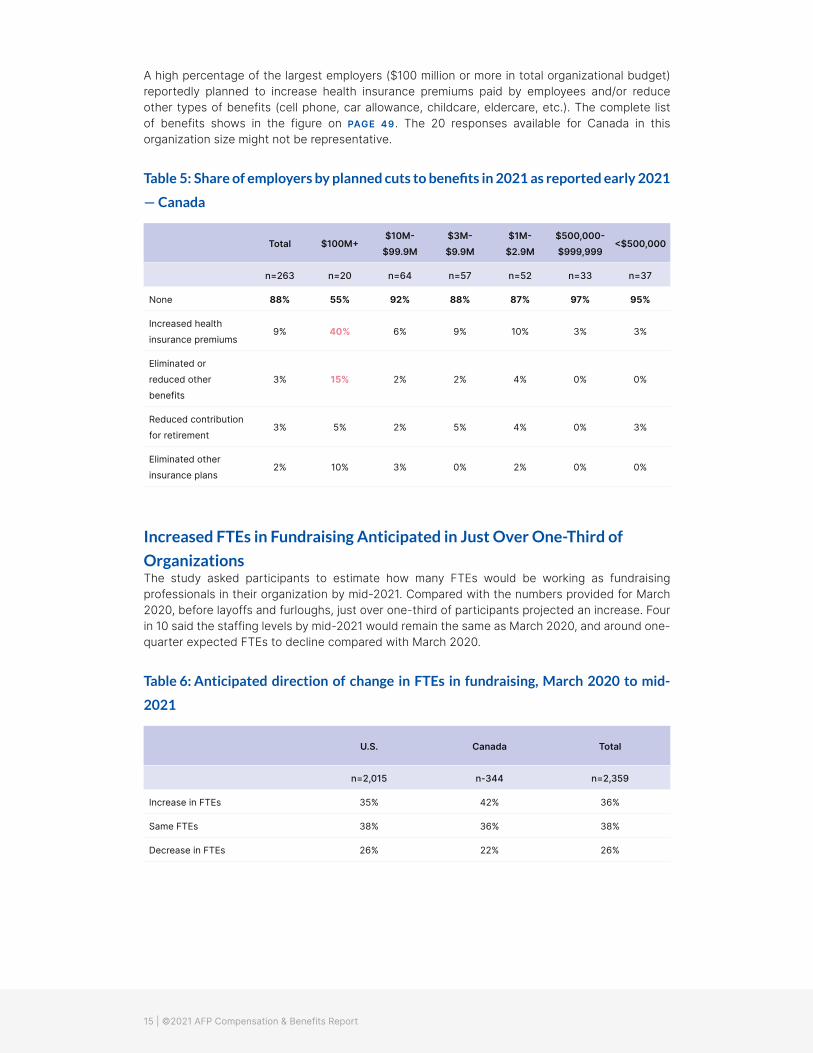
A high percentage of the largest employers ($100 million or more in total organizational budget) reportedly planned to increase health insurance premiums paid by employees and/or reduce other types of benefits (cell phone, car allowance, childcare, eldercare, etc.). The complete list of benefits shows in the figure on PAGE 49. The 20 responses available for Canada in this organization size might not be representative.
Table 5: Share of employers by planned cuts to benefits in 2021 as reported early 2021
— Canada
Increased FTEs in Fundraising Anticipated in Just Over One-Third of
OrganizationsThe study asked participants to estimate how many FTEs would be working as fundraising professionals in their organization by mid-2021. Compared with the numbers provided for March 2020, before layoffs and furloughs, just over one-third of participants projected an increase. Four in 10 said the staffing levels by mid-2021 would remain the same as March 2020, and around one-quarter expected FTEs to decline compared with March 2020.
Table 6: Anticipated direction of change in FTEs in fundraising, March 2020 to mid-
2021
U.S. Canada Total
n=2,015 n-344 n=2,359
Increase in FTEs 35% 42% 36%
Same FTEs 38% 36% 38%
Decrease in FTEs 26% 22% 26%

16 | ©2021 AFP Compensation & Benefits Report
U.S. (n=2,375) Canada (n=416*)
Men n=425
Women n=1,924
Another Gender n=26
Men n=75
Women n=341
Remain where I work now 86% 84% 88% 91% 83%
Look for new work in fundraising sometime in 2021
23% 21% 23% 28% 25%
Look for new work in a different field in 2021
11% 13% 23% 11% 12%
None of the above 2% 2% 0% 3% 1%
* Another gender in Canada, n = 4, results not shown. All reported intending to remain where they are now.
Fundraising Professionals’ Career PlansWhen unexpected events occur, people often change their plans for the future. In order to help inform nonprofit organizations about potential “pipeline” gaps in fundraising, this study asked people about their intentions for 2021, and then for beyond 2021.
In 2021, around 10 percent of respondents indicated they might be looking for work in a different field; 20 to 25 percent intend to look for a different job but remain in fundriasing; and 83 to 91 percent hope to remain where they worked as of early 2021.
Table 7: 2021 Employment plans by gender
Excludes don’t know/no response and responses for gender with fewer than 30 people in the cell. People could select more than one response.
The analysis shows statistically significant differences in employment intentions in 2021 between people who identify as what is called BIPOC by some in the U.S. Fewer people of color intend to remain where they work now. This difference is not found in Canada.
Table 8: 2021 Employment intentions by race/ethnicity — U.S. and Canada
U.S. Canada
White n = 1,999
BIPOCn=322
Whiten=290
Visible Minorityn=59
Remain where I work now 85% 76% 85% 83%
Look for new work in fundraising sometime in 2021
20% 32% 27% 25%
Look for new work in a different field in 2021
12% 18% 12% 14%
None of the above 2% 2% 1% 5%
Red font indicates a value that is lower with statistical significance from the others in the row. Green highlight indicates value that is higher,
with statistical significance, from others in the row.
Beyond 2021, people are roughly equally split between working longer than envisioned or retiring earlier. There appear to be slightly higher values in the cells, but at these sample sizes, the results are not statistically significantly different between men and women or between U.S. and Canadian respondents.

17 | ©2021 AFP Compensation & Benefits Report
By race or ethnic heritage, again about three-quarters of those who responded plan neither earlier nor later change from fundraising. A very slightly higher share of people of color intend to end work as fundraisers sooner than they might otherwise have intended, given the events of 2020. The difference does not reach the level of statistical significance, but it is consistent in the two countries and with earlier findings about leaving fundraising in 2021. This has potential implications for diversity, equity, inclusion, and access within nonprofit organizations and in fundraising specifically.
Table 10: Career plans beyond 2021 by ethnicity or race — U.S. and Canada
U.S. Canada
Menn=425
Womenn=1,919
Another Gendern=27
Menn=73
Womenn=339
Shift long-term plans to work longer 15% 10% 19% 19% 11%
Shift long-term plans to end work as a fundraiser sooner than previously planned
9% 14% 7% 10% 12%
Neither of the above 76% 76% 74% 71% 77%
Table 9: Career plans, beyond 2021 by gender – U.S. and Canada
One response allowed.
U.S. Canada
White n = 1,997
BIPOCn=322
Whiten=286
Visible Minorityn=59
Shift long-term plans to work longer 10% 14% 14% 12%
Shift long-term plans to end work as a fundraiser sooner than previously planned
13% 14% 10% 17%
Neither of the above 77% 72% 76% 71%

18 | ©2021 AFP Compensation & Benefits Report
Section 2: Who Are Fundraisers?Women Predominate in AFP and in Survey
ParticipationMembership statistics at the time of the survey show that approximately 69 percent of AFP members who answer the question are women and 22 percent are men. Nine percent do not respond. Among survey participants, a much higher percentage were women at 81 percent; 18 percent were men; and approximately one percent selected another option.
Fewer Than 15 Percent of Fundraisers Identify as
Black, Indigenous, Asian, Hispanic, or a “Person of
Color”Approximately 86 percent of AFP members who report their ethnic heritage or racial background on their membership materials are white. Among survey participants who provided information about their primary ethnicity or race, 84 percent indicated they are white/non-Hispanic, and 14.2 percent selected another option offered. The balance did not select a racial or ethnic heritage.
Demographics by ResponsibilitiesThe largest share of survey participants are chief development officers—40 percent in the U.S. and 22 percent in Canada. The survey also included fundraising officers (major gifts, planned giving, etc.) at 14 percent in the U.S. and 23 percent in Canada; and fundraising program managers (annual fund, for example) at 11 percent in the U.S. and 18 percent in Canada. Agency CEO or executive directors were 15 percent of the U.S. respondents and 17 percent of those from Canada.
A very high percentage of participants—42 percent in the U.S. and 43 percent in Canada—do not supervise or manage any other staff member. Just over one-quarter of U.S. participants (26 percent) manage three or more colleagues. In Canada, 29 percent do.
Demographics by Experience and TrainingThe average U.S. participant has worked for 3.4 employers as a fundraiser. In Canada, the average is nearly the same, at 3.5. In the U.S., study participants averaged 5.4 years at their current employer, and 6.7 years is the average for the longest time at any employer. In Canada, average time at the current employer is 5.1 years, and the average for the longest time at any employer is 6.2 years.
Twenty-four percent of all U.S. participants and 32 percent of Canadians are Certified Fund Raising Executives.
The following pages show additional detail about fundraisers in the U.S. Results are similar for Canada. See TABLE 37 and following, beginning on PAGE 53 in APPENDIX 2 for more detail.

19 | ©2021 AFP Compensation & Benefits Report
Figure 7: 81% of study participants
identified as women
Figure 8: 47% have four-year degree and 43% have post-graduate diploma or
specialization
n=2,815
4%
1%
4%
2%
4%84%
White Only Another Option, as Share of Total
Multi-Racial/Multi-ethnic
Jewish (0.4%)
Hispanic / Latinx
Asian, Asian America
Middle East or Indian Subcontinent
First Nation / Indian / Native American / Alaskan Native (0.2%)
African Canadian / African American / Black / African
Note: Overall AFP membership is 69% women, 22% men, and 9% no response.
Women84%
Men18%
Other1%
Master’s Degree39%
Four-year Diploma/Bachelor’s Degree
47%Doctorate2%
Advanced Degree / Professional Degree 2%
Specialization, certification, post-graduate study2%
High School3%
Two-year Diploma/Associate Degree4%
Note: AFP Global data about membership do not include education level.
Figure 9: 84% identified as white only
n = 2,747

20 | ©2021 AFP Compensation & Benefits Report
Figure 10: Current average age is 45 with median at 46. Distribution is even from 25
through 64.
n = 2,805
Certification is More Common in Canada Than in the
U.S.In the U.S., a minority of professional fundraisers have been certified by any one of the certification bodies, and 58 percent said, “None of the above.” The certifications held include:
• < 1% ACFRE;
• 24% CFRE;
• 15% from a university-based program in fundraising or nonprofit management; and
• 9% from another program (Grant Professional Certified, FAHP, and others).
Certification is more common in Canada, with a majority reporting some degree of certification and 45 percent responding, “None of the above.”
• < 1% ACFRE;
• 32% CFRE;
• 16% from a university-based program; and
• 17% certification from another program.
Seeking Opportunity and Higher Pay Dominate Job
Seeker MotivesA lower share of survey participants thought about leaving their jobs in 2020 than in prior years: about half in 2020 compared with nearly two-thirds in prior years. Reasons for seeking other employment remain similar as in prior years.
Career goals are very important drivers of job search. Although a lower percentage in 2020 sought higher pay, that still remains one of the dominant reasons for considering another job. The work environment is important, especially the degree of support for fundraising. Personal goals such as work/life balance are comparatively uncommon reasons for considering a job chance.
In 2020, 26% of survey respondents were under age 36, compared with 20% in 2021. In 2020, the survey included a special section for
Young Professionals, defined as 35 and younger. Note: AFP Global data about membership do not include educational level.
Under age 25 25-34 35-44 45-54 55-64 65 or older
1%
19%24% 26% 24%
5%

21 | ©2021 AFP Compensation & Benefits Report
The top five reasons overall were:
• Seeking opportunities for career advancement, 61 percent;
• Higher pay, 59 percent;
• Frustrating work environment, 39 percent;
• Lack of support for fundraising in the organization, 30 percent; and
• Unrealistic employer expectations related to the job, 25 percent.
Across the rankings and percentages for this set of questions, there are no meaningful differences between the U.S. and Canada.
Figure 11: Reasons identified for thinking about changing jobs — U.S. and Canada
combined
Participants could select all that apply. n = 1,623 (those who identified they did think about changing jobs).
As a career move, seeking a path to advancement, more challenge, responsibility, or more opportunity to learn.
Career Goals
To earn a higher salary
61%
59%
Personal Goals
More time to spend on personal/family activities
My values and the organization’s are not the same
To obtain health, retirement, or leave benefits more suited to my (or my family’s) needs.
‘Because I plan to retire
To move closer to family members
11%
14%
9%
8%
7%
Work Environment
A frustrating or negative work environment, toxic culture, or conflicts with co-workers or management
A lack of support for fundraising or a lack of recognition for what fundraising professionals do
Because work expectations are unrealistic
Micro-aggressions, aggressions, or hostilities based on my age, gender, race, disability, or other characteristic
Because my position was or will be terminated
My salary was negatively affected by my gender, race or ethnic identity, age, or other bias
11%
6%
4%
39%
30%
25%

22 | ©2021 AFP Compensation & Benefits Report
Section 3: Where do Fundraisers Work?Nearly three-quarters (73 percent) of AFP members in this study work in:
• Human Services (30 percent);
• Education (24 percent); and
• Health (19 percent).
Among the other 27 percent, the largest number are in Arts/Culture (13 percent of the total). Study participants from other types of organizations were 5 percent or fewer of the total; Environment/Wildlife at 5 percent; Community and Economic Development at 4 percent; Fundraising and Grantmaking or Allocations at 4 percent; and 3 percent at each of these types of organizations—Animals/Animal Welfare and Religion. All other organizational types constituted 1 or 2 percent of the total each).
More data about the organizations where fundraisers work appears in APPENDIX 3 beginning with TABLE 41.
Leadership at the Board LevelStudies of for-profit companies have found that pay scales, commitment to diversity and equity, and even shareholder returns are higher when a higher percentage of board members are women. As part of AFP’s commitment to inclusion, diversity, equity, and access for all fundraising professionals, the Compensation and Benefits Study asks members about leadership within their organizations, at the board level, and about their supervisors.
About Four in 10 Organizations Have at Least 50 Percent Women on the
BoardAs part of AFP’s commitment to inclusion, diversity, equity, and access, this year’s survey is the third to ask about board membership of nonprofit organizations. Over time, as more data are collected, analysis will be possible to assess whether gender composition of boards is aligned in any way with compensation by gender.
For 2020, both 43 percent of U.S. organizations and 43 percent of Canadian said their board was 50 percent or more women. These results are slightly higher than for prior years, when just under 40 percent reported at least half of board members were women.
Table 11: What percentage of your organization’s board identifies as female?
US (n=2,282) Canada (n=373)
n= % n= %
Less than 10% 48 2% 1 0%
10%-24.9% 253 11% 32 9%
25%-49.9% 1,002 44% 178 48%
50%-74.9% 794 35% 139 37%
75% or more 185 8% 23 6%

23 | ©2021 AFP Compensation & Benefits Report
Around One-Third of Organizations Have 25 Percent or More of Board
Members From Under-Represented GroupsThis is the first wave of the AFP Compensation and Benefit Study to ask about “minority or underrepresented groups” on the board of trustees of the participant’s employer organization. In the U.S., 40 percent of the population identifies as Hispanic (including white Hispanic), Asian, Black, Indigenous, Native Alaskan, Native Hawaiian, or Pacific Islander. In Canada, 22 percent of the population in 2016 was a “visible minority.”
The study question asked for the number of people on the governing board, then for the number who identify as a “member of a minority or from a group considered under-represented in leadership positions.” Note that under-representation was left to the survey participant to define. Using the responses, 33 percent of U.S.-based organizations report having one-quarter or more of their board members from minority or under-represented groups, and 29 percent in Canada do.
Table 12: What percentage of your organization’s board identifies as a member of a
minority or from a group under-represented in leadership positions?
US (n=2,064) Canada (n=321)
n= % n= %
Less than 10% 619 30% 122 38%
10%-24.9% 765 37% 106 33%
25%-49.9% 490 24% 69 22%
50%-74.9% 141 7% 16 5%
75% or more 49 2% 8 2%
In U.S., Organizations Founded for Empowering Under-
Represented Groups No More Likely to Include Board
Members From Under-Represented GroupsA total of 588 U.S. participants identified their organization as having a “principal mission to serve or empower people who are considered under-represented in positions of authority and power” and 1,888 said that was not a principal mission. There was no discernable relationship between the percentage of board members who were from under-represented groups and the organization’s mission related to under-represented groups.
In Canada, 68 participants indicated that their organization has a principal mission to serve or empower people who are considered under-represented in positions of authority or power. Another 363 said that was not a principal mission. There is a weak correlation (0.19) between the percentage of the board that is from under-represented groups and the mission of the organization being related to under-represented people.
This is the first year we have looked at this question. As more data are collected over time, AFP will be able to investigate further the extent to which board composition by race or ethnic heritage or other areas of under-representation might intertwine with board membership, salary, and benefits.

24 | ©2021 AFP Compensation & Benefits Report
Supervisors in FundraisingThe 2020 wave of the study asked, for the third time, about the gender of an individual participant’s supervisor, in an effort to build a dataset to evaluate the interactions between manager and staff and compensation, if any.
The distribution found for 2020 is very similar to the results for 2019 and 2018, with a plurality of U.S. participants reporting to a woman (45 percent); about a third in the U.S. (and 20 percent in Canada) reporting to a man; and others reporting to multiple individuals or to the board as a whole (16 percent in the U.S. and 18 percent in Canada) or to no one at all as a self-employed consultant (3 to 4 percent).
Table 13: To whom do you report?
US (n=2,064) Canada (n=321)
n= % n= %
A supervisor who does not identify within the binary gender system 13 1% 1 0%
A supervisor who identifies as female 1,176 45% 234 52%
A supervisor who identifies as male 784 30% 102 23%
Does not apply. Self-employed consultant or a principal in the firm 101 4% 14 3%
More than one individual on staff 97 4% 21 5%
The board 425 16% 81 18%
Size of Fundraising Staff and Volunteer Ratios Many employers and fundraising team members are interested in the size of a team needed to raise funds. This is the first Compensation and Benefits Study to look at staffing ratios based on the amount raised.
Most Organizations Have Two to Three Fundraising Professionals for Each
$1 Million RaisedSurvey participants provided information about the number of FTE fundraising professionals in their organization and about the range of the amount raised. When examined by main mission of the organization, most types of entities have two to three fundraising professional FTEs for each $1 million raised. However, staffing is discernably lower for international aid and development groups, ranging from 0.7 to 1.7 FTEs per $1 million raised. (There were just 28 international groups in this analysis, so results should be used with caution.) By contrast, arts, culture and humanities groups, and environmental groups each have slightly higher staffing patterns, up to 4.5 FTEs per $1 million raised.

25 | ©2021 AFP Compensation & Benefits Report
Figure 12: Low, median, and high fundraising staff per $1 million raised by
organizational mission — U.S.*
5.0
2.0
4.0
1.0
3.0
0.0
4.5
1.5
3.5
0.5
2.5
3.8
2.5
3.2
4.5
3.8
4.4
3.9
3.0
1.7 1.7 1.7
1.00.7
2.5
2.8 2.8
3.2
2.0
1.4
3.9
2.2
1.2
1.9
2.5
1.6
3.0
1.92.0
1.41.6
All
n=21
80
Educ
atio
nn=
537
Anim
aln=
65
Envi
ronm
ent
n-11
3
Art
n=27
1
Fund
rais
ing
n=70
Hea
lthn=
360
Hum
an S
ervi
ces
n=66
9
Inte
rnat
iona
ln=
28
Relig
ion
n=73
Lowest # of FR staff, mean Highest # of FR staff, meanMedian for Lowest #
* This analysis separates the ranges for the amounts raised, instead of using the midpoint. The number of staff people is divided first by
the bottom of the range, say $1 million, and again by the top of the range, say $2.99 million. Dividing by the lowest number in the amount
raised will yield the highest number of fundraising staff per $1 million (green boxes in the graph). Using the highest end of the range yields
a smaller number of FTE per $1 million raised (blue triangles). The median is calculated for this value, as another way to consider a middle
value.

26 | ©2021 AFP Compensation & Benefits Report
In Canada, the ranges of fundraising staff to raise $1 million are similar to those in the U.S., from just over one full-time equivalent up slightly more than four. However, the mid-point (median) for each subsector is lower, closer to one than to two, except for education.
Figure 13: Low, median, and high fundraising staff per $1 million raised by
organizational mission — Canada.*
5.0
2.0
4.0
1.0
3.0
0.0
4.5
1.5
3.5
0.5
2.5
3.9
1.0 1.01.2
4.4
3.9
4.5
3.2
1.4 1.41.1
1.5
1.2
4.1
2.6
3.5
0.7
0.4
1.1 1.1
3.8
1.0
1.5
2.0
1.61.4
1.9
0.50.5
1.5
1.6
3.4
1.0
All
n=21
80
Com
mun
ityn=
21
Anim
als
n=65
Educ
atio
nn=
86
Arts
n=27
1
Envi
ronm
ent
n=13
Fund
rais
ing
n=26
Hea
lthn=
111
Hum
an S
ervi
ces
n=77
Inte
rnat
iona
ln=
13
Relig
ion
n=8
Lowest # of FR staff, mean Highest # of FR staff, meanMedian for Lowest #
* This analysis separates the ranges for the amounts raised, instead of using the midpoint. The number of staff people is divided first by
the bottom of the range -- say $1 million and again by the top of the range, say $2.99 million. Dividing by the lowest number in the amount
raised will yield the highest number of fundraising staff per $1 million (green boxes in the graph). Using the highest end of the range yields
a smaller number of FTE per $1 million raised (blue triangles). The median is calculated for this value, as another way to consider a middle
value.
Volunteer EngagementFundraising engages volunteers, as well as paid staff. We asked about the number of volunteers who assist with fundraising. Entries ranged from zero to more than 5,000. To facilitate comparison, we removed 24 organizations that reported 1,000 or more volunteers. With that adjustment, the average number of volunteers increases at a fairly consistent rate as the amount raised increases. We do not have enough information here to conclude that engaging more volunteers causes increased amounts raised, only that the two are associated.
The values here are similar with those from 2019 except in the largest organizations, where there was a 62 percent decline in the reported average number of volunteers in the U.S. (from 136 in 2019 to 51 in 2020).

27 | ©2021 AFP Compensation & Benefits Report
Figure 14: Average number of volunteers* assisting with fundraising by amount
raised (includes board members) — U.S. and Canada combined
U.S. (n=2,345); Canada (n=415)
18 15
$100,000-
$249,000
11 5
Less than
$100,000
118
<1
30 29
4 - <5
6045
8 - <9
2112
2 - <3
44
21
6 - <7
21
84
10 - <11
16 10
1 - <2
19
58
5 - <6
38
101
9 - <10
3112
3 - <4
27
50
7 - <8
2031
11 - <12
37
43
12+
14 10
$250,000-
$499,000
2131
$500,000-
$999,000
2712
$1M -
$2.99M
33 41
$3M -
$9.99M
50
29
$10M -
$99.99M
51
101
$100M+
U.S.
U.S.
Amount Raised
# FTE Fundraising Professionals
*Excludes data for 24 respondents who reported 1,000 or more volunteers. This group averaged 4,788 volunteers.
*Excludes 85 groups raising $10 million or more and reporting 1,000 or more volunteers. This group averaged 2,850 volunteers.
Canada
Canada
Fundraising volunteer numbers tend to rise with availability of staff to work with them. On average, small fundraising staffs, with less than one full-time equivalent, have fewer volunteers. The Canadian data available for staff sizes larger than six recorded fewer than 30 responses in each size cluster, so results should be used with caution from the middle of the graph to the right.
Figure 15: Average number of volunteers assisting with fundraising by number of
fundraising FTEs — U.S. and Canada
U.S. (n=2,345); Canada (n=415)

28 | ©2021 AFP Compensation & Benefits Report
Section 4: Fundraiser’s CompensationThis section examines type of organization, gender, years of experience, and level of education on salary levels in fundraising. Data tables are in APPENDIX 4 for the U.S. and APPENDIX 5 for Canada.
Section 4.a: Overview of CompensationThe survey reached fundraising professionals at all career stages and at many different sizes and types of organizations. Overall, in the U.S., fundraising professionals who worked 30 hours a week or more as of March 1, 2020 earned a mean of $88,412. The mid-point (median) of the salary range was $75,000. In Canada, average compensation was $90,804 with a mid-point of $78,000.
Figure 16: Share of study participants in each of five salary ranges, as of March 1,
2020 — U.S. and Canada
15%11%
<$50,000
U.S. (n=377)
Canada (n=48)
24% 23%
$75,000 - $99,999
U.S. (n=586)
Canada (n=99)
32% 33%
$50,000 - $74,999
U.S. (n=787)
Canada (n=141)
21% 21%
$100,000 - $149,999
U.S. (n=514)
Canada (n=87)
9% 11%
$150,000+
U.S. (n=223)
Canada (n=48)
U.S. CanadaMean = $88,412 Mean = $90,511Median = $75,000 Median = $78,000
The 4 percent increase in average U.S.-based salaries as of March 1, 2020 was statistically significant compared with 2019 results. In addition, the change in the mean in Canada, an increase of 4.2 percent, is also statistically significant.

29 | ©2021 AFP Compensation & Benefits Report
Table 14: Changes in mean and median salaries, 2019 to 2020, as of March 1, 2020 —
U.S. and Canada, all participants
U.S. Canada
2019 2020 Change 2019 202 Change
Mean $85,060 $88,421 4.0% $86,876 $90,511 4.2%
Median $74,000 $75,000 1.4% $80,000 $78,000 -2.5%
U.S. Canada
2019 2020 Change 2019 2020 Change
Mean $76,920 $79,590 3.5% $80,677 $82,850 2.7%
Median $72,000 $75,000 4.2% $78,000 $75,000 -3.8%
Analysts also considered that the top highest paid fundraising professionals can skew the results. To adjust for this, the mean and median were recalculated, leaving out the top 5 percent of earners in this study. In the U.S., the rates of change when excluding the top 5 percent of salaries was 3.4 percent for the mean and 4.2 percent for the median. These changes reflect increases in inflation-adjusted dollars compared with the prior year, at least through March 1, 2020. Canadian fundraising professionals, excluding the top 5 percent, saw a 3 percent increase in the mean salary and drop in the median. See TABLE 15.
Table 15: Changes in mean and median salaries, 2019 to 2020, as of March 1, 2020 —
U.S. and Canada, excluding top 5%
Even with meaningful change in earnings before the COVID-19 crisis, only some people benefitted. A very high percentage of professional fundraisers saw no change in their 2020 wages even before the crisis.
Figure 17: Half saw no change in salary from the end of 2019 to March 2020.
U.S. n = 2,505; Canada n = 436. Note that U.S. inflation in 2020 was 1.4%, while inflation in Canada in 2020 was 2.3%.
6%4% 1% 1% 2% 2% 2% 3%<1% <1% 2%
Down
10% or more
47%53%
No ChangeDown
4-6%
8% 7%
Up
4-6%
Down
7-9%
27% 25%
Up
1-3%
Down
1-3%
Up
7-9%
5%
Up
10% or more
U.S. CanadaMedian = No Change Median = No Change

30 | ©2021 AFP Compensation & Benefits Report
As noted, 18 percent reported a drop in earnings in 2020 due to any combination of the following: layoff, accepting a lower salary at a new employer, furlough, or accepting a lower salary from the current employer in order to maintain employment. The results of these changes are reported beginning on PAGE 8.
Determining Initial CompensationNegotiating compensation at the time of hire is especially important for fundraisers, as that baseline becomes a reference point within that organization and in future employment.
Six in 10 Feel Confident They Negotiated EffectivelyIn the U.S., 63 percent felt they negotiated effectively for their current salary. This is comparable to results in 2017, 2018, and 2019. In Canada, 58 percent share that perception, also comparable with prior years.
Table 16: Majority* feel that they negotiated effectively for current salary
Did you negotiate effectively for your current position salary?
US (n=2,479) Canada (n=430)
n= % n= %
Yes 1,566 63% 248 58%
No 913 37% 182 42%
*Excludes non-responses.
About One-Third Say Compensation Is Tied to Fundraising PerformanceAbout 39 percent of U.S. participants and 34 percent of Canadians agreed that their organizations “explicitly state that achieving determined performance goals will be a factor in determining a pay raise.” These are slight increases over 2019, although that year reflected a decline from high levels, so the result for 2020 might be a “return to typical” expectations.
Four in 10 report that performance goals are NOT part of determining compensation. The share is 37 percent in the U.S. and 45 percent in Canada. In both countries, just over one in five are neutral on the topic.

31 | ©2021 AFP Compensation & Benefits Report
Section 4.b: Compensation by Fundraisers’
Characteristics — U.S.This section is based on salary data for participants from the U.S. using compensation reported as of March 1, 2020. We use this baseline for the tables in the Appendices as it is part of the on-going series of reports. While 18 percent of study participants reported a decline in salary by year-end, another 15 percent reported an increase. For long-term comparative purposes, these two roughly balance out.
All salary calculations are based on individuals who reported working 75 percent of the time or more (equal to 30 hours a week or more) and who were not self-employed consultants. The key points are:
• The mean (average) salary for all participants was $88,421. This is an increase of 4 percent compared with 2019, which is a statistically significant difference.
• The median (middle value) salary was $75,000. This is 1.4 percent higher than the median for 2019.
• The top 25 percent of participants earned more than $105,000 (the 75th percentile).
• The bottom 25 percent earned $56,000 or less, compared with a U.S. median household income of $68,703 for 2019.
Several Factors Affect CompensationAFP released a study in March 2019 based on five years of data about compensation in the U.S. That report used an analysis of interactions among variables and found that 10 percent of the gap between men’s and women’s pay was associated with gender alone. Other factors also tied to pay gaps were years of experience in the field and the size of the institution at which the AFP member worked.
This report focuses on differences in compensation in 2020 by individual characteristics. Rather than looking at interactions here, as was done in 2019, each factor is considered independently here—gender, race or ethnic heritage, education, experience, certification, and potential negative impacts—and each plays a more or less important role on its own. Additional factors related to institutional traits such as overall budget, location, and subsector (mission type) appear in SECTION 4.
Men Continue to Earn More, on Average — U.S.
The average salary of male fundraisers in this study was $103,175. Women were paid an average of $85,967, or 20 percent less than men. People who selected one of the other options for gender identity averaged a salary of $110,217, which is higher than for both men and women. The sample size for this group is 23, so this finding should be quoted with caution.
Table 17: Men have higher average compensation before considering hours worked,
education, experience, or institution budget
Gender Mean Median N
Women $85,967 $75,000 1,562
Men $103,175 $90,000 348
Other $110,217 $90,000 23

32 | ©2021 AFP Compensation & Benefits Report
Race/Ethnicity Category Mean Median N
Hispanic, BIPOC, Asian, Person of Color * $81,811 $72,500 275
Only white/Caucasian/European, and non-Hispanic $90,379 $78,000 1,618
Ethnic Heritage or Race Associated With Lower Compensation — U.S.Fifteen percent of study participants identified a race or ethnic heritage that was either Multi-racial or something other than “white/Caucasian only.” This includes Hispanic whites. The salary difference reported was 10 percent less for Hispanic, Asian, or Black, Indigenous, and People of Color (BIPOC). In 2019, with a slightly higher percentage of responses from BIPOC, Asian, and Hispanic individuals, earnings were the same as for people who marked “white only.”
Table 18: Average compensation by race or ethnic heritage — U.S.
Works 30+ hours per week and is not a self-employed consultant.
*Terms here might not be used by individuals in the study.
Education and Compensation — U.S.Education level and hours worked per week are both highly correlated with earnings. For full-time employees, there is a near-linear progression based on education, with each increment in additional schooling related to an increase in average compensation, with the exception of high school, where the average salary is $10,000 to $12,000 above the average for someone with an associate degree. This seems to be connected to years of experience.
Table 19: Compensation for part-time and full-time fundraising professionals by
education level — U.S
Highest Education
Worked <30 Hrs/Week n=427
Worked 30+ Hrs/Week n=1,588
Average n= Average n=
High school $63,018 11 $75,107 45
Associate degree $50,769 16 $64,374 41
Bachelor's degree $77,542 186 $85,211 935
Master's degree $82,027 186 $94,268 822
Doctorate $100,730 17 $101,995 35
Other advanced degree (JD, MD, DO, etc.) $105,000 4 $119,492 42
Professional or technical certification* $96,745 7 $77,025 12
* Examples offered in the survey included paralegal, master teacher, apprentice, or journeyman in a trade. Excludes self-employed
consultants. Averages for fewer than 30 participants should be used with caution.
Years of Experience and Compensation — U.S.Years as a professional fundraiser are strongly correlated with compensation, more strongly than longevity at this or other jobs or number of employers. The results using data collected in early 2020 are exactly the same as those collected in early 2019, which were nearly exactly the same as those from 2018. This indicates a very consistent relationship between experience (years in fundraising) and compensation.

33 | ©2021 AFP Compensation & Benefits Report
*An R-value of .10 is considered small; .30 moderate; and .50 large. Excludes nonresponses to any category. All of these are statistically
significant to p < .05. Note: All of these also correlate with each other.
Correlation coefficients with income
Years in fundraising
Age nowLongest
period at same employer
Years at current employer
Number of employers
Pearson R* 0.44 0.30 0.29 0.20 0.22
Strength of Correlation
Moderate - Large Moderate Small - Moderate Small Small
Table 20: Fundraising experience correlates with income, age, and employment tenure
Credentials and Compensation — U.S.The possession of a certification credential correlates positively with salary. In the U.S. sample, people who are Certified Fund Raising Executives (CFRE) reported average salaries between seven and 15 percent higher than their peers without this certification who had a comparable number of years of fundraising experience.
Table 21: CFRE holders earn more, on average, than peers with similar levels of
experience
Years of Experience
Hold CFRE (n=555) No CFRE (n=1,350)
Average Median n= Average Median n=
5 to 6 $86,822 $75,000 23 $65,039 $60,000 224
7 to 8 $88,040 $77,250 42 $71,031 $65,000 186
9 to 10 $88,397 $80,000 42 $80,177 $75,000 159
11 or more $116,320 $105,000 448 $100,607 $88,000 781
Excludes those not responding to the question about certification.
People with other credentials also reported higher average salaries than those with no certification and at least five years of work as a professional fundraiser.
Table 22: Certification is associated with higher income
Certification Average Median n=% Different than None
ACFRE $129,214 $120,000 14 47%
CFRE $110,845 $100,000 555 26%
University-based certification $94,874 $83,650 298 8%
Other $95,499 $88,000 195 9%
None and 5+ years as professional fundraiser $87,993 $76,000 971 –
Excludes those not responding to the certification question.

34 | ©2021 AFP Compensation & Benefits Report
Career Gaps That Might Have a Negative Impact on Compensation — U.S.Years of experience are strongly associated with compensation levels. People have gaps in experience for a variety of reasons. We asked about several that are relatively common including questions related to layoff, furlough, or accepting a lower wage in order to remain employed.
All of these percentages are based on the number of people who responded to this question (2,502 in total, including those who checked “none of the above”). Of those, 26 percent indicated at least one life event might lower their future compensation. When combining values for related reasons:
• Ten percent thought it is possible they will see (or have already seen) a pay cut because they took time off in the past two years to care for family (including raising children) or themselves.
• Six percent anticipated a potential negative impact due to taking time in the past two years to pursue their own education or because of career choices (relocation, taking time between jobs).
• 17 percent anticipated lower pay due to the complexities of 2020, such as layoff, furlough, or staying employed but at lower pay (which is consistent with the 18 percent who reported lower pay at the end of 2020 than they had as of March 1, 2020).
The results are reported by gender, as they have been in the past, and none of the observed differences are statistically significant at these sample sizes.
Table 23: Potential negative earnings effects — U.S.
Years of ExperienceTotal (n=657) Men (n=111) Women (n=494)
Gender not reported, non-
binary, self-identify (n=52)
n= % n= % n= % n= %
Raise children 114 17.4% 13 11.7% 91 18.4% 10 19.2%
Care for family members 94 14.3% 13 11.7% 74 15.0% 7 13.5%
Care for my own health 110 16.7% 20 18.0% 83 16.8% 7 13.5%
Pursue education 23 3.5% 3 2.7% 18 3.6% 2 3.8%
Relocate to another city 59 9.0% 10 9.0% 43 8.7% 6 11.5%
Resign before being offered a new job
80 12.2% 15 13.5% 58 11.7% 7 13.5%
Layoff prior to 2020 58 8.8% 12 10.8% 41 8.3% 5 9.6%
Layoff in 2020 65 9.9% 15 13.5% 42 8.5% 8 15.4%
Furlough (unpaid days) in 2020 131 19.9% 25 22.5% 97 19.6% 9 17.3%
Accepted a lower wage/salary in order to remain employed
250 38.1% 38 34.2% 191 38.7% 21 40.4%
Total is the number of participants that reported at least one factor negatively impacting their pay (including “other”). Where n is less than
30, please use findings with caution.

35 | ©2021 AFP Compensation & Benefits Report
Section 4.c: Compensation Based on Fundraisers’
Characteristics — CanadaThis section is based on salary data for Canadian participants and indicates the following:
• The mean (average) salary for all participants was $90,511.
• The median (middle value) salary was $78,000 in Canada.
• The top 25 percent of participant fundraisers earn more than $109,500 (75th percentile).
• The bottom 25 percent earn $60,000 or less in Canada, compared with the 2018 national family median of $87,930.
TABLE 51 in APPENDIX 5 provides the salary data (in Canadian dollars) for Canadian participants by position.
Men Average Higher Salaries — CanadaOn the surface, there is a difference in the compensation of men and women. The average salary of Canadian male fundraisers in this study is $114,770. Women are paid an average of $85,894, or 34 percent less, on average, than men.
Table 24: Men have higher average compensation before considering hours worked,
education, and experience — Canada
Gender Mean Median n=
Female $85,894 $75,000 270
Male $114,770 $93,000 56
Other $78,167 $67,000 3
Excludes non-responses.
Ethnic Heritage or Race Associated With 5 Percent Less in Compensation
— CanadaIn Canada, 22.5 percent of participants selected a race or ethnic heritage other than only white/Caucasian. This provides at least 50 participants who worked 30 hours a week or more for comparison of salaries for people considered by Statistics Canada to be “visible minorities” and those who are not. In this study, for these participants, there is 5 percent gap in compensation. Demographic data about survey participants in Canada appears in APPENDIX 2, TABLE 37.

36 | ©2021 AFP Compensation & Benefits Report
Table 25: Average compensation by race or ethnic heritage — Canada
Works 30+ hours per week and is not a self-employed consultant.
Excludes self-employed consultants. N/D = no data
Education and Compensation — CanadaPay varies with educational attainment for those who work 30 hours or more a week and for part-time employees as well. Results for rows with fewer than 30 respondents should be interpreted with caution.
Table 26: Education, compensation, and hours worked — Canada
Highest EducationWorked <30 Hrs/Week Worked 30+ Hrs/Week
Average n= Average n=
High school $69,667 3 $78,172 14
Two-year Diploma/some university $71,233 11 $82,510 48
Bachelor's Degree/1e cycle $89,745 34 $88,154 158
Master's Degree/2e cycle $100,620 15 $115,330 59
Doctorate/3e cycle N/D 0 $88,000 3
Post-graduate study: specialization $72,500 6 $66,337 25
Professional degree (JD, LLB, MBA, MD, DO, etc.) $151,091 4 $111,245 11
Professional or technical certification $86,750 4 $80,927 10
Race/Ethnicity Category Mean Median n=
Visible Minority* $87,521 $76,500 50
Only white/Caucasian/European, and non-Hispanic
$91,520 $77,000 230
Other $78,167 $67,000 3
* Includes non-white categories, including Multi-racial/Multi-ethnic. The term “visible minority” is used by Statistics Canada and might not
be a term used by individuals in this study.

37 | ©2021 AFP Compensation & Benefits Report
*An R-value of .10 is considered small; .30 moderate; and .50 large. Excludes non-responses to any category. All of these are statistically
significant to p < .05. Note: All of these also correlate with each other.
Note: Excludes those not responding to the question about certification. Cells with fewer than 30 participants should be used with caution.
Credentials and Compensation — CanadaCFRE is the most widely held fundraising certification among the Canadian AFP members participating in this study. Thirty-five percent of the individuals answering the question about certification held a CFRE. The number of responses is too few for valid comparison until 11 or more years of experience. For that row, those with a CFRE averaged 13 percent more compensation than those without.
Table 28: With more years of experience, CFRE holders earn more on average than
peers without CFRE
Based on those who work 30 hours a week or more.
Years of Experience
Hold CFRE No CFRE
Average Median n= Average Median n=
5 to 6 $60,688 $56,875 4 $69,501 $63,000 34
7 to 8 $80,038 $78,000 13 $90,510 $75,000 27
9 to 10 $74,140 $75,000 7 $79,962 $72,185 21
11 or more $115,379 $100,000 102 $101,954 $87,250 122
Correlation coefficients with income
Years in fundraising
Age nowLongest
period at same employer
Years at current employer
Number of employers
Pearson R* 0.48 0.34 0.35 0.25 0.21
Strength of Correlation
Moderate - Large Moderate Moderate Small - Moderate Small - Moderate
Years of Experience and Compensation — CanadaYears as a professional fundraiser is strongly correlated with compensation, whereas number of employers or years at current employer are not strongly associated with compensation. The results for data collected in early 2021 are similar to those collected in early 2020, based on the comparative strength of the correlations of the different factors.
Table 27: Fundraising experience correlates with age and employment tenure —
Canada

38 | ©2021 AFP Compensation & Benefits Report
Years of ExperienceTotal (n=657) Men (n=111) Women (n=494)
Gender not reported, non-
binary, self-identify (n=52)
n= % n= % n= % n= %
Raise children 23 20.2% 1 5.3% 22 23.7% 0
Care for family members 11 9.6% 2 10.5% 8 8.6% 1 50.0%
Care for my own health 30 26.3% 3 15.8% 26 28.0% 1 50.0%
Pursue education 7 6.1% 3 15.8% 4 4.3% 0
Relocate to another city 14 12.3% 2 10.5% 11 11.8% 1 50.0%
Resign before being offered a new job
9 7.9% 1 5.3% 8 8.6% 0
Layoff prior to 2020 10 8.8% 4 21.1% 6 6.5% 0
Layoff in 2020 17 14.9% 5 26.3% 12 12.9% 0
Furlough (unpaid days) in 2020 11 9.6% 3 15.8% 8 8.6% 0
Accepted a lower wage/salary in order to remain employed
20 17.5% 10 52.6% 10 10.8% 0
Where n is less than 30, use results with caution.
Career Gaps That Might Have a Negative Impact on Compensation —
CanadaPeople have gaps in experience for a variety of reasons. We asked about several that are relatively common including questions about layoff or furlough during the year, plus accepting a lower salary in order to remain employed.
None of the results by gender are statistically significant at these sample sizes.
Table 29: Potential negative earnings effects — Canada
n = 114

39 | ©2021 AFP Compensation & Benefits Report
Section 4.d: Compensation Varies by Organizational
Traits
Compensation for Fundraising Within Different Subsectors Varies — U.S.Within the U.S. the median for all study participants is $75,000 and the average is $88,421. Yet some sectors have higher averages and medians, and others are lower. For example, Arts, Environment, and Human Services and are all lower than the overall mean and median, as shown below in FIGURE 18 for selected subsectors. For data about all subsectors, see TABLE 45 in APPENDIX 4 .
Figure 18: Compensation by selected subsector where n > 100 — U.S.
Median = smaller green arrows; Mean = larger blue arrows.
Arts Performance (n=207) $65,000
$93,227
$75,000
$75,000
$71,000
$85,000
$70,000
$69,500
$65,000
$102,515
$86,784
$88,218
$79,920
$98,957
$78,265
$75,154
Environment (n=117)
Education: Primary/Secondary (n=195
Human Services: Development & Social Services (n=494)
Education: Higher(n=266)
Health Services (n=307)
Education: Other (n=108)
Human Services: Criminal Justice, Legal Aid, Employment, Housing, Homelessness (n=188)
Compensation for Fundraising Within Different Subsectors Varies —
CanadaIn Canada, education salaries, on average, are above the national median and mean; human services salaries are lower. The overall median was $78,000 and the average was $90,511. Subsectors with 30 or more respondents from Canada are shown in and data for all subsectors are in TABLE 52 in APPENDIX 5 .
Figure 19: Compensation by selected subsector where n > 30 – Canada
Median = smaller green arrows; Mean = larger blue arrows
Education: Higher Education (n=57) $88,000
$83,000
$71,065
$98,032
$100,146
$75,772Human Services: Development & Social Services (n=494)
Health Services (n=97)
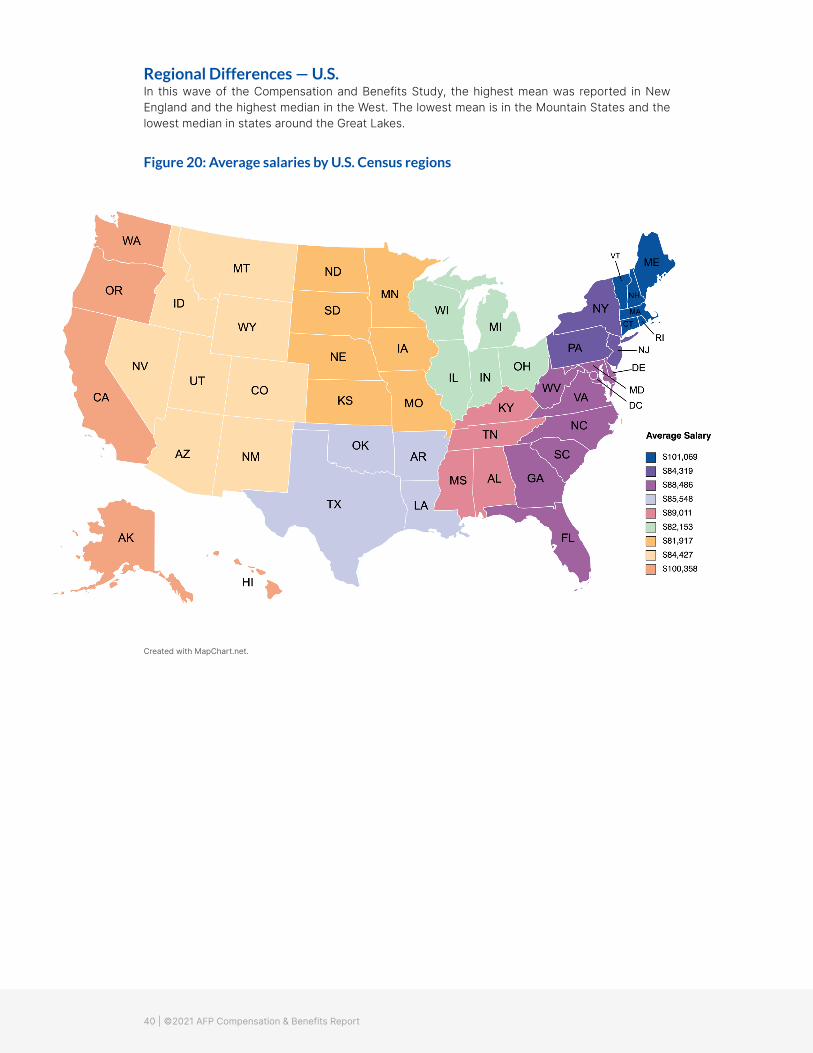
40 | ©2021 AFP Compensation & Benefits Report
Regional Differences — U.S.In this wave of the Compensation and Benefits Study, the highest mean was reported in New England and the highest median in the West. The lowest mean is in the Mountain States and the lowest median in states around the Great Lakes.
Figure 20: Average salaries by U.S. Census regions
Created with MapChart.net.

41 | ©2021 AFP Compensation & Benefits Report
Table 30: Regional salary averages and medians, 2020, pre-COVID-19 — U.S.
Excludes those who did not select a state, represented “other” region, or did not report salary.
Census Region n= Mean Median
Northeast (Connecticut, Maine, Massachusetts, New Hampshire, Rhode Island, Vermont)
149 $101,069 $83,000
Mid-Atlantic (New Jersey, New York, Pennsylvania) 286 $84,319 $75,000
South Atlantic (Delaware, District of Columbia, Florida, Georgia, Maryland, North Carolina, South Carolina, Virginia, West Virginia)
487 $88,486 $75,000
East South Central (Alabama, Kentucky, Mississippi, Tennessee) 107 $89,011 $70,000
Southwest (Arkansas, Louisiana, Oklahoma, Texas) 286 $85,548 $75,925
East North Central (Illinois, Indiana, Michigan, Ohio, Wisconsin) 465 $82,153 $70,000
West North Central (Iowa, Kansas, Minnesota, Missouri, Nebraska, North Dakota, South Dakota)
221 $81,917 $73,000
Mountain (Arizona, Colorado, Idaho, Montana, New Mexico, Nevada, Utah, Wyoming)
139 $84,427 $73,000
Pacific (Alaska, California, Hawaii, Oregon, Washington) 342 $100,358 $91,232
n.s. Islands: Puerto Rico, Virgin Islands, Guam, American Samoa 2 $45,850 $45,850
n.s. = Not shown on map.

42 | ©2021 AFP Compensation & Benefits Report
Created with MapChart.net
Provincial Differences – CanadaCompensation for fundraisers was lowest in the Atlantic provinces and highest in Ontario and Quebec, followed by British Columbia. This is consistent with prior years of this survey.
Figure 21: Average Salary by province in Canada.

43 | ©2021 AFP Compensation & Benefits Report
Geographic Scope of the Organization — U.S.Nearly six in 10 (56 percent) of U.S. fundraisers work in organizations that focused their programming locally and more than a third (35 percent) work at a state or regional level.
The average salary for organizations working at the local/community level in the U.S. is 8.3 percent less than the mean for the entire country. The median is 3.9 percent lower than the national median. Organizations serving national and international constituencies had the highest average and median salaries pre-COVID-19.
Table 32: Salaries by geographic scope of the organization, pre-COVID-19 — U.S.
Respondents could select all that applied. Sum of responses by organization will be more than n for All.
Geographical scope of organization n = Mean Median Difference from All
All 2,487 $88,421 $75,000 Mean Median
International 259 $103,773 $87,382 17.4% 16.5%
National 356 $103,242 $89,500 16.8% 19.3%
Selected States 129 $93,095 $85,000 5.3% 13.3%
State and/or Regional 647 $90,395 $76,000 2.2% 1.3%
Local or Multiple Communities 1,405 $81,043 $72,086 -8.3% -3.9%
Table 31: Regional salary averages and medians, pre-COVID-19 — Canada
Province/Region of Canada n= Mean Median
Prince Edward Island, New Brunswick, Nova Scotia 21 $68,356 $60,000
Newfoundland and Labrador 11 $74,059 $75,000
Quebec 32 $97,144 $87,500
Ontario 192 $97,380 $81,000
Manitoba 26 $71,880 $61,250
Saskatchewan 19 $79,288 $72,000
Alberta 56 $84,811 $81,000
British Columbia 65 $93,245 $78,000
Yukon, Northwest Territories, Nunavut 0 n/d n/d
Provinces/Regions with fewer than 30 response should be used with caution. n/d = No data.

44 | ©2021 AFP Compensation & Benefits Report
Additional data are in TABLE 47, APPENDIX 4 for the U.S. and in TABLE 54, APPENDIX 5 for Canada.
Institutional Budget (Size) and Compensation — U.S.The relationship between the annual budget of the institution and compensation for fundraisers is nearly perfectly linear (a straight line). When calculating using a growth rate formula, between the lowest average and the highest is a growth rate of 9 percent. That is, on average, the change from one size category to another is a 9 percent increase.
Figure 22: Very strong relationship between the organization’s overall budget and
average fundraising professional compensation — U.S.
Less
than
$25
0,00
0n=
92
$5M
- $
9.99
Mn=
261
$500
,000
- $
999,
999
n=22
4
$50M
- $
74.9
9Mn=
68
$3M
= $
4.99
Mn=
229
$250
,000
- $
499,
999
n=16
7
$10M
- $
49.9
9Mn=
261
$1M
- $
4.99
Mn=
507
$75M
- $
99.9
9Mn=
42
$100
M+
n=13
7
$59,306$73,059 $76,713 $78,336 $84,537 $87,643
$103,356 $101,366$110,567
$124,639
Geographical scope of organization n = Mean Median Difference from All
All 423 $90,511 $78,000 Mean Median
International 51 $98,331 $77,000 8.6% -1.3%
National 100 $102,932 $86,500 13.7% 10.9%
Selected States/Provinces 33 $89,819 $77,000 -0.8% -1.3%
State/Provincial and/or Regional 102 $82,974 $74,000 -8.3% -5.1%
Local or Multiple Communities 201 $83,710 $73,000 -7.5% -6.4%
Geographic Scope of the Organization — CanadaIn Canada, organizations with a national constituency have the highest average salary and the highest median.
Table 33: Salaries by geographic scope of the organization, pre-COVID-19 — Canada
Respondents could select all that applied. Sum of responses by organization will be more than n for All.

45 | ©2021 AFP Compensation & Benefits Report
Less
than
$25
0,00
0n=
12
$5M
- $
9.99
Mn=
40
$500
,000
- $
999,
999
n=39
$50M
- $
74.9
9Mn=
13
$3M
= $
4.99
Mn=
36
$250
,000
- $
499,
999
n=33
$10M
- $
49.9
9Mn=
63
$1M
- $
4.99
Mn=
65
$75M
- $
99.9
9Mn=
24
$68,323 $74,350$93,125
$83,113$98,066
$91,070$100,411
$136,096
$101,292
Data for compensation by organizational expenditures in Canada appear in APPENDIX 5, TABLE 56 .
Amount Raised and Compensation — CanadaSurvey results for average and median compensation by range of amount raised appear in APPENDIX 5, TABLE 57 . While the ranges are not equally sized, there is an increase of 6 percent, on average, when the amount raised increases to a new grouping (e.g., from the group of $1 million to $2.99 million in philanthropic contributions to the group for $3 million to $4.99 million).
There are at least 40 responses in every size group, and 100 or more in all but $50 million to $74.99 million and $75 million to $99.99 million.
This analysis uses the total annual budget of the organization as an indicator of “institution size.” Some institutions raise a substantial portion of their budget from charitable gifts; many others receive revenue from fees for service, tuition, government grants, or—as for food banks—gifts-in-kind.
Amount Raised and Compensation — U.S.Survey results for average and median compensation by range of amount raised appear in APPENDIX 4, TABLE 50. While the ranges are not equally sized, there is an increase of 8 percent, on average, when the amount raised increases to a new grouping (e.g., from the group of $1 million to $2.99 million in philanthropic contributions to the group for $3 million to $4.99 million).
Institutional Budget (Size) and Compensation — CanadaSalaries for fundraising professionals in Canada often, but not always, increased with budget category in this survey. The highest rate of compensation was for organizations with operating budgets between $50 million and $74.99 million. The average change in compensation is 9 percent with each increase in budget, when averaged across all budget ranges. The “bumpy” results for Canada likely reflect the low number of responses in some categories.
Table 34: Relationship between the organization’s overall budget and average
fundraising professional compensation — Canada

46 | ©2021 AFP Compensation & Benefits Report
Section 5: BenefitsThe Benefits chapter presents the data on options offered in the areas of health/medical benefits, retirement plans, and other miscellaneous perquisites or “perks” for U.S. and Canadian participants, overall and by position.
Section 5.a: Medical/Health Benefits — U.S.TABLE 58 in APPENDIX 6 provides data about the medical/health benefits data for the participants from the U.S. To be consistent with prior years, the percentages are based on the total number of responses to the survey, even those who did not answer the health benefits section.
• 90 percent of those answering this question indicated that their organization provides some health benefits.
• Ten percent of U.S. participants reported NO health-related benefit, not even a Medical Savings Account. In the 2020 wave of this study, reporting on 2019 benefits, 5 percent reported no health-related benefit.
Other forms of health expense coverage from employers included:
• 79 percent receive dental coverage.
• 71 percent have vision insurance.
• 58 percent have some coverage for prescriptions.
• Medical Savings Accounts (MSA)/Health Savings Accounts (HSA) are offered at 58 percent of employers.
This year’s survey did not ask about share of insurance premiums paid by employer or employee, or about the extent to which employers offered coverage for family members or dependents. For the most recent information about those questions, please refer to the report released in 2020 about compensation and benefits in 2019.
Flexible benefit accounts were offered to 45 percent of respondents from the U.S., either for dependent care, healthcare, or both.
Finding benefits by position
To examine survey results about health benefits for a particular position, e.g., what percentage of U.S. CEOs receive dental insurance benefits, go to TABLE 58 in APPENDIX 6 . The percentages shown are those receiving the benefit. Benefits are listed at left and positions across the top. When you do your analyses, pay particular attention to the total number of participants represented in a category. The smaller the number of participants, the more careful you must be in drawing conclusions about the benefits received by ALL CEOs (or other positions) based on the available data.
Note that the data in this appendix, consistent with all other appendices, are based on the total number of study participants from the U.S. Percentages will not match the figures in this section, which are based on participants who answered the specific question.

47 | ©2021 AFP Compensation & Benefits Report
Section 5.b: Medical/Health Benefits — CanadaAPPENDIX 7 provides the medical/health benefits data for 506 Canadian participants and indicates the following:
• 93 percent of 514 Canadian participants reported some form of health insurance coverage.
• Seven percent said their employer offers no form of health benefits.
Among those with coverage:
• 81 percent receive coverage for basic hospitalization and major medical costs.
• Prescriptions are covered at least in part for 89 percent.
• 74 percent have vision insurance.
• 87 percent are offered dental insurance.
In addition, flexible benefit accounts were offered to 37 percent of Canadian respondents, either for dependent care, healthcare, or both.
Section 5.c: Retirement Benefits — U.S.Among more than 2,400 U.S. participants who answered this section:
• 40 percent of participants indicated they can participate in a 401(k) plan.
• 39 percent of participants are offered a 403(b) plan.
• Seven percent reported their employer has a defined benefit plan.
This year’s survey did not ask about employer contributions to 401(k), 403(b), or IRA plans, nor about limits for matching employee contributions. For the most recent information about those questions, please refer to the report released in 2020 about compensation and benefits in 2019.
TABLE 59 provides the retirement benefits detail by position for U.S. participants.
Table 35: Retirement plans offered, pre-COVID-19 — U.S.
Type of Plan* Percentage Offered**
401(k) 40%
403(b) 39%
Other defined contribution plan 8%
Other defined benefit plan 7%
IRA (Individual Retirement Account) 7%
Profit-sharing plan 1%
Thrift/savings plan 1%
My organization doesn't offer retirement benefits. 16%
*See Appendix 1 for definitions.
** Excludes non-response. Does include “I don’t know” which was less than 1% of total.

48 | ©2021 AFP Compensation & Benefits Report
If you want to examine retirement benefits by position, e.g., what percentage of U.S. CEOs receive retirement benefits through a 401(k) plan, go to APPENDIX 6, TABLE 59 and find the columns labeled CEOs. The percentages shown are those receiving the benefit. Benefits are listed at left and positions across the top.
The same analysis can be used for each of the position-based tables that follow. However, when you do your analyses, pay particular attention to the total number of participants represented in a category. The smaller the number of participants, the more careful you must be in extrapolating from the data.
Section 5.d: Retirement Benefits — CanadaTABLE 62 in APPENDIX 7 provides the retirement benefits data by position for 512 Canadian participants who answered this section and indicates the following:
• 52 percent of participants said their employer offers either a defined benefit or a defined contribution retirement plan. This is a significant drop from the 72 percent who reported availability of a pension plan in 2019.
• 34 percent reported their employer offers a defined benefit pension plan. This is a significant decline from 49 percent reported for 2019.
• 18 percent reported their employer offers a defined contribution plan (DCP). This is up, with statistical significance, from 14 percent reported for 2019.
• 34 percent of Canadian participants reported a Group Registered Retirement Savings Plan (RRSP) is offered. This is a seven-point gain over 2019, which is statistically significant.
This year’s survey did not ask about employer contributions to retirement plans, nor about limits for matching employee contributions. For the most recent information about those questions, please refer to the report released in 2020 about compensation and benefits in 2019.
Table 36: Retirement plans offered, pre-COVID-19 — Canada
Answered retirement questions, n = 436.
Type of Plan* Percentage Offered
Defined Benefit Pension Plan 32%
Defined Contribution Plan 14%
Group Registered Retirement Savings Plan (RRSP) 32%
Profit-sharing plan 0.5%
Don’t know 3%
My organization does not offer retirement benefits. 23%
*See Appendix 1 for definitions.
Excludes non-responses.
If you want to examine retirement benefits by position, e.g., what percentage of Canadian CEOs receive defined benefit pension plans, go to APPENDIX 6, TABLE 62 and find the columns labeled CEOs. The percentages shown are those receiving the benefit. Benefits are listed at left and positions across the top. The same analysis can be used for each of the position-based tables

49 | ©2021 AFP Compensation & Benefits Report
that follow. However, when you do your analyses, pay particular attention to the total number of participants represented in a category. The smaller the number of participants, the more careful you must be in extrapolating from the data.
Note that the data in this appendix, consistent with all other appendices, are based on the total number of study participants from the U.S. Percentages will not match the figure above, which is based on participants who answered this question.
Section 5.e: Other Benefits — U.S.TABLE 63 provides the Other Benefits data by position for 2,400 study participants who answered this question (73 percent of U.S. participants). Seven in 10 employers offer group life or disability insurance. Payment of professional dues is most common, reported by 84 percent. No other benefit was offered by more than half of employers. FIGURE 23 summarizes the overall percentages.
Figure 23: Other benefits organized by those that benefit the family or individual and
those that have a clear connection to work and being available for work
Professional dues
Benefit helps employer
Cellular phone or cell phone plan allowance
Home computer
Time for service on external boards/committees
Professional liability insurance
65%
32%
44%
33%
9%
Short-term disability insurance
Benefit helps individual/family
Long-term disability insurance
Group life insurance
Paid parental leave (other than FMLA)
Tuition reimbursement
Accident insurance
Local transportation subsidy
61%
61%
29%
58%
27%
35%
13%
Benefit helps both
Parking
Car of car allowance
Child care
Relocation expenses
8%
7%
5%
27%
If you want to examine benefits by position, e.g., what percentage of U.S. CEOs receive group life insurance, go to the APPENDIX 6, TABLE 63. The percentages shown are those receiving the benefit. Benefits are listed at left and positions across the top. The same analysis can be used for each of the position-based tables that follow. However, when you do your analyses, pay particular attention to the total number of participants represented in a category. The smaller the number of participants, the more careful you must be in extrapolating from the data.
Note that the data in this appendix, consistent with all other appendices, are based on the total number of study participants from the U.S. Percentages will not match the figure above, which is based on participants who answered this question.

50 | ©2021 AFP Compensation & Benefits Report
Section 5.f: Other Benefits — Canada FIGURE 24 below shows overall frequencies of other benefits for Canadian participants. More detail by position can be found in TABLE 63 in APPENDIX 7 . Professional dues, cell phone plans, and insurance offers are the most common.
Figure 24: Other benefits organized by those that benefit the family or individual and
those that have a clear connection to work and being available for work
Long-term disability insurance
Benefit helps individual/family
Group life insurance
Short-term disability insurance
Accident insurance
Tuition reimbursement
Local transporttion subsidy
74%
74%
50%
68%
27%
10%
64%
38%
40%
67%
27%
9%
Benefit helps employer
Professional dues
Cellular phone or cell phone plan allowance
Paid or partially paid parental leave
Service on external volunteer boards/committees
Home computer
Professional liability insurance
32%
13%
5%
3%
Benefit helps both
Parking
Car of car allowance
Child care
Relocation expenses
If you want to examine benefits by position, e.g., what percentage of Canadian CEOs receive group life insurance, go to APPENDIX 7, TABLE 63. The percentages shown are those receiving the benefit. Benefits are listed at left and positions across the top. The same analysis can be used for each of the position-based tables that follow. However, when you do your analyses, pay particular attention to the total number of participants represented in a category. The smaller the number of participants, the more careful you must be in extrapolating from the data.
Note that the data in this appendix, consistent with all other appendices, are based on the total number of study participants from the U.S. Percentages will not match the figure above, which is based on participants who answered this question.
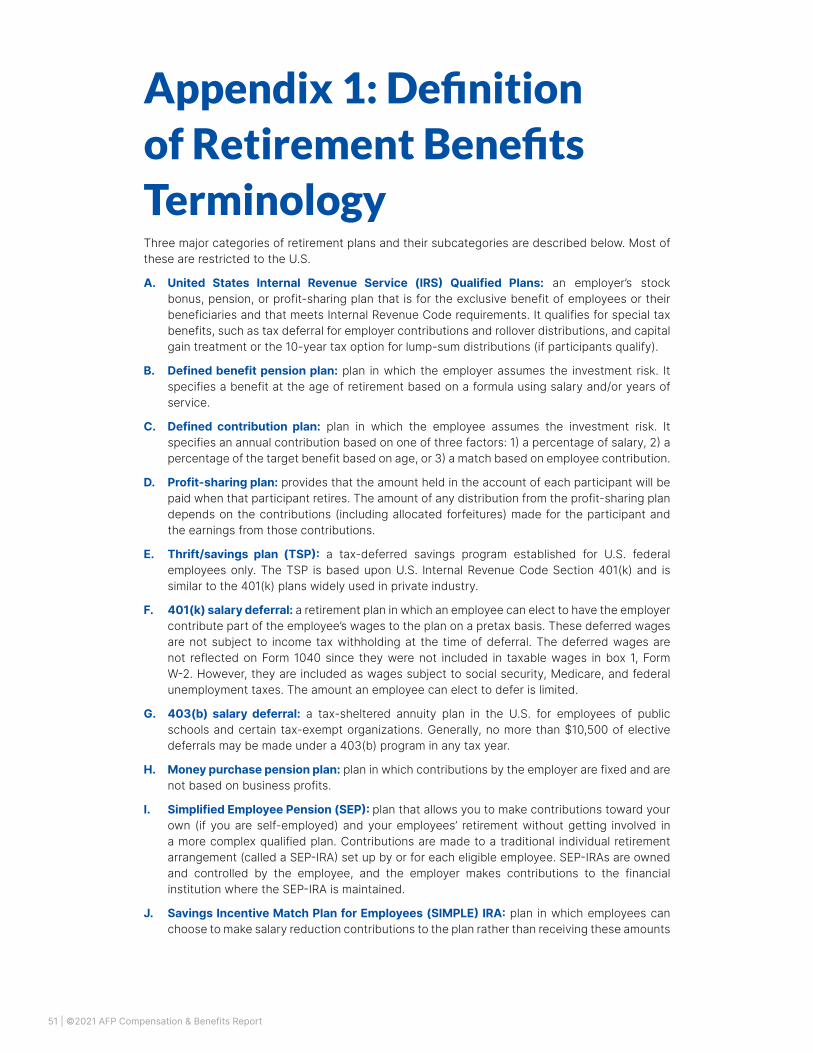
51 | ©2021 AFP Compensation & Benefits Report
Appendix 1: Definition of Retirement Benefits TerminologyThree major categories of retirement plans and their subcategories are described below. Most of these are restricted to the U.S.
A. United States Internal Revenue Service (IRS) Qualified Plans: an employer’s stock bonus, pension, or profit-sharing plan that is for the exclusive benefit of employees or their beneficiaries and that meets Internal Revenue Code requirements. It qualifies for special tax benefits, such as tax deferral for employer contributions and rollover distributions, and capital gain treatment or the 10-year tax option for lump-sum distributions (if participants qualify).
B. Defined benefit pension plan: plan in which the employer assumes the investment risk. It specifies a benefit at the age of retirement based on a formula using salary and/or years of service.
C. Defined contribution plan: plan in which the employee assumes the investment risk. It specifies an annual contribution based on one of three factors: 1) a percentage of salary, 2) a percentage of the target benefit based on age, or 3) a match based on employee contribution.
D. Profit-sharing plan: provides that the amount held in the account of each participant will be paid when that participant retires. The amount of any distribution from the profit-sharing plan depends on the contributions (including allocated forfeitures) made for the participant and the earnings from those contributions.
E. Thrift/savings plan (TSP): a tax-deferred savings program established for U.S. federal employees only. The TSP is based upon U.S. Internal Revenue Code Section 401(k) and is similar to the 401(k) plans widely used in private industry.
F. 401(k) salary deferral: a retirement plan in which an employee can elect to have the employer contribute part of the employee’s wages to the plan on a pretax basis. These deferred wages are not subject to income tax withholding at the time of deferral. The deferred wages are not reflected on Form 1040 since they were not included in taxable wages in box 1, Form W-2. However, they are included as wages subject to social security, Medicare, and federal unemployment taxes. The amount an employee can elect to defer is limited.
G. 403(b) salary deferral: a tax-sheltered annuity plan in the U.S. for employees of public schools and certain tax-exempt organizations. Generally, no more than $10,500 of elective deferrals may be made under a 403(b) program in any tax year.
H. Money purchase pension plan: plan in which contributions by the employer are fixed and are not based on business profits.
I. Simplified Employee Pension (SEP): plan that allows you to make contributions toward your own (if you are self-employed) and your employees’ retirement without getting involved in a more complex qualified plan. Contributions are made to a traditional individual retirement arrangement (called a SEP-IRA) set up by or for each eligible employee. SEP-IRAs are owned and controlled by the employee, and the employer makes contributions to the financial institution where the SEP-IRA is maintained.
J. Savings Incentive Match Plan for Employees (SIMPLE) IRA: plan in which employees can choose to make salary reduction contributions to the plan rather than receiving these amounts

52 | ©2021 AFP Compensation & Benefits Report
as part of their regular pay. In addition, the employer contributes matching or non-elective contributions.
K. Non-Qualified Plan: an employer’s plan that does not meet Internal Revenue Code requirements for qualified employee plans. It does not qualify for most of the tax benefits of a qualified plan.
L. Individual Retirement Account (IRA): a personal savings plan that offers tax advantages to set aside money for retirement. Generally, amounts in an IRA, including earnings and gains, are not taxed until distributed, or, in some cases, are not taxed at all if distributed according to IRS rules.

53 | ©2021 AFP Compensation & Benefits Report
Appendix 2: Information About ParticipantsTable 37: Demographics of Study Participants
GenderUS (n=2,392) Canada (n=422)
% n % n
Male 18% 430 18% 77
Female 81% 1,933 81% 341
Another selection (transgender, gender non-conforming, nonbinary, intersex, prefer to self-identify, prefer not to answer)
1% 29 1% 4
Current AgeUS (n=2,386) Canada (n=419)
% n % n
Under Age 25 1% 30 1% 6
25-34 years old 19% 460 20% 82
35-44 years old 24% 570 25% 104
45-54 years old 26% 609 28% 117
55-64 years old 25% 588 23% 97
65 or more years old 5% 129 3% 13
Race/Ethnic Background (respondents selecting multiple categories are included in the Multiracial/Multiethnic category)
US (n=2,370)
% n
African American/Black, Not Hispanic 4% 89
White/White European/Not Hispanic 85% 2,013
Asian/Pacific Islander (includes Cambodian, Chinese, Filipino, Hawai'ian, Japanese, Korean, Pacific Islander, Samoan, SE Asian, West Asian, which were all distinct options, in addition to Asian)
1% 35
American Indian/Native American/Alaskan Native 0% 1
Hispanic/Latinx 4% 104
Indian sub-continent, Middle East, or North Africa (combined responses)
1% 15
Jewish 0% 3
Multiracial/Multiethnic 4% 84
Prefer to self-describe 1% 26

54 | ©2021 AFP Compensation & Benefits Report
Race/Ethnic Background (respondents selecting multiple categories are included in the Multiracial/Multiethnic category)
Canada (n=405)
% n
Black/African Canadian 2% 6
White/White European/Not Hispanic 77% 292
Asian (includes Cambodian, Chinese, Filipino, Japanese, Korean, SE Asian, West Asian, which were all distinct options, in addition to Asian)
3% 11
Hispanic/Latinx 1% 3
Aboriginal (Indian band, First Nation, Indigenous people) 1% 4
Indian sub-continent, Middle East, or North Africa (combined responses)
2% 9
Jewish 2% 7
Multiracial/Multiethnic 7% 26
Prefer to self-describe 5% 19
Table 38: Fundraising Role(s) of Study Participants
Fundraising Role(s) of Study ParticipantsUS (n=2,596) Canada (n=453)
% n % n
Agency CEO or Executive Director 15% 387 17% 79
Dean or Unit Head 0% 12 0% 2
Chief Operating Officer 1% 21 1% 5
Chief Development Officer 40% 1,040 22% 98
Associate Vice Chancellor, Deputy Director, Associate Director/Assistant or Associate Vice President or equivalent
5% 127 4% 19
Program Director/Manager 11% 277 18% 83
Fundraising Officer 14% 370 23% 102
Grants Manager 2% 59 1% 5
Other Fundraising Staff Position 6% 154 7% 30
Consultant - Principal, Senior Staff member, Campaign Director in Full-service Firm
3% 66 2% 11
Consultant - Staff member at full-service firm but not principal or senior level
0% 9 1% 6
Consultant - Specialized, independent or small-shop consultancy 2% 56 2% 7
Moved to employment in a field other than fundraising 0% 1 0% 1
Retired 0% 1 0% 0
None of the Above 1% 16 1% 5

55 | ©2021 AFP Compensation & Benefits Report
For your fundraising work in your current job, how many people do you manage?
US (n=2,595) Canada (n=452)
% n % n
None 42% 1,082 43% 195
1-2 33% 846 28% 126
3 or more 26% 667 29% 131
For how many years have you been with your current employer?US (n=2,408) Canada (n=424)
n % n %
1 year or less 447 18.6% 88 20.8%
2 years 454 18.9% 68 16.0%
3 years 363 15.1% 62 14.6%
4 years 209 8.7% 34 8.0%
5-6 years 321 13.3% 54 12.7%
7-9 years 229 9.5% 55 13.0%
10-14 years 207 8.6% 41 9.7%
15 or more years 178 7.4% 22 5.2%
Mean 5.4 5.1
Median 3 3
What is the longest period of time you have been employed in the same fundraising position with the same organization?
US (n=2,404) Canada (n=422)
n % n %
1-2 years 381 15.8% 82 19.4%
3 years 348 14.5% 46 10.9%
4 years 256 10.6% 41 9.7%
5 years 292 12.1% 63 14.9%
6-7 years 349 14.5% 78 18.5%
8-9 years 276 11.5% 41 9.7%
10-14 years 323 13.4% 50 11.8%
15-19 years 102 4.2% 11 2.6%
20 or more years 77 3.2% 10 2.4%
Mean 6.7 3.5
Median 3 3
Table 39: Fundraising Careers of Participants

56 | ©2021 AFP Compensation & Benefits Report
For how many employers have you worked as a fundraising professional?
US (n=2,399) Canada (n=420)
n % n %
0 employers 11 0.5% 1 0.2%
Only 1 employer 559 23.3% 96 22.9%
2 employers 509 21.2% 71 16.9%
3 employers 433 18.0% 86 20.5%
4 employers 298 12.4% 55 13.1%
5-6 employers 371 15.5% 61 14.5%
7-9 employers 159 6.6% 38 9.0%
10 or more employers 59 2.5% 12 2.9%
Mean 3.4 3.5
Median 3 3
What was your age in whole years when you entered fundraising?US (n=2,398) Canada (n=421)
n % n %
Under Age 25 633 26.4% 111 26.4%
25-29 years old 611 25.5% 124 29.5%
30-39 years old 610 25.4% 99 23.5%
40-49 years old 374 15.6% 68 16.2%
50 or more years old 170 7.1% 19 4.5%
Mean 32.1 31.1
Median 29 28
For how many years have you been employed as a fundraising professional?
US (n=2,408) Canada (n=422)
n % n %
<4 Years 382 15.9% 54 12.8%
4-6 Years 346 14.4% 66 15.6%
7-9 Years 292 12.1% 54 12.8%
10-14 years 394 16.4% 65 15.4%
15-19 Years 314 13.0% 69 16.4%
20-24 Years 302 12.5% 51 12.1%
25-29 Years 186 7.7% 34 8.1%
30+ Years 192 8.0% 29 6.9%
Mean 13.4 13.4
Median 11 12

57 | ©2021 AFP Compensation & Benefits Report
In the past 12 months, select any of the following that you have done: (Respondents could select more than one)
US (n=2,401) Canada (n=423)
n % n %
Looked for a promotion within your current organization 546 22.7% 132 31.2%
Looked for a job with another employer 1,015 42.3% 199 47.0%
Made plans to become self-employed 187 7.8% 33 7.8%
Made efforts to leave consulting and seek employment at an organization
47 2.0% 11 2.6%
Planned for my retirement within two years 170 7.1% 30 7.1%
None of the above 1,042 43.4% 167 39.5%
Please indicate why you thought about changing you employment in the past year. (Respondents could select more than one
US (n=1,369) Canada (n=254)
n % n %
Because my position was or will be terminated 85 6.2% 18 7.1%
To earn a higher salary 790 57.7% 160 63.0%
As a career move, seeking a path to advancement, more challenge, more responsibility, or more opportunity to learn
825 60.3% 172 67.7%
Because of a lack of support for fundraising or a lack of recognition for what fundraising professionals do
414 30.2% 75 29.5%
Because work expectations are unrealistic 351 25.6% 61 24.0%
Because of a frustrating or negative work environment, toxic culture, or conflicts with co-workers or management
535 39.1% 93 36.6%
Because of micro-aggressions, aggressions or hostilities based on my age, gender, race, disability, or other characteristic
153 11.2% 22 8.7%
To get more time to spend on personal/family activities 189 13.8% 35 13.8%
Because my values and the organization's values are not the same
154 11.2% 28 11.0%
To move closer to family members 87 6.4% 23 9.1%
Because my salary was negatively affected by my gender, race or ethnic identity, age, or other bias
64 4.7% 7 2.8%
Because I plan to retire 113 8.3% 17 6.7%
To obtain health, retirement, or leave benefits more suited to my (or my family's) needs.
133 9.7% 19 7.5%
None of the above 95 6.9% 15 5.9%

58 | ©2021 AFP Compensation & Benefits Report
Table 40: Career Trajectory
Highest Level of EducationUS (n=2,394) Canada (n=421)
n % n %
High School 56 2.3% 17 4.0%
Two-year Diploma/Associate Degree 59 2.5% 61 14.5%
Four-year College/Bachelor's Degree/1er cycle 1,134 47.4% 201 47.7%
Master's Degree/2e cycle 1,026 42.9% 77 18.3%
Doctorate/3e cycle 53 2.2% 3 0.7%
Post-graduate study/specialization n/a n/a 33 7.8%
Other Advanced Degree/Professional Degree (JD, MD, DO, etc.) 46 1.9% 15 3.6%
Professional or technical certification (such as paralegal, master teacher, apprenticeship in a trade, etc.)
20 0.8% 14 3.3%
Professional Certification (Respondents could select more than one)
US (n=2,396) Canada (n=416)
n % n %
CFRE 570 24.1% 134 32.2%
ACFRE 15 0.6% 2 0.5%
University-based certification program in fundraising or nonprofit management
357 15.1% 67 16.1%
Other designation as fellow, certificate holder, or other 235 9.9% 69 16.6%
None of the above 1,374 58.0% 188 45.2%
Professional or technical certification (such as paralegal, master teacher, apprenticeship in a trade, etc.)
20 0.8% 14 3.3%

59 | ©2021 AFP Compensation & Benefits Report
Appendix 3: Organizations Where Fundraisers WorkTable 41: Organizations where professional fundraisers work
Organizational TypeUS (n=3,015) Canada (n=516)
n % n %
Animals/Animal Welfare (domestic or captive animals, shelter, rescue, adoption, zoos) 88 2.9% 11 2.1%
Arts: Cultural or Heritage Focus 119 3.9% 22 4.3%
Arts: Performance, Exhibition, Creation (dance, drama, theatre, music, museum, historic preservation, arts center, etc.)
267 8.9% 30 5.8%
Arts: Public Broadcasting, Nonprofit Publishing 28 0.9% 2 0.4%
Association or Membership Foundation (trade, professional, or fraternal) 45 1.5% 2 0.4%
Civic and Public Affairs (legal, public advocacy, voter registration/education, urban affairs, etc.) 78 2.6% 6 1.2%
Community Development/Economic Development (includes affordable housing) 122 4.0% 25 4.8%
Consultant 6 0.2% 5 1.0%
Education: Higher Education (college, university, community college and/or affiliated foundation) 395 13.1% 85 16.5%
Education: Primary or Secondary Education (private, public and/or affiliated foundation) 252 8.4% 29 5.6%
Education: Pre-K (child care, early childhood education, referrals, parental advice) 75 2.5% 3 0.6%
Education: Other (public library foundation, literacy, vocational training, scholarships, Greek foundation) 137 4.5% 15 2.9%
Environment (wildlife, habitat, conservation, environmental education, etc.) 145 4.8% 20 3.9%
Fundraising & Allocations: Federated or Collective Fundraising (United Way, Jewish Federation etc.) 35 1.2% 8 1.6%
Fundraising & Grantmaking: Community Foundation, Donor-Advised Fund Sponsor 70 2.3% 19 3.7%
Government or Quasi-Governmental Agency 12 0.4% 0 0.0%
Health: National or Regional Health Agency (research or advocacy, disease or health-related problem) 109 3.6% 33 6.4%
Health Services (hospital, clinic, nursing home, specialized services) 397 13.2% 121 23.4%
Human Services: Development & Social Services (child, youth, adult, family, retirement, fitness/sport) 599 19.9% 79 15.3%
Human Services: Criminal Justice, Legal Aid, Employment, Housing, Homelessness 235 7.8% 27 5.2%
Human Services: Multi-Service Center (the YMCA, a community center, neighborhood services, etc.) 117 3.9% 16 3.1%
International: Emergency Relief/Humanitarian Aid 19 0.6% 15 2.9%
International Development/Overseas Aid and Support (excluding emergency relief) 34 1.1% 19 3.7%
Religious Congregation, Ministry, Broadcast, or Publishing; Organizing Body of a Faith (synod, diocese, union, etc.)
92 3.1% 13 2.5%
Scientific or Social Science Research or Other Educational Body (includes think tanks) 35 1.2% 8 1.6%
None of the above 116 3.8% 13 2.5%

60 | ©2021 AFP Compensation & Benefits Report
Funds Raised by Organization FY2020US (n=2,636) Canada (n=444)
n % n %
Less than $100,000 108 4.1% 20 4.5%
$100,000-$249,999 197 7.5% 19 4.3%
$250,000-$499,999 248 9.4% 35 7.9%
$500,000-$999,999 411 15.6% 46 10.4%
$1,000,000-$2,999,999 638 24.2% 97 21.8%
$3,000,000-$4,999,999 290 11.0% 49 11.0%
$5,000,000-$9,999,999 236 9.0% 51 11.5%
$10,000,000-$49,999,999 300 11.4% 71 16.0%
$50,000,000-$74,999,999 47 1.8% 12 2.7%
$75,000,000-$99,999,999 23 0.9% 2 0.5%
$100 million or more 88 3.3% 21 4.7%
Don't know 50 1.9% 21 4.7%
Size of Organizational Budget FY2020US (n=2,666) Canada (n=449)
n % n %
Less than $250,000 101 3.8% 13 2.9%
$250,000-$499,999 181 6.8% 33 7.3%
$500,000-$999,999 249 9.3% 40 8.9%
$1,000,000-$2,999,999 563 21.1% 73 16.3%
$3,000,000-$4,999,999 268 10.1% 37 8.2%
$5,000,000-$9,999,999 286 10.7% 46 10.2%
$10,000,000-$49,999,999 497 18.6% 74 16.5%
$50,000,000-$74,999,999 62 2.3% 14 3.1%
$75,000,000 - $99,999,999 52 2.0% 3 0.7%
$100 million or more 167 6.3% 28 6.2%
Don't Know 240 9.0% 88 19.6%
Organizational ScopeUS (n=2,622) Canada (n=457)
n % n %
International 271 10.3% 59 12.9%
National 379 14.5% 109 23.9%
Selected States 134 5.1% 35 7.7%
State and/or Regional 682 26.0% 112 24.5%
Local or Multiple Communities 1,479 56.4% 220 48.1%

61 | ©2021 AFP Compensation & Benefits Report
Metropolitan Area PopulationUS (n=2,613) Canada (n=457)
n % n %
Population < 50,000 278 10.6% 28 6.1%
Population of 50,000 - 999,999 1,176 45.0% 200 43.8%
Population of 1,000,000 - 2,999,999 603 23.1% 135 29.5%
Population or 3,000,000 or more 556 21.3% 94 20.6%
Location of Organization – U.S.US (n=2,622)
n %
Northeast (Connecticut, Maine, Massachusetts, New Hampshire, Rhode Island, Vermont)
156 5.9%
Mid-Atlantic (New Jersey, New York, Pennsylvania) 304 11.6%
South Atlantic (Delaware, District of Columbia, Florida, Georgia, Maryland, North Carolina, South Carolina, Virginia, West Virginia)
517 19.7%
East South Central (Alabama, Kentucky, Mississippi, Tennessee) 112 4.3%
Southwest (Arkansas, Louisiana, Oklahoma, Texas) 302 11.5%
East North Central (Illinois, Indiana, Michigan Ohio, Wisconsin) 485 18.5%
West North Central (Iowa, Kansas, Minnesota, Missouri, Nebraska, North Dakota, South Dakota)
228 8.7%
Mountain (Arizona, Colorado, Idaho, Montana, New Mexico, Nevada, Utah, Wyoming,)
149 5.7%
Pacific (Alaska, California, Hawaii, Oregon, Washington) 366 14.0%
Islands: Puerto Rico, Virgin Islands, Guam, American Samoa 3 0.1%
Location of Organization – U.S.Canada (n=459)
n %
Prince Edward Island, New Brunswick, Nova Scotia 24 5.2%
Newfoundland and Laborador 11 2.4%
Quebec 36 7.8%
Ontario 213 46.4%
Manitoba 26 5.7%
Saskachewan 19 4.1%
Alberta 60 13.1%
British Columbia 70 15.3%
Yukon, Northwest Territories, Nunavut 0 0.0%
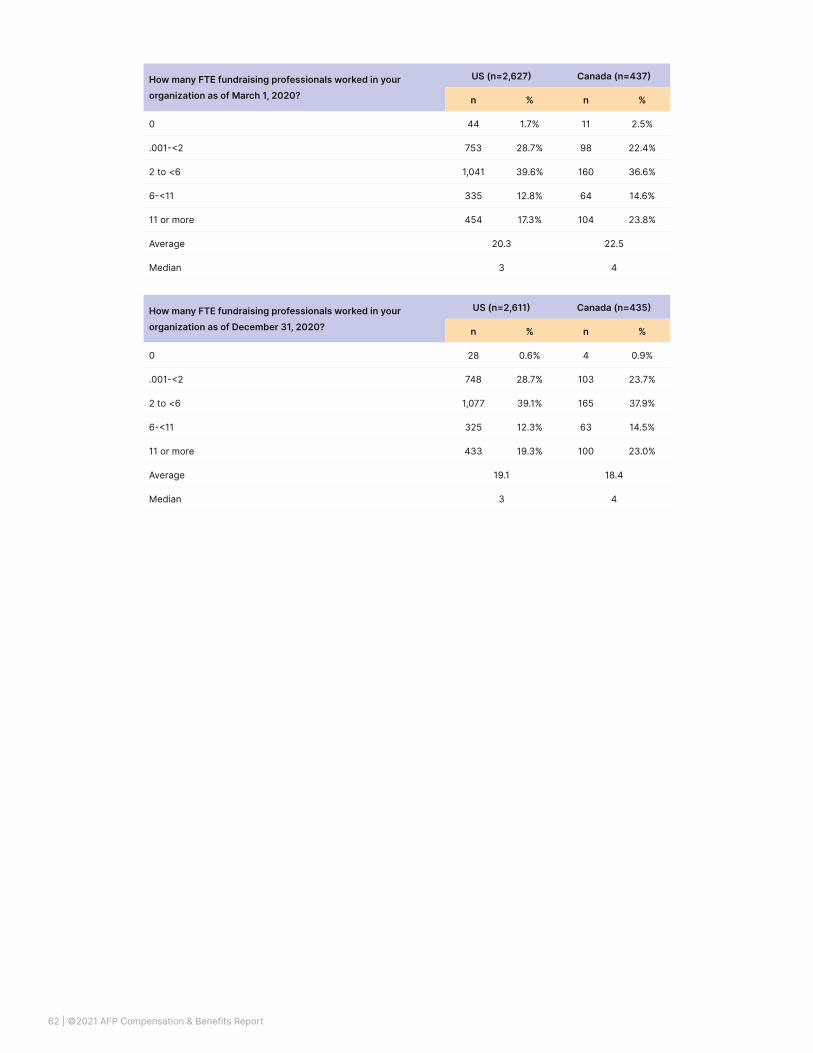
62 | ©2021 AFP Compensation & Benefits Report
How many FTE fundraising professionals worked in your organization as of March 1, 2020?
US (n=2,627) Canada (n=437)
n % n %
0 44 1.7% 11 2.5%
.001-<2 753 28.7% 98 22.4%
2 to <6 1,041 39.6% 160 36.6%
6-<11 335 12.8% 64 14.6%
11 or more 454 17.3% 104 23.8%
Average 20.3 22.5
Median 3 4
How many FTE fundraising professionals worked in your organization as of December 31, 2020?
US (n=2,611) Canada (n=435)
n % n %
0 28 0.6% 4 0.9%
.001-<2 748 28.7% 103 23.7%
2 to <6 1,077 39.1% 165 37.9%
6-<11 325 12.3% 63 14.5%
11 or more 433 19.3% 100 23.0%
Average 19.1 18.4
Median 3 4

63 | ©2021 AFP Compensation & Benefits Report
Appendix 4: Compensation – U.S.Table 42: I feel I negotiated effectively for my salary and benefits when I accepted my
current position.
Table 43: Change in income due to COVID-19
When hired for the position you occupied in 2020, do you feel that you negotiated effectively for the salary you wanted when you accepted your current position?
US (n=2,479) Canada (n=430)
n % n %
Yes 1,566 63.2% 248 57.7%
No 913 36.8% 182 42.3%
Considering your expected annual earnings before COVID, by what percentage did your professional income change from 2019 to 2020?
US (n=2,505) Canada (n=436)
n % n %
Down 10% or more 143 5.7% 19 4.4%
Down 7-9% 20 0.8% 6 1.4%
Down 4-6% 46 1.8% 9 2.1%
Down 1-3% 45 1.8% 7 1.6%
No change 1,188 47.4% 233 53.4%
Up 1-3% 671 26.8% 109 25.0%
Up 4-6% 198 7.9% 32 7.3%
Up 7-9% 57 2.3% 9 2.1%
Up 10% or more 137 5.5% 12 2.8%

64 | ©2021 AFP Compensation & Benefits Report
Table 44: Compensation by position – U.S.
Current PositionMean
(2019)
Mean
(2020)
Change
(19-20)
Median
(2019)
Median
(2020)
Change
(19-20)
25th
Percentile
75th
PercentileCount
Whole Sample: with top 5% $85,060 $88,421 4% $74,000 $75,000 1% $56,000 $105,000 2487
Sample w/o top 5% $76,920 $79,590 3% $72,000 $75,000 4% $55,000 $100,000 2362
Agency CEO or Executive Director $102,383 $96,783 -5% $65,875 $86,000 31% $66,000 $119,500 373
Dean or Unit Head - $142,818 - - $120,000 - $84,000 $173,000 11
Chief Operating Officer - $106,158 - - $104,000 - $69,500 $117,500 19
Chief Development Officer: Vice Chancellor,
Vice President, or Director of Development,
Fundraising or Institutional Relations
$97,192 $96,725 0% $115,000 $83,000 -28% $65,000 $113,750 1007
Associate Vice Chancellor, Deputy Director,
Associate Director/Assistant or Associate Vice
President or equivalent
$93,940 $107,164 14% $83,500 $90,000 8% $70,000 $129,000 125
Program Director/Manager $73,354 $72,682 -1% $67,000 $65,000 -3% $54,625 $85,000 262
Fundraising Officer $71,060 $71,836 1% $66,000 $68,000 3% $51,500 $85,000 349
Grants Manager - $57,058 - - $52,000 - $47,000 $62,000 56
Other Fundraising Staff Position $48,377 $46,188 -5% $46,000 $45,000 -2% $39,505 $51,406 146
Consultant - Principal, Senior Staff member,
Campaign Director in Full-service Firm$119,829 $154,200 29% $117,500 $120,000 2% $67,000 $165,000 61
Consultant - Staff member at Full-Service Firm $60,625 $61,278 1% $60,000 $55,113 -8% $37,250 $77,000 8
Consultant - Specialized, independent or small-
shop consultancy$82,557 $83,499 1% $70,500 $65,000 $38,500 $96,330 50
Moved to employment in a field other than
fundraising- $60,000 - - $60,000 - $60,000 $60,000 1
Retired - $70,000 - - $70,000 - $70,000 $70,000 1
None of the Above $76,275 $65,873 -14% $62,000 $51,300 -17% $48,500 $88,500 15

65 | ©2021 AFP Compensation & Benefits Report
Table 45: Compensation by subsector– U.S.
Subsector / Organizational FocusMean
(2019)
Mean
(2020)
Change
(19-20)
Median
(2019)
Median
(2020)
Change
(19-20)
25th
Percentile
75th
PercentileCount
Whole Sample: with top 5% $85,060 $88,421 4% $74,000 $75,000 1% $56,000 $105,000 2,487
Sample w/o top 5% $76,920 $79,590 3% $72,000 $75,000 4% $55,000 $100,000 2,362
Animals/Animal Welfare $75,910 $76,673 1% $66,575 $68,000 2% $48,558 $87,382 73
Arts: Cultural or Heritage Focus - $86,644 - - $71,000 - $52,174 $95,250 98
Arts: Performance, Exhibition, Creation - $78,635 - - $65,000 - $50,000 $89,500 207
Arts: Public Broadcasting, Nonprofit Publishing $118,305 $74,309 -37% $71,000 $61,000 -14% $47,000 $81,000 21
Association or Membership Foundation $85,386 $95,089 11% $82,500 $91,400 11% $64,250 $116,125 36
Civic and Public Affairs $83,166 $82,913 0% $67,750 $70,000 3% $54,000 $95,000 61
Community Development/Economic
Development$74,352 $71,128 -4% $62,125 $63,500 2% $53,420 $83,625 92
Education: Higher Education $99,167 $102,515 3% $85,000 $93,227 10% $71,100 $120,000 266
Education: Primary or Secondary Education $85,704 $86,784 1% $75,000 $75,000 0% $59,000 $110,000 195
Education: Pre-K $78,445 $74,177 -5% $68,700 $65,000 -5% $52,250 $84,500 62
Education: Other - $88,218 - - $75,000 -% $55,000 $94,875 108
Environment $81,676 $79,920 -2% $73,000 $71,000 -3% $60,000 $95,000 117
Fundraising & Allocations: Federated or
Collective Fundraising- $72,566 - - $60,500 - $48,750 $87,250 28
Fundraising & Grantmaking: Community
Foundation, Donor-Advised Fund Sponsor- $93,020 -% - $84,000 - $65,000 $110,000 53
Government or Quasi-Governmental Agency $74,590 $83,162 11% $69,000 $73,500 7% $72,819 $79,500 7
Health: National or Regional Health Agency $89,274 $86,942 -3% $72,000 $78,700 9% $60,500 $113,250 75
Health Services $92,124 $98,957 7% $80,000 $85,000 6% $64,000 $120,373 307
Human Services: Development & Social
Services$74,420 $78,265 5% $66,000 $70,000 6% $53,250 $91,243 494
Human Services: Criminal Justice, Legal Aid,
Employment, Housing, Homelessness- $75,154 - - $69,500 -% $53,633 $88,250 188
Human Services: Multi-Service Center - $92,770 - - $68,000 -% $54,250 $92,400 99
International: Emergency Relief/Humanitarian
Aid$75,720 $86,047 14% $75,000 $64,000 -15% $56,000 $92,391 12
International Development/Overseas Aid and
Support (excluding emergency relief)$97,055 $87,217 -10% $75,000 $70,000 -7% $53,000 $100,000 29
Religious Congregation, Ministry, Broadcast, or
Publishing; Organizing Body of a Faith (synod,
diocese, union, etc.)
$84,144 $79,819 -5% $75,000 $75,000 0% $55,375 $100,063 76
Scientific or Social Science Research or Other
Educational Body (includes think tanks)$103,875 $123,422 19% $108,000 $118,000 9% $75,500 $147,500 27
None of the above - $88,514 - - $86,000 -% $64,536 $108,000 83

66 | ©2021 AFP Compensation & Benefits Report
Table 46: Compensation by organizational region – U.S.
Organizational RegionMean
(2019)
Mean
(2020)
Change
(19-20)
Median
(2019)
Median
(2020)
Change
(19-20)
25th
Percentile
75th
PercentileCount
Whole Sample: with top 5% $88,421 $75,000 $56,000 $105,000 2,487
Sample w/o top 5% $79,590 $75,000 $55,000 $100,000 2,362
Northeast (Connecticut, Maine, Massachusetts,
New Hampshire, Rhode Island, Vermont)$101,069 $83,000 $65,000 $123,000 149
Mid-Atlantic (New Jersey, New York,
Pennsylvania)$84,319 $75,000 $56,000 $100,750 286
South Atlantic (Delaware, District of Columbia,
Florida, Georgia, Maryland, North Carolina,
South Carolina, Virginia, West Virginia)
$88,486 $75,000 $55,500 $100,000 487
East South Central (Alabama, Kentucky,
Mississippi, Tennessee)$89,011 $70,000 $55,000 $92,000 107
Southwest (Arkansas, Louisiana, Oklahoma,
Texas)$85,548 $75,925 $55,000 $104,625 286
East North Central (Illinois, Indiana, Michigan
Ohio, Wisconsin)$82,153 $70,000 $54,000 $100,000 465
West North Central (Iowa, Kansas, Minnesota,
Missouri, Nebraska, North Dakota, South
Dakota)
$81,917 $73,000 $51,000 $94,500 221
Mountain (Arizona, Colorado, Idaho, Montana,
New Mexico, Nevada, Utah, Wyoming,)$84,427 $73,000 $54,000 $94,000 139
Pacific (Alaska, California, Hawaii, Oregon,
Washington)$100,358 $91,232 $68,000 $120,000 342
Islands: Puerto Rico, Virgin Islands, Guam,
American Samoa$45,850 $45,850 $43,775 $47,925 2
No region specified $396,667 $120,000 $95,000 $560,000 3
Scope of ServiceMean
(2019)
Mean
(2020)
Change
(19-20)
Median
(2019)
Median
(2020)
Change
(19-20)
25th
Percentile
75th
PercentileCount
Whole Sample: with top 5% $85,060 $88,421 4% $74,000 $75,000 1% $56,000 $105,000 2,487
Sample w/o top 5% $76,920 $79,590 3% $72,000 $75,000 4% $55,000 $100,000 2,362
International $98,028 $103,773 6% $82,000 $87,382 7% $63,000 $120,000 259
National $99,141 $103,242 4% $85,000 $89,500 5% $63,000 $125,000 356
Selected States (operations in states separated by other states)
- $93,095 - - $85,000 - $62,300 $109,000 129
State and/or Regional (operations in more than one contiguous state)
- $90,395 - - $76,000 - $58,500 $105,000 647
Local or Multiple Communities $76,568 $81,043 6% $69,000 $72,086 4% $54,000 $98,000 1,405
Table 47: Compensation by organizational scope – U.S.

67 | ©2021 AFP Compensation & Benefits Report
Table 48: Size of metropolitan area where the survey participant’s office is located –
U.S.
Table 49: Compensation by organizational total expenditures (budget) – U.S.
Size of Metro AreaMean
(2019)
Mean
(2020)
Change
(19-20)
Median
(2019)
Median
(2020)
Change
(19-20)
25th
Percentile
75th
PercentileCount
Whole Sample: with top 5% $85,060 $88,421 4% $74,000 $75,000 1% $56,000 $105,000 2,487
Sample w/o top 5% $76,920 $79,590 3% $72,000 $75,000 4% $55,000 $100,000 2,362
Population less than 50,000 $76,392 $80,515 5% $64,326 $72,000 12% $52,025 $96,000 267
Population of 50,000-999,999 $75,702 $78,499 4% $67,000 $71,000 6% $54,000 $95,000 1,123
Population of 1,000,000-2,999,999 $88,054 $92,256 5% $79,250 $76,000 -4% $57,000 $103,250 567
Population of 3 million or more $104,680 $109,571 5% $90,000 $94,765 5% $70,000 $128,500 519
Annual Budget of OrganizationMean
(2019)
Mean
(2020)
Change
(19-20)
Median
(2019)
Median
(2020)
Change
(19-20)
25th
Percentile
75th
PercentileCount
Whole Sample: with top 5% $85,060 $88,421 4% $74,000 $75,000 1% $56,000 $105,000 2,487
Sample w/o top 5% $76,920 $79,590 3% $72,000 $75,000 4% $55,000 $100,000 2,362
Less than $250,000 $59,784 $59,306 -1% $55,500 $56,750 2% $40,750 $71,000 92
$250,000-$499,999 $72,833 $73,059 0% $65,000 $70,000 8% $50,000 $89,500 167
$500,000-$999,999 $68,905 $76,713 11% $61,000 $65,000 7% $50,750 $83,875 224
$1,000,000-$2,999,999 $73,628 $78,336 6% $65,000 $70,000 8% $54,000 $90,652 507
$3,000,000-$4,999,999 $78,049 $84,537 8% $70,000 $76,000 9% $58,000 $103,000 229
$5,000,000-$9,999,999 $86,716 $87,643 1% $78,000 $80,000 3% $62,000 $103,500 261
$10,000,000-$49,999,999 $96,190 $103,356 7% $83,000 $88,000 6% $67,000 $125,000 441
$50,000,000-$74,999,999 $97,950 $101,366 3% $85,000 $88,000 4% $69,524 $123,250 58
$75,000,000 - $99,999,999 $101,664 $110,567 9% $85,000 $88,775 4% $72,000 $138,750 42
$100 million or more $121,052 $124,639 3% $103,000 $112,000 9% $83,000 $154,000 137
I don't know $70,955 $76,871 8% $65,500 $70,500 8% $52,875 $94,000 184

68 | ©2021 AFP Compensation & Benefits Report
Table 50: Compensation by Amount Raised – U.S.
Annual Amount RaisedMean
(2019)
Mean
(2020)
Change
(19-20)
Median
(2019)
Median
(2020)
Change
(19-20)
25th
Percentile
75th
PercentileCount
Whole Sample: with top 5% $85,060 $88,421 4% $74,000 $75,000 1% $56,000 $105,000 2,487
Sample w/o top 5% $76,920 $79,590 3% $72,000 $75,000 4% $55,000 $100,000 2,362
Less than $100,000 $54,172 $57,083 5% $50,000 $55,500 11% $40,000 $67,750 92
$100,000-$249,999 $61,198 $66,095 8% $57,000 $62,150 9% $47,000 $78,563 184
$250,000-$499,999 $65,130 $68,859 6% $60,000 $65,000 8% $52,000 $82,000 228
$500,000-$999,999 $72,032 $76,336 6% $66,000 $70,500 7% $54,000 $92,750 366
$1,000,000-$2,999,999 $79,673 $85,982 8% $74,000 $77,413 5% $60,000 $100,504 578
$3,000,000-$4,999,999 $86,104 $100,052 16% $79,000 $92,000 16% $66,500 $125,148 252
$5,000,000-$9,999,999 $98,845 $100,285 1% $85,000 $88,000 4% $65,000 $120,000 212
$10,000,000-$49,999,999 $110,046 $105,038 -5% $87,642 $91,500 4% $66,750 $125,000 244
$50,000,000-$74,999,999 $105,271 $110,330 5% $85,000 $91,000 7% $70,000 $115,000 41
$75,000,000-$99,999,999 $105,733 $127,846 21% $85,000 $100,000 18% $76,000 $200,000 17
$100 million or more $106,759 $120,434 13% $91,750 $105,000 14% $72,000 $153,000 69
I don't know. - $53,869 - - $52,000 - $43,500 $62,958 31

69 | ©2021 AFP Compensation & Benefits Report
Appendix 5: Compensation – CanadaTable 51: Compensation by Position – Canada
Current PositionMean
(2019)
Mean
(2020)
Change
(19-20)
Median
(2019)
Median
(2020)
Change
(19-20)
25th
Percentile
75th
PercentileCount
Whole Sample: with top 5% $86,876 $90,511 4% $80,000 $78,000 -3% $60,000 $109,500 423
Sample w/o top 5% $80,677 $82,850 3% $78,000 $75,000 -4% $60,000 $100,000 401
Agency CEO or Executive Director $109,162 $128,155 17% $100,000 $113,000 13% $82,000 $160,000 77
Dean or Unit Head - $89,000 - - $89,000 - $85,000 $93,000 2
Chief Operating Officer - $131,250 - - $144,500 - $121,500 $154,250 4
Chief Development Officer: Vice Chancellor,
Vice President, or Director of Development,
Fundraising or Institutional Relations
$103,311 $101,738 -2% $100,000 $88,000 -12% $70,000 $130,000 91
Associate Vice Chancellor, Deputy Director,
Associate Director/Assistant or Associate Vice
President or equivalent
$108,667 $110,026 1% $108,500 $107,000 -1% $88,000 $137,000 19
Program Director/Manager $79,947 $73,469 -8% $79,900 $71,234 -11% $57,000 $85,000 77
Fundraising Officer $66,284 $65,838 -1% $66,000 $67,000 2% $52,800 $76,500 97
Grants Manager - $70,200 - - $73,000 - $60,000 $75,000 5
Other Fundraising Staff Position $52,321 $51,281 -2% $48,500 $48,500 0% $44,500 $60,369 24
Consultant - Principal, Senior Staff member,
Campaign Director in Full-service Firm$110,333 $116,773 6% $109,000 $120,000 10% $85,750 $150,000 11
Consultant - Staff member at Full-Service Firm $115,000 $74,667 -35% $115,000 $77,000 -33% $53,750 $92,750 6
Consultant - Specialized, independent or small-
shop consultancy$72,692 $120,833 66% $50,000 $100,000 100% $66,250 $122,500 6
None of the Above $106,250 $71,000 -33% $75,000 $71,250 -5% $64,250 $78,000 4

70 | ©2021 AFP Compensation & Benefits Report
Table 52: Compensation by Subsector– Canada
Subsector / Organizational FocusMean
(2019)
Mean
(2020)
Change
(19-20)
Median
(2019)
Median
(2020)
Change
(19-20)
25th
Percentile
75th
PercentileCount
Whole Sample: with top 5% $86,876 $90,511 4% $80,000 $78,000 -3% $60,000 $109,500 423
Sample w/o top 5% $80,677 $82,850 3% $78,000 $75,000 -4% $60,000 $100,000 401
Animals/Animal Welfare $83,283 $60,862 -27% $77,350 $65,000 -16% $44,515 $73,500 7
Arts: Cultural or Heritage Focus - $81,311 - - $74,700 - $58,200 $95,500 16
Arts: Performance, Exhibition, Creation $87,872 $76,821 -13% $77,500 $62,000 -20% $56,000 $83,000 25
Arts: Public Broadcasting, Nonprofit Publishing $55,500 $23,751 -57% $55,500 $23,751 -57% $11,876 $35,625 2
Association or Membership Foundation $74,475 $80,001 7% $53,950 $80,001 48% $40,001 $120,000 2
Civic and Public Affairs $67,475 $54,335 -19% $64,500 $65,000 1% $52,258 $68,750 6
Community Development/Economic
Development$64,379 $74,795 16% $63,500 $72,500 14% $57,675 $86,275 18
Education: Higher Education $91,846 $78,000 -15% $84,000 $69,000 -18% $67,000 $84,500 3
Education: Primary or Secondary Education $97,375 $98,032 1% $98,565 $88,000 -11% $72,000 $122,000 57
Education: Pre-K $74,667 $85,977 15% $58,000 $71,400 23% $62,000 $100,500 19
Education: Other - $50,500 - - $50,500 - $42,250 $58,750 2
Environment $78,453 $109,764 40% $75,000 $107,000 43% $72,500 $148,500 11
Fundraising & Allocations: Federated or
Collective Fundraising$75,770 $67,339 -11% $75,000 $65,000 -13% $55,000 $78,750 18
Fundraising & Grantmaking: Community
Foundation, Donor-Advised Fund Sponsor- $143,575 - - $137,150 - $97,500 $183,225 4
Government or Quasi-Governmental Agency $67,500 $86,577 28% $67,500 $77,000 14% $60,000 $117,000 17
Health: National or Regional Health Agency $90,283 $88,940 -1% $82,500 $77,000 -7% $52,000 $120,000 25
Health Services $92,463 $100,146 8% $81,000 $83,000 2% $61,106 $111,496 96
Human Services: Development & Social
Services$74,337 $75,772 2% $69,470 $71,065 2% $56,225 $86,275 58
Human Services: Criminal Justice, Legal Aid,
Employment, Housing, Homelessness- $71,689 - - $70,000 - $62,250 $81,675 24
Human Services: Multi-Service Center - $60,142 - - $52,581 - $43,000 $63,000 9
International: Emergency Relief/Humanitarian
Aid$97,841 $73,333 -25% $85,000 $68,500 -19% $54,500 $69,750 6
International Development/Overseas Aid and
Support (excluding emergency relief)$82,805 $73,656 -11% $75,000 $69,000 -8% $54,500 $75,750 16
Religious Congregation, Ministry, Broadcast, or
Publishing; Organizing Body of a Faith (synod,
diocese, union, etc.)
$88,209 $73,100 -17% $85,000 $80,000 -6% $51,000 $88,750 10
Scientific or Social Science Research or Other
Educational Body (includes think tanks)$95,100 $83,534 -12% $70,000 $75,000 7% $22,150 $143,750 6
None of the above - $95,290 - - $77,700 - $65,875 $115,750 10

71 | ©2021 AFP Compensation & Benefits Report
Table 53: Compensation by organizational region – Canada
Table 54: Compensation by organizational scope – Canada
Table 55: Size of metropolitan area where the survey participant’s office is located –
Canada
Organizational RegionMean
(2019)
Mean
(2020)
Change
(19-20)
Median
(2019)
Median
(2020)
Change
(19-20)
25th
Percentile
75th
PercentileCount
Whole Sample: with top 5% $90,511 $78,000 $60,000 $109,500 423
Sample w/o top 5% $82,850 $75,000 $60,000 $100,000 401
Prince Edward Island, New Brunswick or Nova Scotia
$68,356 $60,000 $46,700 $71,000 21
Newfoundland and Labrador $74,059 $75,000 $58,000 $90,000 11
Quebec $97,144 $87,500 $68,750 $110,000 32
Ontario $97,380 $81,000 $61,106 $120,500 192
Manitoba $71,880 $61,250 $53,186 $78,750 26
Saskatchewan $79,288 $72,000 $54,500 $94,500 19
Alberta $84,811 $81,000 $63,000 $103,000 56
British Columbia $93,245 $78,000 $65,000 $117,000 65
Scope of ServiceMean
(2019)
Mean
(2020)
Change
(19-20)
Median
(2019)
Median
(2020)
Change
(19-20)
25th
Percentile
75th
PercentileCount
Whole Sample: with top 5% $86,876 $90,511 4% $80,000 $78,000 -3% $60,000 $109,500 423
Sample w/o top 5% $80,677 $82,850 3% $78,000 $75,000 -4% $60,000 $100,000 401
International $95,797 $98,331 3% $85,000 $77,000 -9% $64,500 $101,000 51
National $89,409 $102,932 15% $80,000 $86,500 8% $64,000 $132,250 100
Selected Provinces (operations in provinces separated by other provinces)
- $89,819 - - $77,000 - $55,000 $102,000 33
Provincial and/or Regional (operations in more than one contiguous province)
$90,668 $82,974 -8% $80,000 $74,000 -8% $57,175 $99,500 102
Local or Multiple Communities $80,406 $83,710 4% $77,000 $73,000 -5% $56,000 $100,000 201
Size of Metro AreaMean
(2019)
Mean
(2020)
Change
(19-20)
Median
(2019)
Median
(2020)
Change
(19-20)
25th
Percentile
75th
PercentileCount
Whole Sample: with top 5% $86,876 $90,511 4% $80,000 $78,000 -3% $60,000 $109,500 423
Sample w/o top 5% $80,677 $82,850 3% $78,000 $75,000 -4% $60,000 $100,000 401
Population less than 50,000 $78,562 $87,782 12% $80,000 $81,000 1% $56,250 $100,044 26
Population of 50,000-999,999 $78,190 $81,207 4% $72,250 $71,234 -1% $55,000 $95,000 185
Population of 1,000,000-2,999,999 $89,660 $86,863 -3% $80,000 $79,000 -1% $61,738 $105,000 123
Population of 3 million or more $99,270 $113,580 14% $90,000 $100,000 11% $72,000 $142,000 87

72 | ©2021 AFP Compensation & Benefits Report
Table 56: Compensation by organizational total expenditures (budget) – Canada
Table 57: Compensation by Amount Raised – Canada
Annual Budget of OrganizationMean
(2019)
Mean
(2020)
Change
(19-20)
Median
(2019)
Median
(2020)
Change
(19-20)
25th
Percentile
75th
PercentileCount
Whole Sample: with top 5% $86,876 $90,511 4% $80,000 $78,000 -3% $60,000 $109,500 423
Sample w/o top 5% $80,677 $82,850 3% $78,000 $75,000 -4% $60,000 $100,000 401
Less than $250,000 $58,390 $68,323 17% $53,500 $65,500 22% $39,803 $81,000 12
$250,000-$499,999 $87,922 $74,350 -15% $85,883 $75,000 -13% $56,000 $88,000 33
$500,000-$999,999 $80,610 $93,125 16% $80,000 $95,000 19% $60,000 $120,000 39
$1,000,000-$2,999,999 $80,103 $83,113 4% $75,500 $65,000 -14% $53,000 $90,000 65
$3,000,000-$4,999,999 $88,487 $98,066 11% $75,000 $80,000 7% $67,500 $125,000 36
$5,000,000-$9,999,999 $87,450 $91,070 4% $80,000 $77,500 -3% $63,750 $105,750 40
$10,000,000-$49,999,999 $99,913 $100,411 0% $85,000 $85,000 0% $69,000 $121,000 63
$50,000,000-$74,999,999 $98,713 $136,096 38% $82,563 $102,000 24% $68,000 $158,000 13
$75,000,000 - $99,999,999 $82,002 $86,000 5% $81,000 $86,000 6% $86,000 $86,000 1
$100 million or more $110,786 $103,000 -7% $94,500 $94,000 -1% $76,644 $133,500 23
I don't know $74,175 $75,301 2% $70,250 $70,000 0% $53,645 $84,250 68
Annual Amount RaisedMean
(2019)
Mean
(2020)
Change
(19-20)
Median
(2019)
Median
(2020)
Change
(19-20)
25th
Percentile
75th
PercentileCount
Whole Sample: with top 5% $86,876 $90,511 4% $80,000 $78,000 -3% $60,000 $109,500 423
Sample w/o top 5% $80,677 $82,850 3% $78,000 $75,000 -4% $60,000 $100,000 401
Less than $100,000 $55,623 $56,652 2% $54,000 $58,000 7% $34,000 $74,700 19
$100,000-$249,999 $72,988 $62,244 -15% $62,000 $57,500 -7% $48,366 $71,500 16
$250,000-$499,999 $70,890 $75,751 7% $68,500 $70,000 2% $54,750 $89,000 34
$500,000-$999,999 $70,556 $79,910 13% $66,500 $73,592 11% $56,675 $97,750 44
$1,000,000-$2,999,999 $86,074 $87,620 2% $84,100 $79,000 -6% $63,850 $100,000 80
$3,000,000-$4,999,999 $92,039 $103,330 12% $86,500 $94,500 9% $72,250 $130,000 42
$5,000,000-$9,999,999 $94,462 $97,256 3% $85,000 $80,000 -6% $62,000 $132,500 47
$10,000,000-$49,999,999 $93,695 $104,762 12% $84,500 $90,000 7% $68,500 $121,032 60
$50,000,000-$74,999,999 $86,661 $85,367 -1% $78,000 $76,287 -2% $51,500 $107,500 11
$75,000,000-$99,999,999 $78,900 $43,000 -46% $58,000 $43,000 -26% $43,000 $43,000 1
$100 million or more $124,010 $127,194 3% $100,000 $83,000 -17% $72,000 $138,250 18
I don't know. - $74,491 - - $64,000 - $55,495 $85,000 16

73 | ©2021 AFP Compensation & Benefits Report
Appendix 6: Benefits Offered By Position – U.S.Note percentages in this section are based on the total number of participants from this country (n = 3,261).

74 | ©2021 AFP Compensation & Benefits Report
Current Position
Employer contribution tow
ard m
edical insurance or funding for m
edical expenses
Medical Savings Account
Employee Assistance Program
Dental Insurance
Elder Care
Mental H
ealth Coverage
Prescription Drug C
overage
Supplementary Long-Term
Care
Vision Insurance
Alternative Care C
overage
None of these
Total# 2138 1274 1041 1953 79 995 1434 597 1754 308 252
% 65% 39% 32% 60% 2% 30% 44% 18% 53% 9% 8%
Agency CEO or Executive Director# 277 107 101 212 3 98 158 55 187 34 83
% 72% 28% 26% 55% 1% 25% 41% 14% 48% 9% 21%
Dean or Unit Head# 11 8 6 10 2 7 10 6 10 3 0
% 92% 67% 50% 83% 17% 58% 83% 50% 83% 25% 0%
Chief Operating Officer# 14 9 9 13 1 9 11 6 12 3 5
% 67% 43% 43% 62% 5% 43% 52% 29% 57% 14% 24%
Chief Development Officer: Vice Chancellor, Vice President, or Director of Development, Fundraising or Institutional Relations
# 923 533 446 844 24 418 637 241 749 115 53
% 89% 51% 43% 81% 2% 40% 61% 23% 72% 11% 5%
Associate Vice Chancellor, Deputy Director, Associate Director/Assistant or Associate Vice President or equivalent
# 121 98 77 115 13 83 96 57 108 28 3
% 95% 77% 61% 91% 10% 65% 76% 45% 85% 22% 2%
Program Director/Manager# 239 168 133 230 11 122 174 75 212 42 9
% 86% 61% 48% 83% 4% 44% 63% 27% 77% 15% 3%
Fundraising Officer# 322 220 174 311 16 168 219 101 288 55 9
% 87% 59% 47% 84% 4% 45% 59% 27% 78% 15% 2%
Grants Manager# 50 28 25 43 0 24 27 9 39 1 4
% 85% 47% 42% 73% 0% 41% 46% 15% 66% 2% 7%
Other Fundraising Staff Position# 123 73 51 123 6 43 63 32 109 18 7
% 80% 47% 33% 80% 4% 28% 41% 21% 71% 12% 5%
Consultant - Principal, Senior Staff member, Campaign Director in Full-service Firm
# 28 12 7 27 2 11 20 6 19 5 31
% 42% 18% 11% 41% 3% 17% 30% 9% 29% 8% 47%
Consultant - Staff member at Full-Service Firm
# 5 1 0 4 0 2 3 2 3 1 3
% 56% 11% 0% 44% 0% 22% 33% 22% 33% 11% 33%
Consultant - Specialized, independent or small-shop consultancy
# 10 6 6 8 1 3 6 3 6 2 41
% 18% 11% 11% 14% 2% 5% 11% 5% 11% 4% 73%
Moved to employment in a field other than fundraising
# 1 1 0 1 0 0 0 0 0 0 0
% 100% 100% 0% 100% 0% 0% 0% 0% 0% 0% 0%
Retired# 1 1 1 1 0 1 1 0 1 0 0
% 100% 100% 100% 100% 0% 100% 100% 0% 100% 0% 0%
None of the Above# 11 7 3 8 0 4 6 2 8 1 3
% 69% 44% 19% 50% 0% 25% 38% 13% 50% 6% 19%
Table 58: Health Insurance Offered by Position - U.S. See note on page 73.

75 | ©2021 AFP Compensation & Benefits Report
Current Position
401(k) salary deferral plan
403(b) salary deferral plan
Defined Benefit Pension Plan
Another Defined contribution
plan
Profit-Sharing Plan
Thrift/Savings Plan
Money Purchase Pesion Plan
SEP (Simplified Em
ployee Pension)
SIMPLE (Savings Incentive M
atch Plan for Em
ployees) IRA
Non-IRS-Q
ualified Plan
IRA (Individual Retirement
Account)
My organization does not offer
other retirement plans.
I don't know
Total# 1110 1111 172 199 30 19 9 64 108 11 167 1436 292
% 34% 34% 5% 6% 1% 1% 0% 2% 3% 0% 5% 44% 9%
Agency CEO or Executive Director# 142 101 20 28 6 3 3 12 27 1 20 249 5
% 37% 26% 5% 7% 2% 1% 1% 3% 7% 0% 5% 64% 1%
Dean or Unit Head# 7 6 4 0 0 0 0 0 0 0 1 4 2
% 58% 50% 33% 0% 0% 0% 0% 0% 0% 0% 8% 33% 17%
Chief Operating Officer# 6 8 3 2 1 1 0 0 1 1 1 10 1
% 29% 38% 14% 10% 5% 5% 0% 0% 5% 5% 5% 48% 5%
Chief Development Officer: Vice Chancellor, Vice President, or Director of Development, Fundraising or Institutional Relations
# 453 500 66 89 11 8 1 21 45 5 47 621 96
% 44% 48% 6% 9% 1% 1% 0% 2% 4% 0% 5% 60% 9%
Associate Vice Chancellor, Deputy Director, Associate Director/Assistant or Associate Vice President or equivalent
# 65 78 11 11 1 2 0 1 2 2 6 73 15
% 51% 61% 9% 9% 1% 2% 0% 1% 2% 2% 5% 57% 12%
Program Director/Manager# 124 140 20 22 1 1 2 1 8 0 26 143 40
% 45% 51% 7% 8% 0% 0% 1% 0% 3% 0% 9% 52% 14%
Fundraising Officer# 171 172 36 33 4 4 3 4 17 1 32 160 61
% 46% 46% 10% 9% 1% 1% 1% 1% 5% 0% 9% 43% 16%
Grants Manager# 31 26 3 2 0 0 0 0 2 0 3 26 17
% 53% 44% 5% 3% 0% 0% 0% 0% 3% 0% 5% 44% 29%
Other Fundraising Staff Position# 74 63 6 10 0 0 0 2 2 1 18 67 41
% 48% 41% 4% 6% 0% 0% 0% 1% 1% 1% 12% 44% 27%
Consultant - Principal, Senior Staff member, Campaign Director in Full-service Firm
# 22 5 1 2 4 0 0 12 3 0 6 33 1
% 33% 8% 2% 3% 6% 0% 0% 18% 5% 0% 9% 50% 2%
Consultant - Staff member at Full-Service Firm
# 2 1 0 0 1 0 0 0 0 0 0 5 1
% 22% 11% 0% 0% 11% 0% 0% 0% 0% 0% 0% 56% 11%
Consultant - Specialized, independent or small-shop consultancy
# 7 3 0 0 1 0 0 10 1 0 6 31 7
% 13% 5% 0% 0% 2% 0% 0% 18% 2% 0% 11% 55% 13%
Moved to employment in a field other than fundraising
# 0 1 0 0 0 0 0 0 0 0 0 1 0
% 0% 100% 0% 0% 0% 0% 0% 0% 0% 0% 0% 100% 0%
Retired# 1 0 0 0 0 0 0 0 0 0 0 1 0
% 100% 0% 0% 0% 0% 0% 0% 0% 0% 0% 0% 100% 0%
None of the Above# 4 5 1 0 0 0 0 1 0 0 0 11 3
% 25% 31% 6% 0% 0% 0% 0% 6% 0% 0% 0% 69% 19%
Table 59: Retirement Benefits Available by Position – U.S. See note on page 73.

76 | ©2021 AFP Compensation & Benefits Report
Current Position
Group life insurance
Accident insurance
Short-term disability insurance
Long-term disability insurance
Tuition reimbursem
ent
Paid or partially paid parental leave (other than FM
LA time off)
Childcare onsite or childcare
benefit
Car or car allow
ance
Local transportation subsidy
Parking
Cellular phone or cell phone plan
allowance
Hom
e computer
Professional dues
Professional liability insurance
Relocation expenses
Service on external volunteer boards/com
mittees
None of the above
Total# 1473 837 1477 1404 688 649 159 213 405 683 1098 763 1626 217 122 809 157
% 45% 26% 45% 43% 21% 20% 5% 6% 12% 21% 33% 23% 50% 7% 4% 25% 5%
Agency CEO or Executive Director# 166 100 149 148 65 68 16 36 46 81 177 120 253 92 18 155 42
% 43% 26% 39% 38% 17% 18% 4% 9% 12% 21% 46% 31% 65% 24% 5% 40% 11%
Dean or Unit Head# 8 8 8 9 4 6 2 4 2 6 7 4 8 2 1 5 0
% 67% 67% 67% 75% 33% 50% 17% 33% 17% 50% 58% 33% 67% 17% 8% 42% 0%
Chief Operating Officer# 12 8 9 12 6 3 1 2 4 8 8 4 15 3 3 11 1
% 57% 38% 43% 57% 29% 14% 5% 10% 19% 38% 38% 19% 71% 14% 14% 52% 5%
Chief Development Officer: Vice Chancellor, Vice President, or Director of Development, Fundraising or Institutional Relations
# 650 337 628 596 262 268 51 75 144 278 466 302 723 68 48 362 38
% 63% 32% 60% 57% 25% 26% 5% 7% 14% 27% 45% 29% 70% 7% 5% 35% 4%
Associate Vice Chancellor, Deputy Director, Associate Director/Assistant or Associate Vice President or equivalent
# 96 61 94 93 59 44 15 12 27 37 68 37 88 5 10 46 1
% 76% 48% 74% 73% 46% 35% 12% 9% 21% 29% 54% 29% 69% 4% 8% 36% 1%
Program Director/Manager# 168 98 181 182 102 86 31 14 51 77 118 81 159 6 8 65 7
% 61% 35% 65% 66% 37% 31% 11% 5% 18% 28% 43% 29% 57% 2% 3% 23% 3%
Fundraising Officer# 244 140 255 229 125 104 25 38 81 110 146 101 221 14 19 106 11
% 66% 38% 69% 62% 34% 28% 7% 10% 22% 30% 39% 27% 60% 4% 5% 29% 3%
Grants Manager# 24 18 32 27 10 16 2 2 7 17 19 16 34 2 2 13 2
% 41% 31% 54% 46% 17% 27% 3% 3% 12% 29% 32% 27% 58% 3% 3% 22% 3%
Other Fundraising Staff Position# 76 49 87 80 39 40 13 8 28 39 38 53 66 4 6 16 9
% 49% 32% 56% 52% 25% 26% 8% 5% 18% 25% 25% 34% 43% 3% 4% 10% 6%
Consultant - Principal, Senior Staff member, Campaign Director in Full-service Firm
# 10 5 14 14 5 9 2 12 8 16 25 24 29 14 1 19 17
% 15% 8% 21% 21% 8% 14% 3% 18% 12% 24% 38% 36% 44% 21% 2% 29% 26%
Consultant - Staff member at Full-Service Firm
# 2 1 2 2 1 2 0 1 0 1 4 3 5 1 1 2 1
% 22% 11% 22% 22% 11% 22% 0% 11% 0% 11% 44% 33% 56% 11% 11% 22% 11%
Consultant - Specialized, independent or small-shop consultancy
# 7 6 6 2 5 0 0 8 5 8 13 16 14 6 3 7 27
% 13% 11% 11% 4% 9% 0% 0% 14% 9% 14% 23% 29% 25% 11% 5% 13% 48%
Moved to employment in a field other than fundraising
# 0 0 1 1 0 0 0 1 0 0 1 0 1 0 0 0 0
% 0% 0% 100% 100% 0% 0% 0% 100% 0% 0% 100% 0% 100% 0% 0% 0% 0%
Retired# 1 0 1 1 1 0 0 0 0 0 1 1 1 0 0 0 0
% 100% 0% 100% 100% 100% 0% 0% 0% 0% 0% 100% 100% 100% 0% 0% 0% 0%
None of the Above# 8 4 7 6 3 3 1 0 2 4 7 1 7 0 2 2 1
% 50% 25% 44% 38% 19% 19% 6% 0% 13% 25% 44% 6% 44% 0% 13% 13% 6%
Table 60: Other Benefits Available by Position – U.S. See note on page 73.

77 | ©2021 AFP Compensation & Benefits Report
Appendix 7: Benefits Offered By Position – CanadaNote that the data in this appendix, consistent with all other appendices, are based on the total number of study participants from the U.S. Percentages will not match the figures in this section, which are based on participants who answered the specific question.

78 | ©2021 AFP Compensation & Benefits Report
Current Position
Basic Hospitalization/M
ajor M
edical
Major M
edical
Employee Assistance Program
Dental Insurance
Elder Care
Mental H
ealth Coverage
Prescription Drug C
overage
Supplementary long-term
care
Vision Insurance
Alternative Care C
overage
My organization offers none of
these.
Other
Total# 351 248 311 377 29 278 384 144 319 347 31 23
% 62% 44% 55% 67% 5% 49% 68% 25% 56% 61% 5% 4%
Agency CEO or Executive Director# 66 51 54 65 3 42 68 31 57 60 6 5
% 84% 65% 68% 82% 4% 53% 86% 39% 72% 76% 8% 6%
Dean or Unit Head# 0 0 0 0 0 1 0 0 0 1 0 1
% 0% 0% 0% 0% 0% 50% 0% 0% 0% 50% 0% 50%
Chief Operating Officer# 4 3 4 4 1 3 4 2 4 4 0 1
% 80% 60% 80% 80% 20% 60% 80% 40% 80% 80% 0% 20%
Chief Development Officer: Vice Chancellor, Vice President, or Director of Development, Fundraising or Institutional Relations
# 80 55 72 85 10 66 88 34 66 76 4 1
% 82% 56% 73% 87% 10% 67% 90% 35% 67% 78% 4% 1%
Associate Vice Chancellor, Deputy Director, Associate Director/Assistant or Associate Vice President or equivalent
# 16 14 15 19 0 13 19 7 15 17 0 1
% 84% 74% 79% 100% 0% 68% 100% 37% 79% 89% 0% 5%
Program Director/Manager# 66 44 62 74 5 54 74 23 63 68 5 6
% 80% 53% 75% 89% 6% 65% 89% 28% 76% 82% 6% 7%
Fundraising Officer# 83 60 78 91 7 73 92 34 80 86 3 3
% 81% 59% 76% 89% 7% 72% 90% 33% 78% 84% 3% 3%
Grants Manager# 3 2 4 4 1 3 4 2 3 4 1 0
% 60% 40% 80% 80% 20% 60% 80% 40% 60% 80% 20% 0%
Other Fundraising Staff Position# 19 13 15 21 2 15 20 6 19 20 2 2
% 63% 43% 50% 70% 7% 50% 67% 20% 63% 67% 7% 7%
Consultant - Principal, Senior Staff member, Campaign Director in Full-service Firm
# 5 3 2 4 0 2 5 2 4 3 4 2
% 45% 27% 18% 36% 0% 18% 45% 18% 36% 27% 36% 18%
Consultant - Staff member at Full-Service Firm
# 6 1 2 6 0 3 6 1 4 4 0 0
% 100% 17% 33% 100% 0% 50% 100% 17% 67% 67% 0% 0%
Consultant - Specialized, independent or small-shop consultancy
# 0 0 0 0 0 0 0 0 0 0 6 0
% 0% 0% 0% 0% 0% 0% 0% 0% 0% 0% 86% 0%
Not working in fundraising at the end of 2020 but hoping to find work in the field again
# 0 0 0 0 0 0 0 0 0 0 0 0
% 0% 0% 0% 0% 0% 0% 0% 0% 0% 0% 0% 0%
None of the Above# 3 2 3 4 0 3 4 2 4 4 0 1
% 60% 40% 60% 80% 0% 60% 80% 40% 80% 80% 0% 20%
Table 61: Health Benefits Offered by Position – Canada See note on page 77.

79 | ©2021 AFP Compensation & Benefits Report
Current Position
Defined Pension Benefit Plan
Defined C
ontribution Plan
Profit-Sharing Plan
Group Registered Retirem
ent Savings Plan (RRSP)
My organization does not offer
retirement benefits.
Don't know
Total# 139 60 2 140 101 15
% 25% 11% 0% 25% 18% 3%
Agency CEO or Executive Director# 28 8 0 16 25 2
% 35% 10% 0% 20% 32% 3%
Dean or Unit Head# 0 0 0 1 1 0
% 0% 0% 0% 50% 50% 0%
Chief Operating Officer# 4 0 0 1 0 0
% 80% 0% 0% 20% 0% 0%
Chief Development Officer: Vice Chancellor, Vice President, or Director of Development, Fundraising or Institutional Relations
# 27 10 0 30 27 4
% 28% 10% 0% 31% 28% 4%
Associate Vice Chancellor, Deputy Director, Associate Director/Assistant or Associate Vice President or equivalent
# 7 6 0 5 2 0
% 37% 32% 0% 26% 11% 0%
Program Director/Manager# 28 13 0 32 14 1
% 34% 16% 0% 39% 17% 1%
Fundraising Officer# 36 14 1 37 11 4
% 35% 14% 1% 36% 11% 4%
Grants Manager# 1 1 0 2 1 0
% 20% 20% 0% 40% 20% 0%
Other Fundraising Staff Position# 6 5 0 11 2 4
% 20% 17% 0% 37% 7% 13%
Consultant - Principal, Senior Staff member, Campaign Director in Full-service Firm
# 0 1 1 3 7 0
% 0% 9% 9% 27% 64% 0%
Consultant - Staff member at Full-Service Firm
# 0 1 0 1 4 0
% 0% 17% 0% 17% 67% 0%
Consultant - Specialized, independent or small-shop consultancy
# 0 0 0 0 6 0
% 0% 0% 0% 0% 86% 0%
Not working in fundraising at the end of 2020 but hoping to find work in the field again
# 0 0 0 0 0 0
% 0% 0% 0% 0% 0% 0%
None of the Above# 2 1 0 1 1 0
% 40% 20% 0% 20% 20% 0%
Table 62: Retirement Benefits Offered by Position – Canada See note on page 77.

80 | ©2021 AFP Compensation & Benefits Report
Current Position
Group Life Insurance
Accident Insurance
Short-Term D
isability Insurance
Long-Term D
isability Insurance
Tuition Reimbursem
ent
Paid or Partially Paid Parental Leave
Childcare O
nsite or Childcare
Benefit
Car or C
ar Allowance
Local Transportation Subsidy
Parking
Cellular Phone or C
ell Phone Plan Allow
ance
Hom
e Com
puter
Professional Dues
Professional Liability Insurance
Relocation Expenses
Service on External Volunteer Boards/C
omm
ittees
None of the above
Total# 314 214 288 313 116 164 23 62 64 145 286 169 277 37 14 113 12
% 56% 38% 51% 55% 21% 29% 4% 11% 11% 26% 51% 30% 49% 7% 2% 20% 2%
Agency CEO or Executive Director# 61 44 48 57 21 20 1 19 9 34 62 31 58 20 3 28 0
% 77% 56% 61% 72% 27% 25% 1% 24% 11% 43% 78% 39% 73% 25% 4% 35% 0%
Dean or Unit Head# 0 1 1 0 1 0 0 0 1 1 2 0 0 0 0 1 0
% 0% 50% 50% 0% 50% 0% 0% 0% 50% 50% 100% 0% 0% 0% 0% 50% 0%
Chief Operating Officer# 4 3 4 4 2 3 1 1 0 2 3 2 3 0 1 1 0
% 80% 60% 80% 80% 40% 60% 20% 20% 0% 40% 60% 40% 60% 0% 20% 20% 0%
Chief Development Officer: Vice Chancellor, Vice President, or Director of Development, Fundraising or Institutional Relations
# 67 37 64 73 21 42 3 12 18 37 67 38 73 5 3 26 1
% 68% 38% 65% 74% 21% 43% 3% 12% 18% 38% 68% 39% 74% 5% 3% 27% 1%
Associate Vice Chancellor, Deputy Director, Associate Director/Assistant or Associate Vice President or equivalent
# 18 8 16 17 5 11 3 1 3 4 13 9 14 0 1 7 0
% 95% 42% 84% 89% 26% 58% 16% 5% 16% 21% 68% 47% 74% 0% 5% 37% 0%
Program Director/Manager# 56 42 53 58 20 28 5 10 13 28 51 30 52 5 0 22 1
% 67% 51% 64% 70% 24% 34% 6% 12% 16% 34% 61% 36% 63% 6% 0% 27% 1%
Fundraising Officer# 80 59 74 78 35 46 7 12 13 19 60 32 53 4 4 17 1
% 78% 58% 73% 76% 34% 45% 7% 12% 13% 19% 59% 31% 52% 4% 4% 17% 1%
Grants Manager# 3 2 3 2 0 1 0 2 2 2 4 5 4 1 0 1 0
% 60% 40% 60% 40% 0% 20% 0% 40% 40% 40% 80% 100% 80% 20% 0% 20% 0%
Other Fundraising Staff Position# 14 10 15 15 9 10 3 1 2 9 12 9 8 1 1 2 1
% 47% 33% 50% 50% 30% 33% 10% 3% 7% 30% 40% 30% 27% 3% 3% 7% 3%
Consultant - Principal, Senior Staff member, Campaign Director in Full-service Firm
# 5 4 5 4 2 0 0 3 2 5 7 7 6 1 0 5 3
% 45% 36% 45% 36% 18% 0% 0% 27% 18% 45% 64% 64% 55% 9% 0% 45% 27%
Consultant - Staff member at Full-Service Firm
# 3 3 3 2 0 2 0 0 0 2 2 2 2 0 0 2 2
% 50% 50% 50% 33% 0% 33% 0% 0% 0% 33% 33% 33% 33% 0% 0% 33% 33%
Consultant - Specialized, independent or small-shop consultancy
# 0 0 0 0 0 0 0 1 1 1 1 2 1 0 0 0 3
% 0% 0% 0% 0% 0% 0% 0% 14% 14% 14% 14% 29% 14% 0% 0% 0% 43%
Not working in fundraising at the end of 2020 but hoping to find work in the field again
# 0 0 0 0 0 0 0 0 0 0 0 0 0 0 0 0 0
% 0% 0% 0% 0% 0% 0% 0% 0% 0% 0% 0% 0% 0% 0% 0% 0% 0%
None of the Above# 3 1 2 3 0 1 0 0 0 1 2 2 3 0 1 1 0
% 60% 20% 40% 60% 0% 20% 0% 0% 0% 20% 40% 40% 60% 0% 20% 20% 0%
Table 63: Other Benefits Offered by Position – Canada See note on page 77.
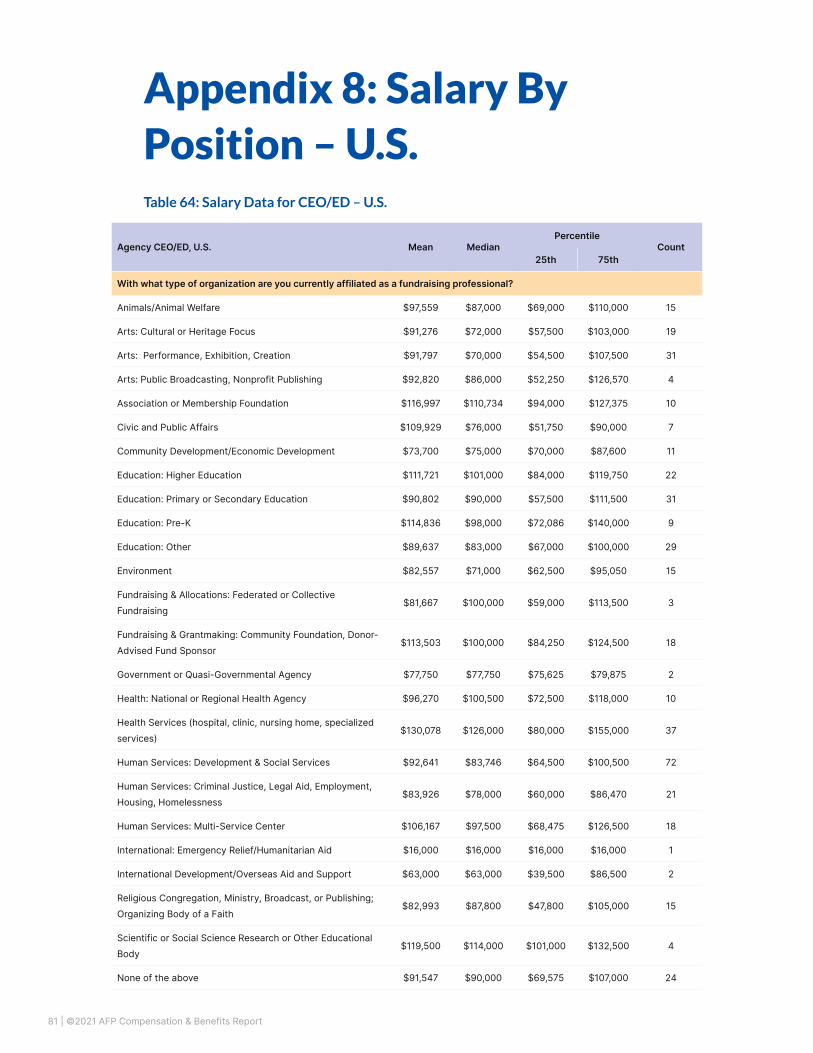
81 | ©2021 AFP Compensation & Benefits Report
Appendix 8: Salary By Position – U.S.
Agency CEO/ED, U.S. Mean MedianPercentile
Count25th 75th
With what type of organization are you currently affiliated as a fundraising professional?
Animals/Animal Welfare $97,559 $87,000 $69,000 $110,000 15
Arts: Cultural or Heritage Focus $91,276 $72,000 $57,500 $103,000 19
Arts: Performance, Exhibition, Creation $91,797 $70,000 $54,500 $107,500 31
Arts: Public Broadcasting, Nonprofit Publishing $92,820 $86,000 $52,250 $126,570 4
Association or Membership Foundation $116,997 $110,734 $94,000 $127,375 10
Civic and Public Affairs $109,929 $76,000 $51,750 $90,000 7
Community Development/Economic Development $73,700 $75,000 $70,000 $87,600 11
Education: Higher Education $111,721 $101,000 $84,000 $119,750 22
Education: Primary or Secondary Education $90,802 $90,000 $57,500 $111,500 31
Education: Pre-K $114,836 $98,000 $72,086 $140,000 9
Education: Other $89,637 $83,000 $67,000 $100,000 29
Environment $82,557 $71,000 $62,500 $95,050 15
Fundraising & Allocations: Federated or Collective Fundraising
$81,667 $100,000 $59,000 $113,500 3
Fundraising & Grantmaking: Community Foundation, Donor-Advised Fund Sponsor
$113,503 $100,000 $84,250 $124,500 18
Government or Quasi-Governmental Agency $77,750 $77,750 $75,625 $79,875 2
Health: National or Regional Health Agency $96,270 $100,500 $72,500 $118,000 10
Health Services (hospital, clinic, nursing home, specialized services)
$130,078 $126,000 $80,000 $155,000 37
Human Services: Development & Social Services $92,641 $83,746 $64,500 $100,500 72
Human Services: Criminal Justice, Legal Aid, Employment, Housing, Homelessness
$83,926 $78,000 $60,000 $86,470 21
Human Services: Multi-Service Center $106,167 $97,500 $68,475 $126,500 18
International: Emergency Relief/Humanitarian Aid $16,000 $16,000 $16,000 $16,000 1
International Development/Overseas Aid and Support $63,000 $63,000 $39,500 $86,500 2
Religious Congregation, Ministry, Broadcast, or Publishing; Organizing Body of a Faith
$82,993 $87,800 $47,800 $105,000 15
Scientific or Social Science Research or Other Educational Body
$119,500 $114,000 $101,000 $132,500 4
None of the above $91,547 $90,000 $69,575 $107,000 24
Table 64: Salary Data for CEO/ED – U.S.

82 | ©2021 AFP Compensation & Benefits Report
Agency CEO/ED, U.S. Mean MedianPercentile
Count25th 75th
What is the geographic scope of your organization?
International $113,446 $108,468 $83,235 $126,250 27
National $125,716 $99,500 $78,188 $143,000 30
Selected States (operations in states separated by other states)
$121,857 $103,000 $69,250 $131,250 14
State and/or Regional (operations in more than one contiguous state)
$101,818 $95,000 $75,000 $120,000 73
Local or Multiple Communities $92,408 $82,000 $62,250 $112,500 255
Approximately how much money did your organization raise in contributed gifts from all sources during the last completed fiscal year?
Less than $100,000 $60,893 $56,500 $46,000 $71,750 39
$100,000-$249,999 $75,696 $68,150 $55,375 $86,450 68
$250,000-$499,999 $82,814 $82,246 $68,425 $94,125 58
$500,000-$999,999 $95,232 $86,000 $72,000 $110,000 81
$1,000,000-$2,999,999 $109,485 $105,875 $85,000 $123,500 71
$3,000,000-$4,999,999 $145,870 $140,714 $120,500 $175,000 26
$5,000,000-$9,999,999 $158,929 $129,000 $116,250 $187,500 14
$10,000,000-$49,999,999 $170,767 $129,800 $114,000 $183,400 6
$50,000,000-$74,999,999 $350,000 $350,000 $350,000 $350,000 1
$75,000,000-$99,999,999 $78,000 $78,000 $78,000 $78,000 1
$100 million or more $109,000 $109,000 $103,500 $114,500 2

83 | ©2021 AFP Compensation & Benefits Report
Agency CEO/ED, U.S. Mean MedianPercentile
Count25th 75th
How many FTE fundraising professionals work in your organization?
None $78,908 $77,250 $49,250 $94,750 12
.001-1.99 $79,190 $72,000 $58,000 $93,000 193
2.00-5.99 $111,935 $105,000 $84,000 $130,000 121
6.00-10.99 $140,663 $117,500 $89,000 $161,250 20
11.00-20.99 $149,100 $126,800 $116,250 $183,400 6
More than 20 $139,868 $120,000 $98,000 $140,000 13
What was your organization’s annual operating budget during the last completed fiscal year?
Less than $250,000 $61,778 $60,000 $45,375 $71,000 62
$250,000-$499,999 $83,472 $80,000 $63,000 $100,000 83
$500,000-$999,999 $87,601 $80,000 $67,500 $101,500 83
$1,000,000-$2,999,999 $111,646 $100,000 $86,103 $124,625 80
$3,000,000-$4,999,999 $144,419 $132,800 $120,000 $169,750 20
$5,000,000-$9,999,999 $150,033 $128,000 $90,000 $157,000 15
$10,000,000-$49,999,999 $163,654 $135,000 $119,000 $150,000 13
$50,000,000-$74,999,999 $106,667 $74,000 $64,000 $133,000 3
$75,000,000 - $99,999,999 $122,667 $90,000 $84,000 $145,000 3
$100 million or more $131,833 $98,000 $97,750 $149,000 3
I don't know $95,000 $95,000 $82,500 $107,500 2
In what region is the office where you work located?
Northeast (Connecticut, Maine, Massachusetts, New Hampshire, Rhode Island, Vermont)
$118,471 $110,000 $82,000 $140,000 17
Mid-Atlantic (New Jersey, New York, Pennsylvania) $81,929 $78,750 $60,000 $100,000 49
South Atlantic (Delaware, District of Columbia, Florida, Georgia, Maryland, North Carolina, South Carolina, Virginia, West Virginia)
$96,953 $86,735 $69,695 $106,000 76
East South Central (Alabama, Kentucky, Mississippi, Tennessee)
$94,745 $81,750 $61,750 $112,000 20
Southwest (Arkansas, Louisiana, Oklahoma, Texas) $91,462 $85,000 $64,830 $105,250 52
East North Central (Illinois, Indiana, Michigan Ohio, Wisconsin)
$86,540 $79,000 $60,000 $103,750 58
West North Central (Iowa, Kansas, Minnesota, Missouri, Nebraska, North Dakota, South Dakota)
$86,543 $80,000 $65,000 $106,000 33
Mountain (Arizona, Colorado, Idaho, Montana, New Mexico, Nevada, Utah, Wyoming,)
$124,599 $100,438 $72,100 $139,821 22
Pacific (Alaska, California, Hawaii, Oregon, Washington) $118,166 $119,000 $78,500 $147,500 46

84 | ©2021 AFP Compensation & Benefits Report
Agency CEO/ED, U.S. Mean MedianPercentile
Count25th 75th
In what size metropolitan area is the office where you work located?
Population less than 50,000 $82,945 $79,375 $60,500 $110,000 70
Population of 50,000-999,999 $88,221 $82,250 $61,975 $105,000 202
Population of 1,000,000-2,999,999 $107,651 $96,500 $72,086 $133,000 61
Population of 3 million or more $150,716 $120,000 $90,000 $184,500 37
For how many years have you been employed as a fundraising professional?
Less than 4 years $70,249 $62,500 $46,600 $83,500 55
4-6 years $89,261 $71,400 $55,000 $96,500 37
7-9 years $87,297 $80,000 $69,700 $105,000 37
10-14 years $97,480 $90,000 $72,750 $113,000 64
15-19 years $98,301 $90,000 $71,500 $110,750 52
20-24 years $107,554 $100,000 $80,000 $120,000 49
25-29 years $129,227 $105,000 $76,875 $160,000 30
30 or more years $109,912 $99,750 $70,000 $140,357 32
For how many years have you been with your current employer?
One year or less $81,633 $78,000 $60,000 $100,000 49
2.0 years $98,028 $101,000 $67,250 $125,250 46
3.0 years $95,469 $78,000 $62,600 $106,000 43
4.0 years $95,670 $86,000 $70,700 $102,430 35
5-6 years $112,493 $96,750 $70,250 $132,250 50
7-9 years $94,890 $82,000 $60,000 $112,000 41
10-14 years $103,132 $90,000 $70,000 $122,000 57
15 or more years $87,265 $81,000 $72,000 $109,500 35
What is your current age?
Under Age 25 $70,000 $70,000 $70,000 $70,000 1
25-34 years old $60,501 $57,000 $43,500 $71,200 23
35-44 years old $86,381 $84,500 $61,650 $106,250 76
45-54 years old $104,445 $91,750 $69,470 $120,500 108
55-64 years old $104,178 $89,000 $70,000 $126,000 121
65 or more years old $91,232 $82,000 $67,000 $106,000 25
How would you describe your gender identity?
Man or Male or Masculine $100,423 $89,500 $65,750 $122,250 84
Woman or Female or Feminine $94,529 $85,000 $65,000 $115,000 269
Prefer not to answer $164,000 $72,000 $71,000 $211,000 3

85 | ©2021 AFP Compensation & Benefits Report
Agency CEO/ED, U.S. Mean MedianPercentile
Count25th 75th
What is your education level?
High school $78,931 $75,000 $63,250 $89,988 8
Associate's degree $64,333 $52,000 $47,000 $80,000 9
Bachelor's degree $94,143 $85,000 $63,125 $111,500 138
Master's degree $98,547 $90,000 $68,000 $120,000 172
Doctorate $102,300 $100,000 $65,000 $120,000 17
Other advanced degree (JD, MD, DO, etc.) $139,408 $120,000 $105,930 $161,500 7
Professional or technical certification (such as paralegal, master teacher, apprenticeship in a trade, etc.)
$90,873 $86,746 $81,869 $95,750 4
Which of the following professional certifications do you hold?
CFRE $124,177 $105,875 $84,500 $144,500 71
ACFRE $107,500 $107,500 $101,250 $113,750 2
University-based certification program in fundraising or nonprofit management
$95,465 $90,500 $70,000 $113,750 58
Other designation as fellow, certificate holder, or other $105,511 $99,700 $75,000 $117,500 39
None of the above $87,056 $80,000 $60,000 $105,750 210

86 | ©2021 AFP Compensation & Benefits Report
Table 65: Salary Data for Chief Development Officer – U.S.
Chief Development Officer, U.S. Mean MedianPercentile
Count25th 75th
With what type of organization are you currently affiliated as a fundraising professional?
Animals/Animal Welfare $85,980 $71,000 $57,000 $106,250 28
Arts: Cultural or Heritage Focus $108,354 $85,000 $70,000 $100,000 45
Arts: Performance, Exhibition, Creation $91,080 $77,500 $55,750 $111,000 90
Arts: Public Broadcasting, Nonprofit Publishing $94,660 $67,500 $55,000 $67,500 5
Association or Membership Foundation $93,057 $87,400 $62,000 $110,000 13
Civic and Public Affairs $93,391 $95,000 $70,000 $107,000 23
Community Development/Economic Development $82,381 $69,500 $55,000 $85,625 40
$54,000 $52,000 $46,000 $61,000 3
Education: Higher Education $122,322 $115,000 $90,000 $145,000 77
Education: Primary or Secondary Education $98,779 $87,750 $70,000 $125,000 100
Education: Pre-K $78,878 $74,283 $62,375 $92,569 30
Education: Other $101,024 $78,000 $65,000 $98,000 53
Environment $88,098 $79,000 $65,000 $101,000 49
Fundraising & Allocations: Federated or Collective Fundraising
$95,444 $87,000 $52,000 $105,000 9
Fundraising & Grantmaking: Community Foundation, Donor-Advised Fund Sponsor
$97,571 $82,500 $74,250 $110,000 14
Government or Quasi-Governmental Agency $92,212 $72,637 $60,319 $114,319 3
Health: National or Regional Health Agency $101,407 $97,000 $75,000 $124,500 27
Health Services (hospital, clinic, nursing home, specialized services)
$100,712 $88,054 $70,000 $120,000 125
Human Services: Development & Social Services $87,076 $76,000 $60,000 $103,000 241
Human Services: Criminal Justice, Legal Aid, Employment, Housing, Homelessness
$83,072 $79,000 $63,500 $98,500 99
Human Services: Multi-Service Center $110,240 $68,500 $56,000 $91,350 42
International: Emergency Relief/Humanitarian Aid $132,913 $99,565 $90,000 $182,000 5
International Development/Overseas Aid and Support $112,528 $99,565 $72,500 $137,500 15
Religious Congregation, Ministry, Broadcast, or Publishing; Organizing Body of a Faith
$83,114 $75,000 $60,000 $91,582 39
Scientific or Social Science Research or Other Educational Body
$156,124 $140,000 $118,000 $220,000 9
None of the above $94,321 $90,022 $69,500 $107,500 31

87 | ©2021 AFP Compensation & Benefits Report
Chief Development Officer, U.S. Mean MedianPercentile
Count25th 75th
What is the geographic scope of your organization?
International $116,596 $100,000 $72,625 $149,500 82
National $115,734 $105,000 $78,500 $138,500 127
Selected States (operations in states separated by other states)
$105,465 $93,400 $78,500 $128,000 46
State and/or Regional (operations in more than one contiguous state)
$99,937 $85,000 $65,000 $120,000 257
Local or Multiple Communities $89,028 $78,000 $62,000 $105,000 597
Approximately how much money did your organization raise in contributed gifts from all sources during the last completed fiscal year?
Less than $100,000 $56,172 $56,620 $38,750 $66,250 20
$100,000-$249,999 $65,182 $65,000 $50,000 $78,000 67
$250,000-$499,999 $69,878 $67,105 $55,000 $80,000 117
$500,000-$999,999 $79,121 $75,000 $59,750 $95,000 188
$1,000,000-$2,999,999 $94,437 $85,000 $68,000 $107,844 311
$3,000,000-$4,999,999 $116,357 $109,000 $89,000 $140,000 117
$5,000,000-$9,999,999 $123,382 $120,000 $84,250 $151,500 80
$10,000,000-$49,999,999 $155,349 $151,000 $115,000 $194,000 61
$50,000,000-$74,999,999 $141,638 $112,000 $102,500 $181,732 7
$75,000,000-$99,999,999 $104,000 $104,000 $101,000 $107,000 2
$100 million or more $147,058 $136,500 $100,000 $231,250 8
I don’t know $56,500 $54,500 $47,750 $63,250 4
How many FTE fundraising professionals work in your organization?
None $60,731 $65,000 $50,000 $70,000 13
.001-1.99 $71,676 $70,000 $54,000 $85,000 336
2.00-5.99 $101,334 $90,000 $72,000 $119,750 446
6.00-10.99 $135,878 $120,000 $85,000 $152,000 95
11.00-20.99 $134,648 $130,000 $82,250 $178,000 51
More than 20 $113,297 $92,000 $70,000 $132,000 53

88 | ©2021 AFP Compensation & Benefits Report
Chief Development Officer, U.S. Mean MedianPercentile
Count25th 75th
What was your organization’s annual operating budget during the last completed fiscal year?
Less than $250,000 $58,309 $53,500 $41,250 $73,750 14
$250,000-$499,999 $68,349 $68,000 $50,000 $79,000 45
$500,000-$999,999 $68,934 $63,556 $50,250 $75,000 82
$1,000,000-$2,999,999 $78,809 $70,000 $57,222 $87,500 273
$3,000,000-$4,999,999 $86,463 $82,300 $67,411 $103,000 123
$5,000,000-$9,999,999 $94,438 $88,000 $72,000 $110,000 149
$10,000,000-$49,999,999 $126,284 $113,000 $85,250 $149,125 214
$50,000,000-$74,999,999 $130,750 $116,500 $99,000 $158,250 24
$75,000,000 - $99,999,999 $160,643 $158,500 $131,250 $200,000 14
$100 million or more $161,194 $146,000 $115,000 $200,000 33
I don't know $94,385 $85,000 $70,000 $106,000 29
In what region is the office where you work located?
Northeast (Connecticut, Maine, Massachusetts, New Hampshire, Rhode Island, Vermont)
$116,158 $102,000 $75,000 $146,000 65
Mid-Atlantic (New Jersey, New York, Pennsylvania) $94,343 $80,000 $67,250 $105,250 108
South Atlantic (Delaware, District of Columbia, Florida, Georgia, Maryland, North Carolina, South Carolina, Virginia, West Virginia)
$96,765 $80,317 $63,500 $110,000 213
East South Central (Alabama, Kentucky, Mississippi, Tennessee)
$105,623 $73,500 $59,500 $92,000 44
Southwest (Arkansas, Louisiana, Oklahoma, Texas) $96,224 $85,000 $65,000 $118,000 111
East North Central (Illinois, Indiana, Michigan Ohio, Wisconsin)
$88,717 $75,000 $60,000 $108,000 195
West North Central (Iowa, Kansas, Minnesota, Missouri, Nebraska, North Dakota, South Dakota)
$92,177 $76,000 $60,000 $108,500 91
Mountain (Arizona, Colorado, Idaho, Montana, New Mexico, Nevada, Utah, Wyoming,)
$81,620 $75,000 $62,250 $93,750 42
Pacific (Alaska, California, Hawaii, Oregon, Washington) $106,484 $100,000 $80,000 $123,275 135
Islands: Puerto Rico, Virgin Islands, Guam, American Samoa $41,700 $41,700 $41,700 $41,700 1
In what size metropolitan area is the office where you work located?
Population less than 50,000 $92,048 $80,000 $60,000 $113,000 93
Population of 50,000-999,999 $84,240 $75,000 $60,500 $101,500 475
Population of 1,000,000-2,999,999 $102,960 $82,000 $65,000 $108,000 225
Population of 3 million or more $119,926 $110,000 $83,000 $144,000 209
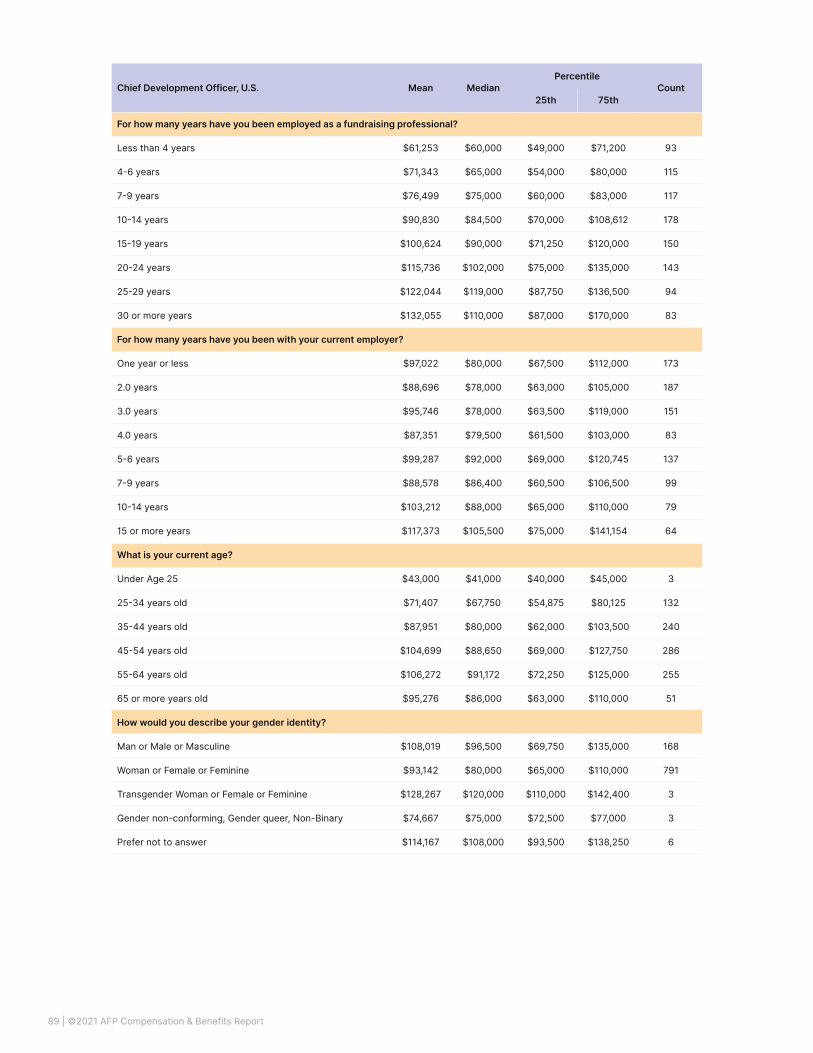
89 | ©2021 AFP Compensation & Benefits Report
Chief Development Officer, U.S. Mean MedianPercentile
Count25th 75th
For how many years have you been employed as a fundraising professional?
Less than 4 years $61,253 $60,000 $49,000 $71,200 93
4-6 years $71,343 $65,000 $54,000 $80,000 115
7-9 years $76,499 $75,000 $60,000 $83,000 117
10-14 years $90,830 $84,500 $70,000 $108,612 178
15-19 years $100,624 $90,000 $71,250 $120,000 150
20-24 years $115,736 $102,000 $75,000 $135,000 143
25-29 years $122,044 $119,000 $87,750 $136,500 94
30 or more years $132,055 $110,000 $87,000 $170,000 83
For how many years have you been with your current employer?
One year or less $97,022 $80,000 $67,500 $112,000 173
2.0 years $88,696 $78,000 $63,000 $105,000 187
3.0 years $95,746 $78,000 $63,500 $119,000 151
4.0 years $87,351 $79,500 $61,500 $103,000 83
5-6 years $99,287 $92,000 $69,000 $120,745 137
7-9 years $88,578 $86,400 $60,500 $106,500 99
10-14 years $103,212 $88,000 $65,000 $110,000 79
15 or more years $117,373 $105,500 $75,000 $141,154 64
What is your current age?
Under Age 25 $43,000 $41,000 $40,000 $45,000 3
25-34 years old $71,407 $67,750 $54,875 $80,125 132
35-44 years old $87,951 $80,000 $62,000 $103,500 240
45-54 years old $104,699 $88,650 $69,000 $127,750 286
55-64 years old $106,272 $91,172 $72,250 $125,000 255
65 or more years old $95,276 $86,000 $63,000 $110,000 51
How would you describe your gender identity?
Man or Male or Masculine $108,019 $96,500 $69,750 $135,000 168
Woman or Female or Feminine $93,142 $80,000 $65,000 $110,000 791
Transgender Woman or Female or Feminine $128,267 $120,000 $110,000 $142,400 3
Gender non-conforming, Gender queer, Non-Binary $74,667 $75,000 $72,500 $77,000 3
Prefer not to answer $114,167 $108,000 $93,500 $138,250 6

90 | ©2021 AFP Compensation & Benefits Report
Chief Development Officer, U.S. Mean MedianPercentile
Count25th 75th
What is your education level?
High school $81,015 $70,000 $57,350 $88,500 23
Associate's degree $67,553 $68,500 $45,000 $78,330 25
Bachelor's degree $94,822 $83,500 $65,000 $112,425 462
Master's degree $98,642 $85,000 $68,000 $120,000 405
Doctorate $116,249 $118,408 $85,541 $140,250 18
Other advanced degree (JD, MD, DO, etc.) $106,672 $80,110 $75,000 $107,000 25
Professional or technical certification (such as paralegal, master teacher, apprenticeship in a trade, etc.)
$83,002 $70,000 $59,750 $85,250 10
Which of the following professional certifications do you hold?
CFRE $114,747 $104,000 $80,317 $135,000 265
ACFRE $139,250 $136,000 $94,000 $181,250 4
University-based certification program in fundraising or nonprofit management
$101,920 $88,000 $70,000 $120,000 147
Other designation as fellow, certificate holder, or other $96,470 $85,700 $67,250 $107,250 100
None of the above $88,016 $75,000 $60,000 $105,000 520

91 | ©2021 AFP Compensation & Benefits Report
Table 66: Salary Data for Associate Vice Chancellor, Deputy / Assistant / Associate
Director, Vice President – U.S.
Associate Vice Chancellor, Deputy/Assistant/Associate Director, Vice President, U.S.
Mean MedianPercentile
Count25th 75th
With what type of organization are you currently affiliated as a fundraising professional?
Animals/Animal Welfare (domestic or captive animals, shelter, rescue, adoption, zoos)
$87,000 $87,000 $87,000 $87,000 1
Arts: Cultural or Heritage Focus $81,625 $98,250 $76,000 $103,875 4
Arts: Performance, Exhibition, Creation (dance, drama, theatre, music, museum, historic preservation, arts center, etc.)
$84,175 $72,500 $64,250 $91,250 12
Arts: Public Broadcasting, Nonprofit Publishing $81,250 $81,250 $80,625 $81,875 2
Civic and Public Affairs (legal, public advocacy, voter registration/education, urban affairs, etc.)
$68,000 $68,000 $68,000 $68,000 1
Community Development/Economic Development (includes affordable housing)
$76,250 $76,250 $64,625 $87,875 2
Education: Higher Education (college, university, community college and/or affiliated foundation)
$133,173 $120,000 $93,000 $156,000 33
Education: Primary or Secondary Education (private, public and/or affiliated foundation)
$72,354 $70,000 $60,000 $75,000 9
Education: Pre-K (child care, early childhood education, referrals, parental advice)
$61,890 $61,890 $61,890 $61,890 1
Education: Other (public library foundation, literacy, vocational training, scholarships, Greek foundation)
$73,000 $73,000 $70,500 $75,500 2
Environment (wildlife, habitat, conservation, environmental education, etc.)
$137,125 $142,750 $79,375 $200,500 4
Fundraising & Grantmaking: Community Foundation, Donor-Advised Fund Sponsor
$163,000 $163,000 $163,000 $163,000 1
Health: National or Regional Health Agency (research or advocacy, disease or health-related problem)
$125,250 $129,000 $97,000 $155,375 3
Health Services (hospital, clinic, nursing home, specialized services)
$121,238 $108,000 $82,000 $148,408 29
Human Services: Development & Social Services (child, youth, adult, family, retirement, fitness/sport)
$80,680 $69,000 $57,750 $82,375 18
Human Services: Criminal Justice, Legal Aid, Employment, Housing, Homelessness
$84,688 $66,250 $59,250 $96,000 8
Human Services: Multi-Service Center (the YMCA, a community center, neighborhood services, etc.)
$96,200 $84,000 $75,000 $90,000 5
Religious Congregation, Ministry, Broadcast, or Publishing; Organizing Body of a Faith (synod, diocese, union, etc.)
$75,000 $75,000 $75,000 $75,000 1
Scientific or Social Science Research or Other Educational Body (includes think tanks)
$158,257 $181,750 $137,886 $190,375 3
None of the above $107,000 $115,000 $102,000 $116,000 3

92 | ©2021 AFP Compensation & Benefits Report
Associate Vice Chancellor, Deputy/Assistant/Associate Director, Vice President, U.S.
Mean MedianPercentile
Count25th 75th
What is the geographic scope of your organization?
International $152,033 $145,954 $110,250 $201,250 20
National $126,203 $110,000 $85,000 $154,000 21
Selected States (operations in states separated by other states)
$98,429 $73,000 $67,500 $109,500 7
State and/or Regional (operations in more than one contiguous state)
$100,952 $83,250 $70,500 $120,000 38
Local or Multiple Communities $97,028 $88,000 $64,750 $117,075 60
Approximately how much money did your organization raise in contributed gifts from all sources during the last completed fiscal year?
Less than $100,000 $75,000 $75,000 $75,000 $75,000 1
$250,000-$499,999 $55,800 $55,000 $50,000 $65,000 5
$500,000-$999,999 $64,751 $60,800 $54,750 $71,978 8
$1,000,000-$2,999,999 $76,394 $72,500 $60,945 $87,000 23
$3,000,000-$4,999,999 $91,136 $80,000 $71,500 $106,500 11
$5,000,000-$9,999,999 $100,656 $98,250 $82,500 $107,750 16
$10,000,000-$49,999,999 $113,452 $110,000 $84,250 $136,250 36
$50,000,000-$74,999,999 $177,200 $175,000 $115,000 $204,000 5
$75,000,000-$99,999,999 $200,000 $215,000 $190,000 $225,000 4
$100 million or more $169,513 $172,375 $107,750 $215,000 12
I don’t know $55,000 $55,000 $55,000 $55,000 1
How many FTE fundraising professionals work in your organization?
.001-1.99 $80,575 $64,500 $56,950 $82,750 8
2.00-5.99 $83,035 $75,000 $64,875 $95,516 44
6.00-10.99 $93,790 $89,000 $68,000 $108,000 27
11.00-20.99 $112,067 $99,500 $91,500 $114,000 15
More than 20 $165,538 $155,000 $125,000 $208,500 28

93 | ©2021 AFP Compensation & Benefits Report
Associate Vice Chancellor, Deputy/Assistant/Associate Director, Vice President, U.S.
Mean MedianPercentile
Count25th 75th
What was your organization’s annual operating budget during the last completed fiscal year?
Less than $250,000 $120,000 $120,000 $120,000 $120,000 1
$250,000-$499,999 $144,000 $144,000 $134,500 $153,500 2
$500,000-$999,999 $69,000 $69,000 $67,000 $71,000 2
$1,000,000-$2,999,999 $81,517 $75,000 $55,650 $105,000 18
$3,000,000-$4,999,999 $116,000 $94,000 $76,500 $145,250 6
$5,000,000-$9,999,999 $78,182 $75,000 $62,500 $87,000 11
$10,000,000-$49,999,999 $95,942 $88,000 $68,875 $113,750 42
$50,000,000-$74,999,999 $89,178 $70,000 $64,000 $85,000 5
$75,000,000 - $99,999,999 $120,000 $120,000 $110,000 $130,000 2
$100 million or more $160,403 $155,704 $113,325 $209,500 22
I don't know $121,074 $104,490 $81,353 $135,000 12
In what region is the office where you work located?
Northeast (Connecticut, Maine, Massachusetts, New Hampshire, Rhode Island, Vermont)
$76,944 $82,000 $68,500 $89,000 9
Mid-Atlantic (New Jersey, New York, Pennsylvania) $113,969 $93,000 $68,500 $121,000 15
South Atlantic (Delaware, District of Columbia, Florida, Georgia, Maryland, North Carolina, South Carolina, Virginia, West Virginia)
$95,518 $76,000 $64,445 $97,011 27
East South Central (Alabama, Kentucky, Mississippi, Tennessee)
$82,880 $71,400 $64,000 $75,000 5
Southwest (Arkansas, Louisiana, Oklahoma, Texas) $109,300 $117,300 $67,500 $140,000 11
East North Central (Illinois, Indiana, Michigan Ohio, Wisconsin)
$109,198 $109,000 $71,375 $136,250 24
West North Central (Iowa, Kansas, Minnesota, Missouri, Nebraska, North Dakota, South Dakota)
$91,801 $83,955 $73,750 $100,875 8
Mountain (Arizona, Colorado, Idaho, Montana, New Mexico, Nevada, Utah, Wyoming,)
$101,588 $90,250 $85,050 $105,000 8
Pacific (Alaska, California, Hawaii, Oregon, Washington) $146,106 $125,000 $100,875 $198,750 18
In what size metropolitan area is the office where you work located?
Population less than 50,000 $81,321 $64,500 $61,890 $110,000 9
Population of 50,000-999,999 $95,373 $82,000 $67,000 $125,000 33
Population of 1,000,000-2,999,999 $100,404 $89,000 $67,000 $121,500 38
Population of 3 million or more $128,317 $105,490 $81,875 $165,000 44

94 | ©2021 AFP Compensation & Benefits Report
Associate Vice Chancellor, Deputy/Assistant/Associate Director, Vice President, U.S.
Mean MedianPercentile
Count25th 75th
For how many years have you been employed as a fundraising professional?
Less than 4 years $62,222 $62,000 $53,000 $70,000 9
4-6 years $66,289 $64,500 $57,000 $74,375 14
7-9 years $92,044 $75,000 $68,375 $106,750 16
10-14 years $98,614 $86,000 $73,500 $117,000 22
15-19 years $125,725 $110,000 $90,000 $149,000 21
20-24 years $126,669 $113,000 $93,000 $156,000 17
25-29 years $122,832 $82,250 $66,918 $133,125 6
30 or more years $156,144 $157,000 $127,500 $178,375 15
For how many years have you been with your current employer?
One year or less $103,639 $84,500 $68,875 $121,750 18
2.0 years $91,461 $83,500 $75,000 $103,750 18
3.0 years $82,266 $70,700 $54,750 $94,250 20
4.0 years $134,188 $122,000 $89,375 $186,063 12
5-6 years $86,973 $83,000 $64,500 $100,980 17
7-9 years $130,372 $105,000 $74,600 $186,500 11
10-14 years $133,645 $125,000 $79,250 $159,500 11
15 or more years $142,531 $135,000 $106,000 $163,000 13
What is your current age?
25-34 years old $69,302 $66,500 $58,750 $75,000 20
35-44 years old $102,671 $89,000 $75,000 $117,300 37
45-54 years old $113,672 $113,000 $71,500 $139,250 35
55-64 years old $136,585 $130,000 $84,000 $165,000 25
65 or more years old $162,500 $162,500 $133,750 $191,250 2
How would you describe your gender identity?
Man or Male or Masculine $124,700 $106,500 $78,150 $150,306 28
Woman or Female or Feminine $103,422 $87,500 $67,500 $125,000 91

95 | ©2021 AFP Compensation & Benefits Report
Associate Vice Chancellor, Deputy/Assistant/Associate Director, Vice President, U.S.
Mean MedianPercentile
Count25th 75th
What is your education level?
High school $127,000 $122,000 $88,500 $163,000 3
Associate's degree $50,000 $50,000 $50,000 $50,000 1
Bachelor's degree $98,974 $82,500 $65,000 $125,000 53
Master's degree $113,267 $96,761 $75,750 $144,875 56
Doctorate $90,100 $88,200 $69,550 $108,750 4
Other advanced degree (JD, MD, DO, etc.) $270,000 $270,000 $255,000 $285,000 2
Professional or technical certification (such as paralegal, master teacher, apprenticeship in a trade, etc.)
$83,000 $83,000 $83,000 $83,000 1
Which of the following professional certifications do you hold?
CFRE $119,127 $121,000 $82,250 $147,181 38
University-based certification program in fundraising or nonprofit management
$93,486 $80,455 $67,750 $123,750 18
Other designation as fellow, certificate holder, or other $91,443 $82,000 $63,000 $116,250 8
None of the above $109,818 $87,250 $69,625 $120,000 64

96 | ©2021 AFP Compensation & Benefits Report
Associate Vice Chancellor, Deputy/Assistant/Associate Director, Vice President, U.S.
Mean MedianPercentile
Count25th 75th
What is your education level?
High school $127,000 $122,000 $88,500 $163,000 3
Associate's degree $50,000 $50,000 $50,000 $50,000 1
Bachelor's degree $98,974 $82,500 $65,000 $125,000 53
Master's degree $113,267 $96,761 $75,750 $144,875 56
Doctorate $90,100 $88,200 $69,550 $108,750 4
Other advanced degree (JD, MD, DO, etc.) $270,000 $270,000 $255,000 $285,000 2
Professional or technical certification (such as paralegal, master teacher, apprenticeship in a trade, etc.)
$83,000 $83,000 $83,000 $83,000 1
Which of the following professional certifications do you hold?
CFRE $119,127 $121,000 $82,250 $147,181 38
University-based certification program in fundraising or nonprofit management
$93,486 $80,455 $67,750 $123,750 18
Other designation as fellow, certificate holder, or other $91,443 $82,000 $63,000 $116,250 8
None of the above $109,818 $87,250 $69,625 $120,000 64

97 | ©2021 AFP Compensation & Benefits Report
Table 67: Salary Data for Fundraising Program Director – U.S.
Fundraising Program Director, U.S. Mean MedianPercentile
Count25th 75th
With what type of organization are you currently affiliated as a fundraising professional?
Animals/Animal Welfare $75,833 $75,000 $58,000 $88,250 6
Arts: Cultural or Heritage Focus $56,000 $54,750 $47,250 $57,000 8
Arts: Performance, Exhibition, Creation $60,012 $56,328 $42,363 $71,500 20
Arts: Public Broadcasting, Nonprofit Publishing $56,480 $50,000 $45,150 $61,250 5
Association or Membership Foundation $88,000 $87,000 $65,000 $115,000 5
Civic and Public Affairs $60,050 $65,100 $58,150 $67,000 4
Community Development/Economic Development $68,500 $64,000 $56,500 $73,750 11
Education: Higher Education $84,430 $81,500 $70,000 $105,500 44
Education: Primary or Secondary Education $71,796 $65,000 $59,000 $83,000 25
Education: Pre-K $59,829 $62,300 $51,000 $66,000 7
Education: Other $66,964 $58,000 $46,500 $70,750 11
Environment $69,325 $64,000 $54,250 $82,500 14
Fundraising & Allocations: Federated or Collective Fundraising
$51,355 $51,000 $40,000 $60,250 8
Fundraising & Grantmaking: Community Foundation, Donor-Advised Fund Sponsor
$72,417 $59,000 $48,500 $93,125 6
Health: National or Regional Health Agency $67,577 $60,000 $53,500 $90,800 11
Health Services $84,826 $76,500 $57,523 $101,500 35
Human Services: Development & Social Services $65,135 $61,600 $50,500 $76,750 50
Human Services: Criminal Justice, Legal Aid, Employment, Housing, Homelessness
$65,214 $61,150 $55,413 $74,600 14
Human Services: Multi-Service Center $66,545 $63,000 $54,750 $68,750 11
International: Emergency Relief/Humanitarian Aid $65,000 $65,000 $65,000 $65,000 1
International Development/Overseas Aid and Support (excluding emergency relief)
$91,000 $91,000 $91,000 $91,000 1
Religious Congregation, Ministry, Broadcast, or Publishing; Organizing Body of a Faith
$74,840 $72,000 $65,000 $113,500 5
Scientific or Social Science Research or Other Educational Body
$135,000 $135,000 $135,000 $135,000 1
None of the above $80,722 $70,500 $50,000 $82,000 9

98 | ©2021 AFP Compensation & Benefits Report
Fundraising Program Director, U.S. Mean MedianPercentile
Count25th 75th
What is the geographic scope of your organization?
International $85,531 $75,000 $61,400 $116,750 31
National $79,582 $72,000 $57,750 $103,250 40
Selected States (operations in states separated by other states)
$80,875 $74,500 $60,975 $94,750 12
State and/or Regional (operations in more than one contiguous state)
$71,461 $64,000 $53,000 $82,000 85
Local or Multiple Communities $66,638 $61,350 $51,750 $80,000 144
Approximately how much money did your organization raise in contributed gifts from all sources during the last completed fiscal year?
Less than $100,000 $59,819 $56,000 $43,000 $80,000 13
$100,000-$249,999 $69,773 $67,000 $46,500 $83,750 11
$250,000-$499,999 $54,150 $48,000 $42,750 $64,750 10
$500,000-$999,999 $55,684 $57,000 $49,000 $62,150 31
$1,000,000-$2,999,999 $63,057 $59,500 $50,700 $73,750 51
$3,000,000-$4,999,999 $75,116 $75,000 $54,875 $86,526 36
$5,000,000-$9,999,999 $76,839 $65,000 $57,875 $96,500 27
$10,000,000-$49,999,999 $78,442 $75,500 $61,250 $96,500 46
$50,000,000-$74,999,999 $90,844 $94,650 $70,738 $104,375 8
$75,000,000-$99,999,999 $118,333 $100,000 $77,500 $150,000 3
$100 million or more $105,721 $110,000 $74,000 $127,750 16
I don’t know $95,000 $90,000 $70,750 $114,250 4
How many FTE fundraising professionals work in your organization?
None $58,500 $59,500 $58,000 $65,000 5
.001-1.99 $64,239 $60,000 $50,000 $74,000 41
2.00-5.99 $62,747 $60,000 $50,000 $72,500 89
6.00-10.99 $75,775 $70,500 $57,512 $88,000 54
11.00-20.99 $80,213 $81,500 $56,500 $99,575 30
More than 20 $92,959 $85,000 $68,000 $107,000 37

99 | ©2021 AFP Compensation & Benefits Report
Fundraising Program Director, U.S. Mean MedianPercentile
Count25th 75th
What was your organization’s annual operating budget during the last completed fiscal year?
Less than $250,000 $55,350 $65,000 $41,500 $72,000 7
$250,000-$499,999 $58,623 $48,500 $44,000 $62,000 13
$500,000-$999,999 $63,388 $60,000 $53,500 $64,750 12
$1,000,000-$2,999,999 $62,467 $58,000 $50,200 $71,750 43
$3,000,000-$4,999,999 $61,680 $58,000 $48,000 $72,500 23
$5,000,000-$9,999,999 $71,252 $62,200 $54,875 $85,000 24
$10,000,000-$49,999,999 $72,786 $70,500 $58,750 $85,000 55
$50,000,000-$74,999,999 $97,500 $94,500 $84,250 $109,250 6
$75,000,000 - $99,999,999 $72,200 $64,000 $63,000 $77,000 5
$100 million or more $102,198 $101,500 $75,000 $120,978 28
I don't know $76,765 $71,000 $56,000 $93,000 45
In what region is the office where you work located?
Northeast (Connecticut, Maine, Massachusetts, New Hampshire, Rhode Island, Vermont)
$68,284 $65,000 $56,750 $70,750 14
Mid-Atlantic (New Jersey, New York, Pennsylvania) $78,334 $73,400 $60,000 $91,052 31
South Atlantic (Delaware, District of Columbia, Florida, Georgia, Maryland, North Carolina, South Carolina, Virginia, West Virginia)
$76,286 $65,000 $54,500 $99,150 43
East South Central (Alabama, Kentucky, Mississippi, Tennessee)
$64,739 $62,000 $55,000 $67,000 9
Southwest (Arkansas, Louisiana, Oklahoma, Texas) $66,701 $65,000 $50,500 $79,750 38
East North Central (Illinois, Indiana, Michigan Ohio, Wisconsin)
$68,986 $61,000 $54,500 $80,000 57
West North Central (Iowa, Kansas, Minnesota, Missouri, Nebraska, North Dakota, South Dakota)
$68,713 $55,000 $48,125 $82,750 26
Mountain (Arizona, Colorado, Idaho, Montana, New Mexico, Nevada, Utah, Wyoming,)
$79,545 $60,000 $52,500 $93,000 11
Pacific (Alaska, California, Hawaii, Oregon, Washington) $80,819 $80,000 $60,000 $100,000 33
In what size metropolitan area is the office where you work located?
Population less than 50,000 $68,900 $67,500 $52,750 $83,500 24
Population of 50,000-999,999 $68,108 $60,500 $50,000 $80,000 112
Population of 1,000,000-2,999,999 $68,409 $61,750 $54,875 $79,250 68
Population of 3 million or more $88,581 $90,000 $65,000 $111,500 57

100 | ©2021 AFP Compensation & Benefits Report
Fundraising Program Director, U.S. Mean MedianPercentile
Count25th 75th
For how many years have you been employed as a fundraising professional?
Less than 4 years $54,543 $50,000 $43,000 $65,000 41
4-6 years $59,662 $57,000 $50,000 $65,000 53
7-9 years $70,895 $65,000 $59,273 $79,000 43
10-14 years $78,763 $74,200 $61,625 $98,691 50
15-19 years $90,143 $87,000 $70,625 $108,625 24
20-24 years $102,898 $108,750 $77,375 $120,518 18
25-29 years $86,087 $83,300 $66,950 $113,000 13
30 or more years $90,125 $83,000 $68,250 $98,000 8
For how many years have you been with your current employer?
One year or less $68,555 $61,600 $50,000 $75,000 50
2.0 years $70,210 $64,000 $54,250 $81,000 43
3.0 years $64,650 $60,500 $48,500 $71,875 42
4.0 years $66,199 $60,000 $55,164 $79,250 22
5-6 years $76,035 $70,000 $59,375 $88,500 39
7-9 years $76,258 $70,500 $58,000 $85,000 25
10-14 years $87,884 $98,300 $64,500 $113,250 15
15 or more years $102,299 $108,000 $74,000 $123,923 14
What is your current age?
Under Age 25 $36,000 $36,000 $36,000 $36,000 1
25-34 years old $59,424 $56,650 $48,000 $67,000 65
35-44 years old $75,022 $70,000 $57,000 $90,000 85
45-54 years old $76,357 $71,000 $52,500 $103,000 45
55-64 years old $84,267 $76,500 $62,250 $100,400 47
65 or more years old $77,138 $70,000 $64,000 $71,000 5
How would you describe your gender identity?
Man or Male or Masculine $85,680 $80,000 $64,625 $105,500 47
Woman or Female or Feminine $69,912 $63,000 $53,000 $83,000 197
Transgender Woman or Female or Feminine $72,500 $72,500 $71,250 $73,750 2
Gender non-conforming, Gender queer, Non-Binary $63,200 $63,200 $63,200 $63,200 1
Prefer not to answer $64,000 $64,000 $64,000 $64,000 1

101 | ©2021 AFP Compensation & Benefits Report
Fundraising Program Director, U.S. Mean MedianPercentile
Count25th 75th
What is your education level?
High school $65,500 $56,000 $51,250 $72,000 7
Associate's degree $53,083 $56,000 $49,000 $58,625 3
Bachelor's degree $68,088 $61,200 $51,500 $80,500 123
Master's degree $76,263 $71,000 $59,023 $91,052 103
Doctorate $106,200 $105,000 $100,000 $120,000 5
Other advanced degree (JD, MD, DO, etc.) $119,600 $109,000 $98,000 $111,000 5
Professional or technical certification (such as paralegal, master teacher, apprenticeship in a trade, etc.)
$70,000 $70,000 $65,000 $75,000 2
Which of the following professional certifications do you hold?
CFRE $90,706 $91,000 $71,000 $109,000 49
ACFRE $55,000 $55,000 $55,000 $55,000 1
University-based certification program in fundraising or nonprofit management
$71,388 $67,842 $56,500 $83,150 39
Other designation as fellow, certificate holder, or other $76,517 $65,000 $54,250 $104,500 26
None of the above $69,322 $62,150 $51,250 $81,750 146

102 | ©2021 AFP Compensation & Benefits Report
Table 68: Salary Data for Fundraising Officer– U.S.
Fundraising Officer, U.S. Mean MedianPercentile
Count25th 75th
With what type of organization are you currently affiliated as a fundraising professional?
Animals/Animal Welfare $56,607 $58,500 $45,125 $69,250 16
Arts: Cultural or Heritage Focus $54,440 $51,000 $46,600 $56,000 9
Arts: Performance, Exhibition, Creation $63,310 $55,000 $46,000 $76,000 33
Arts: Public Broadcasting, Nonprofit Publishing $57,500 $53,000 $43,750 $66,750 4
Association or Membership Foundation $64,700 $58,000 $46,000 $73,500 5
Civic and Public Affairs $67,887 $66,000 $57,000 $82,000 15
Community Development/Economic Development $59,361 $54,500 $50,890 $62,000 14
Education: Higher Education $80,650 $82,000 $63,000 $95,000 65
Education: Primary or Secondary Education $66,483 $56,000 $50,000 $85,000 17
Education: Pre-K $47,500 $47,500 $41,250 $53,750 2
Education: Other $68,875 $50,000 $47,938 $102,500 6
Environment $68,068 $64,000 $58,000 $80,000 25
Fundraising & Allocations: Federated or Collective Fundraising
$68,143 $64,000 $51,500 $85,000 7
Fundraising & Grantmaking: Community Foundation, Donor-Advised Fund Sponsor
$71,773 $65,000 $50,500 $87,500 11
Government or Quasi-Government Agency $73,000 $73,000 $73,000 $73,000 1
Health: National or Regional Health Agency $76,447 $75,000 $54,000 $80,000 19
Health Services $86,601 $78,000 $63,500 $102,000 49
Human Services: Development & Social Services $62,390 $58,600 $51,000 $73,750 50
Human Services: Criminal Justice, Legal Aid, Employment, Housing, Homelessness
$63,487 $57,200 $46,500 $71,500 23
Human Services: Multi-Service Center $70,739 $62,130 $52,500 $82,500 11
International: Emergency Relief/Humanitarian Aid $56,250 $55,000 $51,500 $59,750 4
International Development/Overseas Aid and Support (excluding emergency relief)
$60,000 $62,000 $51,000 $67,750 6
Religious Congregation, Ministry, Broadcast, or Publishing; Organizing Body of a Faith
$70,222 $77,000 $50,000 $94,000 9
Scientific or Social Science Research or Other Educational Body
$99,200 $85,000 $78,000 $130,000 5
None of the above $63,667 $69,000 $54,500 $71,500 6

103 | ©2021 AFP Compensation & Benefits Report
Fundraising Officer, U.S. Mean MedianPercentile
Count25th 75th
What is the geographic scope of your organization?
International $77,005 $72,000 $59,000 $90,000 63
National $78,151 $76,500 $60,000 $92,500 64
Selected States (operations in states separated by other states)
$81,392 $78,125 $70,500 $92,250 15
State and/or Regional (operations in more than one contiguous state)
$71,537 $66,000 $50,500 $85,500 103
Local or Multiple Communities $68,219 $62,000 $50,000 $82,000 161
Approximately how much money did your organization raise in contributed gifts from all sources during the last completed fiscal year?
Less than $100,000 $51,036 $50,000 $44,125 $58,000 7
$100,000-$249,999 $57,827 $51,000 $38,000 $62,100 15
$250,000-$499,999 $53,118 $54,000 $43,000 $60,000 17
$500,000-$999,999 $54,422 $48,750 $45,000 $62,500 28
$1,000,000-$2,999,999 $66,368 $60,000 $51,750 $78,000 72
$3,000,000-$4,999,999 $71,261 $65,000 $50,250 $84,750 34
$5,000,000-$9,999,999 $79,360 $75,000 $63,000 $98,000 51
$10,000,000-$49,999,999 $80,754 $77,000 $60,250 $93,500 66
$50,000,000-$74,999,999 $82,784 $81,000 $62,750 $99,250 16
$75,000,000-$99,999,999 $72,096 $75,500 $68,750 $78,846 4
$100 million or more $94,438 $94,250 $71,750 $106,250 24
I don’t know $50,750 $57,000 $48,875 $64,625 8
How many FTE fundraising professionals work in your organization?
None $56,000 $56,000 $56,000 $56,000 1
.001-1.99 $59,299 $55,000 $41,000 $65,000 49
2.00-5.99 $65,640 $60,000 $48,750 $78,000 131
6.00-10.99 $76,897 $75,000 $58,000 $92,000 61
11.00-20.99 $81,621 $76,000 $62,750 $92,000 40
More than 20 $82,932 $80,000 $64,500 $98,000 55

104 | ©2021 AFP Compensation & Benefits Report
Fundraising Officer, U.S. Mean MedianPercentile
Count25th 75th
What was your organization’s annual operating budget during the last completed fiscal year?
Less than $250,000 $57,125 $57,125 $52,188 $62,063 2
$250,000-$499,999 $46,343 $48,300 $40,750 $53,750 10
$500,000-$999,999 $59,373 $60,500 $44,375 $77,206 24
$1,000,000-$2,999,999 $58,409 $55,000 $42,500 $65,000 49
$3,000,000-$4,999,999 $70,213 $63,565 $50,000 $85,000 34
$5,000,000-$9,999,999 $70,645 $63,500 $52,920 $77,000 32
$10,000,000-$49,999,999 $74,608 $74,000 $53,000 $86,700 69
$50,000,000-$74,999,999 $78,538 $73,000 $67,000 $90,000 13
$75,000,000 - $99,999,999 $85,771 $78,625 $75,250 $100,638 14
$100 million or more $90,417 $90,000 $74,500 $102,250 36
I don't know $73,347 $71,500 $57,500 $92,000 60
In what region is the office where you work located?
Northeast (Connecticut, Maine, Massachusetts, New Hampshire, Rhode Island, Vermont)
$92,153 $86,275 $73,250 $110,000 20
Mid-Atlantic (New Jersey, New York, Pennsylvania) $64,182 $60,000 $50,000 $71,000 33
South Atlantic (Delaware, District of Columbia, Florida, Georgia, Maryland, North Carolina, South Carolina, Virginia, West Virginia)
$64,789 $60,000 $47,625 $75,000 66
East South Central (Alabama, Kentucky, Mississippi, Tennessee)
$70,037 $77,000 $43,000 $90,000 17
Southwest (Arkansas, Louisiana, Oklahoma, Texas) $72,507 $70,000 $52,500 $93,500 39
East North Central (Illinois, Indiana, Michigan Ohio, Wisconsin)
$69,223 $64,500 $51,625 $79,531 66
West North Central (Iowa, Kansas, Minnesota, Missouri, Nebraska, North Dakota, South Dakota)
$74,038 $72,500 $47,200 $85,750 30
Mountain (Arizona, Colorado, Idaho, Montana, New Mexico, Nevada, Utah, Wyoming,)
$67,148 $69,000 $54,750 $80,000 24
Pacific (Alaska, California, Hawaii, Oregon, Washington) $82,338 $75,920 $62,000 $99,964 53
Islands: Puerto Rico, Virgin Islands, Guam, American Samoa $50,000 $50,000 $50,000 $50,000 1
In what size metropolitan area is the office where you work located?
Population less than 50,000 $69,894 $63,000 $50,500 $90,000 31
Population of 50,000-999,999 $65,520 $62,000 $49,750 $76,250 152
Population of 1,000,000-2,999,999 $77,013 $75,920 $57,000 $87,500 79
Population of 3 million or more $78,864 $75,000 $56,500 $98,000 87

105 | ©2021 AFP Compensation & Benefits Report
Fundraising Officer, U.S. Mean MedianPercentile
Count25th 75th
For how many years have you been employed as a fundraising professional?
Less than 4 years $56,623 $51,000 $43,000 $66,000 69
4-6 years $61,660 $60,000 $47,000 $73,000 73
7-9 years $64,153 $60,000 $53,500 $72,750 47
10-14 years $83,133 $80,000 $65,000 $95,500 50
15-19 years $90,458 $83,250 $74,250 $102,750 34
20-24 years $87,583 $86,000 $76,000 $100,500 39
25-29 years $100,364 $86,000 $83,000 $120,000 11
30 or more years $89,111 $78,000 $77,000 $85,000 9
For how many years have you been with your current employer?
One year or less $70,475 $63,500 $50,000 $85,000 83
2.0 years $73,607 $67,668 $54,250 $85,000 78
3.0 years $63,299 $60,000 $46,188 $76,000 51
4.0 years $73,547 $73,000 $60,000 $82,316 23
5-6 years $71,233 $71,000 $55,500 $83,500 43
7-9 years $74,392 $68,000 $54,250 $91,500 30
10-14 years $89,188 $89,000 $69,000 $107,750 16
15 or more years $93,125 $90,000 $73,750 $107,500 8
What is your current age?
Under Age 25 $39,111 $42,000 $36,000 $48,000 9
25-34 years old $58,423 $55,500 $46,000 $66,751 106
35-44 years old $75,444 $74,000 $60,000 $85,000 73
45-54 years old $80,534 $75,000 $61,500 $94,500 64
55-64 years old $83,632 $84,500 $65,250 $99,750 66
65 or more years old $91,955 $103,000 $72,000 $113,000 11
How would you describe your gender identity?
Man or Male or Masculine $79,321 $77,000 $55,000 $100,000 57
Woman or Female or Feminine $70,251 $65,000 $51,699 $84,000 267
Gender non-conforming, Gender queer, Non-Binary $62,000 $62,000 $62,000 $62,000 1
Prefer not to answer $127,667 $135,000 $101,500 $157,500 3

106 | ©2021 AFP Compensation & Benefits Report
Fundraising Officer, U.S. Mean MedianPercentile
Count25th 75th
What is your education level?
High school $53,564 $55,000 $41,000 $60,000 9
Associate's degree $62,286 $48,000 $41,000 $85,500 7
Bachelor's degree $68,533 $64,000 $50,000 $82,000 171
Master's degree $77,507 $75,000 $58,250 $90,000 130
Doctorate $79,450 $94,000 $53,000 $100,000 5
Other advanced degree (JD, MD, DO, etc.) $98,000 $82,000 $70,000 $105,000 5
Professional or technical certification (such as paralegal, master teacher, apprenticeship in a trade, etc.)
$92,500 $92,500 $86,250 $98,750 2
Which of the following professional certifications do you hold?
CFRE $87,699 $83,100 $73,375 $102,250 72
ACFRE $77,000 $77,000 $77,000 $77,000 1
University-based certification program in fundraising or nonprofit management
$70,289 $72,000 $50,000 $86,500 39
Other designation as fellow, certificate holder, or other $79,708 $75,163 $59,875 $105,000 28
None of the above $67,252 $61,000 $50,000 $79,500 203

107 | ©2021 AFP Compensation & Benefits Report
Table 69: Salary Data for Other Fundraising Staff – U.S.
Other Fundraising Staff, U.S. Mean MedianPercentile
Count25th 75th
With what type of organization are you currently affiliated as a fundraising professional?
Animals/Animal Welfare $38,712 $40,000 $35,000 $42,000 5
Arts: Cultural or Heritage Focus $43,250 $42,750 $38,250 $47,250 10
Arts: Performance, Exhibition, Creation $44,795 $41,500 $36,750 $50,375 16
Arts: Public Broadcasting, Nonprofit Publishing $41,000 $41,000 $41,000 $41,000 1
Association or Membership Foundation $56,000 $56,000 $56,000 $56,000 1
Civic and Public Affairs $57,696 $56,563 $49,485 $70,000 8
Community Development/Economic Development $42,576 $41,750 $36,880 $51,125 10
Education: Higher Education $51,458 $50,000 $46,000 $59,500 13
Education: Primary or Secondary Education $48,322 $45,000 $42,000 $48,500 9
Education: Pre-K $44,740 $45,000 $38,500 $49,750 10
Education: Other $34,900 $34,000 $32,250 $36,650 4
Environment $46,814 $37,500 $34,600 $63,000 7
Fundraising & Allocations: Federated or Collective Fundraising
$40,000 $40,000 $40,000 $40,000 1
Fundraising & Grantmaking: Community Foundation, Donor-Advised Fund Sponsor
$44,667 $45,000 $44,500 $45,000 3
Health: National or Regional Health Agency $50,122 $45,000 $40,500 $57,183 3
Health Services $56,901 $50,159 $42,463 $64,375 16
Human Services: Development & Social Services $38,858 $42,000 $33,660 $45,450 31
Human Services: Criminal Justice, Legal Aid, Employment, Housing, Homelessness
$41,119 $40,000 $38,755 $41,800 14
Human Services: Multi-Service Center $39,996 $39,183 $31,800 $43,500 8
International: Emergency Relief/Humanitarian Aid $62,000 $62,000 $62,000 $62,000 1
International Development/Overseas Aid and Support (excluding emergency relief)
$54,122 $53,000 $46,500 $61,183 3
Religious Congregation, Ministry, Broadcast, or Publishing; Organizing Body of a Faith
$56,667 $54,000 $44,000 $68,000 3
Scientific or Social Science Research or Other Educational Body
$56,500 $56,000 $49,250 $63,500 3
None of the above $36,040 $36,040 $29,060 $43,020 2

108 | ©2021 AFP Compensation & Benefits Report
Other Fundraising Staff, U.S. Mean MedianPercentile
Count25th 75th
What is the geographic scope of your organization?
International $48,713 $45,000 $41,800 $54,500 19
National $51,086 $52,063 $45,225 $55,500 18
Selected States (operations in states separated by other states)
$51,182 $50,000 $44,625 $55,329 10
State and/or Regional (operations in more than one contiguous state)
$53,366 $50,000 $40,750 $59,750 36
Local or Multiple Communities $42,112 $41,933 $36,125 $48,000 86
Approximately how much money did your organization raise in contributed gifts from all sources during the last completed fiscal year?
Less than $100,000 $43,917 $39,520 $35,100 $54,100 7
$100,000-$249,999 $36,631 $38,800 $30,000 $44,250 14
$250,000-$499,999 $44,250 $42,400 $37,544 $52,500 18
$500,000-$999,999 $43,701 $42,250 $37,500 $46,925 16
$1,000,000-$2,999,999 $45,999 $45,000 $41,433 $49,500 27
$3,000,000-$4,999,999 $48,727 $42,500 $40,250 $49,639 14
$5,000,000-$9,999,999 $56,063 $50,000 $46,750 $66,000 15
$10,000,000-$49,999,999 $48,487 $49,500 $40,000 $51,500 13
$50,000,000-$74,999,999 $61,196 $57,891 $50,000 $69,087 4
$75,000,000-$99,999,999 $56,000 $56,000 $56,000 $56,000 1
$100 million or more $50,329 $48,159 $43,250 $55,238 4
I don’t know $41,448 $45,000 $38,250 $48,500 11
How many FTE fundraising professionals work in your organization?
None $29,311 $29,311 $23,655 $34,966 2
.001-1.99 $41,376 $38,597 $30,120 $50,000 28
2.00-5.99 $44,982 $45,000 $40,000 $50,000 73
6.00-10.99 $55,341 $46,000 $41,217 $62,311 18
11.00-20.99 $46,515 $46,750 $39,710 $51,000 10
More than 20 $53,756 $50,317 $48,000 $63,891 11

109 | ©2021 AFP Compensation & Benefits Report
Other Fundraising Staff, U.S. Mean MedianPercentile
Count25th 75th
What was your organization’s annual operating budget during the last completed fiscal year?
Less than $250,000 $30,375 $30,000 $24,000 $34,200 5
$250,000-$499,999 $42,678 $39,500 $28,140 $50,515 8
$500,000-$999,999 $38,598 $38,000 $34,500 $44,500 11
$1,000,000-$2,999,999 $42,254 $41,000 $36,500 $46,000 23
$3,000,000-$4,999,999 $42,178 $41,000 $40,000 $45,950 11
$5,000,000-$9,999,999 $49,545 $43,800 $39,750 $55,000 19
$10,000,000-$49,999,999 $47,622 $45,000 $41,000 $52,353 23
$50,000,000-$74,999,999 $52,766 $49,500 $48,500 $53,750 7
$75,000,000 - $99,999,999 $50,000 $50,000 $50,000 $50,000 1
$100 million or more $60,256 $59,500 $56,000 $65,782 5
I don't know $49,757 $48,000 $41,800 $55,000 31
In what region is the office where you work located?
Northeast (Connecticut, Maine, Massachusetts, New Hampshire, Rhode Island, Vermont)
$50,946 $51,500 $45,000 $59,500 9
Mid-Atlantic (New Jersey, New York, Pennsylvania) $47,943 $46,000 $40,000 $49,000 21
South Atlantic (Delaware, District of Columbia, Florida, Georgia, Maryland, North Carolina, South Carolina, Virginia, West Virginia)
$48,639 $43,800 $40,000 $50,000 21
East South Central (Alabama, Kentucky, Mississippi, Tennessee)
$46,741 $48,000 $42,095 $50,000 7
Southwest (Arkansas, Louisiana, Oklahoma, Texas) $39,487 $41,933 $35,000 $47,250 10
East North Central (Illinois, Indiana, Michigan Ohio, Wisconsin)
$43,262 $40,811 $36,875 $48,875 32
West North Central (Iowa, Kansas, Minnesota, Missouri, Nebraska, North Dakota, South Dakota)
$44,888 $43,726 $39,000 $50,375 16
Mountain (Arizona, Colorado, Idaho, Montana, New Mexico, Nevada, Utah, Wyoming,)
$43,388 $41,600 $38,946 $46,000 13
Pacific (Alaska, California, Hawaii, Oregon, Washington) $51,059 $52,000 $43,000 $58,240 17
In what size metropolitan area is the office where you work located?
Population less than 50,000 $44,186 $44,400 $37,862 $49,750 18
Population of 50,000-999,999 $45,596 $43,000 $40,000 $50,000 69
Population of 1,000,000-2,999,999 $43,387 $41,000 $35,000 $50,000 33
Population of 3 million or more $53,513 $51,125 $44,000 $65,000 25

110 | ©2021 AFP Compensation & Benefits Report
Other Fundraising Staff, U.S. Mean MedianPercentile
Count25th 75th
For how many years have you been employed as a fundraising professional?
Less than 4 years $41,486 $42,000 $36,750 $46,595 75
4-6 years $46,410 $45,000 $40,000 $51,750 31
7-9 years $54,397 $53,000 $47,000 $62,000 11
10-14 years $60,674 $59,500 $46,000 $65,782 9
15-19 years $53,693 $50,603 $44,213 $53,801 6
20-24 years $56,333 $60,000 $45,000 $69,500 3
25-29 years $54,000 $54,000 $54,000 $54,000 1
30 or more years $73,000 $73,000 $73,000 $73,000 1
For how many years have you been with your current employer?
One year or less $42,083 $41,800 $36,875 $49,750 34
2.0 years $43,669 $41,300 $36,645 $49,625 44
3.0 years $51,625 $46,190 $45,000 $56,000 21
4.0 years $47,632 $50,000 $40,000 $53,205 13
5-6 years $44,567 $42,000 $40,000 $45,000 13
7-9 years $55,056 $51,500 $48,000 $65,782 5
10-14 years $59,167 $59,000 $53,000 $65,250 3
15 or more years $56,250 $52,000 $48,000 $60,250 4
What is your current age?
Under Age 25 $40,428 $40,000 $34,500 $43,750 14
25-34 years old $44,988 $43,800 $40,000 $50,000 75
35-44 years old $44,863 $45,337 $39,625 $52,625 22
45-54 years old $53,561 $49,603 $45,000 $61,500 10
55-64 years old $50,170 $50,000 $46,000 $61,250 12
65 or more years old $73,333 $90,000 $60,000 $95,000 3
How would you describe your gender identity?
Man or Male or Masculine $49,952 $45,337 $40,466 $52,094 12
Woman or Female or Feminine $45,575 $44,250 $39,200 $51,204 122
Gender non-conforming, Gender queer, Non-Binary $53,500 $53,500 $49,250 $57,750 2

111 | ©2021 AFP Compensation & Benefits Report
Other Fundraising Staff, U.S. Mean MedianPercentile
Count25th 75th
What is your education level?
High school $36,665 $38,580 $27,120 $48,125 4
Associate's degree $50,749 $50,000 $40,000 $58,240 9
Bachelor's degree $46,193 $45,000 $40,000 $50,000 84
Master's degree $45,403 $42,000 $37,674 $55,000 37
Doctorate $51,500 $51,500 $46,250 $56,750 2
Which of the following professional certifications do you hold?
CFRE $58,500 $60,500 $54,250 $64,750 4
ACFRE $38,882 $40,000 $34,685 $43,625 12
University-based certification program in fundraising or nonprofit management
$49,587 $45,000 $37,750 $61,500 10
Other designation as fellow, certificate holder, or other $46,183 $45,000 $39,520 $50,317 113
None of the above $67,252 $61,000 $50,000 $79,500 203

112 | ©2021 AFP Compensation & Benefits Report
Table 70: Salary Data for Consultant, Principal – U.S.
Consultant, Principal, U.S. Mean MedianPercentile
Count25th 75th
With what type of organization are you currently affiliated as a fundraising professional?
Consultant $1,000,000 $1,000,000 $1,000,000 $1,000,000 1
What is the geographic scope of your organization?
International $475,000 $300,000 $212,500 $650,000 3
National $133,292 $138,500 $63,750 $164,250 24
Selected States (operations in states separated by other states)
$120,500 $107,500 $72,500 $173,000 7
State and/or Regional (operations in more than one contiguous state)
$163,034 $100,000 $82,250 $145,250 20
Local or Multiple Communities $100,333 $100,000 $27,500 $148,000 15
How many FTE fundraising professionals work in your organization?
.001-1.99 $1,000,000 $1,000,000 $1,000,000 $1,000,000 1
What was your organization’s annual operating budget during the last completed fiscal year?
$500,000-$999,999 $1,000,000 $1,000,000 $1,000,000 $1,000,000 1
In what region is the office where you work located?
Northeast (Connecticut, Maine, Massachusetts, New Hampshire, Rhode Island, Vermont)
$98,833 $98,000 $74,250 $100,000 6
Mid-Atlantic (New Jersey, New York, Pennsylvania) $156,250 $162,500 $142,500 $176,250 4
South Atlantic (Delaware, District of Columbia, Florida, Georgia, Maryland, North Carolina, South Carolina, Virginia, West Virginia)
$128,375 $142,500 $60,750 $173,750 16
Southwest (Arkansas, Louisiana, Oklahoma, Texas) $163,500 $107,500 $100,000 $280,000 5
East North Central (Illinois, Indiana, Michigan Ohio, Wisconsin)
$210,556 $90,000 $45,000 $125,000 9
West North Central (Iowa, Kansas, Minnesota, Missouri, Nebraska, North Dakota, South Dakota)
$146,536 $150,000 $73,679 $185,000 5
Mountain (Arizona, Colorado, Idaho, Montana, New Mexico, Nevada, Utah, Wyoming,)
$106,143 $83,000 $52,500 $115,000 7
Pacific (Alaska, California, Hawaii, Oregon, Washington) $118,250 $120,000 $96,500 $150,000 8
In what size metropolitan area is the office where you work located?
Population less than 50,000 $69,333 $67,000 $56,000 $81,500 3
Population of 50,000-999,999 $119,945 $107,500 $59,340 $164,500 15
Population of 1,000,000-2,999,999 $183,632 $120,000 $70,000 $200,000 19
Population of 3 million or more $162,917 $132,500 $89,750 $157,500 24

113 | ©2021 AFP Compensation & Benefits Report
Consultant, Principal, U.S. Mean MedianPercentile
Count25th 75th
For how many years have you been employed as a fundraising professional?
Less than 4 years $140,000 $140,000 $140,000 $140,000 1
4-6 years $60,000 $60,000 $45,000 $75,000 2
7-9 years $74,000 $74,000 $61,000 $87,000 2
10-14 years $88,000 $88,000 $85,500 $90,500 2
15-19 years $119,300 $100,000 $65,000 $107,500 5
20-24 years $111,000 $120,000 $100,000 $145,000 5
25-29 years $145,307 $150,000 $78,420 $201,250 12
30 or more years $134,708 $122,500 $58,750 $167,500 24
For how many years have you been with your current employer?
One year or less $91,000 $100,000 $30,000 $140,000 5
2.0 years $139,000 $100,000 $83,500 $175,000 3
3.0 years $124,500 $147,500 $106,000 $150,000 6
4.0 years $84,500 $86,500 $73,500 $97,500 4
5-6 years $115,700 $96,000 $80,000 $107,500 5
7-9 years $120,600 $65,000 $48,000 $150,000 5
10-14 years $157,500 $125,000 $100,000 $182,500 4
15 or more years $140,175 $125,000 $60,000 $175,000 21
What is your current age?
35-44 years old $76,250 $88,000 $43,250 $103,875 6
45-54 years old $135,375 $100,000 $87,000 $197,500 8
55-64 years old $145,174 $146,000 $108,000 $170,000 23
65 or more years old $119,834 $81,840 $52,500 $154,250 14
How would you describe your gender identity?
Man or Male or Masculine $160,730 $140,000 $85,920 $201,250 16
Woman or Female or Feminine $116,891 $100,000 $57,500 $153,500 32
Prefer not to answer $96,000 $96,000 $96,000 $96,000 1
What is your education level?
Bachelor's degree $113,567 $120,000 $65,000 $150,000 25
Master's degree $142,556 $100,000 $73,500 $192,500 27
Which of the following professional certifications do you hold?
CFRE $126,966 $113,750 $72,009 $153,500 24
ACFRE $156,000 $150,000 $120,000 $185,000 5
University-based certification program in fundraising or nonprofit management
$103,714 $83,000 $47,500 $139,000 7
Other designation as fellow, certificate holder, or other $108,000 $112,500 $61,000 $143,750 6
None of the above $134,688 $115,000 $62,500 $181,250 16

114 | ©2021 AFP Compensation & Benefits Report
Table 71: Salary Data for Staff Member at Consulting Firm – U.S.
Staff Member at Consulting Firm, U.S. Mean MedianPercentile
Count25th 75th
What is the geographic scope of your organization?
International $114,000 $114,000 $106,000 $122,000 2
National $47,306 $51,113 $35,750 $62,669 4
Local or Multiple Communities $36,500 $36,500 $29,750 $43,250 2
In what region is the office where you work located?
Mid-Atlantic (New Jersey, New York, Pennsylvania) $71,075 $60,225 $41,613 $95,113 3
Southwest (Arkansas, Louisiana, Oklahoma, Texas) $42,000 $42,000 $42,000 $42,000 1
East North Central (Illinois, Indiana, Michigan Ohio, Wisconsin)
$50,000 $50,000 $50,000 $50,000 1
West North Central (Iowa, Kansas, Minnesota, Missouri, Nebraska, North Dakota, South Dakota)
$70,000 $70,000 $70,000 $70,000 1
Pacific (Alaska, California, Hawaii, Oregon, Washington) $57,500 $57,500 $37,250 $77,750 2
In what size metropolitan area is the office where you work located?
Population of 50,000-999,999 $58,250 $56,000 $37,250 $77,000 4
Population of 1,000,000-2,999,999 $130,000 $130,000 $130,000 $130,000 1
Population of 3 million or more $42,408 $50,000 $33,500 $55,113 3
For how many years have you been employed as a fundraising professional?
Less than 4 years $38,333 $42,000 $32,500 $46,000 3
4-6 years $17,000 $17,000 $17,000 $17,000 1
7-9 years $96,075 $98,000 $79,113 $114,000 3
10-14 years $70,000 $70,000 $70,000 $70,000 1
For how many years have you been with your current employer?
2.0 years $43,000 $42,000 $29,500 $56,000 3
3.0 years $36,500 $36,500 $29,750 $43,250 2
4.0 years $60,225 $60,225 $60,225 $60,225 1
5-6 years $98,000 $98,000 $98,000 $98,000 1
7-9 years $130,000 $130,000 $130,000 $130,000 1
What is your current age?
Under Age 25 $43,000 $42,000 $29,500 $56,000 3
25-34 years old $36,500 $36,500 $29,750 $43,250 2
35-44 years old $60,225 $60,225 $60,225 $60,225 1
45-54 years old $98,000 $98,000 $98,000 $98,000 1
55-64 years old $130,000 $130,000 $130,000 $130,000 1

115 | ©2021 AFP Compensation & Benefits Report
Staff Member at Consulting Firm, U.S. Mean MedianPercentile
Count25th 75th
How would you describe your gender identity?
Man or Male or Masculine $98,000 $98,000 $98,000 $98,000 1
Woman or Female or Feminine $56,032 $50,000 $32,500 $65,113 7
What is your education level?
Bachelor's degree $49,045 $50,000 $42,000 $60,225 5
Master's degree $57,500 $57,500 $37,250 $77,750 2
Other advanced degree (JD, MD, DO, etc.) $130,000 $130,000 $130,000 $130,000 1
Which of the following professional certifications do you hold?
University-based certification program in fundraising or nonprofit management
$50,000 $50,000 $50,000 $50,000 1
Other designation as fellow, certificate holder, or other $50,000 $50,000 $50,000 $50,000 1
None of the above $62,889 $60,225 $32,500 $84,000 7

116 | ©2021 AFP Compensation & Benefits Report
Table 72: Salary Data for Consultant, Principal – U.S.
Consultant, Principal, U.S. Mean MedianPercentile
Count25th 75th
With what type of organization are you currently affiliated as a fundraising professional?
Consultant $1,000,000 $1,000,000 $1,000,000 $1,000,000 1
What is the geographic scope of your organization?
International $475,000 $300,000 $212,500 $650,000 3
National $133,292 $138,500 $63,750 $164,250 24
Selected States (operations in states separated by other states)
$120,500 $107,500 $72,500 $173,000 7
State and/or Regional (operations in more than one contiguous state)
$163,034 $100,000 $82,250 $145,250 20
Local or Multiple Communities $100,333 $100,000 $27,500 $148,000 15
How many FTE fundraising professionals work in your organization?
.001-1.99 $1,000,000 $1,000,000 $1,000,000 $1,000,000 1
What was your organization’s annual operating budget during the last completed fiscal year?
$500,000-$999,999 $1,000,000 $1,000,000 $1,000,000 $1,000,000 1
In what region is the office where you work located?
Northeast (Connecticut, Maine, Massachusetts, New Hampshire, Rhode Island, Vermont)
$98,833 $98,000 $74,250 $100,000 6
Mid-Atlantic (New Jersey, New York, Pennsylvania) $156,250 $162,500 $142,500 $176,250 4
South Atlantic (Delaware, District of Columbia, Florida, Georgia, Maryland, North Carolina, South Carolina, Virginia, West Virginia)
$128,375 $142,500 $60,750 $173,750 16
Southwest (Arkansas, Louisiana, Oklahoma, Texas) $163,500 $107,500 $100,000 $280,000 5
East North Central (Illinois, Indiana, Michigan Ohio, Wisconsin)
$210,556 $90,000 $45,000 $125,000 9
West North Central (Iowa, Kansas, Minnesota, Missouri, Nebraska, North Dakota, South Dakota)
$146,536 $150,000 $73,679 $185,000 5
Mountain (Arizona, Colorado, Idaho, Montana, New Mexico, Nevada, Utah, Wyoming,)
$106,143 $83,000 $52,500 $115,000 7
Pacific (Alaska, California, Hawaii, Oregon, Washington) $118,250 $120,000 $96,500 $150,000 8
In what size metropolitan area is the office where you work located?
Population less than 50,000 $69,333 $67,000 $56,000 $81,500 3
Population of 50,000-999,999 $119,945 $107,500 $59,340 $164,500 15
Population of 1,000,000-2,999,999 $183,632 $120,000 $70,000 $200,000 19
Population of 3 million or more $162,917 $132,500 $89,750 $157,500 24

117 | ©2021 AFP Compensation & Benefits Report
Consultant, Principal, U.S. Mean MedianPercentile
Count25th 75th
For how many years have you been employed as a fundraising professional?
Less than 4 years $140,000 $140,000 $140,000 $140,000 1
4-6 years $60,000 $60,000 $45,000 $75,000 2
7-9 years $74,000 $74,000 $61,000 $87,000 2
10-14 years $88,000 $88,000 $85,500 $90,500 2
15-19 years $119,300 $100,000 $65,000 $107,500 5
20-24 years $111,000 $120,000 $100,000 $145,000 5
25-29 years $145,307 $150,000 $78,420 $201,250 12
30 or more years $134,708 $122,500 $58,750 $167,500 24
For how many years have you been with your current employer?
One year or less $91,000 $100,000 $30,000 $140,000 5
2.0 years $139,000 $100,000 $83,500 $175,000 3
3.0 years $124,500 $147,500 $106,000 $150,000 6
4.0 years $84,500 $86,500 $73,500 $97,500 4
5-6 years $115,700 $96,000 $80,000 $107,500 5
7-9 years $120,600 $65,000 $48,000 $150,000 5
10-14 years $157,500 $125,000 $100,000 $182,500 4
15 or more years $140,175 $125,000 $60,000 $175,000 21
What is your current age?
35-44 years old $76,250 $88,000 $43,250 $103,875 6
45-54 years old $135,375 $100,000 $87,000 $197,500 8
55-64 years old $145,174 $146,000 $108,000 $170,000 23
65 or more years old $119,834 $81,840 $52,500 $154,250 14
How would you describe your gender identity?
Man or Male or Masculine $160,730 $140,000 $85,920 $201,250 16
Woman or Female or Feminine $116,891 $100,000 $57,500 $153,500 32
Prefer not to answer $96,000 $96,000 $96,000 $96,000 1
What is your education level?
Bachelor's degree $113,567 $120,000 $65,000 $150,000 25
Master's degree $142,556 $100,000 $73,500 $192,500 27
Which of the following professional certifications do you hold?
CFRE $126,966 $113,750 $72,009 $153,500 24
ACFRE $156,000 $150,000 $120,000 $185,000 5
University-based certification program in fundraising or nonprofit management
$103,714 $83,000 $47,500 $139,000 7
Other designation as fellow, certificate holder, or other $108,000 $112,500 $61,000 $143,750 6
None of the above $134,688 $115,000 $62,500 $181,250 16

118 | ©2021 AFP Compensation & Benefits Report
Table 73: Salary Data for Consultant, Specialist – U.S.
Consultant, Specialist, U.S. Mean MedianPercentile
Count25th 75th
With what type of organization are you currently affiliated as a fundraising professional?
Human Services: Development & Social Services (child, youth, adult, family, retirement, fitness/sport)
$63,000 $63,000 $63,000 $63,000 1
What is the geographic scope of your organization?
International $29,700 $29,700 $22,050 $37,350 2
National $108,682 $90,659 $50,000 $135,000 16
Selected States (operations in states separated by other states)
$64,120 $62,500 $32,500 $89,739 6
State and/or Regional (operations in more than one contiguous state)
$105,794 $73,000 $35,000 $90,000 9
Local or Multiple Communities $72,057 $59,000 $35,750 $86,580 28
How many FTE fundraising professionals work in your organization?
2.00-5.99 $63,000 $63,000 $63,000 $63,000 1
What was your organization’s annual operating budget during the last completed fiscal year?
$75,000,000 - $99,999,999 $63,000 $63,000 $63,000 $63,000 1
In what region is the office where you work located?
Northeast (Connecticut, Maine, Massachusetts, New Hampshire, Rhode Island, Vermont)
$155,000 $75,000 $62,500 $207,500 3
Mid-Atlantic (New Jersey, New York, Pennsylvania) $82,680 $90,000 $34,000 $125,000 5
South Atlantic (Delaware, District of Columbia, Florida, Georgia, Maryland, North Carolina, South Carolina, Virginia, West Virginia)
$79,467 $65,000 $35,000 $119,000 9
East South Central (Alabama, Kentucky, Mississippi, Tennessee)
$55,000 $55,000 $55,000 $55,000 1
Southwest (Arkansas, Louisiana, Oklahoma, Texas) $70,000 $70,000 $50,000 $90,000 2
East North Central (Illinois, Indiana, Michigan Ohio, Wisconsin)
$38,869 $45,000 $22,672 $50,000 9
West North Central (Iowa, Kansas, Minnesota, Missouri, Nebraska, North Dakota, South Dakota)
$52,367 $44,600 $42,550 $66,000 6
Mountain (Arizona, Colorado, Idaho, Montana, New Mexico, Nevada, Utah, Wyoming,)
$170,000 $170,000 $130,000 $210,000 2
Pacific (Alaska, California, Hawaii, Oregon, Washington) $106,332 $85,000 $65,000 $130,000 13
In what size metropolitan area is the office where you work located?
Population less than 50,000 $105,925 $67,500 $39,500 $135,000 8
Population of 50,000-999,999 $94,973 $69,000 $42,750 $101,000 12
Population of 1,000,000-2,999,999 $66,955 $65,000 $35,000 $80,000 19
Population of 3 million or more $83,247 $83,000 $44,600 $108,159 11

119 | ©2021 AFP Compensation & Benefits Report
How would you describe your gender identity?
Man or Male or Masculine $52,717 $73,000 $36,575 $79,000 3
Woman or Female or Feminine $89,060 $65,000 $41,000 $114,500 43
What is your education level?
Bachelor's degree $86,156 $52,500 $28,168 $120,250 24
Master's degree $83,443 $75,000 $43,100 $87,500 23
Other advanced degree (JD, MD, DO, etc.) $38,000 $38,000 $38,000 $38,000 1
Which of the following professional certifications do you hold?
CFRE $118,929 $90,659 $57,500 $143,500 18
ACFRE $125,000 $125,000 $125,000 $125,000 1
University-based certification program in fundraising or nonprofit management
$76,286 $50,000 $38,500 $92,250 14
Other designation as fellow, certificate holder, or other $111,600 $90,000 $83,000 $90,000 5
None of the above $48,076 $44,600 $22,004 $75,000 16
For how many years have you been employed as a fundraising professional?
Less than 4 years $50,000 $50,000 $50,000 $50,000 1
4-6 years $34,145 $37,500 $24,504 $45,000 6
7-9 years $68,500 $57,500 $38,750 $87,250 4
10-14 years $60,250 $69,000 $52,250 $77,000 4
15-19 years $59,910 $50,000 $14,400 $85,000 5
20-24 years $84,000 $43,500 $35,500 $112,250 12
25-29 years $99,835 $90,000 $50,000 $98,000 9
30 or more years $149,857 $125,000 $75,000 $207,000 7
For how many years have you been with your current employer?
One year or less $53,767 $64,000 $24,550 $74,500 6
2.0 years $44,000 $42,500 $32,500 $58,500 6
3.0 years $61,239 $50,000 $35,500 $67,500 7
4.0 years $78,000 $90,000 $42,000 $90,000 5
5-6 years $78,833 $45,000 $33,750 $73,500 6
7-9 years $232,000 $232,000 $178,000 $286,000 2
10-14 years $99,000 $92,500 $56,250 $121,250 6
15 or more years $108,867 $83,159 $49,400 $142,250 10
What is your current age?
Under Age 25 $50,000 $50,000 $50,000 $50,000 1
25-34 years old $38,400 $37,500 $27,500 $47,500 8
35-44 years old $118,918 $56,500 $43,168 $132,250 4
45-54 years old $89,412 $75,000 $42,000 $110,000 13
55-64 years old $95,915 $75,000 $45,000 $121,500 15
65 or more years old $88,200 $98,000 $38,000 $125,000 5
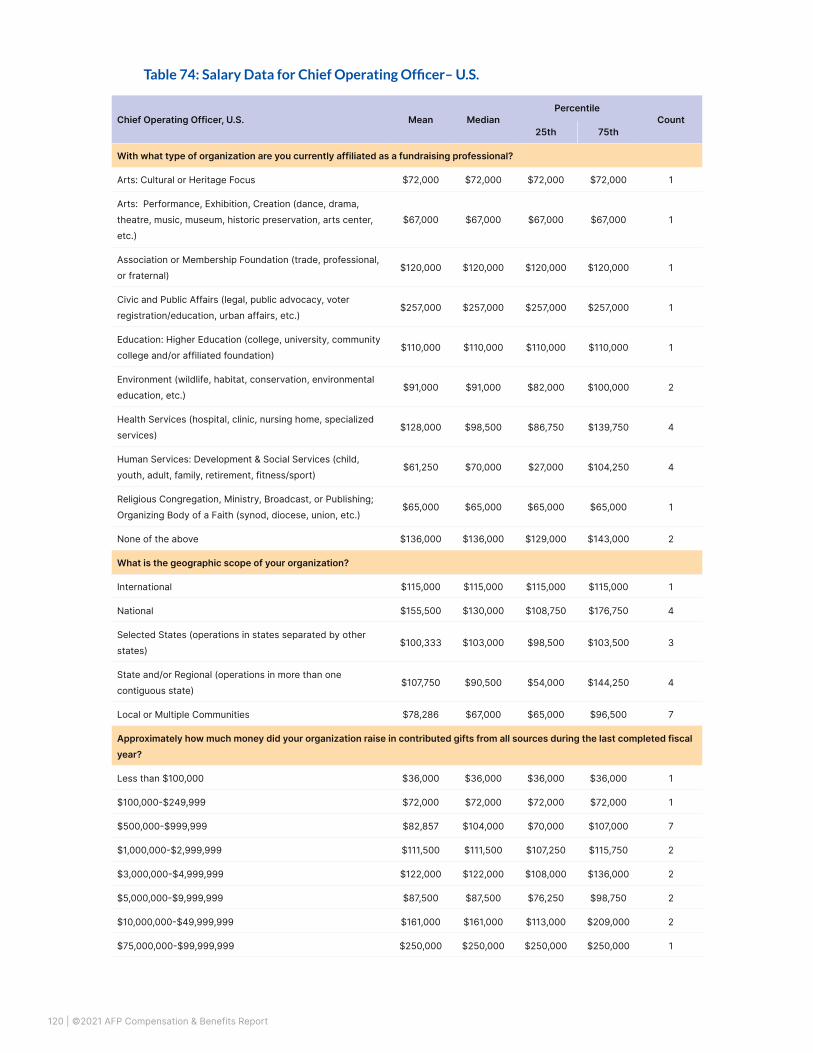
120 | ©2021 AFP Compensation & Benefits Report
Table 74: Salary Data for Chief Operating Officer– U.S.
Chief Operating Officer, U.S. Mean MedianPercentile
Count25th 75th
With what type of organization are you currently affiliated as a fundraising professional?
Arts: Cultural or Heritage Focus $72,000 $72,000 $72,000 $72,000 1
Arts: Performance, Exhibition, Creation (dance, drama, theatre, music, museum, historic preservation, arts center, etc.)
$67,000 $67,000 $67,000 $67,000 1
Association or Membership Foundation (trade, professional, or fraternal)
$120,000 $120,000 $120,000 $120,000 1
Civic and Public Affairs (legal, public advocacy, voter registration/education, urban affairs, etc.)
$257,000 $257,000 $257,000 $257,000 1
Education: Higher Education (college, university, community college and/or affiliated foundation)
$110,000 $110,000 $110,000 $110,000 1
Environment (wildlife, habitat, conservation, environmental education, etc.)
$91,000 $91,000 $82,000 $100,000 2
Health Services (hospital, clinic, nursing home, specialized services)
$128,000 $98,500 $86,750 $139,750 4
Human Services: Development & Social Services (child, youth, adult, family, retirement, fitness/sport)
$61,250 $70,000 $27,000 $104,250 4
Religious Congregation, Ministry, Broadcast, or Publishing; Organizing Body of a Faith (synod, diocese, union, etc.)
$65,000 $65,000 $65,000 $65,000 1
None of the above $136,000 $136,000 $129,000 $143,000 2
What is the geographic scope of your organization?
International $115,000 $115,000 $115,000 $115,000 1
National $155,500 $130,000 $108,750 $176,750 4
Selected States (operations in states separated by other states)
$100,333 $103,000 $98,500 $103,500 3
State and/or Regional (operations in more than one contiguous state)
$107,750 $90,500 $54,000 $144,250 4
Local or Multiple Communities $78,286 $67,000 $65,000 $96,500 7
Approximately how much money did your organization raise in contributed gifts from all sources during the last completed fiscal year?
Less than $100,000 $36,000 $36,000 $36,000 $36,000 1
$100,000-$249,999 $72,000 $72,000 $72,000 $72,000 1
$500,000-$999,999 $82,857 $104,000 $70,000 $107,000 7
$1,000,000-$2,999,999 $111,500 $111,500 $107,250 $115,750 2
$3,000,000-$4,999,999 $122,000 $122,000 $108,000 $136,000 2
$5,000,000-$9,999,999 $87,500 $87,500 $76,250 $98,750 2
$10,000,000-$49,999,999 $161,000 $161,000 $113,000 $209,000 2
$75,000,000-$99,999,999 $250,000 $250,000 $250,000 $250,000 1

121 | ©2021 AFP Compensation & Benefits Report
Chief Operating Officer, U.S. Mean MedianPercentile
Count25th 75th
How many FTE fundraising professionals work in your organization?
$18,000 $18,000 $9,000 $27,000 2 1
$105,000 $120,000 $96,500 $121,000 3 49
$97,600 $104,000 $103,000 $105,000 5 131
$126,200 $94,000 $65,000 $150,000 5 61
$72,000 $72,000 $72,000 $72,000 1 40
$180,000 $180,000 $145,000 $215,000 2 55
What was your organization’s annual operating budget during the last completed fiscal year?
Less than $250,000 $36,000 $36,000 $36,000 $36,000 1
$250,000-$499,999 $103,000 $103,000 $103,000 $103,000 1
$500,000-$999,999 $46,000 $65,000 $32,500 $69,000 3
$1,000,000-$2,999,999 $90,000 $88,500 $68,250 $108,000 6
$3,000,000-$4,999,999 $102,667 $104,000 $99,000 $107,000 3
$5,000,000-$9,999,999 $135,000 $135,000 $127,500 $142,500 2
$10,000,000-$49,999,999 $253,500 $253,500 $251,750 $255,250 2
In what region is the office where you work located?
Northeast (Connecticut, Maine, Massachusetts, New Hampshire, Rhode Island, Vermont)
$104,000 $104,000 $104,000 $104,000 1
Mid-Atlantic (New Jersey, New York, Pennsylvania) $155,000 $110,000 $107,500 $180,000 3
South Atlantic (Delaware, District of Columbia, Florida, Georgia, Maryland, North Carolina, South Carolina, Virginia, West Virginia)
$146,500 $146,500 $91,250 $201,750 2
East South Central (Alabama, Kentucky, Mississippi, Tennessee)
$65,000 $65,000 $65,000 $65,000 1
Southwest (Arkansas, Louisiana, Oklahoma, Texas) $83,833 $101,500 $72,250 $113,500 6
East North Central (Illinois, Indiana, Michigan Ohio, Wisconsin)
$106,667 $103,000 $85,000 $126,500 3
West North Central (Iowa, Kansas, Minnesota, Missouri, Nebraska, North Dakota, South Dakota)
$72,000 $72,000 $72,000 $72,000 1
Mountain (Arizona, Colorado, Idaho, Montana, New Mexico, Nevada, Utah, Wyoming,)
$73,000 $73,000 $73,000 $73,000 1
Pacific (Alaska, California, Hawaii, Oregon, Washington) $122,000 $122,000 $122,000 $122,000 1
In what size metropolitan area is the office where you work located?
Population less than 50,000 $73,000 $73,000 $54,500 $91,500 2
Population of 50,000-999,999 $106,125 $88,000 $70,750 $106,750 8
Population of 1,000,000-2,999,999 $75,667 $105,000 $52,500 $113,500 3
Population of 3 million or more $132,500 $114,500 $97,750 $142,500 6

122 | ©2021 AFP Compensation & Benefits Report
Chief Operating Officer, U.S. Mean MedianPercentile
Count25th 75th
For how many years have you been employed as a fundraising professional?
Less than 4 years $122,000 $122,000 $122,000 $122,000 1
4-6 years $150,000 $150,000 $150,000 $150,000 1
7-9 years $111,500 $111,500 $107,250 $115,750 2
10-14 years $65,000 $65,000 $65,000 $65,000 1
15-19 years $106,000 $107,500 $102,250 $111,250 4
20-24 years $63,800 $72,000 $65,000 $73,000 5
25-29 years $253,500 $253,500 $251,750 $255,250 2
30 or more years $69,000 $67,000 $51,500 $85,500 3
For how many years have you been with your current employer?
One year or less $18,000 $18,000 $9,000 $27,000 2
2.0 years $112,500 $112,500 $107,750 $117,250 2
3.0 years $145,250 $129,500 $99,750 $175,000 4
4.0 years $65,000 $65,000 $65,000 $65,000 1
5-6 years $175,500 $175,500 $134,750 $216,250 2
7-9 years $111,333 $110,000 $107,000 $115,000 3
10-14 years $84,333 $73,000 $69,000 $94,000 3
15 or more years $86,000 $86,000 $76,500 $95,500 2
What is your current age?
35-44 years old $93,500 $99,500 $86,750 $106,250 4
45-54 years old $126,200 $117,500 $81,250 $143,000 10
55-64 years old $86,250 $88,000 $71,000 $103,250 4
65 or more years old $36,000 $36,000 $36,000 $36,000 1
How would you describe your gender identity?
Man or Male or Masculine $94,000 $94,000 $83,500 $104,500 2
Woman or Female or Feminine $107,588 $104,000 $67,000 $120,000 17
What is your education level?
Associate's degree $62,286 $48,000 $41,000 $85,500 7
Bachelor's degree $68,533 $64,000 $50,000 $82,000 171
Master's degree $77,507 $75,000 $58,250 $90,000 130
Which of the following professional certifications do you hold?
CFRE $87,699 $83,100 $73,375 $102,250 72
ACFRE $77,000 $77,000 $77,000 $77,000 1
Other designation as fellow, certificate holder, or other $79,708 $75,163 $59,875 $105,000 28
None of the above $67,252 $61,000 $50,000 $79,500 203

123 | ©2021 AFP Compensation & Benefits Report
Table 75: Salary Data forGrants Manager– U.S.
Grants Manager, U.S. Mean MedianPercentile
Count25th 75th
With what type of organization are you currently affiliated as a fundraising professional?
Animals/Animal Welfare $42,500 $42,500 $37,750 $47,250 2
Arts: Cultural or Heritage Focus $56,000 $56,000 $53,000 $59,000 2
Arts: Performance, Exhibition, Creation $28,075 $28,075 $16,638 $39,513 2
Association or Membership Foundation $104,000 $104,000 $104,000 $104,000 1
Civic and Public Affairs $45,100 $45,100 $45,100 $45,100 1
Community Development/Economic Development $63,833 $61,000 $55,750 $70,500 3
Education: Higher Education $60,333 $59,000 $55,500 $64,500 3
Education: Primary or Secondary Education $53,000 $52,000 $51,000 $54,500 3
Education: Pre-K $58,667 $58,000 $50,000 $67,000 3
Education: Other $42,000 $42,000 $42,000 $42,000 1
Environment $65,000 $65,000 $65,000 $65,000 1
Health: National or Regional Health Agency $48,000 $48,000 $48,000 $48,000 1
Health Services $58,638 $53,500 $39,525 $64,000 8
Human Services: Development & Social Services $56,918 $53,500 $49,050 $61,125 22
Human Services: Criminal Justice, Legal Aid, Employment, Housing, Homelessness
$57,013 $47,000 $46,525 $58,500 8
Human Services: Multi-Service Center $77,500 $77,500 $68,750 $86,250 2
International Development/Overseas Aid and Support (excluding emergency relief)
$52,000 $52,000 $52,000 $52,000 1
Religious Congregation, Ministry, Broadcast, or Publishing; Organizing Body of a Faith
$87,850 $87,850 $81,925 $93,775 2
None of the above $61,667 $45,000 $45,000 $70,000 3
What is the geographic scope of your organization?
International $52,000 $52,000 $52,000 $52,000 1
National $59,620 $55,000 $50,000 $70,000 5
Selected States (operations in states separated by other states)
$50,580 $47,000 $40,000 $61,000 5
State and/or Regional (operations in more than one contiguous state)
$66,100 $55,000 $47,000 $78,000 13
Local or Multiple Communities $56,642 $52,000 $47,000 $62,000 39

124 | ©2021 AFP Compensation & Benefits Report
Grants Manager, U.S. Mean MedianPercentile
Count25th 75th
Approximately how much money did your organization raise in contributed gifts from all sources during the last completed fiscal year?
Less than $100,000 $36,500 $36,500 $31,250 $41,750 2
$100,000-$249,999 $49,250 $46,000 $43,750 $51,500 4
$250,000-$499,999 $67,000 $52,000 $48,500 $78,000 3
$500,000-$999,999 $42,600 $42,000 $41,000 $48,000 5
$1,000,000-$2,999,999 $59,463 $55,000 $49,600 $64,500 15
$3,000,000-$4,999,999 $60,282 $58,000 $52,500 $61,000 11
$5,000,000-$9,999,999 $63,500 $65,500 $57,500 $71,500 4
$10,000,000-$49,999,999 $63,356 $59,000 $50,500 $75,000 9
I don’t know $42,000 $42,000 $42,000 $42,000 1
How many FTE fundraising professionals work in your organization?
None $62,000 $62,000 $62,000 $62,000 1
.001-1.99 $50,763 $44,500 $38,775 $51,500 8
2.00-5.99 $59,042 $56,000 $46,525 $69,250 24
6.00-10.99 $57,357 $50,500 $49,000 $56,500 7
11.00-20.99 $66,064 $60,000 $52,000 $61,750 7
More than 20 $50,886 $52,000 $47,500 $64,500 7
What was your organization’s annual operating budget during the last completed fiscal year?
$250,000-$499,999 $46,000 $46,000 $45,500 $46,500 2
$500,000-$999,999 $54,033 $62,000 $48,550 $63,500 3
$1,000,000-$2,999,999 $49,650 $49,200 $42,000 $51,475 11
$3,000,000-$4,999,999 $59,114 $55,000 $48,500 $58,500 7
$5,000,000-$9,999,999 $56,375 $56,000 $48,500 $64,750 8
$10,000,000-$49,999,999 $62,200 $59,000 $48,000 $71,250 16
$75,000,000 - $99,999,999 $56,000 $56,000 $54,000 $58,000 2
$100 million or more $61,333 $59,000 $53,000 $68,500 3
I don't know $74,500 $74,500 $59,750 $89,250 2

125 | ©2021 AFP Compensation & Benefits Report
Grants Manager, U.S. Mean MedianPercentile
Count25th 75th
In what region is the office where you work located?
Northeast (Connecticut, Maine, Massachusetts, New Hampshire, Rhode Island, Vermont)
$55,000 $55,000 $51,500 $58,500 2
Mid-Atlantic (New Jersey, New York, Pennsylvania) $55,950 $52,750 $42,500 $72,250 10
South Atlantic (Delaware, District of Columbia, Florida, Georgia, Maryland, North Carolina, South Carolina, Virginia, West Virginia)
$58,783 $52,000 $49,000 $59,000 9
East South Central (Alabama, Kentucky, Mississippi, Tennessee)
$124,000 $124,000 $124,000 $124,000 1
Southwest (Arkansas, Louisiana, Oklahoma, Texas) $47,029 $45,000 $43,500 $48,100 7
East North Central (Illinois, Indiana, Michigan Ohio, Wisconsin)
$61,671 $57,000 $47,000 $70,000 7
West North Central (Iowa, Kansas, Minnesota, Missouri, Nebraska, North Dakota, South Dakota)
$50,167 $47,000 $44,500 $54,250 3
Mountain (Arizona, Colorado, Idaho, Montana, New Mexico, Nevada, Utah, Wyoming,)
$57,000 $58,000 $52,000 $60,000 5
Pacific (Alaska, California, Hawaii, Oregon, Washington) $56,358 $56,000 $49,250 $62,750 12
In what size metropolitan area is the office where you work located?
Population less than 50,000 $40,750 $43,500 $36,500 $47,750 4
Population of 50,000-999,999 $50,989 $49,000 $43,500 $56,750 23
Population of 1,000,000-2,999,999 $63,559 $58,000 $50,500 $67,000 17
Population of 3 million or more $64,917 $59,500 $51,500 $78,500 12
For how many years have you been employed as a fundraising professional?
Less than 4 years $48,512 $48,000 $45,000 $52,000 17
4-6 years $61,514 $52,000 $50,000 $70,000 11
7-9 years $61,917 $57,500 $51,625 $61,500 6
10-14 years $56,500 $57,000 $45,500 $73,750 6
15-19 years $69,700 $68,000 $51,900 $79,000 6
20-24 years $55,000 $55,000 $55,000 $55,000 1
25-29 years $65,000 $65,000 $62,500 $67,500 2
30 or more years $58,067 $45,000 $25,100 $84,500 3
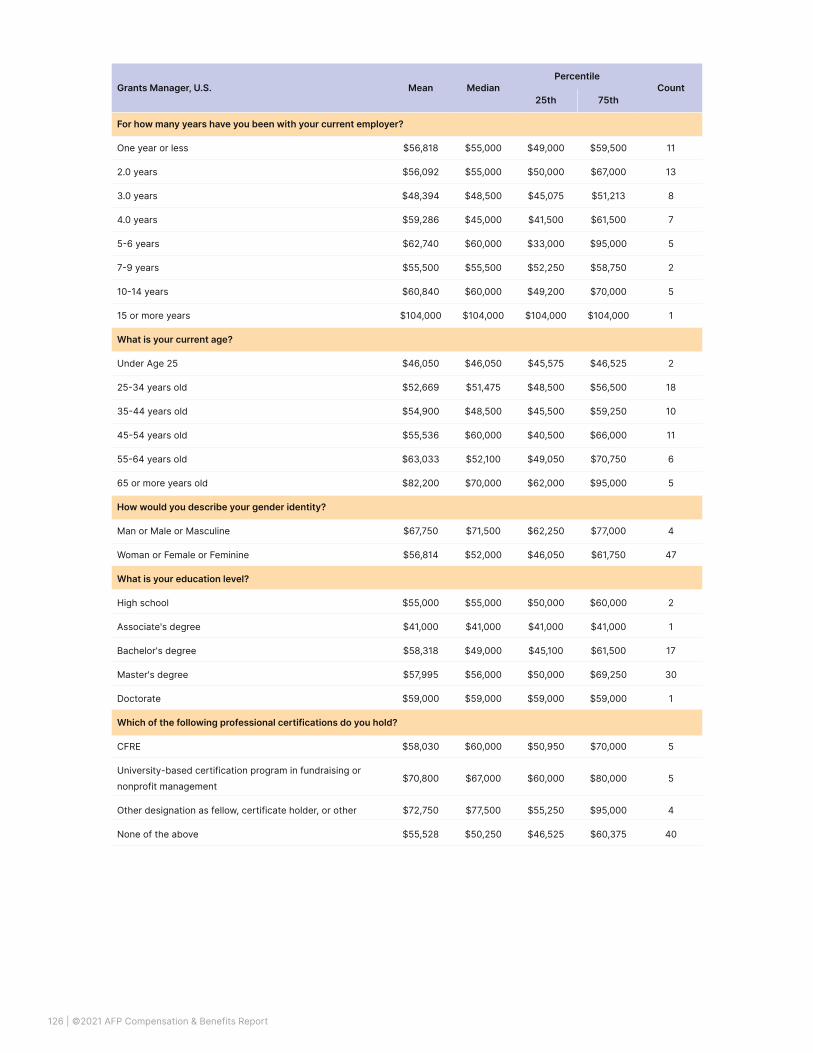
126 | ©2021 AFP Compensation & Benefits Report
Grants Manager, U.S. Mean MedianPercentile
Count25th 75th
For how many years have you been with your current employer?
One year or less $56,818 $55,000 $49,000 $59,500 11
2.0 years $56,092 $55,000 $50,000 $67,000 13
3.0 years $48,394 $48,500 $45,075 $51,213 8
4.0 years $59,286 $45,000 $41,500 $61,500 7
5-6 years $62,740 $60,000 $33,000 $95,000 5
7-9 years $55,500 $55,500 $52,250 $58,750 2
10-14 years $60,840 $60,000 $49,200 $70,000 5
15 or more years $104,000 $104,000 $104,000 $104,000 1
What is your current age?
Under Age 25 $46,050 $46,050 $45,575 $46,525 2
25-34 years old $52,669 $51,475 $48,500 $56,500 18
35-44 years old $54,900 $48,500 $45,500 $59,250 10
45-54 years old $55,536 $60,000 $40,500 $66,000 11
55-64 years old $63,033 $52,100 $49,050 $70,750 6
65 or more years old $82,200 $70,000 $62,000 $95,000 5
How would you describe your gender identity?
Man or Male or Masculine $67,750 $71,500 $62,250 $77,000 4
Woman or Female or Feminine $56,814 $52,000 $46,050 $61,750 47
What is your education level?
High school $55,000 $55,000 $50,000 $60,000 2
Associate's degree $41,000 $41,000 $41,000 $41,000 1
Bachelor's degree $58,318 $49,000 $45,100 $61,500 17
Master's degree $57,995 $56,000 $50,000 $69,250 30
Doctorate $59,000 $59,000 $59,000 $59,000 1
Which of the following professional certifications do you hold?
CFRE $58,030 $60,000 $50,950 $70,000 5
University-based certification program in fundraising or nonprofit management
$70,800 $67,000 $60,000 $80,000 5
Other designation as fellow, certificate holder, or other $72,750 $77,500 $55,250 $95,000 4
None of the above $55,528 $50,250 $46,525 $60,375 40

127 | ©2021 AFP Compensation & Benefits Report
Table 76: Salary Data for Dean or Unit Head– U.S.
Dean or Unit Head, U.S. Mean MedianPercentile
Count25th 75th
With what type of organization are you currently affiliated as a fundraising professional?
Arts: Performance, Exhibition, Creation $50,000 $50,000 $50,000 $50,000 1
Education: Higher Education $176,600 $120,000 $88,000 $245,000 5
Government or Quasi-Governmental Agency $77,000 $77,000 $77,000 $77,000 1
Health Services $178,000 $178,000 $178,000 $178,000 1
Human Services: Development & Social Services $168,000 $168,000 $168,000 $168,000 1
Human Services: Multi-Service Center $127,000 $127,000 $127,000 $127,000 1
Religious Congregation, Ministry, Broadcast, or Publishing; Organizing Body of a Faith
$88,000 $88,000 $88,000 $88,000 1
What is the geographic scope of your organization?
International $135,750 $124,000 $72,500 $187,250 4
National $215,000 $215,000 $147,500 $282,500 2
State and/or Regional (operations in more than one contiguous state)
$100,000 $88,000 $88,000 $120,000 5
Local or Multiple Communities $178,000 $178,000 $178,000 $178,000 1
Approximately how much money did your organization raise in contributed gifts from all sources during the last completed fiscal year?
Less than $100,000 $63,500 $63,500 $56,750 $70,250 2
$1,000,000-$2,999,999 $80,000 $80,000 $80,000 $80,000 1
$3,000,000-$4,999,999 $88,000 $88,000 $88,000 $88,000 1
$10,000,000-$49,999,999 $128,667 $120,000 $104,000 $149,000 3
$100 million or more $240,667 $245,000 $186,000 $297,500 3
How many FTE fundraising professionals work in your organization?
None $77,000 $77,000 $77,000 $77,000 1
.001-1.99 $50,000 $50,000 $50,000 $50,000 1
2.00-5.99 $88,000 $88,000 $88,000 $88,000 1
11.00-20.99 $148,333 $120,000 $100,000 $182,500 3
More than 20 $182,200 $168,000 $127,000 $178,000 5

128 | ©2021 AFP Compensation & Benefits Report
Dean or Unit Head, U.S. Mean MedianPercentile
Count25th 75th
What was your organization’s annual operating budget during the last completed fiscal year?
$250,000-$499,999 $50,000 $50,000 $50,000 $50,000 1
$500,000-$999,999 $80,000 $80,000 $80,000 $80,000 1
$3,000,000-$4,999,999 $88,000 $88,000 $88,000 $88,000 1
$10,000,000-$49,999,999 $127,500 $127,500 $102,250 $152,750 2
$100 million or more $195,600 $168,000 $127,000 $245,000 5
I don't know $120,000 $120,000 $120,000 $120,000 1
In what region is the office where you work located?
Northeast (Connecticut, Maine, Massachusetts, New Hampshire, Rhode Island, Vermont)
$77,000 $77,000 $77,000 $77,000 1
Mid-Atlantic (New Jersey, New York, Pennsylvania) $168,000 $168,000 $168,000 $168,000 1
South Atlantic (Delaware, District of Columbia, Florida, Georgia, Maryland, North Carolina, South Carolina, Virginia, West Virginia)
$88,000 $88,000 $88,000 $88,000 1
East South Central (Alabama, Kentucky, Mississippi, Tennessee)
$178,000 $178,000 $178,000 $178,000 1
East North Central (Illinois, Indiana, Michigan Ohio, Wisconsin)
$104,000 $104,000 $96,000 $112,000 2
Mountain (Arizona, Colorado, Idaho, Montana, New Mexico, Nevada, Utah, Wyoming,)
$103,500 $103,500 $91,750 $115,250 2
Pacific (Alaska, California, Hawaii, Oregon, Washington) $215,000 $245,000 $147,500 $297,500 3
In what size metropolitan area is the office where you work located?
Population less than 50,000 $80,000 $80,000 $80,000 $80,000 1
Population of 50,000-999,999 $94,200 $88,000 $77,000 $88,000 5
Population of 1,000,000-2,999,999 $149,000 $149,000 $134,500 $163,500 2
Population of 3 million or more $240,667 $245,000 $186,000 $297,500 3
For how many years have you been employed as a fundraising professional?
Less than 4 years $50,000 $50,000 $50,000 $50,000 1
7-9 years $178,000 $178,000 $178,000 $178,000 1
10-14 years $92,333 $80,000 $78,500 $100,000 3
15-19 years $168,000 $168,000 $168,000 $168,000 1
20-24 years $88,000 $88,000 $88,000 $88,000 1
25-29 years $238,500 $238,500 $182,750 $294,250 2
30 or more years $88,000 $88,000 $88,000 $88,000 1
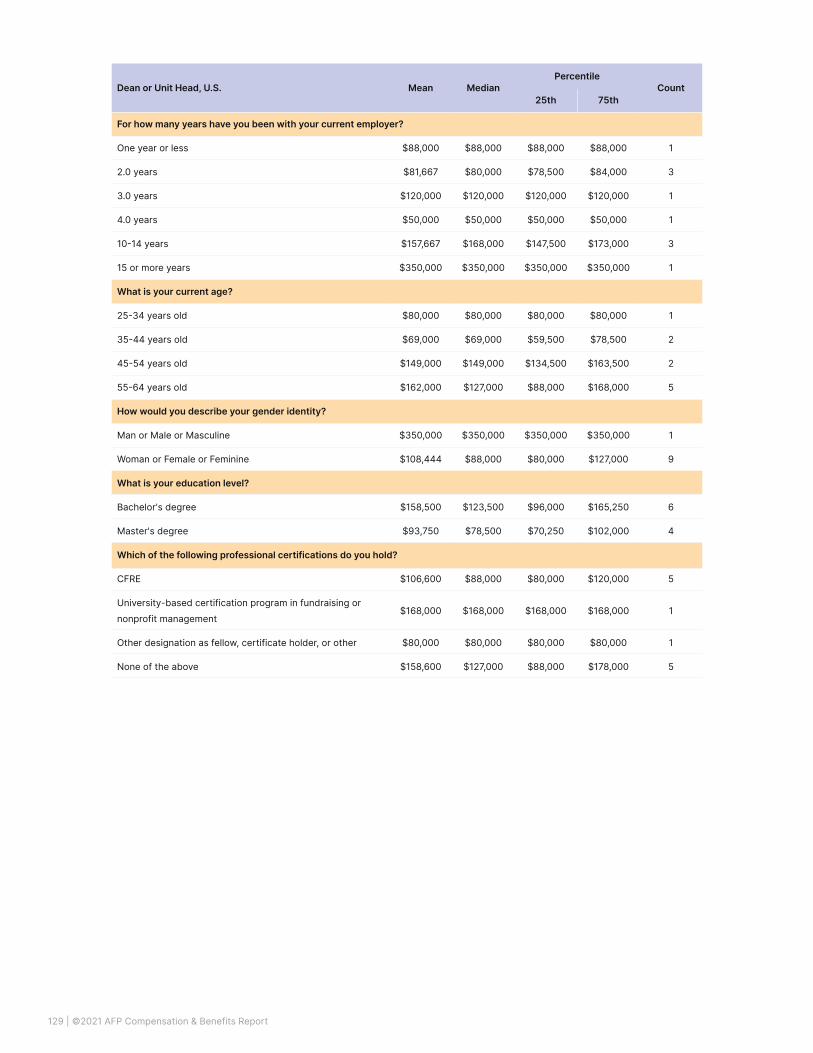
129 | ©2021 AFP Compensation & Benefits Report
Dean or Unit Head, U.S. Mean MedianPercentile
Count25th 75th
For how many years have you been with your current employer?
One year or less $88,000 $88,000 $88,000 $88,000 1
2.0 years $81,667 $80,000 $78,500 $84,000 3
3.0 years $120,000 $120,000 $120,000 $120,000 1
4.0 years $50,000 $50,000 $50,000 $50,000 1
10-14 years $157,667 $168,000 $147,500 $173,000 3
15 or more years $350,000 $350,000 $350,000 $350,000 1
What is your current age?
25-34 years old $80,000 $80,000 $80,000 $80,000 1
35-44 years old $69,000 $69,000 $59,500 $78,500 2
45-54 years old $149,000 $149,000 $134,500 $163,500 2
55-64 years old $162,000 $127,000 $88,000 $168,000 5
How would you describe your gender identity?
Man or Male or Masculine $350,000 $350,000 $350,000 $350,000 1
Woman or Female or Feminine $108,444 $88,000 $80,000 $127,000 9
What is your education level?
Bachelor's degree $158,500 $123,500 $96,000 $165,250 6
Master's degree $93,750 $78,500 $70,250 $102,000 4
Which of the following professional certifications do you hold?
CFRE $106,600 $88,000 $80,000 $120,000 5
University-based certification program in fundraising or nonprofit management
$168,000 $168,000 $168,000 $168,000 1
Other designation as fellow, certificate holder, or other $80,000 $80,000 $80,000 $80,000 1
None of the above $158,600 $127,000 $88,000 $178,000 5

130 | ©2021 AFP Compensation & Benefits Report
Appendix 9: Salary Statistics By Position, By Professional Track and Demographic Traits of Participants – Canada

131 | ©2021 AFP Compensation & Benefits Report
Table 77: Salary Data for CEO– Canada
CEO, Canada Mean MedianPercentile
Count25th 75th
With what type of organization are you currently affiliated as a fundraising professional?
Arts: Cultural or Heritage Focus $71,400 $71,400 $71,400 $71,400 1
Association or Membership Foundation $160,000 $160,000 $160,000 $160,000 1
Community Development/Economic Development $105,000 $100,000 $95,000 $112,500 3
Education: Higher Education $137,800 $134,000 $113,000 $168,000 5
Education: Primary or Secondary Education $123,000 $110,000 $67,000 $154,000 5
Education: Pre-K $50,500 $50,500 $42,250 $58,750 2
Education: Other $126,250 $135,000 $114,000 $147,250 4
Environment $78,700 $78,700 $75,050 $82,350 2
Fundraising & Allocations: Federated or Collective Fundraising
$116,433 $105,000 $90,000 $137,150 3
Fundraising & Grantmaking: Community Foundation, Donor-Advised Fund Sponsor
$117,217 $118,500 $104,250 $120,000 6
Health: National or Regional Health Agency $172,000 $172,000 $146,000 $198,000 2
Health Services (hospital, clinic, nursing home, specialized services)
$144,944 $118,985 $88,661 $173,000 31
Human Services: Development & Social Services $106,563 $99,250 $83,250 $130,500 8
Human Services: Multi-Service Center $175,000 $175,000 $175,000 $175,000 1
International Development/Overseas Aid and Support (excluding emergency relief)
$114,000 $114,000 $81,000 $147,000 2
Religious Congregation, Ministry, Broadcast, or Publishing; Organizing Body of a Faith
$100,000 $100,000 $100,000 $100,000 1
None of the Above $132,250 $132,250 $98,375 $166,125 2
What is the geographic scope of your organization?
International $192,500 $135,000 $80,250 $210,000 6
National $145,367 $147,000 $110,000 $187,500 15
Selected Provinces (operations in provinces separated by other provinces)
$165,000 $165,000 $107,500 $222,500 2
Provincial and/or Regional (operations in more than one contiguous province)
$113,391 $113,000 $81,000 $155,000 11
Local or Multiple Communities $113,053 $105,000 $74,500 $140,250 46

132 | ©2021 AFP Compensation & Benefits Report
CEO, Canada Mean MedianPercentile
Count25th 75th
Approximately how much money did your organization raise in contributed gifts from all sources during the last completed fiscal year?
Less than $100,000 $64,881 $52,700 $25,531 $92,050 4
$100,000-$249,999 $89,250 $86,500 $81,250 $94,500 4
$250,000-$499,999 $88,333 $74,500 $68,500 $102,750 12
$500,000-$999,999 $108,350 $112,000 $95,000 $120,000 10
$1,000,000-$2,999,999 $110,058 $98,250 $75,750 $146,500 16
$3,000,000-$4,999,999 $150,030 $150,000 $138,500 $166,113 7
$5,000,000-$9,999,999 $161,230 $171,650 $143,250 $178,750 10
$10,000,000-$49,999,999 $217,071 $215,000 $162,500 $264,750 7
$100 million or more $540,000 $540,000 $540,000 $540,000 1
I don't know. $130,000 $130,000 $130,000 $130,000 1
How many FTE fundraising professionals work in your organization?
None $100,000 $100,000 $100,000 $100,000 1
.001-1.99 $89,068 $81,500 $67,750 $110,750 22
2.00-5.99 $109,469 $102,000 $88,661 $129,500 27
6.00-10.99 $157,664 $169,300 $127,000 $183,500 11
11.00-20.99 $192,222 $174,000 $143,000 $180,000 9
More than 20 $329,833 $249,500 $224,750 $394,750 3
What was your organization’s annual operating budget during the last completed fiscal year?
Less than $250,000 $97,200 $74,000 $67,000 $127,000 5
$250,000-$499,999 $80,544 $86,000 $72,000 $100,000 21
$500,000-$999,999 $115,934 $120,000 $103,500 $138,000 15
$1,000,000-$2,999,999 $139,459 $135,000 $96,000 $171,000 19
$3,000,000-$4,999,999 $191,000 $195,000 $168,750 $217,250 4
$5,000,000-$9,999,999 $209,400 $209,400 $189,350 $229,450 2
$10,000,000-$49,999,999 $200,000 $175,000 $122,500 $252,500 4
$50,000,000-$74,999,999 $360,000 $360,000 $270,000 $450,000 2
$100 million or more $200,000 $200,000 $200,000 $200,000 1

133 | ©2021 AFP Compensation & Benefits Report
CEO, Canada Mean MedianPercentile
Count25th 75th
In what region is the office where you work located?
Prince Edward Island, New Brunswick or Nova Scotia $115,750 $114,500 $85,000 $145,250 4
Newfoundland and Labrador $71,600 $73,200 $69,300 $75,500 4
Quebec $147,214 $150,000 $89,500 $194,000 7
Ontario $133,301 $119,493 $87,991 $166,975 46
Manitoba $101,500 $101,500 $95,750 $107,250 2
Saskatchewan $130,000 $130,000 $130,000 $130,000 1
Alberta $111,545 $102,000 $86,000 $143,000 5
British Columbia $133,188 $121,000 $84,375 $144,250 8
In what size metropolitan area is the office where you work located?
Population less than 50,000 $107,045 $96,000 $72,000 $118,985 13
Population of 50,000-999,999 $109,733 $102,000 $76,000 $134,500 39
Population of 1,000,000-2,999,999 $129,757 $143,000 $112,500 $153,500 7
Population of 3 million or more $172,853 $168,000 $100,000 $200,000 17
For how many years have you been employed as a fundraising professional?
Less than 4 years $88,200 $88,200 $79,800 $96,600 2
4-6 years $121,400 $113,000 $102,000 $120,000 5
7-9 years $124,357 $110,000 $79,500 $159,000 7
10-14 years $126,135 $125,000 $104,500 $139,500 15
15-19 years $101,636 $90,000 $70,500 $122,500 11
20-24 years $111,888 $102,000 $72,000 $142,000 17
25-29 years $171,850 $171,000 $145,725 $180,500 8
30 or more years $173,680 $150,000 $64,000 $220,000 9
For how many years have you been with your current employer?
One year or less $105,850 $96,250 $80,250 $120,250 10
2.0 years $125,490 $120,000 $88,200 $153,000 11
3.0 years $99,272 $115,000 $52,750 $148,000 10
4.0 years $128,175 $102,000 $88,000 $165,113 7
5-6 years $138,500 $141,000 $117,000 $162,500 4
7-9 years $150,059 $127,000 $90,991 $171,250 14
10-14 years $137,542 $100,000 $84,000 $117,250 12
15 or more years $144,967 $147,150 $119,000 $172,825 6

134 | ©2021 AFP Compensation & Benefits Report
CEO, Canada Mean MedianPercentile
Count25th 75th
What is your current age?
25-34 years old $110,000 $110,000 $93,500 $126,500 2
35-44 years old $110,635 $117,000 $95,000 $125,000 11
45-54 years old $130,690 $109,000 $87,750 $171,325 30
55-64 years old $134,551 $120,000 $74,000 $162,225 25
65 or more years old $86,500 $64,500 $50,000 $109,000 5
How would you describe your gender identity?
Man or Male or Masculine $176,100 $131,000 $108,750 $216,250 20
Woman or Female or Feminine $110,735 $102,000 $74,000 $150,000 53
Prefer not to answer $113,000 $113,000 $113,000 $113,000 1
What is your education level?
High school $119,493 $119,493 $119,239 $119,746 2
Two-Year Diploma or some university $84,507 $74,500 $64,125 $119,250 14
Bachelor's degree/1er cycle $122,398 $102,500 $83,250 $155,750 26
Master's degree/2e cycle $168,870 $150,000 $108,000 $169,650 19
Post-graduate study - specialization $79,250 $68,500 $65,250 $82,500 4
Professional degree (JD, LLB, MBA, MD, DO, etc.) $188,000 $207,500 $168,125 $227,375 4
Professional or technical certification (such as CPA, paralegal, apprenticeship in a trade, etc.)
$128,000 $142,500 $97,750 $172,750 4
Which of the following professional certifications do you hold?
CFRE $136,931 $118,000 $87,991 $173,500 30
ACFRE $215,000 $215,000 $215,000 $215,000 1
University-based certification program in fundraising or nonprofit management
$114,619 $109,500 $73,750 $169,475 12
Other designation as fellow, certificate holder, or other $134,017 $129,500 $95,500 $168,325 12
None of the above $128,061 $109,500 $83,000 $147,250 28
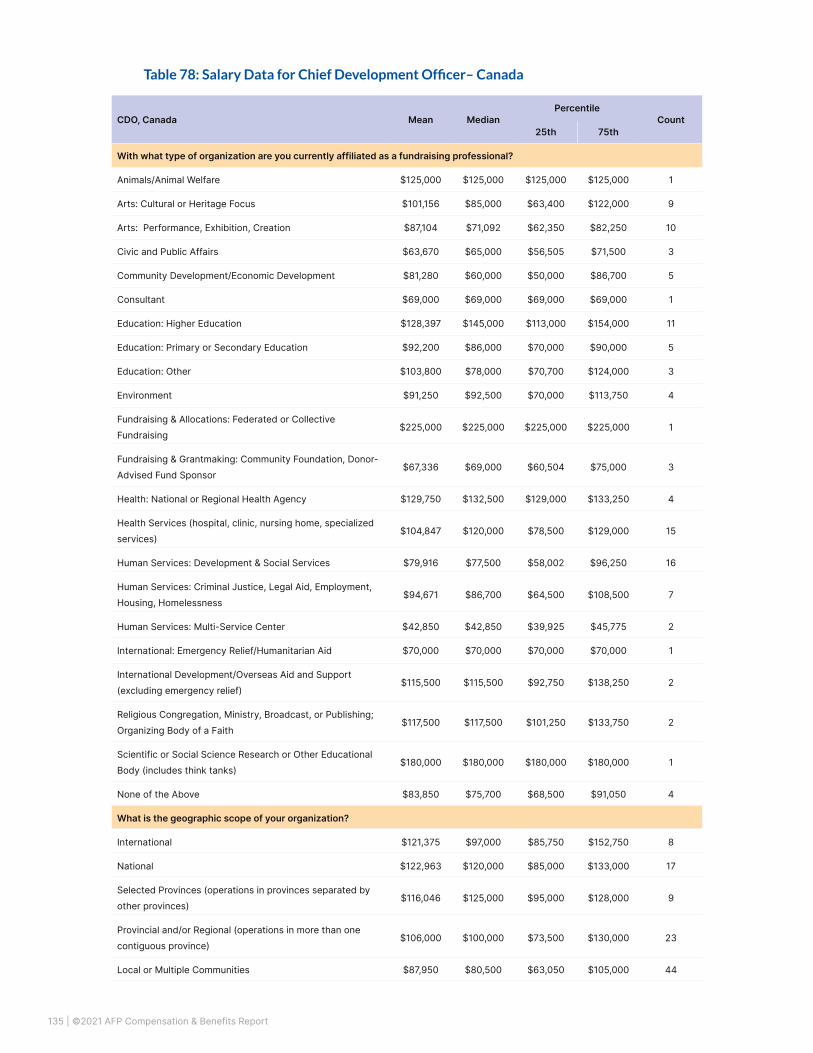
135 | ©2021 AFP Compensation & Benefits Report
Table 78: Salary Data for Chief Development Officer– Canada
CDO, Canada Mean MedianPercentile
Count25th 75th
With what type of organization are you currently affiliated as a fundraising professional?
Animals/Animal Welfare $125,000 $125,000 $125,000 $125,000 1
Arts: Cultural or Heritage Focus $101,156 $85,000 $63,400 $122,000 9
Arts: Performance, Exhibition, Creation $87,104 $71,092 $62,350 $82,250 10
Civic and Public Affairs $63,670 $65,000 $56,505 $71,500 3
Community Development/Economic Development $81,280 $60,000 $50,000 $86,700 5
Consultant $69,000 $69,000 $69,000 $69,000 1
Education: Higher Education $128,397 $145,000 $113,000 $154,000 11
Education: Primary or Secondary Education $92,200 $86,000 $70,000 $90,000 5
Education: Other $103,800 $78,000 $70,700 $124,000 3
Environment $91,250 $92,500 $70,000 $113,750 4
Fundraising & Allocations: Federated or Collective Fundraising
$225,000 $225,000 $225,000 $225,000 1
Fundraising & Grantmaking: Community Foundation, Donor-Advised Fund Sponsor
$67,336 $69,000 $60,504 $75,000 3
Health: National or Regional Health Agency $129,750 $132,500 $129,000 $133,250 4
Health Services (hospital, clinic, nursing home, specialized services)
$104,847 $120,000 $78,500 $129,000 15
Human Services: Development & Social Services $79,916 $77,500 $58,002 $96,250 16
Human Services: Criminal Justice, Legal Aid, Employment, Housing, Homelessness
$94,671 $86,700 $64,500 $108,500 7
Human Services: Multi-Service Center $42,850 $42,850 $39,925 $45,775 2
International: Emergency Relief/Humanitarian Aid $70,000 $70,000 $70,000 $70,000 1
International Development/Overseas Aid and Support (excluding emergency relief)
$115,500 $115,500 $92,750 $138,250 2
Religious Congregation, Ministry, Broadcast, or Publishing; Organizing Body of a Faith
$117,500 $117,500 $101,250 $133,750 2
Scientific or Social Science Research or Other Educational Body (includes think tanks)
$180,000 $180,000 $180,000 $180,000 1
None of the Above $83,850 $75,700 $68,500 $91,050 4
What is the geographic scope of your organization?
International $121,375 $97,000 $85,750 $152,750 8
National $122,963 $120,000 $85,000 $133,000 17
Selected Provinces (operations in provinces separated by other provinces)
$116,046 $125,000 $95,000 $128,000 9
Provincial and/or Regional (operations in more than one contiguous province)
$106,000 $100,000 $73,500 $130,000 23
Local or Multiple Communities $87,950 $80,500 $63,050 $105,000 44

136 | ©2021 AFP Compensation & Benefits Report
CDO, Canada Mean MedianPercentile
Count25th 75th
Approximately how much money did your organization raise in contributed gifts from all sources during the last completed fiscal year?
Less than $100,000 $63,000 $64,000 $58,750 $68,250 4
$100,000-$249,999 $50,386 $48,033 $47,279 $57,175 6
$250,000-$499,999 $74,751 $66,000 $51,505 $87,000 12
$500,000-$999,999 $83,327 $80,700 $70,500 $89,500 14
$1,000,000-$2,999,999 $105,470 $117,000 $74,500 $130,000 23
$3,000,000-$4,999,999 $123,297 $122,000 $98,500 $140,000 15
$5,000,000-$9,999,999 $114,429 $105,000 $90,500 $145,000 7
$10,000,000-$49,999,999 $200,000 $200,000 $175,000 $225,000 2
$50,000,000-$74,999,999 $143,000 $130,000 $125,000 $154,500 3
$100 million or more $152,500 $151,500 $120,250 $183,750 4
How many FTE fundraising professionals work in your organization?
None $70,000 $70,000 $66,000 $74,000 2
.001-1.99 $71,448 $67,000 $54,005 $80,500 30
2.00-5.99 $105,112 $97,000 $81,050 $130,000 32
6.00-10.99 $127,020 $140,000 $86,140 $166,250 8
11.00-20.99 $143,286 $130,000 $115,000 $155,000 7
More than 20 $133,364 $130,000 $120,000 $155,500 11
What was your organization’s annual operating budget during the last completed fiscal year?
Less than $250,000 $68,900 $78,000 $58,350 $84,000 3
$250,000-$499,999 $63,563 $59,500 $49,313 $73,750 4
$500,000-$999,999 $107,195 $95,000 $66,000 $148,500 7
$1,000,000-$2,999,999 $61,532 $62,000 $52,500 $67,500 19
$3,000,000-$4,999,999 $109,265 $108,500 $81,000 $125,000 12
$5,000,000-$9,999,999 $96,534 $86,000 $78,250 $120,000 12
$10,000,000-$49,999,999 $126,114 $122,000 $93,350 $142,000 19
$50,000,000-$74,999,999 $148,500 $152,000 $142,000 $158,500 4
$100 million or more $120,000 $133,000 $107,500 $139,000 3
I don't know $135,500 $139,000 $99,500 $150,000 6

137 | ©2021 AFP Compensation & Benefits Report
CDO, Canada Mean MedianPercentile
Count25th 75th
In what region is the office where you work located?
Prince Edward Island, New Brunswick or Nova Scotia $64,667 $62,000 $54,000 $74,000 3
Newfoundland and Labrador $48,625 $48,625 $47,938 $49,313 2
Quebec $102,500 $95,000 $86,250 $115,000 6
Ontario $112,632 $110,000 $77,000 $141,500 35
Manitoba $68,728 $70,000 $52,500 $83,750 6
Saskatchewan $76,820 $72,000 $63,400 $75,000 5
Alberta $104,208 $117,000 $79,000 $125,000 13
British Columbia $107,555 $94,000 $70,000 $134,000 21
In what size metropolitan area is the office where you work located?
Population less than 50,000 $68,675 $75,000 $58,425 $85,250 4
Population of 50,000-999,999 $84,690 $72,185 $55,000 $104,000 37
Population of 1,000,000-2,999,999 $110,369 $118,500 $82,615 $131,500 34
Population of 3 million or more $131,088 $125,000 $87,850 $163,250 16
For how many years have you been employed as a fundraising professional?
Less than 4 years $61,000 $62,000 $54,000 $68,500 3
4-6 years $61,329 $63,000 $48,700 $65,000 9
7-9 years $76,463 $72,092 $58,002 $87,000 12
10-14 years $93,070 $83,230 $70,000 $121,500 18
15-19 years $92,025 $85,000 $70,000 $117,750 16
20-24 years $130,786 $130,000 $113,750 $142,000 14
25-29 years $122,364 $122,000 $112,000 $154,000 11
30 or more years $168,714 $160,000 $141,000 $202,000 7
For how many years have you been with your current employer?
One year or less $80,713 $78,000 $61,000 $105,000 15
2.0 years $114,564 $110,000 $70,000 $158,750 16
3.0 years $98,728 $87,000 $69,000 $128,000 13
4.0 years $102,683 $104,350 $70,425 $131,000 6
5-6 years $82,438 $76,000 $58,750 $92,000 12
7-9 years $100,404 $84,000 $73,889 $131,500 14
10-14 years $119,500 $122,500 $108,000 $137,500 8
15 or more years $144,000 $113,500 $90,750 $199,250 6

138 | ©2021 AFP Compensation & Benefits Report
CDO, Canada Mean MedianPercentile
Count25th 75th
What is your current age?
Under Age 25 $83,000 $83,000 $83,000 $83,000 1
25-34 years old $68,026 $70,000 $61,000 $80,550 10
35-44 years old $82,798 $79,000 $60,000 $107,500 23
45-54 years old $110,962 $117,500 $70,500 $145,750 26
55-64 years old $119,650 $120,000 $84,000 $150,000 27
65 or more years old $149,500 $149,500 $134,750 $164,250 2
How would you describe your gender identity?
Man or Male or Masculine $112,351 $120,000 $82,930 $135,500 11
Woman or Female or Feminine $99,927 $86,350 $69,250 $130,000 78
What is your education level?
High school $82,002 $61,004 $50,505 $92,500 4
Two-Year Diploma or some university $104,640 $104,000 $80,350 $130,000 10
Bachelor's degree/1er cycle $101,650 $87,000 $70,000 $130,000 45
Master's degree/2e cycle $106,744 $104,000 $66,500 $135,500 19
Doctorate/3e cycle $92,000 $92,000 $77,000 $107,000 2
Post-graduate study - specialization $87,000 $76,000 $70,500 $98,000 3
Professional degree (JD, LLB, MBA, MD, DO, etc.) $115,091 $121,500 $94,341 $142,250 4
Professional or technical certification (such as CPA, paralegal, apprenticeship in a trade, etc.)
$74,000 $74,000 $71,500 $76,500 2
Which of the following professional certifications do you hold?
CFRE $116,125 $122,000 $82,250 $133,750 34
University-based certification program in fundraising or nonprofit management
$110,750 $118,500 $77,500 $134,000 12
Other designation as fellow, certificate holder, or other $99,112 $97,500 $60,000 $128,750 18
None of the above $91,414 $78,000 $62,750 $112,500 36

139 | ©2021 AFP Compensation & Benefits Report
Table 79: Salary Data for Vice Chancellor, Deputy / Assistant / Associate Director,
Vice President – Canada
Associate Vice Chancellor, Deputy/Assistant/Associate Director, Vice President, Canada
Mean MedianPercentile
Count25th 75th
With what type of organization are you currently affiliated as a fundraising professional?
Arts: Performance, Exhibition, Creation $111,250 $120,000 $101,250 $130,000 4
Community Development/Economic Development $70,000 $70,000 $70,000 $70,000 1
Education: Higher Education $137,000 $137,000 $135,500 $138,500 2
Education: Primary or Secondary Education $106,000 $106,000 $106,000 $106,000 1
Education: Other $107,000 $107,000 $107,000 $107,000 1
Health: National or Regional Health Agency $115,333 $109,999 $98,000 $130,000 3
Health Services $91,250 $91,250 $88,125 $94,375 2
Human Services: Development & Social Services $84,375 $85,000 $77,500 $91,875 4
Human Services: Criminal Justice, Legal Aid, Employment, Housing, Homelessness
$70,000 $70,000 $70,000 $70,000 1
International: Emergency Relief/Humanitarian Aid $141,000 $141,000 $141,000 $141,000 1
None of the Above $124,500 $124,500 $113,750 $135,250 2
What is the geographic scope of your organization?
International $141,000 $141,000 $141,000 $141,000 1
National $127,750 $132,500 $109,249 $142,250 8
Provincial and/or Regional (operations in more than one contiguous province)
$93,333 $86,000 $73,000 $110,000 3
Local or Multiple Communities $98,563 $93,750 $83,750 $108,250 8
Approximately how much money did your organization raise in contributed gifts from all sources during the last completed fiscal year?
$250,000-$499,999 $97,500 $97,500 $97,500 $97,500
$500,000-$999,999 $70,000 $70,000 $70,000 $70,000
$1,000,000-$2,999,999 $70,000 $70,000 $65,000 $75,000
$3,000,000-$4,999,999 $94,000 $90,000 $88,000 $98,000
$5,000,000-$9,999,999 $115,000 $115,000 $100,000 $130,000
$10,000,000-$49,999,999 $121,500 $117,500 $107,750 $131,750
$100 million or more $140,500 $140,500 $140,250 $140,750
I don't know. $146,000 $146,000 $146,000 $146,000

140 | ©2021 AFP Compensation & Benefits Report
Associate Vice Chancellor, Deputy/Assistant/Associate Director, Vice President, Canada
Mean MedianPercentile
Count25th 75th
How many FTE fundraising professionals work in your organization?
.001-1.99 $83,750 $83,750 $76,875 $90,625 2
2.00-5.99 $104,000 $106,000 $83,000 $125,000 7
6.00-10.99 $94,000 $90,000 $87,500 $98,500 3
11.00-20.99 $124,400 $125,000 $115,000 $134,000 5
More than 20 $145,500 $145,500 $143,250 $147,750 2
What was your organization’s annual operating budget during the last completed fiscal year?
$1,000,000-$2,999,999 $77,500 $77,500 $73,750 $81,250 2
$3,000,000-$4,999,999 $103,000 $103,000 $81,500 $124,500 2
$5,000,000-$9,999,999 $117,500 $109,999 $103,750 $127,500 3
$10,000,000-$49,999,999 $118,500 $110,500 $105,250 $123,750 4
$50,000,000-$74,999,999 $90,000 $90,000 $90,000 $90,000 1
$100 million or more $123,750 $137,000 $120,500 $140,250 4
I don't know $106,000 $107,000 $96,500 $116,000 3
In what region is the office where you work located?
Prince Edward Island, New Brunswick or Nova Scotia $60,000 $60,000 $60,000 $60,000 1
Newfoundland and Labrador $86,000 $86,000 $86,000 $86,000 1
Ontario $122,182 $125,000 $108,500 $143,000 11
Saskatchewan $134,000 $134,000 $134,000 $134,000 1
Alberta $90,125 $93,750 $85,000 $98,875 4
British Columbia $106,000 $106,000 $106,000 $106,000 1
In what size metropolitan area is the office where you work located?
Population of 50,000-999,999 $90,167 $85,500 $73,750 $101,000 6
Population of 1,000,000-2,999,999 $106,917 $100,250 $91,875 $119,500 6
Population of 3 million or more $129,714 $140,000 $112,500 $143,000 7
For how many years have you been employed as a fundraising professional?
Less than 4 years $121,750 $121,750 $109,625 $133,875 2
4-6 years $79,000 $70,000 $65,000 $88,500 3
7-9 years $108,750 $104,500 $98,500 $114,750 4
10-14 years $134,000 $134,000 $134,000 $134,000 1
15-19 years $111,200 $115,000 $90,000 $125,000 5
20-24 years $145,000 $145,000 $145,000 $145,000 1
25-29 years $113,333 $109,999 $95,000 $130,000 3

141 | ©2021 AFP Compensation & Benefits Report
Associate Vice Chancellor, Deputy/Assistant/Associate Director, Vice President, Canada
Mean MedianPercentile
Count25th 75th
For how many years have you been with your current employer?
One year or less $83,750 $83,750 $76,875 $90,625 2
3.0 years $130,750 $135,000 $120,500 $145,250 4
4.0 years $106,500 $106,500 $104,750 $108,249 2
5-6 years $100,000 $90,000 $75,000 $120,000 3
7-9 years $113,667 $115,000 $100,000 $128,000 3
10-14 years $110,000 $110,000 $84,500 $135,500 4
15 or more years $106,000 $106,000 $106,000 $106,000 1
What is your current age?
25-34 years old $60,000 $60,000 $60,000 $60,000 1
35-44 years old $108,063 $102,250 $88,750 $135,500 8
45-54 years old $116,428 $109,999 $104,500 $130,000 7
55-64 years old $117,000 $125,000 $102,500 $135,500 3
How would you describe your gender identity?
Man or Male or Masculine $97,125 $93,750 $82,500 $108,375 4
Woman or Female or Feminine $113,467 $109,999 $94,500 $137,000 15
What is your education level?
Two-Year Diploma or some university $70,000 $70,000 $70,000 $70,000 1
Bachelor's degree/1er cycle $105,650 $102,250 $87,000 $122,500 10
Master's degree/2e cycle $129,000 $140,000 $123,000 $140,500 3
Post-graduate study - specialization $115,000 $115,000 $100,000 $130,000 2
Professional degree (JD, LLB, MBA, MD, DO, etc.) $122,000 $122,000 $115,999 $128,000 2
Professional or technical certification (such as CPA, paralegal, apprenticeship in a trade, etc.)
$103,000 $103,000 $103,000 $103,000 1
Which of the following professional certifications do you hold?
CFRE $115,500 $118,500 $93,250 $138,500 6
University-based certification program in fundraising or nonprofit management
$143,000 $143,000 $141,500 $144,500 2
Other designation as fellow, certificate holder, or other $104,667 $103,000 $86,500 $122,000 3
None of the above $107,864 $107,000 $91,750 $120,000 11

142 | ©2021 AFP Compensation & Benefits Report
Table 80: Salary Data for Program Director / Manager – Canada
Program Director / Manager, Canada Mean MedianPercentile
Count25th 75th
With what type of organization are you currently affiliated as a fundraising professional?
Animals/Animal Welfare (domestic or captive animals, shelter, rescue, adoption, zoos)
$80,000 $80,000 $80,000 $80,000 1
Arts: Cultural or Heritage Focus $61,667 $78,000 $42,500 $89,000 3
Arts: Performance, Exhibition, Creation $68,333 $57,000 $55,000 $76,000 3
Civic and Public Affairs $67,500 $67,500 $66,250 $68,750 2
Community Development/Economic Development $73,250 $72,500 $68,250 $77,500 4
Consultant $100,000 $100,000 $100,000 $100,000 1
Education: Higher Education $108,285 $117,500 $93,500 $119,532 6
Education: Primary or Secondary Education $78,333 $80,000 $70,000 $87,500 3
Education: Other $70,000 $70,000 $70,000 $70,000 1
Environment $42,300 $50,000 $39,050 $53,250 4
Fundraising & Grantmaking: Community Foundation, Donor-Advised Fund Sponsor
$57,500 $60,000 $55,000 $61,250 3
Health: National or Regional Health Agency $84,200 $77,000 $74,000 $90,000 5
Health Services $74,665 $77,500 $55,000 $90,000 20
Human Services: Development & Social Services $63,690 $66,450 $54,000 $73,750 10
Human Services: Criminal Justice, Legal Aid, Employment, Housing, Homelessness
$75,605 $71,234 $70,000 $77,500 7
Human Services: Multi-Service Center $53,667 $55,000 $49,000 $59,000 3
International: Emergency Relief/Humanitarian Aid $69,000 $69,000 $69,000 $69,000 1
International Development/Overseas Aid and Support (excluding emergency relief)
$55,750 $61,650 $57,375 $67,200 6
Religious Congregation, Ministry, Broadcast, or Publishing; Organizing Body of a Faith
$72,000 $72,000 $63,000 $81,000 2
Scientific or Social Science Research or Other Educational Body (includes think tanks)
$83,733 $80,000 $43,100 $122,500 3
What is the geographic scope of your organization?
International $72,958 $67,000 $60,125 $85,250 12
National $75,421 $75,000 $69,925 $80,000 14
Selected Provinces (operations in provinces separated by other provinces)
$83,500 $83,500 $80,250 $86,750 2
Provincial and/or Regional (operations in more than one contiguous province)
$77,296 $75,000 $57,500 $92,500 15
Local or Multiple Communities $70,454 $63,000 $55,000 $84,000 37

143 | ©2021 AFP Compensation & Benefits Report
Program Director / Manager, Canada Mean MedianPercentile
Count25th 75th
Approximately how much money did your organization raise in contributed gifts from all sources during the last completed fiscal year?
Less than $100,000 $53,500 $61,500 $34,000 $81,000 4
$100,000-$249,999 $57,500 $57,500 $56,250 $58,750 2
$250,000-$499,999 $56,500 $56,500 $54,750 $58,250 2
$500,000-$999,999 $63,767 $55,000 $51,000 $69,900 9
$1,000,000-$2,999,999 $70,510 $75,000 $58,000 $85,500 23
$3,000,000-$4,999,999 $76,265 $74,000 $65,900 $87,000 7
$5,000,000-$9,999,999 $76,161 $70,617 $66,000 $80,000 12
$10,000,000-$49,999,999 $94,474 $90,000 $77,500 $117,500 11
$100 million or more $85,500 $84,000 $73,250 $97,000 3
I don't know. $71,000 $63,000 $56,500 $81,500 3
How many FTE fundraising professionals work in your organization?
None $51,000 $50,000 $50,000 $63,000 5
.001-1.99 $67,317 $63,400 $51,000 $81,000 12
2.00-5.99 $70,701 $70,000 $56,000 $80,000 37
6.00-10.99 $86,722 $80,000 $63,000 $90,000 9
11.00-20.99 $74,188 $72,500 $61,125 $82,500 8
More than 20 $111,542 $119,000 $110,000 $119,709 5
What was your organization’s annual operating budget during the last completed fiscal year?
Less than $250,000 $31,000 $31,000 $19,000 $43,000 2
$250,000-$499,999 $66,333 $60,000 $57,500 $72,000 3
$500,000-$999,999 $73,132 $70,000 $57,500 $92,500 8
$1,000,000-$2,999,999 $58,954 $56,000 $51,000 $65,000 13
$3,000,000-$4,999,999 $80,750 $80,000 $72,000 $85,500 8
$5,000,000-$9,999,999 $83,643 $80,000 $72,500 $95,000 7
$10,000,000-$49,999,999 $76,173 $71,234 $63,000 $80,000 17
$50,000,000-$74,999,999 $63,000 $63,000 $63,000 $63,000 1
$75,000,000 - $99,999,999 $86,000 $86,000 $86,000 $86,000 1
$100 million or more $114,855 $114,855 $112,427 $117,282 2
I don't know $75,969 $77,000 $54,500 $86,250 15

144 | ©2021 AFP Compensation & Benefits Report
Program Director / Manager, Canada Mean MedianPercentile
Count25th 75th
In what region is the office where you work located?
Prince Edward Island, New Brunswick or Nova Scotia $58,240 $55,000 $50,000 $61,500 5
Quebec $106,927 $112,000 $102,000 $116,927 4
Ontario $75,622 $74,000 $61,800 $81,000 41
Manitoba $45,248 $55,000 $29,019 $61,250 7
Saskatchewan $61,750 $54,500 $51,250 $65,000 4
Alberta $84,833 $85,500 $77,500 $89,000 6
British Columbia $76,500 $73,500 $59,250 $87,500 10
In what size metropolitan area is the office where you work located?
Population less than 50,000 $70,010 $67,500 $55,000 $80,000 6
Population of 50,000-999,999 $68,302 $63,000 $55,000 $80,000 33
Population of 1,000,000-2,999,999 $73,768 $72,500 $60,750 $85,750 22
Population of 3 million or more $85,013 $80,500 $73,750 $96,250 16
For how many years have you been employed as a fundraising professional?
Less than 4 years $62,134 $60,900 $53,500 $68,750 10
4-6 years $63,173 $63,000 $55,000 $75,000 17
7-9 years $78,489 $75,000 $62,500 $80,000 9
10-14 years $74,588 $75,000 $63,000 $85,000 17
15-19 years $79,642 $80,000 $65,000 $95,000 11
20-24 years $73,750 $78,500 $59,750 $87,000 8
25-29 years $95,000 $95,000 $92,500 $97,500 2
30 or more years $142,355 $142,355 $131,032 $153,677 2
For how many years have you been with your current employer?
One year or less $72,176 $77,000 $55,000 $85,000 21
2.0 years $75,500 $75,000 $64,750 $87,500 10
3.0 years $65,963 $65,000 $62,400 $69,950 7
4.0 years $71,857 $63,000 $55,500 $85,000 7
5-6 years $74,786 $74,500 $61,750 $94,500 14
7-9 years $79,800 $71,500 $60,000 $85,500 10
10-14 years $63,117 $63,117 $59,059 $67,176 2
15 or more years $80,753 $80,000 $60,000 $100,058 5
What is your current age?
25-34 years old $62,731 $62,500 $55,000 $69,000 13
35-44 years old $77,925 $75,000 $62,700 $91,250 28
45-54 years old $73,689 $77,000 $60,000 $85,000 19
55-64 years old $80,396 $74,000 $58,000 $89,500 15
65 or more years old $7,000 $7,000 $7,000 $7,000 1

145 | ©2021 AFP Compensation & Benefits Report
Program Director / Manager, Canada Mean MedianPercentile
Count25th 75th
How would you describe your gender identity?
Man or Male or Masculine $73,208 $72,500 $60,125 $83,750 12
Woman or Female or Feminine $72,491 $71,234 $58,500 $84,500 63
What is your education level?
High School Diploma $70,000 $69,000 $58,000 $81,000 4
Two-Year Diploma or some university $68,571 $62,500 $57,500 $80,500 15
Bachelor's degree/1er cycle $72,928 $74,000 $56,500 $80,500 39
Master's degree/2e cycle $97,563 $105,000 $79,250 $116,750 8
Doctorate/3e cycle $80,000 $80,000 $80,000 $80,000 1
Post-graduate study - specialization $32,550 $30,500 $6,800 $56,250 4
Professional degree (JD, LLB, MBA, MD, DO, etc.) $79,667 $75,000 $72,000 $85,000 3
Professional or technical certification (such as CPA, paralegal, apprenticeship in a trade, etc.)
$63,000 $63,000 $63,000 $63,000 1
Which of the following professional certifications do you hold?
CFRE $84,794 $84,000 $75,000 $100,029 23
University-based certification program in fundraising or nonprofit management
$68,375 $66,000 $58,500 $81,750 12
Other designation as fellow, certificate holder, or other $62,313 $60,000 $53,750 $81,875 8
None of the above $65,324 $63,000 $55,000 $75,000 36
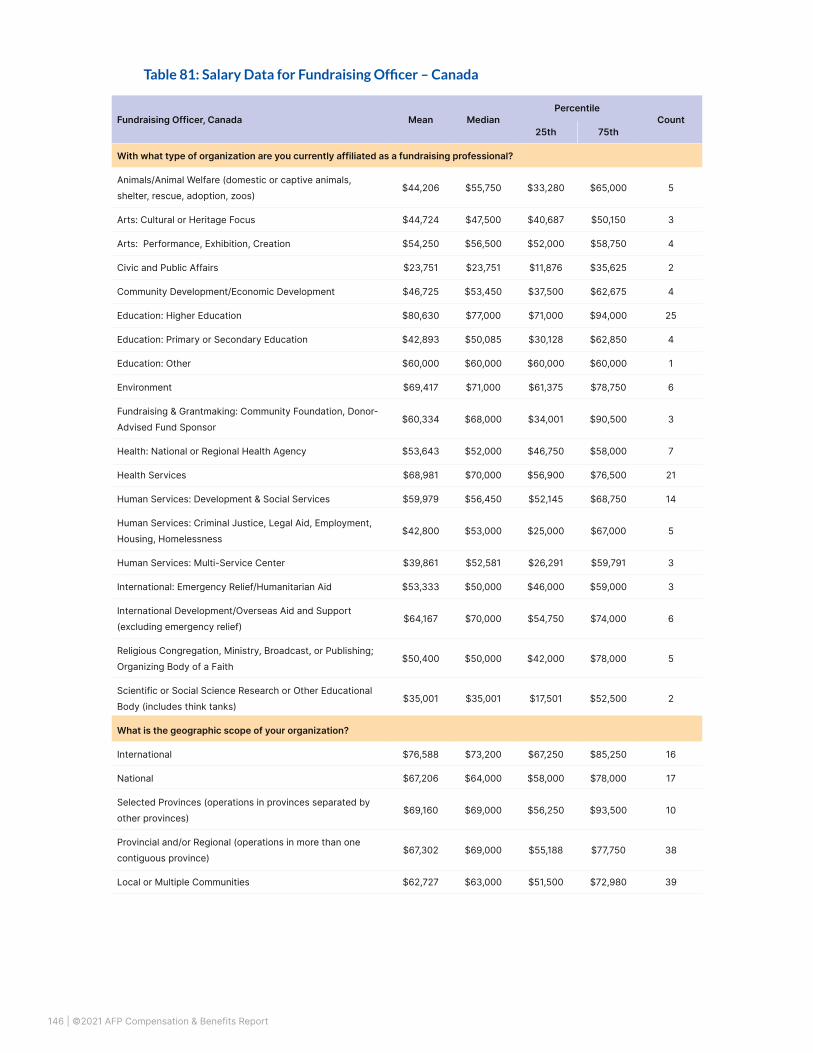
146 | ©2021 AFP Compensation & Benefits Report
Table 81: Salary Data for Fundraising Officer – Canada
Fundraising Officer, Canada Mean MedianPercentile
Count25th 75th
With what type of organization are you currently affiliated as a fundraising professional?
Animals/Animal Welfare (domestic or captive animals, shelter, rescue, adoption, zoos)
$44,206 $55,750 $33,280 $65,000 5
Arts: Cultural or Heritage Focus $44,724 $47,500 $40,687 $50,150 3
Arts: Performance, Exhibition, Creation $54,250 $56,500 $52,000 $58,750 4
Civic and Public Affairs $23,751 $23,751 $11,876 $35,625 2
Community Development/Economic Development $46,725 $53,450 $37,500 $62,675 4
Education: Higher Education $80,630 $77,000 $71,000 $94,000 25
Education: Primary or Secondary Education $42,893 $50,085 $30,128 $62,850 4
Education: Other $60,000 $60,000 $60,000 $60,000 1
Environment $69,417 $71,000 $61,375 $78,750 6
Fundraising & Grantmaking: Community Foundation, Donor-Advised Fund Sponsor
$60,334 $68,000 $34,001 $90,500 3
Health: National or Regional Health Agency $53,643 $52,000 $46,750 $58,000 7
Health Services $68,981 $70,000 $56,900 $76,500 21
Human Services: Development & Social Services $59,979 $56,450 $52,145 $68,750 14
Human Services: Criminal Justice, Legal Aid, Employment, Housing, Homelessness
$42,800 $53,000 $25,000 $67,000 5
Human Services: Multi-Service Center $39,861 $52,581 $26,291 $59,791 3
International: Emergency Relief/Humanitarian Aid $53,333 $50,000 $46,000 $59,000 3
International Development/Overseas Aid and Support (excluding emergency relief)
$64,167 $70,000 $54,750 $74,000 6
Religious Congregation, Ministry, Broadcast, or Publishing; Organizing Body of a Faith
$50,400 $50,000 $42,000 $78,000 5
Scientific or Social Science Research or Other Educational Body (includes think tanks)
$35,001 $35,001 $17,501 $52,500 2
What is the geographic scope of your organization?
International $76,588 $73,200 $67,250 $85,250 16
National $67,206 $64,000 $58,000 $78,000 17
Selected Provinces (operations in provinces separated by other provinces)
$69,160 $69,000 $56,250 $93,500 10
Provincial and/or Regional (operations in more than one contiguous province)
$67,302 $69,000 $55,188 $77,750 38
Local or Multiple Communities $62,727 $63,000 $51,500 $72,980 39

147 | ©2021 AFP Compensation & Benefits Report
Fundraising Officer, Canada Mean MedianPercentile
Count25th 75th
Approximately how much money did your organization raise in contributed gifts from all sources during the last completed fiscal year?
Less than $100,000 $36,291 $33,873 $29,437 $41,937 3
$100,000-$249,999 $52,291 $52,291 $52,145 $52,436 2
$250,000-$499,999 $57,500 $62,000 $54,750 $62,500 3
$500,000-$999,999 $58,759 $54,500 $47,543 $59,925 8
$1,000,000-$2,999,999 $65,581 $67,565 $56,250 $75,600 14
$3,000,000-$4,999,999 $65,894 $70,000 $60,900 $72,500 7
$5,000,000-$9,999,999 $58,476 $60,000 $48,500 $68,000 9
$10,000,000-$49,999,999 $73,200 $75,000 $64,000 $82,000 25
$50,000,000-$74,999,999 $70,340 $66,019 $52,938 $88,072 6
$75,000,000-$99,999,999 $43,000 $43,000 $43,000 $43,000 1
$100 million or more $77,143 $75,000 $69,500 $78,000 7
I don't know. $66,400 $61,850 $56,500 $72,500 8
How many FTE fundraising professionals work in your organization?
.001-1.99 $56,224 $54,000 $48,250 $66,282 16
2.00-5.99 $66,140 $64,000 $50,300 $75,000 31
6.00-10.99 $72,673 $76,000 $68,000 $78,000 17
11.00-20.99 $68,322 $70,000 $55,250 $74,500 18
More than 20 $64,321 $58,000 $52,125 $71,500 7
What was your organization’s annual operating budget during the last completed fiscal year?
Less than $250,000 $32,585 $32,585 $28,793 $36,378 2
$250,000-$499,999 $56,968 $53,000 $45,968 $64,000 4
$500,000-$999,999 $71,740 $67,230 $56,875 $82,095 4
$1,000,000-$2,999,999 $56,163 $50,000 $45,125 $64,750 10
$3,000,000-$4,999,999 $60,648 $62,950 $54,125 $70,375 8
$5,000,000-$9,999,999 $63,410 $61,500 $59,625 $66,250 10
$10,000,000-$49,999,999 $69,983 $69,000 $60,250 $77,000 12
$50,000,000-$74,999,999 $60,450 $68,000 $55,750 $76,500 5
$100 million or more $82,229 $77,500 $75,322 $93,500 10
I don't know $68,756 $70,000 $55,500 $77,250 30

148 | ©2021 AFP Compensation & Benefits Report
Fundraising Officer, Canada Mean MedianPercentile
Count25th 75th
In what region is the office where you work located?
Prince Edward Island, New Brunswick or Nova Scotia $51,897 $58,000 $39,640 $65,000 7
Newfoundland and Labrador $81,667 $94,000 $73,500 $96,000 3
Quebec $70,618 $69,000 $58,500 $76,500 11
Ontario $62,889 $62,000 $50,000 $75,500 31
Manitoba $63,535 $62,850 $54,395 $68,500 8
Saskatchewan $59,968 $67,000 $56,468 $70,500 4
Alberta $73,224 $76,000 $58,000 $90,000 17
British Columbia $67,583 $67,000 $57,625 $78,000 15
In what size metropolitan area is the office where you work located?
Population less than 50,000 $48,000 $48,000 $47,000 $49,000 2
Population of 50,000-999,999 $64,629 $65,000 $55,000 $76,000 45
Population of 1,000,000-2,999,999 $66,262 $67,000 $55,750 $77,000 33
Population of 3 million or more $70,317 $71,000 $52,800 $80,000 17
For how many years have you been employed as a fundraising professional?
Less than 4 years $49,577 $50,000 $36,937 $60,500 19
4-6 years $58,648 $55,750 $49,550 $65,500 19
7-9 years $68,375 $69,000 $57,500 $78,000 16
10-14 years $73,620 $72,930 $66,000 $76,250 12
15-19 years $75,547 $71,500 $66,000 $85,000 15
20-24 years $78,457 $76,287 $76,000 $95,000 5
25-29 years $82,750 $77,000 $70,250 $89,500 4
30 or more years $79,065 $79,065 $74,597 $83,532 2
For how many years have you been with your current employer?
One year or less $64,215 $69,000 $55,000 $76,000 29
2.0 years $63,558 $59,500 $50,686 $78,000 20
3.0 years $62,694 $67,000 $51,000 $74,750 15
4.0 years $63,372 $62,000 $56,900 $74,460 5
5-6 years $69,660 $59,350 $50,500 $91,350 10
7-9 years $64,975 $62,500 $54,450 $71,750 8
10-14 years $87,457 $88,000 $76,287 $94,000 5
15 or more years $72,000 $72,000 $72,000 $72,000 1

149 | ©2021 AFP Compensation & Benefits Report
Fundraising Officer, Canada Mean MedianPercentile
Count25th 75th
What is your current age?
Under Age 25 $43,040 $43,040 $38,160 $47,920 2
25-34 years old $57,567 $55,375 $47,750 $70,750 34
35-44 years old $73,602 $70,000 $62,000 $80,000 25
45-54 years old $73,349 $73,750 $65,750 $80,250 18
55-64 years old $63,603 $67,000 $56,850 $71,700 11
65 or more years old $65,500 $65,500 $54,250 $76,750 2
How would you describe your gender identity?
Man or Male or Masculine $76,236 $79,000 $68,750 $92,500 16
Woman or Female or Feminine $63,761 $63,000 $52,000 $75,000 75
Gender non-conforming, Gender queer or Non-binary $57,250 $57,250 $52,375 $62,125 2
What is your education level?
High School Diploma $63,282 $68,000 $67,000 $70,129 5
Two-Year Diploma or some university $75,000 $78,000 $55,000 $90,000 13
Bachelor's degree/1er cycle $65,662 $70,000 $52,895 $76,625 44
Master's degree/2e cycle $68,585 $63,000 $58,000 $73,000 13
Post-graduate study - specialization $58,940 $52,800 $46,000 $65,000 13
Professional degree (JD, LLB, MBA, MD, DO, etc.) $58,700 $58,700 $58,700 $58,700 1
Professional or technical certification (such as CPA, paralegal, apprenticeship in a trade, etc.)
$54,818 $57,000 $42,218 $69,600 4
Which of the following professional certifications do you hold?
CFRE $74,223 $77,500 $69,600 $86,500 22
University-based certification program in fundraising or nonprofit management
$60,460 $59,750 $51,950 $73,000 18
Other designation as fellow, certificate holder, or other $65,389 $60,000 $50,000 $78,000 15
None of the above $62,165 $60,000 $51,500 $70,565 43

150 | ©2021 AFP Compensation & Benefits Report
Table 82: Salary Data for Other Fundraising Staff – Canada
Other Fundraising Staff, Canada Mean MedianPercentile
Count25th 75th
With what type of organization are you currently affiliated as a fundraising professional?
Arts: Performance, Exhibition, Creation $45,619 $44,500 $33,500 $56,619 4
Education: Higher Education $58,857 $60,000 $51,000 $65,500 7
Education: Primary or Secondary Education $45,000 $45,000 $45,000 $45,000 1
Environment $46,000 $46,000 $46,000 $46,000 1
Fundraising & Grantmaking: Community Foundation, Donor-Advised Fund Sponsor
$58,000 $58,000 $58,000 $58,000 1
Health: National or Regional Health Agency $54,500 $48,000 $44,500 $58,000 4
Health Services $54,827 $55,660 $50,000 $61,475 5
Human Services: Criminal Justice, Legal Aid, Employment, Housing, Homelessness
$40,800 $40,800 $40,400 $41,200 2
None of the Above $30,000 $30,000 $30,000 $30,000 1
What is the geographic scope of your organization?
International $60,667 $60,000 $57,500 $63,500 3
National $54,589 $47,000 $45,000 $60,738 11
Selected Provinces (operations in provinces separated by other provinces)
$47,000 $45,000 $43,500 $52,500 6
Provincial and/or Regional (operations in more than one contiguous province)
$52,830 $55,660 $47,000 $61,738 11
Local or Multiple Communities $48,067 $50,000 $40,800 $56,830 11
Approximately how much money did your organization raise in contributed gifts from all sources during the last completed fiscal year?
Less than $100,000 $34,000 $34,000 $34,000 $34,000 1
$100,000-$249,999 $32,000 $32,000 $32,000 $32,000 1
$250,000-$499,999 $30,000 $30,000 $30,000 $30,000 1
$500,000-$999,999 $55,000 $55,000 $55,000 $55,000 1
$1,000,000-$2,999,999 $71,500 $71,500 $67,750 $75,250 2
$3,000,000-$4,999,999 $54,358 $60,000 $50,800 $60,738 3
$5,000,000-$9,999,999 $51,667 $50,000 $48,500 $54,000 3
$10,000,000-$49,999,999 $48,600 $45,000 $45,000 $46,000 5
$50,000,000-$74,999,999 $44,000 $44,000 $43,500 $44,500 2
$100 million or more $62,000 $62,000 $62,000 $62,000 1
I don't know. $53,330 $53,330 $52,165 $54,495 2

151 | ©2021 AFP Compensation & Benefits Report
Other Fundraising Staff, Canada Mean MedianPercentile
Count25th 75th
How many FTE fundraising professionals work in your organization?
.001-1.99 $32,000 $32,000 $31,000 $33,000 2
2.00-5.99 $50,333 $51,000 $48,000 $53,000 3
6.00-10.99 $56,200 $50,000 $47,000 $60,000 5
11.00-20.99 $52,000 $46,000 $45,000 $61,000 7
More than 20 $52,427 $55,660 $43,000 $61,475 5
What was your organization’s annual operating budget during the last completed fiscal year?
$500,000-$999,999 $32,000 $32,000 $31,000 $33,000 2
$1,000,000-$2,999,999 $32,000 $32,000 $32,000 $32,000 1
$3,000,000-$4,999,999 $58,000 $58,000 $58,000 $58,000 1
$5,000,000-$9,999,999 $58,238 $58,238 $56,619 $59,856 2
$10,000,000-$49,999,999 $48,000 $45,000 $43,750 $49,250 4
$100 million or more $63,500 $63,500 $61,750 $65,250 2
I don't know $53,438 $48,500 $45,000 $57,745 12
In what region is the office where you work located?
Prince Edward Island, New Brunswick or Nova Scotia $64,000 $64,000 $64,000 $64,000 1
Quebec $41,600 $41,600 $41,600 $41,600 1
Ontario $53,956 $54,000 $45,000 $61,606 12
Saskatchewan $51,000 $51,000 $51,000 $51,000 1
Alberta $46,132 $45,000 $45,000 $55,000 5
British Columbia $49,000 $44,500 $42,250 $51,250 4
In what size metropolitan area is the office where you work located?
Population of 50,000-999,999 $47,300 $47,500 $43,500 $54,000 10
Population of 1,000,000-2,999,999 $57,415 $55,660 $46,000 $67,000 9
Population of 3 million or more $48,200 $45,000 $40,000 $60,000 5
For how many years have you been employed as a fundraising professional?
Less than 4 years $44,866 $45,000 $41,600 $46,000 13
4-6 years $58,295 $61,475 $51,000 $62,000 5
10-14 years $79,000 $79,000 $79,000 $79,000 1
15-19 years $66,000 $66,000 $62,000 $70,000 2

152 | ©2021 AFP Compensation & Benefits Report
Other Fundraising Staff, Canada Mean MedianPercentile
Count25th 75th
In what region is the office where you work located?For how many years have you been with your current employer?
One year or less $54,415 $45,000 $45,000 $61,475 5
2.0 years $50,237 $46,000 $44,000 $55,330 7
3.0 years $47,000 $48,000 $41,750 $53,250 4
4.0 years $40,000 $40,000 $35,000 $45,000 2
5-6 years $62,000 $62,000 $62,000 $62,000 1
10-14 years $58,000 $58,000 $58,000 $58,000 1
15 or more years $74,000 $74,000 $74,000 $74,000 1
What is your current age?
Under Age 25 $44,333 $45,000 $44,000 $45,000 3
25-34 years old $50,467 $50,000 $45,000 $60,000 13
35-44 years old $54,500 $54,500 $42,250 $66,750 2
45-54 years old $56,830 $56,830 $56,245 $57,415 2
55-64 years old $74,000 $74,000 $74,000 $74,000 1
How would you describe your gender identity?
Man or Male or Masculine $45,000 $45,000 $45,000 $45,000 2
Woman or Female or Feminine $52,407 $51,000 $44,000 $60,738 19
What is your education level?
Two-Year Diploma or some university $57,500 $57,500 $56,250 $58,750 2
Bachelor's degree/1er cycle $50,518 $46,000 $43,000 $58,000 13
Master's degree/2e cycle $53,500 $53,500 $49,250 $57,750 2
Post-graduate study - specialization $48,000 $48,000 $46,500 $49,500 2
Professional or technical certification (such as CPA, paralegal, apprenticeship in a trade, etc.)
$55,500 $55,500 $43,750 $67,250 2
Which of the following professional certifications do you hold?
CFRE $70,500 $70,500 $68,750 $72,250 2
University-based certification program in fundraising or nonprofit management
$48,333 $51,000 $41,500 $56,500 3
Other designation as fellow, certificate holder, or other $55,738 $55,738 $52,869 $58,606 2
None of the above $49,161 $45,000 $43,500 $55,495 14
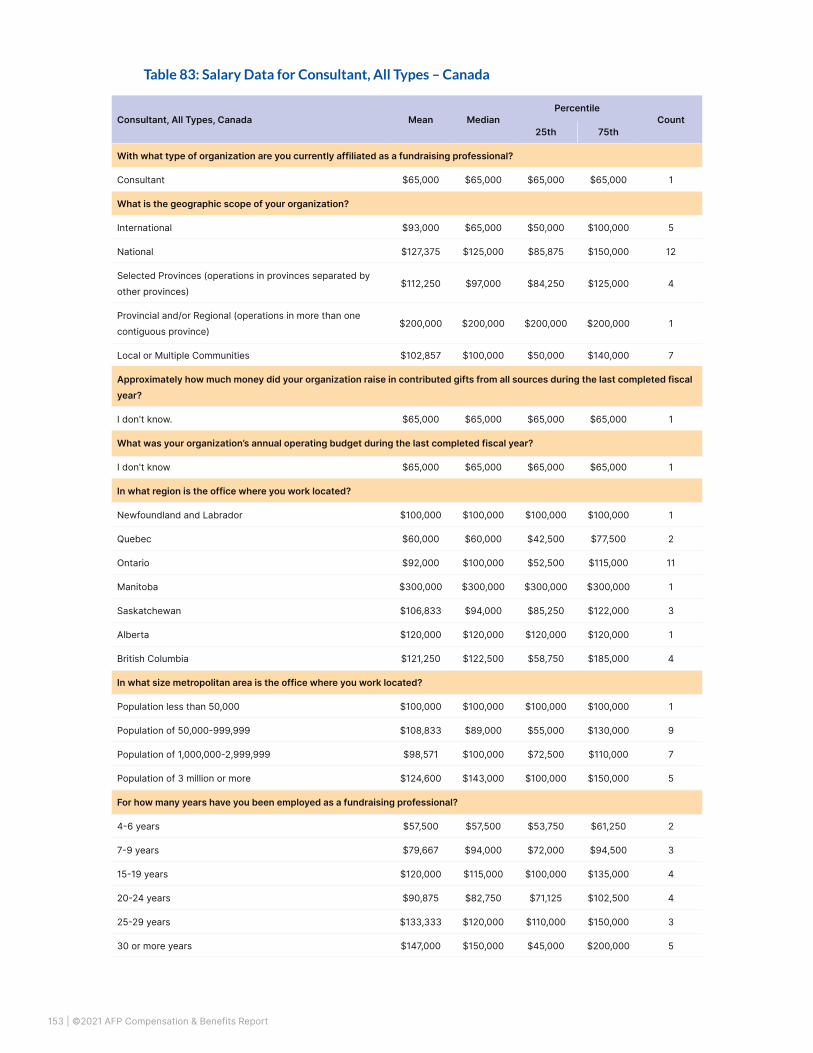
153 | ©2021 AFP Compensation & Benefits Report
Table 83: Salary Data for Consultant, All Types – Canada
Consultant, All Types, Canada Mean MedianPercentile
Count25th 75th
With what type of organization are you currently affiliated as a fundraising professional?
Consultant $65,000 $65,000 $65,000 $65,000 1
What is the geographic scope of your organization?
International $93,000 $65,000 $50,000 $100,000 5
National $127,375 $125,000 $85,875 $150,000 12
Selected Provinces (operations in provinces separated by other provinces)
$112,250 $97,000 $84,250 $125,000 4
Provincial and/or Regional (operations in more than one contiguous province)
$200,000 $200,000 $200,000 $200,000 1
Local or Multiple Communities $102,857 $100,000 $50,000 $140,000 7
Approximately how much money did your organization raise in contributed gifts from all sources during the last completed fiscal year?
I don't know. $65,000 $65,000 $65,000 $65,000 1
What was your organization’s annual operating budget during the last completed fiscal year?
I don't know $65,000 $65,000 $65,000 $65,000 1
In what region is the office where you work located?
Newfoundland and Labrador $100,000 $100,000 $100,000 $100,000 1
Quebec $60,000 $60,000 $42,500 $77,500 2
Ontario $92,000 $100,000 $52,500 $115,000 11
Manitoba $300,000 $300,000 $300,000 $300,000 1
Saskatchewan $106,833 $94,000 $85,250 $122,000 3
Alberta $120,000 $120,000 $120,000 $120,000 1
British Columbia $121,250 $122,500 $58,750 $185,000 4
In what size metropolitan area is the office where you work located?
Population less than 50,000 $100,000 $100,000 $100,000 $100,000 1
Population of 50,000-999,999 $108,833 $89,000 $55,000 $130,000 9
Population of 1,000,000-2,999,999 $98,571 $100,000 $72,500 $110,000 7
Population of 3 million or more $124,600 $143,000 $100,000 $150,000 5
For how many years have you been employed as a fundraising professional?
4-6 years $57,500 $57,500 $53,750 $61,250 2
7-9 years $79,667 $94,000 $72,000 $94,500 3
15-19 years $120,000 $115,000 $100,000 $135,000 4
20-24 years $90,875 $82,750 $71,125 $102,500 4
25-29 years $133,333 $120,000 $110,000 $150,000 3
30 or more years $147,000 $150,000 $45,000 $200,000 5

154 | ©2021 AFP Compensation & Benefits Report
Consultant, All Types, Canada Mean MedianPercentile
Count25th 75th
In what region is the office where you work located?For how many years have you been with your current employer?
One year or less $92,000 $92,000 $90,500 $93,500 2
2.0 years $45,000 $45,000 $45,000 $45,000 1
3.0 years $90,000 $65,000 $60,000 $107,500 3
4.0 years $75,000 $75,000 $62,500 $87,500 2
5-6 years $125,000 $125,000 $115,000 $135,000 4
7-9 years $100,125 $85,250 $69,875 $115,500 4
10-14 years $185,750 $171,500 $132,250 $225,000 4
15 or more years $40,000 $40,000 $40,000 $40,000 1
What is your current age?
25-34 years old $70,800 $65,000 $50,000 $94,000 5
35-44 years old $100,000 $100,000 $100,000 $100,000 1
45-54 years old $146,750 $116,000 $80,500 $182,250 4
55-64 years old $132,143 $130,000 $110,000 $165,000 7
65 or more years old $88,833 $76,500 $58,250 $113,250 3
How would you describe your gender identity?
Man or Male or Masculine $125,714 $150,000 $80,000 $165,000 7
Woman or Female or Feminine $102,500 $94,000 $55,000 $100,000 13
Intersex or other related terms $120,000 $120,000 $120,000 $120,000 1
What is your education level?
High school $65,000 $65,000 $65,000 $65,000 1
Two-Year Diploma or some university $100,000 $100,000 $100,000 $100,000 1
Bachelor's degree/1er cycle $132,591 $120,000 $94,500 $150,000 11
Master's degree/2e cycle $95,000 $77,500 $47,500 $122,500 6
Post-graduate study - specialization $69,500 $69,500 $59,750 $79,250 2
Which of the following professional certifications do you hold?
CFRE $116,111 $100,000 $95,000 $150,000 9
University-based certification program in fundraising or nonprofit management
$139,667 $130,000 $109,500 $165,000 3
Other designation as fellow, certificate holder, or other $112,500 $125,000 $102,500 $135,000 4
None of the above $113,167 $94,000 $65,000 $143,000 9

155 | ©2021 AFP Compensation & Benefits Report
Table 84: Salary Data for Chief Operating Officer – Canada
COO, Canada Mean MedianPercentile
Count25th 75th
With what type of organization are you currently affiliated as a fundraising professional?
Education: Higher Education (college, university, community college and/or affiliated foundation)
$135,000 $135,000 $135,000 $135,000 1
Education: Other (public library foundation, literacy, vocational training, scholarships, Greek foundation)
$154,000 $154,000 $154,000 $154,000 1
Fundraising & Grantmaking: Community Foundation, Donor-Advised Fund Sponsor
$155,000 $155,000 $155,000 $155,000 1
Health Services (hospital, clinic, nursing home, specialized services)
$81,000 $81,000 $81,000 $81,000 1
What is the geographic scope of your organization?
National $148,000 $154,000 $144,500 $154,500 3
Local or Multiple Communities $81,000 $81,000 $81,000 $81,000 1
Approximately how much money did your organization raise in contributed gifts from all sources during the last completed fiscal year?
$10,000,000-$49,999,999 $131,250 $144,500 $121,500 $154,250 4
How many FTE fundraising professionals work in your organization?
2.00-5.99 $154,000 $154,000 $154,000 $154,000 1
6.00-10.99 $155,000 $155,000 $155,000 $155,000 1
11.00-20.99 $81,000 $81,000 $81,000 $81,000 1
More than 20 $135,000 $135,000 $135,000 $135,000 1
What was your organization’s annual operating budget during the last completed fiscal year?
$5,000,000-$9,999,999 $155,000 $155,000 $155,000 $155,000 1
$10,000,000-$49,999,999 $154,000 $154,000 $154,000 $154,000 1
$100 million or more $135,000 $135,000 $135,000 $135,000 1
I don't know $81,000 $81,000 $81,000 $81,000 1
In what region is the office where you work located?
Ontario $148,000 $154,000 $144,500 $154,500 3
British Columbia $81,000 $81,000 $81,000 $81,000 1
In what size metropolitan area is the office where you work located?
Population of 50,000-999,999 $81,000 $81,000 $81,000 $81,000 1
Population of 3 million or more $148,000 $154,000 $144,500 $154,500 3
For how many years have you been employed as a fundraising professional?
15-19 years $117,500 $117,500 $99,250 $135,750 2
25-29 years $135,000 $135,000 $135,000 $135,000 1
30 or more years $155,000 $155,000 $155,000 $155,000 1

156 | ©2021 AFP Compensation & Benefits Report
COO, Canada Mean MedianPercentile
Count25th 75th
For how many years have you been with your current employer?
2.0 years $81,000 $81,000 $81,000 $81,000 1
4.0 years $155,000 $155,000 $155,000 $155,000 1
10-14 years $144,500 $144,500 $139,750 $149,250 2
What is your current age?
35-44 years old $154,000 $154,000 $154,000 $154,000 1
45-54 years old $135,000 $135,000 $135,000 $135,000 1
55-64 years old $118,000 $118,000 $99,500 $136,500 2
How would you describe your gender identity?
Woman or Female or Feminine $131,250 $144,500 $121,500 $154,250 4
What is your education level?
Two-Year Diploma or some university $81,000 $81,000 $81,000 $81,000 1
Bachelor's degree/1er cycle $145,000 $145,000 $140,000 $150,000 2
Post-graduate study - specialization $154,000 $154,000 $154,000 $154,000 1
Which of the following professional certifications do you hold?
CFRE $135,000 $135,000 $135,000 $135,000 1
University-based certification program in fundraising or nonprofit management
$81,000 $81,000 $81,000 $81,000 1
Other designation as fellow, certificate holder, or other $154,500 $154,500 $154,250 $154,750 2

157 | ©2021 AFP Compensation & Benefits Report
Table 85: Salary Data for Grants Manager – Canada
Grants Manager, Canada Mean MedianPercentile
Count25th 75th
With what type of organization are you currently affiliated as a fundraising professional?
Community Development/Economic Development $75,000 $75,000 $75,000 $75,000 1
Environment $58,000 $58,000 $58,000 $58,000 1
Human Services: Development & Social Services $73,333 $75,000 $67,500 $80,000 3
Human Services: Criminal Justice, Legal Aid, Employment, Housing, Homelessness
$73,000 $73,000 $73,000 $73,000 1
What is the geographic scope of your organization?
National $58,000 $58,000 $58,000 $58,000 1
Local or Multiple Communities $73,250 $74,000 $69,750 $77,500 4
Approximately how much money did your organization raise in contributed gifts from all sources during the last completed fiscal year?
Less than $100,000 $59,000 $59,000 $58,500 $59,500 2
$100,000-$249,999 $85,000 $85,000 $85,000 $85,000 1
$250,000-$499,999 $73,000 $73,000 $73,000 $73,000 1
$5,000,000-$9,999,999 $75,000 $75,000 $75,000 $75,000 1
How many FTE fundraising professionals work in your organization?
.001-1.99 $73,333 $75,000 $67,500 $80,000 3
2.00-5.99 $65,500 $65,500 $61,750 $69,250 2
What was your organization’s annual operating budget during the last completed fiscal year?
$500,000-$999,999 $58,000 $58,000 $58,000 $58,000 1
$3,000,000-$4,999,999 $60,000 $60,000 $60,000 $60,000 1
$5,000,000-$9,999,999 $74,000 $74,000 $73,500 $74,500 2
$10,000,000-$49,999,999 $85,000 $85,000 $85,000 $85,000 1
In what region is the office where you work located?
Manitoba $60,000 $60,000 $60,000 $60,000 1
Alberta $72,750 $74,000 $69,250 $77,500 4
In what size metropolitan area is the office where you work located?
Population of 50,000-999,999 $59,000 $59,000 $58,500 $59,500 2
Population of 1,000,000-2,999,999 $77,667 $75,000 $74,000 $80,000 3
For how many years have you been employed as a fundraising professional?
Less than 4 years $60,000 $60,000 $60,000 $60,000 1
4-6 years $72,750 $74,000 $69,250 $77,500 4

158 | ©2021 AFP Compensation & Benefits Report
Grants Manager, Canada Mean MedianPercentile
Count25th 75th
For how many years have you been with your current employer?
One year or less $75,000 $75,000 $75,000 $75,000 1
3.0 years $73,000 $73,000 $73,000 $73,000 1
5-6 years $67,667 $60,000 $59,000 $72,500 3
What is your current age?
25-34 years old $58,000 $58,000 $58,000 $58,000 1
35-44 years old $75,000 $75,000 $75,000 $75,000 1
45-54 years old $79,000 $79,000 $76,000 $82,000 2
55-64 years old $60,000 $60,000 $60,000 $60,000 1
How would you describe your gender identity?
Woman or Female or Feminine $70,200 $73,000 $60,000 $75,000 5
What is your education level?
High school $75,000 $75,000 $75,000 $75,000 1
Two-Year Diploma or some university $72,500 $72,500 $66,250 $78,750 2
Bachelor's degree/1er cycle $58,000 $58,000 $58,000 $58,000 1
Master's degree/2e cycle $73,000 $73,000 $73,000 $73,000 1
Which of the following professional certifications do you hold?
CFRE $58,000 $58,000 $58,000 $58,000 1
Other designation as fellow, certificate holder, or other $60,000 $60,000 $60,000 $60,000 1
None of the above $77,667 $75,000 $74,000 $80,000 3

159 | ©2021 AFP Compensation & Benefits Report
Table 86: Salary Data for Dean or Head Unit – Canada
Dean or Head Unit, Canada Mean MedianPercentile
Count25th 75th
With what type of organization are you currently affiliated as a fundraising professional?
Human Services: Development & Social Services $89,000 $89,000 $85,000 $93,000 2
What is the geographic scope of your organization?
National $97,000 $97,000 $97,000 $97,000 1
Local or Multiple Communities $81,000 $81,000 $81,000 $81,000 1
Approximately how much money did your organization raise in contributed gifts from all sources during the last completed fiscal year?
$250,000-$499,999 $81,000 $81,000 $81,000 $81,000 1
$500,000-$999,999 $97,000 $97,000 $97,000 $97,000 1
How many FTE fundraising professionals work in your organization?
.001-1.99 $81,000 $81,000 $81,000 $81,000 1
2.00-5.99 $97,000 $97,000 $97,000 $97,000 1
What was your organization’s annual operating budget during the last completed fiscal year?
$250,000-$499,999 $81,000 $81,000 $81,000 $81,000 1
$500,000-$999,999 $97,000 $97,000 $97,000 $97,000 1
In what region is the office where you work located?
Quebec $97,000 $97,000 $97,000 $97,000 1
Alberta $81,000 $81,000 $81,000 $81,000 1
In what size metropolitan area is the office where you work located?
Population of 50,000-999,999 $97,000 $97,000 $97,000 $97,000 1
Population of 1,000,000-2,999,999 $81,000 $81,000 $81,000 $81,000 1
For how many years have you been employed as a fundraising professional?
4-6 years $97,000 $97,000 $97,000 $97,000 1
30 or more years $81,000 $81,000 $81,000 $81,000 1
For how many years have you been with your current employer?
One year or less $81,000 $81,000 $81,000 $81,000 1
5-6 years $97,000 $97,000 $97,000 $97,000 1
What is your current age?
45-54 years old $97,000 $97,000 $97,000 $97,000 1
55-64 years old $81,000 $81,000 $81,000 $81,000 1
How would you describe your gender identity?
Man or Male or Masculine $97,000 $97,000 $97,000 $97,000 1
Woman or Female or Feminine $81,000 $81,000 $81,000 $81,000 1

160 | ©2021 AFP Compensation & Benefits Report
Grants Manager, Canada Mean MedianPercentile
Count25th 75th
What is your education level?
High school $75,000 $75,000 $75,000 $75,000 1
Two-Year Diploma or some university $72,500 $72,500 $66,250 $78,750 2
Bachelor's degree/1er cycle $58,000 $58,000 $58,000 $58,000 1
Master's degree/2e cycle $73,000 $73,000 $73,000 $73,000 1
Which of the following professional certifications do you hold?
CFRE $58,000 $58,000 $58,000 $58,000 1
Other designation as fellow, certificate holder, or other $60,000 $60,000 $60,000 $60,000 1
None of the above $77,667 $75,000 $74,000 $80,000 3

161 | ©2021 AFP Compensation & Benefits Report
Appendix 10: Survey QuestionsSee end of section for questions as asked for Canadians.
How were you employed in fundraising, advancement, or development during 2019?
1 For an organization, agency, entity
2 As a consultant
3 Not employed (for compensation) in 2019
For what type of organization were you employed in 2019 as a fundraising professional? Select up to three types for ONE organization that paid you in 2019 as a fundraising professional.
1 Arts/Culture (dance, drama, theatre, music, museum, historic preservation, etc.)
2 Animals/Animal Welfare (domestic or captive animals, shelter, rescue, adoption, zoos)
3 Higher Education (college, university, community college and/or affiliated foundation)
4 Primary or Secondary Education (private, public and/or affiliated foundation)
5 Pre‐K Education (early childhood, child care, referral, assisting parents)
6 Civic and Public Affairs (legal, public advocacy, voter registration/education, urban affairs, etc.) 7 National or Regional Health Agency (specific disease or health‐related problem) *
8 Health Services (hospital, clinic, nursing home, specialized services)
9 Human Development & Social Services (child, youth, adult, family, retirement, fitness/sport)
10 Environmental (wildlife, habitat, conservation, environmental education, etc.)
11 Public Broadcasting, Nonprofit Publishing
12 Religious Congregation, Ministry, Broadcast, or Publishing; Organizing Body of a Faith (synod, diocese, union, etc.)
13 Scientific or Social Science Research or Other Educational Body (includes think tanks)
14 Association or Membership Foundation (trade, professional, or fraternal)
15 Federated or Collective Fundraising (Community Foundation, United Way, UNCF, UJA, etc.) 16 Government or Quasi‐Governmental Agency
17 Community Development/Economic Development (includes affordable housing)
18 Emergency Relief/Humanitarian Aid
19 International Development/Overseas Aid and Support (excluding emergency relief)
20 Other (please specify)
Approximately how much money did your organization raise in philanthropic contributions

162 | ©2021 AFP Compensation & Benefits Report
(gifts) from all sources during the last completed fiscal year? (Consultants, skip this page.)
1 Less than $100,000
2 $100,000‐$249,999
3 $250,000‐$499,999
4 $500,000‐$999,999
5 $1,000,000‐$2,999,999
6 $3,000,000‐$4,999,999
7 $5,000,000‐$9,999,999
8 $10,000,000‐$49,999,999 9 $50,000,000‐$74,999,999
10 $75,000,000‐$99,999,999 11 $100 million or more
What was your organization’s annual operating budget during the last completed fiscal year?
1 Less than $250,000
2 $250,000‐$499,999
3 $500,000‐$999,999
4 $1,000,000‐$2,999,999
5 $3,000,000‐$4,999,999
6 $5,000,000‐$9,999,999
7 $10,000,000‐$49,999,999
8 $50,000,000‐$74,999,999
9 $75,000,000 ‐ $99,999,999
10 $100 million or more
11 Don’t Know
How many FTE fundraising professionals work in your organization? (Consultants, answer for the FTE for fundraising consultants then scroll down to “Next” to skip to the next page.) You can enter numbers in decimals, e.g. 1.5 for one and a half FTE. FTE means Full Time Equivalency and is based on paid work hours as a share of a 40‐hour work week. So someone who is paid for 20 hours of work is 0.5 FTE. Please leave out the comma in any number greater than 999.
How many volunteers (including board members) fundraise on behalf of your organization? (Consultants, skip to the next page.) This is likely answered most easily in terms of individual people, so in a whole number such as 1 or 15 or 25. Please leave out the comma for any number greater than 999.
How satisfied are you with the following at your organization?
Board members’ engagement in fundraising 4 Highly satisfied
3 Satisfied
2 Dissatistied
1 Strong Dissatisfied
0 No Opinion

163 | ©2021 AFP Compensation & Benefits Report
NA
Technology you need to do your job (CRM, database, gift processing, social media monitoring, etc.)
4 Highly satisfied
3 Satisfied
2 Dissatistied
1 Strong Dissatisfied
0 No Opinion
NA
Budget available for fundraising staff, technology, travel, and other costs
4 Highly satisfied
3 Satisfied
2 Dissatistied
1 Strong Dissatisfied
0 No Opinion
NA
Number of staff who dedicate time to fundraising
4 Highly satisfied
3 Satisfied
2 Dissatistied
1 Strong Dissatisfied
0 No Opinion
NA
Chief Executive Officer/Executive Director engagement in fundraising
4 Highly satisfied
3 Satisfied
2 Dissatistied
1 Strong Dissatisfied 0 No Opinion
NA
Skills and knowledge of the fundraising staff your organization hires
4 Highly satisfied
3 Satisfied
2 Dissatistied
1 Strong Dissatisfied 0 No Opinion
NA
How satisfied are you with the following at your organization?
Understanding of and respect from your organization’s staff about the importance of fundraising

164 | ©2021 AFP Compensation & Benefits Report
4 Highly satisfied
3 Satisfied
2 Dissatistied
1 Strong Dissatisfied
0 No Opinion
0 NA
Expectations that are placed on fundraising at your organization 4 Highly satisfied
3 Satisfied
2 Dissatistied
1 Strong Dissatisfied
0 No Opinion
0 NA
Overall effectiveness of your organization’s fundraising 4 Highly satisfied
3 Satisfied
2 Dissatistied
1 Strong Dissatisfied
0 No Opinion
0 NA
Your organization’s work culture
4 Highly satisfied
3 Satisfied
2 Dissatistied
1 Strong Dissatisfied
0 No Opinion
0 NA
Management at your organization
4 Highly satisfied
3 Satisfied
2 Dissatistied
1 Strong Dissatisfied
0 No Opinion
0 NA
The budgeting process for fundraising staff and resources
4 Highly satisfied
3 Satisfied
2 Dissatistied
1 Strong Dissatisfied

165 | ©2021 AFP Compensation & Benefits Report
0 No Opinion
0 NA
In what state or U.S. territory is the office for which you work located? *
What is the geographic scope of your organization? By scope, we mean the area or territory you serve as your primary mission. For example, for a university, select the area that represents the majority of the students. (Please select only ONE)
1 International
2 National
3 State/Provincial/Regional
4 Local
5 Other (please specify)
In what size metropolitan area is the office for which you work located?
1 Population less than 50,000
2 Population of 50,000‐999,999
3 Population of 1,000,000‐2,999,999
4 Population of 3 million or more
What was the Full‐Time Equivalency (FTE) of your job at the end of 2019 for all responsibilities, based on a 40‐ hour week?
1 1‐24% (<10 hours/week)
2 25‐49% (10 ‐ <20 hours/week)
3 50‐74% (20 ‐ <30 hours/week)
4 75‐99% (30 ‐ <40 hours/week)
5 100% (40+ hours/week)
What was your position at the end of 2019? Please select the ONE choice that best describes the level of your responsibilities, even if it is not your exact title.
1 Agency CEO with fundraising and other responsibilities
2 Chief Development Officer: Vice Chancellor, Vice President, or Director of Development, Fundraising or Institutional Relations (top paid position with responsibility for managing fundraising)
3 Associate Vice Chancellor, Deputy Director, Associate Director/Assistant or Associate Vice President or equivalent (reporting to Chief Development Officer, with responsibility for others engaged in fundraising)
4 Program Director/Manager (with responsibility for managing a particular program(s), e.g., annual giving, planned giving, or fundraising for a specific location or school within a university)
5 Fundraising Officer (Major Gifts Officer, Planned Giving Officer, or having responsibility for managing
6 Other Fundraising Staff Position (e.g., coordinator, assistant, researcher, writer, gift entry)
7 Consultant ‐ Principal, Senior Staff member, Campaign Director in Full‐service Firm (surveys,

166 | ©2021 AFP Compensation & Benefits Report
planning, organization, campaign direction, etc.)
8 Consultant ‐ staff member at full‐service firm but not principal or senior level
9 Consultant specialized, independent or small‐shop consultancy
10 Not working in fundraising at the end of 2019 ‐ retired or for other reasons
11 Other (please specify)
How satisfied are you with the following for your role?
Workload assigned
4 Highly satisfied
3 Satisfied
2 Dissatistied
1 Strong Dissatisfied 0 No Opinion
0 NA
Ability to find work‐life balance
4 Highly satisfied
3 Satisfied
2 Dissatistied
1 Strong Dissatisfied
0 No Opinion
0 NA
Adequate support services
4 Highly satisfied
3 Satisfied
2 Dissatistied
1 Strong Dissatisfied
0 No Opinion
0 NA
Opportunity for advancement 4 Highly satisfied
3 Satisfied
2 Dissatistied
1 Strong Dissatisfied
0 No Opinion
0 NA
Job security
4 Highly satisfied
3 Satisfied
2 Dissatistied

167 | ©2021 AFP Compensation & Benefits Report
1 Strong Dissatisfied
0 No Opinion
0 NA
For fundraising work in your job as of the end of 2019, how many other people do you manage or supervise?
1 0
2 1‐2
3 3 or more
4 Other (please specify)
What percentage of your organization’s board identifies as female? [Consultants: Skip to the next question.]
Divide the number of women by the total number of board members. Multiple by 100. Then enter the nearest whole number.So, if your board had 3 women of a total of 7 members3/7 = 0.428 x 100 = 42.8 and you enter 43.
To whom do you report?
1 The board.
2 More than one individual on staff.
3 A supervisor who identifies as female.
4 A supervisor who identifies as male.
5 A supervisor who does not identify within the binary gender system.
6 Does not apply. Self‐employed consultant or principal in the firm.
What was your annual professional income during the last fiscal year (excluding fringe benefits and perquisites or any incentive compensation)? Please leave out commas for numbers greater than 999, e.g., 54000
By what percentage did your professional income (excluding fringe benefits and perquisites or any incentive compensation) change from fiscal year 2018 to fiscal year 2019?
1 Down 10% or more
2 Down 7‐9%
3 Down 4‐6%
4 Down 1‐3%
5 No change
6 Up 1‐3%
7 Up 4‐6%
8 Up 7‐9%
9 Up 10% or more 10 N/A

168 | ©2021 AFP Compensation & Benefits Report
Please indicate the extent to which you agree with the statement “My organization explicitly states that achieving determined performance goals will be a factor in determining a pay raise.”
[Consultants: Skip this question.]
1 Strongly agree
2 Agree
3 Neutral
4 Disagree
5 Strongly disagree
Do you feel that you negotiated effectively for the salary you wanted when you accepted your current position?
1 Yes
2 No
Have any of the following had a negative impact on your earnings potential in the past two years? Check ALL that apply.
1 Taking time off to stay home and raise children
2 Taking time off to care for family members
3 Taking time off to care for my own health
4 Taking time off to further my education
5 Resigning from a position to move to another city to follow my partner’s/spouse’s career
6 Resigning from a position before being offered a new position
Other please specify
Does your organization have a 401(k) salary deferral plan?
(A retirement plan in which an employee directs that some portion of annual compensation is paid into the plan on a pretax basis. The amount an employee can elect to defer is limited. In some organizations, the employer also makes contributions. The employee is responsible for investing contributions and usually has the option of annuities, stocks, bonds, and mutual funds.)
1 Yes
2 No
3 Don’t know
Does your organization have a 403(b) salary deferral plan?
1 Yes
2 No
3 Don’t Know
What other types of retirement plans are offered by your organization? Check ALL that apply. *
1 Defined benefit pension plan (plan in which the employer assumes the investment risk. It

169 | ©2021 AFP Compensation & Benefits Report
specifies a benefit at the age of retirement based on a formula using salary and/or years of experience).
2 Defined contribution plan ‐ (plan in which the employee assumes the investment risk). Annual contribution based on one of these factors: (1) percentage of salary (2) a percentage of the target benefit based on age or (3) a match based on employee contribution, e.g.an employer match for an employee’s contributions to an IRA
3 Profit‐sharing plan (provides that the amount held in the account of each participant will be paid when that participant retires. The amount of any distribution from the profit‐sharing plan depends on the contributions, including allocated forfeitures, made for the participant and the earnings from those contributions).
4 Thrift/savings plan (a tax‐deferred savings program established for federal employees only. The TSP is similar to the 401(d) plans widely used in private industry).
5 Money purchase pension plan ‐ (plan in which contributions by the employer are fixed and are not based on business profits).
6 SEP (Simplified Employee Pension) ‐ a plan that allows you to make contributions toward your own [if you are self‐employed] and your employees’ retirement without getting involved in a more complex qualified plan. Contributions are made to a traditional individual retirement arrangement [called a SEP‐IRA] set up by or for each eligible employee. SEP‐IRAs are owned and controlled by the employee, and the employer makes contributions to the financial institution where the SEP‐IRA is maintained.)
7 SIMPLE (Savings Incentive Match Plan for Employees) IRA ‐ (plan in which employees can choose to make salary reduction contributions to the plan rather than receiving these amounts as part of their regular pay. In addition, the employer contributes matching or nonelective contributions.)
8 Non‐IRS‐Qualified Plan ¬ (an employer’s plan that does not meet Internal Revenue Code requirements for qualified employee plans. It does not qualify for most of the tax benefits of a qualified plan).
9 IRA (Individual Retirement Account) ‐ (a personal savings plan that offers you tax advantages to set aside money for your retirement. Generally, amounts in your IRAs, including earnings and gains, are not taxed until distributed).
10 None. My organization does not offer other retirement plans.
11 Other
12 Don’t know
13 My organization doesn’t offer any retirement plan at all.
Please check ALL healthcare plans/benefits provided by your organization, even if you do not elect to participate. *
1 Employer contribution toward medical insurance or funding for medical expenses (HMO, PPO, basic coverage, direct reimbursement for medical expenses, etc).
2 Medical Savings Account (MSA)/Health Savings Account (HSA)
3 Employee Assistance Program
4 Dental insurance
5 Elder care
6 Mental health coverage
7 Prescription drug coverage

170 | ©2021 AFP Compensation & Benefits Report
8 Supplementary long‐term care
9 Vision insurance
10 naturopath
11 My organization offers NONE of these.
12 Stipend
Other (please specify)
Does your organization provide flexible benefit accounts for dependent care or healthcare?
These are authorized by Sections 125 and 129 of the tax code and allow you to set aside money in a specific account for use during the calendar year. The amount you elect to contribute to the account is deducted from your pay before federal, state, and FICA withholding is calculated. *
1 Yes
2 No
3 Don’t know
4 Doesn’t apply (e.g., self‐employed consultant)
Please mark ALL of the following benefits your employer offers employees (even if you do not take the benefit). Employees might pay some of the costs.
1 Group life insurance
2 Accident insurance
3 Short‐term disability insurance
4 Long‐term disability insurance
5 Tuition reimbursement
6 Local transportation subsidy
7 Paid or partially paid parental leave (other than FMLA time off) 7 Child care
9 Other (please specify)
Please mark benefits you have been offered in your current position (even if you do not take them).
1 Car or car allowance
2 Local transportation subsidy
3 Parking
4 Cellular phone or cell phone plan allowance
5 Home computer
6 Professional dues
7 Professional liability insurance
8 Relocation expenses
9 Service on external volunteer boards/committees
10 Other (please specify)
Please select the ONE response that best describes your field of endeavor immediately prior

171 | ©2021 AFP Compensation & Benefits Report
to entering fundraising.
1 Business (other than sales)
2 Sales
3 School/student
4 Government
5 Healthcare
6 Homemaking
7 Public relations/marketing
8 Financial planning/banking
9 Clerical work in nonprofit organization
10 Military
11 Education
12 Social work
13 Law
14 Volunteer work
15 Religion
16 None
17 Other NP work, not fundraisng
Other (please specify)
For how many years have you been employed as a fundraising professional?
Enter digits in whole years and round to the nearest year (e.g., enter 7 if you have worked 7 years and less than 6 months in fundraising and 8 if you have worked 7 years and 6 or more months).
For how many years have you been with your current employer?
Enter digits in whole years and round to the nearest year (e.g., enter 3 if you have worked there 3 years and less than 6 months and 4 if you have worked there 3 years and 6 or more months).
What is the longest period of time you have been employed in the same fundraising position with the same organization?
Enter digits in whole years and round to the nearest year (e.g., enter 5 if you worked at that job for 5 years and less than 6 months and 6 if you have worked there 5 years and 6 or more months).
For how many employers have you worked as a fundraising professional? (Consultants should count each fundraising consulting firm as one employer.)
What was your age in whole years (e.g., 25, 34) at the time you entered fundraising?
What is your age now?
35 or under Over 35
Young Professionals Questions

172 | ©2021 AFP Compensation & Benefits Report
Only if age 35 or under
Which of the following, if any, does your organization offer?
1 Training about working with people of different generations
2 Formal mentoring for people new to fundraising
3 Affinity groups by any type of identity or interest (age, ethnicity, “green workplace,” bike to work,
etc.)
4 A specific talent development or lleadership development program, strategy, or initiative
Other (please specify) efforts to assist young professionals
Do you ask for/receive “stretch assignments” that challenge you AND for which you receive support for success?
1 Yes, offered and supported to succeed
2 Offered stretch assignments but not supported to succeed
3 Neither assignments or support
Other (please specify)
What part of your job/profession do you feel least prepared for?
Open‐ended text coded by analysts
Do you have a formal mentor or have you had one in your current workplace?
1 Yes
2 No
3 Not sure
Has that mentor helped you think about how to advance in your career?
1 Yes, definitely 2 Somewhat
3 Not much
4 Not at all
5 Don’t know
6 Does not apply
7 Other (please specify)
Do you have or have you had a formal mentor through AFP?
1 Yes
2 No
Has that mentor helped you think about how to advance in your career?
1 Yes, definitely
2 Somewhat
3 Not much

173 | ©2021 AFP Compensation & Benefits Report
4 Not at all
5 Don’t know
6 Does not apply
7 Other (please specify)
For either workplace or AFP mentor, what have been the benefits for you? Check all that apply.
1 Helped support my self‐confidence
2 Problem‐solving
3 Networking, connecting with people in the office
4 Networking, connecting with colleagues in other venues
5 Active coaching in how to do some aspect(s) of the job
6 Challenged me to learn more
7 Other (please specify)
Is there someone you consider a professional role model, other than a mentor considered earlier?
1 Yes
2 No
3 Not sure
If yes, think of ONE individual. Is that person (pick one):
1 A member of your family with whom you do not also work
2 At your workplace now
3 Someone you worked with previously
4 In your career/field but someone you have never worked with
5 In a different field but someone you have never worked with
6 Other (please specify)
How do you interact with/learn from that role model? Check all that apply.
1 In person through conversation
2 During public events (presentations, speeches, social events)
3 Through webinars, training sessions, other specific learning context
4 Through print media (books, articles, and the like)
5 Through social media
6 Other (please specify)
Thinking about your own career development, which THREE possibilities below most interest you?
1 Learning more about evaluating fundraising programs
2 Managing volunteers or more volunteers

174 | ©2021 AFP Compensation & Benefits Report
3 Mentoring someone else
4 Finding a mentor for myself
5 Moving from small shop to larger entity
6 Improving my leadership skills needed for fundraising
7 Gaining skills for managing a team
8 Getting my next job in fundraising
9 Nonprofits and lobbying
10 None of the above
11 Other (please specify)
What do you think your next career step will be?
1 Fundraising / Advancement
2 Move to another organization to gain experience/challenge/knowledge for fundraising/advancement
3 Move out of fundraising profession
4 No plans yet for the “next career step”
5 Don’t know
ALL PARTICPANTS
How long have you been a member of AFP?
1 <1year
2 1 to 4 years
3 5 to 6 years
4 7to9years
5 10+ years
Who pays your AFP dues?
1 Employer 100%
2 Myself 100%
3 A split between my employer and myself
Have you ever been a mentor on behalf of AFP?
1 Yes
2 No
Chapter Activities
1 Attend chapter meetings regularly (6 or more times a year)
2 Attend chapter meetings sometimes (1 to 5 times a year)
3 Almost never attend chapter meetings (<1 a year)

175 | ©2021 AFP Compensation & Benefits Report
4 Do not attend chapter meetings
Local, Regional, or State‐level AFP
1 Attend conference at local/chapter/state level annually
2 Attend conference at local/chapter/state level sometimes
3 Almost never attend local/chapter/state level conference
4 Have never been to a local/chapter/state level conference
National AFP
1 Attend AFP ICON (international conference) annually
2 Attended one or two AFP ICON events in the past three years
3 Did not attend AFP Icon in the past three years
In the past 12 months, select any of the following that you have done:
1 Looked for a promotion within your current organization
2 Looked for a job with another employer
3 Made plans to become self‐employed
4 Made efforts to leave consulting and seek employment at an organization
5 Planned for my retirement within two years
6 None of the above
Please indicate why you thought about changing you employment in the past year. Check all that apply.
1 To earn a higher salary
2 To have greater opportunities for career advancement elsewhere
3 To seek a better mentor/learning experience
4 To advance in my career, to seek a position with more responsibility or authority
5 To engage in more interesting or challenging work
6 Because I lack a sense of recognition for what I do
7 Because work expectations are unrealistic
8 Because my work environment is not supportive of me as an individual
9 Because I am frustrated by the work environment
10 To get more time to spend on personal/family activities
11 Because of personality conflicts with my coworker(s) or manager
12 Because my values and the organization’s values are not the same
13 To move closer to family members
14 Because of gender bias in terms of salary
15 Because I plan to retire
16 To obtain health, retirement, or leave benefits more suited to my (or my family’s) needs.
Other (please specify)

176 | ©2021 AFP Compensation & Benefits Report
Please select the option that suits you.
1 Male
2 Female
3 Transgender Man
4 Transgender Woman
5 Gender non‐conforming
6 Intersex or other related term
7 Prefer not to say
9 Prefer to self‐describe (please specify)
Please check ALL responses that describe your primary ethnic background(s) or race(s). *
1 African American/Black
2 Alaskan Native
3 Asian
4 European American/White
5 Chinese
6 Hawaiian
7 Hispanic/Latin American
8 Indian, Sri Lankan, Pakistani, or Bangladeshi
9 Filipino/Filipina
10 Japanese
11 Jewish
12 Korean
13 Middle Eastern, North African, or Arab
14 Native American/Aboriginal
15 Pacific Islander
16 Samoan
17 Southeast Asian such as Vietnamese, Cambodian, etc.
18 West Asian such as Irani, Afghani, Iraqi, etc.
Other (please specify)
What is your age now?
Which of these is your highest completed education level?
1 High school
2 Associate’s degree
3 Bachelor’s degree
4 Master’s degree
5 Doctorate

177 | ©2021 AFP Compensation & Benefits Report
6 Other advanced degree (JD, MD, DO, etc.) 7 Other (please specify)
Which of the following professional certifications do you hold? Choose ALL that apply.
1 CFRE
2 ACFRE
3 FAHP
4 IADF
5 CFRM
6 None
Other (please specify)
If you are willing to participate in mini‐surveys throughout the year related to your career please provide your contact information below. NOTE: this survey is being analyzed by a professional survey analyst who will preserve your confidentiality by separating your responses here from all other responses in the study.
Canadian QuestionsIn what province is the office for which you work located?
Retirement Benefits
What types of retirement plans are offered by your organization? Check ALL that apply.
1 Defined Pension Benefit Plan
2 Defined Contribution Plan
3 Profit‐sharing plan
4 Group Registered Retirement Savings Plan (RRSP)
5 My organization does not offer retirement benefits. 6 Don’t know
What other types of retirement plans are offered by your organization? Check ALL that apply.
1 Non‐IRS qualified plan
2 SIMPLE
3 Money Purchase pension plan 4 IRA
5 SEP
6 Thrift savings plan
Health Benefits
Please check ALL healthcare plans/benefits provided by your organization, even if you do not elect to participate.
1 Basic hospitalization/major medical 2 Major medical
3 Employee Assistance Program
4 Dental insurance

178 | ©2021 AFP Compensation & Benefits Report
5 Elder care
6 Mental health coverage
7 Prescription drug coverage
8 Supplementary long‐term care 9 Vision insurance
10 Alternative care coverage such as for an accupuncturist, chiropractor, massage therapist or naturopat 11 My organization offers NONE of these.
12 Other (please specify)
Does your organization provide flexible benefit accounts for dependent care or healthcare?
1 Yes
2 No
3 Don’t know
4 Doesn’t apply (eg., self-employed consultant)
ETHNICITY
Please check ALL responses that describe your primary ethnic background(s) or race(s).
1 Black
2 Indigenous people (eg. North American Indian, Metis, or Inuit)
3 Caribbean (West Indian)
4 Chinese
5 European
6 Filipino/Filipina
7 Indian Band/First Nation
8 Jewish
9 Japanese 10 Korean
11 Latin American
12 Middle Eastern, North African, or Arab
13 South Asian (India, Sri Lankan, Pakistani, or Bangladeshi)
14 Southeast Asian such as Vietnamese, Cambodian, etc.
15 West Asian such as Irani, Afghani, Iraqi, etc.
16 Other (please specify)

179 | ©2021 AFP Compensation & Benefits Report

180 | ©2021 AFP Compensation & Benefits Report

181 | ©2021 AFP Compensation & Benefits Report

182 | ©2021 AFP Compensation & Benefits Report


![BENEFITS & COMPENSATION INTERNATIONAL1].pdf · United States who are US citizens, ... qualified deferred compensation plan”. ... Benefits & Compensation International• 2](https://img.pdfslide.net/doc/110x75/5b69676e7f8b9ab0128e2df1/benefits-compensation-1pdf-united-states-who-are-us-citizens-qualified.jpg)