Embed Size (px)
Citation preview
General Counsel Pay TrendsFeaturing Commentary From
S E P T E M B E R 2 0 2 1 • A N EQU I L A R P U B L I C AT I O N


3
Executive Summary 4
Methodology 7
Key Findings 7
Beyond the Numbers 8
Data Points and Figures 10
Median Total Compensation by Revenue, Equilar 500+ 11
Equilar 500 Median Total Compensation by Sector 12
Equilar 500 Median GC Pay Components 13
Equilar 500 Average Pay Mix by Sector 14
Equilar 500 GC Count 15
Equilar 500 GC Count by Sector 16
Equilar 500 GC Share by Gender 17
Equilar 500 Median Total Compensation by Gender 18
Equilar 500 Median GC Pay Components by Gender 19
Equilar 500 CEO-to-GC Pay Ratio 20
Equilar 500 CFO-to-GC Pay Ratio 21
Commentary From BarkerGilmore 22
A Deep Dive: The Critical Role of the General Counsel 22
About the Contributor 24
Contents
TABLE OF CONTENTS 3

4
Executive SummaryAs Corporate America continues to become more complicated to navigate, the General Counsel (GC) role at public companies has risen in prominence in recent years. The global economy has become more intertwined, causing legal considerations to become more complex across borders—from human resources and political involvement to data privacy and cybersecurity.
Chief among the changes to the General Counsel role has been the growing focus on human capital management, including employee health and safety as well as hiring a diverse workforce at all levels of the organization. Amidst the COVID-19 pandemic and the wider acknowledgement of corporations’
the legal department and its top executive.
The GC’s involvement as a leader and advisor on a wider range of corporate initiatives has given these executives a more comprehensive view of the organization than they may have had in a more limited role
and many more, the GC has been elevated to become one of the top executives at many public companies, in addition to becoming a trusted strategic advisor among boards of directors.
These trends represent a shift for GC—from highly ranked supporting
attracting accomplished professionals that demand higher compensation for their increasingly varied skill sets and diverse backgrounds.
General Counsel Roles Rise in Prominence (and Pay)
The GC’s rise among corporate leadership is evidenced by the fact that
highest-paid employees reported in annual proxy statements. Since 2016,
largest U.S. companies by revenue—an increase of 8.2%.
course of the study period to reach $2.8 million in 2020, compared to $2.4 million in 2016.
A large portion of this gain occurred in 2020, as total reported
study period—up 7.5% from the previous year. GC pay experienced double-digit growth from 2019 to 2020 for companies with revenues between $7 billion and $20 billion. The largest companies, those with
©2021 Equilar, Inc. The material in this report may not be reproduced or distributed in whole or in part without the written consent of Equilar, Inc. This report provides information of general interest in an abridged manner and is not intended as a substitute for accounting, tax, investment, legal or other professional advice or services. Readers should consult with the appropriate professional(s) before acting on information contained in this report. All data and analysis provided in this report are owned by Equilar, Inc.Reports are complimentary for Equilar subscribers. Non-subscribers may purchase individual reports for $995.Please contact [email protected] for more information.
Managing Editor Amit Batish
Lead Author Dan Marcec
Data and Analysis Brendan Cullen Nathan Grantz
Design and Layout Christina Cheng Danny Shin
4

5
more than $20 billion in annual revenue, awarded a median $4.9 million
companies with revenues of $5 billion to $7 billion represented the only segment to see a decline, but it was not large enough to put a drag on the overall trend.
$5 billion, GC at U.S. public companies with less than $500 million in revenue saw a 15.7% increase in total reported compensation, rising from $724,669 in 2019 to $838,172 in 2020. Meanwhile, companies with revenues between $500 million and $5 billion gave GC a 1.6% pay raise in 2020, increasing by about $20,000 at the median to reach $1.4 million.
Pay Trends Swing Wildly by Sector
On a sector-by-sector basis, there was little consistency in median pay totals or change in value from year to year. Median total compensation for GC in communication services by far outpaced all other sectors, totaling $6 million, representing a 44.8% increase since 2019. The technology sector had the second-highest GC pay levels in 2020, with median total reported compensation reaching $5 million. Tech GC saw a 50.2% pay increase at the median, the largest gain of any sector.
In addition, GC saw double-digit pay increases at the median in the consumer cyclical and real estate sectors (more than 30%) as well as in the consumer defensive and healthcare industries (more than 10%).
On the other hand, the basic materials sector saw the biggest year-over-year decline in 2020, down 23.5% to $2.1 million. Industrials also saw
saw more modest dips.
Long-term Equity Reigns While Annual Pay Also Rises
The median value of performance incentives represented the largest pay
of the median pay components included in this analysis increased across the study period, indicating that a variety of compensation vehicles serve a complementary purpose to aid the attraction, retention and incentivization of the most prominent GC.
and annual bonus in 2020, split evenly between the two compensation methods. Meanwhile, equity compensation, which includes time-based stock and options awards as well as performance incentives, accounted for the remainder of GC pay.
These trends also varied by industry, with technology companies offering nearly 80% of GC pay packages in equity on average, while companies
EXECUTIVE SUMMARY 5
The Critical Role of the General Counsel
-ore on Thursday, September 16, 2021 for a discussion about the General Counsel's shift from a highly ranked supporting role to an es-sential leadership position and what that means for the corporate environment going forward.
www.equilar.com/webinars

6
in the consumer defensive sector offered nearly half of GC compensation through salary and bonus on average.
(Note: This section of the report excluded an analysis of “other
and perks. Total compensation levels referenced elsewhere in the report included these values.)
Women Gain Ground on the Road to Gender Parity
62 of 171, representing approximately a 50% increase in share from 2016, when more than three-quarters of GC positions were held by men. The number of women in GC roles increased in every year of the study, with the largest gain occurring from 2018 to 2019.
million at the median, in comparison to $2.7 million for men.
6
Equilar Disclosure Search
Search is the most comprehensive solution to accurately examine
The accessible interface allows you to search within
forms, including 8-K,
and more, using a variety
www.equilar.com/ disclosure-search
General Counsel Pay Trends,
to generate the segments associated with reported revenue of less than $500 million and revenue between
stock awards, option awards and all other compensation as reported in the summary compensation table
pension value were excluded from the summation of total compensation. The term “options” includes both options as well as stock appreciation rights (SARs). Similarly, “stock” refers to all full-value shares, including
incentive compensation vehicles that are linked to a performance metric in some way. Industry sectors for
companies decide to compensate the position, including in relation to gender. BarkerGilmore has provided an independent analysis to illustrate the crucial nature of the role.
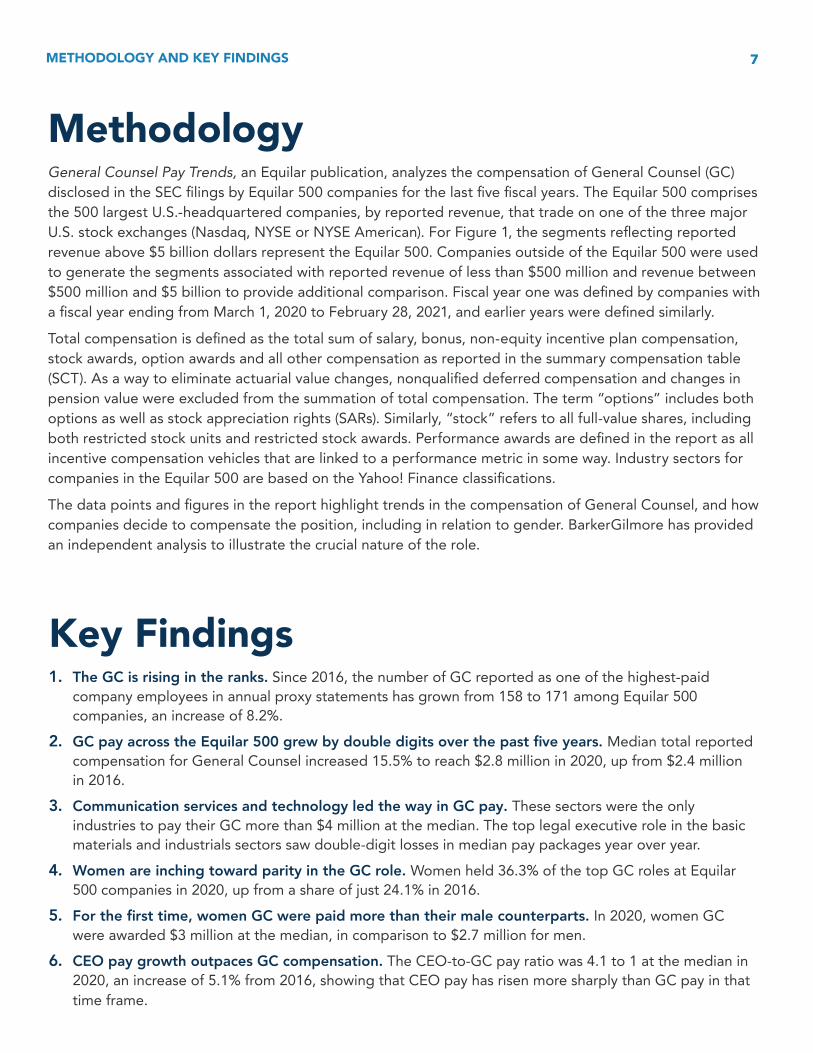
Methodology
Key Findings1. The GC is rising in the ranks. Since 2016, the number of GC reported as one of the highest-paid
companies, an increase of 8.2%.
2. Median total reported compensation for General Counsel increased 15.5% to reach $2.8 million in 2020, up from $2.4 million in 2016.
3. Communication services and technology led the way in GC pay. These sectors were the only industries to pay their GC more than $4 million at the median. The top legal executive role in the basic materials and industrials sectors saw double-digit losses in median pay packages year over year.
4. Women are inching toward parity in the GC role.
5. In 2020, women GC were awarded $3 million at the median, in comparison to $2.7 million for men.
6. CEO pay growth outpaces GC compensation.
time frame.
7 METHODOLOGY AND KEY FINDINGS 7

8 8
Beyond the NumbersA Q&A with John Gilmore, BarkerGilmore
To provide additional perspective on the trends uncovered in General Counsel Pay Trends
General Counsel role, particularly in today’s corporate environment. Additional commentary from Mr. Gilmore can be found at the end of this report.
Equilar: How did the uncertainty and unpredictability of COVID-19 affect the General Counsel role in 2020 and into 2021? How did these trends vary across industry sectors, and for what reasons?
John Gilmore: The past two years provided formidable challenges for General Counsel,
business leaders. When asking GC to look back and assess where they provided the greatest value, the answer in most cases is simply staying positive and
outside of the company with a “we’ll get through this” attitude. The call-to-action in March 2020 was
to reposition products, services, assets, debts, commercial contracts and employees as a means of survival. GC stood up to the challenge, allowing businesses to stabilize and valuations to bounce well past pre-pandemic levels.
Today, General Counsel have assumed a much greater workload, especially with regard to risk management. The volume and complexity of matters
and the devastating potential to business has added
of matters related to data privacy and security, software and systems integration, supply chain,
many highlighted concerns.
General Counsel are also unlike any other member of the executive team in that they serve as a trusted
topics. As a result, GC must be nimble, humble, and
type of trusted relationship takes time; however,
make is priceless.
As with many other executive roles, General Counsel compensation continues to increase and is commensurate with the individual’s value-add to
respective organizations, and while they are taking on an increasing number of roles outside of legal, including compliance, risk, privacy, human resources,
to propel past some C-suite peers who have more siloed responsibilities. GC base salaries in 2020
cash bonuses and long-term equity or deferred cash awards. Short-term bonus targets typically have multiplier potential based on personal and company performance. Personal performance is often driven by the ability to keep the business operating smoothly, the provision of support for the company’s strategic initiatives and adherence to budget.
With Baby Boomer GC reaching retirement age, individual net worth at new highs, and the call to do more with leaner budgets, there is a higher level of

turnover, resulting in a robust hiring market in 2021 for General Counsel. Understandably so, interest in and competition for these positions have never been greater, regardless of the demands and expectations
have far less negotiating power than sitting GC. Those with a track record of leadership, business
board are highest in demand and diverse candidates have even greater leverage.
It is also worth noting that, as GC make succession planning a priority—offering meaningful exposure to the board and supporting executive coaching for succession candidates—more companies are seriously considering legal leaders from within for the GC seat and benchmarking against external candidates.
Read More From The Critical Role of the General Counsel
on page 22 of this report.
9 BEYOND THE NUMBERS 9

Data Points and Figures

Figure 1
11 DATA POINTS AND FIGURES 11
Data Points
1. companies with more than $7 billion in revenue (Fig. 1)
2. At companies earning more than $20 billion in revenue in 2020, GC had a median total reported compensation of nearly $5 million, up 8.3% from the previous year (Fig. 1)
3. GC at companies with revenues between $7 billion and $10 billion saw the largest gain in total reported compensation, up 23.8% to $2.6 million, while GC pay at companies between $10 billion and $20 billion in revenue also saw double-digit growth, rising 14.7% to $2.9 million (Fig. 1)
4. Companies with revenue between $5 billion and $7 billion compensated their GC less in 2020 than in 2019 at the median, with total reported pay falling 6.6% to $2.1 million (Fig. 1)
5. GC at U.S. public companies with less than $500 million in revenue saw a 15.7% increase in total reported compensation, rising from $724,669 in 2019 to $838,172 in 2020 (Fig. 1)
6. Companies with revenues between $500 million and $5 billion gave GC a 1.6% pay raise in 2020, increasing by about $20,000 at the median (Fig. 1)
$0
$1,000
$2,000
$3,000
$4,000
$5,000
Over $20 BillionBetween $10 Billion and $20 Billion
Between $7 Billion and $10 Billion
Between $5 Billion and $7 Billion
Between $500 Million and $5 Billion
Less than $500 Million
Thou
sand
s
Equilar 500
2019 $724.7 $1,371.6 $2,259.1 $2,075.3 $2,512.7 $4,549.5
2020 $838.2 $1,392.9 $2,110.6 $2,568.9 $2,881.6 $4,927.7

Data Points
1. Median total compensation for GC in the communication services by far outpaced all other sectors, totaling $6 million, representing a 44.8% increase since 2019 (Fig. 2)
2. Median total compensation increased in the technology industry more than any other sector, rising 50.2% to $5 million in 2020 (Fig. 2)
3. GC saw pay increases at the median of more than 30% in the consumer cyclical and real estate sectors and more than 10% in the consumer defensive and healthcare industries (Fig. 2)
4. The basic materials sector saw the biggest year over year decline in 2020, down 23.5% to $2.1 million
5. modest dips (Fig. 2)
Figure 2 Equilar 500 Median Total Compensation by Sector
$0
$2,000
$4,000
$6,000
UtilitiesTechnologyReal Estate
IndustrialsHealthcareFinancial Services
EnergyConsumer Defensive
Consumer Cyclical
Comm. Services
Basic Materials
Equilar 500
Thou
sand
s
2016 $2,443.8 $2,325.9 $4,030.3 $1,908.1 $2,292.5 $3,079.3 $2,724.4 $3,364.0 $2,075.7 $4,044.8 $2,607.8 $2,050.0
2017 $2,474.8 $1,919.8 $4,176.6 $2,077.2 $2,266.1 $3,955.5 $2,323.4 $3,430.9 $2,186.8 $3,747.1 $3,097.5 $2,151.8
2018 $2,522.8 $2,009.2 $3,575.5 $2,323.3 $2,268.4 $3,475.3 $2,604.4 $3,978.5 $2,295.1 $2,711.9 $3,048.5 $2,175.7
2019 $2,626.2 $2,721.9 $4,113.0 $2,047.9 $2,634.3 $3,180.0 $2,745.1 $3,379.9 $2,533.0 $2,928.7 $3,343.1 $2,300.4
2020 $2,823.0 $2,081.4 $5,953.6 $2,697.0 $2,935.8 $3,061.9 $2,678.4 $3,736.4 $2,111.6 $3,894.9 $5,020.7 $2,406.0
12 12

Figure 3 Equilar 500 Median GC Pay Components
$0
$200
$400
$600
$800
Performance IncentivesOption AwardsStock AwardsAnnual Cash Bonus TargetSalary
Thou
sand
s
Data Points
1.
and up 14% since 2016 (Fig. 3)
2. Salary and annual cash bonuses increased in each year of the study, as salary grew 10.1% to $581,048 from 2016 to 2020, and bonuses rose 12.9% to $494,260 in that time frame (Fig. 3)
3. important component of GC compensation packages (Fig. 3)
4. Time-based stock awards were an important component within GC pay packages, increasing in value
companies, resulting in a median award value of $0 across the study period (Fig. 3)
2016 $527.9 $437.8 $265.6 - $575.2
2017 $543.5 $449.5 $297.5 - $564.8
2018 $551.5 $463.3 $301.7 - $639.5
2019 $579.7 $480.0 $350.0 - $690.7
2020 $581.0 $494.3 $390.0 - $655.7
13 DATA POINTS AND FIGURES 13
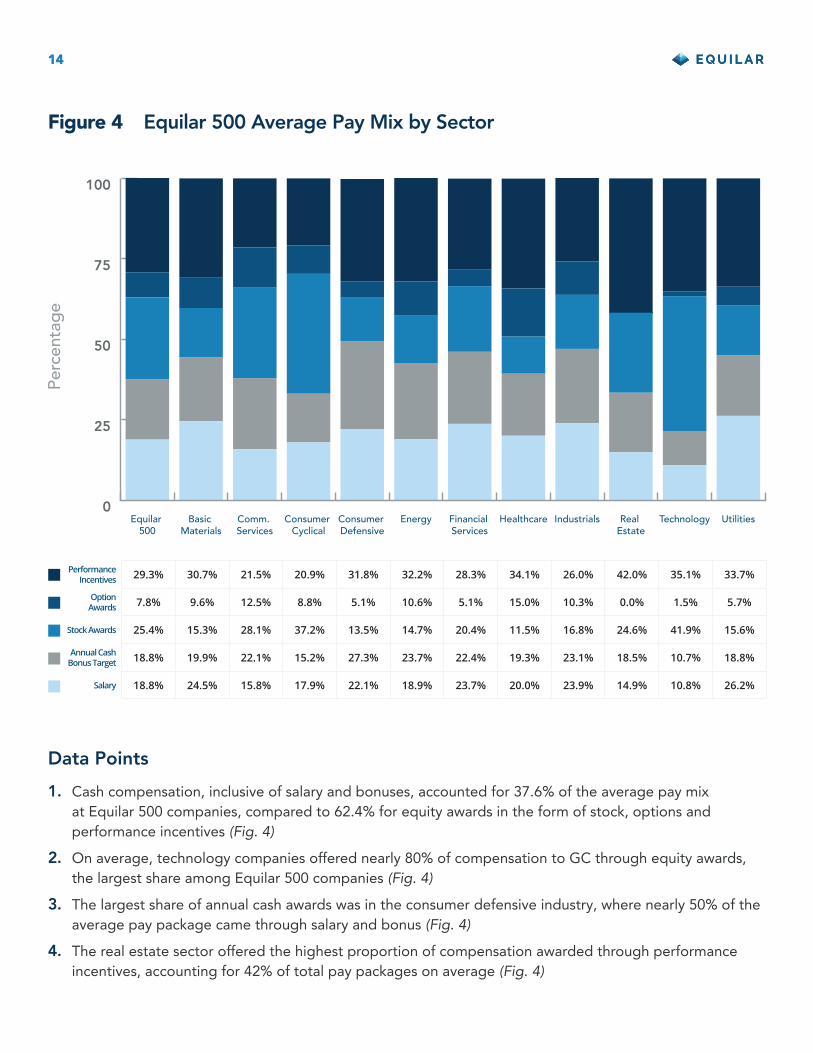
Data Points
1. Cash compensation, inclusive of salary and bonuses, accounted for 37.6% of the average pay mix
performance incentives (Fig. 4)
2. On average, technology companies offered nearly 80% of compensation to GC through equity awards, (Fig. 4)
3. The largest share of annual cash awards was in the consumer defensive industry, where nearly 50% of the average pay package came through salary and bonus (Fig. 4)
4. The real estate sector offered the highest proportion of compensation awarded through performance incentives, accounting for 42% of total pay packages on average (Fig. 4)
Figure 4 Equilar 500 Average Pay Mix by Sector
Perc
enta
ge
0
25
50
75
100
UtilitiesTechnologyReal Estate
IndustrialsHealthcareFinancial Services
EnergyConsumer Defensive
Consumer Cyclical
Comm. Services
Basic Materials
Equilar 500
Performance Incentives 29.3% 30.7% 21.5% 20.9% 31.8% 32.2% 28.3% 34.1% 26.0% 42.0% 35.1% 33.7%
Option Awards 7.8% 9.6% 12.5% 8.8% 5.1% 10.6% 5.1% 15.0% 10.3% 0.0% 1.5% 5.7%
Stock Awards 25.4% 15.3% 28.1% 37.2% 13.5% 14.7% 20.4% 11.5% 16.8% 24.6% 41.9% 15.6%
Annual Cash Bonus Target 18.8% 19.9% 22.1% 15.2% 27.3% 23.7% 22.4% 19.3% 23.1% 18.5% 10.7% 18.8%
Salary 18.8% 24.5% 15.8% 17.9% 22.1% 18.9% 23.7% 20.0% 23.9% 14.9% 10.8% 26.2%
14 14

Data Points
1. statements increased by 13 since 2016, or 8.2% (Fig. 5a)
2. the role at the largest U.S. companies (Fig. 5a)
3. The largest one-year increase in reported GC was from 2016 to 2017, when there was a net gain of six executives disclosed in annual proxy statements (Fig. 5a)
Figure 5a Equilar 500 GC Count
0
50
100
150
200
20202019201820172016
Num
ber
of G
Cs
158164 165
170 171
15 DATA POINTS AND FIGURES 15

0
10
20
30
40
UtilitiesTechnologyReal Estate
IndustrialsHealthcareFinancial Services
EnergyConsumer Defensive
Consumer Cyclical
Comm.Services
Basic Materials
Num
ber
of G
Cs
Data Points
1. The basic materials and consumer cyclical sectors saw the largest increase in the number of GC reported (Fig. 5b)
2. The industrials sector saw the largest year-over-year decrease in the number of GC disclosed, down six from 2019 (Fig. 5b)
3. disclosing their top legal executive in the proxy (Fig. 5b)
4. companies disclosing this role as a highest-paid employee (Fig. 5b)
Figure 5b Equilar 500 GC Count by Sector
16 16
2016 12 8 25 14 11 17 18 26 2 11 14
2017 9 11 28 16 10 17 17 24 3 13 16
2018 9 9 28 14 10 15 18 26 4 16 16
2019 9 11 24 16 11 16 19 31 4 13 16
2020 13 11 28 16 8 16 17 25 4 18 15

Data Points
1. approximately a 50% increase in share from 2016, when more than three-quarters of GC positions were held by men (Fig. 5c)
2. The number of women in GC roles increased in every year of the study, with the largest gain occurring from 2018 to 2019 (Fig. 5c)
Figure 5c Equilar 500 GC Share by Gender
Percen
tage
0
20
40
60
80
100
20202019201820172016
17 DATA POINTS AND FIGURES 17
Male 75.9% 75.0% 73.9% 67.3% 63.7%
Female 24.1% 25.0% 26.1% 32.7% 36.3%

Figure 6 Equilar 500 Median Total Compensation by Gender
$0
$1,000
$2,000
$3,000
$4,000
20202019201820172016
Thou
sand
s
Data Points
1. million at the median in comparison to $2.7 million for men (Fig. 6)
2. Median total compensation for men increased modestly in every year of the study, amounting to an 8% increase from 2016 to 2020 (Fig. 6)
3. (Fig. 6)
18 18
Male $2,466.6 $2,545.6 $2,617.4 $2,646.1 $2,664.6
Female $2,292.5 $2,240.2 $2,218.4 $2,584.9 $3,028.2

Figure 7 Equilar 500 Median GC Pay Components by Gender
$0
$200
$400
$600
$800
Performance IncentivesOption AwardsStock AwardsAnnual Cash Bonus TargetSalary
Thou
sand
s
Data Points
1. Women saw higher median values for at-risk pay in 2020, including annual cash bonuses and performance incentives (Fig. 7)
2. Time-based stock awards were the only pay components for which men saw greater median values in 2020 (Fig. 7)
Male $580.0 $488.0 $399.0 - $630.2
Female $585.1 $531.0 $382.6 - $706.9
19 DATA POINTS AND FIGURES 19

Figure 8a Equilar 500 CEO-to-GC Pay Ratio
0
1
2
3
4
5
20202016
Rat
io
3.94.1
Data Points
1. companies disclosing a GC in the proxy paid their chief executives over four times more than their General Counsel (Fig. 8a)
2. sharply than GC pay in that time frame (Fig. 8a)
20 20

Figure 8b Equilar 500 CFO-to-GC Pay Ratio
0.0
0.2
0.4
0.6
0.8
1.0
1.2
1.4
20202016
Ratio
1.3 1.3
Data Points
1. (Fig. 8b)
2. years (Fig. 8b)
21 DATA POINTS AND FIGURES 21

A Deep Dive
BarkerGilmore is pleased to once again partner with General
Counsel Pay Trends, which seeks to shed light on how changes within the corporate legal realm affect General Counsel (GC) compensation.
only seeking to be involved in a more strategic capacity, but most are also expected to do so by the senior management team and board. As a result of their increased involvement in determining the
executive teams have become a three-legged stool
In addition, some GC have taken on a variety of additional roles, including compliance, risk, human
however, the proportion of General Counsel who are
This is likely the result of not only a heightened focus
While many companies once focused primarily on environmental matters, the demand for communication, transparency, and equity in the workplace and across Corporate America has greatly affected governance and
equal weight, are more and more ingrained in regular business practices, and are heavily scrutinized from a legal
legal function, the General Counsel’s active involvement—
initiatives forward, overseeing disclosures, setting the right governance structures, and ensuring proper board attention is received. It is also worth noting the
to let up any time soon, and a time will likely come—
alone function, but instead, one which is deeply woven into every other aspect of the business. Consequently,
continue to become, a core function of, and a required competency for, the GC role, regardless of whether or not they are head of the function.
It is not surprising, then, that General Counsel compensation has continued to increase in a manner commensurate with the GC’s level of contribution to their company. Some companies have seen a narrowing
GC) and a widening of the gap between the CHRO and GC (with the GC as the more highly compensated individual). These changes are indicative of the GC’s increased scope of responsibilities and value-add. So, too, does it prove GC are quickly solidifying their position as a true partner to the business and an indispensable member of the executive team.
companies appoint a new top legal executive. With most of America’s C-suite consisting of Caucasian
44 lawyers were appointed to the enterprise GC or
The Critical Role of the General Counsel
22 22

GC, further contributing to the robust and competitive 2021 market for talent. BarkerGilmore’s research team
leading to this highly sought-after position. A few of the standout trends for 2020 were a higher percentage of appointments coming from outside of the company and an increased percentage of these hires being women and/or minorities. The overall percentage of women GC
up from 33% in 2019, 28% in 2018 and 26% in 2017. While women are slowly gaining ground, 57% of the GC appointments promoted from within were male.
on diversity within the GC ranks is the insistence of
for one company, another takes a hit. With increased attention on succession planning and an eye on attracting succession-worthy talent below the General Counsel level, the candidate pool for the top spot should improve. The focus of attention needs to be on the soft skills required for the role including gravitas, ability to establish trusted relationships and leadership experience.
23 A DEEP DIVE 23
compliance executive search professionals and leadership consultants. With a team of advisors and recruiters
BarkerGilmore’s niche concentration results in unparalleled access to a specialized network of talent.
including a: 96% retention rate, 53% women placement rate, 27% minority placement rate, and 4.8/5.0 client satisfaction rating.
www.barkergilmore.com
About the Contributor
24 24
John GilmoreManaging Partner | BarkerGilmore
(585) 598.6555 | Email: [email protected]
John Gilmore is co-founder and Managing Partner of BarkerGilmore with over three decades of executive search experience. John has developed trusted relationships with General Counsel and C-suite leaders across the country. He has unfettered access to the extraordinary talent they seek and an innate ability to quickly identify a substantive and cultural match. With a profound institutional understanding of how in-house legal and compliance departments function most effectively, John has earned a reputation as one of the top
helping his clients build strong and productive legal and compliance departments, he is always cognizant of a company’s current situation as well as its future needs throughout the search process.
SM method, which is employed in every BarkerGilmore search. This innovative, powerful recruiting tool has consistently resulted in candidate placements with diversity and retention rates well above industry averages. John not only assesses technical skills, industry knowledge, and leadership
management team.
consultants responsible for identifying specialized attorneys and potential successors who report to the General Counsel. John is frequently featured and/or quoted in industry and business publications, and
compensation, and diversity. Most recently, he was interviewed by a national morning television program on changes in cybersecurity and heightened demand for lawyers specializing in data privacy.
www.equilar.com/proxy-voting-results
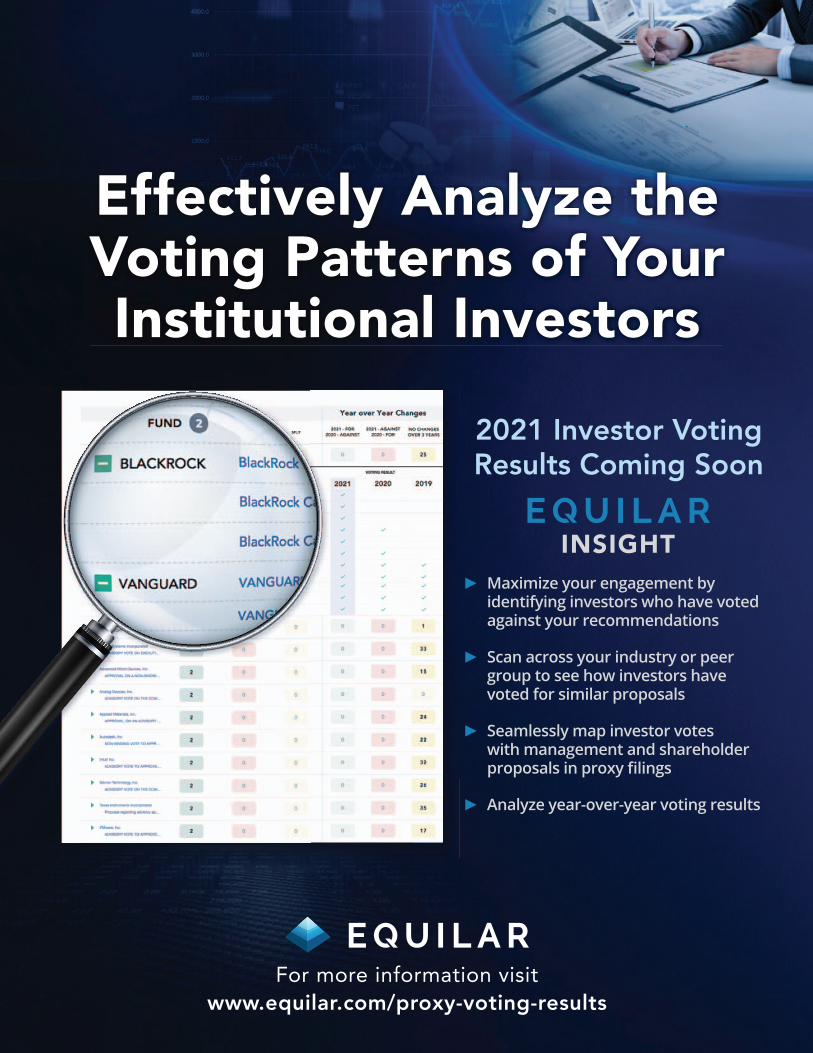
Effectively Analyze the Voting Patterns of Your Institutional Investors
2021 Investor Voting Results Coming Soon
Maximize your engagement by identifying investors who have voted against your recommendations
Scan across your industry or peer group to see how investors have voted for similar proposals
Seamlessly map investor votes with management and shareholder
Analyze year-over-year voting results

1100 Marshall Street, Redwood City, CA 94063
1120 Avenue of the Americas, Suite #4045, New York, NY 10036
Phone: (650) 241-6600 | Fax: (650) 701-0993 | E-mail: [email protected] www.equilar.com