Embed Size (px)
Citation preview

2.1 - StructureIB Topics 2.1.1-2.1.7
Topic 2 – The Ecosystem

Biotic and Abiotic Components
Biotic All living
components of the ecosystem
Ex:
Abiotic All non-living
components of the ecosystem
Ex:
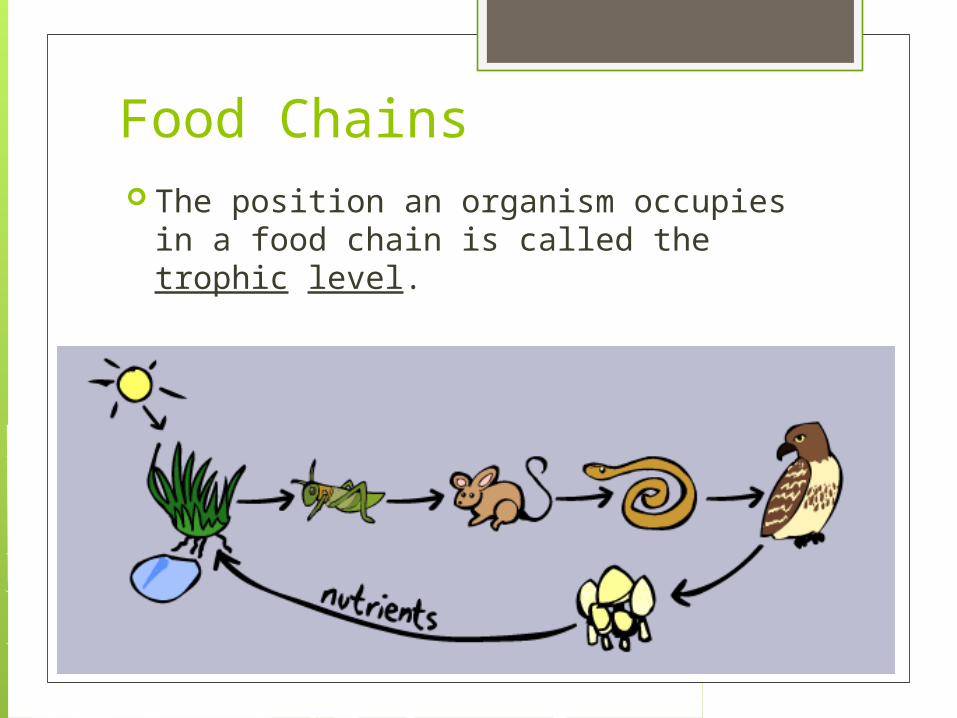
Food Chains The position an organism occupies in a
food chain is called the trophic level.

Local Food Chain Example:


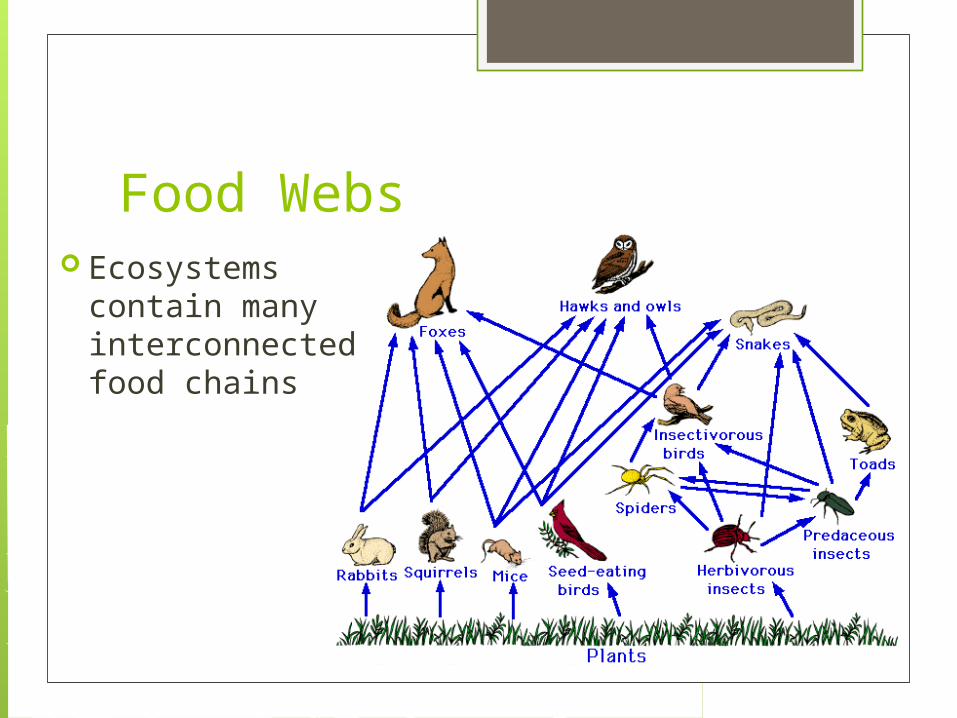
Food Webs Ecosystems
contain many interconnected food chains


Pyramid of Numbers A graphical model
of the number of organisms in a food chain


Pyramid of Biomass A graphical model
of the amount of biomass present in a food chain at a certain point in time

Pyramid of Productivity A graphical model
of the rate of energy production over time

Key Words (define and provide a local example of each) Species Population Habitat Niche Community Ecosystem
Parasitism Mutualism Predation Herbivory

2.2 – Measuring Abiotic ComponentsIB Topics 2.2.1-2.2.2
Topic 2 – The Ecosystem

Significant Abiotic Factors Terrestrial
Ecosystem Marine
Ecosystem Freshwater
Ecosystem

2.3 – Measuring Biotic ComponentsIB Topics 2.3.1-2.3.5
Topic 2 – The Ecosystem
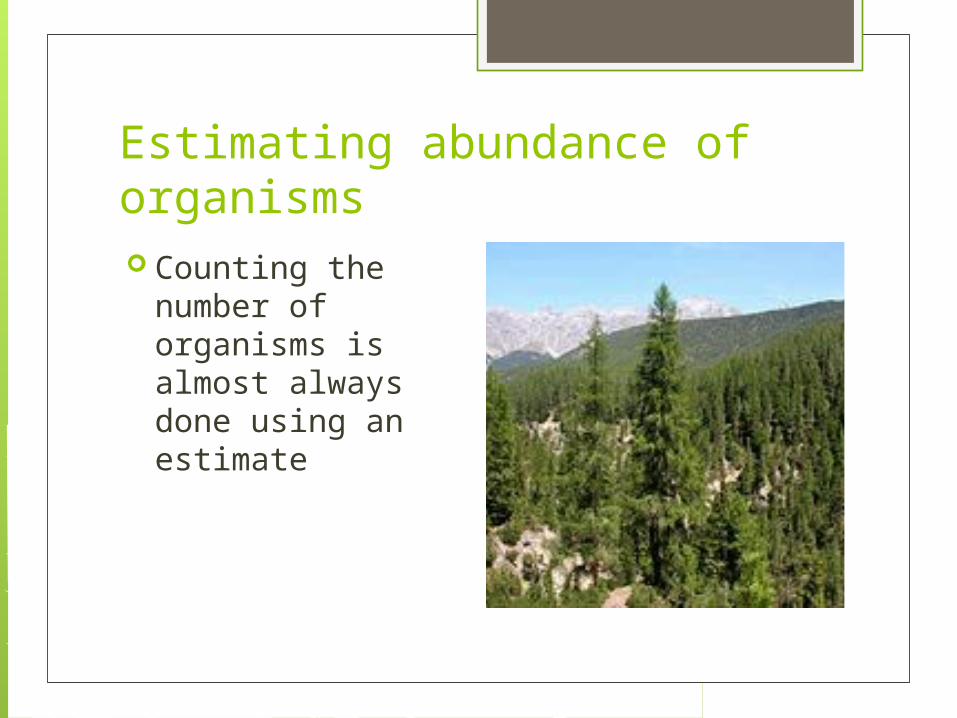
Estimating abundance of organisms Counting the
number of organisms is almost always done using an estimate

Lincoln Index A mathematical
model to estimate population size
Capture-mark-release-recapture
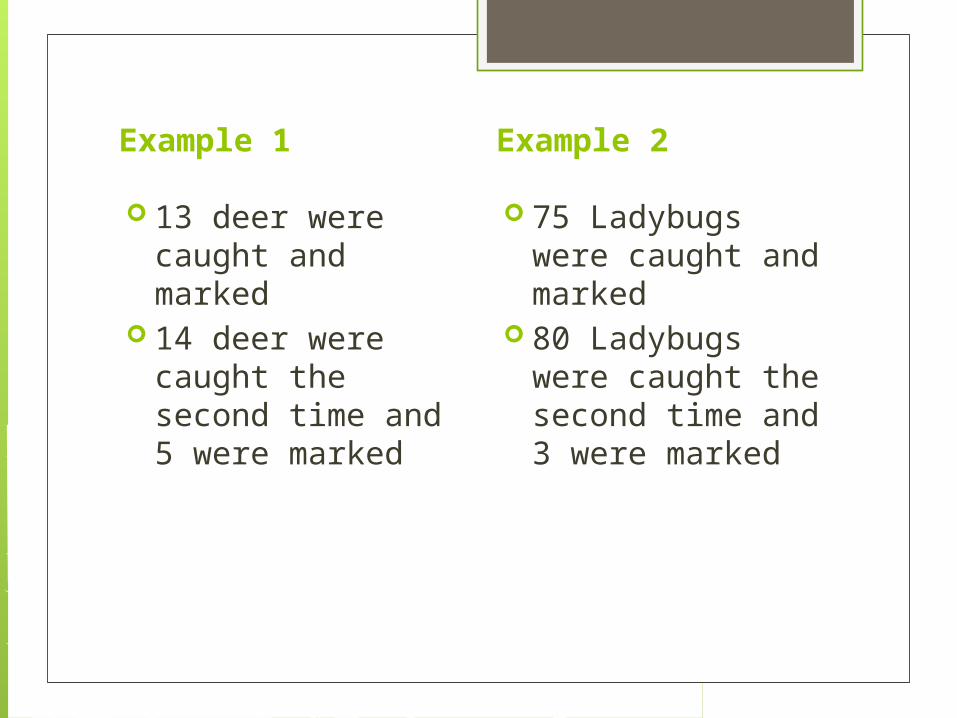
Example 1
13 deer were caught and marked
14 deer were caught the second time and 5 were marked
Example 2
75 Ladybugs were caught and marked
80 Ladybugs were caught the second time and 3 were marked
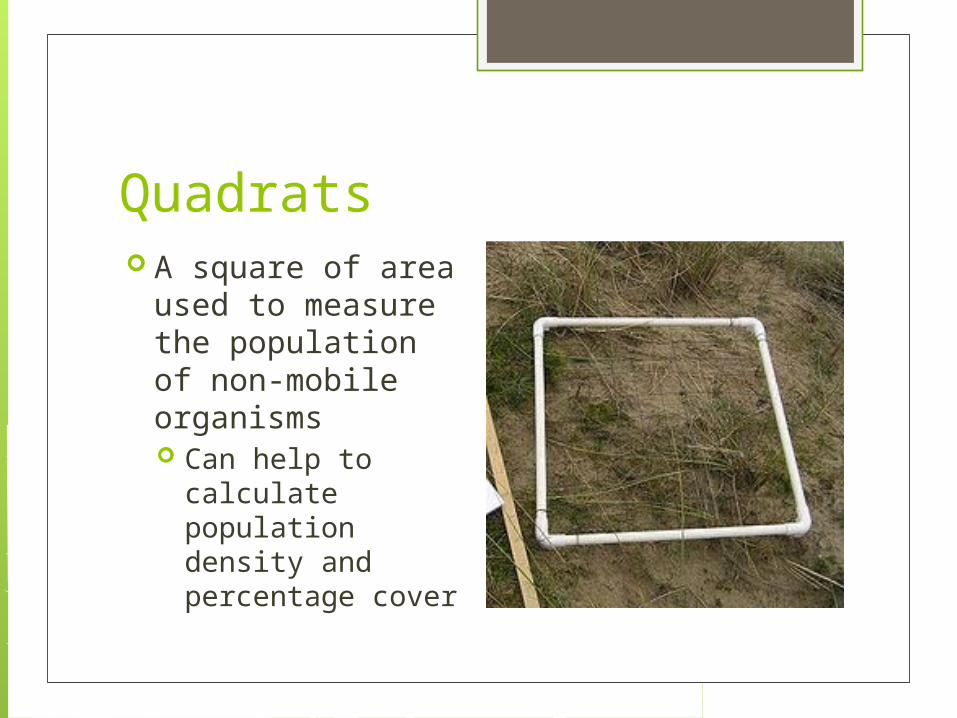
Quadrats A square of area
used to measure the population of non-mobile organisms Can help to
calculate population density and percentage cover
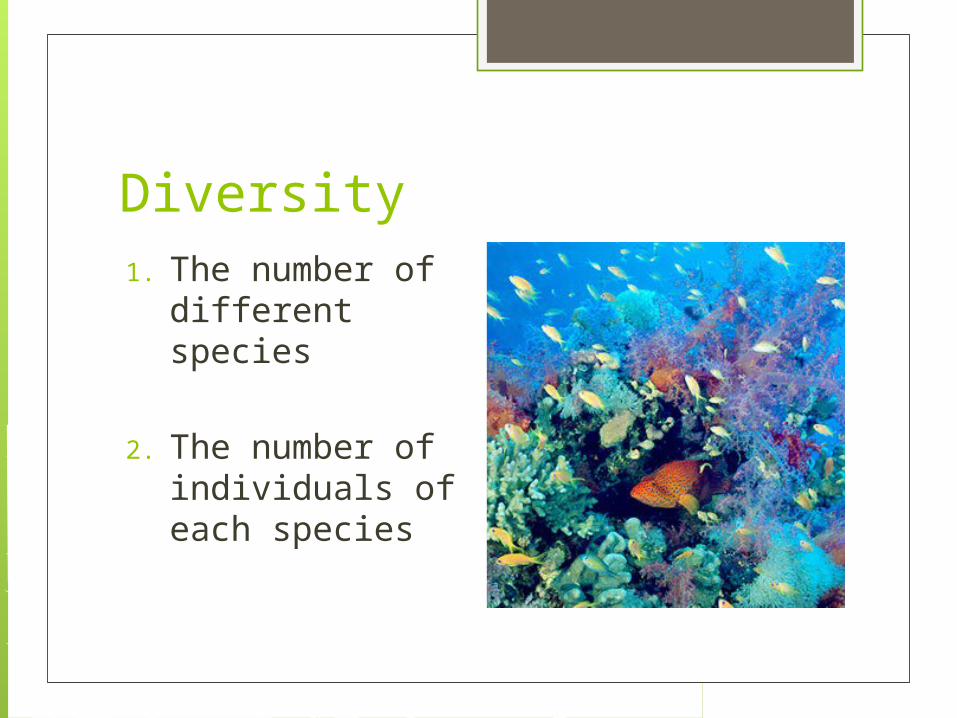
Diversity1. The number of
different species
2. The number of individuals of each species

Simpson’s Diversity Index Used to compare
diversity between areas
High value of D implies stable ecosystem
Low value of D implies unstable ecosystem
2.4 – BiomesIB Topics 2.4.1-2.4.2
Topic 2 – The Ecosystem

Biomes A collection of
ecosystems that share similar climactic conditions

Rainforest
Desert Tundra Temperate Forest
Grassland
Prevailing Climate
Location
Sun Exposure
Precipitation
Limiting Factors

Rainforest
Desert Tundra Temperate Forest
Grassland
Prevailing Climate
Hot, Humid, Rainy
Hot, Dry Cold Seasonal Varied by location
Location Near Equator
Varied, where no
precip
Poles 40-60o N Latitude
Varied, where some precip
Sun Exposure
High Varied, usually
high
Low Medium, Seasonal
Varied
Precipitation
High None Snow Medium, Seasonal
Low
Limiting Factors
Too much precip.
Not enough water
Too cold, permafrost
Seasons Low precip

2.5 – FunctionIB Topics 2.5.1-2.5.7
Topic 2 – The Ecosystem

Photosynthesis

Respiration


Gross Primary Productivity (GPP)
The amount of energy produced by producers
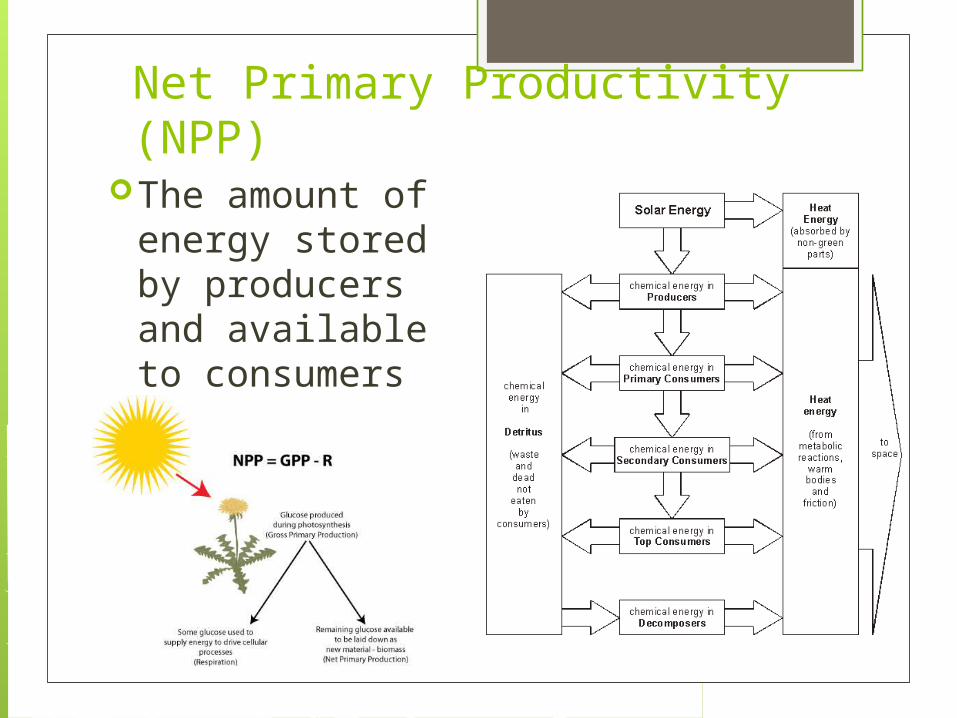
Net Primary Productivity (NPP)The amount of
energy stored by producers and available to consumers

Gross Secondary Productivity (GSP)
The amount of energy consumed by consumers

Net Secondary Productivity (NSP)The amount of
energy stored by consumers and available to the next trophic level


![8[1].1 biotic & abiotic components](https://img.pdfslide.net/doc/110x75/5454c1ceaf79593f778b61fe/811-biotic-abiotic-components.jpg)