Embed Size (px)
Citation preview
1
Vocus Group | vocusgroup.com.au
22 FEBRUARY 2017
THE MANAGER
COMPANY ANNOUNCEMENTS OFFICE
AUSTRALIAN SECURITIES EXCHANGE
4TH FLOOR, 20 BRIDGE ST
SYDNEY NSW 2000
ELECTRONIC LODGEMENT
DEAR SIR/MADAM,
FY17 HALF YEAR RESULTS
Vocus Group (ASX: VOC) today releases its financial results for the half year ended 31 December 2016. Please find attached an Appendix 4D half year report.
The Company will conduct an investor briefing commencing at 9.30am this morning. The briefing will be webcast and can be accessed through the Company’s website at www.vocusgroup.com.au. The investor briefing pack is attached to this announcement.
YOURS FAITHFULLY,
ASHE-LEE JEGATHESAN
GROUP GENERAL COUNSEL & COMPANY SECRETARY
For
per
sona
l use
onl
y

Vocus Group Limited Appendix 4D Half-year report
1. Company details Name of entity: Vocus Group Limited ABN: 96 084 115 499 Reporting period: For the half-year ended 31 December 2016 Previous period: For the half-year ended 31 December 2015
2. Results for announcement to the market $'000 Revenues from ordinary activities up 403.9% to 888,241 Underlying EBITDA * up 200.8% to 187,248 Profit from ordinary activities after tax attributable to the owners of Vocus Group Limited
up
94.9%
to
47,181
Profit for the half-year attributable to the owners of Vocus Group Limited up 94.9% to 47,181 Underlying net profit after tax ** up 235.6% to 91,854 31 Dec 2016 31 Dec 2015 Cents Cents Basic earnings per share 7.72 10.58 Diluted earnings per share 7.71 10.56 Underlying diluted earnings per share *** 15.01 11.94 Basic and diluted earnings per share for the half-year ended 31 December 2016 includes the impact of significant items after tax of $44,673,000 (31 December 2015: $3,163,000). Earnings per share for the half year ended 31 December 2015 has been restated for the effect of the 1-for-8.9 rights issue completed in July 2016, in line with AASB 133 'Earnings per share'. Dividends
Amount per
security
Franked amount per
security Cents Cents Final dividend for the year ending 30 June 2016 paid on 4 October 2016 8.0 8.0 Interim dividend for the year ended 30 June 2017 to be paid on 21 April 2017 6.0 6.0 Comments The profit for Vocus after providing for income tax amounted to $47,181,000 (31 December 2015: $24,211,000). The underlying net profit after tax for Vocus amounted to $91,854,000 (31 December 2015: $27,374,000). Further details of the results for the half-year can be found in the 'Review of operations' section of the Directors' report in the attached Half-Year Financial Report and the operating and financial review report released on the ASX. *, **, *** - Definitions and calculations are on the next page
For
per
sona
l use
onl
y
Vocus Group Limited Appendix 4D Half-year report
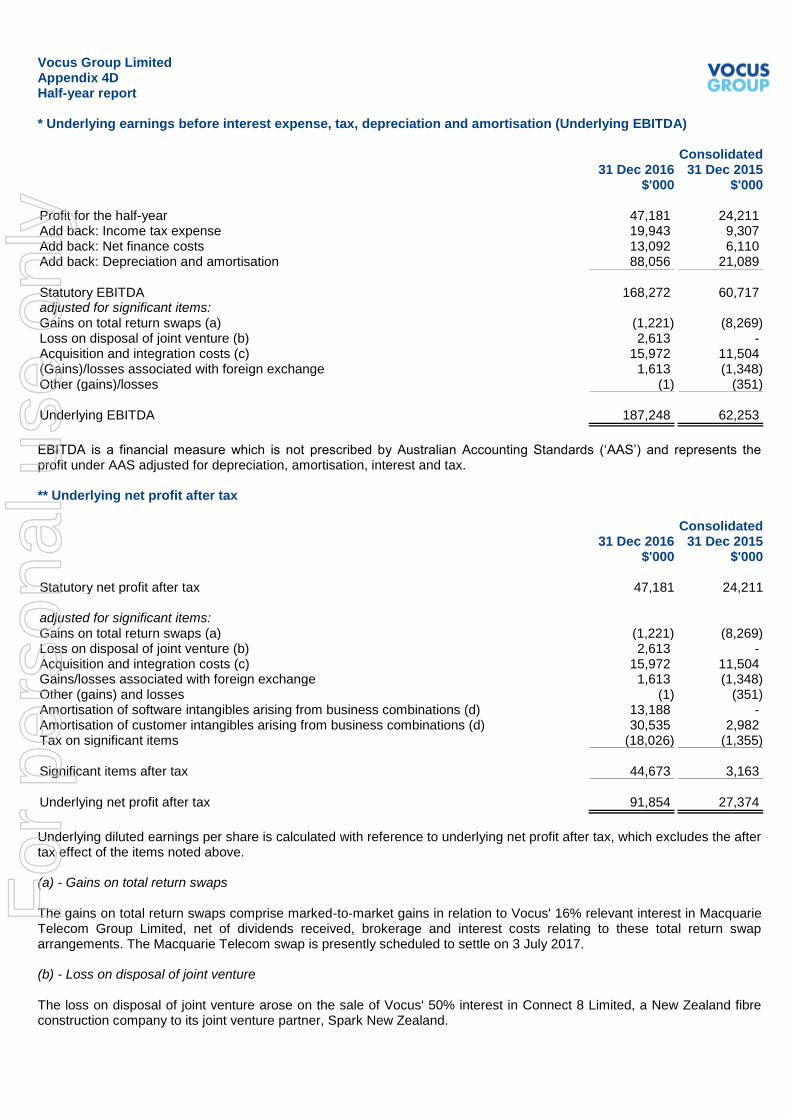
* Underlying earnings before interest expense, tax, depreciation and amortisation (Underlying EBITDA) Consolidated 31 Dec 2016 31 Dec 2015 $'000 $'000 Profit for the half-year 47,181 24,211 Add back: Income tax expense 19,943 9,307 Add back: Net finance costs 13,092 6,110 Add back: Depreciation and amortisation 88,056 21,089
Statutory EBITDA 168,272 60,717 adjusted for significant items: Gains on total return swaps (a) (1,221) (8,269) Loss on disposal of joint venture (b) 2,613 - Acquisition and integration costs (c) 15,972 11,504 (Gains)/losses associated with foreign exchange 1,613 (1,348) Other (gains)/losses (1) (351) Underlying EBITDA 187,248 62,253
EBITDA is a financial measure which is not prescribed by Australian Accounting Standards (‘AAS’) and represents the profit under AAS adjusted for depreciation, amortisation, interest and tax. ** Underlying net profit after tax Consolidated 31 Dec 2016 31 Dec 2015 $'000 $'000 Statutory net profit after tax 47,181 24,211 adjusted for significant items: Gains on total return swaps (a) (1,221) (8,269) Loss on disposal of joint venture (b) 2,613 - Acquisition and integration costs (c) 15,972 11,504 Gains/losses associated with foreign exchange 1,613 (1,348) Other (gains) and losses (1) (351) Amortisation of software intangibles arising from business combinations (d) 13,188 - Amortisation of customer intangibles arising from business combinations (d) 30,535 2,982 Tax on significant items (18,026) (1,355)
Significant items after tax 44,673 3,163
Underlying net profit after tax 91,854 27,374
Underlying diluted earnings per share is calculated with reference to underlying net profit after tax, which excludes the after tax effect of the items noted above. (a) - Gains on total return swaps The gains on total return swaps comprise marked-to-market gains in relation to Vocus' 16% relevant interest in Macquarie Telecom Group Limited, net of dividends received, brokerage and interest costs relating to these total return swap arrangements. The Macquarie Telecom swap is presently scheduled to settle on 3 July 2017. (b) - Loss on disposal of joint venture The loss on disposal of joint venture arose on the sale of Vocus' 50% interest in Connect 8 Limited, a New Zealand fibre construction company to its joint venture partner, Spark New Zealand.
For
per
sona
l use
onl
y

Vocus Group Limited Appendix 4D Half-year report
(c) - Acquisition and integration costs Acquisition and integration costs for the half-year ended 31 December 2016 primarily comprise legal, professional services and other costs relating to the acquisition and integration of Amcom, M2 and Nextgen. The Amcom and M2 transactions completed during the year ended 30 June 2016, while Nextgen was acquired in October 2016. Acquisition and integration costs for the prior corresponding period primarily relate to the Amcom acquisition which completed on 8 July 2015. (d) - Amortisation of intangibles arising on business combinations This refers to amortisation expense incurred in relation to intangible assets recognised on acquisition. These include customer intangibles and software assets. The intangible assets at 31 December 2016 totalled $322,042,000 for customer intangibles and $83,520,000 for software intangibles (30 June 2016: $350,166,000 for customer intangibles and $96,870,000 for software intangibles), which have effective lives between 4 and 15 years. The increase is due to acquisitions during the year ended 30 June 2016 and the half-year ended 31 December 2016.
3. Net tangible assets 31 Dec 2016 30 June 2015 Cents Cents Net tangible assets per ordinary security 6.53 (110.31)
The change in net tangible assets per ordinary security has arisen as part of Vocus' acquisition of Nextgen Networks during the half-year ended 31 December 2016.
4. Control gained over entities Name of entities (or group of entities) Nextgen Networks Date control gained 26 October 2016 The contribution of Nextgen Networks to the Group's profit before income tax was $1,334,000 for the period from acquisition to 31 December 2016.
5. Dividend reinvestment plans The following dividend or distribution plans are in operation: The Vocus Dividend Reinvestment Plan (DRP) allows shareholders to receive their dividends in the form of Vocus shares and will be settled via the issue of new ordinary shares in the Company. The issue price will be the volume weighted average price, in aggregate, over the five trading days commencing on and including the next trading day after the dividend record date, being 5 April 2017 to 12 April 2017, less a discount of 1.5%. The last date(s) for receipt of election notices for the dividend or distribution plans: 5 April 2017
6. Audit qualification or review The financial statements were subject to a review by the Group's auditors and an unmodified review opinion has been issued.
For
per
sona
l use
onl
y

Vocus Group Limited Appendix 4D Half-year report
7. Attachments The Half-Year Financial Report of Vocus Group Limited for the half-year ended 31 December 2016 is attached.
8. Signed Signed ___________________________ Date: 22 February 2017 David Spence Chairman Sydney
For
per
sona
l use
onl
y
Vocus Group Limited
(Formerly known as Vocus Communications Limited)
ABN 96 084 115 499
Half-Year Financial Report - 31 December 2016
For
per
sona
l use
onl
y
Vocus Group Limited Contents 31 December 2016
1
Directors' report 2 Auditor's independence declaration 6 Statement of profit or loss and other comprehensive income 7 Statement of financial position 8 Statement of changes in equity 9 Statement of cash flows 10 Notes to the financial statements 11 Directors' declaration 28 Independent auditor's review report to the members of Vocus Group Limited 29
For
per
sona
l use
onl
y
Vocus Group Limited Directors' report 31 December 2016
2
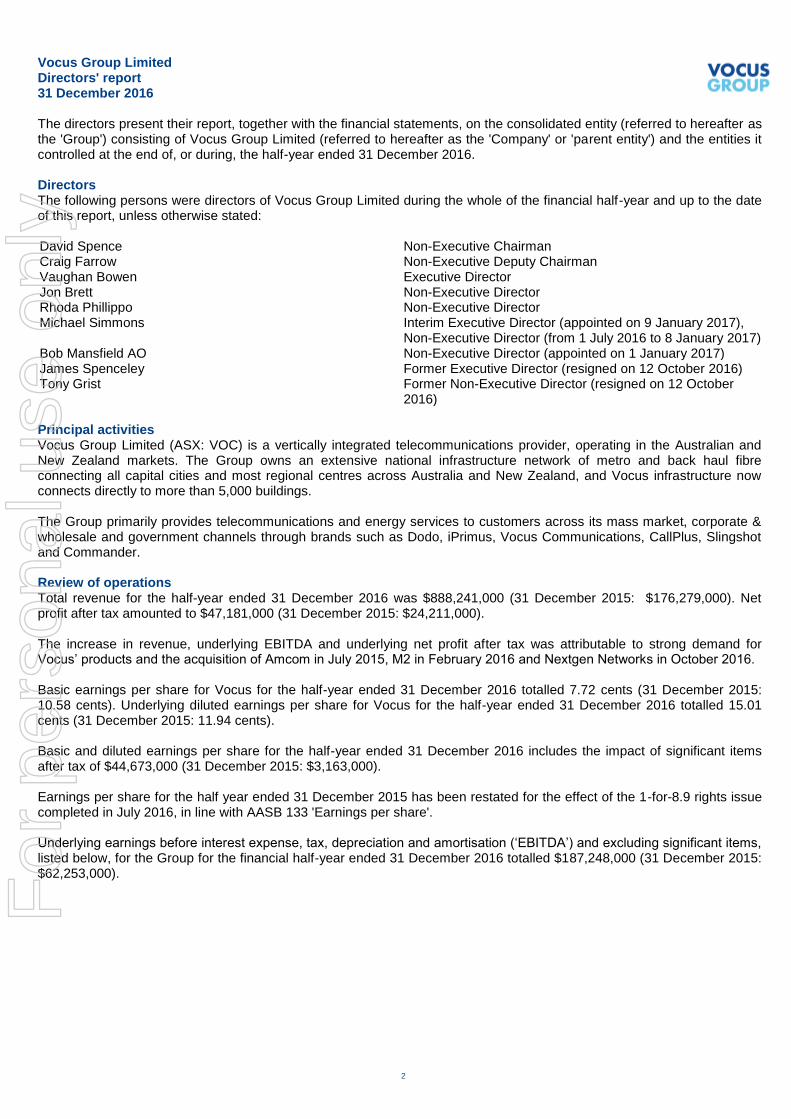
The directors present their report, together with the financial statements, on the consolidated entity (referred to hereafter as the 'Group') consisting of Vocus Group Limited (referred to hereafter as the 'Company' or 'parent entity') and the entities it controlled at the end of, or during, the half-year ended 31 December 2016. Directors The following persons were directors of Vocus Group Limited during the whole of the financial half-year and up to the date of this report, unless otherwise stated: David Spence Non-Executive Chairman Craig Farrow Non-Executive Deputy Chairman Vaughan Bowen Executive Director Jon Brett Non-Executive Director Rhoda Phillippo Non-Executive Director Michael Simmons Interim Executive Director (appointed on 9 January 2017),
Non-Executive Director (from 1 July 2016 to 8 January 2017) Bob Mansfield AO Non-Executive Director (appointed on 1 January 2017) James Spenceley Former Executive Director (resigned on 12 October 2016) Tony Grist Former Non-Executive Director (resigned on 12 October
2016) Principal activities Vocus Group Limited (ASX: VOC) is a vertically integrated telecommunications provider, operating in the Australian and New Zealand markets. The Group owns an extensive national infrastructure network of metro and back haul fibre connecting all capital cities and most regional centres across Australia and New Zealand, and Vocus infrastructure now connects directly to more than 5,000 buildings. The Group primarily provides telecommunications and energy services to customers across its mass market, corporate & wholesale and government channels through brands such as Dodo, iPrimus, Vocus Communications, CallPlus, Slingshot and Commander. Review of operations Total revenue for the half-year ended 31 December 2016 was $888,241,000 (31 December 2015: $176,279,000). Net profit after tax amounted to $47,181,000 (31 December 2015: $24,211,000). The increase in revenue, underlying EBITDA and underlying net profit after tax was attributable to strong demand for Vocus’ products and the acquisition of Amcom in July 2015, M2 in February 2016 and Nextgen Networks in October 2016. Basic earnings per share for Vocus for the half-year ended 31 December 2016 totalled 7.72 cents (31 December 2015: 10.58 cents). Underlying diluted earnings per share for Vocus for the half-year ended 31 December 2016 totalled 15.01 cents (31 December 2015: 11.94 cents). Basic and diluted earnings per share for the half-year ended 31 December 2016 includes the impact of significant items after tax of $44,673,000 (31 December 2015: $3,163,000). Earnings per share for the half year ended 31 December 2015 has been restated for the effect of the 1-for-8.9 rights issue completed in July 2016, in line with AASB 133 'Earnings per share'. Underlying earnings before interest expense, tax, depreciation and amortisation (‘EBITDA’) and excluding significant items, listed below, for the Group for the financial half-year ended 31 December 2016 totalled $187,248,000 (31 December 2015: $62,253,000). F
or p
erso
nal u
se o
nly
Vocus Group Limited Directors' report 31 December 2016
3
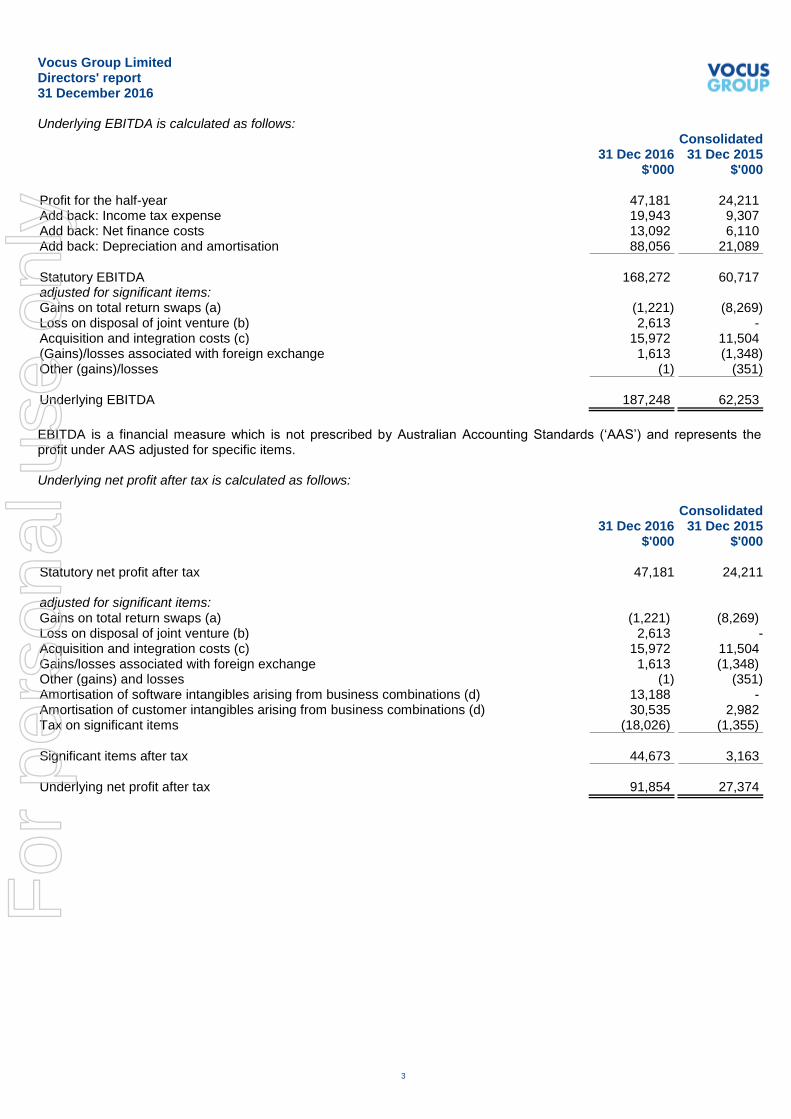
Underlying EBITDA is calculated as follows: Consolidated 31 Dec 2016 31 Dec 2015 $'000 $'000 Profit for the half-year 47,181 24,211 Add back: Income tax expense 19,943 9,307 Add back: Net finance costs 13,092 6,110 Add back: Depreciation and amortisation 88,056 21,089
Statutory EBITDA 168,272 60,717 adjusted for significant items: Gains on total return swaps (a) (1,221) (8,269) Loss on disposal of joint venture (b) 2,613 - Acquisition and integration costs (c) 15,972 11,504 (Gains)/losses associated with foreign exchange 1,613 (1,348) Other (gains)/losses (1) (351)
Underlying EBITDA 187,248 62,253
EBITDA is a financial measure which is not prescribed by Australian Accounting Standards (‘AAS’) and represents the profit under AAS adjusted for specific items. Underlying net profit after tax is calculated as follows: Consolidated 31 Dec 2016 31 Dec 2015 $'000 $'000 Statutory net profit after tax 47,181 24,211 adjusted for significant items: Gains on total return swaps (a) (1,221) (8,269) Loss on disposal of joint venture (b) 2,613 - Acquisition and integration costs (c) 15,972 11,504 Gains/losses associated with foreign exchange 1,613 (1,348) Other (gains) and losses (1) (351) Amortisation of software intangibles arising from business combinations (d) 13,188 - Amortisation of customer intangibles arising from business combinations (d) 30,535 2,982 Tax on significant items (18,026) (1,355)
Significant items after tax 44,673 3,163 Underlying net profit after tax 91,854 27,374
For
per
sona
l use
onl
y
Vocus Group Limited Directors' report 31 December 2016
4
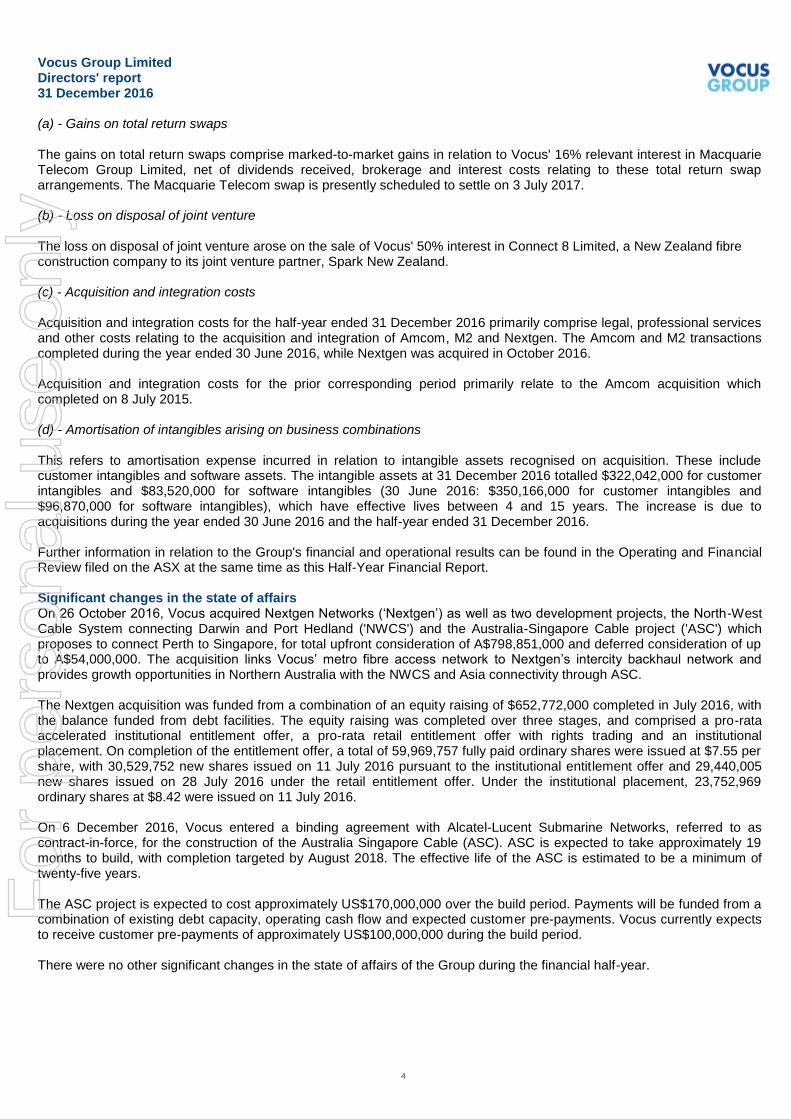
(a) - Gains on total return swaps The gains on total return swaps comprise marked-to-market gains in relation to Vocus' 16% relevant interest in Macquarie Telecom Group Limited, net of dividends received, brokerage and interest costs relating to these total return swap arrangements. The Macquarie Telecom swap is presently scheduled to settle on 3 July 2017. (b) - Loss on disposal of joint venture The loss on disposal of joint venture arose on the sale of Vocus' 50% interest in Connect 8 Limited, a New Zealand fibre construction company to its joint venture partner, Spark New Zealand. (c) - Acquisition and integration costs Acquisition and integration costs for the half-year ended 31 December 2016 primarily comprise legal, professional services and other costs relating to the acquisition and integration of Amcom, M2 and Nextgen. The Amcom and M2 transactions completed during the year ended 30 June 2016, while Nextgen was acquired in October 2016. Acquisition and integration costs for the prior corresponding period primarily relate to the Amcom acquisition which completed on 8 July 2015. (d) - Amortisation of intangibles arising on business combinations This refers to amortisation expense incurred in relation to intangible assets recognised on acquisition. These include customer intangibles and software assets. The intangible assets at 31 December 2016 totalled $322,042,000 for customer intangibles and $83,520,000 for software intangibles (30 June 2016: $350,166,000 for customer intangibles and $96,870,000 for software intangibles), which have effective lives between 4 and 15 years. The increase is due to acquisitions during the year ended 30 June 2016 and the half-year ended 31 December 2016. Further information in relation to the Group's financial and operational results can be found in the Operating and Financial Review filed on the ASX at the same time as this Half-Year Financial Report. Significant changes in the state of affairs On 26 October 2016, Vocus acquired Nextgen Networks (‘Nextgen’) as well as two development projects, the North-West Cable System connecting Darwin and Port Hedland ('NWCS') and the Australia-Singapore Cable project ('ASC') which proposes to connect Perth to Singapore, for total upfront consideration of A$798,851,000 and deferred consideration of up to A$54,000,000. The acquisition links Vocus’ metro fibre access network to Nextgen’s intercity backhaul network and provides growth opportunities in Northern Australia with the NWCS and Asia connectivity through ASC. The Nextgen acquisition was funded from a combination of an equity raising of $652,772,000 completed in July 2016, with the balance funded from debt facilities. The equity raising was completed over three stages, and comprised a pro-rata accelerated institutional entitlement offer, a pro-rata retail entitlement offer with rights trading and an institutional placement. On completion of the entitlement offer, a total of 59,969,757 fully paid ordinary shares were issued at $7.55 per share, with 30,529,752 new shares issued on 11 July 2016 pursuant to the institutional entitlement offer and 29,440,005 new shares issued on 28 July 2016 under the retail entitlement offer. Under the institutional placement, 23,752,969 ordinary shares at $8.42 were issued on 11 July 2016. On 6 December 2016, Vocus entered a binding agreement with Alcatel-Lucent Submarine Networks, referred to as contract-in-force, for the construction of the Australia Singapore Cable (ASC). ASC is expected to take approximately 19 months to build, with completion targeted by August 2018. The effective life of the ASC is estimated to be a minimum of twenty-five years. The ASC project is expected to cost approximately US$170,000,000 over the build period. Payments will be funded from a combination of existing debt capacity, operating cash flow and expected customer pre-payments. Vocus currently expects to receive customer pre-payments of approximately US$100,000,000 during the build period. There were no other significant changes in the state of affairs of the Group during the financial half-year.
For
per
sona
l use
onl
y
Vocus Group Limited Directors' report 31 December 2016
5
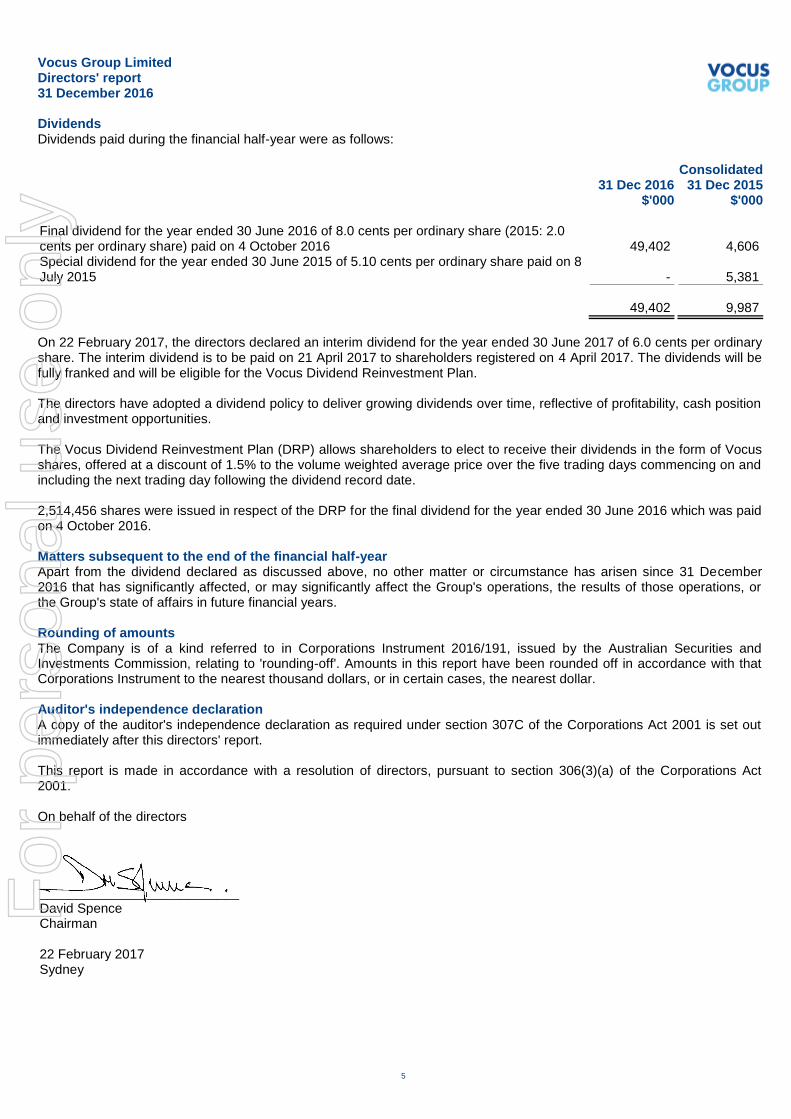
Dividends Dividends paid during the financial half-year were as follows: Consolidated 31 Dec 2016 31 Dec 2015 $'000 $'000 Final dividend for the year ended 30 June 2016 of 8.0 cents per ordinary share (2015: 2.0 cents per ordinary share) paid on 4 October 2016
49,402
4,606
Special dividend for the year ended 30 June 2015 of 5.10 cents per ordinary share paid on 8 July 2015
-
5,381
49,402 9,987
On 22 February 2017, the directors declared an interim dividend for the year ended 30 June 2017 of 6.0 cents per ordinary share. The interim dividend is to be paid on 21 April 2017 to shareholders registered on 4 April 2017. The dividends will be fully franked and will be eligible for the Vocus Dividend Reinvestment Plan. The directors have adopted a dividend policy to deliver growing dividends over time, reflective of profitability, cash position and investment opportunities. The Vocus Dividend Reinvestment Plan (DRP) allows shareholders to elect to receive their dividends in the form of Vocus shares, offered at a discount of 1.5% to the volume weighted average price over the five trading days commencing on and including the next trading day following the dividend record date. 2,514,456 shares were issued in respect of the DRP for the final dividend for the year ended 30 June 2016 which was paid on 4 October 2016. Matters subsequent to the end of the financial half-year Apart from the dividend declared as discussed above, no other matter or circumstance has arisen since 31 December 2016 that has significantly affected, or may significantly affect the Group's operations, the results of those operations, or the Group's state of affairs in future financial years. Rounding of amounts The Company is of a kind referred to in Corporations Instrument 2016/191, issued by the Australian Securities and Investments Commission, relating to 'rounding-off'. Amounts in this report have been rounded off in accordance with that Corporations Instrument to the nearest thousand dollars, or in certain cases, the nearest dollar. Auditor's independence declaration A copy of the auditor's independence declaration as required under section 307C of the Corporations Act 2001 is set out immediately after this directors' report. This report is made in accordance with a resolution of directors, pursuant to section 306(3)(a) of the Corporations Act 2001. On behalf of the directors ___________________________ David Spence Chairman 22 February 2017 Sydney
For
per
sona
l use
onl
y

Liability limited by a scheme approved under Professional Standards Legislation.
Member of Deloitte Touche Tohmatsu Limited
6
Deloitte Touche Tohmatsu
ABN 74 490 121 060
Grosvenor Place
225 George Street
Sydney NSW 2000
PO Box N250 Grosvenor Place
Sydney NSW 1220 Australia
Tel: +61 2 9322 7000
Fax: +61 9322 7001
www.deloitte.com.au
22 February 2017 Dear Board Members
Vocus Group Limited In accordance with section 307C of the Corporations Act 2001, I am pleased to provide the following declaration of independence to the directors of Vocus Group Limited. As lead audit partner for the review of the financial statements of Vocus Group Limited for the half-year ended 31 December 2016, I declare that to the best of my knowledge and belief, there have been no contraventions of:
(i) the auditor independence requirements of the Corporations Act 2001 in relation to the review; and
(ii) any applicable code of professional conduct in relation to the review. Yours sincerely
DELOITTE TOUCHE TOHMATSU
Don Pasquariello Partner Chartered Accountants
The Board of Directors Vocus Group Limited Level 10, 452 Flinders Street Melbourne VIC 3000
For
per
sona
l use
onl
y
Vocus Group Limited Statement of profit or loss and other comprehensive income For the half-year ended 31 December 2016
Consolidated Note 31 Dec 2016 31 Dec 2015 $'000 $'000
The above statement of profit or loss and other comprehensive income should be read in conjunction with the accompanying notes
7
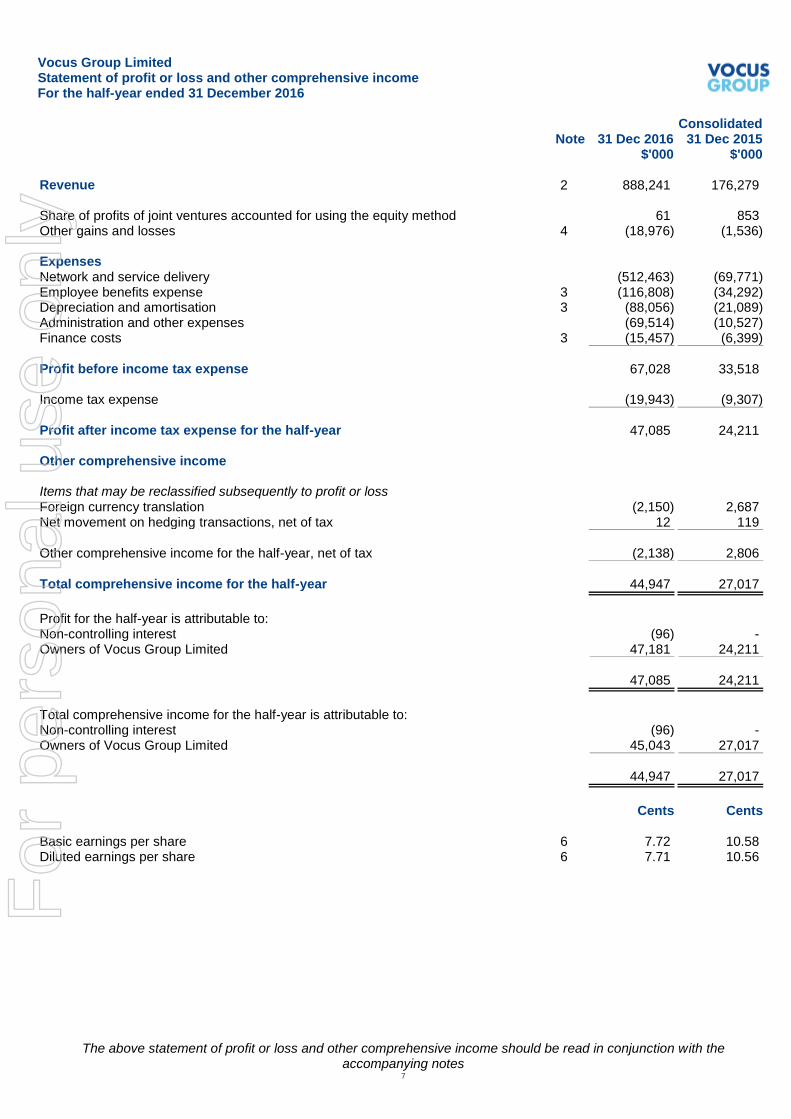
Revenue 2 888,241 176,279 Share of profits of joint ventures accounted for using the equity method 61 853 Other gains and losses 4 (18,976) (1,536) Expenses Network and service delivery (512,463) (69,771) Employee benefits expense 3 (116,808) (34,292) Depreciation and amortisation 3 (88,056) (21,089) Administration and other expenses (69,514) (10,527) Finance costs 3 (15,457) (6,399)
Profit before income tax expense 67,028 33,518 Income tax expense (19,943) (9,307)
Profit after income tax expense for the half-year 47,085 24,211 Other comprehensive income Items that may be reclassified subsequently to profit or loss Foreign currency translation (2,150) 2,687 Net movement on hedging transactions, net of tax 12 119
Other comprehensive income for the half-year, net of tax (2,138) 2,806
Total comprehensive income for the half-year 44,947 27,017
Profit for the half-year is attributable to: Non-controlling interest (96) - Owners of Vocus Group Limited 47,181 24,211
47,085 24,211
Total comprehensive income for the half-year is attributable to: Non-controlling interest (96) - Owners of Vocus Group Limited 45,043 27,017
44,947 27,017
Cents Cents Basic earnings per share 6 7.72 10.58 Diluted earnings per share 6 7.71 10.56
For
per
sona
l use
onl
y
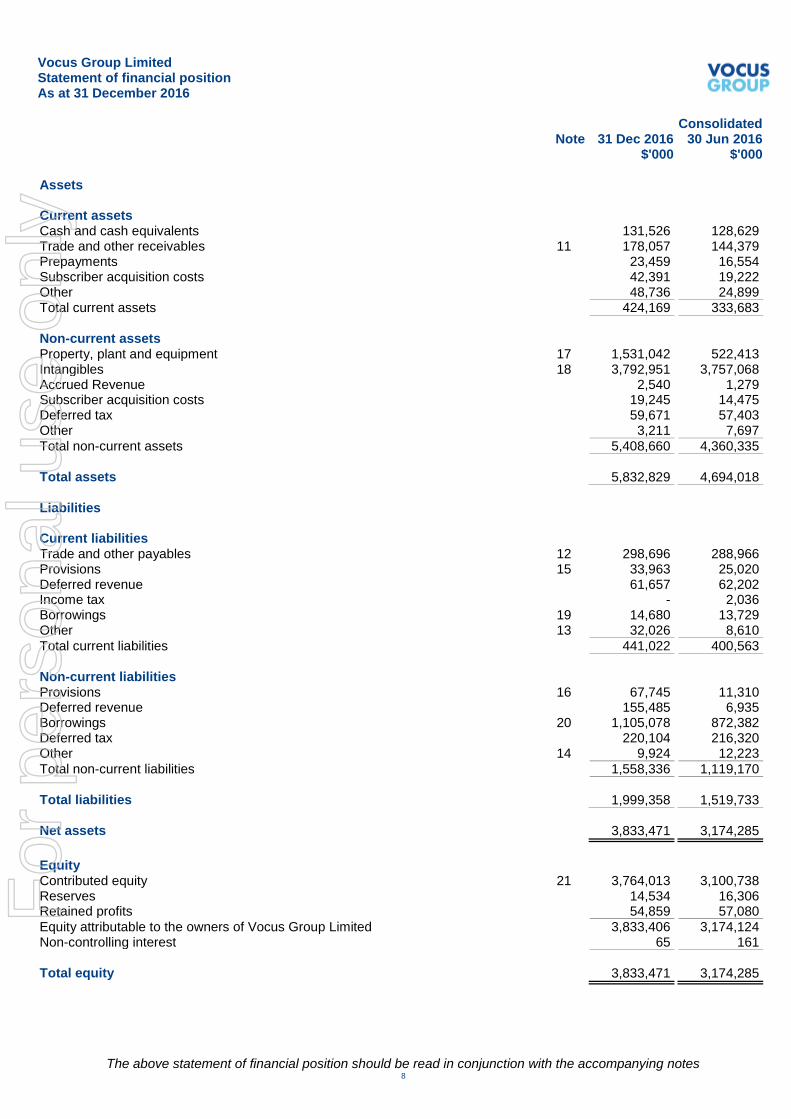
Vocus Group Limited Statement of financial position As at 31 December 2016
Consolidated Note 31 Dec 2016 30 Jun 2016 $'000 $'000
The above statement of financial position should be read in conjunction with the accompanying notes 8
Assets Current assets Cash and cash equivalents 131,526 128,629 Trade and other receivables 11 178,057 144,379 Prepayments 23,459 16,554 Subscriber acquisition costs 42,391 19,222 Other 48,736 24,899 Total current assets 424,169 333,683
Non-current assets Property, plant and equipment 17 1,531,042 522,413 Intangibles 18 3,792,951 3,757,068 Accrued Revenue 2,540 1,279 Subscriber acquisition costs 19,245 14,475 Deferred tax 59,671 57,403 Other 3,211 7,697
Total non-current assets 5,408,660 4,360,335
Total assets 5,832,829 4,694,018
Liabilities Current liabilities Trade and other payables 12 298,696 288,966 Provisions 15 33,963 25,020 Deferred revenue 61,657 62,202 Income tax - 2,036 Borrowings 19 14,680 13,729 Other 13 32,026 8,610
Total current liabilities 441,022 400,563
Non-current liabilities Provisions 16 67,745 11,310 Deferred revenue 155,485 6,935 Borrowings 20 1,105,078 872,382 Deferred tax 220,104 216,320 Other 14 9,924 12,223
Total non-current liabilities 1,558,336 1,119,170
Total liabilities 1,999,358 1,519,733 Net assets 3,833,471 3,174,285
Equity Contributed equity 21 3,764,013 3,100,738 Reserves 14,534 16,306 Retained profits 54,859 57,080
Equity attributable to the owners of Vocus Group Limited 3,833,406 3,174,124 Non-controlling interest 65 161
Total equity 3,833,471 3,174,285
For
per
sona
l use
onl
y
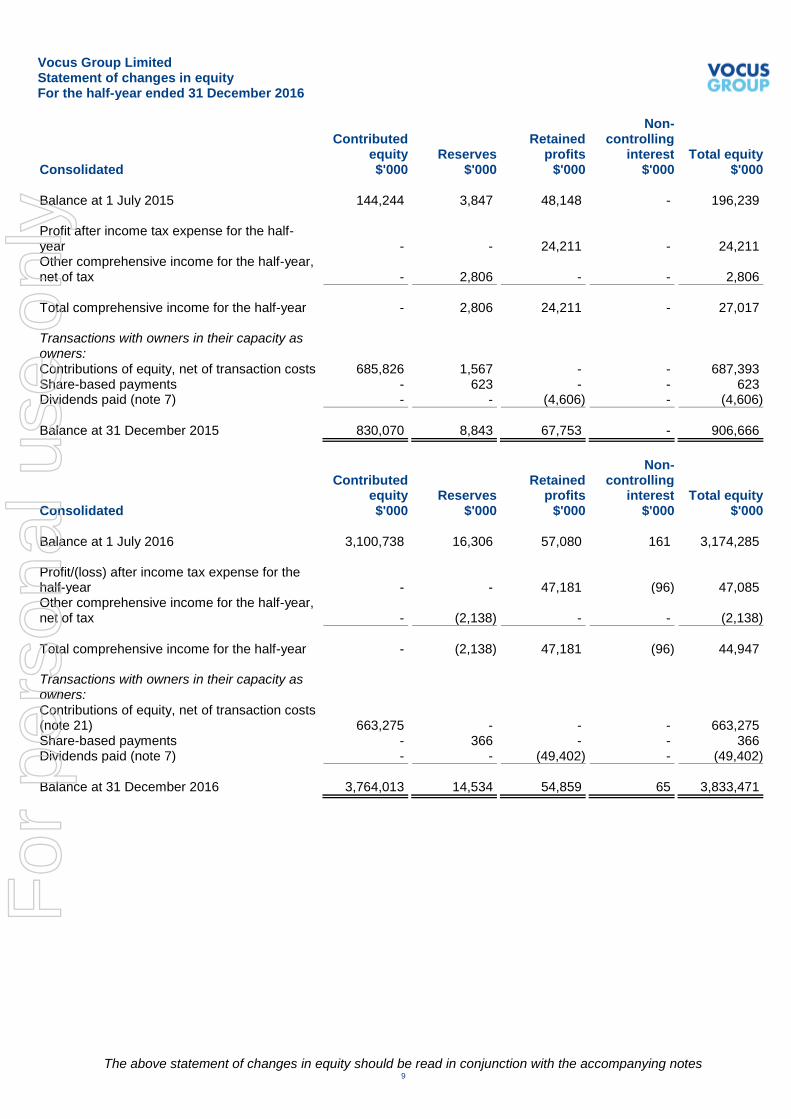
Vocus Group Limited Statement of changes in equity For the half-year ended 31 December 2016
The above statement of changes in equity should be read in conjunction with the accompanying notes 9
Contributed
Retained Non-
controlling
Total equity equity Reserves profits interest Consolidated $'000 $'000 $'000 $'000 $'000 Balance at 1 July 2015 144,244 3,847 48,148 - 196,239 Profit after income tax expense for the half-year
-
-
24,211
-
24,211
Other comprehensive income for the half-year, net of tax
-
2,806
-
-
2,806
Total comprehensive income for the half-year - 2,806 24,211 - 27,017 Transactions with owners in their capacity as owners:
Contributions of equity, net of transaction costs 685,826 1,567 - - 687,393 Share-based payments - 623 - - 623 Dividends paid (note 7) - - (4,606) - (4,606)
Balance at 31 December 2015 830,070 8,843 67,753 - 906,666
Contributed
Retained Non-
controlling
Total equity equity Reserves profits interest Consolidated $'000 $'000 $'000 $'000 $'000 Balance at 1 July 2016 3,100,738 16,306 57,080 161 3,174,285 Profit/(loss) after income tax expense for the half-year
-
-
47,181
(96)
47,085
Other comprehensive income for the half-year, net of tax
-
(2,138)
-
-
(2,138)
Total comprehensive income for the half-year - (2,138) 47,181 (96) 44,947 Transactions with owners in their capacity as owners:
Contributions of equity, net of transaction costs (note 21)
663,275
-
-
-
663,275
Share-based payments - 366 - - 366 Dividends paid (note 7) - - (49,402) - (49,402) Balance at 31 December 2016 3,764,013 14,534 54,859 65 3,833,471
For
per
sona
l use
onl
y
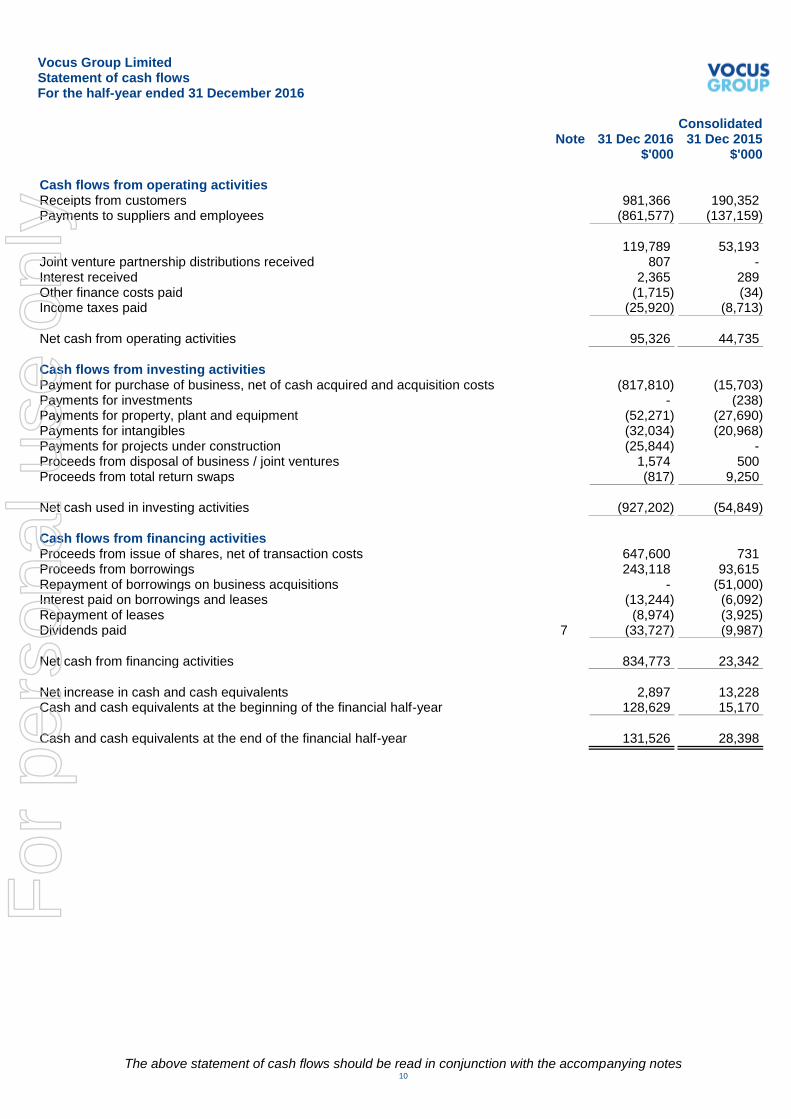
Vocus Group Limited Statement of cash flows For the half-year ended 31 December 2016
Consolidated Note 31 Dec 2016 31 Dec 2015 $'000 $'000
The above statement of cash flows should be read in conjunction with the accompanying notes 10
Cash flows from operating activities Receipts from customers 981,366 190,352 Payments to suppliers and employees (861,577) (137,159)
119,789 53,193 Joint venture partnership distributions received 807 - Interest received 2,365 289 Other finance costs paid (1,715) (34) Income taxes paid (25,920) (8,713)
Net cash from operating activities 95,326 44,735
Cash flows from investing activities Payment for purchase of business, net of cash acquired and acquisition costs (817,810) (15,703) Payments for investments - (238) Payments for property, plant and equipment (52,271) (27,690) Payments for intangibles (32,034) (20,968) Payments for projects under construction (25,844) - Proceeds from disposal of business / joint ventures 1,574 500 Proceeds from total return swaps (817) 9,250
Net cash used in investing activities (927,202) (54,849)
Cash flows from financing activities Proceeds from issue of shares, net of transaction costs 647,600 731 Proceeds from borrowings 243,118 93,615 Repayment of borrowings on business acquisitions - (51,000) Interest paid on borrowings and leases (13,244) (6,092) Repayment of leases (8,974) (3,925) Dividends paid 7 (33,727) (9,987)
Net cash from financing activities 834,773 23,342
Net increase in cash and cash equivalents 2,897 13,228 Cash and cash equivalents at the beginning of the financial half-year 128,629 15,170
Cash and cash equivalents at the end of the financial half-year 131,526 28,398
For
per
sona
l use
onl
y
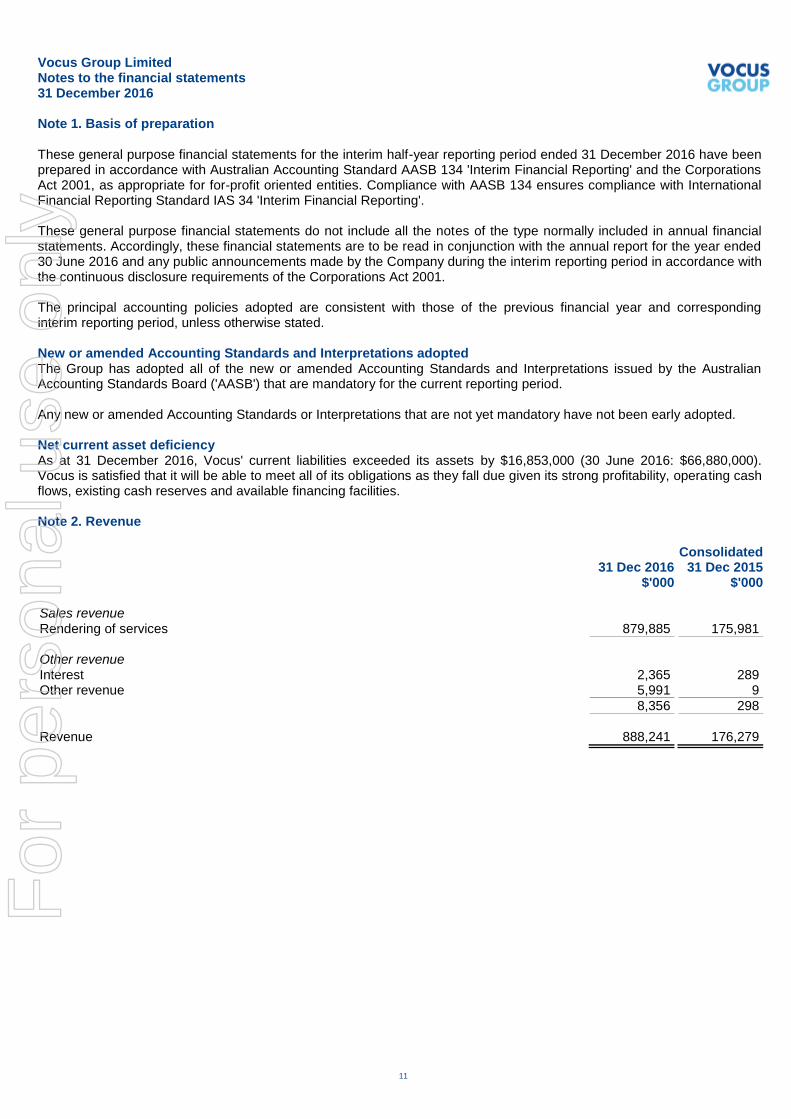
Vocus Group Limited Notes to the financial statements 31 December 2016
11
Note 1. Basis of preparation These general purpose financial statements for the interim half-year reporting period ended 31 December 2016 have been prepared in accordance with Australian Accounting Standard AASB 134 'Interim Financial Reporting' and the Corporations Act 2001, as appropriate for for-profit oriented entities. Compliance with AASB 134 ensures compliance with International Financial Reporting Standard IAS 34 'Interim Financial Reporting'. These general purpose financial statements do not include all the notes of the type normally included in annual financial statements. Accordingly, these financial statements are to be read in conjunction with the annual report for the year ended 30 June 2016 and any public announcements made by the Company during the interim reporting period in accordance with the continuous disclosure requirements of the Corporations Act 2001. The principal accounting policies adopted are consistent with those of the previous financial year and corresponding interim reporting period, unless otherwise stated. New or amended Accounting Standards and Interpretations adopted The Group has adopted all of the new or amended Accounting Standards and Interpretations issued by the Australian Accounting Standards Board ('AASB') that are mandatory for the current reporting period. Any new or amended Accounting Standards or Interpretations that are not yet mandatory have not been early adopted. Net current asset deficiency As at 31 December 2016, Vocus' current liabilities exceeded its assets by $16,853,000 (30 June 2016: $66,880,000). Vocus is satisfied that it will be able to meet all of its obligations as they fall due given its strong profitability, operating cash flows, existing cash reserves and available financing facilities. Note 2. Revenue Consolidated 31 Dec 2016 31 Dec 2015 $'000 $'000 Sales revenue Rendering of services 879,885 175,981
Other revenue Interest 2,365 289 Other revenue 5,991 9
8,356 298
Revenue 888,241 176,279
For
per
sona
l use
onl
y
Vocus Group Limited Notes to the financial statements 31 December 2016
12
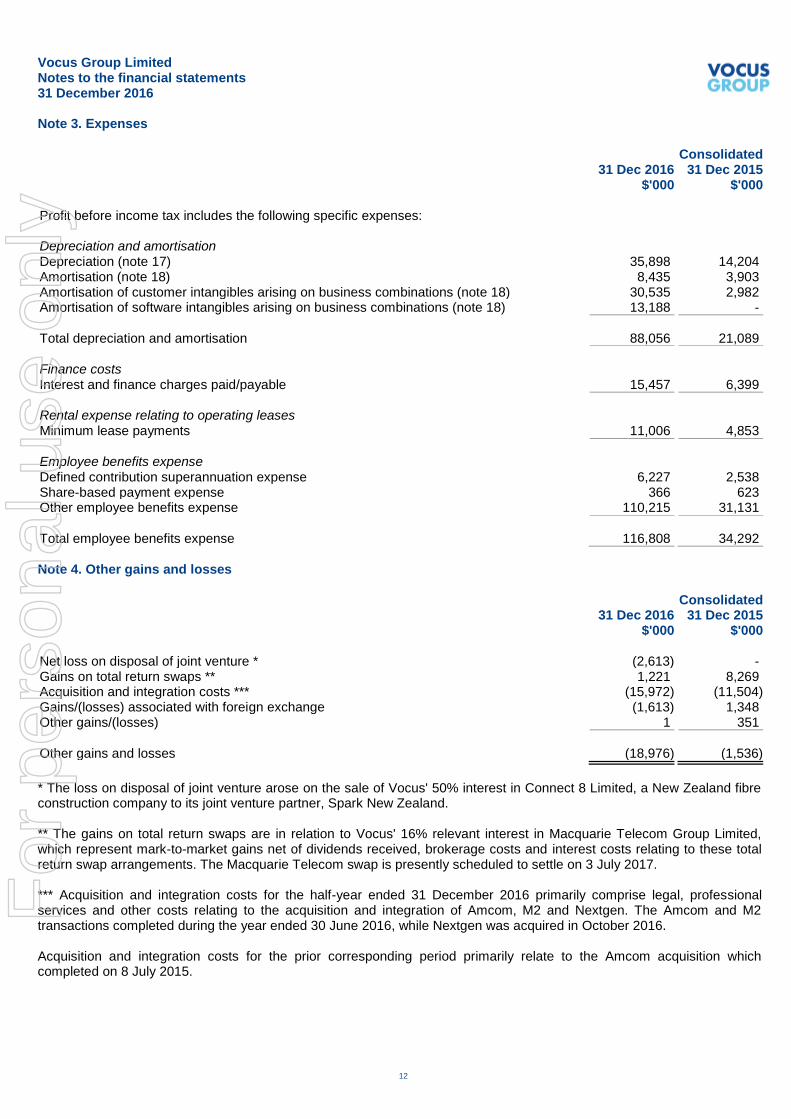
Note 3. Expenses Consolidated 31 Dec 2016 31 Dec 2015 $'000 $'000 Profit before income tax includes the following specific expenses: Depreciation and amortisation Depreciation (note 17) 35,898 14,204 Amortisation (note 18) 8,435 3,903 Amortisation of customer intangibles arising on business combinations (note 18) 30,535 2,982 Amortisation of software intangibles arising on business combinations (note 18) 13,188 -
Total depreciation and amortisation 88,056 21,089
Finance costs Interest and finance charges paid/payable 15,457 6,399
Rental expense relating to operating leases Minimum lease payments 11,006 4,853
Employee benefits expense Defined contribution superannuation expense 6,227 2,538 Share-based payment expense 366 623 Other employee benefits expense 110,215 31,131
Total employee benefits expense 116,808 34,292
Note 4. Other gains and losses Consolidated 31 Dec 2016 31 Dec 2015 $'000 $'000 Net loss on disposal of joint venture * (2,613) - Gains on total return swaps ** 1,221 8,269 Acquisition and integration costs *** (15,972) (11,504) Gains/(losses) associated with foreign exchange (1,613) 1,348 Other gains/(losses) 1 351
Other gains and losses (18,976) (1,536)
* The loss on disposal of joint venture arose on the sale of Vocus' 50% interest in Connect 8 Limited, a New Zealand fibre construction company to its joint venture partner, Spark New Zealand. ** The gains on total return swaps are in relation to Vocus' 16% relevant interest in Macquarie Telecom Group Limited, which represent mark-to-market gains net of dividends received, brokerage costs and interest costs relating to these total return swap arrangements. The Macquarie Telecom swap is presently scheduled to settle on 3 July 2017. *** Acquisition and integration costs for the half-year ended 31 December 2016 primarily comprise legal, professional services and other costs relating to the acquisition and integration of Amcom, M2 and Nextgen. The Amcom and M2 transactions completed during the year ended 30 June 2016, while Nextgen was acquired in October 2016. Acquisition and integration costs for the prior corresponding period primarily relate to the Amcom acquisition which completed on 8 July 2015.
For
per
sona
l use
onl
y
Vocus Group Limited Notes to the financial statements 31 December 2016
13
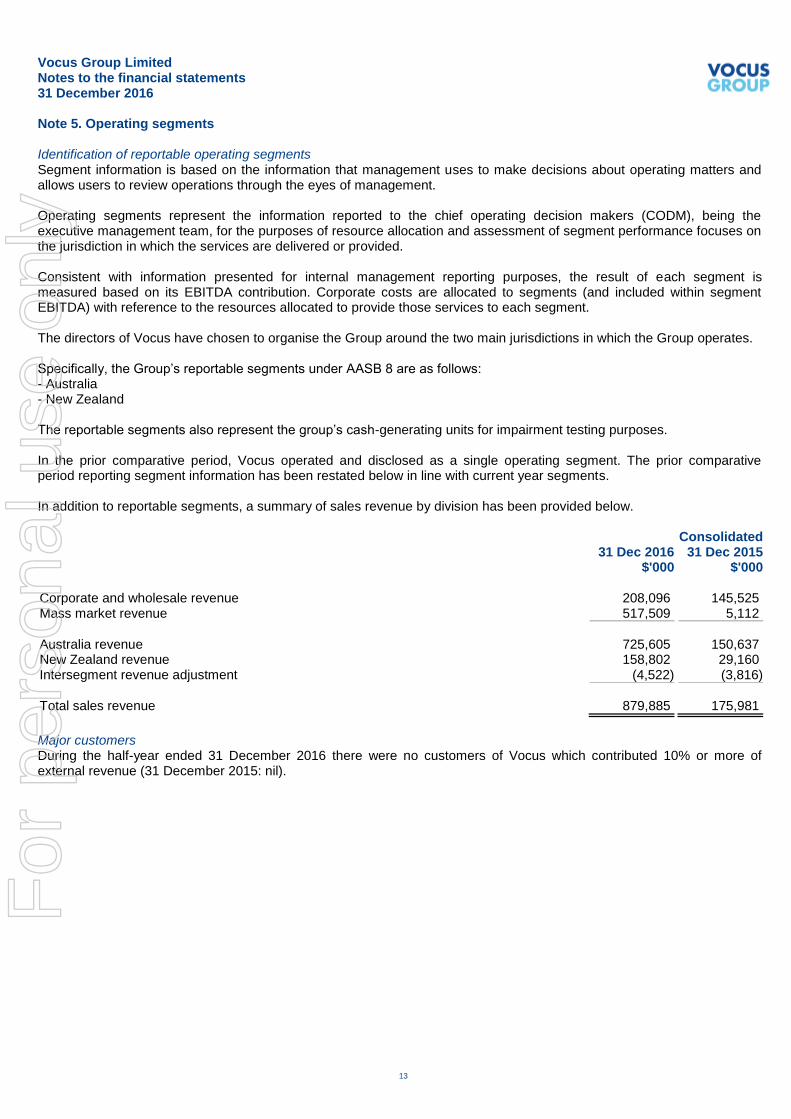
Note 5. Operating segments Identification of reportable operating segments Segment information is based on the information that management uses to make decisions about operating matters and allows users to review operations through the eyes of management. Operating segments represent the information reported to the chief operating decision makers (CODM), being the executive management team, for the purposes of resource allocation and assessment of segment performance focuses on the jurisdiction in which the services are delivered or provided. Consistent with information presented for internal management reporting purposes, the result of each segment is measured based on its EBITDA contribution. Corporate costs are allocated to segments (and included within segment EBITDA) with reference to the resources allocated to provide those services to each segment. The directors of Vocus have chosen to organise the Group around the two main jurisdictions in which the Group operates. Specifically, the Group’s reportable segments under AASB 8 are as follows: - Australia - New Zealand The reportable segments also represent the group’s cash-generating units for impairment testing purposes. In the prior comparative period, Vocus operated and disclosed as a single operating segment. The prior comparative period reporting segment information has been restated below in line with current year segments. In addition to reportable segments, a summary of sales revenue by division has been provided below. Consolidated 31 Dec 2016 31 Dec 2015 $'000 $'000 Corporate and wholesale revenue 208,096 145,525 Mass market revenue 517,509 5,112
Australia revenue 725,605 150,637 New Zealand revenue 158,802 29,160 Intersegment revenue adjustment (4,522) (3,816)
Total sales revenue 879,885 175,981
Major customers During the half-year ended 31 December 2016 there were no customers of Vocus which contributed 10% or more of external revenue (31 December 2015: nil).
For
per
sona
l use
onl
y

Vocus Group Limited Notes to the financial statements 31 December 2016
Note 5. Operating segments (continued)
14
Segment revenues and results New Intersegment Australia Zealand adjustments Total Consolidated - 31 Dec 2016 $'000 $'000 $'000 $'000 Revenue Sales to external customers 725,605 158,802 (4,522) 879,885 Other revenue 5,990 1 - 5,991 Total revenue 731,595 158,803 (4,522) 885,876
EBITDA 141,812 26,460 - 168,272 Depreciation and amortisation (79,618) (8,438) - (88,056) Interest revenue 2,211 154 - 2,365 Finance costs (11,404) (4,053) - (15,457) Non-controlling interest (96) - - (96) Profit before income tax expense 52,905 14,123 - 67,028 Income tax expense (19,943) Profit after income tax expense 47,085
Assets Segment assets 5,049,594 783,235 - 5,832,829 Total assets 5,832,829
Liabilities Segment liabilities 1,660,193 339,165 - 1,999,358 Total liabilities 1,999,358
New Intersegment Australia Zealand adjustment Total Consolidated - 31 Dec 2015 $'000 $'000 $'000 $'000 Revenue Sales to external customers 150,637 29,160 (3,816) 175,981 Other revenue 7 2 - 9 Total revenue 150,644 29,162 (3,816) 175,990
EBITDA 54,106 6,611 - 60,717 Depreciation and amortisation (16,930) (4,159) - (21,089) Interest revenue 272 17 - 289 Finance costs (4,030) (2,369) - (6,399) Profit before income tax expense 33,418 100 - 33,518
Income tax expense (9,307) Profit after income tax expense 24,211
Consolidated - 30 Jun 2016 Assets Segment assets 3,785,829 908,189 - 4,694,018 Total assets 4,694,018
Liabilities Segment liabilities 1,272,796 246,937 - 1,519,733 Total liabilities 1,519,733
For
per
sona
l use
onl
y
Vocus Group Limited Notes to the financial statements 31 December 2016
15
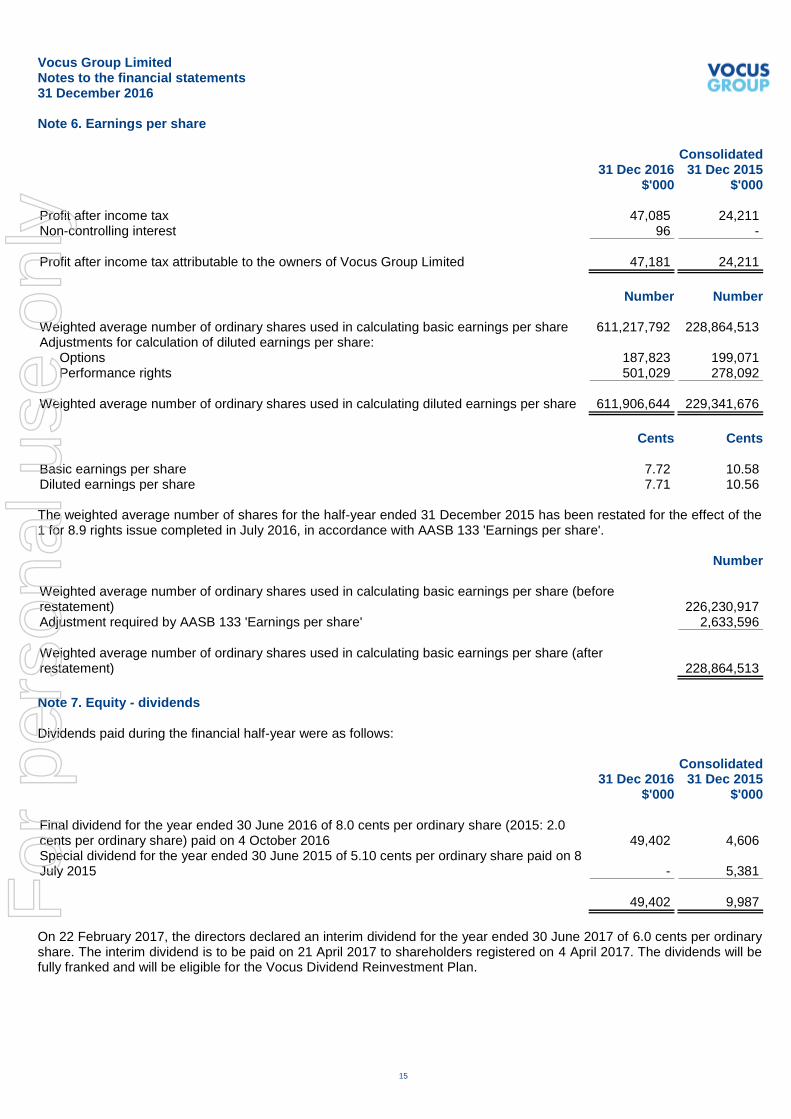
Note 6. Earnings per share Consolidated 31 Dec 2016 31 Dec 2015 $'000 $'000 Profit after income tax 47,085 24,211 Non-controlling interest 96 -
Profit after income tax attributable to the owners of Vocus Group Limited 47,181 24,211
Number Number Weighted average number of ordinary shares used in calculating basic earnings per share 611,217,792 228,864,513 Adjustments for calculation of diluted earnings per share:
Options 187,823 199,071 Performance rights 501,029 278,092
Weighted average number of ordinary shares used in calculating diluted earnings per share 611,906,644 229,341,676
Cents Cents Basic earnings per share 7.72 10.58 Diluted earnings per share 7.71 10.56 The weighted average number of shares for the half-year ended 31 December 2015 has been restated for the effect of the 1 for 8.9 rights issue completed in July 2016, in accordance with AASB 133 'Earnings per share'. Number Weighted average number of ordinary shares used in calculating basic earnings per share (before restatement)
226,230,917
Adjustment required by AASB 133 'Earnings per share' 2,633,596
Weighted average number of ordinary shares used in calculating basic earnings per share (after restatement)
228,864,513
Note 7. Equity - dividends Dividends paid during the financial half-year were as follows: Consolidated 31 Dec 2016 31 Dec 2015 $'000 $'000 Final dividend for the year ended 30 June 2016 of 8.0 cents per ordinary share (2015: 2.0 cents per ordinary share) paid on 4 October 2016
49,402
4,606
Special dividend for the year ended 30 June 2015 of 5.10 cents per ordinary share paid on 8 July 2015
-
5,381
49,402 9,987
On 22 February 2017, the directors declared an interim dividend for the year ended 30 June 2017 of 6.0 cents per ordinary share. The interim dividend is to be paid on 21 April 2017 to shareholders registered on 4 April 2017. The dividends will be fully franked and will be eligible for the Vocus Dividend Reinvestment Plan.
For
per
sona
l use
onl
y
Vocus Group Limited Notes to the financial statements 31 December 2016
Note 7. Equity - dividends (continued)
16
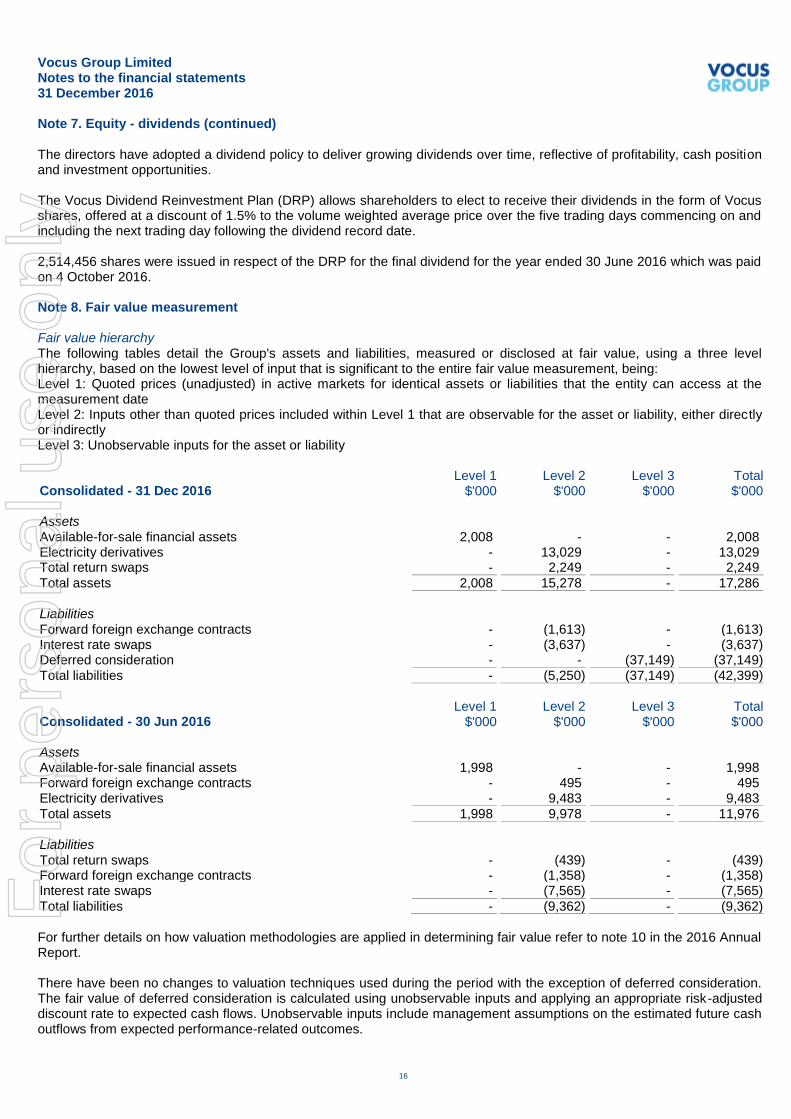
The directors have adopted a dividend policy to deliver growing dividends over time, reflective of profitability, cash position and investment opportunities. The Vocus Dividend Reinvestment Plan (DRP) allows shareholders to elect to receive their dividends in the form of Vocus shares, offered at a discount of 1.5% to the volume weighted average price over the five trading days commencing on and including the next trading day following the dividend record date. 2,514,456 shares were issued in respect of the DRP for the final dividend for the year ended 30 June 2016 which was paid on 4 October 2016. Note 8. Fair value measurement Fair value hierarchy The following tables detail the Group's assets and liabilities, measured or disclosed at fair value, using a three level hierarchy, based on the lowest level of input that is significant to the entire fair value measurement, being: Level 1: Quoted prices (unadjusted) in active markets for identical assets or liabilities that the entity can access at the measurement date Level 2: Inputs other than quoted prices included within Level 1 that are observable for the asset or liability, either directly or indirectly Level 3: Unobservable inputs for the asset or liability Level 1 Level 2 Level 3 Total Consolidated - 31 Dec 2016 $'000 $'000 $'000 $'000 Assets Available-for-sale financial assets 2,008 - - 2,008 Electricity derivatives - 13,029 - 13,029 Total return swaps - 2,249 - 2,249
Total assets 2,008 15,278 - 17,286
Liabilities Forward foreign exchange contracts - (1,613) - (1,613) Interest rate swaps - (3,637) - (3,637) Deferred consideration - - (37,149) (37,149) Total liabilities - (5,250) (37,149) (42,399)
Level 1 Level 2 Level 3 Total Consolidated - 30 Jun 2016 $'000 $'000 $'000 $'000 Assets Available-for-sale financial assets 1,998 - - 1,998 Forward foreign exchange contracts - 495 - 495 Electricity derivatives - 9,483 - 9,483
Total assets 1,998 9,978 - 11,976
Liabilities Total return swaps - (439) - (439) Forward foreign exchange contracts - (1,358) - (1,358) Interest rate swaps - (7,565) - (7,565)
Total liabilities - (9,362) - (9,362)
For further details on how valuation methodologies are applied in determining fair value refer to note 10 in the 2016 Annual Report. There have been no changes to valuation techniques used during the period with the exception of deferred consideration. The fair value of deferred consideration is calculated using unobservable inputs and applying an appropriate risk-adjusted discount rate to expected cash flows. Unobservable inputs include management assumptions on the estimated future cash outflows from expected performance-related outcomes.
For
per
sona
l use
onl
y
Vocus Group Limited Notes to the financial statements 31 December 2016
Note 8. Fair value measurement (continued)
17
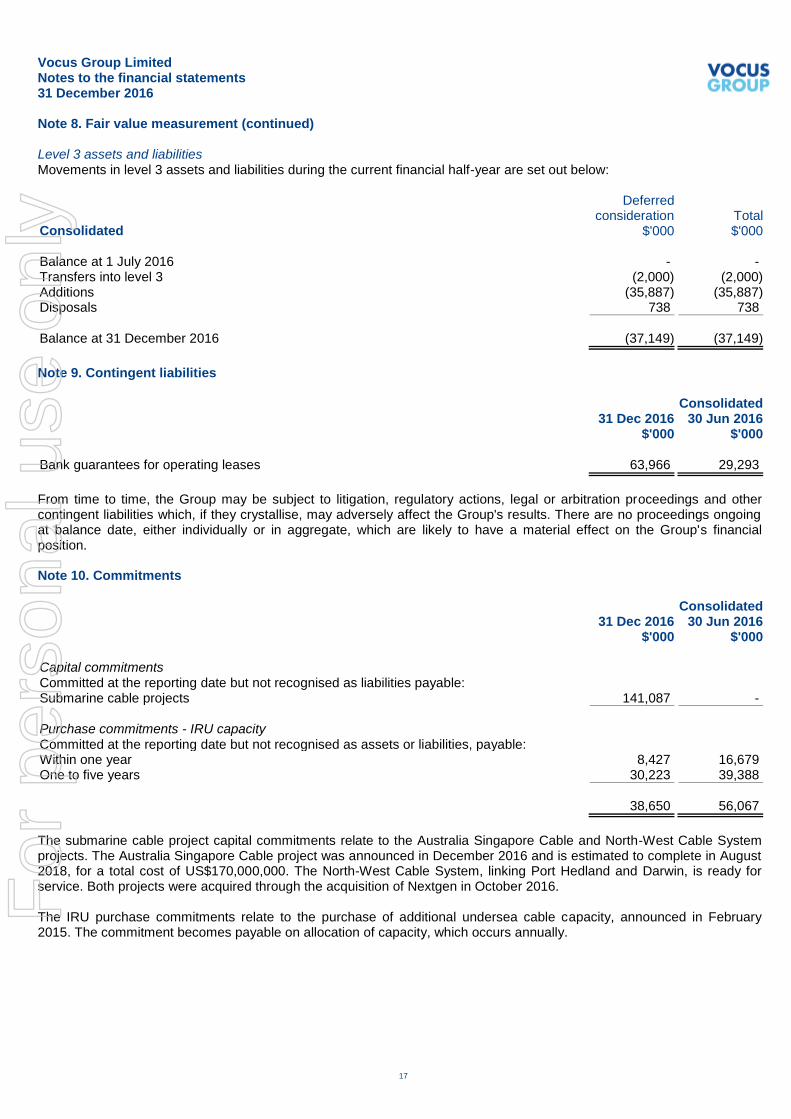
Level 3 assets and liabilities Movements in level 3 assets and liabilities during the current financial half-year are set out below: Deferred consideration Total Consolidated $'000 $'000 Balance at 1 July 2016 - - Transfers into level 3 (2,000) (2,000) Additions (35,887) (35,887) Disposals 738 738
Balance at 31 December 2016 (37,149) (37,149)
Note 9. Contingent liabilities Consolidated 31 Dec 2016 30 Jun 2016 $'000 $'000 Bank guarantees for operating leases 63,966 29,293
From time to time, the Group may be subject to litigation, regulatory actions, legal or arbitration proceedings and other contingent liabilities which, if they crystallise, may adversely affect the Group's results. There are no proceedings ongoing at balance date, either individually or in aggregate, which are likely to have a material effect on the Group's financial position. Note 10. Commitments Consolidated 31 Dec 2016 30 Jun 2016 $'000 $'000 Capital commitments Committed at the reporting date but not recognised as liabilities payable: Submarine cable projects 141,087 -
Purchase commitments - IRU capacity Committed at the reporting date but not recognised as assets or liabilities, payable: Within one year 8,427 16,679 One to five years 30,223 39,388
38,650 56,067
The submarine cable project capital commitments relate to the Australia Singapore Cable and North-West Cable System projects. The Australia Singapore Cable project was announced in December 2016 and is estimated to complete in August 2018, for a total cost of US$170,000,000. The North-West Cable System, linking Port Hedland and Darwin, is ready for service. Both projects were acquired through the acquisition of Nextgen in October 2016. The IRU purchase commitments relate to the purchase of additional undersea cable capacity, announced in February 2015. The commitment becomes payable on allocation of capacity, which occurs annually.
For
per
sona
l use
onl
y
Vocus Group Limited Notes to the financial statements 31 December 2016
18
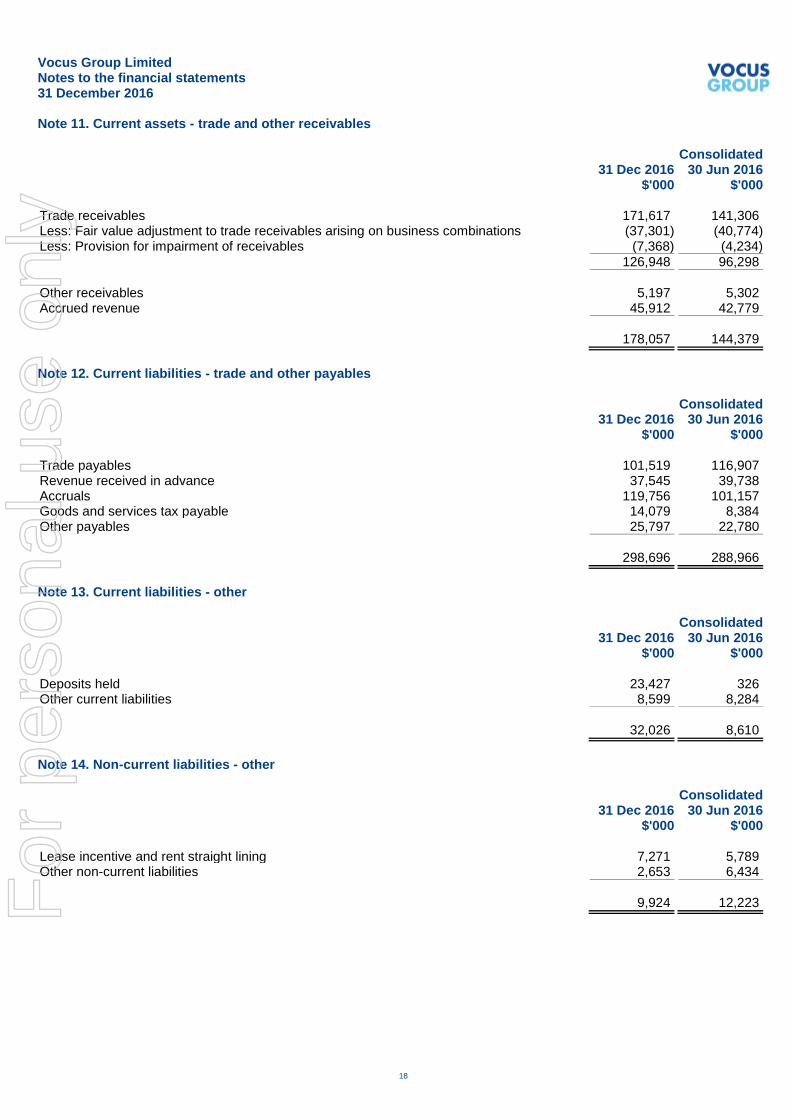
Note 11. Current assets - trade and other receivables Consolidated 31 Dec 2016 30 Jun 2016 $'000 $'000 Trade receivables 171,617 141,306 Less: Fair value adjustment to trade receivables arising on business combinations (37,301) (40,774) Less: Provision for impairment of receivables (7,368) (4,234)
126,948 96,298
Other receivables 5,197 5,302 Accrued revenue 45,912 42,779 178,057 144,379
Note 12. Current liabilities - trade and other payables Consolidated 31 Dec 2016 30 Jun 2016 $'000 $'000 Trade payables 101,519 116,907 Revenue received in advance 37,545 39,738 Accruals 119,756 101,157 Goods and services tax payable 14,079 8,384 Other payables 25,797 22,780
298,696 288,966
Note 13. Current liabilities - other Consolidated 31 Dec 2016 30 Jun 2016 $'000 $'000 Deposits held 23,427 326 Other current liabilities 8,599 8,284
32,026 8,610
Note 14. Non-current liabilities - other Consolidated 31 Dec 2016 30 Jun 2016 $'000 $'000 Lease incentive and rent straight lining 7,271 5,789 Other non-current liabilities 2,653 6,434
9,924 12,223
For
per
sona
l use
onl
y
Vocus Group Limited Notes to the financial statements 31 December 2016
19
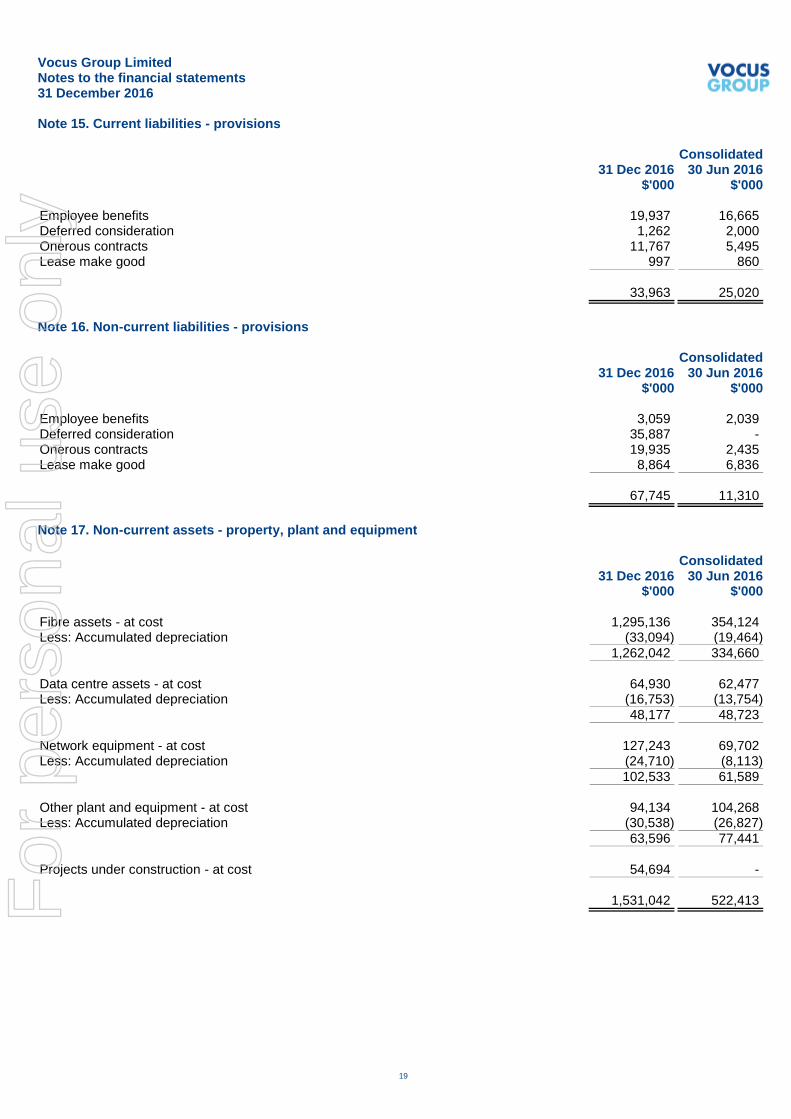
Note 15. Current liabilities - provisions Consolidated 31 Dec 2016 30 Jun 2016 $'000 $'000 Employee benefits 19,937 16,665 Deferred consideration 1,262 2,000 Onerous contracts 11,767 5,495 Lease make good 997 860
33,963 25,020
Note 16. Non-current liabilities - provisions Consolidated 31 Dec 2016 30 Jun 2016 $'000 $'000 Employee benefits 3,059 2,039 Deferred consideration 35,887 - Onerous contracts 19,935 2,435 Lease make good 8,864 6,836
67,745 11,310
Note 17. Non-current assets - property, plant and equipment Consolidated 31 Dec 2016 30 Jun 2016 $'000 $'000 Fibre assets - at cost 1,295,136 354,124 Less: Accumulated depreciation (33,094) (19,464)
1,262,042 334,660
Data centre assets - at cost 64,930 62,477 Less: Accumulated depreciation (16,753) (13,754)
48,177 48,723
Network equipment - at cost 127,243 69,702 Less: Accumulated depreciation (24,710) (8,113)
102,533 61,589
Other plant and equipment - at cost 94,134 104,268 Less: Accumulated depreciation (30,538) (26,827)
63,596 77,441
Projects under construction - at cost 54,694 -
1,531,042 522,413
For
per
sona
l use
onl
y

Vocus Group Limited Notes to the financial statements 31 December 2016
Note 17. Non-current assets - property, plant and equipment (continued)
20
Reconciliations Reconciliations of the written down values at the beginning and end of the current financial half-year are set out below: Fibre Data centre Network Other plant Projects
assets
assets
equipment and
equipment under
construction
Total Consolidated $'000 $'000 $'000 $'000 $'000 $'000 Balance at 1 July 2016 334,660 48,723 61,589 77,441 - 522,413 Additions 24,326 2,400 15,204 16,227 25,844 84,001 Additions through business combinations (note 22)
914,497
-
-
16,249
27,868
958,614
Reclassifications 1,631 - 38,652 (40,283) - - Exchange differences 691 31 170 131 982 2,005 Write off of assets (84) (9) - - - (93) Depreciation expense (13,679) (2,968) (13,082) (6,169) - (35,898)
Balance at 31 December 2016 1,262,042 48,177 102,533 63,596 54,694 1,531,042
Projects under construction Additions of $25,844,000 represent contract milestone payments in relation to the construction of the Australia Singapore Cable (ASC), which was acquired as part of the Nextgen acquisition in October 2016. Note 18. Non-current assets - intangibles Consolidated 31 Dec 2016 30 Jun 2016 $'000 $'000 Goodwill - at cost 3,007,450 2,960,303
Brands - at cost 189,500 190,500 IRU capacity - at cost 182,409 153,392 Less: Accumulated amortisation (32,768) (26,716)
149,641 126,676
Customer intangibles - at cost 378,942 376,531 Less: Accumulated amortisation (56,900) (26,365) 322,042 350,166
Software - at cost 150,807 139,793 Less: Accumulated amortisation (28,551) (12,499)
122,256 127,294
Other intangibles - at cost 2,494 2,494 Less: Accumulated amortisation (432) (365)
2,062 2,129
3,792,951 3,757,068
For
per
sona
l use
onl
y
Vocus Group Limited Notes to the financial statements 31 December 2016
Note 18. Non-current assets - intangibles (continued)
21
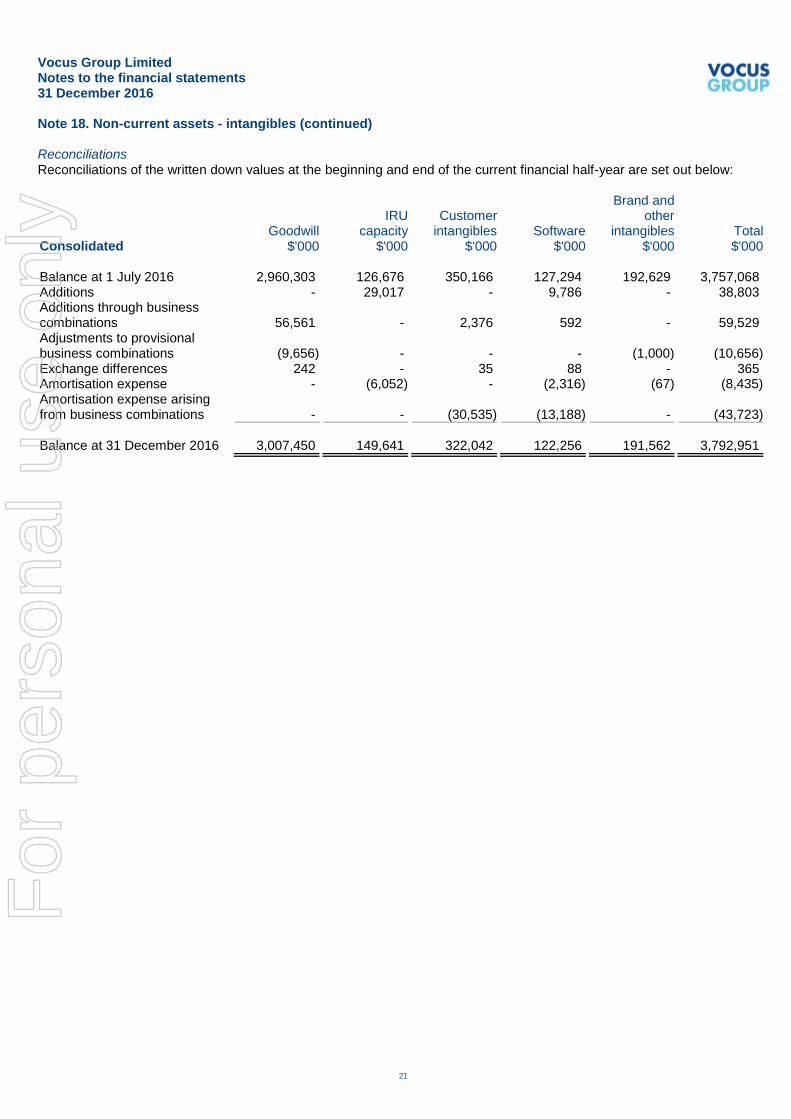
Reconciliations Reconciliations of the written down values at the beginning and end of the current financial half-year are set out below:
IRU
Customer
Brand and
other
Goodwill capacity intangibles Software intangibles Total Consolidated $'000 $'000 $'000 $'000 $'000 $'000 Balance at 1 July 2016 2,960,303 126,676 350,166 127,294 192,629 3,757,068 Additions - 29,017 - 9,786 - 38,803 Additions through business combinations
56,561
-
2,376
592
-
59,529
Adjustments to provisional business combinations
(9,656)
-
-
-
(1,000)
(10,656)
Exchange differences 242 - 35 88 - 365 Amortisation expense - (6,052) - (2,316) (67) (8,435) Amortisation expense arising from business combinations
-
-
(30,535)
(13,188)
-
(43,723)
Balance at 31 December 2016 3,007,450 149,641 322,042 122,256 191,562 3,792,951
For
per
sona
l use
onl
y

Vocus Group Limited Notes to the financial statements 31 December 2016
Note 18. Non-current assets - intangibles (continued)
22
Goodwill Goodwill is not subject to amortisation but is tested for impairment annually or whenever there is an indication that the asset may be impaired. For the purpose of impairment testing, assets are grouped at the lowest levels for which there are separately identifiable cash flows, known as cash-generating units. If the recoverable amount of the cash-generating unit is less than the carrying amount of the unit, the impairment loss is allocated first to reduce the carrying amount of any goodwill allocated to the unit and then to the other assets of the unit pro-rata on the basis of the carrying amount of each asset in the unit. Impairment losses recognised for goodwill are not reversible in subsequent periods. The recoverable amount is the higher of fair value less costs to sell and value in use. In assessing value in use, the estimated future cash flows are discounted to their present value using a pre-tax discount rate that reflects current market assessments of the time value of money and the risks specific to the asset for which the estimates of future cash flows have not been adjusted. In accordance with the Group's accounting policy, impairment testing has been undertaken at 31 December 2016 for all groups of cash generating units (CGUs) with indefinite life intangible assets or where there is an indication of impairment. The Group considered the relationship between its market capitalisation and the book value of its equity, among other factors, when reviewing for indicators of impairment. As at 31 December 2016, the market capitalisation of the Group was below the book value of its equity, indicating a potential impairment of goodwill and other assets. The recoverable amounts of the Australian and New Zealand CGUs have been determined based on a fair value less costs of disposal model based on future cash flows. The key assumptions used in the calculation are: - Forecasts for capital expenditure based on past experience required to maintain current fixed asset levels as well as expand the network to support future growth - Post-tax discount rates for Australia and New Zealand of 8.5% and 9.0% - Year 2-5 revenue growth rates for Australia and New Zealand of 5.2% and 4.8% - Five-year cash flow forecasts including expected synergistic benefits from recent merger and acquisition activity - Terminal growth rate of 3% - 5% cost of disposal The result of those impairment tests was that there was no impairment identified for the Australian and New Zealand CGUs at 31 December 2016. Sensitivity An increase in the discount rate by 1% would result in the recoverable amount to be less than the carrying amount. A decrease in the terminal growth rate by 1% would result in the recoverable amount to be less than the carrying amount. Note 19. Current liabilities - borrowings Consolidated 31 Dec 2016 30 Jun 2016 $'000 $'000 Backhaul IRU liability 6,585 5,992 Lease liability 8,095 7,737
14,680 13,729
Refer to note 20 for further information on assets pledged as security and financing arrangements.
For
per
sona
l use
onl
y
Vocus Group Limited Notes to the financial statements 31 December 2016
23
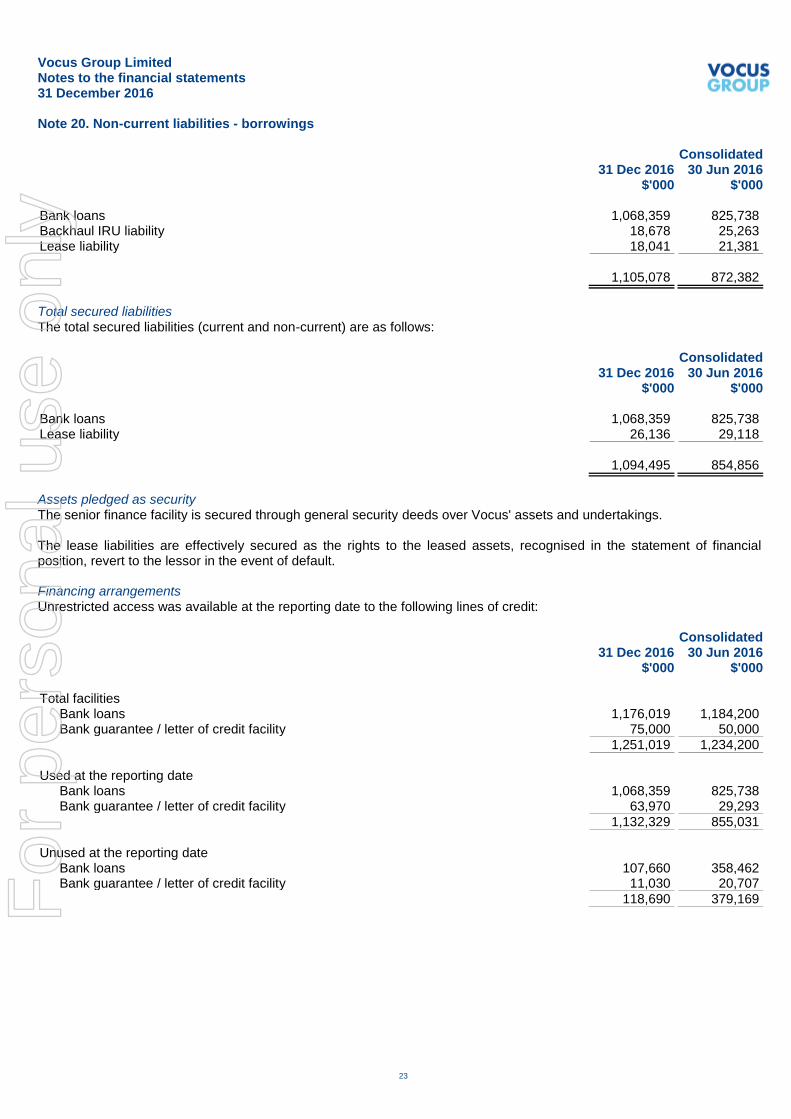
Note 20. Non-current liabilities - borrowings Consolidated 31 Dec 2016 30 Jun 2016 $'000 $'000 Bank loans 1,068,359 825,738 Backhaul IRU liability 18,678 25,263 Lease liability 18,041 21,381
1,105,078 872,382
Total secured liabilities The total secured liabilities (current and non-current) are as follows: Consolidated 31 Dec 2016 30 Jun 2016 $'000 $'000 Bank loans 1,068,359 825,738 Lease liability 26,136 29,118
1,094,495 854,856
Assets pledged as security The senior finance facility is secured through general security deeds over Vocus' assets and undertakings. The lease liabilities are effectively secured as the rights to the leased assets, recognised in the statement of financial position, revert to the lessor in the event of default. Financing arrangements Unrestricted access was available at the reporting date to the following lines of credit: Consolidated 31 Dec 2016 30 Jun 2016 $'000 $'000 Total facilities
Bank loans 1,176,019 1,184,200 Bank guarantee / letter of credit facility 75,000 50,000
1,251,019 1,234,200
Used at the reporting date
Bank loans 1,068,359 825,738 Bank guarantee / letter of credit facility 63,970 29,293
1,132,329 855,031
Unused at the reporting date
Bank loans 107,660 358,462 Bank guarantee / letter of credit facility 11,030 20,707
118,690 379,169
For
per
sona
l use
onl
y
Vocus Group Limited Notes to the financial statements 31 December 2016
Note 20. Non-current liabilities - borrowings (continued)
24
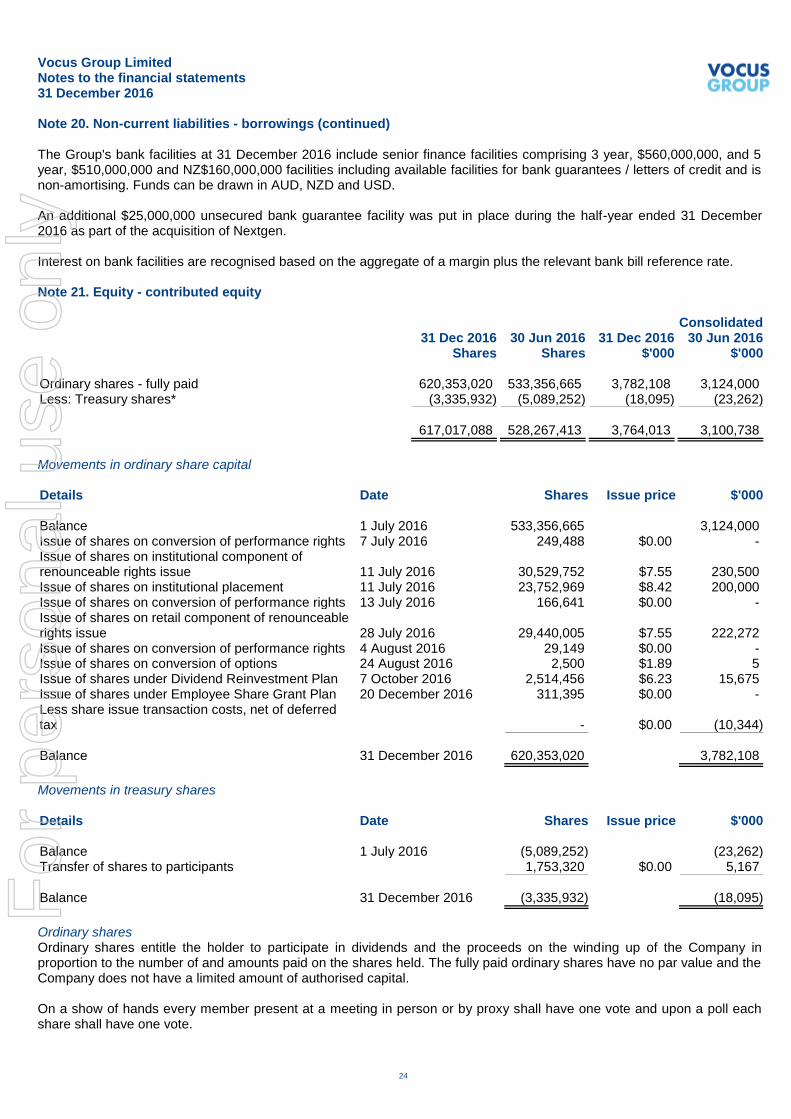
The Group's bank facilities at 31 December 2016 include senior finance facilities comprising 3 year, $560,000,000, and 5 year, $510,000,000 and NZ$160,000,000 facilities including available facilities for bank guarantees / letters of credit and is non-amortising. Funds can be drawn in AUD, NZD and USD. An additional $25,000,000 unsecured bank guarantee facility was put in place during the half-year ended 31 December 2016 as part of the acquisition of Nextgen. Interest on bank facilities are recognised based on the aggregate of a margin plus the relevant bank bill reference rate. Note 21. Equity - contributed equity Consolidated 31 Dec 2016 30 Jun 2016 31 Dec 2016 30 Jun 2016 Shares Shares $'000 $'000 Ordinary shares - fully paid 620,353,020 533,356,665 3,782,108 3,124,000 Less: Treasury shares* (3,335,932) (5,089,252) (18,095) (23,262)
617,017,088 528,267,413 3,764,013 3,100,738
Movements in ordinary share capital Details Date Shares Issue price $'000 Balance 1 July 2016 533,356,665 3,124,000 Issue of shares on conversion of performance rights 7 July 2016 249,488 $0.00 - Issue of shares on institutional component of renounceable rights issue
11 July 2016
30,529,752
$7.55
230,500
Issue of shares on institutional placement 11 July 2016 23,752,969 $8.42 200,000 Issue of shares on conversion of performance rights 13 July 2016 166,641 $0.00 - Issue of shares on retail component of renounceable rights issue
28 July 2016
29,440,005
$7.55
222,272
Issue of shares on conversion of performance rights 4 August 2016 29,149 $0.00 - Issue of shares on conversion of options 24 August 2016 2,500 $1.89 5 Issue of shares under Dividend Reinvestment Plan 7 October 2016 2,514,456 $6.23 15,675 Issue of shares under Employee Share Grant Plan 20 December 2016 311,395 $0.00 - Less share issue transaction costs, net of deferred tax
-
$0.00
(10,344)
Balance 31 December 2016 620,353,020 3,782,108
Movements in treasury shares Details Date Shares Issue price $'000 Balance 1 July 2016 (5,089,252) (23,262) Transfer of shares to participants 1,753,320 $0.00 5,167
Balance 31 December 2016 (3,335,932) (18,095)
Ordinary shares Ordinary shares entitle the holder to participate in dividends and the proceeds on the winding up of the Company in proportion to the number of and amounts paid on the shares held. The fully paid ordinary shares have no par value and the Company does not have a limited amount of authorised capital. On a show of hands every member present at a meeting in person or by proxy shall have one vote and upon a poll each share shall have one vote.
For
per
sona
l use
onl
y

Vocus Group Limited Notes to the financial statements 31 December 2016
25
Note 22. Business combinations Nextgen Networks, North-West Cable System and Australia Singapore Cable On 26 October 2016, Vocus Group Limited (formerly Vocus Communications Limited) acquired 100% of the ordinary shares of Nextgen Networks and two development projects, the North-West Cable System and the Australia Singapore Cable, for the total upfront consideration of $829,820,000. The acquisition provides Vocus ownership of critical infrastructure to connect its metropolitan infrastructure to a larger inter-capital fibre optic network, thereby connecting mainland capital cities to regional and remote areas on one owned network. Goodwill of $49,270,000 represents the residual value of the purchase price of the company over the fair value of identified tangible and intangible assets, and has been determined on a provisional basis due to the size and complexity of the transaction. Independent valuation of tangible assets along with identifiable intangibles such as customer contracts and relationships is ongoing. The acquired business contributed revenues of $34,253,000 and profit after tax of $1,334,000 to Vocus for the period from 26 October 2016 to 31 December 2016. The values identified in relation to the acquisition of Nextgen Networks are provisional as at 31 December 2016. Details of the acquisition are as follows: Fair value $'000 Cash and cash equivalents 22 Trade and other receivables 27,120 Inventories 774 Prepayments 5,297 Fibre assets 914,497 Projects under construction 27,868 Other plant and equipment 16,028 Deferred tax asset 8,310 Trade and other payables (22,300) Provisions (36,834) Deferred revenue (160,232)
Net assets acquired 780,550 Goodwill 49,270
Acquisition-date fair value of the total consideration transferred 829,820
Representing: Cash paid to vendor 798,851 Contingent consideration (at fair value) 30,969
829,820
For
per
sona
l use
onl
y
Vocus Group Limited Notes to the financial statements 31 December 2016
Note 22. Business combinations (continued)
26
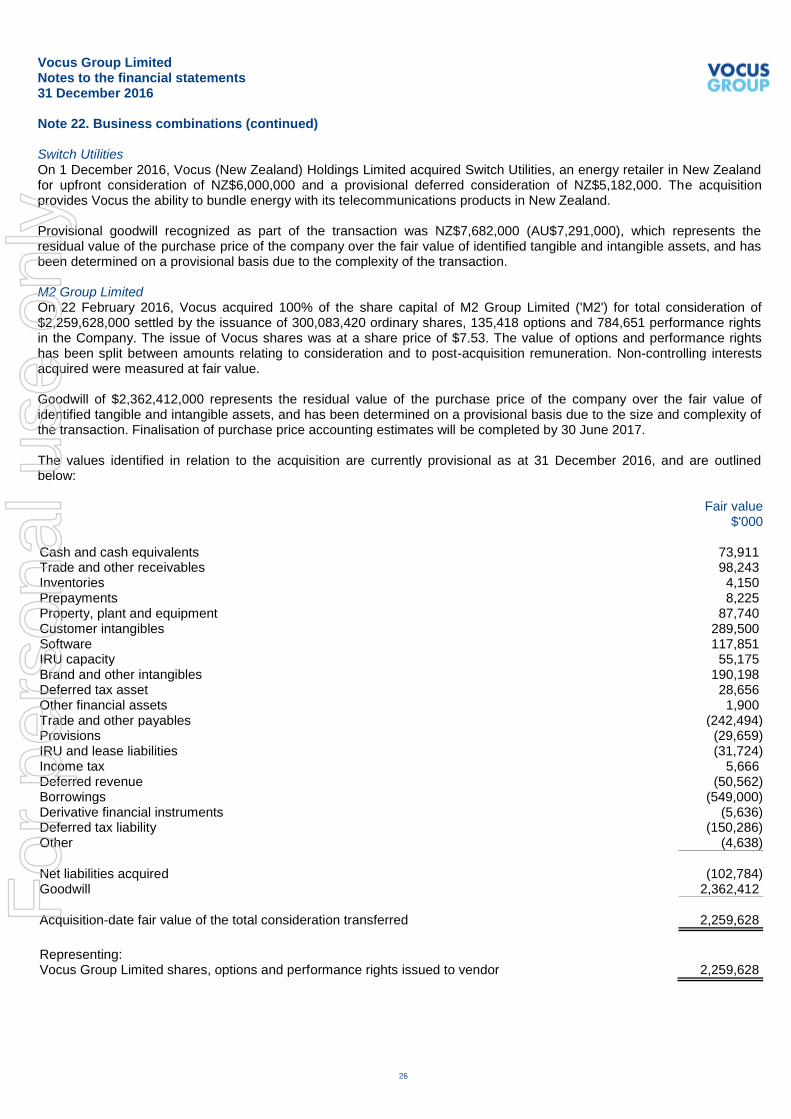
Switch Utilities On 1 December 2016, Vocus (New Zealand) Holdings Limited acquired Switch Utilities, an energy retailer in New Zealand for upfront consideration of NZ$6,000,000 and a provisional deferred consideration of NZ$5,182,000. The acquisition provides Vocus the ability to bundle energy with its telecommunications products in New Zealand. Provisional goodwill recognized as part of the transaction was NZ$7,682,000 (AU$7,291,000), which represents the residual value of the purchase price of the company over the fair value of identified tangible and intangible assets, and has been determined on a provisional basis due to the complexity of the transaction. M2 Group Limited On 22 February 2016, Vocus acquired 100% of the share capital of M2 Group Limited ('M2') for total consideration of $2,259,628,000 settled by the issuance of 300,083,420 ordinary shares, 135,418 options and 784,651 performance rights in the Company. The issue of Vocus shares was at a share price of $7.53. The value of options and performance rights has been split between amounts relating to consideration and to post-acquisition remuneration. Non-controlling interests acquired were measured at fair value. Goodwill of $2,362,412,000 represents the residual value of the purchase price of the company over the fair value of identified tangible and intangible assets, and has been determined on a provisional basis due to the size and complexity of the transaction. Finalisation of purchase price accounting estimates will be completed by 30 June 2017. The values identified in relation to the acquisition are currently provisional as at 31 December 2016, and are outlined below: Fair value $'000 Cash and cash equivalents 73,911 Trade and other receivables 98,243 Inventories 4,150 Prepayments 8,225 Property, plant and equipment 87,740 Customer intangibles 289,500 Software 117,851 IRU capacity 55,175 Brand and other intangibles 190,198 Deferred tax asset 28,656 Other financial assets 1,900 Trade and other payables (242,494) Provisions (29,659) IRU and lease liabilities (31,724) Income tax 5,666 Deferred revenue (50,562) Borrowings (549,000) Derivative financial instruments (5,636) Deferred tax liability (150,286) Other (4,638)
Net liabilities acquired (102,784) Goodwill 2,362,412
Acquisition-date fair value of the total consideration transferred 2,259,628
Representing: Vocus Group Limited shares, options and performance rights issued to vendor 2,259,628
For
per
sona
l use
onl
y
Vocus Group Limited Notes to the financial statements 31 December 2016
27
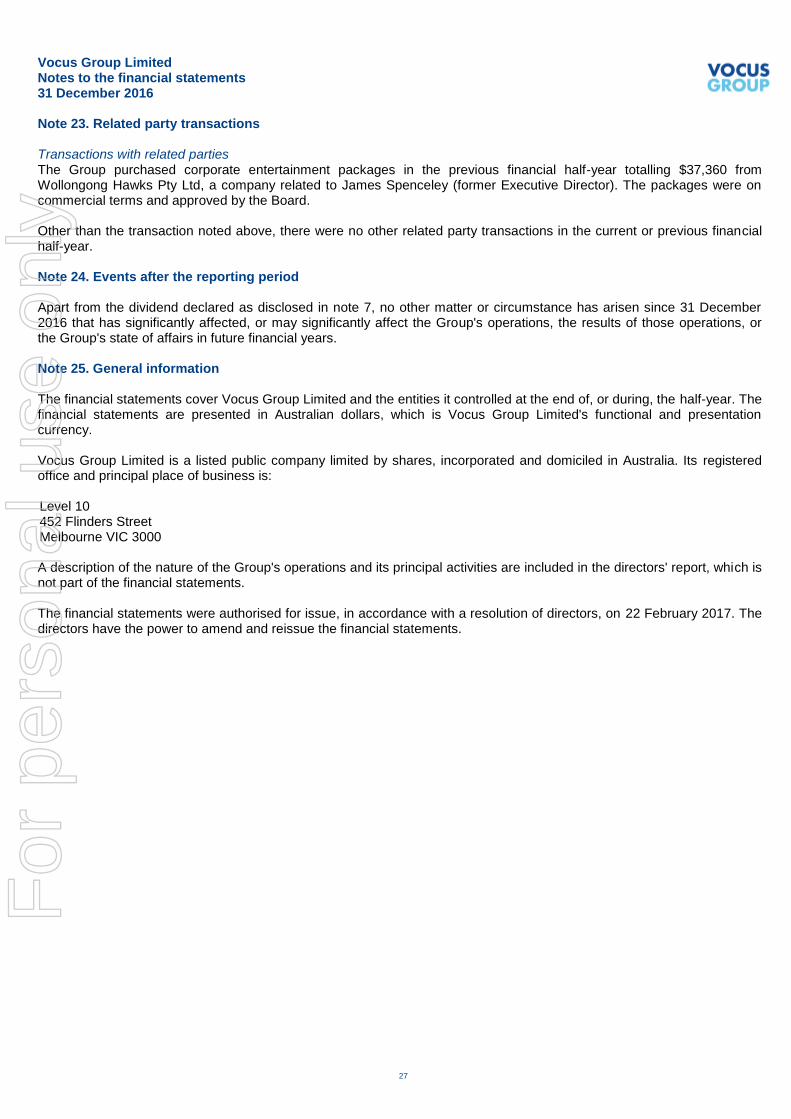
Note 23. Related party transactions Transactions with related parties The Group purchased corporate entertainment packages in the previous financial half-year totalling $37,360 from Wollongong Hawks Pty Ltd, a company related to James Spenceley (former Executive Director). The packages were on commercial terms and approved by the Board. Other than the transaction noted above, there were no other related party transactions in the current or previous financial half-year. Note 24. Events after the reporting period Apart from the dividend declared as disclosed in note 7, no other matter or circumstance has arisen since 31 December 2016 that has significantly affected, or may significantly affect the Group's operations, the results of those operations, or the Group's state of affairs in future financial years. Note 25. General information The financial statements cover Vocus Group Limited and the entities it controlled at the end of, or during, the half-year. The financial statements are presented in Australian dollars, which is Vocus Group Limited's functional and presentation currency. Vocus Group Limited is a listed public company limited by shares, incorporated and domiciled in Australia. Its registered office and principal place of business is: Level 10 452 Flinders Street Melbourne VIC 3000 A description of the nature of the Group's operations and its principal activities are included in the directors' report, which is not part of the financial statements. The financial statements were authorised for issue, in accordance with a resolution of directors, on 22 February 2017. The directors have the power to amend and reissue the financial statements.
For
per
sona
l use
onl
y
Vocus Group Limited Directors' declaration 31 December 2016
28
In the directors' opinion: ● the attached financial statements and notes comply with the Corporations Act 2001, Australian Accounting Standard
AASB 134 'Interim Financial Reporting', the Corporations Regulations 2001 and other mandatory professional reporting requirements;
● the attached financial statements and notes give a true and fair view of the Group's financial position as at 31
December 2016 and of its performance for the financial half-year ended on that date; and ● there are reasonable grounds to believe that the Company will be able to pay its debts as and when they become due
and payable. Signed in accordance with a resolution of directors made pursuant to section 303(5)(a) of the Corporations Act 2001. On behalf of the directors ___________________________ David Spence Chairman 22 February 2017 Sydney
For
per
sona
l use
onl
y
Liability limited by a scheme approved under Professional Standards Legislation.
Member of Deloitte Touche Tohmatsu Limited
29
Deloitte Touche Tohmatsu
ABN 74 490 121 060
Grosvenor Place
225 George Street
Sydney NSW 2000
PO Box N250 Grosvenor Place
Sydney NSW 1220 Australia
Tel: +61 2 9322 7000
Fax: +61 9322 7001
www.deloitte.com.au
Independent Auditor’s Review Report to the Members of Vocus Group Limited
We have reviewed the accompanying half-year financial report of Vocus Group Limited, which comprises the statement of financial position as at 31 December 2016, and the statement of profit or loss and other comprehensive income, the statement of cash flows and the statement of changes in equity for the half-year ended on that date, notes comprising of significant accounting policies and other explanatory information, and the directors’ declaration of the consolidated entity comprising the company and the entities it controlled at the end of the half-year or from time to time during the half-year, as set out on pages 7 to 28. Directors’ Responsibility for the Half-Year Financial Report The directors of the company are responsible for the preparation of the half-year financial report that gives a true and fair view in accordance with Australian Accounting Standards and the Corporations Act 2001 and for such internal control as the directors determine is necessary to enable the preparation of the half-year financial report that gives a true and fair view and is free from material misstatement, whether due to fraud or error. Auditor’s Responsibility Our responsibility is to express a conclusion on the half-year financial report based on our review. We conducted our review in accordance with Auditing Standard on Review Engagements ASRE 2410 Review of a Financial Report Performed by the Independent Auditor of the Entity, in order to state whether, on the basis of the procedures described, we have become aware of any matter that makes us believe that the half-year financial report is not in accordance with the Corporations Act 2001 including: giving a true and fair view of the consolidated entity’s financial position as at 31 December 2016 and its performance for the half-year ended on that date; and complying with Accounting Standard AASB 134 Interim Financial Reporting and the Corporations Regulations 2001. As the auditor of Vocus Group Limited, ASRE 2410 requires that we comply with the ethical requirements relevant to the audit of the annual financial report. A review of a half-year financial report consists of making enquiries, primarily of persons responsible for financial and accounting matters, and applying analytical and other review procedures. A review is substantially less in scope than an audit conducted in accordance with Australian Auditing Standards and consequently does not enable us to obtain assurance that we would become aware of all significant matters that might be identified in an audit. Accordingly, we do not express an audit opinion. Auditor’s Independence Declaration In conducting our review, we have complied with the independence requirements of the Corporations Act 2001. We confirm that the independence declaration required by the Corporations Act 2001, which has been given to the directors of Vocus Group Limited, would be in the same terms if given to the directors as at the time of this auditor’s review report.
For
per
sona
l use
onl
y
30
Conclusion Based on our review, which is not an audit, we have not become aware of any matter that makes us believe that the half-year financial report of Vocus Group Limited is not in accordance with the Corporations Act 2001, including:
(a) giving a true and fair view of the consolidated entity’s financial position as at 31 December 2016 and of its performance for the half-year ended on that date; and
(b) complying with Accounting Standard AASB 134 Interim Financial Reporting and the Corporations Regulations 2001.
DELOITTE TOUCHE TOHMATSU
Don Pasquariello Partner Chartered Accountants Sydney, 22 February 2017
For
per
sona
l use
onl
y

VOCUS GROUP 2
FINANCIAL YEAR 2017 HALF YEAR FINANCIAL RESULTS FOR THE SIX MONTHS ENDED 31 DECEMBER 2016 INCORPORATING THE REQUIREMENTS OF APPENDIX 4D
22 FEBRUARY 2017
For
per
sona
l use
onl
y
VOCUS GROUP 3
Vocus Group Limited
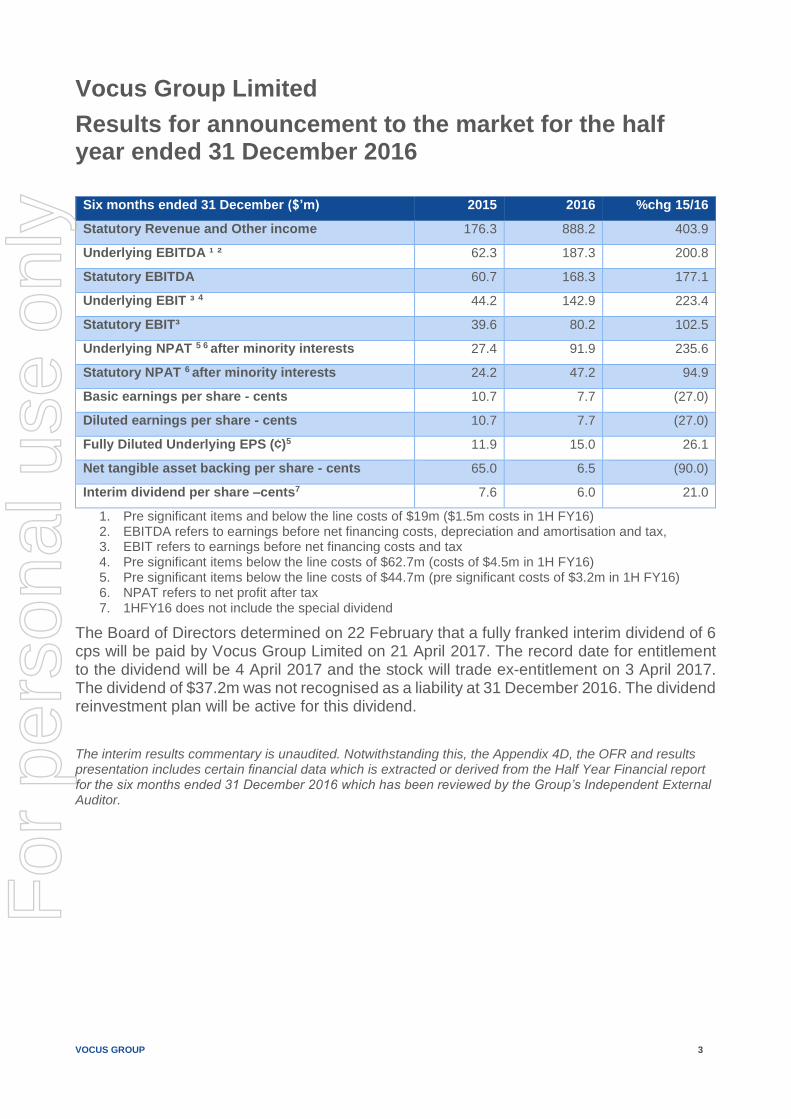
Results for announcement to the market for the half year ended 31 December 2016
Six months ended 31 December ($’m) 2015 2016 %chg 15/16
Statutory Revenue and Other income 176.3 888.2 403.9
Underlying EBITDA ¹ ² 62.3 187.3 200.8
Statutory EBITDA 60.7 168.3 177.1
Underlying EBIT ³ 4 44.2 142.9 223.4
Statutory EBIT³ 39.6 80.2 102.5
Underlying NPAT 5 6 after minority interests 27.4 91.9 235.6
Statutory NPAT 6 after minority interests 24.2 47.2 94.9
Basic earnings per share - cents 10.7 7.7 (27.0)
Diluted earnings per share - cents 10.7 7.7 (27.0)
Fully Diluted Underlying EPS (¢)5 11.9 15.0 26.1
Net tangible asset backing per share - cents 65.0 6.5 (90.0)
Interim dividend per share –cents7 7.6 6.0 21.0
1. Pre significant items and below the line costs of $19m ($1.5m costs in 1H FY16) 2. EBITDA refers to earnings before net financing costs, depreciation and amortisation and tax, 3. EBIT refers to earnings before net financing costs and tax 4. Pre significant items below the line costs of $62.7m (costs of $4.5m in 1H FY16) 5. Pre significant items below the line costs of $44.7m (pre significant costs of $3.2m in 1H FY16) 6. NPAT refers to net profit after tax 7. 1HFY16 does not include the special dividend
The Board of Directors determined on 22 February that a fully franked interim dividend of 6 cps will be paid by Vocus Group Limited on 21 April 2017. The record date for entitlement to the dividend will be 4 April 2017 and the stock will trade ex-entitlement on 3 April 2017. The dividend of $37.2m was not recognised as a liability at 31 December 2016. The dividend reinvestment plan will be active for this dividend.
The interim results commentary is unaudited. Notwithstanding this, the Appendix 4D, the OFR and results presentation includes certain financial data which is extracted or derived from the Half Year Financial report for the six months ended 31 December 2016 which has been reviewed by the Group’s Independent External Auditor.
For
per
sona
l use
onl
y
VOCUS GROUP 4
Half Year Report
For the six months ended 31 December 2016
Contents
1. Financial Statements 2. Media Release 3. Operating and Financial Review 4. 1H FY17 Results Presentation
For Further Information:
Investor & Analysts Media
Kelly Hibbins Debra Mansfield
Tel: +61 2 8316 9856 Tel: +61 3 9674 6569
Mobile: +61 414 609192
[email protected] [email protected]
For
per
sona
l use
onl
y
VOCUS GROUP 5
Financial Year 2017
Half Year Financial Results
Operating and Financial Review
For
per
sona
l use
onl
y

VOCUS GROUP 6
22 February 2017
Record result driven by acquisitions and organic growth
Highlights
Revenue increased 403% on pcp to $885.9m, includes initial contribution from
Nextgen1 of $34.3m
Underlying EBITDA increased 201% on pcp to $187.3m, includes initial contribution
from Nextgen¹ of ~$11m (pre synergies)
Underlying EBITDA up 12.2% on 1HFY16 proforma2 underlying EBITDA of $167m
Nextgen acquisition completed, Day 100 milestones met
Acquisition synergies cumulative exit run rate at end of six month period $47.5m
ASC project launched, NWCS commenced services
The Vocus board reiterates FY17 guidance of EBITDA in the range of $430 - $450
million
Fully franked interim dividend of 6cps
Six months ended 31 December ($’m) 2015 2016 %chg
Revenue 176.0 885.9 403.4
Underlying EBITDA¹ ² 62.3 187.3 200.8
Underlying EBIT³ 4 44.2 142.9 223.7
Underlying PBT 5 6 38.1 129.8 241.3
Underlying NPAT 7 27.4 91.9 235.6
Significant items after tax (3.2) (44.7) -
Statutory NPAT after minority interests 24.2 47.2 94.9
Fully diluted underlying EPS 7 after minority interests (¢) 11.9 14.0 25.7
Fully diluted EPS after minority interests (¢) 10.6 7.7 (27.0)
DPS (¢)8 7.6 6.0 (21.0)
8. Pre significant costs $19m ($1.5m costs in 1H FY16) 9. EBITDA refers to earnings before net financing costs, depreciation and amortisation and tax, 10. EBIT refers to earnings before net financing costs and tax 11. Pre significant items below the line costs of $62.7m (costs of $4.5m in 1H FY16) 12. Pre significant items below the line costs of $44.7m (pre significant costs of $3.2m in 1H FY16) 13. PBT refers to profit before tax 14. NPAT refers to net profit after tax 15. 1HFY16 does not include the special dividend
1 Nextgen acquisition completed on 26 October 2016 2 Proforma underlying EBITDA of $167m assumes the M2 and Vocus 1HFY16 results combined. It does not include a contribution from Nextgen
For
per
sona
l use
onl
y
VOCUS GROUP 7
Vocus Group Limited (ASX: VOC, ‘Vocus’) today announces its results for the six months
ended 31 December 2016.
The record result for the six months ended 31 December 2016 was achieved through a
combination of organic growth, a full six month contribution from the merger with M2 Group
in February 2016 and an initial contribution from the acquisition of Nextgen Networks,
completed 26 October 2016.
Vocus CEO, Geoff Horth, said “We are pleased to have continued to demonstrate organic
growth across the business despite increasing competition in a number of areas and
despite a period of significant corporate activity and integration.
“The Mass Market businesses in both Australia and New Zealand continued to secure
additional market share under their respective national fibre rollouts, with our NBN market
share increasing from 6.4% to 7.8% (ex-satellite) and UFB share increasing to 12% despite
fierce competition in both markets. The rollout of fibre in both Australia and New Zealand
is an extremely positive opportunity for Vocus, with similar margins to copper broadband
and significantly lower churn from the enhanced on-net customer experience.
“The Corporate sales team continued to focus on leveraging our merged business platform
and product set to expand its addressable market. Underlying organic growth in revenue
was in the order of 8% despite the competitive market placing some pressure on pricing.
The Division remains focused on optimising the sales and delivery platform to ensure that
the business takes maximum advantage of the opportunity created by the growing demand
for increasingly resilient, secure and reliable network connectivity.
“New Zealand continues to build out its business platform following recent acquisitions and
is securing new business in both the Corporate & Wholesale and the Mass Market
segments. The business continues to shape its portfolio to leverage its core, as
demonstrated by the sale of its 50% share of the Connect 8 joint venture with Spark New
Zealand and acquisition of a small energy retailer to increase its bundling opportunities in
the market.
“While there is a large program of integration work to be completed to realise the full
benefits of the recent acquisitions, we have a detailed plan and an experienced and
passionate team. We remain confident of our ability to deliver on the potential in the
outstanding platform we have built, and ultimately drive improved returns for shareholders.
“While we have had a lot of near term programs to focus on, we have also continued to be
forward-looking to ensure that the business remains well positioned to participate in the
growth in demand for secure high speed data links. We have recently moved to contract
the build of the Australia Singapore Cable (ASC) which will be rolled out over a ~19 month
period. In October the North West Cable System (NWCS) commenced services and we will
now seek to leverage that platform to secure additional customers beyond the foundation
client base.
For
per
sona
l use
onl
y

VOCUS GROUP 8
“We closed the first half making two key appointments to our team, CFO Mark Wratten, and
Bob Mansfield AO to our Board of Directors. I was also very pleased to be able to announce
that Non-Executive Director Michael Simmons has stepped into an Executive Director role
to manage our Australian Corporate and Wholesale business while we conduct an
executive search. It is fantastic to have Michael’s extensive experience in this role to ensure
we fully exploit the significant growth opportunity in this segment.
Interim Dividend
The Vocus Board is pleased to declare an interim dividend, payable on Friday 21 April, of 6
cents per share, fully franked. The Board of Vocus expects to review dividend payments in
line with the growth of the business, taking into account the capital requirements and
accretive opportunities in M&A and further infrastructure projects.
Guidance and Outlook
The Board confirms the FY17 full year guidance of Underlying EBITDA in the range of $430
- $450 million. The guidance assumes no material change in underlying business
conditions over the six month period. The growth in 2H FY17 will be driven by a full six
month contribution from Nextgen, further synergies generated from recent M&A activity
including Nextgen, organic growth in both Australia and New Zealand and a continued
focus on disciplined investments to take advantage of the opportunity presented by the roll
out of the NBN and UFB networks in Australia and New Zealand.
Mr. Horth concluded “As always, our team is at the centre of our success and I would like
to thank them for their hard work and dedication over the half year. I look forward to
continuing to work with them on leveraging our world-class infrastructure platform, fully
appreciating the opportunities presented by the NBN and UFB and delivering results for
our shareholders.”
Webcast
A webcast will be held for investors at 9.30am on 22nd February. To register or attend,
please go to www.vocusgroup.com.au.
ENDS
For
per
sona
l use
onl
y
VOCUS GROUP 9
OPERATING AND FINANCIAL REVIEW - CONTENTS
OPERATING AND FINANCIAL REVIEW - CONTENTS ........................................................................... 9
OPERATING AND FINANCIAL REVIEW ................................................................................................. 10
1. GROUP OPERATING PERFORMANCE ......................................................................................... 10
1.1 1H FY17 EARNINGS ....................................................................................................................................... 10
1.2 RECONCILIATION OF UNDERLYING AND STATUTORY EARNINGS ........................................................ 11
1.3 TAX RECONCILIATION .................................................................................................................................. 13
1.4 SIGNIFICANT ITEMS ...................................................................................................................................... 13
1.5 CASHFLOW .................................................................................................................................................... 14
1.6 CAPITAL EXPENDITURE ............................................................................................................................... 15
1.7 BALANCE SHEET .......................................................................................................................................... 16
1.8 SHAREHOLDER RETURNS ........................................................................................................................... 17
2. DIVISIONAL PERFORMANCE ........................................................................................................ 19
2.1.1 CORPORATE & WHOLESALE AUSTRALIA ................................................................................................. 19
2.2 MASS MARKET – AUSTRALIA ...................................................................................................................... 21
2.3 NEW ZEALAND .............................................................................................................................................. 23
3. GROUP OUTLOOK .......................................................................................................................... 25
For
per
sona
l use
onl
y
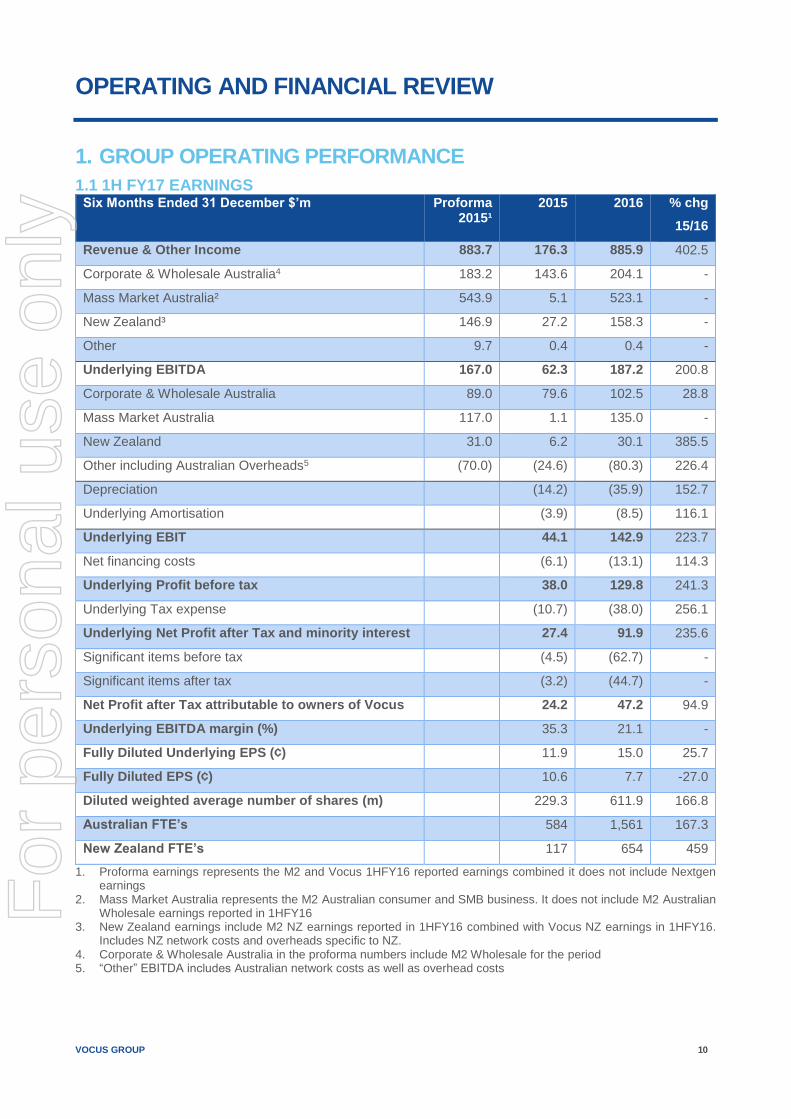
VOCUS GROUP 10
OPERATING AND FINANCIAL REVIEW
1. GROUP OPERATING PERFORMANCE
1.1 1H FY17 EARNINGS Six Months Ended 31 December $’m Proforma
2015¹ 2015 2016 % chg
15/16
Revenue & Other Income 883.7 176.3 885.9 402.5
Corporate & Wholesale Australia4 183.2 143.6 204.1 -
Mass Market Australia² 543.9 5.1 523.1 -
New Zealand³ 146.9 27.2 158.3 -
Other 9.7 0.4 0.4 -
Underlying EBITDA 167.0 62.3 187.2 200.8
Corporate & Wholesale Australia 89.0 79.6 102.5 28.8
Mass Market Australia 117.0 1.1 135.0 -
New Zealand 31.0 6.2 30.1 385.5
Other including Australian Overheads5 (70.0) (24.6) (80.3) 226.4
Depreciation (14.2) (35.9) 152.7
Underlying Amortisation (3.9) (8.5) 116.1
Underlying EBIT 44.1 142.9 223.7
Net financing costs (6.1) (13.1) 114.3
Underlying Profit before tax 38.0 129.8 241.3
Underlying Tax expense (10.7) (38.0) 256.1
Underlying Net Profit after Tax and minority interest 27.4 91.9 235.6
Significant items before tax (4.5) (62.7) -
Significant items after tax (3.2) (44.7) -
Net Profit after Tax attributable to owners of Vocus 24.2 47.2 94.9
Underlying EBITDA margin (%) 35.3 21.1 -
Fully Diluted Underlying EPS (¢) 11.9 15.0 25.7
Fully Diluted EPS (¢) 10.6 7.7 -27.0
Diluted weighted average number of shares (m) 229.3 611.9 166.8
Australian FTE’s 584 1,561 167.3
New Zealand FTE’s 117 654 459
1. Proforma earnings represents the M2 and Vocus 1HFY16 reported earnings combined it does not include Nextgen earnings
2. Mass Market Australia represents the M2 Australian consumer and SMB business. It does not include M2 Australian Wholesale earnings reported in 1HFY16
3. New Zealand earnings include M2 NZ earnings reported in 1HFY16 combined with Vocus NZ earnings in 1HFY16. Includes NZ network costs and overheads specific to NZ.
4. Corporate & Wholesale Australia in the proforma numbers include M2 Wholesale for the period 5. “Other” EBITDA includes Australian network costs as well as overhead costs
For
per
sona
l use
onl
y
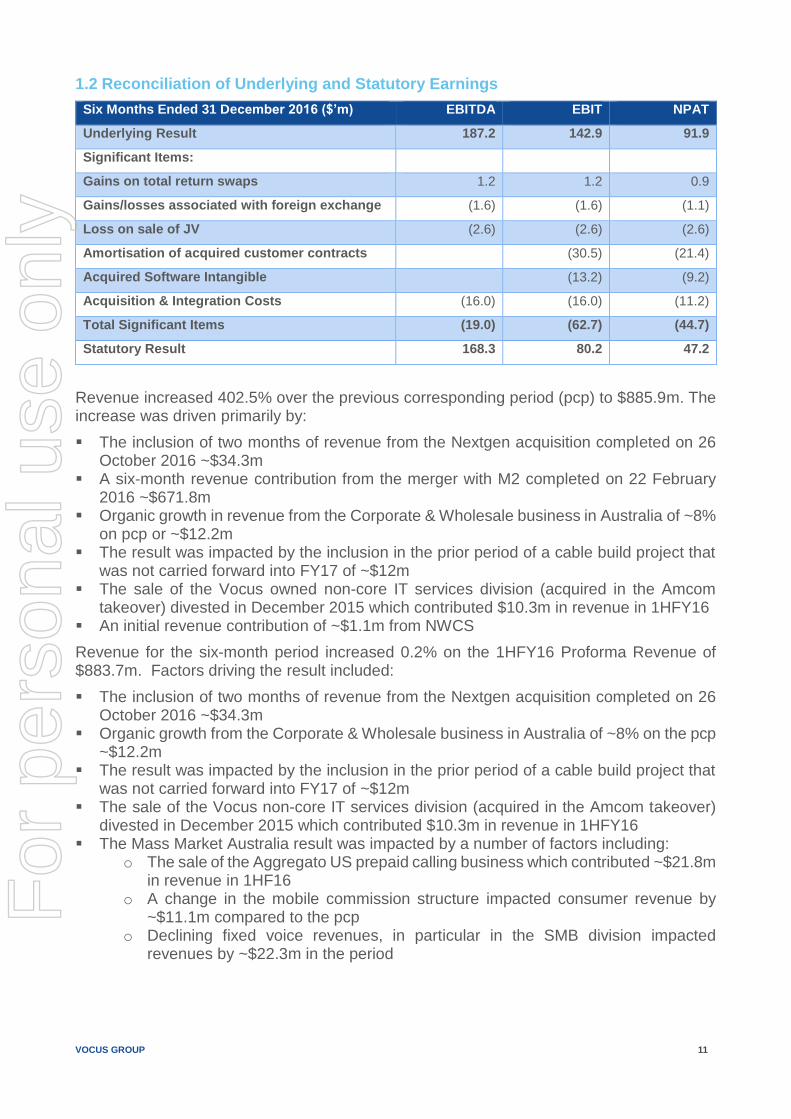
VOCUS GROUP 11
1.2 Reconciliation of Underlying and Statutory Earnings
Six Months Ended 31 December 2016 ($’m) EBITDA EBIT NPAT
Underlying Result 187.2 142.9 91.9
Significant Items:
Gains on total return swaps 1.2 1.2 0.9
Gains/losses associated with foreign exchange (1.6) (1.6) (1.1)
Loss on sale of JV (2.6) (2.6) (2.6)
Amortisation of acquired customer contracts (30.5) (21.4)
Acquired Software Intangible (13.2) (9.2)
Acquisition & Integration Costs (16.0) (16.0) (11.2)
Total Significant Items (19.0) (62.7) (44.7)
Statutory Result 168.3 80.2 47.2
Revenue increased 402.5% over the previous corresponding period (pcp) to $885.9m. The increase was driven primarily by:
The inclusion of two months of revenue from the Nextgen acquisition completed on 26 October 2016 ~$34.3m
A six-month revenue contribution from the merger with M2 completed on 22 February 2016 ~$671.8m
Organic growth in revenue from the Corporate & Wholesale business in Australia of ~8% on pcp or ~$12.2m
The result was impacted by the inclusion in the prior period of a cable build project that was not carried forward into FY17 of ~$12m
The sale of the Vocus owned non-core IT services division (acquired in the Amcom takeover) divested in December 2015 which contributed $10.3m in revenue in 1HFY16
An initial revenue contribution of ~$1.1m from NWCS
Revenue for the six-month period increased 0.2% on the 1HFY16 Proforma Revenue of $883.7m. Factors driving the result included:
The inclusion of two months of revenue from the Nextgen acquisition completed on 26 October 2016 ~$34.3m
Organic growth from the Corporate & Wholesale business in Australia of ~8% on the pcp ~$12.2m
The result was impacted by the inclusion in the prior period of a cable build project that was not carried forward into FY17 of ~$12m
The sale of the Vocus non-core IT services division (acquired in the Amcom takeover) divested in December 2015 which contributed $10.3m in revenue in 1HFY16
The Mass Market Australia result was impacted by a number of factors including: o The sale of the Aggregato US prepaid calling business which contributed ~$21.8m
in revenue in 1HF16 o A change in the mobile commission structure impacted consumer revenue by
~$11.1m compared to the pcp o Declining fixed voice revenues, in particular in the SMB division impacted
revenues by ~$22.3m in the period
For
per
sona
l use
onl
y
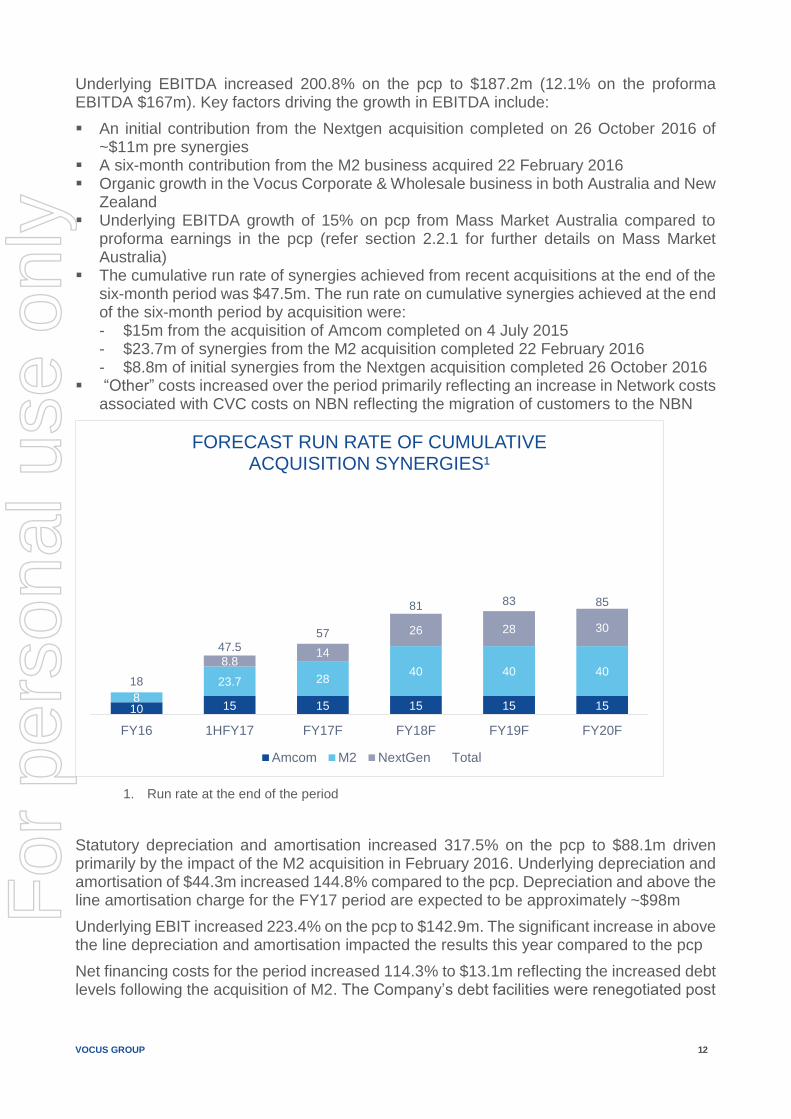
VOCUS GROUP 12
Underlying EBITDA increased 200.8% on the pcp to $187.2m (12.1% on the proforma EBITDA $167m). Key factors driving the growth in EBITDA include:
An initial contribution from the Nextgen acquisition completed on 26 October 2016 of ~$11m pre synergies
A six-month contribution from the M2 business acquired 22 February 2016 Organic growth in the Vocus Corporate & Wholesale business in both Australia and New
Zealand Underlying EBITDA growth of 15% on pcp from Mass Market Australia compared to
proforma earnings in the pcp (refer section 2.2.1 for further details on Mass Market Australia)
The cumulative run rate of synergies achieved from recent acquisitions at the end of the six-month period was $47.5m. The run rate on cumulative synergies achieved at the end of the six-month period by acquisition were: - $15m from the acquisition of Amcom completed on 4 July 2015 - $23.7m of synergies from the M2 acquisition completed 22 February 2016 - $8.8m of initial synergies from the Nextgen acquisition completed 26 October 2016
“Other” costs increased over the period primarily reflecting an increase in Network costs associated with CVC costs on NBN reflecting the migration of customers to the NBN
1. Run rate at the end of the period
Statutory depreciation and amortisation increased 317.5% on the pcp to $88.1m driven primarily by the impact of the M2 acquisition in February 2016. Underlying depreciation and amortisation of $44.3m increased 144.8% compared to the pcp. Depreciation and above the line amortisation charge for the FY17 period are expected to be approximately ~$98m
Underlying EBIT increased 223.4% on the pcp to $142.9m. The significant increase in above the line depreciation and amortisation impacted the results this year compared to the pcp
Net financing costs for the period increased 114.3% to $13.1m reflecting the increased debt levels following the acquisition of M2. The Company’s debt facilities were renegotiated post
10 15 15 15 15 158
23.7 2840 40 40
8.814
26 28 30
18
47.557
81 83 85
FY16 1HFY17 FY17F FY18F FY19F FY20F
FORECAST RUN RATE OF CUMULATIVE ACQUISITION SYNERGIES¹
Amcom M2 NextGen Total
For
per
sona
l use
onl
y
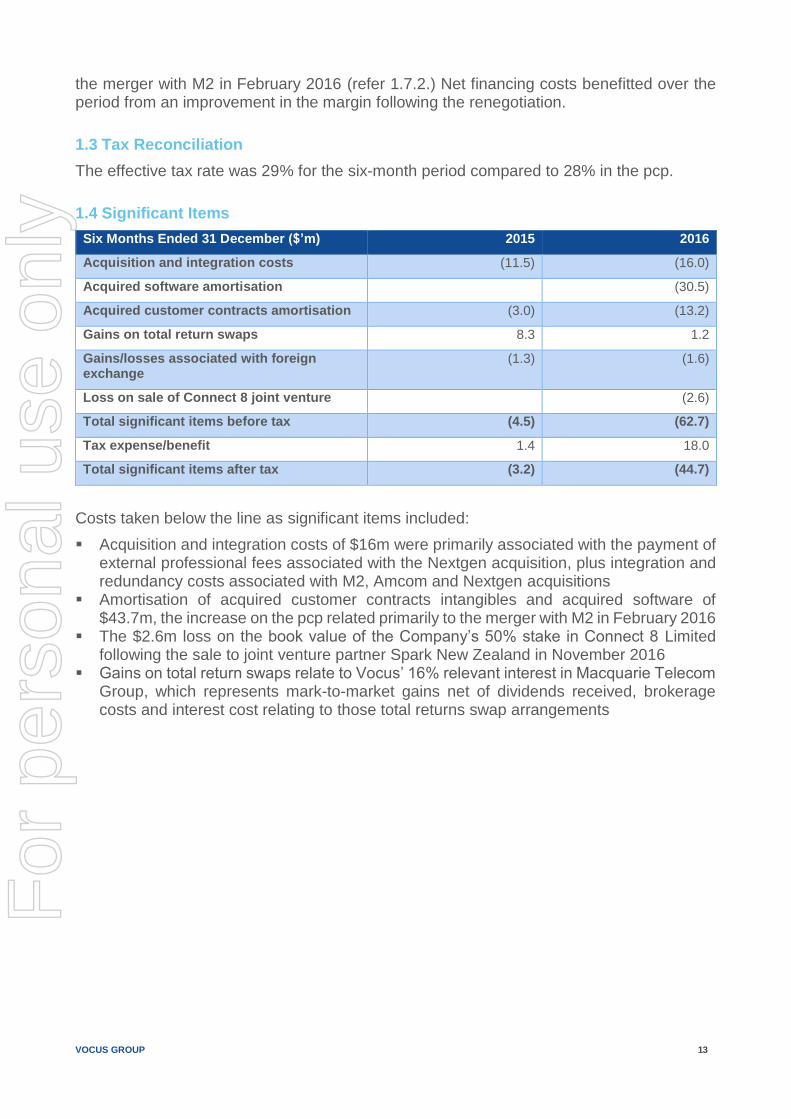
VOCUS GROUP 13
the merger with M2 in February 2016 (refer 1.7.2.) Net financing costs benefitted over the period from an improvement in the margin following the renegotiation.
1.3 Tax Reconciliation
The effective tax rate was 29% for the six-month period compared to 28% in the pcp.
1.4 Significant Items
Six Months Ended 31 December ($’m) 2015 2016
Acquisition and integration costs (11.5) (16.0)
Acquired software amortisation (30.5)
Acquired customer contracts amortisation (3.0) (13.2)
Gains on total return swaps 8.3 1.2
Gains/losses associated with foreign exchange
(1.3) (1.6)
Loss on sale of Connect 8 joint venture (2.6)
Total significant items before tax (4.5) (62.7)
Tax expense/benefit 1.4 18.0
Total significant items after tax (3.2) (44.7)
Costs taken below the line as significant items included:
Acquisition and integration costs of $16m were primarily associated with the payment of external professional fees associated with the Nextgen acquisition, plus integration and redundancy costs associated with M2, Amcom and Nextgen acquisitions
Amortisation of acquired customer contracts intangibles and acquired software of $43.7m, the increase on the pcp related primarily to the merger with M2 in February 2016
The $2.6m loss on the book value of the Company’s 50% stake in Connect 8 Limited following the sale to joint venture partner Spark New Zealand in November 2016
Gains on total return swaps relate to Vocus’ 16% relevant interest in Macquarie Telecom Group, which represents mark-to-market gains net of dividends received, brokerage costs and interest cost relating to those total returns swap arrangements
For
per
sona
l use
onl
y

VOCUS GROUP 14
1.5 Cashflow
Six months ended 31 December ($’m) 2015 2016
Statutory EBITDA 60.7 168.3
Net cash from operating activities 44.7 95.3
Interest, finance costs, tax and JV distribution
8.5 24.5
Adjusted operating cash flow 53.2 119.8
Net interest and finance costs 0.3 0.7
Income taxes paid (8.7) (25.9)
JV partnership distributions received - 0.8
Net cash from operating activities 44.7 95.3
Payments for property plant & equipment¹ (27.7) (52.3)
Payments related to undersea cable projects² - (25.8)
Net business acquisitions³ (15.7) (817.8)
Intangibles payments and proceeds (21.0) (32.0)
Other cash flows from investing activities 9.5 0.8
Investing cash flows (54.8) (927.2)
Proceeds from issue of shares 0.7 647.6
Change in borrowings 42.6 243.1
Interest paid on borrowing and leases (6.1) (13.2)
Repayment of leases (3.9) (9.0)
Dividends paid (10.0) (33.7)
Financing cash flows4 23.3 834.8
Net movement in cash 13.2 2.9
Cash conversion (%)5 88% 71%
1. PP&E also includes IRU payments and other intangibles 2. Predominantly relates to upfront payment to Alcatel Submarine Networks (ASN) for the ASC project 3. Includes acquisition of Nextgen Networks in October 2016, including acquisition and integration costs 4. Financing cash flows include proceeds from pro rata entitlement offer, dividends, change in borrowings and
interest expense on borrowings and leases. Refer to Cash flow statement in the statutory financial statements for further detail
5. Cash conversion % is calculated by dividing adjusted operating cash flow by Statutory EBITDA
Key movements in cash flow over the period include:
Proceeds received in July 2016 from the pro rata renounceable entitlement offer and the drawdown in borrowings used to fund the acquisition of Nextgen Networks in October 2016
Initial capital payments for the ASC cable project
Payments for capital expenditures detailed below in 1.6
Weaker cash conversion was due to negative working capital movements, contributed by:
Lack of discipline around managing working capital
The capitalisation of upfront costs associated with new customer acquisition particularly in the Mass Market
For
per
sona
l use
onl
y
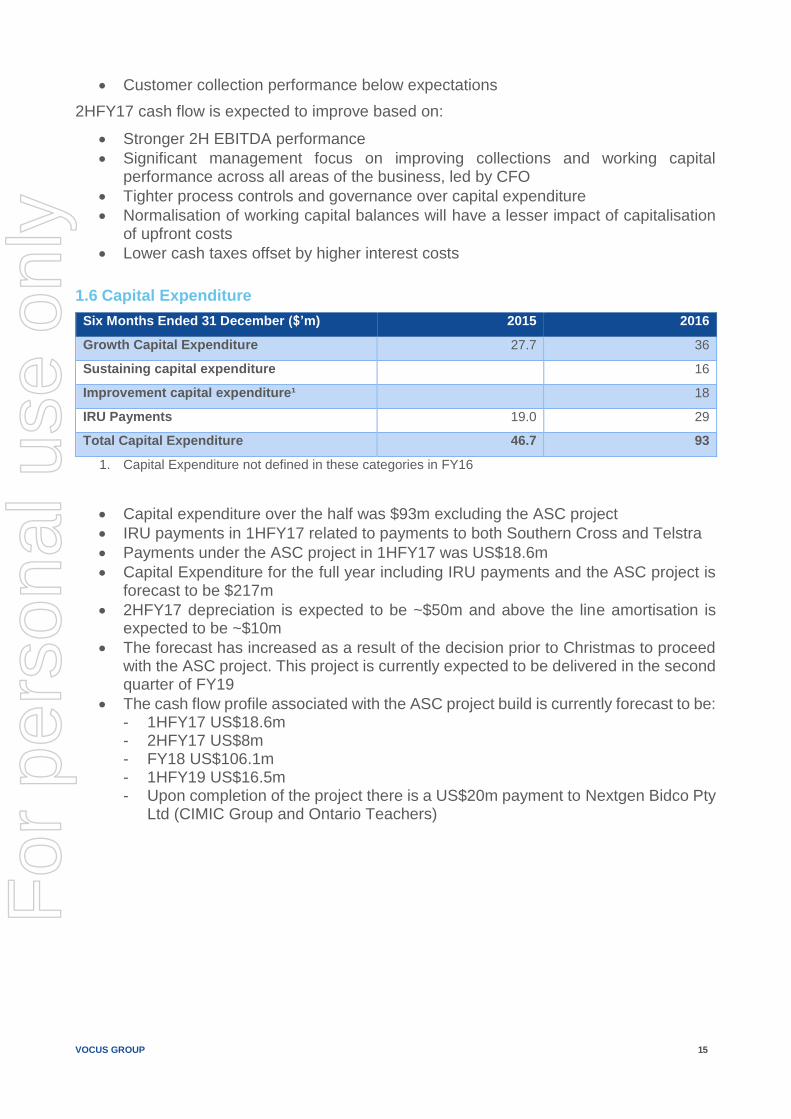
VOCUS GROUP 15
Customer collection performance below expectations
2HFY17 cash flow is expected to improve based on:
Stronger 2H EBITDA performance
Significant management focus on improving collections and working capital performance across all areas of the business, led by CFO
Tighter process controls and governance over capital expenditure
Normalisation of working capital balances will have a lesser impact of capitalisation of upfront costs
Lower cash taxes offset by higher interest costs
1.6 Capital Expenditure
Six Months Ended 31 December ($’m) 2015 2016
Growth Capital Expenditure 27.7 36
Sustaining capital expenditure 16
Improvement capital expenditure¹ 18
IRU Payments 19.0 29
Total Capital Expenditure 46.7 93
1. Capital Expenditure not defined in these categories in FY16
Capital expenditure over the half was $93m excluding the ASC project
IRU payments in 1HFY17 related to payments to both Southern Cross and Telstra
Payments under the ASC project in 1HFY17 was US$18.6m
Capital Expenditure for the full year including IRU payments and the ASC project is forecast to be $217m
2HFY17 depreciation is expected to be ~$50m and above the line amortisation is expected to be ~$10m
The forecast has increased as a result of the decision prior to Christmas to proceed with the ASC project. This project is currently expected to be delivered in the second quarter of FY19
The cash flow profile associated with the ASC project build is currently forecast to be: - 1HFY17 US$18.6m - 2HFY17 US$8m - FY18 US$106.1m - 1HFY19 US$16.5m - Upon completion of the project there is a US$20m payment to Nextgen Bidco Pty
Ltd (CIMIC Group and Ontario Teachers)
For
per
sona
l use
onl
y
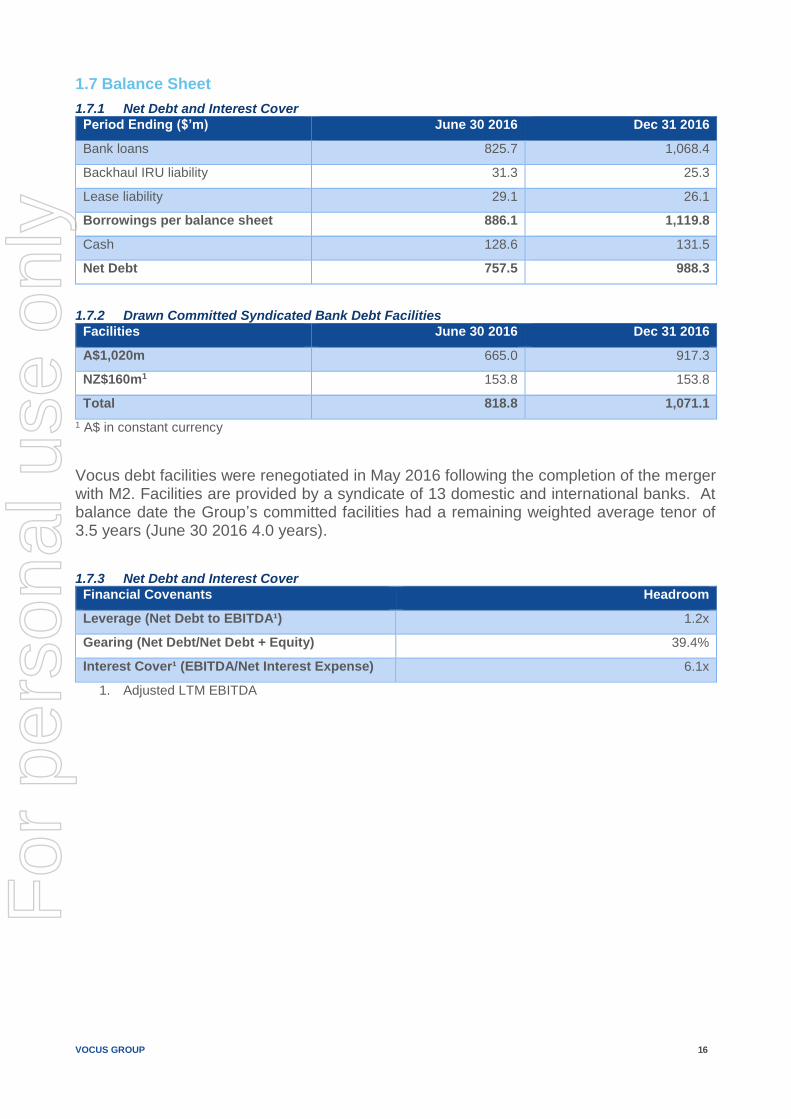
VOCUS GROUP 16
1.7 Balance Sheet
1.7.1 Net Debt and Interest Cover
Period Ending ($’m) June 30 2016 Dec 31 2016
Bank loans 825.7 1,068.4
Backhaul IRU liability 31.3 25.3
Lease liability 29.1 26.1
Borrowings per balance sheet 886.1 1,119.8
Cash 128.6 131.5
Net Debt 757.5 988.3
1.7.2 Drawn Committed Syndicated Bank Debt Facilities
Facilities June 30 2016 Dec 31 2016
A$1,020m 665.0 917.3
NZ$160m1 153.8 153.8
Total 818.8 1,071.1
1 A$ in constant currency
Vocus debt facilities were renegotiated in May 2016 following the completion of the merger with M2. Facilities are provided by a syndicate of 13 domestic and international banks. At balance date the Group’s committed facilities had a remaining weighted average tenor of 3.5 years (June 30 2016 4.0 years).
1.7.3 Net Debt and Interest Cover
Financial Covenants Headroom
Leverage (Net Debt to EBITDA¹) 1.2x
Gearing (Net Debt/Net Debt + Equity) 39.4%
Interest Cover¹ (EBITDA/Net Interest Expense) 6.1x
1. Adjusted LTM EBITDA
For
per
sona
l use
onl
y
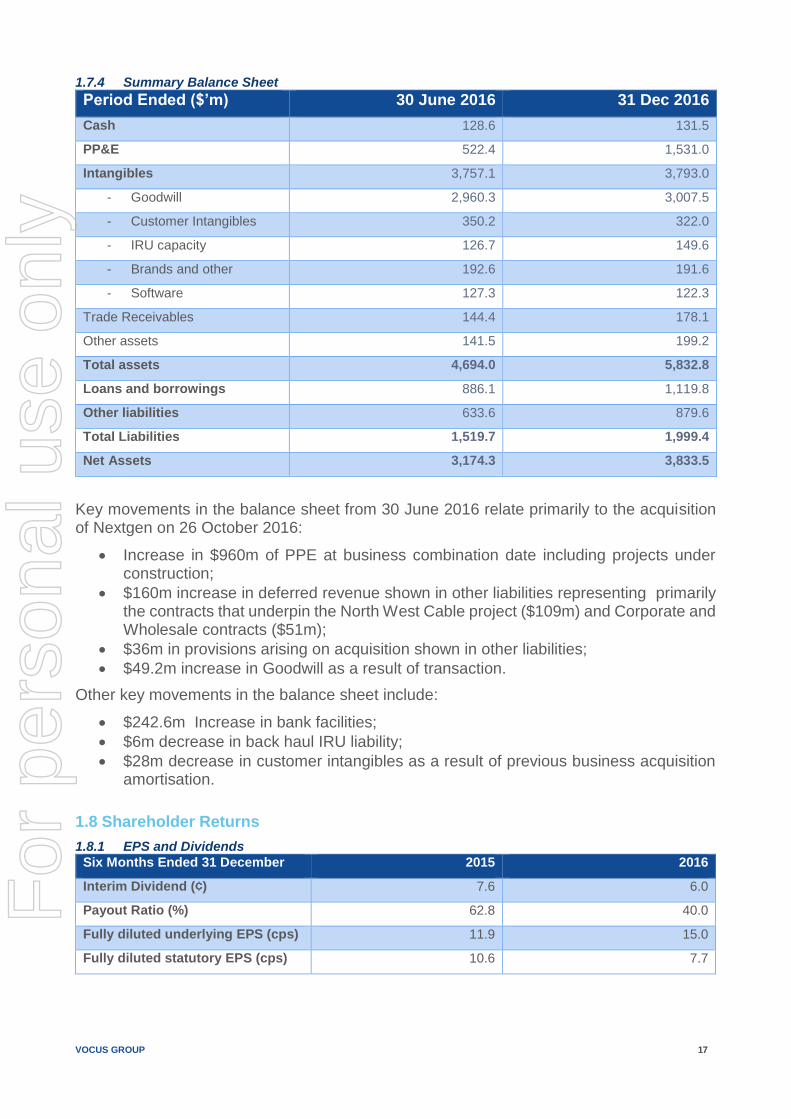
VOCUS GROUP 17
1.7.4 Summary Balance Sheet
Period Ended ($’m) 30 June 2016 31 Dec 2016
Cash 128.6 131.5
PP&E 522.4 1,531.0
Intangibles 3,757.1 3,793.0
- Goodwill 2,960.3 3,007.5
- Customer Intangibles 350.2 322.0
- IRU capacity 126.7 149.6
- Brands and other 192.6 191.6
- Software 127.3 122.3
Trade Receivables 144.4 178.1
Other assets 141.5 199.2
Total assets 4,694.0 5,832.8
Loans and borrowings 886.1 1,119.8
Other liabilities 633.6 879.6
Total Liabilities 1,519.7 1,999.4
Net Assets 3,174.3 3,833.5
Key movements in the balance sheet from 30 June 2016 relate primarily to the acquisition of Nextgen on 26 October 2016:
Increase in $960m of PPE at business combination date including projects under construction;
$160m increase in deferred revenue shown in other liabilities representing primarily the contracts that underpin the North West Cable project ($109m) and Corporate and Wholesale contracts ($51m);
$36m in provisions arising on acquisition shown in other liabilities;
$49.2m increase in Goodwill as a result of transaction.
Other key movements in the balance sheet include:
$242.6m Increase in bank facilities;
$6m decrease in back haul IRU liability;
$28m decrease in customer intangibles as a result of previous business acquisition amortisation.
1.8 Shareholder Returns
1.8.1 EPS and Dividends
Six Months Ended 31 December 2015 2016
Interim Dividend (¢) 7.6 6.0
Payout Ratio (%) 62.8 40.0
Fully diluted underlying EPS (cps) 11.9 15.0
Fully diluted statutory EPS (cps) 10.6 7.7
For
per
sona
l use
onl
y

VOCUS GROUP 18
The Vocus Board declared a fully franked interim dividend per share of 6¢. The Board of Vocus expects to review dividend payments in line with the growth of the business, taking into account the capital requirements and accretive opportunities in M&A and further infrastructure projects.
For
per
sona
l use
onl
y
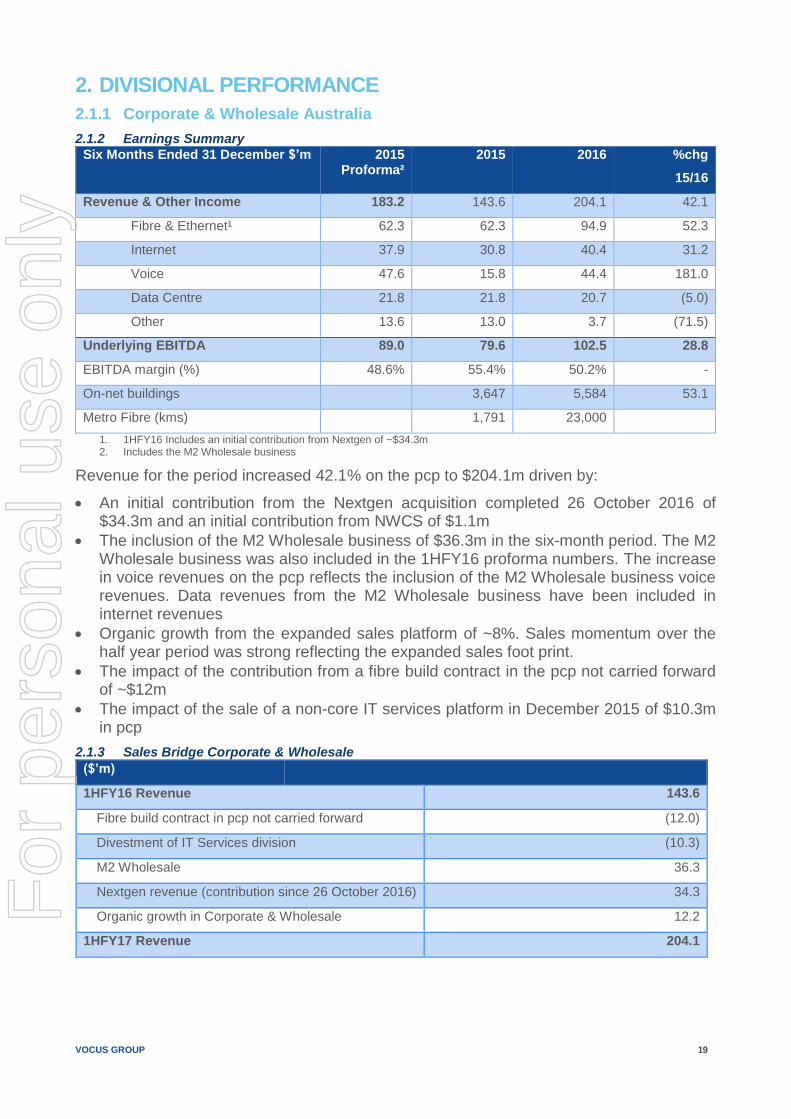
VOCUS GROUP 19
2. DIVISIONAL PERFORMANCE
2.1.1 Corporate & Wholesale Australia
2.1.2 Earnings Summary
Six Months Ended 31 December $’m 2015 Proforma²
2015 2016 %chg
15/16
Revenue & Other Income 183.2 143.6 204.1 42.1
Fibre & Ethernet¹ 62.3 62.3 94.9 52.3
Internet 37.9 30.8 40.4 31.2
Voice 47.6 15.8 44.4 181.0
Data Centre 21.8 21.8 20.7 (5.0)
Other 13.6 13.0 3.7 (71.5)
Underlying EBITDA 89.0 79.6 102.5 28.8
EBITDA margin (%) 48.6% 55.4% 50.2% -
On-net buildings 3,647 5,584 53.1
Metro Fibre (kms) 1,791 23,000
1. 1HFY16 Includes an initial contribution from Nextgen of ~$34.3m 2. Includes the M2 Wholesale business
Revenue for the period increased 42.1% on the pcp to $204.1m driven by:
An initial contribution from the Nextgen acquisition completed 26 October 2016 of $34.3m and an initial contribution from NWCS of $1.1m
The inclusion of the M2 Wholesale business of $36.3m in the six-month period. The M2 Wholesale business was also included in the 1HFY16 proforma numbers. The increase in voice revenues on the pcp reflects the inclusion of the M2 Wholesale business voice revenues. Data revenues from the M2 Wholesale business have been included in internet revenues
Organic growth from the expanded sales platform of ~8%. Sales momentum over the half year period was strong reflecting the expanded sales foot print.
The impact of the contribution from a fibre build contract in the pcp not carried forward of ~$12m
The impact of the sale of a non-core IT services platform in December 2015 of $10.3m in pcp
2.1.3 Sales Bridge Corporate & Wholesale
($’m)
1HFY16 Revenue 143.6
Fibre build contract in pcp not carried forward (12.0)
Divestment of IT Services division (10.3)
M2 Wholesale 36.3
Nextgen revenue (contribution since 26 October 2016) 34.3
Organic growth in Corporate & Wholesale 12.2
1HFY17 Revenue 204.1
For
per
sona
l use
onl
y
VOCUS GROUP 20
Underlying EBITDA increased 28.8% on the pcp to $102.5m. Underlying EBITDA compared to the proforma 1HFY16 revenue increased 15.2% driven by both acquired and organic growth including:
An initial contribution from the Nextgen acquisition of ~$11m before synergies. The business is on track to meet expectations of ~$41m EBITDA before synergies in the FY17 year
The inclusion of the M2 Wholesale business ~$11m
Organic growth in the Corporate & Wholesale business offset to an extent by pressure on pricing and contract cancellations
The impact of additional sales and service delivery resources recruited during the period
Synergies from recent acquisitions
The decline in EBITDA margins over the pcp primarily reflects the inclusion of the lower margin M2 Wholesale business in proforma 1HFY16 and 1HFY17
The contribution from a fibre build contract in the pcp not carried forward of ~$12m
2.1.4 Outlook
Vocus is now focused on leveraging the Nextgen asset base, expanding the product set of the Division and addressable market and optimising the sales and service delivery platforms. The following initiatives are under way:
Next steps in terms of integration of Nextgen occurring and the team structure is now in place
- Day 100 integration complete - Sales team adopting the responsive Vocus sales team strategy and structure
Focus on integrating the Nextgen network with Vocus, Amcom and M2 networks/products to expand product offering and addressable market
- Government sales team and strategy launched - Vocus now on all Federal, State and Territory Government procurement panels
with significant pipeline of opportunities - Launching new products across the merged business platform including third
party services such as NBN - Continue to drive underlying sales momentum and increase focus on the
enterprise and government sectors to drive increased average order value
Continue focus on building provisioning platform and systems to ensure customer service maintained and increase customer engagement
- All service delivery now centralised - Increased focus on development of Vocus One customer engagement portal
Marketing focus on improving awareness and driving penetration of on-net buildings
Recruitment process for Division Director commenced, Executive Director Michael Simmons acting in the role ensuring strong momentum in the division maintained
For
per
sona
l use
onl
y
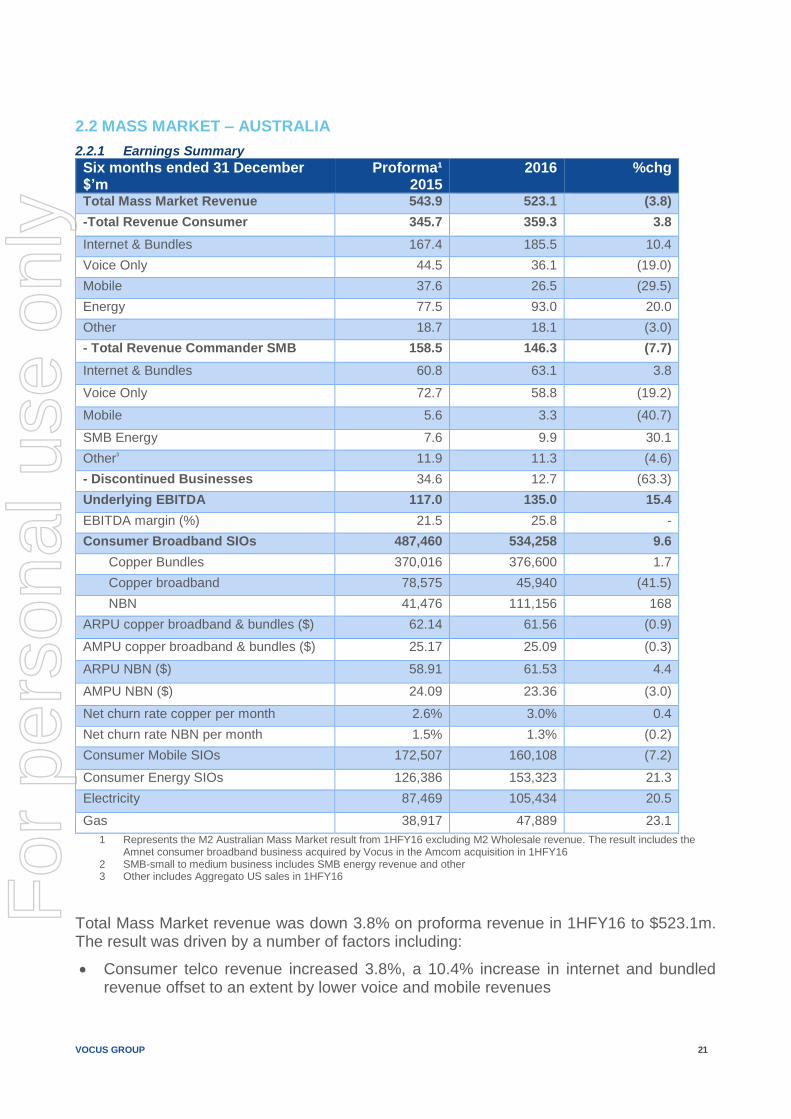
VOCUS GROUP 21
2.2 MASS MARKET – AUSTRALIA
2.2.1 Earnings Summary
Six months ended 31 December $’m
Proforma¹ 2015
2016 %chg
Total Mass Market Revenue 543.9 523.1 (3.8)
-Total Revenue Consumer 345.7 359.3 3.8
Internet & Bundles 167.4 185.5 10.4
Voice Only 44.5 36.1 (19.0)
Mobile 37.6 26.5 (29.5)
Energy 77.5 93.0 20.0
Other 18.7 18.1 (3.0)
- Total Revenue Commander SMB 158.5 146.3 (7.7)
Internet & Bundles 60.8 63.1 3.8
Voice Only 72.7 58.8 (19.2)
Mobile 5.6 3.3 (40.7)
SMB Energy 7.6 9.9 30.1
Other³ 11.9 11.3 (4.6)
- Discontinued Businesses 34.6 12.7 (63.3)
Underlying EBITDA 117.0 135.0 15.4
EBITDA margin (%) 21.5 25.8 -
Consumer Broadband SIOs 487,460 534,258 9.6
Copper Bundles 370,016 376,600 1.7
Copper broadband 78,575 45,940 (41.5)
NBN 41,476 111,156 168
ARPU copper broadband & bundles ($) 62.14 61.56 (0.9)
AMPU copper broadband & bundles ($) 25.17 25.09 (0.3)
ARPU NBN ($) 58.91 61.53 4.4
AMPU NBN ($) 24.09 23.36 (3.0)
Net churn rate copper per month 2.6% 3.0% 0.4
Net churn rate NBN per month 1.5% 1.3% (0.2)
Consumer Mobile SIOs 172,507 160,108 (7.2)
Consumer Energy SIOs 126,386 153,323 21.3
Electricity 87,469 105,434 20.5
Gas 38,917 47,889 23.1
1 Represents the M2 Australian Mass Market result from 1HFY16 excluding M2 Wholesale revenue. The result includes the Amnet consumer broadband business acquired by Vocus in the Amcom acquisition in 1HFY16
2 SMB-small to medium business includes SMB energy revenue and other 3 Other includes Aggregato US sales in 1HFY16
Total Mass Market revenue was down 3.8% on proforma revenue in 1HFY16 to $523.1m. The result was driven by a number of factors including:
Consumer telco revenue increased 3.8%, a 10.4% increase in internet and bundled revenue offset to an extent by lower voice and mobile revenues
For
per
sona
l use
onl
y
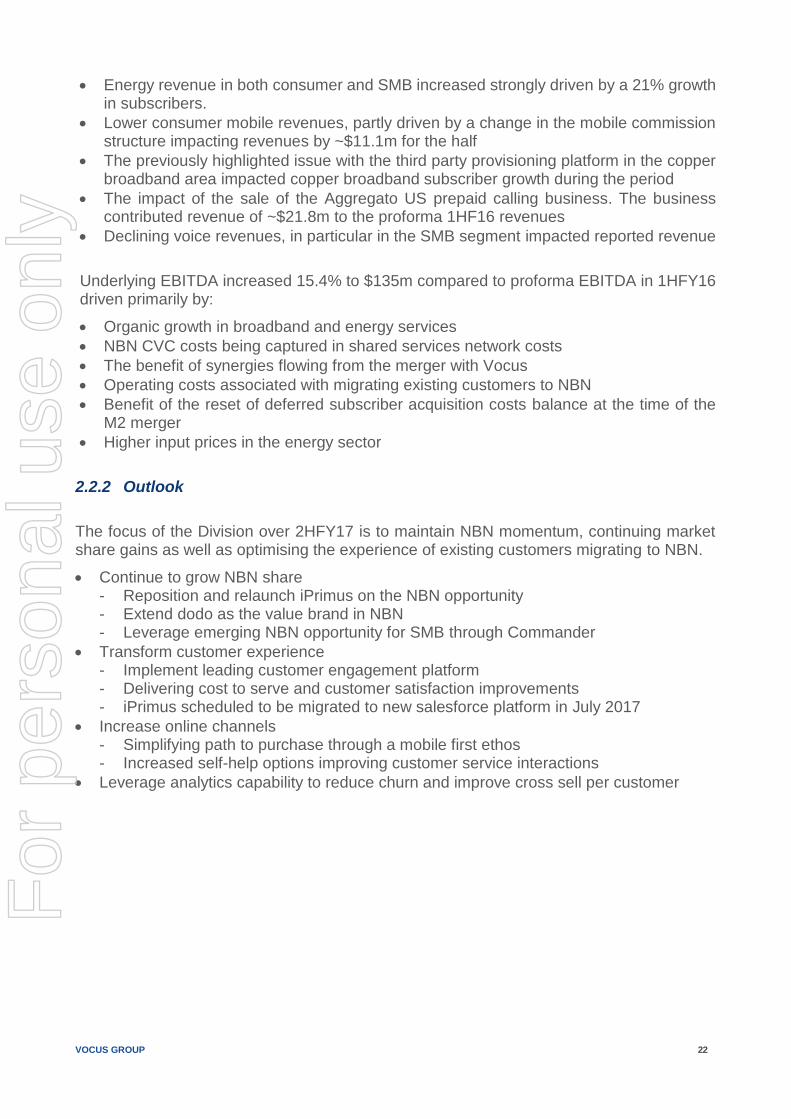
VOCUS GROUP 22
Energy revenue in both consumer and SMB increased strongly driven by a 21% growth in subscribers.
Lower consumer mobile revenues, partly driven by a change in the mobile commission structure impacting revenues by ~$11.1m for the half
The previously highlighted issue with the third party provisioning platform in the copper broadband area impacted copper broadband subscriber growth during the period
The impact of the sale of the Aggregato US prepaid calling business. The business contributed revenue of ~$21.8m to the proforma 1HF16 revenues
Declining voice revenues, in particular in the SMB segment impacted reported revenue
Underlying EBITDA increased 15.4% to $135m compared to proforma EBITDA in 1HFY16 driven primarily by:
Organic growth in broadband and energy services
NBN CVC costs being captured in shared services network costs
The benefit of synergies flowing from the merger with Vocus
Operating costs associated with migrating existing customers to NBN
Benefit of the reset of deferred subscriber acquisition costs balance at the time of the M2 merger
Higher input prices in the energy sector
2.2.2 Outlook
The focus of the Division over 2HFY17 is to maintain NBN momentum, continuing market share gains as well as optimising the experience of existing customers migrating to NBN.
Continue to grow NBN share - Reposition and relaunch iPrimus on the NBN opportunity - Extend dodo as the value brand in NBN - Leverage emerging NBN opportunity for SMB through Commander
Transform customer experience - Implement leading customer engagement platform - Delivering cost to serve and customer satisfaction improvements - iPrimus scheduled to be migrated to new salesforce platform in July 2017
Increase online channels - Simplifying path to purchase through a mobile first ethos - Increased self-help options improving customer service interactions
Leverage analytics capability to reduce churn and improve cross sell per customer
For
per
sona
l use
onl
y
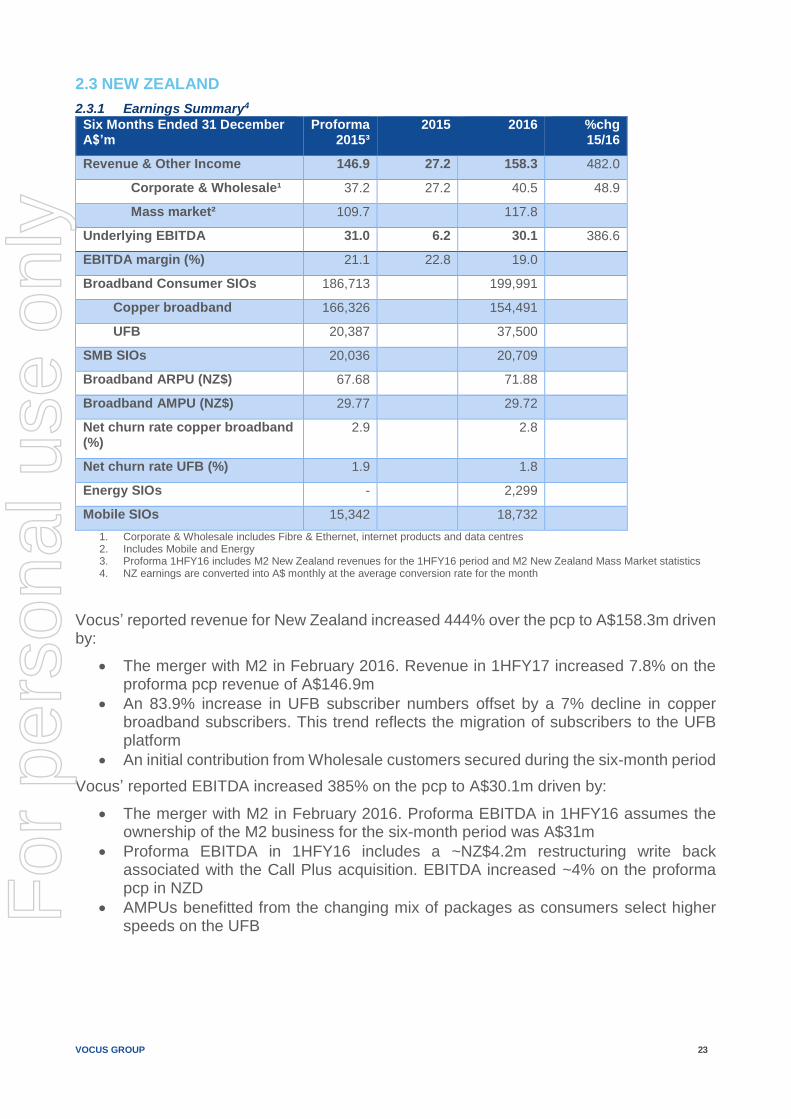
VOCUS GROUP 23
2.3 NEW ZEALAND
2.3.1 Earnings Summary4
Six Months Ended 31 December A$’m
Proforma 2015³
2015 2016 %chg 15/16
Revenue & Other Income 146.9 27.2 158.3 482.0
Corporate & Wholesale¹ 37.2 27.2 40.5 48.9
Mass market² 109.7 117.8
Underlying EBITDA 31.0 6.2 30.1 386.6
EBITDA margin (%) 21.1 22.8 19.0
Broadband Consumer SIOs 186,713 199,991
Copper broadband 166,326 154,491
UFB 20,387 37,500
SMB SIOs 20,036 20,709
Broadband ARPU (NZ$) 67.68 71.88
Broadband AMPU (NZ$) 29.77 29.72
Net churn rate copper broadband (%)
2.9 2.8
Net churn rate UFB (%) 1.9 1.8
Energy SIOs - 2,299
Mobile SIOs 15,342 18,732
1. Corporate & Wholesale includes Fibre & Ethernet, internet products and data centres 2. Includes Mobile and Energy 3. Proforma 1HFY16 includes M2 New Zealand revenues for the 1HFY16 period and M2 New Zealand Mass Market statistics 4. NZ earnings are converted into A$ monthly at the average conversion rate for the month
Vocus’ reported revenue for New Zealand increased 444% over the pcp to A$158.3m driven by:
The merger with M2 in February 2016. Revenue in 1HFY17 increased 7.8% on the proforma pcp revenue of A$146.9m
An 83.9% increase in UFB subscriber numbers offset by a 7% decline in copper broadband subscribers. This trend reflects the migration of subscribers to the UFB platform
An initial contribution from Wholesale customers secured during the six-month period
Vocus’ reported EBITDA increased 385% on the pcp to A$30.1m driven by:
The merger with M2 in February 2016. Proforma EBITDA in 1HFY16 assumes the ownership of the M2 business for the six-month period was A$31m
Proforma EBITDA in 1HFY16 includes a ~NZ$4.2m restructuring write back associated with the Call Plus acquisition. EBITDA increased ~4% on the proforma pcp in NZD
AMPUs benefitted from the changing mix of packages as consumers select higher speeds on the UFB
For
per
sona
l use
onl
y
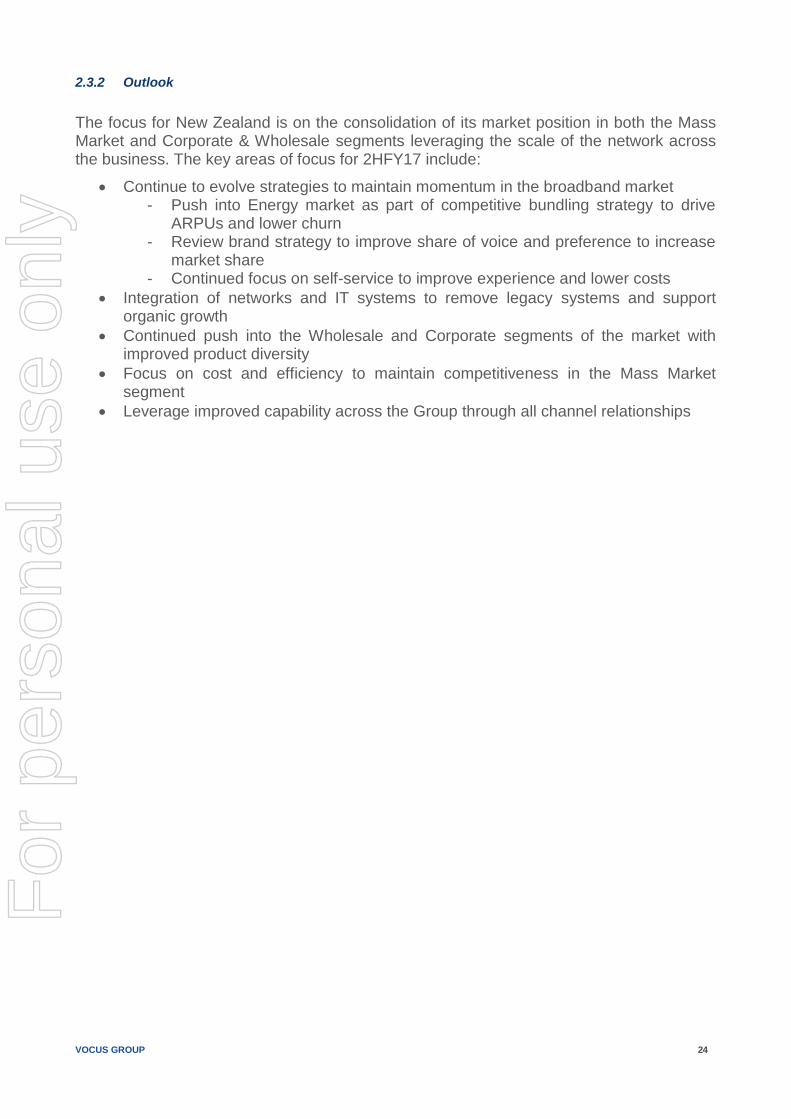
VOCUS GROUP 24
2.3.2 Outlook
The focus for New Zealand is on the consolidation of its market position in both the Mass Market and Corporate & Wholesale segments leveraging the scale of the network across the business. The key areas of focus for 2HFY17 include:
Continue to evolve strategies to maintain momentum in the broadband market - Push into Energy market as part of competitive bundling strategy to drive
ARPUs and lower churn - Review brand strategy to improve share of voice and preference to increase
market share - Continued focus on self-service to improve experience and lower costs
Integration of networks and IT systems to remove legacy systems and support organic growth
Continued push into the Wholesale and Corporate segments of the market with improved product diversity
Focus on cost and efficiency to maintain competitiveness in the Mass Market segment
Leverage improved capability across the Group through all channel relationships
For
per
sona
l use
onl
y
VOCUS GROUP 25
3. GROUP OUTLOOK
Vocus reiterates FY17 guidance of Underlying EBITDA in the range of $430m-$450 driven by: - Full six-month contribution from Nextgen pre synergies expected to be in the range
~$30-35m in 2HFY17 - New Australian wholesale contracts signed in 1HFY17 - Contribution from strong sales momentum in 1HFY17 as provisioning backlog is
resolved - Contribution from subscriber growth in the Australian mass market business - Full six month benefit of growth in NZ UFB subscriber base, new wholesale contracts
and energy business - Further synergy benefits associated with recent acquisitions in particular M2 and
Nextgen
FY17 significant items below the line are expected to be an expense of pre-tax ~$107m including: - Acquisition and integration costs of ~$20m - Non cash amortisation of acquired customer intangibles of ~$61.5m and the
amortisation of acquired software of $26.2m arising from the purchase price allocation process
Capital expenditure for full year now expected to be $217m inclusive of ASC and IRU payments
Business Priorities for 2HFY17 include: - Take Share
o Take advantage of the roll out of the NBN and UFB and continue market share gains
o Leverage our expanded sales platform and product set in the enterprise and government markets
- Grow Shareholder Returns o Manage working capital effectively, all the time o Diligently invest our capital in the core o Deliver on synergies, efficiency safeguards the business
- Be the Most Loved Telco o Simplify our products and processes, automate everything o Put the customer in control with self help o Leverage our data to create actionable customer insights
- Live the values and create a great place to work
For
per
sona
l use
onl
y

22 FEBRUARY 2017
vocusgroup.com.au
FY17 INTERIM RESULTSPRESENTATION
For
per
sona
l use
onl
y
CONTENTS
1. RESULT HIGHLIGHTS CEO • Geoff Horth
2. FINANCIAL OVERVIEW CFO • Mark Wratten
3. BUSINESS UPDATE AND OUTLOOK CEO • Geoff Horth
4. APPENDICES
Further information is available on the Vocus Group website: www.vocusgroup.com.au
2
For
per
sona
l use
onl
y

RESULT
HIGHLIGHTS
CEO • GEOFF HORTH
For
per
sona
l use
onl
y
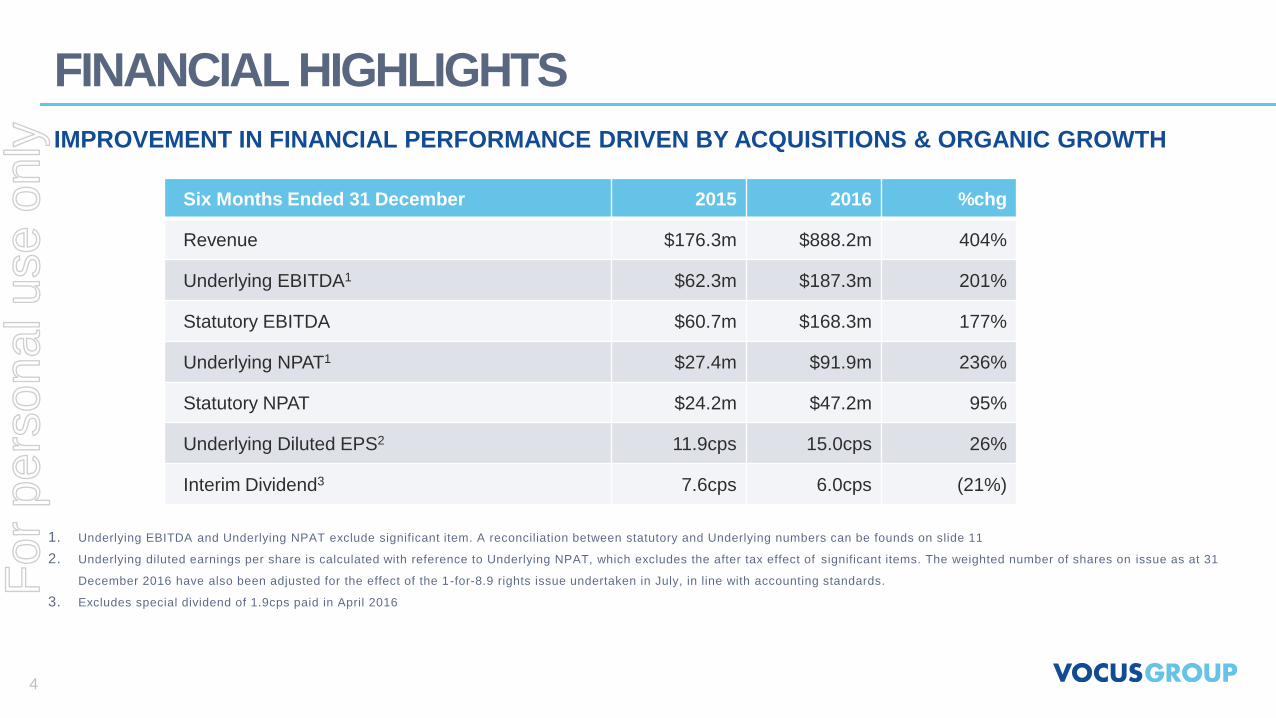
FINANCIAL HIGHLIGHTS
1. Underlying EBITDA and Underlying NPAT exclude significant item. A reconciliation between statutory and Underlying numbers can be founds on slide 11
2. Underlying diluted earnings per share is calculated with reference to Underlying NPAT, which excludes the after tax effect of significant items. The weighted number of shares on issue as at 31
December 2016 have also been adjusted for the effect of the 1-for-8.9 rights issue undertaken in July, in line with accounting standards.
3. Excludes special dividend of 1.9cps paid in April 2016
IMPROVEMENT IN FINANCIAL PERFORMANCE DRIVEN BY ACQUISITIONS & ORGANIC GROWTH
Six Months Ended 31 December 2015 2016 %chg
Revenue $176.3m $888.2m 404%
Underlying EBITDA1 $62.3m $187.3m 201%
Statutory EBITDA $60.7m $168.3m 177%
Underlying NPAT1 $27.4m $91.9m 236%
Statutory NPAT $24.2m $47.2m 95%
Underlying Diluted EPS2 11.9cps 15.0cps 26%
Interim Dividend3 7.6cps 6.0cps (21%)
4
For
per
sona
l use
onl
y
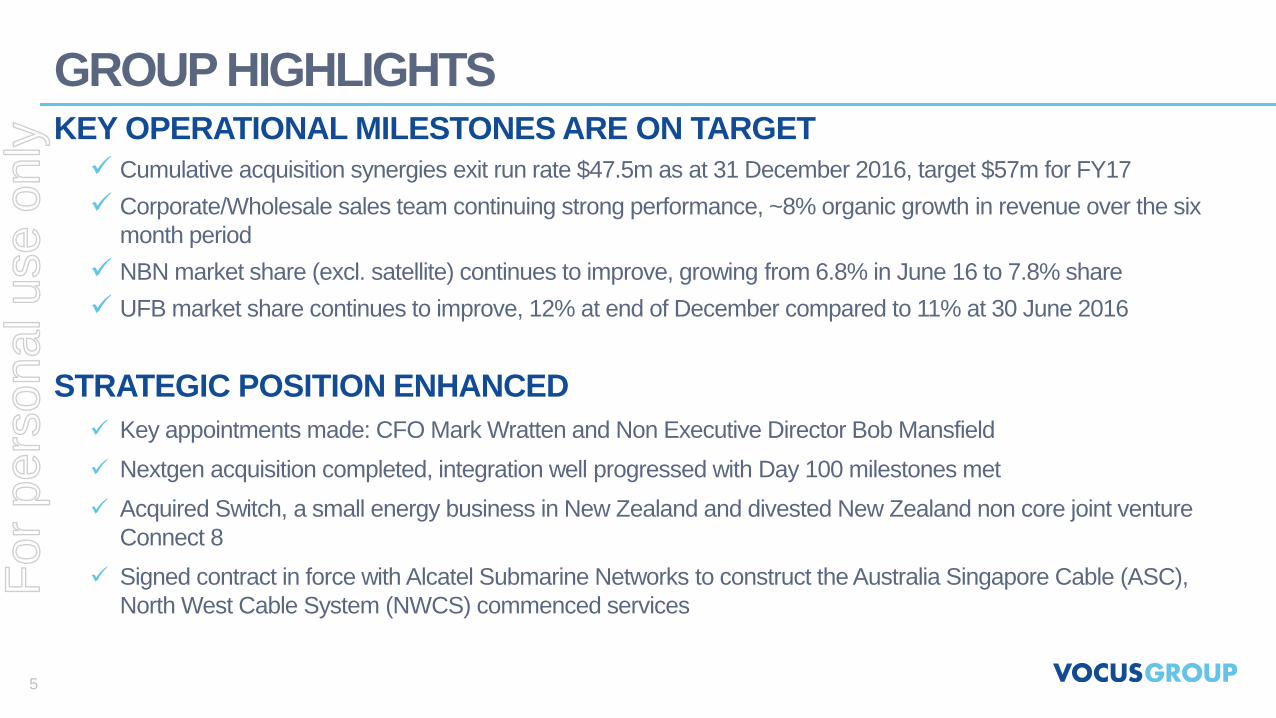
GROUP HIGHLIGHTSKEY OPERATIONAL MILESTONES ARE ON TARGET
Cumulative acquisition synergies exit run rate $47.5m as at 31 December 2016, target $57m for FY17
Corporate/Wholesale sales team continuing strong performance, ~8% organic growth in revenue over the six
month period
NBN market share (excl. satellite) continues to improve, growing from 6.8% in June 16 to 7.8% share
UFB market share continues to improve, 12% at end of December compared to 11% at 30 June 2016
STRATEGIC POSITION ENHANCED
Key appointments made: CFO Mark Wratten and Non Executive Director Bob Mansfield
Nextgen acquisition completed, integration well progressed with Day 100 milestones met
Acquired Switch, a small energy business in New Zealand and divested New Zealand non core joint venture
Connect 8
Signed contract in force with Alcatel Submarine Networks to construct the Australia Singapore Cable (ASC),
North West Cable System (NWCS) commenced services
5
For
per
sona
l use
onl
y
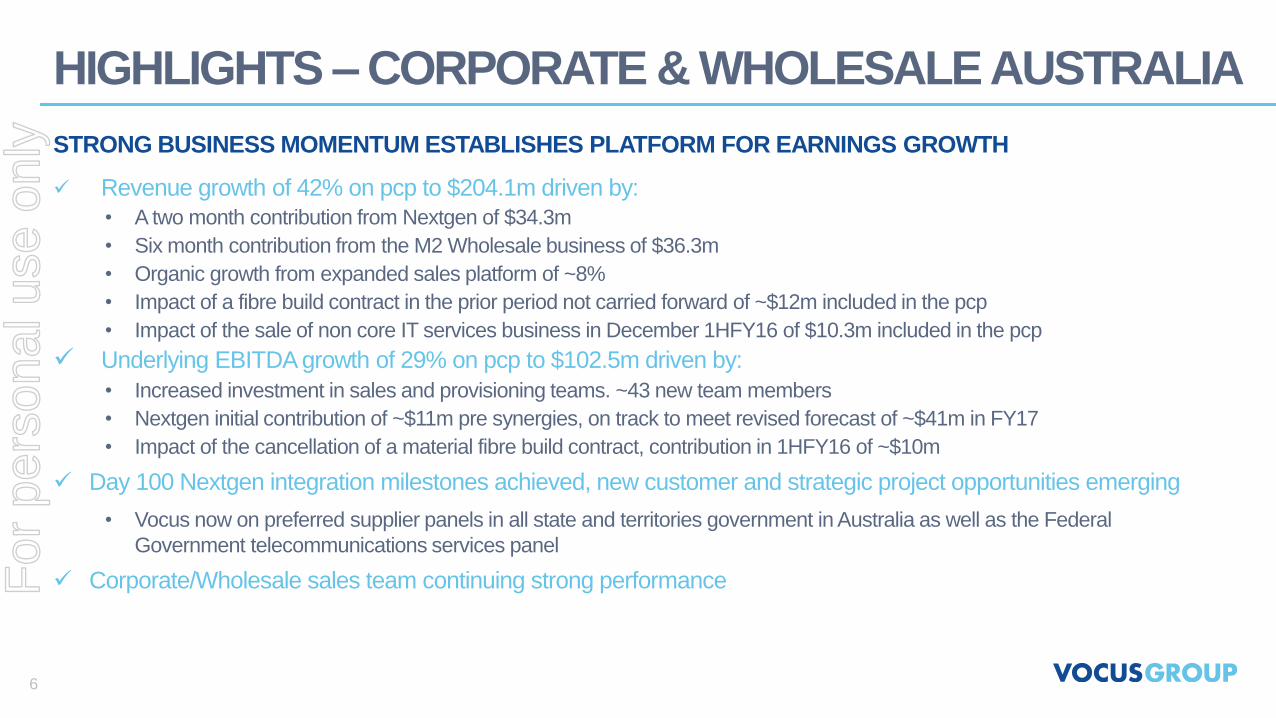
HIGHLIGHTS – CORPORATE & WHOLESALE AUSTRALIA
STRONG BUSINESS MOMENTUM ESTABLISHES PLATFORM FOR EARNINGS GROWTH
Revenue growth of 42% on pcp to $204.1m driven by:
• A two month contribution from Nextgen of $34.3m
• Six month contribution from the M2 Wholesale business of $36.3m
• Organic growth from expanded sales platform of ~8%
• Impact of a fibre build contract in the prior period not carried forward of ~$12m included in the pcp
• Impact of the sale of non core IT services business in December 1HFY16 of $10.3m included in the pcp
Underlying EBITDA growth of 29% on pcp to $102.5m driven by:
• Increased investment in sales and provisioning teams. ~43 new team members
• Nextgen initial contribution of ~$11m pre synergies, on track to meet revised forecast of ~$41m in FY17
• Impact of the cancellation of a material fibre build contract, contribution in 1HFY16 of ~$10m
Day 100 Nextgen integration milestones achieved, new customer and strategic project opportunities emerging
• Vocus now on preferred supplier panels in all state and territories government in Australia as well as the Federal
Government telecommunications services panel
Corporate/Wholesale sales team continuing strong performance
6
For
per
sona
l use
onl
y
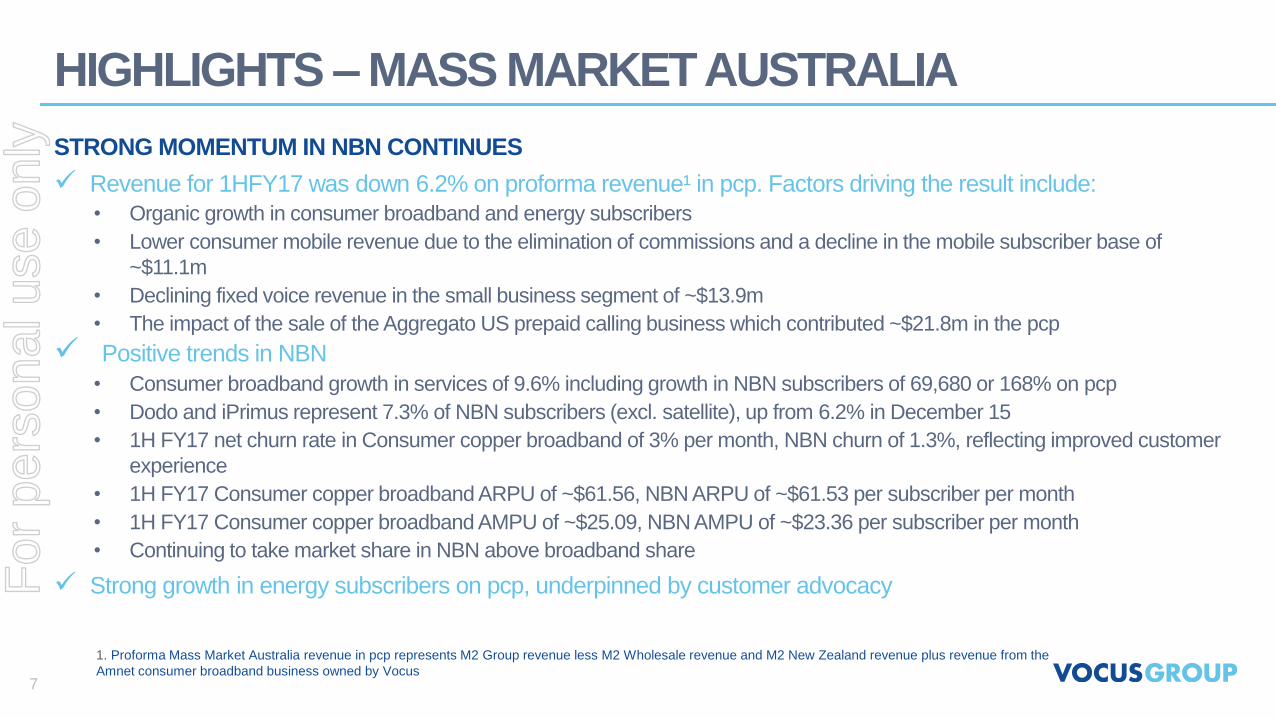
HIGHLIGHTS – MASS MARKET AUSTRALIA
STRONG MOMENTUM IN NBN CONTINUES
Revenue for 1HFY17 was down 6.2% on proforma revenue¹ in pcp. Factors driving the result include:
• Organic growth in consumer broadband and energy subscribers
• Lower consumer mobile revenue due to the elimination of commissions and a decline in the mobile subscriber base of
~$11.1m
• Declining fixed voice revenue in the small business segment of ~$13.9m
• The impact of the sale of the Aggregato US prepaid calling business which contributed ~$21.8m in the pcp
Positive trends in NBN
• Consumer broadband growth in services of 9.6% including growth in NBN subscribers of 69,680 or 168% on pcp
• Dodo and iPrimus represent 7.3% of NBN subscribers (excl. satellite), up from 6.2% in December 15
• 1H FY17 net churn rate in Consumer copper broadband of 3% per month, NBN churn of 1.3%, reflecting improved customer
experience
• 1H FY17 Consumer copper broadband ARPU of ~$61.56, NBN ARPU of ~$61.53 per subscriber per month
• 1H FY17 Consumer copper broadband AMPU of ~$25.09, NBN AMPU of ~$23.36 per subscriber per month
• Continuing to take market share in NBN above broadband share
Strong growth in energy subscribers on pcp, underpinned by customer advocacy
1. Proforma Mass Market Australia revenue in pcp represents M2 Group revenue less M2 Wholesale revenue and M2 New Zealand revenue plus revenue from the
Amnet consumer broadband business owned by Vocus7
For
per
sona
l use
onl
y
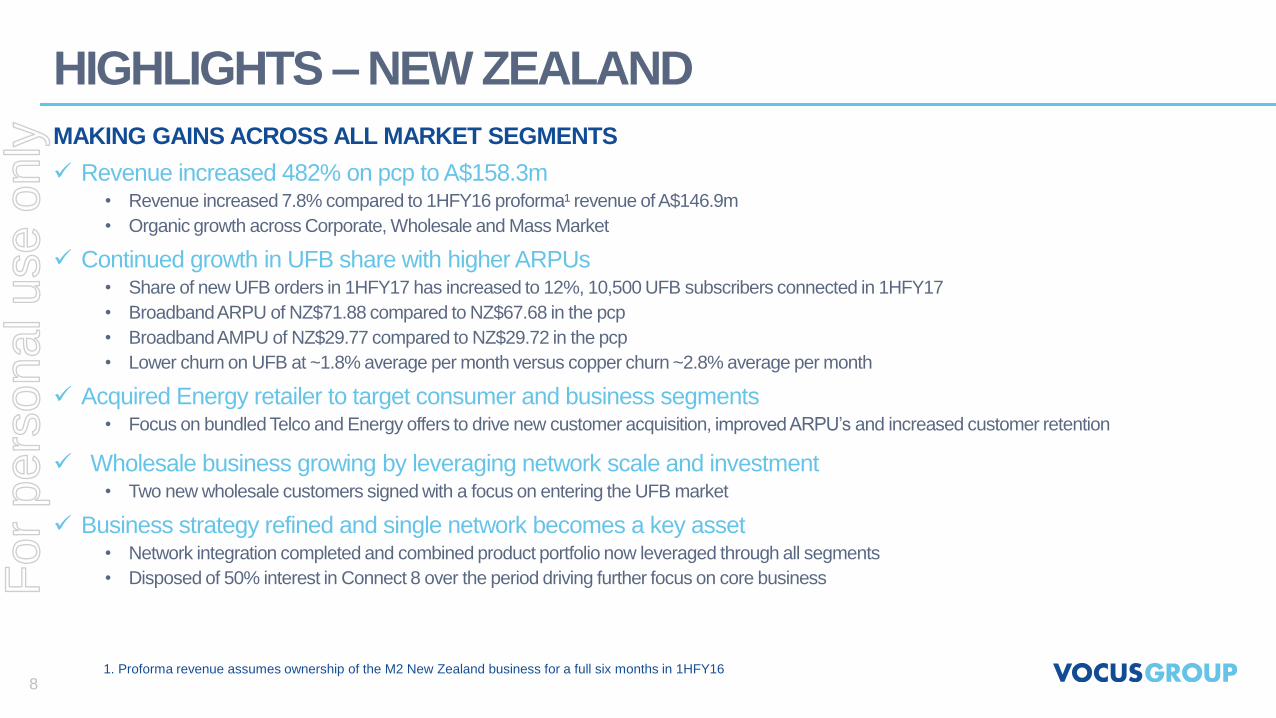
HIGHLIGHTS – NEW ZEALAND
MAKING GAINS ACROSS ALL MARKET SEGMENTS
Revenue increased 482% on pcp to A$158.3m • Revenue increased 7.8% compared to 1HFY16 proforma¹ revenue of A$146.9m
• Organic growth across Corporate, Wholesale and Mass Market
Continued growth in UFB share with higher ARPUs• Share of new UFB orders in 1HFY17 has increased to 12%, 10,500 UFB subscribers connected in 1HFY17
• Broadband ARPU of NZ$71.88 compared to NZ$67.68 in the pcp
• Broadband AMPU of NZ$29.77 compared to NZ$29.72 in the pcp
• Lower churn on UFB at ~1.8% average per month versus copper churn ~2.8% average per month
Acquired Energy retailer to target consumer and business segments • Focus on bundled Telco and Energy offers to drive new customer acquisition, improved ARPU’s and increased customer retention
Wholesale business growing by leveraging network scale and investment • Two new wholesale customers signed with a focus on entering the UFB market
Business strategy refined and single network becomes a key asset• Network integration completed and combined product portfolio now leveraged through all segments
• Disposed of 50% interest in Connect 8 over the period driving further focus on core business
1. Proforma revenue assumes ownership of the M2 New Zealand business for a full six months in 1HFY16
8
For
per
sona
l use
onl
y

FINANCIAL
OVERVIEW
CFO • MARK WRATTEN
For
per
sona
l use
onl
y

FINANCIAL HIGHLIGHTS
IMPROVEMENT IN FINANCIAL PERFORMANCE DRIVEN BY ACQUISITIONS & ORGANIC GROWTH
Six Months Ended 31 December 2015 2016 %chg
Revenue $176.3m $888.2m 404%
Underlying EBITDA1 $62.3m $187.3m 201%
Statutory EBITDA $60.7m $168.3m 177%
Underlying NPAT1 $27.4m $91.9m 236%
Statutory NPAT $24.2m $47.2m 95%
Underlying Diluted EPS2 11.9cps 15.0cps 26%
Interim Dividend3 7.6cps 6.0cps (21%)
10
1. Underlying EBITDA and Underlying NPAT exclude significant items. A reconciliation between statutory and Underlying numbers can be founds on slide 11
2. Underlying diluted earnings per share is calculated with reference to Underlying NPAT, which excludes the after tax effect of significant items. The weighted number of shares on issue as at 31
December 2016 have also been adjusted for the effect of the 1-for-8.9 rights issue undertaken in July, in line with accounting standards.
3. Excludes special dividend of 1.9cps paid in April 2016
For
per
sona
l use
onl
y
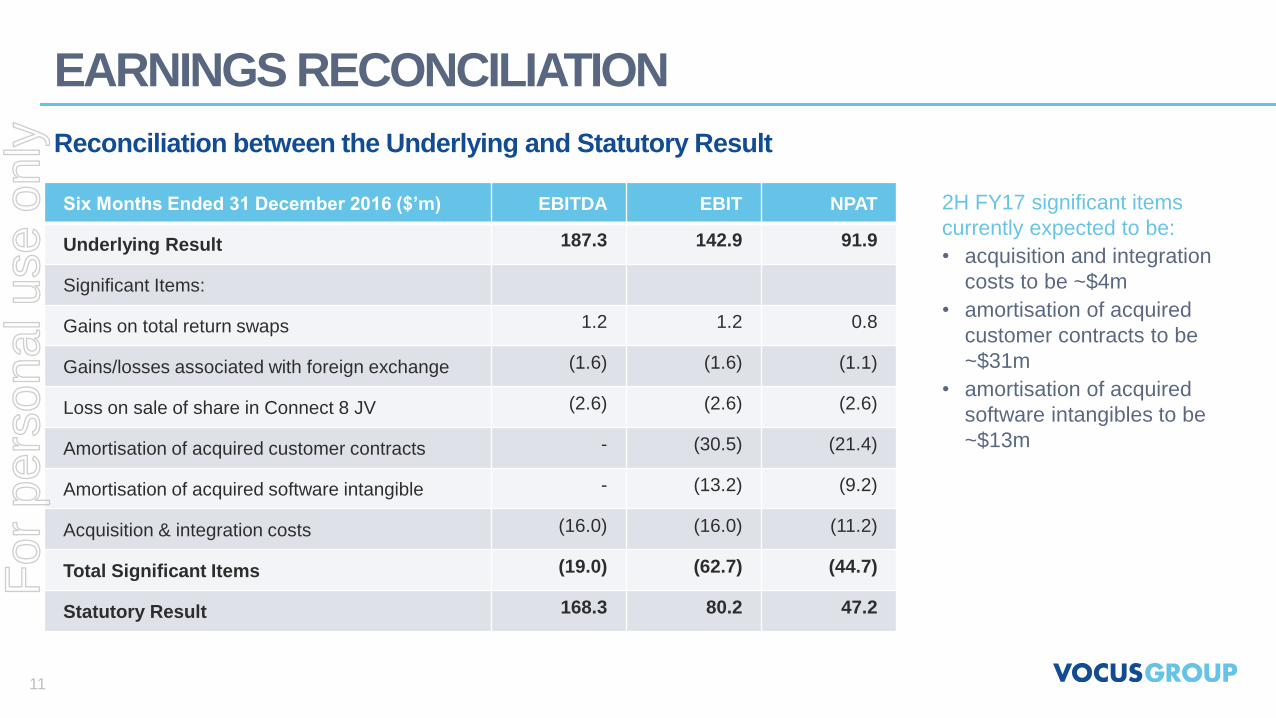
EARNINGS RECONCILIATION
Reconciliation between the Underlying and Statutory Result
Six Months Ended 31 December 2016 ($’m) EBITDA EBIT NPAT
Underlying Result 187.3 142.9 91.9
Significant Items:
Gains on total return swaps 1.2 1.2 0.8
Gains/losses associated with foreign exchange (1.6) (1.6) (1.1)
Loss on sale of share in Connect 8 JV (2.6) (2.6) (2.6)
Amortisation of acquired customer contracts - (30.5) (21.4)
Amortisation of acquired software intangible - (13.2) (9.2)
Acquisition & integration costs (16.0) (16.0) (11.2)
Total Significant Items (19.0) (62.7) (44.7)
Statutory Result 168.3 80.2 47.2
2H FY17 significant items
currently expected to be:
• acquisition and integration
costs to be ~$4m
• amortisation of acquired
customer contracts to be
~$31m
• amortisation of acquired
software intangibles to be
~$13m
11
For
per
sona
l use
onl
y

CASHFLOW AND WORKING CAPITAL
12
• Weaker cash conversion was due to negative
working capital movements, contributed by:
• Lack of discipline around managing working capital
• The capitalisation of upfront costs associated with new
customer acquisition particularly in the Mass Market
• Customer collection performance below expectations
• 2HFY17 cash flow is expected to improve based on:
• Stronger 2H EBITDA performance
• Significant management focus on improving collections
and working capital performance across all areas of the
business, led by CFO
• Tighter process controls and governance over capital
expenditure
• Normalisation of working capital balances will have a
lesser impact of capitalisation of upfront costs
• Lower cash taxes offset by higher interest costs
1. PP&E also includes IRU payments and other intangibles
2. Predominantly relates to upfront payment to Alcatel Submarine Networks (ASN) for the ASC project
3. Includes acquisition of Nextgen Networks in October 2016, including acquisition and integration costs
4. Financing cash flows include proceeds from pro rata entitlement offer, dividends, change in borrowings and interest
expense on borrowings and leases. Refer to Cash flow statement in the statutory financial statements for further detail
5. Cash conversion % is calculated by dividing adjusted operating cash flow by Statutory EBITDA
Six months ended 31 December ($’m) 2015 2016
Statutory EBITDA 60.7 168.3
Net cash from operating activities 44.7 95.3
Interest, finance costs, tax and JV distribution 8.5 24.5
Adjusted operating cash flow 53.2 119.8
Net interest and finance costs 0.3 0.7
Income taxes paid (8.7) (25.9)
JV partnership distributions received - 0.8
Net cash from operating activities 44.7 95.3
Payments for property plant & equipment1 (27.7) (52.3)
Payments related to undersea cable projects2 - (25.8)
Net business acquisitions3 (15.7) (817.8)
Intangibles payments and proceeds (21.0) (32.0)
Other cash flows from investing activities 9.5 0.8
Investing cash flows (54.8) (927.2)
Financing cash flows4 23.3 834.8
Net movement in cash 13.2 2.9
Cash conversion (%)5 88% 71%For
per
sona
l use
onl
y
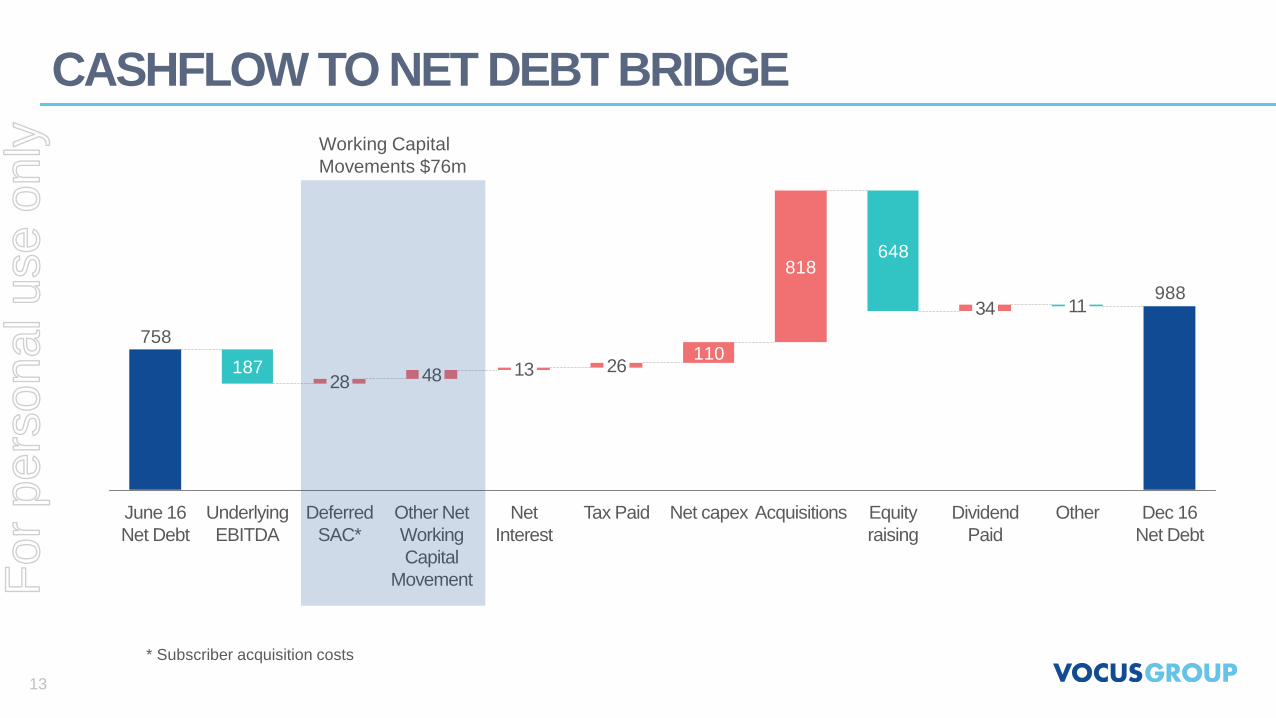
CASHFLOW TO NET DEBT BRIDGE
13
648
988
818
110758
187
Acquisitions Equity
raising
2628
Deferred
SAC*
Dividend
Paid
Other Net
Working
Capital
Movement
Net
Interest
Tax Paid Net capexJune 16
Net Debt
Underlying
EBITDA
Dec 16
Net Debt
Other
34 11
1348
Working Capital
Movements $76m
* Subscriber acquisition costs
For
per
sona
l use
onl
y
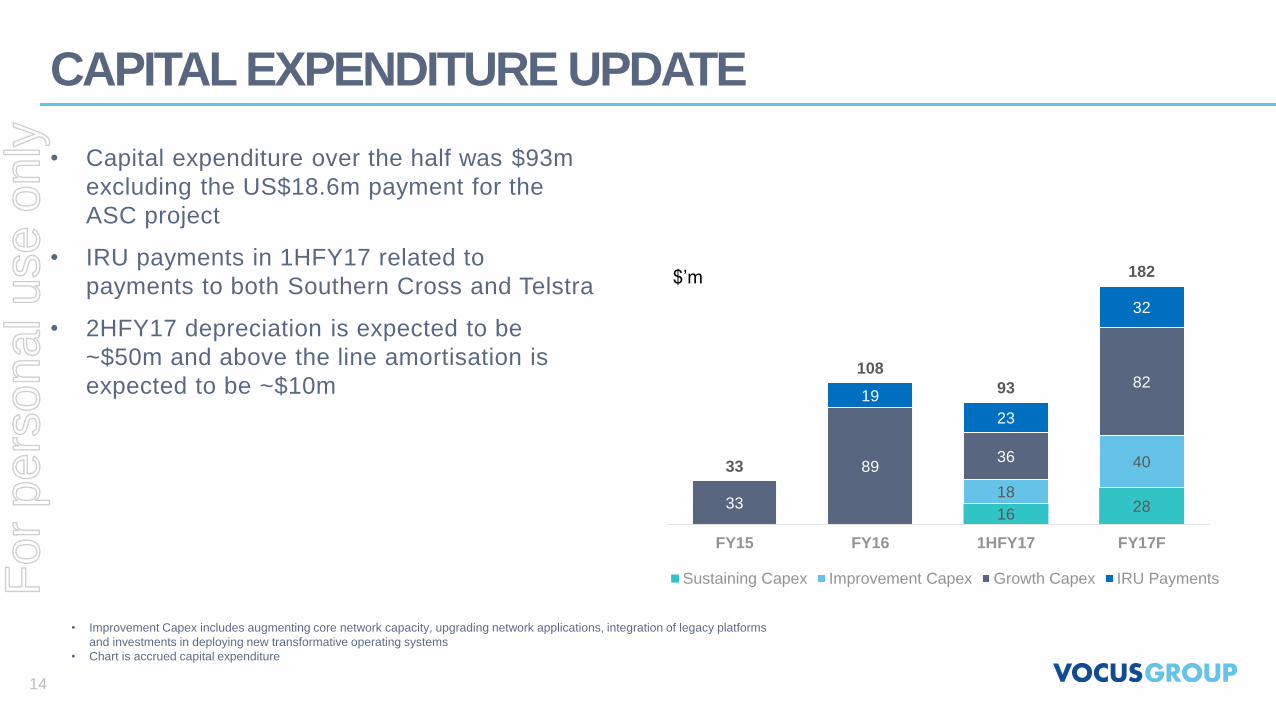
CAPITAL EXPENDITURE UPDATE
• Capital expenditure over the half was $93m
excluding the US$18.6m payment for the
ASC project
• IRU payments in 1HFY17 related to
payments to both Southern Cross and Telstra
• 2HFY17 depreciation is expected to be
~$50m and above the line amortisation is
expected to be ~$10m
• Improvement Capex includes augmenting core network capacity, upgrading network applications, integration of legacy platforms
and investments in deploying new transformative operating systems
• Chart is accrued capital expenditure
1628
18
40
33
8936
8219
23
32
33
108
93
182
FY15 FY16 1HFY17 FY17F
Sustaining Capex Improvement Capex Growth Capex IRU Payments
$’m
14
For
per
sona
l use
onl
y
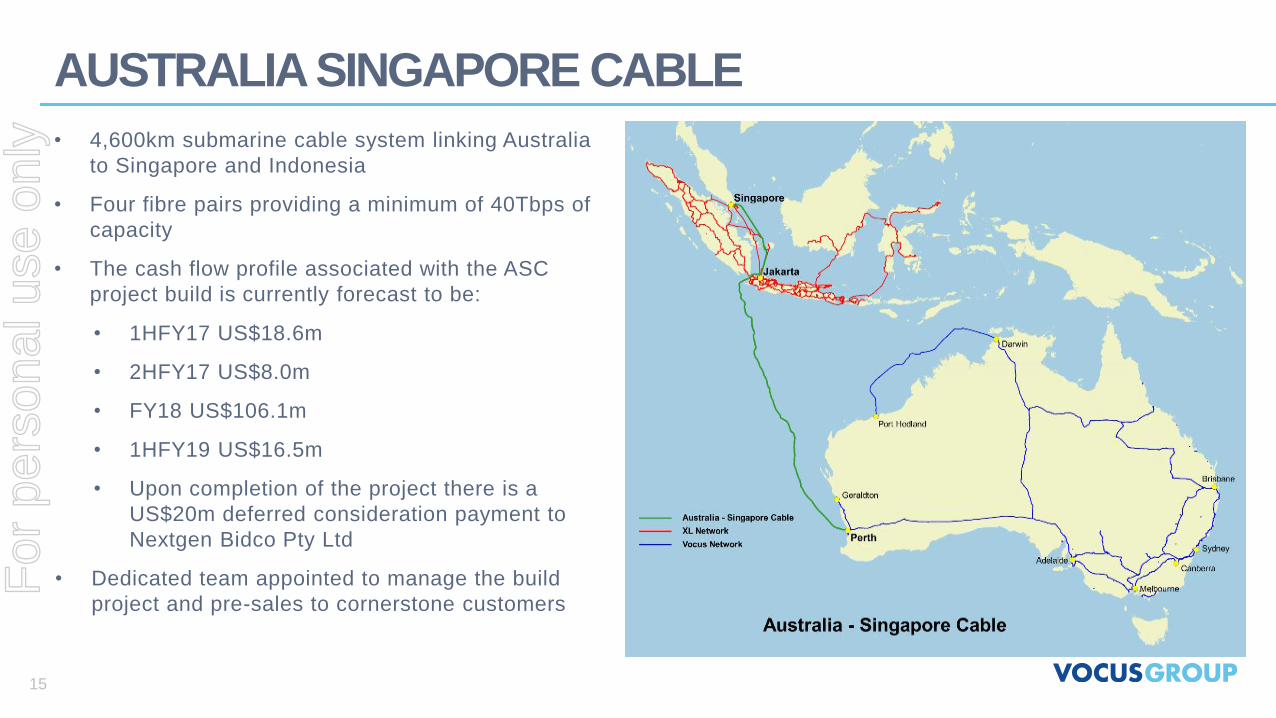
AUSTRALIA SINGAPORE CABLE
• 4,600km submarine cable system linking Australia
to Singapore and Indonesia
• Four fibre pairs providing a minimum of 40Tbps of
capacity
• The cash flow profile associated with the ASC
project build is currently forecast to be:
• 1HFY17 US$18.6m
• 2HFY17 US$8.0m
• FY18 US$106.1m
• 1HFY19 US$16.5m
• Upon completion of the project there is a
US$20m deferred consideration payment to
Nextgen Bidco Pty Ltd
• Dedicated team appointed to manage the build
project and pre-sales to cornerstone customers
15
For
per
sona
l use
onl
y

• Network consolidation ongoing
• Achieved stated $15 million run rate in annualised cost
synergies
• Integration of the network with Amcom, Nextgen and Vocus
commenced
• Focus on delivering synergy targets of $40 million by the end
of FY18
• Ongoing review of business requirements
• Focus on delivering synergy targets of $30 million by the end
of FY20
ACQUISITION SYNERGIES ON TRACK
16
1. Run rate at the end of the period
10 15 15 15 15 158
23.7 2840 40 40
8.814
26 28 30
18
47.5
57
8183 85
FY16 1HFY17 FY17F FY18F FY19F FY20F
Forecast Run Rate Of Cumulative Acquisition Synergies¹
Amcom M2 NextGen Total
$’m
For
per
sona
l use
onl
y
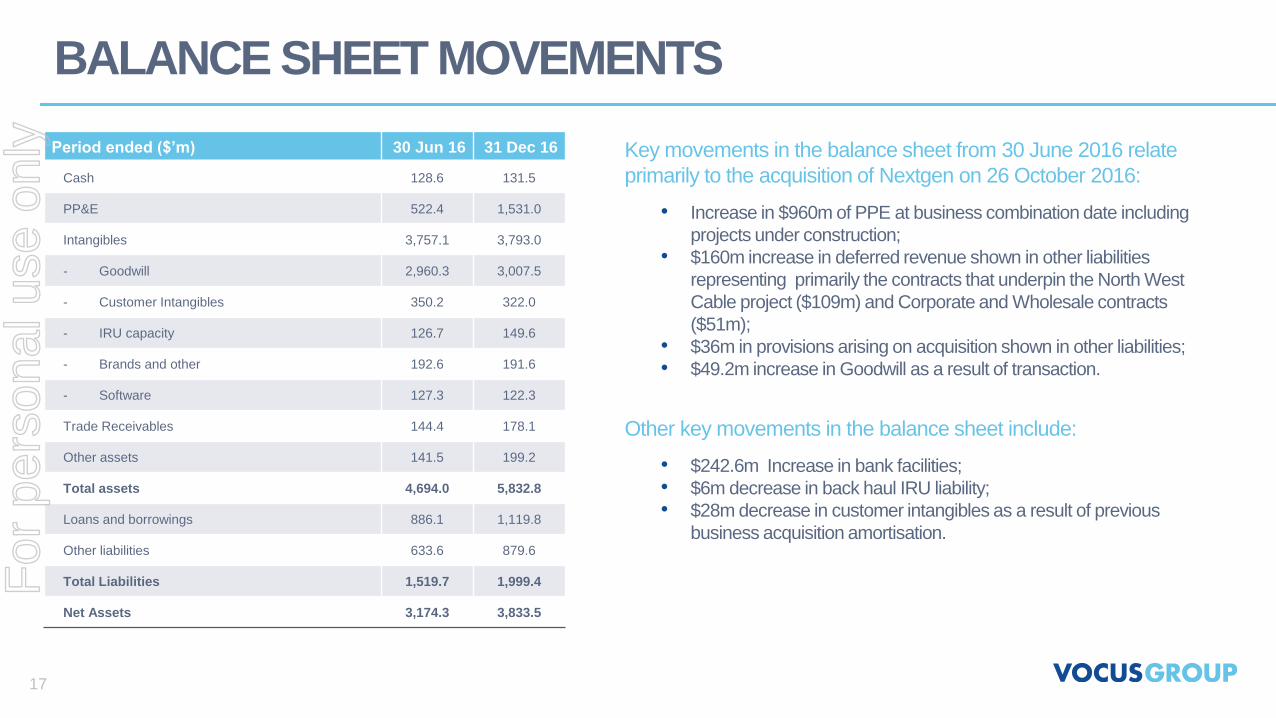
BALANCE SHEET MOVEMENTS
17
Key movements in the balance sheet from 30 June 2016 relate
primarily to the acquisition of Nextgen on 26 October 2016:
• Increase in $960m of PPE at business combination date including
projects under construction;
• $160m increase in deferred revenue shown in other liabilities
representing primarily the contracts that underpin the North West
Cable project ($109m) and Corporate and Wholesale contracts
($51m);
• $36m in provisions arising on acquisition shown in other liabilities;
• $49.2m increase in Goodwill as a result of transaction.
Other key movements in the balance sheet include:
• $242.6m Increase in bank facilities;
• $6m decrease in back haul IRU liability;
• $28m decrease in customer intangibles as a result of previous
business acquisition amortisation.
Period ended ($’m) 30 Jun 16 31 Dec 16
Cash 128.6 131.5
PP&E 522.4 1,531.0
Intangibles 3,757.1 3,793.0
- Goodwill 2,960.3 3,007.5
- Customer Intangibles 350.2 322.0
- IRU capacity 126.7 149.6
- Brands and other 192.6 191.6
- Software 127.3 122.3
Trade Receivables 144.4 178.1
Other assets 141.5 199.2
Total assets 4,694.0 5,832.8
Loans and borrowings 886.1 1,119.8
Other liabilities 633.6 879.6
Total Liabilities 1,519.7 1,999.4
Net Assets 3,174.3 3,833.5
For
per
sona
l use
onl
y
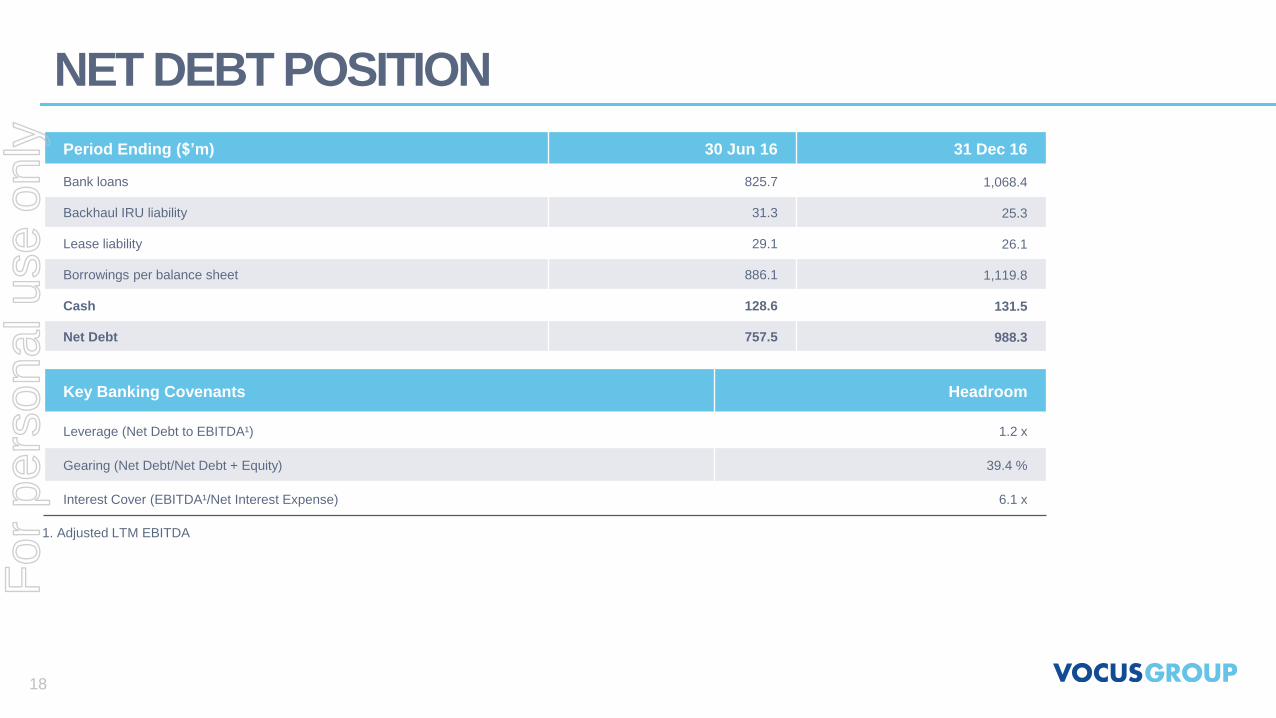
NET DEBT POSITION
18
1. Adjusted LTM EBITDA
Period Ending ($’m) 30 Jun 16 31 Dec 16
Bank loans 825.7 1,068.4
Backhaul IRU liability 31.3 25.3
Lease liability 29.1 26.1
Borrowings per balance sheet 886.1 1,119.8
Cash 128.6 131.5
Net Debt 757.5 988.3
Key Banking Covenants Headroom
Leverage (Net Debt to EBITDA¹) 1.2 x
Gearing (Net Debt/Net Debt + Equity) 39.4 %
Interest Cover (EBITDA¹/Net Interest Expense) 6.1 x
For
per
sona
l use
onl
y
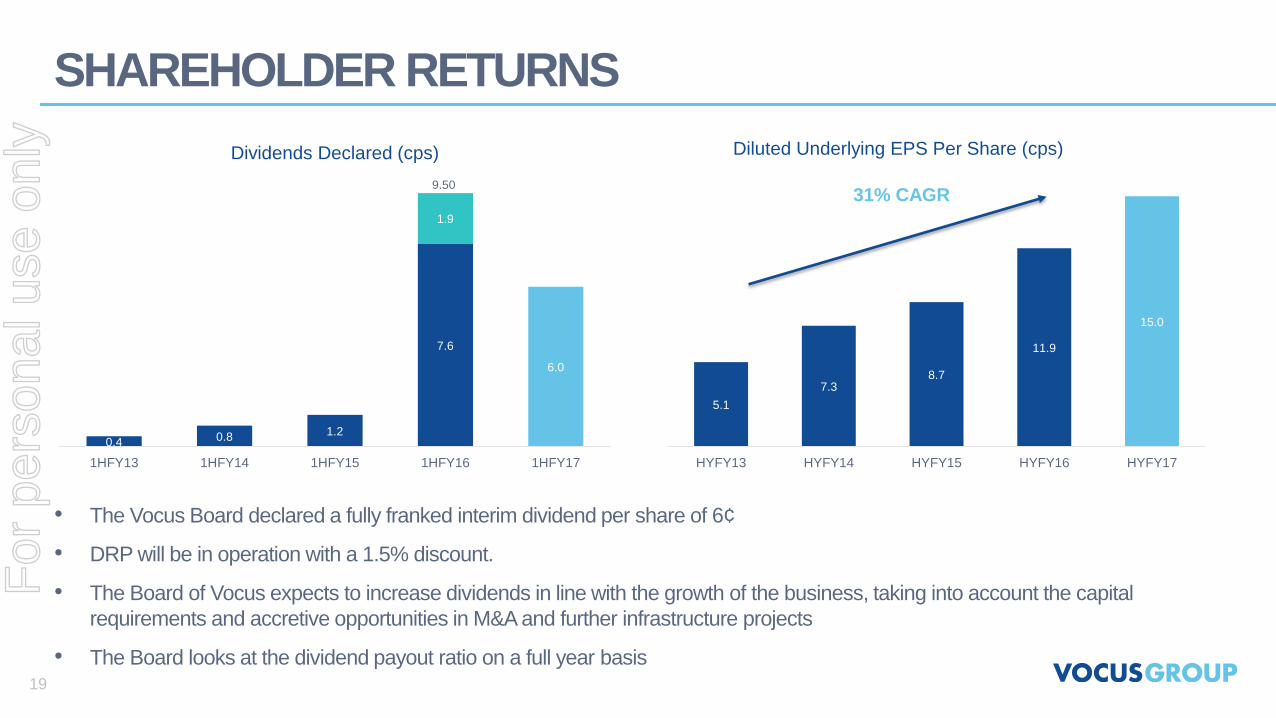
SHAREHOLDER RETURNS
19
• The Vocus Board declared a fully franked interim dividend per share of 6¢
• DRP will be in operation with a 1.5% discount.
• The Board of Vocus expects to increase dividends in line with the growth of the business, taking into account the capital
requirements and accretive opportunities in M&A and further infrastructure projects
• The Board looks at the dividend payout ratio on a full year basis
5.1
7.38.7
11.9
15.0
HYFY13 HYFY14 HYFY15 HYFY16 HYFY17
Diluted Underlying EPS Per Share (cps)
0.4 0.8 1.2
7.6
6.0
1.9
1HFY13 1HFY14 1HFY15 1HFY16 1HFY17
Dividends Declared (cps)
9.5031% CAGR
For
per
sona
l use
onl
y

BUSINESS
UPDATE &
OUTLOOK
CEO • GEOFF HORTHFor
per
sona
l use
onl
y
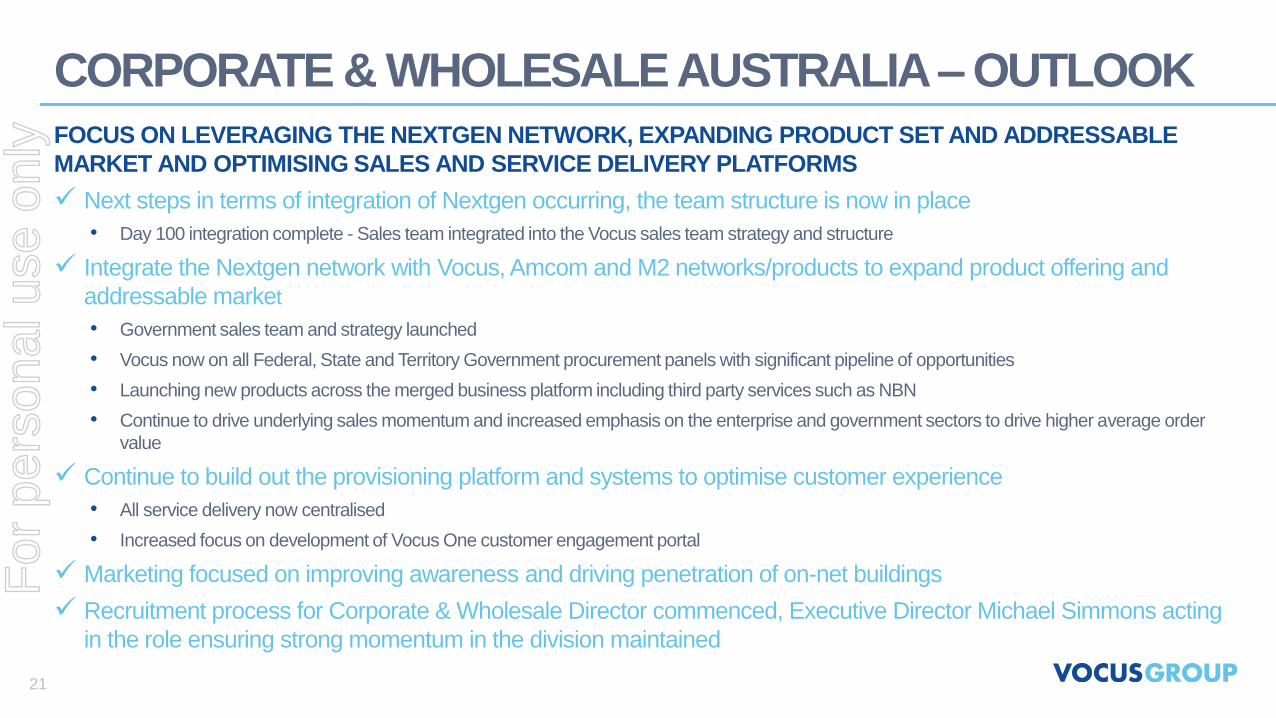
CORPORATE & WHOLESALE AUSTRALIA – OUTLOOK
21
FOCUS ON LEVERAGING THE NEXTGEN NETWORK, EXPANDING PRODUCT SET AND ADDRESSABLE
MARKET AND OPTIMISING SALES AND SERVICE DELIVERY PLATFORMS
Next steps in terms of integration of Nextgen occurring, the team structure is now in place
• Day 100 integration complete - Sales team integrated into the Vocus sales team strategy and structure
Integrate the Nextgen network with Vocus, Amcom and M2 networks/products to expand product offering and
addressable market
• Government sales team and strategy launched
• Vocus now on all Federal, State and Territory Government procurement panels with significant pipeline of opportunities
• Launching new products across the merged business platform including third party services such as NBN
• Continue to drive underlying sales momentum and increased emphasis on the enterprise and government sectors to drive higher average order
value
Continue to build out the provisioning platform and systems to optimise customer experience
• All service delivery now centralised
• Increased focus on development of Vocus One customer engagement portal
Marketing focused on improving awareness and driving penetration of on-net buildings
Recruitment process for Corporate & Wholesale Director commenced, Executive Director Michael Simmons acting
in the role ensuring strong momentum in the division maintained
For
per
sona
l use
onl
y
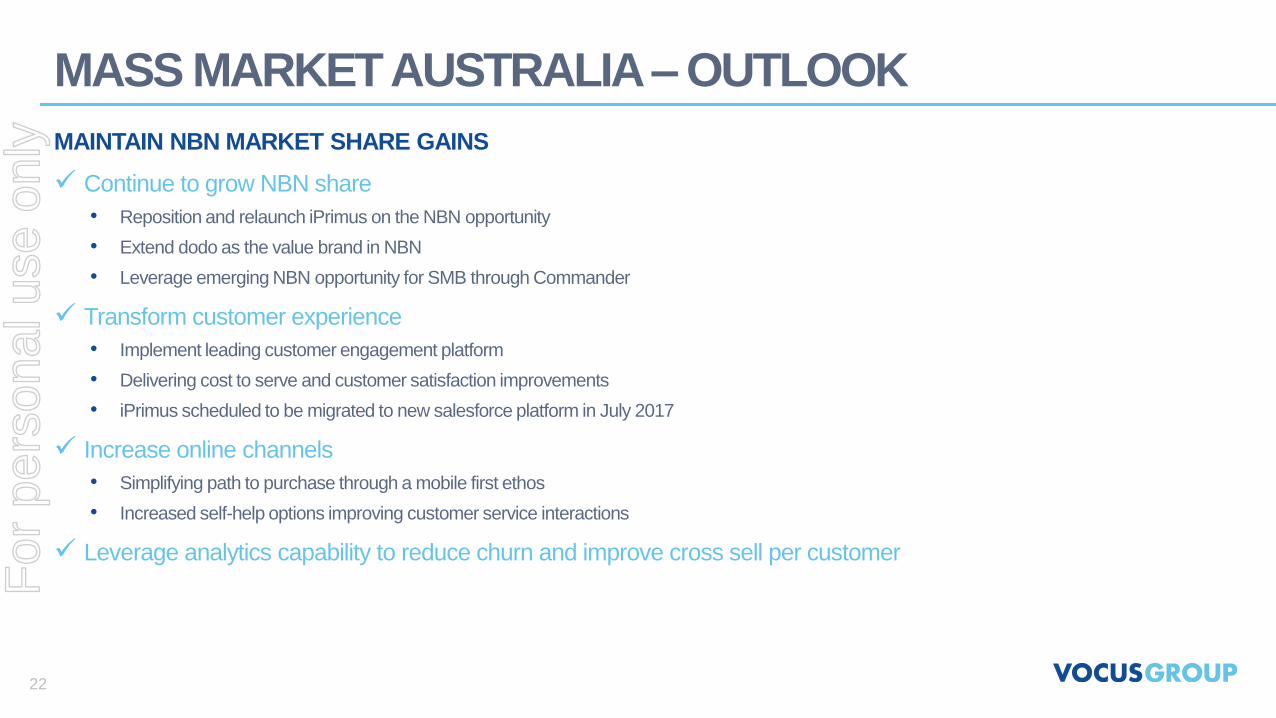
MASS MARKET AUSTRALIA – OUTLOOK
MAINTAIN NBN MARKET SHARE GAINS
Continue to grow NBN share
• Reposition and relaunch iPrimus on the NBN opportunity
• Extend dodo as the value brand in NBN
• Leverage emerging NBN opportunity for SMB through Commander
Transform customer experience
• Implement leading customer engagement platform
• Delivering cost to serve and customer satisfaction improvements
• iPrimus scheduled to be migrated to new salesforce platform in July 2017
Increase online channels
• Simplifying path to purchase through a mobile first ethos
• Increased self-help options improving customer service interactions
Leverage analytics capability to reduce churn and improve cross sell per customer
22
For
per
sona
l use
onl
y
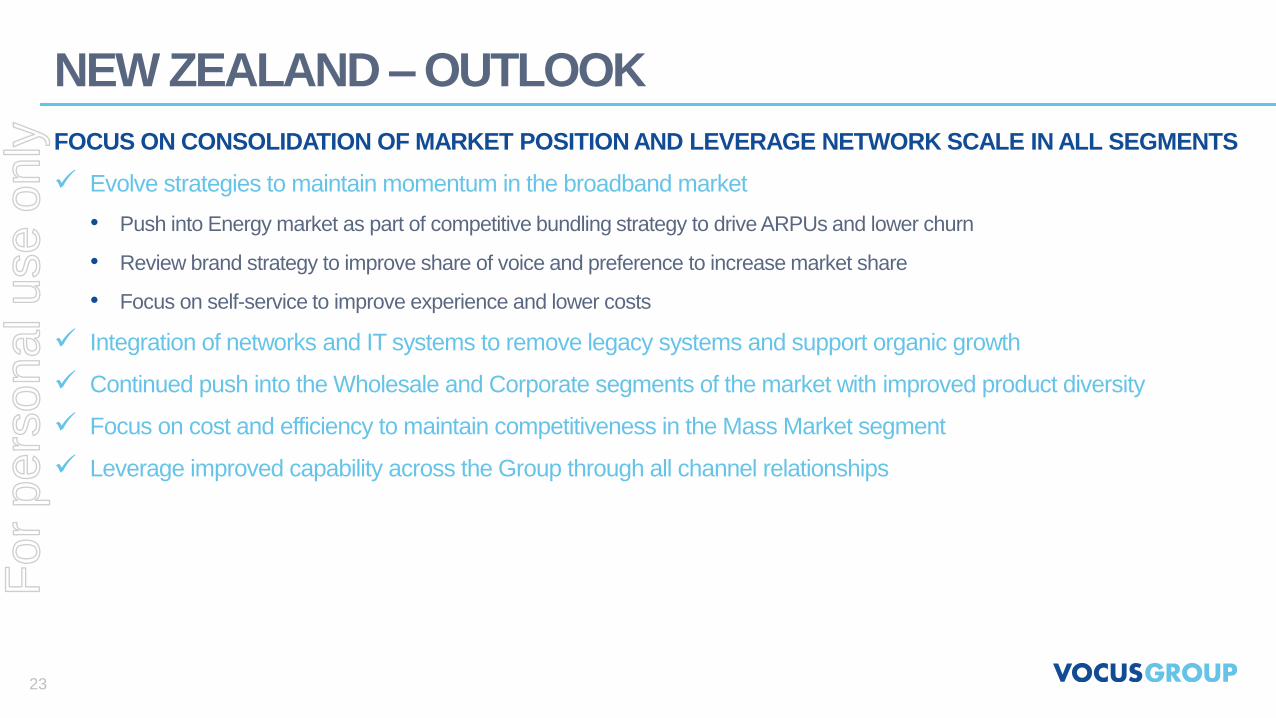
NEW ZEALAND – OUTLOOK
23
FOCUS ON CONSOLIDATION OF MARKET POSITION AND LEVERAGE NETWORK SCALE IN ALL SEGMENTS
Evolve strategies to maintain momentum in the broadband market
• Push into Energy market as part of competitive bundling strategy to drive ARPUs and lower churn
• Review brand strategy to improve share of voice and preference to increase market share
• Focus on self-service to improve experience and lower costs
Integration of networks and IT systems to remove legacy systems and support organic growth
Continued push into the Wholesale and Corporate segments of the market with improved product diversity
Focus on cost and efficiency to maintain competitiveness in the Mass Market segment
Leverage improved capability across the Group through all channel relationships
For
per
sona
l use
onl
y
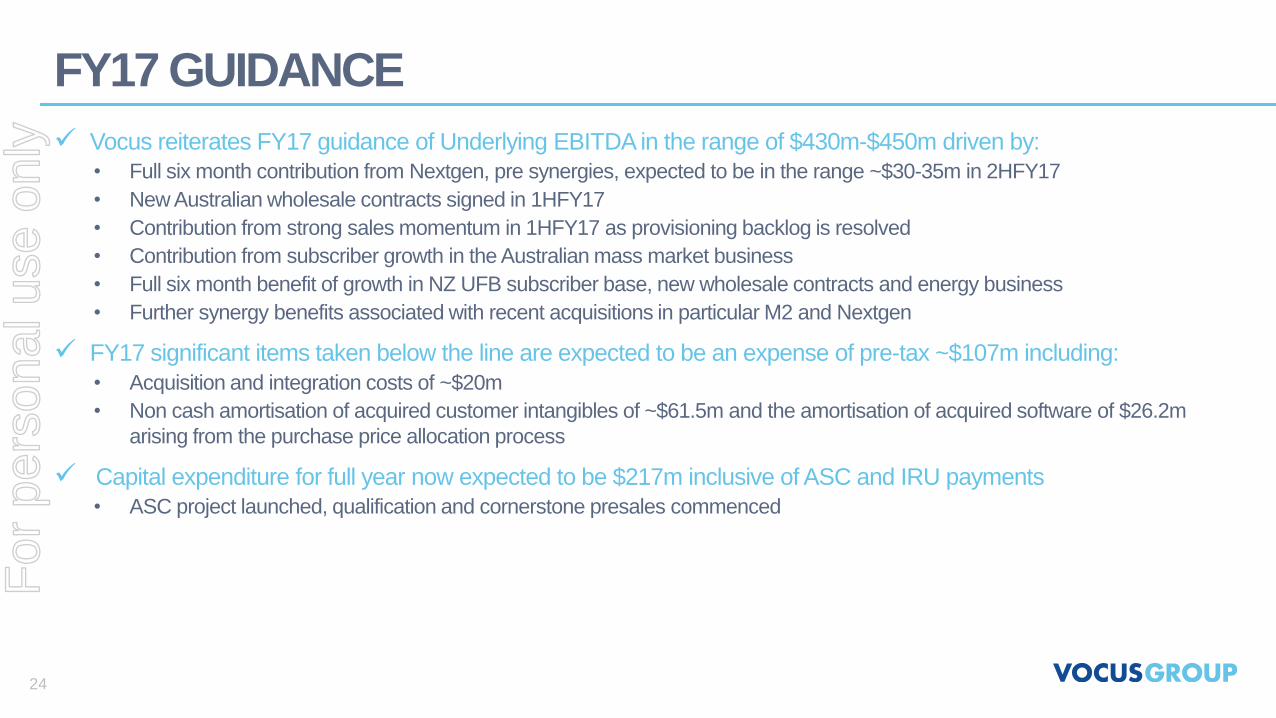
FY17 GUIDANCE
24
Vocus reiterates FY17 guidance of Underlying EBITDA in the range of $430m-$450m driven by:
• Full six month contribution from Nextgen, pre synergies, expected to be in the range ~$30-35m in 2HFY17
• New Australian wholesale contracts signed in 1HFY17
• Contribution from strong sales momentum in 1HFY17 as provisioning backlog is resolved
• Contribution from subscriber growth in the Australian mass market business
• Full six month benefit of growth in NZ UFB subscriber base, new wholesale contracts and energy business
• Further synergy benefits associated with recent acquisitions in particular M2 and Nextgen
FY17 significant items taken below the line are expected to be an expense of pre-tax ~$107m including:
• Acquisition and integration costs of ~$20m
• Non cash amortisation of acquired customer intangibles of ~$61.5m and the amortisation of acquired software of $26.2m
arising from the purchase price allocation process
Capital expenditure for full year now expected to be $217m inclusive of ASC and IRU payments
• ASC project launched, qualification and cornerstone presales commenced
For
per
sona
l use
onl
y
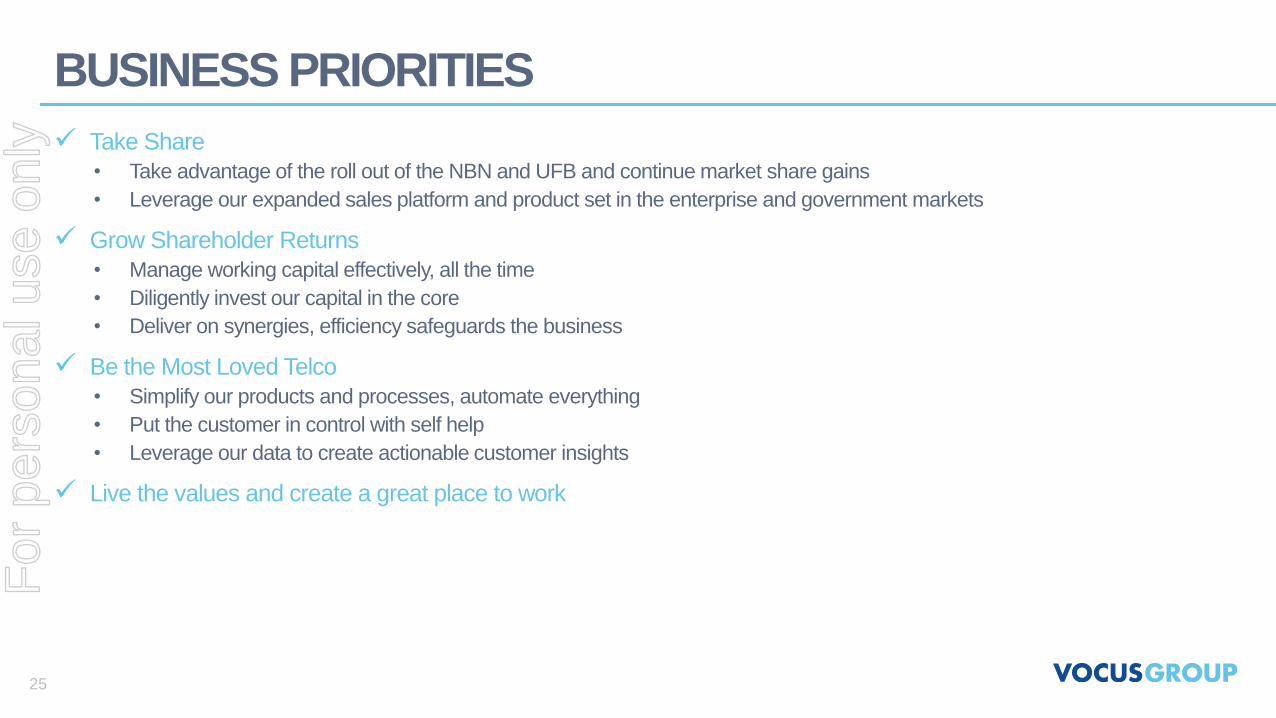
BUSINESS PRIORITIES
Take Share
• Take advantage of the roll out of the NBN and UFB and continue market share gains
• Leverage our expanded sales platform and product set in the enterprise and government markets
Grow Shareholder Returns
• Manage working capital effectively, all the time
• Diligently invest our capital in the core
• Deliver on synergies, efficiency safeguards the business
Be the Most Loved Telco
• Simplify our products and processes, automate everything
• Put the customer in control with self help
• Leverage our data to create actionable customer insights
Live the values and create a great place to work
25
For
per
sona
l use
onl
y

APPENDICES
For
per
sona
l use
onl
y
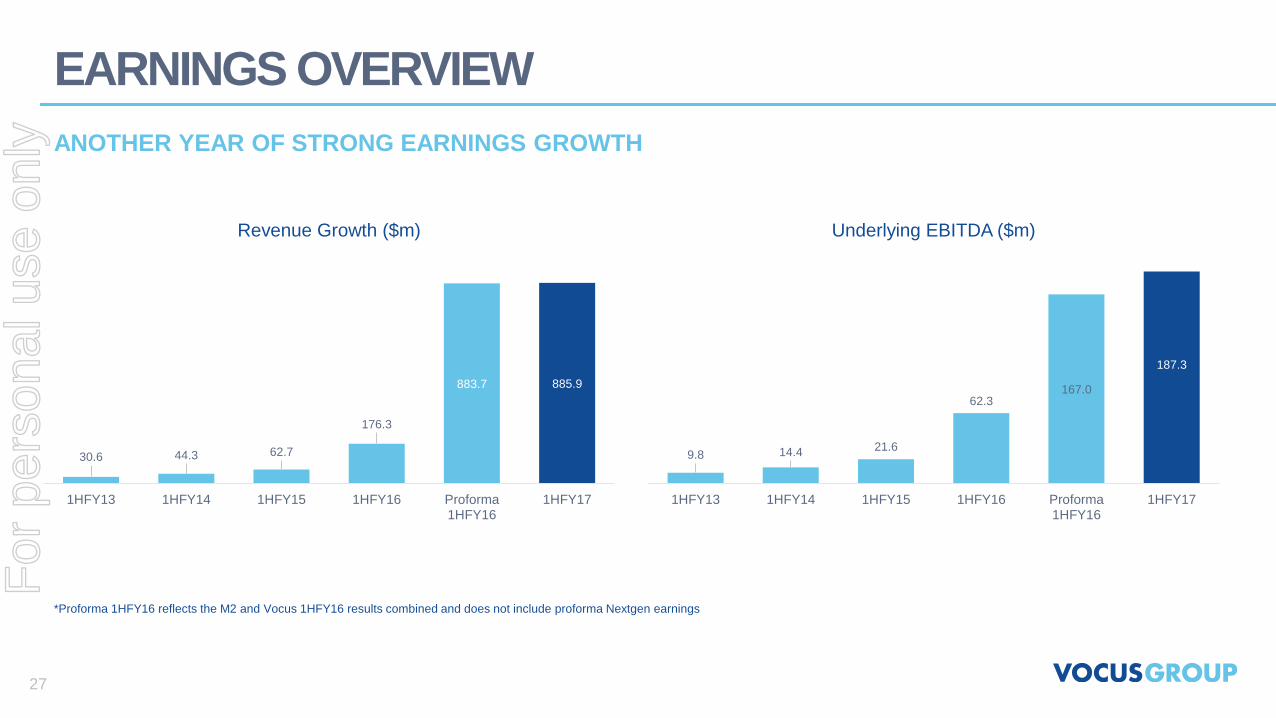
EARNINGS OVERVIEW
*Proforma 1HFY16 reflects the M2 and Vocus 1HFY16 results combined and does not include proforma Nextgen earnings
ANOTHER YEAR OF STRONG EARNINGS GROWTH
30.6 44.3 62.7
176.3
883.7 885.9
1HFY13 1HFY14 1HFY15 1HFY16 Proforma1HFY16
1HFY17
Revenue Growth ($m)
9.8 14.4 21.6
62.3167.0
187.3
1HFY13 1HFY14 1HFY15 1HFY16 Proforma1HFY16
1HFY17
Underlying EBITDA ($m)
27
For
per
sona
l use
onl
y

GROUP EARNINGS BREAKDOWN
DIVERSIFIED EARNINGS PLATFORM
1. This does not take into account Australian corporate overheads and network costs which are not allocated to segments
23
58
18
1
Revenue Breakdown 1HFY17 (%)
Corporate & WholesaleAustralia
Mass Market Australia
New Zealand
Other
38.4
50.3
11.3
EBITDA Contribution1 Breakdown 1HFY17 (%)
Corporate & WholesaleAustralia
Mass Market Australia
New Zealand
28
For
per
sona
l use
onl
y
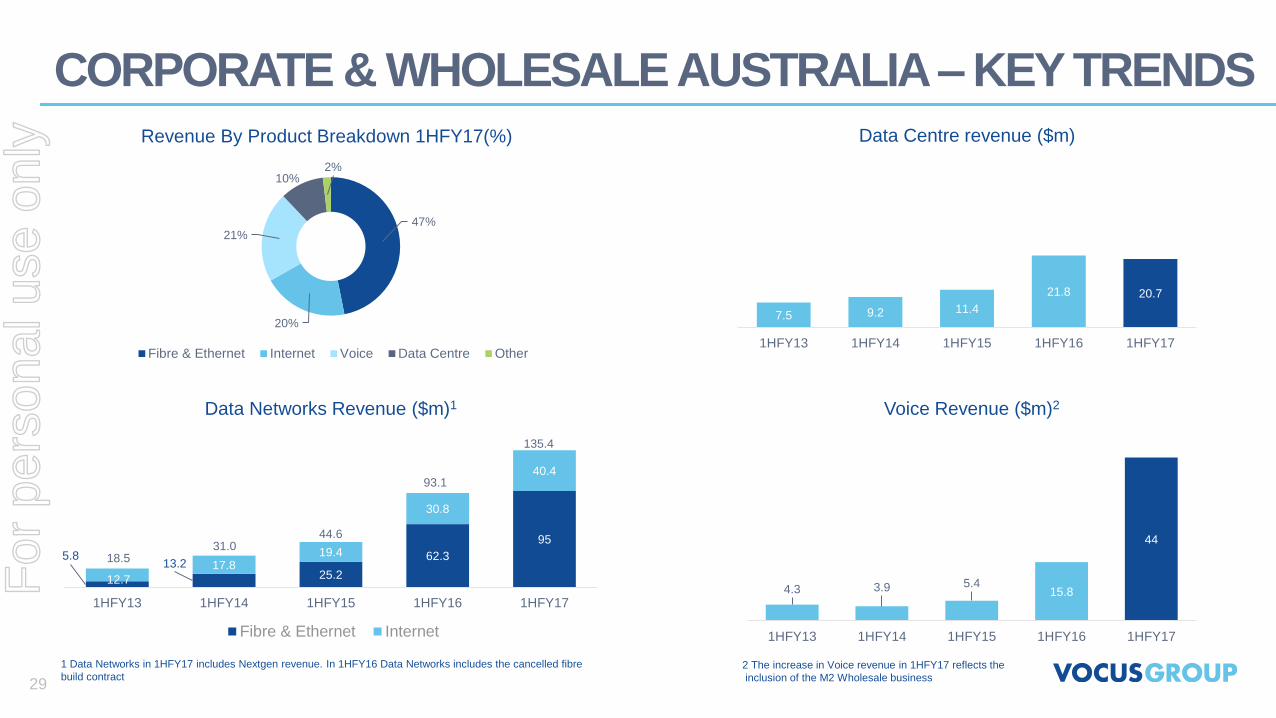
CORPORATE & WHOLESALE AUSTRALIA – KEY TRENDS
5.813.2
25.2
62.3
95
12.7
17.819.4
30.8
40.4
1HFY13 1HFY14 1HFY15 1HFY16 1HFY17
Data Networks Revenue ($m)1
Fibre & Ethernet Internet
7.5 9.2 11.4
21.8 20.7
1HFY13 1HFY14 1HFY15 1HFY16 1HFY17
Data Centre revenue ($m)
4.3 3.9 5.415.8
44
1HFY13 1HFY14 1HFY15 1HFY16 1HFY17
Voice Revenue ($m)2
47%
20%
21%
10%2%
Revenue By Product Breakdown 1HFY17(%)
Fibre & Ethernet Internet Voice Data Centre Other
1 Data Networks in 1HFY17 includes Nextgen revenue. In 1HFY16 Data Networks includes the cancelled fibre
build contract2 The increase in Voice revenue in 1HFY17 reflects the
inclusion of the M2 Wholesale business
18.531.0
44.6
93.1
135.4
29
For
per
sona
l use
onl
y
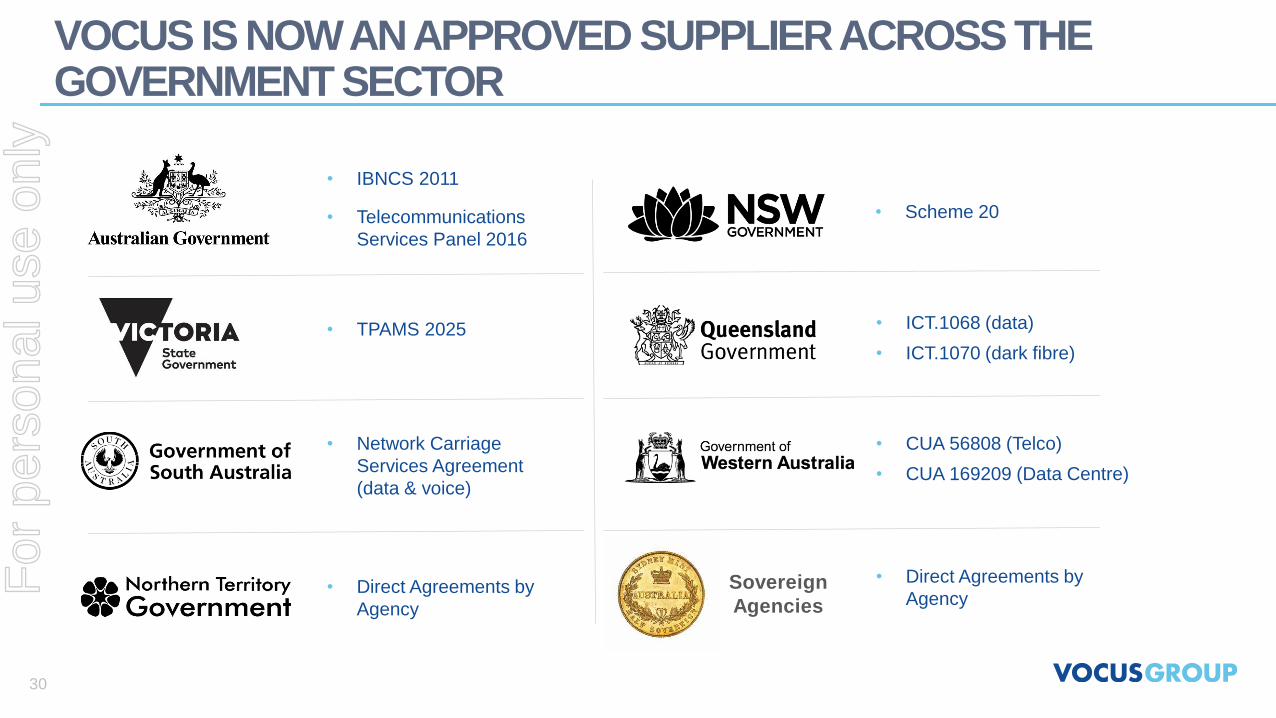
VOCUS IS NOW AN APPROVED SUPPLIER ACROSS THE GOVERNMENT SECTOR
30
• IBNCS 2011
• Telecommunications
Services Panel 2016
• Network Carriage
Services Agreement
(data & voice)
• CUA 56808 (Telco)
• CUA 169209 (Data Centre)
• TPAMS 2025
• Direct Agreements by
Agency
• ICT.1068 (data)
• ICT.1070 (dark fibre)
• Scheme 20
• Direct Agreements by
AgencySovereign
Agencies
For
per
sona
l use
onl
y
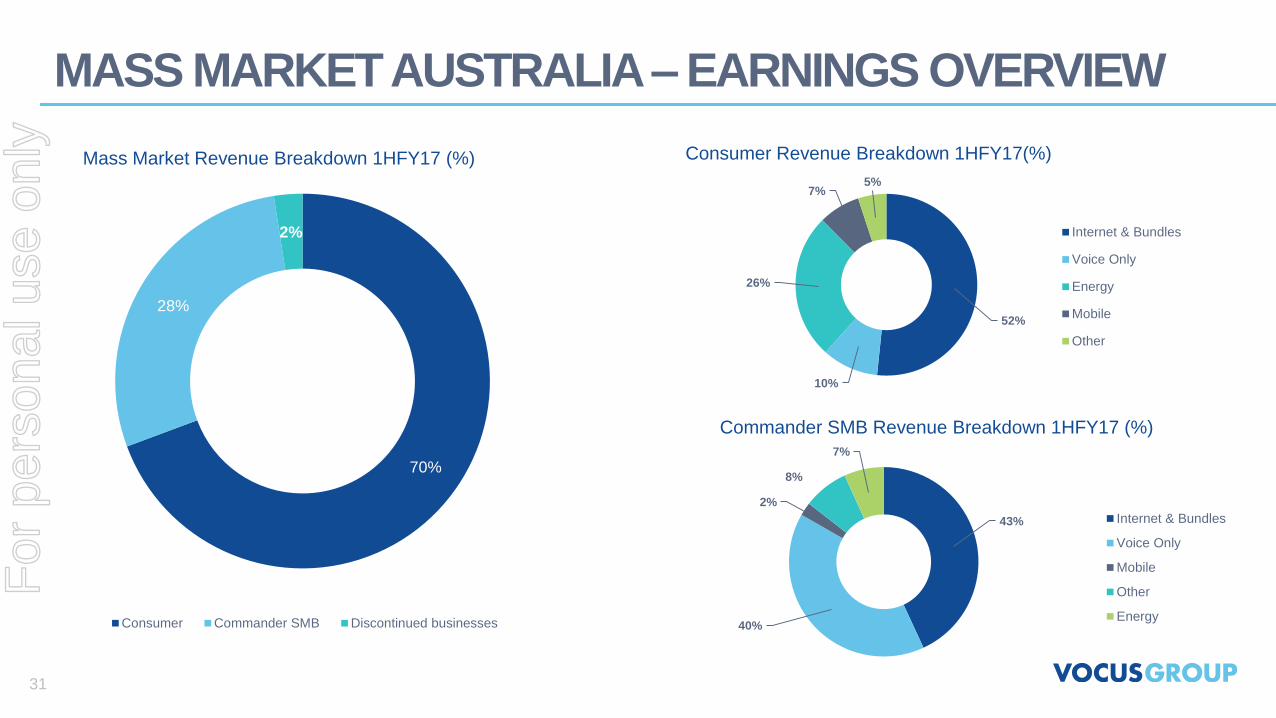
MASS MARKET AUSTRALIA – EARNINGS OVERVIEW
70%
28%
2%
Mass Market Revenue Breakdown 1HFY17 (%)
Consumer Commander SMB Discontinued businesses
52%
10%
26%
7%5%
Consumer Revenue Breakdown 1HFY17(%)
Internet & Bundles
Voice Only
Energy
Mobile
Other
43%
40%
2%
8%
7%
Commander SMB Revenue Breakdown 1HFY17 (%)
Internet & Bundles
Voice Only
Mobile
Other
Energy
31
For
per
sona
l use
onl
y
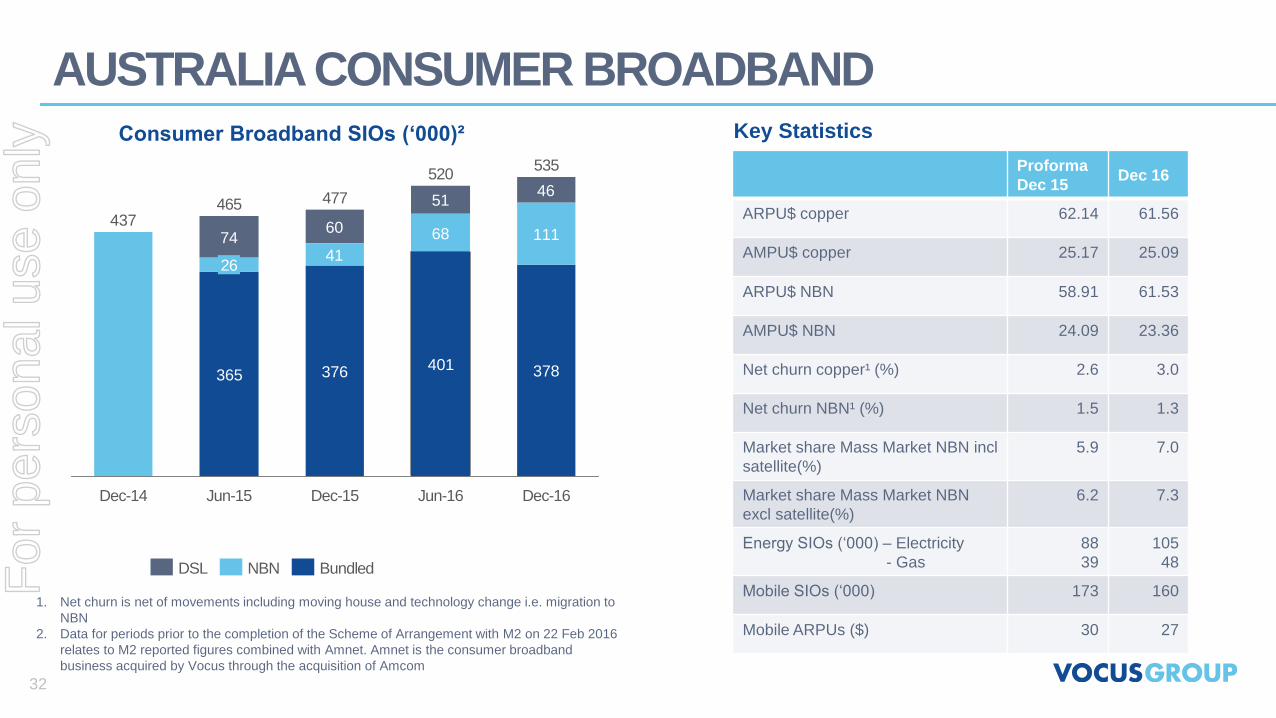
AUSTRALIA CONSUMER BROADBAND
365 376 401 378
41
68 1117460
5146
437
26
477
Dec-15
520
Jun-16Dec-14 Dec-16
535
Jun-15
465
BundledNBNDSL
Consumer Broadband SIOs (‘000)²
1. Net churn is net of movements including moving house and technology change i.e. migration to
NBN
2. Data for periods prior to the completion of the Scheme of Arrangement with M2 on 22 Feb 2016
relates to M2 reported figures combined with Amnet. Amnet is the consumer broadband
business acquired by Vocus through the acquisition of Amcom
Key Statistics
Proforma
Dec 15Dec 16
ARPU$ copper 62.14 61.56
AMPU$ copper 25.17 25.09
ARPU$ NBN 58.91 61.53
AMPU$ NBN 24.09 23.36
Net churn copper¹ (%) 2.6 3.0
Net churn NBN¹ (%) 1.5 1.3
Market share Mass Market NBN incl
satellite(%)
5.9 7.0
Market share Mass Market NBN
excl satellite(%)
6.2 7.3
Energy SIOs (‘000) – Electricity
- Gas
88
39
105
48
Mobile SIOs (‘000) 173 160
Mobile ARPUs ($) 30 27
32
For
per
sona
l use
onl
y
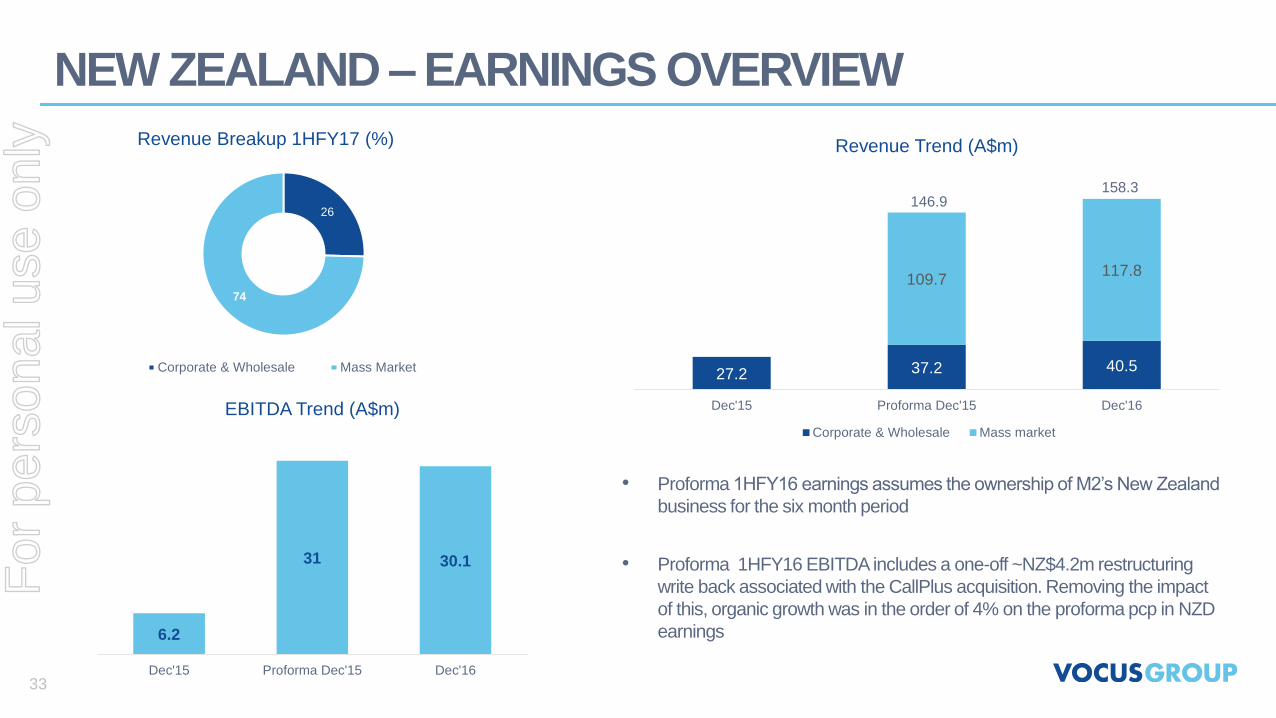
NEW ZEALAND – EARNINGS OVERVIEW
• Proforma 1HFY16 earnings assumes the ownership of M2’s New Zealand
business for the six month period
• Proforma 1HFY16 EBITDA includes a one-off ~NZ$4.2m restructuring
write back associated with the CallPlus acquisition. Removing the impact
of this, organic growth was in the order of 4% on the proforma pcp in NZD
earnings
26
74
Revenue Breakup 1HFY17 (%)
Corporate & Wholesale Mass Market27.2 37.2 40.5
109.7117.8
Dec'15 Proforma Dec'15 Dec'16
Revenue Trend (A$m)
Corporate & Wholesale Mass market
146.9158.3
6.2
31 30.1
Dec'15 Proforma Dec'15 Dec'16
EBITDA Trend (A$m)
33
For
per
sona
l use
onl
y

NEW ZEALAND – KEY TRENDS
1. SIOs and other key Mass Market statistics prior to Dec 16 represent the M2 New Zealand Mass Market business
41 48 52 51
129 118 113104
16 21 2738
Jun'15 Dec'15 Jun'16 Dec'16
Consumer Broadband SIOS¹ (‘000)
DSL Naked DSL Bundled UFB
186 187 192 192
New Zealand Mass Market Key Statistics ¹
Period ended ($’m) Dec 15 Jun 16 Dec 16
ARPU NZ$ broadband 67.68 71.37 71.88
AMPU NZ$ broadband 29.77 29.61 29.72
Net churn copper (%) 2.9% 2.8% 2.8%
Net churn UFB (%) 1.9% 2.0% 1.8%
Market share UFB (%) 13% 11% 12%
Energy SIOs (‘000) - - 2
Mobile SIOs (‘000) 15 17 19
SMB SIOs (‘000) 20 20 21
34
For
per
sona
l use
onl
y
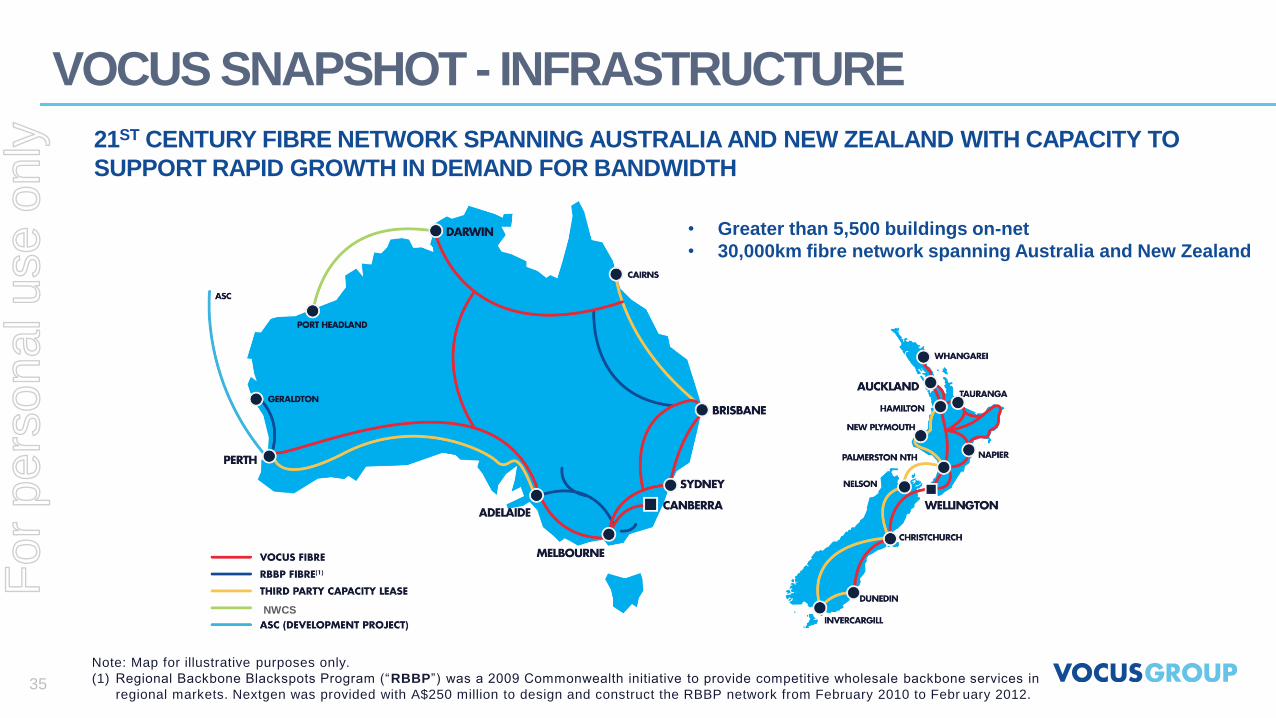
VOCUS SNAPSHOT - INFRASTRUCTURE
Note: Map for illustrative purposes only.
(1) Regional Backbone Blackspots Program (“RBBP”) was a 2009 Commonwealth initiative to provide competitive wholesale backbone services in
regional markets. Nextgen was provided with A$250 million to design and construct the RBBP network from February 2010 to Febr uary 2012.
21ST CENTURY FIBRE NETWORK SPANNING AUSTRALIA AND NEW ZEALAND WITH CAPACITY TO
SUPPORT RAPID GROWTH IN DEMAND FOR BANDWIDTH
NWCS
• Greater than 5,500 buildings on-net
• 30,000km fibre network spanning Australia and New Zealand
35
For
per
sona
l use
onl
y
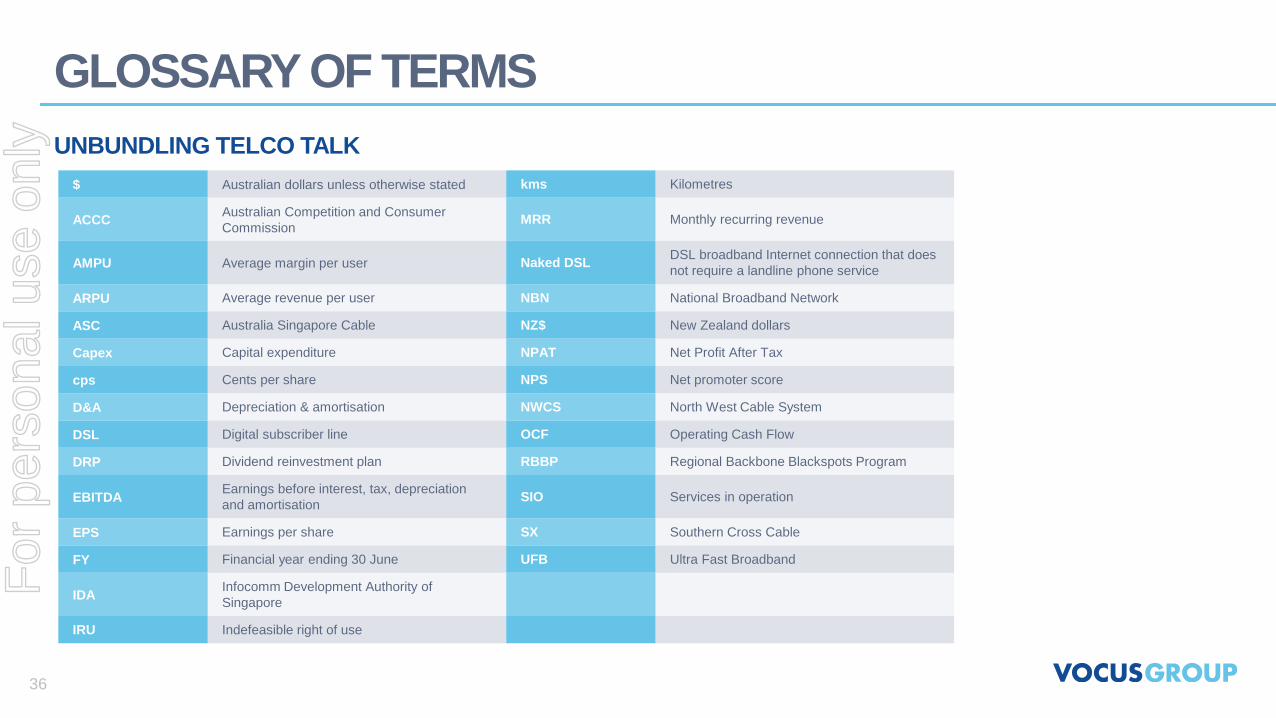
GLOSSARY OF TERMS
UNBUNDLING TELCO TALK
$ Australian dollars unless otherwise stated kms Kilometres
ACCCAustralian Competition and Consumer
CommissionMRR Monthly recurring revenue
AMPU Average margin per user Naked DSLDSL broadband Internet connection that does
not require a landline phone service
ARPU Average revenue per user NBN National Broadband Network
ASC Australia Singapore Cable NZ$ New Zealand dollars
Capex Capital expenditure NPAT Net Profit After Tax
cps Cents per share NPS Net promoter score
D&A Depreciation & amortisation NWCS North West Cable System
DSL Digital subscriber line OCF Operating Cash Flow
DRP Dividend reinvestment plan RBBP Regional Backbone Blackspots Program
EBITDAEarnings before interest, tax, depreciation
and amortisationSIO Services in operation
EPS Earnings per share SX Southern Cross Cable
FY Financial year ending 30 June UFB Ultra Fast Broadband
IDAInfocomm Development Authority of
Singapore
IRU Indefeasible right of use
36
For
per
sona
l use
onl
y
DISCLAIMER
37
This presentation contains forward looking statements that involve risks and uncertainties. These forward looking
statements are not guarantees of Vocus' future performance and involve a number of known and unknown risks and
uncertainties that may cause actual results to differ materially from the results discussed in this presentation.
This presentation only contains information required for a preliminary evaluation of the company and in particular only
discloses information by way of summary within the knowledge of the company and its directors. An investor should
seek its own independent professional advice in relation to the technical, financial, taxation, legal and commercial
matters relating to any investment in Vocus and its subsidiaries.
Other than to the extent required by law (and only to that extent) the company and its officers, employees and
professional advisors make no representation, guarantee or warranty (expressed or implied) as to, and assume no
responsibility or liability for, the contents of this presentation.
This presentation does not constitute an invitation or offer by or on behalf of Vocus, its subsidiaries or any other
person, to subscribe for, purchase, or otherwise deal in any securities, nor is it intended to be used for a connected
purpose.
All amounts are in Australian Dollars unless otherwise specified.For
per
sona
l use
onl
y

VOCUSGROUP.COM.AU
For
per
sona
l use
onl
y