Embed Size (px)
Citation preview
25-hydroxyvitamin D and Biomarkers of Cardiometabolic
Disease
by
Bibiana García Bailo
A thesis submitted in conformity with the requirements
for the degree of Doctor of Philosophy
Department of Nutritional Sciences
University of Toronto
© Copyright by Bibiana García Bailo, 2013
ii
25-hydroxyvitamin D and Biomarkers of Cardiometabolic Disease
Bibiana García Bailo
Doctor of Philosophy
Department of Nutritional Sciences
University of Toronto
2013
Abstract
Background: Vitamin D may have beneficial effects on cardiometabolic disease, but the
evidence is equivocal. This may be due to unaccounted confounders, such as lifestyle factors and
genetic variation. We examined the association between circulating 25-hydroxyvitamin D
[25(OH)D] and biomarkers of cardiometabolic disease risk, including biomarkers of
inflammation, glycemic dysregulation and lipid metabolism, and a panel of 54 plasma proteomic
biomarkers, and determined whether lifestyle variables and genetic variation modified these
associations.
Methods: Participants were from the Toronto Nutrigenomics and Health Study, an ethnically
diverse population of individuals aged 20-29 years. Anthropometric measurements were
obtained. Participants answered general health and lifestyle and food frequency questionnaires
and provided a fasting blood sample for biochemical measurements and genotyping.
Results: Across ethnic groups, women who used hormonal contraceptives (HC) had higher
25(OH)D and C-reactive protein (CRP) than women HC non-users and men. Circulating
25(OH)D was positively associated with CRP in the entire population in models not accounting
for HC use. However, there was no association after accounting for HC use. 25(OH)D was also
not associated with inflammatory cytokines after adjusting for HC use. 25(OH)D was inversely
iii
associated with insulin, HOMA-IR, and HOMA-Beta among Caucasians and East Asians and
among men and women HC non-users. No biomarkers were associated with 25(OH)D among
South Asians and women HC users, although non-significant inverse trends were observed for
markers of glycemic dysregulation. Only two of the 54 plasma proteomic biomarkers were
associated with 25(OH)D in women HC non-users, and none were associated in men. Among
women HC users, after accounting for hormone dose, only three proteins were associated with
25(OH)D. Finally, 25(OH)D affected the association between rs2239182, a variant in the vitamin
D receptor (VDR) and the pro-inflammatory cytokine interferon γ-induced protein 10 (IP-10).
However, the association was suggestive of heterosis and may have been due to chance.
Conclusions: We identified a confounding effect of HC use on the association between
25(OH)D, biomarkers of inflammation and plasma proteomic biomarkers. In addition, HC use
might also affect the association between 25(OH)D and biomarkers of glycemic dysregulation.
Genetic variation in VDR did not modify any associations.
.

iv
Acknowledgments
In my head, I have been writing this section of my thesis for years. In many ways, the degree feels
like a group effort and throughout the journey I have been grateful to my mentors, peers, friends and
family more times than I can count. For having reached the final stage of my PhD with my sanity and
my love of academic pursuits intact, I am forever indebted to Dr. Ahmed El-Sohemy, my thesis
supervisor. Ahmed's unwavering support, optimism and sense of humour kept me going through
good and bad times. His approachability, patience and open-mindedness made me look forward to all
of our discussions, and he broadened my intellectual horizons, provided me with training and career
opportunities that I never would have been able to pursue on my own, and taught me how to
persevere and have faith in my own scientific abilities. Working with Ahmed was a true privilege,
and I could not have wished for a better supervisor.
I am very grateful to the members of my advisory committee, Drs. David Cole, Mohamed Karmali
and Reinhold Vieth, and my PhD examiners, Drs. Tom Wolever and Marie-Claude Vohl. They
shared many ideas, asked important questions and provided thoughtful, constructive criticism. The
quality of my thesis improved significantly thanks to their input. I am equally grateful to the faculty
of the Department of Nutritional Sciences, and in particular Drs. Tony Hanley and Val Tarasuk, who
taught me a great deal about epidemiology and public health nutrition. Their passion and knowledge
are awe-inspiring, and their doors are always open to students. Many thanks also to the great staff of
the department, and especially Louisa Kung and Emeliana D'Souza, who were always so helpful and
such a joy to interact with.
I am thankful to the funding sources that made my work possible, including the Ontario Graduate
Scholarship program, the Public Health Agency of Canada and the Advanced Foods and Materials
Network. In addition, I was fortunate to be able to attend several conferences thanks to funding from
the University of Toronto's Department of Nutritional Sciences, Banting & Best Diabetes Centre, and
School of Graduate Studies, as well as the American Society for Nutrition.
I am also quite grateful to our collaborators from the University of Victoria/Genome BC Proteomics
Centre, the University of Guelph, and, most importantly, the Office of Biotechnology, Genomics and
Population Health of the Public Health Agency of Canada. The BGPH team, including Drs.
Mohamed Karmali, Alaa Badawi, Suneil Malik and John Nash, as well as Ross Duncan, Rachel
Rasile, Andre Villegas, Paul Arora, Chrissy Wessman, Rowena Mulato and Lindsay Nolan, provided

v
a second home for me, wrote many reference letters, and gave me an invaluable opportunity to
conduct epidemiologic research in a public health setting. It was an honour and a pleasure to be a part
of their group.
My interest in nutrigenomics arose during the time I spent as a technician in Dr. José Ordovás's lab,
at Tufts University in Boston, Massachusetts. I am eternally thankful to José and his team, especially
Drs. Larry Parnell and Chao Lai and Ms. Xian Adiconis, for taking a chance on me, giving me the
opportunity to learn from them and their many collaborators around the world, and acting as referees
numerous times. Had I not spent several excellent formative years with their group, I may never have
embarked upon this PhD.
To my friends around the department, thank you for all the wonderful silliness (and crustiness!) that
made nerve-racking situations seem less daunting. Fellow "El-Sohemys" Laura Da Costa, Drs.
Andrea Josse, Karen Eny and Leah Cahill, Lilli Mauer, Daiva Nielsen, Andre Dias, Dennis Wang,
Ouxi Tian, Joseph Jamnik, Nanci Guest, Cristina Cuda, Christine Asik, Erika Day Tasevski,
Francesca Garofalo and Hyeon-Joo Lee provided endless support and bits of wisdom. I am especially
thankful for the friendship of Laura, Andrea and Lilli, with whom I shared many great moments
across North America. Drs. Darren Brenner and Sheena Kayaniyil were fountains of knowledge and I
cherished all of our conversations. With Julie Mason, Ashleigh Wiggins and Chuck Chen I laughed
up and down the Fitzgerald hallways more times than I can count. Shirin Panahi and Ahmed
Aldughpassi were fellows in home-stretch misery. The DNS Running Rogues, and especially fellow
Executive members Matt Parrott and Lesley Hoyt, kept my body fit and my wits sharp (give or take a
few dozens of recovery pints). Matt deserves a special shout-out for being my EB roommate
extraordinaire, ultimate writing comrade and perennial partner in crime. I will forever wonder if all
that barbed wire really was the Mexican border.
My final acknowledgement goes to my parents, Jeremías and Belén, my brother, Alfonso, and my
partner, Joanne. They fed me, cared for my four-legged creatures and sat patiently through many
practice presentations. They put up with me through brutally early mornings, late nights and long
weekends of writing. They dragged me into the sunshine (both figurative and literal) when I needed it
most, and they felt each one of my frustrations and achievements as their own. Most importantly,
they kept me rooted and made me happy every day. I truly lack the words to express my love and
gratitude. I hope to thank you with my actions for the rest of my life.
Y colorín colorado, este cuento se ha acabado.
vi
Table of Contents
Acknowledgments .......................................................................................................................... iv
Table of Contents ........................................................................................................................... vi
List of Tables ................................................................................................................................. xi
List of Figures .............................................................................................................................. xiii
List of Abbreviations ................................................................................................................... xiv
List of Appendices ....................................................................................................................... xvi
Chapter 1 : Literature Review ......................................................................................................... 1
1.1 Introduction ......................................................................................................................... 1
1.2 Cardiometabolic Disease .................................................................................................... 2
1.2.1 Definition and Prevalence ....................................................................................... 2
1.2.2 Etiology ................................................................................................................... 3
1.2.3 Risk Factors ............................................................................................................ 4
1.2.4 Biomarkers of risk ................................................................................................... 5
1.3 Vitamin D .......................................................................................................................... 10
1.3.1 Background and historical perspective ................................................................. 10
1.3.2 Vitamin D metabolism .......................................................................................... 11
1.3.3 Biological Actions of Vitamin D .......................................................................... 13
1.3.4 Vitamin D Sources ................................................................................................ 13
1.3.5 Assessment of Vitamin D Nutritional Status ........................................................ 15
1.3.6 Dietary Reference Intakes ..................................................................................... 15
1.3.7 Determinants of Vitamin D Status ........................................................................ 17
1.3.8 Measurement of 25(OH)D .................................................................................... 22
vii
1.4 Vitamin D and Cardiometabolic Disease .......................................................................... 23
1.4.1 Relationship with Innate Immunity and Inflammation ......................................... 24
1.4.2 Relationship with Glycemic Regulation ............................................................... 25
1.4.3 Relationship with Lipid Metabolism .................................................................... 27
1.4.4 Relationship with the Plasma Proteome ............................................................... 28
1.5 Summary and Rationale .................................................................................................... 29
1.6 Hypothesis and Objectives ................................................................................................ 30
Chapter 2 : Positive association between 25-hydroxyvitamin D and C-reactive protein is
confounded by hormonal contraceptive use ............................................................................. 31
2.1 Abstract ............................................................................................................................. 32
2.2 Introduction ....................................................................................................................... 33
2.3 Methods ............................................................................................................................. 34
2.3.1 Study Design and Participants .............................................................................. 34
2.3.2 Anthropometrics and Physical Activity ................................................................ 35
2.3.3 Dietary Assessment ............................................................................................... 35
2.3.4 Hormonal Contraceptive Use ................................................................................ 36
2.3.5 Biochemical and 25(OH)D Measurements ........................................................... 36
2.3.6 Statistical Analysis ................................................................................................ 36
2.4 Results ............................................................................................................................... 38
2.5 Discussion ......................................................................................................................... 50
Chapter 3 : Association between circulating 25-hydroxyvitamin D and plasma cytokine
concentrations in young adults ................................................................................................. 54
3.1 Abstract ............................................................................................................................. 55
3.2 Introduction ....................................................................................................................... 56
3.3 Methods ............................................................................................................................. 57
3.3.1 Study Design and Participants .............................................................................. 57
3.3.2 Anthropometrics and physical activity ................................................................. 57
viii
3.3.3 Biochemical and 25(OH)D Measurements ........................................................... 57
3.3.4 Statistical Analysis ................................................................................................ 58
3.4 Results ............................................................................................................................... 59
3.5 Discussion ......................................................................................................................... 63
Chapter 4 : Plasma 25-hydroxyvitamin D, hormonal contraceptive use, and cardiometabolic
disease risk in an ethnically diverse population of young adults ............................................. 66
4.1 Abstract ............................................................................................................................. 67
4.2 Introduction ....................................................................................................................... 68
4.3 Methods ............................................................................................................................. 69
4.3.1 Study Design and Participants .............................................................................. 69
4.3.2 Anthropometrics and Physical Activity ................................................................ 69
4.3.3 Hormonal Contraceptive Use ................................................................................ 70
4.3.4 Biochemical and 25(OH)D Measurements ........................................................... 70
4.3.5 Statistical Analysis ................................................................................................ 70
4.4 Results ............................................................................................................................... 71
4.5 Discussion ......................................................................................................................... 85
Chapter 5 : Plasma 25-hydroxyvitamin D, hormonal contraceptive use, and the plasma
proteome in Caucasian, East Asian, and South Asian young adults ........................................ 90
5.1 Abstract ............................................................................................................................. 91
5.2 Introduction ....................................................................................................................... 92
5.3 Methods ............................................................................................................................. 93
5.3.1 Study Design and Participants .............................................................................. 93
5.3.2 Anthropometrics and Physical Activity ................................................................ 94
5.3.3 Hormonal Contraceptive Use ................................................................................ 94
5.3.4 Biochemical and 25(OH)D Measurements ........................................................... 94
5.3.5 Plasma Proteomic Measurements ......................................................................... 94
5.3.6 Statistical Analysis ................................................................................................ 94
ix
5.4 Results ............................................................................................................................... 96
5.5 Discussion ....................................................................................................................... 110
Chapter 6 : Genetic variation in the vitamin D receptor, plasma 25-hydroxyvitamin D, and
biomarkers of cardiometabolic disease in Caucasian young adults ....................................... 115
6.1 Abstract ........................................................................................................................... 116
6.2 Introduction ..................................................................................................................... 117
6.3 Methods ........................................................................................................................... 119
6.3.1 Study Design and Participants ............................................................................ 119
6.3.2 Anthropometrics and Physical Activity .............................................................. 119
6.3.3 Hormonal Contraceptive Use .............................................................................. 119
6.3.4 Biochemical and 25(OH)D Measurements ......................................................... 119
6.3.5 Plasma Proteomic Measurements ....................................................................... 119
6.3.6 Genotyping and candidate SNP selection ........................................................... 119
6.3.7 Statistical Analysis .............................................................................................. 120
6.4 Results ............................................................................................................................. 121
6.5 Discussion ....................................................................................................................... 134
Chapter 7 : Summary, Limitations, Future Directions and Implications .................................... 137
7.1 Summary ......................................................................................................................... 138
7.1.1 Relationship with Inflammation ......................................................................... 140
7.1.2 Relationship with Glycemic Dysregulation ........................................................ 141
7.1.3 Relationship with Lipid Metabolism .................................................................. 142
7.1.4 Relationship with the Plasma Proteome ............................................................. 143
7.2 Limitations ...................................................................................................................... 143
7.3 Future Research .............................................................................................................. 144
7.4 Implications ..................................................................................................................... 145
7.5 Thesis Summary .............................................................................................................. 146

x
References ................................................................................................................................... 147
Appendices .................................................................................................................................. 174
xi
List of Tables
Table 1.1. Dietary sources of vitamin D........................................................................................14
Table 1.2. DRIs for vitamin D, by life stage..................................................................................16
Table 2.1. Study participant characteristics...................................................................................41
Table 2.2. Correlation between plasma 25(OH)D and either dietary vitamin D or plasma CRP,
across ethnic groups, by sex and hormone use..............................................................................43
Table 2.3. Association between 25(OH)D and CRP among individuals below and above the
median 25(OH)D concentration.....................................................................................................45
Table 3.1. Study participant characteristics...................................................................................60
Table 3.2. Mean cytokine concentrations by plasma 25(OH)D tertiles.........................................61
Table 4.1. Study participant characteristics...................................................................................74
Table 4.2. Distribution of vitamin D status among men, women HC non-users, women HC users,
and different ethnic groups............................................................................................................76
Table 4.3. Association between vitamin D status and biomarkers of cardiometabolic disease risk
across ethnic groups.......................................................................................................................77
Table 4.4. Association between vitamin D status and biomarkers of cardiometabolic disease risk
across men, women HC non-users, and women HC users............................................................80
Table 5.1. Study participant characteristics by vitamin D status..................................................99
Table 5.2. Proteins included in each plasma proteomic profile...................................................101
Table 5.3a-c. Mean plasma concentrations (μmol/L) of profile 1 proteins, by vitamin D status, by
sex and HC use.............................................................................................................................103
xii
Table 5.4. Mean plasma concentrations (μmol/L) of profile 1 proteins that were associated with
25(OH)D in women using <1mg vs. ≥1mg total hormone per day.............................................108
Table 6.1. VDR SNPs selected for analysis.................................................................................123
Table 6.2. Study participant characteristics, by vitamin D tertile................................................125
Table 6.3a-c. Associations between VDR SNPs and biomarkers of inflammation, glucose and
lipid metabolism, and plasma proteomic biomarkers where a significant (p<0.05) SNP x
25(OH)D interaction term existed................................................................................................127
xiii
List of Figures
Figure 2.1. Plasma 25(OH)D concentrations among men, women hormonal contraceptive (HC)
non-users, and women HC users, by ethnicity...............................................................................46
Figure 2.2. CRP concentrations among men, women hormonal contraceptive (HC) non-users,
and women HC users, by ethnicity................................................................................................47
Figure 2.3. Association between 25(OH)D and CRP....................................................................48
Figure 3.1. Correlation analysis between circulating 25(OH)D and cytokines.............................62
Figure 4.1. Seasonal fluctuations in 25(OH)D across ethnic groups.............................................83
Figure 4.2. Seasonal fluctuations in 25(OH)D across men, women HC non-users, and women HC
users...............................................................................................................................................84
Figure 5.1. Mean plasma proteomic profile scores, by vitamin D status, by sex and HC use, in
the population as a whole and among female HC users, female HC non-users, and men...........109
Figure 6.1. The association between rs2239182 and IP-10, an inflammatory cytokine, is modified
by vitamin D status......................................................................................................................133
xiv
List of Abbreviations
T2D - Type 2 diabetes
CVD - Cardiovascular disease
25(OH)D - 25-hydroxyvitamin D
IL - Interleukin
TNF - Tumor necrosis factor
VLDL - Very low-density lipoprotein
HDL - High-density lipoprotein
LDL - Low-density lipoprotein
CRP - C-reactive protein
FTO - Obesity-associated gene
Apo - Apolipoprotein
ABCA - ATP-binding cassette transporter
LPL - Lipoprotein lipase
LIPC - Hepatic lipase
CETP - Cholesterol ester transfer protein
GWAS - Genome-wide association study
TCF7L2 - Transcription factor 7-like 2
RANTES - Regulated upon and secreted
HOMA - Homeostasis model assessment
LC - Liquid chromatography
MS - Mass spectrometry
MRM - Multiple reaction monitoring
Ultraviolet - UV
DBP - Vitamin D binding protein
CYP - Cytochrome P450
1,25(OH)2D - 1,25-dihydroxyvitamin D
VDR - Vitamin D receptor
FGF-23 - Fibroblast growth factor 23
RXR - Retinoid X receptor
VDRE - Vitamin D response element
IU - International units
DRI - Dietary reference intake
EAR - Estimated average requirement
RDA - Recommended dietary intake
UL - Tolerable upper intake
AI - Adequate intake
BMI - Body mass index
HC - Hormonal contraceptive
xv
HRT - Hormone replacement therapy
SNP - Single nucleotide polymorphism
DHCR7 - 7-dehydrocholesterol reductase
NADSYN1 - Nicotinamide adenine
dinucleotide synthetase
RIA - Radioimmunoassay
HPLC - High-performance liquid
chromatography
FDA - Food and Drug Administration
DEQAS - International External Quality
Assessment Scheme for Vitamin D
IFN-γ - Interferon-γ
HbA1c - Hemoglobin A1c
NHANES - National Health and Nutrition
Examination Survey
TNH - Toronto Nutrigenomics and Health
FFQ - Food frequency questionnaire
MET - Metabolic equivalent task
ANOVA - Analysis of variance
ANCOVA - Analysis of covariance
SE - Standard error
IL-1RA - Interleukin-1-receptor antagonist
IP-10 - Interferon-γ-induced protein 10
PDGF-bb - Platelet derived growth factor
BB
RBP4 - Retinol-binding protein

List of Appendices
Table A.1a-c. Mean plasma protein concentrations (μmol/L) by vitamin D status, by sex and
contraceptive use.........................................................................................................................174
1
Chapter 1 : Literature Review
1.1 Introduction
Cardiometabolic diseases, such as type 2 diabetes mellitus (T2D) and cardiovascular disease
(CVD), are a leading cause of death and disability worldwide (1). Metabolic abnormalities
including dyslipidemia, central obesity and glycemic dysregulation are considered risk factors
for cardiometabolic diseases (2). In addition, there is growing evidence that abnormal innate
immune responses and chronic low-grade inflammation play a key role in the pathogenesis of
insulin resistance, T2D and CVD (3-9). Overall dietary patterns, as well as specific foods and
nutrients, have been investigated for their effects on pathophysiological processes related to
cardiometabolic disease (10-16). In particular, in recent years, a great deal of interest and
controversy have arisen around vitamin D as a therapeutic agent against the development of
numerous non-skeletal health conditions, including cardiometabolic disease (17-24).
Beyond its well established role in mineral metabolism and bone health, vitamin D may affect
processes involved in cardiometabolic disease, such as innate immunity and inflammation,
insulin sensitivity and pancreatic β cell function (25-28). Indeed, adequate circulating
concentrations of 25-hydroxyvitamin D (25(OH)D), the vitamin D metabolite used to measure
status, have been associated with improved levels of biomarkers of inflammation, glycemic
dysregulation and lipid metabolism, as well as decreased risk of the metabolic syndrome (29-34).
Recent in vitro evidence also suggests that vitamin D modulates the expression of hundreds of
genes, many of which belong to disease-associated pathways (27). However, whether these
widespread genomic effects translate into observable effects at the level of the proteome remains
unknown. Furthermore, recent systematic reviews of epidemiological studies and clinical trials
have concluded that there is insufficient evidence for a relationship between vitamin D and
cardiometabolic disease-related outcomes (35-37). In addition to differences in methodology, the
widespread inconsistencies between studies may result from unaccounted confounding from
lifestyle and demographic variables, genetic variation across individuals, and a lack of adequate
biomarkers of vitamin D action or disease progression (38).
The overall goal of this thesis was to determine the association between 25(OH)D and
biomarkers of cardiometabolic disease risk, including biomarkers of inflammation, glycemic
2
dysregulation and lipid metabolism and plasma proteomic biomarkers, and to examine whether
lifestyle factors and genetic variation in the vitamin D pathway modify these associations.
1.2 Cardiometabolic Disease
1.2.1 Definition and Prevalence
Cardiometabolic disease is an umbrella term for complex, chronic diseases, in particular T2D
and CVD, which share pathophysiologic abnormalities including hypertension, dyslipidemia,
central obesity, glycemic dysregulation, and inflammation. The burden of these conditions is
very high. Indeed, in Canada alone, T2D and CVD each affect over 3 million and nearly 1.3
million individuals, respectively (39;40). T2D itself is an important risk factor for CVD, and a
staggering 30% of mortality among Canadians is a result of CVD (41). In 2000, CVD cost the
Canadian health care system approximately $22 billion, of which about $15 billion were indirect
costs associated with short- and long-term disability and mortality. In turn, overall health care
costs for T2D in Canada were $3 billion during that year (42).
Recently, the Canadian Cardiometabolic Risk Working Group proposed that the compendium of
risk factors that contribute to the development of both T2D and CVD be referred to as
cardiometabolic risk (2). The definition of cardiometabolic risk is similar to that of the metabolic
syndrome, but it differs in a few key ways. The metabolic syndrome, which was originally
termed "Syndrome X", considers insulin resistance the main underlying disorder of both CVD
and T2D, and it quantifies relative disease risk through criteria established around cut-points for
fasting blood glucose, visceral obesity, hypertension and dyslipidemia (2;43). A recent
harmonized definition of the metabolic syndrome has been proposed (44) that takes into
consideration the criteria for diagnosis issued by various health organizations, such as the
National Cholesterol Education Program/American Heart Association (45;46), the World Health
Organization (47), the European Group for the Study of Insulin Resistance (48), and the
International Diabetes Federation (49).
By contrast, the concept of cardiometabolic risk, while acknowledging the importance of insulin
resistance and traditional risk factors to the development of T2D and CVD, also recognizes that
other, emerging risk factors, such as systemic inflammation and pro-thrombotic states, play an
3
important role in the pathophysiology of these diseases (2). Furthermore, no clinically defined
cut-points have been established to determine cardiometabolic risk, with the focus rather
centered around identifying and understanding the various mechanisms that contribute to the
development of cardiometabolic diseases (2).
1.2.2 Etiology
Insulin resistance in adipose, hepatic and muscle tissues, together with central adiposity and
altered adipokine production, are thought to underlie the pathology of cardiometabolic disorders
(2). Visceral and ectopic adiposity lead to elevated free fatty acids in the circulation, coupled
with increased secretion of pro-inflammatory cytokines, such as interleukin (IL)-6 and tumor
necrosis factor (TNF)-α, and decreased secretion of adiponectin, a cytokine that plays important
roles in the modulation of inflammation, glycemia, and lipid metabolism (41;50). Together, these
actions result in dyslipidemia, insulin resistance, systemic inflammation, and endothelial
dysfunction (41). Each of these metabolic abnormalities contributes to the development of both
T2D and CVD.
A number of studies suggest an association between excess visceral and ectopic adiposity and
overall insulin resistance (50;51). As visceral and ectopic adipose stores increase, these tissues
become insulin-resistant and hyperlipolytic, releasing an excess of free fatty acids into the
circulation (52;53). Exposure of the liver to high concentrations of free fatty acids leads to
hepatic gluconeogenesis and elevated secretion of triglycerides and very low-density lipoprotein
(VLDL). At the same time, high-density lipoprotein (HDL) cholesterol decreases and low-
density lipoprotein (LDL) cholesterol increases in density, a process which is associated with
increased risk for CVD (2;54). Together, these actions result in dysglycemia and dyslipidemia.
In addition, high free fatty acid concentrations also reduce muscular insulin sensitivity and
increase insulin secretion by the pancreas, further exacerbating glycemic dysregulation (2).
Beyond its function as an energy depot, adipose tissue acts as an endocrine organ that
participates in a number of physiologically important processes (54). For example, molecules
originating in adipose tissue, such as lipoprotein lipase (LPL) and cholesterol ester transfer
protein (CETP), are involved in the regulation of adipose tissue size and distribution (2). In
addition, adipose tissue is a major source of adipokines (55). Macrophages, which migrate to the
expanding visceral adipose tissue to remove dead cells and promote angiogenesis, secrete pro-

4
inflammatory cytokines, such as IL-6 and TNF-α (56). Increased levels of these cytokines lead to
hepatic production and secretion of acute-phase proteins such as C-reactive protein (CRP),
amyloid-A, α1-acid glycoprotein, fibrinogen, and haptoglobin. Many of these proteins are
considered either traditional or emerging biomarkers of inflammation and endothelial
dysregulation (57-59), and their circulating concentrations increase throughout the development
of cardiometabolic disease (60). At the same time, visceral obesity is often paired with decreased
concentrations of adiponectin, an anti-inflammatory cytokine with insulin-sensitizing and anti-
atherosclerotic properties that has been inversely associated with cardiometabolic disease
(61;62).
1.2.3 Risk Factors
Risk factors for both T2D and CVD include traditional factors such as sex, age, family history,
dyslipidemia, dysglycemia, and hypertension, as well as more recently recognized ones such as
abdominal obesity, insulin resistance, systemic inflammation and endothelial dysfunction (2;41).
These risk factors seem to vary in prevalence across ethnic groups. Indeed, in Canada, the degree
of cardiometabolic risk, as well as the rates of CVD, are known to differ by ethnicity, with South
Asian individuals presenting both a higher prevalence of CVD and specific risk factors, such as
impaired glucose tolerance, dyslipidemia, systemic inflammation and endothelial dysfunction,
than Caucasian or East Asian individuals (63).
Genetic variation may contribute to the variation in cardiometabolic risk across individuals. For
example, variation in the fat mass and obesity-associated gene (FTO), which is expressed in the
hypothalamus and adipocytes, has been linked to obesity, as well as T2D (64-68). A number of
genes expressed primarily in the liver have also been linked to alterations in lipid metabolism,
such as reduced HDL cholesterol and elevated triglycerides and LDL cholesterol (64;69).
Included among these are genes encoding apolipoproteins (Apo-) AI, AII, AIV, AV, E, CIII,
ATP-binding cassette transporter (ABCA) 1, LPL, hepatic lipase (LIPC), and CETP (64;70). In
the last few years, numerous genome-wide association studies (GWAS) have uncovered over 70
loci associated with small increases in risk of T2D, with the greatest relative risk (approximately
1.5) being conferred by a variant in transcription factor 7-like 2 (TCF7L2) (71-78). Many of
these genes affect β-cell functions, such as insulin secretion or conversion of pro-insulin to

5
insulin (64;71;72). Finally, a large, recent GWAS identified or confirmed over 40 variants
associated with CVD (79). Pathway analysis of the data showed an overrepresentation of genes
involved in lipid metabolism and inflammation, underscoring the importance of these processes
in the etiology of cardiometabolic diseases (79).
In addition to biologic and demographic factors, environmental exposures and lifestyle habits,
such as smoking and a lack of physical activity, also contribute to cardiometabolic risk (41;80).
Nutritional and dietary exposures may play an important role in the development of
cardiometabolic disease. For example, a diet rich in saturated fat may have deleterious effects on
cardiometabolic risk, although a recent meta-analysis concluded that the results were inconsistent
across studies (81). On the other hand, polyunsaturated fatty acid intake may beneficially affect
cardiometabolic risk, although, again, inconsistencies exist across studies (82). A recent clinical
trial reported reduced incidence of CVD among elderly individuals at risk of cardiometabolic
disease who consumed a traditional Mediterranean diet supplemented with olive oil or mixed
nuts, as compared to those consuming a low-fat diet (83). In addition, a nutrient-poor diet lacking
in fruit, vegetables, and a mild to moderate consumption of alcohol was linked to risk of
myocardial infarction in a large multinational study (80).
Of central relevance to this thesis, an increasing body of evidence suggests that vitamin D
deficiency may be an important risk factor for cardiometabolic outcomes (29-31;84-87) and even
overall mortality (88). However, recent systematic reviews have concluded that the results of the
various studies are equivocal (35-37). The widespread inconsistencies between studies may
result partly from unaccounted confounding or genetic differences (38).
1.2.4 Biomarkers of risk
Biomarkers are measurable biological factors, such as genetic variants, circulating hormones,
proteins, and metabolites, that can be used as surrogate indicators of normal physiologic
processes, pathogenic states, or to monitor responses to various exposures, therapeutic or
otherwise (89;90). The following sections describe biomarkers of physiologic processes
associated with cardiometabolic diseases.
6
1.2.4.1 Inflammation
Inflammation results from the activation of the innate immune response – the body’s immediate,
non-specific reaction against environmental insults such as pathogens, chemical or physical
injury (91). Inflammation plays a role in tissue damage prevention, restoration of tissue
homeostasis and destruction of infectious agents. It is the result of a system-wide process known
as the acute-phase response. During the acute-phase response, an array of pro-inflammatory
cytokines, such as TNF-α, IL-1β and IL-6, are released, primarily by macrophages (92). As
discussed earlier, these cytokines can enhance insulin resistance directly in adipocytes, muscle
and hepatic cells, leading to systemic disruption of insulin sensitivity and impaired glucose
homeostasis (93). Furthermore, elevated cytokine concentrations result in hepatic production and
secretion of acute-phase proteins, whose concentrations increase as cardiometabolic disease
progresses (60).
Circulating concentrations of both cytokines and acute phase proteins are commonly used
biomarkers of inflammation. Chronic inflammatory diseases, such as rheumatoid arthritis and
inflammatory bowel disease, are characterized by concentrations of these biomarkers that are
either much higher, if the biomarkers are pro-inflammatory, or much lower, if they are anti-
inflammatory, than those observed in healthy individuals (94). In contrast, the inflammation
associated with cardiometabolic diseases tends to be low-grade, with biomarker concentrations
often remaining no more than two- to four-fold higher than those observed in healthy persons
(95). Despite these modest changes in circulating concentrations, a number of inflammatory
biomarkers have been consistently associated with obesity, T2D and CVD, and therefore may be
considered biomarkers of cardiometabolic risk. These include well established markers, such as
high concentrations of CRP, IL-6 and TNF-α and low concentrations of adiponectin, as well as
less well-established markers, such as regulated upon and secreted (RANTES) and von
Willebrand factor (95).
Some have suggested that predictive power increases with the number of biomarkers being
measured (58;95). For example, one study examining the effects of an anti-inflammatory diet on
the transcriptome, proteome, and metabolome found no changes in individual biomarker
concentrations, but observed system-wide changes indicative of reduced inflammation and
7
oxidative stress (16). These changes became apparent when the authors analyzed the integrated
omics data using pathway analysis.
1.2.4.2 Glycemic Regulation
In general terms, adequate glycemic regulation is achieved when insulin is able to modulate
circulating glucose, stimulating its uptake and utilization after a meal or promoting
gluconeogenesis in the liver when glucose levels in the circulation are low (96). Insulin is
secreted from Β-cells in the pancreas, which both produce and store the hormone (97). The
progression to T2D involves both insulin resistance and β-cell dysfunction (96). In insulin-
resistant individuals, more insulin is needed to elicit glucose uptake in peripheral tissues (97). β-
cells meet this need by producing and secreting more insulin, and insulin-resistant individuals
thus become hyperinsulinemic in order to maintain euglycemia (98). Eventually, β-cells are
unable to meet the increased demand for insulin and β-cell dysfunction ensues, followed by
hyperglycemia and frank disease (99-101).
A number of approaches are used to measure insulin resistance and β-cell dysfunction. The gold
standard methods for measuring each are the hyperinsulinemic euglycemic clamp and the
hyperglycemic clamp, respectively (102). The hyperinsulinemic euglycemic clamp involves
intravenous infusion of insulin to raise its circulating levels, and parallel infusion of glucose to
maintain euglycemia. The rate at which glucose is infused represents glucose uptake by tissues
and, therefore, is indicative of the body's degree of sensitivity to the elevated insulin levels (102).
The hyperglycemic clamp, by contrast, involves a steady intravenous infusion of glucose to
maintain a hyperglycemic state; in this case, the plasma insulin response to the high glucose load
is measured (102). While accurate, these methods are time-consuming and expensive, making
their use in epidemiologic studies difficult.
The homeostasis model assessment of insulin resistance (HOMA-IR) and β-cell dysfunction
(HOMA-Beta) is a method commonly used to assess glycemic dysregulation in epidemiologic
studies. HOMA is derived from fasting plasma insulin and glucose concentrations (103). Under
fasting conditions, the relationship between glucose and insulin is representative of the balance
between insulin secretion and glucose output in the liver (104). The original HOMA method was
based on the following formulas:
8
HOMA-IR = (fasting plasma insulin x fasting plasma glucose) / 22.5
HOMA-Beta = (20 x fasting plasma insulin) / (fasting plasma glucose - 3.5), where insulin was
measured in mU/L and glucose was measured in mmol/L (105). The model was subsequently
updated to a computer algorithm that allows for a greater range of glucose concentrations and is
more appropriate for use in hyperglycemic individuals (103). In validation studies, the HOMA
model correlates well (r >0.7) with the clamp methods described earlier (106;107). Importantly,
HOMA-Beta must be interpreted in the context of insulin sensitivity, given that β-cell insulin
output is dependent on an individual's degree of insulin resistance (104).
1.2.4.3 Lipid Metabolism
Dysregulation in lipid metabolism, often characterized by hypercholesterolemia and
hypertriglyceridemia, is characteristic of cardiometabolic diseases (2). Fasting total cholesterol
levels are associated with cardiometabolic risk, although it is important to point out that it is the
lipoprotein carriers of cholesterol, rather than cholesterol itself, that are involved in pathologic
processes (108). Lipoprotein particles consist of apolipoproteins, phospholipids, cholesterol and
triglycerides, and they are classified based on their relative density and the identity of their
apolipoprotein components (108). The latter confer stability to lipoprotein particles, but they also
serve as ligands for cell surface receptors and they foster specific enzymatic processes related to
lipoprotein metabolism (109).
The main lipoproteins that affect cardiometabolic risk are LDL and HDL. Elevated
concentrations of the LDL cholesterol (particularly consisting of small, dense LDL particles),
coupled with low HDL cholesterol concentrations, promote the formation of atherosclerotic
plaques and are, therefore, an important contributor to the development of CVD (108;110;111).
LDL acts as the main transporter of cholesterol to tissues that express LDL receptors, including
the vascular endothelium (109). The development of atherosclerotic plaques is thought to begin
when circulating LDL enters the arterial intima and becomes oxidized, attracting macrophages
(110). As the macrophages engulf lipid, they become foam cells (111). These activated
macrophages also release cytokines that trigger inflammatory processes and attract yet more
macrophages, perpetuating the process. In addition, oxidized LDL damages the endothelium,
attracting platelets to the site of injury and triggering the proliferation of smooth muscle cells
(109). Smooth muscle cells also uptake oxidized LDL, becoming foam cells. The accumulation
9
of foam and smooth muscle cells leads to the formation of plaques, which, in turn, narrow the
arterial lumen and diminish blood flow (109). The protective role of HDL in atherogenesis
results from its functions in reverse cholesterol transport, both from other lipoprotein particles
and from peripheral tissues, back to the liver for subsequent excretion (110). This process
decreases the deposition of cholesterol in the vascular endothelium, preventing the formation of
atherosclerotic plaques. Indeed, high HDL cholesterol concentrations are associated with better
cardiometabolic outcomes (112).
High triglyceride concentrations have been consistently associated with cardiometabolic diseases
(113;114). However, controversy has existed over the years regarding whether these lipids are
causally associated with disease outcomes (115). Some evidence indicates that triglyceride
concentrations affect the metabolism and composition of LDL and HDL cholesterol. For
example, in insulin-resistant individuals, increased lipolysis in adipocytes results in the release of
free fatty acids and their subsequent repackaging into VLDL in the liver (115). As hepatic VLDL
production increases, CETP is activated and it transfers triglycerides to LDL and HDL
cholesterol. The enzymatic actions of LIPC lead to hydrolysis of triglycerides inside LDL,
resulting in small, dense particles. Small, dense LDL cholesterol is thought to be more
atherogenic than its normal-sized counterpart because it is more readily oxidized (116). In
addition, triglyceride-enriched HDL cholesterol is less able to scavenge cholesterol (117;118).
Numerous health organizations recommend screening various groups of individuals at risk of
CVD for these fasting LDL and HDL cholesterol, as well as triglycerides, and have set clinical
cutoff criteria for diagnosis of dyslipidemia (45;112). Total cholesterol is also measured, as a
proxy indicator of the lipoproteins present in plasma (108).
1.2.4.4 Plasma Proteome
The plasma proteome represents the largest version of the human proteome, with over 3,000
proteins identified (57;119). Among the most abundant, ranging in concentration between <1 and
approximately 800 μmol/L, are many molecules of physiological importance, such as
apolipoproteins, members of the complement system, coagulation factors, carrier proteins, and
protease inhibitors (57). Many of these proteins are acute phase reactants whose levels become
altered during inflammatory processes, and they may represent important biomarkers of
inflammation and endothelial dysregulation (59;120).
10
Recent methodological developments in the field of proteomics have allowed for the
simultaneous measurement of multiple proteins. In particular, a liquid chromatography
(LC)/tandem mass spectrometry (MS)-based, multiple-reaction-monitoring (MRM) proteomics
assay was recently developed that can simultaneously measure the concentrations of 54 high-
abundance plasma proteins (120). The concentrations of these 54 proteins were found to differ
across ethnic groups and individuals with different dietary intakes (119).
1.3 Vitamin D
1.3.1 Background and historical perspective
Because it can be synthesized endogenously after exposure to sunlight, vitamin D is not
technically a vitamin, but rather a pro-hormone (121). Structurally, vitamin D resembles steroid
hormones such as cortisol, aldosterone and estradiol (122). It is a secosteroid, where a carbon-
carbon bond is broken in one of the rings of the typical cyclopentanoperhydrophenanthrene
steroid structure. In the case of vitamin D, the breakage occurs in the 9,10 carbon bond of ring B
(122).
The most apparent manifestations of vitamin D deficiency in children and adults are rickets and
osteomalacia, respectively. The former is a bone disease characterized by poor skeletal
mineralization, slow growth, and various skeletal deformities such as bowed legs or knocked
knees, while the latter is also characterized by poor mineralization as well as muscular weakness
and bone pain (123;124). The beneficial effects of vitamin D on bone metabolism have been
appreciated for over a century (123). It is estimated that towards the late 1800s, as many as 90%
of children living in industrialized European and North American cities suffered from rickets
(125). Several anecdotal accounts reported reduced disease prevalence among children living in
sunny environments, subsequently leading to the discovery that ultraviolet radiation, both from
sunlight and from artificial sources such as mercury lamps, induced an improvement in rickets
(123;126). In the 1930s, the food industry adopted ultraviolet radiation as a method to fortify
foods and beverages, including not only milk but also products as wide-ranging as peanut butter,
hot dogs and even beer (123). Overall, vitamin D fortification in the first half of the 20th century
essentially eradicated rickets in countries that implemented it (123). However, by the 1950s,

11
excessive fortification of milk led to isolated incidents of idiopathic hypercalcemia in children,
particularly in Europe, with an ensuing restriction of vitamin D fortification across many
European countries that lasts into the present (123;127). By contrast, in Canada vitamin D
fortification of cow's milk and margarine is mandatory to this day, and fortification of other
products, such as goat milk, plant-based milk substitutes, and some calcium-fortified juices is
optional (128).
Beyond its well accepted therapeutic effects on bone metabolism, a great deal of interest has
arisen over the past few decades surrounding vitamin D's potential role in numerous non-skeletal
outcomes, including cardiometabolic diseases. The following sections provide an overview of
vitamin D physiology and a summary of the evidence for its involvement in disease-associated
processes.
1.3.2 Vitamin D metabolism
The main natural source of vitamin D in humans is cutaneous production of cholecalciferol
(vitamin D3) after ultraviolet (UV) B (290 - 315 nm) irradiation of 7-dehydrocholesterol (124).
Specifically, the conversion takes place in the plasma membranes of epidermal keratinocytes and
dermal fibroblasts, where 7-dehydrocholesterol is embedded (123). The formation of
cholecalciferol in the plasma membrane is preceded by formation of previtamin D3; the latter
metabolite is thermodynamically unstable and quickly undergoes isomerization to yield the more
stable cholecalciferol (123). Once formed, cholecalciferol is ejected from the plasma membrane
into the extracellular space (129). Plasma vitamin D binding protein (DBP), which is the main
transport protein for vitamin D metabolites, has a strong affinity for cholecalciferol and draws it
from the extracellular space into the capillaries for subsequent transport in the circulation to the
liver (130).
Humans can also obtain vitamin D through dietary consumption of cholecalciferol or its plant
and fungal equivalent, ergocalciferol (vitamin D2), from vitamin D-rich foods and supplements
(121). Cholecalciferol and ergocalciferol are very similar in structure, the only difference being
that the latter has a double bond at carbons 22-23 and a methyl group on carbon 24 (124). Many
vitamin D supplements contain ergocalciferol, although a recent meta-analysis suggests that
cholecalciferol may be more effective at raising vitamin D status than ergocalciferol (131).
Regardless of its molecular structure, dietary vitamin D is absorbed by enterocytes in the small
12
intestine and packed with other lipids into chylomicrons, which are delivered to the liver
(121;132;133).
Once in the liver, cholecalciferol is hydroxylated, primarily by cytochrome P450 (CYP-)2R1, to
25(OH)D, which is the major circulating form of vitamin D but is thought to be biologically inert
(121;134). The mitochondrial enzyme CYP27B1 then hydroxylates 25(OH)D to 1,25-
dihydroxyvitamin D (1,25(OH)2D) in the kidney and other target tissues (121;134). The latter is
considered a steroid hormone and it is the main active form of the vitamin, affecting both the
regulation of gene transcription and the activation of various signal transduction pathways (135)
when it binds to the vitamin D receptor (VDR).
As mentioned earlier, DBP is the main transport protein for vitamin D metabolites. 25(OH)D
bound to DBP enters the kidney by binding to megalin, an endocytic receptor (136;137). In its
unbound form, 25(OH)D can also diffuse passively through cell membranes (136). In turn,
1,25(OH)2D also circulates bound to DBP and can pass through membranes in its unbound form
(124).
Excessive sun exposure does not result in vitamin D intoxication because both previtamin D3 and
cholecalciferol can undergo conversion to a series of metabolically inert molecules (124).
Production of 25(OH)D from cholecalciferol in the liver is not tightly regulated. However, the
production of 1,25(OH)2D in the kidney is a rigidly regulated process affected by circulating
concentrations of calcium, parathyroid hormone, phosphorus, fibroblast growth factor 23 (FGF-
23), as well as 1,25(OH)2D itself (138). Low calcium concentrations result in a release of
parathyroid hormone, leading to increased renal 1,25(OH)2D production (138). This results in
increased intestinal calcium absorption (139). Conversely, high circulating phosphorus results in
production of FGF-23 in bone, leading to decreased 1,25(OH)2D production in the kidney (140).
Finally, high concentrations of 1,25(OH)2D signal a catabolic pathway that hydroxylates the
metabolite to water-soluble calcitroic acid, a step which is mediated by CYP24A1 (134). It is
important to note that the extra-renal regulation of 1,25(OH)2D is independent of calcium and
phosphorus metabolism. For example, in cell types such as macrophages and their precursors,
monocytes, regulation of CYP27B1, and hence 1,25(OH)2D production, is dependent upon
immune stimuli (141;142).

13
1.3.3 Biological Actions of Vitamin D
The majority of the biological actions of vitamin D result from binding of 1,25(OH)2D to the
VDR. The ligand-bound VDR heterodimerizes with retinoid X receptor (RXR) and binds to
vitamin D response elements (VDRE) in target genes, thus regulating their transcription (143).
The unliganded VDR/RXR complex can also bind to genes containing VDREs, but in these
instances transcription is prevented by a co-repressor complex (144). Recent in vitro studies have
examined 1,25(OH)2D action across the genome, using gene expression and chromatin
immunoprecipitation techniques (27;145). Hundreds of genes, belonging mainly to immune and
signaling pathways, have been identified whose expression is affected by liganded VDR binding
to VDREs (27;145). Many of these genes are known to be associated with diseases such as type
1 diabetes, Crohn's disease, multiple sclerosis, and colorectal cancer (27). In addition, CYP27B1
is expressed in numerous tissues beyond the kidney, such as cells of the immune system, brain,
prostate, pancreas, bone and skin (146). This widespread expression of the enzyme that converts
25(OH)D to the biologically active metabolite further suggests potential involvement of vitamin
D in numerous physiologic processes.
In addition to its genomic actions via binding to the VDR in the nucleus of vitamin D-responsive
cells, 1,25(OH)2D exerts non-genomic actions by activation of signal transduction pathways in
the cell membrane (121). The receptor for these actions is also thought to be the VDR, which,
while previously thought to be expressed only in the nucleus and the cytosol, has now been
shown to also be present in the membranes of various cell types (147). Binding of 1,25(OH)2D to
the cell membrane-associated VDR may lead to activation of several second messenger systems,
such as phospholipase C, protein kinase C, or G protein-coupled receptors, and this affects
several cellular processes such as the opening of voltage-gated calcium or chloride channels and
the release of intracellular calcium (121;148).
1.3.4 Vitamin D Sources
Few foods are naturally high in vitamin D. Among the highest sources of dietary vitamin D are
fatty fish and organ meats (128). In addition, in Canada and the United States, fortified products,
such as milk, are important sources of dietary vitamin D (149). One food with a particularly high
natural concentration of cholecalciferol is cod liver oil, which contains approximately 400 -
1,000 international units (IU) per teaspoon (124). By contrast, a fair-skinned individual exposed
14
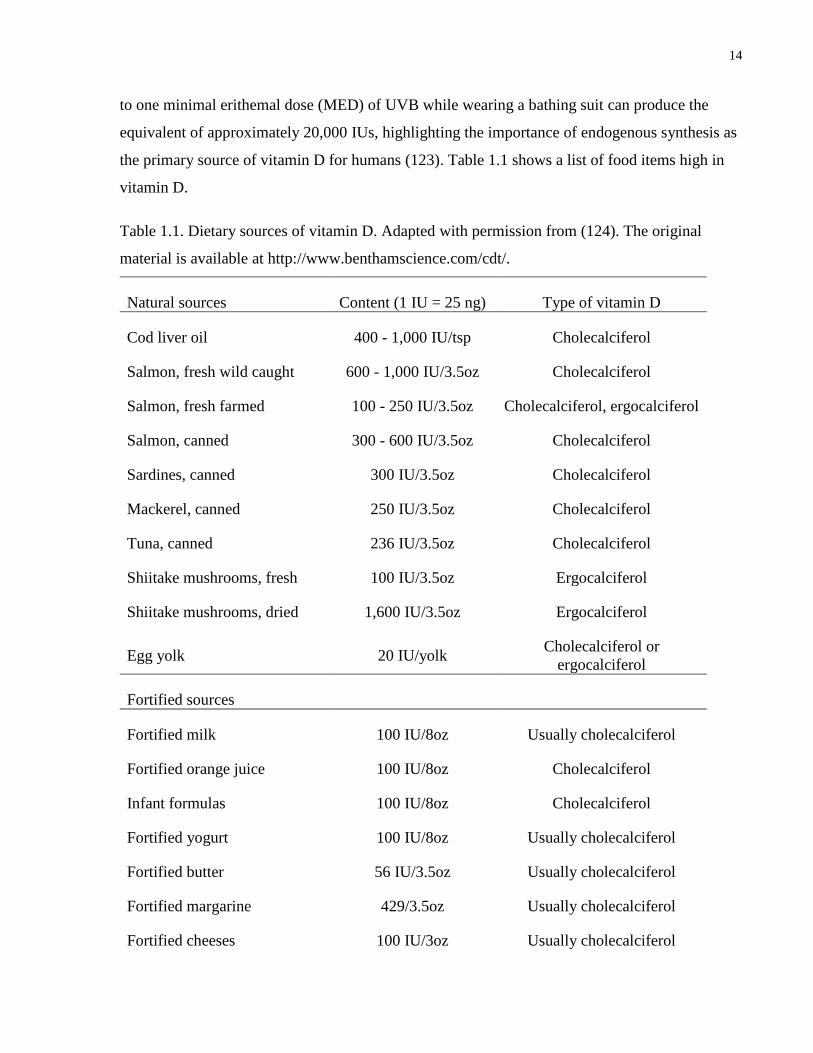
to one minimal erithemal dose (MED) of UVB while wearing a bathing suit can produce the
equivalent of approximately 20,000 IUs, highlighting the importance of endogenous synthesis as
the primary source of vitamin D for humans (123). Table 1.1 shows a list of food items high in
vitamin D.
Table 1.1. Dietary sources of vitamin D. Adapted with permission from (124). The original
material is available at http://www.benthamscience.com/cdt/.
Natural sources Content (1 IU = 25 ng) Type of vitamin D
Cod liver oil 400 - 1,000 IU/tsp Cholecalciferol
Salmon, fresh wild caught 600 - 1,000 IU/3.5oz Cholecalciferol
Salmon, fresh farmed 100 - 250 IU/3.5oz Cholecalciferol, ergocalciferol
Salmon, canned 300 - 600 IU/3.5oz Cholecalciferol
Sardines, canned 300 IU/3.5oz Cholecalciferol
Mackerel, canned 250 IU/3.5oz Cholecalciferol
Tuna, canned 236 IU/3.5oz Cholecalciferol
Shiitake mushrooms, fresh 100 IU/3.5oz Ergocalciferol
Shiitake mushrooms, dried 1,600 IU/3.5oz Ergocalciferol
Egg yolk 20 IU/yolk Cholecalciferol or
ergocalciferol
Fortified sources
Fortified milk 100 IU/8oz Usually cholecalciferol
Fortified orange juice 100 IU/8oz Cholecalciferol
Infant formulas 100 IU/8oz Cholecalciferol
Fortified yogurt 100 IU/8oz Usually cholecalciferol
Fortified butter 56 IU/3.5oz Usually cholecalciferol
Fortified margarine 429/3.5oz Usually cholecalciferol
Fortified cheeses 100 IU/3oz Usually cholecalciferol
15
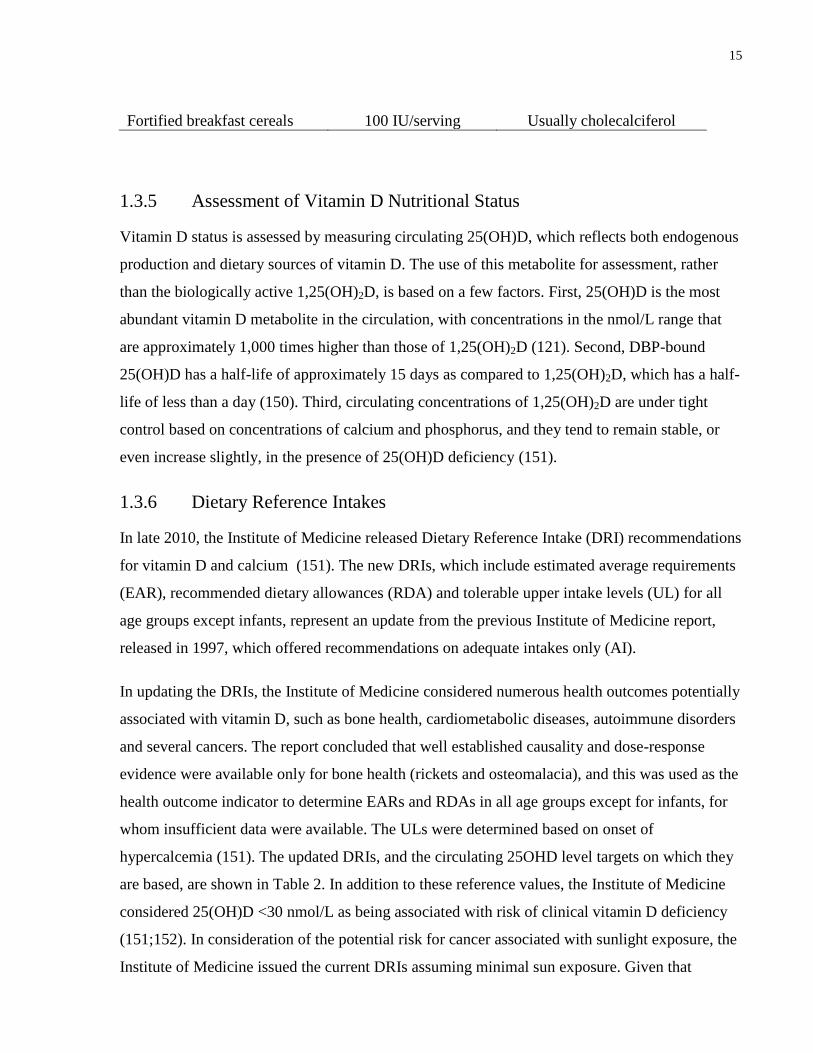
Fortified breakfast cereals 100 IU/serving Usually cholecalciferol
1.3.5 Assessment of Vitamin D Nutritional Status
Vitamin D status is assessed by measuring circulating 25(OH)D, which reflects both endogenous
production and dietary sources of vitamin D. The use of this metabolite for assessment, rather
than the biologically active 1,25(OH)2D, is based on a few factors. First, 25(OH)D is the most
abundant vitamin D metabolite in the circulation, with concentrations in the nmol/L range that
are approximately 1,000 times higher than those of 1,25(OH)2D (121). Second, DBP-bound
25(OH)D has a half-life of approximately 15 days as compared to 1,25(OH)2D, which has a half-
life of less than a day (150). Third, circulating concentrations of 1,25(OH)2D are under tight
control based on concentrations of calcium and phosphorus, and they tend to remain stable, or
even increase slightly, in the presence of 25(OH)D deficiency (151).
1.3.6 Dietary Reference Intakes
In late 2010, the Institute of Medicine released Dietary Reference Intake (DRI) recommendations
for vitamin D and calcium (151). The new DRIs, which include estimated average requirements
(EAR), recommended dietary allowances (RDA) and tolerable upper intake levels (UL) for all
age groups except infants, represent an update from the previous Institute of Medicine report,
released in 1997, which offered recommendations on adequate intakes only (AI).
In updating the DRIs, the Institute of Medicine considered numerous health outcomes potentially
associated with vitamin D, such as bone health, cardiometabolic diseases, autoimmune disorders
and several cancers. The report concluded that well established causality and dose-response
evidence were available only for bone health (rickets and osteomalacia), and this was used as the
health outcome indicator to determine EARs and RDAs in all age groups except for infants, for
whom insufficient data were available. The ULs were determined based on onset of
hypercalcemia (151). The updated DRIs, and the circulating 25OHD level targets on which they
are based, are shown in Table 2. In addition to these reference values, the Institute of Medicine
considered 25(OH)D <30 nmol/L as being associated with risk of clinical vitamin D deficiency
(151;152). In consideration of the potential risk for cancer associated with sunlight exposure, the
Institute of Medicine issued the current DRIs assuming minimal sun exposure. Given that
16
cutaneous synthesis is reduced in dark-skinned individuals (153), by relying only on dietary
sources of vitamin D these DRIs presumably are applicable to all ethnic backgrounds.
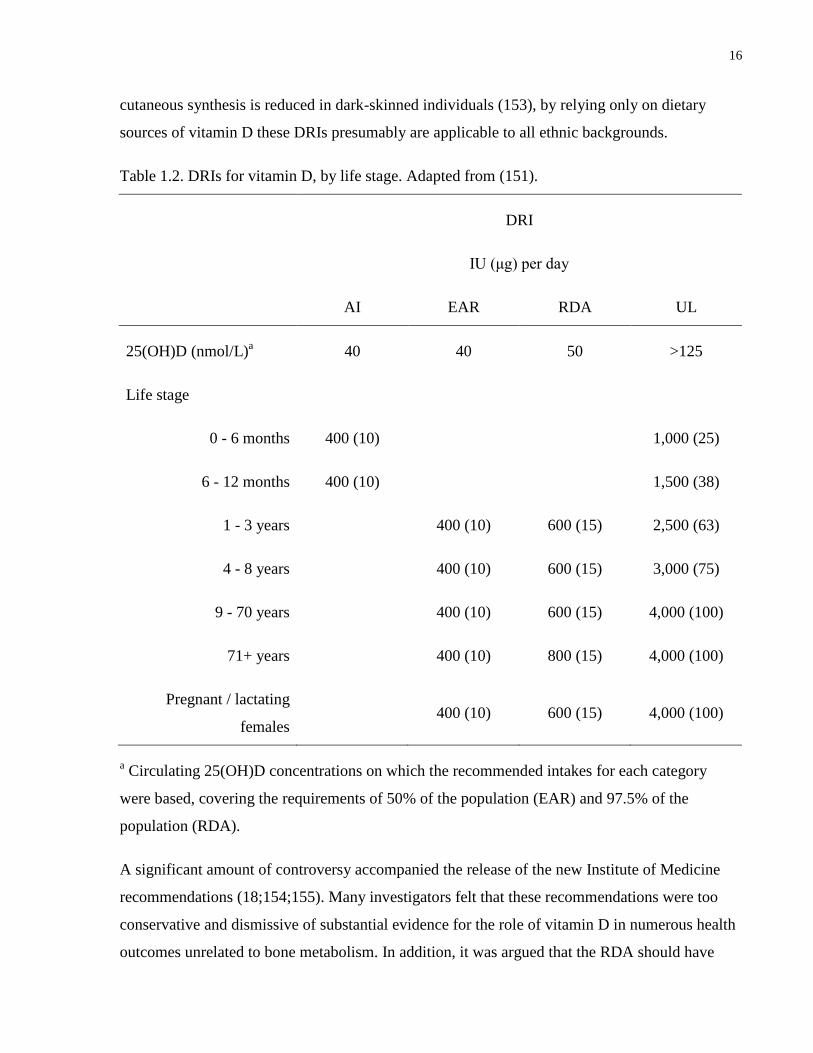
Table 1.2. DRIs for vitamin D, by life stage. Adapted from (151).
DRI
IU (μg) per day
AI EAR RDA UL
25(OH)D (nmol/L)a
40 40 50 >125
Life stage
0 - 6 months 400 (10)
1,000 (25)
6 - 12 months 400 (10)
1,500 (38)
1 - 3 years
400 (10) 600 (15) 2,500 (63)
4 - 8 years
400 (10) 600 (15) 3,000 (75)
9 - 70 years
400 (10) 600 (15) 4,000 (100)
71+ years
400 (10) 800 (15) 4,000 (100)
Pregnant / lactating
females
400 (10) 600 (15) 4,000 (100)
a Circulating 25(OH)D concentrations on which the recommended intakes for each category
were based, covering the requirements of 50% of the population (EAR) and 97.5% of the
population (RDA).
A significant amount of controversy accompanied the release of the new Institute of Medicine
recommendations (18;154;155). Many investigators felt that these recommendations were too
conservative and dismissive of substantial evidence for the role of vitamin D in numerous health
outcomes unrelated to bone metabolism. In addition, it was argued that the RDA should have
17
been calculated to maintain serum 25(OH)D at >75 nmol/L, a level proposed by many, including
the Endocrine Society and the Canadian Osteoporosis Society, to be associated with maximum
health benefits (20;23;24;155;156).
1.3.7 Determinants of Vitamin D Status
Circulating concentrations of 25(OH)D are dependent on numerous biologic, demographic and
behavioural/lifestyle factors. An overview of the main contributors to vitamin D status is
presented below.
1.3.7.1 Ultraviolet Exposure
As mentioned previously, cutaneous exposure to UVB in the 290 - 315 nm range results in
conversion of 7-dehydrocholesterol to cholecalciferol, which is subsequently hydroxylated into
25(OH)D (124). Therefore, an individual's degree of exposure to UVB radiation is an important
determinant of vitamin D status. Time of day, season and geographic location all affect the
amount of UVB reaching the earth's surface (125;157). In the early morning and evening, as well
as in winter, sunlight enters the atmosphere at a more oblique angle, resulting in more efficient
absorption of UVB by the ozone layer (123). Similarly, the sun's rays reach the earth at a more
oblique angle at higher latitudes, which results in diminished UVB exposure (124). In general,
those living above 33° north latitude are unable to produce vitamin D from sun exposure
between November and March; in addition, cutaneous production is minimal before 10am and
after 3pm (157;158).
1.3.7.2 Dietary Intake
The correlation between dietary vitamin D intake and circulating levels of 25(OH)D ranges
between approximately r=0.2 and r=0.7, depending on the study (159;160). The observed range
in r values suggests that a significant portion of the variation in circulating concentrations may
be accounted for by factors other than intake, as discussed below.
1.3.7.3 Body Composition
A number of cross-sectional studies report inverse associations between 25(OH)D and obesity,
with a higher prevalence of vitamin D insufficiency among obese than non-obese individuals
(161-164). This is thought to occur due to sequestration of vitamin D, which is a fat-soluble
18
molecule, in adipose tissue (86;164;165). Indeed, intestinal absorption of cholecalciferol derived
from the diet results in its packaging into chylomicrons together with various lipids, such as
triglycerides (132;133). Chylomicrons are delivered to various tissues where some of their lipid
contents are metabolized by LPL, which is particularly expressed in skeletal muscle and adipose
tissue (109;150). Some of the cholecalciferol associated with chylomicrons is absorbed by the
tissues during this process and does not reach the liver; this may partly explain why adipose
storage of vitamin D leads to lower circulating 25(OH)D in obese individuals (150). Other
factors may also contribute to the low vitamin D status observed in obese individuals, such as a
lack of time spent outdoors due to decreased mobility, an increased activity of CYP24A1 in
adipose tissue, or a decreased ability of the lipid-enriched liver to produce 25(OH)D (164).
Recent studies have suggested that a low vitamin D status may predispose to obesity (164;166).
Adipose tissue expresses the VDR as well as CYP27B1, indicating that not only is this tissue
receptive to the biologically active form of vitamin D, but can also synthesize it locally
(146;167). This suggests a potential role for vitamin D in adipose tissue's normal functions.
Some in vitro evidence has shown possible anti-lipogenic and pro-lipolytic effects of
1,25(OH)2D (168-170). In some human studies, a subject's vitamin D status at baseline predicted
later weight loss (171;172); however, other studies reported no effect of vitamin D
supplementation on weight loss (173;174), although in one of those studies supplementation was
associated with favourable effects on triglycerides and TNF-α (174). Most recently, one group
used a Mendelian randomization approach to examine the causal relationship between obesity
and vitamin D status by pooling data from over 20 cohorts, totaling more than 40,000 individuals
(175). The authors examined the association between genetic variants that have been strongly
associated with body mass index (BMI) and 25(OH)D concentrations; at the same time, they also
examined the association between variants associated with 25(OH)D and BMI. Genetic variants
linked to BMI were associated with 25(OH)D levels, but 25(OH)D-related variants were not
associated with BMI, suggesting that a high BMI, which might be indicative of increased
adiposity, may lead to a lower vitamin D status, but not the other way around (175).
1.3.7.4 Ethnicity
A wealth of evidence suggests that ethnicity is associated with vitamin D status (176). Ethnicity
is a proxy measure for skin pigmentation, and it is dark-skinned individuals who are most at risk
19
for being vitamin D-deficient (122;176). Melanin, the pigment responsible for skin colour, acts
as a natural sunscreen that absorbs UVB and prevents the conversion of 7-dehydrocholesterol to
cholecalciferol (177). Indeed, Caucasian individuals tend to have a higher vitamin D status than
other ethnic groups, and deficiency is particularly prevalent among non-Caucasian individuals
living in environments with a seasonal lack of sunlight, such as Canada (152;153). Based on data
from the Canadian Health Measures Survey, the prevalence of vitamin D deficiency (25(OH)D
<30 nmol/L, as defined by the Institute of Medicine) in Canada has been reported to range from
3% among Caucasians to 16% among non-Caucasians (152). In addition, a few small studies
have reported lower circulating 25(OH)D in South Asian and East Asian individuals living in
Canada than those of European ancestry (153;178). Interestingly, seasonal fluctuations in
25(OH)D concentrations were observed among Caucasians and East Asians, but not South
Asians (153).
In parallel with ethnic differences in vitamin D status, disparities in cardiometabolic disease
prevalence have been documented across ethnic groups (63;80). It is possible that the different
rates of cardiometabolic disease may result, in part, from the variation in 25(OH)D
concentrations seen across ethnic groups. In addition, some have suggested that the relationship
between vitamin D and certain outcomes, such as bone mineral density and atherosclerosis,
differs between Caucasians and African Americans, following an inverse direction in the former
group but a positive direction in the latter (179;180). Overall, the relationship between vitamin D
and cardiometabolic disease across ethnic groups remains relatively poorly understood (180-
183).
1.3.7.5 Medications
A number of common medications are known to affect vitamin D metabolism and alter the
circulating concentrations of both 25(OH)D and 1,25(OH)2D. For example, glucocorticoids have
been shown to downregulate VDR expression in osteosarcoma cells in vitro (184), and use of
these medications is associated with decreased 25(OH)D concentrations in large, population-
based studies (185). The mechanism behind this association remains incompletely understood,
but may be partly a result of glucocorticoid upregulation of CYP24A1 and, subsequently,
increased vitamin D catabolism (185;186).
20
In contrast to medications that decrease vitamin D status, sex hormone-containing medications,
such as hormonal contraceptives (HC) or hormone replacement therapy (HRT), are positively
associated with 25(OH)D (187-191). This relationship has been documented in individuals of
European and African ancestry, but the effects of these medications on vitamin D status in other
ethnic groups are less well understood. The effects of these drugs on circulating 25(OH)D are
thought to be mediated by estrogen. In particular, most modern HC formulations consist of a
combination of synthetic estrogen and progestins (192). In vitro and animal studies suggest that
estrogen downregulates CYP24A1 and upregulates CYP27B1 (193;194). In addition, estrogen
appears to upregulate VDR expression (195), and it is associated with elevated DBP
concentrations (196;197). Thus, estrogen seems to play an important role in modulating vitamin
D metabolism, but the clinical relevance of its effects on circulating vitamin D metabolites is
poorly understood.
Understanding the relationship between HC and vitamin D is important because, in addition to
their effects on vitamin D, HC have been associated with numerous adverse health outcomes
(198-203). Therefore, these drugs may be important confounders of the relationship between
25(OH)D and cardiometabolic disease. HC, which are used by over 100 million women
worldwide, are prescribed not only to prevent unwanted pregnancies, but to treat various other
conditions such as acne, polycystic ovarian syndrome and endometriosis (204;205). At the same
time, HC have been linked to widespread effects at the level of the plasma proteome and a higher
risk of adverse health outcomes, such as elevated concentrations of CRP and other inflammatory
biomarkers (198;199;203;206), impaired glucose tolerance and CVD (204;207;208). However,
despite these documented effects on pathways that become dysregulated during the progression
of cardiometabolic disease, no studies have directly investigated whether these widely used
medications modify the association between 25(OH)D and cardiometabolic disease.
1.3.7.6 Genetic Variation
Based on twin studies, heritability estimates for 25(OH)D levels in plasma range between 43%
and 77% (209-211). These high estimates suggest that genetic factors may be an important
contributor to vitamin D status.
A number of candidate gene studies have examined the role of selected variants along the
vitamin D metabolic pathway on circulating 25(OH)D levels (212). Single nucleotide
21
polymorphisms (SNPs) in vitamin D-related genes were found to be associated with vitamin D
status, including CYP27B1 (213;214), CYP2R1 (215;216), GC (the gene that encodes DBP)
(214-220), VDR (218;221), CYP24A1 (216) , and DHCR7 (encoding 7-dehydrocholesterol
reductase, which synthesizes cholesterol from 7-dehydrocholesterol) (216).
Most recently, studies conducted using the GWAS approach have surveyed variants across the
entire human genome in various populations in association with 25(OH)D (222-226). One study
conducted on approximately 4,500 individuals of European ancestry found significant
associations between 25(OH)D concentrations and SNPs in GC, NADSYN1 (encoding
nicotinamide adenine dinucleotide synthetase), which was in high linkage disequilibrium with a
SNP in DHCR7, and CYP2R1 (223). The SNP with the lowest p-value was rs2282679, which is
found within GC. Another study evaluated circulating 25(OH)D and genetic variation in a
sample consisting of about 34,000 individuals of European descent (223). This study also found
significant associations between 25(OH)D levels and variants within or near GC, DHCR7, and
CYP2R1, as well as CYP24A1 (220). As in the previous study, the SNP with the lowest p-value
was rs2282679, suggesting an important role for this variant in modulating 25(OH)D
concentrations. Several smaller (sample sizes of approximately 230 to 1,000) studies have been
conducted on individuals from the Framingham Heart Study (226), as well as Hispanic
individuals (218) and children with asthma (225). These studies identified no variants associated
with 25(OH)D at the Bonferroni-corrected genome-wide level. This may have been due to the
small size of the study populations. However, one of the studies was able to replicate some of the
findings of the two large GWAS conducted on Caucasian individuals (225). In particular, the
authors reported associations between 25(OH)D and rs2282679, further highlighting the
potential importance of this SNP in determining vitamin D status, as well as between 25(OH)D
and rs10741657 (found within CYP2R1) (225).
Despite providing some insights about the genetic determinants of vitamin D status, it is
estimated that, in total, the variants identified through GWAS account for only about 4% of the
variation in vitamin D status (212;227). This is in contrast to the high heritability estimates
provided by twin studies (209-211). Of note, the SNPs identified through GWAS are common
variants with minor allele frequencies >5%, and the GWAS studies conducted thus far have not
considered rare variants, epistasis, gene-environment interactions, or other potential genetic
factors that may play an important role in determining vitamin D status (227;228). However,
22
taken together, the evidence from the various study types indicates that genetic variants affect
vitamin D status and may, therefore, act as important confounders of the association between
vitamin D and specific health outcomes.
1.3.8 Measurement of 25(OH)D
Several methods exist to measure 25(OH)D. The original method, a competitive binding assay,
was developed in the 1970s and it measured 25(OH)D concentrations using DBP as a binding
agent and radioactively labelled 25(OH)D as a reporter (229;230). The assay was cumbersome
and time-consuming and was not suitable for use in environments where a large number of
samples are processed, such as clinical laboratories (231). Other methods introduced since then
include radioimmunoassay (RIA), high-performance liquid chromatography (HPLC) and LC-
MS/MS (230;232). In addition, more recently several automated immunoassays have become
available as well (232).
In general, measuring 25(OH)D is challenging because of its highly hydrophobic nature, its
strong affinity for DBP, and the structural similarities between 25(OH)D3, which is derived from
cholecalciferol, and the ergocalciferol-derived 25(OH)D2 (230). In fact, not every available assay
is able to either measure, or distinguish between, both metabolites. HPLC and LC-MS/MS are
considered the gold standards because they are considered to be the most accurate, precise and
specific methods, they are able to differentiate between 25(OH)D3 and 25(OH)D2, and they can
also measure other vitamin D metabolites, such as 24,25(OH)D (231-234). Some shortcomings
of these assays include the fact that they are technically sophisticated, time-consuming, and
difficult to implement in high-throughput clinical settings (231). RIA is less technically
demanding than the LC-based methods and has been used extensively. Indeed, it was the first
methodology approved by the United States Food and Drug Administration (FDA) for clinical
assessment of 25(OH)D (230). More recently, DiaSorin, the same company that developed the
FDA-approved RIA, introduced a chemiluminescence-based immunoassay method called
LIASON (235). Unlike RIA, which is a manual method, LIAISON is automated and intended for
use in high-throughput settings. Furthermore, while RIA required the use of radioactive
materials, LIAISON does not.
In consideration of the difficulty inherent to measuring vitamin D and in acknowledgement of
problems with inter-laboratory and inter-assay variability, the International External Quality
23
Assessment Scheme for Vitamin D (DEQAS) was launched in 1989 with the goal of assessing
the performance and reliability of the various 25(OH)D methods across laboratories worldwide
(234). At present, approximately 600 groups participate (231). While issues with variability still
exist (233;236;237), it is generally agreed that the existence of DEQAS has greatly improved the
overall performance of the various assays over time (238).
1.4 Vitamin D and Cardiometabolic Disease
Numerous studies have examined the association between vitamin D and markers of
cardiometabolic risk in both adults and children (29;87;239-241). However, recent systematic
reviews have concluded that the results of the various studies are equivocal (35-37;242;243).
Adding to the controversy, a recently published study reported lower circulating 25(OH)D in the
offspring of nonagenarians, suggesting that low vitamin D status may not be causally associated
with increased mortality from age-related diseases (244). Overall, the inconsistencies between
studies have been attributed to small sample sizes and differences in age, sex, ethnicity and
disease status between the populations studied. In addition, unaccounted factors, such as genetic
variation between individuals and HC use among women, may confound the association between
vitamin D and cardiometabolic disease-related processes. Indeed, a large, long-term prospective
study recently identified a novel association between a VDR variant and a composite of risk for
hip fracture, cancer, myocardial infarction, and mortality (38). This association was only
apparent in individuals with a low vitamin D status, highlighting the importance of taking into
account gene-environment interactions. Furthermore, one study using data from the Women's
Health Initiative found that HRT (which, like HC, often contain synthetic estrogen), modified the
effect of calcium and vitamin D supplementation on colorectal cancer (245), and an analysis of
data from a large German cohort showed that HRT use attenuated an inverse association between
25(OH)D and breast cancer (190). While neither of these studies assessed the role of HC, the
trends observed with HRT suggest that HC may also act as important confounders.
The following sections provide a summary of the relationship between vitamin D and specific
pathways that become dysregulated during the development of cardiometabolic disease.
24
1.4.1 Relationship with Innate Immunity and Inflammation
Most immune cell types, including macrophages, express the VDR as well as CYP27B1, and
thus are not only responsive to 1,25(OH)2D but can synthesize it locally from circulating
25(OH)D (28). In vitro studies conducted on macrophages have shown that, in these cells,
pathogen exposure leads to the upregulation of CYP27B1 through signaling by toll-like receptors
(246-248). The enhanced production of 1,25(OH)2D results in its binding to the VDR, and the
complex of the two subsequently upregulates the transcription of genes encoding endogenous
antimicrobial peptides (249). The upregulation of CYP27B1 and ensuing production of
1,25(OH)2D is also triggered by signaling from interferon-γ (IFN-γ) (141;142). In addition to
antimicrobial activity, cytokine production by macrophages and other immune cell types is
directly regulated by 1,25(OH)D2 (28). Indeed, in vitro and animal studies have shown that
1,25(OH)D2 downregulates the production of pro-inflammatory cytokines such as IFN-γ and IL-
2 and it upregulates the transcription of immuno-supressive cytokines such as IL-10 (250-253).
These effects result both through direct binding of the 1,25(OH)2D-VDR complex to VDREs
present in cytokine genes and through modulation of pro-inflammatory intracellular signalling
pathways, such as those downstream of the nuclear transcription factor NFκB and nuclear factor
of activated T cells (NFAT) (28).
Despite abundant experimental evidence for a relationship between vitamin D and inflammation,
epidemiological studies and clinical trials have yielded inconsistent results. On the one hand,
cross-sectional studies carried out in diverse populations have found an inverse association
between circulating concentrations of 25(OH)D and pro-inflammatory cytokines, acute phase
proteins and hemostatic markers (85;254-257). Certain intervention trials also found that oral
supplementation with vitamin D resulted in increased concentrations of 25(OH)D and decreased
concentrations of CRP and other inflammatory markers (31;258-260). On the other hand, some
other cross-sectional and intervention studies found null associations between 25(OH)D and
markers of inflammation (241;261-266), and one recent study reported a positive association
between 25(OH)D and CRP among vitamin D-sufficient adults (267).
Taken together, the evidence from human studies regarding the relationship between vitamin D
and inflammation is inconsistent. The inconsistencies may be due in part to unaccounted
confounding. Indeed, one recent study reported that FokI, a polymorphism of the VDR gene,

25
modifies the response to vitamin D supplementation (1,000 IU per day for 12 weeks) in subjects
with T2D (268). At the end of the treatment, the change in CRP and IL-6 concentrations was
much more pronounced (i.e., the concentrations of both biomarkers were lower) in individuals
who were homozygous for the major allele than those who were risk allele homozygotes. The
latter group may, therefore, be classified as hypo-responders with respect to vitamin D
supplementation (268). It is not known whether other genetic variants modify the effect of
vitamin D on various cardiometabolic outcomes. In addition, it is possible that lifestyle factors
such as HC affect the relationship between 25(OH)D and inflammation. As mentioned
previously, these medications affect circulating 25(OH)D (188) and they are also associated with
increased levels of inflammatory biomarkers (198;199;203;206).
1.4.2 Relationship with Glycemic Regulation
There is evidence for a higher prevalence of diagnosis of T2D during winter, when UVB
radiation is minimal, than in summer (269). This suggests a potential role for vitamin D in
protecting against T2D. Indeed, experimental evidence accumulated over the years indicates that
vitamin D plays a potentially important role in glycemic regulation. The role of vitamin D was
initially suggested from the presence of the VDR in pancreatic β cells (270). In these cells,
1,25(OH)2D enhances insulin production and secretion (271;272). Furthermore, the promoter of
the insulin receptor gene contains a VDRE (25), and 1,25(OH)2D stimulates insulin
responsiveness and glucose update in vitro (26). Another potential mechanism behind the
beneficial actions of vitamin D on glycemic regulation might revolve around this micronutrient's
important immunomodulatory actions, as described in a previous section (273). Through
downregulation of the NFκB pathway, 1,25(OH)2D attenuates pro-inflammatory cytokine
production, thus inhibiting β-cell apoptosis and promoting their survival (274). Finally, a number
of studies have shown associations between SNPs in VDR and GC, glucose intolerance and
insulin secretion, providing additional evidence for a relationship between vitamin D and
glycemic regulation (275-278).
Various cross-sectional studies have shown an inverse association between circulating 25(OH)D
and glycemic status measures, such as fasting plasma glucose, oral glucose tolerance tests,
hemoglobin A1c (HbA1c), and insulin resistance, as well as the metabolic syndrome
(29;87;183;239;279-283). For example, data from NHANES showed an inverse, dose-dependent

26
association between circulating 25(OH)D and diabetes prevalence in non-Hispanic whites and
Mexican Americans, although the association was not observed in non-Hispanic blacks
(183;279). The same inverse trend was observed between 25(OH)D and insulin resistance, but
there was no association with β-cell function (183;279). Data from the same cohort also showed
an inverse association between 25(OH)D and prevalence of the metabolic syndrome (279). More
recently, data from the Women’s Health Initiative Calcium-Vitamin D trial have shown an
association between 25(OH)D and some cardiometabolic risk factors (e.g. triglycerides,
triglyceride:HDL-cholesterol ratio) as well as metabolic syndrome (239). However, other
cardiometabolic risk factors (e.g. LDL-cholesterol, HDL-cholesterol, glucose, insulin, HOMA-
IR, HOMA-Beta) were not associated with 25(OH)D (239). A recent study using data from the
United States National Health and Nutrition Examination Survey (NHANES) reported a
synergistic interaction between low 25(OH)D and abdominal obesity that increases the risk of
insulin resistance (284).
In prospective studies, dietary vitamin D intake has been associated with impaired glycemic
regulation and incidence of T2D. For example, a study using data from the Nurses Health Study
found a significant inverse association between total vitamin D intake and T2D risk (285). More
recently, a study of Canadian individuals reported a reduced risk of progression to impaired
fasting glucose, impaired glucose tolerance and frank T2D over a 3-year period among those
with a higher baseline 25(OH)D status (30). However, intervention studies have shown
conflicting results regarding the effect of vitamin D supplementation on glycemic regulation and
T2D incidence. One study reported that supplementation with 1,25(OH)2D for one week did not
affect fasting glucose or insulin sensitivity in healthy young men (286). Another study found
that, among T2D patients, supplementing with 1,25(OH)2D for three weeks ameliorated insulin
secretion, but did not improve glucose tolerance after a 75 g oral glucose load (271). Yet another
study found that, among middle-aged men with impaired glucose tolerance or mild T2D who had
adequate serum vitamin D levels at baseline, supplementation with 1,25(OH)2D for 3 months had
no effect on glucose tolerance (287). However, in a cross-over design, 20 diabetes patients with
inadequate vitamin D serum levels who were supplemented with 1,25(OH)2D for 4 days had
improved insulin and C-peptide secretion, but showed no changes in fasting or stimulated
glucose, C-peptide, or insulin concentrations (288). The data from a 2-year-long trial designed to
assess bone health in postmenopausal women without diabetes were analyzed a posteriori for
27
effects of vitamin D3 or 1,25(OH)2D supplementation on fasting glucose, and found no
significant effects (289). Furthermore, a post-hoc analysis of data from a three-year-long trial for
bone health found that daily supplementation with 700 IU of cholecalciferol and 500 mg of
calcium citrate malate had no effect on blood glucose or insulin resistance in elderly adults who
were normoglycemic. In contrast, subjects with IGT at baseline presented a significantly
improved fasting glycemic response and insulin sensitivity after three years (273). A
randomized, controlled trial found that daily supplementation with 400 IU of cholecalciferol for
6 months in insulin-resistant, vitamin D-deficient South Asian women living in New Zealand
resulted in improved insulin resistance and sensitivity (290). Another recent trial found that
daily consumption of a vitamin D-fortified yogurt drink (1,000 IU of cholecalciferol per day)
improved glycemic control in Iranian T2D patients (32). Most recently, it was reported that daily
supplementation with 4,000 IU of cholecalciferol for six months resulted in increased circulating
25(OH)D and improved fasting insulin and HOMA-IR among obese adolescents (86).
1.4.3 Relationship with Lipid Metabolism
The VDR is expressed ubiquitously throughout the body, including the liver and adipose tissue,
which are major contributors to lipid metabolism (109;121;291). Therefore, one might
hypothesize that vitamin D plays a role in regulating lipid concentrations. However, the potential
mechanistic link by which vitamin D may affect lipid metabolism remains unclear.
In epidemiologic studies, 25(OH)D has been associated with higher HDL and ApoA-1, which is
the main lipoprotein particle in HDL (292). This has led some investigators to propose that
vitamin D contributes to the maintenance of adequate ApoA-1 and, subsequently, HDL
concentrations (292;293). This would, in turn, lead to a less atherogenic lipid profile because of
the cholesterol scavenging properties of HDL. However, in experimental studies VDR knockout
mice had higher HDL and ApoA-1 than wildtype animals (294). This paradoxical finding was in
agreement with cell culture studies, where 1,25(OH)2D inhibited both Apo-A1 secretion and
mRNA (295). Therefore, it is not clear whether vitamin D affects production of ApoA-1, and
whether this might lead to increases in HDL.
Another potential mechanistic link between vitamin D and lipid metabolism might be through
effects on circulating triglycerides. Some evidence from in vitro studies suggests that LPL
expression is upregulated in adipocytes exposed to 1,25(OH)2D (169). In vivo, this might
28
translate into decreased triglyceride concentrations in the circulation. Indirectly, vitamin D might
also affect triglyceride concentrations via calcium metabolism. Higher circulating 25(OH)D
leads to the increased absorption of dietary calcium (296). The absorbed calcium may form
insoluble complexes with fatty and bile acids, thus inhibiting cholesterol absorption and leading
to its excretion (297;298). Increases in intracellular calcium in the liver following increased
calcium absorption might also lead to decreased hepatic triglyceride production (299). Another
indirect link between 25(OH)D and triglycerides might be through the elevations in parathyroid
hormone concentrations that parallel decreases in 25(OH)D (300). Increased circulating
parathyroid hormone has been linked to hypertriglyceridemia in rats (301).
In general, cross-sectional studies seem to suggest an inverse association between 25(OH)D and
a pro-atherogenic lipid profile, although the results have been somewhat inconsistent
(163;239;280;281;291;293;302-305). Clinical trials have yielded even more inconsistent results,
as summarized by one recent meta-analysis (306). It must be noted that the sample sizes of all
the trials were small, none of the studies was designed to assess the specific relationship between
vitamin D and lipids, the vitamin D dosage differed widely across studies, and some used
cholecalciferol, whereas others used ergocalciferol (291;306). In addition, unaccounted
confounders such as lifestyle variables and genetic variation may account for some of the
variability in results across studies.
1.4.4 Relationship with the Plasma Proteome
Recent in vitro studies have examined vitamin D action across the genome, using gene
expression and chromatin immunoprecipitation techniques (27;145). Hundreds of target genes,
belonging mainly to immune and signaling pathways, have been identified, and many are known
to be associated with diseases such as type 1 diabetes, Crohn's disease, multiple sclerosis, and
colorectal cancer. However, it is not known whether the observed widespread effects of vitamin
D at the genome level in vitro translate into downstream effects at the level of the proteome in
vivo.

29
1.5 Summary and Rationale
Cardiometabolic diseases, including T2D and CVD, represent a significant global public health
burden (1). There is great interest in the beneficial effects of vitamin D on cardiometabolic
disease, given its potential modulation of disease-associated pathways such as inflammation and
glucose and lipid metabolism. However, while vitamin D modulates the expression of hundreds
of genes in vitro (27), whether these widespread genomic effects translate into observable effects
at the level of the proteome in vivo remains unknown. Furthermore, recent systematic reviews
have concluded that there is insufficient evidence for a relationship between vitamin D and
cardiometabolic disease-related outcomes (35-37). The inconsistencies between studies may
result from unaccounted confounding from lifestyle and demographic factors, genetic variation
across individuals, and a lack of adequate biomarkers of vitamin D action or disease progression
(38). Identifying potential confounders is important because it may enhance our understanding of
the relationship between vitamin D and cardiometabolic disease.
As outlined in this literature review, use of HC by women is associated with both elevated
25(OH)D and a worse cardiometabolic profile (188;204;207). However, the potential role of
these medications as confounders of the relationship between 25(OH)D and cardiometabolic
disease remains poorly understood. Genetic variation in VDR represents another potentially
important source of confounding, because vitamin D exerts its biological actions by binding to
the VDR and the latter is expressed in multiple tissues throughout the body (121). Indeed, some
studies suggest that traditional VDR variants such as TaqI or FokI may affect certain aspects of
cardiometabolic disease, but the potential role of other variants in this gene remains poorly
explored. In addition, few studies have considered the interaction between VDR genotype and
vitamin D status. A recent study reported a link between a VDR variant and a composite risk
score for major clinical outcomes, but the association was present only in those with a low
vitamin D status (38). The results of that study highlight the importance of considering gene-
nutrient interactions.
The overall goal of this thesis was to conduct a comprehensive examination of the association
between 25(OH)D and biomarkers of inflammation, biomarkers of glucose and lipid metabolism,
and plasma proteomic biomarkers, and to assess the role of potential lifestyle and genetic
confounders, namely HC use and genetic variation in VDR, in modifying this relationship.
30
1.6 Hypothesis and Objectives
Hypothesis: Common genetic variants and lifestyle factors modify the association between
circulating levels of vitamin D and biomarkers of inflammation, glucose and lipid metabolism,
and plasma proteomic biomarkers in an ethnically diverse population of young adults.
Objectives:
1. To examine the association between 25(OH)D and CRP, and to determine whether HC
use modifies this association.
2. To examine the association between plasma 25(OH)D and five cytokines, and to
determine whether HC use modifies this association.
3. To examine the association between 25(OH)D and biomarkers of glucose and lipid
metabolism, and to determine whether HC use modifies this association.
4. To examine the association between 25(OH)D and plasma proteomic biomarkers, and to
determine whether HC use modifies this association.
5. To examine whether genetic variants in the VDR are associated with biomarkers of
inflammation, biomarkers of glucose and lipid metabolism, and plasma proteomic
biomarkers, and to determine whether vitamin D status modifies these associations.
31
Chapter 2 : Positive association between 25-hydroxyvitamin D and C-
reactive protein is confounded by hormonal contraceptive use
This chapter is adapted with permission from an article published in the Journal of
Women's Health (c) 2013 (copyright Mary Ann Liebert, Inc.); the Journal of
Women's Health is available online at: http://online.liebertpub.com. The original
article is the following:
García-Bailo B, Josse AR, Jamnik J, Badawi A, El-Sohemy A. Positive
Association Between 25-Hydroxyvitamin D and C-Reactive Protein is Confounded
by Hormonal Contraceptive Use. J Womens Health (Larchmt). 2013
May;22(5):417-25. doi: 10.1089/jwh.2012.4046.
32
2.1 Abstract
Background: Studies of the relationship between vitamin D and inflammation are equivocal.
This may be due to unaccounted confounding. Hormonal contraceptive (HC) use is associated
with elevated circulating 25-hydroxyvitamin D (25(OH)D) in Caucasians and African-
Americans, but its effects on 25(OH)D in other ethnicities are unclear. HC use is associated with
elevated C-reactive protein (CRP), an inflammatory biomarker. Our objectives were to assess
the effect of HC use on 25(OH)D across ethnic groups, and to examine the association between
HC, 25(OH)D and CRP in an ethnically diverse population of young adults.
Methods: We recruited Caucasian, East Asian, and South Asian individuals (n=1,403) from
Toronto, Canada. Fasting blood measures of 25(OH)D and CRP were obtained.
Results: Across ethnic groups, women HC users (n=280) had higher 25(OH)D and CRP than
women HC non-users (n=695) and men (n=428) (p<0.008 and <0.0001, respectively).
Circulating 25(OH)D was positively associated with CRP in the entire population in models not
accounting for HC use (β=0.010±0.003; p<0.0001). There was no association when men and
women HC non-users were examined separately. Among women HC users, there was no
association after accounting for hormone dose. A positive association between 25(OH)D and
CRP among individuals above the median 25(OH)D (≥51.9 nmol/L) was not significant after
adjustment for HC use. No association was observed among individuals below the median.
Conclusions: HC use and 25(OH)D were positively associated across ethnic groups. We found
no association between 25(OH)D and CRP when HC use was accounted for. HC use confounds
the association between 25(OH)D and CRP.
33
2.2 Introduction
There is great interest in the potential preventive and therapeutic effects of vitamin D on
numerous chronic diseases, such as T2D, CVD, various cancers and autoimmune disorders, such
as multiple sclerosis and rheumatoid arthritis. Chronic inflammation, characterized by elevated
circulating concentrations of pro-inflammatory cytokines, such as IL-6, and hepatic acute phase
proteins, such as CRP, is a common feature of these diseases (56;307-309).
Growing evidence from in vitro and animal studies supports a role for vitamin D in innate
immune responses and inflammation (144;248). However, epidemiological studies and clinical
trials have yielded inconsistent results. On the one hand, cross-sectional and case-control studies
carried out in diverse populations have found an inverse association between circulating
concentrations of 25(OH)D and CRP (85;255). Certain intervention trials also found that oral
supplementation with vitamin D resulted in increased concentrations of 25(OH)D and decreased
concentrations of CRP and other inflammatory markers (31;258). On the other hand, some other
cross-sectional and intervention studies found a null association between 25(OH)D and markers
of inflammation, including CRP (261;263), and one recent study reported a positive association
between 25(OH)D and CRP among vitamin D-sufficient adults (267). Circulating 25(OH)D, the
metabolite used clinically to determine vitamin D status, captures both dietary vitamin D intake
and endogenous production after exposure to sunlight (121), while CRP is considered a robust
marker of systemic inflammation (56).
The discrepancies between studies have been attributed partially to differences in vitamin D
dosage, as well as nutritional and disease status of the populations surveyed. However, a number
of biological, lifestyle, and demographic factors affect circulating 25(OH)D concentrations, such
as skin colour, sun exposure behaviours, geographical location, seasonality, genetic variation,
and use of certain medications (121;153;191;223;310). These and other factors may play a role
as confounders in the relationship between vitamin D and inflammatory biomarkers.
A number of studies have reported a positive association between estrogen and 25(OH)D in
women who use estrogen-containing HC or HRT (187-191). However, most studies were
conducted in individuals of European or African ancestry, and the effects of these medications
on 25(OH)D in other ethnic groups are less well understood. In addition, use of HC and HRT has
also been associated with deleterious health outcomes, such as increased risk of CVD and cancer,
34
as well as a worsened metabolic profile, thrombosis, and elevated inflammation (198-203). A
recent study examining the association between HC use and the plasma proteome identified a
number of novel pathways that are affected by HC use, suggesting that the effects of HC on
disease-associated metabolic pathways may be widespread (207). Use of these medications may,
therefore, confound the association between 25(OH)D and various health outcomes. Indeed, one
study from the Women's Health Initiative trial found that HRT modified the effect of calcium
and vitamin D supplementation on colorectal cancer (245), and an analysis of data from a large
German cohort showed that HRT use attenuated an inverse association between 25(OH)D and
breast cancer (190). The use of HC in particular has been associated with elevated concentrations
of CRP and other inflammatory biomarkers (198;199;203;206). These effects are apparent after
only three months of continued HC use (199), and are thought to result from first-pass hepatic
metabolism of estrogen-containing HC, which may affect hepatic production of CRP and other
pro-inflammatory acute phase reactants (206). However, despite these well-known effects on
inflammation, no studies have directly investigated whether HC use, which is widespread among
pre-menopausal women worldwide, modifies the association between 25(OH)D and
inflammation. Accounting for this potential confounding effect may help explain the unexpected
positive association between 25(OH)D and CRP observed in a previous study (267).
The objectives of this study were to assess the effect of HC use on 25(OH)D concentrations
across different ethnic groups, and to examine the interaction between HC use, 25(OH)D
concentrations and CRP in a large, ethnically diverse population of young adults.
2.3 Methods
2.3.1 Study Design and Participants
Study participants were from the Toronto Nutrigenomics and Health (TNH) study, which is a
cross-sectional analysis of individuals aged 20-29 years living in Toronto. Recruitment occurred
from the autumn of 2004 to the autumn of 2010. All recruited individuals gave written informed
consent, and the protocol was approved by the Ethics Review Board of the University of
Toronto. All study participants gave an overnight fasting blood sample and completed a food
frequency questionnaire (FFQ), a general health and lifestyle questionnaire, and a physical
35
activity questionnaire. We excluded individuals who were unable to provide a blood sample, as
well as pregnant or breastfeeding women.
The individuals included in this study (n=1,403) were non-smoking men (n=428) and women
(n=975), free of diabetes, who had available information on 25(OH)D, CRP, HC use among
women, and each additional variable considered for analysis at the time that this study was
carried out. Participants were classified as Caucasian (n=702), East Asian (n=536), or South
Asian (n=165) based on self-reported ancestry, as described previously (119). Caucasians were
of European, Middle Eastern or Hispanic descent. East Asians had Chinese, Japanese, Korean,
Filipino, Vietnamese, Thai or Cambodian descent. South Asians were individuals with ancestors
from India, Pakistan, Sri Lanka and Bangladesh. Individuals who were First Nations Canadian,
Afro-Caribbean, or of mixed ancestry were excluded from the analyses reported here because of
the insufficient sample size.
Participants were grouped by season based on the date when they provided blood: winter
(December, January, February), spring (March, April, May), summer (June, July, August), and
autumn (September, October, November).
2.3.2 Anthropometrics and Physical Activity
Anthropometric variables, including height, waist circumference, BMI, and systolic and diastolic
blood pressure, were measured with the participant wearing light clothing and no shoes, as
previously described (119). Participants provided information on physical activity by
questionnaire, and level of physical activity was expressed as metabolic equivalent task (MET)-
hours per week, as described previously (311).
2.3.3 Dietary Assessment
Dietary intake was assessed using the Toronto-modified Willett questionnaire, which is a 196-
item semi-quantitative FFQ that includes questions on dietary supplements, such as
multivitamins and vitamin D supplements (119;312;313). Subject responses to the individual
foods were converted to daily number of servings for each item. Estimates of intake were based
on the United States Department of Agriculture Nutrient Database for Standard Reference (314).
Vitamin D intake is reported as IU per day.
36
2.3.4 Hormonal Contraceptive Use
Women reported use of HC in the general health and lifestyle questionnaire. The questionnaire
asked female participants if they were currently using HC or had used them in the past. Those
who reported current use of any type of HC, regardless of delivery method (oral, transdermal,
vaginal, injection, etc.), were classified as HC users (n=280), while those who were not currently
taking the medications were classified as HC non-users (n=695). The questionnaire also asked
questions about the brand of HC currently used. Using information on dose available from the
specific brand manufacturer's website, HC users were classified as taking <1mg (n=170) vs.
≥1mg (n= 63) total hormone (calculated as the sum of estrogen- and progesterone-derived
ingredients) per day. A total of 47 HC users were excluded from this classification because the
type of HC medication they reported made it difficult to ascertain daily hormonal exposure (e.g.,
receiving HC by injection, since the timing of this mode of delivery ranges from weeks to
months depending on the brand; reporting 'Other'; or reporting HC use but not reporting a type of
medication).
2.3.5 Biochemical and 25(OH)D Measurements
Each participant provided a blood sample after a minimum 12-hour overnight fast. Individuals
with temporary inflammatory conditions, including recent piercings or tattoos, acupuncture,
medical or dental procedures, vaccinations or immunizations, infections, or a fever, gave blood
after a two-week wait. Samples were collected at LifeLabs Medical Laboratory Services
(Toronto, ON, Canada). High-sensitivity CRP was measured at LifeLabs using a latex-enhanced
immunoturbidimetric method with the Siemens Advia® 2400 analyzer (Siemens Healthcare
Diagnostics Inc., Tarrytown, NY, USA). Plasma 25(OH)D was measured by HPLC-MS/MS at
the University Health Network Specialty Lab (Toronto, ON, Canada). The concentration of
25(OH)D is reported as the sum of 25-hydroxycholecalciferol and 25-hydroxyergocalciferol for
each participant.
2.3.6 Statistical Analysis
The software SAS (version 9.2; SAS Institute Inc, Cary, NC, USA) was used to perform all
statistical analyses. The α error was set at 0.05, and all reported p-values are two-sided.
Continuous variables that were not normally distributed were loge- or square root-transformed
prior to analysis, unless otherwise indicated. In each case, the p-values from analyses using the
37
transformed values of these variables are reported, but untransformed means, regression
coefficients, and measures of spread (standard deviations or standard errors) are reported to
facilitate interpretability.
Subject characteristics between men, women HC non-users, and women HC users were
compared using χ2 tests for categorical variables and analysis of variance (ANOVA) for
continuous variables. We then compared circulating 25(OH)D and CRP concentrations among
men, women HC non-users, and women HC users within each ethnic group using analysis of
covariance (ANCOVA) adjusted for age, waist circumference, physical activity, and season of
recruitment. We also conducted correlation analyses to explore the association between
circulating 25(OH)D and total dietary intake of vitamin D in the population as a whole,
independently within each ethnic group, and separately among men, women HC non-users and
women HC users within each ethnic group. Correlations were also conducted between 25(OH)D
and CRP in the same manner. Where indicated, correlation coefficients were compared between
sub-groups using the Fisher's z transformation.
We examined the association between 25(OH)D and CRP using linear regression. First, an
unadjusted linear regression was conducted with CRP as the outcome variable and 25(OH)D as
the predictor variable in the entire population to explore trends in the data. Then, linear
regressions adjusted for age, waist circumference, physical activity, ethnicity, and season of
blood draw were carried out separately in the population as a whole, among men, women HC
non-users, and women HC users. In the analysis of the population as a whole, the model was also
adjusted for sex. We then conducted additional linear regressions to examine the association
between 25(OH)D and CRP among individuals below and above the median 25(OH)D
concentration, in order to determine whether the direction of the association differed between
those with a lower or a higher vitamin D status. In these analyses, Model 1 was unadjusted.
Model 2 was adjusted for age, sex, waist circumference, physical activity, ethnicity, and season.
Model 3 was adjusted for all the covariates included in Model 2, plus HC use among women.
Finally, within women HC users, we examined the association between 25(OH)D and CRP
among those taking <1mg (n=170) vs. ≥1mg (n= 63) total hormone per day, to determine
whether hormone dose played a role in this relationship. The 47 individuals for whom we were
unable to determine a daily hormonal dose (see Section 2.3.4) were excluded from this analysis.
38
We first compared circulating 25(OH)D and CRP concentrations between women HC users
taking <1mg/d vs. ≥1mg/d total hormone using ANCOVA adjusted for age, waist circumference,
physical activity, and season. We then conducted linear regressions adjusted for age, waist
circumference, physical activity, ethnicity, and season separately among women taking <1mg/d
and ≥1mg/d total hormone.
2.4 Results
Subject characteristics are shown in Table 2.1. We observed differences in HC use across ethnic
groups, with a greater percentage of Caucasian women reporting use of HC than East or South
Asian women (p<0.0001). Circulating 25(OH)D concentrations were approximately 25 nmol/L
higher in women HC users than in men and women HC non-users, despite a similar total vitamin
D intake across groups (p<0.0001 and p=0.26, respectively). Women HC users had the highest
circulating CRP, whereas women HC non-users had the lowest CRP concentrations (p<0.0001).
We examined differences in 25(OH)D concentrations between women HC users, women HC
non-users, and men across ethnic groups (Figure 2.1). Across all ethnic groups, women HC users
had significantly higher circulating 25(OH)D than men and women HC non-users after adjusting
for age, waist circumference, physical activity, and season of recruitment (p<0.0001 for
Caucasians and East Asians, and p=0.0079 for South Asians). Concentrations of 25(OH)D were
similar between men and women HC non-users across ethnic groups.
Differences in CRP concentrations among women HC users, women HC non-users, and men
across ethnic groups are shown in Figure 2.2. After statistical adjustment, women HC users had
higher CRP concentrations than men and women HC non-users across ethnic groups (p<0.0001).
Among Caucasians and South Asians, men had CRP concentrations that were intermediate
between women HC users and non-users. In East Asians, we observed no differences in CRP
concentrations between men and women HC non-users.
Table 2.2 shows the results of correlation analyses exploring the relationship between 25(OH)D
and total dietary vitamin D intake. Overall, circulating 25(OH)D and dietary vitamin D were
more strongly correlated among South Asians than Caucasians and East Asians (Pearson's r=0.55
39
[p<0.0001], 0.24 [p<0.0001], and 0.27 [p<0.0001], respectively; Fisher's z transformation
p<0.0001). Within Caucasians, circulating 25(OH)D and dietary vitamin D appeared to be more
strongly correlated among men and women HC non-users than among women HC users (r=0.28
[p<0.0001], 0.26 [p<0.0001], and 0.19 [p<0.006]). However, these correlation coefficients were
not significantly different from each other (Fisher's z transformation p=0.15). Within East
Asians, circulating 25(OH)D and dietary vitamin D were correlated only among men and women
HC non-users, with coefficients of approximately 0.30 (p<0.0001). In South Asians, correlation
coefficients between 25(OH)D and dietary vitamin D were different between men, women HC
non-users, and women HC users (Fisher's z transformation p=0.03), ranging from 0.48
(p<0.0001) among women HC non-users to nearly 0.70 among women HC users (p=0.0025).
Table 2.2 also shows the results of correlation analyses between 25(OH)D and CRP. In the
population as a whole, 25(OH)D and CRP were positively correlated (r=0.19, p<0.0001). When
examined within each ethnic group, 25(OH)D and CRP were positively correlated among
Caucasians (r=0.14, p=0.0001) and East Asians (r=0.17, p=0.0001), but not South Asians. When
men, women HC non-users, and women HC users were examined separately, the two metabolites
were weakly correlated in East Asian women HC non-users (r=0.13, p=0.0131), and not
correlated in any other sub-group.
The association between 25(OH)D and CRP was first explored using linear regression (Figure
2.3). The two metabolites were positively associated in an unadjusted model in the population as
a whole (p<0.0001). The positive association was retained in the adjusted model. However, when
men, women HC non-users, and women HC users were examined separately, we observed no
association between 25(OH)D and CRP among men and women HC non-users. Among women
HC users, 25(OH)D and CRP were positively associated in an adjusted model (p=0.002).
The population was then divided into two groups: those with 25(OH)D below or above the
median (51.9 nmol/L). Linear regressions were conducted separately within each group to
examine the association between 25(OH)D and CRP. These results are shown in Table 2.3.
Among those below the median 25(OH)D concentration, we observed no association between
25(OH)D and CRP. In the group above the median, we observed a positive association
(p<0.0001) between the two metabolites in both unadjusted and adjusted models (Model 1 and
40
2, respectively). However, the association was no longer significant after further adjusting for
HC use among women (Model 3).
Because we observed a positive association between 25(OH)D and CRP among women HC
users (Figure 2.3), we assessed whether total HC dose affected this association. After adjusting
for age, waist circumference, physical activity, ethnicity, and season, women who took <1mg/d
total hormone had lower 25(OH)D concentrations than those who took ≥1 mg/d (mean ±
standard error: <1 mg/d = 76.4 ± 2.7 nmol/L; ≥1 mg/d = 85.1 ± 4.5 nmol/L; p=0.0475), but
circulating CRP concentrations were similar across women HC users regardless of daily
hormone dose (<1 mg/d: 2.8 ± 0.3 mg/L, ≥1 mg/d: 2.8 ± 0.4 mg/L; p=0.8544). In separate
adjusted linear regression models of women taking <1 mg/d and women taking ≥ 1mg/d, we
observed no association between 25(OH)D and CRP in either group.
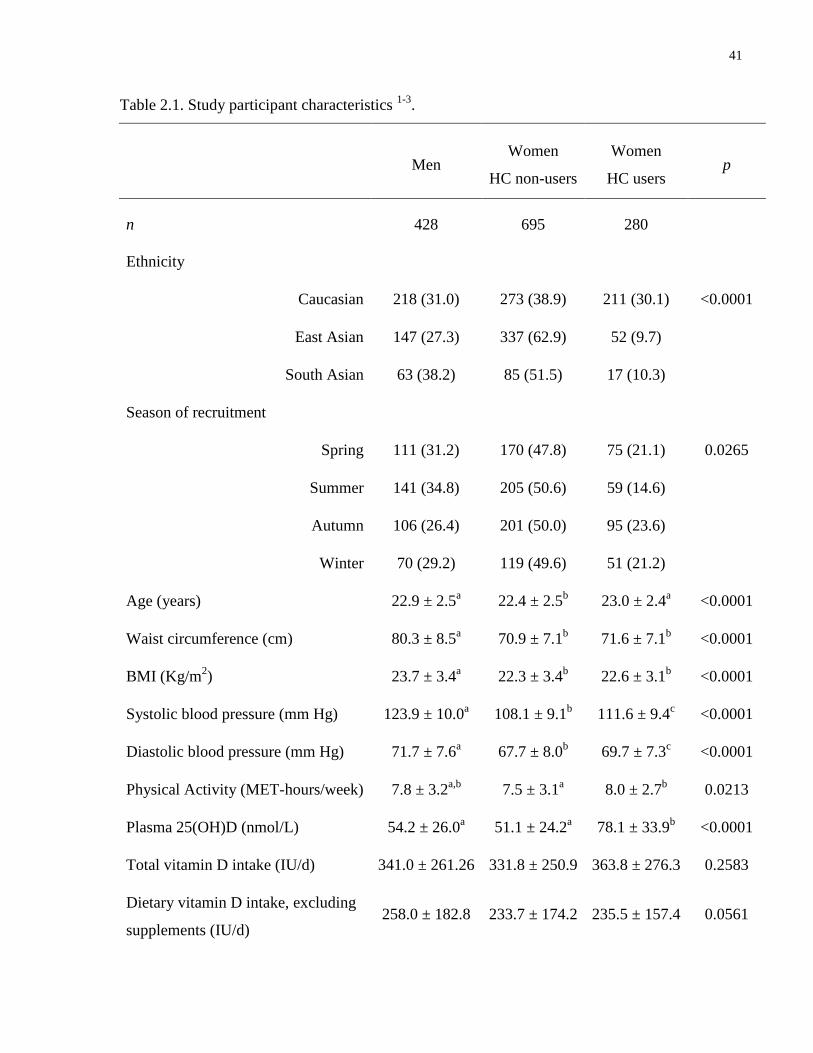
41
Table 2.1. Study participant characteristics 1-3
.
Men Women
HC non-users
Women
HC users p
n 428 695 280
Ethnicity
Caucasian 218 (31.0) 273 (38.9) 211 (30.1) <0.0001
East Asian 147 (27.3) 337 (62.9) 52 (9.7)
South Asian 63 (38.2) 85 (51.5) 17 (10.3)
Season of recruitment
Spring 111 (31.2) 170 (47.8) 75 (21.1) 0.0265
Summer 141 (34.8) 205 (50.6) 59 (14.6)
Autumn 106 (26.4) 201 (50.0) 95 (23.6)
Winter 70 (29.2) 119 (49.6) 51 (21.2)
Age (years) 22.9 ± 2.5a 22.4 ± 2.5
b 23.0 ± 2.4
a <0.0001
Waist circumference (cm) 80.3 ± 8.5a 70.9 ± 7.1
b 71.6 ± 7.1
b <0.0001
BMI (Kg/m2) 23.7 ± 3.4
a 22.3 ± 3.4
b 22.6 ± 3.1
b <0.0001
Systolic blood pressure (mm Hg) 123.9 ± 10.0a 108.1 ± 9.1
b 111.6 ± 9.4
c <0.0001
Diastolic blood pressure (mm Hg) 71.7 ± 7.6a 67.7 ± 8.0
b 69.7 ± 7.3
c <0.0001
Physical Activity (MET-hours/week) 7.8 ± 3.2a,b
7.5 ± 3.1a 8.0 ± 2.7
b 0.0213
Plasma 25(OH)D (nmol/L) 54.2 ± 26.0a 51.1 ± 24.2
a 78.1 ± 33.9
b <0.0001
Total vitamin D intake (IU/d) 341.0 ± 261.26 331.8 ± 250.9 363.8 ± 276.3 0.2583
Dietary vitamin D intake, excluding
supplements (IU/d) 258.0 ± 182.8 233.7 ± 174.2 235.5 ± 157.4 0.0561
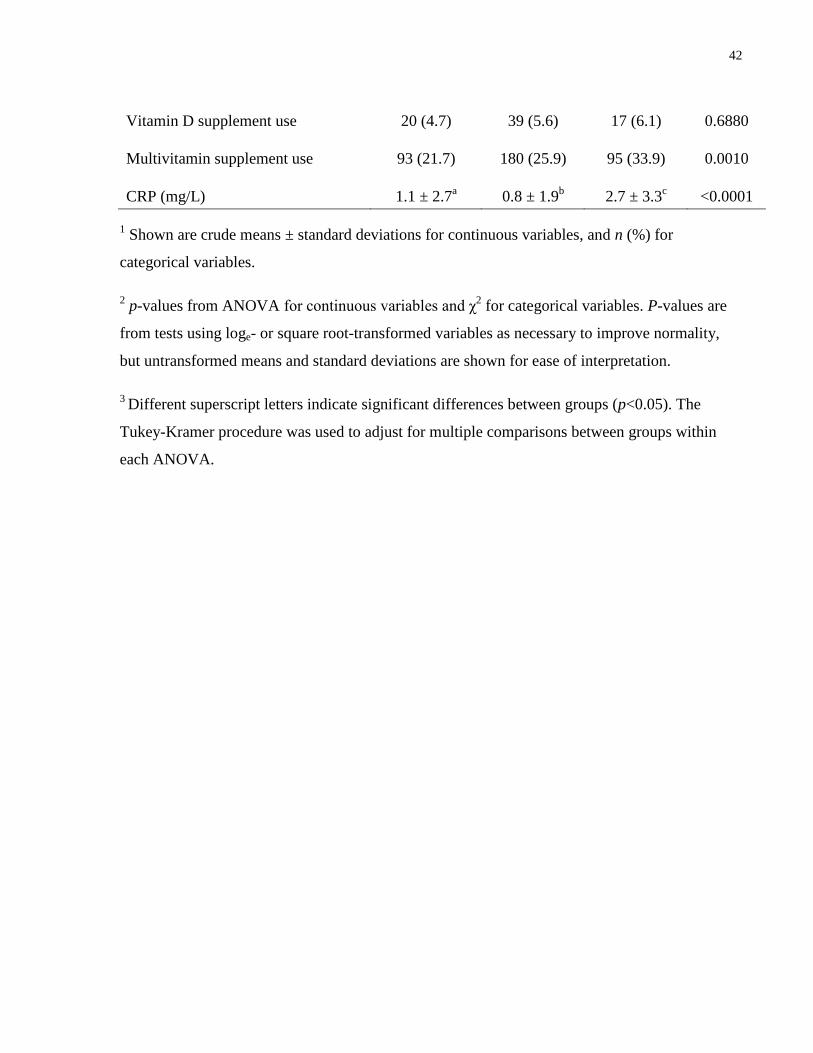
42
Vitamin D supplement use 20 (4.7) 39 (5.6) 17 (6.1) 0.6880
Multivitamin supplement use 93 (21.7) 180 (25.9) 95 (33.9) 0.0010
CRP (mg/L) 1.1 ± 2.7a 0.8 ± 1.9
b 2.7 ± 3.3
c <0.0001
1 Shown are crude means ± standard deviations for continuous variables, and n (%) for
categorical variables.
2 p-values from ANOVA for continuous variables and χ
2 for categorical variables. P-values are
from tests using loge- or square root-transformed variables as necessary to improve normality,
but untransformed means and standard deviations are shown for ease of interpretation.
3 Different superscript letters indicate significant differences between groups (p<0.05). The
Tukey-Kramer procedure was used to adjust for multiple comparisons between groups within
each ANOVA.
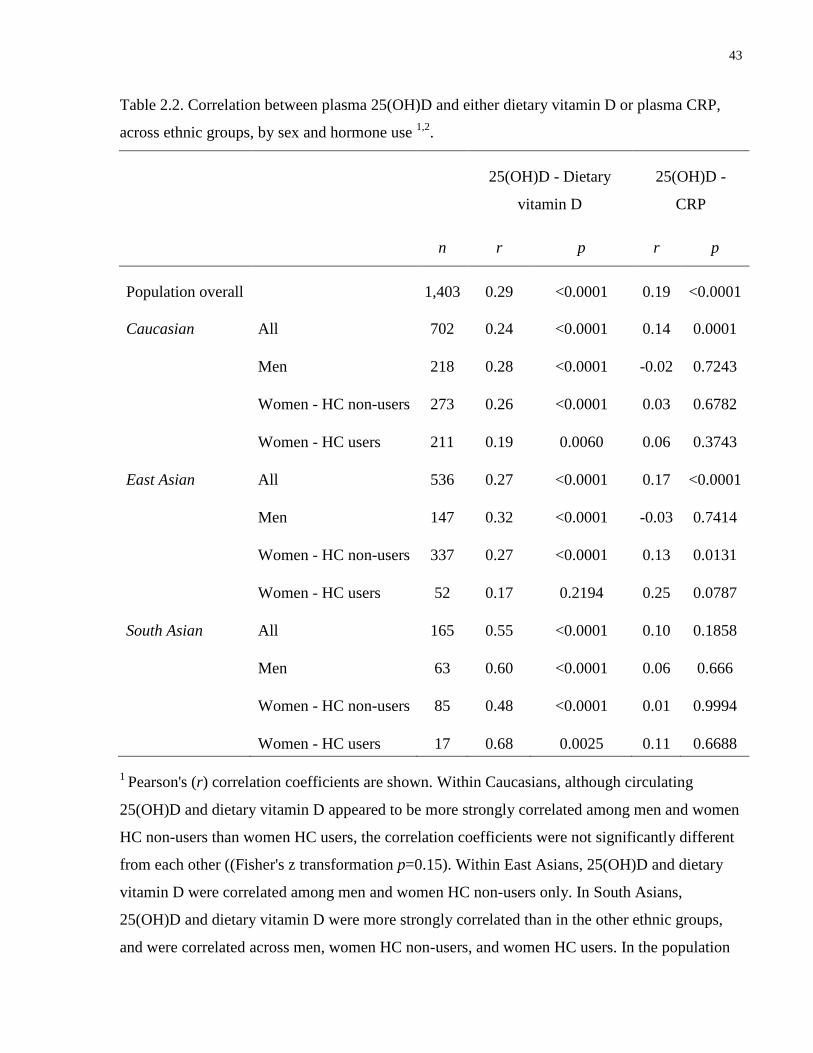
43
Table 2.2. Correlation between plasma 25(OH)D and either dietary vitamin D or plasma CRP,
across ethnic groups, by sex and hormone use 1,2
.
25(OH)D - Dietary
vitamin D
25(OH)D -
CRP
n r p r p
Population overall
1,403 0.29 <0.0001 0.19 <0.0001
Caucasian All 702 0.24 <0.0001 0.14 0.0001
Men 218 0.28 <0.0001 -0.02 0.7243
Women - HC non-users 273 0.26 <0.0001 0.03 0.6782
Women - HC users 211 0.19 0.0060 0.06 0.3743
East Asian All 536 0.27 <0.0001 0.17 <0.0001
Men 147 0.32 <0.0001 -0.03 0.7414
Women - HC non-users 337 0.27 <0.0001 0.13 0.0131
Women - HC users 52 0.17 0.2194 0.25 0.0787
South Asian All 165 0.55 <0.0001 0.10 0.1858
Men 63 0.60 <0.0001 0.06 0.666
Women - HC non-users 85 0.48 <0.0001 0.01 0.9994
Women - HC users 17 0.68 0.0025 0.11 0.6688
1 Pearson's (r) correlation coefficients are shown. Within Caucasians, although circulating
25(OH)D and dietary vitamin D appeared to be more strongly correlated among men and women
HC non-users than women HC users, the correlation coefficients were not significantly different
from each other ((Fisher's z transformation p=0.15). Within East Asians, 25(OH)D and dietary
vitamin D were correlated among men and women HC non-users only. In South Asians,
25(OH)D and dietary vitamin D were more strongly correlated than in the other ethnic groups,
and were correlated across men, women HC non-users, and women HC users. In the population

44
as a whole, 25(OH)D and CRP were positively correlated. When examined within each ethnic
group, 25(OH)D and CRP were positively correlated among Caucasians and East Asians, but not
South Asians. When men, women HC non-users, and women HC users were examined
separately, the two metabolites were not significantly correlated in any ethnic group.
2 Variables were loge- or square root-transformed as needed prior to analysis.
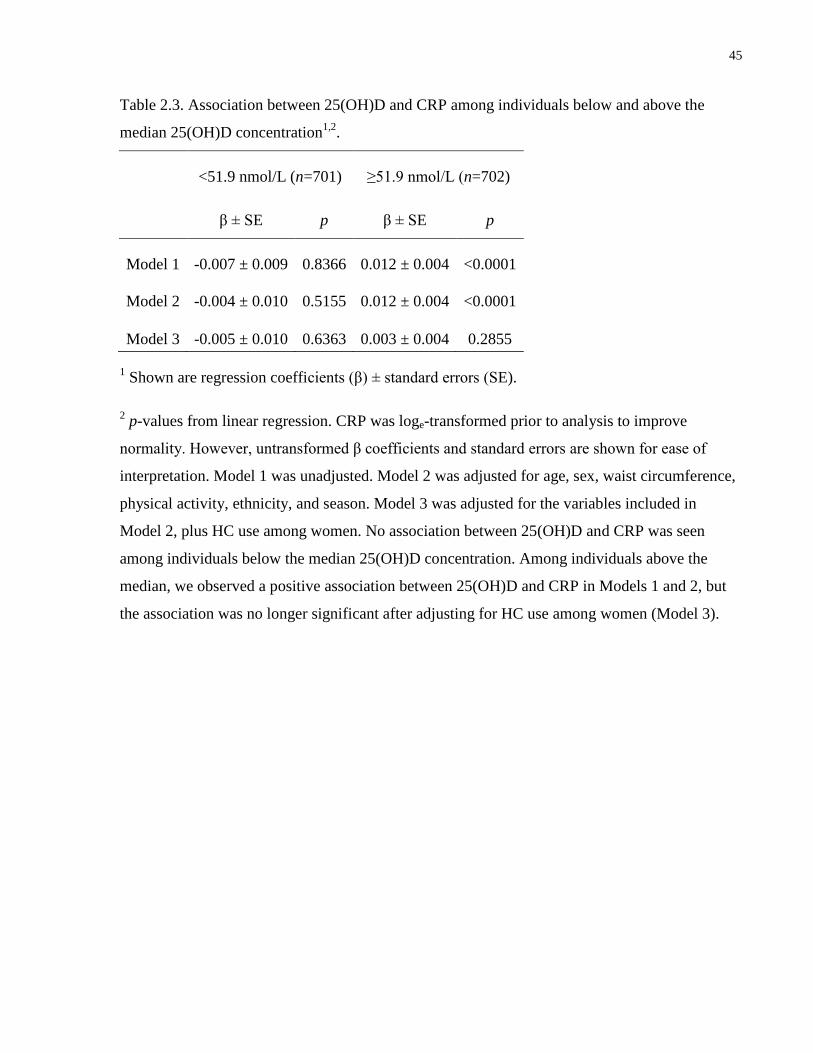
45
Table 2.3. Association between 25(OH)D and CRP among individuals below and above the
median 25(OH)D concentration1,2
.
<51.9 nmol/L (n=701) ≥51.9 nmol/L (n=702)
β ± SE p β ± SE p
Model 1
-0.007 ± 0.009 0.8366 0.012 ± 0.004 <0.0001
Model 2
-0.004 ± 0.010 0.5155 0.012 ± 0.004 <0.0001
Model 3 -0.005 ± 0.010 0.6363 0.003 ± 0.004 0.2855
1 Shown are regression coefficients (β) ± standard errors (SE).
2 p-values from linear regression. CRP was loge-transformed prior to analysis to improve
normality. However, untransformed β coefficients and standard errors are shown for ease of
interpretation. Model 1 was unadjusted. Model 2 was adjusted for age, sex, waist circumference,
physical activity, ethnicity, and season. Model 3 was adjusted for the variables included in
Model 2, plus HC use among women. No association between 25(OH)D and CRP was seen
among individuals below the median 25(OH)D concentration. Among individuals above the
median, we observed a positive association between 25(OH)D and CRP in Models 1 and 2, but
the association was no longer significant after adjusting for HC use among women (Model 3).
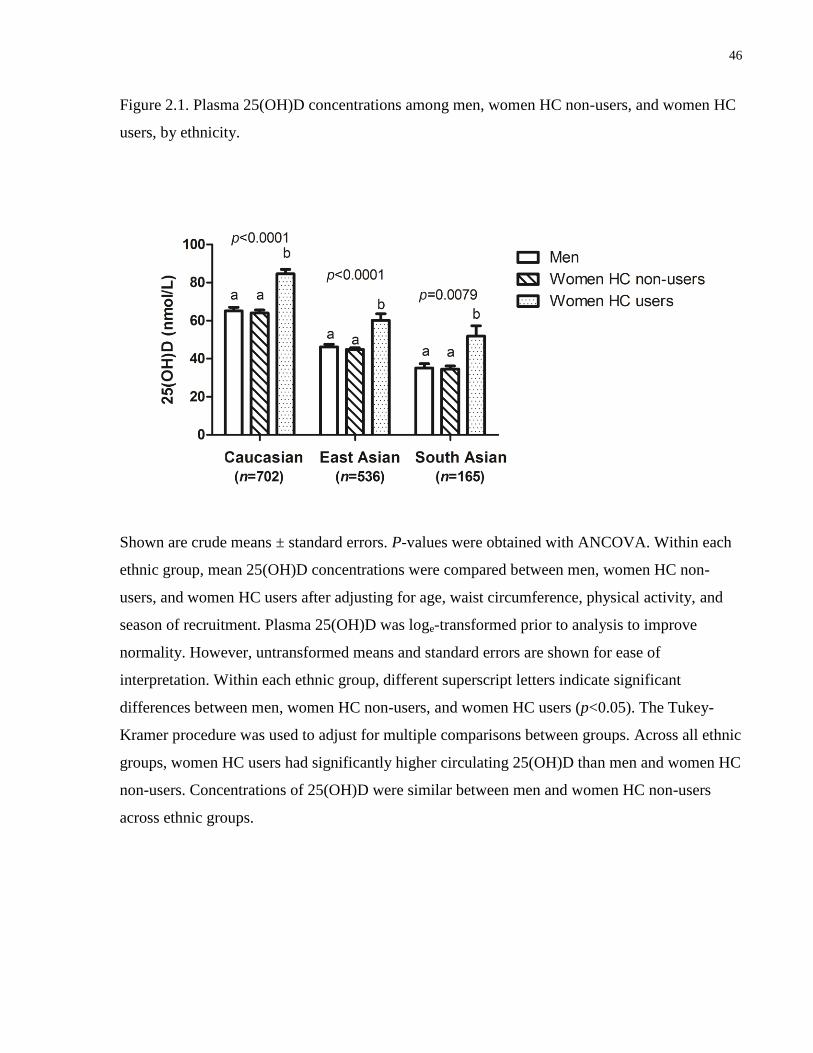
46
Figure 2.1. Plasma 25(OH)D concentrations among men, women HC non-users, and women HC
users, by ethnicity.
Shown are crude means ± standard errors. P-values were obtained with ANCOVA. Within each
ethnic group, mean 25(OH)D concentrations were compared between men, women HC non-
users, and women HC users after adjusting for age, waist circumference, physical activity, and
season of recruitment. Plasma 25(OH)D was loge-transformed prior to analysis to improve
normality. However, untransformed means and standard errors are shown for ease of
interpretation. Within each ethnic group, different superscript letters indicate significant
differences between men, women HC non-users, and women HC users (p<0.05). The Tukey-
Kramer procedure was used to adjust for multiple comparisons between groups. Across all ethnic
groups, women HC users had significantly higher circulating 25(OH)D than men and women HC
non-users. Concentrations of 25(OH)D were similar between men and women HC non-users
across ethnic groups.
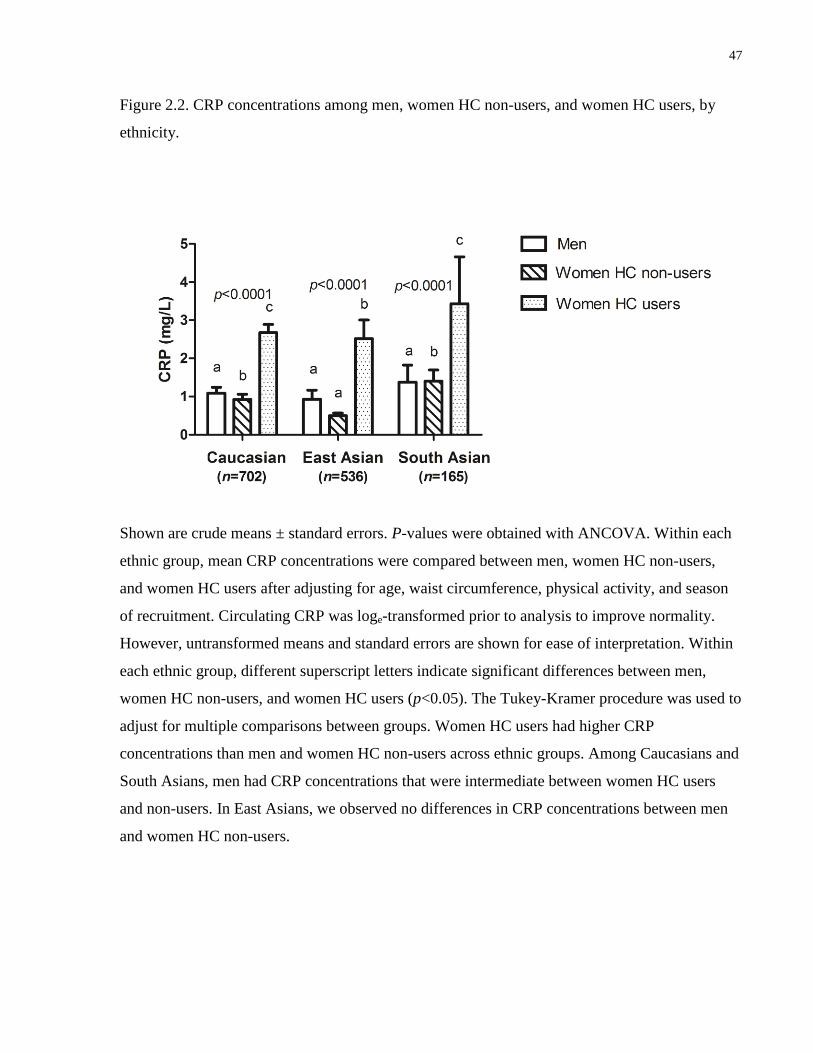
47
Figure 2.2. CRP concentrations among men, women HC non-users, and women HC users, by
ethnicity.
Shown are crude means ± standard errors. P-values were obtained with ANCOVA. Within each
ethnic group, mean CRP concentrations were compared between men, women HC non-users,
and women HC users after adjusting for age, waist circumference, physical activity, and season
of recruitment. Circulating CRP was loge-transformed prior to analysis to improve normality.
However, untransformed means and standard errors are shown for ease of interpretation. Within
each ethnic group, different superscript letters indicate significant differences between men,
women HC non-users, and women HC users (p<0.05). The Tukey-Kramer procedure was used to
adjust for multiple comparisons between groups. Women HC users had higher CRP
concentrations than men and women HC non-users across ethnic groups. Among Caucasians and
South Asians, men had CRP concentrations that were intermediate between women HC users
and non-users. In East Asians, we observed no differences in CRP concentrations between men
and women HC non-users.

48
Figure 2.3. Association between 25(OH)D and CRP.
First, unadjusted, untransformed 25(OH)D and CRP values were plotted on a single graph with
open circles representing men, open triangles representing women HC non-users, and crosses
representing women HC users. An unadjusted linear regression was conducted on the
untransformed values for the entire population to explore the association between 25(OH)D and
CRP (linear regression shown as dotted line). Then, linear regressions adjusted for age, waist
circumference, physical activity, ethnicity, and season, using loge-transformed CRP, were carried
out separately among men, women HC non-users and women HC users, as well as in the
population as a whole (in this case, the model was also adjusted for sex). The table insert shows
regression coefficients (β) ± standard errors and p-values for these adjusted linear regressions.
Untransformed β coefficients and standard errors are shown for ease of interpretation. In the
unadjusted model of the population as a whole, the two metabolites were positively associated.

49
The positive association was retained in an adjusted model. However, when men, women HC
non-users, and women HC users were examined separately, we observed no association between
25(OH)D and CRP among men and women HC non-users. Among women HC users, 25(OH)D
and CRP were positively associated in an adjusted model.
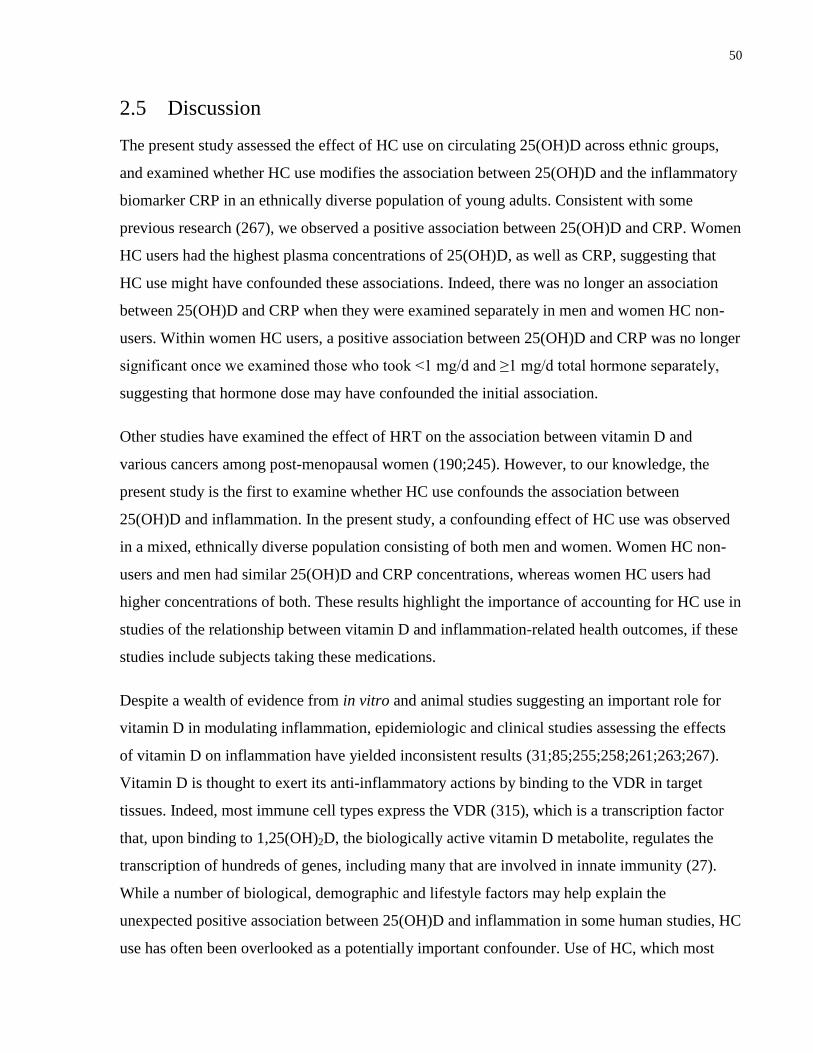
50
2.5 Discussion
The present study assessed the effect of HC use on circulating 25(OH)D across ethnic groups,
and examined whether HC use modifies the association between 25(OH)D and the inflammatory
biomarker CRP in an ethnically diverse population of young adults. Consistent with some
previous research (267), we observed a positive association between 25(OH)D and CRP. Women
HC users had the highest plasma concentrations of 25(OH)D, as well as CRP, suggesting that
HC use might have confounded these associations. Indeed, there was no longer an association
between 25(OH)D and CRP when they were examined separately in men and women HC non-
users. Within women HC users, a positive association between 25(OH)D and CRP was no longer
significant once we examined those who took <1 mg/d and ≥1 mg/d total hormone separately,
suggesting that hormone dose may have confounded the initial association.
Other studies have examined the effect of HRT on the association between vitamin D and
various cancers among post-menopausal women (190;245). However, to our knowledge, the
present study is the first to examine whether HC use confounds the association between
25(OH)D and inflammation. In the present study, a confounding effect of HC use was observed
in a mixed, ethnically diverse population consisting of both men and women. Women HC non-
users and men had similar 25(OH)D and CRP concentrations, whereas women HC users had
higher concentrations of both. These results highlight the importance of accounting for HC use in
studies of the relationship between vitamin D and inflammation-related health outcomes, if these
studies include subjects taking these medications.
Despite a wealth of evidence from in vitro and animal studies suggesting an important role for
vitamin D in modulating inflammation, epidemiologic and clinical studies assessing the effects
of vitamin D on inflammation have yielded inconsistent results (31;85;255;258;261;263;267).
Vitamin D is thought to exert its anti-inflammatory actions by binding to the VDR in target
tissues. Indeed, most immune cell types express the VDR (315), which is a transcription factor
that, upon binding to 1,25(OH)2D, the biologically active vitamin D metabolite, regulates the
transcription of hundreds of genes, including many that are involved in innate immunity (27).
While a number of biological, demographic and lifestyle factors may help explain the
unexpected positive association between 25(OH)D and inflammation in some human studies, HC
use has often been overlooked as a potentially important confounder. Use of HC, which most
51
often consist of a combination of synthetic estrogen and progestins (192), has been associated
with elevated 25(OH)D (188). The potential effects of progesterone-derived HC ingredients on
vitamin D metabolism are not well understood. However, estrogen may upregulate CYP27B1,
the enzyme that converts 25(OH)D to 1,25(OH)2D, as well as the VDR and DBP, which is the
main vitamin D metabolite carrier in the circulation (190;195;316). Estrogen also appears to
downregulate CYP24A1, the main catabolic enzyme in the vitamin D pathway (190;193).
Together, these actions may result in elevated circulating vitamin D metabolites, although the
clinical significance of this effect remains unknown. HC use has also been associated with
changes in numerous physiologic pathways, increased inflammation and a poorer metabolic
profile (198;199;203;206;207). Our finding that adjustment for HC use attenuates a positive
association between 25(OH)D and CRP might partly account for some of the unexpected results
of previous studies.
Recently, a cross-sectional analysis of NHANES data reported a positive association between
25(OH)D and CRP among those with 25(OH)D ≥ 52.5 nmol/L (267). Conversely, the
relationship between 25(OH)D and CRP was inverse among those with lower vitamin D status
(267). In the present study, we found no association between 25(OH)D and CRP in those below
the median 25(OH)D concentration, and an initially positive association between 25(OH)D and
CRP in those above the median was no longer significant after adjustment for HC use. It is
possible that the previously observed (267) positive association between 25(OH)D and CRP
among individuals with a higher vitamin D status may be due to unaccounted-for HC use among
women.
The present study also aimed to assess the effect of HC use on 25(OH)D concentrations across
several ethnic groups. To our knowledge, few studies have examined the effect of HC use on
vitamin D status in non-Caucasian individuals, and those that did focused on individuals of
African ancestry only (189;191). In the present study, we observed that, across all ethnic groups,
women HC users had significantly higher circulating 25(OH)D than women HC non-users and
men, even after adjusting for factors known to influence vitamin D concentrations. These
observations corroborate previous findings that HC use elevates circulating 25(OH)D
(188;191;317). Furthermore, our results suggest that the effect is consistent across ethnic groups.
The magnitude of the effect of HC use on 25(OH)D concentrations across ethnic groups was
similar to that observed in previous studies in Caucasians, with women HC users having values
52
over 20 nmol/L higher than women HC non-users, who had 25(OH)D concentrations similar to
men. Our observation that 25(OH)D concentrations were higher in women taking ≥1 mg/d total
hormone than those taking <1 mg/d suggests that the effect of HC on 25(OH)D may be dose-
dependent.
We observed that the association between 25(OH)D and dietary vitamin D differed across ethnic
groups. Vitamin D can be obtained exogenously from the diet and supplements, or produced
endogenously in the skin after exposure to sunlight (121). Dark-skinned individuals are less able
to produce vitamin D endogenously because of a higher skin melanin content, and exogenous
sources may contribute more to vitamin D status in these individuals (153). In the present study,
while dietary vitamin D contributed to 25(OH)D concentrations in all ethnic groups, the
correlation was weaker among Caucasians and East Asians than among South Asians. The
stronger correlation between 25(OH)D and dietary vitamin D observed among South Asians may
partly reflect a decreased ability to produce vitamin D endogenously because of generally darker
skin, so that dietary vitamin D intake becomes a more important source of 25(OH)D. However,
no information was available on lifestyle variables that may affect sun exposure, such as use of
long-sleeved clothing or sunscreen. Therefore, we cannot determine whether other lifestyle
factors specific to these individuals also contributed to decreased endogenous vitamin D
production.
We noted an initial positive association between 25(OH)D and CRP among women HC users.
However, this association was no longer significant after we examined HC users who took <1
mg/d and ≥1 mg/d total hormone separately. As noted earlier, we observed a dose-dependent
association between HC dose and 25(OH)D among women HC users, which might partly explain
the initial positive association between 25(OH)D and CRP observed in this group. However,
CRP concentrations were equally elevated in women taking <1 mg/d vs. ≥1 mg/d total hormone.
It is possible that the initial positive association observed between 25(OH)D and CRP among
women HC users as a whole was due to residual confounding.
One limitation of the present study is the smaller sample size of women HC users across ethnic
groups, particularly South Asians. Another limitation is the lack of information on menstrual
cycle stage and circulating sex hormone concentrations, which prevented us from investigating
the potential role of natural fluctuations in estrogen and progesterone in modulating the

53
association between 25(OH)D and CRP. We were also unable to explore whether estrogen or
progestin-derived HC components have a greater effect on the observed associations.
In conclusion, in the present study we identified a confounding effect of HC use on the
association between 25(OH)D and CRP in an ethnically diverse population of young adults. An
apparent positive association between 25(OH)D and CRP was no longer significant after
adjusting for HC use. In addition, we noted that HC use increased 25(OH)D concentrations
significantly across ethnic groups. Overall, our results bring to light the importance of
considering lifestyle variables, particularly HC use, as significant confounders in the relationship
between vitamin D and inflammation, as well as, potentially, other health outcomes.
54
Chapter 3 : Association between circulating 25-hydroxyvitamin D and
plasma cytokine concentrations in young adults
Adapted from:
García-Bailo B, Roke K, Mutch DM, El-Sohemy A, Badawi A. Association
between circulating ascorbic acid, α-tocopherol, 25-hydroxyvitamin D, and plasma
cytokine concentrations in young adults: a cross-sectional study. Nutr Metab
(Lond). 2012 Nov 16;9(1):102. doi: 10.1186/1743-7075-9-102.

55
3.1 Abstract
Background: Chronic inflammation is thought to be implicated in the etiology of
cardiometabolic disease. Vitamin D can be synthesized locally by immune system cells and is
thought to modulate inflammation, potentially helping prevent or delay disease development.
However, the relationship between vitamin D and inflammation at the systemic level is
inconsistent, and few studies have examined this relationship in young adults, who may be in the
earliest stages of disease development. Our objective was to examine the association between
circulating 25-hydroxyvitamin D (25(OH)D), the biomarker of vitamin D status, and five
cytokines in an ethnically diverse population of young adults.
Methods: Participants (n=1,007) from the Toronto Nutrigenomics and Health study provided
fasting blood samples for biomarker measurements and were categorized into tertiles based on
their plasma 25(OH)D concentrations. We conducted Pearson's correlation analyses to explore
trends in the relationships between 25(OH)D and each cytokine. We further examined the
association between 25(OH)D and the cytokines using analysis of covariance with models
including age, sex, waist circumference, ethnicity, physical activity, season of blood collection,
and hormonal contraceptive use (women only) as covariates.
Results: We observed correlations between 25(OH)D, IP-10 (r=0.12, p<0.0001), and RANTES
(r=0.22, p<0.0001), but no other cytokines. We noticed strong correlations between specific
cytokines, such as interleukin 1- receptor antagonist (IL-1RA) and interferon-γ (IFN-γ) (r=0.83,
p<0.0001), and IL-1RA and platelet-derived growth factor BB (PDGF-bb) (r=0.80, p<0.0001).
After full covariate adjustment, 25(OH)D was not associated with any cytokine.
Conclusion: 25(OH)D was not associated with systemic biomarkers of inflammation in healthy
young adults.

56
3.2 Introduction
Inflammation plays an important role in the development of cardiometabolic diseases, such as
the metabolic syndrome, T2D and CVD (56;318). The excessive release of pro-inflammatory
cytokines that takes place during chronic inflammation can result in dysregulation of processes
such as glucose and lipid metabolism and vascular function, via the effects of cytokines on
adipocytes, muscle tissue, the liver and blood vessels (60;93;319;320). In addition, chronic
inflammation is closely associated with oxidative stress, which is characterized by an elevated
presence of highly reactive, potentially harmful molecular compounds, such as reactive oxygen
and nitrogen species and free radicals (319;321). These reactive molecules contribute to further
oxidative damage and inflammation through their ability to activate the pro-inflammatory
transcription factor NFқB (322).
Accumulating evidence suggests that, beyond its central function as a regulator of calcium and
bone metabolism, vitamin D may play a role in the prevention of cardiometabolic diseases
(19;20). The beneficial effects of this micronutrient may result, at least in part, from its role in
modulation of innate immunity and inflammation (28). Indeed, circulating concentrations of
25(OH)D, which is considered the biomarker of vitamin D nutritional status, have been inversely
associated with biomarkers of systemic inflammation (31;85). However, the results are equivocal
(261;263;267) and few studies have examined this relationship in young, healthy individuals.
Therefore, the role of vitamin D in the earliest stages of chronic inflammation remains poorly
understood.
Traditional enzyme-linked immunoassay-based methods are restricted to measuring single
inflammatory biomarkers, such as CRP, IL-6, and TNFα (323;324). However, the development
of multiplex assays has made it possible to measure numerous cytokines simultaneously in order
to obtain a more comprehensive picture of an individual’s inflammatory status. In the present
study, we analyzed five common cytokines using the multiplex approach. The cytokines included
were IL-1-receptor antagonist (IL-1RA), IFN-γ, interferon γ-induced protein 10 (IP-10), platelet-
derived growth factor BB (PDGF-bb) and RANTES. Examining the association between
25(OH)D and cytokines involved in inflammatory pathways may contribute to our understanding
of the role that this micronutrient plays in modulating inflammation during the earliest stages of
disease progression. Therefore, the objective of this study was to examine the relationship
57
between circulating concentrations of 25(OH)D and biomarkers of inflammation in an ethnically
diverse population of young adults.
3.3 Methods
3.3.1 Study Design and Participants
The present study included 1,007 non-smoking individuals (300 men and 707 women) from the
TNH study population who were free of diabetes and who had available data for 25(OH)D, the
five cytokines, and every other variable considered for analysis at the time that the study was
carried out. For more details on the TNH study population, recruitment, exclusions, and
classification into ethnic groups and seasons, please refer to Chapter 2, Section 2.3.1.
3.3.2 Anthropometrics and physical activity
Please refer to Chapter 2, Section 2.3.2.
3.3.3 Biochemical and 25(OH)D Measurements
For details on fasting blood collection and how 25(OH)D was measured, please refer to Chapter
2, Section 2.3.5.
A custom multiplex bead assay was designed to measure the cytokines assessed in this study
using a Bio-Plex-200 instrument (Bio-Rad, Mississauga, ON, Canada). As a first step, we used a
commercially available kit to examine 27 cytokines in a subset of 70 individuals in order to
determine which inflammatory biomarkers could be consistently measured in our study
population. Since the population consisted of predominantly healthy young adults, it was
expected that some cytokines would be below the detection limit of our analytical platform. To
avoid drawing erroneous conclusions, we made a decision to examine only the five cytokines
that were detected in all 70 of these subjects and had concentrations in the working range of the
assay, specified in the manufacturer's prospectus for each cytokine and defined as concentrations
between the lower and upper limits of quantification. The five cytokines measured included IL-
1RA, IFN-γ, IP-10, PDGF-bb and RANTES. IL-1RA binds to the IL-1 receptor and, therefore,
inhibits the inflammatory actions of both IL-1α and IL-1β (325), while IFN-γ is a pro-
58
inflammatory cytokine with important immunomodulatory properties that induces the production
of IP-10 (326;327). PDGF-bb is a growth factor involved in angiogenesis (328). RANTES, a
pro-inflammatory cytokine, also plays a role in angiogenesis (329;330).
To measure the five cytokines in the study population, plasma samples (30 μL/sample) were
diluted 1:4 with sample diluent, and the assay was run according to the manufacturer’s
instructions. Once the procedure was complete, beads were read using the Bio-Plex suspension
array system (Bio-Rad) and concentrations (pg/ml) were determined with Bio-Plex Manager
software (version 6.0). Analytical reproducibility was assessed by calculating intra-assay
coefficients of variability (CV) (as the average of three standards within each analytical run), and
resulted in the following CVs: IL-1RA <8%; IFN-γ <11%; IP-10 <9%; PDGF-bb <9%;
RANTES <6%. Additionally, inter-assay CVs for all five cytokines, calculated by measuring the
average of three standards across fifteen assays run on different days, were the following: IL-
1RA <4%; IFN-γ <5%; IP-10 <4%; PDGF-bb <5%; RANTES <3%.
3.3.4 Statistical Analysis
All statistical analyses were performed in SAS. The error was set at 0.05, and reported p-
values are 2-sided. The Bonferroni correction for multiple comparisons (significant p=/number
of independent tests conducted) was used to determine significance, unless indicated otherwise.
The distributions of continuous variables were examined and loge- or square root-transformed as
necessary to improve normality. However, untransformed, unadjusted means and measures of
spread are reported throughout to facilitate interpretability. Subject characteristics were
compared between men and women using t-tests for continuous variables and χ2 tests for
categorical variables. Pearson crude correlation coefficients were calculated between 25(OH)D
and each of the cytokines, as well as across all cytokines with each other, using loge- or square
root-transformed variables as necessary to improve normality. The association between each
cytokine and 25(OH)D was further examined with ANCOVA. Circulating concentrations of
plasma 25(OH)D were categorized into tertiles, and these categorical variables were used as
predictor variables. In each case, three models were constructed. Model 1 was unadjusted. Model
2 included age, sex, waist circumference, ethnicity, physical activity, and season as covariates.
Model 3 included the variables considered in Model 2, plus current HC use among women. This
approach allowed us to examine, in addition to variables known to affect 25(OH)D
59
concentrations such as ethnicity, the specific contribution of HC, which may play an important
role as confounders of the relationship between 25(OH)D and systemic inflammation (331).
3.4 Results
Subject characteristics are shown in Table 3.1. Women had lower anthropometric values but
higher plasma 25(OH)D concentrations than men. Concentrations of IFN-γ and RANTES were
lower in men than women, but we observed no differences between the sexes with respect to IL-
1RA, IP-10, or PDGF-bb concentrations.
Pearson's correlation analyses between 25(OH)D and all the cytokines were conducted to explore
trends in the data, and the results are shown in Figure 3.1. Circulating 25OH)D was weakly
positively correlated with IP-10 (r=0.12) and RANTES (r=0.22), but it was not correlated with
any of the other cytokines. The strongest correlation (r=0.83) was between IL-1RA and IFN-γ.
IL-1RA was also correlated with PDGF-bb (r=0.80), RANTES (r=0.38), and IP-10 (r=0.13).
IFN-γ was correlated with PDGF-bb (r=0.67), IP-10 (r=0.23), and RANTES (r=0.18). IP-10 was
correlated with RANTES (r=0.28) and PDGF-bb (r=0.10). Finally, PDGF-bb was correlated
with RANTES (r=0.38).
The associations between each cytokine and 25(OH)D, after adjusting for relevant covariates, are
shown in Table 3.2. We observed a U-shaped association between IP-10 and 25(OH)D
(p=0.0032) in an unadjusted model; however, the association was no longer significant in either
of the adjusted models. A positive association (p≤0.0001) was also present between RANTES
and 25(OH)D in Model 1 (unadjusted) and Model 2 (adjusted for age, sex, waist circumference,
ethnicity, physical activity and season). However, the two variables were no longer associated
after adjusting for HC use.
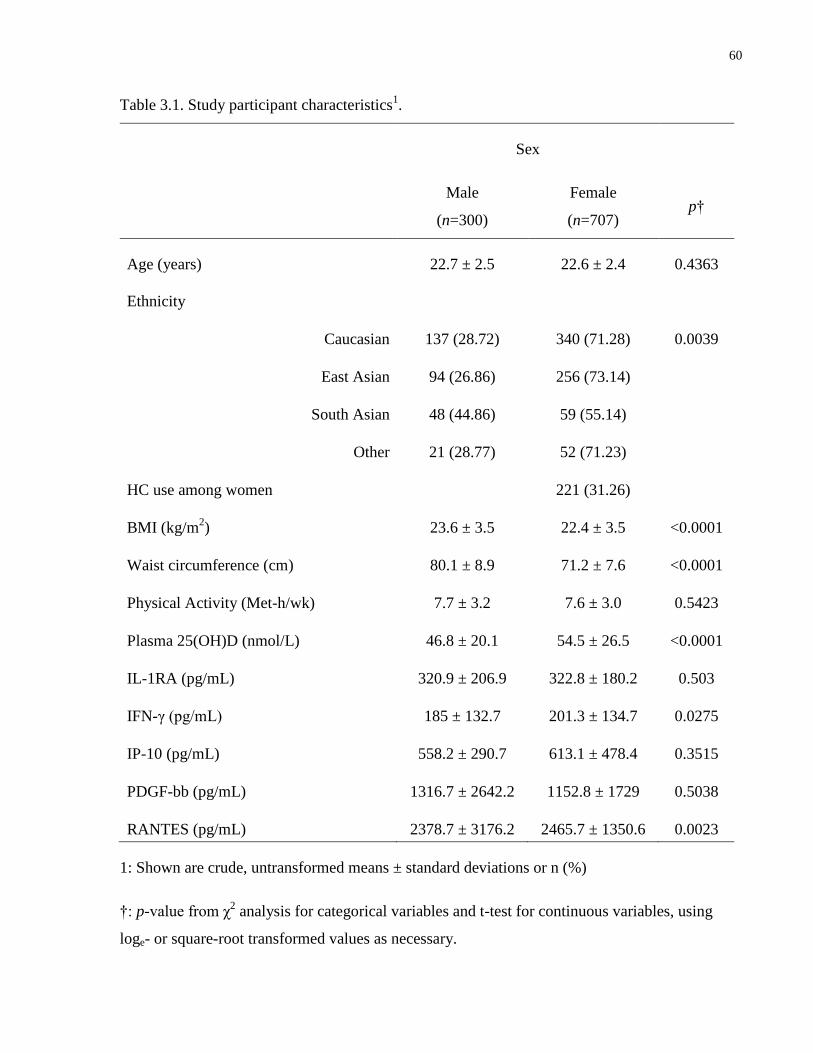
60
Table 3.1. Study participant characteristics1.
Sex
Male
(n=300)
Female
(n=707) p†
Age (years) 22.7 ± 2.5 22.6 ± 2.4 0.4363
Ethnicity
Caucasian 137 (28.72) 340 (71.28) 0.0039
East Asian 94 (26.86) 256 (73.14)
South Asian 48 (44.86) 59 (55.14)
Other 21 (28.77) 52 (71.23)
HC use among women
221 (31.26)
BMI (kg/m2) 23.6 ± 3.5 22.4 ± 3.5 <0.0001
Waist circumference (cm) 80.1 ± 8.9 71.2 ± 7.6 <0.0001
Physical Activity (Met-h/wk) 7.7 ± 3.2 7.6 ± 3.0 0.5423
Plasma 25(OH)D (nmol/L) 46.8 ± 20.1 54.5 ± 26.5 <0.0001
IL-1RA (pg/mL) 320.9 ± 206.9 322.8 ± 180.2 0.503
IFN-γ (pg/mL) 185 ± 132.7 201.3 ± 134.7 0.0275
IP-10 (pg/mL) 558.2 ± 290.7 613.1 ± 478.4 0.3515
PDGF-bb (pg/mL) 1316.7 ± 2642.2 1152.8 ± 1729 0.5038
RANTES (pg/mL) 2378.7 ± 3176.2 2465.7 ± 1350.6 0.0023
1: Shown are crude, untransformed means ± standard deviations or n (%)
†: p-value from χ2 analysis for categorical variables and t-test for continuous variables, using
loge- or square-root transformed values as necessary.
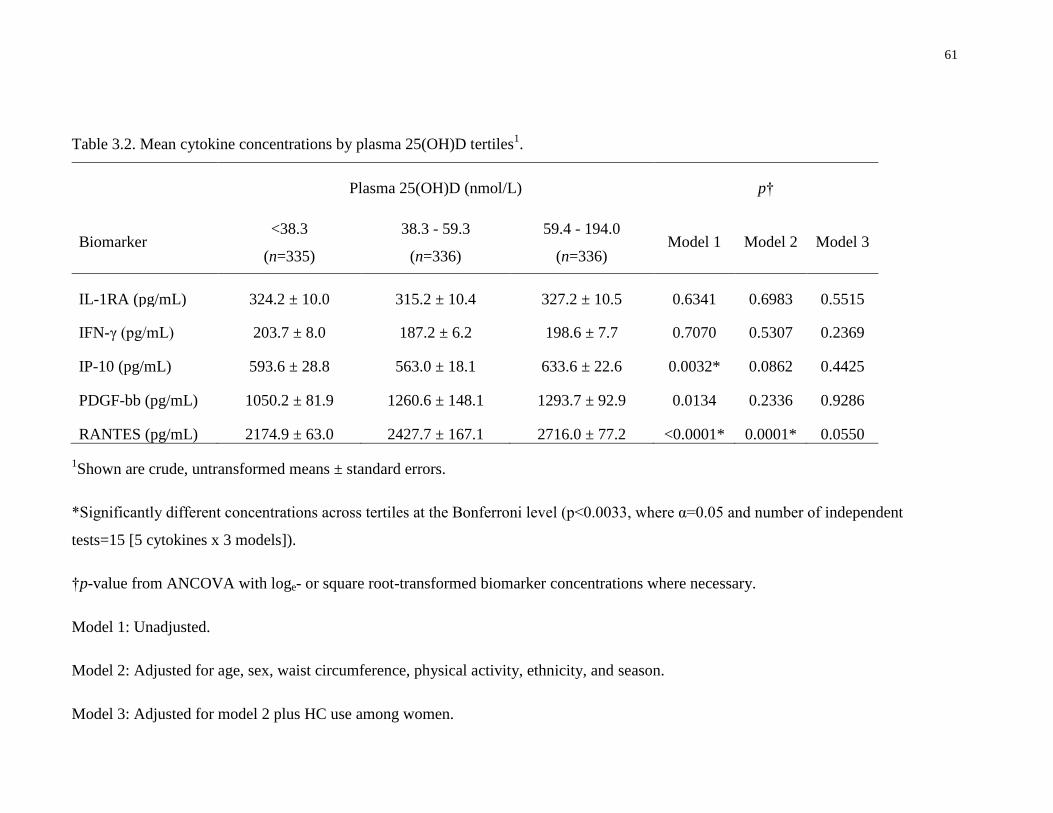
61
Table 3.2. Mean cytokine concentrations by plasma 25(OH)D tertiles1.
Plasma 25(OH)D (nmol/L) p†
Biomarker <38.3
(n=335)
38.3 - 59.3
(n=336)
59.4 - 194.0
(n=336) Model 1 Model 2 Model 3
IL-1RA (pg/mL) 324.2 ± 10.0 315.2 ± 10.4 327.2 ± 10.5 0.6341 0.6983 0.5515
IFN-γ (pg/mL) 203.7 ± 8.0 187.2 ± 6.2 198.6 ± 7.7 0.7070 0.5307 0.2369
IP-10 (pg/mL) 593.6 ± 28.8 563.0 ± 18.1 633.6 ± 22.6 0.0032* 0.0862 0.4425
PDGF-bb (pg/mL) 1050.2 ± 81.9 1260.6 ± 148.1 1293.7 ± 92.9 0.0134 0.2336 0.9286
RANTES (pg/mL) 2174.9 ± 63.0 2427.7 ± 167.1 2716.0 ± 77.2 <0.0001* 0.0001* 0.0550
1Shown are crude, untransformed means ± standard errors.
*Significantly different concentrations across tertiles at the Bonferroni level (p<0.0033, where α=0.05 and number of independent
tests=15 [5 cytokines x 3 models]).
†p-value from ANCOVA with loge- or square root-transformed biomarker concentrations where necessary.
Model 1: Unadjusted.
Model 2: Adjusted for age, sex, waist circumference, physical activity, ethnicity, and season.
Model 3: Adjusted for model 2 plus HC use among women.
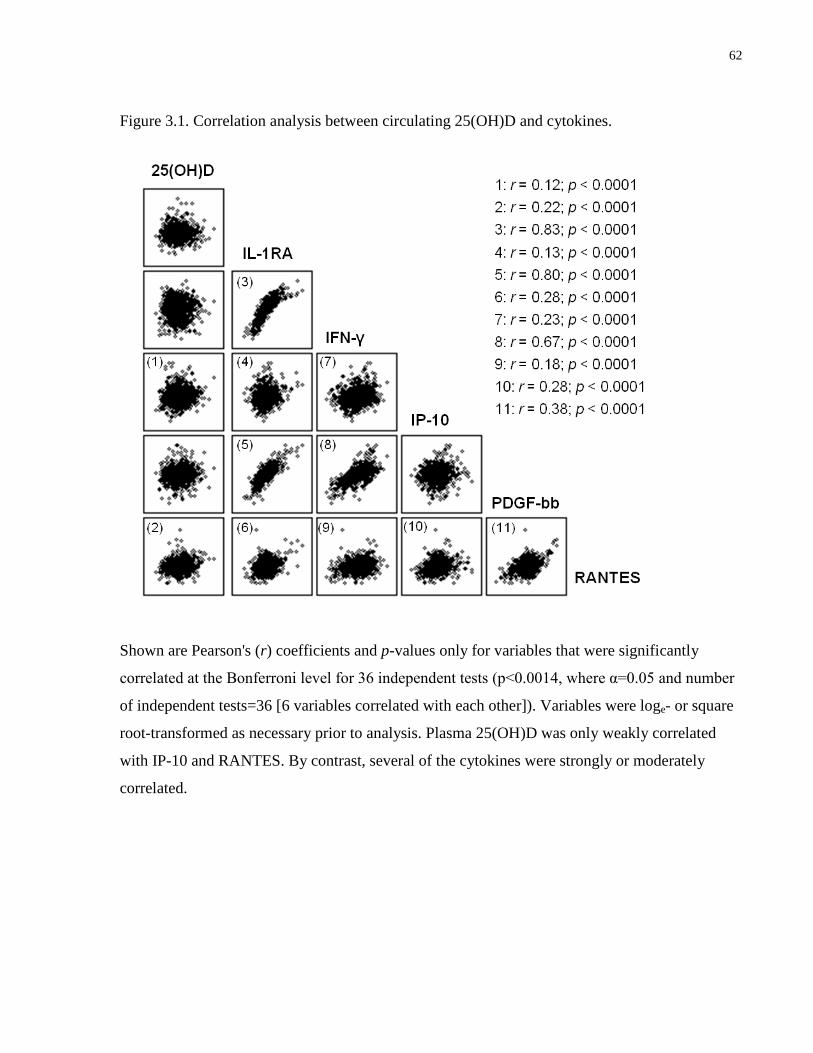
62
Figure 3.1. Correlation analysis between circulating 25(OH)D and cytokines.
Shown are Pearson's (r) coefficients and p-values only for variables that were significantly
correlated at the Bonferroni level for 36 independent tests (p<0.0014, where α=0.05 and number
of independent tests=36 [6 variables correlated with each other]). Variables were loge- or square
root-transformed as necessary prior to analysis. Plasma 25(OH)D was only weakly correlated
with IP-10 and RANTES. By contrast, several of the cytokines were strongly or moderately
correlated.
63
3.5 Discussion
The present study examined the association between circulating concentrations of 25(OH)D and
five cytokines in healthy young adults. We observed that 25(OH)D was not associated with
concentrations of inflammatory biomarkers in this population after accounting for potentially
confounding factors, including age, sex, waist circumference, physical activity, ethnicity, season
of blood collection, and HC use among women.
A wealth of research using cell lines and animal models suggests a key role for vitamin D in
modulating immune responses (144). The actions of vitamin D result from binding of
1,25(OH)2D, the biologically active vitamin D metabolite, to the VDR, a transcription factor
expressed in tissues throughout the body (121). The ligand-bound VDR then binds to VDRE in
target genes, regulating their transcription (143). Most immune cell types express the VDR, as
well as CYP27B1, which is the main enzyme responsible for conversion of 25(OH)D into
1,25(OH)2D. Thus, immune cells are not only responsive to 1α,25(OH)2D but can synthesize it
locally from circulating 25(OH)D (332). In experimental models, vitamin D modulates
inflammatory processes by downregulating the production of pro-inflammatory cytokines, such
as IFN-γ and IL-2, upregulating the transcription of immuno-supressive cytokines, such as IL-10,
and modulating pro-inflammatory intracellular signalling pathways (28).
Despite the strong mechanistic evidence for an immuno-modulatory effect of vitamin D, human
studies have yielded inconsistent results on the association between 25(OH)D and inflammatory
biomarkers (34;257;267;333). These inconsistencies might reflect differences in disease status
between the populations studied, as well as unaccounted confounding from various biological,
demographic, and lifestyle factors. In particular, the use of HC is often overlooked as an
important confounder in the relationship between vitamin D and inflammation. Indeed, we have
recently reported a confounding effect of HC use on the association between 25(OH)D and CRP
in a population of young adults (331). An initial positive association between 25(OH)D and CRP
was no longer significant after use of these medications was considered.
In the present study, we noted a positive association between RANTES and 25(OH)D. RANTES
is a pro-inflammatory cytokine that plays an important role in recruitment of leukocytes to sites
of inflammation and in mediating T cell and monocyte traffic (334). Given the anti-inflammatory
properties of vitamin D, this initial association was unexpected because elevated RANTES
64
concentrations are observed in several inflammatory conditions, including atherosclerosis
(335;336). However, the association was no longer significant after use of HC among women
was taken into account. These medications, which commonly consist of synthetic estrogen and
progestins (192), have been linked to elevated circulating vitamin D metabolites (188). These
effects are thought to be mediated through the actions of estrogen on upregulation of CYP27B1,
the VDR, and DBP (190;195;316), as well as downregulation of CYP24A1, the main catabolic
enzyme in the vitamin D pathway (190;193). At the same time, ethinyl estradiol, the main
estrogenic component of many HC, affects hepatic production of hemostasis-related proteins and
pro-inflammatory acute phase reactants, such as CRP (206;337). Some evidence indicates that
CRP upregulates the production of RANTES (338). Therefore, the observed confounding effect
of HC on the association between 25(OH)D and RANTES may be partly a result of the effects of
these medications on CRP. Alternately, use of HC could affect RANTES directly. Indeed, we
found that RANTES concentrations, as well as those of the other cytokines, were higher among
women who used these medications than those who did not (data not shown).
We observed no associations between 25(OH)D and any of the other cytokines, except for an
initial U-shaped association with IP-10 that was no longer significant after covariate adjustment.
It is important to note that our study population consisted of healthy young adults. It is possible
that the anti-inflammatory effects of vitamin D may be more apparent in older or more diseased
populations with a greater burden of systemic inflammation that can be more easily measured
through biomarkers circulating in the blood. Indeed, several studies that have reported beneficial
effects of vitamin D on inflammation were conducted in obese individuals or those with T2D
(31;85). Furthermore, it is also possible that 25(OH)D concentrations higher than those found
among our study participants are necessary to observe its effects on immune modulation at the
systemic level.
Finally, while we found weak correlations, and no covariate-adjusted associations between
25(OH) and any cytokine, we observed some strong positive correlations between certain
cytokines, namely IL-1RA and IFN-γ, IL-1RA and PDGF-bb, and IFN-γ and PDGF-bb. These
observations are in agreement with previous in vitro work reporting that IFN-γ up-regulates
production of both IL-1RA and PDGF-bb (339;340).
65
One limitation of the present study is the cross-sectional nature of the analyses, which precludes
making any inferences about causality. In addition, of the 27 cytokines initially measured in a
subset of the population, the concentrations of many were too low to detect accurately, which
prevented us from examining other important inflammatory biomarkers such as IL-6 and TNFα.
While the young age and general good health of the present study population may have
accounted for this shortcoming, studying healthy individuals provides a picture of inflammatory
status before the onset of disease, and understanding how inflammation may be modulated by
various micronutrients at this stage provides the potential for developing nutrition-based
strategies to prevent later disease development.
In conclusion, the present study examined the association between circulating concentrations of
25(OH)D, and inflammatory biomarkers in healthy young adults living in Canada. We observed
that circulating 25(OH)D was not associated with decreased concentrations of any inflammatory
biomarkers. In addition, we identified a confounding effect of HC use on the association between
25(OH)D and RANTES.
66
Chapter 4 : Plasma 25-hydroxyvitamin D, hormonal contraceptive use,
and cardiometabolic disease risk in an ethnically diverse population of
young adults
Adapted with permission from an article published by the Journal of the American
College of Nutrition, which is available online at
http://www.tandfonline.com/loi/uacn20#.Uht-Oz8piRM. The original article is the
following:
García-Bailo B, Karmali M, Badawi A, El-Sohemy A. Plasma 25-hydroxyvitamin
D, hormonal contraceptive use, and cardiometabolic disease risk in an ethnically
diverse population of young adults. J Am Coll Nutr. In press.
67
4.1 Abstract
Background: The relationship between vitamin D and cardiometabolic disease risk across ethnic
groups is unclear, and it is not known whether use of HC, which affect vitamin D metabolism
and are also associated with cardiometabolic disease risk, modify this relationship. Our
objectives were to determine the prevalence of vitamin D deficiency (plasma 25(OH)D <30
nmol/L), to assess seasonal variation in concentrations of 25(OH)D, and to examine whether
25(OH)D is associated with cardiometabolic biomarkers across ethnic groups and across men,
women non-users of hormonal contraceptives (HC), and women HC users in an ethnically
diverse population of young adults living in Canada.
Methods: The study population consisted of Caucasian, East Asian and South Asian individuals
(n=1,384, 69% female) aged 20 – 29 years. Participants provided overnight fasting blood
samples, from which plasma 25(OH)D and cardiometabolic biomarkers were measured. Vitamin
D status distributions were compared using χ2
tests, and ANCOVA was used to examine seasonal
variations in 25(OH)D, as well as the association between 25(OH)D and cardiometabolic
biomarkers, across groups.
Results: Plasma 25(OH)D concentrations fluctuated seasonally among Caucasians and East
Asians and across men, women HC non-users, and women HC users, but they remained low
year-round in South Asians, half of whom were vitamin D-deficient. Vitamin D deficiency was
associated with higher insulin, HOMA-IR, and HOMA-Beta among Caucasians and East Asians
and among men and women HC non-users, and with higher triglycerides among men only. No
biomarkers were associated with 25(OH)D among South Asians and women HC users, although
non-significant trends were observed for higher markers of glycemic dysregulation in those who
were vitamin D-deficient in both groups.
Conclusions: Vitamin D deficiency varies between ethnic groups, being particularly high among
South Asians, and it is associated with biomarkers of glycemic dysregulation; however, HC use
among women may attenuate this association. Given the widespread use of HC by women
throughout the world, a better understanding of the extent to which these medications may
modify the relationship between vitamin D and processes related to disease is warranted.

68
4.2 Introduction
Cardiometabolic diseases, such as T2D and CVD, are a leading cause of death and disability
worldwide (1). Metabolic abnormalities including hypertension, dyslipidemia, central obesity
and glycemic dysregulation, which often cluster together as the metabolic syndrome, are
considered risk factors for cardiometabolic disease (341). Evidence from in vitro studies and
recent human clinical trials suggests that vitamin D may affect processes involved in
cardiometabolic disease, such as insulin sensitivity and pancreatic β cell function (26;32;33).
Adequate circulating concentrations of 25(OH)D, the vitamin D metabolite used to measure
status, which captures both dietary intake and endogenous synthesis of vitamin D, have been
associated with improved levels of biomarkers of cardiometabolic disease and decreased risk of
the metabolic syndrome (29;30). However, recent systematic reviews have concluded that the
results of the various studies are equivocal (35-37). In addition to differences in methodology,
the widespread inconsistencies between studies may result partly from unaccounted confounding
or genetic differences (38).
While vitamin D can be obtained through the diet, the primary source is endogenous cutaneous
production after exposure to UV radiation (121). Thus, a seasonal lack of sunlight and darker
skin increase the risk of vitamin D deficiency.The prevalence of vitamin D deficiency, as defined
by the Institute of Medicine, in Canada has been reported to range from 3% among Caucasians to
16% among non-Caucasians (152), but only a few small studies have examined the differences
between specific ethnic groups, such as East Asians and South Asians, within Canada (153;178).
Disparities in cardiometabolic disease prevalence have been documented across ethnic groups
(63;80), but few studies have assessed whether these ethnic differences in cardiometabolic
disease are associated with differences in vitamin D status (182;342). Elucidating the
relationship between vitamin D and cardiometabolic disease across ethnic groups may partly
explain the inconsistencies between studies.
In addition to skin colour, other demographic, lifestyle, and biological factors can affect
25(OH)D concentrations and may confound the relationship between this vitamin and various
health outcomes (223;317). In particular, the use of estrogen-containing medications, such as
HC, among women is associated with elevated circulating 25(OH)D (188;191). At the same
time, HC, which are used by over 100 million women worldwide, have been linked to
69
widespread effects on disease-associated pathways and a higher risk of adverse health outcomes,
such as impaired glucose tolerance and CVD (204;207;208). Taken together, this evidence
suggests that HC use may confound the association between 25(OH)D and disease-associated
pathways. Indeed, we have recently characterized confounding effects of HC use on the
association between 25(OH)D and CRP, a biomarker of systemic inflammation, as well as
numerous disease-associated plasma proteins, in young women across ethnic groups (331;343).
However, it is not known whether the association between vitamin D and other biomarkers of
cardiometabolic disease is different in women HC users than men and women HC non-users.
Given the widespread use of these medications by women throughout the world, it is important
to characterize their potential effects on the relationship between vitamin D and cardiometabolic
disease.
The objectives of the present study were to examine whether 25(OH)D is associated with
cardiometabolic biomarkers across ethnic groups and across men, women HC non-users, and
women HC users in an ethnically diverse population of young adults living in Canada. We also
determined the prevalence of vitamin D deficiency and assessed seasonal variation in 25(OH)D
concentrations across groups.
4.3 Methods
4.3.1 Study Design and Participants
The present study included 1,384 non-smoking men (n=427) and women (n=957), free of
diabetes, with available data for 25(OH)D and the remaining variables considered for analysis.
We excluded individuals who were self-reported as Afro-Caribbean, Aboriginal, or of mixed
descent (n=118) because of the low number of persons recruited from each of these groups. For
more details on the TNH study population, recruitment, exclusions, and classification into ethnic
groups and seasons, please refer to Chapter 2, Section 2.3.1.
4.3.2 Anthropometrics and Physical Activity
Please refer to Chapter 2, Section 2.3.2.

70
4.3.3 Hormonal Contraceptive Use
Please refer to Chapter 2, Section 2.3.4.
4.3.4 Biochemical and 25(OH)D Measurements
For details on fasting blood collection and how 25(OH)D was measured, please refer to Chapter
2, Section 2.3.5.
All measures of glucose and lipid metabolism were performed on-site at LifeLabs Medical
Laboratory Services using standard procedures, as previously described (311). Insulin resistance
and % β cell function were assessed through HOMA, with values calculated using the HOMA2
Calculator version 2.2 (Diabetes Trials Unit, University of Oxford, Oxford, United Kingdom)
(103).
Vitamin D status categories were created based on 25(OH)D concentrations and in consideration
of the recommendations of the Institute of Medicine (151), the Endocrine Society (23), and the
Canadian Osteoporosis Society (24). Deficiency was defined as 25(OH)D <30 nmol/L.
Insufficiency was defined as 30 – 49.9 nmol/L. Adequacy was equivalent to 50 – 74.9 nmol/L,
and optimal vitamin D status was defined as ≥75 nmol/L.
4.3.5 Statistical Analysis
All statistical analyses were performed using SAS. The error was set at 0.05 and reported p-
values are 2-sided. Where indicated, the Bonferroni correction for multiple testing was applied.
Continuous variables with non-normal distributions were loge- or square root-transformed prior
to analysis. In these instances, the p-values from analyses using the transformed values are
reported, but untransformed means and measures of spread are shown for ease of interpretation.
Subject characteristics were compared using t-tests, ANOVA, and χ2 tests. Vitamin D status
distributions across men, women HC non-users, and women HC users, as well as across ethnic
groups, were compared using χ2 tests. Concentrations of 25(OH)D across ethnic groups and
across men, women HC non-users, and women HC users were compared between seasons using
ANCOVA. When comparing ethnic groups, the analyses were adjusted for age, sex, waist
circumference, physical activity, and HC use among women. When comparing men, women HC
non-users, and women HC users, the analyses were adjusted for age, waist circumference,
71
physical activity, and ethnicity. Finally, the association between specific cardiometabolic
biomarkers and vitamin D status across ethnic groups and across men, women HC non-users, and
women HC users was explored using ANCOVA. To examine the association across ethnic
groups, we first conducted exploratory analyses in models including an interaction term for
vitamin D status x ethnicity, as well as age, sex, waist circumference, physical activity, season,
and HC use among women as covariates. We also conducted analyses stratified by ethnicity
using ANCOVA models adjusted for age, sex, waist circumference, physical activity, season,
and HC use among women. To examine the association across men, women HC non-users, and
women HC users, as previously, we first conducted exploratory analyses in models including an
interaction term for vitamin D status x HC use, as well as age, sex, waist circumference, physical
activity, season, and ethnicity as covariates. Subsequently, analyses were stratified by sex and
HC use and adjusted for age, waist circumference, ethnicity, physical activity, and season.
Across all ethnicities and sex groups, analyses examining the association between HOMA-Beta
and vitamin D status were also adjusted for the ratio of circulating triglycerides to HDL
cholesterol, as a surrogate measure of insulin sensitivity (104;344).
4.4 Results
The characteristics of the study population are shown in Table 4.1. Men had higher values of
most anthropometric measures than women as a whole, but women had higher plasma 25(OH)D,
insulin, HOMA-IR, HOMA-Beta, total and HDL cholesterol than men. Nearly 45% of Caucasian
women reported HC use, whereas approximately 15% of East Asian and South Asian women
were HC users. Plasma 25(OH)D was highest in Caucasians and lowest in South Asians.
Biomarkers of glycemic dysregulation, LDL cholesterol, and total:HDL ratio were higher among
South Asians than the other groups, whereas HDL cholesterol was lowest in this group.
The distribution of vitamin D status differed across men, women HC non-users, and women HC
users, and it also differed across ethnocultural groups (Table 4.2). Half of women HC users were
in the optimal vitamin D status category (25(OH)D ≥75 nmol/L), while only 20% of men and
14% of women HC non-users had an optimal vitamin D status. Only about 5% of Caucasians
were vitamin D deficient, whereas 17% of East Asians and 45% of South Asians were
categorized as deficient. In contrast, nearly 40% of Caucasians had an optimal vitamin D status,
72
but less than 10% of the individuals from the other two ethnic groups fell in the optimal status
category.
Mean 25(OH)D concentrations fluctuated seasonally among Caucasians and East Asians, but not
South Asians (Figure 4.1). Caucasians and East Asians recruited during summer and fall had
higher average concentrations than those recruited during winter and spring. Among South
Asians, 25(OH)D concentrations did not fluctuate seasonally. Across seasons, Caucasians had
the highest 25(OH)D concentrations. Mean 25(OH)D concentrations also fluctuated seasonally
across men, women HC non-users, and women HC users (Figure 4.2), with concentrations being
higher for those recruited in summer and fall than winter and spring. Regardless of the season,
women HC users had the highest plasma 25(OH)D.
The association between cardiometabolic risk biomarkers and vitamin D status was examined
separately within each ethnic group, as shown in Table 4.3. When examined as a whole, there
were no 25(OH)D x ethnicity interaction effects in the overall population. When examined
separately, among Caucasians, individuals with optimal vitamin D status had the lowest mean
fasting insulin, HOMA-IR, and HOMA-Beta scores. Among East Asians, fasting insulin and
HOMA-IR were highest in vitamin D-deficient individuals. In this ethnic group, HOMA-Beta
was higher in those who were vitamin D-deficient than in those who had an adequate or optimal
vitamin D status. There were no significant associations between any biomarkers and vitamin D
status among South Asians, although we observed non-significant trends for lower fasting
insulin, HOMA-IR, and HOMA-Beta in those with optimal vitamin D status.
Finally, we examined the association between cardiometabolic risk biomarkers and vitamin D
status separately within men, women HC non-users, and women HC users (Table 4.4). When
examined as a whole, there was an interaction effect of 25(OH)D and HC use on triglycerides in
the overall population. When examined separately, among men, fasting insulin and HOMA-IR
were lower in those with an adequate or optimal vitamin D status than those who were vitamin
D-deficient or insufficient. Men with an optimal vitamin D status had the lowest HOMA-Beta
scores. Triglyceride concentrations were higher in men who were vitamin D-deficient or
insufficient than those with an adequate vitamin D status. Women HC non-users with an optimal
vitamin D status had lower insulin concentrations, HOMA-IR and HOMA-Beta scores than those
who were vitamin D-deficient. Among women HC users, we observed no associations between

73
any biomarkers and vitamin D status, although we noted a non-significant trend for measures of
glycemic dysregulation to be higher in the vitamin D-deficient category.
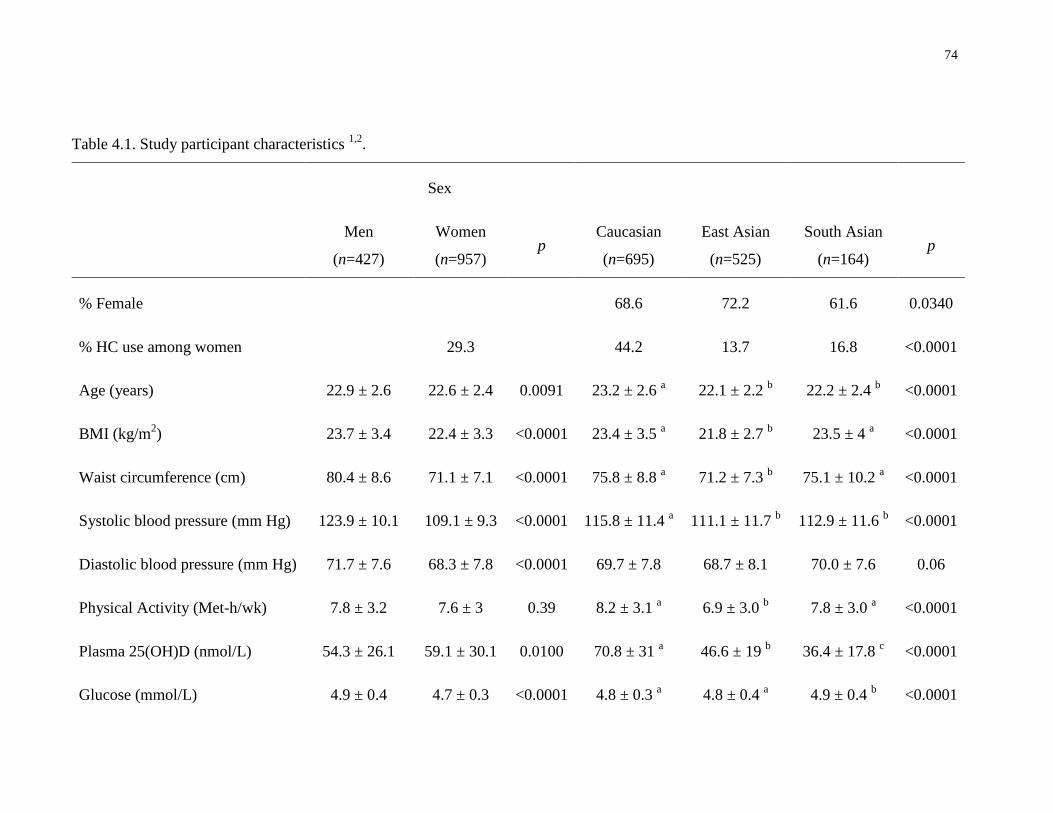
74
Table 4.1. Study participant characteristics 1,2
.
Sex
Men
(n=427)
Women
(n=957) p
Caucasian
(n=695)
East Asian
(n=525)
South Asian
(n=164) p
% Female
68.6 72.2 61.6 0.0340
% HC use among women
29.3
44.2 13.7 16.8 <0.0001
Age (years) 22.9 ± 2.6 22.6 ± 2.4 0.0091 23.2 ± 2.6 a 22.1 ± 2.2
b 22.2 ± 2.4
b <0.0001
BMI (kg/m2) 23.7 ± 3.4 22.4 ± 3.3 <0.0001 23.4 ± 3.5
a 21.8 ± 2.7
b 23.5 ± 4
a <0.0001
Waist circumference (cm) 80.4 ± 8.6 71.1 ± 7.1 <0.0001 75.8 ± 8.8 a 71.2 ± 7.3
b 75.1 ± 10.2
a <0.0001
Systolic blood pressure (mm Hg) 123.9 ± 10.1 109.1 ± 9.3 <0.0001 115.8 ± 11.4 a 111.1 ± 11.7
b 112.9 ± 11.6
b <0.0001
Diastolic blood pressure (mm Hg) 71.7 ± 7.6 68.3 ± 7.8 <0.0001 69.7 ± 7.8 68.7 ± 8.1 70.0 ± 7.6 0.06
Physical Activity (Met-h/wk) 7.8 ± 3.2 7.6 ± 3 0.39 8.2 ± 3.1 a 6.9 ± 3.0
b 7.8 ± 3.0
a <0.0001
Plasma 25(OH)D (nmol/L) 54.3 ± 26.1 59.1 ± 30.1 0.0100 70.8 ± 31 a 46.6 ± 19
b 36.4 ± 17.8
c <0.0001
Glucose (mmol/L) 4.9 ± 0.4 4.7 ± 0.3 <0.0001 4.8 ± 0.3 a 4.8 ± 0.4
a 4.9 ± 0.4
b <0.0001
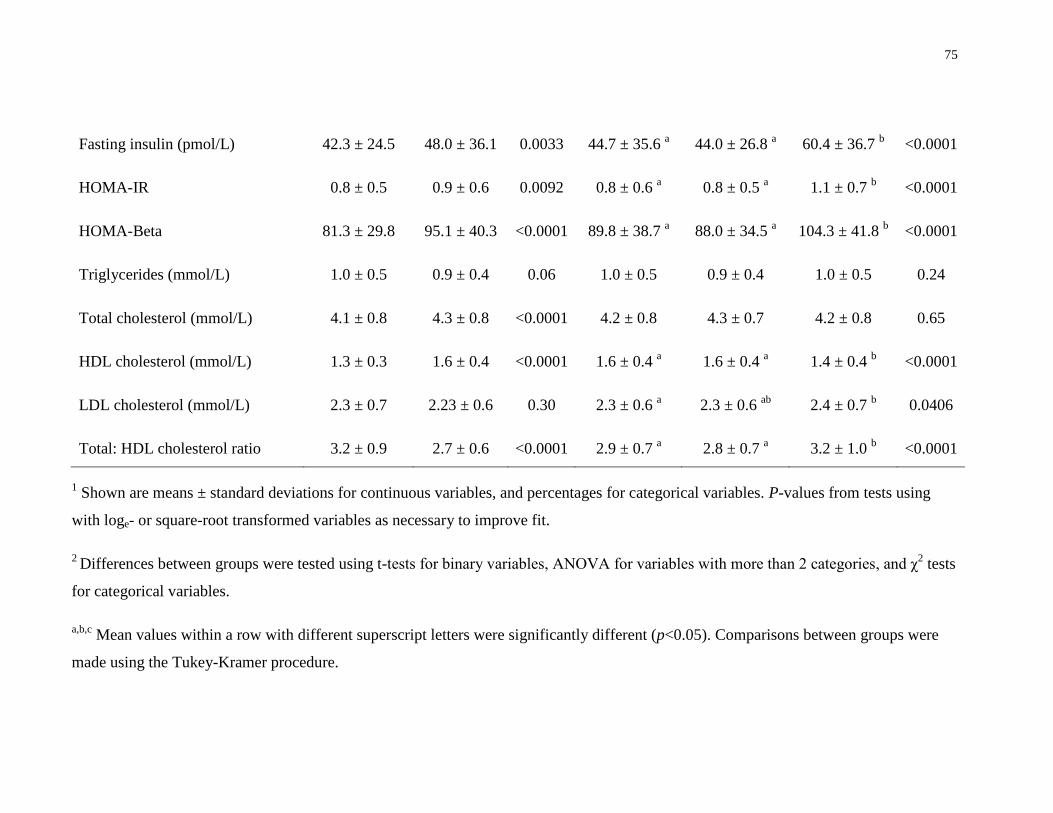
75
Fasting insulin (pmol/L) 42.3 ± 24.5 48.0 ± 36.1 0.0033 44.7 ± 35.6 a 44.0 ± 26.8
a 60.4 ± 36.7
b <0.0001
HOMA-IR 0.8 ± 0.5 0.9 ± 0.6 0.0092 0.8 ± 0.6 a 0.8 ± 0.5
a 1.1 ± 0.7
b <0.0001
HOMA-Beta 81.3 ± 29.8 95.1 ± 40.3 <0.0001 89.8 ± 38.7 a 88.0 ± 34.5
a 104.3 ± 41.8
b <0.0001
Triglycerides (mmol/L) 1.0 ± 0.5 0.9 ± 0.4 0.06 1.0 ± 0.5 0.9 ± 0.4 1.0 ± 0.5 0.24
Total cholesterol (mmol/L) 4.1 ± 0.8 4.3 ± 0.8 <0.0001 4.2 ± 0.8 4.3 ± 0.7 4.2 ± 0.8 0.65
HDL cholesterol (mmol/L) 1.3 ± 0.3 1.6 ± 0.4 <0.0001 1.6 ± 0.4 a 1.6 ± 0.4
a 1.4 ± 0.4
b <0.0001
LDL cholesterol (mmol/L) 2.3 ± 0.7 2.23 ± 0.6 0.30 2.3 ± 0.6 a 2.3 ± 0.6
ab 2.4 ± 0.7
b 0.0406
Total: HDL cholesterol ratio 3.2 ± 0.9 2.7 ± 0.6 <0.0001 2.9 ± 0.7 a 2.8 ± 0.7
a 3.2 ± 1.0
b <0.0001
1 Shown are means ± standard deviations for continuous variables, and percentages for categorical variables. P-values from tests using
with loge- or square-root transformed variables as necessary to improve fit.
2 Differences between groups were tested using t-tests for binary variables, ANOVA for variables with more than 2 categories, and χ
2 tests
for categorical variables.
a,b,c Mean values within a row with different superscript letters were significantly different (p<0.05). Comparisons between groups were
made using the Tukey-Kramer procedure.
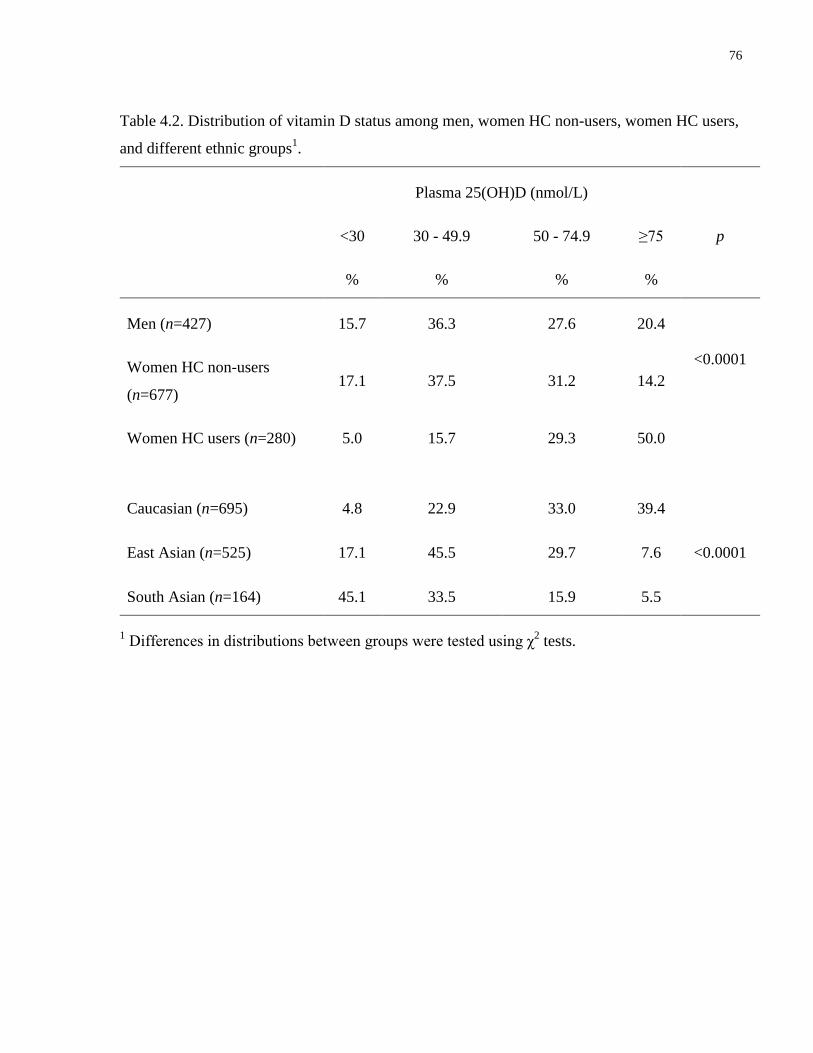
76
Table 4.2. Distribution of vitamin D status among men, women HC non-users, women HC users,
and different ethnic groups1.
Plasma 25(OH)D (nmol/L)
<30 30 - 49.9 50 - 74.9 ≥75 p
% % % %
Men (n=427) 15.7 36.3 27.6 20.4
<0.0001 Women HC non-users
(n=677) 17.1 37.5 31.2 14.2
Women HC users (n=280) 5.0 15.7 29.3 50.0
Caucasian (n=695) 4.8 22.9 33.0 39.4
<0.0001 East Asian (n=525) 17.1 45.5 29.7 7.6
South Asian (n=164) 45.1 33.5 15.9 5.5
1 Differences in distributions between groups were tested using χ
2 tests.
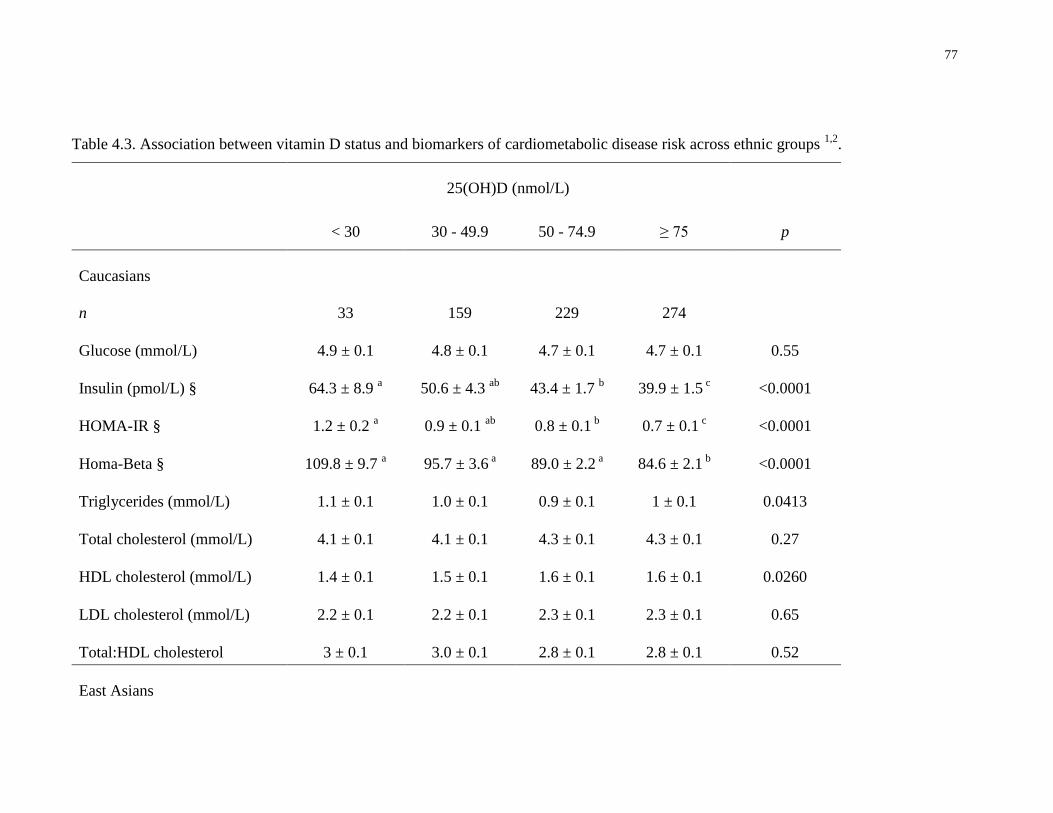
77
Table 4.3. Association between vitamin D status and biomarkers of cardiometabolic disease risk across ethnic groups 1,2
.
25(OH)D (nmol/L)
< 30 30 - 49.9 50 - 74.9 ≥ 75 p
Caucasians
n 33 159 229 274
Glucose (mmol/L) 4.9 ± 0.1 4.8 ± 0.1 4.7 ± 0.1 4.7 ± 0.1 0.55
Insulin (pmol/L) § 64.3 ± 8.9 a
50.6 ± 4.3 ab
43.4 ± 1.7 b 39.9 ± 1.5
c <0.0001
HOMA-IR § 1.2 ± 0.2 a 0.9 ± 0.1
ab 0.8 ± 0.1
b 0.7 ± 0.1
c <0.0001
Homa-Beta § 109.8 ± 9.7 a 95.7 ± 3.6
a 89.0 ± 2.2
a 84.6 ± 2.1
b <0.0001
Triglycerides (mmol/L) 1.1 ± 0.1 1.0 ± 0.1 0.9 ± 0.1 1 ± 0.1 0.0413
Total cholesterol (mmol/L) 4.1 ± 0.1 4.1 ± 0.1 4.3 ± 0.1 4.3 ± 0.1 0.27
HDL cholesterol (mmol/L) 1.4 ± 0.1 1.5 ± 0.1 1.6 ± 0.1 1.6 ± 0.1 0.0260
LDL cholesterol (mmol/L) 2.2 ± 0.1 2.2 ± 0.1 2.3 ± 0.1 2.3 ± 0.1 0.65
Total:HDL cholesterol 3 ± 0.1 3.0 ± 0.1 2.8 ± 0.1 2.8 ± 0.1 0.52
East Asians
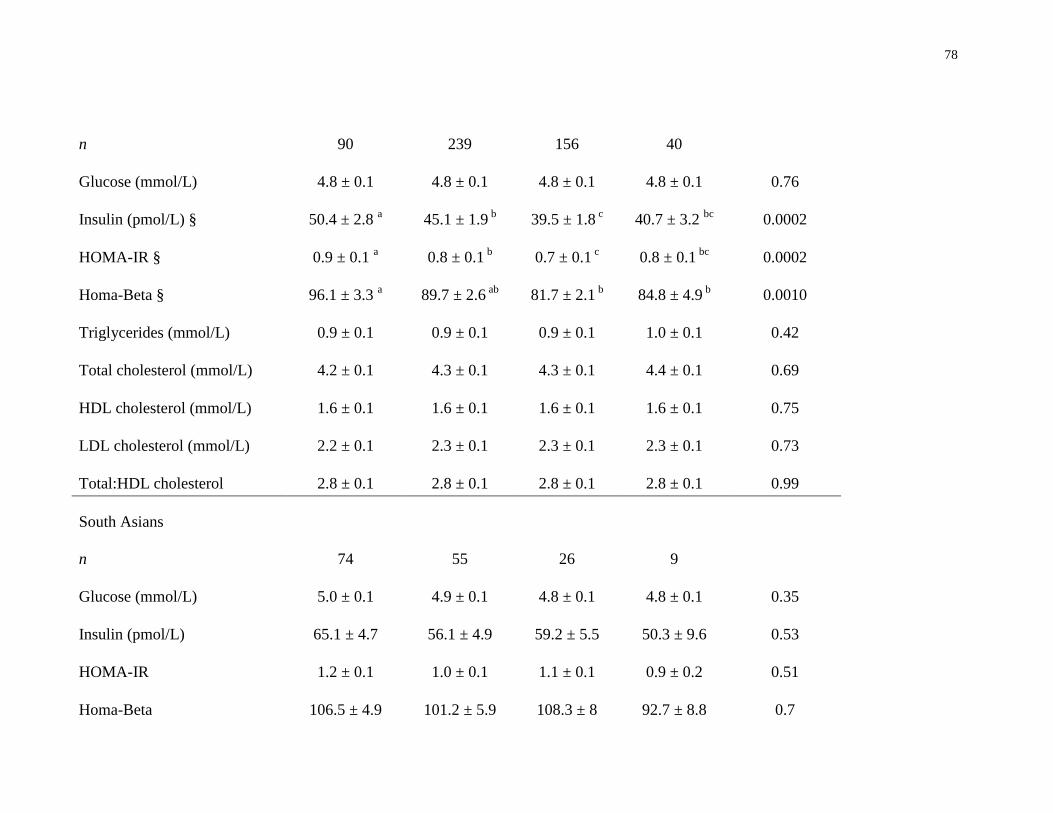
78
n 90 239 156 40
Glucose (mmol/L) 4.8 ± 0.1 4.8 ± 0.1 4.8 ± 0.1 4.8 ± 0.1 0.76
Insulin (pmol/L) § 50.4 ± 2.8 a
45.1 ± 1.9 b 39.5 ± 1.8
c 40.7 ± 3.2
bc 0.0002
HOMA-IR § 0.9 ± 0.1 a 0.8 ± 0.1
b 0.7 ± 0.1
c 0.8 ± 0.1
bc 0.0002
Homa-Beta § 96.1 ± 3.3 a 89.7 ± 2.6
ab 81.7 ± 2.1
b 84.8 ± 4.9
b 0.0010
Triglycerides (mmol/L) 0.9 ± 0.1 0.9 ± 0.1 0.9 ± 0.1 1.0 ± 0.1 0.42
Total cholesterol (mmol/L) 4.2 ± 0.1 4.3 ± 0.1 4.3 ± 0.1 4.4 ± 0.1 0.69
HDL cholesterol (mmol/L) 1.6 ± 0.1 1.6 ± 0.1 1.6 ± 0.1 1.6 ± 0.1 0.75
LDL cholesterol (mmol/L) 2.2 ± 0.1 2.3 ± 0.1 2.3 ± 0.1 2.3 ± 0.1 0.73
Total:HDL cholesterol 2.8 ± 0.1 2.8 ± 0.1 2.8 ± 0.1 2.8 ± 0.1 0.99
South Asians
n 74 55 26 9
Glucose (mmol/L) 5.0 ± 0.1 4.9 ± 0.1 4.8 ± 0.1 4.8 ± 0.1 0.35
Insulin (pmol/L) 65.1 ± 4.7 56.1 ± 4.9 59.2 ± 5.5 50.3 ± 9.6 0.53
HOMA-IR 1.2 ± 0.1 1.0 ± 0.1 1.1 ± 0.1 0.9 ± 0.2 0.51
Homa-Beta 106.5 ± 4.9 101.2 ± 5.9 108.3 ± 8 92.7 ± 8.8 0.7
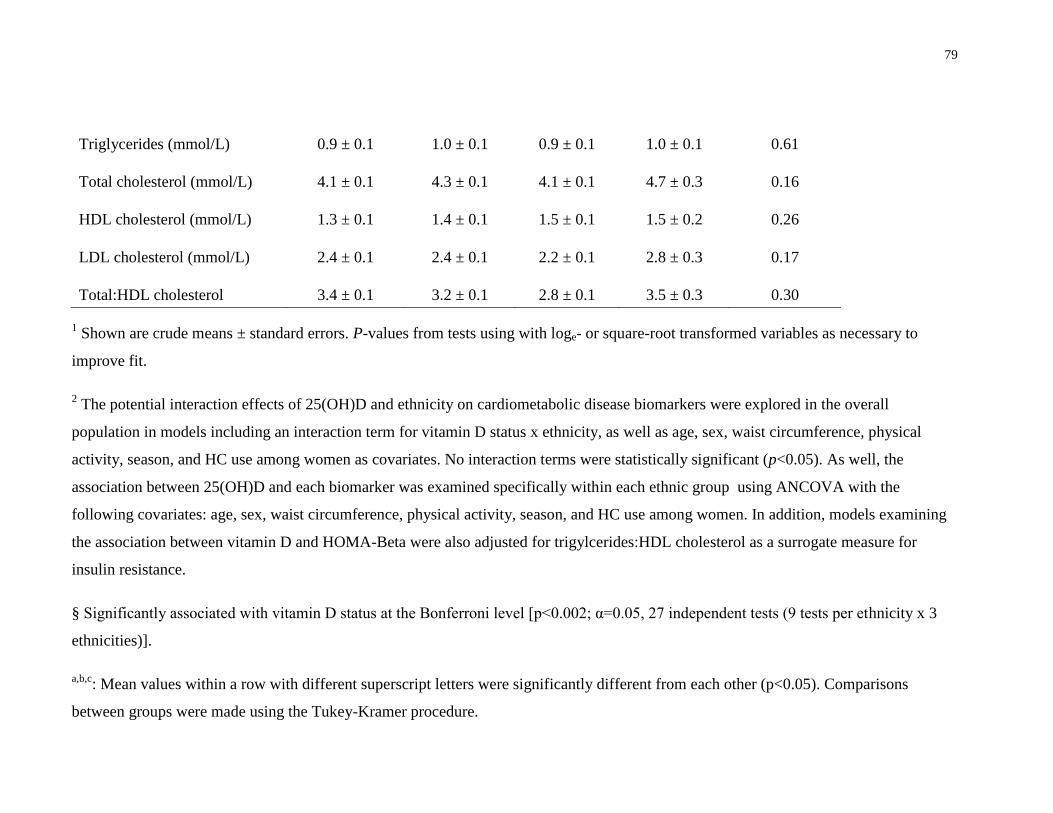
79
Triglycerides (mmol/L) 0.9 ± 0.1 1.0 ± 0.1 0.9 ± 0.1 1.0 ± 0.1 0.61
Total cholesterol (mmol/L) 4.1 ± 0.1 4.3 ± 0.1 4.1 ± 0.1 4.7 ± 0.3 0.16
HDL cholesterol (mmol/L) 1.3 ± 0.1 1.4 ± 0.1 1.5 ± 0.1 1.5 ± 0.2 0.26
LDL cholesterol (mmol/L) 2.4 ± 0.1 2.4 ± 0.1 2.2 ± 0.1 2.8 ± 0.3 0.17
Total:HDL cholesterol 3.4 ± 0.1 3.2 ± 0.1 2.8 ± 0.1 3.5 ± 0.3 0.30
1 Shown are crude means ± standard errors. P-values from tests using with loge- or square-root transformed variables as necessary to
improve fit.
2 The potential interaction effects of 25(OH)D and ethnicity on cardiometabolic disease biomarkers were explored in the overall
population in models including an interaction term for vitamin D status x ethnicity, as well as age, sex, waist circumference, physical
activity, season, and HC use among women as covariates. No interaction terms were statistically significant (p<0.05). As well, the
association between 25(OH)D and each biomarker was examined specifically within each ethnic group using ANCOVA with the
following covariates: age, sex, waist circumference, physical activity, season, and HC use among women. In addition, models examining
the association between vitamin D and HOMA-Beta were also adjusted for trigylcerides:HDL cholesterol as a surrogate measure for
insulin resistance.
§ Significantly associated with vitamin D status at the Bonferroni level [p<0.002; α=0.05, 27 independent tests (9 tests per ethnicity x 3
ethnicities)].
a,b,c: Mean values within a row with different superscript letters were significantly different from each other (p<0.05). Comparisons
between groups were made using the Tukey-Kramer procedure.
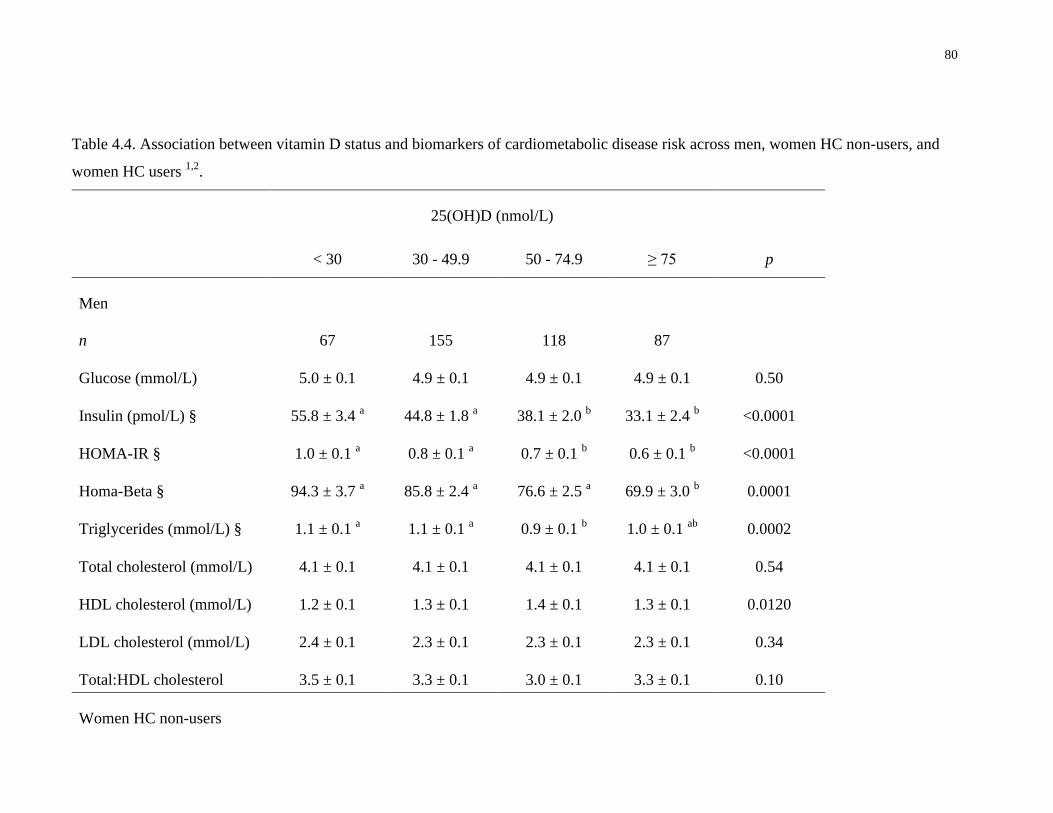
80
Table 4.4. Association between vitamin D status and biomarkers of cardiometabolic disease risk across men, women HC non-users, and
women HC users 1,2
.
25(OH)D (nmol/L)
< 30 30 - 49.9 50 - 74.9 ≥ 75 p
Men
n 67 155 118 87
Glucose (mmol/L) 5.0 ± 0.1 4.9 ± 0.1 4.9 ± 0.1 4.9 ± 0.1 0.50
Insulin (pmol/L) § 55.8 ± 3.4 a 44.8 ± 1.8
a 38.1 ± 2.0
b 33.1 ± 2.4
b <0.0001
HOMA-IR § 1.0 ± 0.1 a 0.8 ± 0.1
a 0.7 ± 0.1
b 0.6 ± 0.1
b <0.0001
Homa-Beta § 94.3 ± 3.7 a 85.8 ± 2.4
a 76.6 ± 2.5
a 69.9 ± 3.0
b 0.0001
Triglycerides (mmol/L) § 1.1 ± 0.1 a 1.1 ± 0.1
a 0.9 ± 0.1
b 1.0 ± 0.1
ab 0.0002
Total cholesterol (mmol/L) 4.1 ± 0.1 4.1 ± 0.1 4.1 ± 0.1 4.1 ± 0.1 0.54
HDL cholesterol (mmol/L) 1.2 ± 0.1 1.3 ± 0.1 1.4 ± 0.1 1.3 ± 0.1 0.0120
LDL cholesterol (mmol/L) 2.4 ± 0.1 2.3 ± 0.1 2.3 ± 0.1 2.3 ± 0.1 0.34
Total:HDL cholesterol 3.5 ± 0.1 3.3 ± 0.1 3.0 ± 0.1 3.3 ± 0.1 0.10
Women HC non-users
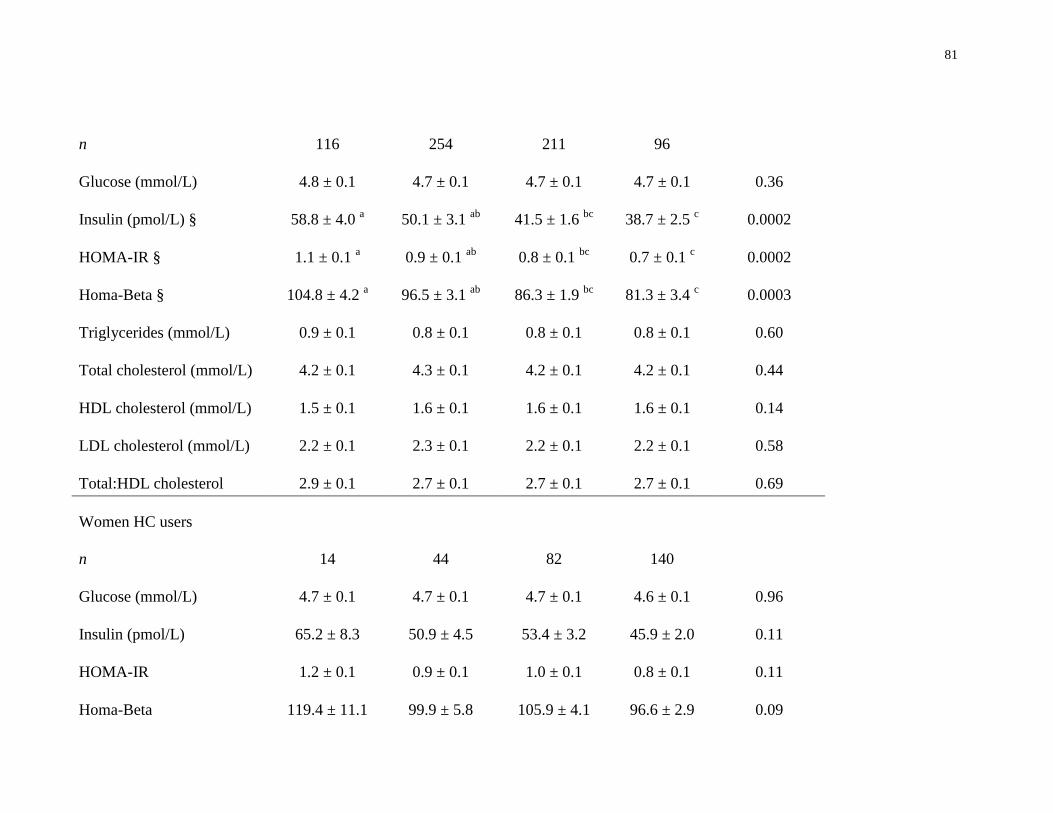
81
n 116 254 211 96
Glucose (mmol/L) 4.8 ± 0.1 4.7 ± 0.1 4.7 ± 0.1 4.7 ± 0.1 0.36
Insulin (pmol/L) § 58.8 ± 4.0 a 50.1 ± 3.1
ab 41.5 ± 1.6
bc 38.7 ± 2.5
c 0.0002
HOMA-IR § 1.1 ± 0.1 a 0.9 ± 0.1
ab 0.8 ± 0.1
bc 0.7 ± 0.1
c 0.0002
Homa-Beta § 104.8 ± 4.2 a 96.5 ± 3.1
ab 86.3 ± 1.9
bc 81.3 ± 3.4
c 0.0003
Triglycerides (mmol/L) 0.9 ± 0.1 0.8 ± 0.1 0.8 ± 0.1 0.8 ± 0.1 0.60
Total cholesterol (mmol/L) 4.2 ± 0.1 4.3 ± 0.1 4.2 ± 0.1 4.2 ± 0.1 0.44
HDL cholesterol (mmol/L) 1.5 ± 0.1 1.6 ± 0.1 1.6 ± 0.1 1.6 ± 0.1 0.14
LDL cholesterol (mmol/L) 2.2 ± 0.1 2.3 ± 0.1 2.2 ± 0.1 2.2 ± 0.1 0.58
Total:HDL cholesterol 2.9 ± 0.1 2.7 ± 0.1 2.7 ± 0.1 2.7 ± 0.1 0.69
Women HC users
n 14 44 82 140
Glucose (mmol/L) 4.7 ± 0.1 4.7 ± 0.1 4.7 ± 0.1 4.6 ± 0.1 0.96
Insulin (pmol/L) 65.2 ± 8.3 50.9 ± 4.5 53.4 ± 3.2 45.9 ± 2.0 0.11
HOMA-IR 1.2 ± 0.1 0.9 ± 0.1 1.0 ± 0.1 0.8 ± 0.1 0.11
Homa-Beta 119.4 ± 11.1 99.9 ± 5.8 105.9 ± 4.1 96.6 ± 2.9 0.09
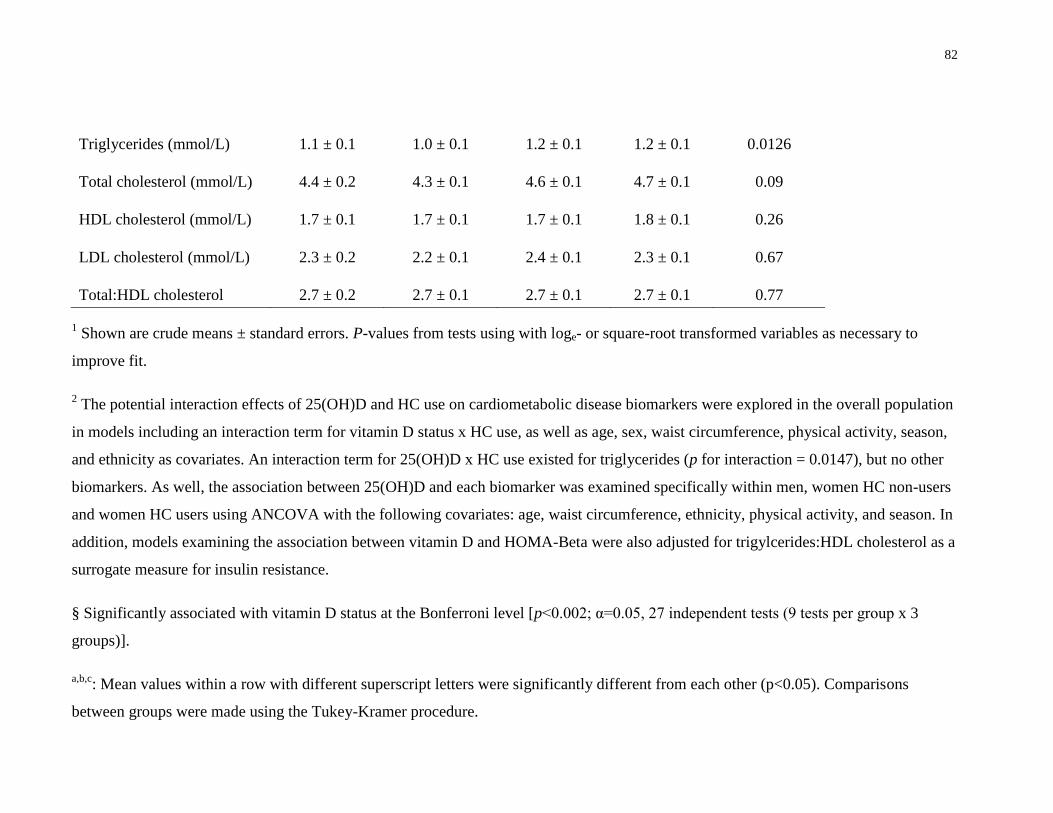
82
Triglycerides (mmol/L) 1.1 ± 0.1 1.0 ± 0.1 1.2 ± 0.1 1.2 ± 0.1 0.0126
Total cholesterol (mmol/L) 4.4 ± 0.2 4.3 ± 0.1 4.6 ± 0.1 4.7 ± 0.1 0.09
HDL cholesterol (mmol/L) 1.7 ± 0.1 1.7 ± 0.1 1.7 ± 0.1 1.8 ± 0.1 0.26
LDL cholesterol (mmol/L) 2.3 ± 0.2 2.2 ± 0.1 2.4 ± 0.1 2.3 ± 0.1 0.67
Total:HDL cholesterol 2.7 ± 0.2 2.7 ± 0.1 2.7 ± 0.1 2.7 ± 0.1 0.77
1 Shown are crude means ± standard errors. P-values from tests using with loge- or square-root transformed variables as necessary to
improve fit.
2 The potential interaction effects of 25(OH)D and HC use on cardiometabolic disease biomarkers were explored in the overall population
in models including an interaction term for vitamin D status x HC use, as well as age, sex, waist circumference, physical activity, season,
and ethnicity as covariates. An interaction term for 25(OH)D x HC use existed for triglycerides (p for interaction = 0.0147), but no other
biomarkers. As well, the association between 25(OH)D and each biomarker was examined specifically within men, women HC non-users
and women HC users using ANCOVA with the following covariates: age, waist circumference, ethnicity, physical activity, and season. In
addition, models examining the association between vitamin D and HOMA-Beta were also adjusted for trigylcerides:HDL cholesterol as a
surrogate measure for insulin resistance.
§ Significantly associated with vitamin D status at the Bonferroni level [p<0.002; α=0.05, 27 independent tests (9 tests per group x 3
groups)].
a,b,c: Mean values within a row with different superscript letters were significantly different from each other (p<0.05). Comparisons
between groups were made using the Tukey-Kramer procedure.
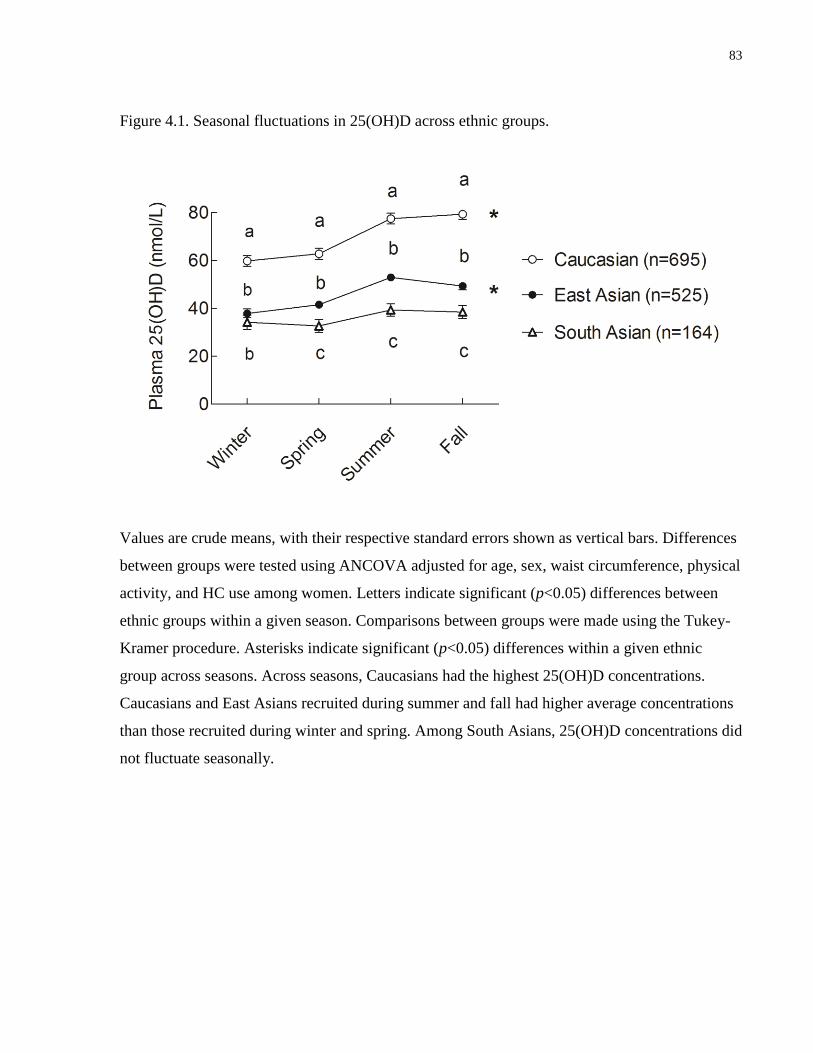
83
Figure 4.1. Seasonal fluctuations in 25(OH)D across ethnic groups.
Values are crude means, with their respective standard errors shown as vertical bars. Differences
between groups were tested using ANCOVA adjusted for age, sex, waist circumference, physical
activity, and HC use among women. Letters indicate significant (p<0.05) differences between
ethnic groups within a given season. Comparisons between groups were made using the Tukey-
Kramer procedure. Asterisks indicate significant (p<0.05) differences within a given ethnic
group across seasons. Across seasons, Caucasians had the highest 25(OH)D concentrations.
Caucasians and East Asians recruited during summer and fall had higher average concentrations
than those recruited during winter and spring. Among South Asians, 25(OH)D concentrations did
not fluctuate seasonally.
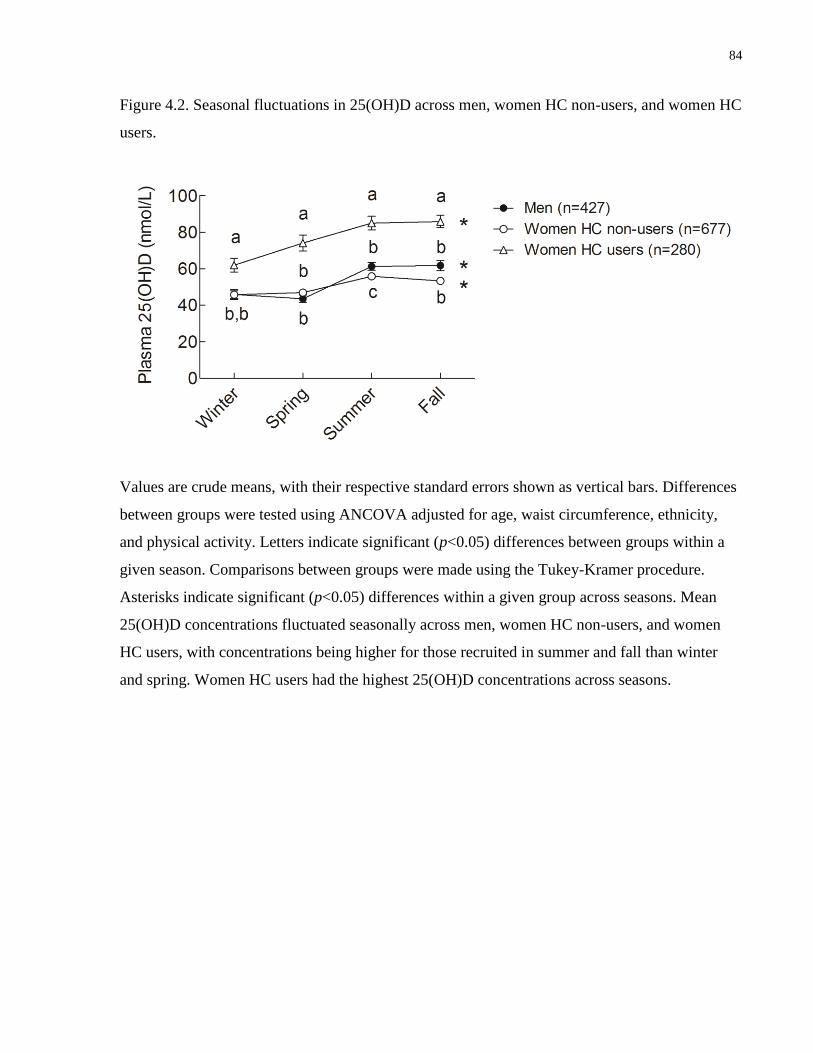
84
Figure 4.2. Seasonal fluctuations in 25(OH)D across men, women HC non-users, and women HC
users.
Values are crude means, with their respective standard errors shown as vertical bars. Differences
between groups were tested using ANCOVA adjusted for age, waist circumference, ethnicity,
and physical activity. Letters indicate significant (p<0.05) differences between groups within a
given season. Comparisons between groups were made using the Tukey-Kramer procedure.
Asterisks indicate significant (p<0.05) differences within a given group across seasons. Mean
25(OH)D concentrations fluctuated seasonally across men, women HC non-users, and women
HC users, with concentrations being higher for those recruited in summer and fall than winter
and spring. Women HC users had the highest 25(OH)D concentrations across seasons.
85
4.5 Discussion
The present study explored the relationship between ethnicity, HC use, vitamin D status, and
biomarkers of cardiometabolic disease risk in a population of young adults in Canada. In line
with previous studies, we identified inverse associations between biomarkers of glycemic
dysregulation and 25(OH)D, potentially suggesting a beneficial role of vitamin D in glucose
metabolism (30;182;290). Of note, we observed these associations in men and women HC non-
users, but not women HC users. Similarly, we noted inverse associations between biomarkers of
glycemic dysregulation and 25(OH)D in Caucasian and East Asian, but not South Asian,
individuals. However, the lack of association observed in women HC users and South Asians
may have been due to the smaller sample size of these groups.
Experimental evidence suggests that vitamin D may improve insulin secretion and also
upregulate the expression of insulin receptors, leading to increased insulin sensitivity (26;272).
In the present study, fasting insulin, HOMA-IR and HOMA-β were inversely associated with
25(OH)D, but fasting glucose measures were similar across vitamin D status categories in men,
women HC non-users, Caucasians, and East Asians. Sustained elevated production of insulin by
the pancreas to counteract high circulating glucose may, over time, result in both insulin
resistance and β-cell dysfunction, which are major steps in the progression of T2D (101). The
inverse association between 25(OH)D, insulin and HOMA indices observed here should be
interpreted with caution because vitamin D deficiency is often paralleled by visceral adiposity
and fatty liver disease, conditions which independently contribute to impaired glucose
metabolism. Furthermore, the cross-sectional study design precludes making inferences about
causality. However, while the participants of the present study were young and generally healthy,
it is possible that the onset of insulin resistance and β-cell dysfunction may already be underway
among vitamin D-deficient young adults.
In agreement with previous research, we observed elevated circulating 25(OH)D among women
HC users in the TNH study population (188;191). As shown in the present study, half of women
HC users, but one fifth or less of men and women HC non-users, were in the vitamin D optimal
status category, and the observed association between HC use and elevated 25(OH)D was
consistent across seasons. Most modern HC preparations include a combination of ethinyl
estradiol, a synthetic estrogen, and progestins (192). In human cell lines and in animal models,
86
estrogen has been shown to downregulate CYP24A1, the main enzyme responsible for catalysis
of 25(OH)D, and to upregulate CYP27B1, which converts 25(OH)D to 1,25(OH)2D, the primary
biologically active vitamin D metabolite (193;194). In addition, estrogen upregulates expression
of the VDR in various animal tissues and human cell lines (195), and it is associated with
elevated circulations of DBP (196;197). Thus, estrogen appears to play an important role in
modulating vitamin D metabolism, but the clinical relevance of its effects on circulating vitamin
D metabolites is poorly understood.
To our knowledge, no other study has directly examined the association between vitamin D and
cardiometabolic disease biomarkers separately across women HC users, women HC non-users
and men. In the present study, while vitamin D was inversely associated with markers of
glycemic dysregulation in men and women HC non-users, no significant associations existed
between vitamin D and any cardiometabolic disease biomarkers among women HC users. The
use of HC is associated with decreased insulin sensitivity in healthy, non-obese young women,
although the potential mechanism remains unclear (204;337;345). Overall, the results of the
present study may suggest that, among those who use HC, the potential benefits of elevated
circulating vitamin D on glycemic regulation may be attenuated by the deleterious effects of HC
on this pathway (204;207). We recently reported a confounding effect of HC on the association
between 25(OH)D and CRP, a biomarker of systemic inflammation (331), as well as a similar
confounding effect of these medications on the relationship between 25(OH)D and the plasma
proteome (343). Along parallel lines, an examination of data from the Women's Health Initiative
trial found that estrogen-containing HRT modified the effect of vitamin D and calcium
supplementation on colorectal cancer (245), and these medications were found to attenuate an
inverse association between 25(OH)D and breast cancer in a large population of German post-
menopausal women (190). In the present study, we did observe a non-significant trend for
decreased concentrations of biomarkers of glycemic dysregulation in women HC users with
increasing vitamin D status, similar to the significant inverse associations seen in men and
women HC non-users. It is possible that, among women who use sex hormone-containing
medications, any beneficial effects of vitamin D may only be realized at concentrations of
25(OH)D higher than those observed in the present study. However, it is also important to note
that no statistical interaction existed between 25(OH)D and HC use for any biomarkers other
than triglycerides. Therefore, the lack of association between vitamin D and any biomarkers in
87
women HC users may have been due to the smaller sample size of this group. Future studies with
larger sample sizes are needed to further examine the potential effects of HC use on the
association between 25(OH)D and cardiometabolic disease.
The results of the present study corroborate previous findings showing that the prevalence of
vitamin D deficiency among young Canadians varies by ethnic group, with circulating 25(OH)D
being particularly low in South Asians (153;178). Indeed, nearly half of South Asians in our
study population were vitamin D-deficient (<30 nmol/L), compared to only 5% of Caucasians.
The lower 25(OH)D concentrations observed in South Asians are likely due to reduced
endogenous vitamin D synthesis that may be partly a result of having darker skin and/or adopting
a sun-avoiding lifestyle. Our data also support previous findings that seasonal effects on
25(OH)D are absent among South Asians (153), suggesting that endogenous vitamin D synthesis
from casual sun exposure in summer and fall is low in this group.
While we noted trends towards improved insulin sensitivity and pancreatic β-cell function with
higher vitamin D status in all ethnocultural groups, these associations were not statistically
significant in South Asians. The lack of statistical interaction between vitamin D and ethnicity
suggests that the smaller sample size and generally low 25(OH)D concentrations observed in the
South Asian group may have prevented identifying existing links between vitamin D status and
any cardiometabolic markers. Indeed, in a previous study, 25(OH)D partly explained differences
in insulin sensitivity between Caucasians and African Americans (182). Furthermore, a recent
intervention study found improvements in insulin sensitivity with vitamin D supplementation in
South Asian women (290).
We observed that triglycerides were associated with vitamin D status in men, with individuals in
the adequate status category having lower concentrations than those who were vitamin D
insufficient or deficient. We observed no association between vitamin D status and any other
marker of lipid metabolism in women or any ethnocultural group. Previous studies have reported
an inverse relationship between vitamin D and triglycerides, although the results have been
inconsistent (306;346). The underlying mechanism for the association between 25(OH)D and
triglycerides may involve vitamin D upregulation of lipoprotein lipase activity in fat cells,
leading to decreased circulating triglyceride concentrations (169). Our study population consists
of young adults, and it is possible that any potential deleterious effects of vitamin D deficiency
88
on triglycerides in women may manifest later in life. However, the present study is not designed
to determine whether the observed sex differences in the association between 25(OH)D and
triglycerides are biologically based or a result of unaccounted confounding.
Numerous recent studies have examined the association between vitamin D and markers of
cardiometabolic risk in both adults and children (29;87;239-241). However, the results are
inconsistent, possibly due to small sample sizes, differences in age, sex, ethnicity, and disease
status between the populations studied, and diverse environmental and lifestyle-related factors. A
strength of the present study is the ethnocultural diversity of the study population, which allowed
for assessing the association between 25(OH)D and cardiometabolic biomarkers across various
ethnic groups. In addition, circulating 25(OH)D is considered a better biomarker of vitamin D
status than dietary vitamin D intake, since 25(OH)D captures both endogenous and exogenous
sources of this micronutrient. Finally, assessing the relationship between 25(OH)D and
biomarkers of cardiometabolic risk in health young adults provides an opportunity to better
understand the potential role of this micronutrient in the early stages of cardiometabolic disease
development.
One limitation of the present study is the relatively low number of South Asian participants, as
well as women HC users. Although subjects were recruited from a university campus and may
not be representative of all young adults across Canada, our results corroborate those of a
previous study conducted in a similar population (153). We were unable to assess whether
estrogen or progesterone-derived HC components have different effects on the associations
examined here, and we also lacked information on endogenous sex hormone concentrations.
Finally, unaccounted genetic variation and residual confounding from unidentified factors, such
as time spent outdoors or use of sunscreen, may confound the results presented here.
In summary, the present study found that vitamin D status is inversely associated with
biomarkers of glycemic dysregulation in men and women HC non-users and certain ethnic
groups, but not in women HC users. Our results suggest that HC use among women may
attenuate the association between vitamin D and glycemic dysregulation, but future studies with
larger sample sizes are needed to further examine this potential relationship. Indeed, given the
widespread use of HC by women throughout the world, a better understanding of the extent to

89
which these medications may modify the relationship between vitamin D and processes related
to disease is warranted. In addition, we observed that the prevalence of vitamin D deficiency
varies greatly among young adults living in Canada, depending on ethnicity. Considering the
ethnocultural diversity of the Canadian population, further efforts should be directed to
characterizing the relationship between vitamin D and cardiometabolic disease risk and to
evaluate its preventive efficacy in various ethnic groups.

90
Chapter 5 : Plasma 25-hydroxyvitamin D, hormonal contraceptive use,
and the plasma proteome in Caucasian, East Asian, and South Asian
young adults
Adapted with permission from:
García-Bailo B, Jamnik J, Da Costa LA, Borchers CH, Badawi A, El-Sohemy A.
Plasma 25-hydroxyvitamin D, hormonal contraceptive use, and the plasma
proteome in Caucasian, East Asian, and South Asian young adults. J Proteome
Res. 2013. Feb;12(4):1797-1807. doi: 10.1021/pr4001042. Copyright (2013)
American Chemical Society.
91
5.1 Abstract
Background: Vitamin D affects gene expression, but its downstream effects on the proteome are
unclear. Hormonal contraceptives (HC), which affect vitamin D metabolism and have
widespread effects on the plasma proteome, may confound the association between vitamin D
and the proteome. We determined whether HC use modified the association between 25-
hydroxyvitamin D (25(OH)D) and a panel of 54 high-abundance plasma proteins.
Methods: Cross-sectional analyses were conducted in healthy, non-smoking women HC users
(n=216), women HC non-users (n=502), and men (n=301) from Toronto, Canada. Plasma
25(OH)D was measured by HPLC-MS/MS, and proteins were measured by LC-multiple-
reaction-monitoring (MRM)-MS.
Results: The 54 proteins clustered into four distinct proteomic profiles. A positive association
was observed between Profile 1, containing positive acute phase proteins, and 25(OH)D. In
women HC users, a J-shaped association existed between Profile 1 and 25(OH)D, but no
associations existed in women HC non-users and men. Twelve proteins were individually
associated with 25(OH)D in women HC users, but only two were associated with 25(OH)D in
women HC non-users and no associations were observed in men. After accounting for hormone
dose, only three proteins were associated with 25(OH)D.
Conclusions: In summary, HC use is an important confounder of the association between
circulating 25(OH)D and numerous plasma proteins.
92
5.2 Introduction
Cardiometabolic disease, including T2D and CVD, represents a global health problem (1).
Vitamin D has been examined extensively as a potentially preventive factor in the development
of cardiometabolic and other chronic diseases (151). However, as summarized by recent
systematic reviews, the evidence from epidemiologic studies and clinical trials is inconclusive
(35-37). The inconsistencies between studies may result not only from differences in
methodology, but also from a lack of adequate biomarkers, unaccounted confounding from
various demographic and lifestyle factors, and genetic differences both within and between
populations (38).
The protective actions of vitamin D on cardiometabolic disease are thought to occur through
modulation of physiologic processes that become dysregulated during disease progression, such
as inflammation and pancreatic β-cell function (26;32;272;290). Vitamin D, obtained through
cutaneous sunlight exposure or through the diet, is hydroxylated in the liver to 25(OH)D (121).
This metabolite is the most abundant circulating form of vitamin D, and it is the accepted
functional biomarker of vitamin D status (151). Conversion of 25(OH)D to 1,25(OH)2D, the
main biologically active form of the vitamin, occurs through hydroxylation in the kidney and
other target tissues (121). The latter form of vitamin D is a steroid hormone that affects both the
regulation of target gene transcription and the activation of various signal transduction pathways
when it binds to the VDR, a transcription factor with effects on numerous tissues (121).
Recent in vitro studies have examined vitamin D action across the genome, using gene
expression and chromatin immunoprecipitation techniques (27;145). Hundreds of target genes,
belonging mainly to immune and signaling pathways, have been identified, and many are known
to be associated with diseases such as type 1 diabetes, Crohn's disease, multiple sclerosis, and
colorectal cancer (27). However, it is not known whether the observed widespread effects of
vitamin D at the genome level in vitro translate into downstream effects at the level of the
proteome in vivo. Over 3,000 proteins have been identified in the human plasma proteome
(57;119). Among the most abundant, ranging in concentration between <1 and 800 μmol/L, are
many molecules of physiological importance, such as apolipoproteins, members of the
complement system, coagulation factors, carrier proteins, and protease inhibitors (57). Many of
these proteins are acute phase reactants whose levels become altered during inflammatory

93
processes, and they may represent important biomarkers of disease progression (59;120). A
recently developed LC-MS/MS-based, MRM proteomics assay can simultaneously measure the
concentrations of 54 high-abundance plasma proteins (120). The concentrations of these 54
proteins were found to differ across ethnic groups and individuals with different dietary intakes
(119).
Use of HC has been linked to elevated 25(OH)D concentrations (188;191). HC use by women is
common worldwide, not only to prevent unwanted pregnancies, but also to treat a number of
dermatological and gynecological conditions (204;205). At the same time, these medications are
associated with elevated risk of CVD and impaired glucose tolerance (204;208). Furthermore, we
recently reported a widespread effect of HC use on the plasma proteome (207). Therefore, HC
use may have significant effects on the relationship between vitamin D and numerous diseases.
Determining whether vitamin D modulates the concentrations of plasma proteomic biomarkers,
and understanding whether HC use modifies the association between vitamin D and the plasma
proteome, may help identify novel pathways affected by this micronutrient, as well as elucidate
some of the inconsistencies between studies on the relationship between vitamin D and
cardiometabolic disease. The objective of this study was to examine the association between
25(OH)D and plasma proteomic biomarkers in young adults of Caucasian, East Asian, and South
Asian ancestry, and to determine whether HC use modifies this association.
5.3 Methods
5.3.1 Study Design and Participants
The individuals included in this study (n=1,019) were healthy, non-smoking women HC users
(n=216), women HC non-users (n=502), and men (n=301) who, at the time that the study was
conducted, had available measurements for 25(OH)D, the proteomics assay, and each of the
covariates considered in the analyses. Individuals of Aboriginal Canadian, Afro-Caribbean, or
mixed ancestry were excluded from the analyses reported here because of insufficient sample
size to make adequately powered comparisons. For more details on the TNH study population,
recruitment, exclusions, and classification into ethnic groups and seasons, please refer to Chapter
2, Section 2.3.1.
94
5.3.2 Anthropometrics and Physical Activity
Please refer to Chapter 2, Section 2.3.2.
5.3.3 Hormonal Contraceptive Use
Please refer to Chapter 2, Section 2.3.4.
5.3.4 Biochemical and 25(OH)D Measurements
For details on fasting blood collection and how 25(OH)D was measured, please refer to Chapter
2, Section 2.3.5.
For details on how vitamin D status categories were created, please refer to Chapter 4, Section
4.3.4.
5.3.5 Plasma Proteomic Measurements
The concentrations of high-abundance plasma proteins were measured at the University of
Victoria – Genome British Columbia Proteomics Centre (Victoria, BC, Canada), using a MS-
MRM assay as described previously (59;119;120;207). In brief, the assay involves quantifying
proteins against stable isotope labelled standard proteotypic peptides, representative of
endogenous proteins, that are added to tryptic digests of plasma samples. The protein
concentration measurements obtained with this MS-MRM assay are comparable to reported
values (57). The original assay was able to measure 45 proteins (120). Since being developed,
the list of measurable proteins has expanded to a total of 63. Of the 63 proteins included in the
assay, the present study assessed 54 proteins that had inter-assay coefficients of variation of
<15%, as previously described (119).
5.3.6 Statistical Analysis
All statistical analyses were performed using SAS. Subject characteristics across the four vitamin
D status categories were compared using χ2 tests and ANOVA. Continuous variables that were
not normally distributed were loge- or square root-transformed prior to analysis. Except where
indicated, the p-values from models using the transformed values of these variables are reported,
but untransformed means and measures of spread are reported to facilitate interpretability.

95
Principal components analysis was used to identify principal components representative of
independent plasma proteomic profiles, based on the concentrations of the 54 proteins included
in the proteomics assay, as described previously (119). The principal components representative
of the proteomic profiles were obtained through orthogonal rotation with the Varimax rotation,
which provided a component structure with independent patterns (347). Components were
chosen using the consideration parameters of eigenvalues >1 and the Scree test. Each protein
received a loading score for each one of the identified components, which was representative of
the degree of correlation of that protein with that principal component. A loading score criterion
of ≥0.5 was used to determine inclusion of a given protein into a specific component,
representative of specific proteomic profiles.
In the present study, we examined the association between each of the identified proteomic
profiles and circulating 25(OH)D using ANCOVA, first in the population as a whole and then
separately in women HC users, women HC non-users, and men. The covariates included in the
models were age, waist circumference, physical activity, season, ethnicity, and, in the analysis
for the whole population, sex and HC use as well. These analyses allowed us to identify groups
of proteins to explore further.
When a significant association between a specific proteomic profile and 25(OH)D was observed
in any group, we then examined the association between each individual protein included in that
profile and 25(OH)D separately among women HC users, HC non-users, and men, so as to better
characterize the individual relationships between these proteins and vitamin D across groups.
ANCOVA was conducted in each group with age, waist circumference, physical activity, season,
and ethnicity as covariates. In consideration of the large number of individual tests conducted,
these analyses were adjusted for multiple testing using the Bonferroni correction.
In women HC users, we examined the association between proteins identified in previous
analyses and 25(OH)D separately among those taking <1mg (n= 132) vs. ≥1mg (n= 46) daily
total hormone, in order to assess the potential role of hormone dose in the relationship between
vitamin D and plasma proteins. Thirty-eight subjects were excluded from the analyses because
the self-reported type of HC made ascertainment of daily hormonal dose difficult, as described
previously (207). The association between each of the identified proteins and 25(OH)D was
examined separately in users of <1mg vs. ≥1mg total hormone per day, using ANCOVA
96
adjusted for age, waist circumference, physical activity, season, and ethnicity. As before, these
analyses were adjusted for multiple testing using the Bonferroni correction.
5.4 Results
Study participant characteristics are shown in Table 5.1. We observed significant differences in
the distribution of vitamin D status between men and women and across ethnic groups, with
more women and Caucasians being represented in the optimal category of vitamin D and more
men and East and South Asians being vitamin D deficient. Physical activity levels were higher
among those with adequate or optimal vitamin D status than those who were vitamin D
insufficient or deficient. Use of HC differed across vitamin D status categories, with a higher
proportion of women reporting use of contraceptives in the optimal vitamin D status category
than the other categories. Finally, we also observed significant differences in the distribution of
vitamin D status by season, with a greater proportion of individuals being vitamin D deficient in
winter and spring than in summer and fall.
The 54 plasma proteins clustered into four main proteomic profiles. The proteins included in
each profile are listed in Table 5.2. In brief, profile 1 included primarily positive acute phase
proteins with roles in various physiological systems, such as hemostasis, lipid metabolism, signal
transduction, and transmembrane transport (119;348). Profile 2 consisted of several negative
acute phase proteins also involved in various physiological processes (119;348). Profile 3
comprised proteins involved in innate immunity and regulation of the complement cascade
(119;348). Finally, profile 4 included proteins involved exclusively in coagulation (119;348).
While most proteins loaded onto a single proteomic profile, four proteins (clusterin, α2-
antiplasmin, apolipoprotein C-I, and complement C-3) had loading scores ≥0.5 for two
proteomic profiles and, therefore, were included in both. Four proteins (α1B-glycoprotein, zinc-
α2-glycoprotein, apolipoprotein D, and adiponectin) did not load significantly onto any principal
component and, therefore, were not included in any.
We examined the association between 25(OH)D and each proteomic profile first in the
population as a whole, and then separately in women HC users, women HC non-users, and men
(Figure 5.1). In the overall population, profile 1 was positively associated with 25(OH)D, with
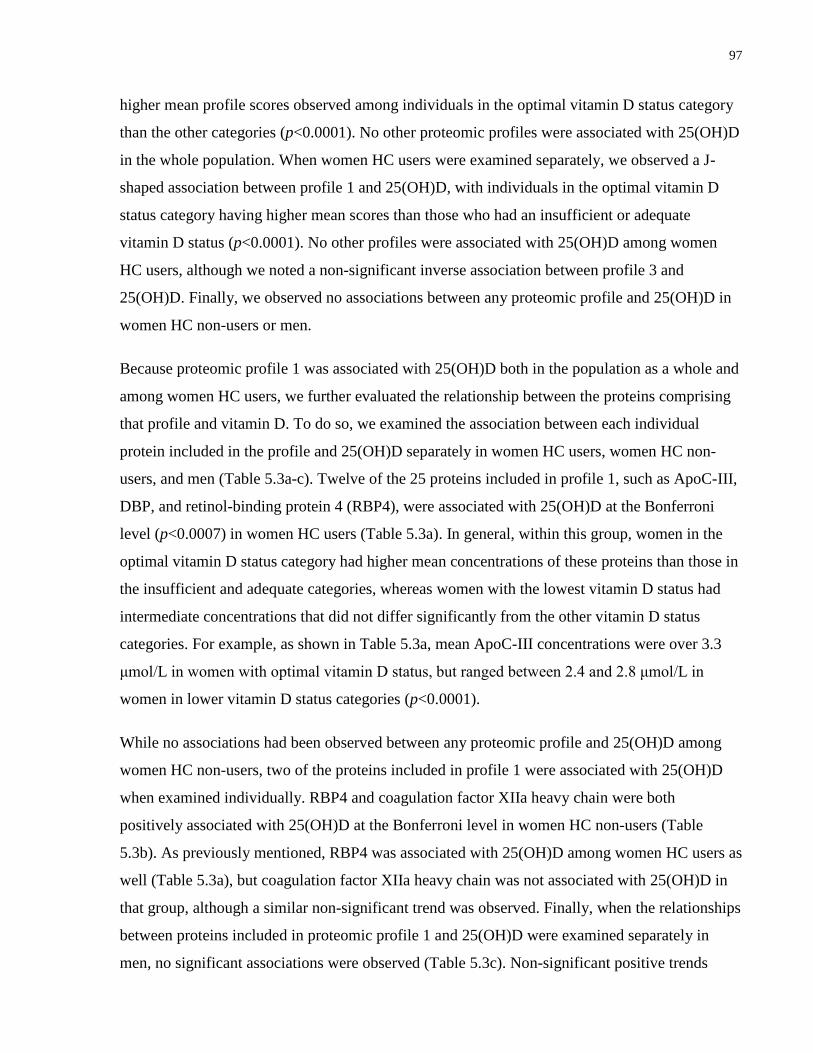
97
higher mean profile scores observed among individuals in the optimal vitamin D status category
than the other categories (p<0.0001). No other proteomic profiles were associated with 25(OH)D
in the whole population. When women HC users were examined separately, we observed a J-
shaped association between profile 1 and 25(OH)D, with individuals in the optimal vitamin D
status category having higher mean scores than those who had an insufficient or adequate
vitamin D status (p<0.0001). No other profiles were associated with 25(OH)D among women
HC users, although we noted a non-significant inverse association between profile 3 and
25(OH)D. Finally, we observed no associations between any proteomic profile and 25(OH)D in
women HC non-users or men.
Because proteomic profile 1 was associated with 25(OH)D both in the population as a whole and
among women HC users, we further evaluated the relationship between the proteins comprising
that profile and vitamin D. To do so, we examined the association between each individual
protein included in the profile and 25(OH)D separately in women HC users, women HC non-
users, and men (Table 5.3a-c). Twelve of the 25 proteins included in profile 1, such as ApoC-III,
DBP, and retinol-binding protein 4 (RBP4), were associated with 25(OH)D at the Bonferroni
level (p<0.0007) in women HC users (Table 5.3a). In general, within this group, women in the
optimal vitamin D status category had higher mean concentrations of these proteins than those in
the insufficient and adequate categories, whereas women with the lowest vitamin D status had
intermediate concentrations that did not differ significantly from the other vitamin D status
categories. For example, as shown in Table 5.3a, mean ApoC-III concentrations were over 3.3
μmol/L in women with optimal vitamin D status, but ranged between 2.4 and 2.8 μmol/L in
women in lower vitamin D status categories (p<0.0001).
While no associations had been observed between any proteomic profile and 25(OH)D among
women HC non-users, two of the proteins included in profile 1 were associated with 25(OH)D
when examined individually. RBP4 and coagulation factor XIIa heavy chain were both
positively associated with 25(OH)D at the Bonferroni level in women HC non-users (Table
5.3b). As previously mentioned, RBP4 was associated with 25(OH)D among women HC users as
well (Table 5.3a), but coagulation factor XIIa heavy chain was not associated with 25(OH)D in
that group, although a similar non-significant trend was observed. Finally, when the relationships
between proteins included in proteomic profile 1 and 25(OH)D were examined separately in
men, no significant associations were observed (Table 5.3c). Non-significant positive trends
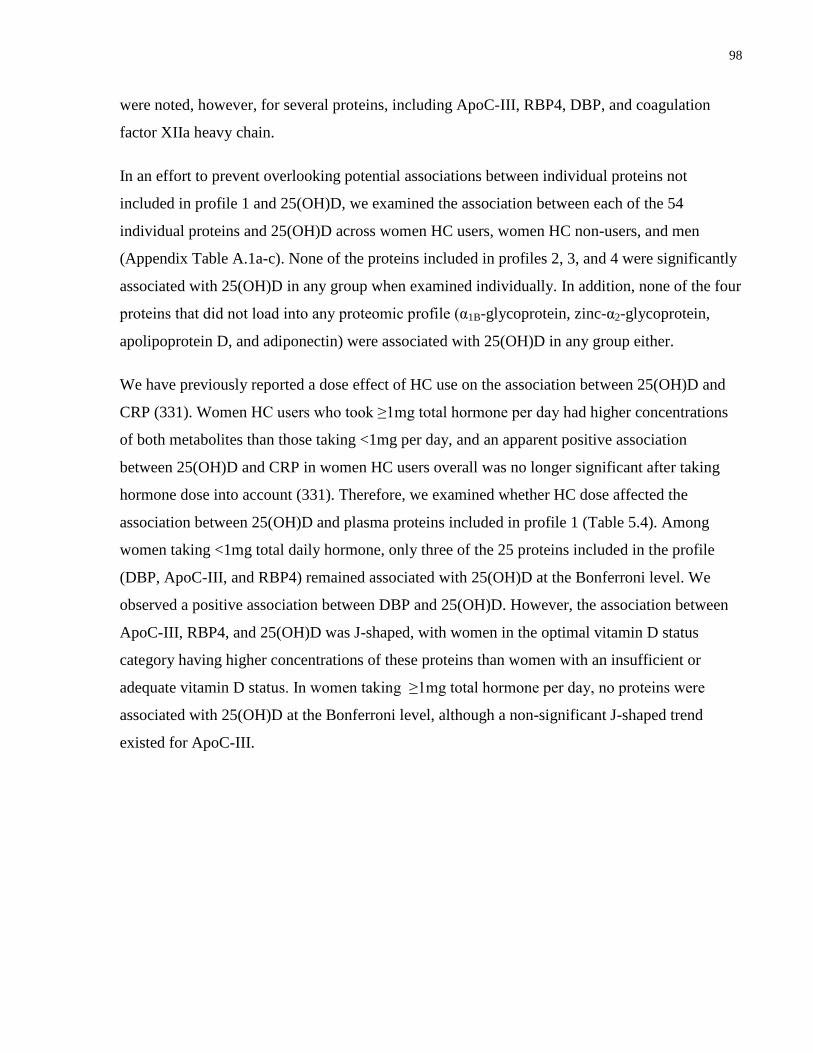
98
were noted, however, for several proteins, including ApoC-III, RBP4, DBP, and coagulation
factor XIIa heavy chain.
In an effort to prevent overlooking potential associations between individual proteins not
included in profile 1 and 25(OH)D, we examined the association between each of the 54
individual proteins and 25(OH)D across women HC users, women HC non-users, and men
(Appendix Table A.1a-c). None of the proteins included in profiles 2, 3, and 4 were significantly
associated with 25(OH)D in any group when examined individually. In addition, none of the four
proteins that did not load into any proteomic profile (α1B-glycoprotein, zinc-α2-glycoprotein,
apolipoprotein D, and adiponectin) were associated with 25(OH)D in any group either.
We have previously reported a dose effect of HC use on the association between 25(OH)D and
CRP (331). Women HC users who took ≥1mg total hormone per day had higher concentrations
of both metabolites than those taking <1mg per day, and an apparent positive association
between 25(OH)D and CRP in women HC users overall was no longer significant after taking
hormone dose into account (331). Therefore, we examined whether HC dose affected the
association between 25(OH)D and plasma proteins included in profile 1 (Table 5.4). Among
women taking <1mg total daily hormone, only three of the 25 proteins included in the profile
(DBP, ApoC-III, and RBP4) remained associated with 25(OH)D at the Bonferroni level. We
observed a positive association between DBP and 25(OH)D. However, the association between
ApoC-III, RBP4, and 25(OH)D was J-shaped, with women in the optimal vitamin D status
category having higher concentrations of these proteins than women with an insufficient or
adequate vitamin D status. In women taking ≥1mg total hormone per day, no proteins were
associated with 25(OH)D at the Bonferroni level, although a non-significant J-shaped trend
existed for ApoC-III.
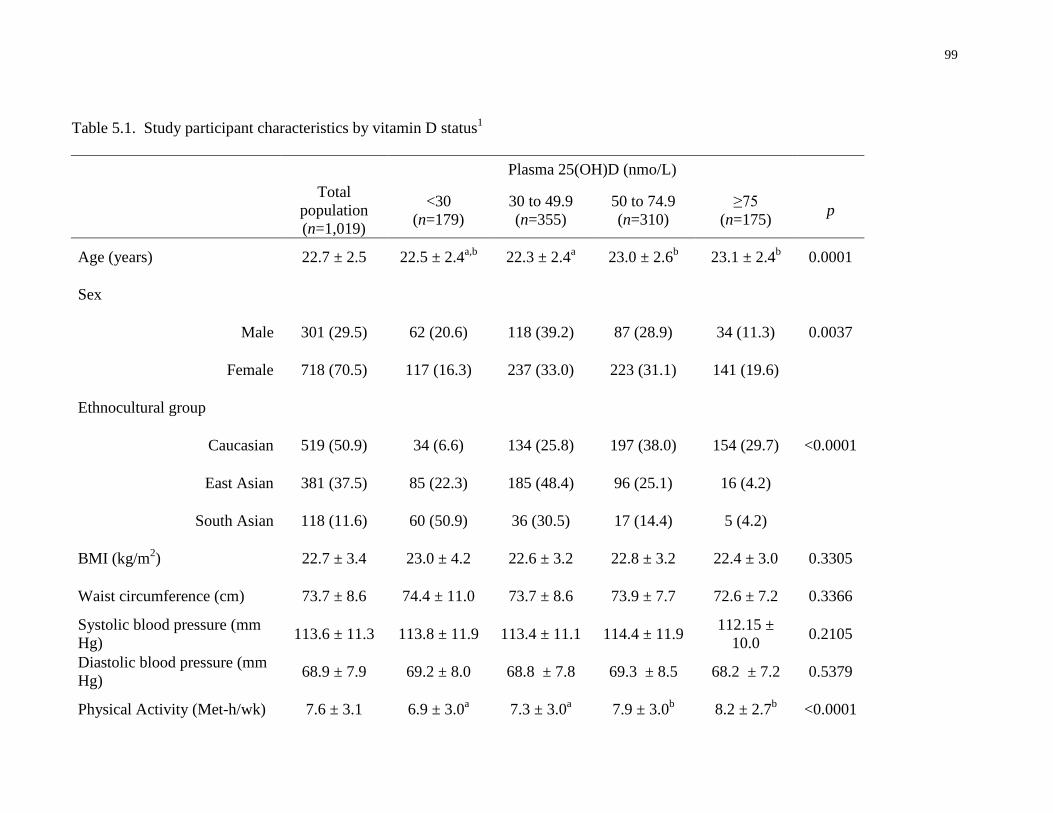
99
Table 5.1. Study participant characteristics by vitamin D status1
Plasma 25(OH)D (nmo/L)
Total
population
(n=1,019)
<30
(n=179)
30 to 49.9
(n=355)
50 to 74.9
(n=310)
≥75
(n=175) p
Age (years) 22.7 ± 2.5 22.5 ± 2.4a,b
22.3 ± 2.4a 23.0 ± 2.6
b 23.1 ± 2.4
b 0.0001
Sex
Male 301 (29.5) 62 (20.6) 118 (39.2) 87 (28.9) 34 (11.3) 0.0037
Female 718 (70.5) 117 (16.3) 237 (33.0) 223 (31.1) 141 (19.6)
Ethnocultural group
Caucasian 519 (50.9) 34 (6.6) 134 (25.8) 197 (38.0) 154 (29.7) <0.0001
East Asian 381 (37.5) 85 (22.3) 185 (48.4) 96 (25.1) 16 (4.2)
South Asian 118 (11.6) 60 (50.9) 36 (30.5) 17 (14.4) 5 (4.2)
BMI (kg/m2) 22.7 ± 3.4 23.0 ± 4.2 22.6 ± 3.2 22.8 ± 3.2 22.4 ± 3.0 0.3305
Waist circumference (cm) 73.7 ± 8.6 74.4 ± 11.0 73.7 ± 8.6 73.9 ± 7.7 72.6 ± 7.2 0.3366
Systolic blood pressure (mm
Hg) 113.6 ± 11.3 113.8 ± 11.9 113.4 ± 11.1 114.4 ± 11.9
112.15 ±
10.0 0.2105
Diastolic blood pressure (mm
Hg) 68.9 ± 7.9 69.2 ± 8.0 68.8 ± 7.8 69.3 ± 8.5 68.2 ± 7.2 0.5379
Physical Activity (Met-h/wk) 7.6 ± 3.1 6.9 ± 3.0a 7.3 ± 3.0
a 7.9 ± 3.0
b 8.2 ± 2.7
b <0.0001
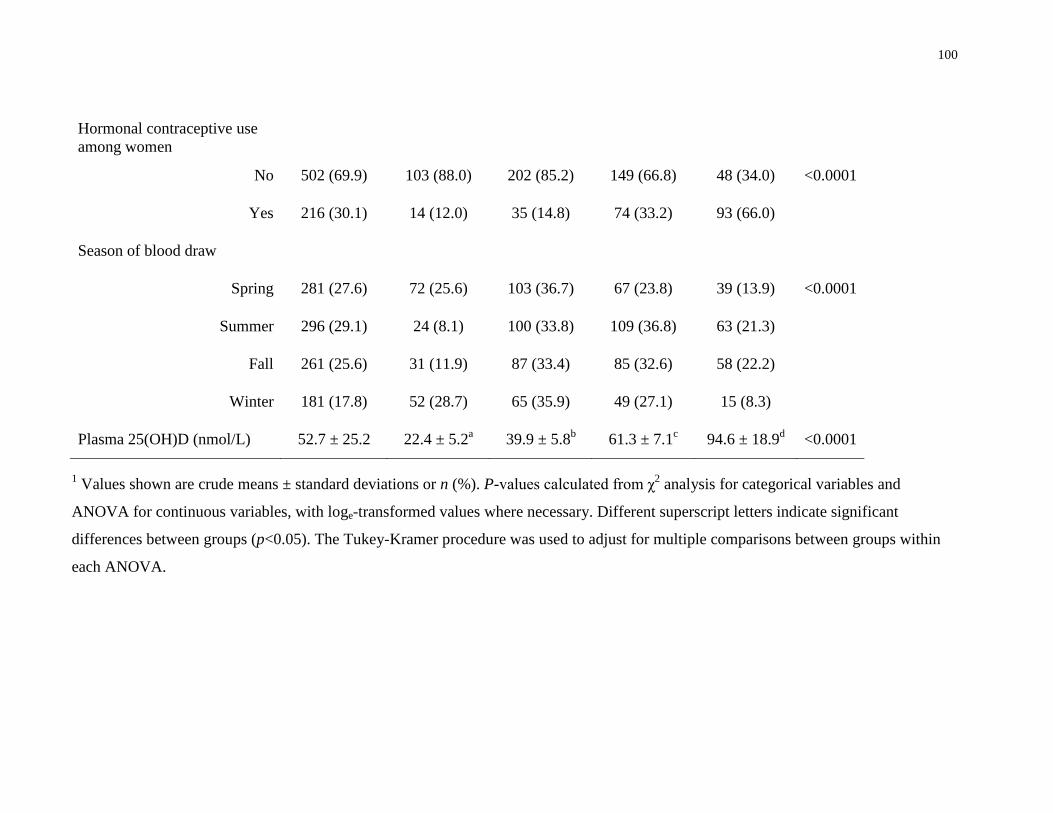
100
Hormonal contraceptive use
among women
No 502 (69.9) 103 (88.0) 202 (85.2) 149 (66.8) 48 (34.0) <0.0001
Yes 216 (30.1) 14 (12.0) 35 (14.8) 74 (33.2) 93 (66.0)
Season of blood draw
Spring 281 (27.6) 72 (25.6) 103 (36.7) 67 (23.8) 39 (13.9) <0.0001
Summer 296 (29.1) 24 (8.1) 100 (33.8) 109 (36.8) 63 (21.3)
Fall 261 (25.6) 31 (11.9) 87 (33.4) 85 (32.6) 58 (22.2)
Winter 181 (17.8) 52 (28.7) 65 (35.9) 49 (27.1) 15 (8.3)
Plasma 25(OH)D (nmol/L) 52.7 ± 25.2 22.4 ± 5.2a 39.9 ± 5.8
b 61.3 ± 7.1
c 94.6 ± 18.9
d <0.0001
1 Values shown are crude means ± standard deviations or n (%). P-values calculated from χ
2 analysis for categorical variables and
ANOVA for continuous variables, with loge-transformed values where necessary. Different superscript letters indicate significant
differences between groups (p<0.05). The Tukey-Kramer procedure was used to adjust for multiple comparisons between groups within
each ANOVA.
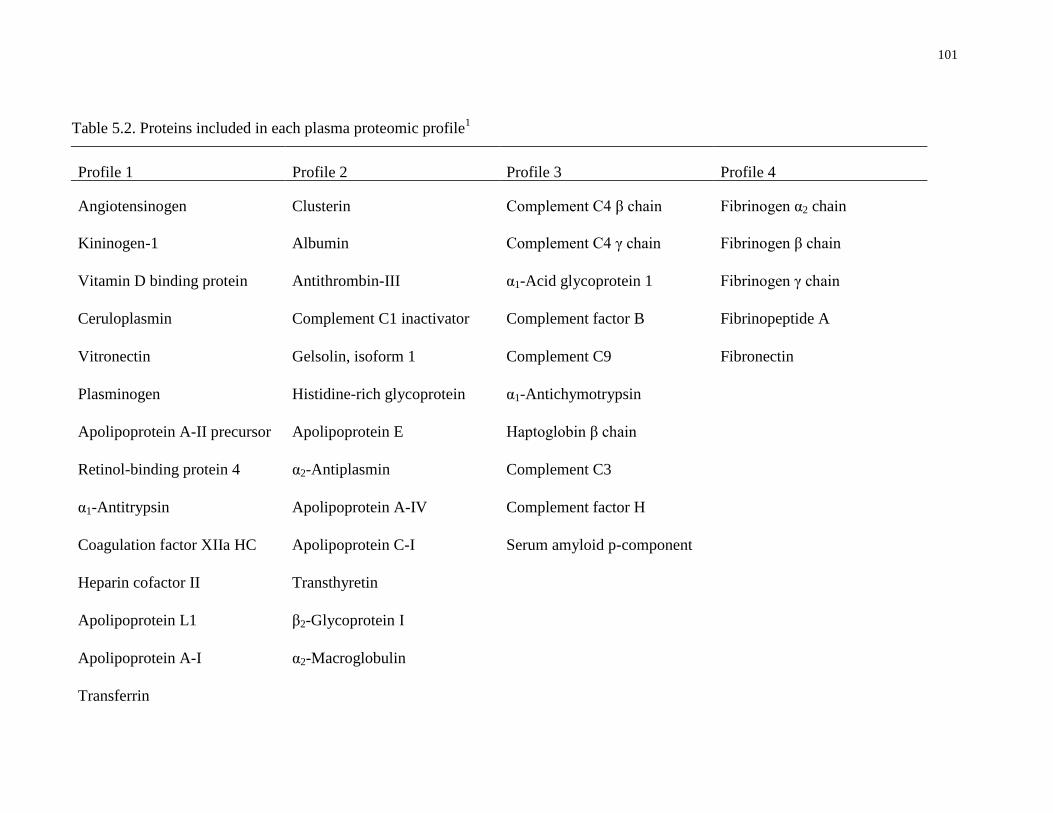
101
Table 5.2. Proteins included in each plasma proteomic profile1
Profile 1 Profile 2 Profile 3 Profile 4
Angiotensinogen Clusterin Complement C4 β chain Fibrinogen α2 chain
Kininogen-1 Albumin Complement C4 γ chain Fibrinogen β chain
Vitamin D binding protein Antithrombin-III α1-Acid glycoprotein 1 Fibrinogen γ chain
Ceruloplasmin Complement C1 inactivator Complement factor B Fibrinopeptide A
Vitronectin Gelsolin, isoform 1 Complement C9 Fibronectin
Plasminogen Histidine-rich glycoprotein α1-Antichymotrypsin
Apolipoprotein A-II precursor Apolipoprotein E Haptoglobin β chain
Retinol-binding protein 4 α2-Antiplasmin Complement C3
α1-Antitrypsin Apolipoprotein A-IV Complement factor H
Coagulation factor XIIa HC Apolipoprotein C-I Serum amyloid p-component
Heparin cofactor II Transthyretin
Apolipoprotein L1 β2-Glycoprotein I
Apolipoprotein A-I α2-Macroglobulin
Transferrin
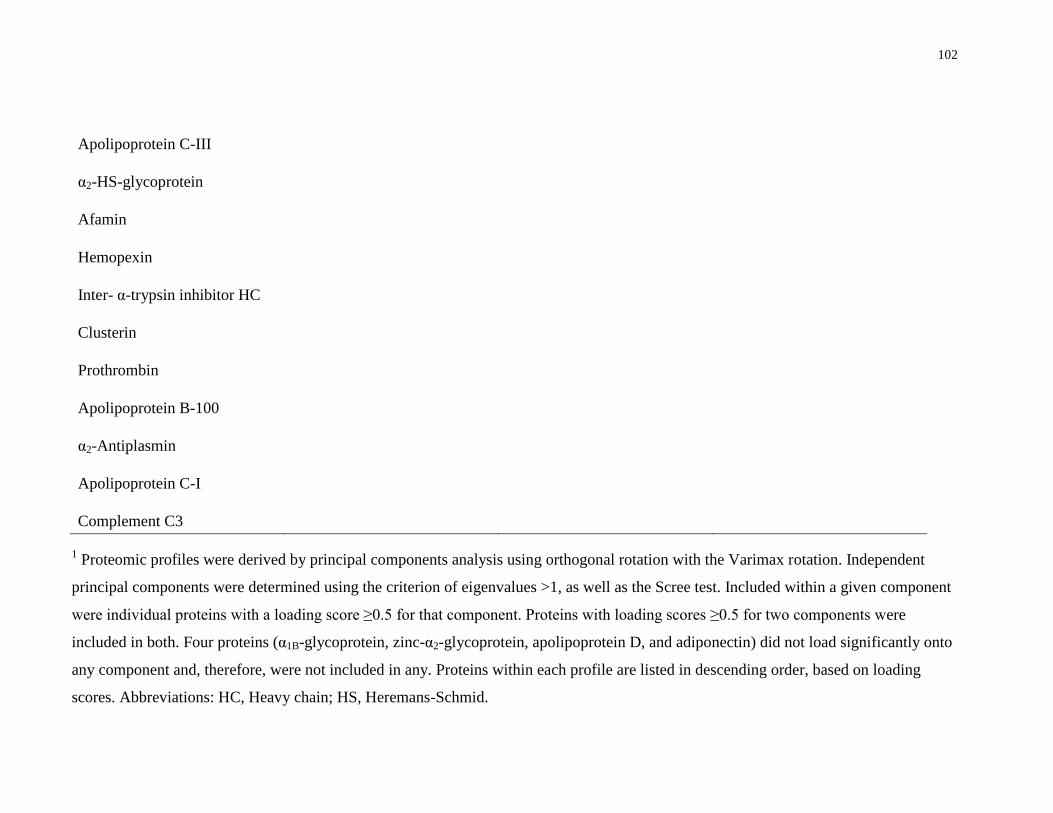
102
Apolipoprotein C-III
α2-HS-glycoprotein
Afamin
Hemopexin
Inter- α-trypsin inhibitor HC
Clusterin
Prothrombin
Apolipoprotein B-100
α2-Antiplasmin
Apolipoprotein C-I
Complement C3
1 Proteomic profiles were derived by principal components analysis using orthogonal rotation with the Varimax rotation. Independent
principal components were determined using the criterion of eigenvalues >1, as well as the Scree test. Included within a given component
were individual proteins with a loading score ≥0.5 for that component. Proteins with loading scores ≥0.5 for two components were
included in both. Four proteins (α1B-glycoprotein, zinc-α2-glycoprotein, apolipoprotein D, and adiponectin) did not load significantly onto
any component and, therefore, were not included in any. Proteins within each profile are listed in descending order, based on loading
scores. Abbreviations: HC, Heavy chain; HS, Heremans-Schmid.
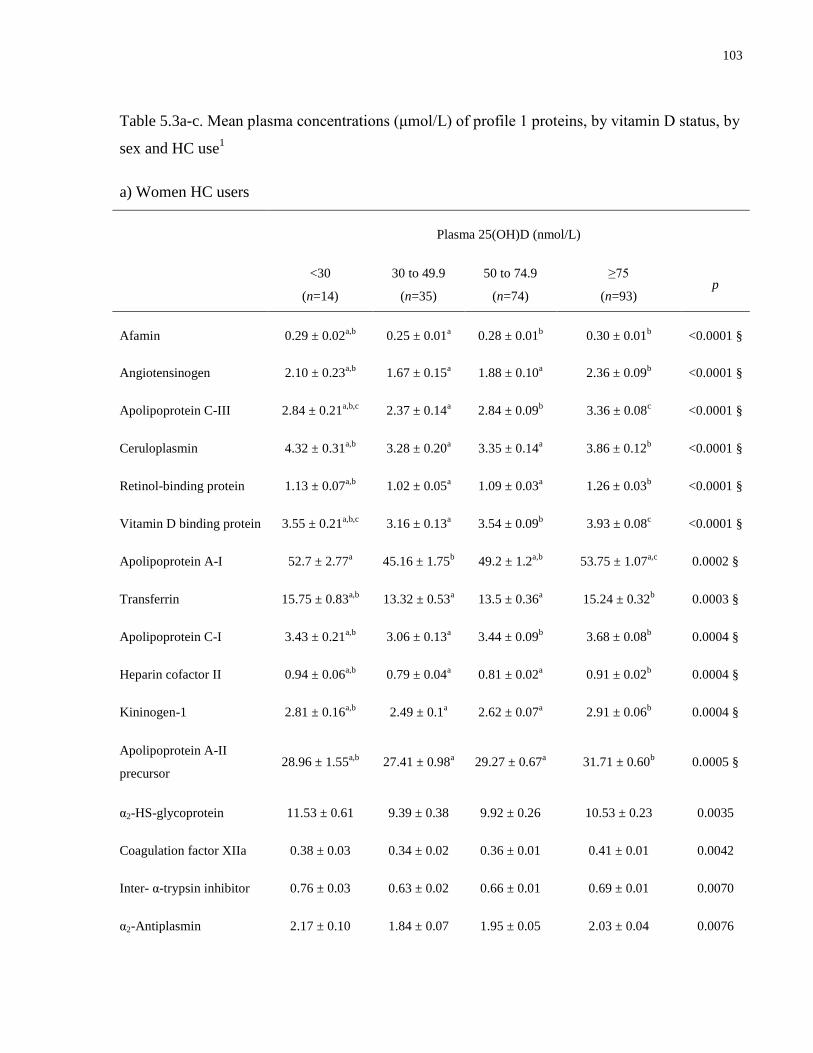
103
Table 5.3a-c. Mean plasma concentrations (μmol/L) of profile 1 proteins, by vitamin D status, by
sex and HC use1
a) Women HC users
Plasma 25(OH)D (nmol/L)
<30
(n=14)
30 to 49.9
(n=35)
50 to 74.9
(n=74)
≥75
(n=93) p
Afamin 0.29 ± 0.02a,b
0.25 ± 0.01a 0.28 ± 0.01
b 0.30 ± 0.01
b <0.0001 §
Angiotensinogen 2.10 ± 0.23a,b
1.67 ± 0.15a 1.88 ± 0.10
a 2.36 ± 0.09
b <0.0001 §
Apolipoprotein C-III 2.84 ± 0.21a,b,c
2.37 ± 0.14a 2.84 ± 0.09
b 3.36 ± 0.08
c <0.0001 §
Ceruloplasmin 4.32 ± 0.31a,b
3.28 ± 0.20a 3.35 ± 0.14
a 3.86 ± 0.12
b <0.0001 §
Retinol-binding protein 1.13 ± 0.07a,b
1.02 ± 0.05a 1.09 ± 0.03
a 1.26 ± 0.03
b <0.0001 §
Vitamin D binding protein 3.55 ± 0.21a,b,c
3.16 ± 0.13a 3.54 ± 0.09
b 3.93 ± 0.08
c <0.0001 §
Apolipoprotein A-I 52.7 ± 2.77a 45.16 ± 1.75
b 49.2 ± 1.2
a,b 53.75 ± 1.07
a,c 0.0002 §
Transferrin 15.75 ± 0.83a,b
13.32 ± 0.53a 13.5 ± 0.36
a 15.24 ± 0.32
b 0.0003 §
Apolipoprotein C-I 3.43 ± 0.21a,b
3.06 ± 0.13a 3.44 ± 0.09
b 3.68 ± 0.08
b 0.0004 §
Heparin cofactor II 0.94 ± 0.06a,b
0.79 ± 0.04a 0.81 ± 0.02
a 0.91 ± 0.02
b 0.0004 §
Kininogen-1 2.81 ± 0.16a,b
2.49 ± 0.1a 2.62 ± 0.07
a 2.91 ± 0.06
b 0.0004 §
Apolipoprotein A-II
precursor 28.96 ± 1.55
a,b 27.41 ± 0.98
a 29.27 ± 0.67
a 31.71 ± 0.60
b 0.0005 §
α2-HS-glycoprotein 11.53 ± 0.61 9.39 ± 0.38 9.92 ± 0.26 10.53 ± 0.23 0.0035
Coagulation factor XIIa
HC
0.38 ± 0.03 0.34 ± 0.02 0.36 ± 0.01 0.41 ± 0.01 0.0042
Inter- α-trypsin inhibitor
HC
0.76 ± 0.03 0.63 ± 0.02 0.66 ± 0.01 0.69 ± 0.01 0.0070
α2-Antiplasmin 2.17 ± 0.10 1.84 ± 0.07 1.95 ± 0.05 2.03 ± 0.04 0.0076
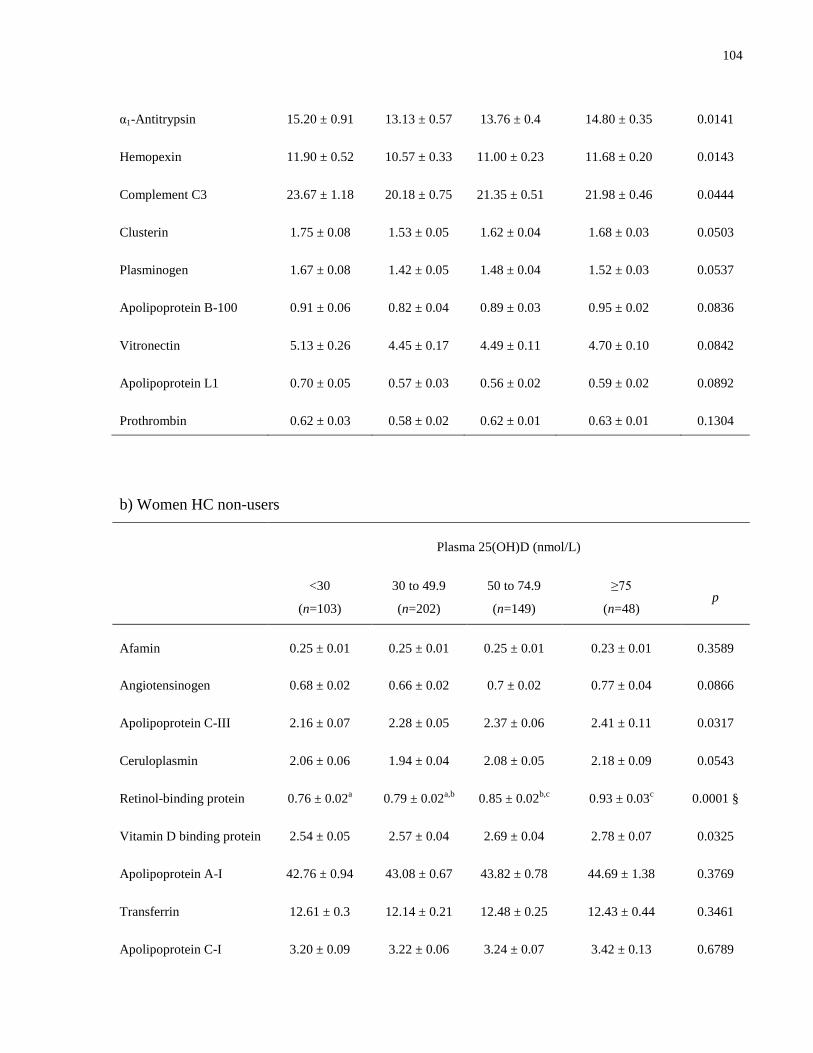
104
α1-Antitrypsin 15.20 ± 0.91 13.13 ± 0.57 13.76 ± 0.4 14.80 ± 0.35 0.0141
Hemopexin 11.90 ± 0.52 10.57 ± 0.33 11.00 ± 0.23 11.68 ± 0.20 0.0143
Complement C3 23.67 ± 1.18 20.18 ± 0.75 21.35 ± 0.51 21.98 ± 0.46 0.0444
Clusterin 1.75 ± 0.08 1.53 ± 0.05 1.62 ± 0.04 1.68 ± 0.03 0.0503
Plasminogen 1.67 ± 0.08 1.42 ± 0.05 1.48 ± 0.04 1.52 ± 0.03 0.0537
Apolipoprotein B-100 0.91 ± 0.06 0.82 ± 0.04 0.89 ± 0.03 0.95 ± 0.02 0.0836
Vitronectin 5.13 ± 0.26 4.45 ± 0.17 4.49 ± 0.11 4.70 ± 0.10 0.0842
Apolipoprotein L1 0.70 ± 0.05 0.57 ± 0.03 0.56 ± 0.02 0.59 ± 0.02 0.0892
Prothrombin 0.62 ± 0.03 0.58 ± 0.02 0.62 ± 0.01 0.63 ± 0.01 0.1304
b) Women HC non-users
Plasma 25(OH)D (nmol/L)
<30
(n=103)
30 to 49.9
(n=202)
50 to 74.9
(n=149)
≥75
(n=48) p
Afamin 0.25 ± 0.01 0.25 ± 0.01 0.25 ± 0.01 0.23 ± 0.01 0.3589
Angiotensinogen 0.68 ± 0.02 0.66 ± 0.02 0.7 ± 0.02 0.77 ± 0.04 0.0866
Apolipoprotein C-III 2.16 ± 0.07 2.28 ± 0.05 2.37 ± 0.06 2.41 ± 0.11 0.0317
Ceruloplasmin 2.06 ± 0.06 1.94 ± 0.04 2.08 ± 0.05 2.18 ± 0.09 0.0543
Retinol-binding protein 0.76 ± 0.02a 0.79 ± 0.02
a,b 0.85 ± 0.02
b,c 0.93 ± 0.03
c 0.0001 §
Vitamin D binding protein 2.54 ± 0.05 2.57 ± 0.04 2.69 ± 0.04 2.78 ± 0.07 0.0325
Apolipoprotein A-I 42.76 ± 0.94 43.08 ± 0.67 43.82 ± 0.78 44.69 ± 1.38 0.3769
Transferrin 12.61 ± 0.3 12.14 ± 0.21 12.48 ± 0.25 12.43 ± 0.44 0.3461
Apolipoprotein C-I 3.20 ± 0.09 3.22 ± 0.06 3.24 ± 0.07 3.42 ± 0.13 0.6789

105
Heparin cofactor II 0.67 ± 0.02 0.65 ± 0.01 0.67 ± 0.01 0.67 ± 0.03 0.6493
Kininogen-1 2.00 ± 0.04 1.95 ± 0.03 2.03 ± 0.03 2.09 ± 0.06 0.3359
Apolipoprotein A-II
precursor 23.58 ± 0.50 23.38 ± 0.35 23.87 ± 0.41 23.69 ± 0.73 0.9470
α2-HS-glycoprotein 8.74 ± 0.19 8.31 ± 0.13 8.45 ± 0.16 8.17 ± 0.28 0.1236
Coagulation factor XIIa
HC
0.21 ± 0.01a 0.21 ± 0.01
a 0.26 ± 0.01
b 0.27 ± 0.01
b <0.0001 §
Inter- α-trypsin inhibitor
HC
0.62 ± 0.01 0.61 ± 0.01 0.61 ± 0.01 0.61 ± 0.02 0.7522
α2-Antiplasmin 1.96 ± 0.04 1.89 ± 0.03 1.94 ± 0.04 1.93 ± 0.06 0.4369
α1-Antitrypsin 10.90 ± 0.22 10.16 ± 0.16 10.38 ± 0.19 10.58 ± 0.33 0.0290
Hemopexin 10.30 ± 0.22 9.73 ± 0.16 10.35 ± 0.18 10.22 ± 0.32 0.0348
Complement C3 19.13 ± 0.46 18.42 ± 0.33 19.01 ± 0.38 18.25 ± 0.67 0.1247
Clusterin 1.49 ± 0.03 1.49 ± 0.02 1.52 ± 0.03 1.54 ± 0.05 0.5858
Plasminogen 1.18 ± 0.02 1.16 ± 0.02 1.16 ± 0.02 1.19 ± 0.03 0.6600
Apolipoprotein B-100 0.78 ± 0.02 0.77 ± 0.02 0.77 ± 0.02 0.75 ± 0.03 0.8373
Vitronectin 3.66 ± 0.07 3.49 ± 0.05 3.54 ± 0.06 3.41 ± 0.1 0.0412
Apolipoprotein L1 0.35 ± 0.01 0.35 ± 0.01 0.36 ± 0.01 0.36 ± 0.02 0.9893
Prothrombin 0.58 ± 0.01 0.57 ± 0.01 0.57 ± 0.01 0.55 ± 0.02 0.3779
c) Men
Plasma 25(OH)D (nmol/L)
<30
(n=62)
30 to 49.9
(n=118)
50 to 74.9
(n=87)
≥75
(n=34) p
Afamin 0.26 ± 0.01 0.25 ± 0.01 0.24 ± 0.01 0.23 ± 0.01 0.0603
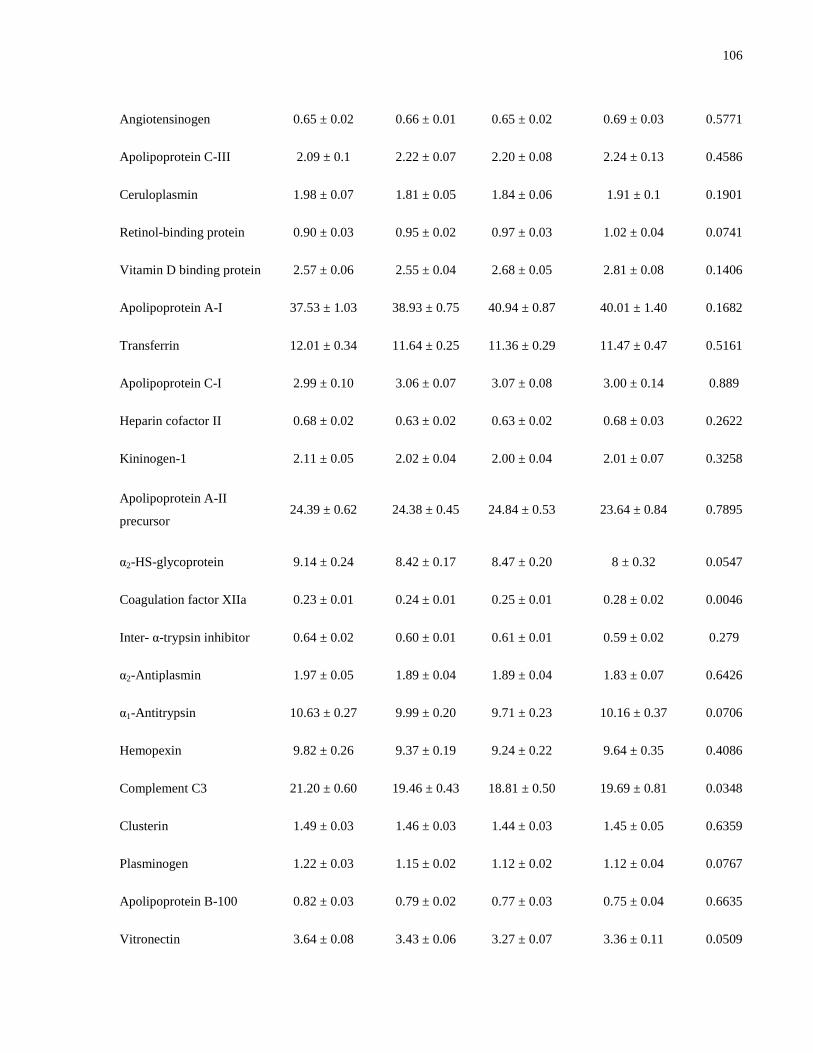
106
Angiotensinogen 0.65 ± 0.02 0.66 ± 0.01 0.65 ± 0.02 0.69 ± 0.03 0.5771
Apolipoprotein C-III 2.09 ± 0.1 2.22 ± 0.07 2.20 ± 0.08 2.24 ± 0.13 0.4586
Ceruloplasmin 1.98 ± 0.07 1.81 ± 0.05 1.84 ± 0.06 1.91 ± 0.1 0.1901
Retinol-binding protein 0.90 ± 0.03 0.95 ± 0.02 0.97 ± 0.03 1.02 ± 0.04 0.0741
Vitamin D binding protein 2.57 ± 0.06 2.55 ± 0.04 2.68 ± 0.05 2.81 ± 0.08 0.1406
Apolipoprotein A-I 37.53 ± 1.03 38.93 ± 0.75 40.94 ± 0.87 40.01 ± 1.40 0.1682
Transferrin 12.01 ± 0.34 11.64 ± 0.25 11.36 ± 0.29 11.47 ± 0.47 0.5161
Apolipoprotein C-I 2.99 ± 0.10 3.06 ± 0.07 3.07 ± 0.08 3.00 ± 0.14 0.889
Heparin cofactor II 0.68 ± 0.02 0.63 ± 0.02 0.63 ± 0.02 0.68 ± 0.03 0.2622
Kininogen-1 2.11 ± 0.05 2.02 ± 0.04 2.00 ± 0.04 2.01 ± 0.07 0.3258
Apolipoprotein A-II
precursor 24.39 ± 0.62 24.38 ± 0.45 24.84 ± 0.53 23.64 ± 0.84 0.7895
α2-HS-glycoprotein 9.14 ± 0.24 8.42 ± 0.17 8.47 ± 0.20 8 ± 0.32 0.0547
Coagulation factor XIIa
HC
0.23 ± 0.01 0.24 ± 0.01 0.25 ± 0.01 0.28 ± 0.02 0.0046
Inter- α-trypsin inhibitor
HC
0.64 ± 0.02 0.60 ± 0.01 0.61 ± 0.01 0.59 ± 0.02 0.279
α2-Antiplasmin 1.97 ± 0.05 1.89 ± 0.04 1.89 ± 0.04 1.83 ± 0.07 0.6426
α1-Antitrypsin 10.63 ± 0.27 9.99 ± 0.20 9.71 ± 0.23 10.16 ± 0.37 0.0706
Hemopexin 9.82 ± 0.26 9.37 ± 0.19 9.24 ± 0.22 9.64 ± 0.35 0.4086
Complement C3 21.20 ± 0.60 19.46 ± 0.43 18.81 ± 0.50 19.69 ± 0.81 0.0348
Clusterin 1.49 ± 0.03 1.46 ± 0.03 1.44 ± 0.03 1.45 ± 0.05 0.6359
Plasminogen 1.22 ± 0.03 1.15 ± 0.02 1.12 ± 0.02 1.12 ± 0.04 0.0767
Apolipoprotein B-100 0.82 ± 0.03 0.79 ± 0.02 0.77 ± 0.03 0.75 ± 0.04 0.6635
Vitronectin 3.64 ± 0.08 3.43 ± 0.06 3.27 ± 0.07 3.36 ± 0.11 0.0509
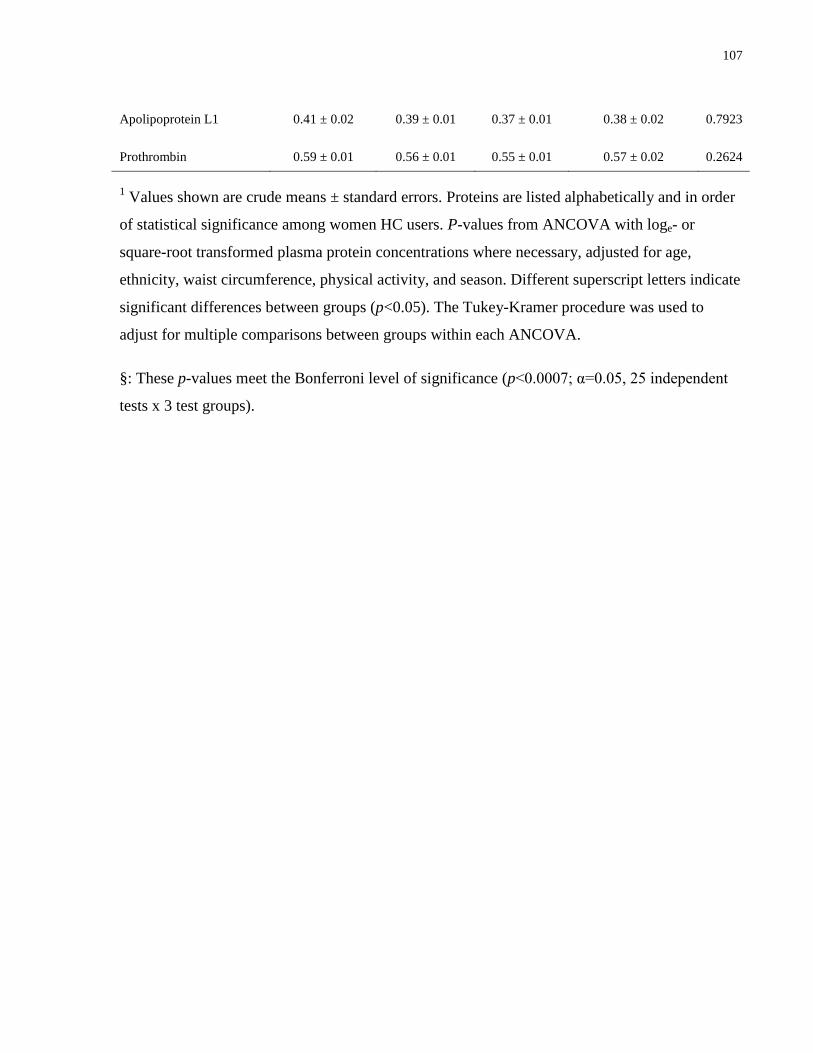
107
Apolipoprotein L1 0.41 ± 0.02 0.39 ± 0.01 0.37 ± 0.01 0.38 ± 0.02 0.7923
Prothrombin 0.59 ± 0.01 0.56 ± 0.01 0.55 ± 0.01 0.57 ± 0.02 0.2624
1 Values shown are crude means ± standard errors. Proteins are listed alphabetically and in order
of statistical significance among women HC users. P-values from ANCOVA with loge- or
square-root transformed plasma protein concentrations where necessary, adjusted for age,
ethnicity, waist circumference, physical activity, and season. Different superscript letters indicate
significant differences between groups (p<0.05). The Tukey-Kramer procedure was used to
adjust for multiple comparisons between groups within each ANCOVA.
§: These p-values meet the Bonferroni level of significance (p<0.0007; α=0.05, 25 independent
tests x 3 test groups).
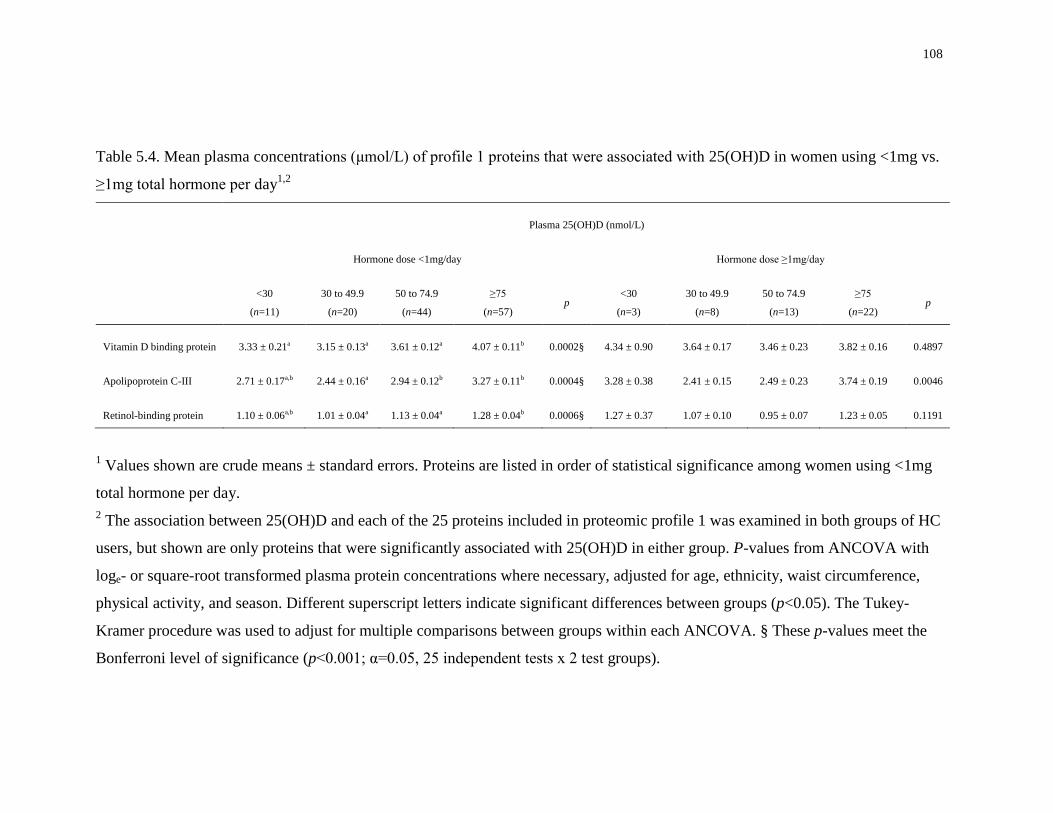
108
Table 5.4. Mean plasma concentrations (μmol/L) of profile 1 proteins that were associated with 25(OH)D in women using <1mg vs.
≥1mg total hormone per day1,2
Plasma 25(OH)D (nmol/L)
Hormone dose <1mg/day Hormone dose ≥1mg/day
<30
(n=11)
30 to 49.9
(n=20)
50 to 74.9
(n=44)
≥75
(n=57) p
<30
(n=3)
30 to 49.9
(n=8)
50 to 74.9
(n=13)
≥75
(n=22) p
Vitamin D binding protein 3.33 ± 0.21a 3.15 ± 0.13a 3.61 ± 0.12a 4.07 ± 0.11b 0.0002§ 4.34 ± 0.90 3.64 ± 0.17 3.46 ± 0.23 3.82 ± 0.16 0.4897
Apolipoprotein C-III 2.71 ± 0.17a,b 2.44 ± 0.16a 2.94 ± 0.12b 3.27 ± 0.11b 0.0004§ 3.28 ± 0.38 2.41 ± 0.15 2.49 ± 0.23 3.74 ± 0.19 0.0046
Retinol-binding protein 1.10 ± 0.06a,b 1.01 ± 0.04a 1.13 ± 0.04a 1.28 ± 0.04b 0.0006§ 1.27 ± 0.37 1.07 ± 0.10 0.95 ± 0.07 1.23 ± 0.05 0.1191
1 Values shown are crude means ± standard errors. Proteins are listed in order of statistical significance among women using <1mg
total hormone per day.
2 The association between 25(OH)D and each of the 25 proteins included in proteomic profile 1 was examined in both groups of HC
users, but shown are only proteins that were significantly associated with 25(OH)D in either group. P-values from ANCOVA with
loge- or square-root transformed plasma protein concentrations where necessary, adjusted for age, ethnicity, waist circumference,
physical activity, and season. Different superscript letters indicate significant differences between groups (p<0.05). The Tukey-
Kramer procedure was used to adjust for multiple comparisons between groups within each ANCOVA. § These p-values meet the
Bonferroni level of significance (p<0.001; α=0.05, 25 independent tests x 2 test groups).
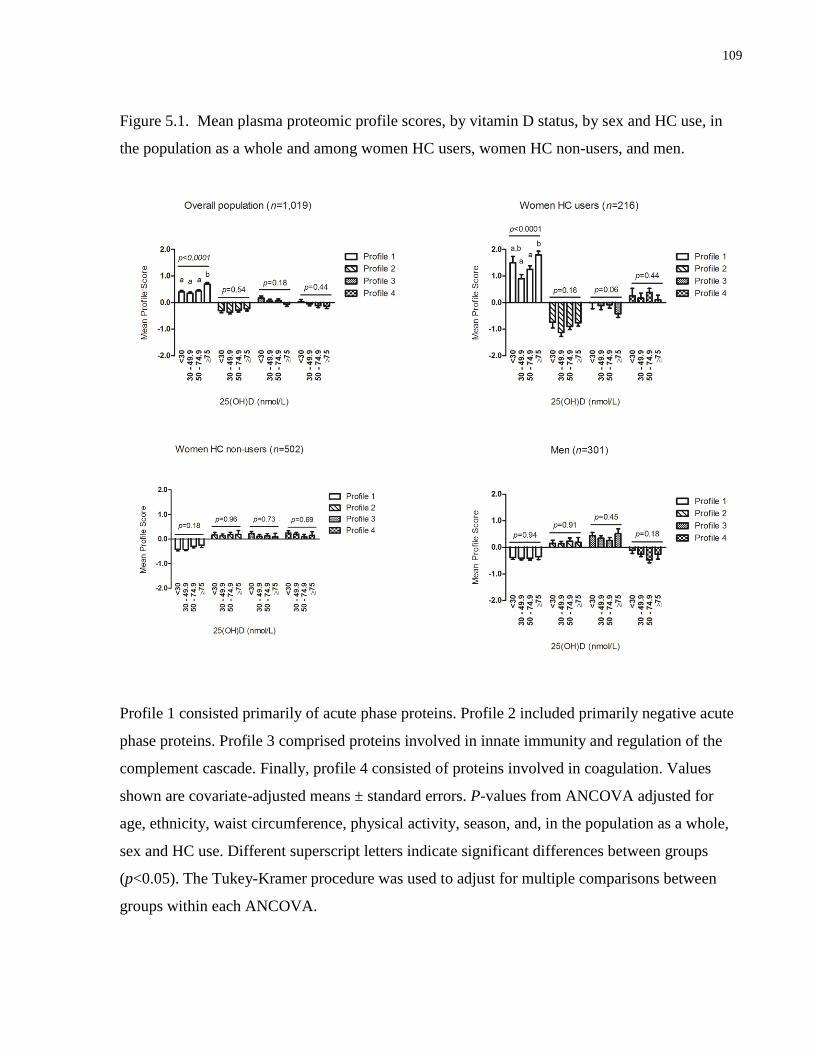
109
Figure 5.1. Mean plasma proteomic profile scores, by vitamin D status, by sex and HC use, in
the population as a whole and among women HC users, women HC non-users, and men.
Profile 1 consisted primarily of acute phase proteins. Profile 2 included primarily negative acute
phase proteins. Profile 3 comprised proteins involved in innate immunity and regulation of the
complement cascade. Finally, profile 4 consisted of proteins involved in coagulation. Values
shown are covariate-adjusted means ± standard errors. P-values from ANCOVA adjusted for
age, ethnicity, waist circumference, physical activity, season, and, in the population as a whole,
sex and HC use. Different superscript letters indicate significant differences between groups
(p<0.05). The Tukey-Kramer procedure was used to adjust for multiple comparisons between
groups within each ANCOVA.

110
5.5 Discussion
There is considerable interest in the potential protective role of vitamin D in cardiometabolic
disease (349). The beneficial effects of vitamin D are thought to occur partly through regulation
of gene transcription by the VDR. Two recent studies identified hundreds of genetic targets of
vitamin D action across the human genome (27;145). However, it is not known whether this
widespread genomic signature of vitamin D translates into downstream effects at the proteome
level. The present study is the first to examine the association between circulating 25(OH)D and
the plasma proteome. We identified a number of associations between positive acute phase
proteins and 25(OH)D; however, the majority of these associations were present only in women
HC users. Furthermore, after accounting for total daily hormone dose, only three proteins (DBP,
ApoC-III, and RBP4) were still significantly associated with 25(OH)D. We have previously
reported a confounding effect of HC use on the association between 25(OH)D and CRP, a well
established biomarker of systemic inflammation (331). In addition, use of HRT in post-
menopausal women has been found to modify the association between 25(OH)D and various
cancers (190;245). Together with these findings, the results of the present study suggest that sex
hormone-based medications may play an important role as confounders or effect modifiers of the
association between 25(OH)D and various disease-related outcomes. Given the widespread use
of these medications by women throughout the world, efforts to fully elucidate their effects on
the relationship between vitamin D and disease are warranted.
High-abundance components of the plasma proteome include a number of physiologically
important proteins, such as protease inhibitors, complement system members, apolipoproteins,
carrier proteins, and coagulation factors (57). The concentrations of many of these proteins
become altered during inflammation, and they are considered acute phase reactants that may be
useful as biomarkers of disease risk (59;120). Indeed, many of the 54 proteins included in the
proteomics panel used in the present study are acute phase reactants that represent both
traditional and novel disease biomarkers (207), and they belong to pathways that become
dysregulated during disease progression, such as hemostasis, lipid metabolism, and innate
immunity (119;348).
A large body of evidence suggests that vitamin D may have important anti-inflammatory and
immunomodulatory properties (248). The active form of the vitamin, 1,25(OH)2D, binds to the
111
VDR, which then binds to VDRE in cytokine-encoding genes, downregulating their transcription
and attenuating the pro-inflammatory cascades that trigger hepatic production of acute phase
proteins (28;319). Indeed, a number of studies have reported inverse associations between
circulating 25(OH)D and acute phase proteins, such as CRP and RBP4 (31;85). Given these
findings, the positive association between 25(OH)D and a plasma proteomic profile consisting of
positive acute phase proteins in the overall population is unexpected. However, as our analyses
stratified by sex and HC use indicate, the observed association seemed to be driven by HC use.
Use of HC is associated with high circulating concentrations of 25(OH)D (188;191;331). Most
contemporary HC consist of a combination of synthetic estrogen and progestins (192). The
effects of these medications on vitamin D metabolite concentrations are thought to be mediated
by estrogen via downregulation of CYP24A1, a 24-hydroxylase that plays a key role in vitamin
D metabolism by initiating the catabolism of both 25(OH)D and 1,25(OH)2D, and upregulation
of CYP27B1, the main 1-α-hydroxylase responsible for conversion of 25(OH)D to 1,25(OH)2D
(193;194). Decreased catabolism of both 25(OH)D and 1,25(OH)2D and increased conversion
from 25(OH)D to 1,25(OH)2D by estrogen may result in elevated vitamin D metabolite
concentrations in the blood. At the same time, HC use is associated with a number of metabolic
perturbations, including increased inflammation, impaired glucose metabolism, and altered blood
lipid and coagulation factor concentrations (337). In particular, ethinyl estradiol, the synthetic
estrogenic component of many HC, affects hepatic production of hemostasis-related proteins
involved in coagulation and fibrinolysis, as well as pro-inflammatory acute phase reactants
(206;337). These effects are thought to be, at least in part, the result of hepatic metabolism of
ethinyl estradiol, combined with its long half-life and chemical potency (337). We have recently
reported a widespread effect of HC use on the same 54 proteins surveyed in the present study,
with women HC users having higher concentrations of many of them than women HC non-users
(207). These effects of HC on multiple plasma proteins, combined with their effect on 25(OH)D
concentrations, are the likely explanation for the initially unexpected positive association
between 25(OH)D and positive acute phase proteins in women HC users. Indeed, after adjusting
for hormone dose, most of these associations were no longer significant.
Of the twelve proteins associated with 25(OH)D in women HC users as a whole, only three
(DBP, ApoC-III, and RBP4) were associated with 25(OH)D in women HC users taking <1mg
total hormone per day, and none of them were associated in HC users taking ≥1mg total hormone
112
per day. In all three cases, in the <1mg group, the protein concentrations were higher in women
with a higher vitamin D status. ApoC-III is a component of triglyceride-rich particles, such as
chylomicrons and VLDL, that inhibits triglyceride-rich particle hydrolysis (350), preventing their
uptake and contributing to the development of hypertriglyceridemia (351). In addition, levels of
ApoC-III are altered during the acute phase response, and ApoC-III has been shown to
upregulate pro-inflammatory cascades (352). DBP, which is produced hepatically, is the main
carrier of vitamin D metabolites in the circulation (121). RBP4 is secreted hepatically and
transports the main vitamin A metabolite, retinol, from the liver to target tissues (353). RBP4 is
also secreted from adipocytes and is considered a pro-inflammatory adipokine (353). HC use is
generally associated with high concentrations of all three of these proteins, and we recently
reported a dose-dependent association between HC use and 25(OH)D concentrations
(197;331;353;354). Therefore, the observed associations between these proteins and 25(OH)D in
HC users taking <1mg total hormone may still be driven by dose-dependent effects within that
group that our study design was unable to capture.
Although no association was observed between any proteomic profile and 25(OH)D among
women HC non-users, analysis of individual proteins revealed positive associations between
RBP4 and coagulation factor XIIa heavy chain and 25(OH)D. No association existed between
coagulation factor XIIa heavy chain and 25(OH)D in women HC users. Among men, we
identified no significant associations between any proteins and 25(OH)D. The lack of association
between 25(OH)D and DBP in women HC non-users and men may seem surprising, because
genetic polymorphisms in GC, the gene encoding this protein, are associated with 25(OH)D
concentrations (222;223). However, while nearly 90% of circulating 25(OH)D is bound to DBP,
the concentration of the latter greatly exceeds that of 25(OH)D (133), so that changes in vitamin
D status may not necessarily be paralleled by fluctuations in DBP concentration.
The observed positive association between 25(OH)D and RBP4 across all women, regardless of
HC use, is inconsistent with the results of a previous trial where vitamin D supplementation in
individuals with T2D resulted in decreased concentrations of RBP4. In both adults and
adolescents, circulating RBP4 is positively associated with whole body adiposity, BMI, insulin
resistance and T2D, and it may predict CVD (355). In light of these findings, our observation of
a sex-specific positive association between 25(OH)D and RBP4 is unexpected and warrants
further study.
113
To our knowledge, the present study is the first to report an association between 25(OH)D and
coagulation factor XIIa heavy chain. The latter is a principal member of the intrinsic pathway,
which triggers the formation of fibrin (356). The link between vitamin D and coagulation has
been poorly explored. A small study found no improvements in coagulation-related parameters
with vitamin D supplementation (357). Despite our finding of a positive association between
coagulation factor XIIa heavy chain and 25(OH)D, we observed no association between
25(OH)D and other coagulation-related proteins included in the proteomics panel, suggesting an
overall lack of important effects of 25(OH)D on this pathway in healthy young adults.
Finally, we found no associations between 25(OH)D and either negative acute phase reactants
(proteomic profile 2) or innate immunity-related proteins (proteomic profile 3). We also
observed no association between 25(OH)D and any of the four proteins that did not load onto
any specific proteomic profiles, such as adiponectin, which is an anti-inflammatory cytokine. It
is possible that the anti-inflammatory and immunomodulatory effects of circulating vitamin D
are more evident in older populations with a greater degree of chronic inflammation, which may
be more easily captured through measurement of plasma biomarkers. In young, healthy
individuals, the anti-inflammatory effects of vitamin D may be localized to specific sites of
inflammation and, therefore, only be measurable in specific tissue regions.
One limitation of the present study is that, while the overall study population was large in size,
there were relatively few women HC users. The small sample size of this sub-group precluded
examining whether the effect of HC use on the association between 25(OH)D and plasma
proteins differs across different ethnic groups that have varying degrees of vitamin D deficiency,
as well as different concentrations of the assessed proteins (119;153). In addition, the present
study was not designed to examine whether the estrogenic or progesterone-related compounds in
HC drive the associations reported here, nor whether endogenous differences in sex hormones
play a role in the relationship between vitamin D and the plasma proteome. Despite these
limitations, our findings suggest that sex hormone-based medications represent a potentially
important confounder that should be considered in any studies examining the association
between vitamin D and biomarkers of cardiometabolic and other diseases. Adequately powered
prospective studies and clinical trials that examine the effect of various types of sex hormone-
based medications, as well as endogenous hormones, on the relationship between vitamin D and
specific outcomes are needed to elucidate how sex hormones may modulate the effects of
114
vitamin D. Such studies will allow for a better understanding of whether the confounding effects
of these drugs are specific to certain ethnic groups and whether certain components of the
medication (e.g. estrogen or progesterone-derived components), as well as an individual's
endogenous hormonal status, play a more important confounding role.
In summary, the present study examined the association between circulating 25(OH)D and the
plasma proteome and determined whether HC use modifies this association. While a number of
positive associations between 25(OH)D and positive acute phase proteins involved in various
pathways that become dysregulated during disease progression were identified, the majority were
no longer significant after accounting for HC use. These results suggest that HC use may play an
important role as a confounder in the association between 25(OH)D and proteomic biomarkers of
disease risk. Given the widespread use of these medications by women throughout the world,
efforts to fully elucidate their effects on the relationship between vitamin D and disease are
warranted.
115
Chapter 6 : Genetic variation in the vitamin D receptor, plasma 25-
hydroxyvitamin D, and biomarkers of cardiometabolic disease in
Caucasian young adults
Adapted with permission from:
García-Bailo B, Jamnik J, Da Costa L, Badawi A, El-Sohemy A. Genetic variation
in the vitamin D receptor, plasma 25-hydroxyvitamin D, and biomarkers of
cardiometabolic disease in Caucasian young adults. J Nutrigenet Nutrigenomics. In
press.
116
6.1 Abstract
Background: Vitamin D regulates gene transcription through binding of 1,25-dihydroxyvitamin
D (1,25(OH)2D) to the vitamin D receptor (VDR), potentially modulating physiologic processes
related to cardiometabolic disease. However, studies of the association between 25-
hydroxyvitamin D (25(OH)D) (which is the accepted biomarker of vitamin D status and is
converted to 1,25(OH)2D) and cardiometabolic disease have been inconsistent. These
inconsistencies may result from unaccounted gene-nutrient interactions between VDR and
circulating 25(OH)D. Our objective was to examine the effect of 25(OH)D on the association
between VDR variants and cardiometabolic disease biomarkers, including inflammation, glucose
and lipid metabolism, and the plasma proteome, in young adults.
Methods: The relationship between 27 VDR variants and each biomarker (biomarkers of
inflammation n=6; biomarkers of glucose and lipid metabolism n=9; plasma proteomic
biomarkers n=54) was examined in 488 Caucasians aged 20-29 years. General linear models
were used to examine the effect of the SNP x 25(OH)D interaction on each biomarker. For any
SNP-biomarker associations where SNP x 25(OH)D interaction p <0.05, the effect of vitamin D
status on that association was further examined with analysis of covariance, stratified by tertiles
of vitamin D.
Results: 25(OH)D affected the association between rs2239182 and interferon γ-induced protein
(IP-10) (p=0.0005). Among individuals in the lowest vitamin D tertile, heterozygotes had higher
IP-10 concentrations than minor and major allele homozygotes, suggesting a heterosis effect.
Conclusion: An association between rs2239182 and IP-10 was modified by 25(OH)D. The
association seemed indicative of heterosis, making its biological interpretation difficult, and it
may have been due to chance. Overall, in this population, vitamin D status does not seem to
interact with VDR variants to affect biomarkers of cardiometabolic disease.
117
6.2 Introduction
Interest in vitamin D as a therapeutic agent has grown exponentially over the last decade.
Beyond its central function as a regulator of calcium and bone metabolism, vitamin D may play a
role in the prevention of cardiometabolic diseases, such as CVD and T2D (19;20). Metabolic
abnormalities such as dyslipidemia and dysglycemia, which often cluster together with
hypertension and central adiposity, are a major risk factor for cardiometabolic disease (341).
Growing evidence also indicates that abnormal innate immune responses and chronic low-grade
inflammation play a key role in the development of cardiometabolic disease (3;5;7;8).
Evidence from in vitro and animal models indicates that vitamin D may play an important role as
a mediator of innate immunity and inflammatory responses (144;248). In addition, experimental
models suggest that vitamin D improves insulin sensitivity and secretion, regulates adipocyte
differentiation, and upregulates LPL activity in these cells (26;169;358;359). Through its actions
on these pathways, vitamin D may decrease inflammation and improve glucose and lipid
metabolism, thus contributing to a reduced risk of disease. A number of human studies have
reported inverse associations between 25(OH)D, which is the biomarker of vitamin D status, and
traditional biomarkers of inflammation, glycemic dysregulation, and dyslipidemia
(30;31;85;302). However, recent systematic reviews examining the association between vitamin
D and various cardiometabolic disease-related outcomes have yielded inconsistent findings
(35;36;360). These inconsistencies may be due to differences in methodology across studies, as
well as confounding from lifestyle and demographic factors, a lack of adequate biomarkers, and
unaccounted genetic variation between individuals.
25(OH)D is the most abundant vitamin D metabolite in the circulation and is representative of
vitamin D produced endogenously and obtained from dietary sources (121). Hydroxylation of
25(OH)D results in conversion to the main biologically active vitamin D metabolite, 1,25(OH)2D
(361). The latter exerts its biological effects by binding to the VDR, a transcription factor present
in tissues throughout the body (121). Together with other molecules, 1,25(OH)2D and the VDR
form a complex that binds to VDREs in target genes, regulating their transcription (361). Recent
in vitro work examining VDR binding sites throughout the genome has identified hundreds of
potential vitamin D target genes, primarily along innate immune and signaling pathways, many
of which are associated with diseases such as type 1 diabetes, Crohn's disease, colorectal cancer,
118
and multiple sclerosis (27;145). However, despite this widespread genomic signature, the
downstream effects of vitamin D at the level of the proteome remain poorly explored. The
plasma proteome is considered the largest version of the human proteome, with over 3,000
plasma proteins identified (58). Of these, a small number represent 99% of the total plasma
protein mass (57). These high-abundance proteins include a number of physiologically important
molecules, such as coagulation factors, complement system components, apolipoproteins, carrier
proteins, and protease inhibitors, many of which are acute phase reactants whose levels become
altered during inflammatory processes (59;120). Given the potential importance of plasma
proteins as biomarkers of disease, understanding their relationship with vitamin D may lead to a
better understanding of this vitamin's role in biological pathways that become dysregulated
during disease progression.
A number of variants exist within the VDR gene, and they may modify the effects of vitamin D
on disease-associated pathways across individuals. Traditionally, most studies have assessed
only a few polymorphisms (e.g. BsmI, FokI) (362;363), and the potential effects of other VDR
variants on disease-related outcomes remain poorly explored. Furthermore, few studies have
considered the vitamin D status of the study subjects. Recently, a large, long-term prospective
study identified a novel association between a VDR polymorphism, rs7968585, and a composite
of risk for hip fracture, cancer, myocardial infarction, and mortality (38). This association was
only apparent in individuals with a low vitamin D status, highlighting the importance of taking
into account gene-environment interactions.
Investigating the relationship between circulating 25(OH)D, VDR genetic variants, and
biomarkers of cardiometabolic disease may yield a better understanding of the biological roles of
vitamin D and help explain some of the inconsistent results across studies of the relationship
between this vitamin and cardiometabolic disease. The objective of the present study was to
examine the effect of vitamin D status on the association between variants across the VDR gene
and biomarkers of inflammation, biomarkers of glucose and lipid metabolism, and plasma
proteomic biomarkers in healthy young adults.
119
6.3 Methods
6.3.1 Study Design and Participants
For details on the TNH study population, recruitment, exclusions, and classification into ethnic
groups and seasons, please refer to Chapter 2, Section 2.3.1.
The present study consisted of 488 non-smoking Caucasian men and women without diabetes,
with available measurements for circulating 25(OH)D and plasma proteomic biomarkers, and
data from genome-wide scans at the time that the study was carried out.
6.3.2 Anthropometrics and Physical Activity
Please refer to Chapter 2, Section 2.3.2.
6.3.3 Hormonal Contraceptive Use
Please refer to Chapter 2, Section 2.3.4.
6.3.4 Biochemical and 25(OH)D Measurements
Please refer to Chapter 2, Section 2.3.5; Chapter 3, Section 3.3.3; and Chapter 4, Section 4.3.4.
6.3.5 Plasma Proteomic Measurements
Please refer to Chapter 5, Section 5.3.4.
6.3.6 Genotyping and candidate SNP selection
Genome-wide scans were carried out by Gene Logic (Houston, TX, United States), using the
Affymetrix (Santa Clara, CA, United States) 6.0 chip. After initial quality control measures
(excluding SNPs with call rate <95%, Hardy-Weinberg equilibrium p <10 x 10-8
, associated with
sex, monoallelic in the study sample), a total of 38 VDR SNPs were available on the chip. Of
these, 26 tag SNPs representative of variation across the VDR gene were selected based on the
following criteria: minor allele frequency (MAF)>0.01, Hardy-Weinberg equilibrium p>0.001,
and linkage disequilibrium r2<0.8. The selected SNPs are shown in Table 6.1. In addition, the
candidate SNP rs7968585, which was recently found to modify the association between
25(OH)D and a composite of several disease outcomes (38), was genotyped in the study
120
population using the Sequenom MassArray multiplex method, as described previously (364).
This SNP was not in linkage disequilibrium with any of the other 26 VDR SNPs.
6.3.7 Statistical Analysis
Statistical analyses were carried out using SAS version 9.2. Alpha was set at 0.05 and p-values
are two-sided. Non-normally distributed continuous variables were loge- or square root-
transformed prior to analysis, so as to improve normality. In such cases, p-values from models
using transformed values are reported, but untransformed means and measures of spread are
shown for ease of interpretation.
Subjects were categorized into plasma 25(OH)D tertiles, and subject characteristics were
compared across tertiles using χ2 tests and ANOVA. We then examined the effect of 25(OH)D
on the association between each of the 27 VDR SNPs and each biomarker. The analyses were
conducted separately for each group of biomarkers (inflammation, glucose and lipid metabolism,
and plasma proteomic biomarkers). First, general linear models were constructed to examine the
effect of the interaction between 25(OH)D and each SNP on each biomarker. In each case, the
model included the biomarker as the outcome variable and an interaction term for SNP x
25(OH)D as the predictor, with age, sex, waist circumference, physical activity, season, and HC
use among women as covariates. In addition, models examining HOMA-Beta also were adjusted
for the ratio of circulating triglycerides to HDL cholesterol, as a surrogate measure of insulin
sensitivity (104;344). Biomarker-SNP associations where the models yielded p<0.05 for the SNP
x 25(OH)D interaction term were carried forward to the second step of the analysis. No multiple
testing criteria were applied at this point because these analyses were considered exploratory and
their purpose was to generate candidate associations for further analysis in the second step.
For each of the identified candidate associations, we then conducted analyses stratified by
vitamin D tertile that compared mean levels of the specific biomarker across genotypes for the
SNP with which it was associated. ANCOVA adjusted for age, sex, waist circumference,
physical activity, season, and HC use among women was used. As before, models examining
HOMA-Beta also were adjusted for the ratio of circulating triglycerides to HDL cholesterol. At
this stage, the Bonferroni (=α/number of tests) method was used as a multiple testing correction
threshold. Finally, for any SNP-biomarker associations identified in this second stage that were
modified by vitamin D status, we also compared mean levels of the biomarker across vitamin D
121
categories within each genotype. ANCOVA, with the same covariates listed earlier, was used to
conduct these analyses.
6.4 Results
Subject characteristics are shown in Table 6.2. A greater percentage of men were in the lowest
25(OH)D tertile than women, and a greater proportion of women who reported HC use were in
the highest vitamin D tertile than women who did not use these medications. Individuals with the
highest vitamin D status had lower BMI, waist circumference, and systolic blood pressure, and
reported higher physical activity, than those in the lowest vitamin D tertile.
As shown in Table 6.3a, we identified a total of 10 associations between seven SNPs and six
biomarkers of inflammation where the interaction term for SNP x 25(OH)D was significant
(p=0.0054 to p=0.0461). A total of 162 potential associations (27 SNPs and 6 inflammatory
biomarkers) were examined. One SNP, rs2239186, had a significant interaction with 25(OH)D
for three biomarkers, and another, rs2248098, had a significant interaction for two biomarkers.
An additional five SNPs each had significant interactions with 25(OH)D for one biomarker each.
We identified 30 associations between 13 SNPs and eight biomarkers of glucose and lipid
metabolism with significant SNP x 25(OH)D interaction terms (p=0.0018 to p=0.0474) (Table
6.3b). A total of 243 potential associations (27 SNPs and 9 biomarkers of glucose and lipid
metabolism) were examined. The interaction terms with the lowest p-values were for the
associations between rs3819545 and fasting insulin, HOMA-Beta and HOMA-IR (p=0.0018,
0.0019 and 0.0021, respectively). No SNPs were associated with triglycerides.
Finally, as shown in Table 6.3c, we observed a total of 52 associations between 16 SNPs and 31
plasma proteomic biomarkers with significant SNP x 25(OH)D interaction terms (p=0.0008 to
p=0.0499). A total of 1,458 potential associations (27 SNPs and 54 plasma proteomic
biomarkers) were examined. The interaction term with the lowest p-value was for rs2228570,
commonly referred to as FokI, and circulating levels of retinol binding protein. This SNP also
had the greatest number of significant interactions with 25(OH)D, for a total of nine.
122
For each of the associations identified in Tables 6.3a-c, we further investigated the effect of
25(OH)D on the relationship between each SNP and biomarker by comparing mean levels of the
biomarker across genotypes, separately within each vitamin D tertile group. Of the candidate
associations between VDR SNPs and biomarkers of inflammation identified in Table 6.3a, after
correcting for multiple testing, we found an association significant at the Bonferroni level
(p<0.0017, based on α=0.05 and 30 independent tests [10 SNP-inflammatory biomarker
associations x 3 vitamin D tertiles]) between rs2239182 and the inflammatory biomarker IP-10
among individuals in the lowest vitamin D tertile (Figure 6.1). Heterozygotes had higher IP-10
concentrations than either group of homozygotes. No association between rs2239182 and IP-10
was seen, however, among those in the intermediate and high vitamin D tertiles. In these
analyses stratified by vitamin D tertile, none of the candidate associations listed in Tables 6.3b-c
were significant after adjustment for multiple comparisons.
For the association between rs2239182 and IP-10 identified in Figure 6.1, we then examined
potential differences in concentrations of this cytokine across vitamin D tertiles within each
genotype. We noted that IP-10 concentrations were higher in the lowest vitamin D tertile than the
middle and high tertiles among heterozygotes (p=0.0259). Minor allele homozygotes had higher
IP-10 concentrations in the middle than the lowest vitamin D tertile (p=0.0396). Among major
allele homozygotes, we saw no differences in IP-10 between vitamin D categories (p=0.0887).
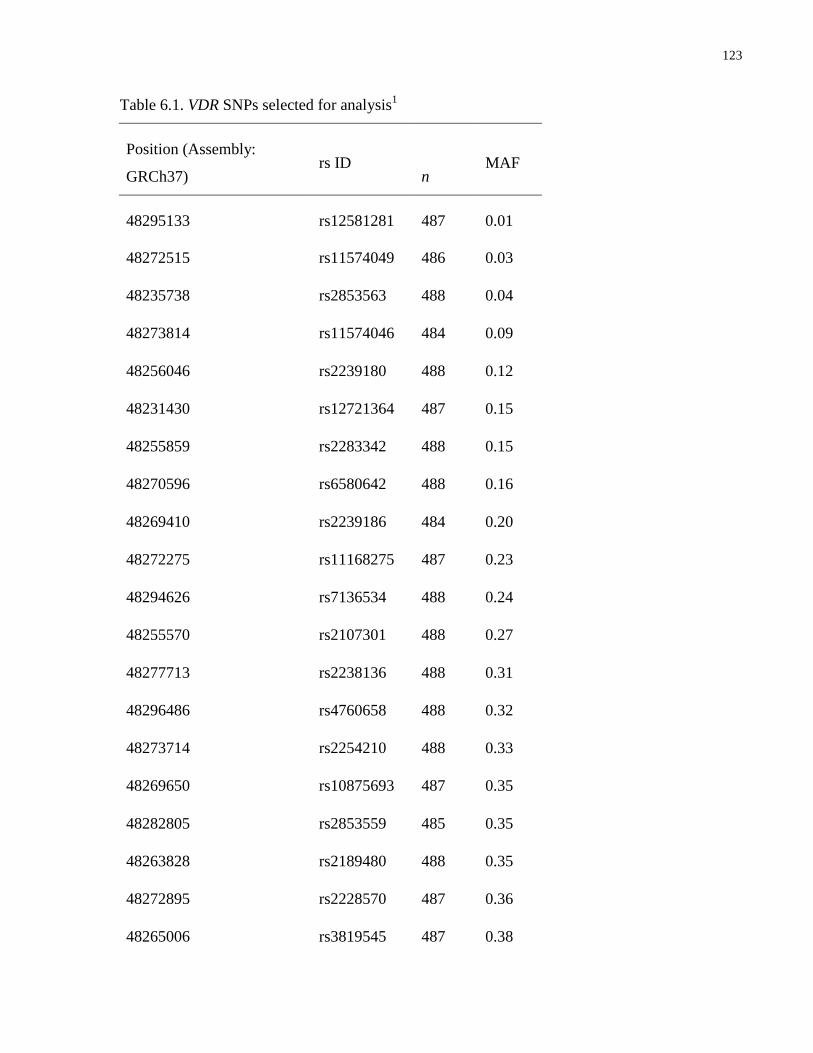
123
Table 6.1. VDR SNPs selected for analysis1
Position (Assembly:
GRCh37) rs ID
n MAF
48295133 rs12581281 487 0.01
48272515 rs11574049 486 0.03
48235738 rs2853563 488 0.04
48273814 rs11574046 484 0.09
48256046 rs2239180 488 0.12
48231430 rs12721364 487 0.15
48255859 rs2283342 488 0.15
48270596 rs6580642 488 0.16
48269410 rs2239186 484 0.20
48272275 rs11168275 487 0.23
48294626 rs7136534 488 0.24
48255570 rs2107301 488 0.27
48277713 rs2238136 488 0.31
48296486 rs4760658 488 0.32
48273714 rs2254210 488 0.33
48269650 rs10875693 487 0.35
48282805 rs2853559 485 0.35
48263828 rs2189480 488 0.35
48272895 rs2228570 487 0.36
48265006 rs3819545 487 0.38

124
48259126 rs12717991 483 0.38
48239835 rs1544410 485 0.39
48232747 rs2525046 487 0.42
48231898 rs10783215 487 0.49
48255411 rs2239182 488 0.49
48231843 rs7968585 482 0.49
48253356 rs2248098 488 0.50
1 SNPs are listed in order based on minor allele frequency, from lowest to highest. 26 tag SNPs
representative of variation across the VDR gene were selected based on the following criteria:
minor allele frequency (MAF)>0.01, Hardy-Weinberg equilibrium p>0.001, and linkage
disequilibrium r2<0.8. An additional candidate VDR SNP, rs7968585, previously associated
with a composite of risk for hip fracture, cancer, myocardial infarction, and mortality (38) was
also selected for analysis.

125
Table 6.2. Study participant characteristics, by vitamin D tertile1
Plasma 25(OH)D
Tertile 1 Tertile 2 Tertile 3 p
25(OH)D range (nmol/L) 13.3 - 50.7 50.8 - 72.3 72.6 - 194.0
n 162 163 163
Sex
Male (n=142) 63 (44.4) 49 (34.5) 30 (21.1) 0.0002
Female (n=346) 99 (28.6) 114 (33.0) 133 (38.4)
Hormonal contraceptive use among women
No (n=192) 70 (36.5) 74 (38.5) 48 (25.0) <0.0001
Yes (n=154) 29 (18.8) 40 (26.0) 85 (55.2)
Age (years) 23.1 ± 2.7 23.3 ± 2.6 23.3 ± 2.3 0.7769
BMI (kg/m2) 23.9 ± 4
a 23.1 ± 3.3
a,b 22.6 ± 2.9
b 0.0023
Waist circumference (cm) 77.8 ± 10a 75.2 ± 7.4
b 73.2 ± 7
b <0.0001
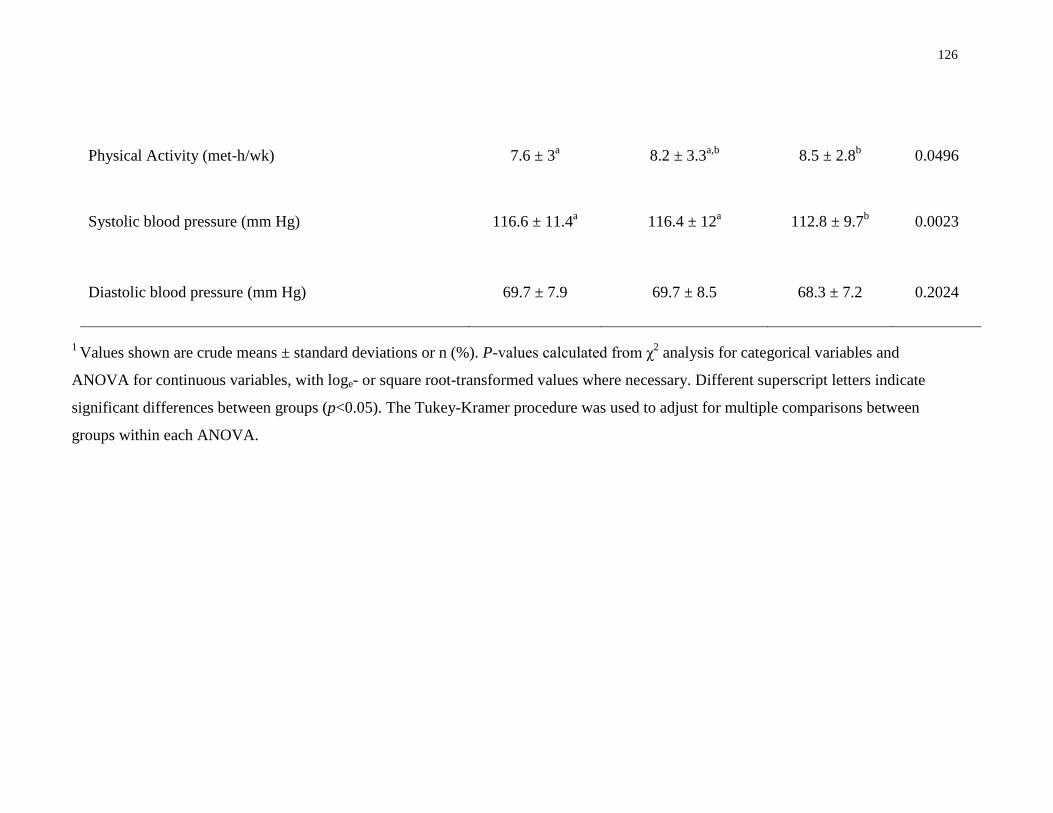
126
Physical Activity (met-h/wk) 7.6 ± 3a 8.2 ± 3.3
a,b 8.5 ± 2.8
b 0.0496
Systolic blood pressure (mm Hg) 116.6 ± 11.4a 116.4 ± 12
a 112.8 ± 9.7
b 0.0023
Diastolic blood pressure (mm Hg) 69.7 ± 7.9 69.7 ± 8.5 68.3 ± 7.2 0.2024
1 Values shown are crude means ± standard deviations or n (%). P-values calculated from χ
2 analysis for categorical variables and
ANOVA for continuous variables, with loge- or square root-transformed values where necessary. Different superscript letters indicate
significant differences between groups (p<0.05). The Tukey-Kramer procedure was used to adjust for multiple comparisons between
groups within each ANOVA.
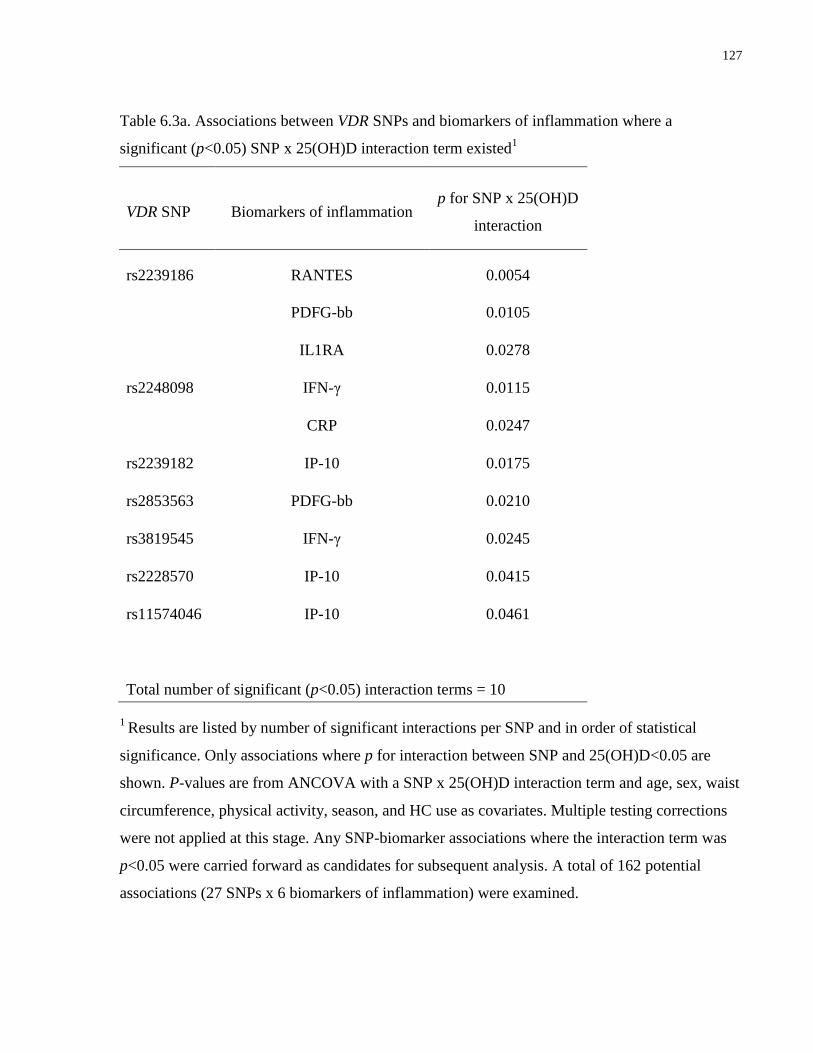
127
Table 6.3a. Associations between VDR SNPs and biomarkers of inflammation where a
significant (p<0.05) SNP x 25(OH)D interaction term existed1
VDR SNP Biomarkers of inflammation p for SNP x 25(OH)D
interaction
rs2239186 RANTES 0.0054
PDFG-bb 0.0105
IL1RA 0.0278
rs2248098 IFN-γ 0.0115
CRP 0.0247
rs2239182 IP-10 0.0175
rs2853563 PDFG-bb 0.0210
rs3819545 IFN-γ 0.0245
rs2228570 IP-10 0.0415
rs11574046 IP-10 0.0461
Total number of significant (p<0.05) interaction terms = 10
1 Results are listed by number of significant interactions per SNP and in order of statistical
significance. Only associations where p for interaction between SNP and 25(OH)D<0.05 are
shown. P-values are from ANCOVA with a SNP x 25(OH)D interaction term and age, sex, waist
circumference, physical activity, season, and HC use as covariates. Multiple testing corrections
were not applied at this stage. Any SNP-biomarker associations where the interaction term was
p<0.05 were carried forward as candidates for subsequent analysis. A total of 162 potential
associations (27 SNPs x 6 biomarkers of inflammation) were examined.
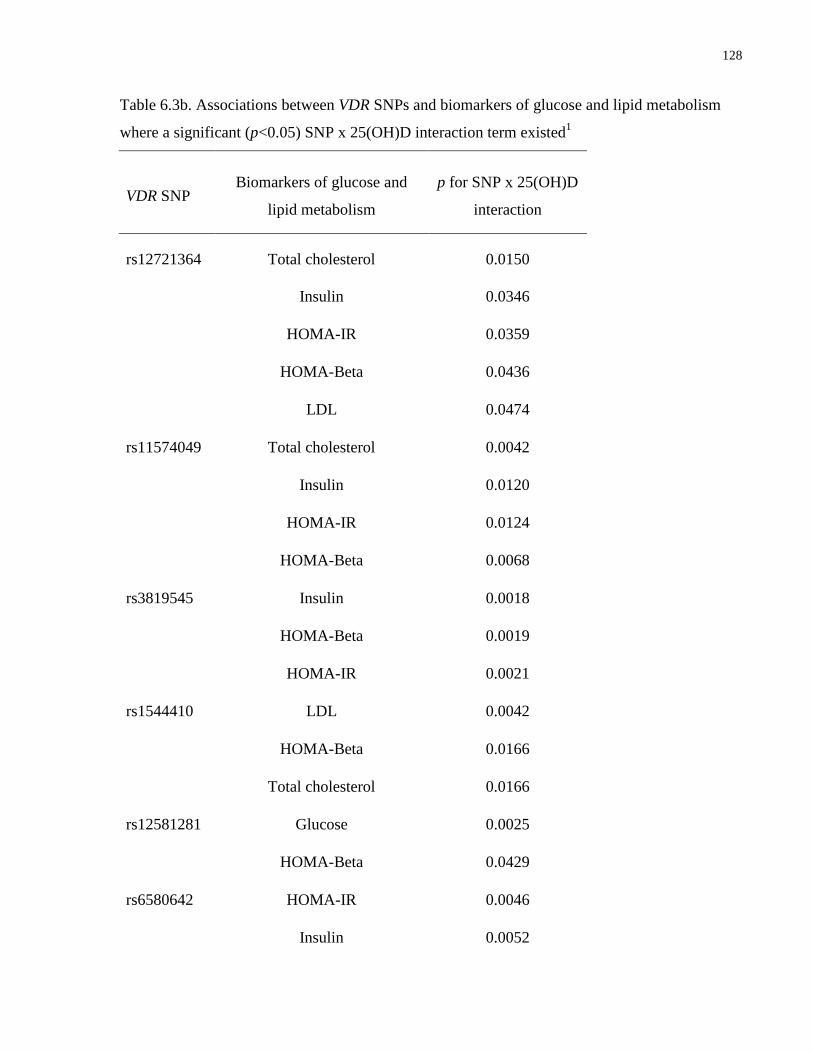
128
Table 6.3b. Associations between VDR SNPs and biomarkers of glucose and lipid metabolism
where a significant (p<0.05) SNP x 25(OH)D interaction term existed1
VDR SNP Biomarkers of glucose and
lipid metabolism
p for SNP x 25(OH)D
interaction
rs12721364 Total cholesterol 0.0150
Insulin 0.0346
HOMA-IR 0.0359
HOMA-Beta 0.0436
LDL 0.0474
rs11574049 Total cholesterol 0.0042
Insulin 0.0120
HOMA-IR 0.0124
HOMA-Beta 0.0068
rs3819545 Insulin 0.0018
HOMA-Beta 0.0019
HOMA-IR 0.0021
rs1544410 LDL 0.0042
HOMA-Beta 0.0166
Total cholesterol 0.0166
rs12581281 Glucose 0.0025
HOMA-Beta 0.0429
rs6580642 HOMA-IR 0.0046
Insulin 0.0052
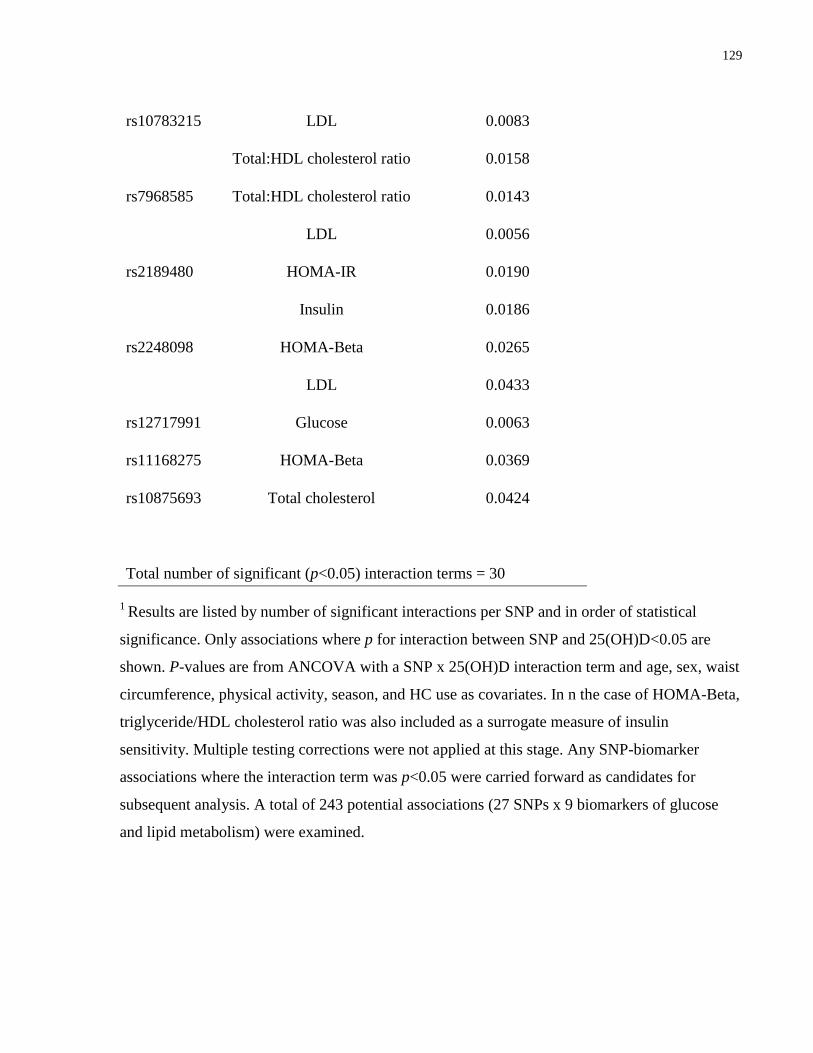
129
rs10783215 LDL 0.0083
Total:HDL cholesterol ratio 0.0158
rs7968585 Total:HDL cholesterol ratio 0.0143
LDL 0.0056
rs2189480 HOMA-IR 0.0190
Insulin 0.0186
rs2248098 HOMA-Beta 0.0265
LDL 0.0433
rs12717991 Glucose 0.0063
rs11168275 HOMA-Beta 0.0369
rs10875693 Total cholesterol 0.0424
Total number of significant (p<0.05) interaction terms = 30
1 Results are listed by number of significant interactions per SNP and in order of statistical
significance. Only associations where p for interaction between SNP and 25(OH)D<0.05 are
shown. P-values are from ANCOVA with a SNP x 25(OH)D interaction term and age, sex, waist
circumference, physical activity, season, and HC use as covariates. In n the case of HOMA-Beta,
triglyceride/HDL cholesterol ratio was also included as a surrogate measure of insulin
sensitivity. Multiple testing corrections were not applied at this stage. Any SNP-biomarker
associations where the interaction term was p<0.05 were carried forward as candidates for
subsequent analysis. A total of 243 potential associations (27 SNPs x 9 biomarkers of glucose
and lipid metabolism) were examined.
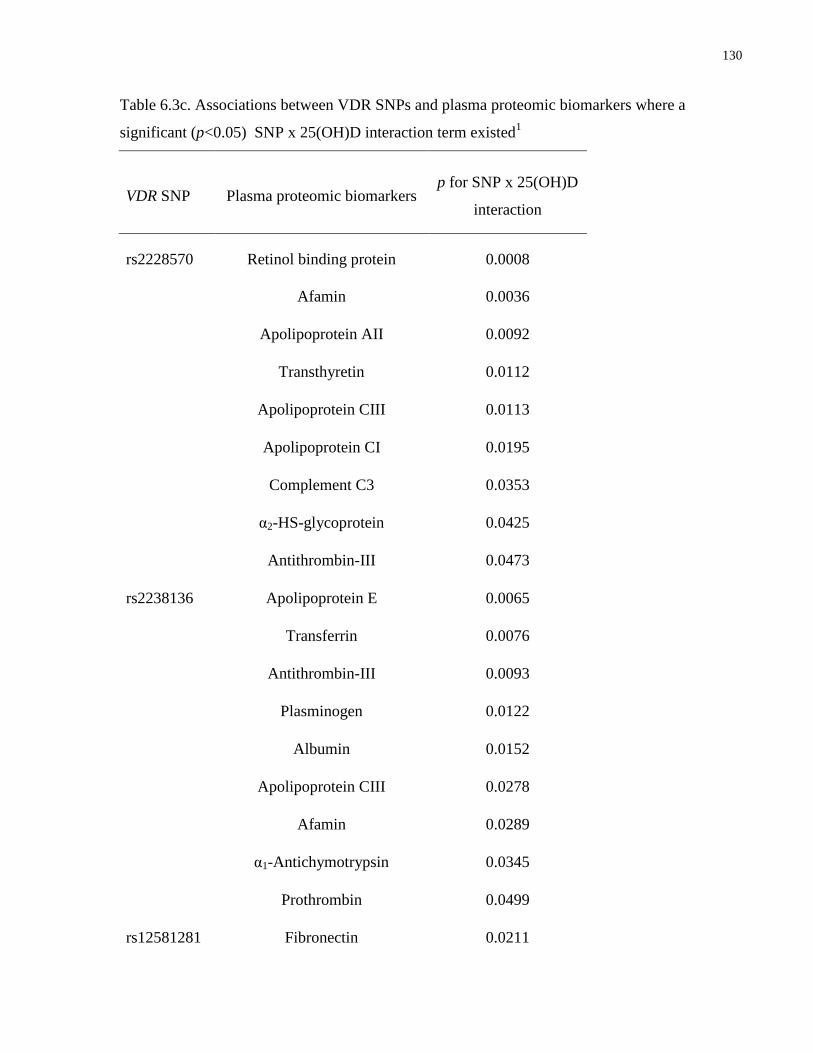
130
Table 6.3c. Associations between VDR SNPs and plasma proteomic biomarkers where a
significant (p<0.05) SNP x 25(OH)D interaction term existed1
VDR SNP Plasma proteomic biomarkers p for SNP x 25(OH)D
interaction
rs2228570 Retinol binding protein 0.0008
Afamin 0.0036
Apolipoprotein AII 0.0092
Transthyretin 0.0112
Apolipoprotein CIII 0.0113
Apolipoprotein CI 0.0195
Complement C3 0.0353
α2-HS-glycoprotein 0.0425
Antithrombin-III 0.0473
rs2238136 Apolipoprotein E 0.0065
Transferrin 0.0076
Antithrombin-III 0.0093
Plasminogen 0.0122
Albumin 0.0152
Apolipoprotein CIII 0.0278
Afamin 0.0289
α1-Antichymotrypsin 0.0345
Prothrombin 0.0499
rs12581281 Fibronectin 0.0211
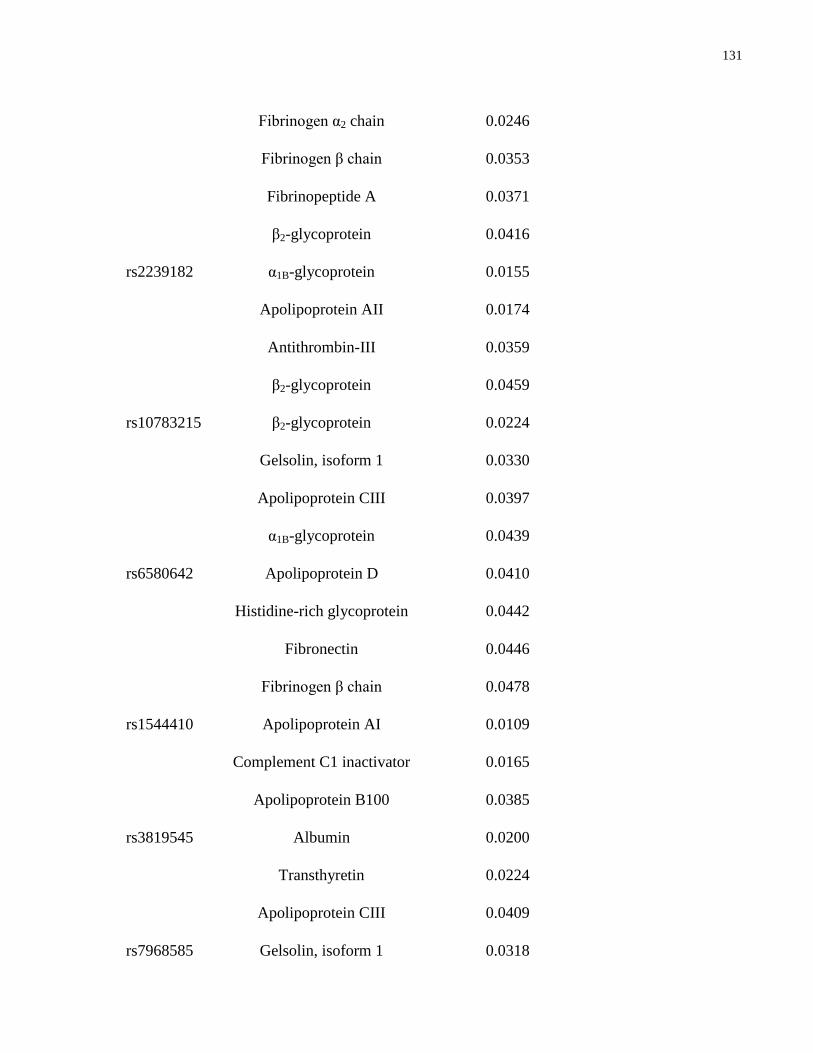
131
Fibrinogen α2 chain 0.0246
Fibrinogen β chain 0.0353
Fibrinopeptide A 0.0371
β2-glycoprotein 0.0416
rs2239182 α1B-glycoprotein 0.0155
Apolipoprotein AII 0.0174
Antithrombin-III 0.0359
β2-glycoprotein 0.0459
rs10783215 β2-glycoprotein 0.0224
Gelsolin, isoform 1 0.0330
Apolipoprotein CIII 0.0397
α1B-glycoprotein 0.0439
rs6580642 Apolipoprotein D 0.0410
Histidine-rich glycoprotein 0.0442
Fibronectin 0.0446
Fibrinogen β chain 0.0478
rs1544410 Apolipoprotein AI 0.0109
Complement C1 inactivator 0.0165
Apolipoprotein B100 0.0385
rs3819545 Albumin 0.0200
Transthyretin 0.0224
Apolipoprotein CIII 0.0409
rs7968585 Gelsolin, isoform 1 0.0318
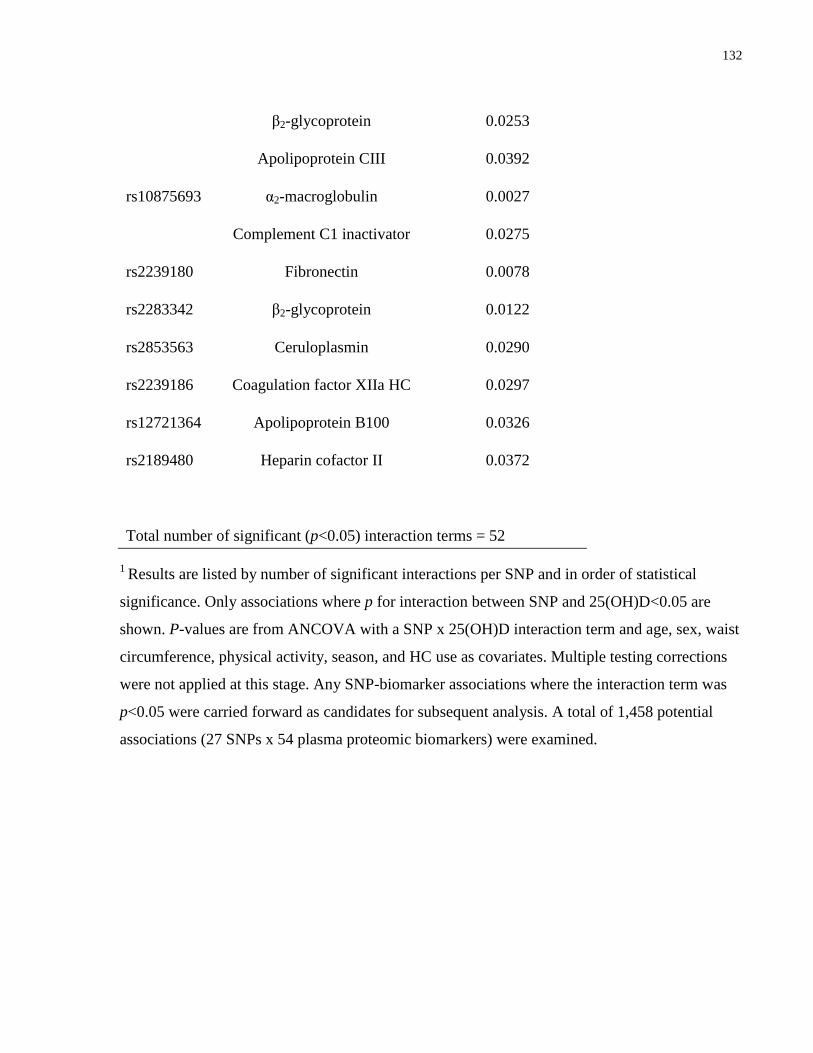
132
β2-glycoprotein 0.0253
Apolipoprotein CIII 0.0392
rs10875693 α2-macroglobulin 0.0027
Complement C1 inactivator 0.0275
rs2239180 Fibronectin 0.0078
rs2283342 β2-glycoprotein 0.0122
rs2853563 Ceruloplasmin 0.0290
rs2239186 Coagulation factor XIIa HC 0.0297
rs12721364 Apolipoprotein B100 0.0326
rs2189480 Heparin cofactor II 0.0372
Total number of significant (p<0.05) interaction terms = 52
1 Results are listed by number of significant interactions per SNP and in order of statistical
significance. Only associations where p for interaction between SNP and 25(OH)D<0.05 are
shown. P-values are from ANCOVA with a SNP x 25(OH)D interaction term and age, sex, waist
circumference, physical activity, season, and HC use as covariates. Multiple testing corrections
were not applied at this stage. Any SNP-biomarker associations where the interaction term was
p<0.05 were carried forward as candidates for subsequent analysis. A total of 1,458 potential
associations (27 SNPs x 54 plasma proteomic biomarkers) were examined.
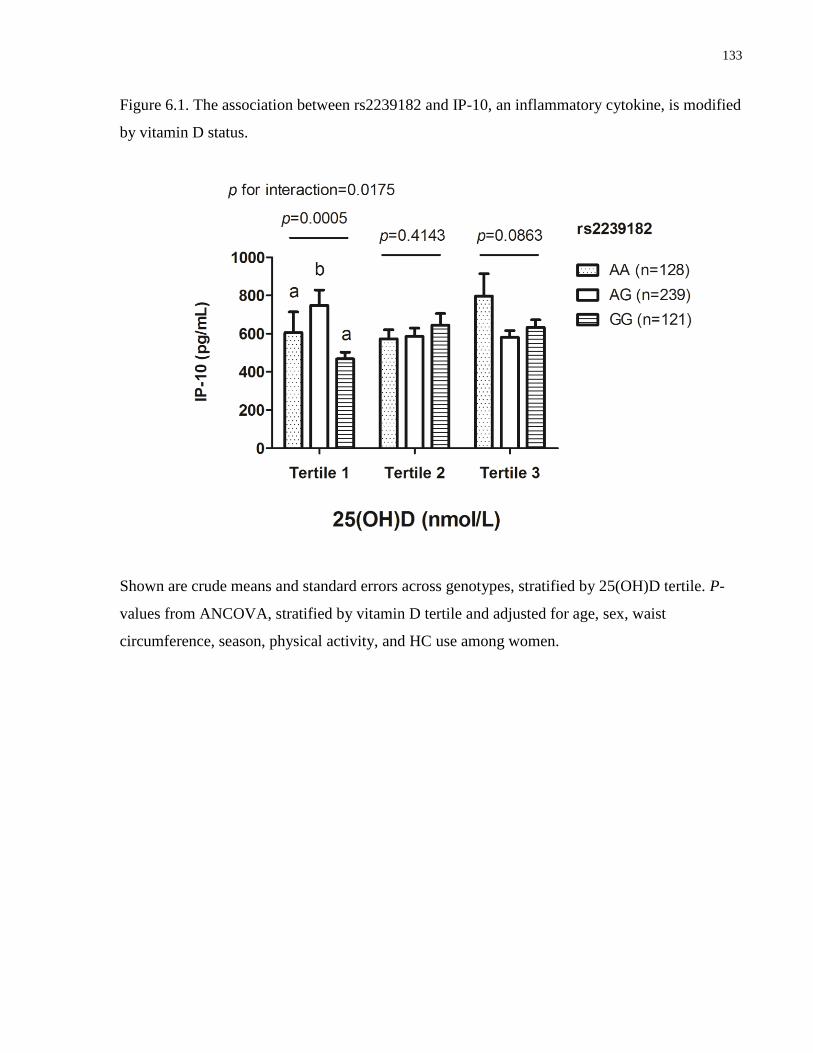
133
Figure 6.1. The association between rs2239182 and IP-10, an inflammatory cytokine, is modified
by vitamin D status.
Shown are crude means and standard errors across genotypes, stratified by 25(OH)D tertile. P-
values from ANCOVA, stratified by vitamin D tertile and adjusted for age, sex, waist
circumference, season, physical activity, and HC use among women.
134
6.5 Discussion
To our knowledge, the present study is the first to conduct a comprehensive examination of the
interplay between vitamin D status and VDR genetic variation along several cardiometabolic
disease-associated pathways simultaneously. In particular, we identified an association between
rs2239182 and IP-10 that appeared to be mediated by vitamin D status. Among individuals with
a low vitamin D status, heterozygotes had higher values of IP-10 than both major and minor
allele homozygotes. However, concentrations of IP-10 were similar across genotypes in the
higher vitamin D status categories. Among heterozygotes, those in the lowest vitamin D tertile
had higher IP-10 concentrations. However, minor allele homozygotes had higher concentrations
in the middle than the lowest vitamin D tertile, and major allele homozygotes had similar IP-10
concentrations regardless of their vitamin D status.
IP-10 is a chemoattractant for cells of the immune system whose transcription is upregulated by
IFN-γ (365). In vitro, 1,25(OH)D decreases expression of IP-10 (366). This is in line with
experimental evidence suggesting that 1,25(OH)2D downregulates the production of pro-
inflammatory cytokines such as IFN-γ and IL-2 and upregulates the transcription of
immunosuppressive cytokines such as IL-10 (250-253). Previously, the variant rs2239182 has
been associated with myopia (367). This SNP, which yields an A to G nucleotide substitution,
resides within intron 7 of the VDR gene, located on chromosome 12q13.1 and comprising 14
exons (367;368). The minor allele frequency observed in our population, 0.49, is similar to that
previously reported in Caucasians (367). It is not known whether rs2239182 is a functional
variant.
The results of the present study suggest a heterosis effect of rs2239182 on IP-10 that is apparent
only in individuals with a low vitamin D status, where heterozygotes with low circulating
25(OH)D may have greater inflammation, as indicated by IP-10 levels, than either group of
homozygotes. At the molecular level, heterosis takes place when heterozygotes for a particular
variant exhibit a greater or lesser phenotypic effect than either group of homozygotes for a
specific quantitative trait (369). This may seem counterintuitive, as one might expect
heterozygotes to exhibit a phenotype intermediate between the two homozygote groups. Indeed,
the existence of molecular heterosis has been debated; however, some instances of molecular
heterosis have been reported in humans (369). The mechanisms by which heterosis might occur
135
at the molecular level remain poorly understood, but may involve factors such as protein subunit
interaction, lethality associated with being homozygous for the risk allele, a greater range of
adaptive responsiveness in heterozygotes, or the influence of an independent third factor (369).
In order to determine the biological plausibility of the heterosis effect observed in the present
study, further research would be needed to examine the potential molecular mechanisms through
which this effect might act. However, it is also possible that the observed result is due to chance.
Accumulating evidence over the past decade suggests that, beyond its traditional role in bone
metabolism and calcium homeostasis, vitamin D has important functions as a modulator of
immune function and inflammation (144;248). Previous studies have also reported inverse
associations between biomarkers of glycemic dysregulation and 25(OH)D (30;182;290),
suggesting a role for vitamin D in maintaining or improving glucose control. Some evidence also
indicates a potential role for this micronutrient in adipocyte differentiation and regulation of LPL
activity, suggesting an involvement in lipid metabolism (169;358). Finally, two recent studies
identified hundreds of genetic targets of vitamin D action across the human genome, suggesting
widespread effects across numerous physiologic pathways, in particular those associated with
innate immunity (27;145). However, despite examining a large number of biomarkers, the
present study found little evidence for a relationship between circulating 25(OH)D, VDR genetic
variants and these physiologic pathways. It is possible that the observed lack of effects is due to
the young age and relative good health of our study population. These relationships may be more
easily observed in older adults with overt cardiometabolic disease, where circulating plasma
biomarkers may better reflect metabolic dysregulation.
A recent study identified a VDR variant, rs7968585, that predicted risk for hip fracture, cancer,
myocardial infarction, and mortality among older Caucasian individuals with a low vitamin D
status (38). We observed no relationships between this SNP, circulating 25(OH)D and any of the
biomarkers examined. It is possible that the effects of this variant are only apparent in the
context of severe outcomes such as those examined in (38). Nonetheless, studies such as that
(38) highlight the importance of considering gene-environment interactions in the context of
vitamin D and disease. Indeed, one recent study reported an effect of FokI, a traditional VDR
restriction fragment length polymorphism, on the association between vitamin D
supplementation and improved insulin sensitivity in a small cohort of South Asian women living
in New Zealand (370). Another study reported that FokI modifies the response to vitamin D
136
supplementation in subjects with T2D, where those who were homozygous for the risk allele saw
lesser improvements in levels of inflammatory biomarkers than heterozygotes and non-risk allele
homozygotes (268). Given these findings, one important strength of the present study is its
consideration of the joint effects of genetic variation and vitamin D status on the assessed
biomarkers. Furthermore, we examined variants across VDR, rather than focusing exclusively on
a few commonly assessed polymorphisms. This approach allows for the identification of
potential non-traditional VDR SNPs that may be implicated in disease risk.
In addition to the limitations already mentioned, the present study has several other drawbacks.
The VDR gene encodes the transcription factor that mediates the majority of the biological
effects of vitamin D and, as such, variants within this gene may play important roles in the
relationship between vitamin D and disease-related processes. However, it is possible that
variation in other genes along the vitamin D pathway may affect some of the relationships
examined here. The genetic variants chosen for analysis were drawn from those available in the
Affymetrix 6.0 chip. Thus, other potentially important SNPs not present in that chip may have
been excluded. The study population consisted only of Caucasian individuals and was relatively
small in size, especially considering the large number of SNPs and biomarkers examined. While
we corrected for multiple testing so as to minimize the chances of reporting spurious
associations, it is possible that the observed results are due to chance.
In summary, we examined the effect of 25(OH)D on the association between 27 variants across
VDR and cardiometabolic disease biomarkers, including inflammation, glucose and lipid
metabolism, and the plasma proteome, in young Caucasian adults. We identified an association
between the VDR variant rs2239182 and the inflammatory biomarker IP-10 that was modified by
25(OH)D. Among individuals with a low vitamin D status, heterozygotes had higher IP-10
concentrations than either group of homozygotes. This observation seemed indicative of
heterosis, making its biological interpretation difficult, and it may have been due to chance. No
other associations were significantly modified by vitamin D status. These results suggest that, in
this population of healthy young adults, vitamin D status does not seem to interact with VDR
variants to affect biomarkers of cardiometabolic disease.

137
Chapter 7 : Summary, Limitations, Future Directions and Implications
138
7.1 Summary
The overall goal of this thesis was to determine the association between 25(OH)D and
biomarkers of cardiometabolic disease risk, including biomarkers of inflammation, glycemic
dysregulation and lipid metabolism and plasma proteomic biomarkers, and to examine whether
lifestyle factors (specifically, HC use among women) and genetic variation in the vitamin D
pathway (in particular, genetic variation in VDR) modify these associations.
Objective 1: To examine the association between 25(OH)D and CRP, and to determine whether
HC use modifies this association.
Results: Across ethnic groups, women HC users had higher 25(OH)D and CRP than women HC
non-users and men (p<0.008 and <0.0001, respectively) (thesis chapter 2). Circulating 25(OH)D
was positively associated with CRP in the entire population in models not accounting for HC use
(β=0.010±0.003; p<0.0001). However, there was no association when men and women HC non-
users were examined separately. Among women HC users, there was no association after
accounting for hormone dose. A positive association between 25(OH)D and CRP among
individuals above the median 25(OH)D (≥51.9 nmol/L) was not significant after adjustment for
HC use. No association was observed among individuals below the median. These results
suggest that HC use confounds a positive association between 25(OH)D and CRP.
Objective 2: To examine the association between plasma 25(OH)D and pro-inflammatory
cytokines, and to determine whether HC use modifies this association.
Results: There were crude correlations between 25(OH)D, IP-10 (Pearson's r=0.12, p<0.0001),
and RANTES (r=0.22, p<0.0001), but no other cytokines (thesis chapter 3). However, after full
covariate adjustment, 25(OH)D was not associated with any cytokine. These results suggest that
25(OH)D is not associated with systemic biomarkers of inflammation in healthy young adults.
Objective 3: To examine the association between 25(OH)D and biomarkers of glucose and lipid
metabolism, and to determine whether HC use modifies this association.
Results: Plasma 25(OH)D concentrations fluctuated seasonally among Caucasians and East
Asians and across men, women HC non-users, and women HC users, but they remained low
year-round in South Asians, half of whom were vitamin D-deficient (thesis chapter 4). Vitamin
139
D deficiency was associated with higher insulin, HOMA-IR, and HOMA-Beta among
Caucasians and East Asians and among men and women HC non-users, and with higher
triglycerides among men only. No biomarkers were associated with 25(OH)D among South
Asians and women HC users, although non-significant trends were observed for higher markers
of glycemic dysregulation in those who were vitamin D-deficient. These results suggest that
vitamin D deficiency is associated with biomarkers of glycemic dysregulation; however, HC use
among women may attenuate this association.
Objective 4: To examine the association between 25(OH)D and plasma proteomic biomarkers,
and to determine whether HC use modifies this association.
Results: The 54 proteins included in the proteomics panel used in this study clustered into four
distinct plasma proteomic profiles (thesis chapter 5). A positive association was observed
between Profile 1, containing positive acute phase proteins, and 25(OH)D. In women HC users, a
J-shaped association existed between Profile 1 and 25(OH)D, but no associations existed in
women HC non-users and men. Twelve proteins were individually associated with 25(OH)D in
women HC users, but only two were associated with 25(OH)D in women HC non-users and no
associations were observed in men. After accounting for hormone dose among women HC users,
only three proteins were associated with 25(OH)D. These results suggest that HC use may be an
important confounder of the association between circulating 25(OH)D and numerous plasma
proteins.
Objective 5: To examine whether genetic variants in the VDR are associated with biomarkers of
inflammation, biomarkers of glucose and lipid metabolism, and plasma proteomic biomarkers,
and to determine whether vitamin D status modifies these associations.
Results: 25(OH)D affected the association between rs2239182 and IP-10 (p=0.0005) (thesis
chapter 6). Among individuals in the lowest vitamin D tertile, heterozygotes had higher IP-10
concentrations than minor and major allele homozygotes. The association was suggestive of
heterosis and may have been due to chance. No other vitamin D status x VDR interactions were
statistically significant. These results suggest that, in this population, 25(OH)D does not seem to
interact with VDR variants to affect biomarkers of cardiometabolic disease.
140
7.1.1 Relationship with Inflammation
Overall, the results of the present thesis suggest that 25(OH)D is not associated with biomarkers
of systemic inflammation, including CRP and various cytokines, in young adults. Furthermore,
initially we observed unexpected positive associations between 25(OH)D and two inflammatory
biomarkers, namely CRP and RANTES. As indicated by the results of chapters 2 and 3, these
associations were confounded by HC use among women, but genetic variation across VDR does
not appear to modify the association between 25(OH)D and any inflammatory biomarker
(chapter 6).
A wealth of experimental evidence supports a role for vitamin D in modulating inflammatory
processes. Indeed, in vitro and animal studies have shown that 1,25(OH)D2 downregulates the
production of pro-inflammatory cytokines such as IFN-γ and IL-2 and it upregulates the
transcription of immuno-supressive cytokines such as IL-10 (250-253). However,
epidemiological studies and clinical trials have yielded inconsistent results, with some suggesting
an inverse association between circulating concentrations of (25(OH)D) and pro-inflammatory
cytokines, acute phase proteins and hemostatic markers (85;254;256-259), while others found
null associations between 25(OH)D and markers of inflammation (241;261-266). Furthermore,
using NHANES data, one recent study reported a positive association between 25(OH)D and
CRP among vitamin D-sufficient adults (267). These inconsistencies between studies may be due
to unaccounted confounders.
The present work is the first to examine the modifying effect of HC use on the relationship
between 25(OH)D and inflammation. These medications have often been overlooked as
potentially important confounders of the relationship between 25(OH)D and various disease-
related outcomes. Use of HC has been linked to elevated 25(OH)D (188), a relationship thought
to be mediated, at least in part, by estrogen's downregulation of CYP24A1, the main catabolic
enzyme in the vitamin D pathway (190;193). However, most studies were conducted in
individuals of European or African ancestry, and the effects of these medications on 25(OH)D in
other ethnic groups have been less well understood. The present thesis found that women who
used HC had higher 25(OH)D across ethnic groups. At the same time, HC use has also been
associated with changes in numerous physiologic pathways, increased inflammation and a poorer
metabolic profile (198;199;203;206;207). Our finding that adjustment for HC use attenuates a
141
positive association between 25(OH)D and CRP, as well as RANTES, might partly account for
some of the unexpected results of previous studies.
Considering the wealth of experimental evidence for anti-inflammatory effects of vitamin D, the
lack of evidence for an inverse association between 25(OH)D and biomarkers of inflammation
may seem surprising. It is important to note that our study population consisted of healthy young
adults. It is possible that the anti-inflammatory effects of vitamin D may be more apparent in
older or more diseased populations with a greater burden of systemic inflammation that can be
more easily measured through biomarkers circulating in the blood. Indeed, several studies that
have reported beneficial effects of vitamin D on inflammation were conducted in obese
individuals or those with T2D (31;85). Furthermore, it is also possible that 25(OH)D
concentrations higher than those found among our study participants are necessary to observe its
effects on immune modulation at the systemic level.
7.1.2 Relationship with Glycemic Dysregulation
The present thesis shows an inverse association between 25(OH)D and biomarkers of glycemic
dysregulation, in particular insulin, HOMA-IR and HOMA-Beta (chapter 4). However, the
association was only significant in men and in women who did not use HC, as well as
Caucasians and East Asians. In women who used HC and South Asians, no significant
association was present. Furthermore, VDR variants did not appear to modify the relationship
between 25(OH)D and biomarkers of glycemic dysregulation (chapter 6).
The results of this thesis are in line with previous cross-sectional and prospective studies
showing an inverse relationship between circulating 25(OH)D and glycemic status measures
(30;183;280;281;285). Indeed, experimental evidence suggests that vitamin D may improve
insulin secretion and also upregulate the expression of insulin receptors, leading to increased
insulin sensitivity (26;272). In the present study, fasting insulin and HOMA-IR were inversely
associated with 25(OH)D, but fasting glucose measures were similar regardless of vitamin D
status. This observation suggests that, in this population of primarily healthy young adults,
individuals with low circulating 25(OH)D may be able to compensate for a reduced insulin
sensitivity through elevated insulin production, in order to maintain normal glucose
concentrations. However, as these individuals age, sustained elevated production of insulin by
the pancreas to counteract high circulating glucose may result in both insulin resistance and β-
142
cell dysfunction. Our results suggest that the onset of these conditions may already be underway
among vitamin D-deficient young adults.
To our knowledge, no other study has directly examined the association between vitamin D and
cardiometabolic disease biomarkers separately across women HC users, women HC non-users
and men. In addition to their previously mentioned effects on 25(OH)D concentrations, these
medications are associated with decreased insulin sensitivity in healthy, non-obese young women
(204;337;345). Overall, the results of this thesis suggest that, among women who use HC, the
potential benefits of elevated circulating 25(OH)D on glucose metabolism may be attenuated by
potential deleterious effects of HC on this pathway (204;207). However, it is important to note
that no statistical interaction existed between 25(OH)D and HC use for biomarkers of glucose
metabolism (chapter 4). It is possible that the lack of association between 25(OH)D and any
biomarkers in women HC users may have been due to the smaller sample size of this group.
Future studies with larger sample sizes are needed to further examine the potential effects of HC
use on the association between 25(OH)D and glucose metabolism.
The lack of association between 25(OH)D and markers of glucose metabolism in South Asians
may be a result of the small size of this subgroup, combined with their overall low vitamin D
status (chapter 4). Indeed, the results of the present thesis confirm previous observations that the
prevalence of vitamin D deficiency in individuals of this ethnic group living in Canada is very
high and their vitamin D status remains low year-round (153).
7.1.3 Relationship with Lipid Metabolism
Overall, the present thesis found no association between 25(OH)D and any markers of lipid
metabolism, except for an inverse relationship with triglycerides that was apparent in men only
(chapter 4). Genetic variation in VDR did not explain the observed lack of association between
25(OH)D and biomarkers of lipid metabolism (chapter 6).
Although some studies have noted inverse trends between 25(OH)D and a pro-atherogenic lipid
profile, the results have been inconsistent (239;291;306). Furthermore, while some mechanisms
have been proposed, the biological link between vitamin D and lipid metabolism remains
unclear. With respect to triglycerides, it is possible that 1,25(OH)2D, the biologically active
vitamin D metabolite, upregulates LPL activity in adipocytes, leading to decreased circulating
143
triglyceride concentrations (169). Whether biological differences between the sexes account for
the observed lack of association between 25(OH)D and triglycerides in women remains to be
ascertained.
7.1.4 Relationship with the Plasma Proteome
After accounting for HC use, 25(OH)D was not associated with most of the 54 high-abundance
plasma proteins surveyed (chapter 5). Furthermore, genetic variation in VDR did not modify any
associations (chapter 6).
Recent in vitro studies have examined 1,25(OH)2D action across the genome, using gene
expression and chromatin immunoprecipitation techniques (27;145). Hundreds of target genes,
belonging mainly to immune and signaling pathways, have been identified, and many are known
to be associated with diseases such as type 1 diabetes, Crohn's disease, multiple sclerosis, and
colorectal cancer. The research in this thesis is the first to examine whether these widespread
effects of vitamin D at the level of the genome translate into downstream effects at the level of
the plasma proteome. Our results suggest that HC use is an important confounder of the
relationship between 25(OH)D and the plasma proteome. Many of the proteins included in the
proteomics panel are acute phase reactants that belong to disease-associated pathways, such as
innate immunity, hemostasis and lipid metabolism. The observed overall lack of association
between 25(OH)D and the assessed proteins may reflect the young age and general good health
of the study population. Any effects of vitamin D may be more apparent in older or more
diseased populations, where there may be more pronounced differences in concentrations of the
assessed biomarkers across vitamin D status categories.
7.2 Limitations
The present thesis has a number of limitations. First, the cross-sectional study design precludes
drawing any conclusions about causality based on the observed associations. Analyses within
specific subgroups, in particular women HC users and South Asians, may be limited by the small
sample size of these groups. Alternatively, given the large number of independent tests
conducted in some of the thesis chapters, the observed associations may have been due to

144
chance. We attempted to minimize this possibility by using the Bonferroni correction for
multiple testing whenever necessary.
We were unable to assess whether estrogen or progesterone-derived HC components have
different effects on the associations examined here, and we also lacked information on
endogenous sex hormone concentrations. While we measured a comprehensive set of biomarkers
along several cardiometabolic disease-associated pathways, it is possible that 25(OH)D may be
associated with other biomarkers not assessed in the present thesis. Furthermore, in addition to
VDR, it is possible that variation in other genes along the vitamin D pathway may affect some of
the relationships examined here. Residual confounding from unidentified factors may also have
confounded the results presented here.
Finally, certain associations may have been more apparent in an older, more diseased population
with higher circulating concentrations of the assessed biomarkers. However, studying healthy
individuals provides a picture of physiologic status before the onset of disease, and
understanding how specific disease-associated pathways may be modulated by various
micronutrients at this stage provides the potential for developing nutrition-based strategies to
prevent later disease development.
7.3 Future Research
Our findings suggest that HC use among women may represent a potentially important
confounder that should be considered in any epidemiologic studies examining the association
between vitamin D and cardiometabolic disease. Adequately powered longitudinal studies and
clinical trials that examine the effect of various types of sex hormone-based medications, as well
as endogenous hormones, on the relationship between vitamin D and specific outcomes are
needed to further document how sex hormones modulate the effects of vitamin D. In addition,
experimental studies conducted in cell culture and animal models are needed to better understand
the mechanisms through which estrogen, and potentially other sex hormones, mediates the
relationship between vitamin D and various physiologic processes. An increasing number of
recent studies suggests that genetic variants along the vitamin D pathway may affect certain
disease outcomes (38;212;268). Indeed, a large, long-term prospective study recently identified a
145
novel association between a VDR variant and a composite of risk for hip fracture, cancer,
myocardial infarction, and mortality that was only apparent in individuals with a low vitamin D
status (38). Studies such as (38) highlight the importance of taking into account gene-
environment interactions when examining the relationship between vitamin D and disease. While
the present thesis found that no VDR variants, including the one assessed in (38), modified the
association between 25(OH)D and any biomarkers, large studies are needed to examine the
potential effects of variants in VDR and other vitamin D pathway genes on the relationship
between vitamin D status and various disease-related outcomes across ethnic groups.
7.4 Implications
The most important implication of this work is that it highlights the importance of accounting for
HC use among women in any studies examining the relationship between vitamin D and
biomarkers of cardiometabolic disease, as well as potentially other diseases. Our finding that HC
use may confound or attenuate several of the assessed relationships might help explain some of
the inconsistencies observed across previous studies.
HC are used by over 100 million women throughout the world, not only to prevent unwanted
pregnancies but also to treat various other conditions such as acne, polycystic ovarian syndrome
and endometriosis (204;205). Therefore, understanding the extent to which they might modify
the relationship between vitamin D and disease outcomes is of potentially great public health
importance.
The present thesis also lends further support to the increasingly accepted view that vitamin D
may play a beneficial role in certain non-skeletal health outcomes, namely glycemic regulation.
Furthermore, our work highlights the widespread prevalence of vitamin D deficiency in certain
ethnocultural groups in Canada, particularly South Asians, as many of 50% of whom were
vitamin D-deficient based on the IOM's definition of deficiency, which is arguably quite
conservative. Given the potential benefits of vitamin D on glucose metabolism that may already
be present in young adults, efforts to improve vitamin D status in sub-groups at risk of deficiency
are warranted and may have a potentially large public health impact.
146
7.5 Thesis Summary
In summary, the present thesis examined the relationship between 25(OH)D and biomarkers of
inflammation, glucose and lipid metabolism, and the plasma proteome, and assessed the potential
effects of HC use and genetic variants across VDR on these relationships. We identified a
confounding effect of HC use on the association between 25(OH)D, biomarkers of inflammation
and plasma proteomic biomarkers. In addition, HC use appeared to attenuate an inverse
association between 25(OH)D and biomarkers of glycemic dysregulation. Genetic variation in
VDR did not modify any associations.
147
References
1. Kraushaar LE, Kramer A. Are we losing the battle against cardiometabolic
disease? The case for a paradigm shift in primary prevention. BMC Public Health
2009;9:64.
2. Leiter LA, Fitchett DH, Gilbert RE, Gupta M, Mancini GB, McFarlane PA, Ross
R, Teoh H, Verma S, Anand S et al. Cardiometabolic risk in Canada: a detailed analysis
and position paper by the cardiometabolic risk working group. Can J Cardiol 2011;27:e1-
e33.
3. Barzilay JI, Abraham L, Heckbert SR, Cushman M, Kuller LH, Resnick HE,
Tracy RP. The relation of markers of inflammation to the development of glucose
disorders in the elderly: the Cardiovascular Health Study. Diabetes 2001;50:2384-9.
4. Adameova A, Xu YJ, Duhamel TA, Tappia PS, Shan L, Dhalla NS. Anti-
atherosclerotic molecules targeting oxidative stress and inflammation. Curr Pharm Des
2009;15:3094-107.
5. Hu FB, Meigs JB, Li TY, Rifai N, Manson JE. Inflammatory markers and risk of
developing type 2 diabetes in women. Diabetes 2004;53:693-700.
6. Krogh-Madsen R, Plomgaard P, Moller K, Mittendorfer B, Pedersen BK.
Influence of TNF-alpha and IL-6 infusions on insulin sensitivity and expression of IL-18
in humans. Am J Physiol Endocrinol Metab 2006;291:E108-E114.
7. Laaksonen DE, Niskanen L, Nyyssonen K, Punnonen K, Tuomainen TP,
Valkonen VP, Salonen R, Salonen JT. C-reactive protein and the development of the
metabolic syndrome and diabetes in middle-aged men. Diabetologia 2004;47:1403-10.
8. Jenny NS, Arnold AM, Kuller LH, Tracy RP, Psaty BM. Serum amyloid P and
cardiovascular disease in older men and women: results from the Cardiovascular Health
Study. Arterioscler Thromb Vasc Biol 2007;27:352-8.
9. Hage FG, Szalai AJ. C-reactive protein gene polymorphisms, C-reactive protein
blood levels, and cardiovascular disease risk. J Am Coll Cardiol 2007;50:1115-22.
10. Lopez-Garcia E, Schulze MB, Fung TT, Meigs JB, Rifai N, Manson JE, Hu FB.
Major dietary patterns are related to plasma concentrations of markers of inflammation
and endothelial dysfunction. Am J Clin Nutr 2004;80:1029-35.
11. Nettleton JA, Schulze MB, Jiang R, Jenny NS, Burke GL, Jacobs DR, Jr. A
priori-defined dietary patterns and markers of cardiovascular disease risk in the Multi-
Ethnic Study of Atherosclerosis (MESA). Am J Clin Nutr 2008;88:185-94.
12. Nettleton JA, Matijevic N, Folsom AR, Boerwinkle E. Associations between
dietary patterns and flow cytometry-measured biomarkers of inflammation and cellular
activation in the Atherosclerosis Risk in Communities (ARIC) Carotid Artery MRI
Study. Atherosclerosis 2010;212:260-7.
13. Brighenti F, Valtuena S, Pellegrini N, Ardigo D, Del RD, Salvatore S, Piatti P,
Serafini M, Zavaroni I. Total antioxidant capacity of the diet is inversely and
148
independently related to plasma concentration of high-sensitivity C-reactive protein in
adult Italian subjects. Br J Nutr 2005;93:619-25.
14. Detopoulou P, Panagiotakos DB, Antonopoulou S, Pitsavos C, Stefanadis C.
Dietary choline and betaine intakes in relation to concentrations of inflammatory markers
in healthy adults: the ATTICA study. Am J Clin Nutr 2008;87:424-30.
15. Esposito K, Marfella R, Ciotola M, Di PC, Giugliano F, Giugliano G, D'Armiento
M, D'Andrea F, Giugliano D. Effect of a mediterranean-style diet on endothelial
dysfunction and markers of vascular inflammation in the metabolic syndrome: a
randomized trial. JAMA 2004;292:1440-6.
16. Bakker GC, van Erk MJ, Pellis L, Wopereis S, Rubingh CM, Cnubben NH,
Kooistra T, van OB, Hendriks HF. An antiinflammatory dietary mix modulates
inflammation and oxidative and metabolic stress in overweight men: a nutrigenomics
approach. Am J Clin Nutr 2010;91:1044-59.
17. Lavie CJ, Lee JH, Milani RV. Vitamin D and cardiovascular disease will it live
up to its hype? J Am Coll Cardiol 2011;58:1547-56.
18. Maxmen A. Nutrition advice: the vitamin D-lemma. Nature 2011;475:23-5.
19. Rosen CJ, Adams JS, Bikle DD, Black DM, Demay MB, Manson JE, Murad MH,
Kovacs CS. The nonskeletal effects of vitamin D: an Endocrine Society scientific
statement. Endocr Rev 2012;33:456-92.
20. Vieth R, Bischoff-Ferrari H, Boucher BJ, Dawson-Hughes B, Garland CF,
Heaney RP, Holick MF, Hollis BW, Lamberg-Allardt C, McGrath JJ et al. The urgent
need to recommend an intake of vitamin D that is effective. Am J Clin Nutr 2007;85:649-
50.
21. Shapses SA, Manson JE. Vitamin D and prevention of cardiovascular disease and
diabetes: why the evidence falls short. JAMA 2011;305:2565-6.
22. Manson JE, Mayne ST, Clinton SK. Vitamin D and prevention of cancer--ready
for prime time? N Engl J Med 2011;364:1385-7.
23. Holick MF, Binkley NC, Bischoff-Ferrari HA, Gordon CM, Hanley DA, Heaney
RP, Murad MH, Weaver CM. Evaluation, treatment, and prevention of vitamin D
deficiency: an Endocrine Society clinical practice guideline. J Clin Endocrinol Metab
2011;96:1911-30.
24. Hanley DA, Cranney A, Jones G, Whiting SJ, Leslie WD, Cole DE, Atkinson SA,
Josse RG, Feldman S, Kline GA et al. Vitamin D in adult health and disease: a review
and guideline statement from Osteoporosis Canada. CMAJ 2010;182:E610-E618.
25. Maestro B, D+ívila N, Carranza MC, Calle C. Identification of a Vitamin D
response element in the human insulin receptor gene promoter. Journal of Steroid
Biochemistry and Molecular Biology 2003;84:223-30.
26. Maestro B, Campion J, Davila N, Calle C. Stimulation by 1,25-dihydroxyvitamin
D3 of insulin receptor expression and insulin responsiveness for glucose transport in U-
937 human promonocytic cells. Endocr J 2000;47:383-91.
149
27. Ramagopalan SV, Heger A, Berlanga AJ, Maugeri NJ, Lincoln MR, Burrell A,
Handunnetthi L, Handel AE, Disanto G, Orton SM et al. A ChIP-seq defined genome-
wide map of vitamin D receptor binding: associations with disease and evolution.
Genome Res 2010;20:1352-60.
28. van Etten E, Mathieu C. Immunoregulation by 1,25-dihydroxyvitamin D3: basic
concepts. J Steroid Biochem Mol Biol 2005;97:93-101.
29. Brenner DR, Arora P, Garcia-Bailo B, Wolever TM, Morrison H, El-Sohemy A,
Karmali M, Badawi A. Plasma vitamin D levels and risk of metabolic syndrome in
Canadians. Clin Invest Med 2011;34:E377.
30. Kayaniyil S, Retnakaran R, Harris SB, Vieth R, Knight JA, Gerstein HC, Perkins
BA, Zinman B, Hanley AJ. Prospective associations of vitamin D with beta-cell function
and glycemia: the PROspective Metabolism and ISlet cell Evaluation (PROMISE) cohort
study. Diabetes 2011;60:2947-53.
31. Neyestani TR, Nikooyeh B, avi-Majd H, Shariatzadeh N, Kalayi A, Tayebinejad
N, Heravifard S, Salekzamani S, Zahedirad M. Improvement of vitamin D status via daily
intake of fortified yogurt drink either with or without extra calcium ameliorates systemic
inflammatory biomarkers, including adipokines, in the subjects with type 2 diabetes. J
Clin Endocrinol Metab 2012;97:2005-11.
32. Nikooyeh B, Neyestani TR, Farvid M, avi-Majd H, Houshiarrad A, Kalayi A,
Shariatzadeh N, Gharavi A, Heravifard S, Tayebinejad N et al. Daily consumption of
vitamin D- or vitamin D + calcium-fortified yogurt drink improved glycemic control in
patients with type 2 diabetes: a randomized clinical trial. Am J Clin Nutr 2011;93:764-71.
33. Mitri J, wson-Hughes B, Hu FB, Pittas AG. Effects of vitamin D and calcium
supplementation on pancreatic beta cell function, insulin sensitivity, and glycemia in
adults at high risk of diabetes: the Calcium and Vitamin D for Diabetes Mellitus
(CaDDM) randomized controlled trial. Am J Clin Nutr 2011;94:486-94.
34. Bucharles S, Barberato SH, Stinghen AE, Gruber B, Piekala L, Dambiski AC,
Custodio MR, Pecoits-Filho R. Impact of cholecalciferol treatment on biomarkers of
inflammation and myocardial structure in hemodialysis patients without
hyperparathyroidism. J Ren Nutr 2012;22:284-91.
35. Pittas AG, Chung M, Trikalinos T, Mitri J, Brendel M, Patel K, Lichtenstein AH,
Lau J, Balk EM. Systematic review: Vitamin D and cardiometabolic outcomes. Ann
Intern Med 2010;152:307-14.
36. Elamin MB, bu Elnour NO, Elamin KB, Fatourechi MM, Alkatib AA, Almandoz
JP, Liu H, Lane MA, Mullan RJ, Hazem A et al. Vitamin D and cardiovascular outcomes:
a systematic review and meta-analysis. J Clin Endocrinol Metab 2011;96:1931-42.
37. Mitri J, Muraru MD, Pittas AG. Vitamin D and type 2 diabetes: a systematic
review. Eur J Clin Nutr 2011;65:1005-15.
38. Levin GP, Robinson-Cohen C, de B, I, Houston DK, Lohman K, Liu Y,
Kritchevsky SB, Cauley JA, Tanaka T, Ferrucci L et al. Genetic Variants and
Associations of 25-Hydroxyvitamin D Concentrations With Major Clinical Outcomes.
JAMA 2012;308:1898-905.
150
39. Lee DS, Chiu M, Manuel DG, Tu K, Wang X, Austin PC, Mattern MY, Mitiku
TF, Svenson LW, Putnam W et al. Trends in risk factors for cardiovascular disease in
Canada: temporal, socio-demographic and geographic factors. CMAJ 2009;181:E55-E66.
40. Canadian Diabetes Association. The prevalence and costs of diabetes. 2012.
http://www.diabetes.ca/documents/about-diabetes/PrevalanceandCost_09.pdf. Accessed
February 2013.
41. Chatterjee A, Harris SB, Leiter LA, Fitchett DH, Teoh H, Bhattacharyya OK.
Managing cardiometabolic risk in primary care: summary of the 2011 consensus
statement. Can Fam Physician 2012;58:389-201.
42. Public Health Agency of Canada. Economic Burden of Illness in Canada, 2000.
http://www.phac-aspc.gc.ca/cd-mc/cvd-mcv/cvd_ebic-mcv_femc-eng.php. Accessed
February 2013.
43. Reaven GM. Role of insulin resistance in human disease (syndrome X): an
expanded definition. Annu Rev Med 1993;44:121-31.
44. Alberti KG, Eckel RH, Grundy SM, Zimmet PZ, Cleeman JI, Donato KA,
Fruchart JC, James WP, Loria CM, Smith SC, Jr. Harmonizing the metabolic syndrome:
a joint interim statement of the International Diabetes Federation Task Force on
Epidemiology and Prevention; National Heart, Lung, and Blood Institute; American
Heart Association; World Heart Federation; International Atherosclerosis Society; and
International Association for the Study of Obesity. Circulation 2009;120:1640-5.
45. Executive Summary of The Third Report of The National Cholesterol Education
Program (NCEP) Expert Panel on Detection, Evaluation, And Treatment of High Blood
Cholesterol In Adults (Adult Treatment Panel III). JAMA 2001;285:2486-97.
46. Grundy SM, Brewer HB, Jr., Cleeman JI, Smith SC, Jr., Lenfant C. Definition of
metabolic syndrome: Report of the National Heart, Lung, and Blood Institute/American
Heart Association conference on scientific issues related to definition. Circulation
2004;109:433-8.
47. Alberti KG, Zimmet PZ. Definition, diagnosis and classification of diabetes
mellitus and its complications. Part 1: diagnosis and classification of diabetes mellitus
provisional report of a WHO consultation. Diabet Med 1998;15:539-53.
48. Balkau B, Charles MA. Comment on the provisional report from the WHO
consultation. European Group for the Study of Insulin Resistance (EGIR). Diabet Med
1999;16:442-3.
49. International Diabetes Federation. The IDF consensus global definition of the
metabolic syndrome. 2006. http://www.idf.org/webdata/docs/IDF_Meta_def_final.pdf.
Accessed February 2013.
50. Despres JP, Lemieux I, Bergeron J, Pibarot P, Mathieu P, Larose E, Rodes-Cabau
J, Bertrand OF, Poirier P. Abdominal obesity and the metabolic syndrome: contribution
to global cardiometabolic risk. Arterioscler Thromb Vasc Biol 2008;28:1039-49.
51. Despres JP, Lemieux I. Abdominal obesity and metabolic syndrome. Nature
2006;444:881-7.
151
52. Cornier MA, Dabelea D, Hernandez TL, Lindstrom RC, Steig AJ, Stob NR, Van
Pelt RE, Wang H, Eckel RH. The metabolic syndrome. Endocr Rev 2008;29:777-822.
53. Eckel RH, Grundy SM, Zimmet PZ. The metabolic syndrome. Lancet
2005;365:1415-28.
54. Tchernof A, Despres JP. Pathophysiology of human visceral obesity: an update.
Physiol Rev 2013;93:359-404.
55. Shoelson SE, Lee J, Goldfine AB. Inflammation and insulin resistance. J Clin
Invest 2006;116:1793-801.
56. Badawi A, Klip A, Haddad P, Cole DEC, Garcia Bailo B, El-Sohemy A, Karmali
M. Type 2 Diabetes Mellitus and Inflammation: Prospects for Biomarkers of Risk and
Nutritional Intervention. Diabetes, Metabolic Syndrome and Obesity: Targets and
Therapy 2010;3:173-86.
57. Hortin GL, Sviridov D, Anderson NL. High-abundance polypeptides of the
human plasma proteome comprising the top 4 logs of polypeptide abundance. Clin Chem
2008;54:1608-16.
58. Anderson L. Candidate-based proteomics in the search for biomarkers of
cardiovascular disease. J Physiol 2005;563:23-60.
59. Fischer K, Da Costa LA, Garcia-Bailo B, Borchers CH, El-Sohemy A.
Glutathione S-Transferase (GST) M1, but Not GSTT1, Genotype Influences Plasma
Proteomic Profiles in Caucasian and East Asian Young Adults. J Proteome Res
2012;11:5022-33.
60. Fernandez-Real JM, Pickup JC. Innate immunity, insulin resistance and type 2
diabetes. TRENDS Endocrin Metabol 2007;19:10-6.
61. Lau DC, Dhillon B, Yan H, Szmitko PE, Verma S. Adipokines: molecular links
between obesity and atheroslcerosis. Am J Physiol Heart Circ Physiol 2005;288:H2031-
H2041.
62. Szmitko PE, Teoh H, Stewart DJ, Verma S. Adiponectin and cardiovascular
disease: state of the art? Am J Physiol Heart Circ Physiol 2007;292:H1655-H1663.
63. Anand SS, Yusuf S, Vuksan V, Devanesen S, Teo KK, Montague PA, Kelemen
L, Yi C, Lonn E, Gerstein H et al. Differences in risk factors, atherosclerosis, and
cardiovascular disease between ethnic groups in Canada: the Study of Health Assessment
and Risk in Ethnic groups (SHARE). Lancet 2000;356:279-84.
64. Blackett PR, Sanghera DK. Genetic determinants of cardiometabolic risk: a
proposed model for phenotype association and interaction. J Clin Lipidol 2013;7:65-81.
65. Frayling TM, Timpson NJ, Weedon MN, Zeggini E, Freathy RM, Lindgren CM,
Perry JR, Elliott KS, Lango H, Rayner NW et al. A common variant in the FTO gene is
associated with body mass index and predisposes to childhood and adult obesity. Science
2007;316:889-94.
66. Rees SD, Islam M, Hydrie MZ, Chaudhary B, Bellary S, Hashmi S, O'Hare JP,
Kumar S, Sanghera DK, Chaturvedi N et al. An FTO variant is associated with Type 2

152
diabetes in South Asian populations after accounting for body mass index and waist
circumference. Diabet Med 2011;28:673-80.
67. Li H, Kilpelainen TO, Liu C, Zhu J, Liu Y, Hu C, Yang Z, Zhang W, Bao W, Cha
S et al. Association of genetic variation in FTO with risk of obesity and type 2 diabetes
with data from 96,551 East and South Asians. Diabetologia 2012;55:981-95.
68. Pausova Z, Syme C, Abrahamowicz M, Xiao Y, Leonard GT, Perron M, Richer
L, Veillette S, Smith GD, Seda O et al. A common variant of the FTO gene is associated
with not only increased adiposity but also elevated blood pressure in French Canadians.
Circ Cardiovasc Genet 2009;2:260-9.
69. Kathiresan S, Manning AK, Demissie S, D'Agostino RB, Surti A, Guiducci C,
Gianniny L, Burtt NP, Melander O, Orho-Melander M et al. A genome-wide association
study for blood lipid phenotypes in the Framingham Heart Study. BMC Med Genet
2007;8 Suppl 1:S17.
70. Kathiresan S, Melander O, Guiducci C, Surti A, Burtt NP, Rieder MJ, Cooper
GM, Roos C, Voight BF, Havulinna AS et al. Six new loci associated with blood low-
density lipoprotein cholesterol, high-density lipoprotein cholesterol or triglycerides in
humans. Nat Genet 2008;40:189-97.
71. Schafer SA, Machicao F, Fritsche A, Haring HU, Kantartzis K. New type 2
diabetes risk genes provide new insights in insulin secretion mechanisms. Diabetes Res
Clin Pract 2011;93 Suppl 1:S9-24.
72. Sanghera DK, Blackett PR. Type 2 Diabetes Genetics: Beyond GWAS. J Diabetes
Metab 2012;3.
73. Zeggini E, Groves CJ, Parkinson JR, Halford S, Owen KR, Frayling TM, Walker
M, Hitman GA, Levy JC, O'Rahilly S et al. Large-scale studies of the association
between variation at the TNF/LTA locus and susceptibility to type 2 diabetes.
Diabetologia 2005;48:2013-7.
74. Saxena R, Voight BF, Lyssenko V, Burtt NP, de Bakker PI, Chen H, Roix JJ,
Kathiresan S, Hirschhorn JN, Daly MJ et al. Genome-wide association analysis identifies
loci for type 2 diabetes and triglyceride levels. Science 2007;316:1331-6.
75. Scott LJ, Mohlke KL, Bonnycastle LL, Willer CJ, Li Y, Duren WL, Erdos MR,
Stringham HM, Chines PS, Jackson AU et al. A genome-wide association study of type 2
diabetes in Finns detects multiple susceptibility variants. Science 2007;316:1341-5.
76. Sladek R, Rocheleau G, Rung J, Dina C, Shen L, Serre D, Boutin P, Vincent D,
Belisle A, Hadjadj S et al. A genome-wide association study identifies novel risk loci for
type 2 diabetes. Nature 2007;445:881-5.
77. Genome-wide association study of 14,000 cases of seven common diseases and
3,000 shared controls. Nature 2007;447:661-78.
78. Zeggini E, Scott LJ, Saxena R, Voight BF, Marchini JL, Hu T, de Bakker PI,
Abecasis GR, Almgren P, Andersen G et al. Meta-analysis of genome-wide association
data and large-scale replication identifies additional susceptibility loci for type 2 diabetes.
Nat Genet 2008;40:638-45.
153
79. Deloukas P, Kanoni S, Willenborg C, Farrall M, Assimes TL, Thompson JR,
Ingelsson E, Saleheen D, Erdmann J, Goldstein BA et al. Large-scale association analysis
identifies new risk loci for coronary artery disease. Nat Genet 2013;45:25-33.
80. Yusuf S, Hawken S, Ounpuu S, Dans T, Avezum A, Lanas F, McQueen M, Budaj
A, Pais P, Varigos J et al. Effect of potentially modifiable risk factors associated with
myocardial infarction in 52 countries (the INTERHEART study): case-control study.
Lancet 2004;364:937-52.
81. Siri-Tarino PW, Sun Q, Hu FB, Krauss RM. Meta-analysis of prospective cohort
studies evaluating the association of saturated fat with cardiovascular disease. Am J Clin
Nutr 2010;91:535-46.
82. Siri-Tarino PW, Sun Q, Hu FB, Krauss RM. Saturated fat, carbohydrate, and
cardiovascular disease. Am J Clin Nutr 2010;91:502-9.
83. Estruch R, Ros E, Salas-Salvado J, Covas MI, Pharm D, Corella D, Aros F,
Gomez-Gracia E, Ruiz-Gutierrez V, Fiol M et al. Primary Prevention of Cardiovascular
Disease with a Mediterranean Diet. N Engl J Med 2013.
84. Kayaniyil S, Vieth R, Retnakaran R, Knight JA, Qi Y, Gerstein HC, Perkins BA,
Harris SB, Zinman B, Hanley AJ. Association of vitamin D with insulin resistance and
beta-cell dysfunction in subjects at risk for type 2 diabetes. Diabetes Care 2010;33:1379-
81.
85. Bellia A, Garcovich C, D'Adamo M, Lombardo M, Tesauro M, Donadel G,
Gentileschi P, Lauro D, Federici M, Lauro R et al. Serum 25-hydroxyvitamin D levels are
inversely associated with systemic inflammation in severe obese subjects. Intern Emerg
Med 2013;8:33-40.
86. Belenchia AM, Tosh AK, Hillman LS, Peterson CA. Correcting vitamin D
insufficiency improves insulin sensitivity in obese adolescents: a randomized controlled
trial. Am J Clin Nutr 2013; 97:774-81.
87. Kayaniyil S, Vieth R, Harris SB, Retnakaran R, Knight JA, Gerstein HC, Perkins
BA, Zinman B, Hanley AJ. Association of 25(OH)D and PTH with metabolic syndrome
and its traditional and nontraditional components. J Clin Endocrinol Metab 2011;96:168-
75.
88. Schottker B, Haug U, Schomburg L, Kohrle J, Perna L, Muller H, Holleczek B,
Brenner H. Strong associations of 25-hydroxyvitamin D concentrations with all-cause,
cardiovascular, cancer, and respiratory disease mortality in a large cohort study. Am J
Clin Nutr 2013;97:782-93.
89. Cummings J, Ward TH, Greystoke A, Ranson M, Dive C. Biomarker method
validation in anticancer drug development. Br J Pharmacol 2008;153:646-56.
90. Biomarkers and surrogate endpoints: preferred definitions and conceptual
framework. Clin Pharmacol Ther 2001;69:89-95.
91. Pickup JC. Inflammation and activated innate immunity in the pathogenesis of
type 2 diabetes. Diabetes Care 2004;27:813-23.
92. Medzhitov R, Janeway C. Innate immunity. N Engl J Med 2000;343:338-44.
154
93. Hotamisligil GS, Arner P, Caro JF, Atkinson RL, Spiegelman BM. Increased
adipose tissue expression of tumor necrosis factor-a in human obesity and insulin
resistance. J Clin Invest 1995;95:2409-15.
94. Calder PC, Albers R, Antoine JM, Blum S, Bourdet-Sicard R, Ferns GA, Folkerts
G, Friedmann PS, Frost GS, Guarner F et al. Inflammatory disease processes and
interactions with nutrition. Br J Nutr 2009;101 Suppl 1:S1-45.
95. Calder PC, Ahluwalia N, Albers R, Bosco N, Bourdet-Sicard R, Haller D, Holgate
ST, Jonsson LS, Latulippe ME, Marcos A et al. A consideration of biomarkers to be used
for evaluation of inflammation in human nutritional studies. Br J Nutr 2013;109 Suppl
1:S1-34.
96. Stumvoll M, Goldstein B, van Haeften T. Type 2 diabetes: principles of
pathogenesis and therapy. Lancet 2005;365:1333-46.
97. Gastaldelli A. Role of beta-cell dysfunction, ectopic fat accumulation and insulin
resistance in the pathogenesis of type 2 diabetes mellitus. Diabetes Res Clin Pract
2011;93 Suppl 1:S60-S65.
98. Bremer AA, Mietus-Snyder M, Lustig RH. Toward a unifying hypothesis of
metabolic syndrome. Pediatrics 2012;129:557-70.
99. Maedler K. Beta cells in type 2 diabetes - a crucial contribution to pathogenesis.
Diabetes Obes Metab 2008;10:408-20.
100. Lencioni C, Lupi R, Del PS. Beta-cell failure in type 2 diabetes mellitus. Curr
Diab Rep 2008;8:179-84.
101. Prentki M, Nolan CJ. Islet beta cell failure in type 2 diabetes. J Clin Invest
2006;116:1802-12.
102. DeFronzo RA, Tobin JD, Andres R. Glucose clamp technique: a method for
quantifying insulin secretion and resistance. Am J Physiol 1979;237:E214-E223.
103. Levy JC, Matthews DR, Hermans MP. Correct homeostasis model assessment
(HOMA) evaluation uses the computer program. Diabetes Care 1998;21:2191-2.
104. Wallace TM, Levy JC, Matthews DR. Use and abuse of HOMA modeling.
Diabetes Care 2004;27:1487-95.
105. Matthews DR, Hosker JP, Rudenski AS. Homeostasis model assessment: Insulin
resistance and beta-cell function from fasting plasma glucose and insulin concentrations
in man. Diabetologia 1985;28:412-9.
106. Bonora E, Targher G, Alberiche M, Bonadonna RC, Saggiani F, Zenere MB,
Monauni T, Muggeo M. Homeostasis model assessment closely mirrors the glucose
clamp technique in the assessment of insulin sensitivity: studies in subjects with various
degrees of glucose tolerance and insulin sensitivity. Diabetes Care 2000;23:57-63.
107. Emoto M, Nishizawa Y, Maekawa K, Hiura Y, Kanda H, Kawagishi T, Shoji T,
Okuno Y, Morii H. Homeostasis model assessment as a clinical index of insulin
resistance in type 2 diabetic patients treated with sulfonylureas. Diabetes Care
1999;22:818-22.

155
108. Brunzell JD, Davidson M, Furberg CD, Goldberg RB, Howard BV, Stein JH,
Witztum JL. Lipoprotein management in patients with cardiometabolic risk: consensus
statement from the American Diabetes Association and the American College of
Cardiology Foundation. Diabetes Care 2008;31:811-22.
109. Gropper SS, Smith JL, Groff JL. Advanced nutrition and human metabolism, 5th
edition. Belmont, CA: Wadsworth, 2005.
110. Steinberg D, Witztum JL. Lipoproteins and atherogenesis. Current concepts.
JAMA 1990;264:3047-52.
111. Durrington P. Dyslipidaemia. Lancet 2003;362:717-31.
112. Anderson TJ, Gregoire J, Hegele RA, Couture P, Mancini GB, McPherson R,
Francis GA, Poirier P, Lau DC, Grover S et al. 2012 update of the Canadian
Cardiovascular Society guidelines for the diagnosis and treatment of dyslipidemia for the
prevention of cardiovascular disease in the adult. Can J Cardiol 2013;29:151-67.
113. Sarwar N, Danesh J, Eiriksdottir G, Sigurdsson G, Wareham N, Bingham S,
Boekholdt SM, Khaw KT, Gudnason V. Triglycerides and the risk of coronary heart
disease: 10,158 incident cases among 262,525 participants in 29 Western prospective
studies. Circulation 2007;115:450-8.
114. Ninomiya JK, L'Italien G, Criqui MH, Whyte JL, Gamst A, Chen RS. Association
of the metabolic syndrome with history of myocardial infarction and stroke in the Third
National Health and Nutrition Examination Survey. Circulation 2004;109:42-6.
115. Miller M, Stone NJ, Ballantyne C, Bittner V, Criqui MH, Ginsberg HN, Goldberg
AC, Howard WJ, Jacobson MS, Kris-Etherton PM et al. Triglycerides and cardiovascular
disease: a scientific statement from the American Heart Association. Circulation
2011;123:2292-333.
116. Chait A, Brazg RL, Tribble DL, Krauss RM. Susceptibility of small, dense, low-
density lipoproteins to oxidative modification in subjects with the atherogenic lipoprotein
phenotype, pattern B. Am J Med 1993;94:350-6.
117. Greene DJ, Skeggs JW, Morton RE. Elevated triglyceride content diminishes the
capacity of high density lipoprotein to deliver cholesteryl esters via the scavenger
receptor class B type I (SR-BI). J Biol Chem 2001;276:4804-11.
118. Skeggs JW, Morton RE. LDL and HDL enriched in triglyceride promote
abnormal cholesterol transport. J Lipid Res 2002;43:1264-74.
119. Garcia-Bailo B, Brenner DR, Nielsen D, Lee HJ, Domanski D, Kuzyk M,
Borchers CH, Badawi A, Karmali MA, El-Sohemy A. Dietary patterns and ethnicity are
associated with distinct plasma proteomic groups. Am J Clin Nutr 2012;95:352-61.
120. Kuzyk MA, Smith D, Yang J, Cross TJ, Jackson AM, Hardie DB, Anderson NL,
Borchers CH. Multiple reaction monitoring-based, multiplexed, absolute quantitation of
45 proteins in human plasma. Mol Cell Proteomics 2009;8:1860-77.
121. Norman AW. From vitamin D to hormone D: fundamentals of the vitamin D
endocrine system essential for good health. Am J Clin Nutr 2008;88:491S-9S.
156
122. Norman AW. Sunlight, season, skin pigmentation, vitamin D, and 25-
hydroxyvitamin D: Integral components of the vitamin D endocrine system. American
Journal of Clinical Nutrition 1998;67:1108-10.
123. Holick MF. Sunlight and vitamin D for bone health and prevention of
autoimmune diseases, cancers, and cardiovascular disease. Am J Clin Nutr
2004;80:1678S-88S.
124. Holick MF. Vitamin D: evolutionary, physiological and health perspectives. Curr
Drug Targets 2011;12:4-18.
125. Holick MF. Vitamin D: A millenium perspective. J Cell Biochem 2003;88:296-
307.
126. Hess AF, Unger LJ, Pappenheimer AM. Experimental rickets in rats: VII. The
prevention of rickets by sunlight, by the rays of the mercury vapor lamp, and by the
carbon arc lamp. J Exp Med 1922;36:427-46.
127. Schlingmann KP, Kaufmann M, Weber S, Irwin A, Goos C, John U, Misselwitz J,
Klaus G, Kuwertz-Broking E, Fehrenbach H et al. Mutations in CYP24A1 and idiopathic
infantile hypercalcemia. N Engl J Med 2011;365:410-21.
128. Calvo MS, Whiting SJ, Barton CN. Vitamin D fortification in the United States
and Canada: current status and data needs. Am J Clin Nutr 2004;80:1710S-6S.
129. Holick MF, Tian XQ, Allen M. Evolutionary importance for the membrane
enhancement of the production of vitamin D3 in the skin of poikilothermic animals. Proc
Natl Acad Sci U S A 1995;92:3124-6.
130. Haddad JG, Matsuoka LY, Hollis BW, Hu YZ, Wortsman J. Human plasma
transport of vitamin D after its endogenous synthesis. J Clin Invest 1993;91:2552-5.
131. Tripkovic L, Lambert H, Hart K, Smith CP, Bucca G, Penson S, Chope G,
Hypponen E, Berry J, Vieth R et al. Comparison of vitamin D2 and vitamin D3
supplementation in raising serum 25-hydroxyvitamin D status: a systematic review and
meta-analysis. Am J Clin Nutr 2012;95:1357-64.
132. Reboul E, Borel P. Proteins involved in uptake, intracellular transport and
basolateral secretion of fat-soluble vitamins and carotenoids by mammalian enterocytes.
Prog Lipid Res 2011;50:388-402.
133. Speeckaert MM, Taes YE, De Buyzere ML, Christophe AB, Kaufman JM,
Delanghe JR. Investigation of the potential association of vitamin D binding protein with
lipoproteins. Ann Clin Biochem 2010;47:143-50.
134. Prosser DE, Jones G. Enzymes involved in the activation and inactivation of
vitamin D. Trends Biochem Sci 2004;29:664-73.
135. Haussler MR, Jurutka PW, Mizwicki M, Norman AW. Vitamin D receptor
(VDR)-mediated actions of 1alpha,25(OH)vitamin D: genomic and non-genomic
mechanisms. Best Pract Res Clin Endocrinol Metab 2011;25:543-59.
136. Nykjaer A, Dragun D, Walther D, Vorum H, Jacobsen C, Herz J, Melsen F,
Christensen EI, Willnow TE. An endocytic pathway essential for renal uptake and
activation of the steroid 25-(OH) vitamin D3. Cell 1999;96:507-15.
157
137. Hilpert J, Wogensen L, Thykjaer T, Wellner M, Schlichting U, Orntoft TF,
Bachmann S, Nykjaer A, Willnow TE. Expression profiling confirms the role of
endocytic receptor megalin in renal vitamin D3 metabolism. Kidney Int 2002;62:1672-
81.
138. Wacker M, Holick MF. Vitamin D - effects on skeletal and extraskeletal health
and the need for supplementation. Nutrients 2013;5:111-48.
139. Christakos S, Dhawan P, Liu Y, Peng X, Porta A. New insights into the
mechanisms of vitamin D action. J Cell Biochem 2003;88:695-705.
140. Shimada T, Hasegawa H, Yamazaki Y, Muto T, Hino R, Takeuchi Y, Fujita T,
Nakahara K, Fukumoto S, Yamashita T. FGF-23 is a potent regulator of vitamin D
metabolism and phosphate homeostasis. J Bone Miner Res 2004;19:429-35.
141. Overbergh L, Stoffels K, Waer M, Verstuyf A, Bouillon R, Mathieu C. Immune
regulation of 25-hydroxyvitamin D-1alpha-hydroxylase in human monocytic THP1 cells:
mechanisms of interferon-gamma-mediated induction. J Clin Endocrinol Metab
2006;91:3566-74.
142. Stoffels K, Overbergh L, Giulietti A, Verlinden L, Bouillon R, Mathieu C.
Immune regulation of 25-hydroxyvitamin-D3-1alpha-hydroxylase in human monocytes. J
Bone Miner Res 2006;21:37-47.
143. Zhang Y, Leung DY, Richers BN, Liu Y, Remigio LK, Riches DW, Goleva E.
Vitamin d inhibits monocyte/macrophage proinflammatory cytokine production by
targeting MAPK phosphatase-1. J Immunol 2012;188:2127-35.
144. Bouillon R, Carmeliet G, Verlinden L, van EE, Verstuyf A, Luderer HF, Lieben
L, Mathieu C, Demay M. Vitamin D and human health: lessons from vitamin D receptor
null mice. Endocr Rev 2008;29:726-76.
145. Heikkinen S, Vaisanen S, Pehkonen P, Seuter S, Benes V, Carlberg C. Nuclear
hormone 1alpha,25-dihydroxyvitamin D3 elicits a genome-wide shift in the locations of
VDR chromatin occupancy. Nucleic Acids Res 2011;39:9181-93.
146. Zehnder D, Bland R, Williams MC, McNinch RW, Howie AJ, Stewart PM,
Hewison M. Extrarenal expression of 25-hydroxyvitamin d(3)-1 alpha-hydroxylase. J
Clin Endocrinol Metab 2001;86:888-94.
147. Huhtakangas JA, Olivera CJ, Bishop JE, Zanello LP, Norman AW. The vitamin D
receptor is present in caveolae-enriched plasma membranes and binds 1 alpha,25(OH)2-
vitamin D3 in vivo and in vitro. Mol Endocrinol 2004;18:2660-71.
148. Fleet JC. Rapid, membrane-initiated actions of 1,25 dihydroxyvitamin D: what
are they and what do they mean? J Nutr 2004;134:3215-8.
149. Baz-Hecht M, Goldfine AB. The impact of vitamin D deficiency on diabetes and
cardiovascular risk. Curr Opin Endocrinol Diabetes Obes 2010;17:113-9.
150. Jones G. Pharmacokinetics of vitamin D toxicity. Am J Clin Nutr 2008;88:582S-
6S.
151. Institute of Medicine. Dietary Reference Intakes for Calcium and Vitamin D.
Washington, DC: National Academies Press, 2011.
158
152. Whiting SJ, Langlois KA, Vatanparast H, Greene-Finestone LS. The vitamin D
status of Canadians relative to the 2011 Dietary Reference Intakes: an examination in
children and adults with and without supplement use. Am J Clin Nutr 2011;94:128-35.
153. Gozdzik A, Barta JL, Weir A, Cole DE, Vieth R, Whiting SJ, Parra EJ. Serum 25-
hydroxyvitamin d concentrations fluctuate seasonally in young adults of diverse ancestry
living in toronto. J Nutr 2010;140:2213-20.
154. Schwalfenberg GK, Whiting SJ. A Canadian response to the 2010 Institute of
Medicine vitamin D and calcium guidelines. Public Health Nutr 2011;14:746-8.
155. Vieth R. Why the minimum desirable serum 25-hydroxyvitamin D level should be
75 nmol/L (30 ng/ml). Best Pract Res Clin Endocrinol Metab 2011;25:681-91.
156. Bischoff-Ferrari HA, Giovannucci E, Willett WC, Dietrich T, Dawson-Hughes B.
Estimation of optimal serum concentrations of 25-hydroxyvitamin D for multiple health
outcomes. Am J Clin Nutr 2006;84:18-28.
157. Webb AR, Kline L, Holick MF. Influence of season and latitude on the cutaneous
synthesis of vitamin D3: exposure to winter sunlight in Boston and Edmonton will not
promote vitamin D3 synthesis in human skin. J Clin Endocrinol Metab 1988;67:373-8.
158. Holick MF, Chen TC, Lu Z, Sauter E. Vitamin D and skin physiology: a D-
lightful story. J Bone Miner Res 2007;22 Suppl 2:V28-V33.
159. Willett WC. Nutritional Epidemiology. New York, NY: Oxford University Press,
1998.
160. Wu H, Gozdzik A, Barta JL, Wagner D, Cole DE, Vieth R, Parra EJ, Whiting SJ.
The development and evaluation of a food frequency questionnaire used in assessing
vitamin D intake in a sample of healthy young Canadian adults of diverse ancestry. Nutr
Res 2009;29:255-61.
161. Aasheim ET, Hofso D, Hjelmesaeth J, Birkeland KI, Bohmer T. Vitamin status in
morbidly obese patients: a cross-sectional study. Am J Clin Nutr 2008;87:362-9.
162. Alemzadeh R, Kichler J, Babar G, Calhoun M. Hypovitaminosis D in obese
children and adolescents: relationship with adiposity, insulin sensitivity, ethnicity, and
season. Metabolism 2008;57:183-91.
163. Cheng S, Massaro JM, Fox CS, Larson MG, Keyes MJ, McCabe EL, Robins SJ,
O'Donnell CJ, Hoffmann U, Jacques PF et al. Adiposity, cardiometabolic risk, and
vitamin D status: the Framingham Heart Study. Diabetes 2010;59:242-8.
164. Earthman CP, Beckman LM, Masodkar K, Sibley SD. The link between obesity
and low circulating 25-hydroxyvitamin D concentrations: considerations and
implications. Int J Obes (Lond) 2012;36:387-96.
165. Blum M, Dolnikowski G, Seyoum E, Harris SS, Booth SL, Peterson J, Saltzman
E, wson-Hughes B. Vitamin D(3) in fat tissue. Endocrine 2008;33:90-4.
166. Gonzalez-Molero I, Rojo-Martinez G, Morcillo S, Gutierrez C, Rubio E, Perez-
Valero V, Esteva I, Ruiz de Adana MS, Almaraz MC, Colomo N et al. Hypovitaminosis
D and incidence of obesity: a prospective study. Eur J Clin Nutr 2013.

159
167. Wood RJ. Vitamin D and adipogenesis: new molecular insights. Nutr Rev
2008;66:40-6.
168. Kong J, Li YC. Molecular mechanism of 1,25-dihydroxyvitamin D3 inhibition of
adipogenesis in 3T3-L1 cells. Am J Physiol Endocrinol Metab 2006;290:E916-E924.
169. Querfeld U, Hoffmann MM, Klaus G, Eifinger F, Ackerschott M, Michalk D,
Kern PA. Antagonistic effects of vitamin D and parathyroid hormone on lipoprotein
lipase in cultured adipocytes. J Am Soc Nephrol 1999;10:2158-64.
170. Rayalam S, la-Fera MA, Ambati S, Yang JY, Park HJ, Baile CA. Enhanced
effects of 1,25(OH)(2)D(3) plus genistein on adipogenesis and apoptosis in 3T3-L1
adipocytes. Obesity (Silver Spring) 2008;16:539-46.
171. Ortega RM, Lopez-Sobaler AM, Aparicio A, Bermejo LM, Rodriguez-Rodriguez
E, Perea JM, Andres P. Vitamin D status modification by two slightly hypocaloric diets
in young overweight/obese women. Int J Vitam Nutr Res 2009;79:71-8.
172. Teegarden D, White KM, Lyle RM, Zemel MB, Van L, Matkovic V, Craig BA,
Schoeller DA. Calcium and dairy product modulation of lipid utilization and energy
expenditure. Obesity (Silver Spring) 2008;16:1566-72.
173. Sneve M, Figenschau Y, Jorde R. Supplementation with cholecalciferol does not
result in weight reduction in overweight and obese subjects. Eur J Endocrinol
2008;159:675-84.
174. Zittermann A, Frisch S, Berthold HK, Gotting C, Kuhn J, Kleesiek K, Stehle P,
Koertke H, Koerfer R. Vitamin D supplementation enhances the beneficial effects of
weight loss on cardiovascular disease risk markers. Am J Clin Nutr 2009;89:1321-7.
175. Vimaleswaran KS, Berry DJ, Lu C, Tikkanen E, Pilz S, Hiraki LT, Cooper JD,
Dastani Z, Li R, Houston DK et al. Causal relationship between obesity and vitamin D
status: bi-directional Mendelian randomization analysis of multiple cohorts. PLoS Med
2013;10:e1001383.
176. Prentice A. Vitamin D deficiency: a global perspective. Nutr Rev 2008;66:S153-
S164.
177. Clemens TL, Adams JS, Henderson SL, Holick MF. Increased skin pigment
reduces the capacity of skin to synthesise vitamin D3. Lancet 1982;1:74-6.
178. Sulistyoningrum DC, Green TJ, Lear SA, Devlin AM. Ethnic-specific differences
in vitamin d status is associated with adiposity. PLoS One 2012;7:e43159.
179. Freedman BI, Register TC. Effect of race and genetics on vitamin D metabolism,
bone and vascular health. Nat Rev Nephrol 2012.
180. Freedman BI, Wagenknecht LE, Hairston KG, Bowden DW, Carr JJ, Hightower
RC, Gordon EJ, Xu J, Langefeld CD, Divers J. Vitamin d, adiposity, and calcified
atherosclerotic plaque in african-americans. J Clin Endocrinol Metab 2010;95:1076-83.
181. Harris SS. Does vitamin D deficiency contribute to increased rates of
cardiovascular disease and type 2 diabetes in African Americans? Am J Clin Nutr
2011;93:1175S-8S.
160
182. Alvarez JA, Ashraf AP, Hunter GR, Gower BA. Serum 25-hydroxyvitamin D and
parathyroid hormone are independent determinants of whole-body insulin sensitivity in
women and may contribute to lower insulin sensitivity in African Americans. Am J Clin
Nutr 2010;92:1344-9.
183. Scragg R, Sowers M, Bell C. Serum 25-hydroxyvitamin D, diabetes, and ethnicity
in the Third National Health and Nutrition Examination Survey. Diabetes Care
2004;27:2813-8.
184. Godschalk M, Levy JR, Downs RW, Jr. Glucocorticoids decrease vitamin D
receptor number and gene expression in human osteosarcoma cells. J Bone Miner Res
1992;7:21-7.
185. Skversky AL, Kumar J, Abramowitz MK, Kaskel FJ, Melamed ML. Association
of glucocorticoid use and low 25-hydroxyvitamin D levels: results from the National
Health and Nutrition Examination Survey (NHANES): 2001-2006. J Clin Endocrinol
Metab 2011;96:3838-45.
186. Kurahashi I, Matsunuma A, Kawane T, Abe M, Horiuchi N. Dexamethasone
enhances vitamin D-24-hydroxylase expression in osteoblastic (UMR-106) and renal
(LLC-PK1) cells treated with 1alpha,25-dihydroxyvitamin D3. Endocrine 2002;17:109-
18.
187. Sowers MR, Wallace RB, Hollis BW, Lemke JH. Parameters related to 25-OH-D
levels in a population-based study of women. Am J Clin Nutr 1986;43:621-8.
188. Harris SS, Dawson-Hughes B. The association of oral contraceptive use with
plasma 25-hydroxyvitamin D levels. J Am Coll Nutr 1998;17:282-4.
189. Bouillon R, van BH, de MP. The measurement of the vitamin D-binding protein
in human serum. J Clin Endocrinol Metab 1977;45:225-31.
190. Abbas S, Linseisen J, Slanger T, Kropp S, Mutschelknauss EJ, Flesch-Janys D,
Chang-Claude J. Serum 25-hydroxyvitamin D and risk of post-menopausal breast cancer-
-results of a large case-control study. Carcinogenesis 2008;29:93-9.
191. Nesby-O'Dell S, Scanlon KS, Cogswell ME, Gillespie C, Hollis BW, Looker AC,
Allen C, Doughertly C, Gunter EW, Bowman BA. Hypovitaminosis D prevalence and
determinants among African American and white women of reproductive age: third
National Health and Nutrition Examination Survey, 1988-1994. Am J Clin Nutr
2002;76:187-92.
192. Williams JK. Rationale for new oral contraceptive dosing. Int J Fertil Womens
Med 2004;49:30-5.
193. Lechner D, Bajna E, Adlercreutz H, Cross HS. Genistein and 17beta-estradiol, but
not equol, regulate vitamin D synthesis in human colon and breast cancer cells.
Anticancer Res 2006;26:2597-603.
194. Tanaka Y, Castillo L, DeLuca HF. Control of renal vitamin D hydroxylases in
birds by sex hormones. Proc Natl Acad Sci U S A 1976;73:2701-5.
195. Schwartz B, Smirnoff P, Shany S, Liel Y. Estrogen controls expression and
bioresponse of 1,25-dihydroxyvitamin D receptors in the rat colon. Mol Cell Biochem
2000;203:87-93.
161
196. van Hoof HJ, de Sevaux RG, van BH, Swinkels LM, Klipping C, Ross HA,
Sweep CG. Relationship between free and total 1,25-dihydroxyvitamin D in conditions of
modified binding. Eur J Endocrinol 2001;144:391-6.
197. Aarskog D, Aksnes L, Markestad T, Rodland O. Effect of estrogen on vitamin D
metabolism in tall girls. J Clin Endocrinol Metab 1983;57:1155-8.
198. Kwok S, Canoy D, Ashton WD, Lowe GD, Wood D, Humphries SE, Charlton-
Menys V, Durrington PN. Increased C-reactive protein levels in overweight and obese
women taking exogenous hormones: the United Kingdom Women's Heart Study
(UKWHS). Clin Endocrinol (Oxf) 2009;71:727-32.
199. Soska V, Fiala J, Nebeska K, Jarkovsky J, Hruba D. The atherogenic index of
plasma is increased by hormonal contraception. Scand J Clin Lab Invest 2011;71:94-100.
200. Katayama H, Paczesny S, Prentice R, Aragaki A, Faca VM, Pitteri SJ, Zhang Q,
Wang H, Silva M, Kennedy J et al. Application of serum proteomics to the Women's
Health Initiative conjugated equine estrogens trial reveals a multitude of effects relevant
to clinical findings. Genome Med 2009;1:47.
201. Pitteri SJ, Hanash SM, Aragaki A, Amon LM, Chen L, Busald BT, Paczesny S,
Katayama H, Wang H, Johnson MM et al. Postmenopausal estrogen and progestin effects
on the serum proteome. Genome Med 2009;1:121.
202. Chlebowski RT, Anderson GL. Changing concepts: Menopausal hormone therapy
and breast cancer. J Natl Cancer Inst 2012;104:517-27.
203. Dreon DM, Slavin JL, Phinney SD. Oral contraceptive use and increased plasma
concentration of C-reactive protein. Life Sci 2003;73:1245-52.
204. Piltonen T, Puurunen J, Hedberg P, Ruokonen A, Mutt SJ, Herzig KH, Nissinen
A, Morin-Papunen L, Tapanainen JS. Oral, transdermal and vaginal combined
contraceptives induce an increase in markers of chronic inflammation and impair insulin
sensitivity in young healthy normal-weight women: a randomized study. Hum Reprod
2012;27:3046-56.
205. Haider Z, D'Souza R. Non-contraceptive benefits and risks of contraception. Best
Pract Res Clin Obstet Gynaecol 2009;23:249-62.
206. Kluft C, Leuven JA, Helmerhorst FM, Krans HM. Pro-inflammatory effects of
oestrogens during use of oral contraceptives and hormone replacement treatment. Vascul
Pharmacol 2002;39:149-54.
207. Josse AR, Garcia-Bailo B, Fischer K, El-Sohemy A. Novel effects of hormonal
contraceptive use on the plasma proteome. PLoS One 2012;7:e45162.
208. Lidegaard O, Lokkegaard E, Jensen A, Skovlund CW, Keiding N. Thrombotic
stroke and myocardial infarction with hormonal contraception. N Engl J Med
2012;366:2257-66.
209. Hunter D, De Lange M, Snieder H, MacGregor AJ, Swaminathan R, Thakker RV,
Spector TD. Genetic contribution to bone metabolism, calcium excretion, and vitamin D
and parathyroid hormone regulation. J Bone Miner Res 2001;16:371-8.
162
210. Orton SM, Morris AP, Herrera BM, Ramagopalan SV, Lincoln MR, Chao MJ,
Vieth R, Sadovnick AD, Ebers GC. Evidence for genetic regulation of vitamin D status in
twins with multiple sclerosis. Am J Clin Nutr 2008;88:441-7.
211. Karohl C, Su S, Kumari M, Tangpricha V, Veledar E, Vaccarino V, Raggi P.
Heritability and seasonal variability of vitamin D concentrations in male twins. Am J Clin
Nutr 2010;92:1393-8.
212. Dastani Z, Li R, Richards B. Genetic Regulation of Vitamin D Levels. Calcif
Tissue Int 2013;92:106-17.
213. Hypponen E, Berry DJ, Wjst M, Power C. Serum 25-hydroxyvitamin D and IgE -
a significant but nonlinear relationship. Allergy 2009;64:613-20.
214. Signorello LB, Shi J, Cai Q, Zheng W, Williams SM, Long J, Cohen SS, Li G,
Hollis BW, Smith JR et al. Common variation in vitamin D pathway genes predicts
circulating 25-hydroxyvitamin D Levels among African Americans. PLoS One
2011;6:e28623.
215. Bu FX, Armas L, Lappe J, Zhou Y, Gao G, Wang HW, Recker R, Zhao LJ.
Comprehensive association analysis of nine candidate genes with serum 25-hydroxy
vitamin D levels among healthy Caucasian subjects. Hum Genet 2010;128:549-56.
216. Cooper JD, Smyth DJ, Walker NM, Stevens H, Burren OS, Wallace C, Greissl C,
Ramos-Lopez E, Hypponen E, Dunger DB et al. Inherited variation in vitamin D genes is
associated with predisposition to autoimmune disease type 1 diabetes. Diabetes
2011;60:1624-31.
217. Lu L, Sheng H, Li H, Gan W, Liu C, Zhu J, Loos RJ, Lin X. Associations
between common variants in GC and DHCR7/NADSYN1 and vitamin D concentration
in Chinese Hans. Hum Genet 2012;131:505-12.
218. Engelman CD, Fingerlin TE, Langefeld CD, Hicks PJ, Rich SS, Wagenknecht
LE, Bowden DW, Norris JM. Genetic and environmental determinants of 25-
hydroxyvitamin D and 1,25-dihydroxyvitamin D levels in Hispanic and African
Americans. J Clin Endocrinol Metab 2008;93:3381-8.
219. Sinotte M, Diorio C, Berube S, Pollak M, Brisson J. Genetic polymorphisms of
the vitamin D binding protein and plasma concentrations of 25-hydroxyvitamin D in
premenopausal women. Am J Clin Nutr 2009;89:634-40.
220. Fu L, Yun F, Oczak M, Wong BY, Vieth R, Cole DE. Common genetic variants
of the vitamin D binding protein (DBP) predict differences in response of serum 25-
hydroxyvitamin D [25(OH)D] to vitamin D supplementation. Clin Biochem
2009;42:1174-7.
221. d'Alesio A, Garabedian M, Sabatier JP, Guaydier-Souquieres G, Marcelli C,
Lemacon A, Walrant-Debray O, Jehan F. Two single-nucleotide polymorphisms in the
human vitamin D receptor promoter change protein-DNA complex formation and are
associated with height and vitamin D status in adolescent girls. Hum Mol Genet
2005;14:3539-48.
163
222. Ahn J, Yu K, Stolzenberg-Solomon R, Simon KC, McCullough ML, Gallicchio
L, Jacobs EJ, Ascherio A, Helzlsouer K, Jacobs KB et al. Genome-wide association study
of circulating vitamin D levels. Hum Mol Genet 2010;19:2739-45.
223. Wang TJ, Zhang F, Richards JB, Kestenbaum B, van Meurs JB, Berry D, Kiel
DP, Streeten EA, Ohlsson C, Koller DL et al. Common genetic determinants of vitamin
D insufficiency: a genome-wide association study. Lancet 2010;376:180-8.
224. Engelman CD, Meyers KJ, Ziegler JT, Taylor KD, Palmer ND, Haffner SM,
Fingerlin TE, Wagenknecht LE, Rotter JI, Bowden DW et al. Genome-wide association
study of vitamin D concentrations in Hispanic Americans: the IRAS family study. J
Steroid Biochem Mol Biol 2010;122:186-92.
225. Lasky-Su J, Lange N, Brehm JM, Damask A, Soto-Quiros M, Avila L, Celedon
JC, Canino G, Cloutier MM, Hollis BW et al. Genome-wide association analysis of
circulating vitamin D levels in children with asthma. Hum Genet 2012;131:1495-505.
226. Benjamin EJ, Dupuis J, Larson MG, Lunetta KL, Booth SL, Govindaraju DR,
Kathiresan S, Keaney JF, Jr., Keyes MJ, Lin JP et al. Genome-wide association with
select biomarker traits in the Framingham Heart Study. BMC Med Genet 2007;8 Suppl
1:S11.
227. Hiraki LT, Major JM, Chen C, Cornelis MC, Hunter DJ, Rimm EB, Simon KC,
Weinstein SJ, Purdue MP, Yu K et al. Exploring the genetic architecture of circulating
25-hydroxyvitamin D. Genet Epidemiol 2013;37:92-8.
228. Manolio TA, Collins FS, Cox NJ, Goldstein DB, Hindorff LA, Hunter DJ,
McCarthy MI, Ramos EM, Cardon LR, Chakravarti A et al. Finding the missing
heritability of complex diseases. Nature 2009;461:747-53.
229. Haddad JG, Chyu KJ. Competitive protein-binding radioassay for 25-
hydroxycholecalciferol. J Clin Endocrinol Metab 1971;33:992-5.
230. Hollis BW. Measuring 25-hydroxyvitamin D in a clinical environment: challenges
and needs. Am J Clin Nutr 2008;88:507S-10S.
231. Hollis BW. Assessment and interpretation of circulating 25-hydroxyvitamin D
and 1,25-dihydroxyvitamin D in the clinical environment. Endocrinol Metab Clin North
Am 2010;39:271-86.
232. Wagner D, Hanwell HE, Schnabl K, Yazdanpanah M, Kimball S, Fu L, Sidhom
G, Rousseau D, Cole DE, Vieth R. The ratio of serum 24,25-dihydroxyvitamin D(3) to
25-hydroxyvitamin D(3) is predictive of 25-hydroxyvitamin D(3) response to vitamin
D(3) supplementation. J Steroid Biochem Mol Biol 2011;126:72-7.
233. Roth HJ, Schmidt-Gayk H, Weber H, Niederau C. Accuracy and clinical
implications of seven 25-hydroxyvitamin D methods compared with liquid
chromatography-tandem mass spectrometry as a reference. Ann Clin Biochem
2008;45:153-9.
234. Snellman G, Melhus H, Gedeborg R, Byberg L, Berglund L, Wernroth L,
Michaelsson K. Determining vitamin D status: a comparison between commercially
available assays. PLoS One 2010;5:e11555.
164
235. Wagner D, Hanwell HE, Vieth R. An evaluation of automated methods for
measurement of serum 25-hydroxyvitamin D. Clin Biochem 2009;42:1549-56.
236. Binkley N, Krueger D, Cowgill CS, Plum L, Lake E, Hansen KE, DeLuca HF,
Drezner MK. Assay variation confounds the diagnosis of hypovitaminosis D: a call for
standardization. J Clin Endocrinol Metab 2004;89:3152-7.
237. Glendenning P, Taranto M, Noble JM, Musk AA, Hammond C, Goldswain PR,
Fraser WD, Vasikaran SD. Current assays overestimate 25-hydroxyvitamin D3 and
underestimate 25-hydroxyvitamin D2 compared with HPLC: need for assay-specific
decision limits and metabolite-specific assays. Ann Clin Biochem 2006;43:23-30.
238. Carter GD. Accuracy of 25-hydroxyvitamin D assays: confronting the issues. Curr
Drug Targets 2011;12:19-28.
239. Chacko SA, Song Y, Manson JE, Van HL, Eaton C, Martin LW, McTiernan A,
Curb JD, Wylie-Rosett J, Phillips LS et al. Serum 25-hydroxyvitamin D concentrations in
relation to cardiometabolic risk factors and metabolic syndrome in postmenopausal
women. Am J Clin Nutr 2011;94:209-17.
240. Delvin EE, Lambert M, Levy E, O'Loughlin J, Mark S, Gray-Donald K, Paradis
G. Vitamin D status is modestly associated with glycemia and indicators of lipid
metabolism in French-Canadian children and adolescents. J Nutr 2010;140:987-91.
241. Ganji V, Zhang X, Shaikh N, Tangpricha V. Serum 25-hydroxyvitamin D
concentrations are associated with prevalence of metabolic syndrome and various
cardiometabolic risk factors in US children and adolescents based on assay-adjusted
serum 25-hydroxyvitamin D data from NHANES 2001-2006. Am J Clin Nutr
2011;94:225-33.
242. Zittermann A, Gummert JF, Borgermann J. The role of vitamin D in dyslipidemia
and cardiovascular disease. Curr Pharm Des 2011;17:933-42.
243. Parker J, Hashmi O, Dutton D, Mavrodaris A, Stranges S, Kandala NB, Clarke A,
Franco OH. Levels of vitamin D and cardiometabolic disorders: systematic review and
meta-analysis. Maturitas 2010;65:225-36.
244. Noordam R, de Craen AJ, Pedram P, Maier AB, Mooijaart SP, van PJ, Feskens
EJ, Streppel MT, Slagboom PE, Westendorp RG et al. Levels of 25-hydroxyvitamin D in
familial longevity: the Leiden Longevity Study. CMAJ 2012.
245. Ding EL, Mehta S, Fawzi WW, Giovannucci EL. Interaction of estrogen therapy
with calcium and vitamin D supplementation on colorectal cancer risk: reanalysis of
Women's Health Initiative randomized trial. Int J Cancer 2008;122:1690-4.
246. Liu PT, Stenger S, Li H, Wenzel L, Tan BH, Krutzik SR, Ochoa MT, Schauber J,
Wu K, Meinken C et al. Toll-like receptor triggering of a vitamin D-mediated human
antimicrobial response. Science 2006;311:1770-3.
247. Hewison M. An update on vitamin D and human immunity. Clin Endocrinol
(Oxf) 2012;76:315-25.
248. Lagishetty V, Liu NQ, Hewison M. Vitamin D metabolism and innate immunity.
Mol Cell Endocrinol 2011;347:97-105.
165
249. Adams JS, Ren S, Liu PT, Chun RF, Lagishetty V, Gombart AF, Borregaard N,
Modlin RL, Hewison M. Vitamin d-directed rheostatic regulation of monocyte
antibacterial responses. J Immunol 2009;182:4289-95.
250. Cippitelli M, Santoni A. Vitamin D3: a transcriptional modulator of the
interferon-gamma gene. Eur J Immunol 1998;28:3017-30.
251. Takeuchi A, Reddy GS, Kobayashi T, Okano T, Park J, Sharma S. Nuclear factor
of activated T cells (NFAT) as a molecular target for 1alpha,25-dihydroxyvitamin D3-
mediated effects. J Immunol 1998;160:209-18.
252. Boonstra A, Barrat FJ, Crain C, Heath VL, Savelkoul HF, O'Garra A. 1alpha,25-
Dihydroxyvitamin d3 has a direct effect on naive CD4(+) T cells to enhance the
development of Th2 cells. J Immunol 2001;167:4974-80.
253. Overbergh L, Decallonne B, Waer M, Rutgeerts O, Valckx D, Casteels KM,
Laureys J, Bouillon R, Mathieu C. 1alpha,25-dihydroxyvitamin D3 induces an
autoantigen-specific T-helper 1/T-helper 2 immune shift in NOD mice immunized with
GAD65 (p524-543). Diabetes 2000;49:1301-7.
254. Codoner-Franch P, Tavarez-Alonso S, Simo-Jorda R, Laporta-Martin P,
Carratala-Calvo A, onso-Iglesias E. Vitamin D status is linked to biomarkers of oxidative
stress, inflammation, and endothelial activation in obese children. J Pediatr
2012;161:848-54.
255. Salekzamani S, Neyestani TR, avi-Majd H, Houshiarrad A, Kalayi A,
Shariatzadeh N, Gharavi A. Is vitamin D status a determining factor for metabolic
syndrome? A case-control study. Diabetes Metab Syndr Obes 2011;4:205-12.
256. Kim M, Na W, Sohn C. Correlation between vitamin D and cardiovascular
disease predictors in overweight and obese Koreans. J Clin Biochem Nutr 2013;52:167-
71.
257. Hypponen E, Berry D, Cortina-Borja M, Power C. 25-Hydroxyvitamin D and pre-
clinical alterations in inflammatory and hemostatic markers: a cross sectional analysis in
the 1958 British Birth Cohort. PLoS One 2010;5:e10801.
258. Shab-Bidar S, Neyestani TR, Djazayery A, Eshraghian MR, Houshiarrad A,
Kalayi A, Shariatzadeh N, Khalaji N, Gharavi A. Improvement of vitamin D status
resulted in amelioration of biomarkers of systemic inflammation in the subjects with type
2 diabetes. Diabetes Metab Res Rev 2012;28:424-30.
259. Schleithoff SS, Zittermann A, Tenderich G, Berthold HK, Stehle P, Koerfer R.
Vitamin D supplementation improves cytokine profiles in patients with congestive heart
failure: a double-blind, randomized, placebo-controlled trial. Am J Clin Nutr
2006;83:754-9.
260. Wu CC, Chang JH, Chen CC, Su SB, Yang LK, Ma WY, Zheng CM, Diang LK,
Lu KC. Calcitriol treatment attenuates inflammation and oxidative stress in hemodialysis
patients with secondary hyperparathyroidism. Tohoku J Exp Med 2011;223:153-9.
261. Jorde R, Sneve M, Torjesen PA, Figenschau Y, Goransson LG, Omdal R. No
effect of supplementation with cholecalciferol on cytokines and markers of inflammation
in overweight and obese subjects. Cytokine 2010;50:175-80.

166
262. Barnes MS, Horigan G, Cashman KD, Hill TR, Forsythe LK, Lucey AJ,
McSorley EM, Kiely M, Bonham MP, Magee PJ et al. Maintenance of wintertime
vitamin D status with cholecalciferol supplementation is not associated with alterations in
serum cytokine concentrations among apparently healthy younger or older adults. J Nutr
2011;141:476-81.
263. Gepner AD, Ramamurthy R, Krueger DC, Korcarz CE, Binkley N, Stein JH. A
prospective randomized controlled trial of the effects of vitamin d supplementation on
cardiovascular disease risk. PLoS One 2012;7:e36617.
264. Vilarrasa N, Vendrell J, Maravall J, Elio I, Solano E, San JP, Garcia I, Virgili N,
Soler J, Gomez JM. Is plasma 25(OH) D related to adipokines, inflammatory cytokines
and insulin resistance in both a healthy and morbidly obese population? Endocrine
2010;38:235-42.
265. Shea MK, Booth SL, Massaro JM, Jacques PF, D'Agostino RB, Sr., wson-Hughes
B, Ordovas JM, O'Donnell CJ, Kathiresan S, Keaney JF, Jr. et al. Vitamin K and vitamin
D status: associations with inflammatory markers in the Framingham Offspring Study.
Am J Epidemiol 2008;167:313-20.
266. Yiu YF, Yiu KH, Siu CW, Chan YH, Li SW, Wong LY, Lee SW, Tam S, Wong
EW, Lau CP et al. Randomized controlled trial of vitamin D supplement on endothelial
function in patients with type 2 diabetes. Atherosclerosis 2013;227:140-6.
267. Amer M, Qayyum R. Relation between serum 25-hydroxyvitamin D and C-
reactive protein in asymptomatic adults (from the continuous National Health and
Nutrition Examination Survey 2001 to 2006). Am J Cardiol 2012;109:226-30.
268. Neyestani TR, Djazayery A, Shab-Bidar S, Eshraghian MR, Kalayi A,
Shariatzadeh N, Khalaji N, Zahedirad M, Gharavi A, Houshiarrad A et al. Vitamin D
Receptor Fok-I Polymorphism Modulates Diabetic Host Response to Vitamin D Intake:
Need for a nutrigenetic approach. Diabetes Care 2012.
269. Doro P, Benko R, Matuz M, Soos G. Seasonality in the incidence of type 2
diabetes: a population-based study. Diabetes Care 2006;29:173.
270. Holick MF. Diabetes and the vitamin d connection. Curr Diab Rep 2008;8:393-8.
271. Inomata S, Kadowaki S, Yamatani T, Fukase M, Fujita T. Effect of 1 alpha (OH)-
vitamin D3 on insulin secretion in diabetes mellitus. Bone Miner 1986;1:187-92.
272. Bourlon PM, Billaudel B, Faure-Dussert A. Influence of vitamin D3 deficiency
and 1,25 dihydroxyvitamin D3 on de novo insulin biosynthesis in the islets of the rat
endocrine pancreas. J Endocrinol 1999;160:87-95.
273. Pittas AG, Harris SS, Stark PC, Dawson-Hughes B. The effects of calcium and
vitamin D supplementation on blood glucose and markers of inflammation in nondiabetic
adults. Diabetes Care 2007;30:980-6.
274. Riachy R, Vandewalle B, Kerr CJ, Moerman E, Sacchetti P, Lukowiak B, Gmyr
V, Bouckenooghe T, Dubois M, Pattou F. 1,25-dihydroxyvitamin D3 protects RINm5F
and human islet cells against cytokine-induced apoptosis: implication of the antiapoptotic
protein A20. Endocrinology 2002;143:4809-19.
167
275. Baier LJ, Dobberfuhl AM, Pratley RE, Hanson RL, Bogardus C. Variations in the
vitamin D-binding protein (Gc locus) are associated with oral glucose tolerance in
nondiabetic Pima Indians. J Clin Endocrinol Metab 1998;83:2993-6.
276. Szathmary EJ. The effect of Gc genotype on fasting insulin level in Dogrib
Indians. Hum Genet 1987;75:368-72.
277. Hirai M, Suzuki S, Hinokio Y, Hirai A, Chiba M, Akai H, Suzuki C, Toyota T.
Variations in vitamin D-binding protein (group-specific component protein) are
associated with fasting plasma insulin levels in Japanese with normal glucose tolerance. J
Clin Endocrinol Metab 2000;85:1951-3.
278. Wang Q, Xi B, Reilly KH, Liu M, Fu M. Quantitative assessment of the
associations between four polymorphisms (FokI, ApaI, BsmI, TaqI) of vitamin D
receptor gene and risk of diabetes mellitus. Mol Biol Rep 2012;39:9405-14.
279. Ford ES, Ajani UA, McGuire LC, Liu S. Concentrations of serum vitamin D and
the metabolic syndrome among U.S. adults. Diabetes Care 2005;28:1228-30.
280. Chiu KC, Chu A, Go VL, Saad MF. Hypovitaminosis D is associated with insulin
resistance and beta cell dysfunction. Am J Clin Nutr 2004;79:820-5.
281. Hypponen E, Power C. Vitamin D status and glucose homeostasis in the 1958
British birth cohort: the role of obesity. Diabetes Care 2006;29:2244-6.
282. Need AG, O'Loughlin PD, Horowitz M, Nordin BE. Relationship between fasting
serum glucose, age, body mass index and serum 25 hydroxyvitamin D in postmenopausal
women. Clin Endocrinol (Oxf) 2005;62:738-41.
283. Hurskainen AR, Virtanen JK, Tuomainen TP, Nurmi T, Voutilainen S.
Association of serum 25-hydroxyvitamin D with type 2 diabetes and markers of insulin
resistance in a general older population in Finland. Diabetes Metab Res Rev
2012;28:418-23.
284. Kabadi SM, Lee BK, Liu L. Joint effects of obesity and vitamin D insufficiency
on insulin resistance and type 2 diabetes: results from the NHANES 2001-2006. Diabetes
Care 2012;35:2048-54.
285. Pittas AG, Dawson-Hughes B, Li T, Van Dam RM, Willett WC, Manson JE, Hu
FB. Vitamin D and calcium intake in relation to type 2 diabetes in women. Diabetes Care
2006;29:650-6.
286. Fliser D, Stefanski A, Franek E, Fode P, Gudarzi A, Ritz E. No effect of calcitriol
on insulin-mediated glucose uptake in healthy subjects. Eur J Clin Invest 1997;27:629-
33.
287. Ljunghall S, Lind L, Lithell H, Skarfors E, Selinus I, Sorensen OH, Wide L.
Treatment with one-alpha-hydroxycholecalciferol in middle-aged men with impaired
glucose tolerance--a prospective randomized double-blind study. Acta Med Scand
1987;222:361-7.
288. Orwoll E, Riddle M, Prince M. Effects of vitamin D on insulin and glucagon
secretion in non-insulin-dependent diabetes mellitus. Am J Clin Nutr 1994;59:1083-7.

168
289. Nilas L, Christiansen C. Treatment with vitamin D or its analogues does not
change body weight or blood glucose level in postmenopausal women. Int J Obes
1984;8:407-11.
290. von Hurst PR, Stonehouse W, Coad J. Vitamin D supplementation reduces insulin
resistance in South Asian women living in New Zealand who are insulin resistant and
vitamin D deficient - a randomised, placebo-controlled trial. Br J Nutr 2010;103:549-55.
291. Jorde R, Grimnes G. Vitamin D and metabolic health with special reference to the
effect of vitamin D on serum lipids. Prog Lipid Res 2011;50:303-12.
292. Jaimungal S, Wehmeier K, Mooradian AD, Haas MJ. The emerging evidence for
vitamin D-mediated regulation of apolipoprotein A-I synthesis. Nutr Res 2011;31:805-
12.
293. Johnson MD, Nader NS, Weaver AL, Singh R, Kumar S. Relationships between
25-hydroxyvitamin D levels and plasma glucose and lipid levels in pediatric outpatients.
J Pediatr 2010;156:444-9.
294. Wang JH, Keisala T, Solakivi T, Minasyan A, Kalueff AV, Tuohimaa P. Serum
cholesterol and expression of ApoAI, LXRbeta and SREBP2 in vitamin D receptor
knock-out mice. J Steroid Biochem Mol Biol 2009;113:222-6.
295. Wehmeier K, Beers A, Haas MJ, Wong NC, Steinmeyer A, Zugel U, Mooradian
AD. Inhibition of apolipoprotein AI gene expression by 1, 25-dihydroxyvitamin D3.
Biochim Biophys Acta 2005;1737:16-26.
296. Barger-Lux MJ, Heaney RP, Lanspa SJ, Healy JC, DeLuca HF. An investigation
of sources of variation in calcium absorption efficiency. J Clin Endocrinol Metab
1995;80:406-11.
297. Welberg JW, Monkelbaan JF, de Vries EG, Muskiet FA, Cats A, Oremus ET,
Boersma-van EW, van RH, van der MR, Mulder NH et al. Effects of supplemental
dietary calcium on quantitative and qualitative fecal fat excretion in man. Ann Nutr
Metab 1994;38:185-91.
298. Vaskonen T, Mervaala E, Sumuvuori V, Seppanen-Laakso T, Karppanen H.
Effects of calcium and plant sterols on serum lipids in obese Zucker rats on a low-fat diet.
Br J Nutr 2002;87:239-45.
299. Cho HJ, Kang HC, Choi SA, Ju YC, Lee HS, Park HJ. The possible role of Ca2+
on the activation of microsomal triglyceride transfer protein in rat hepatocytes. Biol
Pharm Bull 2005;28:1418-23.
300. Lips P. Vitamin D deficiency and secondary hyperparathyroidism in the elderly:
consequences for bone loss and fractures and therapeutic implications. Endocr Rev
2001;22:477-501.
301. Lacour B, Basile C, Drueke T, Funck-Brentano JL. Parathyroid function and lipid
metabolism in the rat. Miner Electrolyte Metab 1982;7:157-65.
302. Karhapaa P, Pihlajamaki J, Porsti I, Kastarinen M, Mustonen J, Niemela O,
Kuusisto J. Diverse associations of 25-hydroxyvitamin D and 1,25-dihydroxy-vitamin D
with dyslipidaemias. J Intern Med 2010;268:604-10.

169
303. Liu E, Meigs JB, Pittas AG, McKeown NM, Economos CD, Booth SL, Jacques
PF. Plasma 25-hydroxyvitamin D is associated with markers of the insulin resistant
phenotype in nondiabetic adults. Journal of Nutrition 2009;139:329-34.
304. Pinelli NR, Jaber LA, Brown MB, Herman WH. Serum 25-hydroxy vitamin d and
insulin resistance, metabolic syndrome, and glucose intolerance among Arab Americans.
Diabetes Care 2010;33:1373-5.
305. Botella-Carretero JI, Alvarez-Blasco F, Villafruela JJ, Balsa JA, Vazquez C,
Escobar-Morreale HF. Vitamin D deficiency is associated with the metabolic syndrome
in morbid obesity. Clin Nutr 2007;26:573-80.
306. Wang H, Xia N, Yang Y, Peng DQ. Influence of vitamin D supplementation on
plasma lipid profiles: a meta-analysis of randomized controlled trials. Lipids Health Dis
2012;11:42.
307. Multhoff G, Radons J. Radiation, inflammation, and immune responses in cancer.
Front Oncol 2012;2:58.
308. Choy E. Understanding the dynamics: pathways involved in the pathogenesis of
rheumatoid arthritis. Rheumatology (Oxford) 2012;51 Suppl 5:v3-11.
309. Comabella M, Khoury SJ. Immunopathogenesis of multiple sclerosis. Clin
Immunol 2012;142:2-8.
310. Wang Y, Jacobs EJ, McCullough ML, Rodriguez C, Thun MJ, Calle EE, Flanders
WD. Comparing methods for accounting for seasonal variability in a biomarker when
only a single sample is available: insights from simulations based on serum 25-
hydroxyvitamin d. Am J Epidemiol 2009;170:88-94.
311. Cahill L, Corey PN, El-Sohemy A. Vitamin C deficiency in a population of young
Canadian adults. Am J Epidemiol 2009;170:464-71.
312. Fontaine-Bisson B, Wolever TM, Connelly PW, Corey PN, El-Sohemy A. NF-
kappaB -94Ins/Del ATTG polymorphism modifies the association between dietary
polyunsaturated fatty acids and HDL-cholesterol in two distinct populations.
Atherosclerosis 2009;204:465-70.
313. Eny KM, Corey PN, El-Sohemy A. Dopamine D2 receptor genotype (C957T) and
habitual consumption of sugars in a free-living population of men and women. J
Nutrigenet Nutrigenomics 2009;2:235-42.
314. USDA National Nutrient Database for Standard Reference, Release 20. US
Department of Agriculture Agricultural Research Service 2007.
http://www.ars.usda.gov/main/site_main.htm?modecode=12-35-45-00. Accessed March
2010.
315. Wang Y, Zhu J, DeLuca HF. Where is the vitamin D receptor? Arch Biochem
Biophys 2012;523:123-33.
316. Buchanan JR, Santen R, Cauffman S, Cavaliere A, Greer RB, Demers LM. The
effect of endogenous estrogen fluctuation on metabolism of 25-hydroxyvitamin D. Calcif
Tissue Int 1986;39:139-44.
170
317. Gagnon C, Baillargeon JP, Desmarais G, Fink GD. Prevalence and predictors of
vitamin D insufficiency in women of reproductive age living in northern latitude. Eur J
Endocrinol 2010;163:819-24.
318. Hotamisligil GS. Inflammation and metabolic disorders. Nature 2006;444:860-7.
319. Garcia-Bailo B, El-Sohemy A, Haddad PS, Arora P, BenZaied F, Karmali M,
Badawi A. Vitamins D, C, and E in the prevention of type 2 diabetes mellitus:
modulation of inflammation and oxidative stress. Biologics 2011;5:7-19.
320. Pickup JC, Crook MA. Is Type II diabetes mellitus a disease of the innate immune
system? Diabetologia 1998;41:1241-8.
321. Da Costa LA, Garcia-Bailo B, Badawi A, El-Sohemy A. Genetic determinants of
dietary antioxidant status. Prog Mol Biol Transl Sci 2012;108:179-200.
322. Evans JL, Goldfine ID, Maddux BA, Grodsky GM. Oxidative stress and stress-
activated signaling pathways: a unifying hypothesis of type 2 diabetes. Endocr Rev
2002;23:599-622.
323. Clendenen TV, Koenig KL, Arslan AA, Lukanova A, Berrino F, Gu Y, Hallmans
G, Idahl A, Krogh V, Lokshin AE et al. Factors associated with inflammation markers, a
cross-sectional analysis. Cytokine 2011;56:769-78.
324. Leng SX, McElhaney JE, Walston JD, Xie D, Fedarko NS, Kuchel GA. ELISA
and multiplex technologies for cytokine measurement in inflammation and aging
research. J Gerontol A Biol Sci Med Sci 2008;63:879-84.
325. Perrier S, Darakhshan F, Hajduch E. IL-1 receptor antagonist in metabolic
diseases: Dr Jekyll or Mr Hyde? FEBS Lett 2006;580:6289-94.
326. Gysemans C, Callewaert H, Overbergh L, Mathieu C. Cytokine signalling in the
beta-cell: a dual role for IFNgamma. Biochem Soc Trans 2008;36:328-33.
327. Rotondi M, Lazzeri E, Romagnani P, Serio M. Role for interferon-gamma
inducible chemokines in endocrine autoimmunity: an expanding field. J Endocrinol
Invest 2003;26:177-80.
328. Hellberg C, Ostman A, Heldin CH. PDGF and vessel maturation. Recent Results
Cancer Res 2010;180:103-14.
329. Suffee N, Richard B, Hlawaty H, Oudar O, Charnaux N, Sutton A. Angiogenic
properties of the chemokine RANTES/CCL5. Biochem Soc Trans 2011;39:1649-53.
330. Navarro-Gonzalez JF, Mora-Fernandez C, Muros de FM, Garcia-Perez J.
Inflammatory molecules and pathways in the pathogenesis of diabetic nephropathy. Nat
Rev Nephrol 2011;7:327-40.
331. Garcia-Bailo B, Josse AR, Jamnik J, Badawi A, El-Sohemy A. Positive
Association Between 25-Hydroxyvitamin D and C-Reactive Protein is Confounded by
Hormonal Contraceptive Use. J Womens Health (Larchmt ) 2013;22:417-25.
332. Yamshchikov AV, Desai NS, Blumberg HM, Ziegler TR, Tangpricha V. Vitamin
D for treatment and prevention of infectious diseases: a systematic review of randomized
controlled trials. Endocr Pract 2009;15:438-49.
171
333. Sacheck J, Goodman E, Chui K, Chomitz V, Must A, Economos C. Vitamin D
deficiency, adiposity, and cardiometabolic risk in urban schoolchildren. J Pediatr
2011;159:945-50.
334. Jin Y, Cui X, Singh UP, Chumanevich AA, Harmon B, Cavicchia P, Hofseth AB,
Kotakadi V, Stroud B, Volate SR et al. Systemic inflammatory load in humans is
suppressed by consumption of two formulations of dried, encapsulated juice concentrate.
Mol Nutr Food Res 2010;54:1506-14.
335. Appay V, Rowland-Jones SL. RANTES: a versatile and controversial chemokine.
Trends Immunol 2001;22:83-7.
336. Virani SS, Nambi V, Hoogeveen R, Wasserman BA, Coresh J, Gonzalez F,
Chambless LE, Mosley TH, Boerwinkle E, Ballantyne CM. Relationship between
circulating levels of RANTES (regulated on activation, normal T-cell expressed, and
secreted) and carotid plaque characteristics: the Atherosclerosis Risk in Communities
(ARIC) Carotid MRI Study. Eur Heart J 2011;32:459-68.
337. Sitruk-Ware R, Nath A. Metabolic effects of contraceptive steroids. Rev Endocr
Metab Disord 2011;12:63-75.
338. Baer PC, Gauer S, Wegner B, Schubert R, Geiger H. C-reactive protein induced
activation of MAP-K and RANTES in human renal distal tubular epithelial cells in vitro.
Clin Nephrol 2006;66:177-83.
339. Kovalovsky D, Paez PM, Sauer J, Perez CC, Nahmod VE, Stalla GK, Holsboer F,
Arzt E. The Th1 and Th2 cytokines IFN-gamma and IL-4 antagonize the inhibition of
monocyte IL-1 receptor antagonist by glucocorticoids: involvement of IL-1. Eur J
Immunol 1998;28:2075-85.
340. Badgett A, Bonner JC, Brody AR. Interferon-gamma modulates lung macrophage
production of PDGF-BB and fibroblast growth. J Lipid Mediat Cell Signal 1996;13:89-
97.
341. Aschner P. Metabolic syndrome as a risk factor for diabetes. Expert Rev
Cardiovasc Ther 2010;8:407-12.
342. Alvarez JA, Gower BA, Calhoun DA, Judd SE, Dong Y, Dudenbostel T, Scholl J,
Ashraf AP. Serum 25-hydroxyvitamin D and Ethnic Differences in Arterial Stiffness and
Endothelial Function. J Clin Med Res 2012;4:197-205.
343. Garcia-Bailo B, Jamnik J, Da Costa LA, Borchers CH, Badawi A, El-Sohemy A.
Plasma 25-Hydroxyvitamin D, Hormonal Contraceptive Use, and the Plasma Proteome in
Caucasian, East Asian, and South Asian Young Adults. J Proteome Res 2013;12:1797-
807.
344. McLaughlin T, Abbasi F, Cheal K, Chu J, Lamendola C, Reaven G. Use of
metabolic markers to identify overweight individuals who are insulin resistant. Ann
Intern Med 2003;139:802-9.
345. Cheang KI, Essah PA, Sharma S, Wickham EP, III, Nestler JE. Divergent effects
of a combined hormonal oral contraceptive on insulin sensitivity in lean versus obese
women. Fertil Steril 2011;96:353-9.
172
346. Ponda MP, Huang X, Odeh MA, Breslow JL, Kaufman HW. Vitamin D may not
improve lipid levels: a serial clinical laboratory data study. Circulation 2012;126:270-7.
347. Kim J, Mueller C. Factor analysis: statistical methods and practical issues.
Newbury Park, CA: Sage Publications, Inc., 1978.
348. Reactome. 2012. http://www.reactome.org. Accessed February 2011.
349. Pittas AG, Dawson-Hughes B. Vitamin D and diabetes. J Steroid Biochem Mol
Biol 2010;121:425-9.
350. Starck M, Schiele F, Herbeth B, Vincent-Viry M, Beaud B, Siest G, Visvikis S.
Apolipoproteins E and C-III in apo B- and non-apo B-containing lipoproteins in middle-
aged women from the Stanislas cohort: effect of oral contraceptive use and common
apolipoprotein E polymorphism. Atherosclerosis 2001;155:509-16.
351. Zugaro A, Pandolfi C, Barbonetti A, Vassallo MR, D'Angeli A, Necozione S,
Colangeli MS, Francavilla S, Francavilla F. Retinol binding protein 4, low birth weight-
related insulin resistance and hormonal contraception. Endocrine 2007;32:166-9.
352. Kotnik P, Fischer-Posovszky P, Wabitsch M. RBP4: a controversial adipokine.
Eur J Endocrinol 2011;165:703-11.
353. Maas C, Renne T. Regulatory mechanisms of the plasma contact system. Thromb
Res 2012;129 Suppl 2:S73-S76.
354. Stricker H, Tosi BF, Guidicelli-Nicolosi S, Limoni C, Colucci G. Effect of a
single, oral, high-dose vitamin D supplementation on endothelial function in patients with
peripheral arterial disease: a randomised controlled pilot study. Eur J Vasc Endovasc
Surg 2012;44:307-12.
355. Nimitphong H, Holick MF, Fried SK, Lee MJ. 25-hydroxyvitamin d(3) and 1,25-
dihydroxyvitamin d(3) promote the differentiation of human subcutaneous preadipocytes.
PLoS One 2012;7:e52171.
356. Bland R, Markovic D, Hills CE, Hughes SV, Chan SLF, Squires PE, Hewison M.
Expression of 25-hydroxyvitamin D3-1-alpha-hydroxylase in pancreatic islets. Journal of
Steroid Biochemistry and Molecular Biology 2004;89-90:121-5.
357. Brondum-Jacobsen P, Benn M, Jensen GB, Nordestgaard BG. 25-hydroxyvitamin
d levels and risk of ischemic heart disease, myocardial infarction, and early death:
population-based study and meta-analyses of 18 and 17 studies. Arterioscler Thromb
Vasc Biol 2012;32:2794-802.
358. DeLuca HF. Overview of general physiologic features and functions of vitamin
D. The American Journal of Clinical Nutrition 2004;80:1698S-96S.
359. Valdivielso JM, Fernandez E. Vitamin D receptor polymorphisms and diseases.
Clin Chim Acta 2006;371:1-12.
360. Reis AF, Hauache OM, Velho G. Vitamin D endocrine system and the genetic
susceptibility to diabetes, obesity and vascular disease. A review of evidence. Diabetes
Metab 2005;31:318-25.
173
361. Josse AR, Da Costa LA, Campos H, El-Sohemy A. Associations between
polymorphisms in the AHR and CYP1A1-CYP1A2 gene regions and habitual caffeine
consumption. Am J Clin Nutr 2012;96:665-71.
362. Schroder K, Hertzog PJ, Ravasi T, Hume DA. Interferon-gamma: an overview of
signals, mechanisms and functions. J Leukoc Biol 2004;75:163-89.
363. Selvaraj P, Harishankar M, Singh B, Banurekha VV, Jawahar MS. Effect of
vitamin D3 on chemokine expression in pulmonary tuberculosis. Cytokine 2012;60:212-
9.
364. Mutti DO, Cooper ME, Dragan E, Jones-Jordan LA, Bailey MD, Marazita ML,
Murray JC, Zadnik K. Vitamin D receptor (VDR) and group-specific component (GC,
vitamin D-binding protein) polymorphisms in myopia. Invest Ophthalmol Vis Sci
2011;52:3818-24.
365. Sung CC, Liao MT, Lu KC, Wu CC. Role of vitamin D in insulin resistance. J
Biomed Biotechnol 2012;2012:634195.
366. Comings DE, MacMurray JP. Molecular heterosis: a review. Mol Genet Metab
2000;71:19-31.
367. Jain R, von Hurst PR, Stonehouse W, Love DR, Higgins CM, Coad J. Association
of vitamin D receptor gene polymorphisms with insulin resistance and response to
vitamin D. Metabolism 2012;61:293-301.
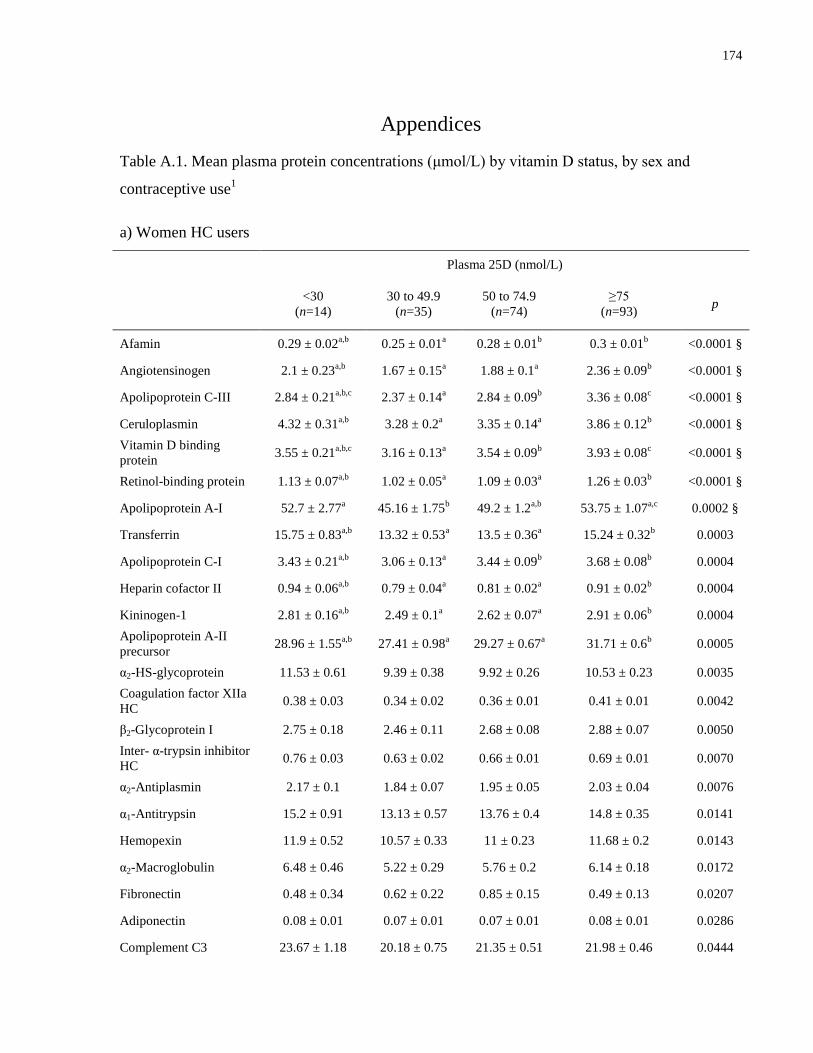
174
Appendices
Table A.1. Mean plasma protein concentrations (μmol/L) by vitamin D status, by sex and
contraceptive use1
a) Women HC users
Plasma 25D (nmol/L)
<30
(n=14)
30 to 49.9
(n=35)
50 to 74.9
(n=74)
≥75
(n=93) p
Afamin 0.29 ± 0.02a,b
0.25 ± 0.01a 0.28 ± 0.01
b 0.3 ± 0.01
b <0.0001 §
Angiotensinogen 2.1 ± 0.23a,b
1.67 ± 0.15a 1.88 ± 0.1
a 2.36 ± 0.09
b <0.0001 §
Apolipoprotein C-III 2.84 ± 0.21a,b,c
2.37 ± 0.14a 2.84 ± 0.09
b 3.36 ± 0.08
c <0.0001 §
Ceruloplasmin 4.32 ± 0.31a,b
3.28 ± 0.2a 3.35 ± 0.14
a 3.86 ± 0.12
b <0.0001 §
Vitamin D binding
protein 3.55 ± 0.21
a,b,c 3.16 ± 0.13
a 3.54 ± 0.09
b 3.93 ± 0.08
c <0.0001 §
Retinol-binding protein 1.13 ± 0.07a,b
1.02 ± 0.05a 1.09 ± 0.03
a 1.26 ± 0.03
b <0.0001 §
Apolipoprotein A-I 52.7 ± 2.77a 45.16 ± 1.75
b 49.2 ± 1.2
a,b 53.75 ± 1.07
a,c 0.0002 §
Transferrin 15.75 ± 0.83a,b
13.32 ± 0.53a 13.5 ± 0.36
a 15.24 ± 0.32
b 0.0003
Apolipoprotein C-I 3.43 ± 0.21a,b
3.06 ± 0.13a 3.44 ± 0.09
b 3.68 ± 0.08
b 0.0004
Heparin cofactor II 0.94 ± 0.06a,b
0.79 ± 0.04a 0.81 ± 0.02
a 0.91 ± 0.02
b 0.0004
Kininogen-1 2.81 ± 0.16a,b
2.49 ± 0.1a 2.62 ± 0.07
a 2.91 ± 0.06
b 0.0004
Apolipoprotein A-II
precursor 28.96 ± 1.55
a,b 27.41 ± 0.98
a 29.27 ± 0.67
a 31.71 ± 0.6
b 0.0005
α2-HS-glycoprotein 11.53 ± 0.61 9.39 ± 0.38 9.92 ± 0.26 10.53 ± 0.23 0.0035
Coagulation factor XIIa
HC 0.38 ± 0.03 0.34 ± 0.02 0.36 ± 0.01 0.41 ± 0.01 0.0042
β2-Glycoprotein I 2.75 ± 0.18 2.46 ± 0.11 2.68 ± 0.08 2.88 ± 0.07 0.0050
Inter- α-trypsin inhibitor
HC 0.76 ± 0.03 0.63 ± 0.02 0.66 ± 0.01 0.69 ± 0.01 0.0070
α2-Antiplasmin 2.17 ± 0.1 1.84 ± 0.07 1.95 ± 0.05 2.03 ± 0.04 0.0076
α1-Antitrypsin 15.2 ± 0.91 13.13 ± 0.57 13.76 ± 0.4 14.8 ± 0.35 0.0141
Hemopexin 11.9 ± 0.52 10.57 ± 0.33 11 ± 0.23 11.68 ± 0.2 0.0143
α2-Macroglobulin 6.48 ± 0.46 5.22 ± 0.29 5.76 ± 0.2 6.14 ± 0.18 0.0172
Fibronectin 0.48 ± 0.34 0.62 ± 0.22 0.85 ± 0.15 0.49 ± 0.13 0.0207
Adiponectin 0.08 ± 0.01 0.07 ± 0.01 0.07 ± 0.01 0.08 ± 0.01 0.0286
Complement C3 23.67 ± 1.18 20.18 ± 0.75 21.35 ± 0.51 21.98 ± 0.46 0.0444
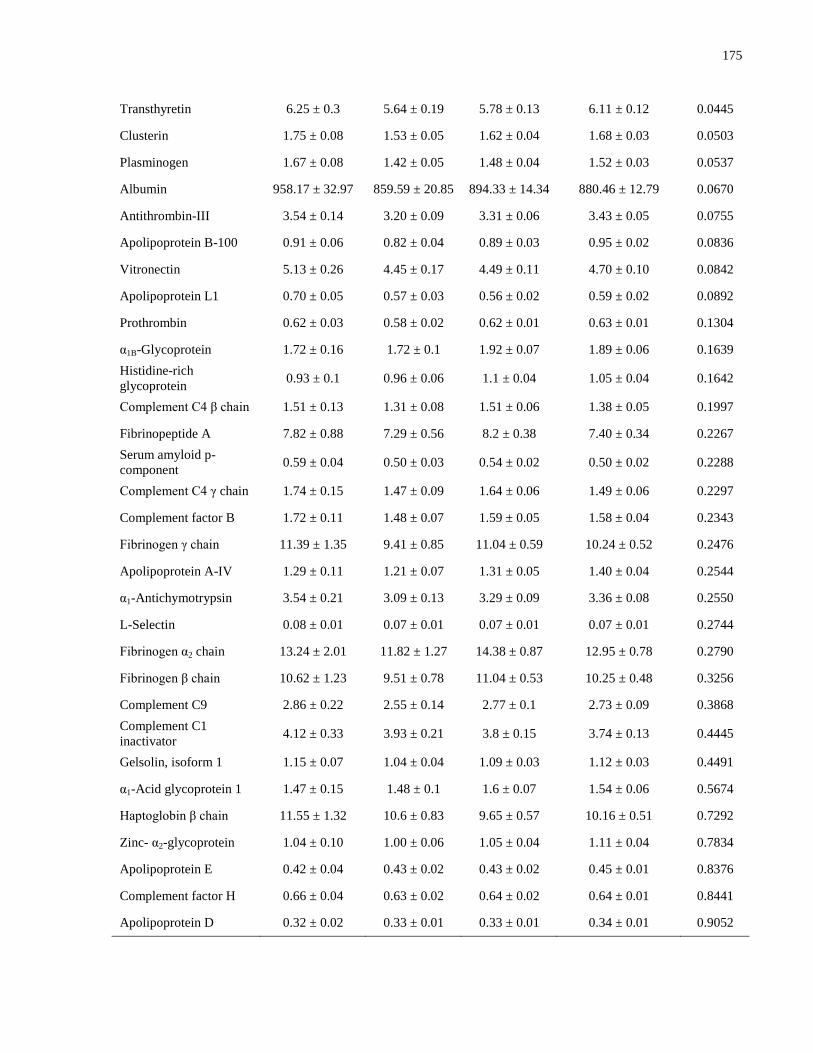
175
Transthyretin 6.25 ± 0.3 5.64 ± 0.19 5.78 ± 0.13 6.11 ± 0.12 0.0445
Clusterin 1.75 ± 0.08 1.53 ± 0.05 1.62 ± 0.04 1.68 ± 0.03 0.0503
Plasminogen 1.67 ± 0.08 1.42 ± 0.05 1.48 ± 0.04 1.52 ± 0.03 0.0537
Albumin 958.17 ± 32.97 859.59 ± 20.85 894.33 ± 14.34 880.46 ± 12.79 0.0670
Antithrombin-III 3.54 ± 0.14 3.20 ± 0.09 3.31 ± 0.06 3.43 ± 0.05 0.0755
Apolipoprotein B-100 0.91 ± 0.06 0.82 ± 0.04 0.89 ± 0.03 0.95 ± 0.02 0.0836
Vitronectin 5.13 ± 0.26 4.45 ± 0.17 4.49 ± 0.11 4.70 ± 0.10 0.0842
Apolipoprotein L1 0.70 ± 0.05 0.57 ± 0.03 0.56 ± 0.02 0.59 ± 0.02 0.0892
Prothrombin 0.62 ± 0.03 0.58 ± 0.02 0.62 ± 0.01 0.63 ± 0.01 0.1304
α1B-Glycoprotein 1.72 ± 0.16 1.72 ± 0.1 1.92 ± 0.07 1.89 ± 0.06 0.1639
Histidine-rich
glycoprotein 0.93 ± 0.1 0.96 ± 0.06 1.1 ± 0.04 1.05 ± 0.04 0.1642
Complement C4 β chain 1.51 ± 0.13 1.31 ± 0.08 1.51 ± 0.06 1.38 ± 0.05 0.1997
Fibrinopeptide A 7.82 ± 0.88 7.29 ± 0.56 8.2 ± 0.38 7.40 ± 0.34 0.2267
Serum amyloid p-
component 0.59 ± 0.04 0.50 ± 0.03 0.54 ± 0.02 0.50 ± 0.02 0.2288
Complement C4 γ chain 1.74 ± 0.15 1.47 ± 0.09 1.64 ± 0.06 1.49 ± 0.06 0.2297
Complement factor B 1.72 ± 0.11 1.48 ± 0.07 1.59 ± 0.05 1.58 ± 0.04 0.2343
Fibrinogen γ chain 11.39 ± 1.35 9.41 ± 0.85 11.04 ± 0.59 10.24 ± 0.52 0.2476
Apolipoprotein A-IV 1.29 ± 0.11 1.21 ± 0.07 1.31 ± 0.05 1.40 ± 0.04 0.2544
α1-Antichymotrypsin 3.54 ± 0.21 3.09 ± 0.13 3.29 ± 0.09 3.36 ± 0.08 0.2550
L-Selectin 0.08 ± 0.01 0.07 ± 0.01 0.07 ± 0.01 0.07 ± 0.01 0.2744
Fibrinogen α2 chain 13.24 ± 2.01 11.82 ± 1.27 14.38 ± 0.87 12.95 ± 0.78 0.2790
Fibrinogen β chain 10.62 ± 1.23 9.51 ± 0.78 11.04 ± 0.53 10.25 ± 0.48 0.3256
Complement C9 2.86 ± 0.22 2.55 ± 0.14 2.77 ± 0.1 2.73 ± 0.09 0.3868
Complement C1
inactivator 4.12 ± 0.33 3.93 ± 0.21 3.8 ± 0.15 3.74 ± 0.13 0.4445
Gelsolin, isoform 1 1.15 ± 0.07 1.04 ± 0.04 1.09 ± 0.03 1.12 ± 0.03 0.4491
α1-Acid glycoprotein 1 1.47 ± 0.15 1.48 ± 0.1 1.6 ± 0.07 1.54 ± 0.06 0.5674
Haptoglobin β chain 11.55 ± 1.32 10.6 ± 0.83 9.65 ± 0.57 10.16 ± 0.51 0.7292
Zinc- α2-glycoprotein 1.04 ± 0.10 1.00 ± 0.06 1.05 ± 0.04 1.11 ± 0.04 0.7834
Apolipoprotein E 0.42 ± 0.04 0.43 ± 0.02 0.43 ± 0.02 0.45 ± 0.01 0.8376
Complement factor H 0.66 ± 0.04 0.63 ± 0.02 0.64 ± 0.02 0.64 ± 0.01 0.8441
Apolipoprotein D 0.32 ± 0.02 0.33 ± 0.01 0.33 ± 0.01 0.34 ± 0.01 0.9052
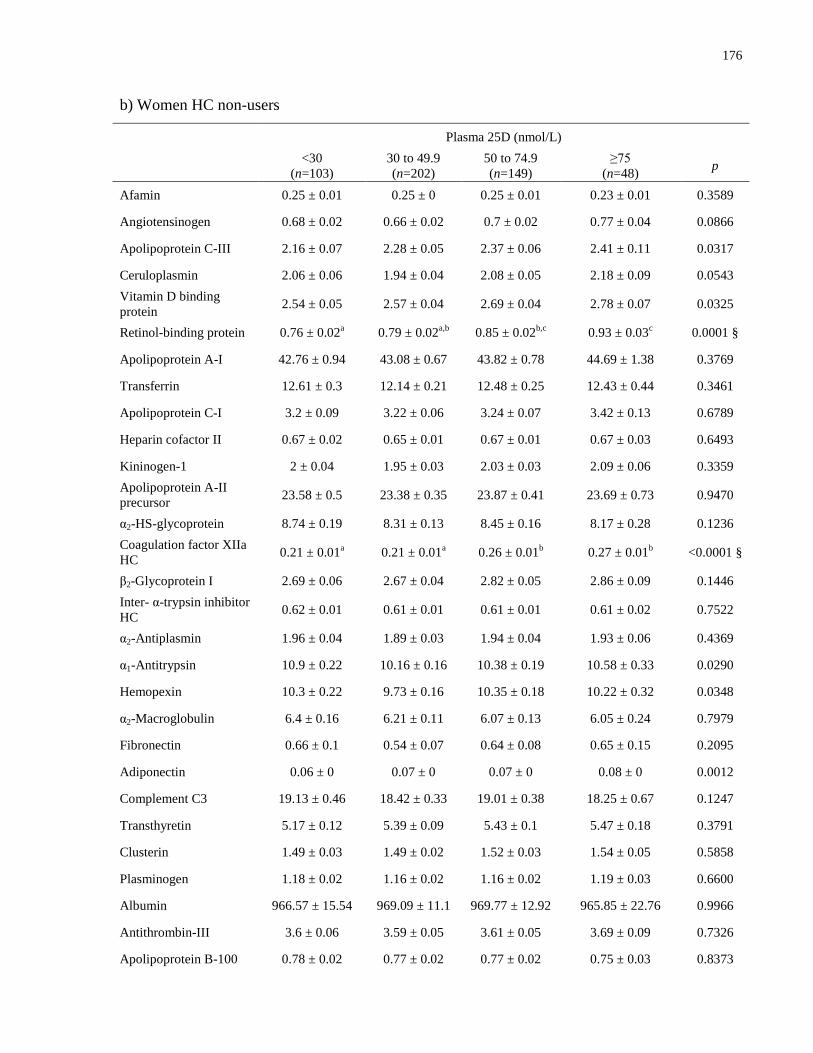
176
b) Women HC non-users
Plasma 25D (nmol/L)
<30
(n=103)
30 to 49.9
(n=202)
50 to 74.9
(n=149)
≥75
(n=48) p
Afamin 0.25 ± 0.01 0.25 ± 0 0.25 ± 0.01 0.23 ± 0.01 0.3589
Angiotensinogen 0.68 ± 0.02 0.66 ± 0.02 0.7 ± 0.02 0.77 ± 0.04 0.0866
Apolipoprotein C-III 2.16 ± 0.07 2.28 ± 0.05 2.37 ± 0.06 2.41 ± 0.11 0.0317
Ceruloplasmin 2.06 ± 0.06 1.94 ± 0.04 2.08 ± 0.05 2.18 ± 0.09 0.0543
Vitamin D binding
protein 2.54 ± 0.05 2.57 ± 0.04 2.69 ± 0.04 2.78 ± 0.07 0.0325
Retinol-binding protein 0.76 ± 0.02a 0.79 ± 0.02
a,b 0.85 ± 0.02
b,c 0.93 ± 0.03
c 0.0001 §
Apolipoprotein A-I 42.76 ± 0.94 43.08 ± 0.67 43.82 ± 0.78 44.69 ± 1.38 0.3769
Transferrin 12.61 ± 0.3 12.14 ± 0.21 12.48 ± 0.25 12.43 ± 0.44 0.3461
Apolipoprotein C-I 3.2 ± 0.09 3.22 ± 0.06 3.24 ± 0.07 3.42 ± 0.13 0.6789
Heparin cofactor II 0.67 ± 0.02 0.65 ± 0.01 0.67 ± 0.01 0.67 ± 0.03 0.6493
Kininogen-1 2 ± 0.04 1.95 ± 0.03 2.03 ± 0.03 2.09 ± 0.06 0.3359
Apolipoprotein A-II
precursor 23.58 ± 0.5 23.38 ± 0.35 23.87 ± 0.41 23.69 ± 0.73 0.9470
α2-HS-glycoprotein 8.74 ± 0.19 8.31 ± 0.13 8.45 ± 0.16 8.17 ± 0.28 0.1236
Coagulation factor XIIa
HC 0.21 ± 0.01
a 0.21 ± 0.01
a 0.26 ± 0.01
b 0.27 ± 0.01
b <0.0001 §
β2-Glycoprotein I 2.69 ± 0.06 2.67 ± 0.04 2.82 ± 0.05 2.86 ± 0.09 0.1446
Inter- α-trypsin inhibitor
HC 0.62 ± 0.01 0.61 ± 0.01 0.61 ± 0.01 0.61 ± 0.02 0.7522
α2-Antiplasmin 1.96 ± 0.04 1.89 ± 0.03 1.94 ± 0.04 1.93 ± 0.06 0.4369
α1-Antitrypsin 10.9 ± 0.22 10.16 ± 0.16 10.38 ± 0.19 10.58 ± 0.33 0.0290
Hemopexin 10.3 ± 0.22 9.73 ± 0.16 10.35 ± 0.18 10.22 ± 0.32 0.0348
α2-Macroglobulin 6.4 ± 0.16 6.21 ± 0.11 6.07 ± 0.13 6.05 ± 0.24 0.7979
Fibronectin 0.66 ± 0.1 0.54 ± 0.07 0.64 ± 0.08 0.65 ± 0.15 0.2095
Adiponectin 0.06 ± 0 0.07 ± 0 0.07 ± 0 0.08 ± 0 0.0012
Complement C3 19.13 ± 0.46 18.42 ± 0.33 19.01 ± 0.38 18.25 ± 0.67 0.1247
Transthyretin 5.17 ± 0.12 5.39 ± 0.09 5.43 ± 0.1 5.47 ± 0.18 0.3791
Clusterin 1.49 ± 0.03 1.49 ± 0.02 1.52 ± 0.03 1.54 ± 0.05 0.5858
Plasminogen 1.18 ± 0.02 1.16 ± 0.02 1.16 ± 0.02 1.19 ± 0.03 0.6600
Albumin 966.57 ± 15.54 969.09 ± 11.1 969.77 ± 12.92 965.85 ± 22.76 0.9966
Antithrombin-III 3.6 ± 0.06 3.59 ± 0.05 3.61 ± 0.05 3.69 ± 0.09 0.7326
Apolipoprotein B-100 0.78 ± 0.02 0.77 ± 0.02 0.77 ± 0.02 0.75 ± 0.03 0.8373

177
Vitronectin 3.66 ± 0.07 3.49 ± 0.05 3.54 ± 0.06 3.41 ± 0.1 0.0412
Apolipoprotein L1 0.35 ± 0.01 0.35 ± 0.01 0.36 ± 0.01 0.36 ± 0.02 0.9893
Prothrombin 0.58 ± 0.01 0.57 ± 0.01 0.57 ± 0.01 0.55 ± 0.02 0.3779
α1B-Glycoprotein 1.69 ± 0.05 1.6 ± 0.03 1.73 ± 0.04 1.71 ± 0.07 0.1000
Histidine-rich
glycoprotein 1.42 ± 0.04 1.41 ± 0.03 1.38 ± 0.03 1.42 ± 0.06 0.7065
Complement C4 β chain 1.47 ± 0.05 1.38 ± 0.04 1.42 ± 0.04 1.32 ± 0.08 0.1837
Fibrinopeptide A 7.34 ± 0.25 7.1 ± 0.18 7.2 ± 0.21 7.01 ± 0.37 0.2947
Serum amyloid p-
component 0.38 ± 0.01 0.38 ± 0.01 0.38 ± 0.01 0.37 ± 0.02 0.3564
Complement C4 γ chain 1.61 ± 0.06 1.53 ± 0.04 1.57 ± 0.05 1.45 ± 0.08 0.2863
Complement factor B 1.42 ± 0.04 1.37 ± 0.03 1.42 ± 0.03 1.35 ± 0.06 0.5817
Fibrinogen γ chain 9.92 ± 0.4 9.69 ± 0.29 9.3 ± 0.33 9.7 ± 0.59 0.1600
Apolipoprotein A-IV 1.39 ± 0.04 1.36 ± 0.03 1.46 ± 0.03 1.5 ± 0.06 0.1007
α1-Antichymotrypsin 3.46 ± 0.08 3.29 ± 0.06 3.46 ± 0.07 3.49 ± 0.12 0.0568
L-Selectin 0.07 ± 0 0.07 ± 0 0.08 ± 0 0.08 ± 0 0.0838
Fibrinogen α2 chain 12.31 ± 0.52 11.95 ± 0.37 12.17 ± 0.43 12.18 ± 0.76 0.4182
Fibrinogen β chain 9.89 ± 0.36 9.53 ± 0.26 9.68 ± 0.3 9.59 ± 0.53 0.4123
Complement C9 2.91 ± 0.08 2.75 ± 0.06 2.87 ± 0.07 2.79 ± 0.12 0.1766
Complement C1
inactivator 4.97 ± 0.11 4.86 ± 0.08 4.85 ± 0.09 4.7 ± 0.17 0.2838
Gelsolin, isoform 1 1.21 ± 0.03 1.17 ± 0.02 1.19 ± 0.02 1.18 ± 0.04 0.6200
α1-Acid glycoprotein 1 1.73 ± 0.06 1.72 ± 0.04 1.89 ± 0.05 1.79 ± 0.09 0.4627
Haptoglobin β chain 11.36 ± 0.54 10.74 ± 0.38 10.86 ± 0.45 10.31 ± 0.79 0.4481
Zinc- α2-glycoprotein 0.97 ± 0.04 0.97 ± 0.03 1.01 ± 0.03 1.08 ± 0.06 0.2320
Apolipoprotein E 0.58 ± 0.02 0.55 ± 0.01 0.53 ± 0.02 0.5 ± 0.03 0.0874
Complement factor H 0.59 ± 0.01 0.57 ± 0.01 0.58 ± 0.01 0.6 ± 0.02 0.1109
Apolipoprotein D 0.34 ± 0.01 0.34 ± 0.01 0.34 ± 0.01 0.36 ± 0.01 0.7448
c) Men
Plasma 25D (nmol/L)
<30
(n=62)
30 to 49.9
(n=118)
50 to 74.9
(n=87)
≥75
(n=34) p
Afamin 0.26 ± 0.01 0.25 ± 0.01 0.24 ± 0.01 0.23 ± 0.01 0.0603
Angiotensinogen 0.65 ± 0.02 0.66 ± 0.01 0.65 ± 0.02 0.69 ± 0.03 0.5771
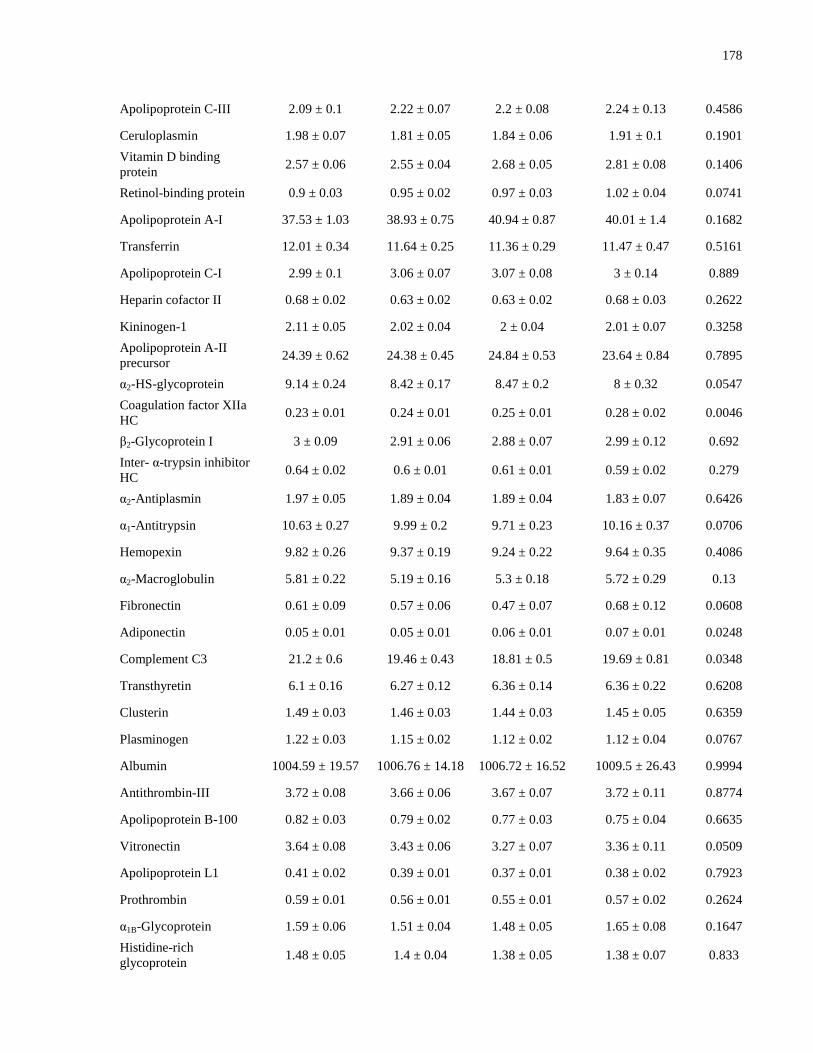
178
Apolipoprotein C-III 2.09 ± 0.1 2.22 ± 0.07 2.2 ± 0.08 2.24 ± 0.13 0.4586
Ceruloplasmin 1.98 ± 0.07 1.81 ± 0.05 1.84 ± 0.06 1.91 ± 0.1 0.1901
Vitamin D binding
protein 2.57 ± 0.06 2.55 ± 0.04 2.68 ± 0.05 2.81 ± 0.08 0.1406
Retinol-binding protein 0.9 ± 0.03 0.95 ± 0.02 0.97 ± 0.03 1.02 ± 0.04 0.0741
Apolipoprotein A-I 37.53 ± 1.03 38.93 ± 0.75 40.94 ± 0.87 40.01 ± 1.4 0.1682
Transferrin 12.01 ± 0.34 11.64 ± 0.25 11.36 ± 0.29 11.47 ± 0.47 0.5161
Apolipoprotein C-I 2.99 ± 0.1 3.06 ± 0.07 3.07 ± 0.08 3 ± 0.14 0.889
Heparin cofactor II 0.68 ± 0.02 0.63 ± 0.02 0.63 ± 0.02 0.68 ± 0.03 0.2622
Kininogen-1 2.11 ± 0.05 2.02 ± 0.04 2 ± 0.04 2.01 ± 0.07 0.3258
Apolipoprotein A-II
precursor 24.39 ± 0.62 24.38 ± 0.45 24.84 ± 0.53 23.64 ± 0.84 0.7895
α2-HS-glycoprotein 9.14 ± 0.24 8.42 ± 0.17 8.47 ± 0.2 8 ± 0.32 0.0547
Coagulation factor XIIa
HC 0.23 ± 0.01 0.24 ± 0.01 0.25 ± 0.01 0.28 ± 0.02 0.0046
β2-Glycoprotein I 3 ± 0.09 2.91 ± 0.06 2.88 ± 0.07 2.99 ± 0.12 0.692
Inter- α-trypsin inhibitor
HC 0.64 ± 0.02 0.6 ± 0.01 0.61 ± 0.01 0.59 ± 0.02 0.279
α2-Antiplasmin 1.97 ± 0.05 1.89 ± 0.04 1.89 ± 0.04 1.83 ± 0.07 0.6426
α1-Antitrypsin 10.63 ± 0.27 9.99 ± 0.2 9.71 ± 0.23 10.16 ± 0.37 0.0706
Hemopexin 9.82 ± 0.26 9.37 ± 0.19 9.24 ± 0.22 9.64 ± 0.35 0.4086
α2-Macroglobulin 5.81 ± 0.22 5.19 ± 0.16 5.3 ± 0.18 5.72 ± 0.29 0.13
Fibronectin 0.61 ± 0.09 0.57 ± 0.06 0.47 ± 0.07 0.68 ± 0.12 0.0608
Adiponectin 0.05 ± 0.01 0.05 ± 0.01 0.06 ± 0.01 0.07 ± 0.01 0.0248
Complement C3 21.2 ± 0.6 19.46 ± 0.43 18.81 ± 0.5 19.69 ± 0.81 0.0348
Transthyretin 6.1 ± 0.16 6.27 ± 0.12 6.36 ± 0.14 6.36 ± 0.22 0.6208
Clusterin 1.49 ± 0.03 1.46 ± 0.03 1.44 ± 0.03 1.45 ± 0.05 0.6359
Plasminogen 1.22 ± 0.03 1.15 ± 0.02 1.12 ± 0.02 1.12 ± 0.04 0.0767
Albumin 1004.59 ± 19.57 1006.76 ± 14.18 1006.72 ± 16.52 1009.5 ± 26.43 0.9994
Antithrombin-III 3.72 ± 0.08 3.66 ± 0.06 3.67 ± 0.07 3.72 ± 0.11 0.8774
Apolipoprotein B-100 0.82 ± 0.03 0.79 ± 0.02 0.77 ± 0.03 0.75 ± 0.04 0.6635
Vitronectin 3.64 ± 0.08 3.43 ± 0.06 3.27 ± 0.07 3.36 ± 0.11 0.0509
Apolipoprotein L1 0.41 ± 0.02 0.39 ± 0.01 0.37 ± 0.01 0.38 ± 0.02 0.7923
Prothrombin 0.59 ± 0.01 0.56 ± 0.01 0.55 ± 0.01 0.57 ± 0.02 0.2624
α1B-Glycoprotein 1.59 ± 0.06 1.51 ± 0.04 1.48 ± 0.05 1.65 ± 0.08 0.1647
Histidine-rich
glycoprotein 1.48 ± 0.05 1.4 ± 0.04 1.38 ± 0.05 1.38 ± 0.07 0.833
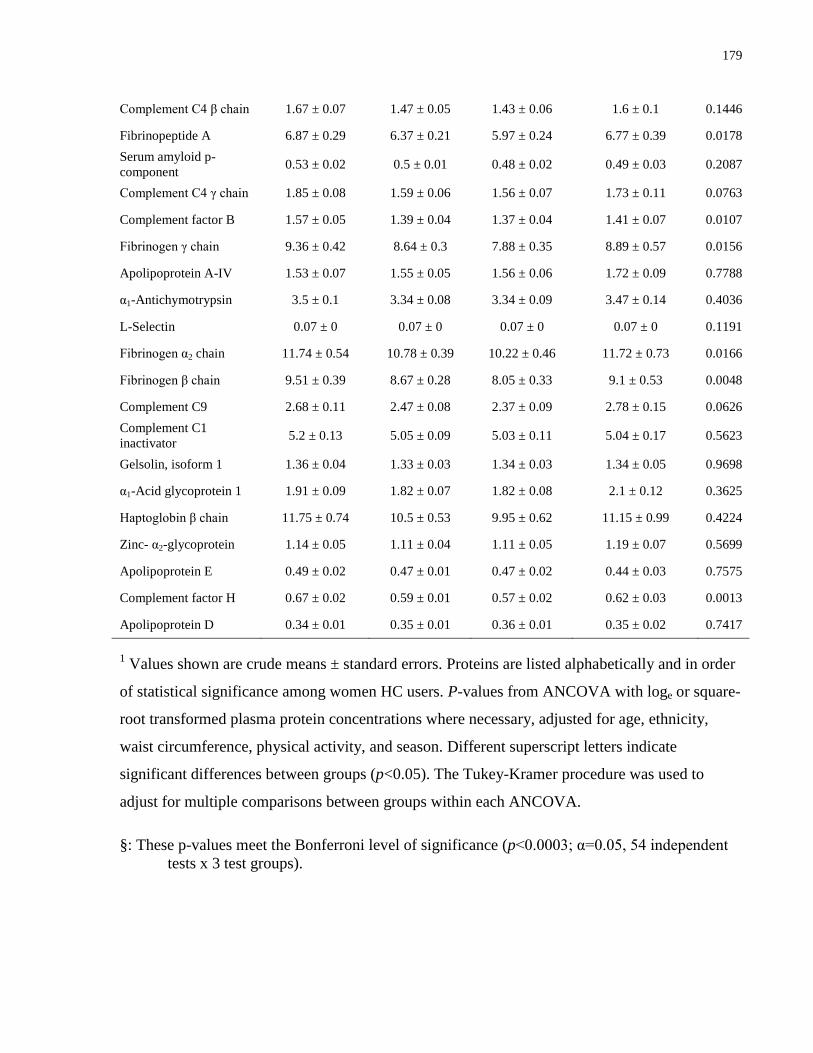
179
Complement C4 β chain 1.67 ± 0.07 1.47 ± 0.05 1.43 ± 0.06 1.6 ± 0.1 0.1446
Fibrinopeptide A 6.87 ± 0.29 6.37 ± 0.21 5.97 ± 0.24 6.77 ± 0.39 0.0178
Serum amyloid p-
component 0.53 ± 0.02 0.5 ± 0.01 0.48 ± 0.02 0.49 ± 0.03 0.2087
Complement C4 γ chain 1.85 ± 0.08 1.59 ± 0.06 1.56 ± 0.07 1.73 ± 0.11 0.0763
Complement factor B 1.57 ± 0.05 1.39 ± 0.04 1.37 ± 0.04 1.41 ± 0.07 0.0107
Fibrinogen γ chain 9.36 ± 0.42 8.64 ± 0.3 7.88 ± 0.35 8.89 ± 0.57 0.0156
Apolipoprotein A-IV 1.53 ± 0.07 1.55 ± 0.05 1.56 ± 0.06 1.72 ± 0.09 0.7788
α1-Antichymotrypsin 3.5 ± 0.1 3.34 ± 0.08 3.34 ± 0.09 3.47 ± 0.14 0.4036
L-Selectin 0.07 ± 0 0.07 ± 0 0.07 ± 0 0.07 ± 0 0.1191
Fibrinogen α2 chain 11.74 ± 0.54 10.78 ± 0.39 10.22 ± 0.46 11.72 ± 0.73 0.0166
Fibrinogen β chain 9.51 ± 0.39 8.67 ± 0.28 8.05 ± 0.33 9.1 ± 0.53 0.0048
Complement C9 2.68 ± 0.11 2.47 ± 0.08 2.37 ± 0.09 2.78 ± 0.15 0.0626
Complement C1
inactivator 5.2 ± 0.13 5.05 ± 0.09 5.03 ± 0.11 5.04 ± 0.17 0.5623
Gelsolin, isoform 1 1.36 ± 0.04 1.33 ± 0.03 1.34 ± 0.03 1.34 ± 0.05 0.9698
α1-Acid glycoprotein 1 1.91 ± 0.09 1.82 ± 0.07 1.82 ± 0.08 2.1 ± 0.12 0.3625
Haptoglobin β chain 11.75 ± 0.74 10.5 ± 0.53 9.95 ± 0.62 11.15 ± 0.99 0.4224
Zinc- α2-glycoprotein 1.14 ± 0.05 1.11 ± 0.04 1.11 ± 0.05 1.19 ± 0.07 0.5699
Apolipoprotein E 0.49 ± 0.02 0.47 ± 0.01 0.47 ± 0.02 0.44 ± 0.03 0.7575
Complement factor H 0.67 ± 0.02 0.59 ± 0.01 0.57 ± 0.02 0.62 ± 0.03 0.0013
Apolipoprotein D 0.34 ± 0.01 0.35 ± 0.01 0.36 ± 0.01 0.35 ± 0.02 0.7417
1 Values shown are crude means ± standard errors. Proteins are listed alphabetically and in order
of statistical significance among women HC users. P-values from ANCOVA with loge or square-
root transformed plasma protein concentrations where necessary, adjusted for age, ethnicity,
waist circumference, physical activity, and season. Different superscript letters indicate
significant differences between groups (p<0.05). The Tukey-Kramer procedure was used to
adjust for multiple comparisons between groups within each ANCOVA.
§: These p-values meet the Bonferroni level of significance (p<0.0003; α=0.05, 54 independent
tests x 3 test groups).