Embed Size (px)
Citation preview

Larson, R. L., Lancelot, Y., et al, 1992Proceedings of the Ocean Drilling Program, Scientific Results, Vol. 129
29. COMPARISON OF LABORATORY AND LOGGING DATA FROM LEG 129AND THE INVERSION OF LOGS TO DETERMINE LITHOLOGY1
Andrew T. Fisher,2 Lewis Abrams,3 and William H. Busch4
ABSTRACT
Coring during Ocean Drilling Program Leg 129 in the western Pacific resulted in poor to fair recovery, often less than 10%,meaning that sedimentary sections have been poorly characterized through description of the cores. This study is an attempt tobetter characterize the sediments over parts of the drilled intervals, using continuous wireline-logging measurements. Laboratoryand log data are presented and compared to establish which intervals are well represented by the recovered cores. Reboundcorrections are applied to sediments containing a significant proportion of clay, as these materials seem to have most closelyfollowed standard compactional trends for deep-sea sediments. Laboratory and log measurements are then used to establish fiveidealized lithotypes, end-member components that can be mixed to generate a variety of sediment compositions and properties.The log data are then inverted to determine the proportions of each of these lithotypes represented at every measurement depth.Examination of trends in the proportions of the five lithotypes reveals sedimentological relationships that were not apparent inthe cores, largely because core recovery was strongly biased. The results of this exercise are qualitatively satisfying, but morequantitative log inversion would probably require significantly higher recovery in order to constrain possible lithotypes, bothphysically and chemically.
INTRODUCTION
Three sites were drilled and cored during Ocean Drilling Program(ODP) Leg 129 to the Pigafetta and East Mariana basins, yielding awide variety of sediment and rock types and ages. One to four samplesof typical lithologies from every core were collected and run througha series of standard tests to determine physical properties. Wirelinelogs were also run at all three sites in an effort to obtain continuousdata from the sedimentary section; these logs cover only a part of thesedimentary section at each site, and no logs were run in basement.The logs are particularly important because overall recovery withinthe sedimentary sections was fair to poor. Several hundred-meterintervals are characterized by rock representing <5% of that drilledand cored.
The purpose of this study is to use physical properties and logmeasurements made during the cruise, and geochemical data col-lected after the cruise, to (1) better characterize the physical state ofthe sediments, (2) establish some degree of ground-truth for both laband borehole measurements, and (3) provide a qualitative assessmentof the distribution of lithotypes that would be present in "repre-sentative" sections from these sites, if such complete records couldbe obtained.
Sediments Drilled and Cored during Leg 129
Site 800 was the first drilled during Leg 129, and is located in thenortheastern Pigafetta Basin, at about 22°N (Fig. 1; Brenner andAngell, this volume; Shipboard Scientific Party, 1990a). Sedimentsfrom Site 800 range in age from younger than Pliocene to EarlyCretaceous, with the greatest representation by Aptian and Albianmaterial. The sedimentary section was divided into five primary
Larson, R. L., Lancelot, Y., et al., 1992. Proc. ODP, Sci. Results, 129: CollegeStation, TX (Ocean Drilling Program).
Ocean Drilling Program and Department of Geophysics, Texas A&M University,1000 Discovery Drive, College Station, TX 77845-9547, U.S.A.
Graduate School of Oceanography, University of Rhode Island, Narragansett,Rhode Island, 02882-1197, U.S.A.
Department of Geology and Geophysics, University of New Orleans, New Orleans,LA 70148, U.S.A.
lithologic units by the Shipboard Scientific Party (1990a), only three ofwhich include significant coverage by wireline logs: Unit II—brown chertand porcellanite; Unit HI—gray chert and limestone; and Unit IV—rede-posited volcaniclastics (sandstone, siltstone and claystone). Recoveryranged from extremely poor in Units π and HI (3.5%-7.3%, 5.1% overall)to excellent in parts of Unit IV (>80% in some cores, 42.7% overall).Although these divisions, and those that followed at the remaining sites,appear to be obvious from the core descriptions and site chapters inLancelot, Larson, et al. (1990), a quick examination of the barrel sheetsand logs reveals that each lithologic unit is actually a complex mixture ofmany different sediment types. In general, the lithologic unit boundarieswere positioned at the first significant occurrence of a major lithologicchange (usually a change in sediment type that suggested a change indepositional facies), although for any particular unit, sediments typical ofoverlying and underlying units commonly appear throughout (Lancelot,Larson, et al., 1990).
Two holes included coring within the sedimentary section at Site801 (Fig. 1; Brenner and Angell, this volume; Shipboard ScientificParty, 1990b), yielding five lithologic units, three of which werecovered by wireline logs: Unit II—brown chert and porcellanite; UnitIII—volcaniclastic turbidites and minor pelagic intervals; and UnitIV—brown radiolarite. Unit III provided poor-fair recovery (20.9%overall) whereas recovery in Units II and IV was extremely poor,averaging only 4.8%. Sediments at Site 801 ranged in age fromyounger than Paleocene to Middle Jurassic, with the greatest repre-sentation of mid-Cretaceous material. Although Site 801 is locatedabout 500 km to the southeast of Site 800, several of the lithologicunits appear to correlate well between the sites, in terms of theircompositions, if not ages: Site 800, Unit II correlates with Site 801,Unit II; Site 800, Unit IV correlates with Site 801, Unit III; and Site800, Unit V correlates with Site 801, Unit IV (Karpoff, this volume;Shipboard Scientific Party, 1990a,b). This correlation allows somecomparison and combination of physical properties and log responsesin order to characterize the typical properties of individual sedimen-tary units, as described later.
A single hole was drilled at Site 802, located in the East MarianaBasin, approximately 830 km southwest of Site 801 (Fig. 1; Brennerand Angell, this volume; Shipboard Scientific Party, 1990c). Sedi-ments recovered while drilling Hole 802A ranged in age fromQuaternary to Early Cretaceous, with the greatest representation by
507
A. T. FISHER, L. ABRAMS, W. H. BUSCH
55°N
150 170° 170°W
Figure 1. Locations of ODP Sites 800, 801, and 802 in the western Pacific(Lancelot, Larson, et al., 1990).
Miocene material. These materials yielded nine lithologic units, onlytwo of which were logged: Unit II—volcaniclastic turbidite tuffs,and Unit III—nannofossil chalk. Recovery was poor to good in bothof these units, ranging from 2% to 80%, and was 23.4% overall. This sitewas separated from those in the Pigafetta Basin by a major morphotec-tonic boundary, a seamount province and fracture zone, which stronglyinfluenced sediment distribution; sediments in Units II and III at Site 802do not correlate well (by age or composition) with sediments from eitherSite 800 or 801 (Shipboard Scientific Party, 1990c).
Biased Sampling
In addition to being extremely poorly sampled overall because oflow recovery, many of the lithologic units recovered during Leg 129were sampled nonrepresentatively. For example, the small chunks ofchert and limestone brought back to the surface when cutting coresfrom lithologic Unit III in Hole 800A are a biased sample of thesediments penetrated, as there is good evidence that these two lith-ologic types compose less than half of the stratigraphic sequence ofthe unit. First, the drillers reported alternating hard and soft intervals,particularly when penetrating zones where very hard materials suchas chert, limestone, porcellanite, and radiolarite were the only rocksrecovered (and where recovery was typically extremely low). Second,the interval velocities determined from site surveys in this areaindicate that the average acoustic velocity through the sedimentarysections is near 2 km/s at all three sites, yet the hard lithologies listedpreviously yielded significantly greater laboratory velocities (Lance-lot, Larson et al., 1990). Similarly, sonic logs through several intervalsthat yielded low recovery of only very hard material suggest in-situsediment velocities that are significantly lower than the velocitiesmeasured on samples from cores within these intervals.
Additional biases were also introduced because of the specificinterests of the shipboard party and the techniques used for samplecollection and testing. Several specialists sampled primarily silica-rich intervals (Behl et al., this volume; Karl and Karpoff, this volume)
whereas others measured the bulk geochemistry of samples that couldbe squeezed for pore fluids (France-Lanord et al., this volume). As aresult, our knowledge of the composition of materials drilled andcored during Leg 129 is not only limited, but also strongly skewed.
EXPERIMENTAL METHODS
Shipboard physical properties and logging measurement tech-niques are described in detail in Lancelot, Larson et al. (1990), andonly a brief review is provided here. Within each core, shipboardphysical-properties scientists sampled both representative and un-usual lithologic types to characterize the recovered materials. Vol-umes of dry samples (approximately 10 cm3), determined using ahelium-displacement pycnometer, and wet and dry masses, measuredwith an electronic balance, were used to calculate bulk and graindensities, porosities, and water contents. These data were checked bygamma-ray attenuation porosity evaluator (GRAPE) (Boyce, 1976)and found to be reproducible to within about 5%. Salt correctionswere applied as per Hamilton (1971). Some samples of extremelyhard and nonporous lithologies were powdered to more accuratelydetermine grain densities. Compressional-wave velocities were de-termined using a Hamilton frame velocimeter, with an estimatedaccuracy of about 2% (Boyce, 1976). Residues from index propertiesmeasurements were tested for calcium carbonate content using acoulometer, with an estimated error of about 1%.
Standard logging runs during Leg 129 included a quad-combina-tion string (long-spaced sonic, dual-induction, natural spectral gamma,and high-temperature lithodensity tools) and a geochemical combina-tion string (natural spectral gamma, induced spectral gamma, andaluminum clay tools). These tools all have different sampling intervals,depths of investigation, and sensitivities to hole conditions. Completedescriptions of the tools can be found in the Ocean Drilling ProgramLogging Manual (Borehole Research Group, 1990). Logs were re-corded in all cases through as much open hole as was available.Because the logs were run last, often after many days of coring anddrilling, deteriorating hole conditions allowed only parts of each holeto be logged (Lancelot, Larson et al., 1990).
Log records from the different strings run in the same hole weredepth-shifted to match natural gamma readings, where possible. InHole 80IB, the lithodensity and natural gamma tools were run out ofsequence, resulting in irradiation of the formation immediately beforemeasurement of "natural" radiation levels. Depth-shifting in Hole80IB, therefore, required a more subjective matching of naturalgamma and other tracks from the geochemical string and with physi-cal-property records from the quad-combination string. Log depthswere tied to core depths (that is, depth below the seafloor) based onthe identification of the seafloor and/or the end of the pipe and thedriller's depth records.
The caliper from the lithodensity tool was used to measure bore-hole size to identify washed-out zones and correct the responses oftools to borehole variations. Records from the long-spaced sonic toolwere processed aboard ship to remove noise and unrealistic velocitiescaused by cycle skips (Lancelot, Larson et al., 1990). Data from thegeochemical combination string were subjected to significant post-cruise processing, as described in Hertzog et al. (1989) and Pratsonet al. (this volume). The field data were first corrected for loggingspeed, pipe effects, and the presence of mud added to the borehole tomaintain hole stability. Relative elemental yields were then deter-mined for a maximum of nine elements. Total radioactivity and Th,U, and K concentrations were calculated with data from the naturalspectral gamma tool, and Al concentrations were calculated with datafrom the aluminum clay tool, with a correction applied for siliconinterference. Al and K elemental yields were then normalized to allowfor the calculation of elemental, dry-weight fractions. These fractionswere, in turn, used to estimate dry-weight fractions of individual
oxides. Comparison of geochemical log and laboratory data has oftenrevealed accuracy for elements better than 3% (van den Oord, 1990;Wentdlandt and Bhuyan, 1990; Cannon and Coates, 1990).
The geochemical logging tools were developed primarily for oilfield applications. As such, the tools have generally been tested andcalibrated within lithologies typical of these settings. For example,the conversions from elemental yields to oxide abundances are basedon experimental data from "typical" sedimentary rocks (Pratson et al.,this volume), which may not be typical of those materials loggedduring Leg 129. As elemental responses are not expected to be linearwith concentration (Hertzog et al., 1989), the exotic nature of someLeg 129 lithologies adds significant uncertainty to the interpretationsbased on geochemical logging data. In addition, much of the geo-chemical log calibration and processing is proprietary, meaning thatthe exact procedures are not available to the scientific community.
Logging data collected on the Resolution were recorded every0.15 m (6 in.). In order to directly compare log measurements fromdifferent strings, reduce the number of data points to a more manage-able quantity, and allow for cross-plotting and ratioing, we passed thedata through a 0.5-m boxcar-averaging filter, with final depths chosenat regular 0.5 m intervals relative to the seafloor (i.e., 55.0, 55.5,60.0,...m below seafloor [mbsf]). All logs presented in this paper havebeen filtered using the same scheme; examination of the final curvessuggests that significant character remains after filtering.
Physical Properties Rebound Corrections
In the following sections, we have grouped data by lithotype andplotted all properties as a function of depth to examine compactionalinfluences on physical properties. Compaction is a function of time,not just depth (e.g., Busch, 1989), but this simple approach allowselucidation of several important relationships. Figure 2 reveals thatonly the clay and claystone samples collected during Leg 129 displaya significant compaction with depth. In particular, the chert, lime-stone, porcellanite, radiolarite, and chalk samples display no coherentvariations in porosity with depth. Several chert samples collectedfrom above 100 mbsf are somewhat higher in porosity (and corre-spondingly lower in density) than those found below 300 mbsf, butwithin each group there is no strong trend. Sandstone and tuff samplesdisplay a slight decrease in porosity with depth and siltstone samplesreflect a significantly greater compactional trend, but clay andclaystone samples fall squarely between the pelagic clay and ter-rigenous sediment curves defined by Hamilton (1976). This findingsuggests that, to a first order, only the index properties of clay andclaystone samples need be corrected for rebound due to removal fromin-situ conditions. Some caution must be used in making this inter-pretation, as there may have been insufficient time for the samples torebound fully between collection and testing. For this reason, we havechosen to apply the smaller of the rebound corrections suggested byHamilton (1976) for clay-rich sediments, that for terrigenous clay(Fig. 2A). No porosity correction has been applied to data from chalksamples, mainly because these data do not display a coherent trendwith depth (Fig. 2B). In addition, within an appropriate range ofporosities the acoustic properties of pelagic carbonate sediments maybe somewhat less sensitive to interparticle porosity than they are tointraparticle porosity, changes in which do not depend directly onburial and compaction (e.g., Fulthorpe et al., 1989).
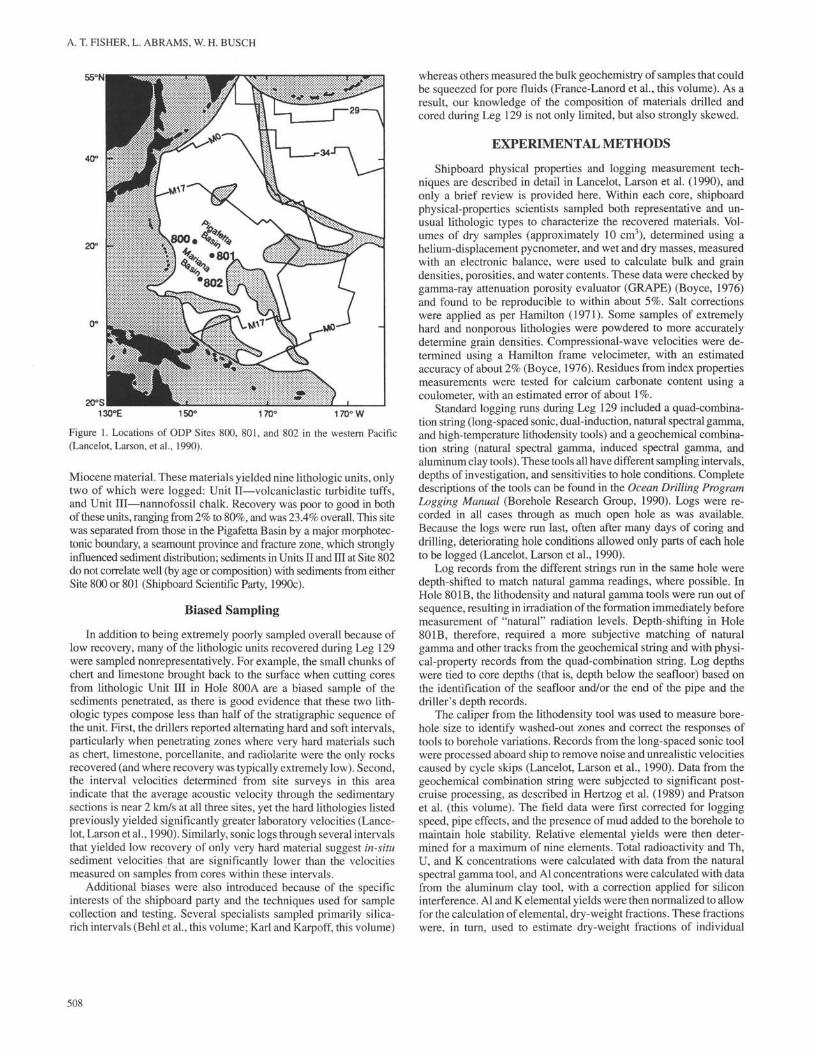
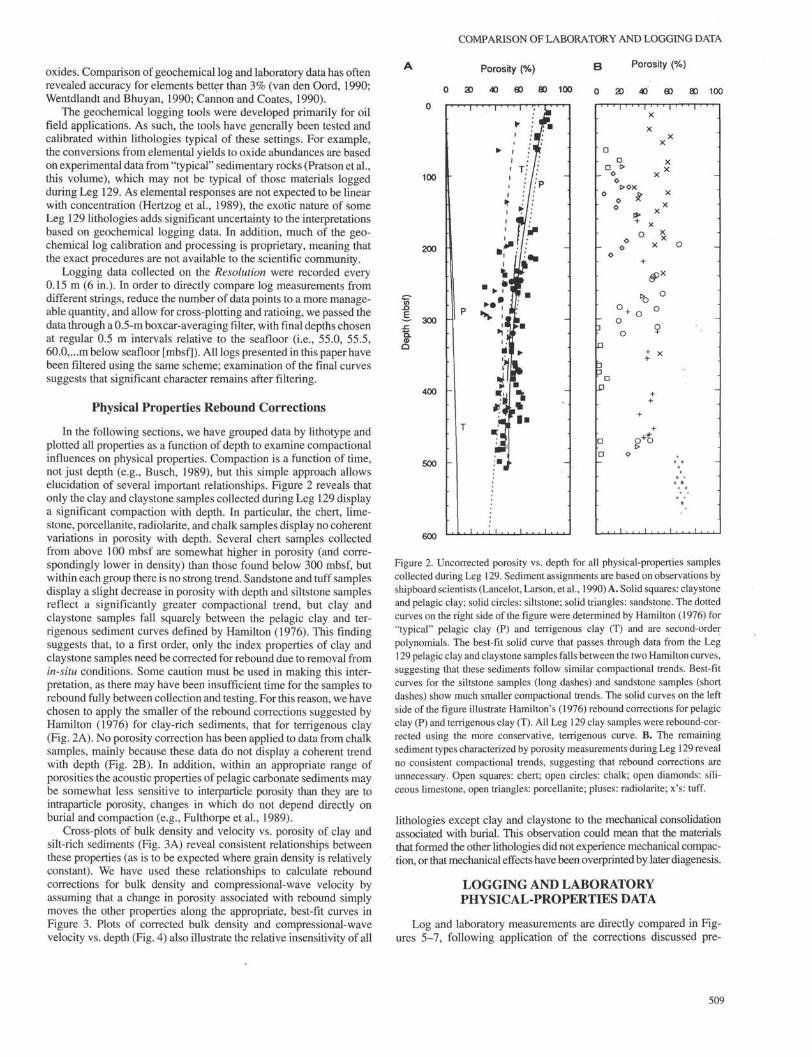
Cross-plots of bulk density and velocity vs. porosity of clay andsilt-rich sediments (Fig. 3A) reveal consistent relationships betweenthese properties (as is to be expected where grain density is relativelyconstant). We have used these relationships to calculate reboundcorrections for bulk density and compressional-wave velocity byassuming that a change in porosity associated with rebound simplymoves the other properties along the appropriate, best-fit curves inFigure 3. Plots of corrected bulk density and compressional-wavevelocity vs. depth (Fig. 4) also illustrate the relative insensitivity of all
COMPARISON OF LABORATORY AND LOGGING DATA
Porosity (%)
20 40 θO 80 100
Porosity (%)
20 40 60 83 100
100
200
X>
~ 300
400 -
500 -
α
π
0
c
-3
a
b3' DD
a
a
T I '
D>
>O
• 1 • • • 1 • • • 1 • • 'X
XX
X
X
×X
>ox0o
oo
ooo
o
. 1 ,
×
+ Xo ^
X O
oo
o
+ ×
•,*
, 1 . . , 1 . , . 1 . , .600
Figure 2. Uncorrected porosity vs. depth for all physical-properties samplescollected during Leg 129. Sediment assignments are based on observations byshipboard scientists (Lancelot, Larson, et al., 1990) A. Solid squares: claystoneand pelagic clay; solid circles: siltstone; solid triangles: sandstone. The dottedcurves on the right side of the figure were determined by Hamilton (1976) for"typical" pelagic clay (P) and terrigenous clay (T) and are second-orderpolynomials. The best-fit solid curve that passes through data from the Leg129 pelagic clay and claystone samples falls between the two Hamilton curves,suggesting that these sediments follow similar compactional trends. Best-fitcurves for the siltstone samples (long dashes) and sandstone samples (shortdashes) show much smaller compactional trends. The solid curves on the leftside of the figure illustrate Hamilton's (1976) rebound corrections for pelagicclay (P) and terrigenous clay (T). All Leg 129 clay samples were rebound-cor-rected using the more conservative, terrigenous curve. B. The remainingsediment types characterized by porosity measurements during Leg 129 revealno consistent compactional trends, suggesting that rebound corrections areunnecessary. Open squares: chert; open circles: chalk; open diamonds: sili-ceous limestone, open triangles: porcellanite; pluses: radiolarite; x's: tuff.
lithologies except clay and claystone to the mechanical consolidationassociated with burial. This observation could mean that the materialsthat formed the other lithologies did not experience mechanical compac-tion, or that mechanical effects have been overprinted by later diagenesis.
LOGGING AND LABORATORYPHYSICAL-PROPERTIES DATA
Log and laboratory measurements are directly compared in Fig-ures 5-7, following application of the corrections discussed pre-
509

A. T. FISHER, L. ABRAMS, W. H. BUSCH
A 3000
2600 —
E, 2200
•
-° 1800Φ
1400 —
1000
- Vθ
-—.
•
=2
• — _ .
[
i
743.3 -
i
21.2*p
i O
I I I 1 I ! I
>or + 0.8*por r-0.82 i ; ;
o:
k A è̂σ P i do
i i i i i i i i i i
C~o~
i i i ! | i j i |
<- — . «
—M —_O
• — -
O>—<=>TT<)
• —
r. . .
i . .
.o
3
co
2.6
2.4 F-
f 1.8
1.0
2.2
2.0
1 . 6 ^ •
1.4 =-•
1 . 2 - •
xs•
i
A
_ f
I
I I ' : ! ! ! ; ! ! ; i l l
! den = 2.44 - 0.0079*por - .000075*por2 r - 0.95
T : : : : : : : : : : : : :
^ J J Λ * . I f ] | | | j
f NW^%Kg"2;• •| ; t ! ;i • ! i Q i o crβRCLaα: - ! ; ! !
r : r •i•D i i •Oi i^^j^-j^•• i i
! ! i i i i i i i i i i l ^ ö
> i •i •i i \ i i > 't i• 4- '. <
: : I : : : : : : : : i :i l l I i I I l
|δ|
1
y
)
-
- –
30 40 50 60
Porosity (%)
70 80 90
Figure 3. Cross-plots of the physical properties of pelagic clay and claystone samples. The best-fit curves in these figures were used to applyrebound corrections to shipboard data. A. Vertical compressional-wave velocity vs. porosity. Circles are laboratory data from all sites; squaresare log data within clay-rich zones from Site 800 only. The presence of intervals composed mainly of clay was not apparent from the logs atSites 801 and 802. Log velocities were measured directly, but log porosities were determined from the lithodensity log and a synthetic graindensity log derived from the lithologic inversion described elsewhere in this paper. The borehole and laboratory trends agree. The solid line isa best-fit, second-order polynomial through the laboratory data only. B. Bulk density vs. porosity. Circles are measurements made using standardgravimetric methods; squares are from two-minute GRAPE measurements (Lancelot, Larson et al., 1990). The solid line is a best-fit,second-order polynomial through all data (A). The dashed line is the expected relationship from trends listed in Hamilton (1976) for pelagicclay (P), whereas the dotted line is a similar relationship for terrigenous clay (T).
viously. Depth errors may have been introduced in core-log depthcorrelations. Many errors are introduced as a result of differentialdrill-pipe and wireline stretch and heave. In addition, all recoveredcore has been pushed to the top of the cored interval for archivalpurposes, as is standard ODP procedure.
We have confidence in the overall quality of the density andvelocity logs in Hole 800A because of the strong, nearly peak-for-peak, correlation between the two. There is also excellent agreementbetween laboratory and borehole density measurements within theinterval of 220-280 mbsf (mainly Unit IV, redeposited volcaniclas-tics). The agreement between the measurements at 160-220 mbsf isalso surprisingly good, considering the extremely poor recovery andbiased sampling in this section. Significantly higher laboratory den-sity measurements between 40 and 160 mbsf are not surprisingconsidering the preferential core recovery in the chert and limestoneof lithologic Units II and III.
Velocity measurements from Hole 800A follow similar trends,with excellent agreement between 220 and 260 mbsf, and signifi-cantly poorer agreement at lesser depths. It is not immediately appar-ent what happened below 150 mbsf that allowed the two data sets tomatch so closely, but this is the approximate depth below which
claystone and chalk appear in cores within the chert and limestone oflithologic Unit III. It may be that these constituents were also presentin the shallower portions of the section, but were too soft andunlithified to allow recovery.
We inverted the medium-depth resistivity log derived from thedual-induction tool to look at in-situ porosity trends, with poor results.The empirical Archie (1942) relationship for clean quartz sandstoneis known to break down in unlithified to Semilithified, high-porositymaterials, and when clay content is greater than a few percent (e.g.,Waxman and Smits, 1968; Clavier et al., 1977) because the measuredresistivity includes contributions from both free water in pores andbound water on clay minerals. Although the absolute correlationbetween laboratory porosities and log porosities determined withArchie's Law is poor, there are zones within which the two curvesfollow similar trends; these are the same zones over which there is agood correlation between shipboard and log density and velocity data.
Also shown in Figure 5 (and in Figs. 6 and 7 for Sites 801 and802, respectively) is a synthetic porosity log calculated from theborehole bulk density curve, an assumed pore-fluid density of 1.050g/cm3 (appropriate for seawater at 6000 m water depth; Neumann andPierson, 1966), and an average grain density based on the weight per-
510

COMPARISON OF LABORATORY AND LOGGING DATA
_ „ , ., . , 3× Velocity (m/s)Bulk density (g/cm ) B
1.2 1.4 1.6 1.8 2.0 2.2 2.4 2.6 2.8 1000 2000 3000 4000 5000 6000
100 _
200 _
E
Q.
Q
300 _
400 -
500 _
. . . I 1 . . .
1
_
XX
×X
>
- à° •if- +T »àT *•l +*.
- P
1
o
×>
X
X
P
α>
× oo>
o ×o
o
o
o
1
1 '
D
α
X
o
1 ' 1
o
π
_
DD
DD
D
, . 1
-
600
Figure 4. Rebound-corrected physical properties vs. depth from Leg 129. The symbols are the same as in Figure 2. The solid linesillustrate trends in the pelagic clay and claystone data. A. Bulk density. B. Compressional-wave velocity.
centages of individual lithologies determined with the inversionprocedure described later in this paper. The porosity data show trendscorresponding to those of the other physical-properties data; thevariable goodness of fit of the laboratory porosity data to the syntheticporosity log support the inference that the laboratory data are repre-sentative only within zones over which recovery was relatively high.
At Site 801, the section from about 190 to 270 mbsf displaysremarkable agreement between borehole and corrected laboratoryphysical-properties data (Fig. 6). Again, the materials that dominatethis interval are redeposited volcaniclastic sediments. Chert- andradiolarite-rich sections reveal less consistent trends. The fit betweenthe lab and borehole data is best overall in Hole 802A (Fig. 7). Thereis general agreement throughout the logged section, with an excellentmatch below about 200 mbsf. The logged interval in Hole 802A iscomposed almost entirely of volcaniclastic tuff, claystone, and chalk,which seem to have allowed for the most representative core samplingof the drilled formation, despite the relatively low recovery.
The corrected laboratory data provide a means to check theconsistency of borehole measurements, particularly within zones of
good recovery where we have high confidence that the core isrepresentative of the drilled section. In all cases where recovery wasgood (>60%-70%) the match between physical-properties measure-ments and corresponding logs is excellent. If borehole conditionswere sufficiently good for the lithodensity tool, which is highlysensitive to borehole irregularities, conditions within the same zonesshould have been good for other logs as well. Within identifiablezones in these intervals that contain a single lithology, individualproperties or characteristics of that lithology can be determined. If azone assumed to contain a single lithology actually contains a mixtureof several lithologies, characterization of any one will be impossiblewithout an a priori estimate of the relative proportions and propertiesof the other constituents.
Mean Properties
The consistency of physical properties as a function of lithology(rather than depth or degree of compaction) is evident when individ-ual measurements are averaged using samples that appeared to be
511
A. T. FISHER, L. ABRAMS, W. H. BUSCH
DensityVelocity(km/s)
1.0 2.0 3.0 1 0 3 0
(g/cm3) Porosity (%)
0 50 100
100
200
v I
300
400
500
1
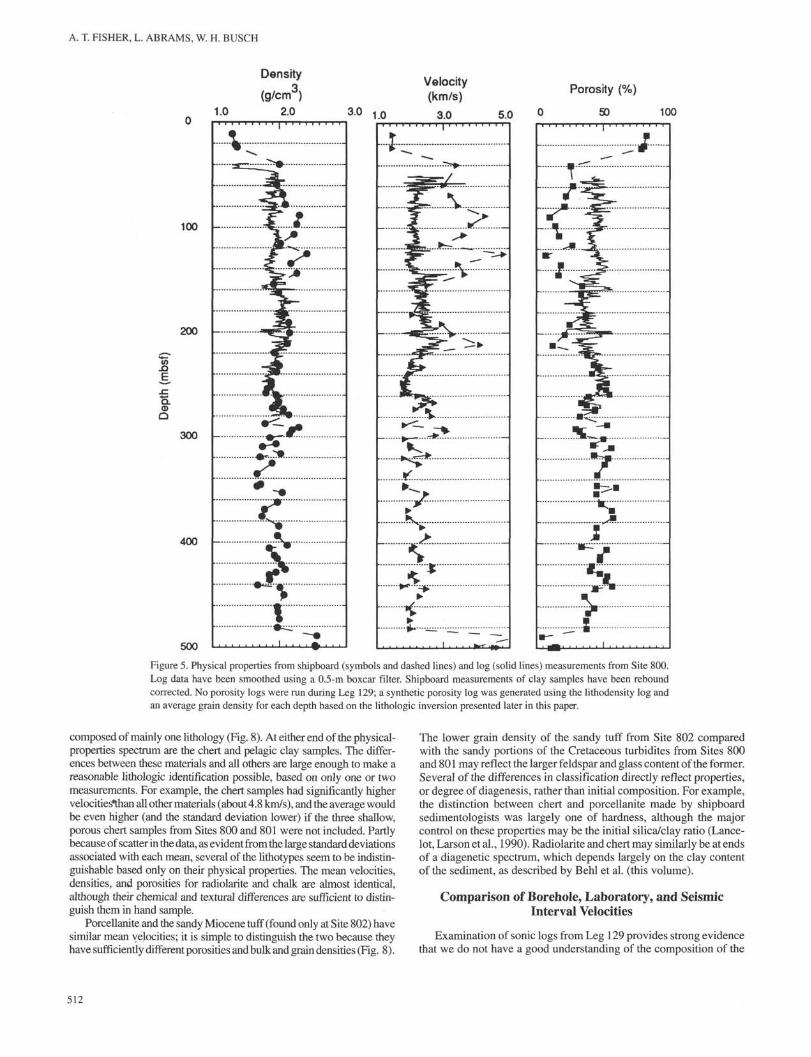
Figure 5. Physical properties from shipboard (symbols and dashed lines) and log (solid lines) measurements from Site 800.Log data have been smoothed using a 0.5-m boxcar filter. Shipboard measurements of clay samples have been reboundcorrected. No porosity logs were run during Leg 129; a synthetic porosity log was generated using the lithodensity log andan average grain density for each depth based on the lithologic inversion presented later in this paper.
composed of mainly one lithology (Fig. 8). At either end of the physical-properties spectrum are the chert and pelagic clay samples. The differ-ences between these materials and all others are large enough to make areasonable lithologic identification possible, based on only one or twomeasurements. For example, the chert samples had significantly highervelocities than all other materials (about 4.8 km/s), and the average wouldbe even higher (and the standard deviation lower) if the three shallow,porous chert samples from Sites 800 and 801 were not included. Partly
t because of scatter in the data, as evident from the large standard deviationsassociated with each mean, several of the lithotypes seem to be indistin-guishable based only on their physical properties. The mean velocities,densities, and porosities for radiolarite and chalk are almost identical,although their chemical and textural differences are sufficient to distin-guish them in hand sample.
Porcellanite and the sandy Miocene tuff (found only at Site 802) havesimilar mean velocities; it is simple to distinguish the two because theyhave sufficiently different porosities and bulk and grain densities (Fig. 8).
The lower grain density of the sandy tuff from Site 802 comparedwith the sandy portions of the Cretaceous turbidites from Sites 800and 801 may reflect the larger feldspar and glass content of the former.Several of the differences in classification directly reflect properties,or degree of diagenesis, rather than initial composition. For example,the distinction between chert and porcellanite made by shipboardsedimentologists was largely one of hardness, although the majorcontrol on these properties may be the initial silica/clay ratio (Lance-lot, Larson et al., 1990). Radiolarite and chert may similarly be at endsof a diagenetic spectrum, which depends largely on the clay contentof the sediment, as described by Behl et al. (this volume).
Comparison of Borehole, Laboratory, and SeismicInterval Velocities
Examination of sonic logs from Leg 129 provides strong evidencethat we do not have a good understanding of the composition of the
512

COMPARISON OF LABORATORY AND LOGGING DATA
Density
1.0
3(g/cm*3)
2.0 3.0 1.0
velocity(km/s)
3.0 5.0 0
Porosity (%)
50 100
100
200
ΦCl
300
400
500
• • • • i • • • • i • • • i • • • • i • • • •
"X—ft. ....
< * >
te^*
. . . . 1 . . . . 1 . . . . 1 .. . % ! . . .
' P • •
••s
• *.....^ -^
* ^
fc^r .^.
•
T i
* ,
Figure 6. Physical properties from shipboard (symbols and dashed lines) and log (solid lines) measurements from Site 801;curves and symbols are as in Figure 5.
sedimentary section drilled at the three sites. Figure 9 illustrates acomparison of interval slowness estimated from the correlation ofseismic reflectors with lithologic boundaries, and slowness deter-mined using the long-spaced sonic tool. Over complete logged inter-vals, the sonic slowness is within one standard deviation of theinferred interval slowness. The weighted fit for Sites 800 and 802 isactually quite good, and the fit for Site 801 somewhat less so. Whenthe individual seismic intervals are examined, however, the match isless assuring. Zones predicted to have low slowness (high velocities)from seismic picks have higher sonic-tool slowness (lower veloci-ties), whereas other zones predicted from the seismic picks to havehigh slowness (low velocities) have lower sonic-tool slowness (highervelocities). It is not expected that the seismic and sonic data will be aperfect match, particularly because only portions of some seismicintervals were logged; a good match of seismic and sonic velocitieswithin these intervals would require that average velocities applyacross each. Velocities of complete seismic intervals over which thesonic tool was run should match, however.
The interval velocities reported by the Shipboard Scientific Party(1990a,c) for Sites 800 and 802 were estimated from synthetic seismo-grams derived from logged velocity and density measurements,whereas the interval velocities for Site 801 were estimated without theguidance of log-generated synthetic seismograms. The detail presentedfor the interval velocities (Shipboard Scientific Party, 1990a, figure 42;Shipboard Scientific Party, 1990b, figure 57; Shipboard ScientificParty, 1990c, figure 58) was poorly constrained, particularly at Site801, although there are several correlatable seismic and lithologichorizons that should provide a reasonable estimate for average sedi-ment velocities.
There appears to be a good correlation between seismic reflectionsand cored lithologies at the following sub-seafloor boundaries: the top ofUpper Cretaceous chert and porcellanite units at Sites 800 and 801(Unit II in both cases); the top of a massive chert bed at the base of, orbounding, Unit III at Site 801; the top of the first abundant chert intervalwithin the chalky part of Unit III at Site 802; and the top of massiveigneous units at all three sites (Jurassic igneous basement at Site 801;
513

A. T. FISHER, L. ABRAMS, W. H. BUSCH
Density
(g/cm3)
1.0 2.0 3.0
Velocity
(km/s)
3.0 5.0
Porosity (%)
0 50 100
50
ioo
150
•B 200Q.ΦQ
250
300
350
400. . . . I
Figure 7. Physical properties from shipboard (symbols and dashed lines) and log (solid lines) measurements from Site 802;
curves and symbols are as in Figure 5.
mid-Cretaceous sills at Site 800; mid-Cretaceous flows at Site 802).Combined with a good reflector at the seafloor, these correlations suggestaverage velocities for the sedimentary sections of approximately 2.0 km/sat Sites 800 and 801 and 1.9 km/s at Site 802 (Abrams et al., this volume).These interval velocities are consistently lower than the sonic-log veloci-ties determined from averaging travel times over the logged intervals(Sites 800 and 801:2.2 km/s; Site 802:2.1 km/s). The sonic-log velocitiescovary consistently with the resistivity, gamma-ray, and bulk-densitylogging data, which indicates that at least the relative changes in loggedvelocities are correct. It is these changes in velocities that provide anecessary discriminant for the inversion exercise that follows.
Comparison of Log and Laboratory Geochemical Data
Figures 10-12 illustrate processed geochemical log data plotted withlaboratory data from the three sites. Within the chert-rich intervals,laboratory silica contents tend to exceed those calculated from logmeasurements, which is not surprising as cherty lithologies tended to be
(1) preferentially recovered, and (2) preferentially sampled by chertspecialists who provided most of the data over these intervals (Behl, thisvolume; Karl and Karpoff, this volume). The Site 800 laboratory data forthe other major oxides used in this study match the log-derived oxideswell (Fig. 10). At Site 801, log-derived silica oxide contents are againlower than those determined in the laboratory, particularly in the upper-most volcaniclastic turbidites of lithologic Unit III (Fig. 11). The lab datafrom this interval also include preferentially sampled chert and porcel-lanite. These samples also yielded lower aluminum and iron oxidepercentages than measured with logs, and calcium contents are lowthroughout the logged interval (Fig. 11). The match between log- andlab-derived oxide contents appears to be fair to good at Site 802, wheredominantly volcaniclastic tuff and chalk were logged (Fig. 12). Thisinterval displays the widest range in variations of all oxides, making arealistic evaluation of the match between log and lab data difficult(particularly considering the lingering questions concerning core-logdepth shifting). Some of the logged oxide contents appear to be unreal-istically extreme at Site 802 (particularly silica and iron), which may
514

COMPARISON OF LABORATORY AND LOGGING DATA
Grain density (g/cm ) Velocity (m/s)Bulk density (g/cm )
Chert
Siliceouslimestone
Porcellanite
Sandy tuff
Sandstone
Radiolarite
Chalk
Siltstone
Claystone
Pelagicclay
I I ^ ^ " I • ' '
Figure 8. Average bulk density, vertical compressional-wave velocity, and grain density values for each of the 10 primary lithologies identified duringLeg 129, as determined with shipboard measurements. Bars indicate one standard deviation. Data from clay samples have been rebound corrected.
reflect the use of the geochemical logging tool and standard process-ing outside the normally calibrated range.
INVERSION OF LOGS FOR LITHOLOGY
Since its introduction, the geochemical logging tool has been used todetermine quantitative mineral assemblages, usually through inversionof calculated element and oxide abundances (e.g., Harvey et al., 1990).There are many techniques available to complete this inversion, and eachhas benefits and drawbacks. We have used selected physical propertieslogs in combination with calculated oxide percentages and several limit-ing assumptions to estimate the abundances of fixed lithotypes through-out the logged intervals of Sites 800, 801, and 802.
As a first step in this exercise, we have defined a series of idealized"lithotypes" that have end-member compositions and properties. Thisapproach contrasts with standard geochemical log inversions for
mineralogy (e.g, van den Oord, 1990; Wentdlandt and Bhuyan, 1990;Pratson et al., this volume). We did not feel that we had sufficient data(either laboratory or borehole) or sufficient confidence in the boreholedata (particularly at Site 802) to constrain the vast number of miner-alogies apparent from x-ray diffraction analysis, and hand-sample andthin-section examination (Lancelot, Larson et al., 1990). In addition,our primary interest was in determining the relative proportions oflithologies present in the chert-, radiolarite-, and limestone-rich inter-vals. Following completion of this first-order analysis, a more detailedmineralogical analysis could focus on the mineralogies within iso-lated intervals.
The use of linear inversion techniques is detailed elsewhere (Harveyet al., 1990); only a brief overview is presented here. We assume that theinstrument response for each measurement used in the analysis varies indirect response to the proportion of each constituent, according to thefollowing system of equations, expressed in matrix form:
515

A. T. FISHER, L. ABRAMS, W. H. BUSCH
180
170 —
sr 160
CD
'o
I0
150 -
Φ 140c_ow 130
120 -
' ' •
»
/
1 1 i
. . . .
i
/
i
- /
/
/
cy4»
1 ' ' '
. . . .
/
i
-
/
\
r"i
, . , .
j
k\
1
i
i
j
1 ' "•
110 "
100100 110 120 130 140 150 160 170 180
eInterval slowness (10" s/ft)
Figure 9. Sonic slowness for individual logged intervals vs. interval slowness,based on picks from synthetic seismograms made during Leg 129 (Lancelot,Larson, et al., 1990). Circles: Site 800; squares: Site 801; triangles: Site 802.Sonic slowness was determined by averaging measurements from the long-spaced sonic tool; bars indicate one standard deviation. Slowness was used inthis study, rather than velocity, because the former is believed to vary morelinearly as a function of lithology, as discussed in the text. Solid symbols indicatethe slowness of individual intervals, whereas the large, open symbols indicateaverage values for entire logged sections. A good match between determinationsmade with the different methods would result in points that fall on the solid line,which has a slope of 1. Relative to sonic-log determinations, interval picksoverestimated velocities for high-velocity (low-slowness) materials and under-estimated velocities for low-velocity (high-slowness) materials.
-^2,2
1.0 1.0
• • X2,m
1.0
×
P\Pi
Pn
=
Cl
1.0
(1)
where n is the number of components in the natural system, pn is theproportion of each component, m is the number of logs, Xnm is theresponse of each log to each component, and cn is the actual log signal.In this exactly-determined system, the matrix equation can be ex-pressed as X ×p = C, where the matrix/? is the desired solution, andis easily determined through inversion.
We have elected to use a simple error minimization model based onan over-determined system of equations to estimate the abundances ofindividual rock types. In an over-determined system, the inverted matrixequation is/; = (XTX)A Xc. In this formulation, there must be at least asmany logs as there are components to be identified. The system will thenbe at least slightly over-determined as the unity relation (requiring that thedecimal fractions of all final components must add up to one) provides onemore constraint. In practice, it is desirable that there be at least several morelogs than components, particularly in cases where the accuracy of individ-ual logs or the consistency of chemical compositions of the individualcomponents is in question.
Weights can be assigned to each log based on the expectedaccuracy and reliability of the signal, as well as the significance ofthe signal in differentiating lithotypes. In equation (2), these weights
would be expressed as proportional factors against which the totalsignals (c) are multiplied. When weights are included in an over-de-termined system, the proportions of individual components are deter-mined through solution of the following matrix equation: p = (XT WX)' XT We, where Wis a diagonal matrix containing the elements ofthe weight vector (Harvey et al., 1990).
In order for the transform to be stable, there must be at least onelog that clearly discriminates each component. For example, the bulkdensity log is useful for separating chert and clay components atLeg 129 sites, based on the widely different responses each of theselithologies typically provides (Fig. 8). If one part of the sedimentarysection is assumed to be composed only of chert and clay, then only asingle, good-quality density log is needed to assign the relative propor-tion of each present over that interval. The same log would be uselessfor separating radiolarite and chalk components, however, because oftheir similar responses (Fig. 8). A better discriminator in this latter casemight be CaO content, as estimated from the geochemical tool.
As more components are added to the system, additional discrimi-natory logs are needed. A system composed entirely of chert, lime-stone, and clay would, at first, seem to require only two logs, perhapsdensity and sonic. All three lithologies have distinct densities andtravel times (Fig. 8), suggesting that an exactly determined system ofequations (three lithologies and three equations, two logs plus theunity relation) should be adequate to estimate the relative proportionof each component. The hitch in this case is that one of the threecomponents (limestone) has properties that are intermediate com-pared to both properties of the other two components. Chert has thehighest density and velocity, and clay the lowest of each. Thus, a linearsystem of chert, limestone, and clay, which includes only two physicalindicators, is actually underdetermined in a strict sense because theinverse problem is still underconstrained (i.e., an inversion using onlythese two logs does not allow for discrimination between a mixtureof chert and clay from pure limestone). Adding an additional discrimi-nator, such as calcium content, would allow the limestone componentto stand out more clearly.
We have modified the basic approach to log inversion in several ways.Most importantly, we have elected to invert for idealized "lithotypes"rather than individual mineral components. This is equivalent in someways to defining a series of electrofacies (Serra, 1986). We have takenthis approach because it allows us to emphasize differences in densityand velocity between distinct lithologies without introducing errors dueto poorly understood, often empirical, mixing transforms. Standardchemical distinctions commonly used for mineralogical inversion arealso used in this study, as individual lithotypes are assumed to havedistinct mineralogical assemblages. We feel that this approach is neces-sary because we were unable to identify zones of truly pure mineralogyin the Leg 129 sediments at a scale of thickness and accuracy suitable forlog calibration, whereas there are many samples and zones that arecharacterized by individual lithologies. The downside to inverting forlithotype, rather than mineralogy, is that the former includes an implicitinterpretation with respect to the mineralogical composition of individualunits. We feel this is a fair compromise, because the overriding assump-tion in any inversion is that the composition of possible components (bethese lithological or mineralogical) is known to be from a finite list thatis selected prior to the computation. This assumption introduces thegreatest uncertainty in the calculations. At best, this analysis will result inan overall composition that is reasonable within the uncertainty of themeasurements. This composition still must be justified on additionalgeological or geophysical grounds before it can be accepted.
Characterization of Lithotypes
In order to generate statistically meaningful results from the inver-sion of logging data, it is necessary to reduce the number of lithologicalcomponents to as few end-member compositions as possible. A plot ofx-ray diffraction data from whole-rock samples collected fromSites 800, 801 and 802 (Fig. 13; Behl, this volume) suggested the
516
COMPARISON OF LABORATORY AND LOGGING DATA
i O 2 (Wt%)
40 80
AI2O3(wt%) FeO*(wt%) CaO(wt%) K2O(wt%)
10 2 0 X 4 0 0 10 2 0 3 0 4 0 0 40 80 0 2 4 6 8 10
I I T 1 i i i i i r i i i i i r i i i i i r
100
200
ε
CLCDQ
o S <p>
‰300
400
500 I I i i i i i i i I i
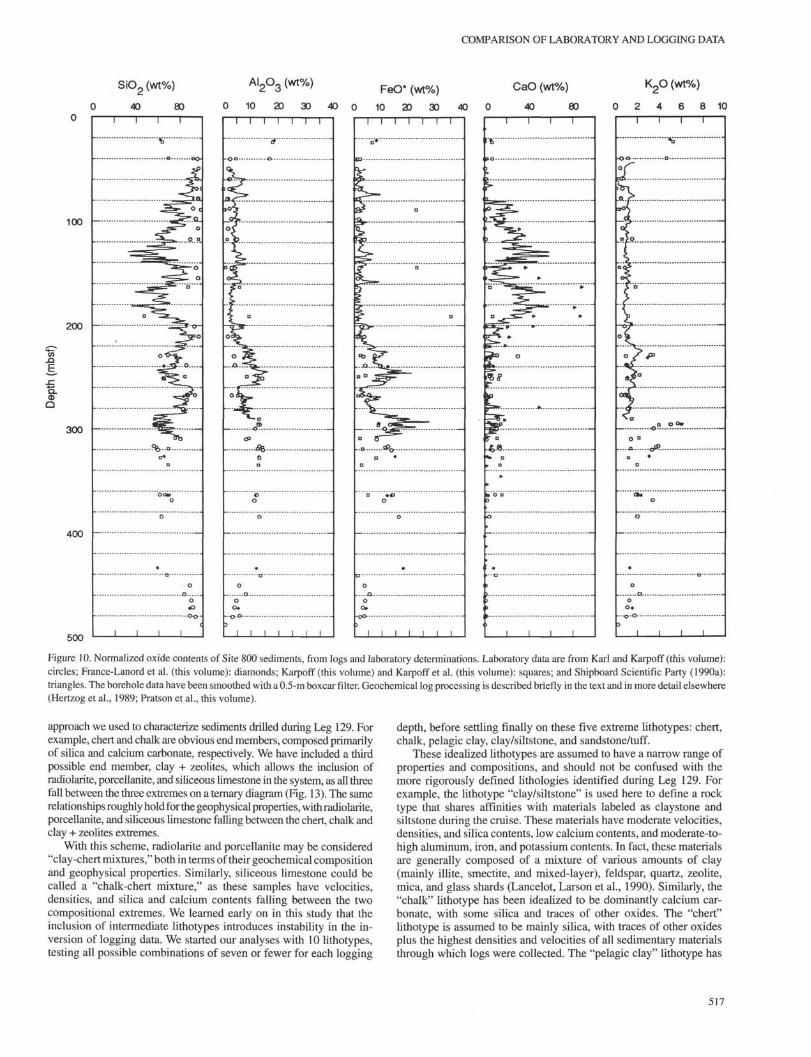
Figure 10. Normalized oxide contents of Site 800 sediments, from logs and laboratory determinations. Laboratory data are from Karl and Karpoff (this volume):circles; France-Lanord et al. (this volume): diamonds; Karpoff (this volume) and Karpoff et al. (this volume): squares; and Shipboard Scientific Party (1990a):triangles. The borehole data have been smoothed with a 0.5-m boxcar filter. Geochemical log processing is described briefly in the text and in more detail elsewhere(Hertzog et al., 1989; Pratson et al., this volume).
approach we used to characterize sediments drilled during Leg 129. Forexample, chert and chalk are obvious end members, composed primarilyof silica and calcium carbonate, respectively. We have included a thirdpossible end member, clay + zeolites, which allows the inclusion ofradiolarite, porcellanite, and siliceous limestone in the system, as all threefall between the three extremes on a ternary diagram (Fig. 13). The samerelationships roughly hold for the geophysical properties, with radiolarite,porcellanite, and siliceous limestone falling between the chert, chalk andclay + zeolites extremes.
With this scheme, radiolarite and porcellanite may be considered"clay-chert mixtures," both in terms of their geochemical compositionand geophysical properties. Similarly, siliceous limestone could becalled a "chalk-chert mixture," as these samples have velocities,densities, and silica and calcium contents falling between the twocompositional extremes. We learned early on in this study that theinclusion of intermediate lithotypes introduces instability in the in-version of logging data. We started our analyses with 10 lithotypes,testing all possible combinations of seven or fewer for each logging
depth, before settling finally on these five extreme lithotypes: chert,chalk, pelagic clay, clay/siltstone, and sandstone/tuff.
These idealized lithotypes are assumed to have a narrow range ofproperties and compositions, and should not be confused with themore rigorously defined lithologies identified during Leg 129. Forexample, the lithotype "clay/siltstone" is used here to define a rocktype that shares affinities with materials labeled as claystone andsiltstone during the cruise. These materials have moderate velocities,densities, and silica contents, low calcium contents, and moderate-to-high aluminum, iron, and potassium contents. In fact, these materialsare generally composed of a mixture of various amounts of clay(mainly illite, smectite, and mixed-layer), feldspar, quartz, zeolite,mica, and glass shards (Lancelot, Larson et al., 1990). Similarly, the"chalk" lithotype has been idealized to be dominantly calcium car-bonate, with some silica and traces of other oxides. The "chert"lithotype is assumed to be mainly silica, with traces of other oxidesplus the highest densities and velocities of all sedimentary materialsthrough which logs were collected. The "pelagic clay" lithotype has
517
A. T. FISHER, L. ABRAMS, W. H. BUSCH
S i O 2 (wt%)
0 40 80 0
AI2O3 (wt%)
10 20 30 40
FθO* (Wt%)
0 10 20 30 40
CaO (wt%)
0 40 80
K o 0 (wt%)
100 -
200 -
cLΦ
300 -
400 -
500
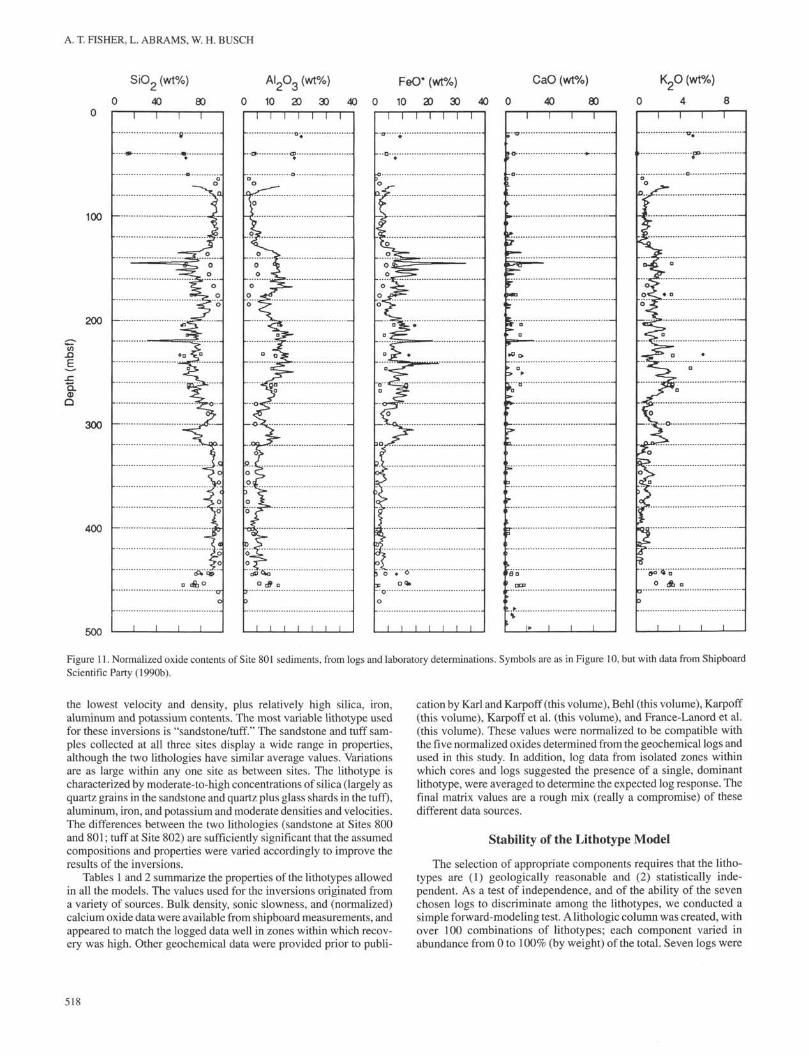
Figure 11. Normalized oxide contents of Site 801 sediments, from logs and laboratory determinations. Symbols are as in Figure 10, but with data from Shipboard
Scientific Party (1990b).
the lowest velocity and density, plus relatively high silica, iron,aluminum and potassium contents. The most variable lithotype usedfor these inversions is "sandstone/tuff." The sandstone and tuff sam-ples collected at all three sites display a wide range in properties,although the two lithologies have similar average values. Variationsare as large within any one site as between sites. The lithotype ischaracterized by moderate-to-high concentrations of silica (largely asquartz grains in the sandstone and quartz plus glass shards in the tuff),aluminum, iron, and potassium and moderate densities and velocities.The differences between the two lithologies (sandstone at Sites 800and 801; tuff at Site 802) are sufficiently significant that the assumedcompositions and properties were varied accordingly to improve theresults of the inversions.
Tables 1 and 2 summarize the properties of the lithotypes allowedin all the models. The values used for the inversions originated froma variety of sources. Bulk density, sonic slowness, and (normalized)calcium oxide data were available from shipboard measurements, andappeared to match the logged data well in zones within which recov-ery was high. Other geochemical data were provided prior to publi-
cation by Karl and Karpoff (this volume), Behl (this volume), Karpoff(this volume), Karpoff et al. (this volume), and France-Lanord et al.(this volume). These values were normalized to be compatible withthe five normalized oxides determined from the geochemical logs andused in this study. In addition, log data from isolated zones withinwhich cores and logs suggested the presence of a single, dominantlithotype, were averaged to determine the expected log response. Thefinal matrix values are a rough mix (really a compromise) of thesedifferent data sources.
Stability of the Lithotype Model
The selection of appropriate components requires that the litho-types are (1) geologically reasonable and (2) statistically inde-pendent. As a test of independence, and of the ability of the sevenchosen logs to discriminate among the lithotypes, we conducted asimple forward-modeling test. A lithologic column was created, withover 100 combinations of lithotypes; each component varied inabundance from 0 to 100% (by weight) of the total. Seven logs were
518

COMPARISON OF LABORATORY AND LOGGING DATA
SiO 2 (wt%)
0 40 80
A I 2 O 3 (wt%)
0 10 20 30 40 0
FeO* (wt%)
20 40 60
CaO (wt%)
0 40 80
K 2O (wt%)
0 4 8
100 -
200 -
E
Q.CDQ
300 -
400 -
500
Figure 12. Normalized oxide contents of Site 802 sediments, from logs and laboratory determinations. Symbols are as in Figure 10, but with data from ShipboardScientific Party (1990c). Note the unrealistically low silica and high iron values, which may reflect errors during acquisition or processing of the geochemicallogging data.
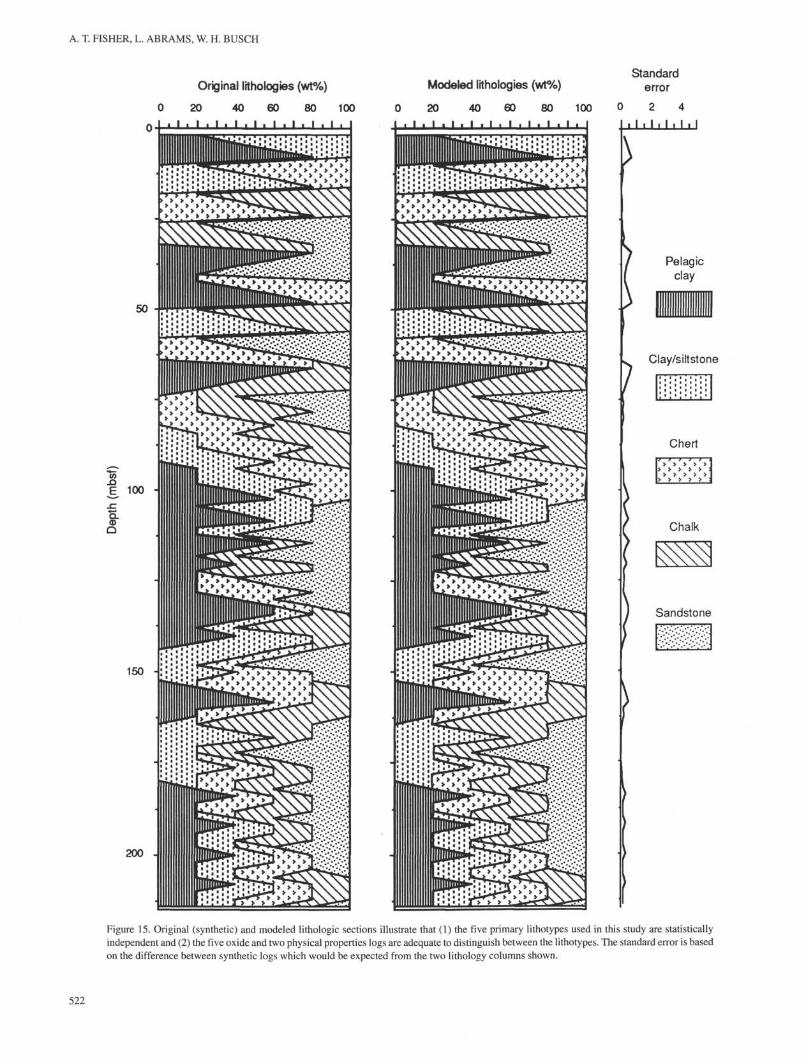
then generated from this column (Fig. 14) and inverted. The resultinglithology column was then compared to the original column, yieldinga standard error of <1% in all cases (Fig. 15). This result shows thatthe lithotypes are independent and can be readily identified with theavailable logs. The test does not assure that the lithotypes are geologi-cally reasonable, however, as this requires additional geological andgeophysical evidence.
Error Analysis
With seven log types and a maximum of five lithotypes, the systemof equations inverted for this study is over-determined, allowing fordetailed error analysis (e.g., Doveton, 1986). The most basic erroranalysis involves a comparison of recorded and calculated tool re-sponses, with the latter based on the estimated lithologic percentages.After calculation of the proportions of the various lithotypes, the toolresponses to the modeled system were calculated, based on the originalrelationships assumed between each lithotype and tool (Tables 1
and 2). In an exactly-determined system (the number of tools equalsthe number of lithologies minus one) this analysis would be useless.In an over-determined system, particularly one in which the differenttool responses have been weighted, this analysis will provide a roughindication of the numerical consistency of the model. It is still up tothe geologist to evaluate the true "likeliness" of the modeled output.
Perhaps the most significant indicator is the negative sum error(NSE), the total of all proportions for which negative values werecalculated during the inversion (Harvey et al., 1990). During theinversion of data from any one depth, negative proportions may becalculated if these values allow the best fit to the data. Geologically,negative proportions are impossible. The presence of large negativevalues following the inversion suggests that the assumed lithotypesand/or properties are inappropriate for the given data interval. Nega-tive proportions may be calculated for several reasons. First, poor-quality data or incorrect depth-shifting between logs can result in asearch for a "phantom" lithotype, with some combination of proper-ties that is unrealistic. The same effect can result from having too few
519
A. T. FISHER, L. ABRAMS, W. H. BUSCH
Silica
• Chert• Porcellanite
RadiolariteSiliceous limestoneChalk
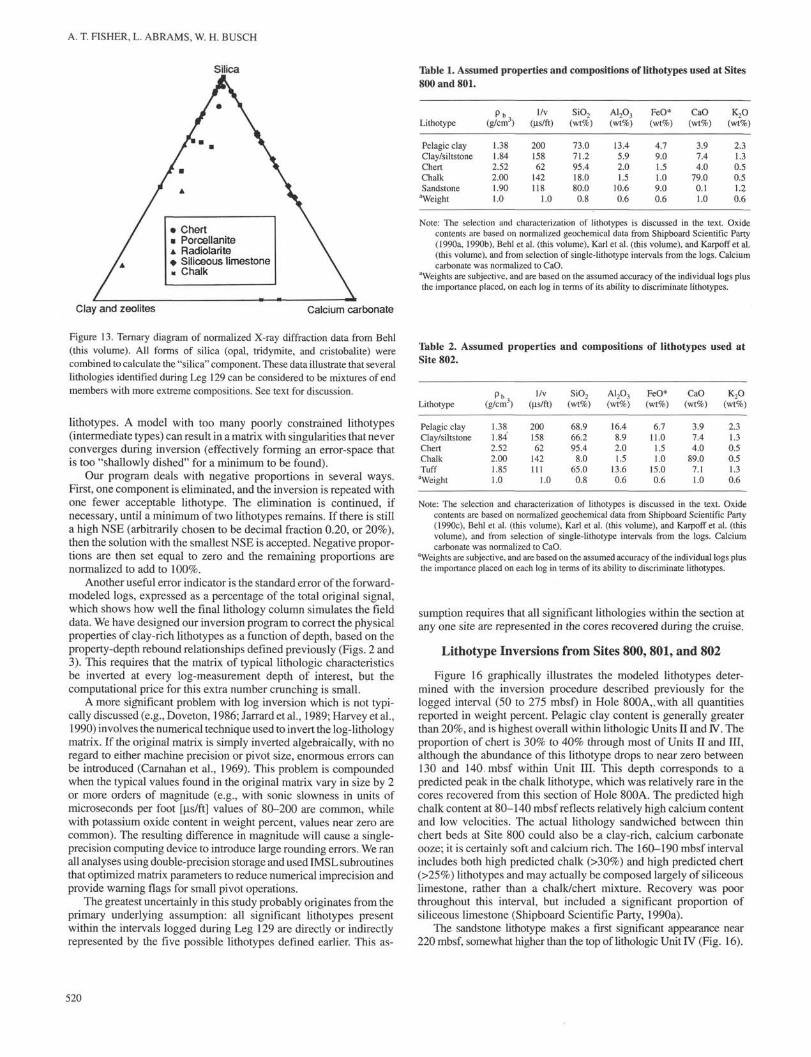
Table 1. Assumed properties and compositions of lithotypes used at Sites800 and 801.
Clay and zeolites Calcium carbonate
Figure 13. Ternary diagram of normalized X-ray diffraction data from Behl(this volume). All forms of silica (opal, tridymite, and cristobalite) werecombined to calculate the "silica" component. These data illustrate that severallithologies identified during Leg 129 can be considered to be mixtures of endmembers with more extreme compositions. See text for discussion.
lithotypes. A model with too many poorly constrained lithotypes(intermediate types) can result in a matrix with singularities that neverconverges during inversion (effectively forming an error-space thatis too "shallowly dished" for a minimum to be found).
Our program deals with negative proportions in several ways.First, one component is eliminated, and the inversion is repeated withone fewer acceptable lithotype. The elimination is continued, ifnecessary, until a minimum of two lithotypes remains. If there is stilla high NSE (arbitrarily chosen to be decimal fraction 0.20, or 20%),then the solution with the smallest NSE is accepted. Negative propor-tions are then set equal to zero and the remaining proportions arenormalized to add to 100%.
Another useful error indicator is the standard error of the forward-modeled logs, expressed as a percentage of the total original signal,which shows how well the final lithology column simulates the fielddata. We have designed our inversion program to correct the physicalproperties of clay-rich lithotypes as a function of depth, based on theproperty-depth rebound relationships defined previously (Figs. 2 and3). This requires that the matrix of typical lithologic characteristicsbe inverted at every log-measurement depth of interest, but thecomputational price for this extra number crunching is small.
A more significant problem with log inversion which is not typi-cally discussed (e.g., Doveton, 1986; Jarrard et al., 1989; Harvey et al,1990) involves the numerical technique used to invert the log-lithologymatrix. If the original matrix is simply inverted algebraically, with noregard to either machine precision or pivot size, enormous errors canbe introduced (Carnahan et al., 1969). This problem is compoundedwhen the typical values found in the original matrix vary in size by 2or more orders of magnitude (e.g., with sonic slowness in units ofmicroseconds per foot [µs/ft] values of 80-200 are common, whilewith potassium oxide content in weight percent, values near zero arecommon). The resulting difference in magnitude will cause a single-precision computing device to introduce large rounding errors. We ranall analyses using double-precision storage and used IMSL subroutinesthat optimized matrix parameters to reduce numerical imprecision andprovide warning flags for small pivot operations.
The greatest uncertainly in this study probably originates from theprimary underlying assumption: all significant lithotypes presentwithin the intervals logged during Leg 129 are directly or indirectlyrepresented by the five possible lithotypes defined earlier. This as-
Lithotype
Pelagic clayClay/siltstoneChertChalkSandstone
aWeight
Pb(g/cm3)
1.381.842.522.001.901.0
1/v(µs/ft)
20015862
142118
1.0
SiO2
(wt%)
73.071.295.418.080.00.8
A12O3
(wt%)
13.45.92.01.5
10.60.6
FeO*(wt%)
4.79.01.51.09.00.6
CaO(wt%)
3.97.44.0
79.00.11.0
K2O(wt%)
2.31.30.50.51.20.6
Note: The selection and characterization of lithotypes is discussed in the text. Oxidecontents are based on normalized geochemical data from Shipboard Scientific Party(1990a, 1990b), Behl et al. (this volume), Karl et al. (this volume), and Karpoff et al.(this volume), and from selection of single-lithotype intervals from the logs. Calciumcarbonate was normalized to CaO.
aWeights are subjective, and are based on the assumed accuracy of the individual logs plusthe importance placed, on each log in terms of its ability to discriminate lithotypes.
Table 2. Assumed properties and compositions of lithotypes used atSite 802.
Lithotype
Pelagic clayClay/siltstoneChertChalkTuff"Weight
Pb(g/cm3)
1.381.842.522.001.851.0
1/v(µs/ft)
20015862
142111
1.0
SiO2
(wt%)
68.966.295.4
8.065.00.8
A12O3
(wt%)
16.48.92.01.5
13.60.6
FeO*(wt%)
6.711.01.51.0
15.00.6
CaO(wt%)
3.97.44.0
89.07.11.0
K2O(wt%)
2.31.30.50.51.30.6
Note: The selection and characterization of lithotypes is discussed in the text. Oxidecontents are based on normalized geochemical data from Shipboard Scientific Party(1990c), Behl et al. (this volume), Karl et al. (this volume), and Karpoff et al. (thisvolume), and from selection of single-lithotype intervals from the logs. Calciumcarbonate was normalized to CaO.
aWeights are subjective, and are based on the assumed accuracy of the individual logs plusthe importance placed on each log in terms of its ability to discriminate lithotypes.
sumption requires that all significant lithologies within the section atany one site are represented in the cores recovered during the cruise.
Lithotype Inversions from Sites 800,801, and 802
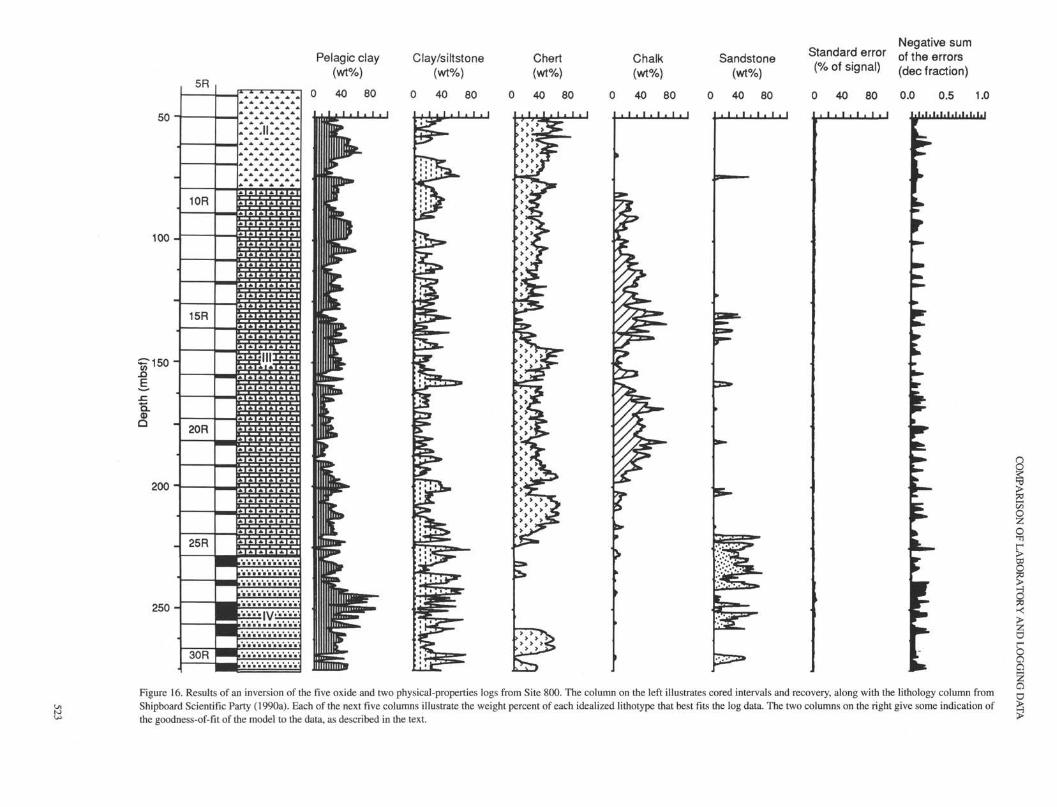
Figure 16 graphically illustrates the modeled lithotypes deter-mined with the inversion procedure described previously for thelogged interval (50 to 275 mbsf) in Hole 800A,,with all quantitiesreported in weight percent. Pelagic clay content is generally greaterthan 20%, and is highest overall within lithologic Units II and IV. Theproportion of chert is 30% to 40% through most of Units II and III,although the abundance of this lithotype drops to near zero between130 and 140. mbsf within Unit III. This depth corresponds to apredicted peak in the chalk lithotype, which was relatively rare in thecores recovered from this section of Hole 800A. The predicted highchalk content at 80-140 mbsf reflects relatively high calcium contentand low velocities. The actual lithology sandwiched between thinchert beds at Site 800 could also be a clay-rich, calcium carbonateooze; it is certainly soft and calcium rich. The 160-190 mbsf intervalincludes both high predicted chalk (>30%) and high predicted chert(>25%) lithotypes and may actually be composed largely of siliceouslimestone, rather than a chalk/chert mixture. Recovery was poorthroughout this interval, but included a significant proportion ofsiliceous limestone (Shipboard Scientific Party, 1990a).
The sandstone lithotype makes a first significant appearance near220 mbsf, somewhat higher than the top of lithologic Unit IV (Fig. 16).
520
COMPARISON OF LABORATORY AND LOGGING DATA
SiO2 (wt%) A l
2 ° 3 W/o) FeO* (wt%) C a θ (wt%)
0 4 0 8 0 0 20 4 0 0 20 4 0 0 4 0 8 0
Bulk density
K_O (wt%) (g/cm3)
8 1
Velocity (km/s)
3 1 3 5
50
ü 100 h
150 -
200
I I I 1
^ ^
•^—
»
IX
J
)
<r
>i i i i
^i i i
^~*
fK -
V//
$
(VyV
jΛ
y
CrV/cc1/
i i i
! 1 1
i 1 1 1 1
f
— — ^ ^
L"̂ _
l
IITl ± ^r
Li
<r
! 1 1 1
1 I 1 1
7
y
jsiTVV
<!
Jrf\
L /LJ
\
>cir
i i i I
1 A 1 1
I\ ™ ^
A
"<r
\>T
\""̂ >
f\y
c\
>i i i i
/' ' '
r—~1^̂ *̂
CL
J\\
V
f\
i
S•
1 1 1
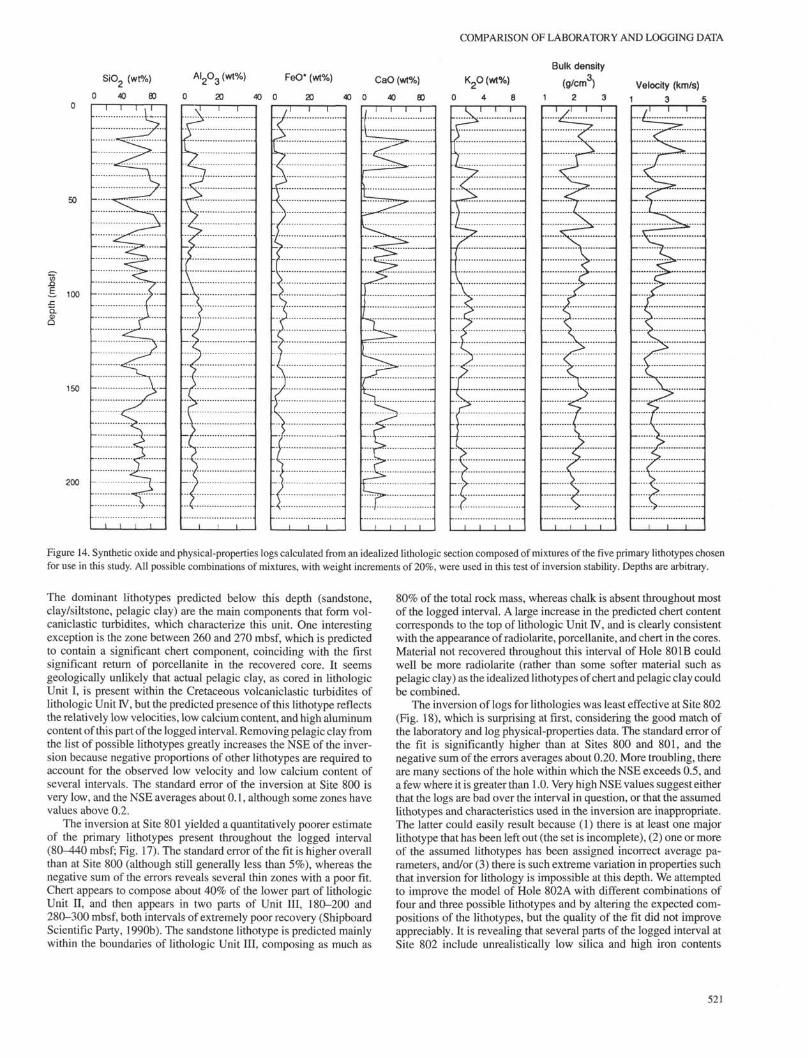
Figure 14. Synthetic oxide and physical-properties logs calculated from an idealized lithologic section composed of mixtures of the five primary lithotypes chosen
for use in this study. All possible combinations of mixtures, with weight increments of 20%, were used in this test of inversion stability. Depths are arbitrary.
The dominant lithotypes predicted below this depth (sandstone,clay/siltstone, pelagic clay) are the main components that form vol-caniclastic turbidites, which characterize this unit. One interestingexception is the zone between 260 and 270 mbsf, which is predictedto contain a significant chert component, coinciding with the firstsignificant return of porcellanite in the recovered core. It seemsgeologically unlikely that actual pelagic clay, as cored in lithologicUnit I, is present within the Cretaceous volcaniclastic turbidites oflithologic Unit IV, but the predicted presence of this lithotype reflectsthe relatively low velocities, low calcium content, and high aluminumcontent of this part of the logged interval. Removing pelagic clay fromthe list of possible lithotypes greatly increases the NSE of the inver-sion because negative proportions of other lithotypes are required toaccount for the observed low velocity and low calcium content ofseveral intervals. The standard error of the inversion at Site 800 isvery low, and the NSE averages about 0.1, although some zones havevalues above 0.2.
The inversion at Site 801 yielded a quantitatively poorer estimateof the primary lithotypes present throughout the logged interval(80-440 mbsf; Fig. 17). The standard error of the fit is higher overallthan at Site 800 (although still generally less than 5%), whereas thenegative sum of the errors reveals several thin zones with a poor fit.Chert appears to compose about 40% of the lower part of lithologicUnit II, and then appears in two parts of Unit III, 180-200 and280-300 mbsf, both intervals of extremely poor recovery (ShipboardScientific Party, 1990b). The sandstone lithotype is predicted mainlywithin the boundaries of lithologic Unit III, composing as much as
80% of the total rock mass, whereas chalk is absent throughout mostof the logged interval. A large increase in the predicted chert contentcorresponds to the top of lithologic Unit N, and is clearly consistentwith the appearance of radiolarite, porcellanite, and chert in the cores.Material not recovered throughout this interval of Hole 80IB couldwell be more radiolarite (rather than some softer material such aspelagic clay) as the idealized lithotypes of chert and pelagic clay couldbe combined.
The inversion of logs for lithologies was least effective at Site 802(Fig. 18), which is surprising at first, considering the good match ofthe laboratory and log physical-properties data. The standard error ofthe fit is significantly higher than at Sites 800 and 801, and thenegative sum of the errors averages about 0.20. More troubling, thereare many sections of the hole within which the NSE exceeds 0.5, anda few where it is greater than 1.0. Very high NSE values suggest eitherthat the logs are bad over the interval in question, or that the assumedlithotypes and characteristics used in the inversion are inappropriate.The latter could easily result because (1) there is at least one majorlithotype that has been left out (the set is incomplete), (2) one or moreof the assumed lithotypes has been assigned incorrect average pa-rameters, and/or (3) there is such extreme variation in properties suchthat inversion for lithology is impossible at this depth. We attemptedto improve the model of Hole 802A with different combinations offour and three possible lithotypes and by altering the expected com-positions of the lithotypes, but the quality of the fit did not improveappreciably. It is revealing that several parts of the logged interval atSite 802 include unrealistically low silica and high iron contents
521
A. T. FISHER, L. ABRAMS, W. H. BUSCH
Original lithologies (wt%) Modeled lithologies (wt%)
0 20 40 60 80 100
200
Standarderror
0 2 4
I • I • I • I • I
/ Pelagicclay
Clay/siltstone
Chert
> > > > >> > > > >> t > > >
> > > > >
Chalk
Sandstone
Figure 15. Original (synthetic) and modeled lithologic sections illustrate that (1) the five primary lithotypes used in this study are statisticallyindependent and (2) the five oxide and two physical properties logs are adequate to distinguish between the lithotypes. The standard error is basedon the difference between synthetic logs which would be expected from the two lithology columns shown.
522
50
100H
^150 i
Q.ΦQ
2 0 0 -
2 5 0 -
5R
10R
15R
20R
Pelagic clay(wt%)
Clay/siltstone(wt%)
Chert(wt%)
Chalk(wt%)
Sandstone(wt%)
40 80
Negative sumStandard error o f t h θ errors(% of signal) ( d e c fraction)
40 80 0.0
• i • i . i . i I . I .
0.5 1.0
•i.i.i•i•i.i.i
Figure 16. Results of an inversion of the five oxide and two physical-properties logs from Site 800. The column on the left illustrates cored intervals and recovery, along with the lithology column from
Shipboard Scientific Party (1990a). Each of the next five columns illustrate the weight percent of each idealized lithotype that best fits the log data. The two columns on the right give some indication of
the goodness-of-fit of the model to the data, as described in the text.

A. T. FISHER, L. ABRAMS, W. H. BUSCH
(Fig. 12), perhaps due to a problem in calibration of the logging tool orin basic processing. One could accommodate this kind of problem byreducing the weight applied to the silica and iron signals, but this wouldresult in an effectively underdetermined system, as these data are neededto discriminate between several lithotypes.
Despite the poor fit over parts of the logged interval, the modeledoutput may predict reasonable trends within several zones. A largeincrease in predicted chalk content (from essentially zero to 30-40%)takes place near the boundary between lithologic Units II and III,while the predicted proportion of sandstone drops dramatically. Thesandstone/pelagic clay ratio within Unit II appears to drop off withdepth, as was observed in the cores (Shipboard Scientific Party,1990c). The model also predicts several significant, isolated accumu-lations of chert within Unit III (Fig. 18). The corrected laboratoryporosities from Hole 802A match well with the synthetic log porosi-ties (which are based on the borehole lithodensity log and a meangrain density determined for each depth from the inversion describedabove) indicating that the physical properties data set is self consis-tent, as are the general trends in the inverted lithology columns(Fig. 7A).
DISCUSSION AND SUMMARY
A wide variety of lithologies was cored and recovered duringLeg 129, although statistical representation of the drilled section isprobably poor. Several of the cored lithologies are easily distin-guished on the basis of consistent physical and chemical parameters,whereas others are better classified as mixtures of more extreme endmembers. Of the lithologies represented in cores, only those rich inclay appear to require significant rebound corrections. A closed set oflithotypes was defined, based on the variety of sediment types ob-served during Leg 129, and a combined set of logs was inverted todetermine the relative proportions of each lithotype present throughoutthe logged interval.
The subjective "quality" of these inversions, as indicated by theNSE values, appears to correlate well with the size of the "normali-zation factors" used by Pratson et al. (this volume, their Figs. 4, 6,and 8) to invert the original geochemical logging data to generateoxide estimates. These authors suggest that the size of the normaliza-tion factor (NF) reflects the quality of the "counting statistics" (witha lower NF reflecting better data), but a large NF could also indicateerrors in instrument calibration, depth shifting, or data processing.More significantly, the good correlation between the large NF andlarge NSE values suggests that at least part of the inaccuracy associ-ated with the analysis presented here was introduced prior to theclassification of lithotypes and subsequent inversion.
The inversion of data from Hole 802A may reveal the greatestlimitation of this method, that it requires some a priori knowledge of thecomposition (or at least the closed set of possible compositions) of thevarious lithologies within each interval of the logged hole. The formsof error analysis available for checking lithologic inversions are mostrigorous in terms of numerical consistency, but do not directly addressproblems related to missing or incorrectly characterized lithotypes. Avariety of optimization schemes could be employed to improve thefit by modifying the chemistry or properties of the acceptable litho-types (within a range constrained by laboratory data) but there is noway to test directly the validity of the resulting inversion. We at-tempted an optimization scheme in which the number of acceptablelithologies was varied to find the best statistical fit to the log data, butfound that the solutions were often unstable, with no quantitativelyreliable means for choosing one model over another. Instead, itprobably makes the most sense to look at general trends in themodeled output and interpret the logged interval accordingly.
The inversion of data from Site 800 suggests that pelagic claycomprises the missing lithology within Unit II, whereas chalk andpelagic clay lithotypes (as defined in this paper), or perhaps chalky
radiolarite, porcellanite, or some combination of the preceding, com-prises the missing material within Unit III. It is unlikely that morethan about 30% of this missing material is actually chert or siliceouslimestone, as the densities and velocities of these lithologies (Fig. 8)are too high in comparison to the log and interval means (Fig. 9).
In contrast, there is probably little chalk and significantly moreclay and claystone within the logged units at Site 801. The turbiditesof Unit III appear to be coarser overall than those of the upper part ofUnit IV at Site 801, based on the modeled sandstone and clay/siltstonelithotypes. Two significant "cherty" intervals have been identifiedwithin lithologic Unit III at Site 801 (possibly radiolarite, porcellanite,or true chert) and one such interval within the upper portion of UnitIV at Site 800. The composition of lithologic Unit IV at Site 801appears to be relatively uniform, with approximately equal compo-nents of chert and pelagic clay lithotypes, and about half again asmuch clay/siltstone. In this interval, it appears that the recoveredmaterial is a better statistical sample than that of the overlying units.
This inversion procedure is useful where recovery is extremely low,but probably has greater utility when all the possible lithologies withina section are better characterized. This characterization might takeplace during drilling of a nearby borehole, or could result from coretaken while drilling the hole in question if recovery is sufficiently high(perhaps 40%-60%). In the latter case the lithotypes could be welldefined, but there may still be a need to establish accurate estimates ofthe overall proportions of each lithologic component.
ACKNOWLEDGMENTS
Thanks to R. Behl, C. France-Lanord, S. Karl, A. Karpoff, and J.Ogg for providing sediment composition data prior to publication.Special thanks to the staff of the Borehole Research Group, and toBeth Pratson in particular, for their patience and assistance. Reviewsby R. Wilkens and W. Briickmann were also appreciated. Acknowl-edgment is made to the donors of the Petroleum Research Fund,administered by the ACS, for partial support of this research. Thiswork was also supported by the Ocean Drilling Program, and byUSSAC grants 20408 (ATF), 20431 (LA), and 20425 (WHB).
REFERENCES
Archie, G. E., 1942. Electrical resistivity as an aid in determining somereservoir characteristics. Pet. Trans., AIME, 146:54-62.
Borehole Research Group, 1990. Ocean Drilling Program Logging Man-ual, LDGO.
Boyce, R. E., 1976. Definitions and laboratory techniques of the compres-sional sound velocity parameters and wet-water content, wet bulk density,and porosity parameters by gravimetric and gamma ray attenuation tech-niques. In Schlanger, S. O., Jackson, E. D., et al., Init. Repts. DSDP, 33:Washington (U.S. Govt. Printing Office), 931-958.
Busch, W. H., 1989. Patterns of sediment compaction at Ocean DrillingProgram Sites 645, 646, and 647, Baffin Bay and Labrador Sea. InSrivastava, S. P., Arthur, M. A., Clement, B., et al., Proc. ODP, Sci. Results,105: College Station, TX (Ocean Drilling Program), 781-790.
Cannon, D. E., and Coates, G. R., 1990. Applying mineral knowledge tostandard log interpretation. 31st Ann. Logging Symp., Soc. Prof. Well LogAnalysts, Pap. V.
Carnahan, B., Luther, H. A., and Wilkes, J. O., 1969. Applied NumericalMethods: New York (Wiley).
Clavier, C, Coates, G., and Dumanoir, J., 1977. The theoretical and experi-mental basis for the "dual-water" model for the interpretation of shalysands. Soc. Petrol. Eng., Pap. 6859.
Doveton, J. H., 1986. Log Analysis for Subsurface Geology: New York (Wiley).Fulthorpe, C. S., Schlanger, S. O., and Jarrard, R. D., 1989. In situ properties
of pelagic carbonate sediments on the Ontong Java Plateau. J. Geophys.Res., 94:4025^032.
Hamilton, E. L., 1971. Prediction of in situ acoustic and elastic properties inmarine sediments. Geophysics, 36:266-284.
, 1976. Variations of density and porosity with depth in deep-seasediments. J. Sediment. Petrol, 46:280-300.
524

COMPARISON OF LABORATORY AND LOGGING DATA
Harvey, P. K., Bristow, J. F., and Lovell, M. A., 1990. Mineral transforms anddownhole geophysical measurements. Sci. Drilling, 1:163-176.
Hertzog, R., Colson, L., Seeman, B., O'Brien, M., Scott, H., McKeon, D.,Wraight, P., Grau, J., Schweitzer, J., and Herron, M., 1989. Geochemicallogging with spectrometry tools. J. Soc. Petrol. Eng., 4:153-162.
Jarrard, R. D., Dadey, K. A., and Busch, W. H., 1989. Velocity and density ofsediments of Eirik Ridge, Labrador Sea: control by porosity and mineral-ogy. In Srivastava, S. P., Arthur, M. A., Clement, B., et al., Proc. ODP, Sci.Results, 105: College Station, TX (Ocean Drilling Program), 811-835.
Lancelot, Y, Larson, R., et al., 1990. Proc. ODP, Init. Repts., 129: CollegeStation, TX (Ocean Drilling Program).
Neumann, G., and Pierson, W. J., Jr., 1966. Principles of Physical Oceanog-raphy: Englewood Cliffs, NJ (Prentice-Hall).
Serra, O., 1986. Fundamentals of Well Log Interpretation: 2. The Interpreta-tion of Logging Data: Amsterdam (Elsevier).
Shipboard Scientific Party, 1990a. Site 800. In Lancelot, Y, Larson, R., et al.,Proc. ODP, Init. Repts., 129: College Station, TX (Ocean Drilling Pro-gram), 33-89.
, 1990b. Site 801. In Lancelot, Y, Larson, R., et al., Proc. ODP, Init.Repts., 129: College Station, TX (Ocean Drilling Program), 91-170.
, 1990c. Site 802. In Lancelot, Y, Larson, R., et al., Proc. ODP, Init.Repts., 129: College Station, TX (Ocean Drilling Program), 171-243.
van den Oord, R. J., 1990. Experiences with geochemical logging. 31st Ann.Logging Symp., Soc. Prof. Well Log Analysts, Pap. TT.
Von Herzen, R. P., Francis, T.J.G., and Becker, K., 1983. In situ large-scaleelectrical resistivity of oceanic crust, Hole 504B. In Cann, J. R., Langseth,M. G., Honnorez, J., Von Herzen, R. P., White, S. M., et al., Init. Repts.DSDP, 69: Washington (U.S. Govt. Printing Office), 237-244.
Waxman, M. H., and Smits, L.J.M., 1968. Electrical conductivities in oil-bear-ing shaly sands. J. Soc. Pet. Eng., 8:107-122.
Wendlandt, R. F., and Bhuyan, K., 1990. Estimation of mineralogy andlithology from geochemical log measurements. AAPG Bull, 74:837-856.
Winsauer, W. O., Shearin, H. M., Jr., Masson, P. H., and Williams, M., 1952.Resistivity of brine saturated sands in relation to pore geometry. AAPGBull, 36:253-277.
Date of initial receipt: 29 May 1991Date of acceptance: 2 December 1991Ms 129B-138
525

Pelagic clay
(wt%)0 40 80
Clay/siltstone
(wt%)0 40 80 0
Chert(wt%)40 80 0
Chalk(wt%)40 80
100 -
Negative sum ofSandstone Standard error the errors
(wt%) (% of signal) (dec fraction)
0 40 80 0 40 80 0.0 0.5 1.0I • I . I . I . I I . I . I . I . I . I I • I • I . I • I • I • I • I • L I • I
Figure 17. Results of an inversion of the five oxide and two physical-properties logs from Site 801. Columns are as in Figure 16, except that the core data are from Shipboard Scientific Party (1990b).

Pelagic clay(wt%)
0 40 80
Clay/siltstone(wt%)
0 40 80100
<fl
E
3.ΦQ
200 —
Chert(wt%)
0 40 80i . i . I . i . i
Chalk(wt%)
0 40 80. i . i . i . i . i
Negative sumStandard error of the errors
(% of signal) (dec. fraction)0 40 80 0.0 0.5 1.0
. i . i • i • i . i
300 —I
Figure 18. Results of an inversion of the five oxide and two physical-properties logs from Site 802. Columns are as in Figure 16, except that the core data are from Shipboard Scientific Party (1990c).