Embed Size (px)
Citation preview

W E S T G A T E L A N D U S E P L A N
Exis
ting C
onditio
ns
Introduction
7
3 Existing Conditions
IntroductionThe initial step of any planning process involving future projections must be a full investigation and analysis of the existing conditions for the study area. Without intimate knowledge of the underlying forces driving decisions and potential obstacles preventing change, an accurate prediction of future conditions cannot be made. The existing conditions report for the Westgate Land Use Plan covers the following topics:
• Existing Plans and Policies• Land Use and Development• Public Utilities• Demographics• Transportation• Environment
The existing conditions report not only provides the basis for the development of future alternatives, but also provides decision makers and stakeholders with information to make informed choices about the future of the study area. Some key findings from the existing conditions report include the following:
• Few plans, policies or recommendations have been made regarding the study area• The lack of development regulations has led to a varied mix of land uses and development styles• While partially developed, the study area has retained most of its rural character• Vermilion County has been steadily losing population since 1970• Vermilion County could take better advantage of national employment sectors that are currently growing• The study area has excellent vehicular access to major roadways• The study area lacks pedestrian, bicycle and transit facilities• Numerous State and County parks are within close proximity to the study area• Many lakes, ponds, rivers, streams, wetlands, and floodplains are located north, south and west of the study area• Topography varies along the southern and western boundaries of the study area, dropping significantly toward the Salt Fork River• There are a number of endangered species potentially located in and around the study area

W E S T G A T E L A N D U S E P L A N
Exis
ting C
onditio
ns
Exist ing Plans & Policies
8
Existing Plans and PoliciesVarious plans and policies have been written since 1995 that have some effect on the study area. Some plans directly relate to the study area, while others shape future conditions around the study area. It is important to review the existing plans and policies to ensure recommendations and information from those references are used to formulate the recommendations for this plan. This section will provide a general overview of, and touch on some of the important aspects related to this study area as found in four existing plans.
I-74 Corridor Study - 1995The Vermilion County/I-74 Corridor Study assesses the market and economic factors which could influence future development and business reuse along the I-74 corridor in Vermilion County. The report investigated target markets, site development potential, transportation facilities, and environmental constraints for future development. The report looked at six specific development zones, mostly those surrounding interchanges with I-74. One of the development sites described in the report is the Westgate study area. The report highlighted this study area as a future location for eco-tourism and recreation with supportive commercial development and a possible visitor’s center. The proximity of the study area to many natural amenities gave this development site a high potential for tourism and recreational industries. The study also pointed out the importance of establishing some development guidelines, which would take into account utility placement, construction materials, landscaping, roadway widths, and parking requirements.
City of Danville Comprehensive Plan Update - 2006The Comprehensive Plan is a master plan for the future growth of the City of Danville and serves as the long-range vision for how the City should evolve over time. According to the Comprehensive Plan, the City is interested in finding a balance between infill development taking place in the core of the community and greenfield development taking place on the fringes. The City is also interested in looking for alternative modes of transportation to offset some of the increased automobile traffic and reduce congestion on local roadways. Finally, the City is very interested in boosting future economic development and creating economic development plans which promote specific sectors unique to Danville. While the study area is outside the current municipal boundaries of Danville, the success of the study area does rely in part on how successful the City is in the future. The study area might also be used to fill some of the niche market aspects the City is currently missing.
Catlin Alternative Corridor Feasibility Study - 2006This feasibility study was namely an evaluation of transportation routes in the southwest portion of Vermilion County to provide alternative access to the City of Danville. The study looked at the current and future capacity of travel routes to provide good connectivity and access to travelers coming into Danville from the southwest. The study also looked at using Henning Road via US 150 and I-74 as a north-south alternative to using Route 1. Recommendations from this study included realigning Shangri-La Road from Catlin north to Batestown Road. This would provide a more viable route from Catlin to the western and northern portions of Danville and Vermilion County. The study also suggests the possibility of diverting Shangri-La Road away from its current connection with Batestown Road, and realigning it further to the west to connect it with US 150.

W E S T G A T E L A N D U S E P L A N
Exis
ting C
onditio
ns
Exist ing Plans & Policies
9
DATS 2030 Long Range Transportation Plan - 2007The DATS LRTP describes existing transportation conditions and future transportation infrastructure improvements for the urbanized and metropolitan planning areas. According to the LRTP, the entire study area is within the metropolitan planning area and nearly all is within the urbanized area boundary except the far western end. Most of the transportation issues and opportunities are focused within the Danville municipal limits. The LRTP does note that a small section of US 150 near the east side of the I-74 interchange is approaching its capacity for vehicular traffic. The projections for this section of US 150 in the year 2030 are showing even more congestion than what is shown in 2007. The section of Henning Road north of US 150 is also shown as approaching capacity for the year 2030. The LRTP rated US 150 as having a very low compatibility for bicycle connections.
These four plans have analyzed different scenarios and aspects of the study area, and are important to consider when creating future recommendations for the study area.

W E S T G A T E L A N D U S E P L A N
Exis
ting C
onditio
ns
Land Use
10
Land Use and DevelopmentA significant emphasis has been placed on the future land use and development potential of the Westgate study area. The study area is located one mile west of the City of Danville, and has excellent connections via I-74 and US 150 to many cities and destinations. Within the study area, there are numerous parcels of underutilized or undeveloped land. As can be seen in Table 3.1, 26.93% of the study area is agricultural; of that, 19.55% is agricultural without a residential unit constructed on the property. Approximately 7% of parcels in the study area are categorized as vacant lots, meaning the parcels do not have any permanent structures on them and are not being used for any specific purpose at this time. Combining these two categories, 34% of the study area has some immediate development potential. Future development on these parcels would depend on a property owner’s willingness to sell or develop, and agricultural land owner’s willingness to end farming operations and sell to a developer.
Currently, about 13.6% of the study area is comprised of commercial land uses. Commercial uses in the study area range from sit-down restaurants to gas stations to pest removal services. The current uses suggest sporadic development of each parcel with little focus on compatibility or links between businesses to create a stronger draw for the area. This land use pattern is typical of unincorporated parcel by parcel rural development. The study area does not have many daily service needs such as a grocery store (large or small scale), a dry cleaner or choices in restaurants. Residents in and around the study area have to travel to nearby Danville for service needs, and some residents are even traveling as far as Champaign-Urbana for retail shopping and restaurants.
Single family and multi-family residential land uses make up about 17.9% of the acreage within the study area; they are situated primarily along the north side of Batestown Road in small rural subdivisions or on individually developed parcels. The development of single family residential along Batestown Road seems appropriate given the likelihood of commercial and industrial development locating along US 150. Land uses on the south side of Batestown Road, just outside the study area boundaries, are also consistent with the single family rural development patterns found on the north side of Batestown Road. Only one parcel containing a multi-family development was found within the study area. This parcel is located on the east side of Henning Road just north of the US 150/Henning Road intersection. The lack of multi-family housing options is most likely due to the rural lower density development patterns consistent with a majority of the residential development in the area.
Utilities and Right-of-Way (ROW) make up about 31.6% of the acreage within the study area. The Illinois Department of Transportation (IDOT) owns a large amount of ROW in the study area, mostly surrounding the interchange of I-74 and US 150.
Figure 3.1 shows the land use designation for each parcel within the study area.
Table 3.1 Land Use AcreageCategory Acres % of Total
Agriculture 182.27 26.93% With Residence 49.92 7.38% Without Residence 132.35 19.55%Commercial 92.05 13.60%Industrial 6.85 1.01%Institutional 14.73 2.18%Multi-Family 1.89 0.28%Single Family 119.55 17.66%Utilities or ROW 213.86 31.60%Vacant Lot 45.63 6.74%Total 676.83 100.0%

W E S T G A T E L A N D U S E P L A N
Exis
ting C
onditio
ns
Land Use
11
Figure 3.1 - Study Area Land Use Map
DATS

W E S T G A T E L A N D U S E P L A N
Exis
ting C
onditio
ns
Land Use
12
Development Patterns and CharacterThe development patterns within the study area are typical of non-urbanized rural development. Most of the commercial and industrial development that has taken place in the study area has been single-use structures constructed on a single parcel of land. There are no developments that have multiple uses on a single parcel of land. The commercial and industrial developments are incompatible with each other. Within the study area, businesses are not exhibiting benefits resulting from clustering like industries together to create economies of agglomeration, or benefits from like businesses locating near each other. Development within the study area seems to be random at best; for example, a newly constructed day care is located next to a scrap metal recycling center. This development pattern is consistent with a lack of land use and zoning regulation which is found in unincorporated areas of Vermilion County. Currently, the County Health Department is one of the few agencies that can regulate a portion of a development; however, the regulations only cover sanitary and potable water sources. The lack of regulations for development can be a concern, especially in an area where transportation connections and natural resources make it an attractive location for larger scale development.
The residential development within and surrounding the study area is rural in character. Most homes are part of small multiple-parcel subdivisions or constructed as a single-parcel subdivision. Many of the homes in the study area are smaller, one-story ranch homes or prefabricated modular trailers. The average single family parcel of land is approximately one acre in size, typical for rural residential development. A majority of the development north and south of the study area is also single family housing, both in subdivisions and single parcel developments. The development to the south of Batestown Road is similar to the character and style found within the study area. The development to the north of the study area, on the west side of Henning Road, is constructed in and around old mining pits that have been filled with water to create small ponds and lakes. The development in this area is higher end and constructed to take advantage of views and topographic changes that are the result of past mining operations.
As mentioned earlier, the study area does have a significant amount of land that is either agricultural or vacant/undeveloped. Most of the land in the agricultural land use category is being farmed at this time. Along with agricultural land, there are also parcels which are vacant, some of which are currently for sale. A majority of these parcels are found either directly adjacent to the interchange or on the southeast side of the interchange. These parcels have a distinct development advantage due to their close proximity to the interchange. A majority of the agricultural land is on the east side of Henning Road adjacent to US 150.
Recycling Center Gas Station Rural Residential Pre-School & Daycare Facility

W E S T G A T E L A N D U S E P L A N
Exis
ting C
onditio
ns
Land Use
13
Public UtilitiesAlthough the study area is rural in character and located in an unincorporated part of Vermilion County, it does have access to existing connections for public utilities. The following is a listing of the availability of public utilities:• Potable Water - Provided by AquaIllinois• Sanitary Sewer System - Not currently extended to the study area• Natural Gas - Provided by Ameren• Electricity - Provided by Ameren• Storm Sewers/Drainage Swales - Maintained by Vermilion County or local roadway commission
AquaIllinois provides potable water service to the study area through 12” water mains running along US 150, Henning Road, Batestown Road, and Kickapoo Drive. Smaller 6” and 8” supply lines branch off the 12” mains to provide water to the smaller subdivisions and developments surrounding the study area. Some of the parcels within the study area are small water users and are supplied by personal wells. AquaIllinois stated that the study area has large enough infrastructure to support additional commercial, light industrial or residential development. A map of existing water lines can be seen in Figure 3.2.
The only public utility currently missing from the study area is the extension of sanitary sewers. The Danville Sanitary District has extended its infrastructure as far as the western edge of the City of Danville. In order to service the study area, the District would have to extend new sanitary infrastructure approximately 3.5 miles to service the eastern portion of the study area up to the interchange. A project of this magnitude would be costly, and depending on what future development occurs in the study area, upgrades to the existing sanitary infrastructure may be necessary. Other possibilities exist for providing sanitary infrastructure to the study area, such as private treatment plants and septic systems for smaller development. Figure 3.2 shows the preferred route for a future sanitary extension along US 150 into the study area.
Ameren provides natural gas and electricity service to the study area. Natural gas coverage is excellent within the study area with 3-4” supply lines coming in along Oakwood Avenue and Batestown Road. A 4” supply line has been extended north along Henning Road between Batestown Road and US 150, serving most of the commercial and industrial development in that area. Smaller 1.25” feeder lines can be seen supplying the smaller residential developments along Batestown Road and Oakwood Avenue. Electrical coverage in the study area is also excellent. Primary electrical lines run along Oakwood Avenue, Henning Road, Kickapoo Drive/US 150, and Batestown Road. These primary lines feed secondary lines which supply power to the smaller residential and commercial developments throughout the study area. Figures 3.3 and 3.4 show the locations of natural gas and electric supply lines.
Finally, stormwater infrastructure within the study area is provided by either curb and gutter or drainage swales. Curb and gutter can be found along Henning Road and along a small section of Batestown Road between Henning Road west to the overpass at I-74. The majority of the stormwater system is drainage swales, typical for non-urbanized areas. The stormwater infrastructure system can be seen in Figure 3.5.

W E S T G A T E L A N D U S E P L A N
Exis
ting C
onditio
ns
Land Use
14
Figure 3.2 - Water and Sanitary Supply Lines
AquaIllinois, Danville Sanitary District, DATS

W E S T G A T E L A N D U S E P L A N
Exis
ting C
onditio
ns
Land Use
15
Figure 3.3 - Natural Gas Supply Lines
Ameren, DATS

W E S T G A T E L A N D U S E P L A N
Exis
ting C
onditio
ns
Land Use
16
Figure 3.4 - Electrical Supply Lines
Ameren, DATS

W E S T G A T E L A N D U S E P L A N
Exis
ting C
onditio
ns
Land Use
17
Figure 3.5 - Stormwater Infrastructure
Vermilion County, DATS

W E S T G A T E L A N D U S E P L A N
Exis
ting C
onditio
ns
Demographics
18
Demographic and Economic AnalysisIn order to gain a better understanding of the existing demographics and local economy, an analysis was completed for both the study area and Vermilion County. The study area’s small size and relatively low population does not lend itself to a tell-all analysis for local demographics and economic analyses. A regional approach, looking at the entire county, will yield a more accurate view of demographic trends and economic shifts over time. Appropriate sources of demographic data for Vermilion County and the Westgate Study Area include the United States Census Bureau, United States Bureau of Economic Analysis, United States Bureau of Labor Statistics, and Illinois Department of Employment Security. Demographic and economic analyses are provided at the municipal, county, and regional levels.
Local Population in DeclineThe U.S. Bureau of Economic Analysis (BEA) reported a population decline of 4,353 people (5.0%) for Vermilion County between 1990 and 2000. The BEA further reports a population decrease of 2,109 people (2.5%) between 2000 and 2007. Populations for the City of Danville and Vermilion County continue to decline even as the United States and the State of Illinois are growing.
According to the U.S. Census Bureau Decennial Census program, the population of Danville was 33,904 in 2000. This is a population increase of 76 people (0.2%) from 1990, which deviates from the trend of steady decline that Danville experienced between 1970 and 1990. Between 1970 and 1990, the population of Danville declined by 8,742 people (20.5%).
Current annual estimates from the U.S. Census Bureau report a population decline of approximately 200 people per year (0.6%) since 2000 for the City of Danville. The estimate places the population for Danville at 32,248 for July 1, 2008.
50
75
100
125
150
1970
1972
1974
1976
1978
1980
1982
1984
1986
1988
1990
1992
1994
1996
1998
2000
2002
2004
2006
Vermilion Illinois United States
Figure 3.6 - Index of Population Change
Source: U.S. Bureau of Economic Analysis
Year Danville Vermilion County
2000 33,838 83,919
2001 33,614 83,452
2002 33,336 82,923
2003 33,020 82,386
2004 32,838 82,170
2005 32,695 81,743
2006 32,651 81,641
2007 32,468 81,167
2008 32,248 80,680
Table 3.2 Annual
Population Estimates
Source: U.S. Census Bureau

W E S T G A T E L A N D U S E P L A N
Exis
ting C
onditio
ns
Demographics
19
MigrationNet migration by age provides greater detail about the decline in Vermilion County’s population. The majority of age ranges show a net out-migration between 1990 and 2000. Estimated migration assumes that migration is the primary component of population change for ages 10 to 69. Death becomes a larger component of population change for ages over 70, and is therefore not included in the estimation. The majority of age cohorts experienced a decline, including the early retirement population. This is of note because the population would be expected to stay the same or possibly increase if aging populations tended to remain in the area. Also of note, are the 20-40 year cohorts. Ages 20-30 are likely leaving for higher education, while those age 30-40 are increasing in population. This is encouraging because it shows that Vermilion County is recapturing some of its population loss. However, the amount of recapture is not nearly enough to offset the population loss. Figure 3.7 shows the age cohorts and population gain or loss.
Population by Age and Sex in Vermilion CountyIn 2000, the population of Vermilion County was split evenly between males and females, 49.2% and 50.8% respectively. The population pyramid provides an expectation of population growth; ages 20 and below have greater population than many of the cohorts above it. However, as shown with the net migration statistics, the likelihood that this population will remain in the County is very small. Figure 3.8 shows the population for each age cohort and sex.
-2,0
00
-1,5
00
-1,0
00
-500 0
500
1,00
0
10-14 years
15-19 years
20-24 years
25-29 years
30-34 years
35-39 years
40-44 years
45-49 years
50 to 54 years
55 to 59 years
60 to 64 years
65 to 69 years
Figure 3.7 - Vermilion County Net Migration (1990-2000) Figure 3.8 - Population by Age and Sex (2000)
(2,708)
(2,907)
(2,892)
(2,837)
(2,308)
(2,419)
(2,546)
(2,985)
(3,111)
(2,976)(2,762)
(2,260)
(2,001)
(1,913)
(1,861)
(1,776)
(1,213)
(1,153)
2869
3014
2961
2925
2601
2749
2666
3136
3198
29842645
2168
1866
1613
1496
1234
713
453
(4,000) (2,000) 0 2,000 4,000
Under 5 years
10-14 years
20-24 years
30-34 years
40-44 years
50 to 54 years
60 to 64 years
70 - 74 years
80 to 84 years
Female MaleSource: U.S. Census Bureau
Source: U.S. Census Bureau

W E S T G A T E L A N D U S E P L A N
Exis
ting C
onditio
ns
Demographics
20
Median Age Remains in the Mid-30sThe median of age in Vermilion County has increased each decade since 1980. The median age (38) in 2000, was higher than that of the United States (35.3). This is due to the population under 20 years of age being nearly the size of the baby boomer generation who in 2000 were between the age of 36 and 54. In 2000, 27.5 percent of the population in Vermilion County was under the age of 20, and 11.8 percent were age 70 or over. Figure 3.9 shows the median age in Vermilion County from 1980-2000.
AgingThe population in Vermilion County between the ages of 65 and 74 decreased from 1990 to 2000, while the population 75 and over increased. This change is similar to what happened in the State of Illinois as a whole. Figure 3.10 shows the aging population in Vermilion County as compared to the State of Illinois.
Race and EthnicityThe racial composition of Vermilion County is predominantly White (86%), followed by Black or African American (11%). The City of Danville also has a predominantly White population (70%), followed by Black or African American (24%). Both Vermilion County and the City of Danville became more diverse in 2000, with increasing populations of Black or African American. Significant increase is also noted in the ‘some other race’ category; however, this may be due partly to increased options for the race question on the Census 2000 questionnaire. Table 3.3 shows the change in race from 1990 to 2000 Vermilion County.
38
35.4
31.2
0
10
20
30
40
200019901980
Year
s
Figure 3.9 - Median Age in Vermilion County
Source: U.S. Census Bureau
Percent Change of Population 65 years and Older
1990 - 2000
-40% -20% 0% 20% 40%
65 to 69years
70 - 74years
75 to 79years
80 to 84years
85 yearsand over
Vermilion County Illinois
Figure 3.10 - Percent Change of Population 65 and Over
Source: U.S. Census Bureau
Table 3.3 - Vermilion County Change in Race
Source: U.S. Census Bureau
Category 1990 2000 % Change
White 78,956 72,032 -8.8%
Black or African American 7,841 8,882 13.3%
Asian or Pacific Islander 507 498 -1.8%
Some other race 953 2,507 163.1%
Total 88,257 83,919 -4.9%

W E S T G A T E L A N D U S E P L A N
Exis
ting C
onditio
ns
Demographics
21
Future Population for Vermilion CountyThe trend of population decline for Vermilion County is expected to continue into the future. The composition of the existing population is also expected to change. Over the next twenty years, the Black or African American and Asian populations are expected to experience some growth. However, growth of these segments is not expected to occur at a level that will change the population decline. Conditions that may change this expectation include changes in the national and local economy, changes in local infrastructure, sector specific development, public policy, climate, and many others.
The rate of population decline has slowed over the past decade, indicating the chance that a floor has been reached in the local population decline. However, further research must be completed to develop a valid forecast of future population.
EducationResidents of Vermilion County have the Danville Area Community College and the Lakeview College of Nursing as local resources for higher education. Additional educational resources, such as the University of Illinois at Urbana-Champaign, Indiana State University and Parkland College are in close proximity to Vermilion County. Table 3.4 shows educational attainment for Vermilion County in 2000.
HousingIn 2000, Vermilion County had 36,349 housing units; 14,886 (41%) of these were within the City of Danville. There were 8,334 (62.5%) owner occupied units, and of those, 271 units (3.3%) were vacant. Of the 33,406 occupied housing units in Vermilion County, 10,303 (30.8%) were built prior to 1940. The City of Danville had relatively stable home construction until the 1980s, when construction decreased significantly. The construction of residential buildings has decreased from a high of 68 in 2003 to a low of 11 in 2008. The number of residential units constructed hit a high of 116 in 2004. The development that occurred in 2004 added a significant number of multifamily dwellings.
Table 3.4 - Vermilion County Educational Attainment
Source: U.S. Census Bureau
Attainment Level Vermilion CountyPercent of Population
Less than high school 11,857 21.3%
High school 21,403 38.4%
Some college 11,643 20.9%
Associate degree 3,930 7.0%
Bachelor’s degree 4,625 8.3%
Master’s degree 1,565 2.8%
Professional school degree 643 1.2%
Doctoral degree 112 0.2%
Total 55,778 100%
Figure 3.11 - Construction of Housing Units
Source: U.S. Census Bureau
4424
1931
2102
1926
1769
674
478
10303
3843
4613
4756
5261
2460
2170
0 2000 4000 6000 8000 10000 12000
1939 or Earlier
1940 - 1949
1950 - 1959
1960 - 1969
1970 - 1979
1980 - 1989
1990 - 2000
Danville Vermilion County

W E S T G A T E L A N D U S E P L A N
Exis
ting C
onditio
ns
Demographics
22
Housing AffordabilityIn 2000, the average rental costs in Danville and Vermilion County were $410 and $420, respectively. As a percent of household income, median rent in Danville was 25%, while Vermilion County was 23%. These numbers are below the 30% rule for the amount the average American should be spending on housing payments. However, approximately 38% of renters pay 30% or more of their household income towards rent in the City of Danville, while 35% of renters in Vermilion County pay over 30% of their income. Danville has a higher proportion of public housing and Section 8 housing than other communities in central Illinois. During a Holiday Hills Association neighborhood meeting in 2008, Danville’s Mayor Eisenhauer presented statistics substantiating this claim, though the source was not provided. Table 3.5 shows Danville’s public housing figures compared to other central Illinois communities.
IncomePer capita income increased by 42.6% from 1989 to 1999 in Vermilion County. This is below the state average of a 52% increase. Median household income and median family income also increased by 42.9% and 36.7%, respectively. Incomes also increased in Danville, but not at the magnitude of the County or the State.
CityPublic HousingOne for Every
Section 8One for Every
Danville 63 residents 54 residents
Champaign/Urbana 260 residents 83 residents
Decatur 116 residents 91 residents
Springfield 135 residents 58 residents
Table 3.5 - Housing Assistance
Source: Notes from a Neighborhood Association Meeting (2008)
CategoryCity of Danville Vermilion County
1989 1999 Change 1989 1999 Change
Per capita income $12,401 $16,476 32.9% $11,771 $16,787 42.6%
Median household income $22,315 $30,431 36.4% $23,841 $34,071 42.9%
Median family income $30,263 $39,308 29.9% $30,392 $41,553 36.7%
Table 3.6 - Income from 1989-1999
Source: U.S. Census Bureau
PovertyThe poverty rate for Vermilion County is higher than the state average. Between 1989 and 1999, the percent of people whose income was below the poverty level decreased from 15.2% to 13.3%. This is the second highest poverty rate in a six county region. Champaign County is showing the highest poverty rate because the University of Illinois’ student population largely falls below the poverty level. This in turn artificially inflates the poverty statistics. In reality, Vermilion County most likely has the highest poverty levels. Table 3.7 shows how Vermilion County’s poverty status compares to other central Illinois counties.

W E S T G A T E L A N D U S E P L A N
Exis
ting C
onditio
ns
Demographics
23
EmploymentIn 2008, the Vermilion County labor force included 37,738 people, and had an annual unemployment rate of 6.9%. Unemployment in Vermilion County varied between 2000 and 2008 with a low of 5.7% in 1999 and a peak of 8.2% in 2008. The labor force in Vermilion County has decreased since 1999, but has been relatively stable since 2005. Employment experienced greater fluctuation between 1999 and 2008. A sharp increase in employment in 2005 resulted in lower unemployment, however, the recent economic downturn has taken away numerous jobs in Vermilion County, while the labor pool has remained near the previous year’s level.
Table 3.7 - Poverty Levels 1989-1999
Figure 3.12 - Labor Force vs. Employment Figure 3.13 - Unemployment Rate
Source: U.S. Census Bureau
County1989 Number
Below
1989 Percent Below
1999 Number Below
1999 Percent Below
Champaign 24,127 15.6 26,460 16.1
Douglas 1,843 9.6 1,247 6.4
Ford 1,284 9.3 956 7.0
Iroquois 2,777 9.2 2,669 8.7
Piatt 939 6.1 799 5.0
Vermilion 12,971 15.2 10,704 13.3
District 43,941 10.8 42,835 9.4
State 1,326,731 11.9 1,291,958 10.7
320003300034000350003600037000380003900040000
1999
2000
2001
2002
2003
2004
2005
2006
2007
2008
Labor Force Employment
0
2
4
6
8
10
1999
2000
2001
2002
2003
2004
2005
2006
2007
2008
Per
cent
Unemployment RateSource: Illinois Department of Employment SecuritySource: Illinois Department of Employment Security

W E S T G A T E L A N D U S E P L A N
Exis
ting C
onditio
ns
Demographics
24
Employment by IndustryThe largest industries in Vermilion County are Trade, Transportation and Utilities, and Manufacturing. In 2008, 52% of the labor force was employed in these two industry sectors, according to the United States Bureau of Labor Statistics. The employment trend for the top four industry sectors is shown in the Figure 3.14. The Illinois Department of Employment Security reports different statistics for the top three: a steady decrease in manufacturing since 1990, an increase in retail trade towards the middle 1990s, which then steadily decreased since 2001. Educational and Health Services have steadily, but slowly increased since 1990. Table 3.8 shows employment by industrial sector for Vermilion County.
Industry Sector Employment 2001
Employment2008
Employment Change
Percent Growth 2001-2008
Natural Resources and Mining 316 352 36 11.4%
Construction 961 634 -327 -34.0%
Manufacturing 6,322 5,750 -572 -9.0%
Trade, Transportation and Utilities 7,324 6,660 -664 -9.1%
Information 607 370 -237 -39.0%
Financial Activities 1,742 1,505 -237 -13.6%
Professional and Business Services 1,051 2,076 1,025 97.5%
Educational and Health Services 3,029 3,192 163 5.4%
Leisure and Hospitality 2,638 2,293 -345 -13.1%
Other Services 1,264 951 -313 -24.8%
Totals: 25,256 23,786 -1,470 -5.8%
Table 3.8 - Employment by Industry
Source: Illinois Department of Employment Security
Source: United States Bureau of Labor Statistics
Figure 3.14 Employment
Trends of Top Four Sectors
Source: Illinois Department of Employment Security
0
2000
4000
6000
8000
10000
12000
14000
16000
18000
Jan-
90
Jan-
91
Jan-
92
Jan-
93
Jan-
94
Jan-
95
Jan-
96
Jan-
97
Jan-
98
Jan-
99
Jan-
00
Jan-
01
Jan-
02
Jan-
03
Jan-
04
Jan-
05
Jan-
06
Jan-
07
Jan-
08
Jan-
09
Manufacturing Educational and Health ServicesTrade, Transportation, and Utilitie Professional and Business Servicess
The highlighted rows show the greatest percentage disparities

W E S T G A T E L A N D U S E P L A N
Exis
ting C
onditio
ns
Demographics
25
Job Growth and Competitive AdvantageThe Illinois Department of Commerce and Economic Opportunity developed ten year employment projections for Vermilion County to the year 2016. These projections show growth in a number of sectors, notably, Education and Health Services, Health Care and Social Assistance and Trade, Transportation and Utilities. The combination of annual compound growth rate and competitive advantage provides further analysis in comparison to the State of Illinois. This analysis shows that there is a competitive advantage for Natural Resources, Government, and Agricultural production and manufacturing in Vermilion County. Unfortunately, all of these sectors are expected to experience decline.
Figure 3.15 shows the projected growth and the locational advantage of employment sectors in Vermilion County as compared to that of the State of Illinois. The X-axis measures the growth of each industry. To the right of 0 means the industry is growing, to the left, the industry is declining. The Y-axis measures the advantage any given industry has of succeeding in Vermilion County as compared to other locations in the State of Illinois. The higher the circle is above the X-axis, the better the location. Ideally, Vermilion County is looking for any employment sectors which fall in the upper right-hand corner of the graph. This would indicate both job growth as well as a competitive locational value for Vermilion County.
The Trade, Transportation, and Utilities sector is shown to have a slight advantage compared to the state, and is projected to grow. This sector is projected to increase by 265 jobs (indicated by the size of the circle). Other sectors, while expected to increase employment, do not have particular advantages to locating in Vermilion County (graphed very close to the X-axis). Sectors which are projected to bring the greatest number of jobs are Educational and Health Services and Health Care and Social Assistance. Sectors that have no growth or are projected to decline are shown as the same size point. The four sectors found in the upper left-hand corner of the graph have excellent locational value in Vermilion County, but are expected to decline in employment. Manufacturing, mining, and agriculture are employment sectors declining across the United States.
Figure 3.15 - Projected Growth and Locational Advantage Compared to State of Illinois
Source: Illinois Department of Employment Security

W E S T G A T E L A N D U S E P L A N
Exis
ting C
onditio
ns
Demographics
26
Shift Share Analysis - Privately Owned Industries in Vermilion County (2000 to 2008)Shift share is an academic analysis used to analyze and better understand changes in local economies. The analysis is a comparison of the share of jobs in the local economy compared to the share of jobs in the same sector for the national economy. The analysis utilizes these assumptions: employment in the local economy follows trends found in the national economy, the diversity of industries in both economies is similar, and shifts in employment by sector are similar in both economies.
Table 3.9 shows the results of the shift share analysis for ten employment sectors. The national growth column refers to the job growth expected per employment sector in Vermilion County based on the overall increase in national employment. For example, if between 2000-2008 the national economy grew by 4%, then it is inferred that each employment sector grew by 4%.
The industrial mix component refers to the job growth in the national economy for each specific sector of employment. For instance, the national job growth may have been 4%, but within the Construction employment sector, the nation may have seen a 15% increase. The industrial mix accounts for employment increases in specific employment sectors.
Finally, the competitive share column shows how Vermilion County’s employment sectors are performing compared to national growth trends. Positive values indicate the local economy is growing, negative numbers indicate job loss. Employment sectors are defined by North American Industry Classification System (NAICS) 2002.
Important sectors to note in this analysis are Educational and Health Services, and Leisure and Hospitality. These sectors show high national and industrial mix growth but show a decline in the competitive share column. This may be caused by Vermilion County’s lack of leisure and hospitality businesses, but indicates sectors where job growth could be captured. It is also possible that Champaign County is taking away educational and health service sector jobs from Vermilion County with the University of Illinois and major regional hospitals. Changes to local conditions may allow Vermilion County to take advantage of the national trend in these sectors.
The Professional and Business Services sector saw the most growth and is attributed to local conditions. While growth was seen throughout the nation, significant growth was experienced locally. Also of note is the Manufacturing sector, which is well situated locally; however, the national decline outweighed any growth that the area might have experienced between 2000 and 2008.

W E S T G A T E L A N D U S E P L A N
Exis
ting C
onditio
ns
Demographics
27
A Quick Look at Westgate Study Area DemographicsA demographic summary was completed for the Westgate Study Area. The following statistics were taken from the 2000 U.S. Census:
• The Westgate Study Area spans nineteen Census Blocks, which is the smallest spatial division for which data can be acquired. • The population of the study area was 220 in 2000• 51.8 percent of the population is male• 58 percent of the population is age 40 or over• 77.7 percent of the population lives as a family unit• There are 106 housing units• The population within one mile of the study area was 2,406
The demographic and economic information presented in this section not only helps to define trends within Vermilion County and the City of Danville, but it provides a basis for understanding what future growth can be expected and where agencies should focus their efforts in order to create a successful outcome for the Westgate Study Area.
Employment SectorNational Growth Component,
JobsIndustrial Mix Component,
JobsCompetitive Share Component,
Jobs
Natural Resources and Mining 11 21 4
Construction 34 16 -377
Manufacturing 225 -1,383 587
Trade, Transportation, and Utilities 260 -134 -790
Information 22 -124 -135
Financial Activities 62 3 -302
Professional and Business Services 37 52 936
Educational and Health Services 108 525 -470
Leisure and Hospitality 94 241 -680
Other Services 45 38 -396
Totals 898 -745 -1,625
Table 3.9 - Shift Share Analysis 2000-2008
Source: United States Bureau of Labor StatisticsThe highlighted rows highlight important employment sectors for Vermilion County

W E S T G A T E L A N D U S E P L A N
Exis
ting C
onditio
ns
Transportation
28
TransportationThe transportation network connecting the study area to surrounding locations is a key element to analyze in conjunction with land use and development patterns. Transportation and land use go hand in hand, and each depends on the other for the fluid movement of people and goods. This section will review the existing automobile, pedestrian and bicycle, transit, and truck travel patterns and networks to better understand how travelers are moving through the study area.
Roadway NetworkOne distinct advantage the study area has over many other development locations in the region is the availability of an interstate interchange at I-74 and US 150. Interstate access becomes a valuable asset when locating not only commercial and industrial development but also residential development. The accessibility and connectivity of the local roadway network drives development decisions and attractiveness of an area for future growth. The study area not only has an interchange, but also has a major US route (Route 150) bisecting it from east to west. US 150 provides direct connection to Danville east of the study area, and west to Urbana-Champaign. It is an alternate travel route for those not wanting to use I-74 to go east and west from the study area.
Local urban collectors, like Batestown Road and Henning Road, provide connections in and around the study area for residents as well as businesses. Batestown Road is a relatively low traffic two-lane two-way collector on the south side of the study area, and loops around connecting to US 150 on the east and west sides of the study area. Batestown Road collects a majority of the residential traffic along the south side of the study area, accessing US 150 and the interchange with I-74. Henning Road is the major north/south roadway connecting the study area to development north of US 150. Henning Road also provides access to Kickapoo State Park and Kennekuk County Park, two regional destinations within close proximity to the study area.
The local roadway and street network is mostly comprised of small dead end roadways that provide access to small residential subdivisions and frontage roads for commercial and industrial development. Most of the local roadways are outside the study area to the north and south, providing access to residential developments. Since nearly half the study area is currently undeveloped, it is not surprising to see a roadway network comprised of mostly collectors and arterials.
Roadway JurisdictionRoadway jurisdiction is an important aspect of the overall roadway network because it determines who would be responsible for any current or future improvements. IDOT has jurisdiction over the portions of I-74 and US 150 that traverse the study area and would be responsible for any maintenance and improvements. Henning Road and Batestown Road are under the jurisdiction of the Vermilion County Highway Department. The remaining local roadways are left under the jurisdiction of the township road district. Any private roadway segments are the responsibility of private property owners. Future improvements may also fall under cost sharing agreements between the jurisdiction responsible and developers if agreements are structured in that manner. Figure 3.16 shows the jurisdiction of roadways in the study area.

W E S T G A T E L A N D U S E P L A N
Exis
ting C
onditio
ns
Transportation
29
Figure 3.16 - Roadway Jurisdiction
IDOT, DATS

W E S T G A T E L A N D U S E P L A N
Exis
ting C
onditio
ns
Transportation
30
Roadway Average Daily Traffic (ADT)Average daily traffic refers to the number of vehicles traveling along a roadway segment during an average 24-hour period. A majority of the roadway segments in the study area are not experiencing high ADT values. As expected, the segment of I-74 running through the study area has the highest ADT values, ranging from about 22,000 - 24,000. The segment of US 150 east of the I-74 interchange has the second highest ADT values, ranging from 8,800 - 9,400. The west side of US 150 has about half the ADT as found on the east side of the interchange, meaning most drivers are using US 150 to get from the interchange to destinations east of the interchange. There is also a significant number of vehicles entering US 150 at the eastern intersection of Batestown Road and US 150. Most of the local roadways have relatively low ADT values, ranging from 0 - 2,700. Currently, there are no capacity issues on roadways in the study area, and capacity should be adequate to handle most types of future development. Figure 3.18 shows the ADT value ranges for roadways within the study area.
Roadway Functional ClassificationRoadway functional classification designations were provided by IDOT for all roadways in the study area. Roadways are designated with a functional classification to categorize levels of movement in relation to access provided along any given roadway. Interstates have the highest functional class, allowing for the greatest amount of traffic flow with the most limited amount of access. At the other end of the spectrum are local roadways, which are meant to handle low volumes of traffic and often have few limits on access control. Currently, the roadways in the study area are functioning according to their classifications. US 150, an arterial/collector, has strict access control with development served through the use of frontage roads. This access control provides for safer travel conditions and more efficient travel times. Batestown Road, east of I-74, is categorized as an urban collector which is meant to collect residential traffic and distribute it to the arterial roadway system, in this case US 150, Henning Road and Shangri-La Road. Batestown Road currently allows direct access from residential driveways to the roadway without the use of a local roadway system. The smaller rural subdivisions do have some local road access onto Batestown Road, but a majority of the single-parcel residential homes have direct access to Batestown Road. If traffic volumes increase along Batestown Road in the future, the direct access may cause a reduction in safety and travel times. Overall, the functional classification of each roadway within the study area currently meets the criteria and expectations for the network. Figure 3.19 shows the functional classification of each roadway in the study area.
Roadway Segment Level of Service (LOS)Roadway segment level of service is a term used to indicate the amount of congestion along a given roadway segment. LOS is based on factors like density, speed, volume to capacity ratio, travel time, and safety. LOS designation ranges from A to F, with LOS A representing no congestion and LOS F representing the worst congestion. An LOS analysis was completed for two segments of US 150 using IDOT’s 2008 ADT counts. The segment of US 150 from Batestown Road east to the I-74 interchange has a LOS of A. The segment of US 150 from the I-74 interchange east to Batestown Road has a LOS of B. Both segments are experiencing very little congestion and free flowing traffic speeds.
Figure 3.17: Movement and Access

W E S T G A T E L A N D U S E P L A N
Exis
ting C
onditio
ns
Transportation
31
Figure 3.18 - Roadway ADT (2008)
IDOT, DATS

W E S T G A T E L A N D U S E P L A N
Exis
ting C
onditio
ns
Transportation
32
Figure 3.19 - Functional Classification
IDOT, DATS

W E S T G A T E L A N D U S E P L A N
Exis
ting C
onditio
ns
Transportation
33
Intersection Control TypesThere are two types of intersection controls found within the study area: signalized intersections and two-way stop controlled intersections. There is only one signalized intersection found within the entire study area, and that is at the intersection of US 150 and Henning Road. All other intersections are two-way stop controlled. The stop signs at these intersections provide continuous traffic flow at the major approaches and place the stop control at the minor approaches. This in turn causes less delay on roadways with higher traffic volumes.
Crash HistoryCrash data from 2001-2007 was provided for all roadways within the study area. Given the relatively low traffic volumes on most of the roadways, except for the stretch of I-74 traversing the study area, total crashes per year are low. Crashes occurring on the segment of I-74 running through the study area accounted for 28% of all crashes. Higher crash occurrences on I-74 are directly proportional to the ADT volumes, meaning higher ADT volumes will most likely lead to more crashes. The same can be said for the segments of US 150 running through the study area. This roadway has the second highest ADT volumes after I-74, and crashes on US 150 account for approximately 66% of all crashes in the study area. The remainder of crashes occurred on Henning Road, Batestown Road and one on Kickapoo Drive.
Figure 3.20 shows the total number of crashes that occurred along roadways and at intersections in the study area from 2001-2007. Total crashes climbed steadily from 2001 to 2004, then dropped significantly, before increasing greatly from 2005-2007. One major reason for the increase in total crashes from 2005-2007 was a sharp rise in intersection crashes, particularly at the intersection of US 150 and Henning Road. There were a number of rear end and turning crashes at that intersection in 2006 and 2007.
Crash TypesCrashes occurring in the study area were classified under ten different crash categories ranging from angle crashes to overturned vehicle. Table 3.10 shows the crash types and total crashes per category. Between 2001-2007, 46% of the crashes occurring in the study area were animal related. The rural character of the study area does create more of a chance for crashes involving animals crossing the roadway. Nearly all of these animal crashes occurred along I-74 and US 150. Many of the crashes involving animals and
Crash Type Total %
Angle 8 5.8%
Animal 64 46.4%
Other Object 5 3.6%
Rear End 18 13.0%
Fixed Object 15 10.9%
Turning 16 11.6%
Vehicle Overturned 4 2.9%
Non-Collision 2 1.4%
Parked Vehicle 1 0.7%
Sideswipe 5 3.6%
Totals 138 100.0%
Table 3.10 Crash Types (2001-2007)
Figure 3.20 - Total Crashes 2001-2007Total Crashes per Year
0
5
10
15
20
25
30
35
40
2001 2002 2003 2004 2005 2006 2007
Year
Tota
l Cra
shes

W E S T G A T E L A N D U S E P L A N
Exis
ting C
onditio
ns
Transportation
34
fixed objects occurred during dark conditions. The lack of street level lighting could be a factor in the amount of crashes occurring in low light conditions. Only about 35% of the crashes in the study area involved more than one vehicle, which is a relatively low number and consistent with the low traffic volumes found in the study area. Rear end and turning crashes accounted for the highest vehicle to vehicle crash categories, most of which occurred at intersections.
Crash Severity LevelsWith the relatively low number of total crashes, as well as the low number of crashes involving more than one vehicle, it is not surprising to find low numbers of severe crashes in the study area. Between 2001-2007, only 19% of all crashes in the study area involved some type of injury to the driver or passengers in the vehicle. The highest number of injury crashes, 9, occurred at the intersection of Henning Road and US 150 over the seven year period. Fortunately, no fatalities were recorded during this time period. Tables 3.11 and 3.12 show the crash severity levels along roadway segments and at intersections within the study area.
Table 3.12 Intersection Crashes
(2001-2007)
Intersection
Crash Severity LevelTotal
CrashesFatal Crashes Injury Crashes PDO Crashes
Num. % Num. % Num. %
US 150/Henning Rd. 0 0.0% 9 50.0% 9 50.0% 18
US150/Batestown Rd. (West) 0 0.0% 3 37.5% 5 62.5% 8
US 150/I-74 Ramp 0 0.0% 1 33.3% 2 66.7% 3
US150/Batestown Rd. (East) 0 0.0% 1 20.0% 4 80.0% 5
I-74 Ramp 0 0.0% 1 50.0% 1 50% 1
Batestown Rd./Lenover Ave. 0 0.0% 0 0.0% 1 100.0% 1Total: 0 0.0% 15 40.5% 22 59.5% 37
Roadway Segment From To
Crash Severity LevelTotal
CrashesFatal Crashes Injury Crashes PDO Crashes
Num. % Num. % Num. %
US 150
Batestown Rd. (West) I-74 Interchange 0 0.0% 2 10.5% 17 89.5% 19
I-74 Interchange Henning Road 0 0.0% 4 16.7% 20 83.3% 24
Henning Road Batestown Rd. (East) 0 0.0% 1 7.1% 13 92.9% 14
I-74 Length of Study Area 0 0.0% 4 10.8% 33 89.2% 37
Kickapoo Dr. Terminus Henning Road 0 0.0% 0 0.0% 1 100.0% 1
Batestown Rd.East of I-74 Overpass 0 0.0% 0 0.0% 2 100.0% 2
West of I-74 Overpass 0 0.0% 0 0.0% 1 100.0% 1
Henning Rd. Batestown Rd. US 150 0 0.0% 0 0.0% 3 100.0% 3Total: 0 0.0% 11 10.9% 90 89.1% 101
Table 3.11 Roadway Segment Crashes
(2001-2007)
PDO = Property Damage Only
W E S T G A T E L A N D U S E P L A N
Exis
ting C
onditio
ns
Transportation
35
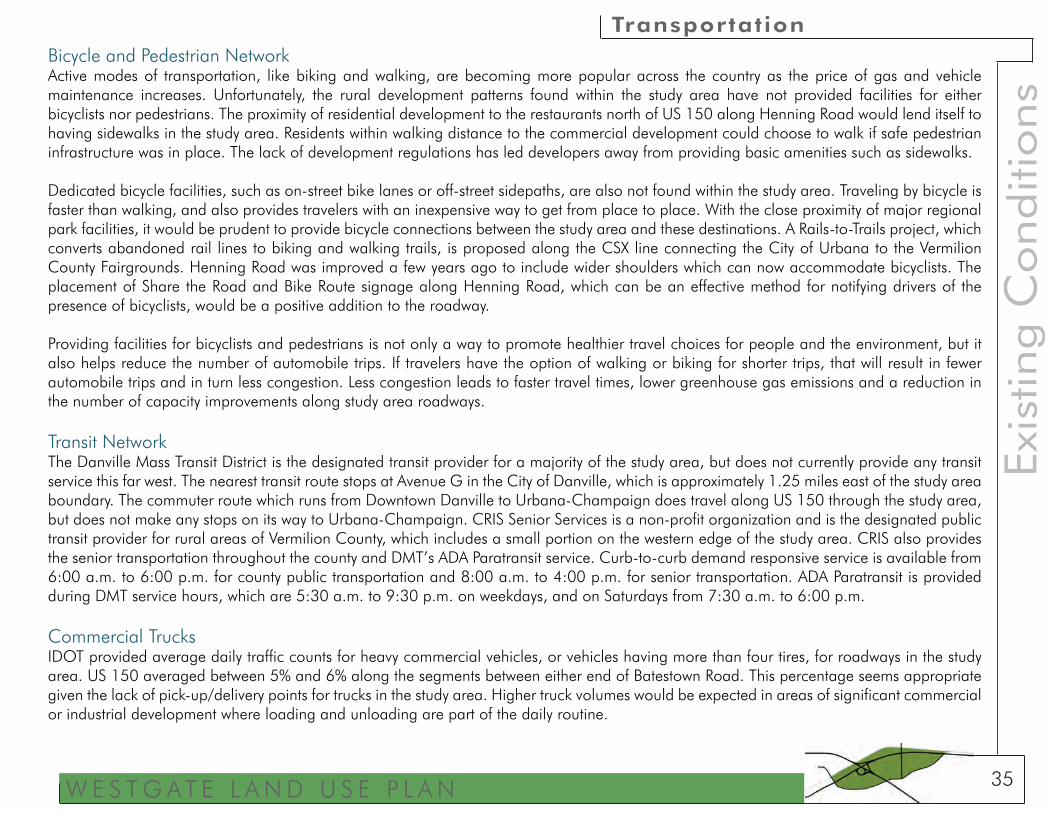
Bicycle and Pedestrian NetworkActive modes of transportation, like biking and walking, are becoming more popular across the country as the price of gas and vehicle maintenance increases. Unfortunately, the rural development patterns found within the study area have not provided facilities for either bicyclists nor pedestrians. The proximity of residential development to the restaurants north of US 150 along Henning Road would lend itself to having sidewalks in the study area. Residents within walking distance to the commercial development could choose to walk if safe pedestrian infrastructure was in place. The lack of development regulations has led developers away from providing basic amenities such as sidewalks.
Dedicated bicycle facilities, such as on-street bike lanes or off-street sidepaths, are also not found within the study area. Traveling by bicycle is faster than walking, and also provides travelers with an inexpensive way to get from place to place. With the close proximity of major regional park facilities, it would be prudent to provide bicycle connections between the study area and these destinations. A Rails-to-Trails project, which converts abandoned rail lines to biking and walking trails, is proposed along the CSX line connecting the City of Urbana to the Vermilion County Fairgrounds. Henning Road was improved a few years ago to include wider shoulders which can now accommodate bicyclists. The placement of Share the Road and Bike Route signage along Henning Road, which can be an effective method for notifying drivers of the presence of bicyclists, would be a positive addition to the roadway.
Providing facilities for bicyclists and pedestrians is not only a way to promote healthier travel choices for people and the environment, but it also helps reduce the number of automobile trips. If travelers have the option of walking or biking for shorter trips, that will result in fewer automobile trips and in turn less congestion. Less congestion leads to faster travel times, lower greenhouse gas emissions and a reduction in the number of capacity improvements along study area roadways.
Transit NetworkThe Danville Mass Transit District is the designated transit provider for a majority of the study area, but does not currently provide any transit service this far west. The nearest transit route stops at Avenue G in the City of Danville, which is approximately 1.25 miles east of the study area boundary. The commuter route which runs from Downtown Danville to Urbana-Champaign does travel along US 150 through the study area, but does not make any stops on its way to Urbana-Champaign. CRIS Senior Services is a non-profit organization and is the designated public transit provider for rural areas of Vermilion County, which includes a small portion on the western edge of the study area. CRIS also provides the senior transportation throughout the county and DMT’s ADA Paratransit service. Curb-to-curb demand responsive service is available from 6:00 a.m. to 6:00 p.m. for county public transportation and 8:00 a.m. to 4:00 p.m. for senior transportation. ADA Paratransit is provided during DMT service hours, which are 5:30 a.m. to 9:30 p.m. on weekdays, and on Saturdays from 7:30 a.m. to 6:00 p.m.
Commercial TrucksIDOT provided average daily traffic counts for heavy commercial vehicles, or vehicles having more than four tires, for roadways in the study area. US 150 averaged between 5% and 6% along the segments between either end of Batestown Road. This percentage seems appropriate given the lack of pick-up/delivery points for trucks in the study area. Higher truck volumes would be expected in areas of significant commercial or industrial development where loading and unloading are part of the daily routine.

W E S T G A T E L A N D U S E P L A N
Exis
ting C
onditio
ns
Environment
36
EnvironmentThe environmental section is intended to survey and inventory the existing environmental conditions and assess the positive and negative aspects that current conditions could have on future land use and transportation. This section will provide details in the following areas:• Topography• Soils• Wetlands• Floodplains• Water Quality• Natural Areas• Regional Parks and Open Space
Effects from new development and transportation infrastructure on the environment not only take place within the study area, but can be seen and felt outside the study area as well. Disturbances that may seem insignificant to conditions within the study area, can sometimes have more serious repercussions outside the study area. This is why it is important to look at environmental conditions not only within the study area itself, but in surrounding areas as well. The natural environment surrounding the study area is an important asset to the region and its natural character must be preserved as much as possible.
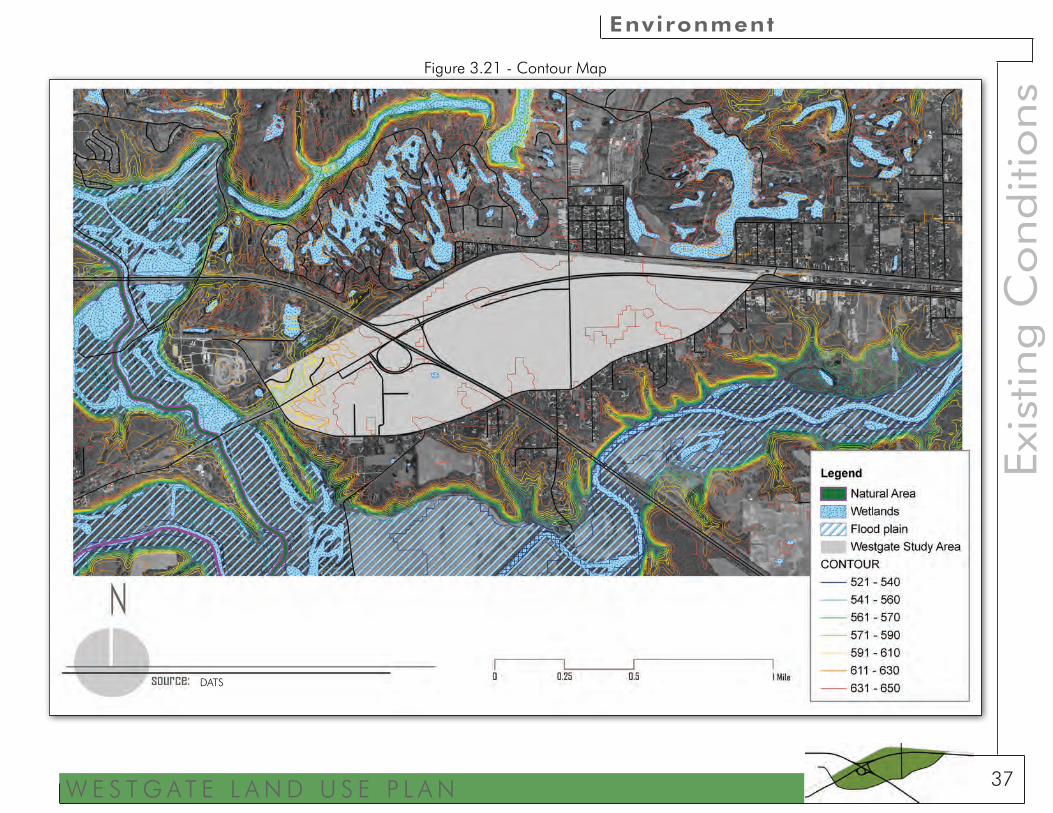
TopographyThe topography surrounding the study area has a change in elevation of approximately 130 feet from the high point within the study area to the low points north, south and west along the Salt Fork River. The topography to the north of the study area has been altered and made more dramatic through strip mining facilities that have since moved out. The mining operations created man-made elevation changes that are now being used as marketing tools for new residential development. Nearly the entire study area, with the exception of the western edge, sits approximately 650 feet above mean sea level. The dip in elevation that occurs on the western edge does have the potential to create a viewshed west to the Salt Fork River. Within the study area, slope changes very little, approximately 1%. This flat surface could cause concern for future development and may require water retention/detention facilities to move water off site and into the surrounding water bodies. A series of steep ravines exist between the study area and the Salt Fork River. This steep natural drainage pathway could be used to remove stormwater from the study area in the future. Figure 3.21 shows the contours within and surrounding the study area.
SoilsSoil characteristics are important to review, especially for an area where future development potential exists. Understanding the make-up of soils will show potential limitations and mitigation efforts that may be needed on site. Within the study area, there are eight different soil types: Strawn Silt Loam, Drummer Silty Clay Loam, Orthents Loam, Starks Silt Loam, Martinsville Loam and Silt Loam, Shaffton Loam, and Camden Silt Loam.
W E S T G A T E L A N D U S E P L A N
Exis
ting C
onditio
ns
Environment
37
Figure 3.21 - Contour Map
DATS

W E S T G A T E L A N D U S E P L A N
Exis
ting C
onditio
ns
Environment
38
The Natural Resources Conservation Service (NRCS) rates soil types based on their development potential. The soils within the study area have both “somewhat limited” and “very limited” development potential for dwellings with and without basements, as well as small commercial buildings. “Somewhat limited” indicates that the soil has properties which may be moderately favorable for some types of development, while “very limited” indicates that the soil has at least one or more specific properties that are unfavorable for some types of development. Table 3.13 shows the different soil types found in the study area, percent of the total site, development potential, and the reason for its development rating.
All of the soils in the study area have either somewhat limited or very limited development potential. The reasons provided for their limited potential are mostly related to steep slopes or the shrink/swell factor, which can have a negative effect on foundations and at-grade concrete slabs. Ratings are provided for each soil class based on the soil’s ability to withstand movement and have substantial load bearing capacity. Most of the soils are rated very low in both these categories, and therefore have limited development potential. The Starks and Drummer soil classes, which make up about 73% of the study area soils, have issues with ponding water and shallow depth to the saturated zone. Depth to the saturated zone or water table can be a significant issue if developments with basements are planned.
During the development and construction process, some of these issues can be mitigated by proper site drainage techniques and not building where slopes and grades are too steep. Figure 3.22 shows the location of each soil type in the study area.
Table 3.13 - Soil Properties
Soil Class % of Total Hydric
Development PotentialReasonDwellings w/out
BasementDwellings with
BasementSmall Commercial
Buildings
Strawn Silt Loam 4.5% No Very Limited Very Limited Very Limited Slope
Drummer Silty Clay Loam 20.5% Yes Very Limited Very Limited Very Limited Ponding, Depth to Saturated Zone
Orthents Loamy 11.5% No Somewhat Limited Somewhat Limited Somewhat Limited Slope/Shrink Swell
Starks Silt Loam 53.3% No Very Limited Very Limited Very Limited Depth to Saturated Zone
Martinsville Loam 1.3% Yes Somewhat Limited Somewhat Limited Somewhat Limited Shrink Swell
Martinsville Silt Loam 0.5% No Somewhat Limited Somewhat Limited Very Limited Slope/Shrink Swell
Shaffton Loam 0.9% No Very Limited Very Limited Very Limited Flooding
Camden Silt Loam 7.6% No Somewhat Limited Very Limited Somewhat Limited Shrink Swell

W E S T G A T E L A N D U S E P L A N
Exis
ting C
onditio
ns
Environment
39
Figure 3.22 - Soils Map
DATS

W E S T G A T E L A N D U S E P L A N
Exis
ting C
onditio
ns
Environment
40
Water ResourcesThe natural features and environment surrounding the study area are important resources, especially the quantity of water resources. Within close proximity to the study area there are lakes, rivers, streams, ponds, wetlands, and floodplains which need to be protected from any negative effects future development may have. Water resources not only provide habitat and refuge for flora and fauna, but also recreational opportunities for residents and tourists. This section will discuss the various water resources in close proximity to the study area.
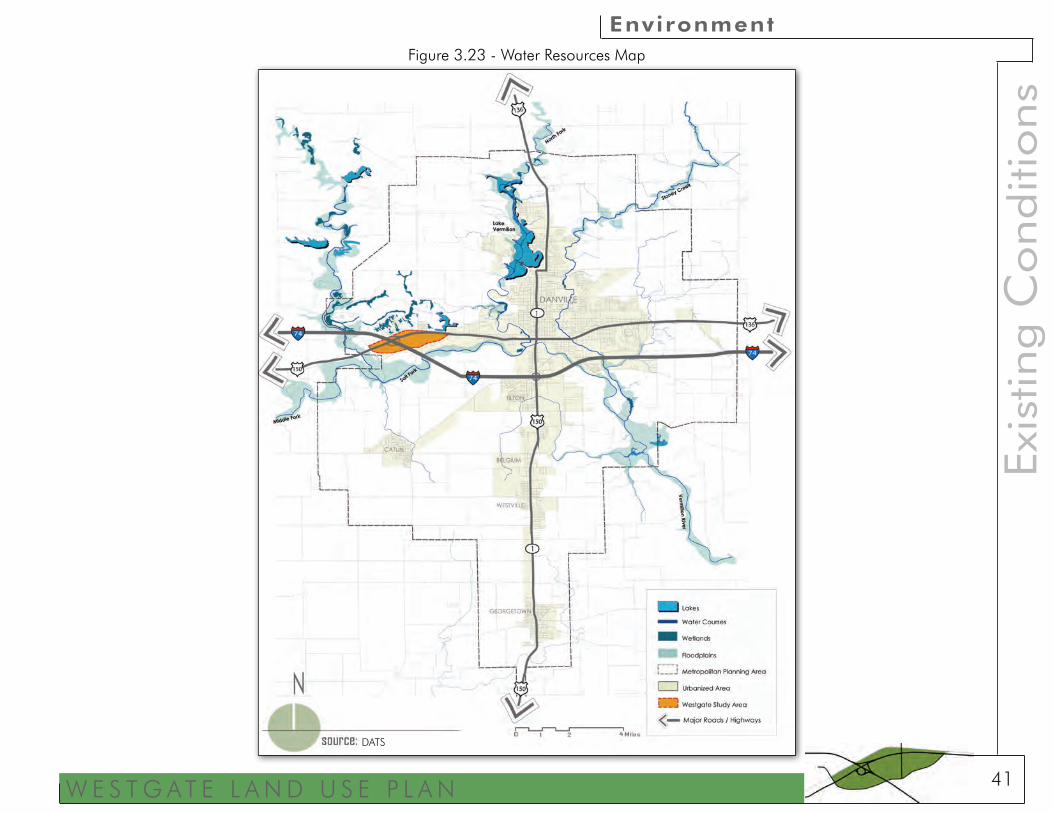
Lakes, Rivers and StreamsThere are no water resources found directly within the study area boundaries, but there are a number of larger water bodies and rivers found in close proximity. Lake Vermilion and Lake Mingo are two large recreational lakes found northeast and northwest of the study area. Also near the study area is Kickapoo State Park, which houses a series of lakes and ponds that are interconnected, providing excellent boating and fishing opportunities. The Salt Fork River loops around the study area to the west and south before connecting with the Vermilion River south of Danville. The Salt Fork River is the closest major water course to the study area, and its steep slopes provide a natural drainage path for most of the land in the study area. Figure 3.23 shows the location of major water bodies and water courses.
WetlandsLands surrounding the study area, namely to the north and northwest, were once used for strip mining operations. Once the mining operations were shut down, the numerous mining holes filled with water and created lakes, ponds and wetland areas. Wetland areas are defined, per the Clean Water Act, as areas that are inundated or saturated by surface water or groundwater at a frequency and duration sufficient to support, and under normal circumstances do support, a prevalence of vegetation typically adapted for life in saturated soil conditions (33 CFR 328.3). Wetlands provide critical habitats for vegetation and wildlife that are not found in many other locations. Wetlands also provide transitional areas between aquatic and terrestrial systems where water is able to filter through a series of vegetated areas before entering a permanent water body. This intermediate process can be important for cleaning water runoff from development or roadways before it enters the main water body. Figure 3.23 shows the locations of wetland areas near the study area.
FloodplainsWith the quantity of rivers and streams along the western and southern edges of the study area, it is no surprise that significant floodplain areas exist as well. A floodplain is defined as a lowland adjacent to a river, lake or ocean. Floodplains are typically defined by the frequency of the flood such as a 10-year, 100-year or 500-year. The frequency refers to a flood level that has a specified percent chance of being equaled or exceeded in any given year. For example, the 100-year flood occurs on average once every 100 years and therefore has 1% chance of occurring in any given year. The floodplain near the study area is categorized as a 100-year floodplain. Floodplains, similar to wetlands, are intermediary lands between terrestrial and aquatic systems that can also provide a filtering mechanism before water runoff reaches the main water body. Development within floodplain areas should also be avoided where possible because of the potential for flooding.
W E S T G A T E L A N D U S E P L A N
Exis
ting C
onditio
ns
Environment
41
Figure 3.23 - Water Resources Map
DATS

W E S T G A T E L A N D U S E P L A N
Exis
ting C
onditio
ns
Environment
42
Table 3.14 - 2006 Water Quality Assessment
Table 3.15 - 2008 Water Quality Assessment
Water QualityOne way to track the impacts of development and land alteration is to look at changes in water quality. The Illinois Environmental Protection Agency (IEPA) monitors water bodies throughout the state of Illinois every two years and makes determinations on the levels of support the water body provides to aquatic life, fish consumption, and types of contact. If the water body is unable to support aquatic life, fish consumption or contact, IEPA will typically provide a cause for the poor water quality and a source. The two branches of the Middle Fork and Vermilion Rivers were monitored in both 2006 and 2008 for their water quality. Tables 3.14 and 3.15 show the results from the two monitoring years.
The two water bodies monitored have a water quality level in both 2006 and 2008 that can support aquatic life. The Vermilion River in 2006 supported both aquatic life as well as fish consumption, but in 2008 when the river was reassessed, it was no longer supporting fish consumption. According to the IEPA report, the cause of impairment and removal of fish consumption from the use supported column was mercury. Unfortunately, the sources for impairment are not listed for either river branch, but it was noted that the additional mercury could be a result of atmospheric deposition of the toxin. The source of the fecal coliform in the Middle Fork branch was unknown in 2006 and 2008.
Since the study area is in close proximity to these two river branches, future development or transportation infrastructure improvements should be mindful of the impacts created on the water resources. Additional impervious surfaces will cause lower infiltration rates for groundwater recharge and result in additional stormwater that will need to be removed from the development site.
Water Body Branch Use Supported Cause of
ImpairmentSource of
Impairment
Vermilion River(IL-BP-04)
Aquatic Life and Fish Consumption
No Cause Identified
Source Unknown
Middle Fork Branch of Vermilion River
(IL-BPK-07)Aquatic Life Fecal Coliform Source Unknown
Water Body Branch Use Supported Cause of
ImpairmentSource of
Impairment
Vermilion River(IL-BP-04)
Aquatic Life Mercury Source Unknown
Middle Fork Branch of Vermilion River
(IL-BPK-07)Aquatic Life Fecal Coliform Source Unknown

W E S T G A T E L A N D U S E P L A N
Exis
ting C
onditio
ns
Environment
43
Natural Areas and Endangered SpeciesThe Illinois Natural Areas Inventory (INAI) was created to provide a data set for the location of high quality natural areas, habitats of endangered species and other significant features. The information provided by INAI is used during the due diligence for growth areas and support informed choices for the future development of land. The information can also be used for locating potential land for preservation by governments and private landowners alike. There are no natural areas located within the study area, but there are two natural areas in close proximity. The Middle Fork Woods Nature Preserve and Middle Fork Branch of the Vermilion River are noted as natural areas in the inventory.
One aspect of the natural areas inventory is locating sites where there is high potential for endangered species habitat. An EcoCat report was completed for the study area using the Illinois Department of Natural Resources (IDNR) web application. The EcoCat process is a quick and easy way to delineate a study area and gather a full listing of endangered species which may have habitat in or in close proximity to the chosen study area. The following is a list of species which were found through the EcoCat reporting process:• Bigeye Chub• Bluebreast Darter• Purple Wartyback• Rainbow• River Redhorse• Salamander Mussel• Wavy-Rayed Lampmussel
The endangered species noted in the EcoCat report are ones most likely found having habitat in and around the Middle Fork of the Vermilion River INAI site. The close proximity of the study area to the Middle Fork Branch gives this area a higher chance of having some endangered species habitat within it. This is important information to have for future development so that it does not disturb the natural habitats of Vermilion County’s endangered species.
State and County ParksThe nearby state and county park systems are a truly unique asset to the study area and surrounding communities. The mixture of forested lands, natural prairies, lakes, ponds, rivers, and streams makes this portion of Vermilion County a destination not only for residents of Illinois, but also for out-of-state travelers. The terrain in the parks also offers slight elevation changes, which can be difficult to find in other parts of central Illinois. Kickapoo State Park and Kennekuk County Park are the two largest parks in the region and provide recreational opportunities for walking, biking, hiking, and fishing, among many others. The two parks are easily accessible from the study area by traveling north on Henning Road and then west into either park. Forest Glen County Park, a few miles southeast of the study area, is another regional park offering hikes through naturally forested areas. The Vermilion County Fairgrounds are located just northwest of the intersection of US 150 and Batestown Road on the west side of the study area. The excellent location and connections from the study area to these natural areas makes it a prime location for nature enthusiasts and outdoor recreation. Figure 3.24 shows the location of the study area in relation to the regional parks.

W E S T G A T E L A N D U S E P L A N
Exis
ting C
onditio
ns
Environment
44
Figure 3.24 - State and County Parks Map
DATS, VCCD