Embed Size (px)
Citation preview

31.1 / S. S. Kim
31.1: Invited Paper: World’s First 240Hz TFT-LCD Technology for Full-HD LCD-TV and Its Application to 3D Display
Sang Soo Kim*, Bong Hyun You, Heejin Choi, Brian H. Berkeley*, Dong Gyu Kim, and Nam Deog Kim
LCD Business, Samsung Electronics Co., Ltd. Asan-Si, Chungcheongnam-Do, Korea
* Technology Center, Samsung Mobile Display Co., Ltd. Yongin-Si, Gyeonggi-Do, Korea
Abstract A full-HD (FHD) liquid crystal display TV (LCD-TV) has been enhanced by increasing the panel’s frame rate to 240Hz, and this 240Hz driving technology has been applied to 3D TV. Compared to a 120Hz LCD, the 240Hz LCD has two challenges: 1) half of the available pixel charging time, and 2) three times as many interpolated frames. A new architecture has doubled the available pixel charging time by means of a half-gate two-data (hG-2D) driving scheme and a charge-shared super PVA (CS S-PVA) pixel structure. Additionally, a 240Hz ME/MC algorithm has been implemented on the LCD module to convert 60Hz incoming frames into 240Hz frames. Motion picture response time (MPRT) of the new LCD-TV has been measured as 4.7msec, which is similar to the MPRT for a cathode ray tube (CRT) TV.
1. Introduction Motion blur in LCDs mainly arises from the LCD’s inherent hold type driving method, and is considered to be one of the most significant causes of moving picture image degradation. Recently, due to rapid advances in image processing and LCD driving technology, double speed (120Hz/100Hz) driving with motion estimation (ME) and motion compensation (MC) has became popular as a means of improving motion image quality [1]. However, the MPRT of 120Hz LCDs is on the order of 7-8ms, which is similar to that of plasma display panels (PDPs). Motion image quality of LCDs has still been considered to be inferior to other display devices, especially CRTs. As a result, the need for high speed driving beyond 120Hz has been noted. In this work, we report the world’s first 240Hz LCD-TV panel, which has been developed by adopting a half-gate two-data (hG-2D) and charge-shared super PVA (CS S-PVA) pixel structure and advanced driving scheme [2-3]. The concept of 240Hz ME/MC driving is shown and compared to conventional 120Hz ME/MC driving in figure 1. With 240Hz driving, three interpolated frames are inserted between the two original 60Hz frames. The extra frames result in hold time which is half that of a 120Hz-driven LCD, which should result in further reduction of motion blur. However, it is not enough to simply send twice as many frames to the panel. To benefit from this extra data, the LCD module must be completely re-architected from its input interface to the pixel structure.
2. Pixel Structure and Driving Method 2.1 hG-2D CS S-PVA pixel structure To achieve 240Hz driving of a Super-PVA panel, the first point that must be considered is to find a suitable countermeasure for insufficient pixel charging time. Figure 2 shows a graph of pixel
charging time for HD, FHD, and UD resolutions driven at 60Hz, 120Hz, and 240Hz frame rates. Figure 2 shows that charging time for FHD at 240Hz would only be 3.7μs for conventional driving methods. This time is insufficient for charging of a-Si thin film transistors (TFTs) on a large area panel. Moreover, the S-PVA pixel structure for wide viewing angle also needs two different data values (low and high gamma) for a single pixel. Therefore, to drive the LCD panel at 240Hz while maintaining a single bank of column drivers, available charging time must be doubled.
1/120sec1/120sec
OriginalFrames
(a) 120Hz frame rate driving
1/240sec1/240sec
OriginalFrames
(b) 240Hz frame rate driving
Figure 1. Comparison of 120Hz ME/MC and 240Hz ME/MC
To meet this need, the 240Hz LCD panel incorporates hG-2D driving and a CS S-PVA pixel structure to double the available charging time without loss of angle of view. The principle of CS S-PVA pixel driving is shown in figure 3. In the S-PVA structure, one pixel is composed of low gamma (brighter) and high gamma (darker) sub-pixels to widen the viewing angle. As a result, the S-PVA structure requires two separate data for the two sub-pixels. The CS S-PVA pixel structure has solved this problem by adopting a charge sharing scheme via the Cdown capacitance. In figure 3, one pixel data is charged simultaneously to sub-pixel A
Interpolated frame
Interpolated frames
ISSN/009-0966X/09/3901-0424-$1.00 © 2009 SID424 • SID 09 DIGEST

31.1 / S. S. Kim
(low gamma, high brightness) and sub-pixel B (high gamma, low brightness) while the gate-on signal GN turns on TFT1 and TFT2. Then, the next line’s gate signal (GN+1) turns on the next line’s TFTs, but also TFT3 to move a portion of the charge from sub-pixel B to Cdown. As a result, sub-pixel B becomes darker than sub-pixel A due to the shared (reduced) charge into Cdown, and S-PVA driving is achieved with only a single data value.
Ava
ilabl
e C
harg
ing
Tim
e(μ
s)
25
20
15
10
5
060Hz
(16.7ms)120Hz
(8.3ms)180Hz
(5.5ms)240Hz
(4.1ms)
Frame Rate (frame time)
7.4
3.7
2.5 1.8
UD
14.8
7.4
4.93.7
FHD14.8
7.4
4.93.7
14.8
7.4
4.93.7
FHD
20.7
10.4
HD20.7
10.4
20.7
10.4
HD
120Hz UD(hG-2D)
2x
240Hz FHD(hG-2D)
2x
Figure 2. Pixel charging time of HD, FHD, and UD resolutions
at various frame rates
Figure 3. Principle of CS S-PVA scheme
Use of hG-2D to drive one pixel with a single data value has increased available charging time for one pixel from 3.7μs to 7.4μs, which is same as the time for 1G-2D FHD 120Hz as shown in figure 2. In the hG-2D driving scheme, two gate lines are turned on at the same time, and pixel data on each line is provided by two separate data lines. Therefore, it is possible to charge all pixels of two gate lines simultaneously and the charging time for each line is doubled (3.7μs 7.4μs). Although the CS S-PVA and hG-2D methods were introduced in our 82” UD display [4], in the proposed 240Hz driving scheme, a more advanced topology uses a separate charge-sharing (CS) signal to control CS timing
instead of using the gate-on signal of next line (GN+1). The gate driver supplies CS control signals through additional output channels as shown in fig.4. Therefore, this new method enables simpler panel design which does not require a bridge line between gate lines.
Figure 4. CS S-PVA panel structure with hG-2D driving and separate CS control
2.2 240Hz ME/MC and panel driving scheme To drive a panel at 240Hz, three frames must be interpolated for every incoming 60Hz frame. The 240Hz frame stream consists of double the data of 120Hz driving; therefore a more advanced interface must be used between the timing controller (TCON) and LCD panel. The new FHD 240Hz driving scheme has evolved in two steps. Figure 5 shows the first step, which uses two frame rate converters (FRCs) and two TCONs, each of which were originally optimized for FHD 120Hz driving.
Figure 5. 240Hz ME/MC driving architecture (step 1)
GN
GN+1
Cst(A) Clc(A)
Cst(B) Clc(B)
TFT2
TFT1
TFT3
Cdown
to TFT3 of GN-1
Sub-pixel A
Sub-pixel B
Data
VA
VB
H L
HL
H L
H L
HL
HL
GN
CSN
GN+1
CSN+1
GN+2
CSN+2
GN+3
CSN+3
H L
H L
H L
H L
H L
HL
SID 09 DIGEST • 425
31.1 / S. S. Kim
In this structure, the two FRCs are dedicated to the left and right halves of the FHD screen. The pixel frequency of FHD 120Hz is the same as half-FHD 240Hz, and the re-programmed FRCs are therefore capable of generating half-FHD data streams at 240Hz. Because each FRC provides an interpolated stream for only half of the screen, care must be taken to avoid artifacts near the panel’s centerline. To prevent such artifacts, motion vector information from the right side of the screen is needed by the left FRC engine, and vice versa. In fig. 5, each FRC engine receives the full screen incoming 60Hz FHD data stream by way of an LVDS repeater, which duplicates the entire input signal. Then the two FRCs generate interpolated frames for the left (columns 1-960) and right (columns 961-1920) halves of the screen, transmitting the results to each TCON using an LVDS interface. Each TCON sends its data to the panel’s column drivers by way of an advanced intra-panel interface (AiPi) [5]. AiPi is a point to point interface which uses clock-embedded differential signaling. It enables the pixel data to be transmitted at 800Mbps, which reduces the number of required signal lines.
Figure 6. 240Hz ME/MC driving architecture (step 2)
The next step (step 2) is to implement the 240Hz system using a single FRC and a single 240Hz TCON, as depicted in figure 6. In the step 2 structure, no LVDS repeater is needed because a full screen of 240Hz ME/MC data is processed in a single FRC chip. Driving of the 240Hz panel is performed by a single TCON which uses a V-by-One interface at its input and AiPi at its output. Table 1 compares the number of signal lines required by mini-LVDS and AiPi interfaces, and between existing LVDS and V-by-One interfaces. V-by-One® HS is a new interface technology developed by THine Electronics Co. Like AiPi, V-by-One uses an embedded clock to eliminate clock-data skew, enabling greatly increased bandwidth compared to LVDS. Since the 240Hz FRC
and TCON have the same amount of input/output pixel data as in step 1 (two FRCs and TCONs), changing the interface is essential to reasonably manage the number of I/O pins and the package size. With those improvements, the 240Hz driving scheme of step 2 is simpler, with less logic devices and lower ASIC count.
Table 1. Technology comparison for external(TCON input) and internal (TCON output to LCD driver) interfaces
Conventional Technology
Advanced Technology
Number of signal lines between FRC and TCON
LVDS 96 lines
V-by-One 16 lines
Numbers of signal lines between TCON(s) and panel
m-LVDS 112 lines
AiPi 64 lines
3. Motion Picture Quality of 240Hz LCD As noted, the 240Hz LCD module was developed to improve motion picture quality. MPRT is a common method used to quantify the amount of motion blur in a display. MPRT of the 240Hz LCD was measured and compared with other devices. For best picture quality, a new overdriving method was also adopted. To make the comparison, MPRT of 60 and 120Hz LCDs was measured at various scroll speeds, and a 29-inch flat CRT TV was also used for the test. MPRT measurements were based on blurred edge time (BET), and the results are shown in figure 7. As the figure shows, MPRT of the 240Hz LCD is 4.7ms at a scroll speed of 12ppf, which is even better than that of the CRT. This is a significant result, showing that LCD motion picture quality has finally surpassed CRT performance.
20181614121086420 8 ppf 12 ppf 16 ppf
MPR
T (m
sec)
Scroll Speed (pixel/frame)
60Hz16.615.7 15.7
60Hz60Hz16.615.7 15.7
120Hz11.08.6 9.4
120Hz120Hz11.08.6 9.4
CRT6.9 6.55.0
CRTCRT6.9 6.55.0
240Hz5.94.7 4.7240Hz240Hz5.94.7 4.7
Figure 7. MPRT of 60Hz/120Hz/240Hz LCDs and CRT
4. 3D Display with 240Hz LCD Additionally, in the proposed 240Hz LCD-TV, it is also possible to deliver 3D functionality without any loss of resolution by using LC shutter glasses and providing the left eye and right eye images by time sequential driving as shown in figure 8. Conventionally, 120Hz LCD driving is not suitable for a 3D display using LC shutter glasses because of crosstalk due to progressive scanning. With the 240Hz LCD-TV, however, it is possible to minimize the crosstalk between the left eye and right eye images by image processing using twice as many frames as the 120Hz driving scheme. Therefore, the 240Hz LCD-TV has many attractive points for the consumer, as it not only provides superior motion picture image quality, but it can also provide an uncompromised 3D experience using LC shutter glasses.
426 • SID 09 DIGEST

31.1 / S. S. Kim
Scan
RR
L R
Scan
ScanningRight-eye data
DisplayRight-eye data
ScanningBlack data
Shutter glassesR
Scan
RR
L
R
L R
Scan
ScanningRight-eye data
DisplayRight-eye data
ScanningBlack data
Shutter glassesR
(a) Display of right eye image
L
R
ScanningLeft-eye data
DisplayLeft-eye data
L
Scan
Scan
L
ScanningBlack data
Shutter glassesL
L
R
L
R
ScanningLeft-eye data
DisplayLeft-eye data
L
Scan
Scan
L
ScanningBlack data
Shutter glassesL
(b) Display of left eye image
Figure 8. 3D display based on 240Hz driving technology with LC shutter glasses
Figure 9. World’s first 240Hz LCD-TV exhibited at Korea Electronics Show 2008
Table 2. Specifications of 240Hz LCD-TV
5. Conclusion A true 240Hz FHD LCD-TV has been developed by using hG-2D driving, the CS S-PVA pixel structure, and a 240Hz ME/MC driving scheme based on a new interface. Pixel data are actually updated 240 times per second, thereby avoiding ghost images and other issues associated with so-called 240Hz hybrid techniques. MPRT of the new 240Hz LCD-TV has been measured at 4.7ms, providing a level of motion picture quality comparable to that of CRTs. Moreover, this 240Hz LCD driving technology makes it possible to deliver a full resolution 3D display by using LC shutter
glasses, thereby enabling 3D to become mainstream technology for television. This 240Hz LCD-TV panel, the world’s first, was demonstrated at IFA’08 and at KES’08 as shown in figure 9. Specifications of the 240Hz panel are summarized in Table 2.
6. References [1] S. S. Kim, B. H. You, N. D. Kim, and B. H. Berkeley, “Novel
120-Hz TFT-LCD motion-blur-reduction technology with integrated motion-compensated frame-interpolation timing controller”, Journal of the SID 16/3, p. 403-413 (2008).
[2] S. S. Kim, B. H. Berkeley, and T. S. Kim, “Advancements for highest performance LCD-TV”, SID Symposium Digest Tech. Papers 37, p. 1938-1941 (2006).
[3] S. S. Kim, “The world’s largest (82-in.) TFT-LCD”, SID Symposium Digest Tech. Papers 36, p. 1842-1847 (2005).
[4] S. S. Kim, B. H. You, J. H. Cho, D. G. Kim, B. H. Berkeley, and N. D. Kim, “An 82-in. ultra-definition 120-Hz LCD TV using new driving scheme and advanced Super PVA technology”, Journal of the SID 17/2, p. 71-78 (2009).
[5] H. S. Nam et al., “Cost effective 60Hz FHD LCD with 800Mbps AiPi Technology”, SID Symposium Digest Tech. Papers 39, p. 677-680 (2008).
Resolution 1920 x 1080 (full HD)
Brightness 500cd/m2
Contrast Ratio 3,000:1 (static)
Color Gamut 72% of NTSC (CIE 1976)
Number of Colors 1.07B
Response Time 4.7ms (MPRT)
Viewing Angle 180° in all directions
SID 09 DIGEST • 427
31.2 / D. Suzuki
31.2: Crosstalk-Free 3D Display with Time-Sequential OCB LCD Daiichi Suzuki, Tetsuo Fukami, Emi Higano, Naoya Kubota, Toshiyuki Higano,
Seiji Kawaguchi, Yuuki Nishimoto, Kazuhiro Nishiyama, Kenji Nakao, Research & Development Center, Toshiba Matsushita Display Technology Co., Ltd.,
26-2 Kawakita Nomi, Ishikawa, 923-1296, Japan
Takayoshi Tsukamoto, Hirofumi Kato PC&AV-USE LCD Division, Toshiba Matsushita Display Technology Co., Ltd.,
1-9-2 Hatara Fukaya, Saitama, 366-0032, Japan
Abstract We have developed high quality 3D display system with time-sequential OCB LCD. That is 3D display of 15.4 inch WXGA panel without the problem of 3D crosstalk, pseudoscopy and 3D moiré. Fast response OCB LCDs were used for both the panel and active shutter glasses and improved blinking backlight control technology was applied.
1. Introduction Recently the market of 3-dimentional (3D) system (stereoscopic
and auto-stereoscopic displays) has been rapidly expanding worldwide. This is thought to be due to the increasing 3D contents, such as 3D cinema. This has brought the demand for 3D displays. The various types of 3D displays have been proposed. However, many 3D displays have big problems: loss of spatial resolution, 3D crosstalk (ghosting), pseudoscopy (reverse image) and 3D moiré [1-5]. The types of 3D system using LCD are mainly grouped into 2 types: one is area-division type and the other is time-sequential. The former has the problem of the loss of spatial resolution, occurrence of pseudoscopy, difficulty in switching 2D/3D display, and 3D moiré (especially in the type of autostereoscopic display without 3D glasses). On the other hand, the latter with active glasses has neither the loss of spatial resolution, nor the 3D moiré between pixels and barrier. Therefore the time sequential system is suitable for high quality 3D display. However, this system can not be realized with conventional LCDs, because their response is not fast enough. Since the time-sequential 3D system requires higher frame rate than 2D display, in the case of slow response, the luminance is low and 3D crosstalk becomes worse.
Recently, we have developed OCB (Optically Compensated Bend [6]) LCD with very fast response and realized high performance of moving picture quality, MPRT=2.0ms, using blinking backlight system[7-11].
In this paper we have applied the OCB LCD to the time-sequential 3D display to realize high quality 3D display.
2. Application of OCB to 3D system 2.1. 3D system The 3D system we have developed is binocular vision system
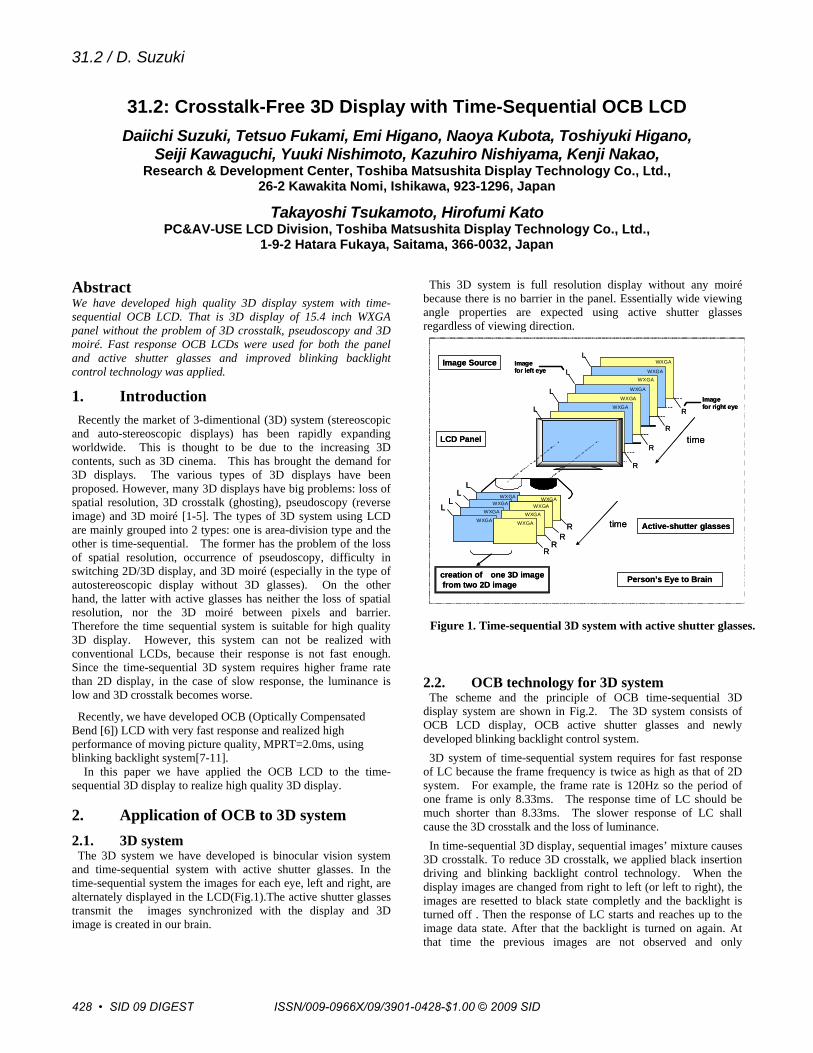
and time-sequential system with active shutter glasses. In the time-sequential system the images for each eye, left and right, are alternately displayed in the LCD(Fig.1).The active shutter glasses transmit the images synchronized with the display and 3D image is created in our brain.
This 3D system is full resolution display without any moiré because there is no barrier in the panel. Essentially wide viewing angle properties are expected using active shutter glasses regardless of viewing direction.
2.2. OCB technology for 3D system The scheme and the principle of OCB time-sequential 3D
display system are shown in Fig.2. The 3D system consists of OCB LCD display, OCB active shutter glasses and newly developed blinking backlight control system. 3D system of time-sequential system requires for fast response
of LC because the frame frequency is twice as high as that of 2D system. For example, the frame rate is 120Hz so the period of one frame is only 8.33ms. The response time of LC should be much shorter than 8.33ms. The slower response of LC shall cause the 3D crosstalk and the loss of luminance. In time-sequential 3D display, sequential images’ mixture causes
3D crosstalk. To reduce 3D crosstalk, we applied black insertion driving and blinking backlight control technology. When the display images are changed from right to left (or left to right), the images are resetted to black state completly and the backlight is turned off . Then the response of LC starts and reaches up to the image data state. After that the backlight is turned on again. At that time the previous images are not observed and only
RR
RR
LL WXGA
LWXGA
L
WXGA
Active-shutter glassesWXGAWXGA
WXGA
WXGAWXGA
R
R
R
RL
L
L
L
Imagefor right eye
Imagefor left eye
LCD Panel time
Image Source WXGA
WXGAWXGA
WXGA
WXGA
WXGA
time
creation of one 3D imagefrom two 2D image Person’s Eye to Brain
RR
RR
LL WXGAWXGA
LWXGAWXGA
L
WXGAWXGA
Active-shutter glassesWXGAWXGAWXGA
WXGA
WXGAWXGA
R
R
R
RL
L
L
L
Imagefor right eye
Imagefor left eye
LCD Panel time
Image Source WXGA
WXGAWXGA
WXGA
WXGA
WXGA
time
creation of one 3D imagefrom two 2D image Person’s Eye to Brain
Figure 1. Time-sequential 3D system with active shutter glasses.
428 • SID 09 DIGEST ISSN/009-0966X/09/3901-0428-$1.00 © 2009 SID

31.2 / D. Suzuki
the correct images can be seen. In this way the reduction of the images’ mixture can be realized and we can achieve small 3D crosstalk.
The OCB mode is well-known for its fast response. We have newly developed LC material to improve the response time of OCB (Fig.3), τr+τd=3ms. The rise time from all gray level to black is very fast, < 0.26ms (Fig.4). This means display image can be resetted immediately and it make no influence to next image. In this case very small 3D crosstalk is achieved. The fast decay time from black to any gray level means high luminance of 3D display because of the high effective aperture in time range of LC response. We can get high luminance 3D display using OCB. In case of other LC mode, large 3D-crosstalk will appear
because the response time to the black is not so fast. Also, the brightness is very low because the time to the white is not fast. The demand for 3D active shutter glasses is the same as that for
the LCD panel, that is, fast response of LC. The slow LC response shall cause the 3D-crosstalk and shortage of luminance. So we also applied OCB to active-shutter glasses.
3. Results of 3D quality’s evaluation 3.1. Definition of 3D crosstalk There are many quantitative parameters for 3D quality, such as
3D crosstalk, pseudoscopy and 3D moiré. Among them the 3D crosstalk is one of the most important parameter to discuss the 3D quality. The 3D crosstalk means a ratio of incorrect, for opposite eyes, images’ luminance to white luminance. Large 3D crosstalk means that much incorrect image is visible and results in double image (ghosting). That is obstacle to viewing 3D images and it might introduce disturbing to visual fatigue. We have evaluated 3D quality in 3D crosstalk, pseudoscopy and
3D moiré. We defined the 3D crosstalk ratio as below (shown in Fig. 5 in detail).
3D crosstalk ratio (%) = (B-C)/(A) ×100
A: the luminance through active shutter glass for left (or right) eye when white level for both eyes is displayed in LCD panel.
Figure 4. Response of OCB (gray to gray).
12345678
1 23 4 5 6 7 8
0
1
2
3
4
5
Start level End level
Whit eWhit e
Black
Response Time(ms)
at room temperature12345678
1 23 4 5 6 7 8
0
1
2
3
4
5
Start level End level
Whit eWhit e
Black
Response Time(ms)
at room temperature
Worst:0.26ms(White→ Black)
12345678
1 23 4 5 6 7 8
0
1
2
3
4
5
Start level End level
Whit eWhit e
Black
Response Time(ms)
at room temperature12345678
1 23 4 5 6 7 8
0
1
2
3
4
5
Start level End level
Whit eWhit e
Black
Response Time(ms)
at room temperature
Worst:0.26ms(White→ Black)
Figure 3. Response of newly developed OCB (τr+τd=3ms).
00.10.20.30.40.50.60.70.80.9
11.1
0 1 2 3 4 5 6 7 8 9 10 11 12 13 14 15 16 17 18Time ms
Nor
mal
ized
Bri
ghtn
ess
( )
00.10.20.30.40.50.60.70.80.9
11.1
0 1 2 3 4 5 6 7 8 9 10 11 12 13 14 15 16 17 18Time ms
Nor
mal
ized
Bri
ghtn
ess
( )
OCB-panel
OCB active shutter glasses
for Right Eye
for Left Eye
Backlight
Time
Transmittance
OPEN CLOSE OPEN CLOSE
ON ON ON ON
OPENCLOSE OPENCLOSE
R L R L
OCB-panel
OCB active shutter glasses
for Right Eye
for Left Eye
Backlight
Time
Transmittance
OPEN CLOSE OPEN CLOSE
ON ON ON ON
OPENCLOSE OPENCLOSE
R L R L
Figure 2. Scheme of OCB 3D-system.
SID 09 DIGEST • 429

31.2 / D. Suzuki
B: the luminance through active shutter glass for left (or right) eye when white level is displayed for opposite right (or left) eye, black level is displayed for left (or right) eye in LCD panel. C: the luminance through active shutter glass for left (or right) eye when black level for both eyes is displayed in LCD panel. According to the definition, pseudoscopy (reverse image) occurs in the case over 50% of 3D crosstalk ratio.
3.2. Experimental Results We have measured 3D crosstalk ratio in all viewing angle. We used the luminance meter and goniometer to measure the characteristics of viewing angle. The active shutter glass is set in the front of the luminance meter. The experimental result is in Fig. 6. This is the data of 15.4 inch WXGA OCB panel. The 3D crosstalk ratio is only 0.08% of the normal direction at the center of the panel. This value is very low and almost the same as the visibility thresholds [12]. Angular dependence of the 3D crosstalk ratio is almost the same and less than 0.14% in wide viewing angle. At the same time, there is no pseudoscopy. We would like to declare that our panel is the "crosstalk-free"
3D display system.
Of course the 3D moiré does not occur at all. That is clearly natural because there is no barrier (special lattice pattern) to create 3D pictures, which causes 3D moiré. It is different from other 3D display (especially in auto-stereoscopic 3D system).
3.3. Prototype specification Table 1 shows the specification of the prototype 15.4 inch OCB 3D with time-sequential system. The definition of 3D-luminance is the luminance through the active shutter glass when white level is displayed in the LCD panel. The luminance of 3D image is lower than the luminance of 2D image. However both of brightness sense is about same, because the human eye adapts to its viewing environment. The brightness sense becomes the brightness in the adaptation field.
Table 1. Specification of 15.4 inch OCB 3D system
400 cd/m22D-Luminance
0.08% at normal direction<0.14% in polar 60°
3D-Crosstalk ratio
no occurrencefrom all viewing angle
Pseudoscopy
120 cd/m23D-Luminance
1280RGB×800Pixel Format
no occurrencefrom all viewing angle
3D Moiré
15.4inchDiagonal Size
Specification
400 cd/m22D-Luminance
0.08% at normal direction<0.14% in polar 60°
3D-Crosstalk ratio
no occurrencefrom all viewing angle
Pseudoscopy
120 cd/m23D-Luminance
1280RGB×800Pixel Format
no occurrencefrom all viewing angle
3D Moiré
15.4inchDiagonal Size
Specification
※the luminance through active shutter glass
※
Figure 6. Measurement result of 3D crosstalk ratio.
0.01
0.1
1
10
100
- 60 - 50 - 40 - 30 - 20 - 10 0 10 20 30 40 50 60Polar Angle(deg.)
3D c
ross
talk
ratio
(%)
azimuth 0° - 180°azimuth 45°azimuth 90°azimuth - 45°
0°90°
LCD
0.08%
0.14%
0.01
0.1
1
10
100
- 60 - 50 - 40 - 30 - 20 - 10 0 10 20 30 40 50 60Polar Angle(deg.)
3D c
ross
talk
ratio
(%)
azimuth 0° - 180°azimuth 45°azimuth 90°azimuth - 45°
0°90°
LCD
0.08%0.08%
0.14%0.14%
Image forLeft eye
Image forRight eye
White/White(Luminance=A)
Black/White(Luminance=B)
Black/Black(Luminance=C)
active-shutterglasses
Luminancemeter
3D crosstalk ratio (%) = (B-C)/A× 100
panel
images displayed in the panelImage forLeft eye
Image forRight eye
White/White(Luminance=A)
Black/White(Luminance=B)
Black/Black(Luminance=C)
active-shutterglasses
Luminancemeter
3D crosstalk ratio (%) = (B-C)/A× 100
panel
images displayed in the panel
Figure 5. The definition of 3D crosstalk ratio.
430 • SID 09 DIGEST

31.2 / D. Suzuki
4. Conclusion We have realized high quality 3D display system using time-
sequential OCB LCD. This is 3D crosstalk-free, no pseudoscopy, no 3D moiré in wide viewing angle. It was achieved by fast response OCB panel, fast response OCB active shutter glasses and newly developed blinking backlight control.
5. References [1] G. Hamagishi, K. Taira, K. Izumi, S. Uehara, T. Nomura, K.
Mashitani, A. Miyazawa, T. Koike, A. Yuuki, T. Horikoshi, Y. Yoshihara, Y. Hisatake, H. Ujike, Y. Nakano, “Ergonomics for 3D Displays and Their Standardization”, IDW'08 Proc., pp.1099-1102, 2008.
[2] K. Taira, G. Hamagishi, K. Izumi, S. Uehara, T. Nomura, K. Mashitani, A. Miyazawa, T. Koike, A. Yuuki, T. Horikoshi, Y. Hisatake, H. Ujike, Y. Nakano, “Variation of Autostereoscopic Displays and Their Measurement”,IDW'08 Proc., pp.1103-1106, 2008.
[3] S. Uehara, K. Taira, G. Hamagishi, K. Izumi, T. Nomura, K. Mashitani, A. Miyazawa, T. Koike, A. Yuuki, T. Horikoshi, Y. Hisatake, H. Ujike, “Methodology of Optical Mesurement for Autostereoscopic Displays”, IDW'08 Proc., pp.1107-1110, 2008.
[4] A. Yuuki, S. Uehara, K. Taira, G. Hamagishi, K. Izumi, T. Nomura, K. Mashitani, A. Miyazawa, T. Koike, T. Horikoshi, H. Ujike, “Viewing Zones of Autostereoscopic Displays and their Measurement Methods”, IDW'08 Proc., pp.1111-1114, 2008.
[5] T. Koike, A. Yuuki, S. Uehara, K. Taira, G. Hamagishi, K. Izumi, T. Nomura, K. Mashitani, A. Miyazawa, T.
Horikoshi, H. Ujike, “Measurement of Multi-view and Integral Photography Displays Based on Sampling in Ray Space”,IDW'08 Proc., pp.1115-1118, 2008.
[6] T. Miyashita, P. Vetter, M. Suzuki, Y. Yamaguchi, T. Uchida, “Wide Viewing Angle Display Mode for Active Matrix LCD Using Bend Alignment Liquid Crystal Cell”, Eurodisplay‘93 Conf. Proc., pp.149-152, 1993.
[7] K. Kumagawa, A. Takimoto, H.Wakemoto, “Fast Response OCB-LCD for TV Applications” SID’02 Symposium Digest, pp.1288-1291, 2002.
[8] K. Nakao, D. Suzuki, T. Kojima, M. Tsukane, H. Wakemoto, “High-Speed Bend Transition Method using Electrical Twist Field in OCB Mode TFT-LCDs”, SID’04 Symposium Digest, pp.1416-1419, 2004.
[9] K. Nishiyama, M. Okita, S. Kawaguchi, K. Teranishi, R. Takamatsu, “32”WXGA LCD TV using OCB Mode, Low Temperature p-Si TFT and Blinking Backlight Technology” SID’05 Symposium Digest, pp.132-135, 2005.
[10] K. Nakao, Y. Tanaka, H. Takahara, S. Kawaguchi, K. Nishiyama, S. Araki, A. Takimoto, “OCB-LCDs with New Driving Method Having Fast Response of 2.3-ms MPRT and High Contrast Ratio of 1000:1”, SID’07 Symposium Digest, pp.138-141, 2007.
[11] S. Araki, K. Nakao, S. Kawaguchi, Y. Nishimoto, K.Nishiyama, K. Shiiba, A.Takimoto, “High Contrast, Low MPRT OCB LCD with Dynamic Backlight Control Technology”, SID’08 Symposium Digest, pp.975-978, 2008
[12] S.Pastoor, “Human Factors of 3D Imaging: Results of Recent Research at Helnrich-Hertz-Institut Berlin”, IDW’95 Proc., pp.69-72, 1995
SID 09 DIGEST • 431

31.3 / S. Uehara
31.3: Reduction and Measurement of 3D Moiré Caused by Lenticular Sheet and Backlight
Shin-ichi Uehara, Tsutomu Hiroya, Kouji Shigemura, and Hideki Asada NEC LCD Technologies, Ltd., Kawasaki, Kanagawa, Japan
Abstract We found that interference between a 3D display's lenticular sheet and backlight prism sheet causes 3D moiré. This previously unknown phenomenon affects image quality. Its mechanism, reduction methods and their implementation results are described. An appropriate measurement method for 3D moiré is also proposed.
1. Introduction With the improvement in the performance of displays, such as LCDs and PDPs, a variety of 3D displays not requiring special glasses, that are often known as autostereoscopic displays, have recently been developed for entertainment, medical, design, and other applications. In order to show the performance of autostereoscopic displays, the certification of space for viewing 3D images is considered to be essential. This space is called as QSVS (Qualified Stereoscopic Viewing Space) [1] [2], and 3D moiré is one of the significant factors that determine the QSVS. In order to evaluate the 3D moiré correctly, careful consideration of the cause of 3D moiré is required, otherwise the performance would not be shown correctly, thus misleading the development of 3D displays, such as by improvement of undesirable performance or meaningless competition in specifications. In general, 3D moiré is considered to be caused by the combination of the optical components, e.g. a lenticular, and a pixel structure, e.g. black matrix. In addition, in our previous work, we found that a combination of a reflector with a rough surface and a lenticular causes 3D moiré in reflective displays [3]. In this paper, we describe a previously unknown 3D moiré caused by interference between the backlight structure and a lenticular sheet for 3D display. We also describe its reduction methods and their implementation result. We propose appropriate measurement methods for 3D moiré, which are especially important for establishment of the international standards, which are being developed by many organizations for standardization, such as ISO, IEC, ICDM and so on.
2. 3D moiré and its reduction methods 2.1. 3D moiré 3D moiré is generated by an interference of the optics for autostereoscopy, such as a lenticular, and a display structure. 3D moiré is considered to be a kind of moiré in a wide sense. When its spatial frequency is high, e.g. in the case of slant lenticular, it looks like a moiré on ordinary 2D displays, which often appear when layers of grids are overlapped. The moiré on 2D displays is patterns of intensity variations superimposed on the screen image. For example, ISO9241-303 defines that moiré is a regular image superimposed on the intended image, and that they can appear as ripples, waves and intensity variations that are superimposed on the screen image. In this case, conventional measurement methods can be applied. However, in some cases, the spatial frequency of a 3D moiré will be lower, and its appearance is quite different from that of the moiré on ordinary 2D displays. In this case, luminance angular fluctuation increases, causing the uniformity on the screen to be degraded, that is, what is called a black band or banding. 3D moiré is considered to be a complex phenomenon of various spatial frequencies induced by various factors of 3D displays. Since autostereoscopic displays have the function of parallax view, the optical components and the display structures make 3D moiré unavoidable. In order to consider the factors of 3D moiré, the complex refractive index is effective, as shown in Figure 1. (a) The imaginary part indicates the absorption, which is
related to the black matrix. Interference between the black matrix and the optical components sometimes causes luminance 3D moiré, because the black matrix doesn’t emit light.
Figure 1. Factors of 3D moiré
(c) Reflection by Reflector
Reflector
)()( λλ ikn +
(d) Refraction on Prism Sheet
(b) Absorption Dispersion by Color Filters
Color Filters
Prism Sheet (Backlight)
Lenticular Lens
(a) Absorption by Black Matrix
Black Matrix
ISSN/009-0966X/09/3901-0432-$1.00 © 2009 SID432 • SID 09 DIGEST

31.3 / S. Uehara
(b) When the imaginary part has the dispersion in wavelength,
such as color filters, chromaticity variations, called chromaticity 3D moiré, sometimes occur. In addition, when the array direction of same colors is not parallel to the direction of lens effect, chromaticity 3D moiré will be undesirable.
(c) The real part represents the refraction and the reflection, including the direction of rays. Reflection is related to the rough reflector. In our previous work, we found that a combination of the micro structure on the reflector and a lenticular lens gives rise to luminance 3D moiré. In order to avoid this, we optimized the micro structure and the lenticular lens, and then we have developed a high-quality reflective type [3] and a transflective type of 2D and 3D display [4].
(d) Refraction is related to backlight structure, which is the main topic described in this paper. In addition, the 3D moiré caused by a lenticular and a backlight is also interesting in that its factors are situated on both of the outer sides of the LCD panel.
The structure of a 3D LCD with a lenticular and a backlight is shown in Figure 2. In general, a backlight has various optical sheets, such as light guide or prism sheets, which have roughness patterns on the surface to idealize the optical property. These patterns are composed of many slopes of different angles whose light distributions are different. This means that the optical sheet is a gathering of various different distributions microscopically.
For example, as shown in Figure 3, the prism sheet has two kinds of slopes whose angles of inclination are different, which means that the optical distribution on the left slope of each prism is different from that on the right slope. In addition, the light output from each slope is non-lambertian. Therefore, a lens-type 3D display has a close relation between the angle of light output from a lens and a region on the prism, such as the left or right slopes. As shown in Figure 4(a) and Figure 4(b), when the region which corresponds to an angle of parallel light is narrower than the prism pitch, since the distribution will be changed according to the position of the region, the angular luminance will fluctuate, thus causing 3D moiré. Figure 5 shows a photo of this 3D moiré with an LCD panel. In Figure 6, although the LCD panel was removed, the 3D moiré didn’t disappear, that means the 3D moiré is caused by a lenticular and a backlight. The 3D moiré will be more noticeable, when the LCD module becomes thinner, that is to say, when the distance between the prism sheet and the focal plane of a lens becomes shorter. The pitch of a lens or prism is also an impact parameter. Recently, because not only small or middle size displays, but also large size displays become thinner, and because backlights that use many optical sheets are becoming popular, this 3D moiré will be a great issue in the near future.
Figure 5. Photo of 3D moiré Caused by Lenticular and Backlight
Figure 6. 3D moiré by BL with Lens
BL with lens - 3D moiré appears
BL without lens - no 3D moiré
Figure 3. Optical Distributions
of Slopes on Prism
Figure 2. Structure of 3D LCD with Lenticular and Backlight Figure 4. Mechanism of 3D moiré
Caused by Lenticular and Backlight
Prism Sheet (Backlight)
Left Slope
Lenticular
Right-eye Pixel
Left-eye Pixel
Right Slope
LCD panel
Bright Dark
(a) (b)
SID 09 DIGEST • 433

31.3 / S. Uehara
2.2. Reduction methods for 3D moiré In order to reduce the 3D moiré, we propose three methods, as shown in Figure 7. The first method is to optimize the prism pitch V, the lens pitch L, the focal length f and the distance S between LCD panel and backlight as follows:
V < L x S / f (1) The second method is to incline the prism sheet against the lenticular. The third method is to introduce a diffusive layer between LCD panel and backlight. These three methods had better be used together, because the effect of each method is limited. Figure 8 shows a photo of our implementation result, which shows these methods are effective.
3. Implementation and measurement 3.1. Application to HDDP arrangement We have also applied the reduction methods to our 2D/3D-LCD with novel pixel structure, called HDDP (Horizontally Double-Density Pixels) [5], as shown in Figure 9. In the HDDP arrangement, since it incorporates rectangular pixels whose width is half that of their height, in a lenticular-lens equipped 3D mode, the horizontal resolution will equal that of the vertical. This not only results in high 3D image quality, it also means that 2D characters can be displayed with perfect legibility.
We have developed 2.7-inch diagonal 2D/3D LCD with the methods. Each pixel set consists of 2 pixels (for left and right), and each pixel consists of 3 RGB dots. Horizontal and vertical pixel set numbers are, respectively, 240 and 320 (QVGA format). Thanks to the fully custom-made LCD for autostereoscopic display and the optimized optics, the 3D crosstalk level is 0.8%, which is truly excellent for viewing. The maximum width of the QSVS is about 50mm at the viewing distance of 380mm. Figure 10 shows a photo of a sample image for the 2D/3D LCD, which shows high image quality without patterns of intensity variations.
3.2. Measurement methods for 3D moire and their implementation results
As mentioned above, since 3D moiré occurs in various spatial frequencies according to many factors, the measurement methods based on the principle of 3D moiré should be established. This will enable the method to correspond to an unexpected 3D moiré. We consider that not only the spatial measurement using a calibrated camera, but also the angular measurement is significant to certify the viewing space. The ordinary moiré can be measured by conventional methods. In this paper, the angular measurement is described.
Figure 8. Implementation Result of Our Methods
Figure 7. Reduction Methods for 3D moiré
f
S
L
V V < L x S / f
Figure 9. HDDP Arrangement
Green
Left-Eye Pixel
Square
Right-Eye Pixel
Blue
Red
Lenticular Lens
Figure 10. Photo of Sample Image
(a) Optimization of Prism Pitch
(b) Inclination of Prism Sheet
(c) Introduction of Diffusive Layer
Diffusive Layer
434 • SID 09 DIGEST

31.3 / S. Uehara
a) Objective The objective of this measurement is to obtain the viewing space where the requirement for 3D moiré is fulfilled. In particular, the low-frequency 3D moiré peculiar to autostereoscopic displays that causes luminance non-uniformity or luminance difference is measured by optical measurement. b) Set-up and procedure Luminance profile in all views white is measured at the center of the screen, otherwise luminance profiles of each view are measured, and all luminance profiles are summed up as all white luminance profile. c) Analysis [1] On luminance profile in all white, inflection points, which are points where the curvature changes sign, are detected, as shown in Figure 11. [2] Then, luminance contrast modulation and angular differences are calculated between two neighboring inflection points. The luminance contrast modulation is
Cm = | LA – LB | / ( LA + LB ) (2) The luminance contrast modulation is also called Michelson contrast, that shows the difference from the average. [3] These values should be below the curve of threshold characteristics for 3D moiré. This threshold curve should be determined carefully based on ergonomics data. Furthermore, it should be confirmed whether the threshold depends on the luminance level, viewing distance, and a number of inflection points in each lobe. As a simple method, the value of Cm / |θ A-θ B| will be effective. The minimal and essential location is considered to be the center of the screen, because the center is mainly used. In addition, the left and the right of the screen had better be used for measurement, because some autostereoscopic displays have different optical conditions in each location. As regards chromaticity 3D moiré, luminance measurement will be replaced by chromaticity measurement.
Figure 12 shows the measurement results of our 2D/3D LCD. Thanks to the reduction methods, the luminance profile is very smooth. The maximum luminance contrast modulation is 5.5% at the angular difference of 3.2 degrees. Although the threshold should be determined carefully based on ergonomics, the subjective evaluation shows this level has no problem for viewing. Figure 10 also shows that the ordinary moiré doesn’t occur.
4. Summary We found interference between a 3D display's lenticular sheet and backlight optics causes 3D moiré, which is a previously unknown phenomenon that affects image quality. The thinner an LCD module is, the more noticeable and unavoidable this 3D moiré is. Its mechanism, reduction methods and their implementation results were described. We also proposed the measurement methods based on the principle of 3D moiré.
5. Acknowledgements The authors thank JENC (Japanese Ergonomics National Committee) / TC 159 / SC 4 / WG 2 as Japanese mirror committee for ISO, and also thank ELDIM for providing the measurement data and fruitful discussions.
6. References [1] K. Taira, G. Hamagishi, K. Izumi, S. Uehara, T. Nomura, K.
Mashitani, A. Miyazawa, T. Koike, A. Yuuki, T. Horikoshi, Y. Hisatake, H. Ujike, and Y. Nakano, Proc. of the 15th IDW, 3D2-2, pp.1103-1106 (2008).
[2] S. Uehara, K. Taira, G. Hamagishi, A.Yuuki, K. Mashitani, T. Koike, K. Izumi, T. Nomura, A. Miyazawa, T. Horikoshi, and H. Ujike, Proc. of the 15th IDW, 3D2-3, pp.1107-1110 (2008).
[3] S. Uehara, et. al., Proc. of 26th IDRC, pp.131-134 (2006). [4] S. Uehara, et. al., 6803-22, Proc. of SPIE-IS&T Electronic
Imaging, SPIE Vol.6803 (2008). [5] S. Uehara, et. al., Asia Display / IMID'04 Digest, pp.783-786
(2004).
0
100
200
300
-20 -10 0 10 20Angle [degree]
Lum
inan
ce [
cd/m
2]Figure 11. 3D moiré
θ B
Angle
Luminance LA
LB
)( BA
BAm LL
LLC
+−
=
Luminance Contrast Modulation
BA θθ −
Angular Difference
Threshold Curve
X
Z
θ A
Figure 12. Measurement Result of 3D Luminance
200
250
300
-10 -8 -6 -4 -2 0 2 4 6 8 10Angle [degree]
Lum
inan
ce [c
d/m
2].
.
Luminance Contrast Modulation: 5.5%
Angular Difference: 3.2°
SID 09 DIGEST • 435

31.4 / H.-H. Huang
31.4: Direct View and Projection Switchable Mobile Display
Hsin-Hsuan Huang and Cheng-Huan Chen Dept. of Power Mechanical Engineering, National Tsing Hua University, Hsinchu, Taiwan, R.O.C
Yu-Cheng Lai , Yu-Cheng Chang , Yi-Pai Huang and Han-Ping D. Shieh Dept. of Photonics and Display Institute, National Chiao Tung University, Hsinchu, Taiwan, R.O.C.
Chih-Wen Chen LC Technology Dept., AC Technology Division, AU Optronics Corporation, Hsinchu, Taiwan, R.O.C
Abstract The function of mobile phone becomes more versatile as a personal assistant. In order to make display device optimized for different function of the mobile phone, this paper proposes a display device which can be switched among 2D direct view, 3D direct view and projection modes while using single liquid crystal(LC) panel as image source. The device features a highly collimated backlight unit and polymer dispersed liquid crystal(PDLC) diffuser at the back of the LC panel, and a switchable lenticular array as well as a stretchable projection lens in front. The ray tracing simulation has shown well controlled light path of the backlight module and sufficient image quality of the projection lens while maintaining the compactness of the device for mobile application.
1. Introduction The function of mobile phone nowadays is not limited for speech communication as for its original purpose and becomes more versatile as a personal assistant and/or entertainment unit. The integration of camera imaging, PDA, GPS and video game has already been popular in the market. Integration of TV and internet access etc will gain more attention in the near future. The display unit plays the key role as the human interface for those different function and application of the mobile phone. However, different application requests different specification of the display unit with
the consideration on effectiveness and efficiency. Therefore, quite a few integrated or switchable display unit have been proposed, including 2D/3D switchable display[1] and pico projector embedded into a handset with a direct view panel of its own[2] etc. In this paper, a versatile display unit which can be switched among 2D direct view, 3D direct view and projection modes while using single LC panel as the image source has been proposed. The form factor is also taken into consideration in evaluating the feasibility of the architecture in order to ensure its availability as a mobile display unit.
2. Switchable display configuration The architecture of the display unit being proposed is shown in Figure 1, which looks similar to a folding mobile phone with the image source panel and illumination backlight module in the bottom plate, and a projection lens in the top plate. The image source is a traditional liquid crystal panel with a polymer dispersed liquid crystal(PDLC) diffuser[3] underneath in between the backlight module and the LC panel. The backlight module needs to have the emerging light from the top surface as collimated as possible. A switchable lenticular array[4] or parallax barrier[5] is attached onto the top surface of the LC panel. The projection lens in the top plate is a stretchable one, similar to several camera lenses, which stretch out only when being used.
Figure 1 Configuration of the proposed three-in-one hybrid display unit
436 • SID 09 DIGEST ISSN/009-0966X/09/3901-0436-$1.00 © 2009 SID

31.4 / H.-H. Huang
Three different operation modes of the display unit, namely 2D direct view, 3D direct view and projection modes, are illustrated in Figure 2. For 2D direct view as in Figure 2(a), the cover plate is flipped over, the PDLC is off and becomes highly diffusive, and the switchable lenticular array is off to behave like a simple transparent plate. In 3D direct view mode as shown in Figure 2(b), the cover plate is flipped over, the PDLC is on to become a simple transparent film, the switchable lenticular array is on so as to direct light towards different viewing direction for different group of pixel and become a spatial multiplexed autostereoscopic 3D display. The projection mode requests to close the cover plate and stretch the projection lens element, as shown in Figure 2(c). In this mode, the PDLC is on to make the illumination highly collimated, and the switchable lenticular array should be disabled.
(a) (b)
(c)
Figure.2 Operation mode of hybrid display unit (a) 2D (b) 3D (c) Projection mode
3. High collimation backlight module The above mentioned concept is clearly feasible based on the currently available technology, and the key issues become the form factor and maintaining efficiency in switching between direct view and projection mode. A highly collimated backlight is desired for projection mode, while it can be diffused in direct view mode by a PDLC diffuser at off state. Figure 3 shows the top view and bird’s eye view of the high collimation backlight module using LEDs as the light source. The LEDs located at the side edge of the light guide are firstly collimated by a parabolic reflector, one for each LED. Micro-scale prism structure is patterned on the bottom surface of the light guide to make the emerging light from the top surface confined within a small cone angle. Figure 4(a) and (b) show the illuminance
distribution over the light guide surface and the angular profile of emerging light respectively from the simulation result of ray tracing using Light Tools. The uniformity reaches 70% and the angular divergence is less than 5∘ measured at half intensity. The total thickness of the backlight light module is 15mm.
(a)
(b)
Figure 3 Configuration of high collimation backlight module(a) Side view (b)Bird’s eye view
(a)
(b)
Figure 4 (a)Illuminace distribution (b)Angular profile of emerging light from backlight module Stretchable projection lens
SID 09 DIGEST • 437

31.4 / H.-H. Huang
4. Stretchable projection lens The projection lens needs to provide good quality image while having compact form factor. The trade-off can be resolved with a stretchable lens module as what has been adapted in several compact digital cameras. Figure 5(a) show the layout and light path of the projection lens at stretching condition. All the four lenses are spherical plastic lens. Table 1 lists the parameters of projection lens which include radius, thickness and the lens material. PMMA is the only material used in this design because of cost consideration. The panel size on the right end of the light path has a diagonal size of 1.96 inches and an aspect ratio of 4:3. The pixel size is 0.1245mm, which corresponds to spatial frequency of 4.0 lp/mm. Figure 5(b) shows the MTF of the projection lens, which indicates a MTF of 50% at 5 lp/mm. One major feature of the projection lens is telecentricity at the panel side with a ray cone of 5∘ half angle. Accompanying with the high collimation light guide, it makes the best use of the energy from the light source in projection mode. The other feature of the projection lens is the compact size of lens element stretching far away from the image source, which makes the display unit mechanically stable in projection mode operation. The total track of the light path in Figure 5(a) is 500mm, and the total thickness of the lens elements is 19.9mm, which will be roughly the thickness of the cover plate containing projection lens elements. The project image size is 180mm*135mm, roughly A4 size, with a throw distance of 427mm.
Table 1 the list of radius, thickness and material for the projection lens
Radius Thickness Glass
Object Infinity 426.7 1 16.5 3.6 PMMA 2 -465.4 5
Stop Infinity 3.5 4 -16.2 1.1 PMMA 5 19 2.6 6 41.3 3.8 PMMA 7 -23.7 29.6 8 50.5 11.4 PMMA 9 -656.9 12.6
Image Infinity
5. Conclusion A three-in-one hybrid display unit using single image source panel has been proposed as the visual interface for mobile device. The display provides switchable function among 2D direct view, 3D direct view and projection. The major feature of the hardware is a highly collimated backlight module and a stretchable projection lens. Ray tracing simulation has shown sufficient performance of both modules and the feasibility of the proposed display architecture.
(a)
(b)
Figure 5. (a) Light path and layout (b) MTF of projection lens
at stretching condition
6. References [1] K. J. Kim, H. Kang, " Development of a 42-in. 2-D/3-D
switchable display using multi-view technology for public-information-display applications," in SID 15/11, 2007, pp.899-903
[2] Denis Darmon, John R. McNeil, and Mark A. Handschy " LED-Illuminated Pico Projector Architectures," J. Appl. Phys. Lett. Vol.48, pp.269-271,1986.
[3] W. Doane, N.A. Vaz, B.-G. Wu, S. Zumer, " Field controlled light scattering from nematic microdroplets," Prodeedings of SID, 2008,pp.1070-1073.
[4] S.T. de Zwart, " A 20” Switchable Auto-Stereoscopic 2D/3D Display," Prodeedings of IDW’04,pp.1459-1460.
[5] Byoungho Lee, Heejin Choi, Joohwan Kim, Yunhee Kim, and Seong-Woo Cho, " Status and Prospects of Autostereoscopic 3D Display Technologies," Prodeedings of IEEE, pp. 354-355, 2007.
438 • SID 09 DIGEST