Embed Size (px)
Citation preview


320.253.9940
320.253.3054
braunintertec.com
3900 Roosevelt Road
Suite 113
Saint Cloud, MN 56301
Phone:
Fax:
Web:
Braun Intertec Corporation
Providing engineering and environmental solutions since 1957
AA
/EO
E
March 5, 2012 Project SC-11-06650A Mr. John Frischmann St. Cloud State University 401 4th Avenue South St. Cloud, MN 56301 Re: Column Reinforcing Investigation Eastman Hall St. Cloud State University St. Cloud, Minnesota Dear Mr. Frischmann: This letter provides a summary of the column reinforcement observations we recently conducted. Our testing was conducted on the columns as requested by Steve Clark, project structural engineer with Ericksen Roed & Associates. Our services were provided in accordance with our proposal to Mr. John Frischmann of St. Cloud State University on December 21, 2011, and Purchase Order 136751 issued on January 30, 2012.
Background Mr. Clark requested investigation of the basement and first floor levels of the following: Columns 8 or 10, columns 12 or 14, column 18 and column 51. The column numbers are as noted on the 1929 building plans prepared by C.H. Johnson – Architect.
Results On February 10, 2012, Braun Intertec completed Ground Penetrating Radar (GPR) and X-Ray (Radiography) to estimate the size and spacing of the reinforcing steel inside the columns. The results in this report are estimates based on past experience using both nondestructive methods and an understanding of the limitations of these methods when used for locating reinforcing steel. The GPR was used to estimate the number and spacing of the horizontal and vertical bars. X-Rays were used to determine approximate size and confirm apparent spacing noted from the GPR. We chose to investigate Columns 10, 14, 18 and 51. Table 1. Column 10
Column 10 Basement
Outside Dimensions (inches) 14 by 14
Number of Vertical Bars 6
Spacing of Vertical Bars Not able to determine due to the circular configuration

St. Cloud State University Project SC-11-06650A March 5, 2012 Page 2
Vertical Bar Diameter (inches) 0.75
Horizontal Bar Size (inches) 0.25
Horizontal Bar Spacing Heli-coiled at 2 inches
Column 10 First Floor
Outside Dimensions (inches) 15 by 15
Number of Vertical Bars 4
Spacing of Vertical Bars Not able to determine due to the circular configuration
Vertical Bar Diameter (inches) 0.75
Horizontal Bar Size (inches) 0.375
Horizontal Bar Spacing Heli-coiled at 8 inches
Table 2. Column 14
Column 14 Basement
Outside Dimensions (inches) 14 by 14
Number of Vertical Bars 6
Spacing of Vertical Bars Not able to determine due to the circular configuration
Vertical Bar Diameter (inches) 0.75
Horizontal Bar Size (inches) 0.25
Horizontal Bar Spacing Heli-coiled at 2 inches
Column 14 First Floor
Outside Dimensions (inches) 15 by 15
Number of Vertical Bars 4
Spacing of Vertical Bars Not able to determine due to the circular configuration
Vertical Bar Diameter (inches) 0.75
Horizontal Bar Size (inches) 0.375
Horizontal Bar Spacing Heli-coiled at 8 inches

St. Cloud State University Project SC-11-06650A March 5, 2012 Page 3
Table 3. Column 18
Column 18 Basement
Outside Dimensions (inches) 20 by 20
Number of Vertical Bars 8
Apparent Spacing of Vertical Bars 3
Vertical Bar Diameter (inches) 0.75
Horizontal Bar Size (inches) 0.25
Horizontal Bar Spacing Heli-coiled at 2 inches
Note – A 6-inch by 6-inch area of concrete was deteriorated from this column, exposing the reinforcement. The vertical and horizontal bar diameter and spacing was physically measured in this area. GPR was used to determine the number of vertical bars.
Column 18 First Floor
Outside Dimensions (inches) 21 1/2 by 21 1/2
Number of Vertical Bars 8
Spacing of Vertical Bars Not able to determine due to the circular configuration
Vertical Bar Diameter (inches) Not able to determine
Horizontal Bar Size (inches) Not able to determine
Horizontal Bar Spacing Heli-coiled at 2 inches
X-Ray was not able to be used on this column because of its size. The Iridium 192 source we used is not able to penetrate the column thickness.
Table 4. Column 51
Column 51 Basement
Outside Dimensions (inches) 14 by 14
Number of Vertical Bars 6
Spacing of Vertical Bars Not able to determine due to the circular configuration
Vertical Bar Diameter (inches) 0.75
Horizontal Bar Size (inches) 0.375
Horizontal Bar Spacing Heli-coiled at 3 inches

St. Cloud State University Project SC-11-06650A March 5, 2012 Page 4
Column 51 First Floor
Column 51 on the first floor was inaccessible due to the sheet rock walls on each side of the column. An X-Ray was attempted, but no useable information was obtainable due to the amount of space between the walls and the column.
Remarks We appreciate the opportunity to provide these services, if you have any questions or need additional information or testing, please call Steve Thayer at 320.202.7225. Sincerely, BRAUN INTERTEC CORPORATION
Steve A. Thayer, PE Associate Principal/Senior Engineer c: Stephen Clark, PE; Ericksen Roed & Associates, Inc. (email) Jason Nordling, AIA; BWBR (email) 06650A letter


320.253.9940320.253.3054braunintertec.com
3900 Roosevelt RoadSuite 113Saint Cloud, MN 56301
Phone:Fax:Web:
Braun Intertec Corporation
Providing engineering and environmental solutions since 1957
AA
/EO
E
March 5, 2012, Project SC-11-06650
John Frischmann, AIA, LEEDSt. Cloud State University720 4th Avenue South St. Cloud, MN 56301-4498
Re: Geotechnical EvaluationEastman Hall RenovationSt. Cloud State UniversitySt. Cloud, Minnesota
Dear Mr. Frischmann:
We are pleased to present this Geotechnical Evaluation Report for the renovation of Eastman Hall. A summary of our results and recommendations is presented below. More detailed information and recommendations follow the Table of Contents.
Summary of Test Results
We completed one penetration test boring near the southwest corner of the building. The boring encountered about 10 feet of fill underlain by poorly graded sand to a depth of about 24 feet. Lean clay and silty clay were encountered to a depth of about 30 feet. Silty sand was encountered below the clay. Penetration resistances indicated the sands were very loose to medium dense and the clays were rather stiff to stiff. Groundwater was not observed in the boring.
We completed two hand auger borings and dynamic cone penetrometer (DCP) tests below the basement floor. The borings encountered naturally deposited sand. The DCP indicated the sand ranged from loose to medium dense. Groundwater was not observed in the borings.
We completed two standard Proctor tests and direct shear tests on samples collected from the hand auger borings. The tests indicated the sands have a friction angle of 36 degrees.
Summary of Analyses
Based on our testing, field observations, review of the existing plans, and site observations, we have determined the ultimate bearing capacity of the soils below several columns within the existing building. The columns are numbered according to the 1929 drawings from CH Johnson – Architect. Following is a summary of our results:
Column 49, ultimate bearing capacity of 8,700 pounds per square foot (psf). Column 50, ultimate bearing capacity of 12,000 psf. Column 23, ultimate bearing capacity of 13,700 psf. Column 12, ultimate bearing capacity of 13,500 psf.

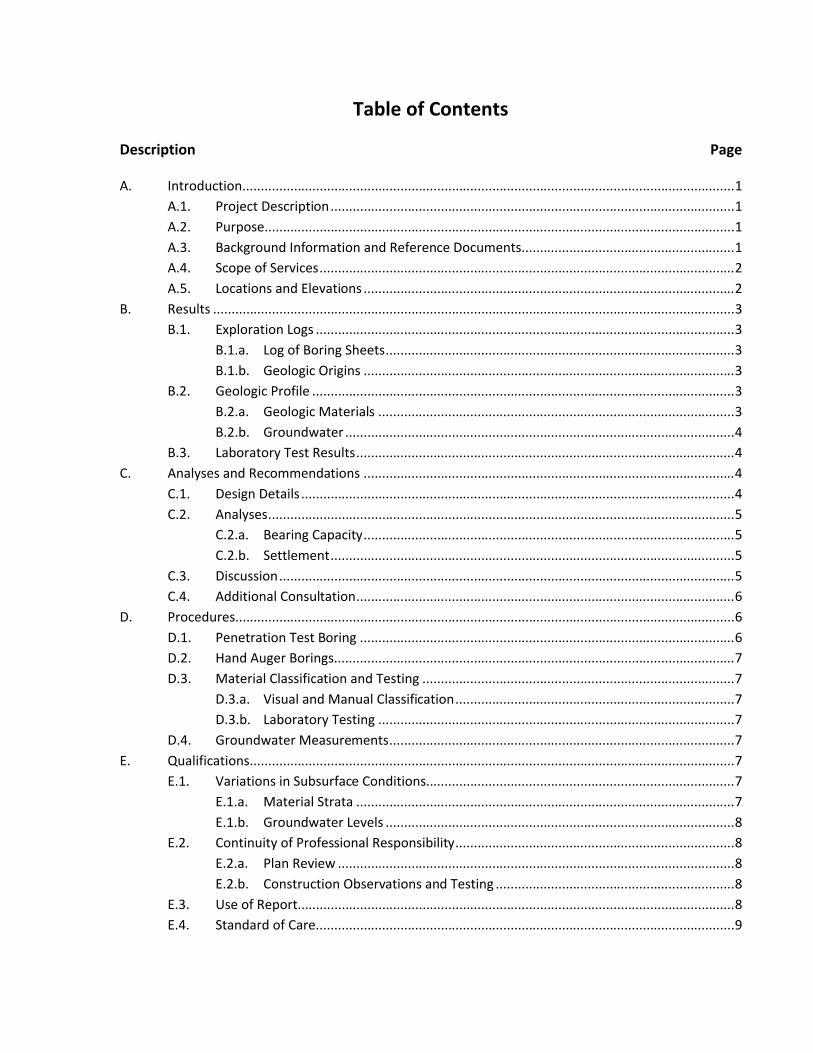
Table of Contents
Description Page
A. Introduction......................................................................................................................................1A.1. Project Description..............................................................................................................1A.2. Purpose................................................................................................................................1A.3. Background Information and Reference Documents..........................................................1A.4. Scope of Services.................................................................................................................2A.5. Locations and Elevations .....................................................................................................2
B. Results ..............................................................................................................................................3B.1. Exploration Logs ..................................................................................................................3
B.1.a. Log of Boring Sheets...............................................................................................3B.1.b. Geologic Origins .....................................................................................................3
B.2. Geologic Profile ...................................................................................................................3B.2.a. Geologic Materials .................................................................................................3B.2.b. Groundwater ..........................................................................................................4
B.3. Laboratory Test Results.......................................................................................................4C. Analyses and Recommendations .....................................................................................................4
C.1. Design Details ......................................................................................................................4C.2. Analyses...............................................................................................................................5
C.2.a. Bearing Capacity.....................................................................................................5C.2.b. Settlement..............................................................................................................5
C.3. Discussion............................................................................................................................5C.4. Additional Consultation.......................................................................................................6
D. Procedures........................................................................................................................................6D.1. Penetration Test Boring ......................................................................................................6D.2. Hand Auger Borings.............................................................................................................7D.3. Material Classification and Testing .....................................................................................7
D.3.a. Visual and Manual Classification............................................................................7D.3.b. Laboratory Testing .................................................................................................7
D.4. Groundwater Measurements..............................................................................................7E. Qualifications....................................................................................................................................7
E.1. Variations in Subsurface Conditions....................................................................................7E.1.a. Material Strata .......................................................................................................7E.1.b. Groundwater Levels ...............................................................................................8
E.2. Continuity of Professional Responsibility............................................................................8E.2.a. Plan Review ............................................................................................................8E.2.b. Construction Observations and Testing .................................................................8
E.3. Use of Report.......................................................................................................................8E.4. Standard of Care..................................................................................................................9

Table of Contents (continued)
Description Page
AppendixBoring Location SketchMoisture-Density Relationship (P-01 and P-02)Direct Shear Test (Boring Col. 49 and Boring Col. 50)Descriptive Terminology Log of Boring Sheets ST-1, H-2 and H-3

A. Introduction
A.1. Project Description
This Geotechnical Evaluation Report addresses the renovation of Eastman Hall on the St. Cloud State University campus. The project consists of adding a new floor level within the existing gymnasium area. If the structure is capable, the floor will be supported on the existing columns and footings.
A.2. Purpose
The purpose of our evaluation is to characterize subsurface geologic conditions at selected exploration locations and evaluate their impact on the design of the renovation project.
A.3. Background Information and Reference Documents
To facilitate our evaluation, we were provided with partial copies of the following plans:
Foundation and Basement Plan
First Floor Plan
Second Floor Plan
Third Floor Plan
Section C-C Plan
Section and Elevation Plan
The above plans were prepared by CH Johnston – Architect. The date prepared, September 1929, was indicated on only the Section C-C Plan.
We were also provided with the Basement Floor Plan, Slab Drainage, prepared by Legend Technical Services Inc. The date prepared was not indicated.
St. Cloud State UniversityProject SC-11-06650AMarch 5, 2012Page 2
A.4. Scope of Services
Our scope of services for this project was originally submitted as a Proposal to Mr. John Frischmann of St. Cloud State University. We received Purchase Order 136345, as authorization to proceed from SCSU on October 28, 2011. Tasks performed in accordance with our authorized scope of services included:
Staking the boring location and coordinating the locating of underground utilities near the boring.
Performing one penetration test boring to a depth of 30 feet.
Performing two hand auger borings, extended below the basement slab, to depths of 5 to 10 feet.
Performing Dynamic Cone Penetrometer (DCP) testing on the soils in the hand auger borings.
Obtaining bulk samples of the geologic materials encountered in the hand auger borings.
Performing laboratory Proctor and Direct Shear tests on the bulk samples.
Preparing this report containing a sketch, exploration logs, a summary of the geologic materials encountered, results of laboratory tests, and results of bearing capacity and settlement analyses.
A.5. Locations and Elevations
We selected the penetration test and hand auger boring locations. The approximate locations are shown on the sketch in the appendix of this report. The ground elevation at Boring ST-1 was referenced to the first floor of the building. The plans indicate the elevation of this reference is 96.5.

St. Cloud State UniversityProject SC-11-06650AMarch 5, 2012Page 3
B. Results
B.1. Exploration Logs
B.1.a. Log of Boring SheetsLog of Boring sheets for our penetration test and hand auger borings are included in the Appendix. The logs identify and describe the soils encountered, penetration resistance tests, DCP tests, laboratory tests, and groundwater measurements.
Strata boundaries were inferred from changes in the penetration test samples and the auger cuttings. Because sampling was not performed continuously, the strata boundary depths are only approximate. The boundary depths likely vary away from the boring locations, and the boundaries themselves may also occur as gradual rather than abrupt transitions.
B.1.b. Geologic OriginsGeologic origins assigned to the materials shown on the logs and referenced within this report were based on visual classification of the penetration test samples, penetration resistance testing performed for the project, laboratory test results and available common knowledge of the geologic processes and environments that have impacted the site and surrounding area in the past.
B.2. Geologic Profile
B.2.a. Geologic MaterialsWe completed one penetration test boring near the southwest corner of the building. The boring encountered about 10 feet of fill underlain by poorly graded sand to a depth of about 24 feet. Lean clay and silty clay were encountered to a depth of about 30 feet. Silty sand was encountered below the clay. Penetration resistances indicated the sands were very loose to medium dense and the clays were rather stiff to stiff.
We completed two hand auger borings and dynamic cone penetrometer (DCP) tests below the basement floor. The borings encountered naturally deposited sand. The DCP indicated the sand ranged from loose to medium dense.

St. Cloud State UniversityProject SC-11-06650AMarch 5, 2012Page 4
B.2.b. GroundwaterGroundwater was not observed as our borings were advanced. Based on the moisture contents of the geologic materials encountered, it appears that groundwater was below the depths explored.
Seasonal and annual fluctuations of groundwater, however, should be anticipated.
B.3. Laboratory Test Results
Standard Proctor and direct shear tests were conducted on samples from the cuttings of the hand auger borings. The tests were conducted to help estimate the friction angle of the soil. The test results are provided in the appendix of this report.
C. Analyses and Recommendations
C.1. Design Details
Eastman Hall was constructed in about 1929. The building is a three-story structure with a full-depth basement. The second floor has a gymnasium area that extends through the third floor, to the roof level. The first and second floors of the building are structural concrete, supported by concrete columns and spread footings. The third floor and roof are supported on steel columns.
SCSU is considering remodeling Eastman Hall and reconfiguring the building for use other than gymnasium area. The current plan is to construct a new third floor within the current gym area and support the floor on the existing columns. Mr. Stephen Clark, Ericksen Roed & Associates, indicated representative bearing pressures on the column footings will increase from about 6,300 pounds per square foot (psf) to 7,500 psf.
We have attempted to describe our understanding of the proposed construction to the extent it was reported to us by others. Depending on the extent of available information, assumptions may have been made based on our experience with similar projects. If we have not correctly recorded or interpreted the project details, we should be notified. New or changed information could require additional evaluation, analyses and/or recommendations.

St. Cloud State UniversityProject SC-11-06650AMarch 5, 2012Page 5
C.2. Analyses
C.2.a. Bearing CapacityBased on the laboratory tests, soil borings, foundation plan and site observations, we have determined the ultimate soil bearing capacities for several of the existing column pads. The bearing capacities are summarized in the table below.
Column PadFooting Size
(inches)Embedment Depth
(feet)Ultimate Bearing
Capacity (psf)*
49 53 x 53 0 8,700
50 47 x 47 0.9 12,000
23 85 x 91 0 13,700
12 54 x 54 1 13,500
*Ultimate bearing capacity does not include a factor of safety.
C.2.b. SettlementBased on an increase in load of about 20 percent, we anticipate settlement from the new load will be less than 1/2 inch.
C.3. Discussion
We have completed bearing capacity and settlement analysis for footings located near our hand auger borings. The analysis was based on both the existing condition of the footings under a load of 6,300 psf and the planned increase in loading to 7,500 psf. Our analysis considered the soil profile encountered in the hand auger borings and penetration test boring; i.e., loose sands to 4 or 5 feet below the footings, then medium dense to dense sands. The footing size and embedment depth of the existing footings was also a significant input to the analysis.
We have determined that several of the existing footings would have settled about 2/3- to 3/4-inch under the current bearing pressure of 6,300. More importantly, the factors of safety with regard to bearing capacity failure were below 3 for the footings we analyzed. In some cases, the factor of safety was less than 2 1/2, and in one case, less than 2. Increasing the bearing pressure on the footings to 7,500 would, of course, reduce the safety factors further.

St. Cloud State UniversityProject SC-11-06650AMarch 5, 2012Page 6
For some structures, a safety factor of 2 for footings founded on sand would be adequate. However, considering the planned usage of the renovated building and common practice for assigning factors of safety for bearing capacity failure, it is our opinion that the minimum factor of safety should be 3.
It is difficult to provide a general recommended solution to the bearing capacity issue. The existing footings differ in size, elevation and embedment. A footing embedded well into the sands beneath the floor slab would have a significantly higher bearing capacity than an identical footing bearing at or just below the floor level. Potential options for increasing the safety factor include increasing the bearing capacity of sands (through grouting), increasing the footing sizes, or supporting the footings on deeper soil stratums with installation of helical piles or micropiles below the existing footings.
C.4. Additional Consultation
Due to the unique dimensions, elevations, embedment, loads, etc., we are unable to provide a generalized foundation recommendation. Depending on the individual footing characteristics, some footings may actually be capable of supporting the 20 percent increase in bearing pressure. Adjacent footings may not be capable without improvements of the soils or modifications to the footing.
We recommend additional consultation with the structural engineer. Further analysis and testing for individual footings may be necessary. Based on our current information, it appears chemical grouting the sands below the footings may be the more viable approach toward improving the bearing capacity characteristics of the sands just below the bottom of the foundation levels. However, further analysis may result in several improvement options tailored to the various footing locations.
D. Procedures
D.1. Penetration Test Boring
The penetration test boring was drilled with a truck-mounted core and auger drill equipped with hollow-stem auger. The boring was performed in accordance with ASTM D 1586. Penetration test samples were taken at 2 1/2- or 5-foot intervals. Actual sample intervals and corresponding depths are shown on the boring log.

St. Cloud State UniversityProject SC-11-06650AMarch 5, 2012Page 7
D.2. Hand Auger Borings
The hand auger borings were drilled with a 2 1/2-inch diameter orchard barrel hand auger. The borings were advanced in 6-inch increments. The auger was then withdrawn from the hole to obtain the cuttings. A dynamic cone penetrometer (DCP) was then used to evaluate the density of the soils in the bottoms of the holes. The DCP consists of driving a 1 3/16-inch diameter tip with a 10-pound hammer falling 24 inches. The blows to drive the tip 6 inches are counted and recorded.
D.3. Material Classification and Testing
D.3.a. Visual and Manual ClassificationThe geologic materials encountered were visually and manually classified in accordance with ASTM Standard Practice D 2488. A chart explaining the classification system is attached. Samples were sealed in jars or bags and returned to our facility for review and storage.
D.3.b. Laboratory TestingThe results of the laboratory tests performed on geologic material samples are noted on or follow the appropriate attached exploration logs. The tests were performed in accordance with ASTM or AASHTO procedures.
D.4. Groundwater Measurements
The drillers checked for groundwater as the penetration test boring and hand auger borings were advanced, and again after auger withdrawal. The boreholes were then backfilled as noted on the boring logs.
E. Qualifications
E.1. Variations in Subsurface Conditions
E.1.a. Material StrataOur evaluation, analyses and recommendations were developed from a limited amount of site and subsurface information. It is not standard engineering practice to retrieve material samples from exploration locations continuously with depth, and therefore strata boundaries and thicknesses must be

St. Cloud State UniversityProject SC-11-06650AMarch 5, 2012Page 8
inferred to some extent. Strata boundaries may also be gradual transitions, and can be expected to vary in depth, elevation and thickness away from the exploration locations.
Variations in subsurface conditions present between exploration locations may not be revealed until additional exploration work is completed, or construction commences. If any such variations are revealed, our recommendations should be re-evaluated. Such variations could increase construction costs, and a contingency should be provided to accommodate them.
E.1.b. Groundwater LevelsGroundwater measurements were made under the conditions reported herein and shown on the exploration logs, and interpreted in the text of this report. It should be noted that the observation period was relatively short, and groundwater can be expected to fluctuate in response to rainfall, flooding, irrigation, seasonal freezing and thawing, surface drainage modifications and other seasonal and annual factors.
E.2. Continuity of Professional Responsibility
E.2.a. Plan ReviewThis report is based on a limited amount of information, and a number of assumptions were necessary to help us develop our recommendations. It is recommended that our firm review the geotechnical aspects of the designs and specifications, and evaluate whether the design is as expected, if any design changes have affected the validity of our recommendations, and if our recommendations have been correctly interpreted and implemented in the designs and specifications.
E.2.b. Construction Observations and TestingIt is recommended that we be retained to perform observations and tests during construction. This will allow correlation of the subsurface conditions encountered during construction with those encountered by the borings, and provide continuity of professional responsibility.
E.3. Use of Report
This report is for the exclusive use of the parties to which it has been addressed. Without written approval, we assume no responsibility to other parties regarding this report. Our evaluation, analyses and recommendations may not be appropriate for other parties or projects.
St. Cloud State UniversityProject SC-11-06650AMarch 5, 2012Page 9
E.4. Standard of Care
In performing its services, Braun Intertec used that degree of care and skill ordinarily exercised under similar circumstances by reputable members of its profession currently practicing in the same locality. No warranty, express or implied, is made.

Appendix


Test specification:
Project:
Remarks:Client:Project No.:
MATERIAL DESCRIPTION
No.200Moist.AASHTOUSCSDepth
% <% >PILLSp.G.
Nat.ClassificationElev/
Moisture-Density RelationshipD
ry d
ensi
ty, p
cf
Water content, %
99
101
103
105
107
109
9 11 13 15 17 19 21
ZAV forSp.G. =2.65
Specific Gravity was assumed.Boring Col. 49, 1'-4'12/19/11
St. Cloud State UniversitySC-11-06650
Poorly Graded Sand, fine-medium grained,brown
1.122.65SP
ASTM D 698-07e1 Method B Standard
Eastman Hall Renovation St. Cloud, MN
ST
Source: Sample No.: P-01
TEST RESULTS
3/8 in.
Optimum moisture = 15.0 %
Maximum dry density = 106.2 pcf

Test specification:
Project:
Remarks:Client:Project No.:
MATERIAL DESCRIPTION
No.200Moist.AASHTOUSCSDepth
% <% >PILLSp.G.
Nat.ClassificationElev/
Moisture-Density RelationshipD
ry d
ensi
ty, p
cf
Water content, %
100
102
104
106
108
110
8 10 12 14 16 18 20
ZAV forSp.G. =2.65
Specific Gravity was assumed.Boring Col.50, 1'-4'12/19/11
St. Cloud State UniversitySC-11-06650
Poorly Graded Sand, fine-medium grained,brown
2.442.65SP
ASTM D 698-07e1 Method A Standard
Eastman Hall Renovation St. Cloud, MN
ST
Source: Sample No.: P-02
TEST RESULTS
No.4
Optimum moisture = 12.7 %
Maximum dry density = 107.1 pcf
Client: St. Cloud State Univerity
Project: Eastman Hall Renovation
St. Cloud State University, St. Cloud, MN
Sample Number: Boring Col. 49 Depth: 1-4'
Proj. No.: SC-11-06650 Date Sampled:
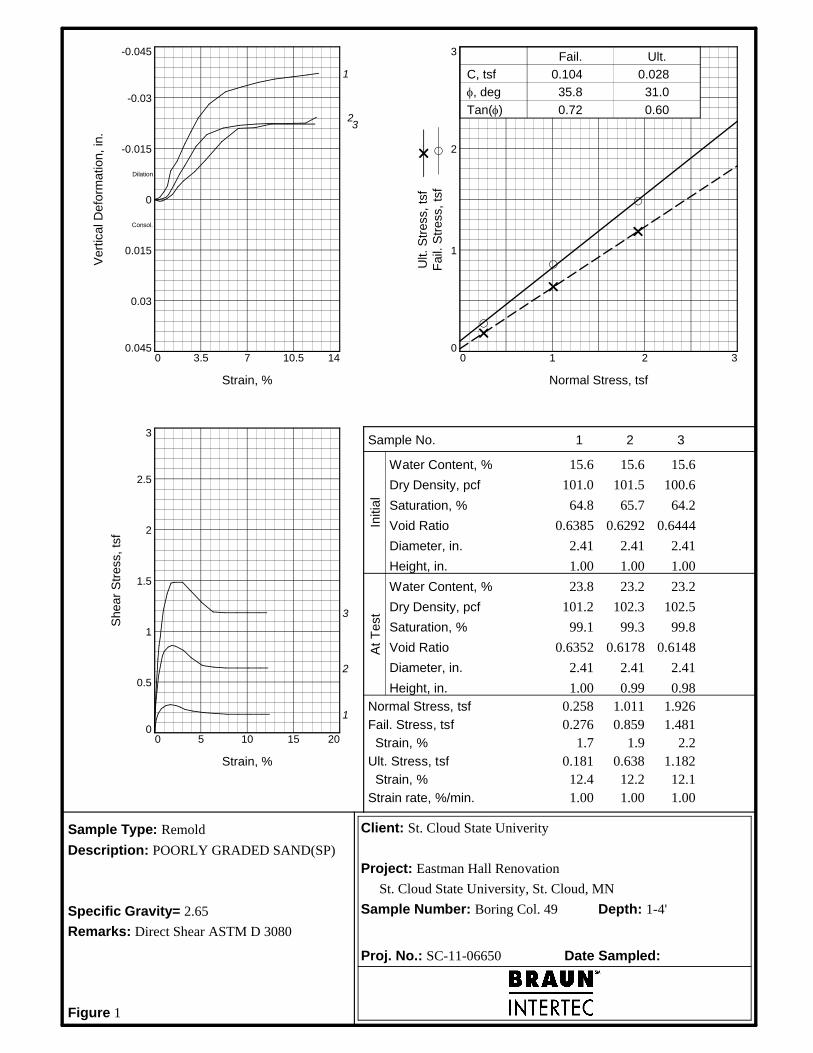
Sample Type: Remold
Description: POORLY GRADED SAND(SP)
Specific Gravity= 2.65
Remarks: Direct Shear ASTM D 3080
Figure 1
Sample No.
Water Content, %
Dry Density, pcf
Saturation, %
Void Ratio
Diameter, in.
Height, in.
Water Content, %
Dry Density, pcf
Saturation, %
Void Ratio
Diameter, in.
Height, in.
Normal Stress, tsf
Fail. Stress, tsf
Strain, %
Ult. Stress, tsf
Strain, %
Strain rate, %/min.
Initi
alA
t T
est
She
ar S
tres
s, t
sf
0
0.5
1
1.5
2
2.5
3
Strain, %
0 5 10 15 20
1
2
3
Ver
tical
Def
orm
atio
n, in
.
0.045
0.03
0.015
0
-0.015
-0.03
-0.045
Strain, %
0 3.5 7 10.5 14
Dilation
Consol.
1
23
Ult.
Str
ess,
tsf
Fai
l. S
tres
s, t
sf
0
1
2
3
Normal Stress, tsf
0 1 2 3
C, tsf
, deg
Tan()
Fail. Ult.
0.104
35.8
0.72
0.028
31.0
0.60
1
15.6
101.0
64.8
0.6385
2.41
1.00
23.8
101.2
99.1
0.6352
2.41
1.000.2580.276
1.70.181
12.41.00
2
15.6
101.5
65.7
0.6292
2.41
1.00
23.2
102.3
99.3
0.6178
2.41
0.991.0110.859
1.90.638
12.21.00
3
15.6
100.6
64.2
0.6444
2.41
1.00
23.2
102.5
99.8
0.6148
2.41
0.981.9261.481
2.21.182
12.11.00

Client: St. Cloud State Univerity
Project: Eastman Hall Renovation
St. Cloud State University, St. Cloud, MN
Sample Number: Boring Col. 50 Depth: 1-4'
Proj. No.: SC-11-06650 Date Sampled:
Sample Type: Thinwall
Description: POORLY GRADED SAND(SP)
Specific Gravity= 2.65
Remarks: Direct Shear ASTM D 3080
Figure 2
Sample No.
Water Content, %
Dry Density, pcf
Saturation, %
Void Ratio
Diameter, in.
Height, in.
Water Content, %
Dry Density, pcf
Saturation, %
Void Ratio
Diameter, in.
Height, in.
Normal Stress, tsf
Fail. Stress, tsf
Strain, %
Ult. Stress, tsf
Strain, %
Strain rate, %/min.
Initi
alA
t T
est
She
ar S
tres
s, t
sf
0
0.5
1
1.5
2
2.5
3
Strain, %
0 5 10 15 20
1
2
3
Ver
tical
Def
orm
atio
n, in
.
0.06
0.04
0.02
0
-0.02
-0.04
-0.06
Strain, %
0 3.5 7 10.5 14
Dilation
Consol.
1
2
3
Ult.
Str
ess,
tsf
Fai
l. S
tres
s, t
sf
0
1
2
3
Normal Stress, tsf
0 1 2 3
C, tsf
, deg
Tan()
Fail. Ult.
0.092
37.4
0.76
0.006
32.7
0.64
1
13.0
103.3
57.3
0.6015
2.41
1.00
22.6
103.3
99.7
0.6013
2.41
1.000.2580.284
1.50.173
11.91.00
2
13.0
102.6
56.2
0.6130
2.41
1.00
22.9
102.8
99.8
0.6086
2.41
1.001.0110.875
2.50.654
12.51.00
3
13.1
102.1
56.0
0.6207
2.41
1.00
22.7
103.2
99.7
0.6036
2.41
0.991.9261.560
3.31.245
12.41.00

Descriptive Terminology of SoilStandard D 2487 - 00Classification of Soils for Engineering Purposes(Unified Soil Classification System)
Rev. 7/07
DD Dry density, pcfWD Wet density, pcfMC Natural moisture content, %LL Liqiuid limit, %PL Plastic limit, %PI Plasticity index, %P200 % passing 200 sieve
OC Organic content, %S Percent of saturation, %SG Specific gravityC Cohesion, psf
Angle of internal frictionqu Unconfined compressive strength, psfqp Pocket penetrometer strength, tsf
Liquid Limit (LL)
Laboratory Tests
Pla
stic
ity
Ind
ex (
PI)
Drilling Notes
Standard penetration test borings were advanced by 3 1/4” or 6 1/4”ID hollow-stem augers unless noted otherwise, Jetting water was usedto clean out auger prior to sampling only where indicated on logs.Standard penetration test borings are designated by the prefix “ST”(Split Tube). All samples were taken with the standard 2” OD split-tubesampler, except where noted.
Power auger borings were advanced by 4” or 6” diameter continuous-flight, solid-stem augers. Soil classifications and strata depths were in-ferred from disturbed samples augered to the surface and are, therefore,somewhat approximate. Power auger borings are designated by theprefix “B.”
Hand auger borings were advanced manually with a 1 1/2” or 3 1/4”diameter auger and were limited to the depth from which the auger couldbe manually withdrawn. Hand auger borings are indicated by the prefix“H.”
BPF: Numbers indicate blows per foot recorded in standard penetrationtest, also known as “N” value. The sampler was set 6” into undisturbedsoil below the hollow-stem auger. Driving resistances were then countedfor second and third 6” increments and added to get BPF. Where theydiffered significantly, they are reported in the following form: 2/12 for thesecond and third 6” increments, respectively.
WH: WH indicates the sampler penetrated soil under weight of hammerand rods alone; driving not required.
WR: WR indicates the sampler penetrated soil under weight of rodsalone; hammer weight and driving not required.
TW indicates thin-walled (undisturbed) tube sample.
Note: All tests were run in general accordance with applicable ASTMstandards.
Particle Size Identification
Boulders ............................... over 12”Cobbles ............................... 3” to 12”Gravel
Coarse ............................ 3/4” to 3”Fine ................................. No. 4 to 3/4”
SandCoarse ............................ No. 4 to No. 10Medium ........................... No. 10 to No. 40Fine ................................. No. 40 to No. 200
Silt ....................................... No. 200, PI 4 or below “A” line
Clay ..................................... No. 200, PI 4 and on or above “A” line
Relative Density of Cohesionless Soils
Very loose ................................ 0 to 4 BPFLoose ....................................... 5 to 10 BPFMedium dense ......................... 11 to 30 BPFDense ...................................... 31 to 50 BPFVery dense ............................... over 50 BPF
Consistency of Cohesive Soils
Very soft ................................... 0 to 1 BPFSoft ....................................... 2 to 3 BPFRather soft ............................... 4 to 5 BPFMedium .................................... 6 to 8 BPFRather stiff ............................... 9 to 12 BPFStiff ....................................... 13 to 16 BPFVery stiff ................................... 17 to 30 BPFHard ....................................... over 30 BPF
a. Based on the material passing the 3-in (75mm) sieve.b. If field sample contained cobbles or boulders, or both, add “with cobbles or boulders or both” to group name.c. C
u = D
60 / D
10 C
c = (D
30)2
D10
x D60
d. If soil contains 15% sand, add “with sand” to group name.e. Gravels with 5 to 12% fines require dual symbols:
GW-GM well-graded gravel with siltGW-GC well-graded gravel with clayGP-GM poorly graded gravel with siltGP-GC poorly graded gravel with clay
f. If fines classify as CL-ML, use dual symbol GC-GM or SC-SM.g. If fines are organic, add “with organic fines” to group name.h. If soil contains 15% gravel, add “with gravel” to group name.i. Sands with 5 to 12% fines require dual symbols:
SW-SM well-graded sand with siltSW-SC well-graded sand with claySP-SM poorly graded sand with siltSP-SC poorly graded sand with clay
j. If Atterberg limits plot in hatched area, soil is a CL-ML, silty clay.k. If soil contains 10 to 29% plus No. 200, add “with sand” or “with gravel” whichever is predominant.l. If soil contains 30% plus No. 200, predominantly sand, add “sandy” to group name.m. If soil contains 30% plus No. 200 predominantly gravel, add “gravelly” to group name.n. PI 4 and plots on or above “A” line.o. PI 4 or plots below “A” line.p. PI plots on or above “A” line.q. PI plots below “A” line.
Poorly graded sand h
Peat
Well-graded gravel d
PI plots on or above “A” line
PI 7 and plots on or above “A” line j
PI 4 or plots below “A” line j
Fin
e-g
rain
ed
So
ils
50%
or
mor
e pa
ssed
the
No.
200
sie
ve
Co
ars
e-g
rain
ed
So
ils
mor
e th
an 5
0% r
etai
ned
onN
o. 2
00 s
ieve
Soils Classification
GravelsMore than 50% of
coarse fractionretained onNo. 4 sieve
Sands50% or more ofcoarse fraction
passesNo. 4 sieve
Silts and ClaysLiquid limit
less than 50
Highly Organic Soils
Silts and claysLiquid limit50 or more
Primarily organic matter, dark in color and organic odor
GroupSymbol
Criteria for Assigning Group Symbols andGroup Names Using Laboratory Tests a
Group Name b
GW
GP
GM
GC
SW
SP
SM
CL
ML
OLOL
SC
Poorly graded gravel d
Silty gravel d f g
Clean Gravels5% or less fines e
Gravels with FinesMore than 12% fines e
Clean Sands5% or less fines i
Sands with FinesMore than 12% i
Fines classify as ML or MH
Fines classify as CL or CH Clayey gravel d f g
Well-graded sand h
Fines classify as CL or CH
Fines classify as ML or MH Silty sand f g h
Clayey sand f g h
Inorganic
Organic Liquid limit - oven dried
Liquid limit - not dried0.75
Inorganic
Organic
PI plots below “A” line
Lean clay k l m
Liquid limit - oven dried
Liquid limit - not dried0.75
CH
MH
OHOH
Fat clay k l m
Elastic silt k l m
Organic clay k l m n
Organic silt k l m o
Organic clay k l m p
Organic silt k l m q
Cu 6 and 1 C
c 3 C
PT
Cu 4 and 1 C
c 3 C
Cu 4 and/or 1 Cc 3 C
Cu 6 and/or 1 C
C 3 C
0 10 16 20 30 40 50 60 70 80 90 100 110
7
“U” L
ine
“A” L
ine
10
20
30
40
50
60
4 0
ML or OL
MH or OHCL or
OL
CH or
OH
CL - ML
Silt k l m

7
5
6
2
11
15
20
23
24
13
10
14
BITAGGFILL
SP
CL
CL-ML
SM
3 1/2 inches Bituminous4 inches Aggregate BasePoorly Graded Sand, fine- to medium-grained, with Silt,trace of gravel, brown, moist.
POORLY GRADED SAND, fine- to medium-grained,with GRAVEL, brown, moist, very loose to mediumdense.
(Outwash)
LEAN CLAY with Sand, brown, moist, stiff.(Alluvium)
SILTY CLAY, brown, moist, rather stiff.(Alluvium)
SILTY SAND, fine- to medium-grained, brown, moist,medium dense.
(Glacial Till)End of Boring
Groundwater was not observed while drilling.
Groundwater was not observed with 29 1/2 feet ofhollow-stem auger in the ground.
Groundwater was not observed to a cave-in depth of20 feet immediately after withdrawl of the auger.
Boring then backfilled.
Qp = 2
94.293.9
84.5
70.5
67.5
64.5
63.5
0.30.6
10.0
24.0
27.0
30.0
31.0
LOCATION: 25' North and 10' West of the SWcorner of Eastman Hall
ST-1
METHOD:
BORING:
SCALE:DRILLER:
BPF Tests or NotesWL
Braun Intertec Corporation ST-1 page 1 of 1
3 1/4" HSA, AutohammerM. Nolden 12/6/11 1" = 5'DATE:
L O G O F B O R I N G(S
ee D
escr
iptiv
e T
erm
inol
ogy
shee
t for
exp
lana
tion
of a
bbre
viat
ions
)
(Soil-ASTM D2488 or D2487, Rock-USACE EM1110-1-2908)
Description of Materials
SC-11-06650
LOG
OF
BORI
NG
N:\
GIN
T\PR
OJE
CTS\
STCL
OU
D\2
011\
0665
0.G
PJ B
RAU
N_V
8_CU
RREN
T.G
DT
3/5
/12
10:5
3
Braun Project SC-11-06650Geotechnical EvaluationEastman Hall RenovationSt. Cloud State UniversitySt. Cloud, Minnesota
Symbol
Elev.feet94.5
Depthfeet
0.0

1*12655
1022242620242530284054
CONCSP
4" Concrete.POORLY GRADED SAND, fine- to medium-grained,with Gravel, brown, moist.
(Glacial Outwash)
END OF HAND AUGER.
*blows for 6" of drive from aDCP.
85.0
76.8
0.3
8.5
LOCATION: Column 49.
H-2
METHOD:
BORING:
SCALE:DRILLER:
BPF Tests or NotesWL
Braun Intertec Corporation H-2 page 1 of 1
Hand AugerS. Thayer 1" = 4'DATE:
L O G O F B O R I N G(S
ee D
escr
iptiv
e T
erm
inol
ogy
shee
t for
exp
lana
tion
of a
bbre
viat
ions
)
(Soil-ASTM D2488 or D2487, Rock-USACE EM1110-1-2908)
Description of Materials
SC-11-06650
LOG
OF
BORI
NG
N:\
GIN
T\PR
OJE
CTS\
STCL
OU
D\2
011\
0665
0.G
PJ B
RAU
N_V
8_CU
RREN
T.G
DT
3/5
/12
11:1
5
Braun Project SC-11-06650Geotechnical EvaluationEastman Hall RenovationSt. Cloud State UniversitySt. Cloud, Minnesota
Symbol
Elev.feet85.3
Depthfeet
0.0

4*8
11211724202776727976
CONCSP
4" Concrete Slab.POORLY GRADED SAND, fine- to medium-grained,with Gravel, brown, moist.
(Glacial Outwash)
END OF HAND AUGER.
*blows for 6" of drive from aDCP.
85.0
78.3
0.3
7.0
LOCATION: Column 50.
H-3
METHOD:
BORING:
SCALE:DRILLER:
BPF Tests or NotesWL
Braun Intertec Corporation H-3 page 1 of 1
Hand AugerS. Thayer 1" = 4'DATE:
L O G O F B O R I N G(S
ee D
escr
iptiv
e T
erm
inol
ogy
shee
t for
exp
lana
tion
of a
bbre
viat
ions
)
(Soil-ASTM D2488 or D2487, Rock-USACE EM1110-1-2908)
Description of Materials
SC-11-06650
LOG
OF
BORI
NG
N:\
GIN
T\PR
OJE
CTS\
STCL
OU
D\2
011\
0665
0.G
PJ B
RAU
N_V
8_CU
RREN
T.G
DT
3/5
/12
11:1
5
Braun Project SC-11-06650Geotechnical EvaluationEastman Hall RenovationSt. Cloud State UniversitySt. Cloud, Minnesota
Symbol
Elev.feet85.3
Depthfeet
0.0
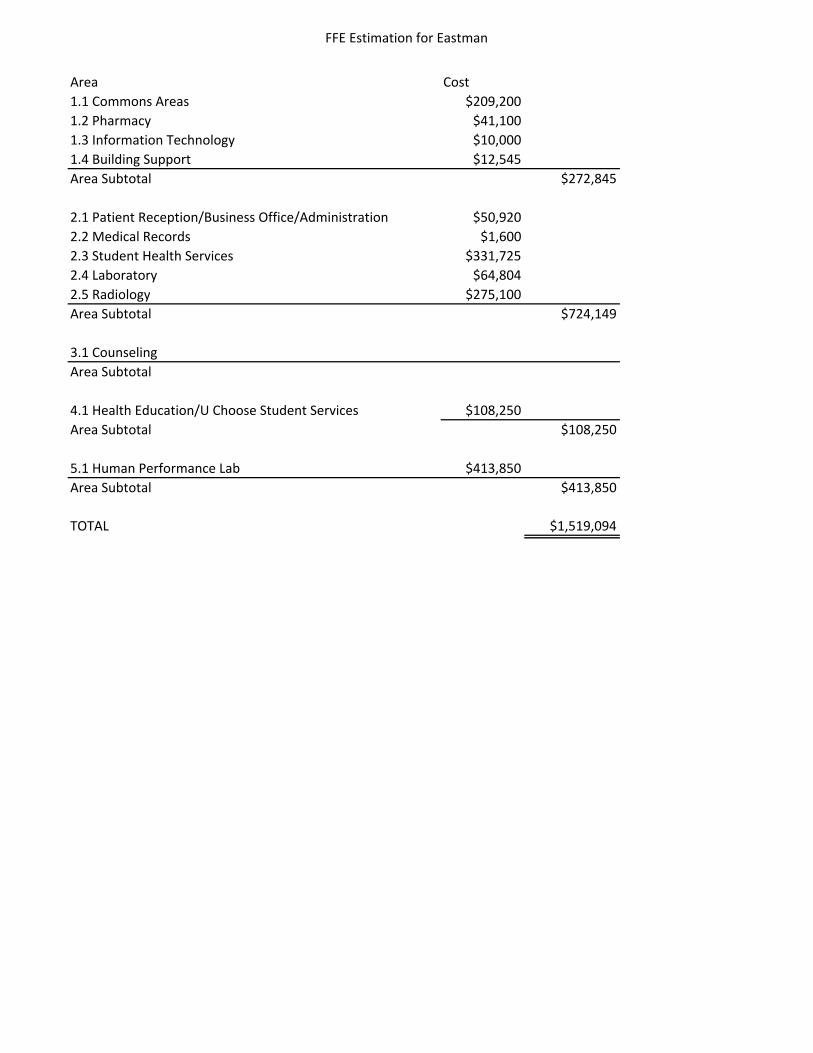
FFE Estimation for Eastman
Area Cost
1.1 Commons Areas $209,200
1.2 Pharmacy $41,100
1.3 Information Technology $10,000
1.4 Building Support $12,545
Area Subtotal $272,845
2.1 Patient Reception/Business Office/Administration $50,920
2.2 Medical Records $1,600
2.3 Student Health Services $331,725
2.4 Laboratory $64,804
2.5 Radiology $275,100
Area Subtotal $724,149
3.1 Counseling
Area Subtotal
4.1 Health Education/U Choose Student Services $108,250
Area Subtotal $108,250
5.1 Human Performance Lab $413,850
Area Subtotal $413,850
TOTAL $1,519,094

1.1 Common Areas
Room/Area Unit NSF Total NSF Est Cost/Unit Total Cost
Check In/Reception 4 75 300 $1,000.00 $4,000.00
Self Check-in Kiosk 7 20 140 $2,500.00 $17,500.00
Multipurpose Room 1 650 650 $15,000.00 $15,000.00
Commons Area/Intro Waiting Area 1 200 200 $11,300.00 $11,300.00
Public Restrooms 2 200 400 $100.00 $200.00
Lactation Room 1 75 75 $4,150.00 $4,150.00
Locker/Shower Rooms 2 350 700 $0.00
Triage Room 0 100 0 $5,260.00 $0.00
Treatment Room 3 120 360 $2,350.00 $7,050.00
Gathering Space/*Café/Retail - Allowance 1 1500 1500 $100,000.00 $100,000.00
Exterior Patio - Allowance 1 $50,000.00 $50,000.00
*Not including kitchen equipment
TOTAL FOR AREA $209,200.00

1.2 Pharmacy
Room/Area Unit NSF Total NSF Est Cost/Unit Total Cost
Waiting 1 180 180 $3,500.00 $3,500.00
OTC Retail Sales 1 160 160 $1,000.00 $1,000.00
Presscription Pick-up/Drop-off 4 60 240 $1,750.00 $7,000.00
Dispensing/Computer Work Stations 4 60 240 $4,000.00 $16,000.00
Drug Storage 1 200 200 $6,000.00 $6,000.00
Pharmacist Office 1 90 90 $5,000.00 $5,000.00
Consultation Room 1 90 90 $2,000.00 $2,000.00
Record Storage 1 180 180 $600.00 $600.00
TOTAL FOR AREA $41,100.00

1.3 Info Tech
Room/Area Unit NSF Total NSF Est Cost/Unit Total Cost
IT Office 1 80 80 $5,500.00 $5,500.00
Data Closets 3 80 240 $1,500.00 $4,500.00
TOTAL FOR AREA $10,000.00

1.4 Bldg Support*
Room/Area Unit NSF Total NSF Est Cost/Unit Total Cost
Storage 1 80 80 $0.00
Mechanical 1 3150 3150 $0.00
Electrial 1 500 500 $0.00
Data 1 150 150 $0.00
Clean Holding 1 150 150 $1,025.00 $1,025.00
Soiled Holding 1 150 150 $565.00 $565.00
Receiving 1 300 300 $7,730.00 $7,730.00
Custodial 1 120 120 $3,225.00 $3,225.00
Trash 1 100 100 $0.00
Recycling 1 100 100 $0.00
*Need major building maintenance equipment (floor scrubbers, waxer, vacuums, etc)
TOTAL FOR AREA $12,545.00

2.1 Reception Business Admin
Room/Area Unit NSF Total NSF Est Cost/Unit Total Cost
SHS Director Office 1 180 180 $8,000.00 $8,000.00
SHS Associate Director Office 1 120 120 $8,000.00 $8,000.00
SHS Administrative Assistant 1 100 100 $5,500.00 $5,500.00
Work Room 1 120 120 $2,420.00 $2,420.00
Cashier 3 60 180 $4,000.00 $12,000.00
Insurance Billing/Coder 2 120 240 $5,000.00 $10,000.00
Insurance Advocate 1 120 120 $5,000.00 $5,000.00
TOTAL FOR AREA $50,920.00

2.2 Medical Records
Room/Area Unit NSF Total NSF Est Cost/Unit Total Cost
Inactive Storage 1 50 50 $600.00 $600.00
Supply Storage 1 100 100 $1,000.00 $1,000.00
TOTAL FOR AREA $1,600.00

2.3 Health Services
Room/Area Unit NSF Total NSF Est Cost/Unit Total Cost
Waiting Room 1 450 450 $15,000.00 $15,000.00
Appointment Desk 2 60 120 $2,760.00 $5,520.00
Conference Room 1 300 300 $4,700.00 $4,700.00
MD Office 1 150 150 $5,500.00 $5,500.00
NP Office 3 180 540 $5,500.00 $16,500.00
PA Office 2 120 240 $5,500.00 $11,000.00
Medical Director's Office 1 150 150 $8,000.00 $8,000.00
Nursing Manager 1 90 90 $8,000.00 $8,000.00
Referrals/Manager's Office 1 150 150 $5,500.00 $5,500.00
Work Room 1 120 120 $2,500.00 $2,500.00
Exam Rooms 18 110 1980 $7,760.00 $139,680.00
Consult Rooms 4 110 440 $5,260.00 $21,040.00
Nursing Station 4 150 600 $3,000.00 $12,000.00
Triage Nurse 2 110 220 $1,750.00 $3,500.00
Observation 1 110 110 $10,000.00 $10,000.00
Procedure Room 1 200 200 $14,220.00 $14,220.00
Injection Room 1 110 110 $3,000.00 $3,000.00
Supply Storage 1 150 150 $1,205.00 $1,205.00
Clean Utility 1 150 150 $1,025.00 $1,025.00
Soiled Holding 1 100 100 $3,065.00 $3,065.00
Patient Toilets 4 65 260 $100.00 $400.00
Staff Break Room 1 500 500 $7,145.00 $7,145.00
Building Services* 1 40 40 $33,225.00 $33,225.00
TOTAL FOR AREA $331,725.00
*Includes emergency call system
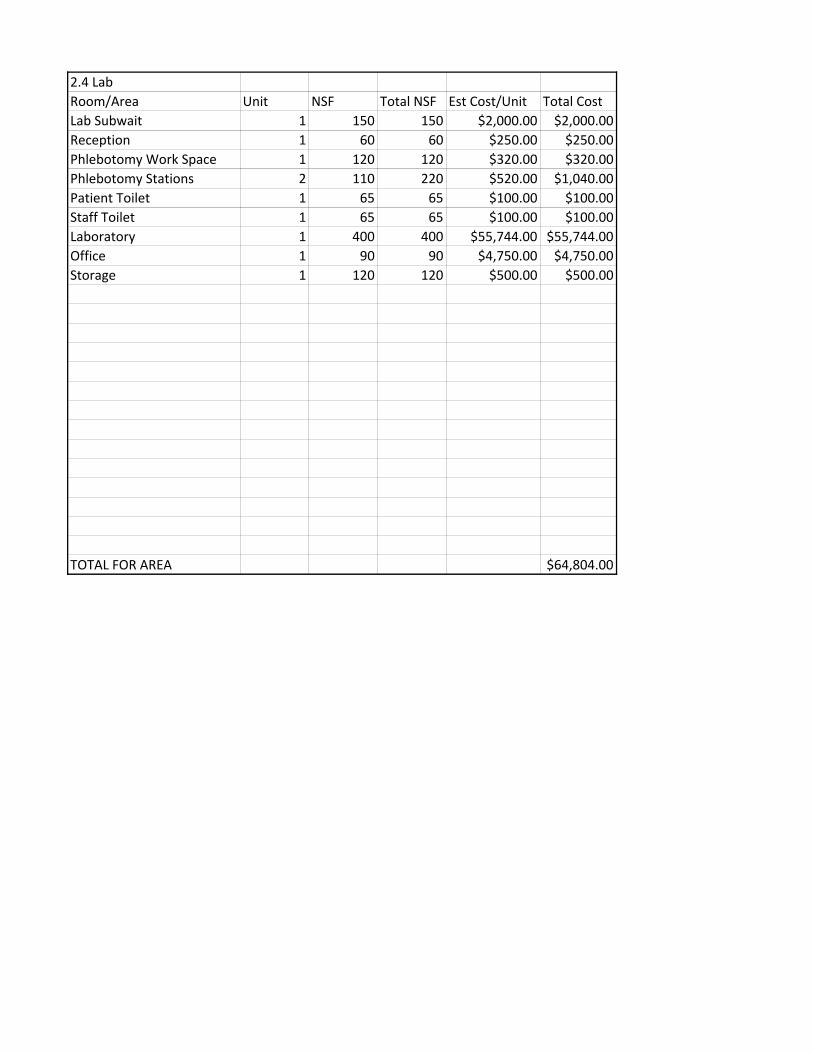
2.4 Lab
Room/Area Unit NSF Total NSF Est Cost/Unit Total Cost
Lab Subwait 1 150 150 $2,000.00 $2,000.00
Reception 1 60 60 $250.00 $250.00
Phlebotomy Work Space 1 120 120 $320.00 $320.00
Phlebotomy Stations 2 110 220 $520.00 $1,040.00
Patient Toilet 1 65 65 $100.00 $100.00
Staff Toilet 1 65 65 $100.00 $100.00
Laboratory 1 400 400 $55,744.00 $55,744.00
Office 1 90 90 $4,750.00 $4,750.00
Storage 1 120 120 $500.00 $500.00
TOTAL FOR AREA $64,804.00

2.5 Radiology
Room/Area Unit NSF Total NSF Est Cost/Unit Total Cost
Subwait 1 120 120 $0.00
Radiography Exam Room 1 450 450 $275,000.00 $275,000.00
Dressing Room 1 75 75 $0.00
Toilet 1 65 65 $100.00 $100.00
Technician Work Room 1 100 100 $0.00
Control Area 1 100 100 $0.00
Viewing/Consultation 1 75 75 $0.00
Storage 1 100 100 $0.00
Wheelchair Storage 1 25 25 $0.00
TOTAL FOR AREA $275,100.00

4.1 Health Education/U Choose Student Services
Room/Area Unit NSF Total NSF Est Cost/Unit Total Cost
Health Educator Office 2 120 240 $8,000.00 $16,000.00
U Choose Administrator Office 1 120 120 $8,000.00 $8,000.00
Coordinator Office 2 100 200 $5,500.00 $11,000.00
Offices 3 100 300 $5,500.00 $16,500.00
Health Promotion Marketing 1 120 120 $5,000.00 $5,000.00
Peer Ed Area 1 350 350 $18,500.00 $18,500.00
Resource Area/Husky Neighbors 1 500 500 $6,900.00 $6,900.00
Storage Space 1 400 400 $1,000.00 $1,000.00
Classroom 1 700 700 $17,100.00 $17,100.00
Graduate Assistant/Student Workspace 1 850 850 $7,850.00 $7,850.00
Staff Toilet 2 65 130 $100.00 $200.00
Student Toilet 2 65 130 $100.00 $200.00
TOTAL FOR AREA $108,250.00

5.1 Human Performance Lab
Room/Area Item Comments Total NSFEst Cost/Unit Total Cost
Conference Room Table 1 $1,500 $1,500
Chairs 12 $200 $2,400
White board 4 $200 $800
Stress Testing Treadmill Trackmaster TMX425 2 $5,000 $10,000
PC EKG Software
See Iworks, Welch Allyn, Cardiosoft, Quinton,
Medgraphics 2 $4,000 $8,000
AED Defibrillator Medtronic LifePak 1 $2,000 $2,000
Biochem Lab
Refridgerator/Freez
er 1 $800 $800
Prep table 2 $150 $300
Chairs 6 $100 $600
Lactate analyzer YSI 1 $15,000 $15,000
Body Composition Dexa Scan
See dexascanners.com (current models are
Lunar (GE), Norland (Siemens), Hologic) 1 $40,000 $40,000
Exam table 2 $500 $1,000
lockers (6) 3 $500 $1,500
Towel dispensers 4 $50 $200
Coat rack 3 $50 $150
Water filter 1 $600 $600
Water pump 1 $300 $300
UWW Tank (cut and weld old tank) 1 $500 $500
mirror 2 $100 $200
Gait Analysis Treadmill AMTI Force-Sensing Tandem Treadmill 1 $145,000 $145,000
Quality digital video
camera Basler or better 2 $750 $1,500
Studio lights and
tripods See B&H 2 $300 $600
24" monitor 1 $300 $300
Power
Cycle Ops with
Power Tap Ergometer 1 $1,500 $1,500
Bike roller Bike roller 1 $200 $200
Anat/Phys Lab Class BioPac Station http://www.biopac.com/ 4 $4,000 $16,000

Misc
Digital
thermometer Model that will work with existing probes 3 $0
USB Data
Acquisition Station Computer, AD, terminal block, software 1 $5,000 $5,000
Tools Drill press Check out Grizzly Co. 1 $800 $800
Table saw 1 $900 $900
Band saw 1 $1,000 $1,000
Combination
sander 1 $800 $800
Metal cutting
bandsaw 1 $900 $900
Mig Welder 1 $1,200 $1,200
Office furniture Desks 12 $300 $3,600
Partitions 12 $100 $1,200
Computer stations 12 $2,500 $30,000
Chairs 16 $200 $3,200
Filing cabinets 16 $100 $1,600
Receptionist center 1 $4,000 $4,000
Central
Printer/Copy 1 $1,500 $1,500
Moving Classroom
Treadmill desks
w/treadmills http://www.lifespanfitness.com/ 24 $2,000 $48,000
Smart classroom 2 $25,000 $50,000
Classroom tables 1st or 3rd floor 16 $200 $3,200
Classroom chairs 30 $200 $6,000
$413,850