Embed Size (px)
Citation preview

3D grain structures from X-ray diffraction contrast tomography
W. Ludwig1,2, A. King2,3, G. Johnson2,3, P. Reischig2,S. Rolland2, M. Herbig1, E.M. Lauridsen4
1MATEIS, INSA-Lyon, France2ESRF, Grenoble, France
3Manchester University, UK4 Risoe National Lab, Roskilde, Denmark

Improve our understandingof how structural materials react to external stimuli
- deformation- annealing- chemical environment
Focus on metallic alloys (polycrystalline)
Spanos, Rowenhorst, Lewis, GeltmacherCombining serial sectioning, EBSD andFinite Element Modeling, MRS Bulletin

Outline:
Non destructive mapping of polycrystals in 3D
Diffraction contrast tomography:- principle- analysis strategy- current possibilities- limitations
Applications
ConclusionsTopotomography of Al grainduring recrystallization

Conventional absorption tomography
Collect ~1500 absorption images over 180º rotation
Filtered backprojection algorithm yields local attenuation coefficient
Synchrotron or lab X-rays, neutrons, etc• Uses absorption or phase constrast.• Pores, cracks, inclusions, composite materials.• No contrast between grains of the same phase
• No crystallographic orientation or strain information

X-ray absorption or phase contrast imaging may reveal 3D grain structure in these cases
However: crystallographic orientation unknown
…some exceptions
• Segregation and/or precipitation at grain boundaries• Duplex microstructures• Liquid metal penetration (Al - Ga)

3D grain microstructure from X-rayphase contrast tomography
E.M. E.M. E.M. E.M. LauridsenLauridsenLauridsenLauridsen, R. Fonda, W. Ludwig et al., R. Fonda, W. Ludwig et al., R. Fonda, W. Ludwig et al., R. Fonda, W. Ludwig et al.
50µm
30µm
Ti β alloy (21s) with α phase precipitates
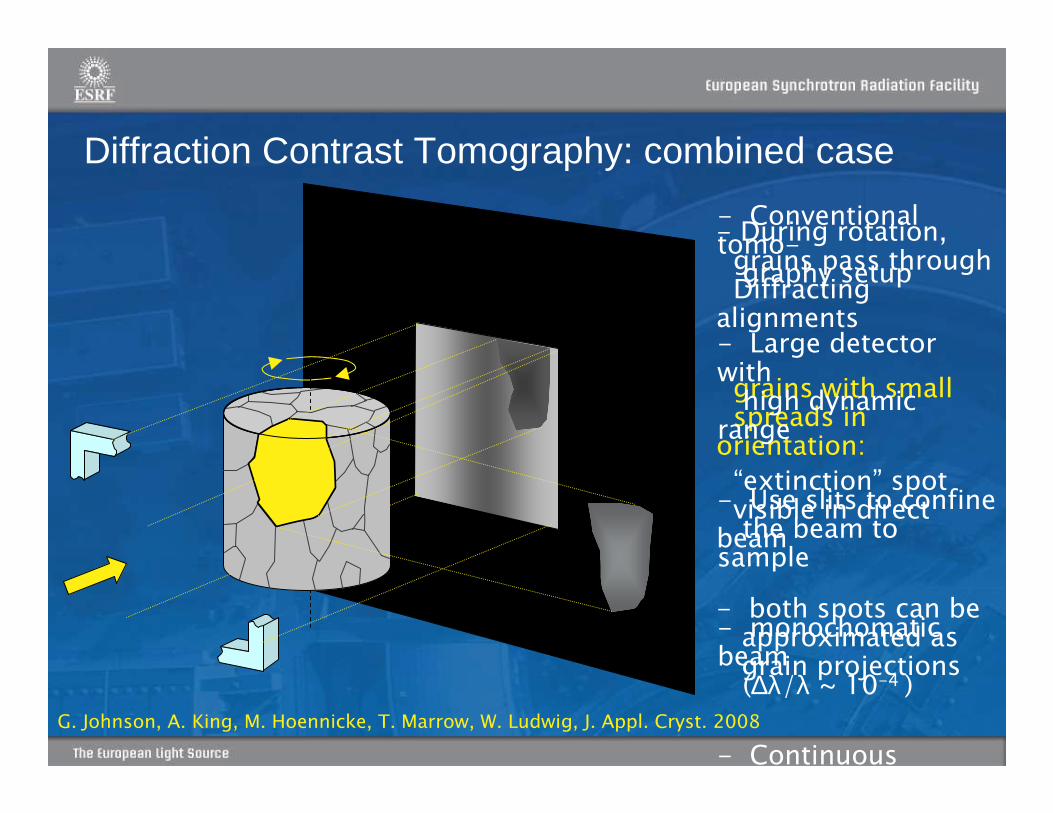
Diffraction Contrast Tomography: combined case
- During rotation,grains pass throughDiffracting
alignments
grains with smallspreads in
orientation:
“extinction” spotvisible in direct
beam
- both spots can beapproximated asgrain projections
- Conventional tomo-graphy setup
- Large detector withhigh dynamic
range
- Use slits to confinethe beam to
sample
- monochomaticbeam(∆λ/λ ~ 10-4 )
- Continuous
G. Johnson, A. King, M. Hoennicke, T. Marrow, W. Ludwig, J. Appl. Cryst. 2008

During sample rotation should see each grain ~ 20 - 100 times.
Some may be lost• Overlaps• Off the detector• Low contrast
Enough to reveal the 3D grain shape through ART reconstruction
Diffraction contrast tomography: combined acquisition

Segment and record diffraction spots in database (~20,000 - 100,000)
Need to determine diffraction angles (θ,η,ω)
Determination of diffraction vectors
90-2θ
Visualise 180ºsample rotation as reversed beam direction, and detector position.
Find Friedel pairs of diffraction spots
•(hkl), (-h-k-l) separated by 180º ω

Image processing
Separate diffraction contrasts from images(background removal, filtering)
Direct beam area (frequent overlaps)
Extinction spot
Diffraction spotWell spaced out no overlapping spots
1 mm
add flipped 180° offset image

Slide: 11
3D backprojection geometry (as opposed to pseudo 2D) for the ART reconstruction has been implemented� Gives more accurate grain reconstructions
Data processing - grain reconstructions
Introduction - Principles - Results - Perspectives - Conclusions

Analysis route
1. Background removal, integration and segmentation of diffraction spots
2. Find Friedel pairs of diffraction spots (pair matching)
3. Find consistent groups of reflections (indexing)
Results: - Sets of projections belongingto individual grains
- Grain orientation
- Grain position
- elastic strain tensors (optional)
5. 3D grain shape from ART (grain by grain)
6. Assemble sample volume
7. Post-process grain map (remove overlaps, fill gaps)
QuickTime™ and a decompressor
are needed to see this picture.
200 µm

Slide: 13Michael Herbig Characterization of Short Fatigue Crack Propagation
Experimental – Diffraction Contrast Tomography
Removed
overlaps
Dilated until
grains touch
Reconstruction
output
Question: are grain boundaries correct?Reconstructed volume
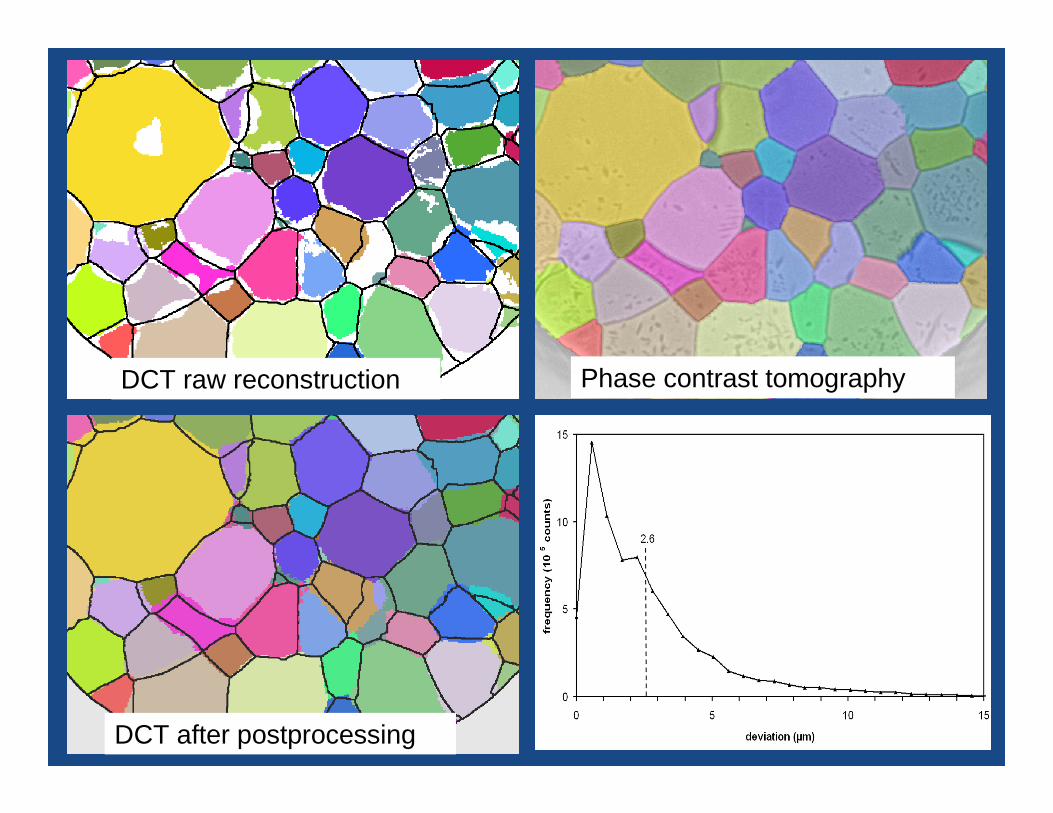
Segmented from phasecontrast tomography
DCT raw reconstruction
DCT after postprocessing
Phase contrast tomography

3D grain reconstruction from DCT
� Acquisition time @ ID11: 2 h
� 1008 reconstructed grains
� 2 days of processing (30 nodes)
� ~ 3 �m accuracy
QuickTime™ and a decompressor
are needed to see this picture.
100 µm
QuickTime™ and a decompressor
are needed to see this picture.
W. Ludwig et al., Rev. Sci. Instrum. 80 033905 (2009)

Known limitations…
1. Sample requirements
- low mosaicity (< 1 degree: recrystallisation or solidification)
- grain size bigger than about 20 times pixel size
- sample diameter less than 20 times grain size
- strong texture and high mosaicity reduce these numbers
2. Significant orientation & strain distributions inside grains violateassumption of parallel projections
3. Assumption of kinematical scattering may be violated:
Absorption, multiple scattering & dynamical diffraction effects
alter intensity distributions

Application examples
Determination of elastic strain tensors
during a tensile load test
(master thesis P. Reischig, TU Delft 2008)
Analysis of short fatigue crack
propagation in Ti alloy
(PhD thesis project of M. Herbig)

Measurement device
25 mm
- 360 degree visibility
- 500N load cell
- mechanical loading (fine thread)
10 mm
∅ 0.6 x 2 mm
Material: Ti β alloy 21S (bcc)electrical discharge machiningP. Bernard, ESRF
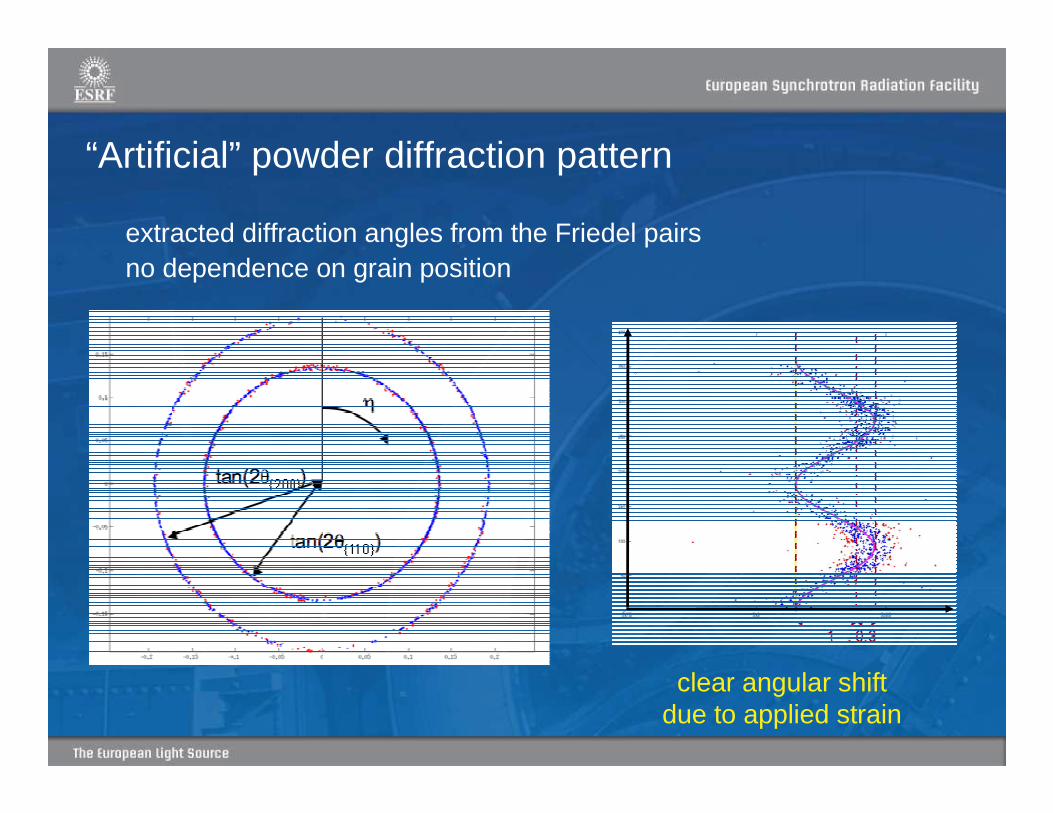
“Artificial” powder diffraction pattern
extracted diffraction angles from the Friedel pairsno dependence on grain position
clear angular shiftdue to applied strain

Fit of the strain tensor components
Combines:
Fit of strain tensors using linear elasticity model
change in interplanar distancechange in interplanar angles
Measured variables: n (plane normals), Bragg angles
Theoretical interplanar angles in unstrained state (bcc)
Input
Reference lattice parameter
P. Reischig, master thesis

Average elastic strain tensors

Elongation along the load axis (ε33)
Measured strain tensor components
= 467.9 Mpa= 0.00572
… analysis in progress

CFEM simulation of elastic deformation
Collaboration with H. Proudhon, S. Forest, ENSMP
Strong variation of local stress& strain distribution
Need to develop local characterizationtechniques (e.g. combine DCT &scanning µ-diffraction)
Comparison of grainaverage values: …in progress

Characterization of short fatigue crack propagation
Experiment: - DCT of FIB notched sample (ID11)- in-situ crack propagation (25 time steps, ID19)
Heat treatment (grain boundary decoration)
- holotomography (ID19)
QuickTime™ and a decompressor
are needed to see this picture.
“Short fatigue crack problem”
- strong variability- no reliable prediction / simulation- need for more fundamental work- experimental challenge
SEM: Fatigue fracture surface

In situ crack propagation at ID19
QuickTime™ and a decompressor
are needed to see this picture.
Crack initiation fromFIB notch
25 time steps
0.7 µm voxels
3D rendition of short fatigue crack in Ti 21S alloy sample

QuickTime™ and a decompressor
are needed to see this picture.

Slide: 27Michael Herbig Characterization of Short Fatigue Crack Propagation
Orientation of crack insample coordinate system
Pole figure of upper hemisphere
z
y
x
Orientation of crack incrystal coordinate system
001
010
100

Slide: 28Michael Herbig Characterization of Short Fatigue Crack Propagation
Data Analysis – Orientation of crack in single grain
crack in single grain color coded with respect to crystal coordinate system

Conclusions
X-ray Diffraction Contrast Tomography can provide
- 3D grain shapes ~ 3 µm accuracy- orientations ~ 0.1 degree- elastic strain tensors 4.10-4 (?)- attenuation coefficient
in plastically undeformed polycrystals (single phase) fulfilling some requirements on grain vs. sample size, mosaicity and texture.
The technique can be readily combined with in-situ X-ray tomography observations and provides direct input for 3D Finite Element simulations
… exciting times for 3D Materials Science

Future directions / goals
• Further improve spatial resolution
• detector point spread function• improved reconstruction algorithms :
• fill gaps based on forward simulation • advanced algebraic reconstruction algorithms
• Characterization of local orientationand strain state in deformed materials
• combine DCT & scanning microdiffraction approach• use of Monte Carlo simulation techniques

Acknowledgements
ESRF:
Peter Reischig (master student, ESRF)
Andrew King (postdoc, Manchester, ESRF)
Sabine Rolland (postdoc, CNRS)
Greg Johnson (postdoc, Manchester, ESRF)
Michael Herbig (thesis student, INSA Lyon)
Peter Cloetens (scientist, ESRF)Elodie Boller (ID19, ESRF)
Alejandro Homs (Bliss, ESRF)
Bernard Pascal (Engineering, ESRF)
Jose Baruchel (Head of Imaging group, ESRF)
Mateis, INSA Lyon:
Jean-Yves Buffiere, Eric Maire
Risoe: Manchester University:
Erik Mejdal Lauridsen James Marrow
Henning Friis Poulsen TU Delft:
Soeren Schmidt Sybrand van der Zwaag


![Diffraction Contrast Tomography - ZEISS · crystallographic imaging, known as diffraction contrast tomography (DCT) has emerged over the past decade [3,4]. ... can be visualized through](https://img.pdfslide.net/doc/110x75/5b5bf6077f8b9ab8578f00c1/diffraction-contrast-tomography-zeiss-crystallographic-imaging-known-as-diffraction.jpg)