Embed Size (px)
Citation preview
Using 3Dimensional Indicator for Bulk Solids Stress Controlling
Ales Sliva Faculty of Mechanical Engineering, Institute of Transportation, Laboratory of Bulk Solids
VSB-Technical University of Ostrava 17. listopadu 15, 708 33 Ostrava-Poruba
CZECH REPUBLIC http://www.id.vsb.cz
Abstract: - In the past fatal injuries would often happen when the system operator, who was trying to ensure the flow of material from the storage system by use of mechanical means, would be buried during the fill. It is much better today with newly designed storage systems, and ensuring the continuous flow of material has become more efficient, making the problems a rare occurrence. Still, there is a whole line of obsolete systems in use today with operating problems and it is very difficult to identify the location and nature of the malfunction in order to propose measures for ensuring the trouble-free operation of the system. The measurement process, including the procedure for processing values within the interactive software environment that was created, has been thoroughly explained in the paper and researched in an actual silo loaded with a poured bulk solid. Real results and outputs of the investigation have been presented and discovered in the paper. Key-Words: - Storage system, bulk solid, mechanical mean, continuous flow 1 Introduction Yet, there are not investigated means able to register real stresses/pressures inside storage systems deeply. Current indicators work in 2D generally and moreover, usually are situated to inner circumference of a body silo. That is the reason, why often a wall stress/pressure has been measured instead of a real stress/pressure inside bulk solids pored in a silo. The problem is more acute in regard to transport of tough flow powder, which often changes flow properties depending upon storage and environmental conditions, such as storage time, temperature, moisture, etc. Detection of the real pressure inside the storage mass using the stress/pressure indicator may be a possible solution for the problem, which is encouraged by modeling of the particulate solid flow. In present, there are a lot of storage systems not working properly in Czech industry. The reason is the complexity of powders and the ease with which their bulk properties may change [10,11]. The nature of powders therefore is such that an adverse combination of environmental factors can cause an otherwise free flowing powder to block or flow with difficulty. Conversely, a very cohesive powder may be processed satisfactorily if the handling conditions are optimized. Powders are often considered as a mass of solid particles or granules. In fact, these particles are usually surrounded by air (or other fluid [4]) and it is the solids plus fluid combination that significantly affects the bulk properties of the powder. It is perhaps the most complicating characteristic because the amount of fluid can be so variable [3].
A particulate solid is an assembly consisting of particles of various shape, size, number, but the same bulk density. Particulate solids incl. powders are probably the least predictable of all materials in relation to flowability because of the large number of factors that can change their rheological properties. Therefore, its properties depend on a lot of factors, such as mechanical-physical properties (size distribution, shape, porosity and so on) [1,2], environmental conditions mentioned above and actual conditions among particulates considered for fine particles/powders, in particular (electrostatic and chemical changes, van der Walls forces, mechanism of growth created agglomerates from individual particulates, etc.). For this purpose a 3Dimensional indicator for bulk solids (fig. 2, [8-11]) has been designed and constructed for allowing the actual stress in critical areas where the failures tend to occur to be detected. The change in stress (pressure), rather an increase in it, is the indication that a failure has occurred. Earlier indicators were based on the presumption that pressure and its fluctuations were transmitted to the wall of the container and for this reason they were located directly on the container (silo) wall itself. Unfortunately, this measurement often didn’t reflect the real situation or the actual status due to the poor transmission of the signal from the source of the problematic material. The 3D indicator, including a methodology for identifying pressures using the SW developed for it (fig. 7 and 8), is able to completely solve these problems and, moreover, register all sudden occurrences that take place directly within the bulk solid.
2005 WSEAS Int. Conf. on DYNAMICAL SYSTEMS and CONTROL, Venice, Italy, November 2-4, 2005 (pp299-302)
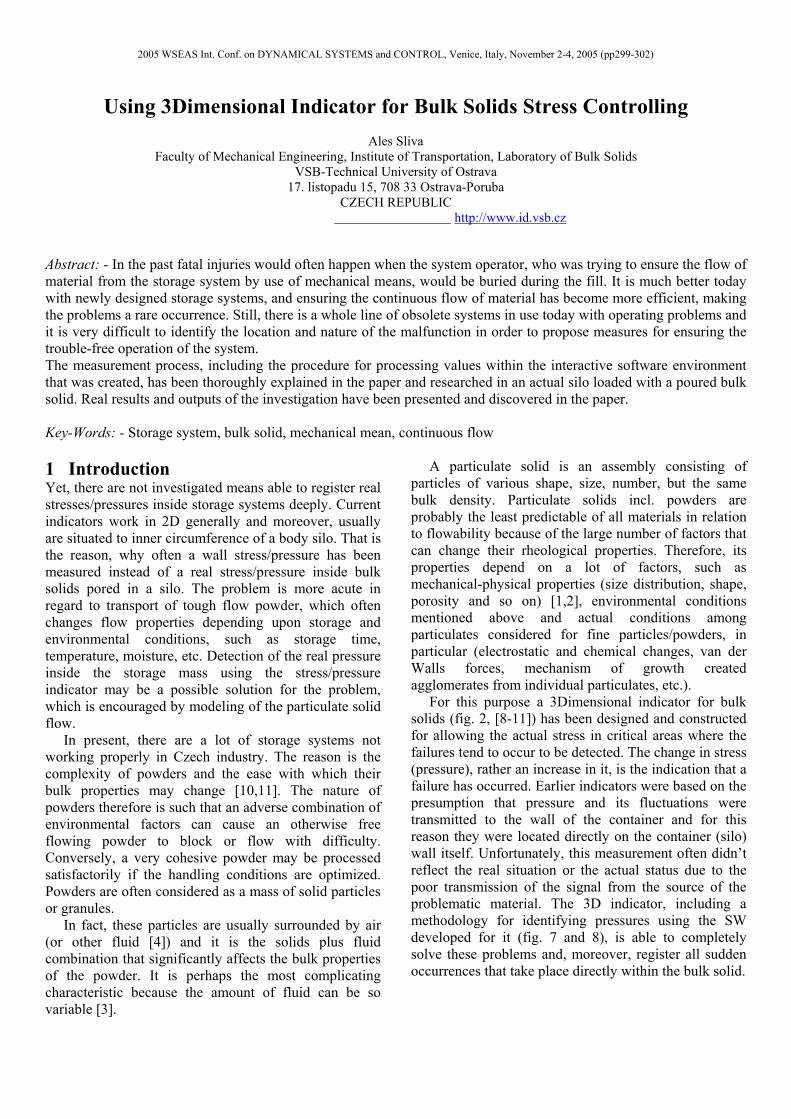
2 The application for connecting the model of the 3 Dimensional indicator to a 16-bit card NI A model of the functional connection of the 3D indicator with all four detectors and its location in the storage silo is shown in fig. 6 (schematic of the connection fig. 1). The stress of the bulk solid [Pa] in its actual location is transmitted from the surface of the bulk solid (fig. 5-h) to the deformation faces with the detectors (tensometric sensors, fig. 8) connected to the full bridge. The deformation is registered by a change in the stress [V] on the terminal outputs of the bridge connected to an AD 524C measuring amplifier (fig. 3). These measuring amplifiers are moreover powered by the base voltage Vs emitted from the power source (fig. 4) and the given change in stress [V] is registered by transmitting the signal from the terminal block to the measuring card located in the computer. The signals (a total of 4, see fig. 8) can then be properly saved and processed with the appropriate measuring software for multi-channel observation.
Fig.1. A description of the measuring system consisting of the power source, tensometric sensor, measuring amplifier, measuring card NI and PC. Source: [9]
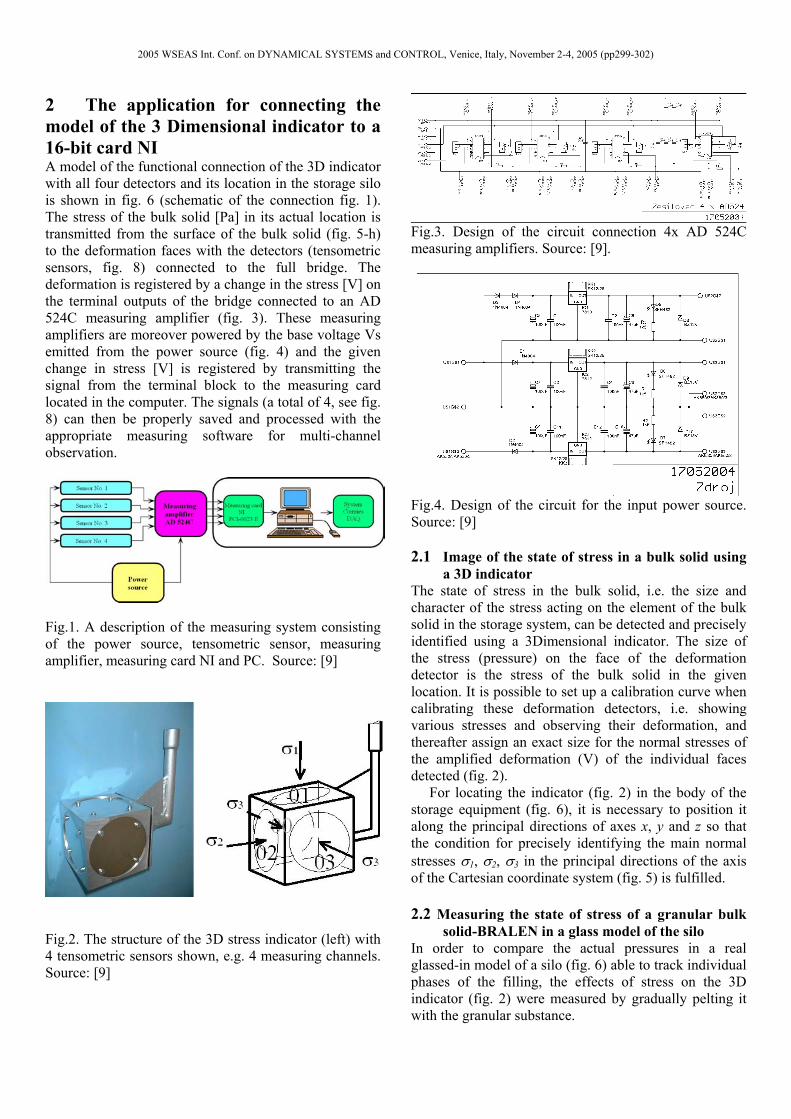
Fig.2. The structure of the 3D stress indicator (left) with 4 tensometric sensors shown, e.g. 4 measuring channels. Source: [9]
Fig.3. Design of the circuit connection 4x AD 524C measuring amplifiers. Source: [9].
Fig.4. Design of the circuit for the input power source. Source: [9] 2.1 Image of the state of stress in a bulk solid using
a 3D indicator The state of stress in the bulk solid, i.e. the size and character of the stress acting on the element of the bulk solid in the storage system, can be detected and precisely identified using a 3Dimensional indicator. The size of the stress (pressure) on the face of the deformation detector is the stress of the bulk solid in the given location. It is possible to set up a calibration curve when calibrating these deformation detectors, i.e. showing various stresses and observing their deformation, and thereafter assign an exact size for the normal stresses of the amplified deformation (V) of the individual faces detected (fig. 2). For locating the indicator (fig. 2) in the body of the storage equipment (fig. 6), it is necessary to position it along the principal directions of axes x, y and z so that the condition for precisely identifying the main normal stresses σ1, σ2, σ3 in the principal directions of the axis of the Cartesian coordinate system (fig. 5) is fulfilled. 2.2 Measuring the state of stress of a granular bulk
solid-BRALEN in a glass model of the silo In order to compare the actual pressures in a real glassed-in model of a silo (fig. 6) able to track individual phases of the filling, the effects of stress on the 3D indicator (fig. 2) were measured by gradually pelting it with the granular substance.
2005 WSEAS Int. Conf. on DYNAMICAL SYSTEMS and CONTROL, Venice, Italy, November 2-4, 2005 (pp299-302)
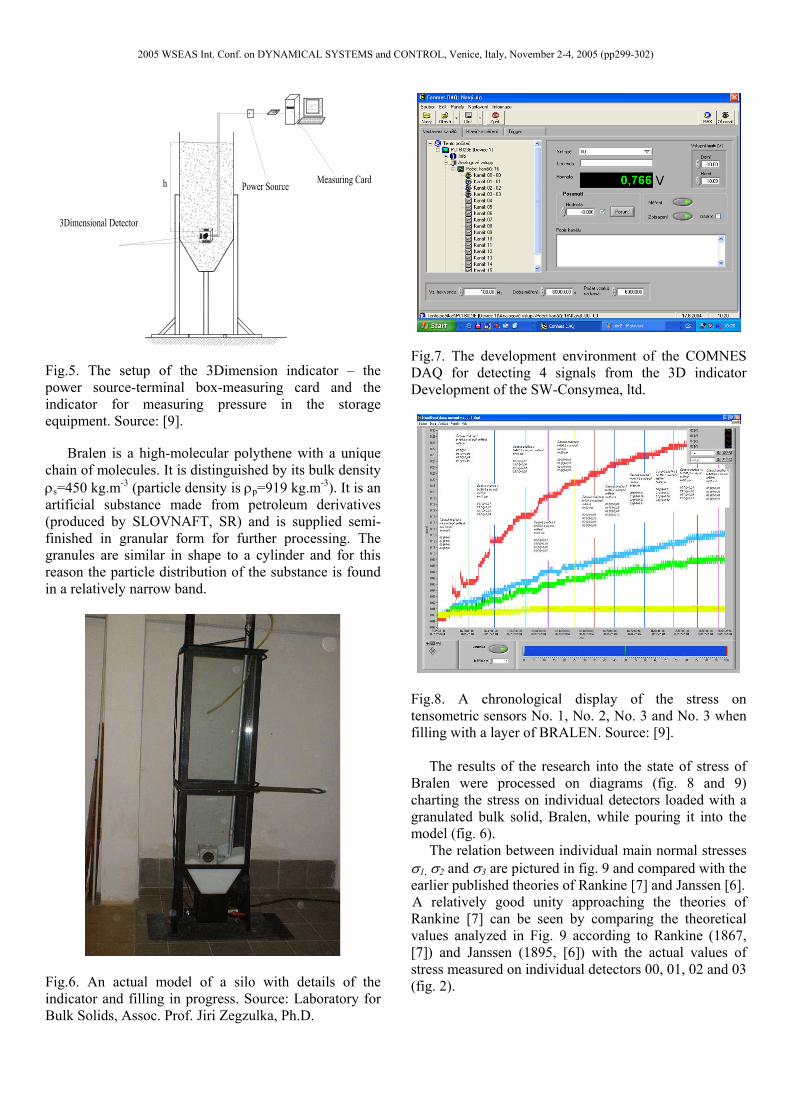
Fig.5. The setup of the 3Dimension indicator – the power source-terminal box-measuring card and the indicator for measuring pressure in the storage equipment. Source: [9]. Bralen is a high-molecular polythene with a unique chain of molecules. It is distinguished by its bulk density ρs=450 kg.m-3 (particle density is ρp=919 kg.m-3). It is an artificial substance made from petroleum derivatives (produced by SLOVNAFT, SR) and is supplied semi-finished in granular form for further processing. The granules are similar in shape to a cylinder and for this reason the particle distribution of the substance is found in a relatively narrow band.
Fig.6. An actual model of a silo with details of the indicator and filling in progress. Source: Laboratory for Bulk Solids, Assoc. Prof. Jiri Zegzulka, Ph.D.
Fig.7. The development environment of the COMNES DAQ for detecting 4 signals from the 3D indicator Development of the SW-Consymea, ltd.
Fig.8. A chronological display of the stress on tensometric sensors No. 1, No. 2, No. 3 and No. 3 when filling with a layer of BRALEN. Source: [9]. The results of the research into the state of stress of Bralen were processed on diagrams (fig. 8 and 9) charting the stress on individual detectors loaded with a granulated bulk solid, Bralen, while pouring it into the model (fig. 6). The relation between individual main normal stresses σ1, σ2 and σ3 are pictured in fig. 9 and compared with the earlier published theories of Rankine [7] and Janssen [6]. A relatively good unity approaching the theories of Rankine [7] can be seen by comparing the theoretical values analyzed in Fig. 9 according to Rankine (1867, [7]) and Janssen (1895, [6]) with the actual values of stress measured on individual detectors 00, 01, 02 and 03 (fig. 2).
2005 WSEAS Int. Conf. on DYNAMICAL SYSTEMS and CONTROL, Venice, Italy, November 2-4, 2005 (pp299-302)
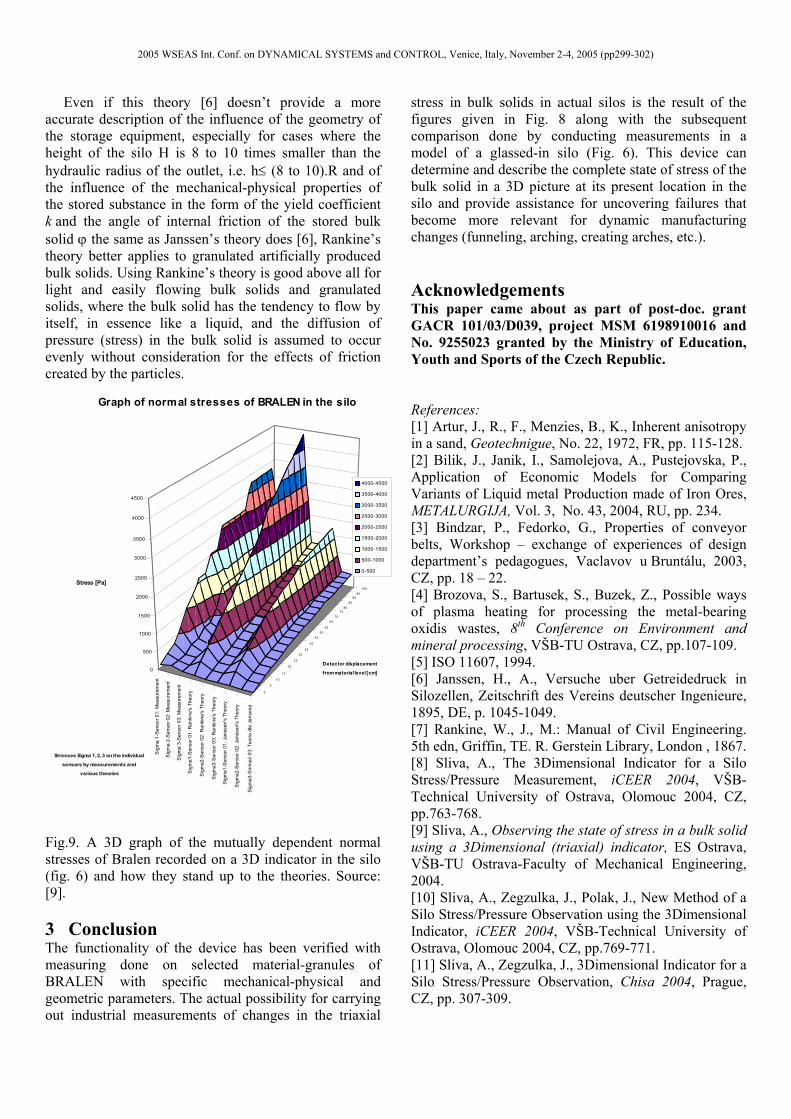
Even if this theory [6] doesn’t provide a more accurate description of the influence of the geometry of the storage equipment, especially for cases where the height of the silo H is 8 to 10 times smaller than the hydraulic radius of the outlet, i.e. h≤ (8 to 10).R and of the influence of the mechanical-physical properties of the stored substance in the form of the yield coefficient k and the angle of internal friction of the stored bulk solid ϕ the same as Janssen’s theory does [6], Rankine’s theory better applies to granulated artificially produced bulk solids. Using Rankine’s theory is good above all for light and easily flowing bulk solids and granulated solids, where the bulk solid has the tendency to flow by itself, in essence like a liquid, and the diffusion of pressure (stress) in the bulk solid is assumed to occur evenly without consideration for the effects of friction created by the particles.
0
5
10
15
20
25
3035
40
45
5055
65
7075
80
8590
95
100
Sig
ma
1-S
enso
r 01:
Mea
sure
men
t
Sig
ma
2-S
enso
r 02:
Mea
sure
men
t
Sig
ma
3-S
enso
r 03:
Mea
sure
men
t
Sig
ma1
-Sen
sor 0
1: R
anki
ne's
The
ory
Sig
ma2
-Sen
sor 0
2: R
anki
ne's
The
ory
Sig
ma3
-Sen
sor 0
3: R
anki
ne's
The
ory
Sig
ma1
-Sen
sor 0
1: J
anss
en's
The
ory
Sig
ma2
-Sen
sor 0
2: J
anss
en's
The
ory
Sig
ma3
-Sní
mač
03:
Teo
rie d
le J
anse
na
0
500
1000
1500
2000
2500
3000
3500
4000
4500
Stress [Pa]
Detector displacement
from material level [cm]
Stresses Sigma 1, 2, 3 on the individual
sensors by measurements and
various theories
Graph of normal stresses of BRALEN in the silo
4000-4500
3500-4000
3000-3500
2500-3000
2000-2500
1500-2000
1000-1500
500-1000
0-500
Fig.9. A 3D graph of the mutually dependent normal stresses of Bralen recorded on a 3D indicator in the silo (fig. 6) and how they stand up to the theories. Source: [9].
3 Conclusion The functionality of the device has been verified with measuring done on selected material-granules of BRALEN with specific mechanical-physical and geometric parameters. The actual possibility for carrying out industrial measurements of changes in the triaxial
stress in bulk solids in actual silos is the result of the figures given in Fig. 8 along with the subsequent comparison done by conducting measurements in a model of a glassed-in silo (Fig. 6). This device can determine and describe the complete state of stress of the bulk solid in a 3D picture at its present location in the silo and provide assistance for uncovering failures that become more relevant for dynamic manufacturing changes (funneling, arching, creating arches, etc.). Acknowledgements This paper came about as part of post-doc. grant GACR 101/03/D039, project MSM 6198910016 and No. 9255023 granted by the Ministry of Education, Youth and Sports of the Czech Republic. References: [1] Artur, J., R., F., Menzies, B., K., Inherent anisotropy in a sand, Geotechnigue, No. 22, 1972, FR, pp. 115-128. [2] Bilik, J., Janik, I., Samolejova, A., Pustejovska, P., Application of Economic Models for Comparing Variants of Liquid metal Production made of Iron Ores, METALURGIJA, Vol. 3, No. 43, 2004, RU, pp. 234. [3] Bindzar, P., Fedorko, G., Properties of conveyor belts, Workshop – exchange of experiences of design department’s pedagogues, Vaclavov u Bruntálu, 2003, CZ, pp. 18 – 22. [4] Brozova, S., Bartusek, S., Buzek, Z., Possible ways of plasma heating for processing the metal-bearing oxidis wastes, 8th Conference on Environment and mineral processing, VŠB-TU Ostrava, CZ, pp.107-109. [5] ISO 11607, 1994. [6] Janssen, H., A., Versuche uber Getreidedruck in Silozellen, Zeitschrift des Vereins deutscher Ingenieure, 1895, DE, p. 1045-1049. [7] Rankine, W., J., M.: Manual of Civil Engineering. 5th edn, Griffin, TE. R. Gerstein Library, London , 1867. [8] Sliva, A., The 3Dimensional Indicator for a Silo Stress/Pressure Measurement, iCEER 2004, VŠB- Technical University of Ostrava, Olomouc 2004, CZ, pp.763-768. [9] Sliva, A., Observing the state of stress in a bulk solid using a 3Dimensional (triaxial) indicator, ES Ostrava, VŠB-TU Ostrava-Faculty of Mechanical Engineering, 2004. [10] Sliva, A., Zegzulka, J., Polak, J., New Method of a Silo Stress/Pressure Observation using the 3Dimensional Indicator, iCEER 2004, VŠB-Technical University of Ostrava, Olomouc 2004, CZ, pp.769-771. [11] Sliva, A., Zegzulka, J., 3Dimensional Indicator for a Silo Stress/Pressure Observation, Chisa 2004, Prague, CZ, pp. 307-309.
2005 WSEAS Int. Conf. on DYNAMICAL SYSTEMS and CONTROL, Venice, Italy, November 2-4, 2005 (pp299-302)