Embed Size (px)
Citation preview
1
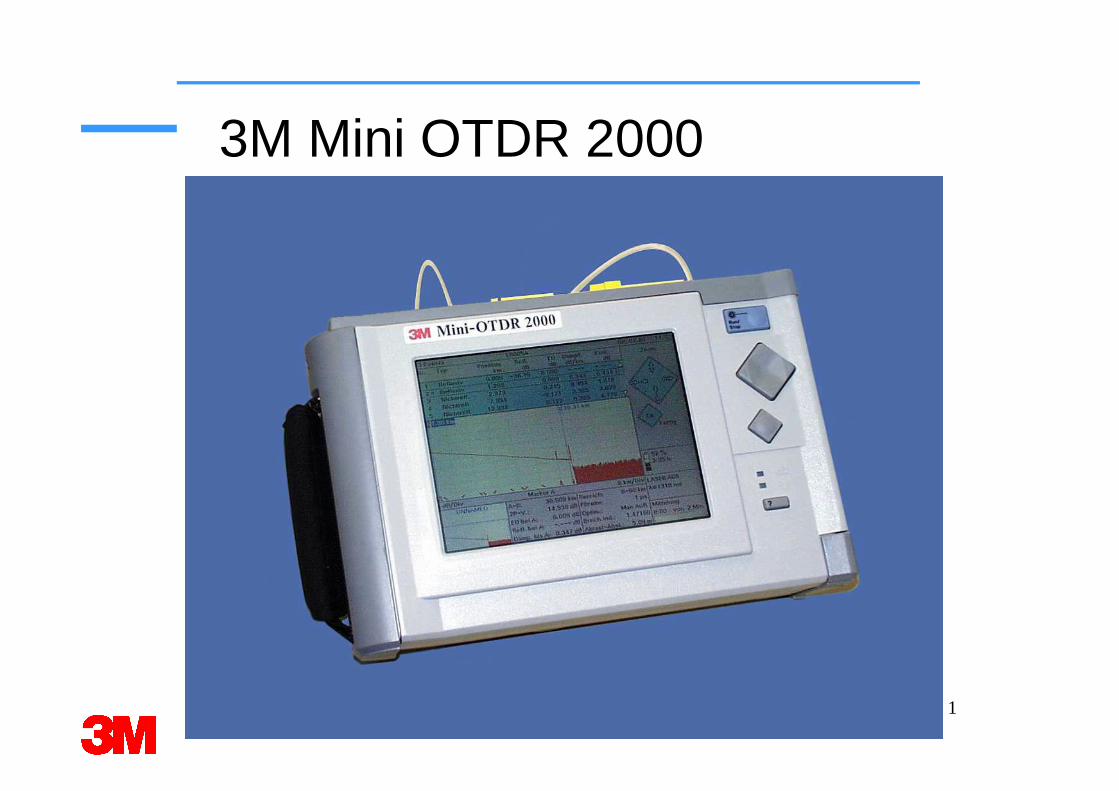
3M Mini OTDR 2000
2
3M Mini-OTDR 2000User training -
Agenda8:00 Welcome and Agenda Review8:45 Introduction to Fiber Optics and OTDR Theory9:45 Introduction to OTDR Measurements11:00 Introduction to the 3M 2000 Mini-OTDR11:30 Hands on Measurements with the 3M Mini-OTDR 200012:30 Lunch13:30 Question and Answers14:00 END
3
4
l Introduction to 3M Lightwave l Fibers and Connectorsl Optical Time Domain Reflectometer Theoryl OTDR Measurementsl Introducing the 3M Mini-OTDR 2000l Software Utilities the 3M Mini OTDR 2000l Using the 3M Mini OTDR 2000
OTDR Measurements Agenda
5
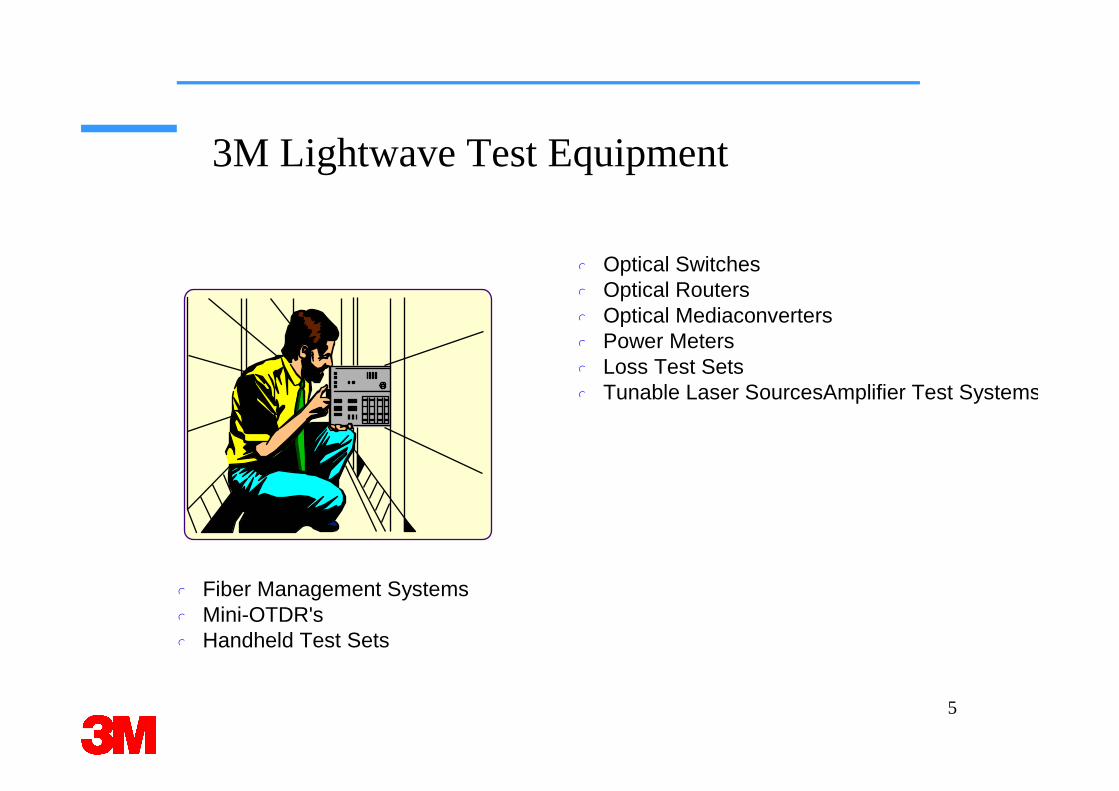
3M Lightwave Test Equipment
l Optical Switchesl Optical Routersl Optical Mediaconverters l Power Metersl Loss Test Setsl Tunable Laser SourcesAmplifier Test Systems
l Fiber Management Systemsl Mini-OTDR'sl Handheld Test Sets
6
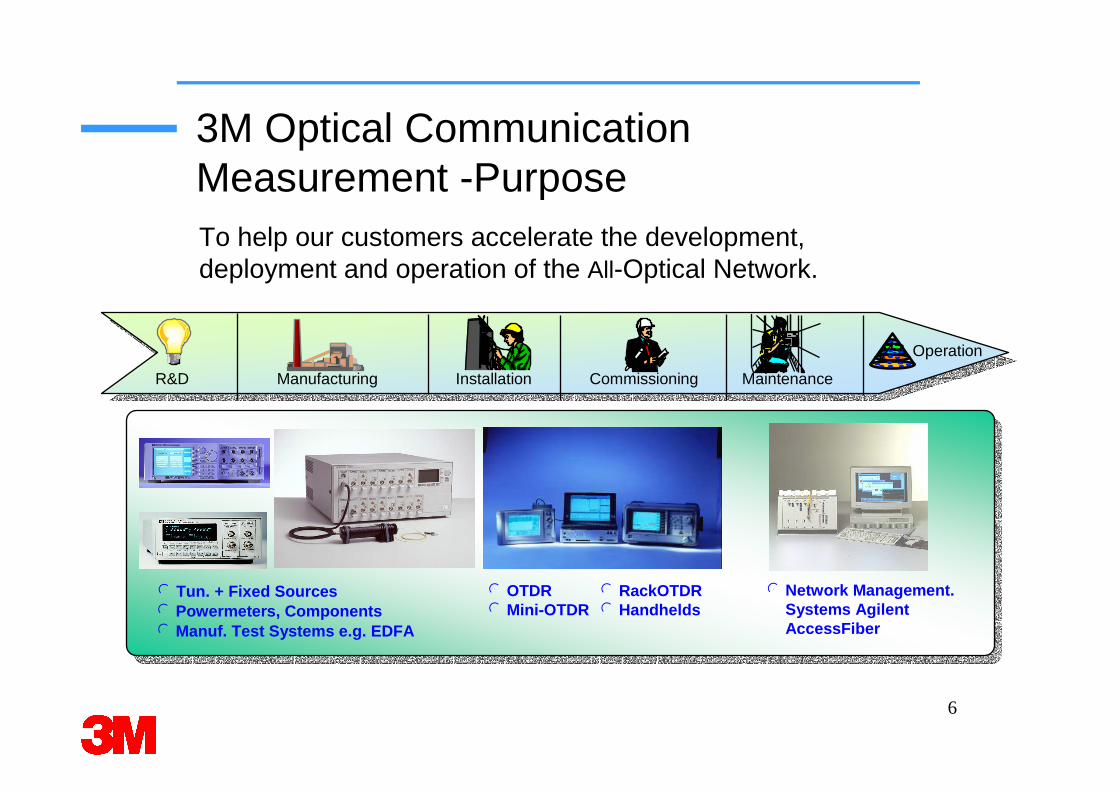
3M Optical Communication Measurement -PurposeTo help our customers accelerate the development, deployment and operation of the All-Optical Network.
R&D Manufacturing Installation Commissioning Maintenance
Operation
l OTDRl Mini-OTDR
l Network Management. Systems Agilent AccessFiber
l Tun. + Fixed Sourcesl Powermeters, Componentsl Manuf. Test Systems e.g. EDFA
l RackOTDRl Handhelds
7
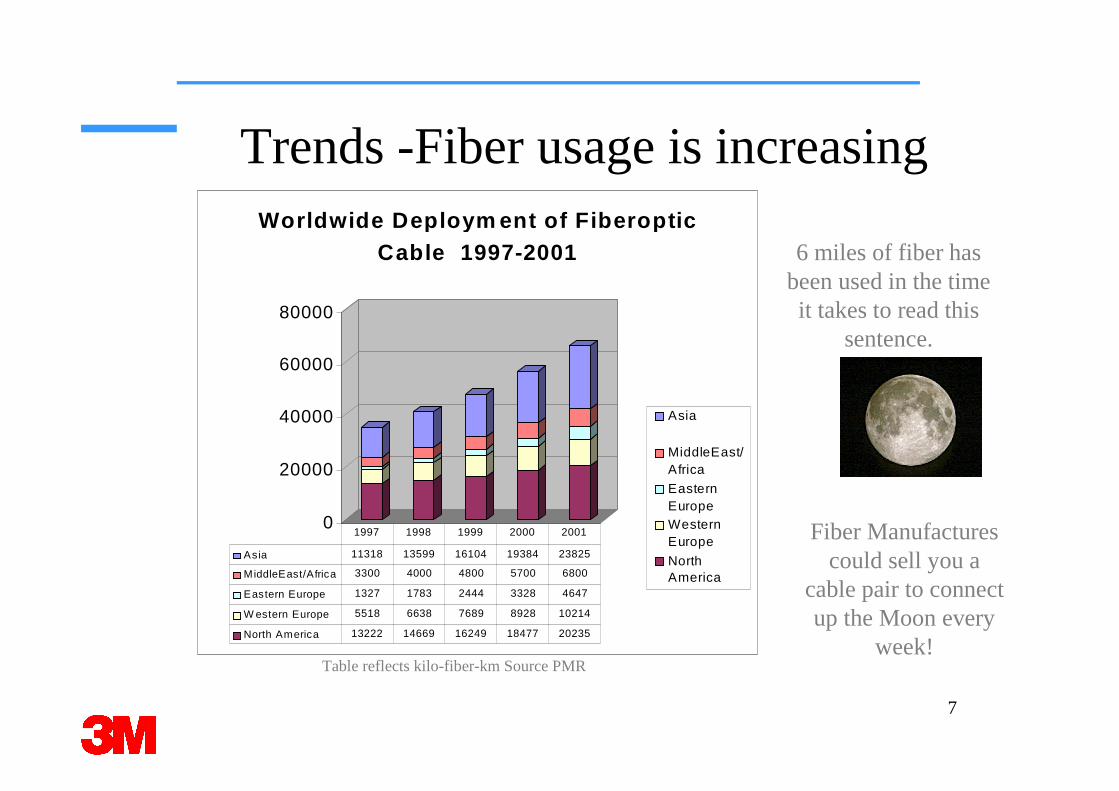
Trends -Fiber usage is increasing
0
20000
40000
60000
80000
Worldwide Deploym ent of Fiberoptic Cable 1997-2001
Asia
MiddleEast/Africa
EasternEuropeWesternEurope
NorthAmerica
Asia 11318 13599 16104 19384 23825
MiddleEast/Africa 3300 4000 4800 5700 6800
Eastern Europe 1327 1783 2444 3328 4647
W estern Europe 5518 6638 7689 8928 10214
North America 13222 14669 16249 18477 20235
1997 1998 1999 2000 2001
6 miles of fiber has been used in the time it takes to read this
sentence.
Table reflects kilo-fiber-km Source PMR
Fiber Manufactures could sell you a
cable pair to connect up the Moon every
week!
8
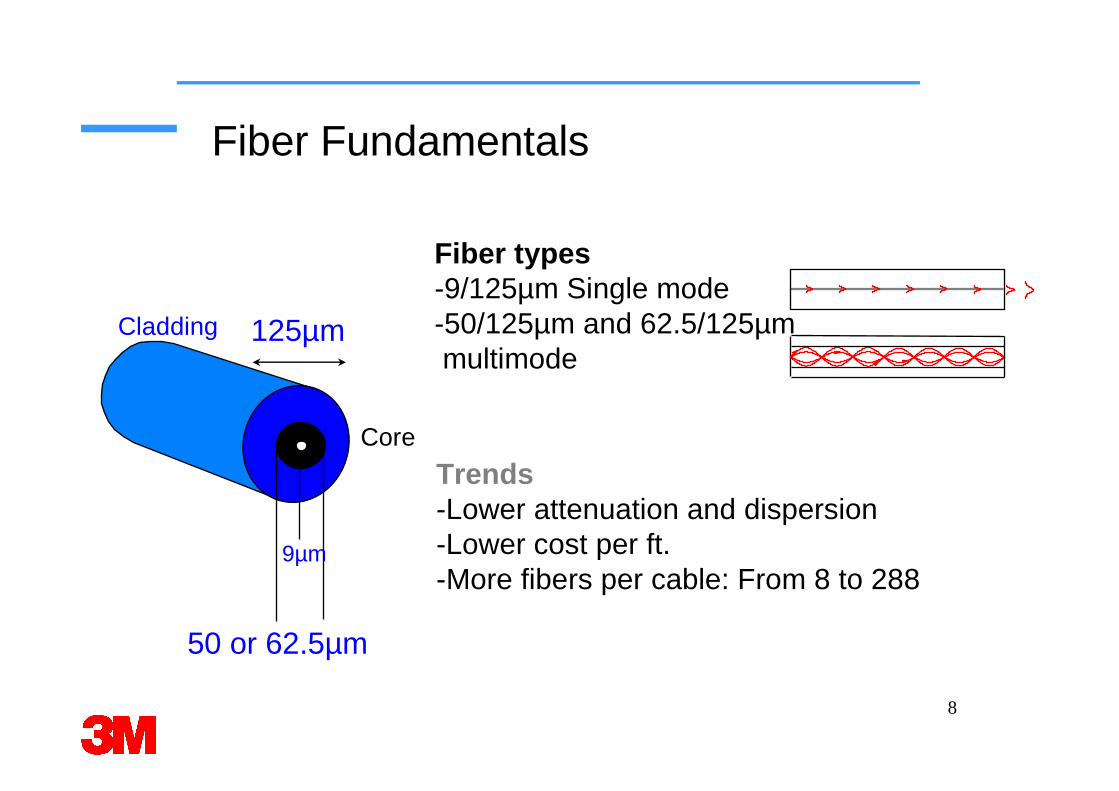
Fiber Fundamentals
Fiber types-9/125µm Single mode-50/125µm and 62.5/125µmmultimode
125µm
50 or 62.5µm
9µm
Cladding
Core
Trends-Lower attenuation and dispersion-Lower cost per ft.-More fibers per cable: From 8 to 288
9
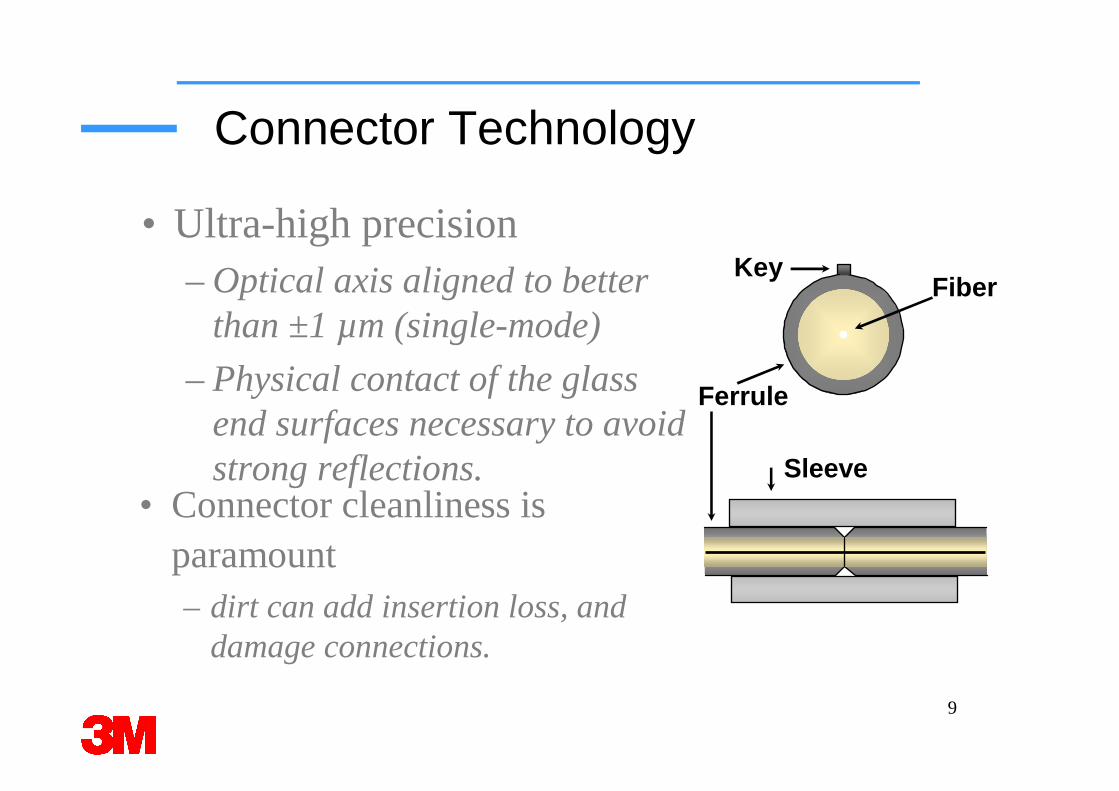
Connector Technology
• Ultra-high precision– Optical axis aligned to better
than ±1 µm (single-mode)
– Physical contact of the glass end surfaces necessary to avoid strong reflections. Sleeve
Ferrule
FiberKey
• Connector cleanliness is paramount– dirt can add insertion loss, and
damage connections.
10
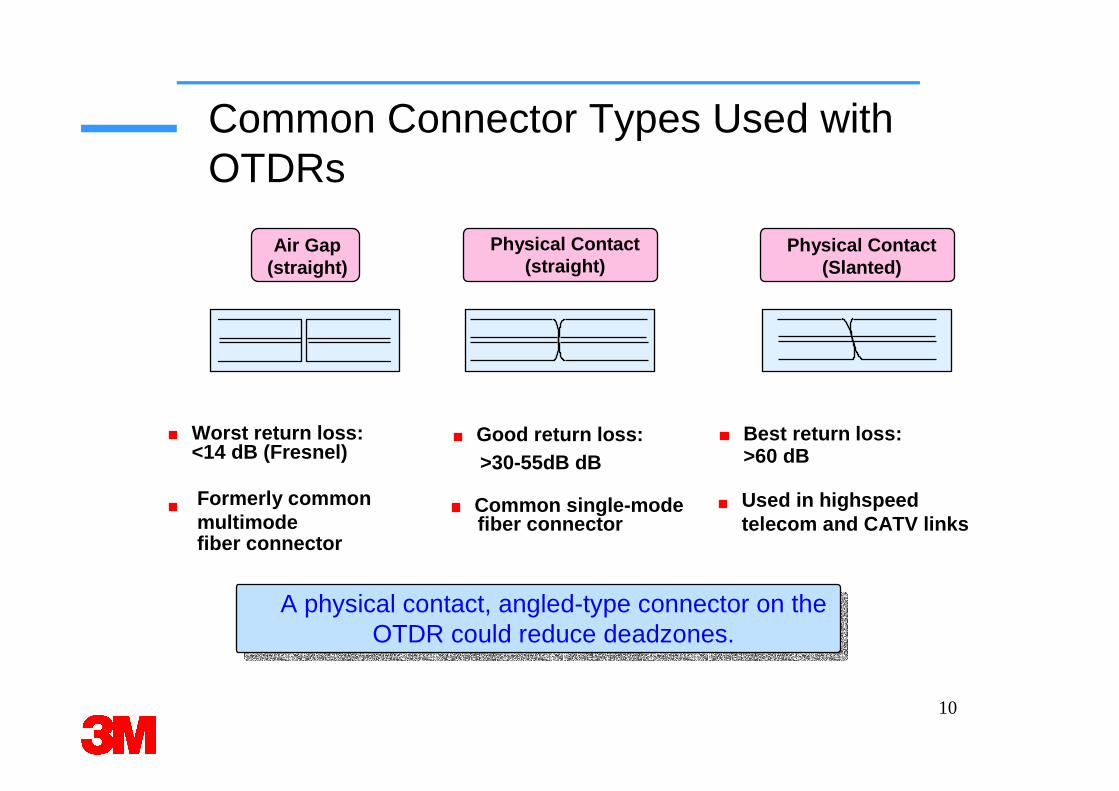
Common Connector Types Used with OTDRs
Worst return loss:<14 dB (Fresnel)
Formerly common multimode fiber connector
Best return loss:
Used in highspeedtelecom and CATV links
Good return loss:
Common single-modefiber connector
>30-55dB dB >60 dB
Air Gap(straight)
Physical Contact(straight)
Physical Contact(Slanted)
A physical contact, angled-type connector on theOTDR could reduce deadzones.
11
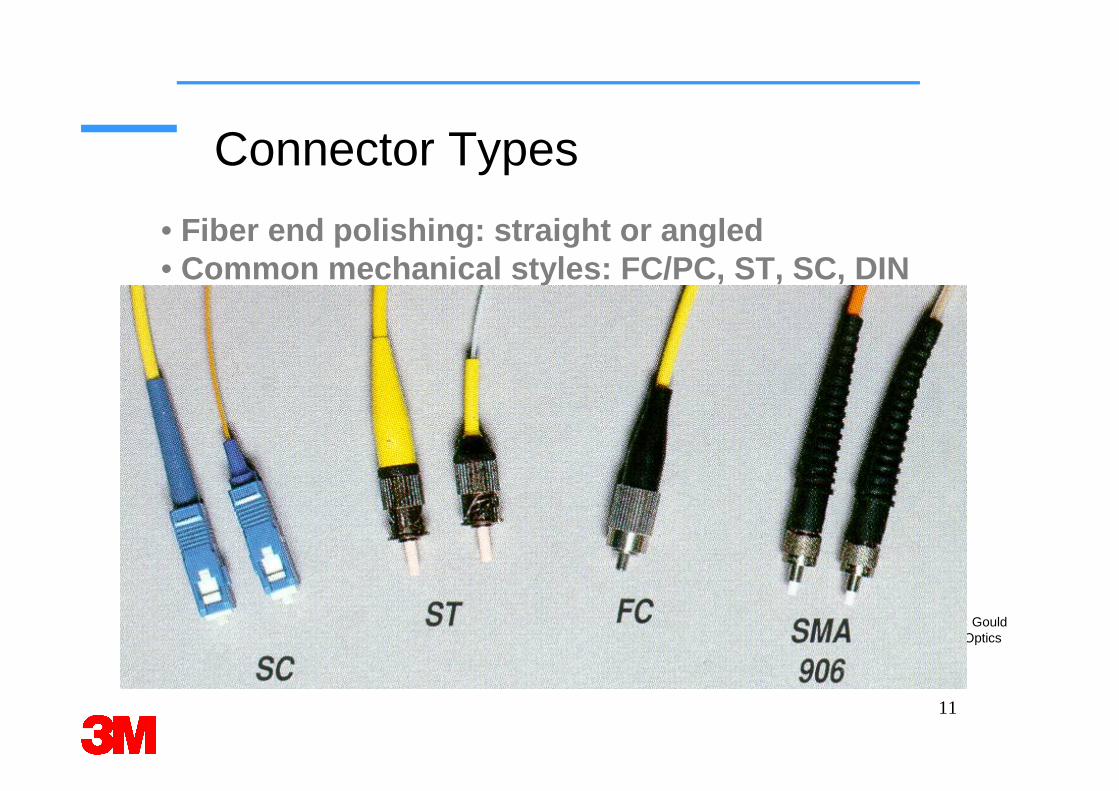
Connector Types
• Fiber end polishing: straight or angled• Common mechanical styles: FC/PC, ST, SC, DIN
Photo: Gould Fiber Optics
12
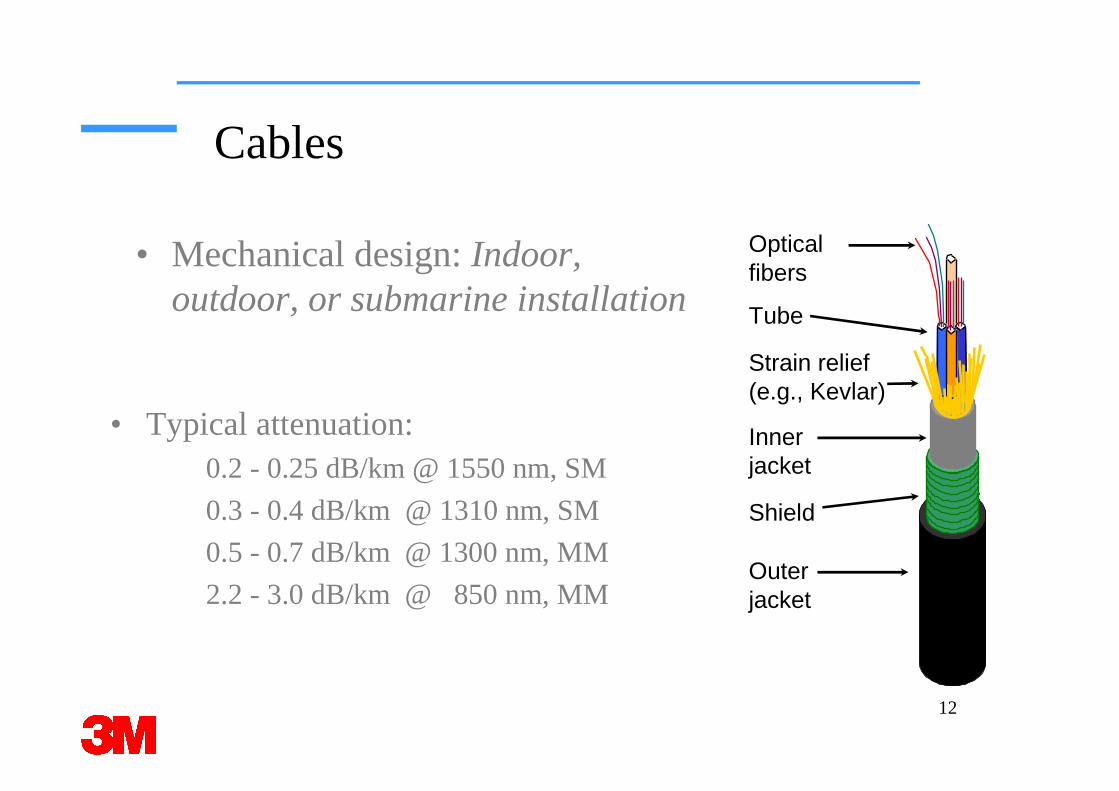
Cables
• Mechanical design: Indoor, outdoor, or submarine installation
Optical fibers
Tube
Strain relief(e.g., Kevlar)
Innerjacket
Shield
Outerjacket
• Typical attenuation:0.2 - 0.25 dB/km @ 1550 nm, SM
0.3 - 0.4 dB/km @ 1310 nm, SM
0.5 - 0.7 dB/km @ 1300 nm, MM
2.2 - 3.0 dB/km @ 850 nm, MM
13
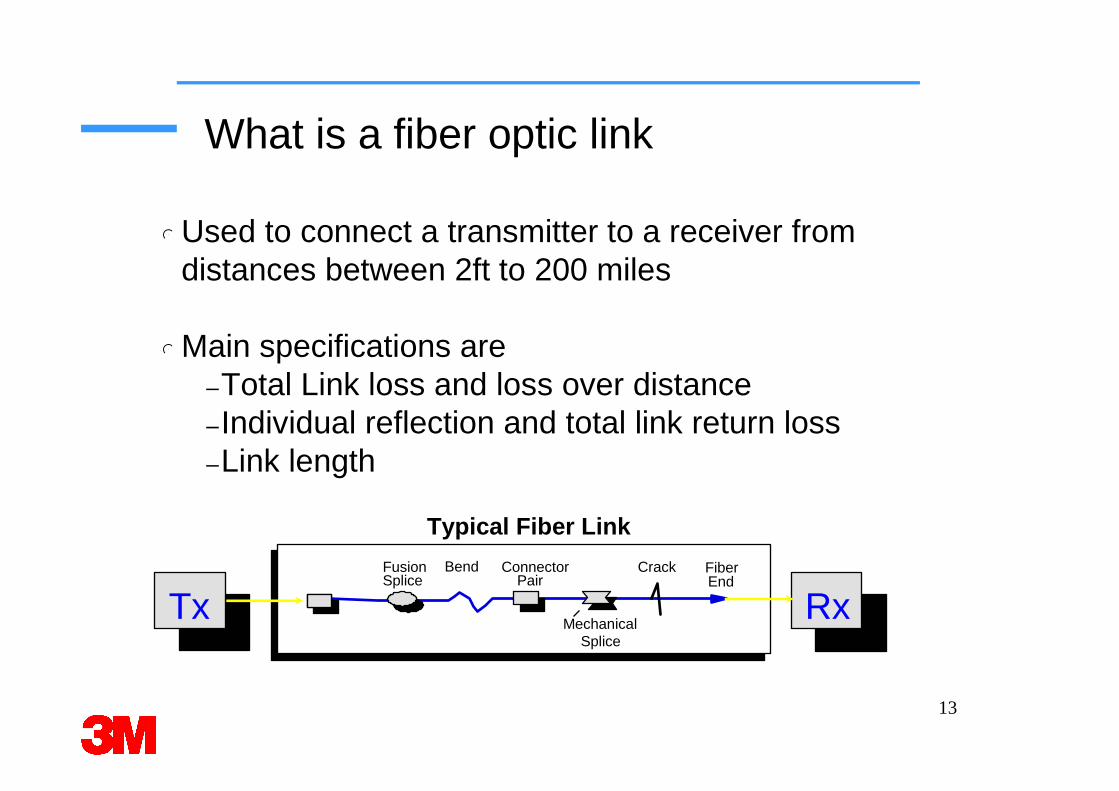
What is a fiber optic link
l Used to connect a transmitter to a receiver from distances between 2ft to 200 miles
l Main specifications are–Total Link loss and loss over distance–Individual reflection and total link return loss –Link length
FusionSplice
Bend ConnectorPair
Crack FiberEnd
MechanicalSplice
Typical Fiber Link
Tx Rx
14
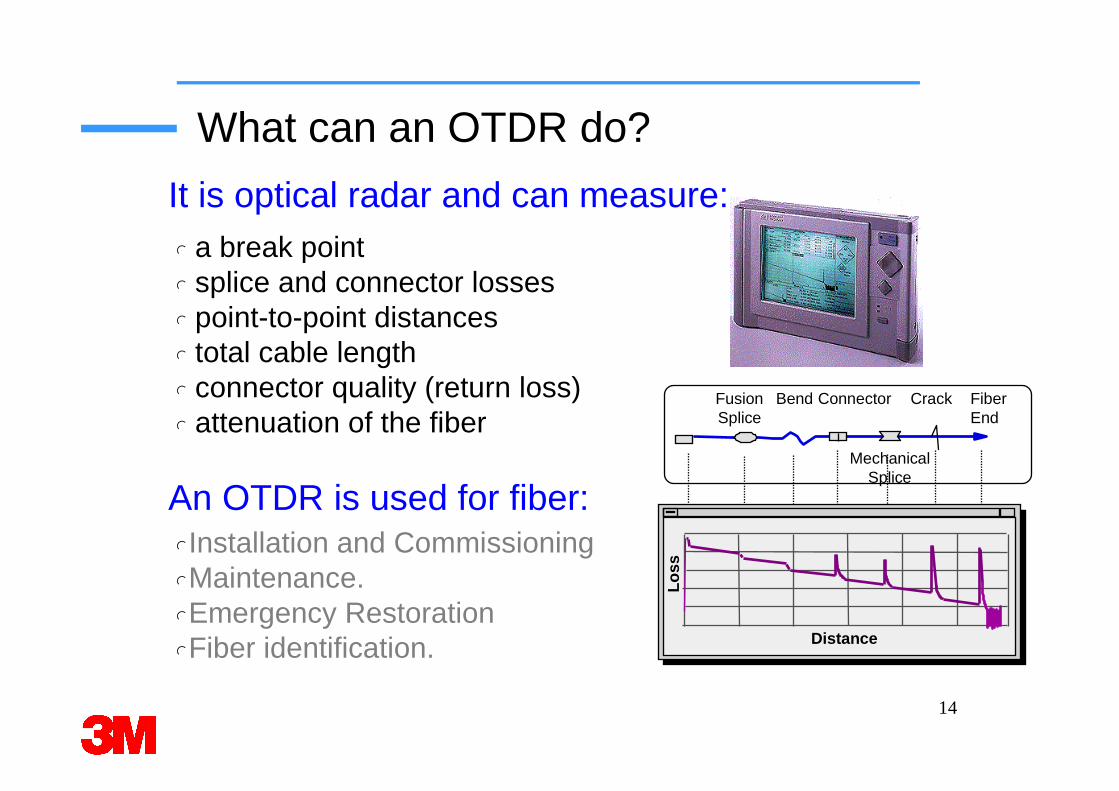
What can an OTDR do?
l a break point l splice and connector lossesl point-to-point distances l total cable lengthl connector quality (return loss)l attenuation of the fiber
It is optical radar and can measure:
FusionSplice
Bend Connector Crack FiberEnd
MechanicalSplice
Lo
ss
Distance
lInstallation and CommissioninglMaintenance.lEmergency RestorationlFiber identification.
An OTDR is used for fiber:
15
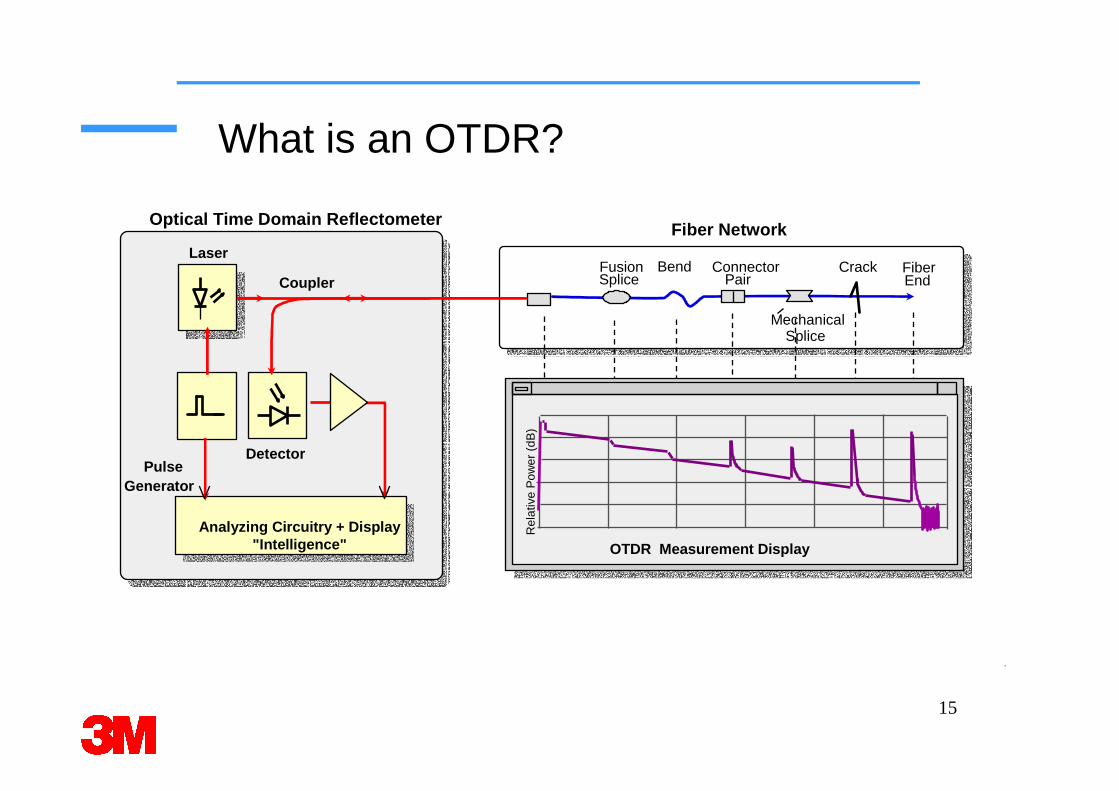
What is an OTDR?
.
FusionSplice
Bend ConnectorPair
Crack FiberEnd
MechanicalSplice
Fiber Network
OTDR Measurement DisplayR
elat
ive
Pow
er (
dB)
Optical Time Domain Reflectometer
Laser
Coupler
PulseGenerator
Detector
Analyzing Circuitry + Display"Intelligence"
16
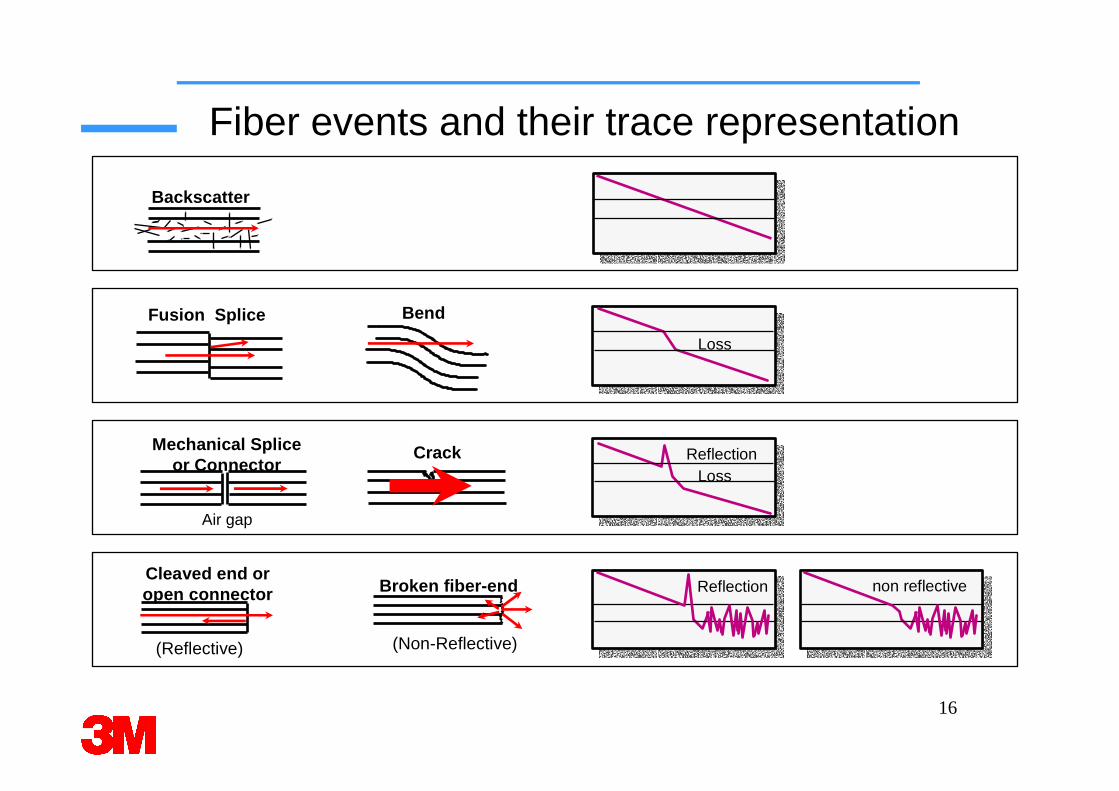
Fiber events and their trace representation
Backscatter
Mechanical Spliceor Connector
Air gap
CrackLoss
Reflection
(Non-Reflective)
Broken fiber-endCleaved end or open connector
(Reflective)
Reflection non reflective
Bend
Loss
Fusion Splice
17
lBackscatter
lIOR - Index of Refraction
lNon-Reflective Events
lReflective Events
lFiber End
Basic Terms
18
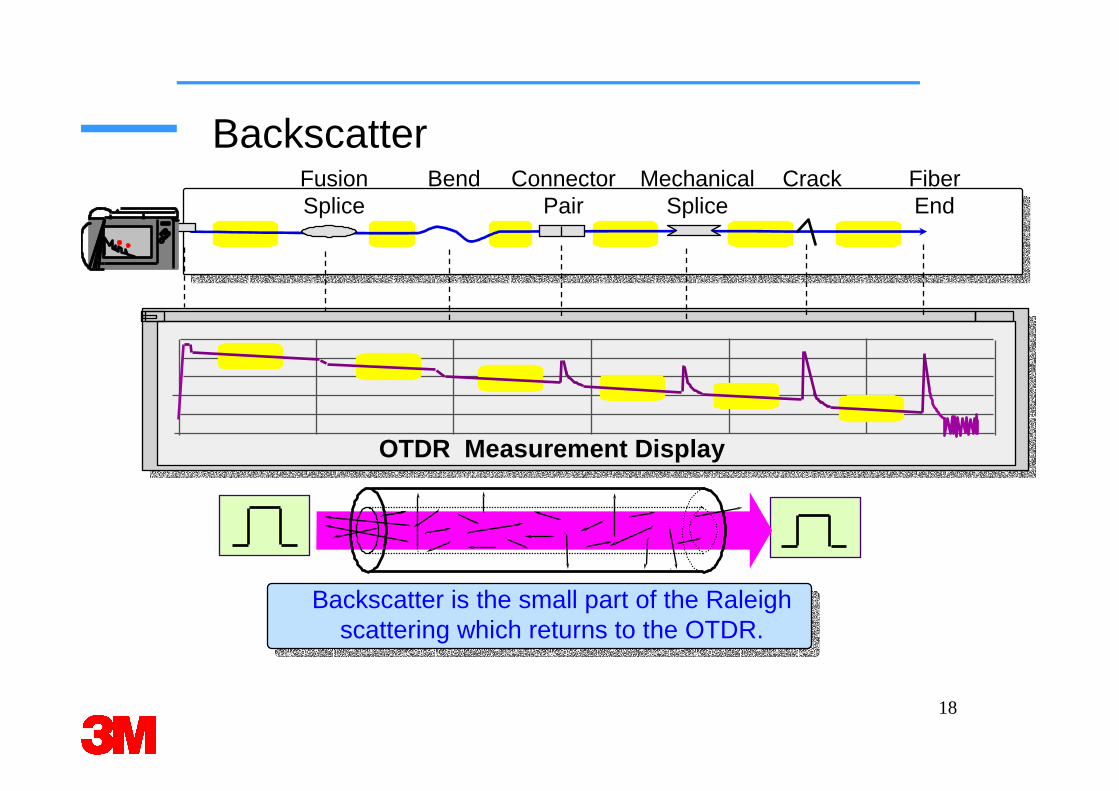
Backscatter
Backscatter is the small part of the Raleighscattering which returns to the OTDR.
OTDR Measurement Display
FusionSplice
Bend ConnectorPair
MechanicalSplice
Crack FiberEnd
19
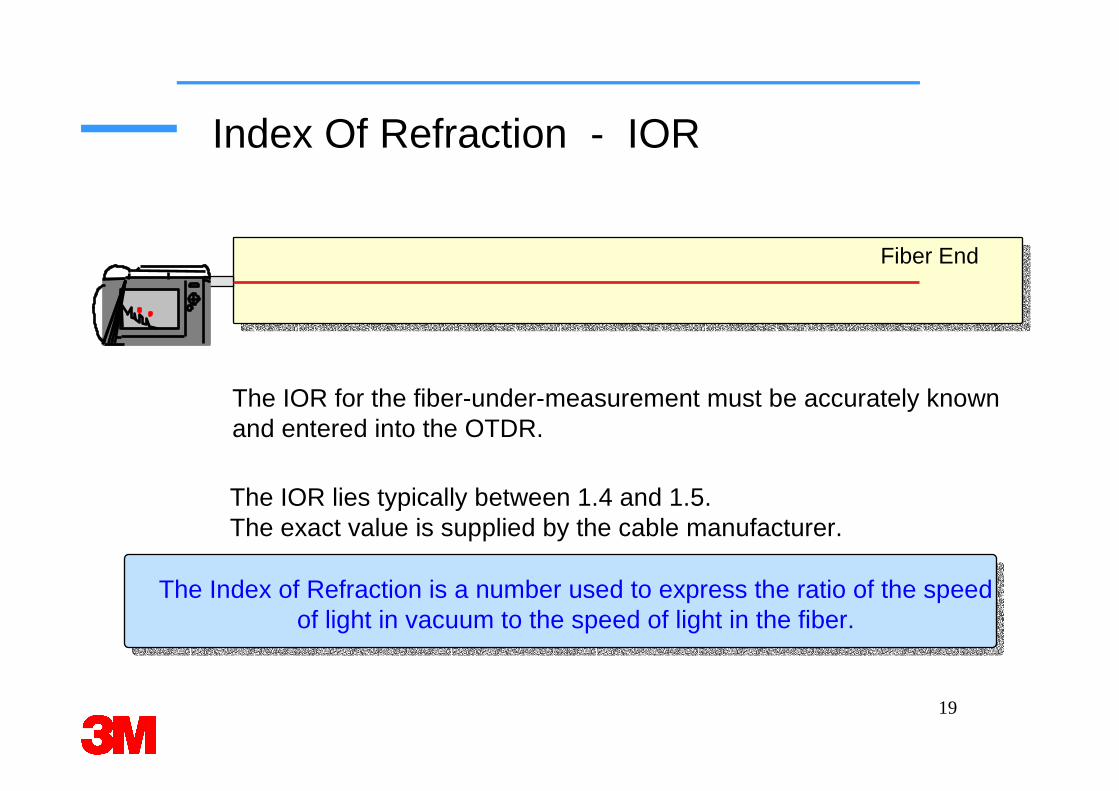
Index Of Refraction - IOR
The Index of Refraction is a number used to express the ratio of the speed of light in vacuum to the speed of light in the fiber.
Fiber End
The IOR for the fiber-under-measurement must be accurately knownand entered into the OTDR.
The IOR lies typically between 1.4 and 1.5.The exact value is supplied by the cable manufacturer.
20
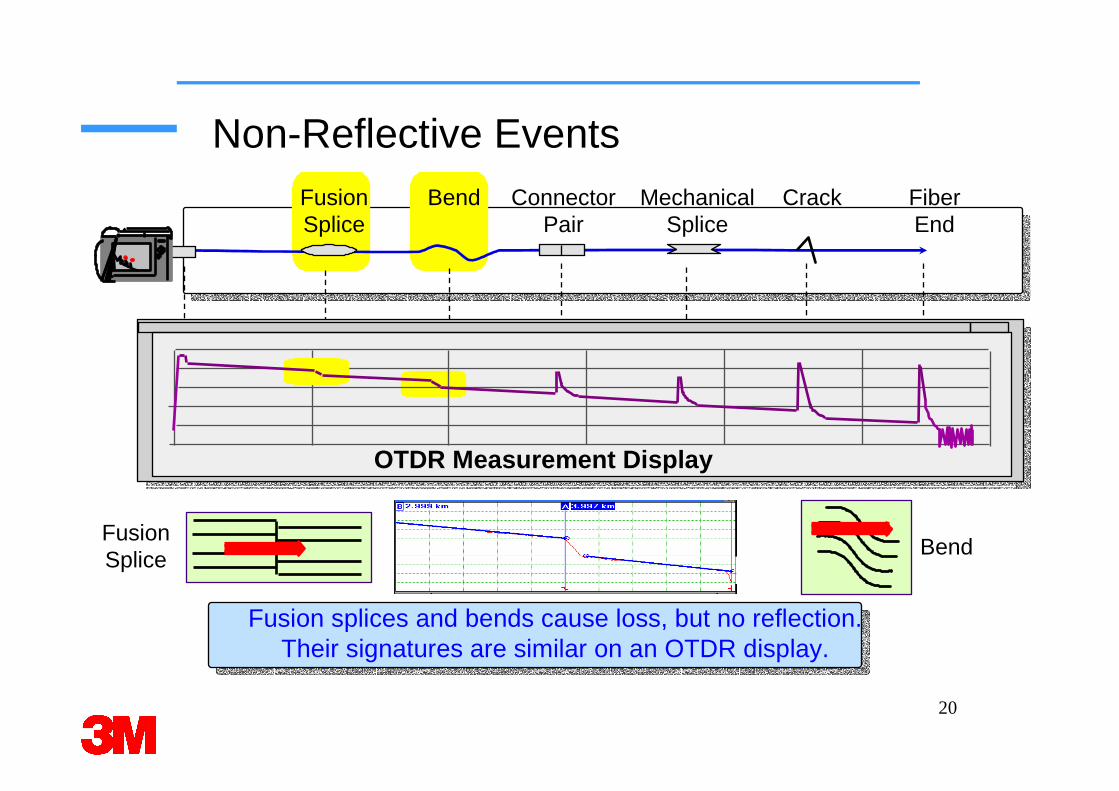
Non-Reflective Events
Fusion splices and bends cause loss, but no reflection.Their signatures are similar on an OTDR display.
BendFusionSplice
BendFusionSplice
ConnectorPair
MechanicalSplice
Crack FiberEnd
OTDR Measurement Display
21
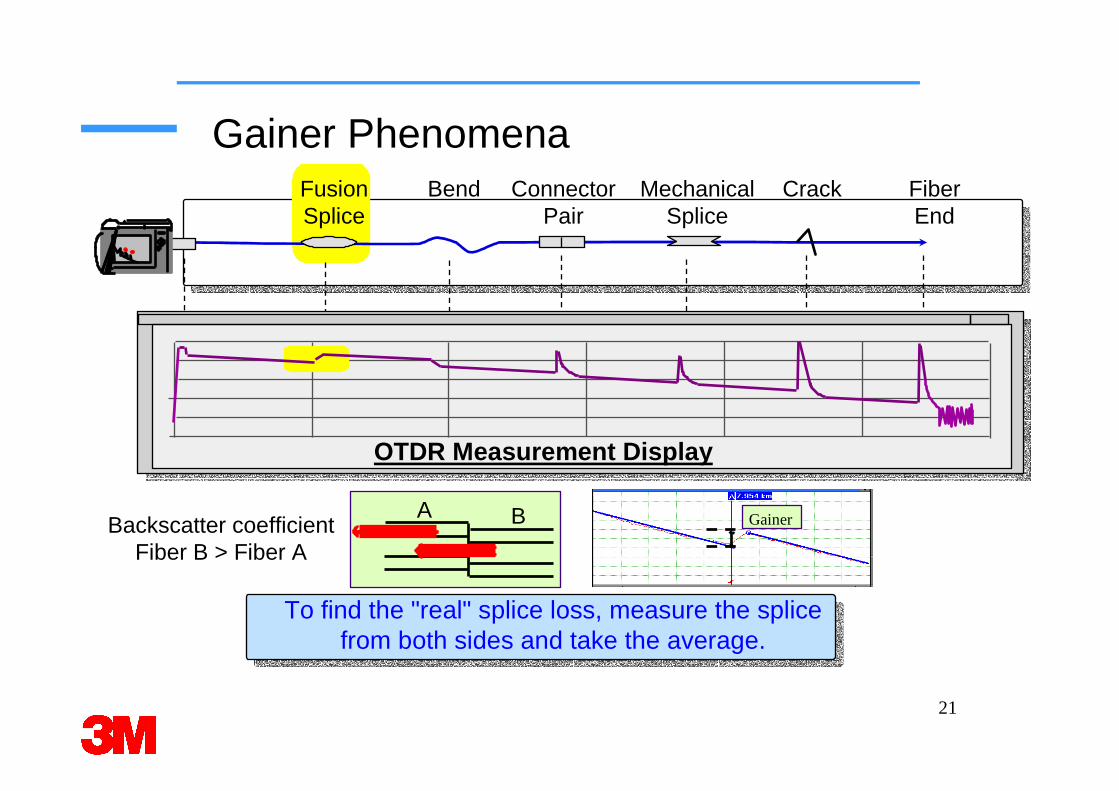
Gainer Phenomena
To find the "real" splice loss, measure the splicefrom both sides and take the average.
BendFusionSplice
ConnectorPair
MechanicalSplice
Crack FiberEnd
Backscatter coefficientFiber B > Fiber A
OTDR Measurement Display
A B Gainer
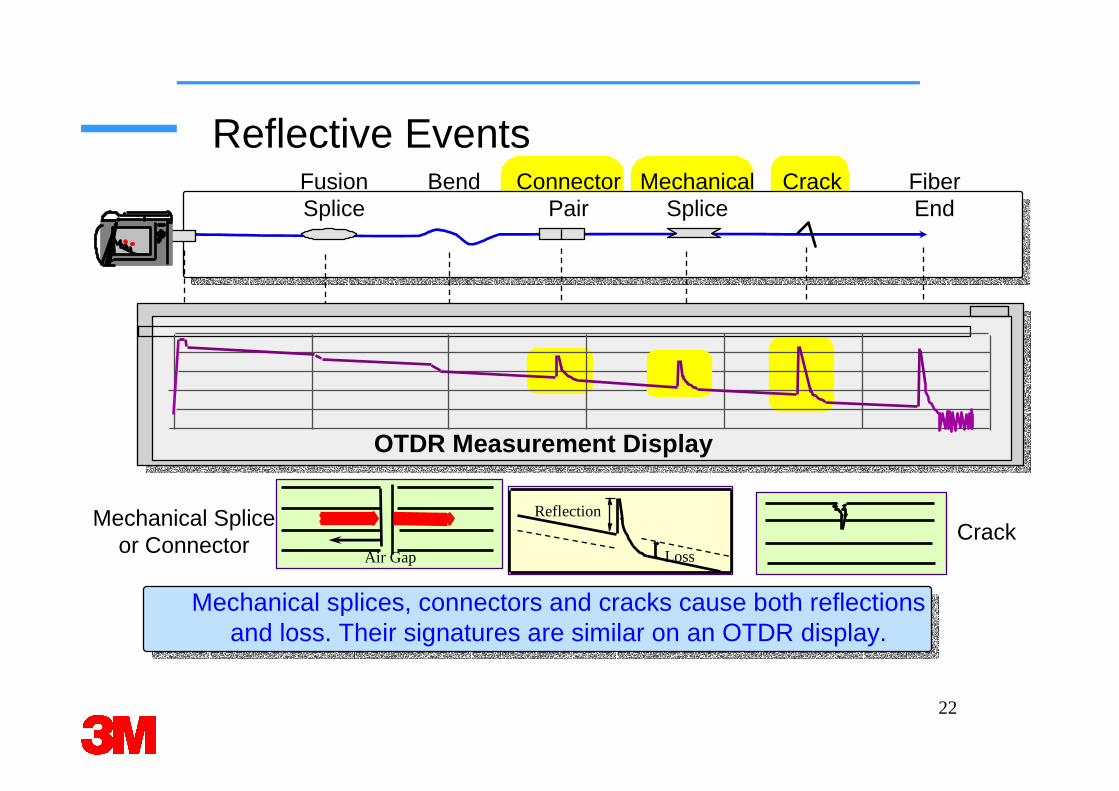
22
Reflective EventsBendFusion
SpliceConnector
PairMechanical
SpliceCrack Fiber
End
Mechanical splices, connectors and cracks cause both reflectionsand loss. Their signatures are similar on an OTDR display.
OTDR Measurement Display
Loss
Reflection
CrackMechanical Splice
or ConnectorAir Gap
23
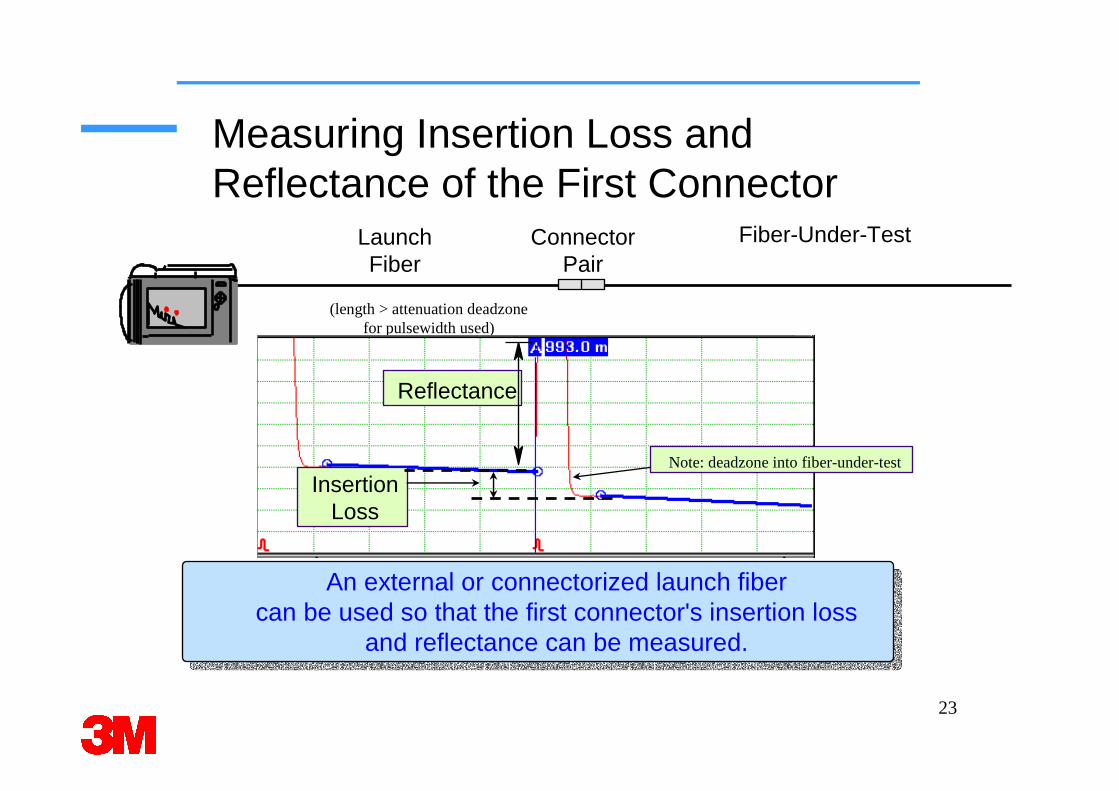
Measuring Insertion Loss and Reflectance of the First Connector
An external or connectorized launch fibercan be used so that the first connector's insertion loss
and reflectance can be measured.
LaunchFiber
Fiber-Under-TestConnectorPair
(length > attenuation deadzonefor pulsewidth used)
InsertionLoss
Reflectance
Note: deadzone into fiber-under-test
24
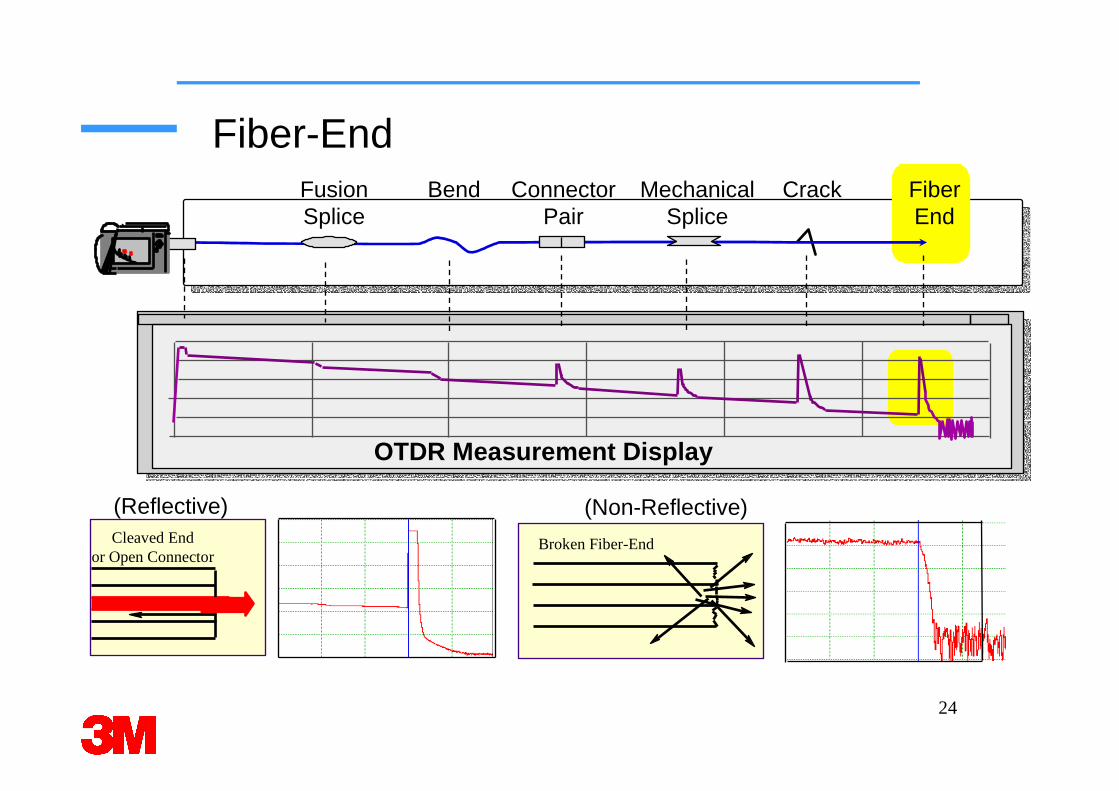
Fiber-End
OTDR Measurement Display
BendFusionSplice
ConnectorPair
MechanicalSplice
Crack FiberEnd
(Non-Reflective)(Reflective)Cleaved End
or Open ConnectorBroken Fiber-End
25
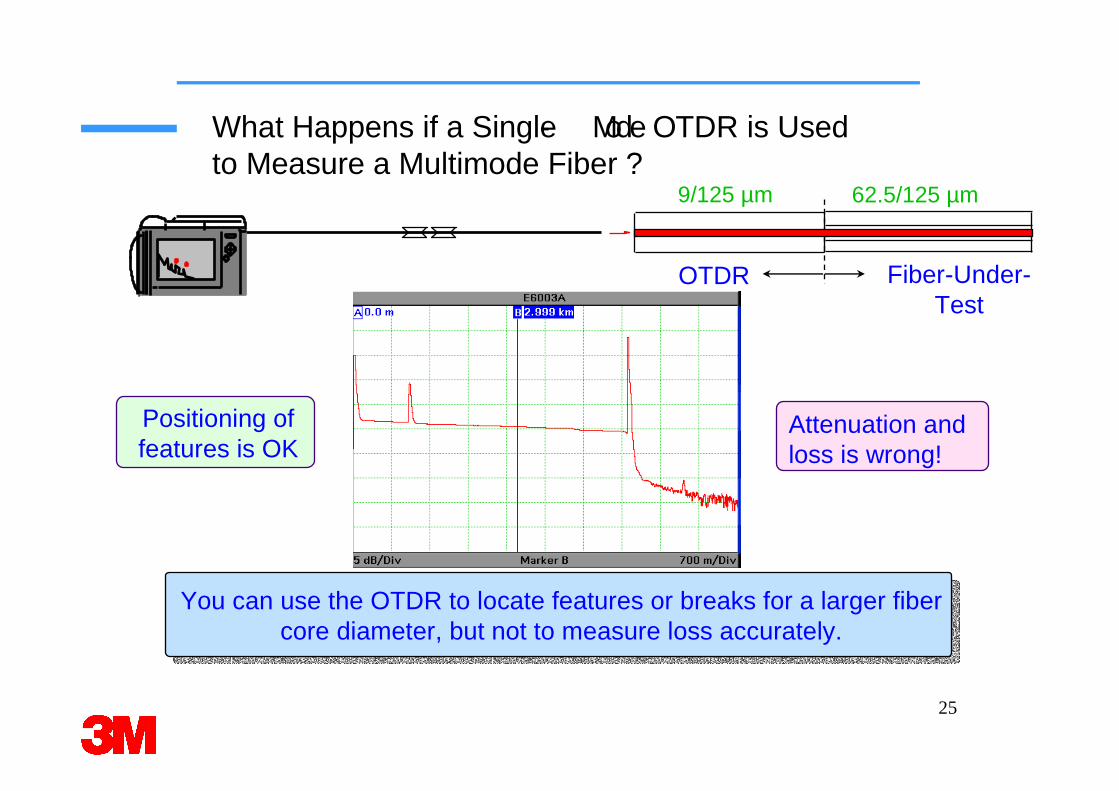
What Happens if a Single- Mode OTDR is Usedto Measure a Multimode Fiber ?
You can use the OTDR to locate features or breaks for a larger fiber core diameter, but not to measure loss accurately.
Positioning of features is OK
Attenuation and loss is wrong!
OTDR Fiber-Under-Test
9/125 µm 62.5/125 µm
26
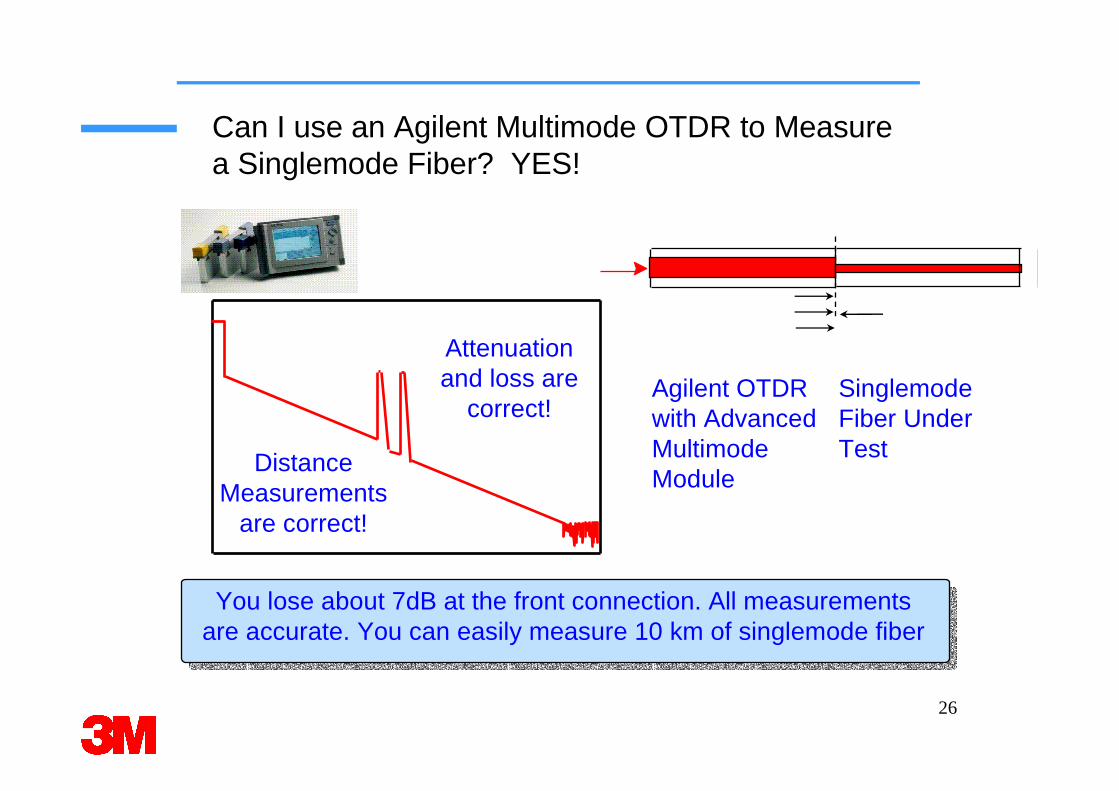
You lose about 7dB at the front connection. All measurements are accurate. You can easily measure 10 km of singlemode fiber
Agilent OTDR with Advanced Multimode Module
Singlemode Fiber UnderTestDistance
Measurements are correct!
Attenuation and loss are
correct!
Can I use an Agilent Multimode OTDR to Measure a Singlemode Fiber? YES!
27
l Basic Termsl Fibers and Connectorsl OTDR Measurementsl Introducing the 3M Mini-OTDR 2000l Software Utilities
OTDR Measurements Agenda
28
lDynamic Range
lDeadzone
lDistance Accuracy
lOTDR Design
Performance Parameters
29
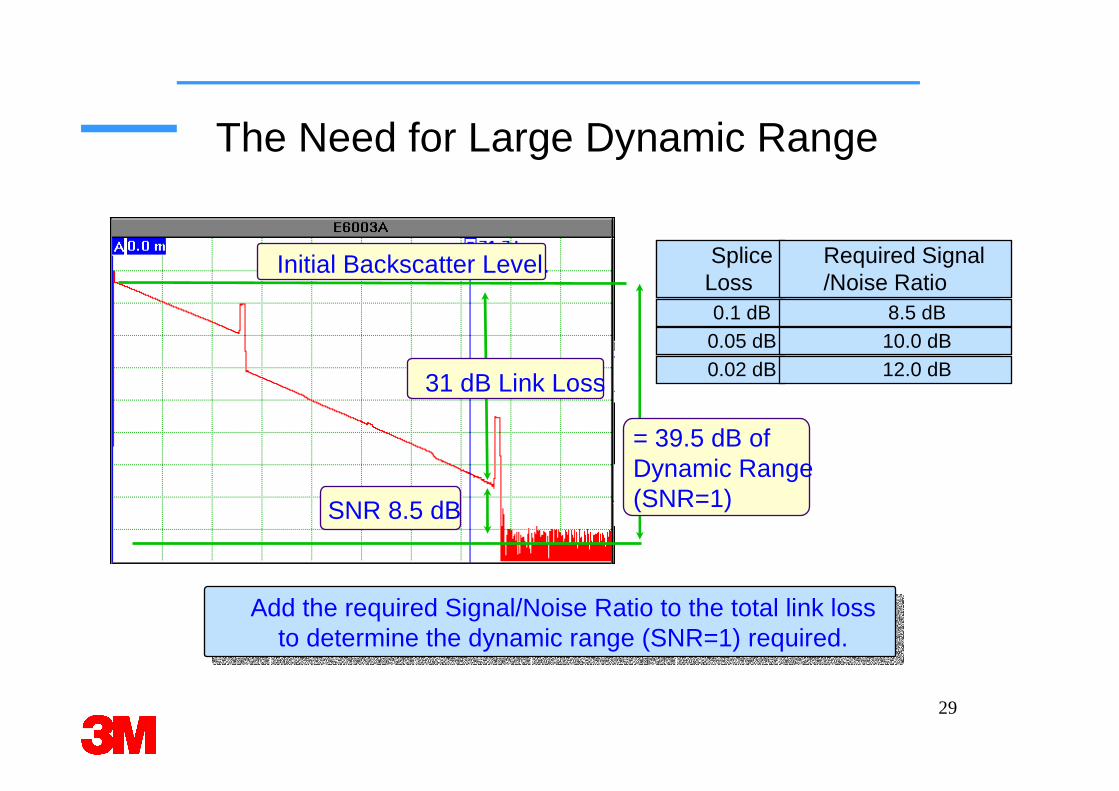
The Need for Large Dynamic Range
Add the required Signal/Noise Ratio to the total link lossto determine the dynamic range (SNR=1) required.
Splice Loss
Required Signal/Noise Ratio
0.1 dB 8.5 dB0.05 dB 10.0 dB0.02 dB 12.0 dB
31 dB Link Loss
= 39.5 dB of Dynamic Range (SNR=1)SNR 8.5 dB
Initial Backscatter Level.
30
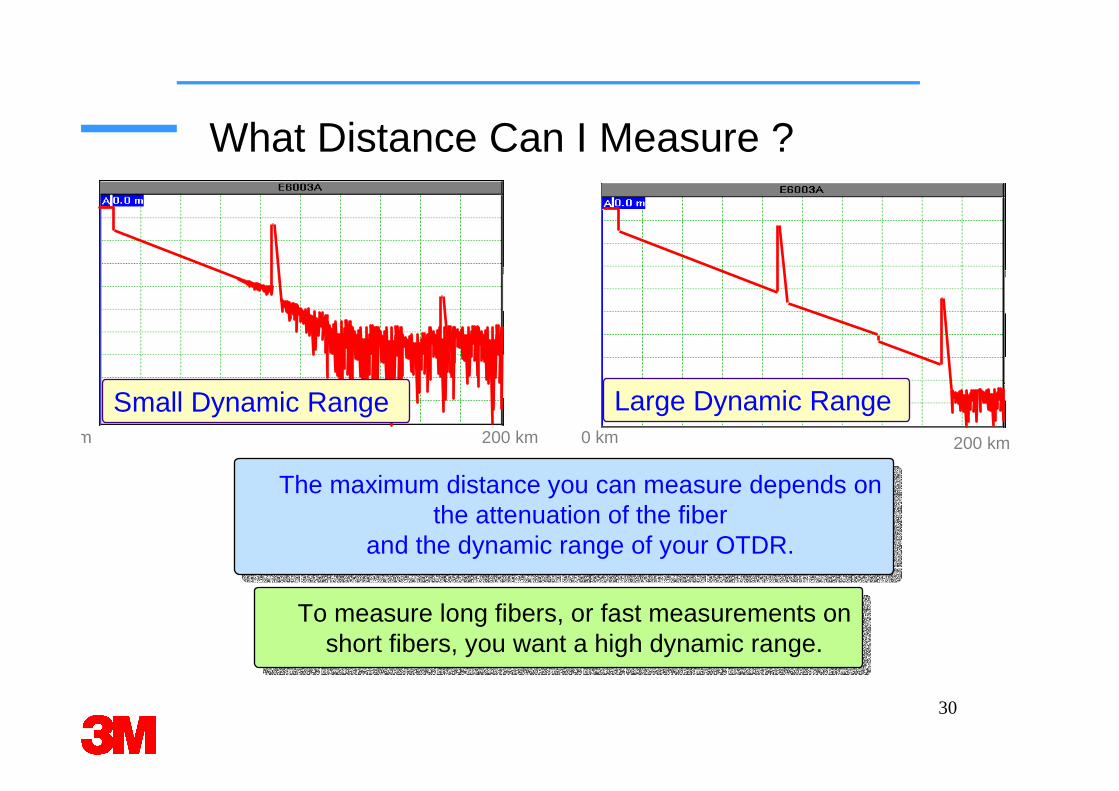
What Distance Can I Measure ?
The maximum distance you can measure depends on the attenuation of the fiber
and the dynamic range of your OTDR.
To measure long fibers, or fast measurements onshort fibers, you want a high dynamic range.
Small Dynamic Range Large Dynamic Range0 km 0 km200 km 200 km
31
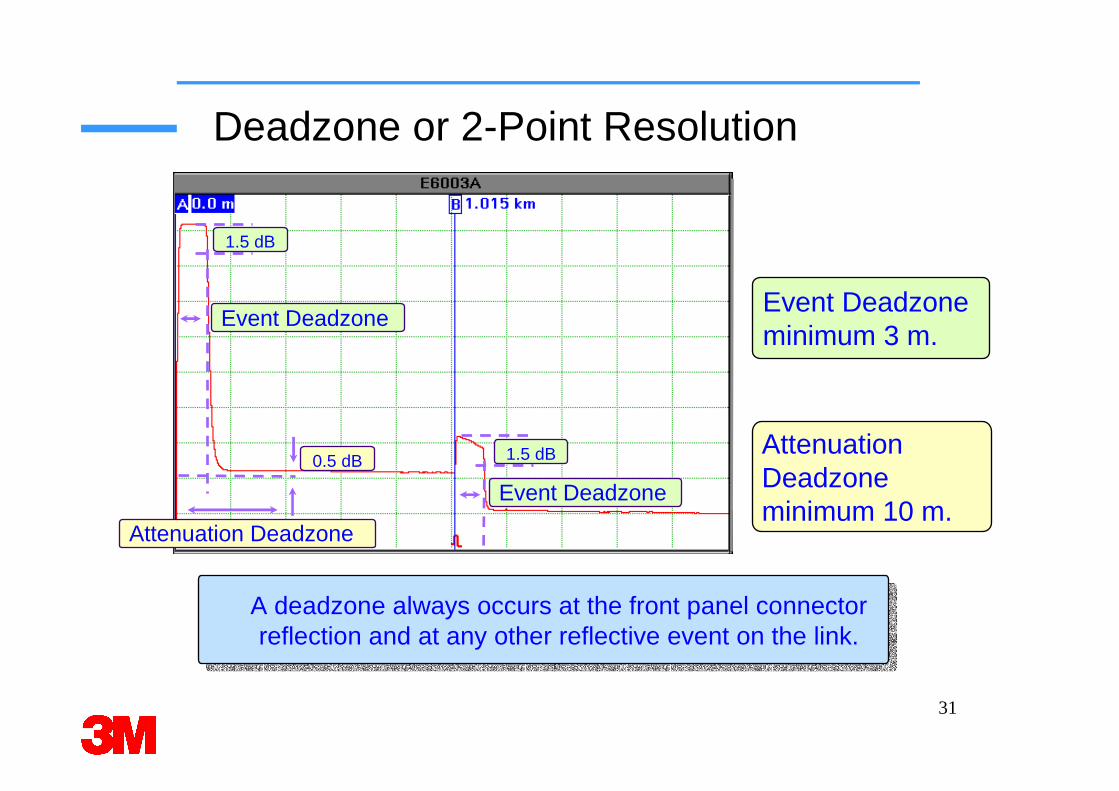
Deadzone or 2-Point Resolution
A deadzone always occurs at the front panel connectorreflection and at any other reflective event on the link.
Event Deadzone minimum 3 m.
Attenuation Deadzone minimum 10 m.
1.5 dB
Event Deadzone
Attenuation Deadzone
1.5 dB
Event Deadzone
0.5 dB
32
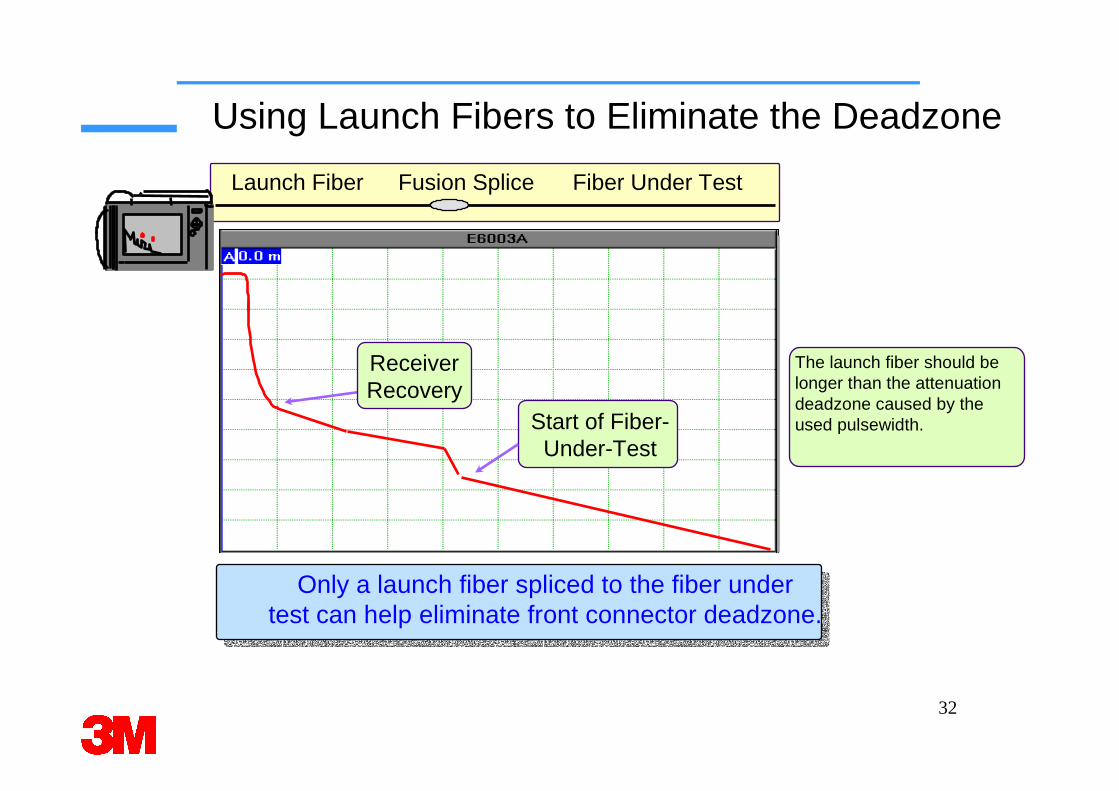
Using Launch Fibers to Eliminate the Deadzone
Only a launch fiber spliced to the fiber undertest can help eliminate front connector deadzone.
Fusion SpliceLaunch Fiber Fiber Under Test
The launch fiber should be longer than the attenuation deadzone caused by the used pulsewidth.
ReceiverRecovery
Start of Fiber-Under-Test
33
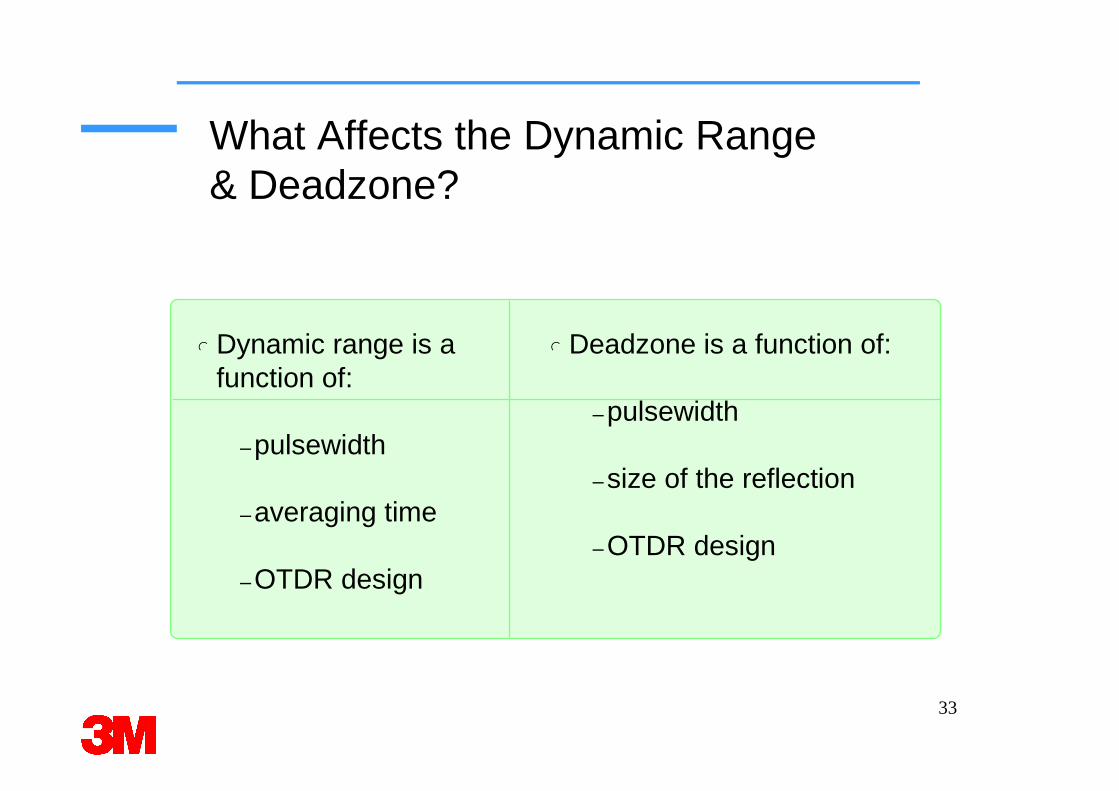
What Affects the Dynamic Range& Deadzone?
l Dynamic range is a function of:
–pulsewidth
–averaging time
–OTDR design
l Deadzone is a function of:
–pulsewidth
–size of the reflection
–OTDR design
34
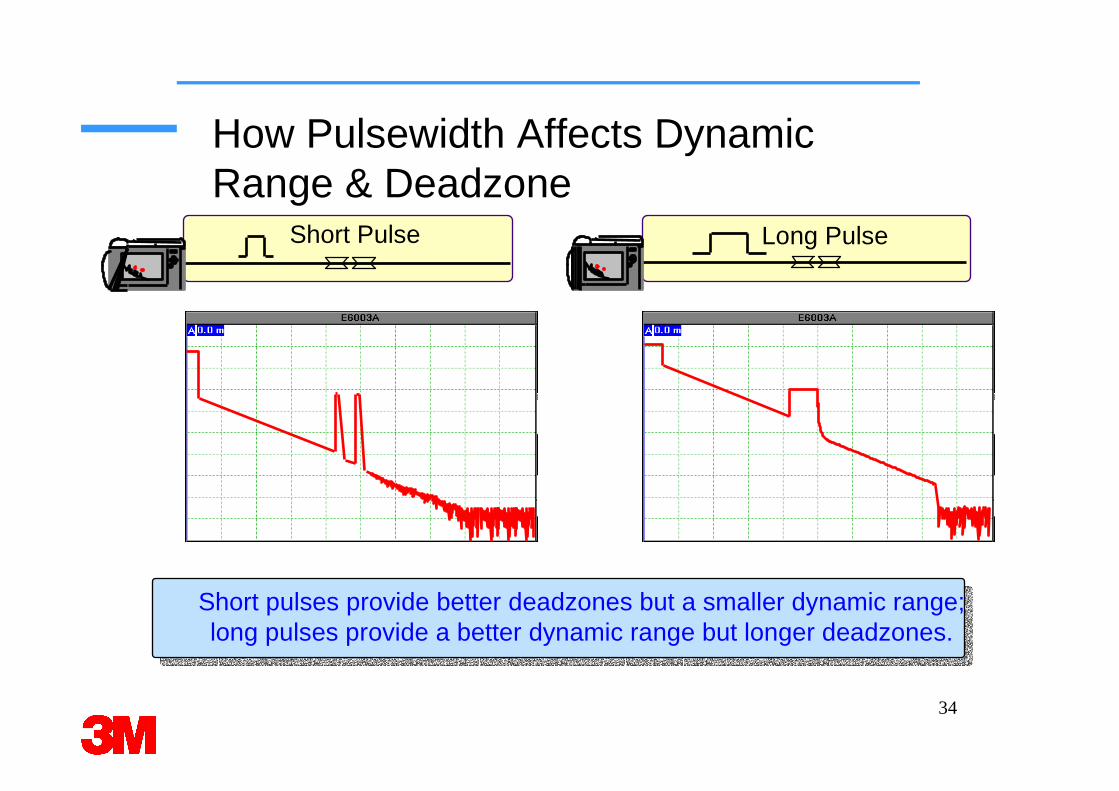
How Pulsewidth Affects Dynamic Range & Deadzone
Short pulses provide better deadzones but a smaller dynamic range;long pulses provide a better dynamic range but longer deadzones.
Short Pulse Long Pulse
35
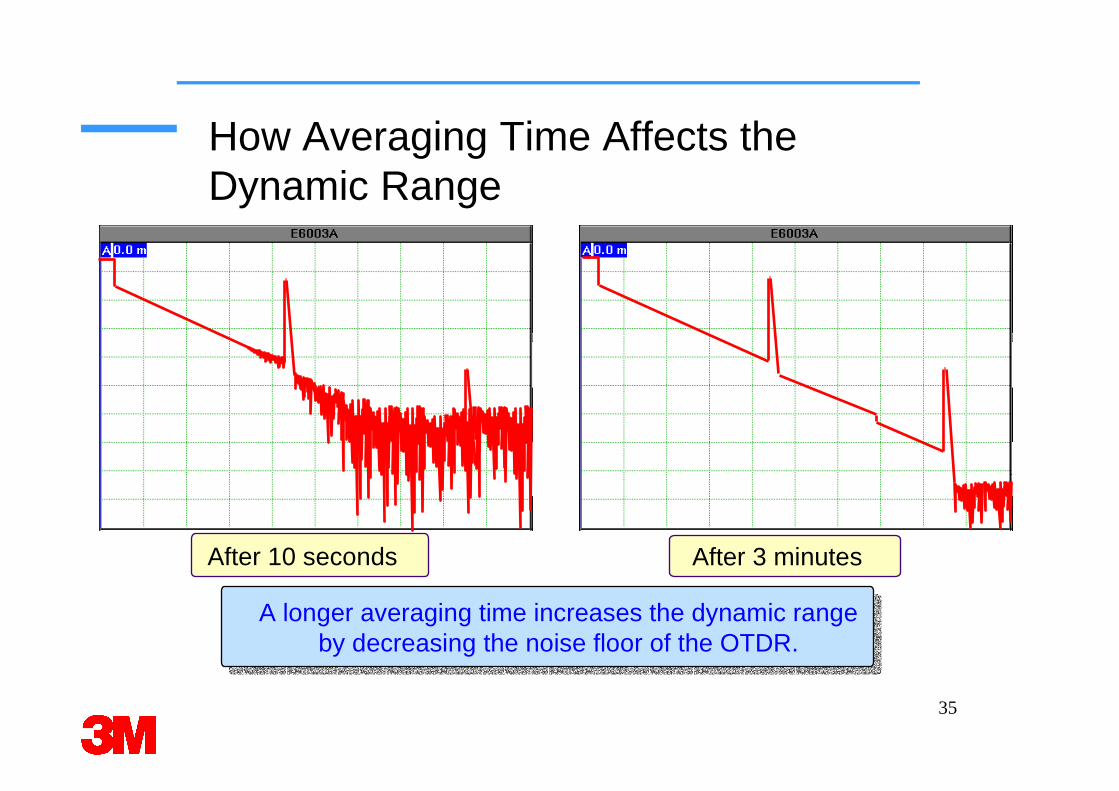
How Averaging Time Affects the Dynamic Range
A longer averaging time increases the dynamic rangeby decreasing the noise floor of the OTDR.
After 10 seconds After 3 minutes
36
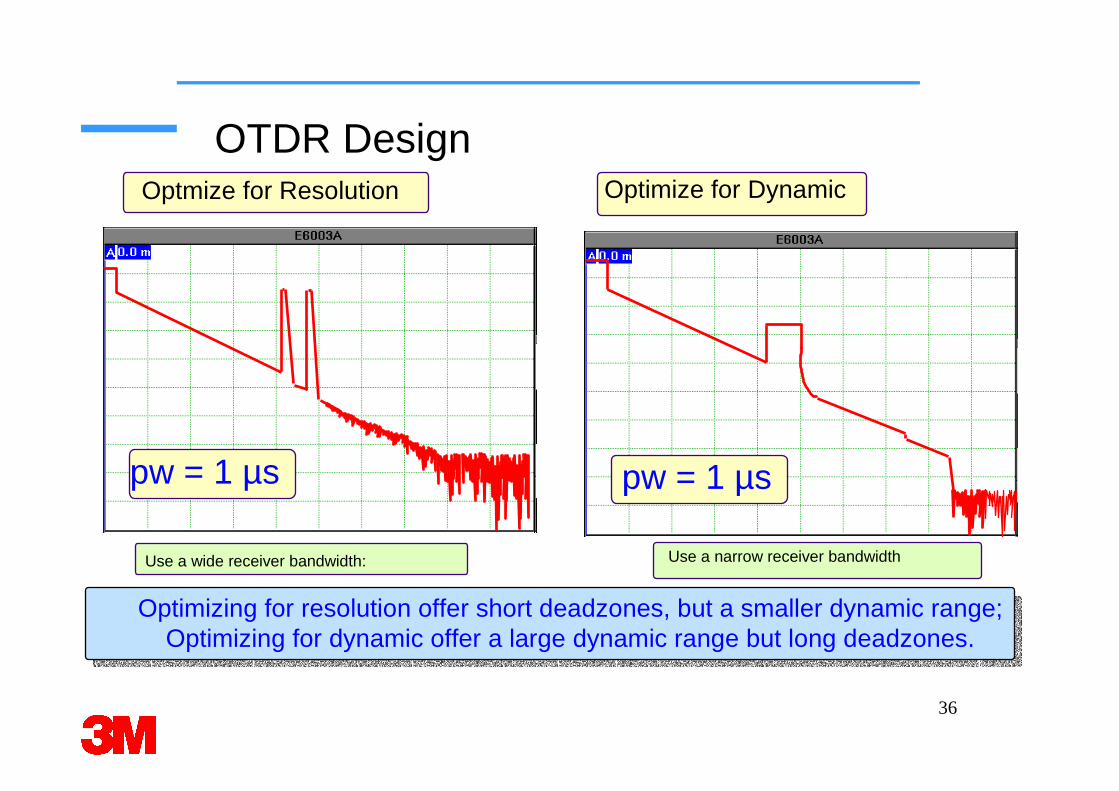
OTDR DesignOptmize for Resolution
Optimizing for resolution offer short deadzones, but a smaller dynamic range;Optimizing for dynamic offer a large dynamic range but long deadzones.
Use a wide receiver bandwidth: Use a narrow receiver bandwidth
pw = 1 µs pw = 1 µs
Optimize for Dynamic
37
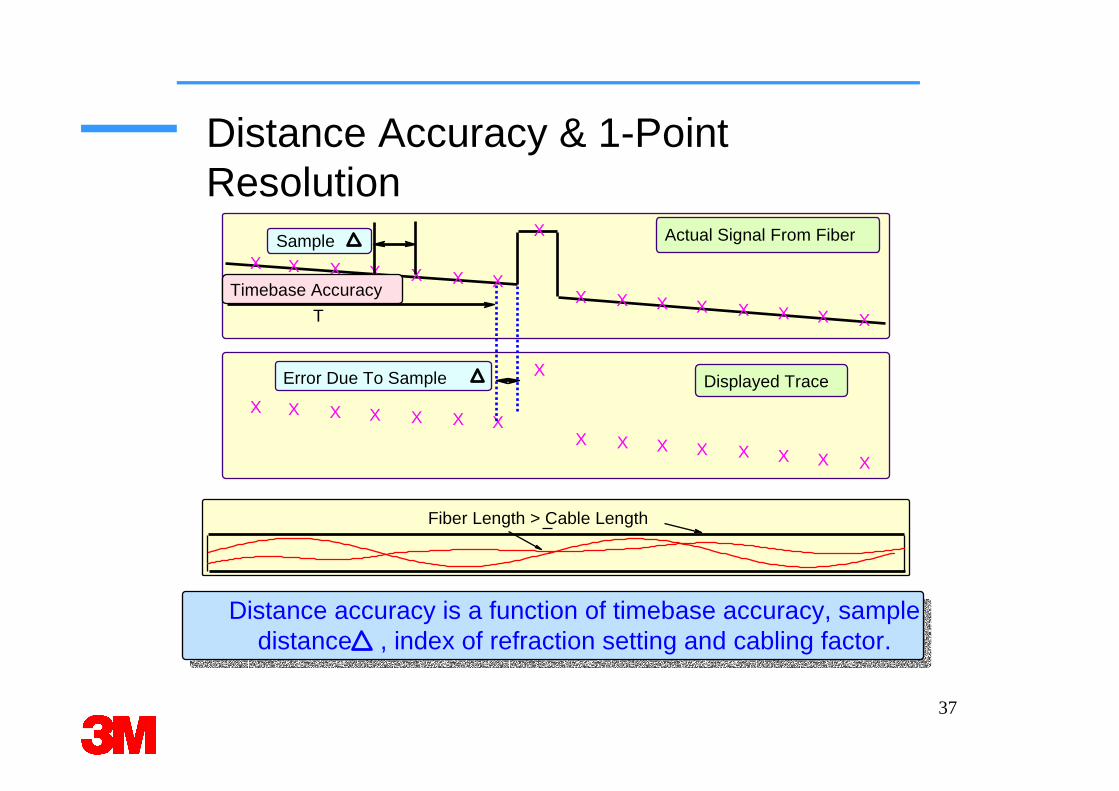
Distance Accuracy & 1-PointResolution
X X X X X X X
X
X X X X X X X X
X X X X X X X
X
X X X X X X X X
Actual Signal From Fiber
Displayed Trace
Timebase Accuracy
T
Error Due To Sample
Sample
Fiber Length > Cable Length
Distance accuracy is a function of timebase accuracy, sampledistance , index of refraction setting and cabling factor.
38
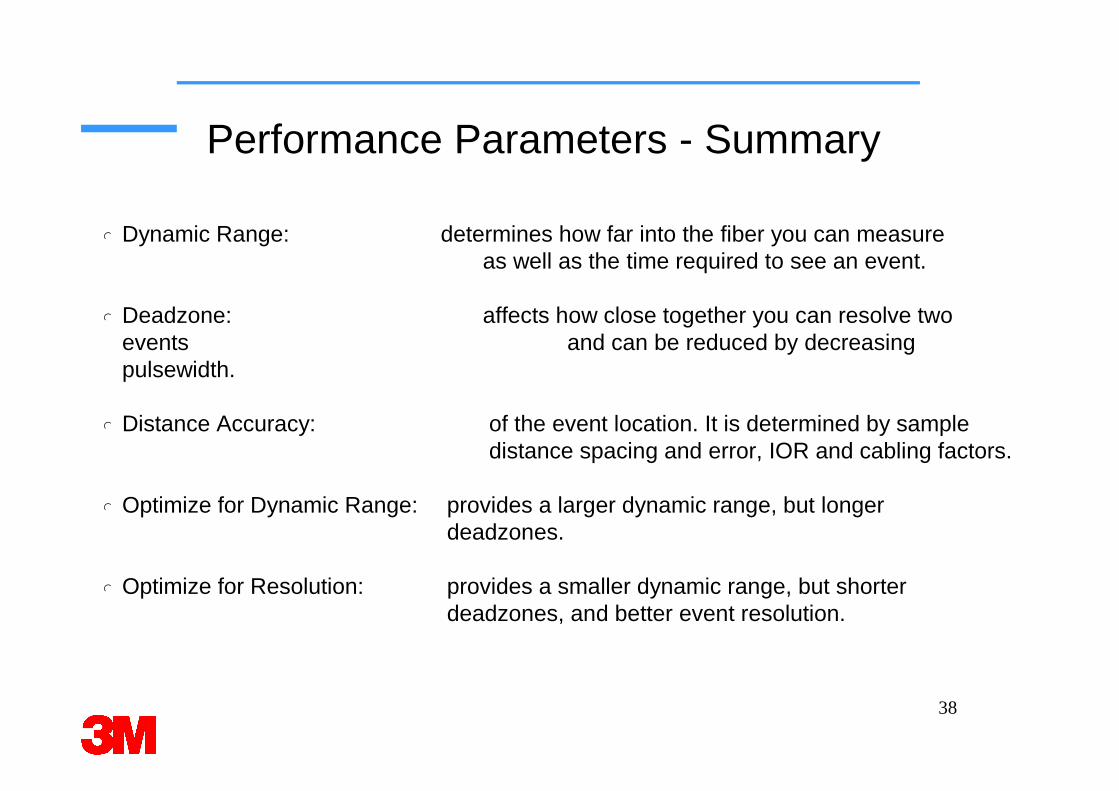
Performance Parameters - Summary
l Dynamic Range: determines how far into the fiber you can measure as well as the time required to see an event.
l Deadzone: affects how close together you can resolve two events and can be reduced by decreasing pulsewidth.
l Distance Accuracy: of the event location. It is determined by sample distance spacing and error, IOR and cabling factors.
l Optimize for Dynamic Range: provides a larger dynamic range, but longer deadzones.
l Optimize for Resolution: provides a smaller dynamic range, but shorter deadzones, and better event resolution.
39
l Basic Termsl Fibers and Connectorsl OTDR Measurementsl Introducing the 3M 2000 Mini- OTDRl Software Utilities
OTDR Measurements Agenda
40
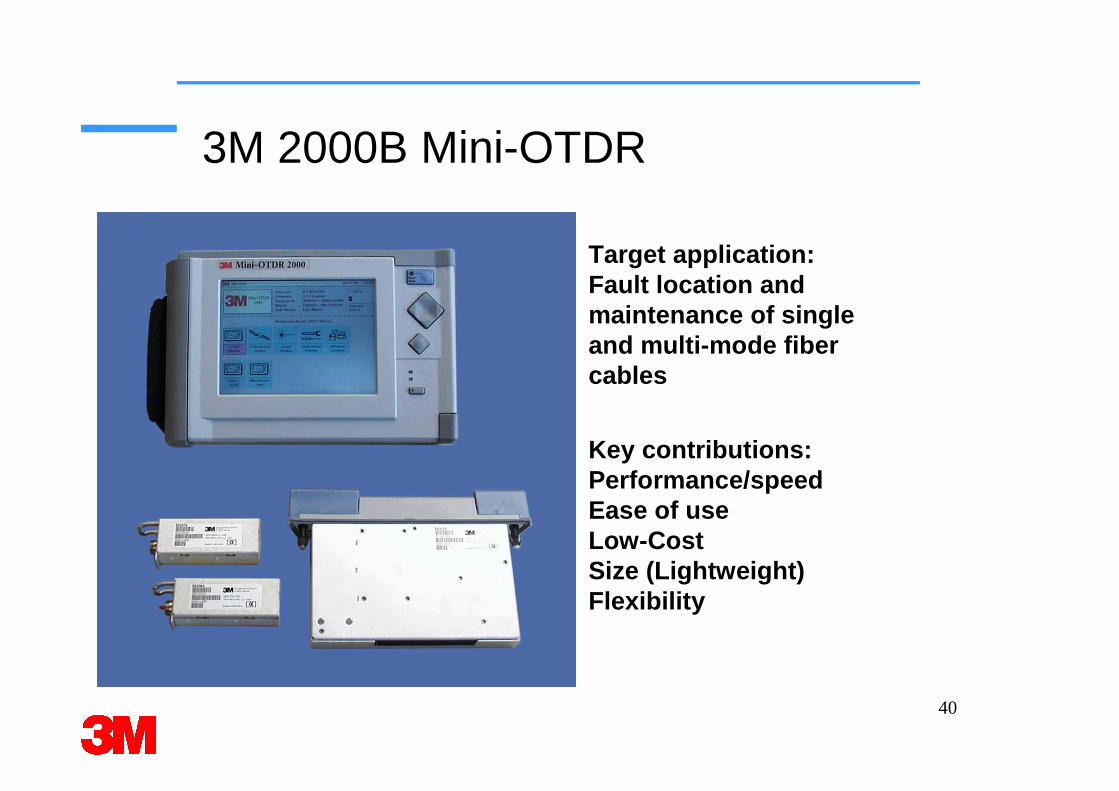
3M 2000B Mini-OTDR
Key contributions:Performance/speedEase of useLow-CostSize (Lightweight)Flexibility
Target application:Fault location andmaintenance of singleand multi-mode fibercables
41
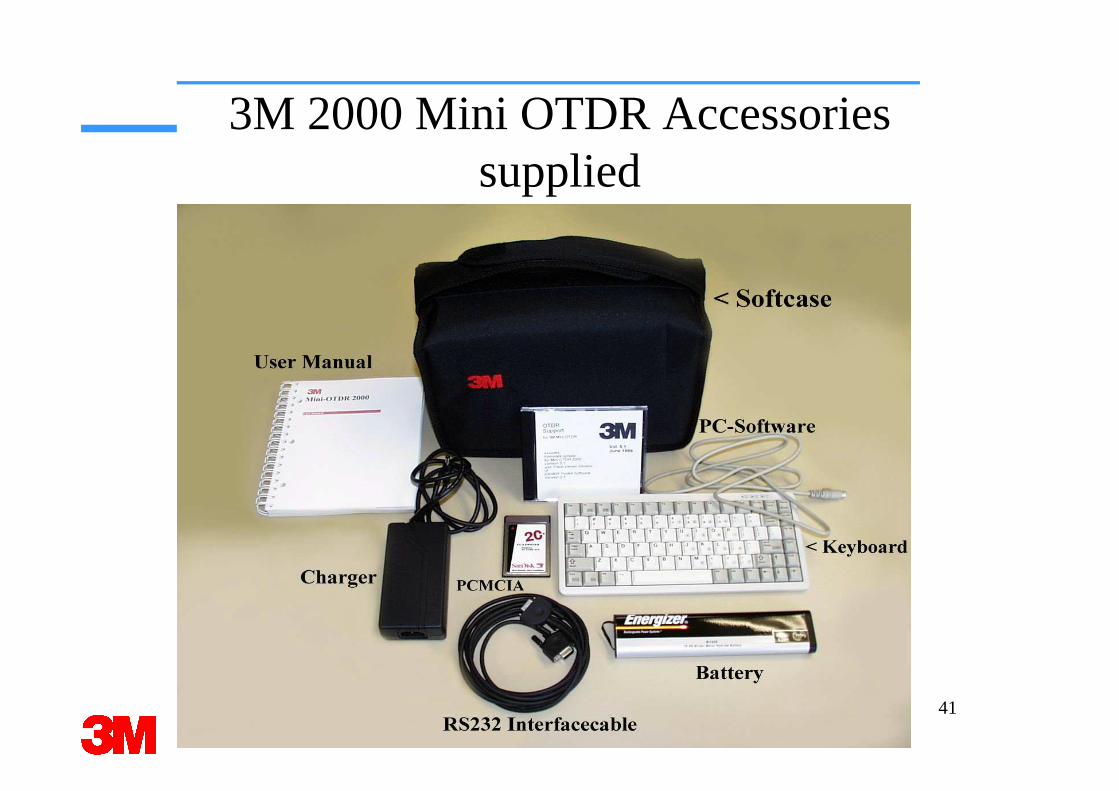
3M 2000 Mini OTDR Accessories supplied
42
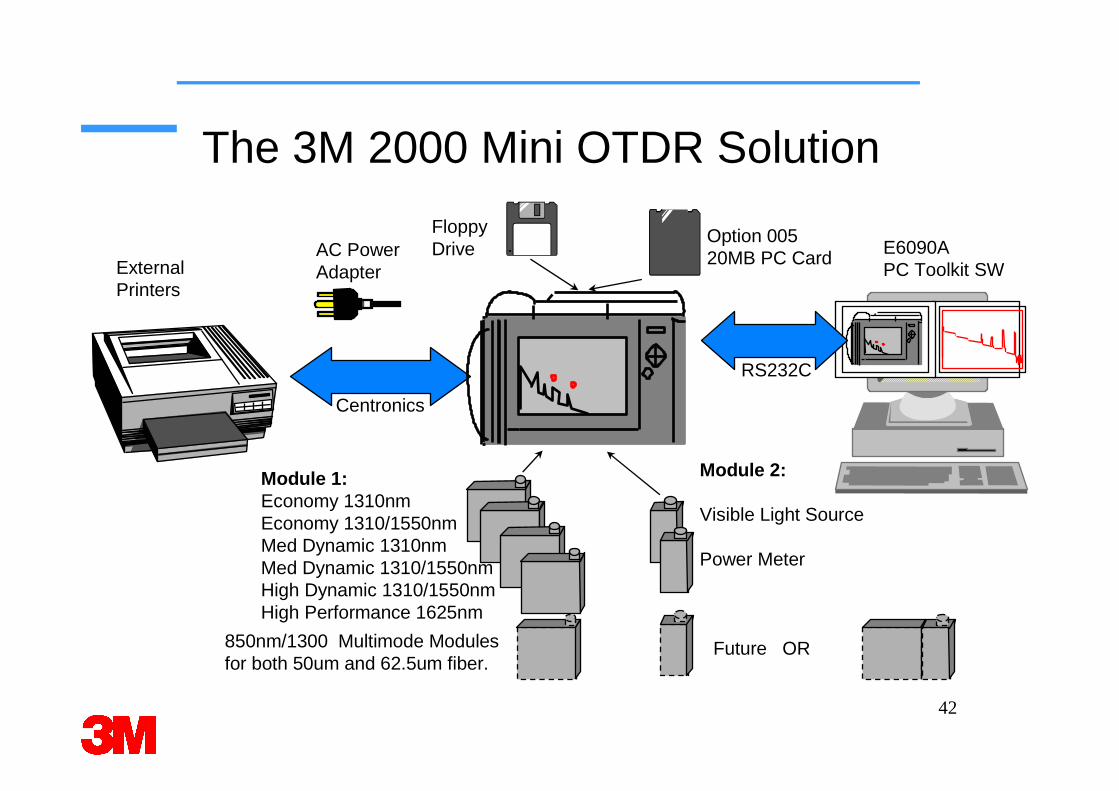
The 3M 2000 Mini OTDR Solution
Module 1:Economy 1310nmEconomy 1310/1550nmMed Dynamic 1310nmMed Dynamic 1310/1550nmHigh Dynamic 1310/1550nmHigh Performance 1625nm
Module 2:
Visible Light Source
Power Meter
FloppyDrive
Option 00520MB PC CardAC Power
Adapter
Future OR850nm/1300 Multimode Modules for both 50um and 62.5um fiber.
E6090APC Toolkit SWExternal
Printers
Centronics
RS232C
43
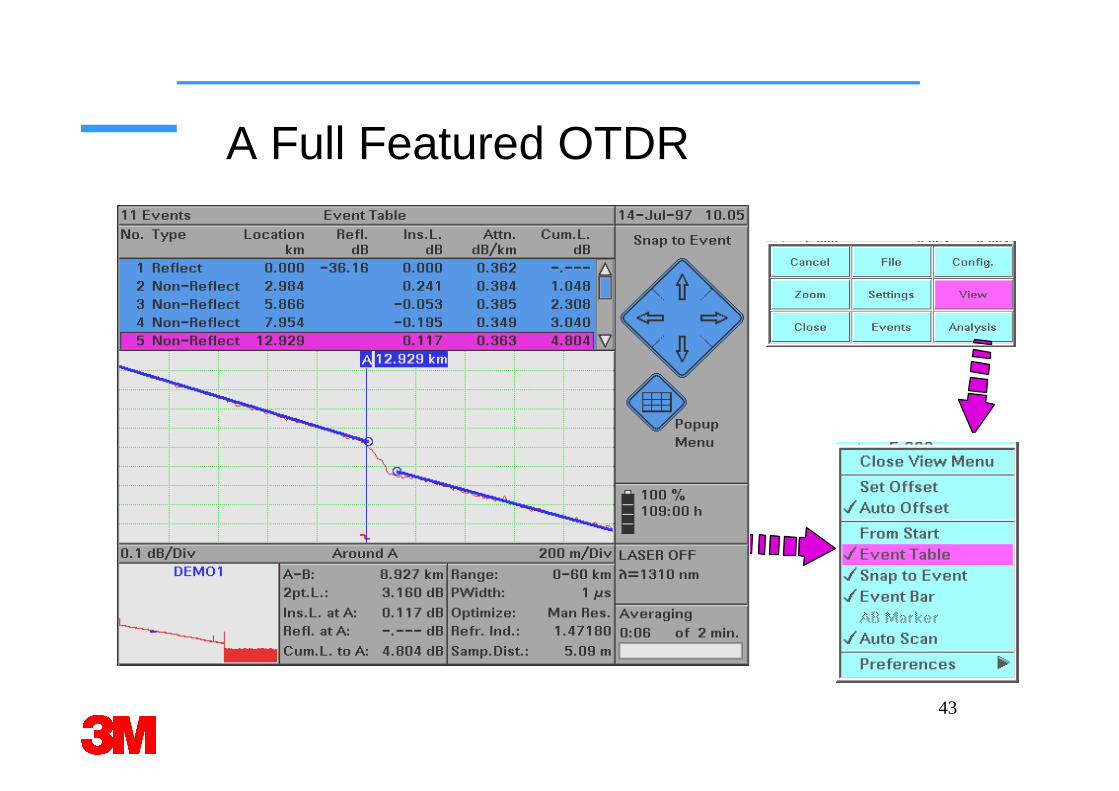
A Full Featured OTDR
44
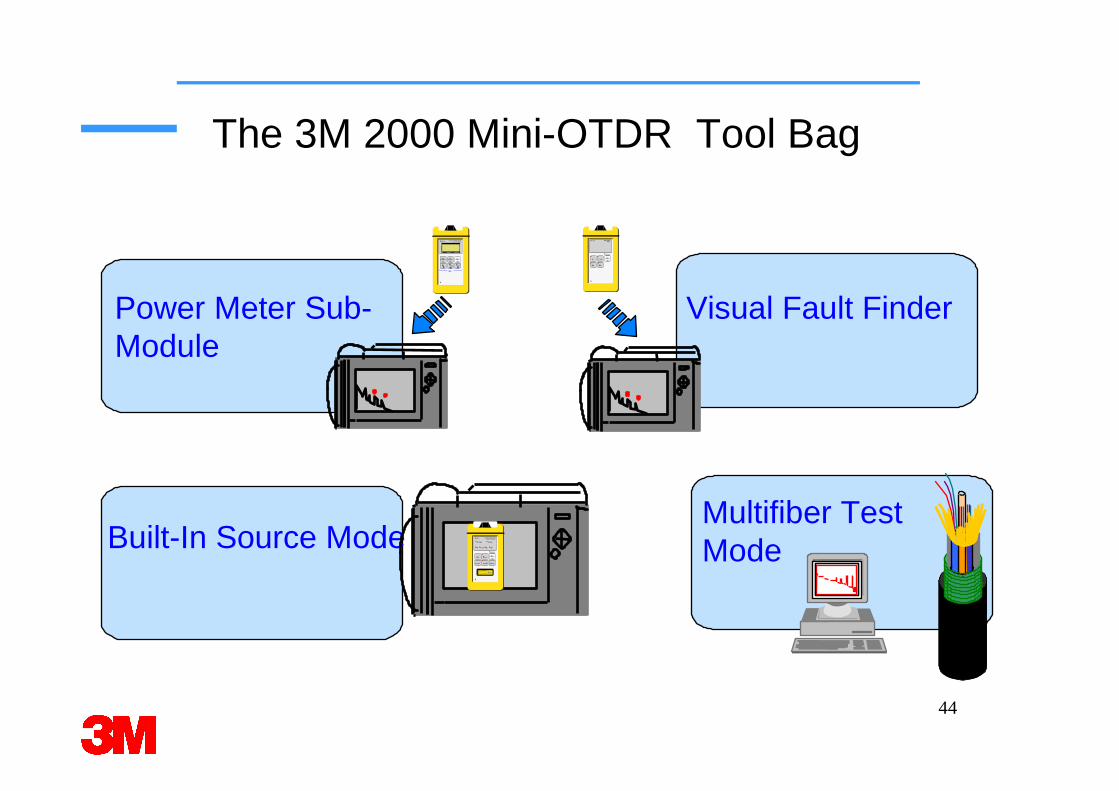
The 3M 2000 Mini-OTDR Tool Bag
H
OPTICAL POWER METER850 - 1550 nm
E5970 A
Hold Disp→→→→Ref
dBm
λλλλ S el
dB
Re fW
���� ����
Modify
On
Off
LED SOURCE13 0 0nm
E5972A
Co ntinuo usOpera tion
1kHz
CW 27 0Hz
2kHz
On
Off
H
Power Meter Sub-Module
Built-In Source Mode
Visual Fault Finder
Multifiber TestModeContinuous
Ope rat ion
E5974 A DUAL LASER SOURCE1310 / 1550 nm
1310nm
Mod
1550nm
1310 nm 15 50nm
Dual λλλλ
CW 270Hz 1kHz 2kHz
λλλλ LockOn
Off
CLAS S 1 LAS ER PRODUCTCOMPLIES WITH 21 CF R 1040.10
MANUFACTURED: __________________________HEWLETT-PACKARD GMBHHERRENBERGER STR. 130, D- 71034 BÖBL INGEN
Feb 95
H
45
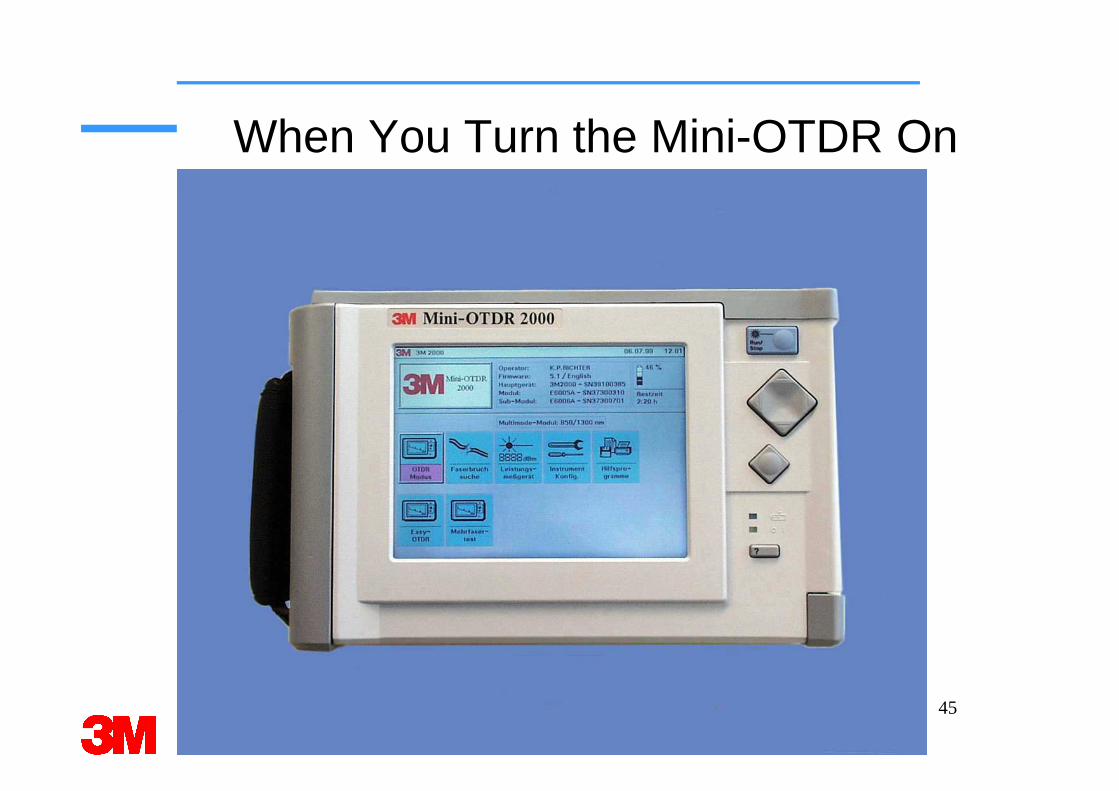
When You Turn the Mini-OTDR On
46
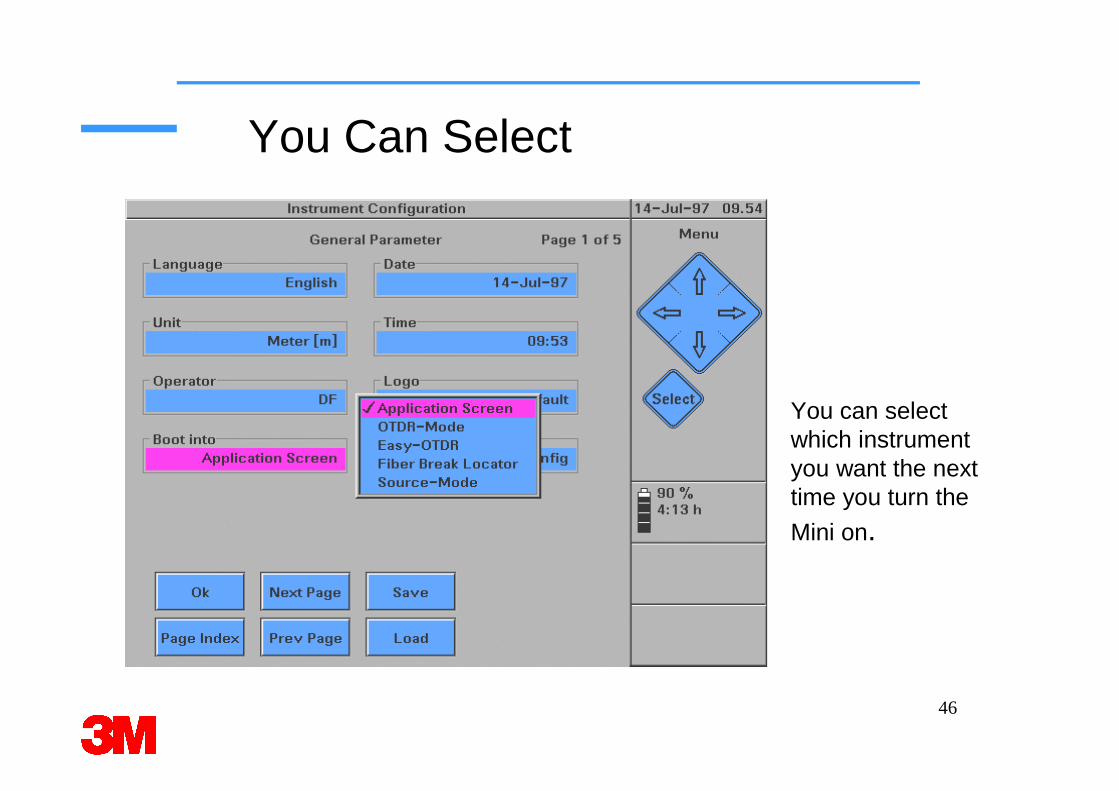
You Can Select
You can select which instrument you want the next time you turn the
Mini on.
47
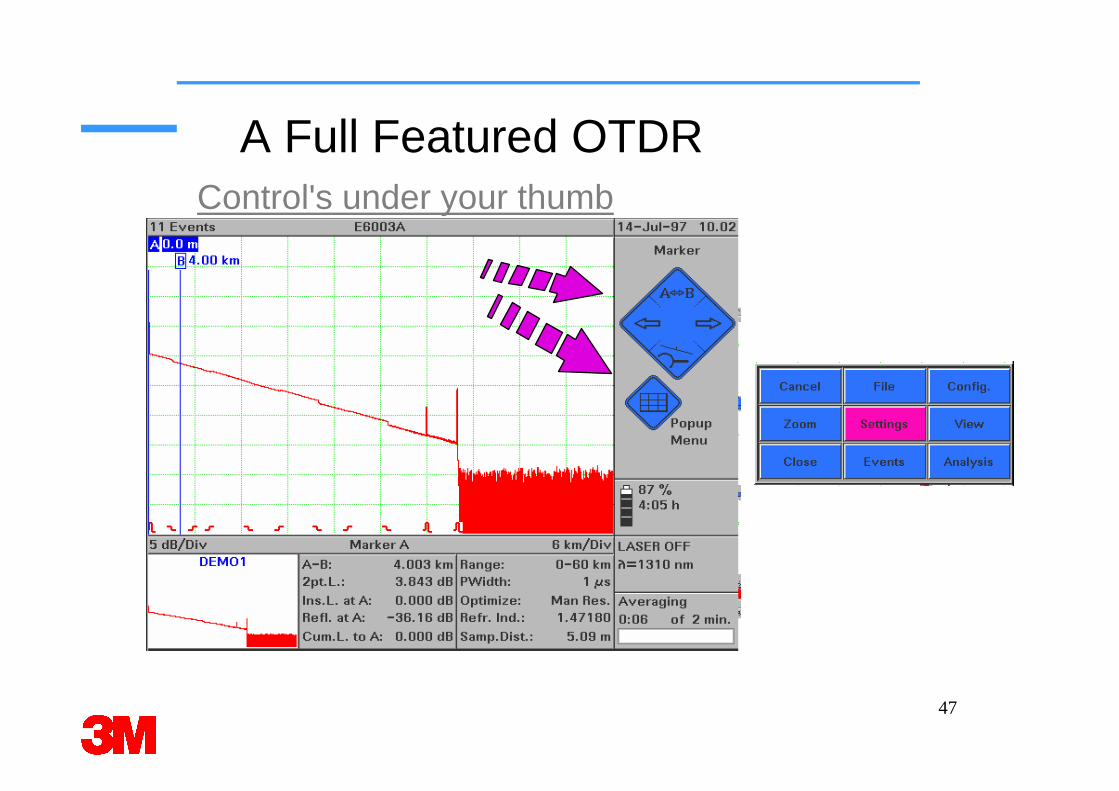
A Full Featured OTDRControl's under your thumb
48
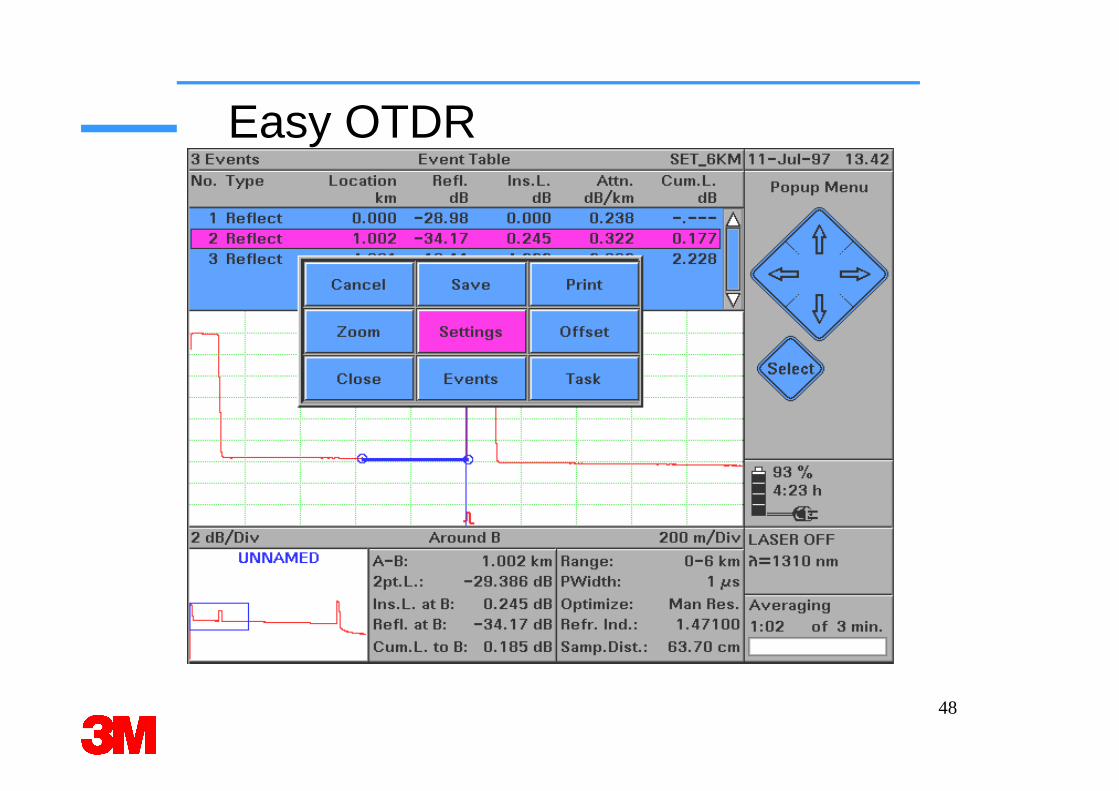
Easy OTDR
49
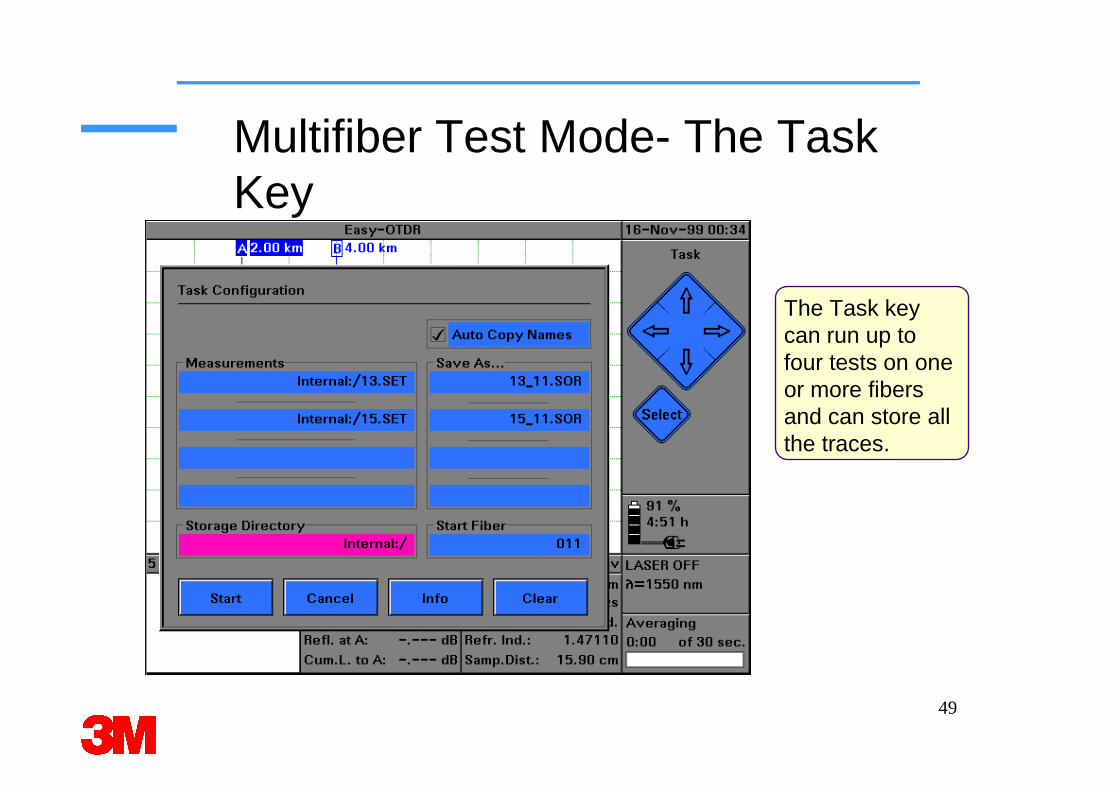
Multifiber Test Mode- The Task Key
The Task key can run up to four tests on one or more fibers and can store all the traces.
50
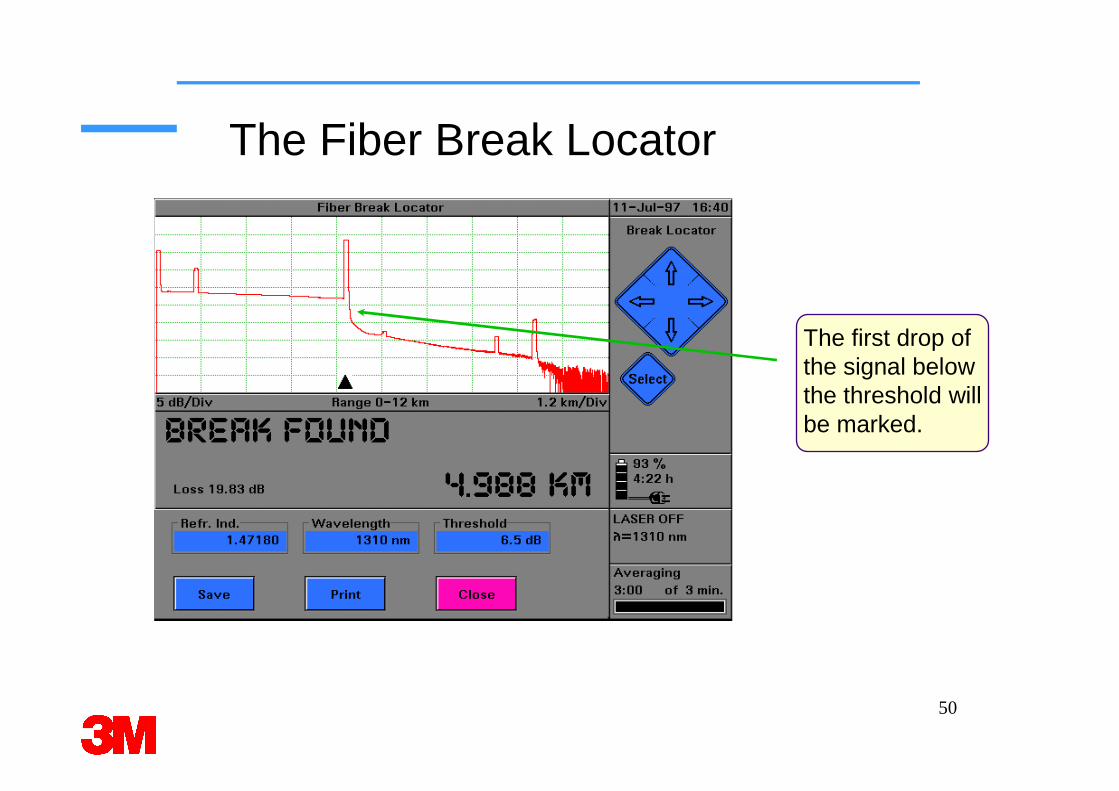
The Fiber Break Locator
The first drop of the signal below the threshold will be marked.
51
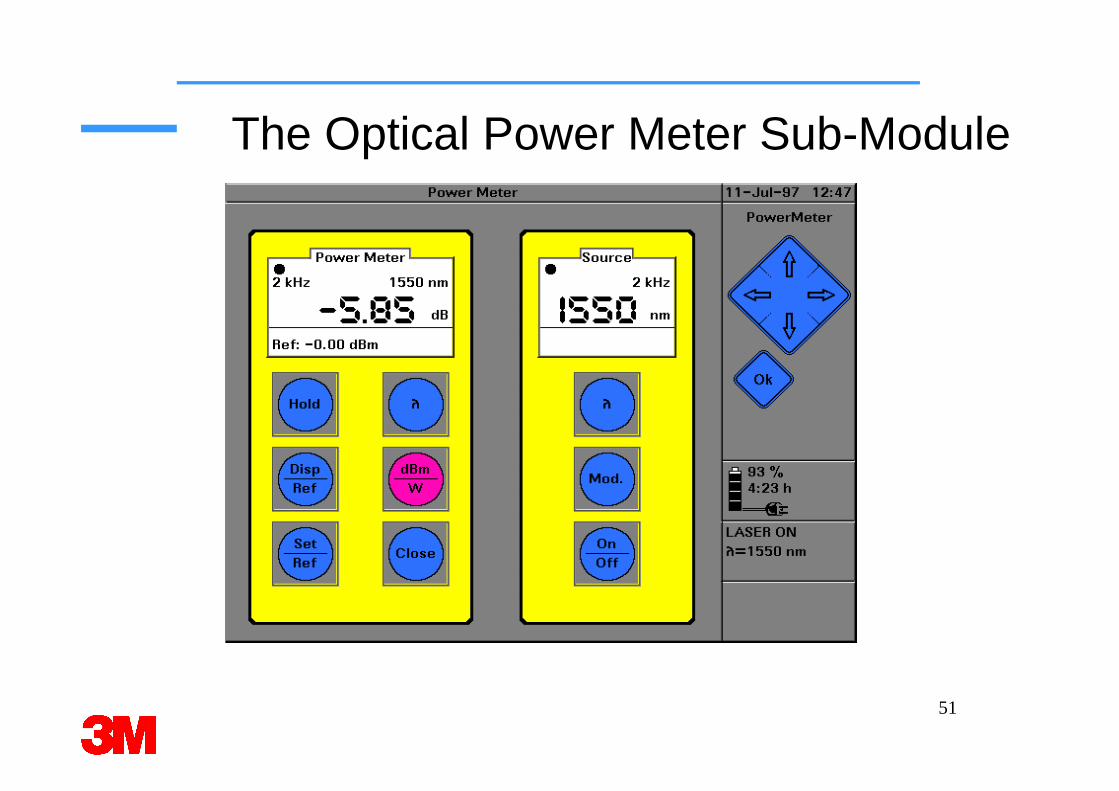
The Optical Power Meter Sub-Module
52
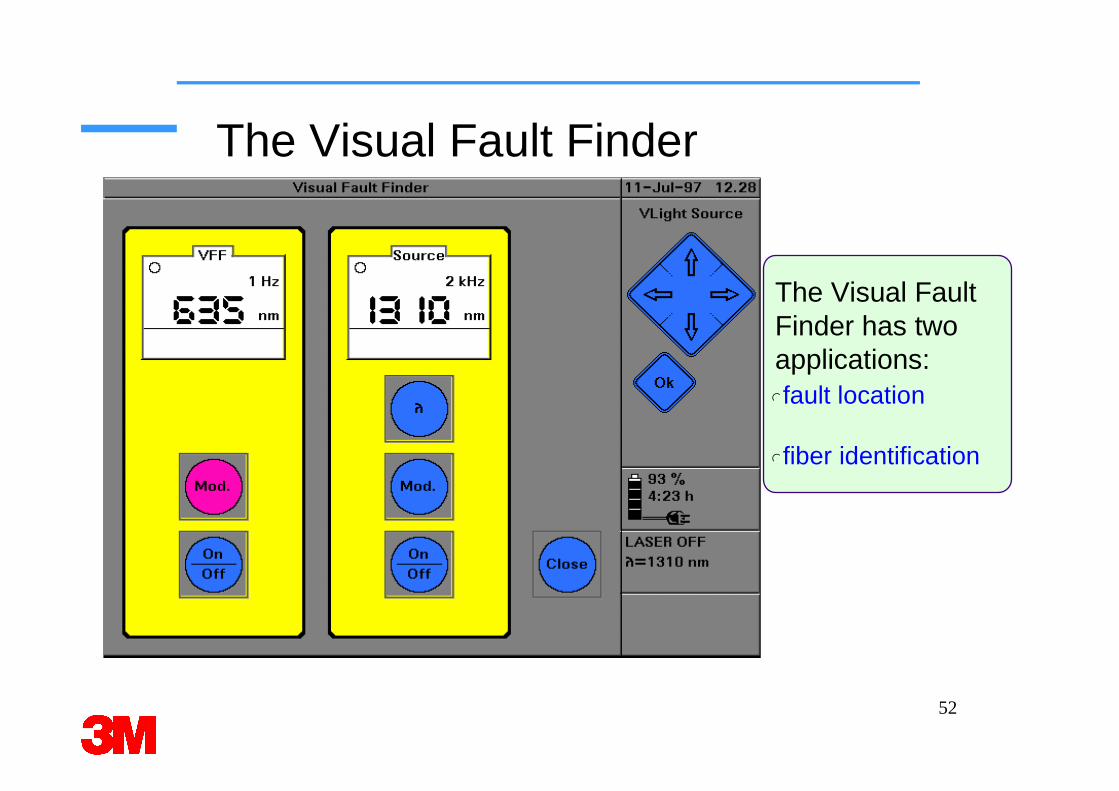
The Visual Fault Finder
lfault location
lfiber identification
The Visual Fault Finder has two applications:
53
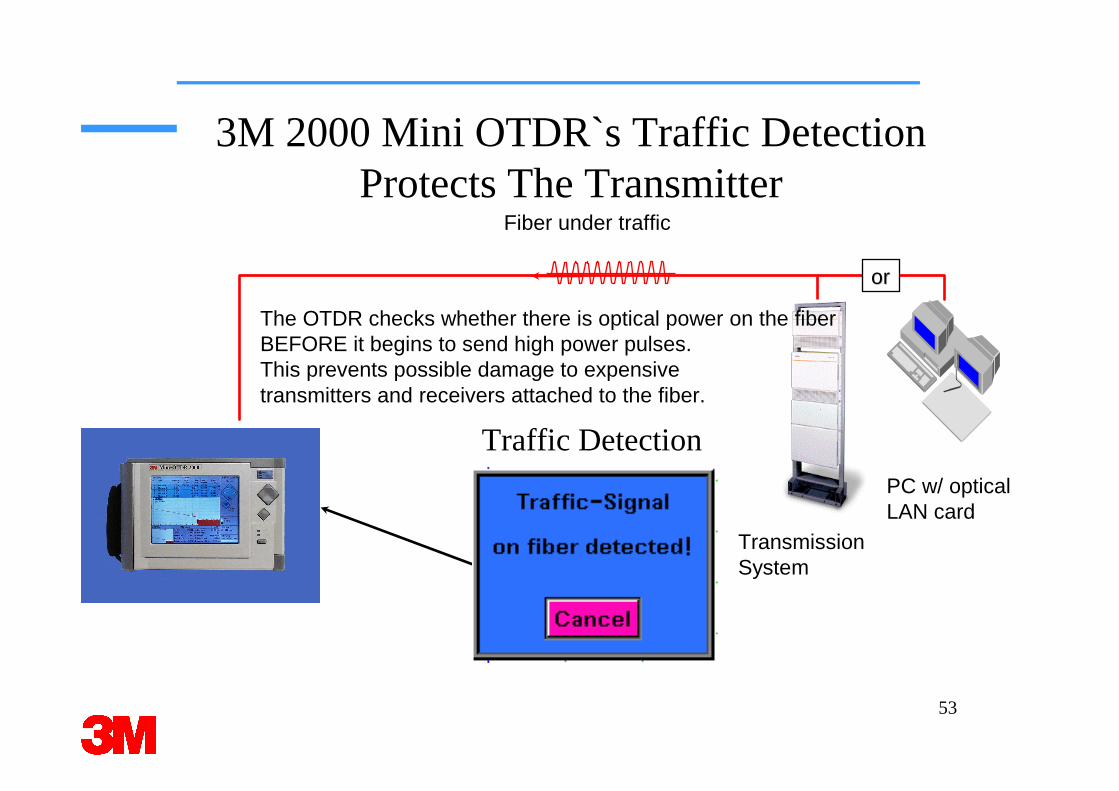
3M 2000 Mini OTDR`s Traffic Detection Protects The Transmitter
Traffic Detection
Fiber under traffic
PC w/ opticalLAN card
TransmissionSystem
oror
The OTDR checks whether there is optical power on the fiberBEFORE it begins to send high power pulses. This prevents possible damage to expensive transmitters and receivers attached to the fiber.
54
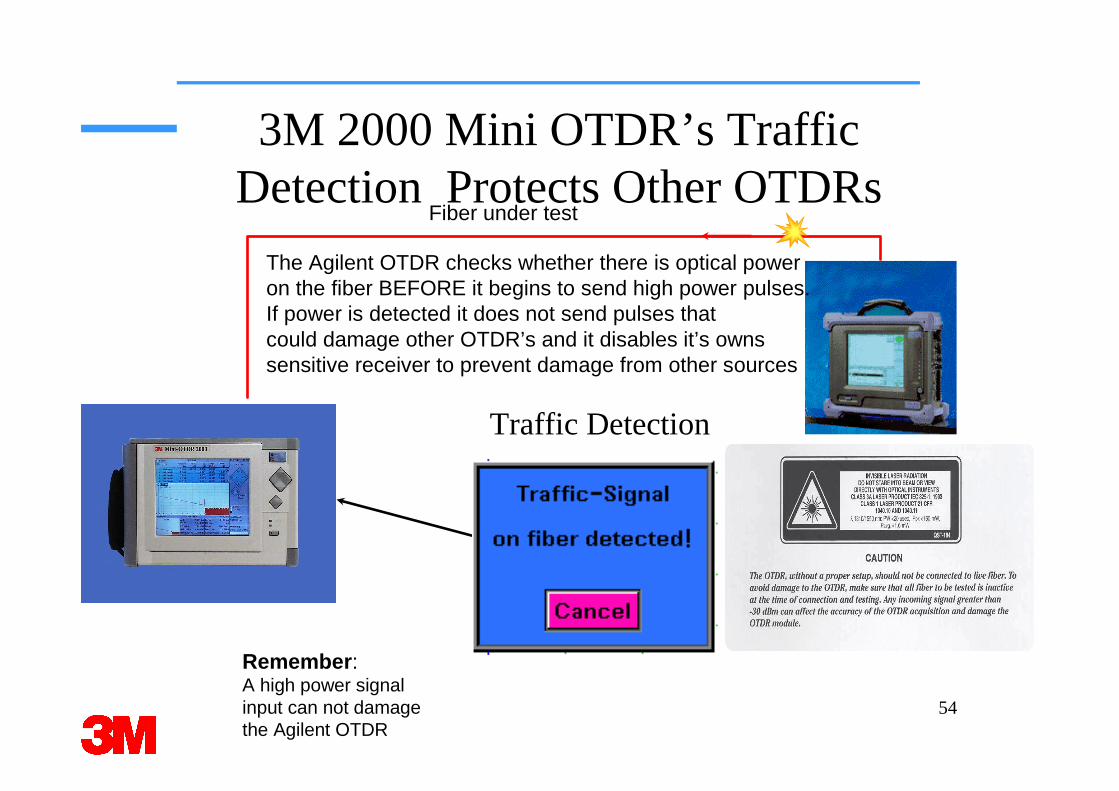
3M 2000 Mini OTDR’s Traffic Detection Protects Other OTDRs
Traffic Detection
Fiber under test
Remember: A high power signal input can not damage the Agilent OTDR
The Agilent OTDR checks whether there is optical power on the fiber BEFORE it begins to send high power pulses. If power is detected it does not send pulses that could damage other OTDR’s and it disables it’s owns sensitive receiver to prevent damage from other sources
55
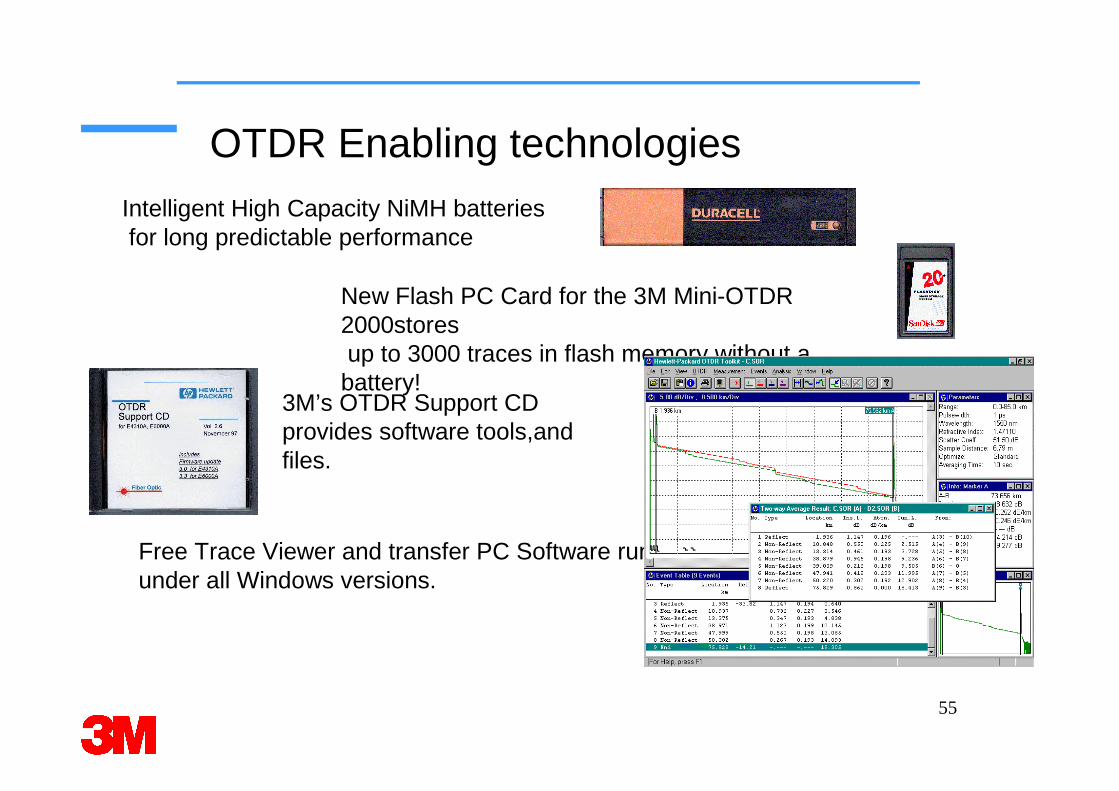
OTDR Enabling technologiesIntelligent High Capacity NiMH batteriesfor long predictable performance
New Flash PC Card for the 3M Mini-OTDR 2000storesup to 3000 traces in flash memory without a
battery!
Free Trace Viewer and transfer PC Software runs under all Windows versions.
3M’s OTDR Support CD provides software tools,and files.
56
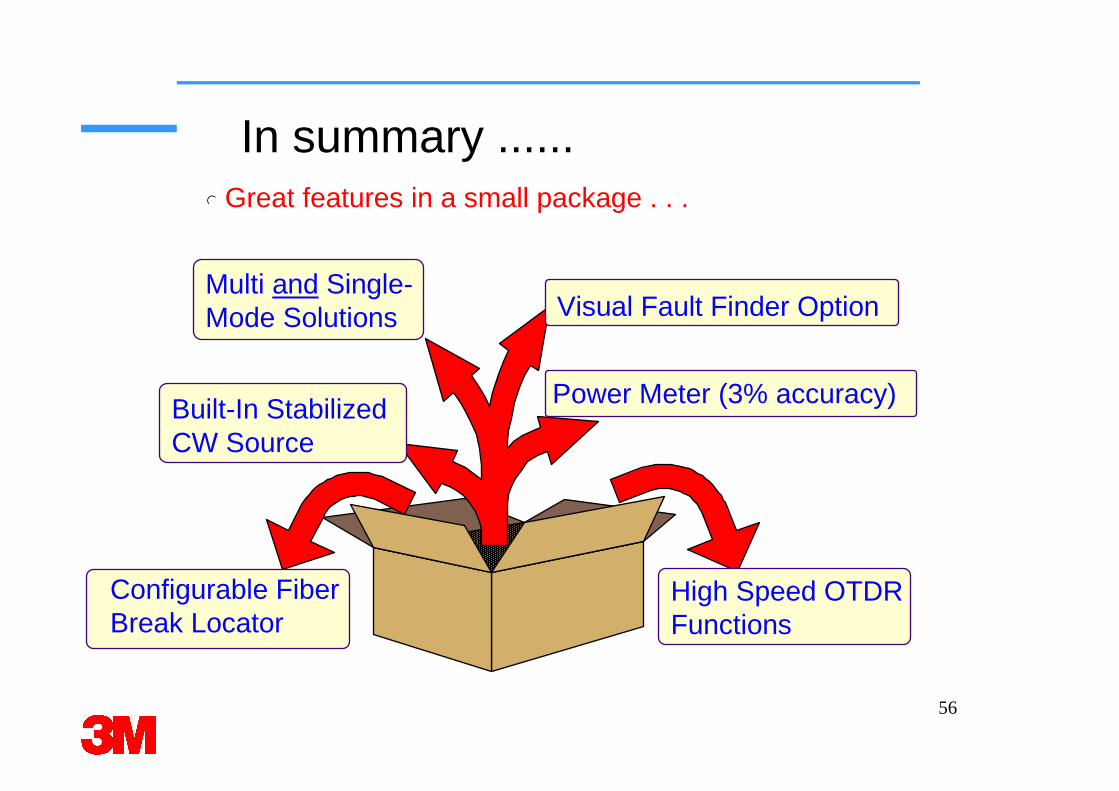
In summary ......l Great features in a small package . . .
Power Meter (3% accuracy)
Visual Fault Finder Option Multi and Single-Mode Solutions
Built-In StabilizedCW Source
High Speed OTDRFunctions
Configurable Fiber Break Locator
57
l Basic Termsl Fibers and Connectorsl OTDR Measurementsl Introducing the 3M Mini- OTDR 2000l Software Utilities
OTDR Measurements Agenda
58
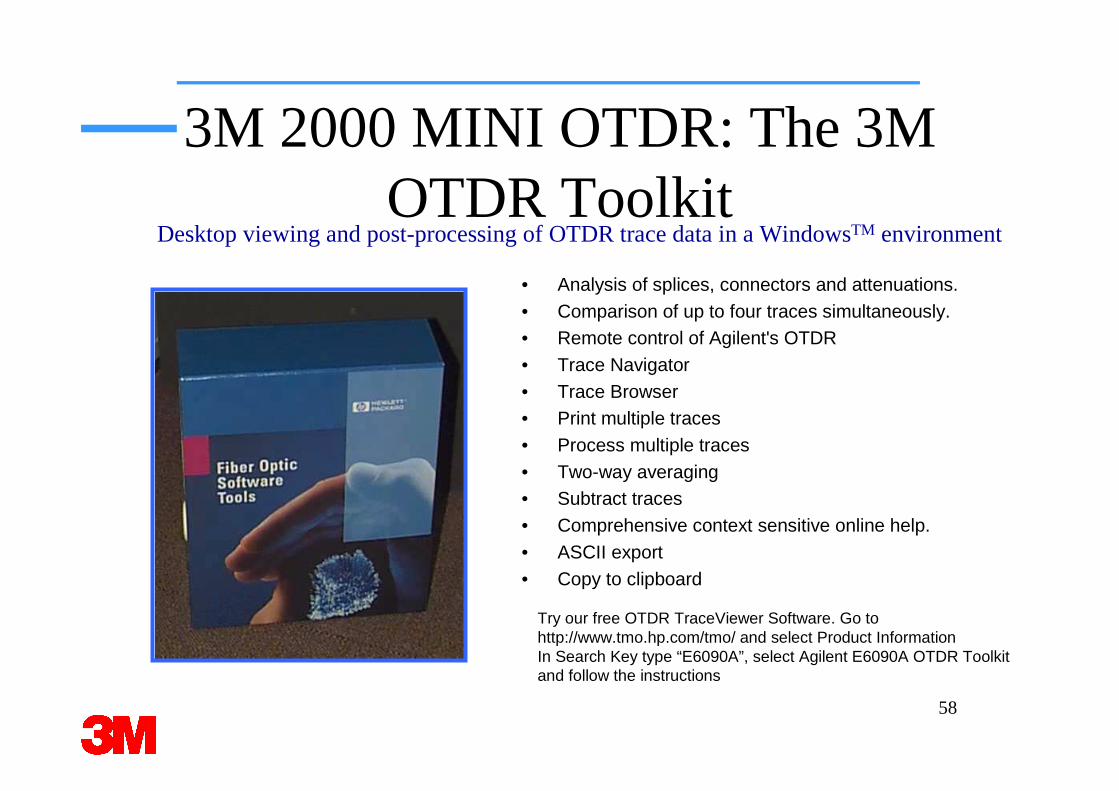
3M 2000 MINI OTDR: The 3M OTDR Toolkit
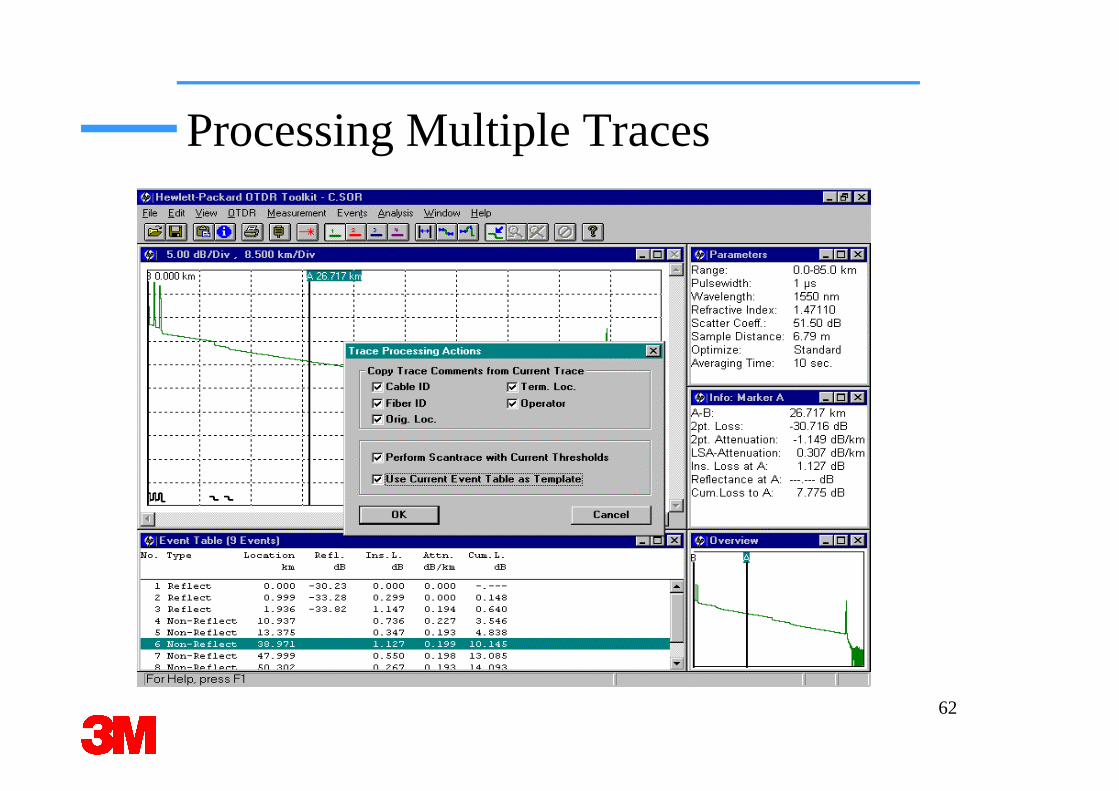
• Analysis of splices, connectors and attenuations. • Comparison of up to four traces simultaneously. • Remote control of Agilent's OTDR • Trace Navigator• Trace Browser• Print multiple traces• Process multiple traces• Two-way averaging • Subtract traces • Comprehensive context sensitive online help. • ASCII export • Copy to clipboard
Desktop viewing and post-processing of OTDR trace data in a WindowsTM environment
Try our free OTDR TraceViewer Software. Go to http://www.tmo.hp.com/tmo/ and select Product Information In Search Key type “E6090A”, select Agilent E6090A OTDR Toolkitand follow the instructions
59
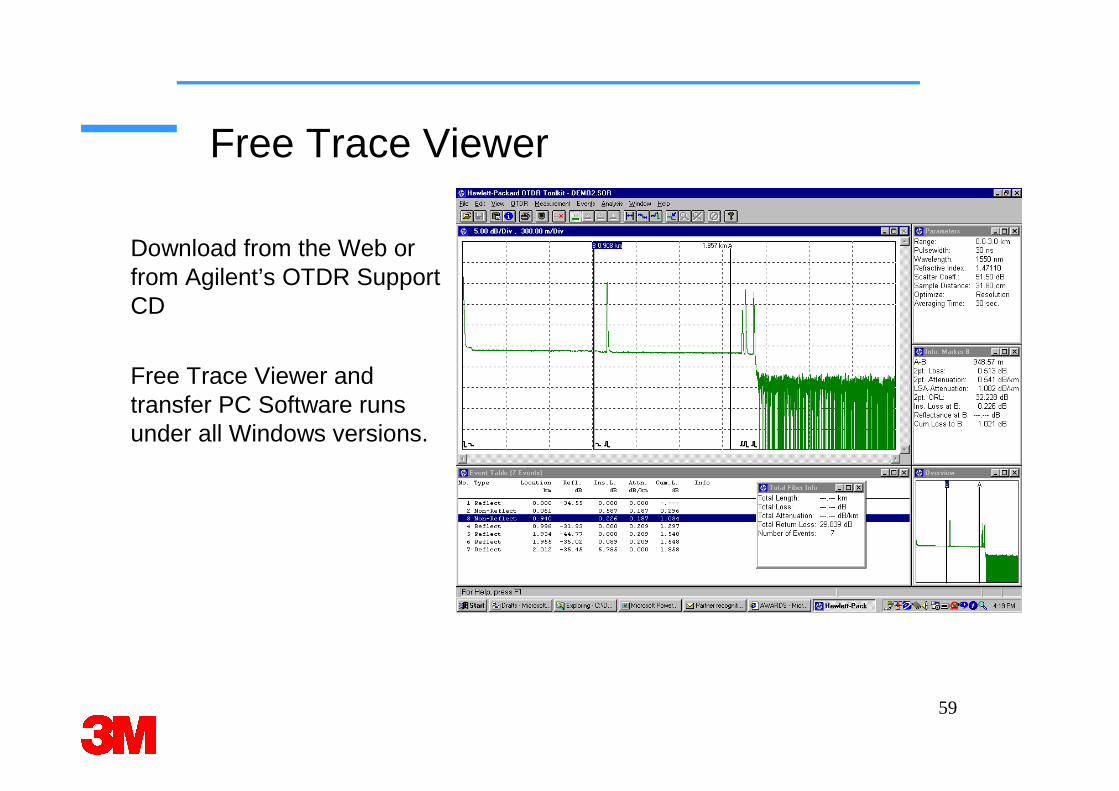
Free Trace Viewer
Free Trace Viewer and transfer PC Software runs under all Windows versions.
Download from the Web or from Agilent’s OTDR Support CD
60
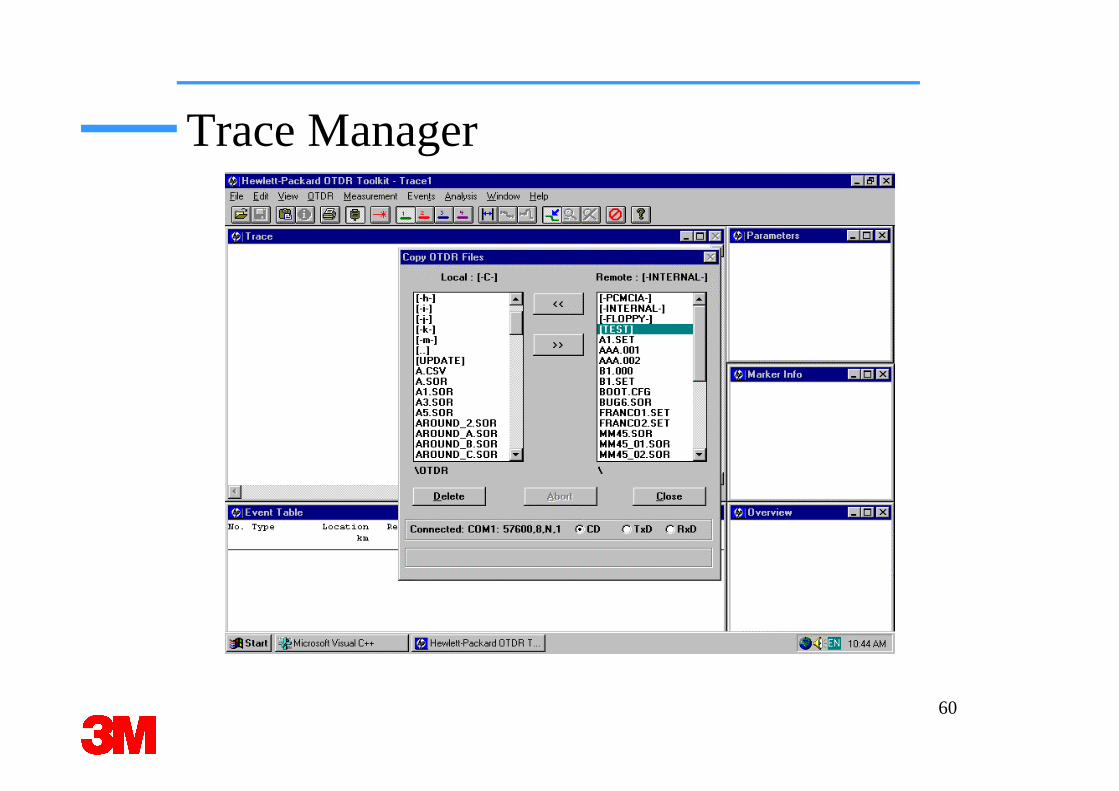
Trace Manager
61
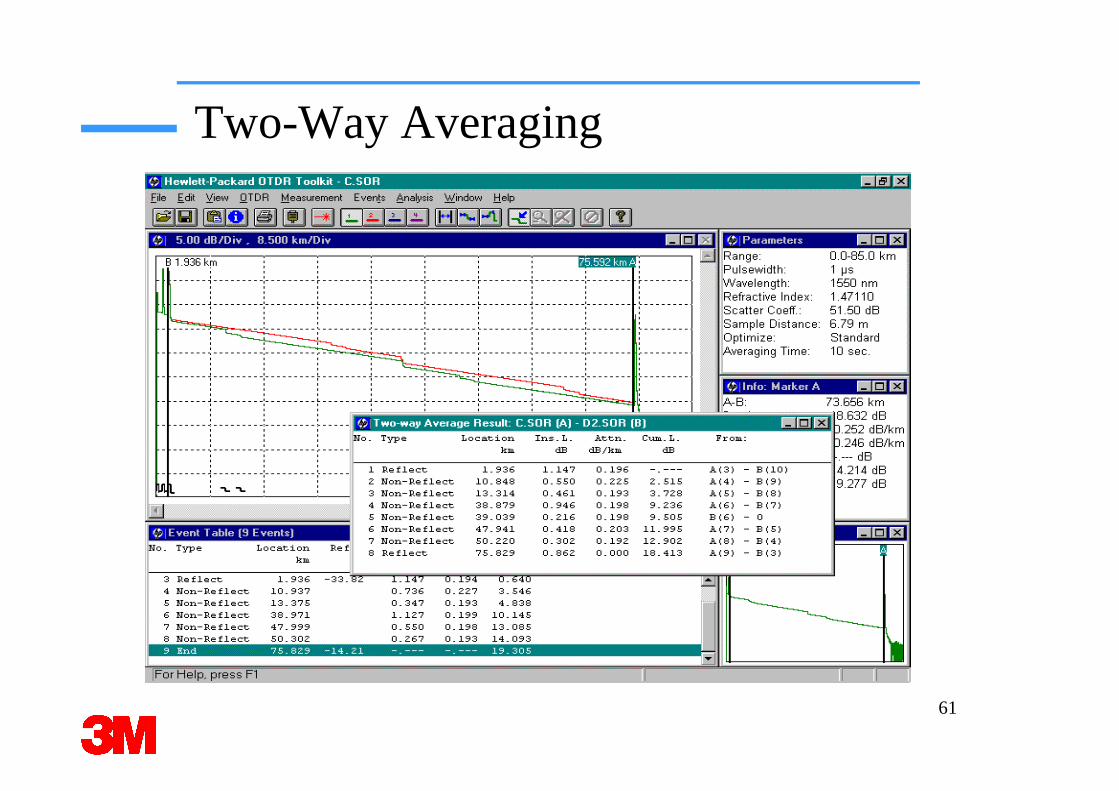
Two-Way Averaging
62
Processing Multiple Traces
63
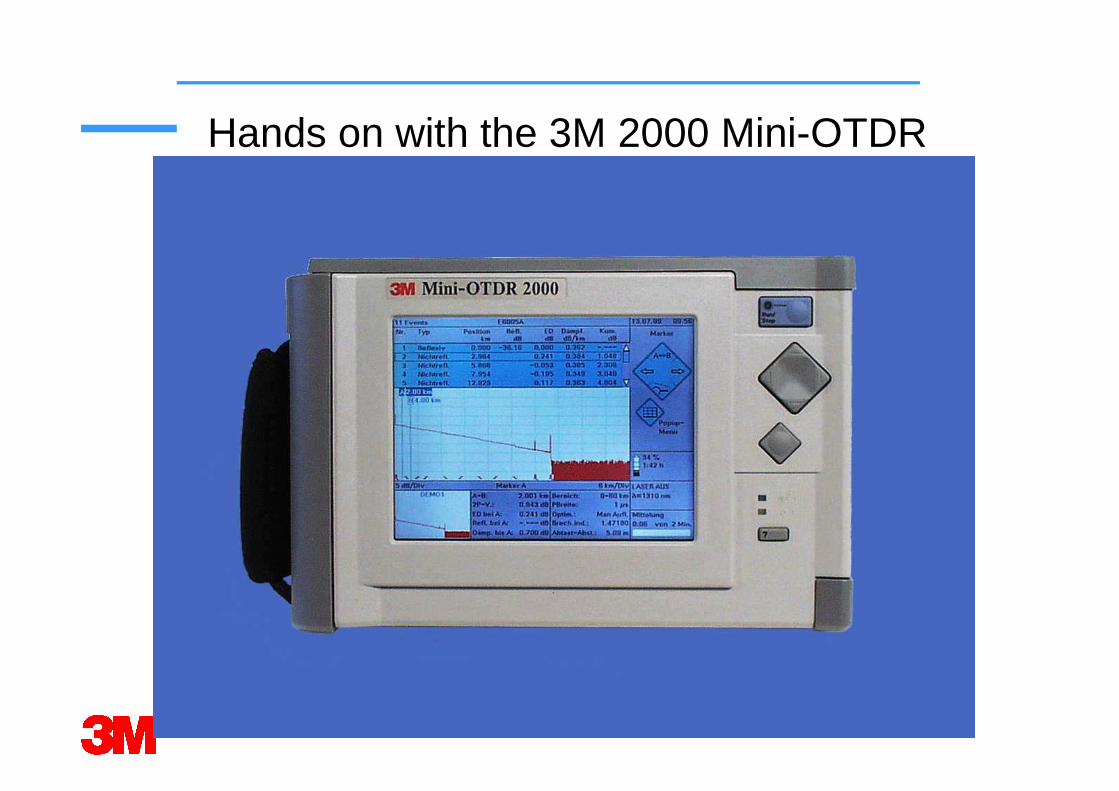
Hands on with the 3M 2000 Mini-OTDR
64
l The Hardkeys - Softkeys and Menusl Getting started - Storing your Setupsl Measurement Parametersl Analyzing Tracesl Using Easy Model Printing and Saving Traces
Using the 3M 2000 Mini-OTDR
65
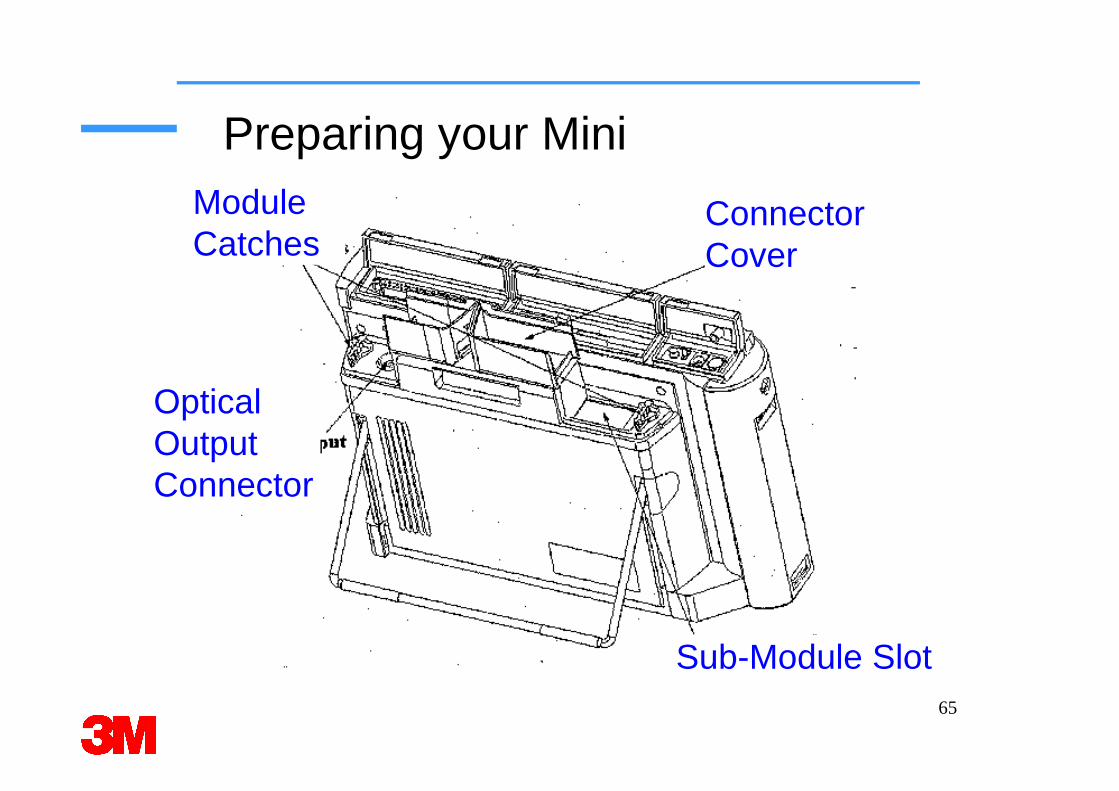
Preparing your Mini
Connector Cover
Sub-Module Slot
Optical OutputConnector
Module Catches
66
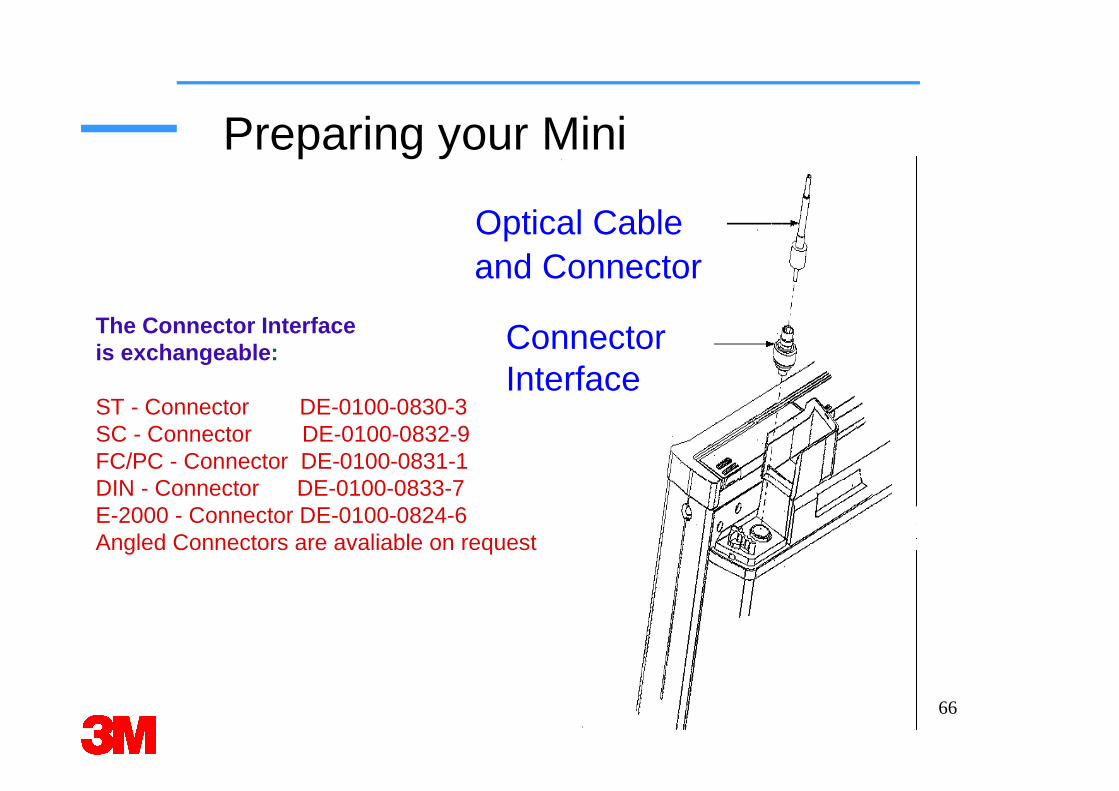
Preparing your Mini
The Connector Interfaceis exchangeable:
ST - Connector DE-0100-0830-3SC - Connector DE-0100-0832-9FC/PC - Connector DE-0100-0831-1DIN - Connector DE-0100-0833-7E-2000 - Connector DE-0100-0824-6Angled Connectors are avaliable on request
Connector Interface
and ConnectorOptical Cable
67
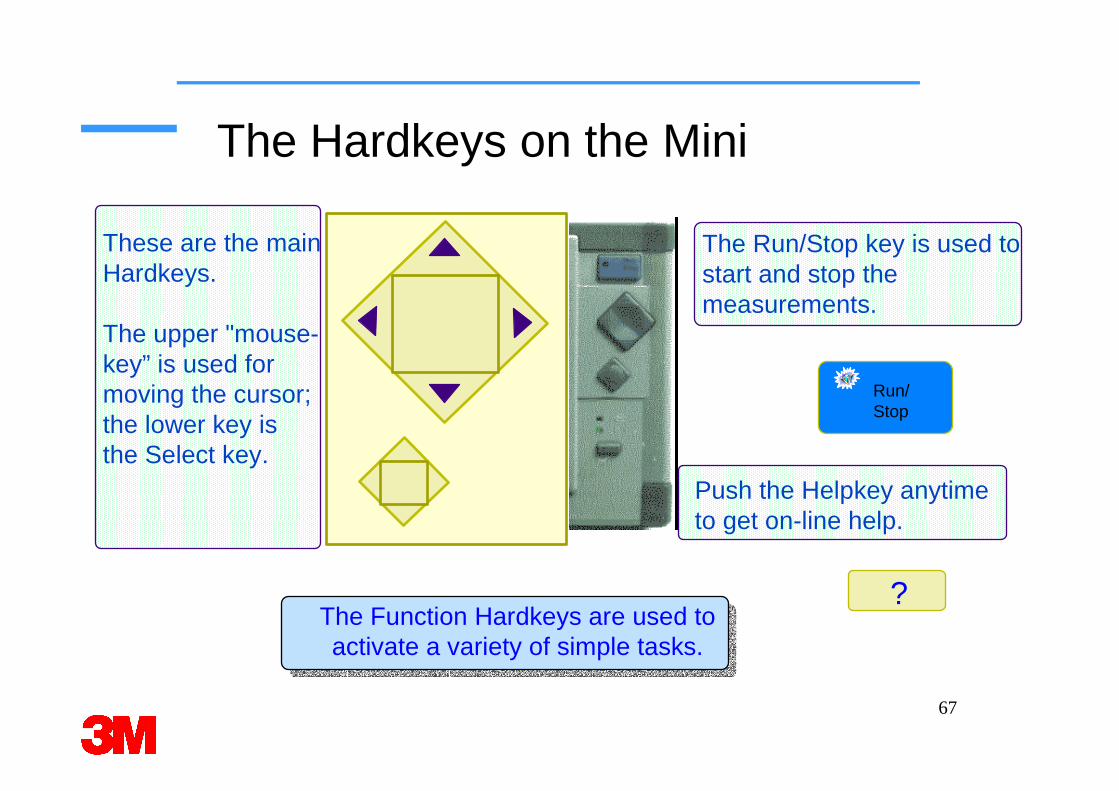
The Hardkeys on the Mini
The Run/Stop key is used to start and stop the measurements.
The Function Hardkeys are used toactivate a variety of simple tasks.
?
Run/Stop
Push the Helpkey anytime to get on-line help.
These are the main Hardkeys.
The upper "mouse-key” is used for moving the cursor; the lower key isthe Select key.
68
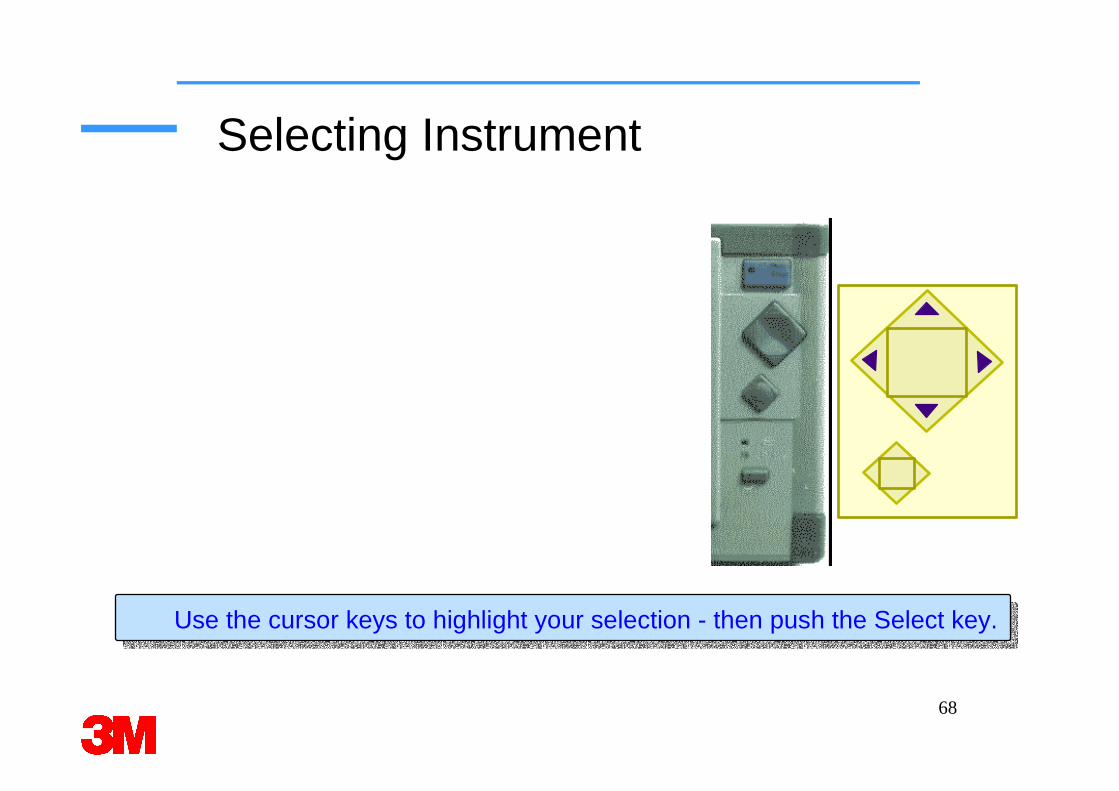
Selecting Instrument
Use the cursor keys to highlight your selection - then push the Select key.
69
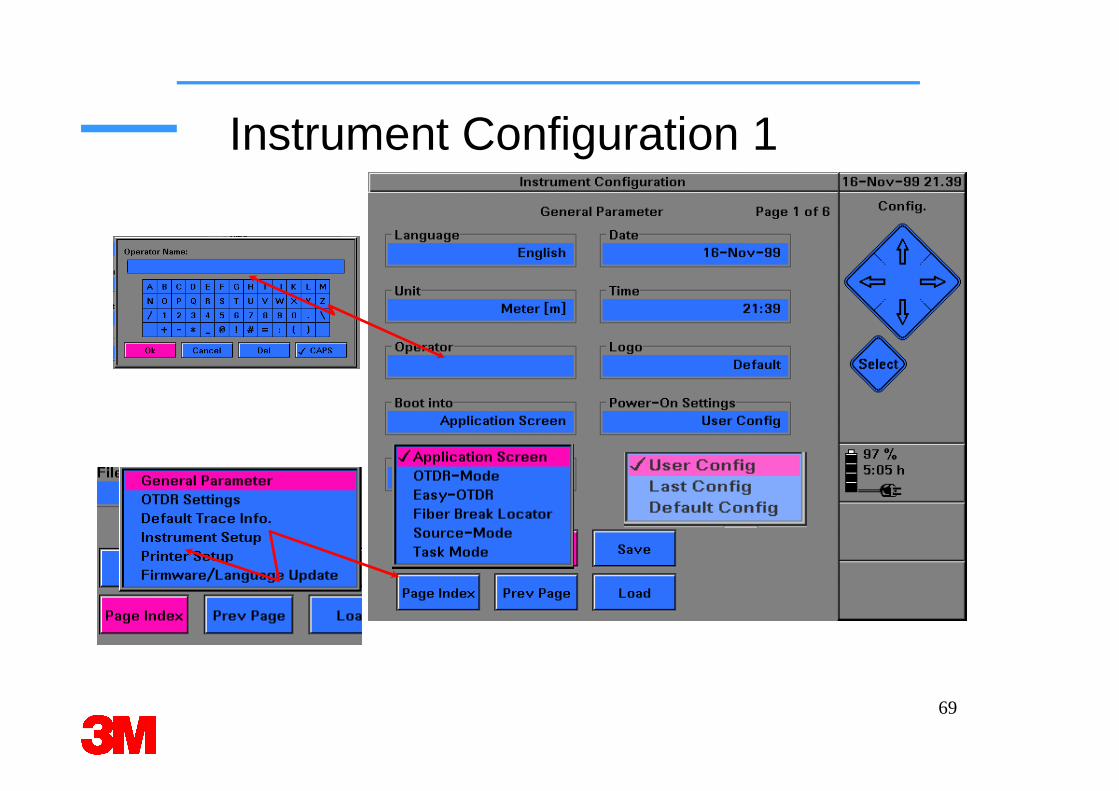
Instrument Configuration 1
70
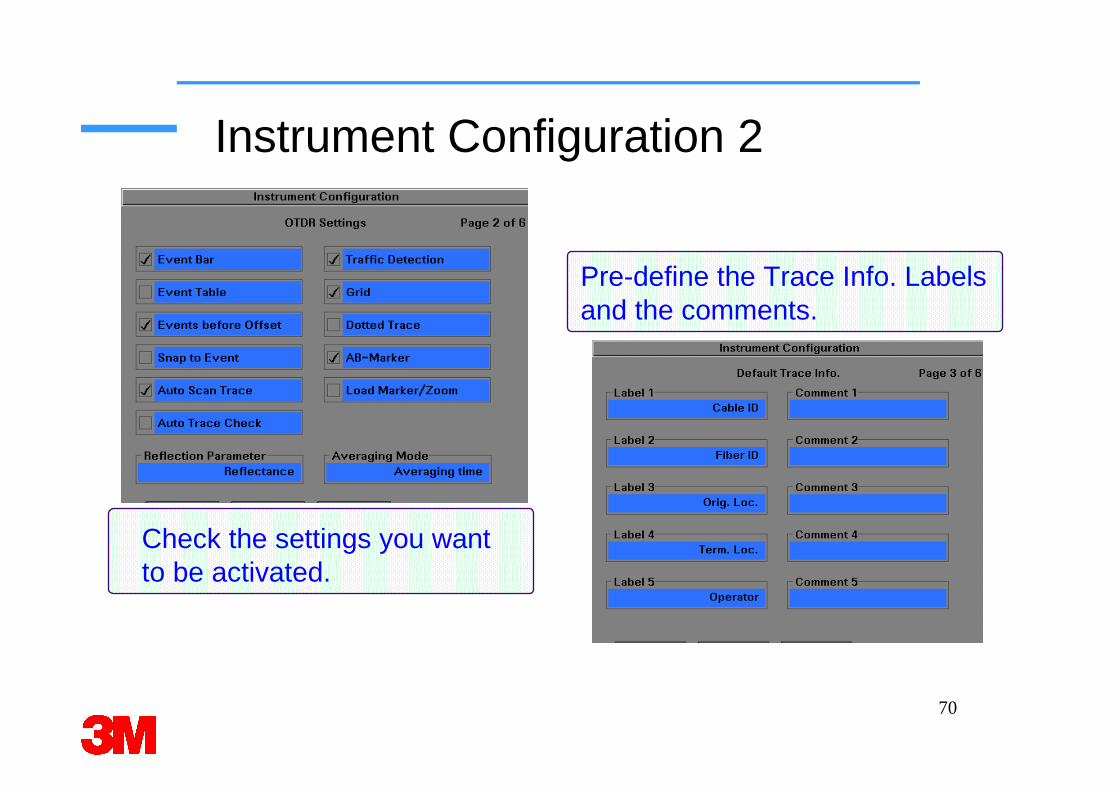
Instrument Configuration 2
Pre-define the Trace Info. Labelsand the comments.
Check the settings you wantto be activated.
71
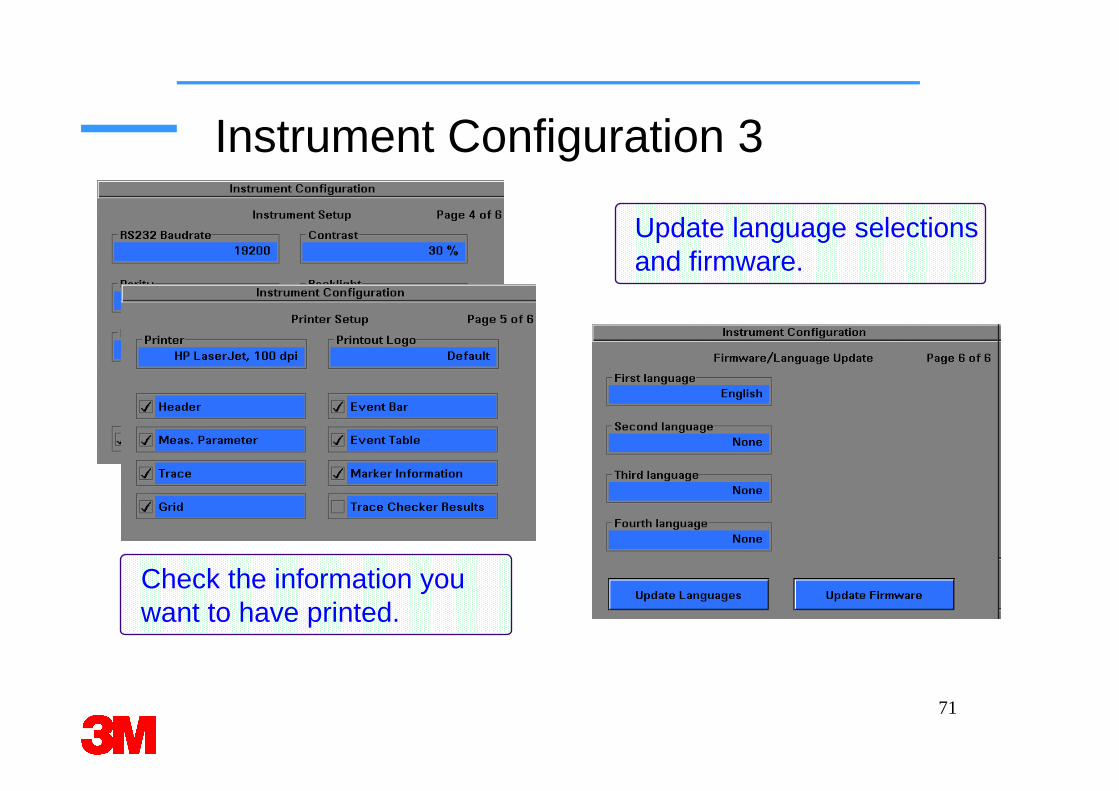
Instrument Configuration 3
Check the information you want to have printed.
Update language selections and firmware.
72
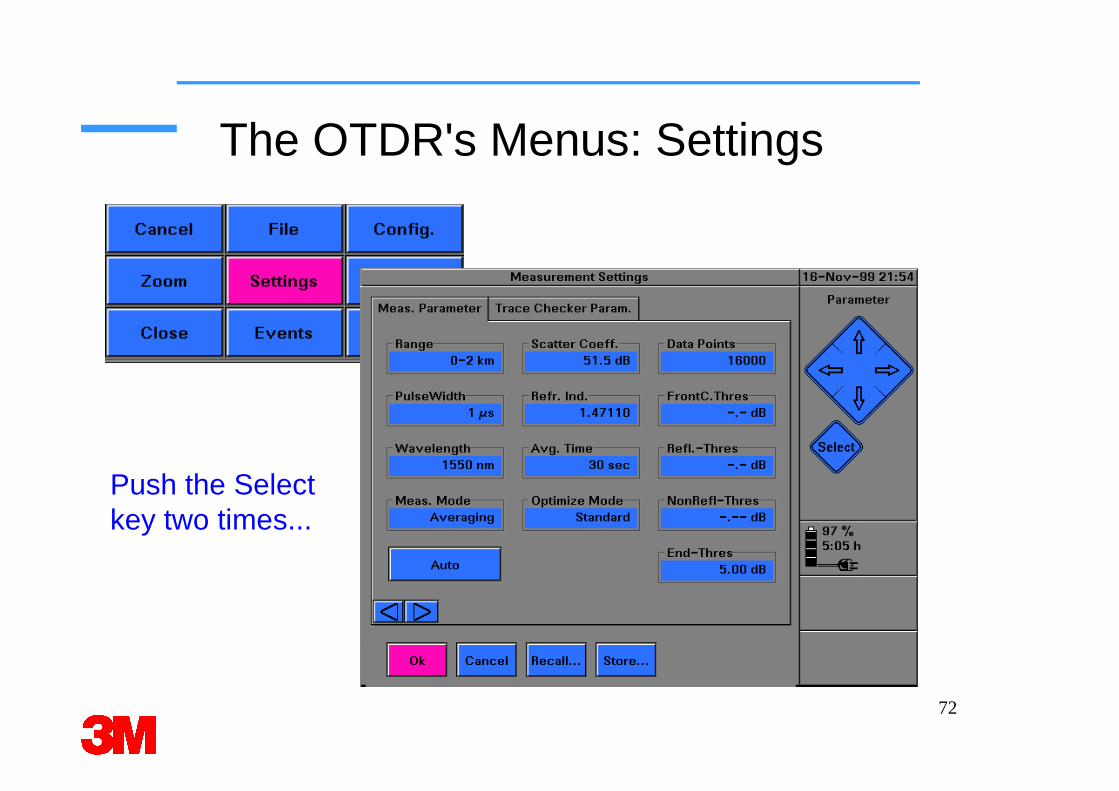
The OTDR's Menus: Settings
Push the Selectkey two times...
73
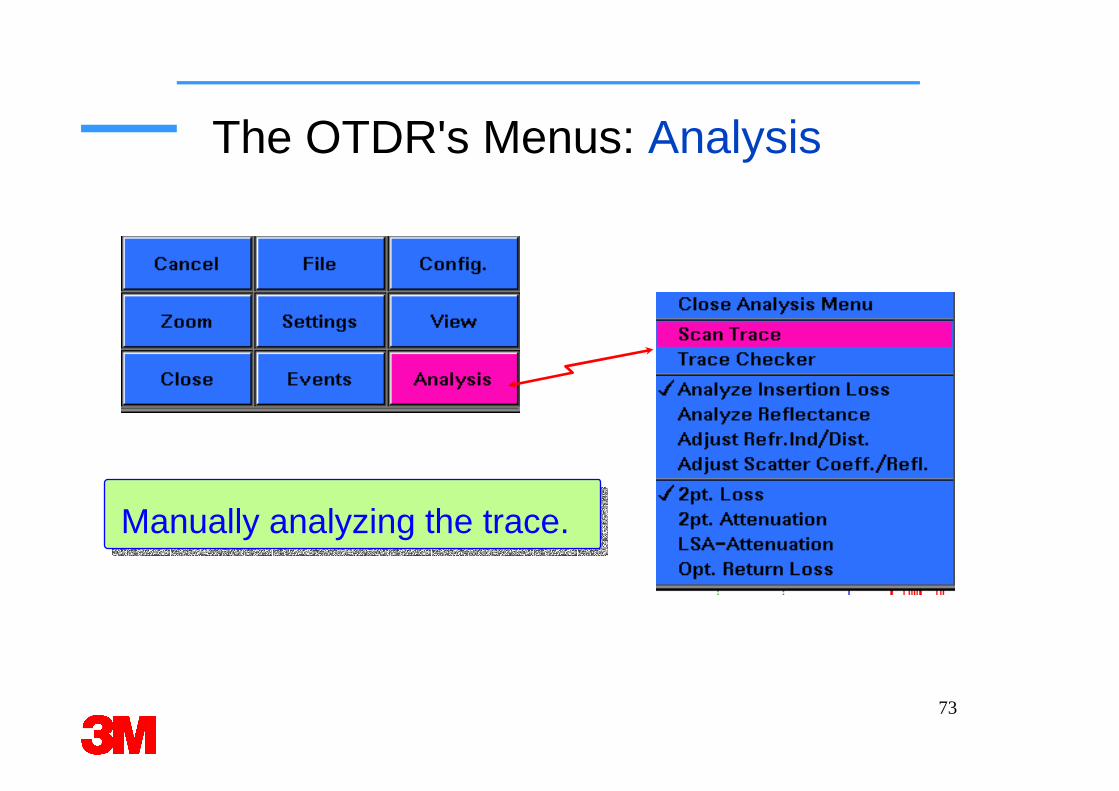
The OTDR's Menus: Analysis
Manually analyzing the trace.
74
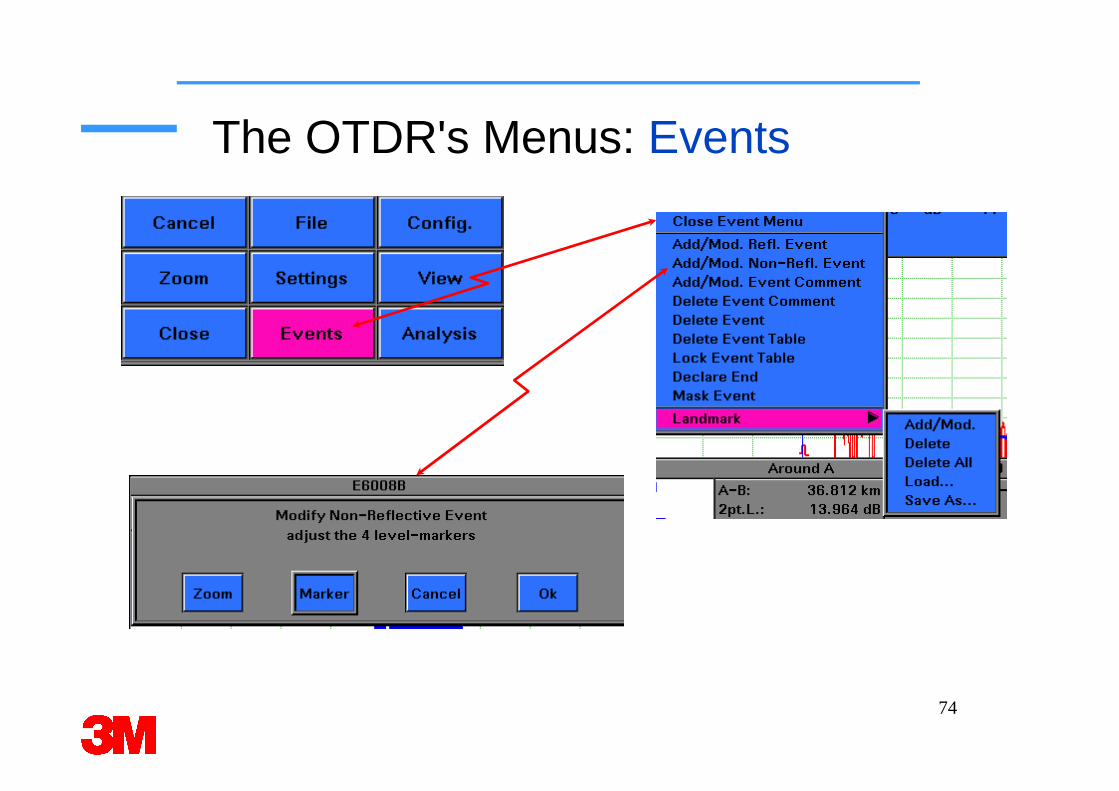
The OTDR's Menus: Events
75
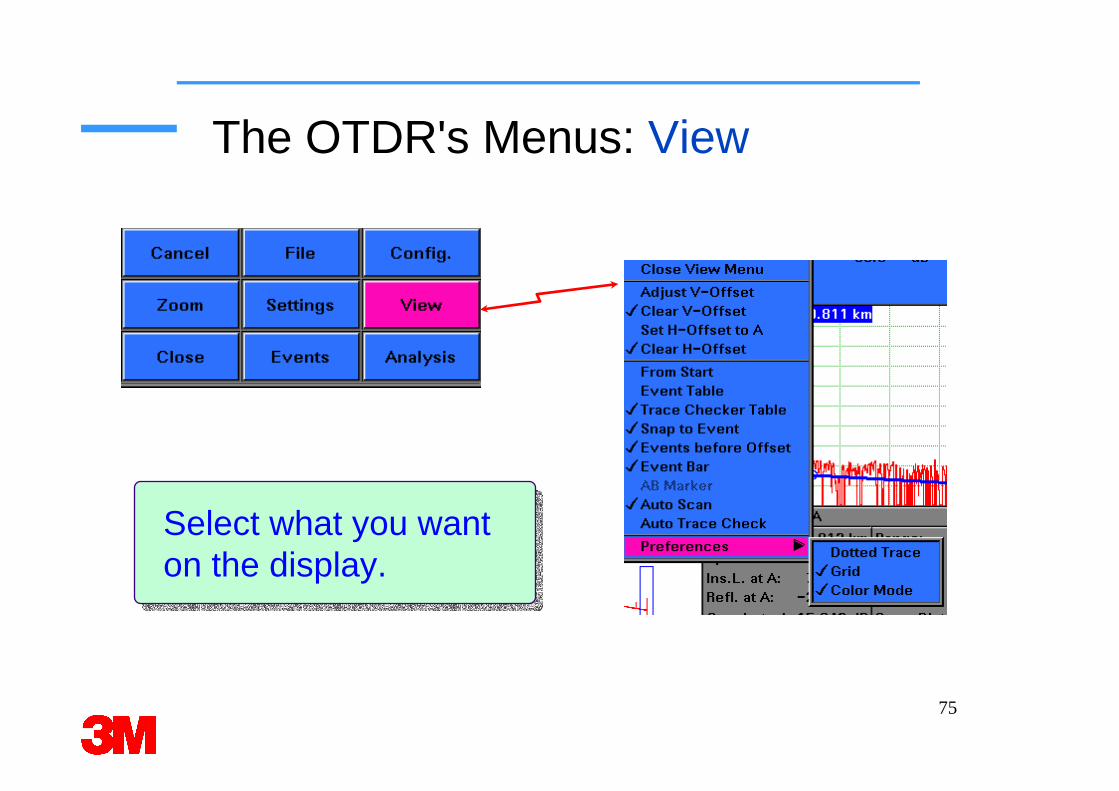
The OTDR's Menus: View
Select what you want on the display.
76
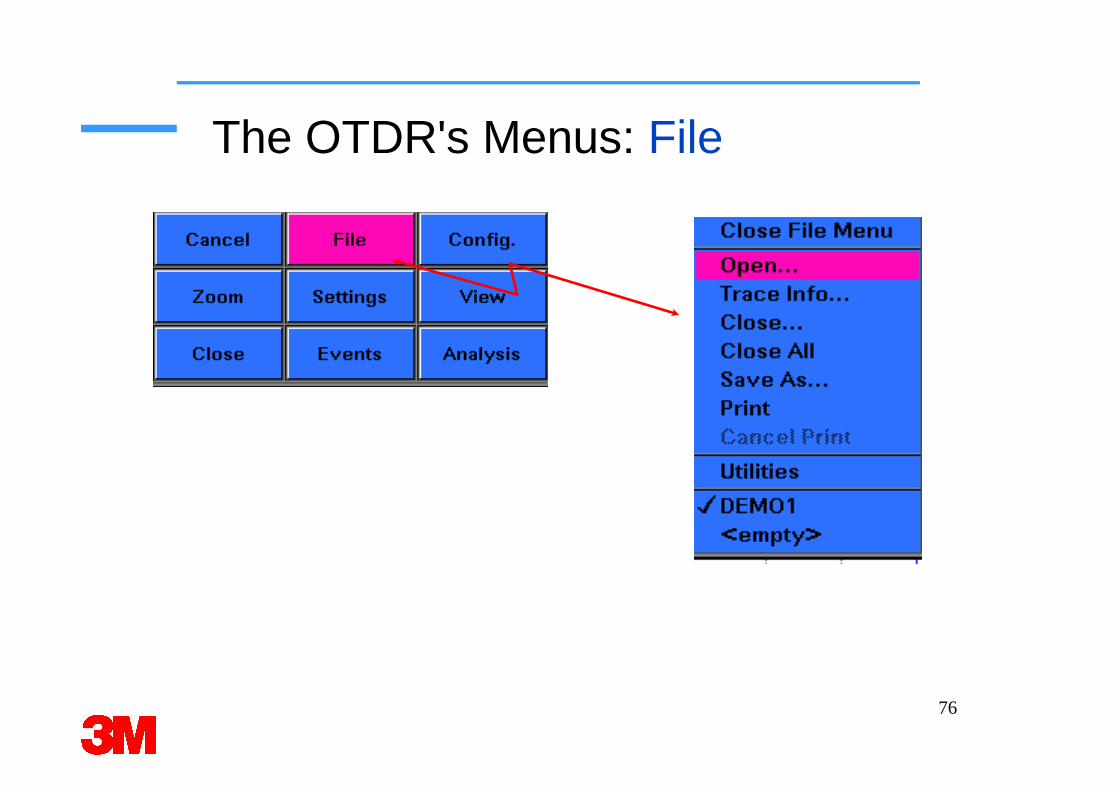
The OTDR's Menus: File
77
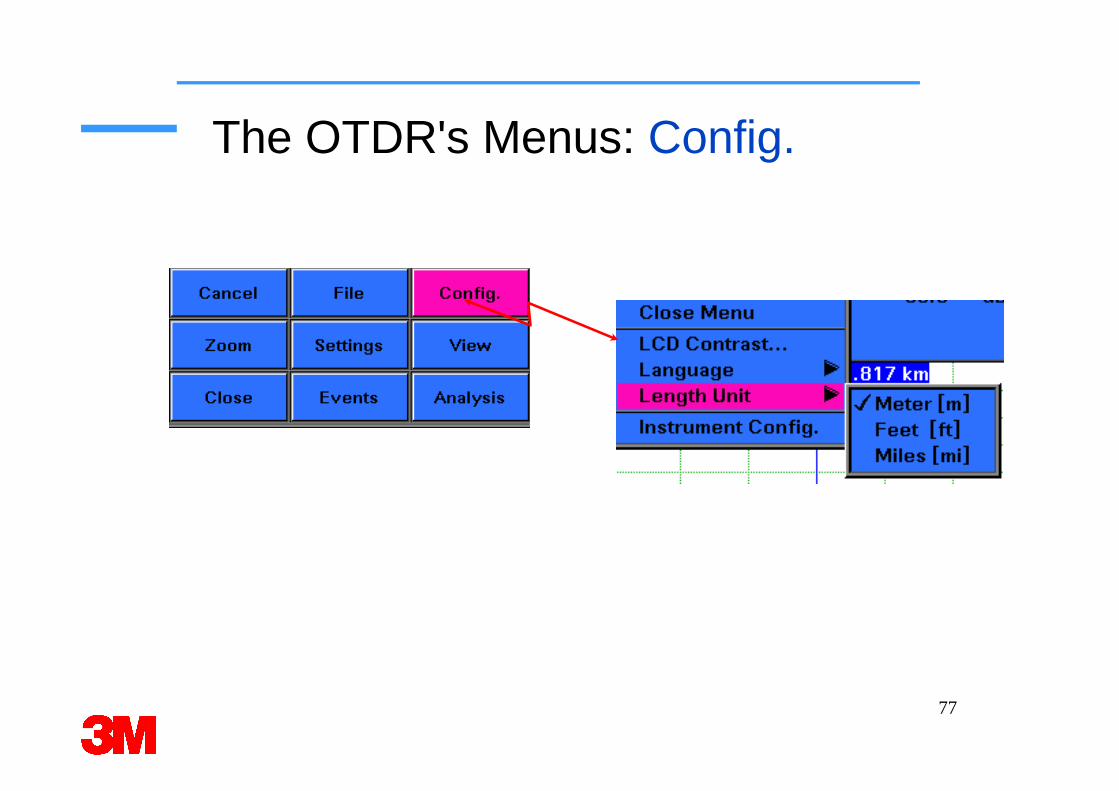
The OTDR's Menus: Config.
78
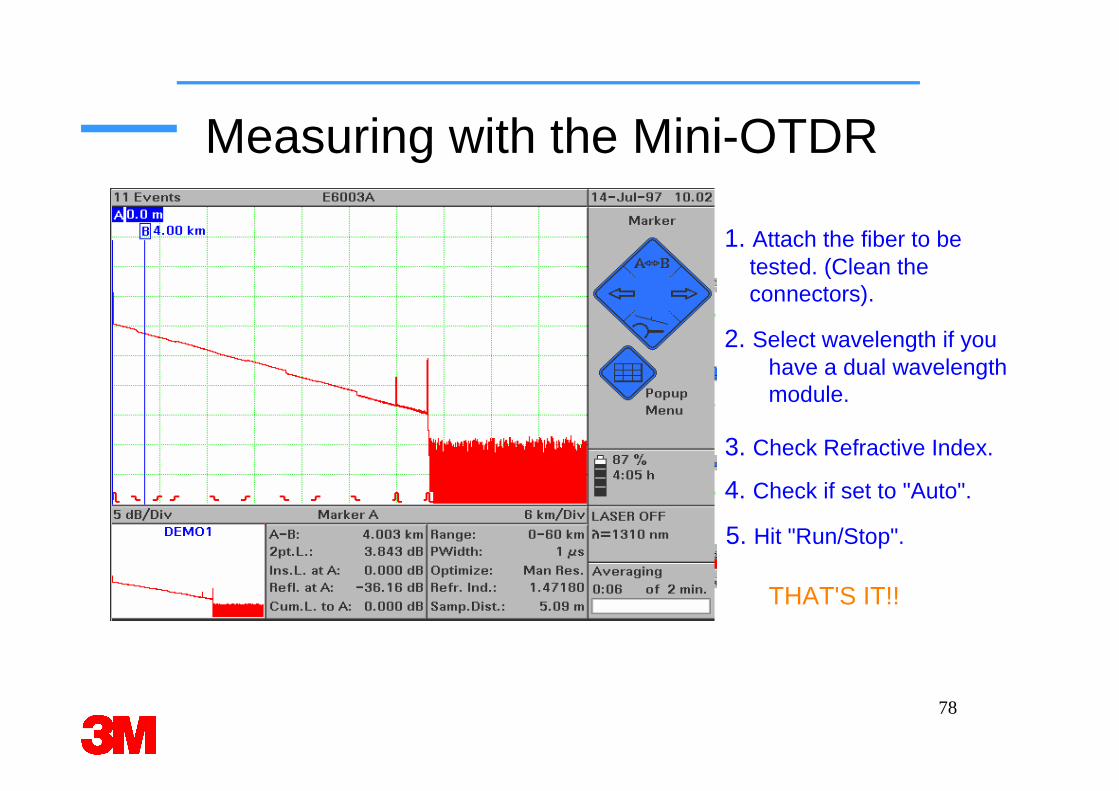
Measuring with the Mini-OTDR
1. Attach the fiber to betested. (Clean the connectors).
2. Select wavelength if youhave a dual wavelengthmodule.
5. Hit "Run/Stop".
THAT'S IT!!
3. Check Refractive Index.
4. Check if set to "Auto".
79
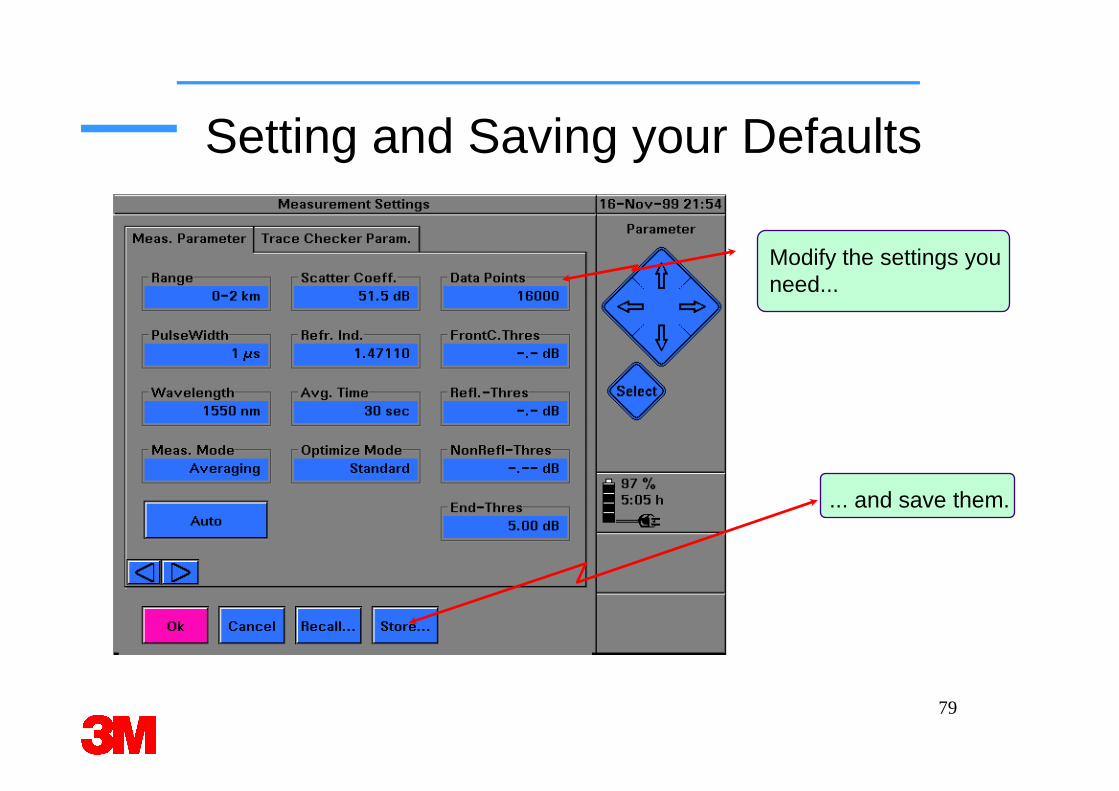
Setting and Saving your Defaults
Modify the settings you need...
... and save them.
80
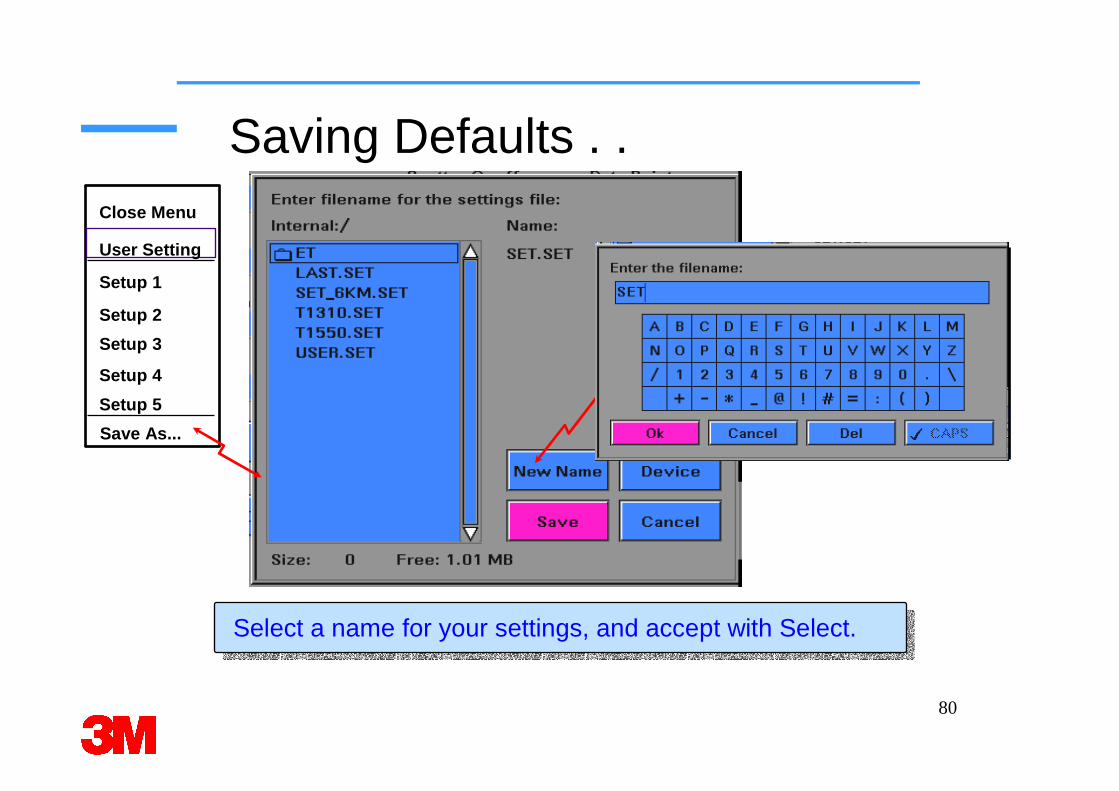
Saving Defaults . .
Select a name for your settings, and accept with Select.
Close Menu
User Setting
Setup 1
Setup 2
Setup 3
Setup 4
Setup 5
Save As...
81
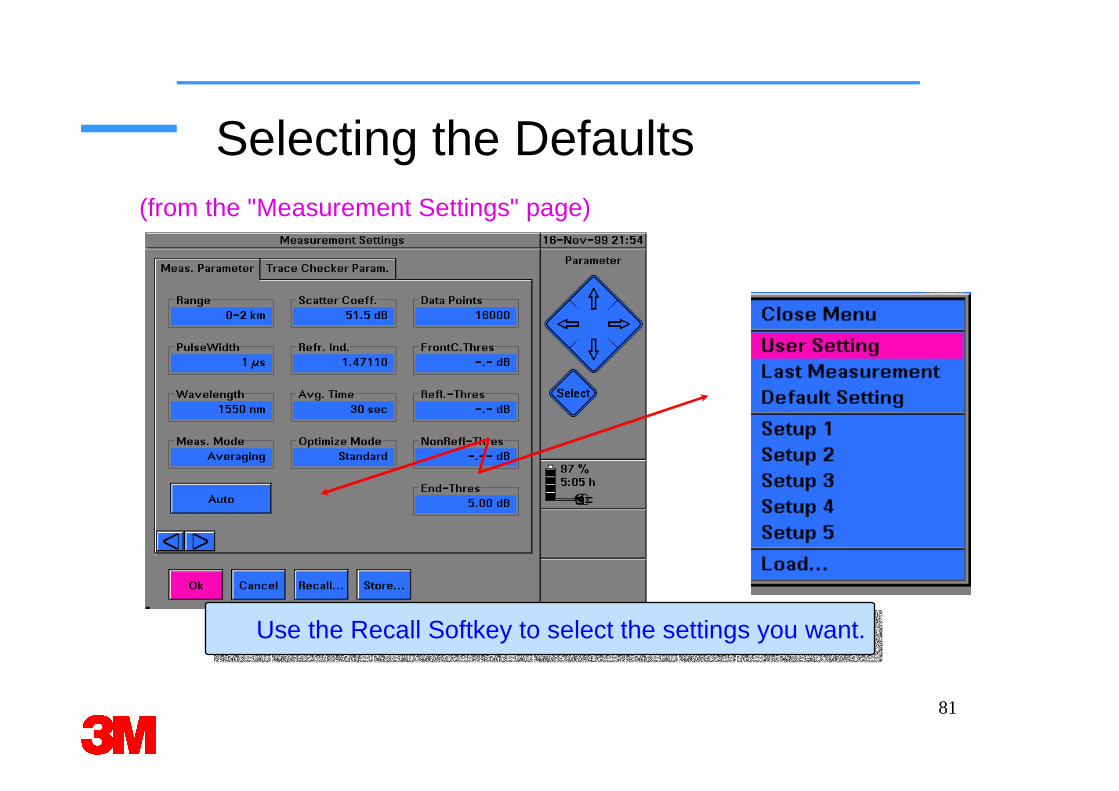
Selecting the Defaults
Use the Recall Softkey to select the settings you want.
(from the "Measurement Settings" page)
82
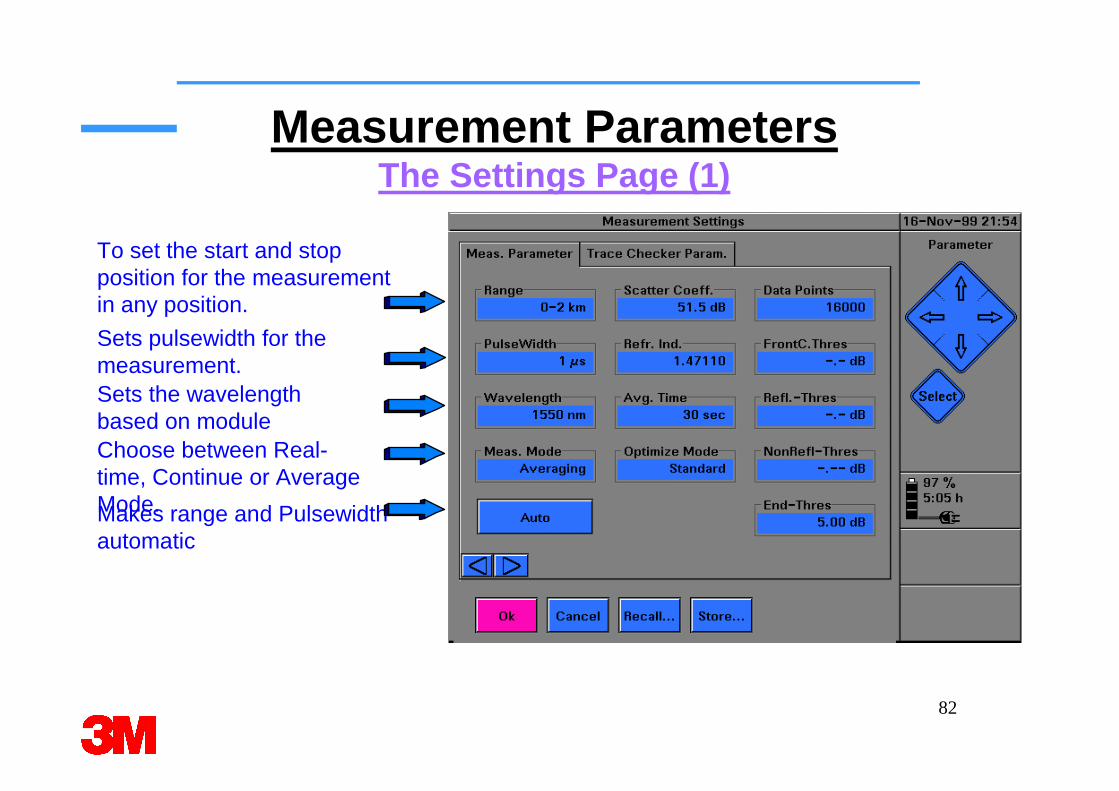
Measurement ParametersThe Settings Page (1)
To set the start and stop position for the measurement in any position.
Sets pulsewidth for the measurement.Sets the wavelength based on moduleChoose between Real-time, Continue or Average Mode.Makes range and Pulsewidth automatic
83
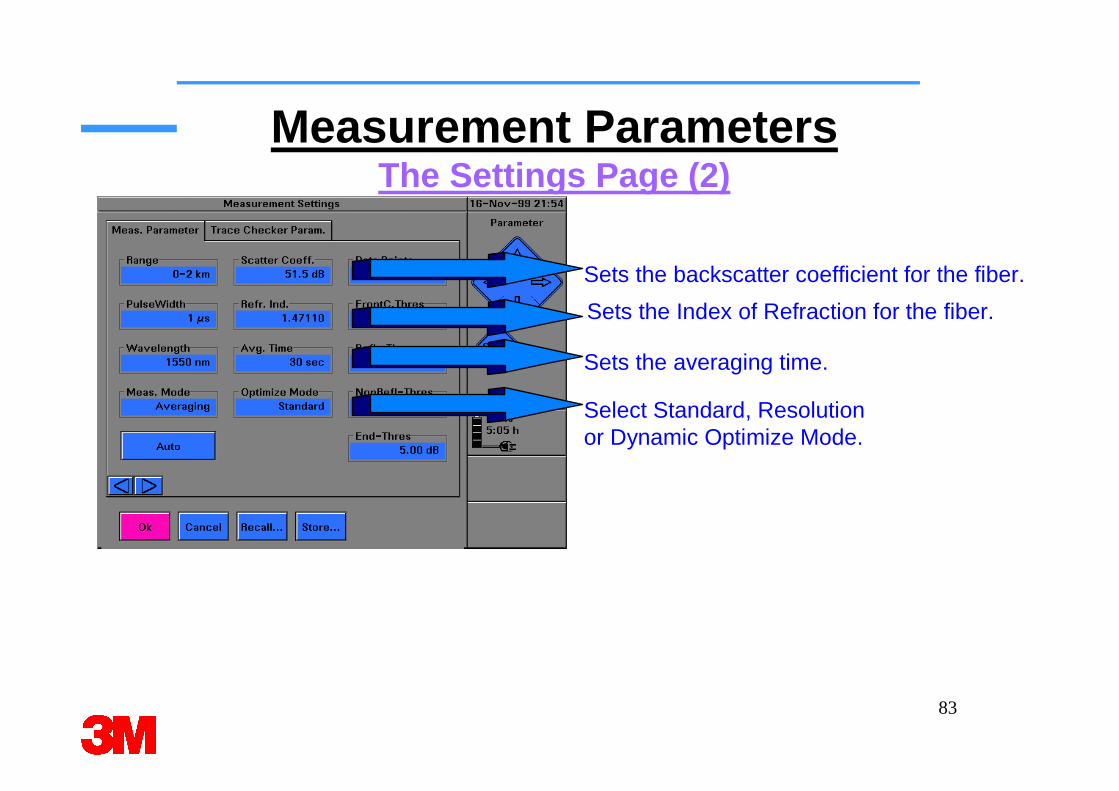
Measurement ParametersThe Settings Page (2)
Sets the backscatter coefficient for the fiber.
Sets the Index of Refraction for the fiber.
Sets the averaging time.
Select Standard, Resolutionor Dynamic Optimize Mode.
84
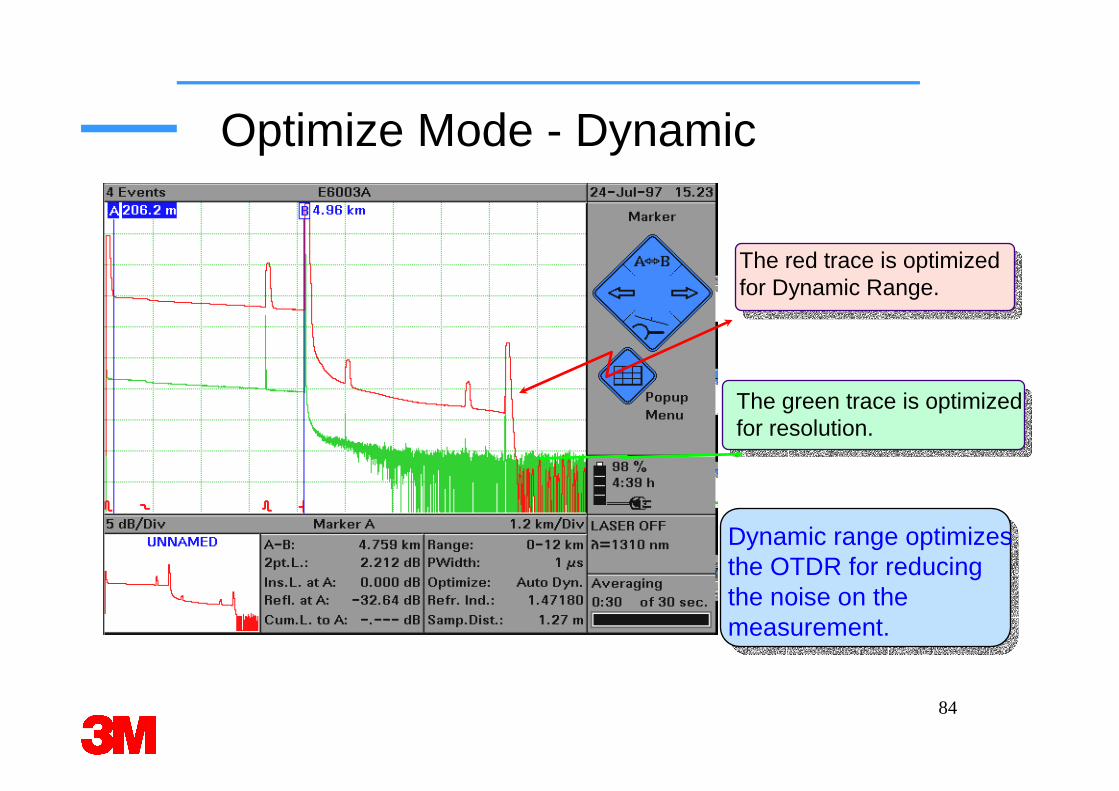
Optimize Mode - Dynamic
Dynamic range optimizes the OTDR for reducing the noise on the measurement.
The red trace is optimizedfor Dynamic Range.
The green trace is optimized for resolution.
85
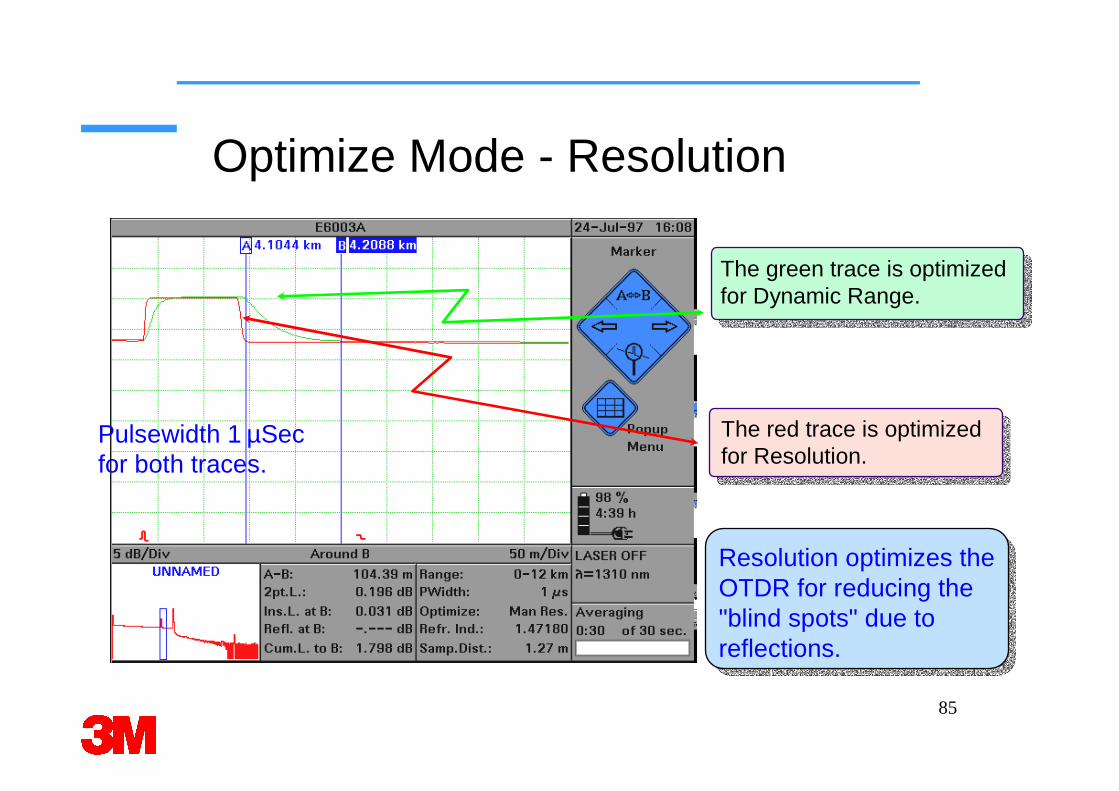
Optimize Mode - Resolution
Resolution optimizes the OTDR for reducing the "blind spots" due to reflections.
The red trace is optimizedfor Resolution.
The green trace is optimizedfor Dynamic Range.
Pulsewidth 1 µSecfor both traces.
86
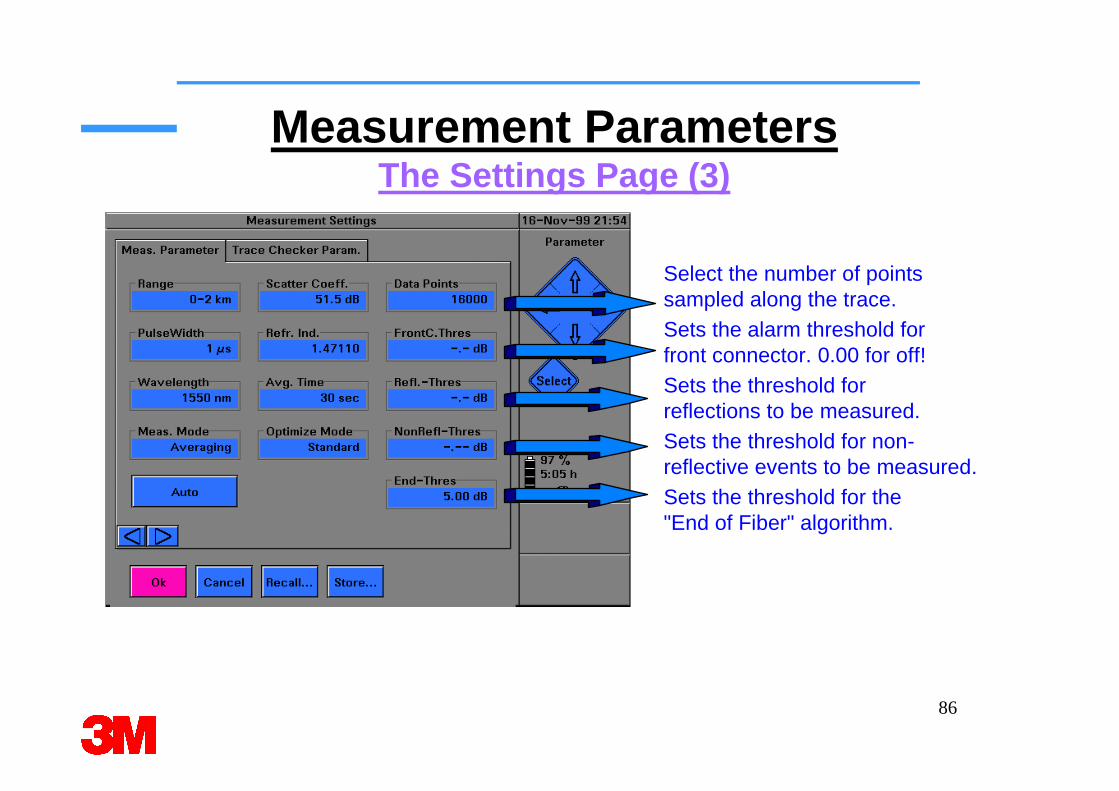
Measurement ParametersThe Settings Page (3)
Select the number of points sampled along the trace.Sets the alarm threshold forfront connector. 0.00 for off!Sets the threshold for reflections to be measured.Sets the threshold for non-reflective events to be measured.Sets the threshold for the"End of Fiber" algorithm.
87
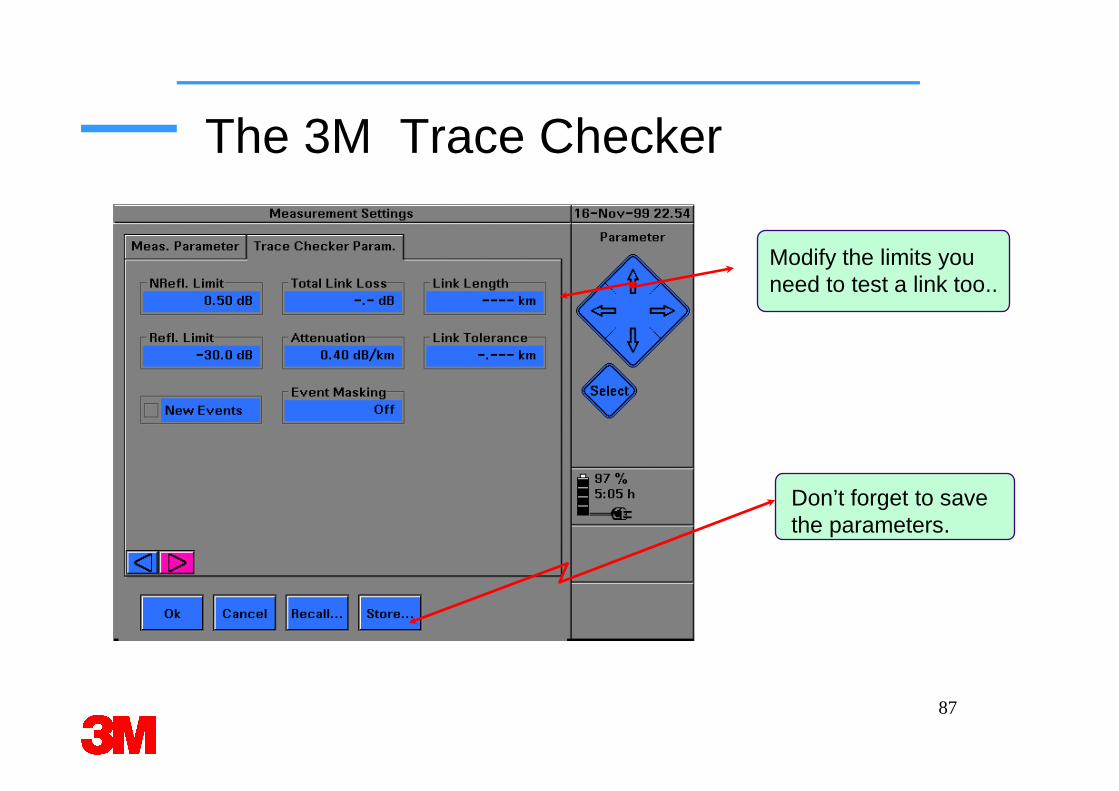
The 3M Trace Checker
Modify the limits you need to test a link too..
Don’t forget to save the parameters.
88
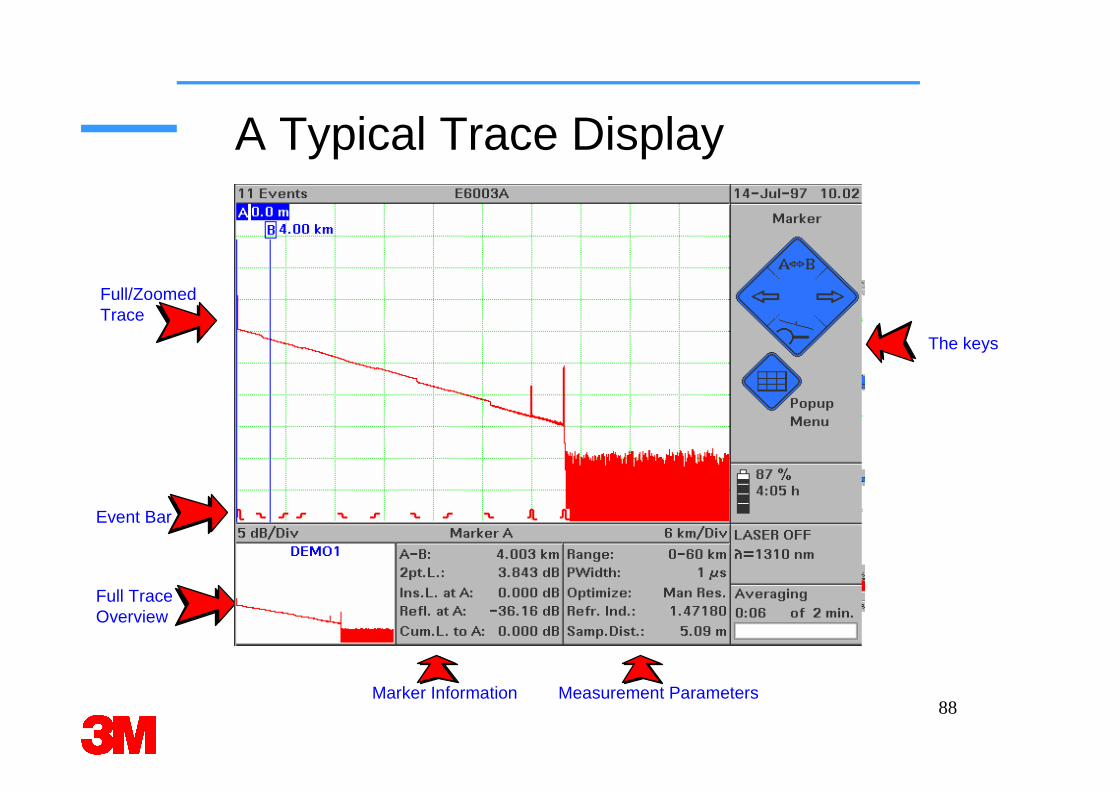
A Typical Trace Display
Full TraceOverview
Full/ZoomedTrace
Event Bar
The keys
Marker Information Measurement Parameters
89
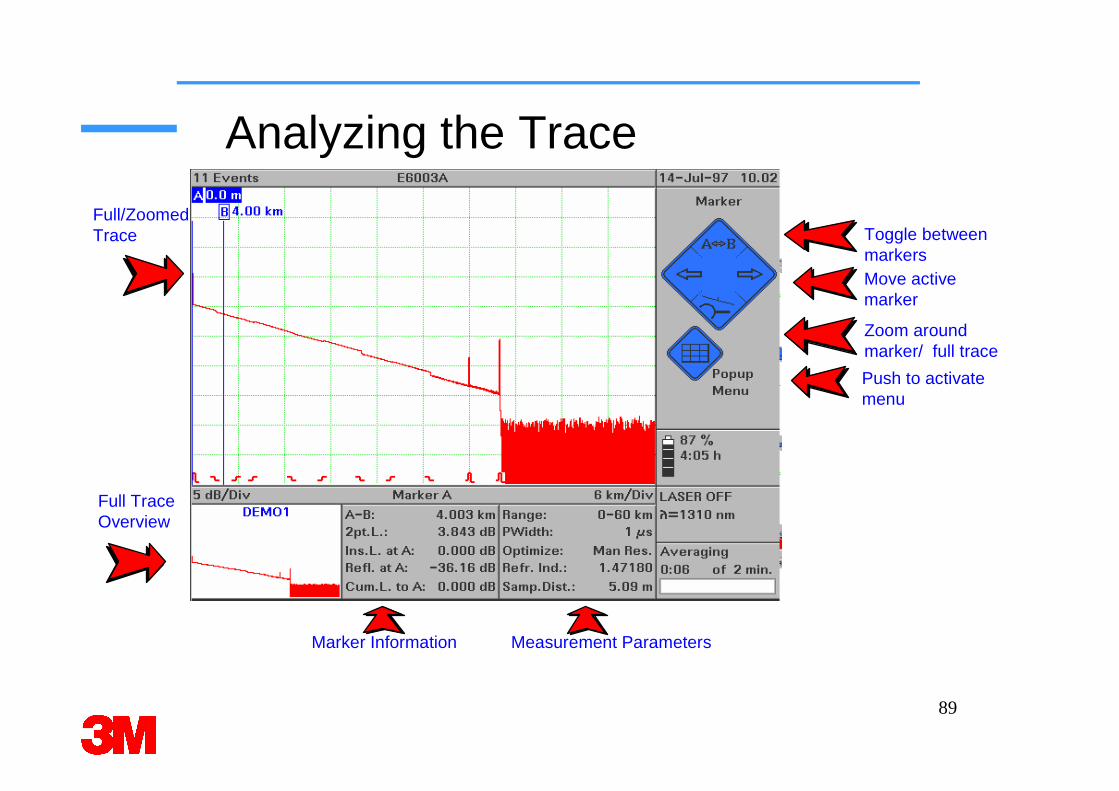
Analyzing the Trace
Full TraceOverview
Full/ZoomedTrace
Marker Information Measurement Parameters
Move active marker
Push to activate menu
Toggle between markers
Zoom around marker/ full trace
90
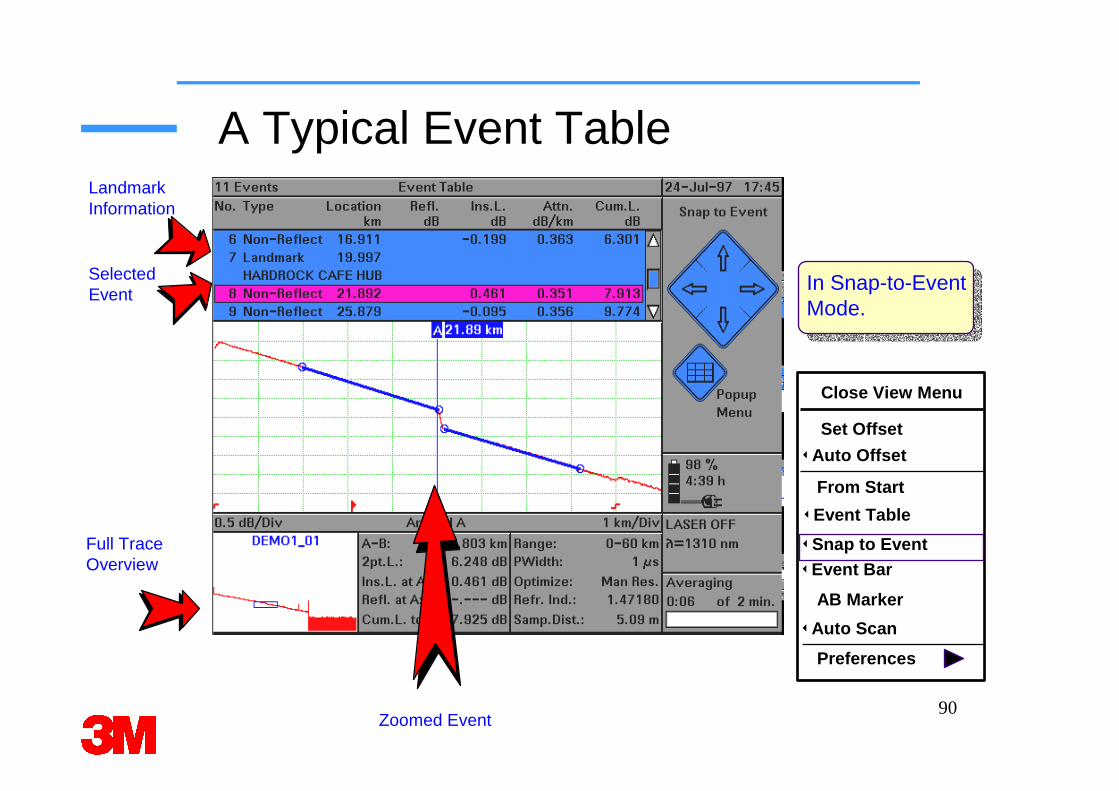
A Typical Event TableLandmarkInformation
Full TraceOverview
Zoomed Event
Selected Event
Close View Menu
Set Offset
3Auto Offset
From Start
3Event Table
3Snap to Event3Event Bar
AB Marker
3Auto Scan
Preferences
In Snap-to-EventMode.
91
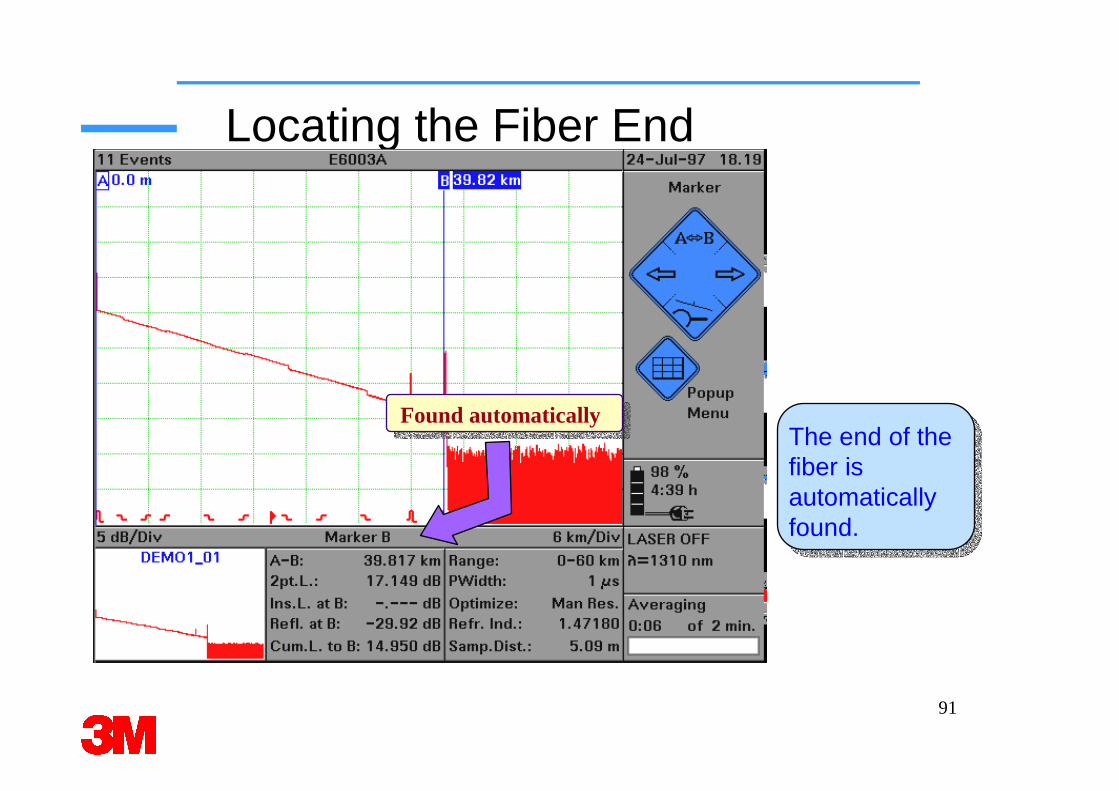
Locating the Fiber End
The end of the fiber is automatically found.
Found automatically
92
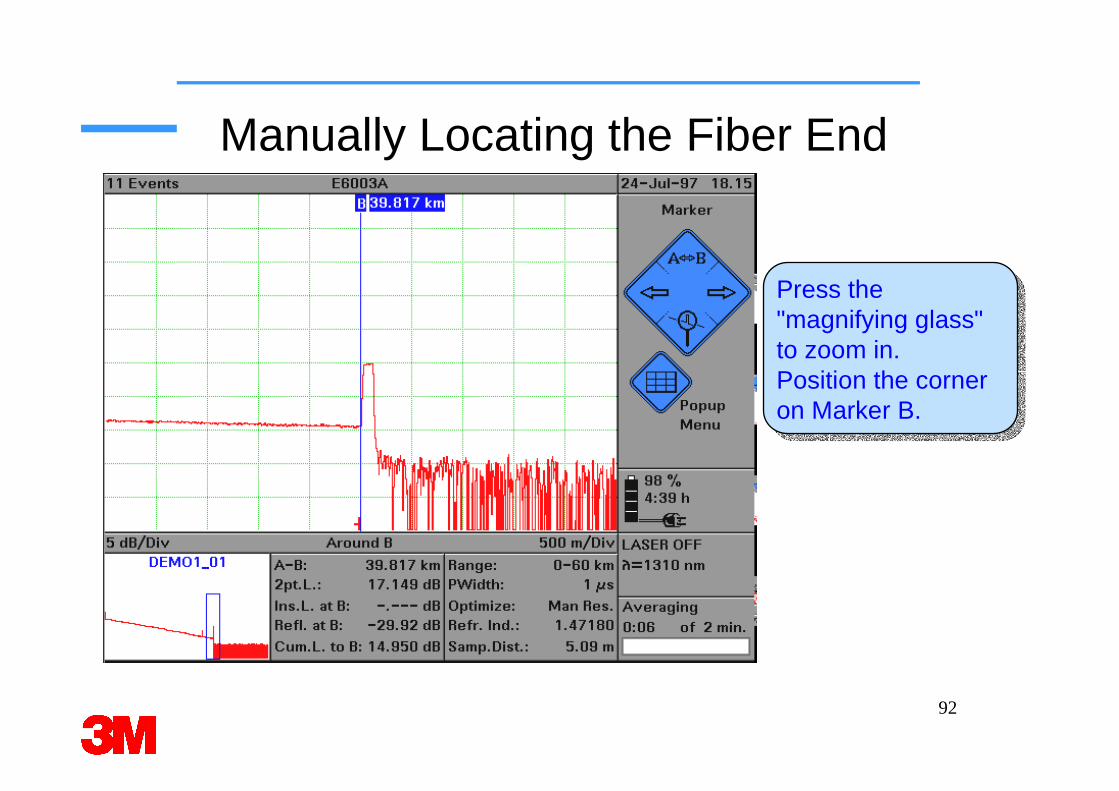
Manually Locating the Fiber End
Press the "magnifying glass" to zoom in. Position the corner on Marker B.
93
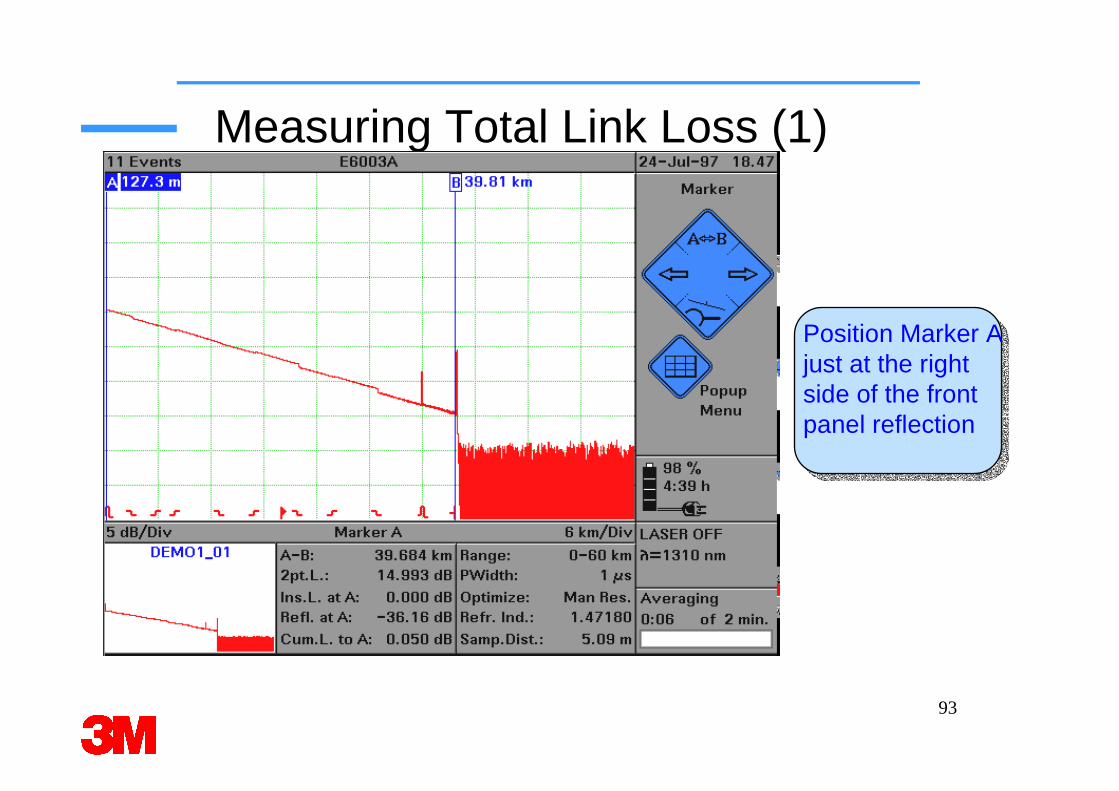
Measuring Total Link Loss (1)
Position Marker A just at the right side of the front panel reflection
94
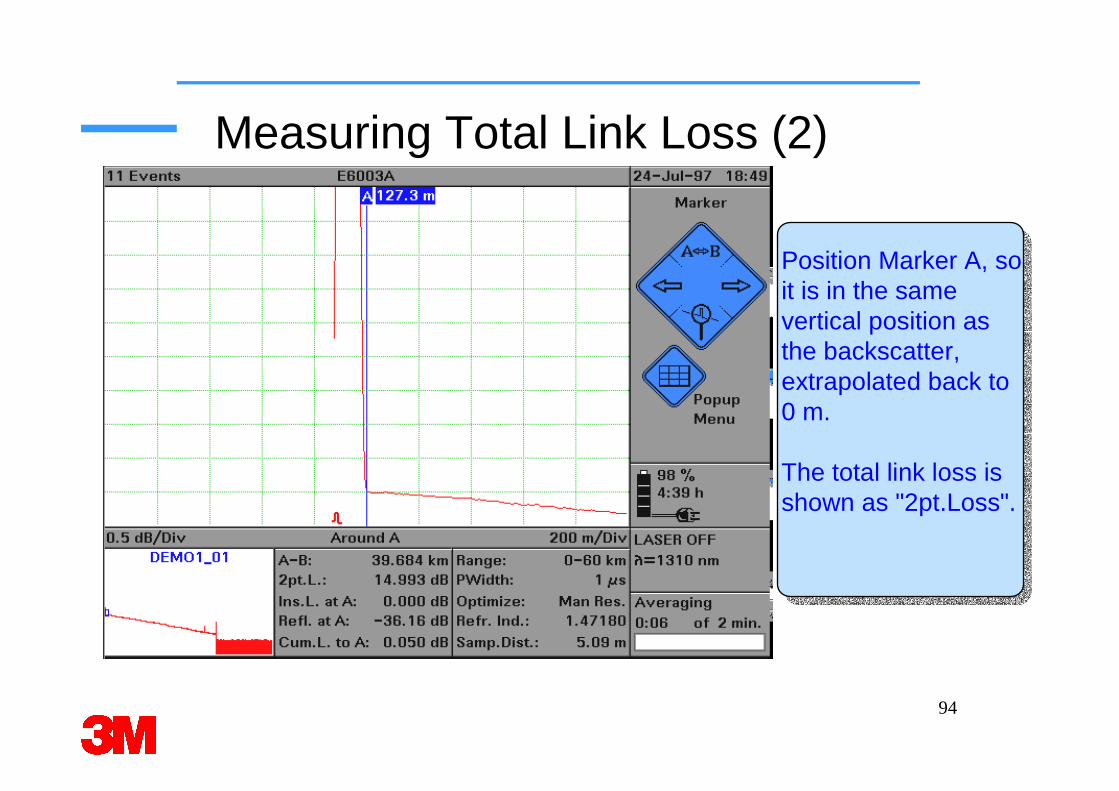
Measuring Total Link Loss (2)
Position Marker A, so it is in the same vertical position as the backscatter, extrapolated back to 0 m.
The total link loss is shown as "2pt.Loss".
95
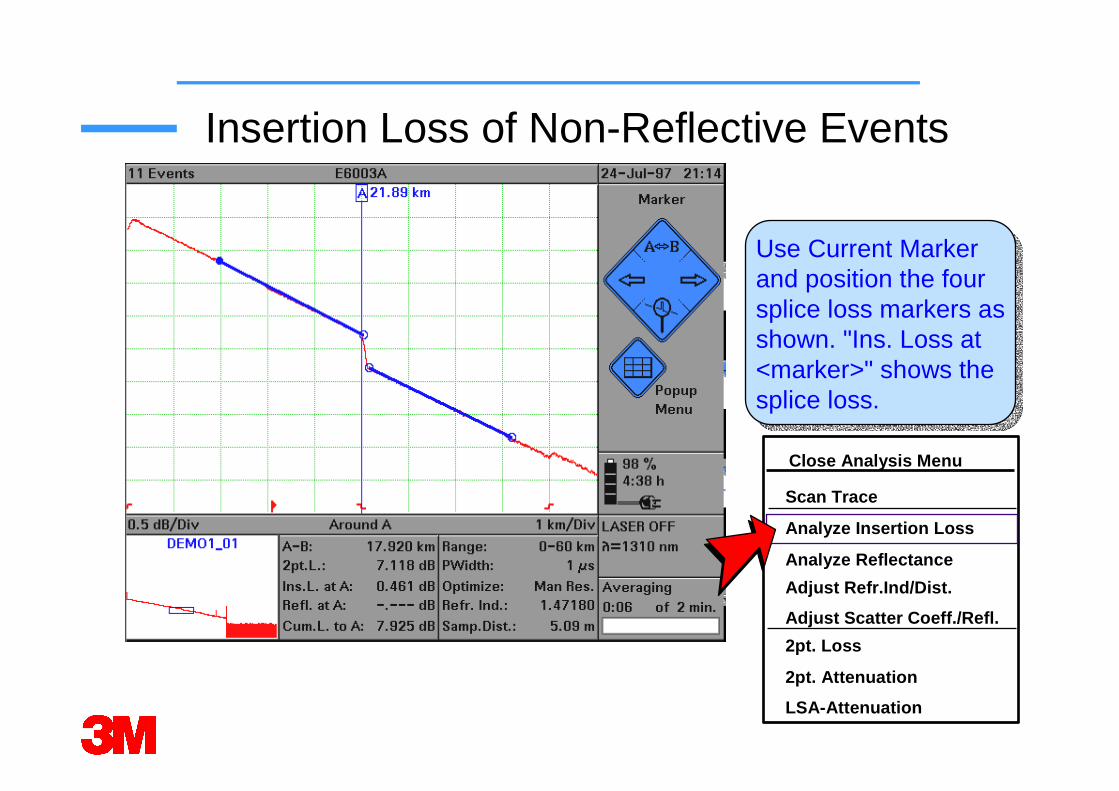
Insertion Loss of Non-Reflective Events
Use Current Marker and position the four splice loss markers as shown. "Ins. Loss at <marker>" shows the splice loss.
Close Analysis Menu
Scan Trace
Analyze Insertion Loss
Analyze Reflectance
Adjust Refr.Ind/Dist.
Adjust Scatter Coeff./Refl.
2pt. Loss
2pt. Attenuation
LSA-Attenuation
96
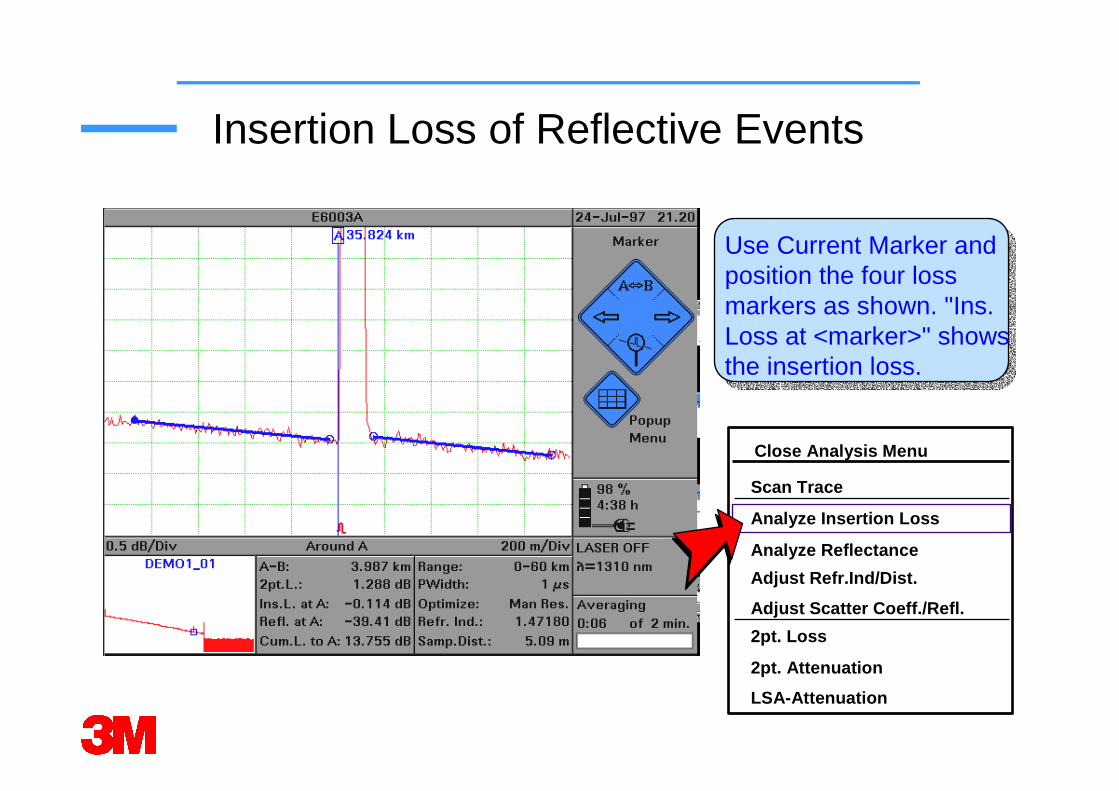
Insertion Loss of Reflective Events
Use Current Marker and position the four loss markers as shown. "Ins. Loss at <marker>" shows the insertion loss.
Close Analysis Menu
Scan Trace
Analyze Insertion Loss
Analyze Reflectance
Adjust Refr.Ind/Dist.
Adjust Scatter Coeff./Refl.
2pt. Loss
2pt. Attenuation
LSA-Attenuation
97
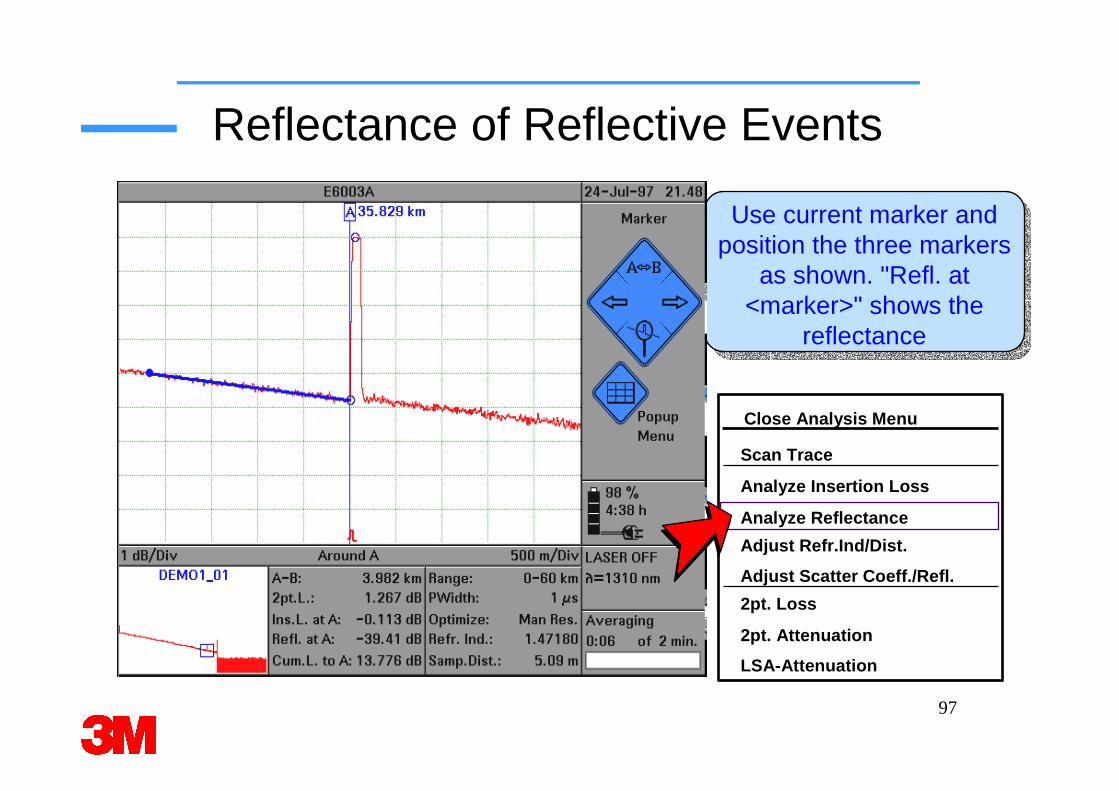
Reflectance of Reflective Events
Use current marker and position the three markers
as shown. "Refl. at <marker>" shows the
reflectance
Close Analysis Menu
Scan Trace
Analyze Insertion Loss
Analyze Reflectance
Adjust Refr.Ind/Dist.
Adjust Scatter Coeff./Refl.
2pt. Loss
2pt. Attenuation
LSA-Attenuation
98
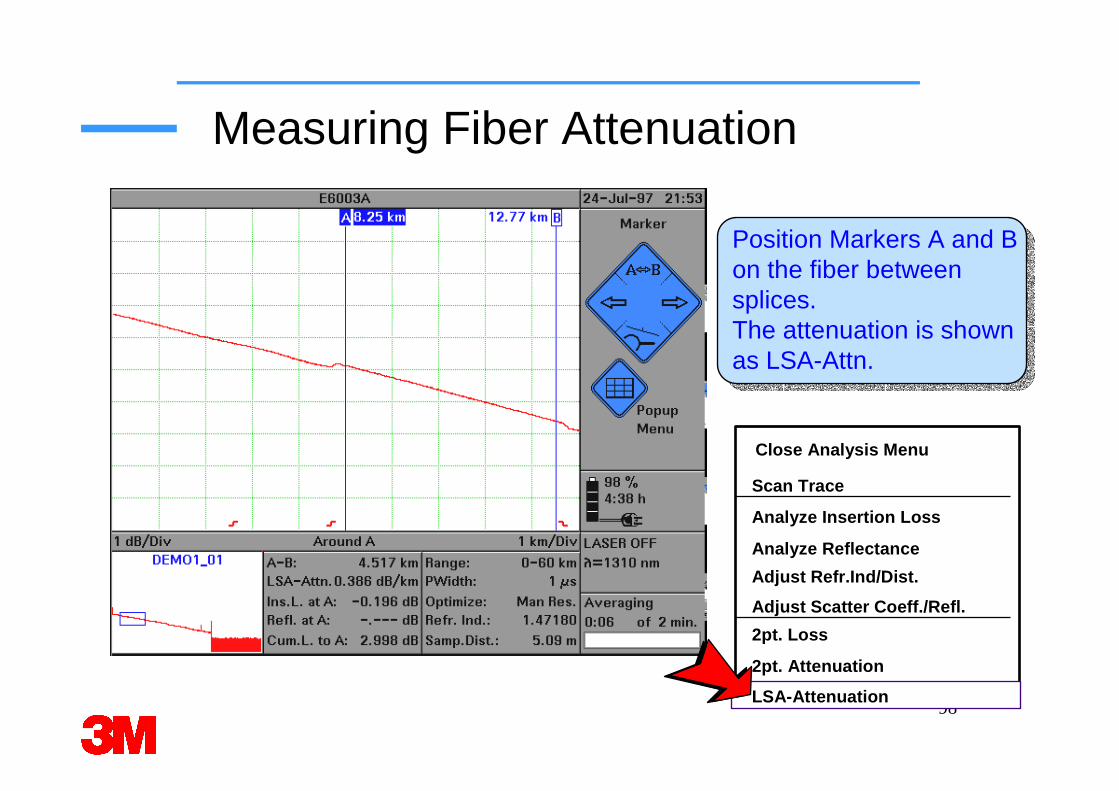
Measuring Fiber Attenuation
Position Markers A and B on the fiber between splices.The attenuation is shown as LSA-Attn.
Close Analysis Menu
Scan Trace
Analyze Insertion Loss
Analyze Reflectance
Adjust Refr.Ind/Dist.
Adjust Scatter Coeff./Refl.
2pt. Loss
2pt. Attenuation
LSA-Attenuation
99
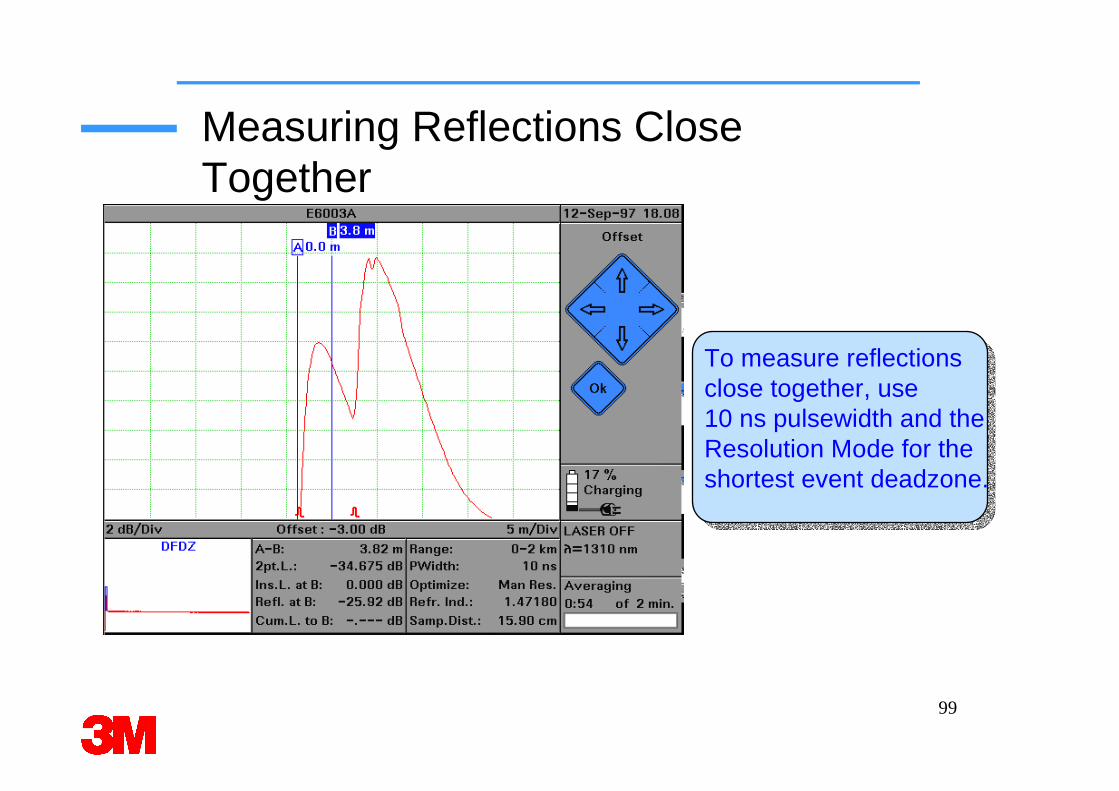
Measuring Reflections Close Together
To measure reflections close together, use 10 ns pulsewidth and the Resolution Mode for the shortest event deadzone.
100
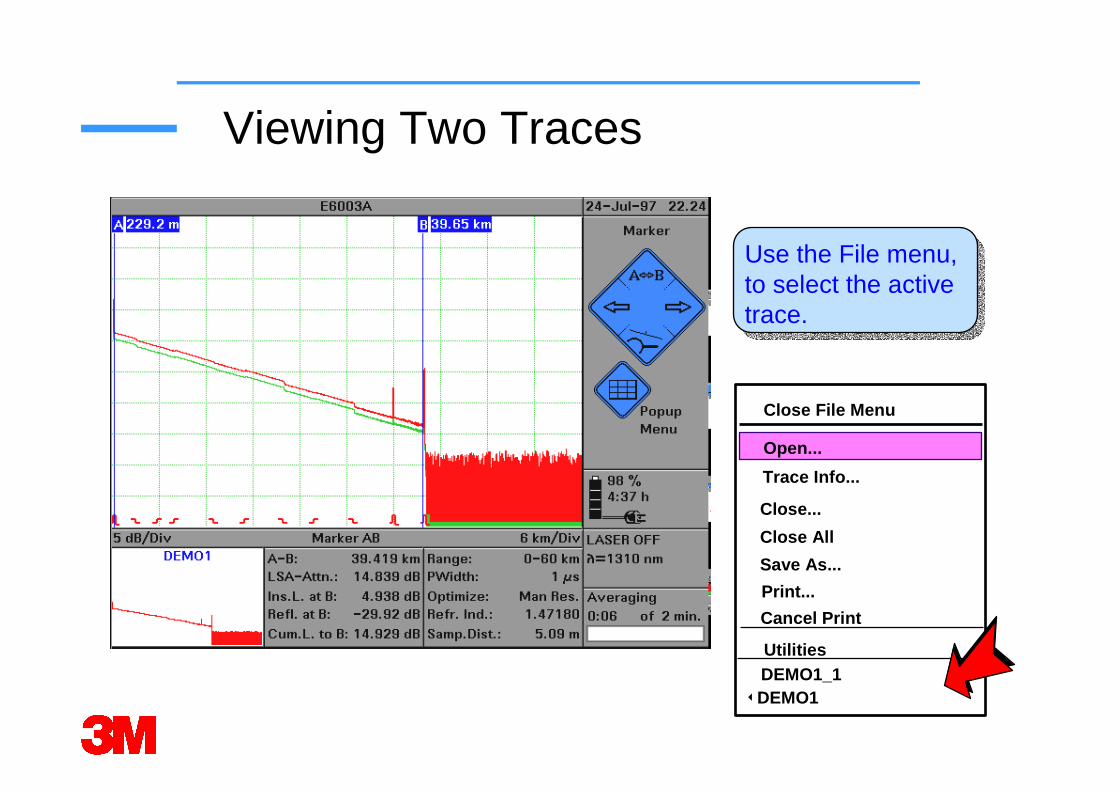
Viewing Two Traces
Use the File menu, to select the active trace.
Close File Menu
Open...
Trace Info...
Close...
Close All
Cancel Print
3DEMO1
Save As...
Print...
UtilitiesDEMO1_1
101
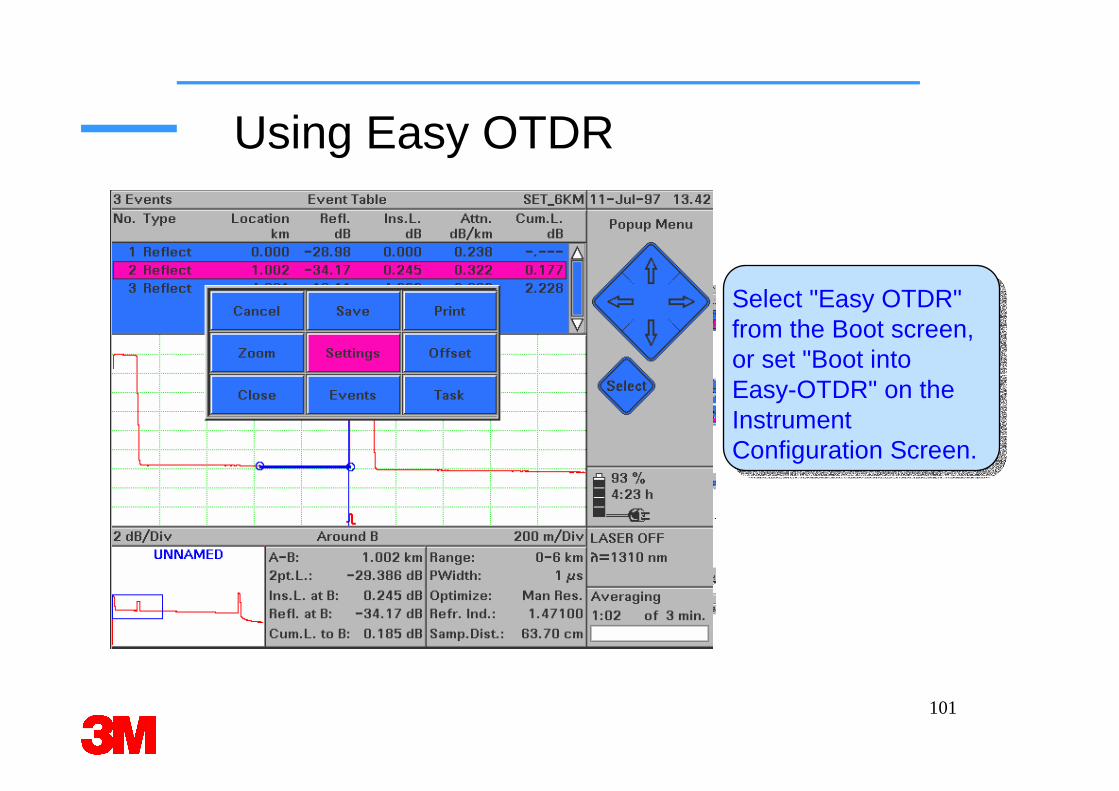
Using Easy OTDR
Select "Easy OTDR" from the Boot screen, or set "Boot into Easy-OTDR" on the Instrument Configuration Screen.
102
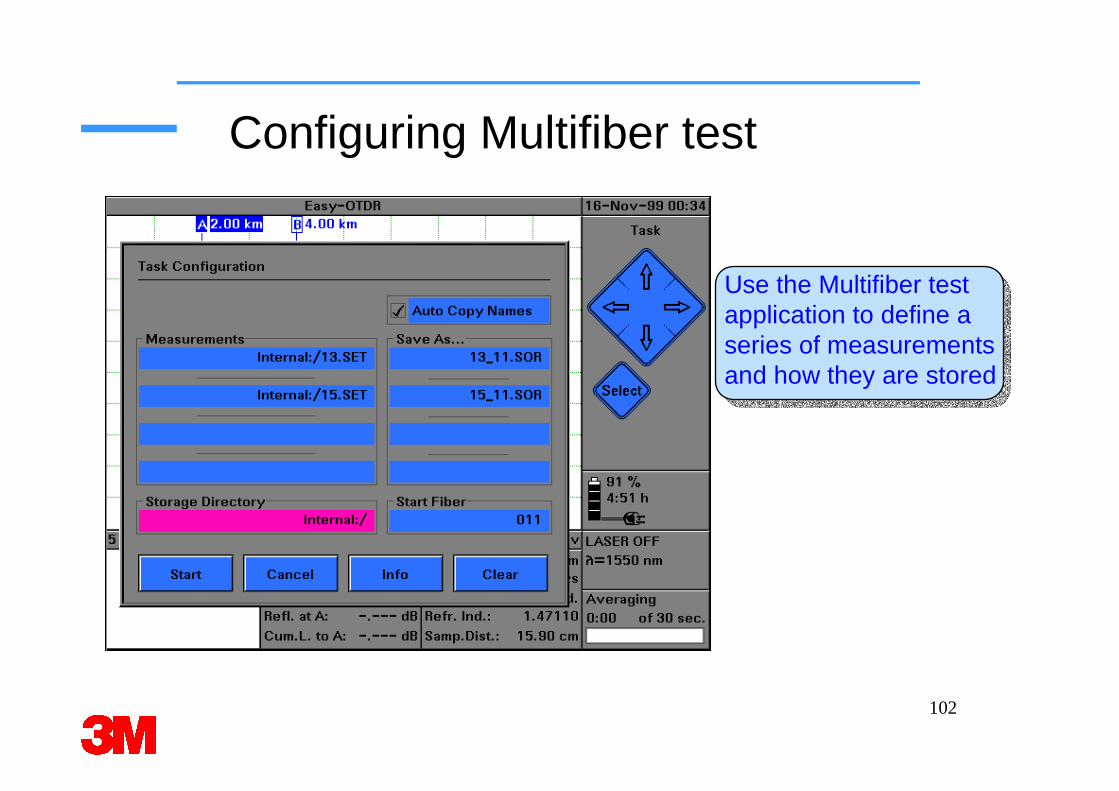
Configuring Multifiber test
Use the Multifiber test application to define a series of measurements and how they are stored
103
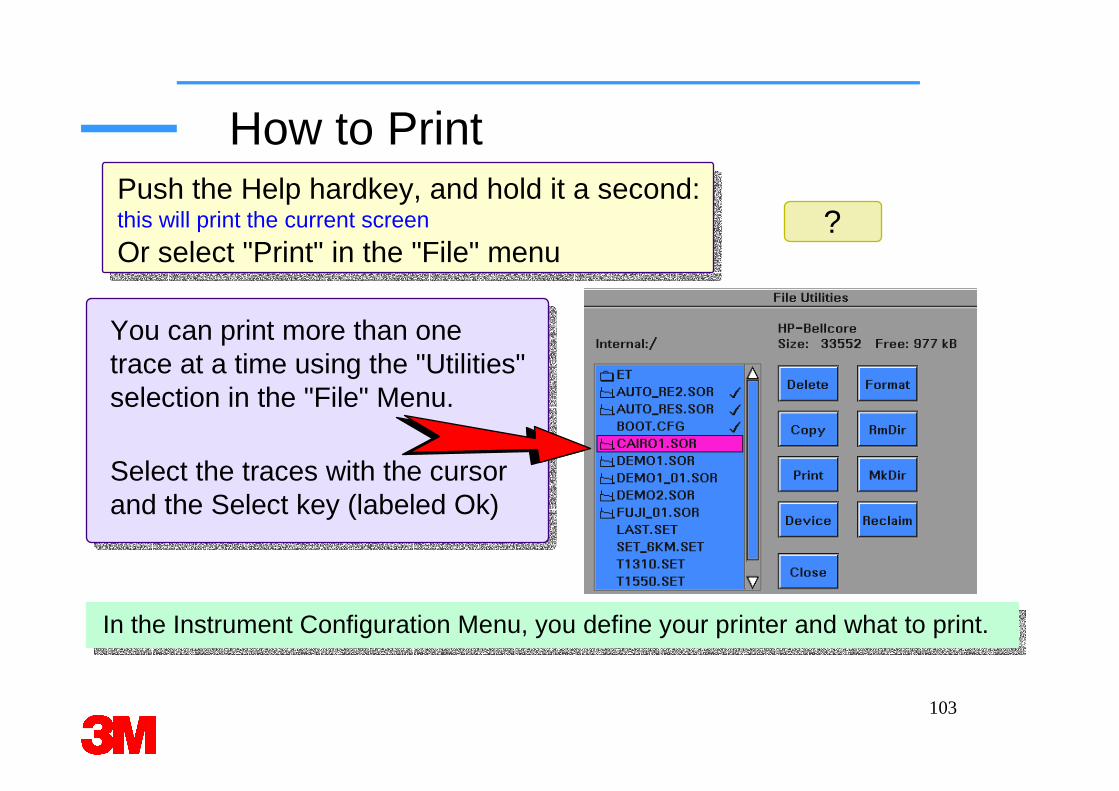
How to Print
You can print more than one trace at a time using the "Utilities" selection in the "File" Menu.
In the Instrument Configuration Menu, you define your printer and what to print.
?Push the Help hardkey, and hold it a second:this will print the current screen
Or select "Print" in the "File" menu
Select the traces with the cursor and the Select key (labeled Ok)
104
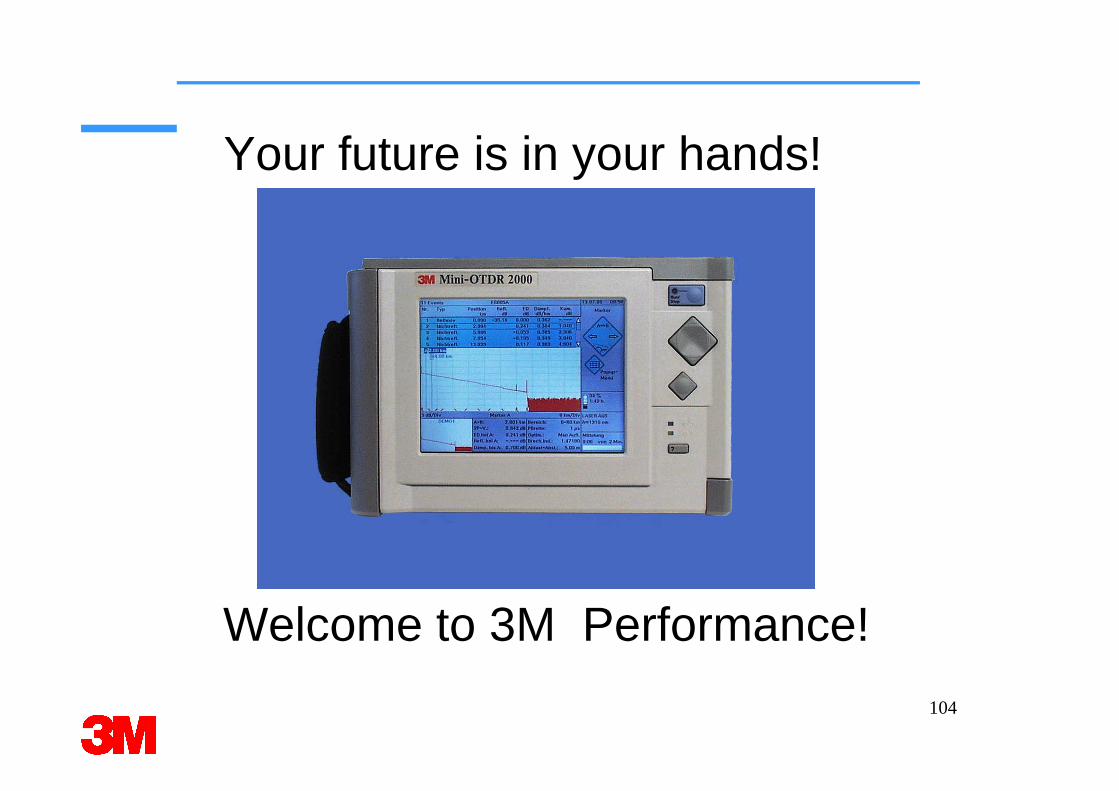
Your future is in your hands!
Welcome to 3M Performance!